Embed Size (px)
Citation preview
Bisalloy Steel Group Limited 2017 Annual Report
1
2017 Financial Report
Bisalloy Steel Group Limited 2017 Annual Report
2
Your directors submit their report for the year ended 30 June 2017.
Directors
The names and details of the Company’s directors in office during the financial year and until the date of this report are as follows. Directors were in office for this entire period unless otherwise stated.
Mr Phillip Cave, AM B.Bus, FCPA Chairman
Skills & Experience:Mr Cave is an experienced director, Chairman and Chief Executive Officer with a career in major corporate turnaround projects, structured finance and corporate advisory service. Over a 35 year career, Mr Cave’s experience has combined a mixture of operational management expertise across a wide variety of industries with an in depth knowledge of finance and banking.
Term of office: A founding director of the Company and Chairman since appointed in November 2001. Last re-elected in November 2016.
Board Committees:• Chairman of the Nominations & Remuneration Committee• Audit & Risk Committee
Other public company directorships during past three years:• Chairman Dick Smith Holdings Ltd from December 2013 to February 2015.
Other directorships: • Chairman Anchorage Capital Partners• Chairman Excelsia College• Chairman Ability First Australia• Chairman Solgen Energy Group• Acrow Formwork & Scaffolding Pty Ltd
Mr Greg Albert, MBA Managing Director and CEO
Skills & Experience:Mr Albert has professional qualifications in Mechanical Engineering, Marketing and has an MBA. Mr Albert brings a wealth of experience in the steel, mining and construction industries, as well as solid knowledge of international markets, having held postings in Asia and Europe. Mr Albert is a Director of Bisalloy Steel Group’s joint venture businesses – PT Bima Bisalloy and Bisalloy Thailand. Mr Albert is also Chairman of the Group’s Co-operative Joint Venture, Bisalloy Jigang (Shandong) Steel Plate Co., Limited.
Term of office: Appointed in January 2016. As the managing director he is not subject to re-election by rotation.
Board Committees: Nil
Other directorships: Nil
Directors’ Report
Bisalloy Steel Group Limited 2017 Annual Report
3
Mr Kym Godson, Dip Tech (Bus Admin), FAICD, FAIM Non-executive Director
Skills & Experience: Mr Godson is an experienced public company director and has extensive experience in the management of industrial businesses, particularly within the steel industry. He is a former Managing Director and CEO of the Company having retired from the position in November 2008.
Term of office: A founding director of the Company appointed in November 2001. Last re-elected in November 2016.
Board Committees: • Audit & Risk Committee• Nominations & Remuneration Committee
Other directorships: • The House of M&K Pty. Ltd
Mr Richard Grellman, AM FCA Non-executive Director
Skills & Experience:Mr Grellman brings significant accounting and finance skills to the Company, having had over 32 years experience in the accounting profession. He was a partner at KPMG from 1982 to 2000 and a member of KPMG’s National Board from 1995 to 1997 and National Executive from 1997 to 2000.
Term of office: • Appointed in February 2003 and is retiring by rotation pursuant to the requirements of the
Company’s constitution in order to seek re-election at the 2017 AGM.
Board Committees: • Chairman of the Audit & Risk Committee• Nominations & Remuneration Committee
Other public company directorships during past three years: Current• Chairman, IPH Ltd from September 2014Former• Chairman, Crowe Horwath Australasia Ltd (2011-2015)• Chairman, Genworth Mortgage Insurance Ltd (2012-2016)
Other directorships: • Chairman, Bible Society Australia• Chairman, AMP Foundation
Bisalloy Steel Group Limited 2017 Annual Report
4
Directors’ Report continued
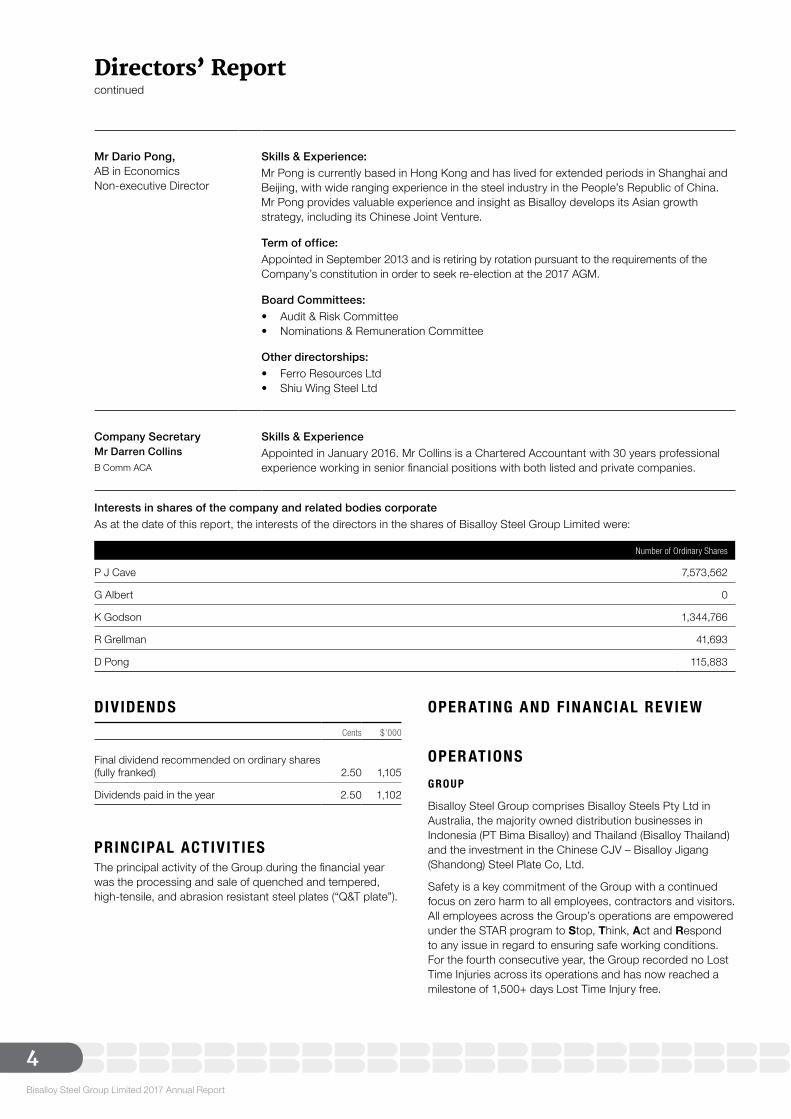
Mr Dario Pong, AB in Economics Non-executive Director
Skills & Experience:Mr Pong is currently based in Hong Kong and has lived for extended periods in Shanghai and Beijing, with wide ranging experience in the steel industry in the People’s Republic of China. Mr Pong provides valuable experience and insight as Bisalloy develops its Asian growth strategy, including its Chinese Joint Venture.
Term of office: Appointed in September 2013 and is retiring by rotation pursuant to the requirements of the Company’s constitution in order to seek re-election at the 2017 AGM.
Board Committees: • Audit & Risk Committee• Nominations & Remuneration Committee
Other directorships: • Ferro Resources Ltd• Shiu Wing Steel Ltd
Company SecretaryMr Darren CollinsB Comm ACA
Skills & ExperienceAppointed in January 2016. Mr Collins is a Chartered Accountant with 30 years professional experience working in senior financial positions with both listed and private companies.
Interests in shares of the company and related bodies corporateAs at the date of this report, the interests of the directors in the shares of Bisalloy Steel Group Limited were:
Number of Ordinary Shares
P J Cave 7,573,562
G Albert 0
K Godson 1,344,766
R Grellman 41,693
D Pong 115,883
DIVIDENDSCents $’000
Final dividend recommended on ordinary shares (fully franked) 2.50 1,105
Dividends paid in the year 2.50 1,102
PRINCIPAL ACTIVITIESThe principal activity of the Group during the financial year was the processing and sale of quenched and tempered, high-tensile, and abrasion resistant steel plates (“Q&T plate”).
OPER ATING AND FINANCIAL REVIEW
OPER ATIONSGROUP
Bisalloy Steel Group comprises Bisalloy Steels Pty Ltd in Australia, the majority owned distribution businesses in Indonesia (PT Bima Bisalloy) and Thailand (Bisalloy Thailand) and the investment in the Chinese CJV – Bisalloy Jigang (Shandong) Steel Plate Co, Ltd.
Safety is a key commitment of the Group with a continued focus on zero harm to all employees, contractors and visitors. All employees across the Group’s operations are empowered under the STAR program to Stop, Think, Act and Respond to any issue in regard to ensuring safe working conditions. For the fourth consecutive year, the Group recorded no Lost Time Injuries across its operations and has now reached a milestone of 1,500+ days Lost Time Injury free.
Bisalloy Steel Group Limited 2017 Annual Report
5
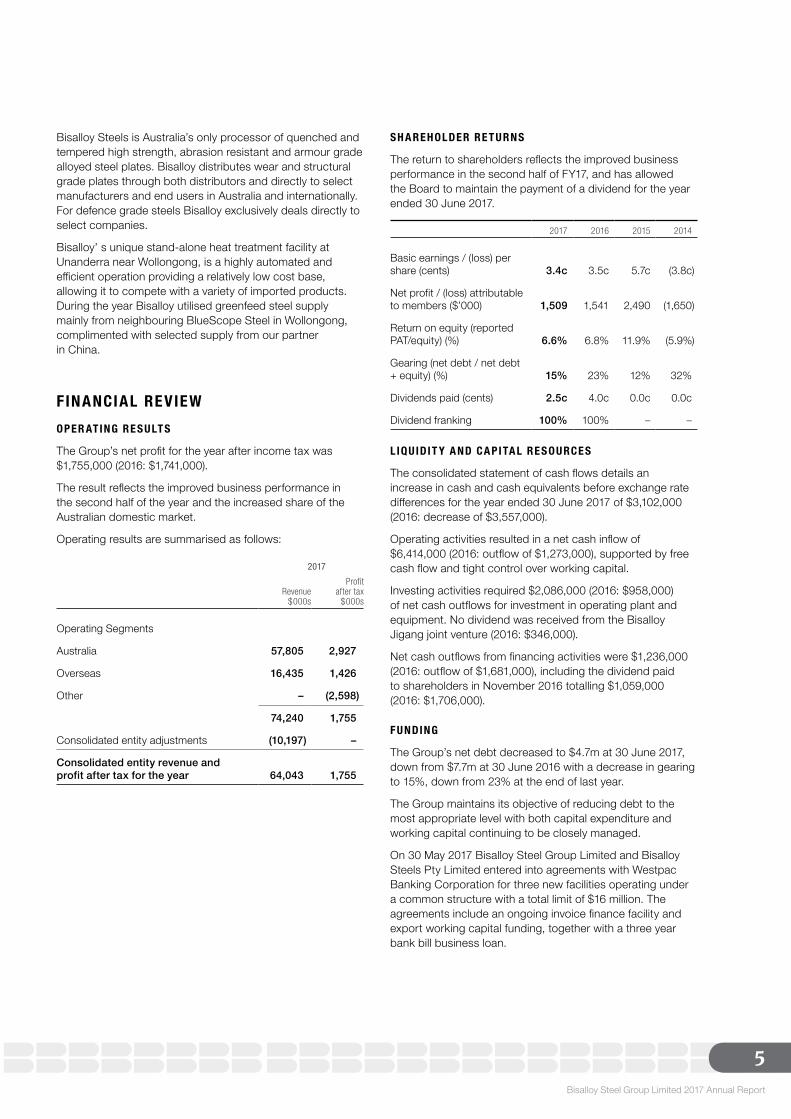
Bisalloy Steels is Australia’s only processor of quenched and tempered high strength, abrasion resistant and armour grade alloyed steel plates. Bisalloy distributes wear and structural grade plates through both distributors and directly to select manufacturers and end users in Australia and internationally. For defence grade steels Bisalloy exclusively deals directly to select companies.
Bisalloy’ s unique stand-alone heat treatment facility at Unanderra near Wollongong, is a highly automated and efficient operation providing a relatively low cost base, allowing it to compete with a variety of imported products. During the year Bisalloy utilised greenfeed steel supply mainly from neighbouring BlueScope Steel in Wollongong, complimented with selected supply from our partner in China.
FINANCIAL REVIEWOPER ATING RE SULT S
The Group’s net profit for the year after income tax was $1,755,000 (2016: $1,741,000).
The result reflects the improved business performance in the second half of the year and the increased share of the Australian domestic market.
Operating results are summarised as follows:
2017
Revenue$000s
Profit after tax
$000s
Operating Segments
Australia 57,805 2,927
Overseas 16,435 1,426
Other – (2,598)
74,240 1,755
Consolidated entity adjustments (10,197) –
Consolidated entity revenue and profit after tax for the year 64,043 1,755
SH A REHOLDER RE T URNS
The return to shareholders reflects the improved business performance in the second half of FY17, and has allowed the Board to maintain the payment of a dividend for the year ended 30 June 2017.
2017 2016 2015 2014
Basic earnings / (loss) per share (cents) 3.4c 3.5c 5.7c (3.8c)
Net profit / (loss) attributable to members ($’000) 1,509 1,541 2,490 (1,650)
Return on equity (reported PAT/equity) (%) 6.6% 6.8% 11.9% (5.9%)
Gearing (net debt / net debt + equity) (%) 15% 23% 12% 32%
Dividends paid (cents) 2.5c 4.0c 0.0c 0.0c
Dividend franking 100% 100% – –
L IQUIDIT Y A ND CA PITA L RE SOURCE S
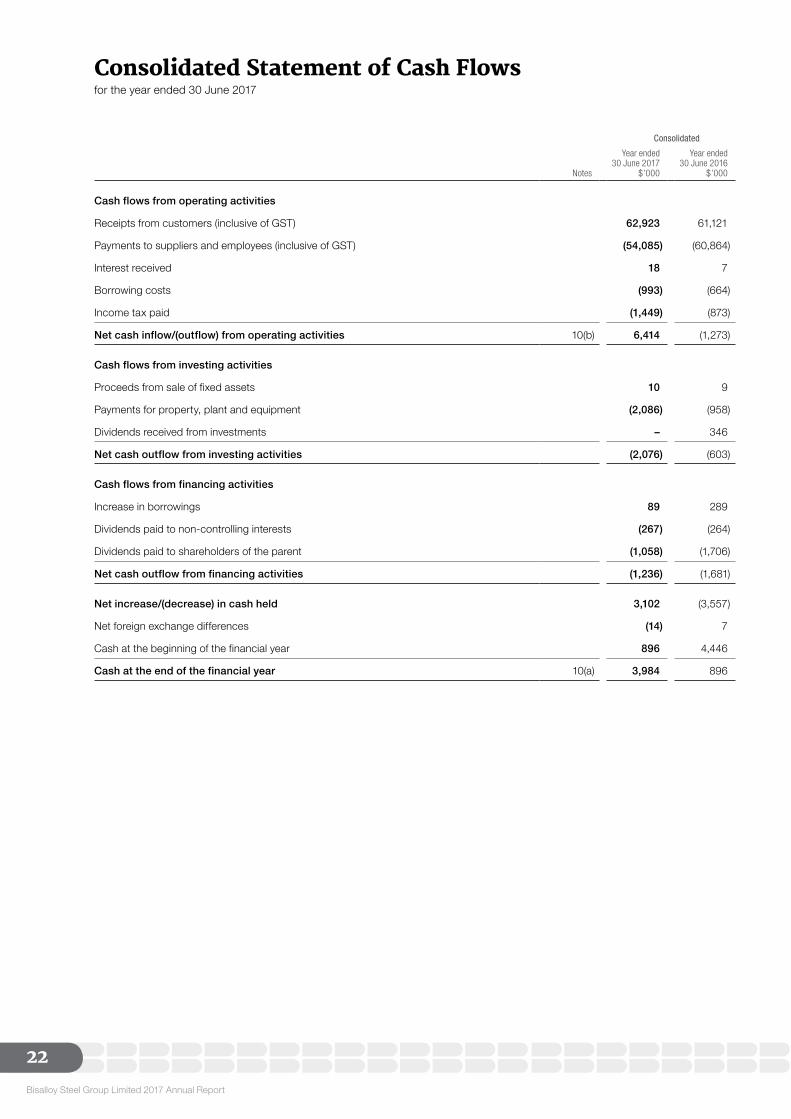
The consolidated statement of cash flows details an increase in cash and cash equivalents before exchange rate differences for the year ended 30 June 2017 of $3,102,000 (2016: decrease of $3,557,000).
Operating activities resulted in a net cash inflow of $6,414,000 (2016: outflow of $1,273,000), supported by free cash flow and tight control over working capital.
Investing activities required $2,086,000 (2016: $958,000) of net cash outflows for investment in operating plant and equipment. No dividend was received from the Bisalloy Jigang joint venture (2016: $346,000).
Net cash outflows from financing activities were $1,236,000 (2016: outflow of $1,681,000), including the dividend paid to shareholders in November 2016 totalling $1,059,000 (2016: $1,706,000).
F UNDING
The Group’s net debt decreased to $4.7m at 30 June 2017, down from $7.7m at 30 June 2016 with a decrease in gearing to 15%, down from 23% at the end of last year.
The Group maintains its objective of reducing debt to the most appropriate level with both capital expenditure and working capital continuing to be closely managed.
On 30 May 2017 Bisalloy Steel Group Limited and Bisalloy Steels Pty Limited entered into agreements with Westpac Banking Corporation for three new facilities operating under a common structure with a total limit of $16 million. The agreements include an ongoing invoice finance facility and export working capital funding, together with a three year bank bill business loan.
Bisalloy Steel Group Limited 2017 Annual Report
6
Directors’ Report continued
BUSINESS STR ATEGY AND OUTLOOKSTR ATEGY
In FY17 Bisalloy focussed on the execution of its strategy of strengthening the current operation in its production and distribution of high performance quench & tempered steel in the Australian domestic market, in conjunction with building on the existing JV operations throughout Asia for future growth opportunities.
A new sales organisation was established, including the appointment of a new Group General Manager of Sales, with the goal of improving the customer experience via an enhanced customer focus. This team is tasked with engaging with the domestic end users and distributors to have Bisalloy at front of mind when purchasing Q&T products and to aggressively claw back market share from imports. Renewed customer services and technical support organisations were created to deliver on the strategy of providing exceptional customer services. Simultaneously, our operation and production teams were tasked to innovatively source raw material, improve efficiency and increase volume to meet the forecast higher demand. As a result, Bisalloy’s market share is already showing signs of improvement.
A refreshed brand was launched with a focus on a clear and consistent message to the market place with a strategy to supply beyond the traditional resource market. This also included developing new Q&T products, including partnering with international Q&T manufacturers, to fill current and future market gaps, which will both improve Bisalloy’s market share, and allow us to service customer requirements which were not previously able to be met.
During FY17 Bisalloy strengthened the Co-operative Joint Venture in China and its Indonesian and Thailand subsidiaries with the strategy to be the significant international Q&T supplier in these markets.
OU TLOOK
Focused efforts to engage with Bisalloy’s traditional customers, while actively seeking new customers, has been a significant driver of the increase in market share in the domestic market. This resulted in high volumes in the third quarter of FY17 with good momentum and a healthy order backlog going into FY18.
Growth in armour grade steels is a major target area for Bisalloy in FY18. Bisalloy is well advanced in its engagement with all major bidders for the Australian defence forces new land vehicles and navy vessels including the DCNS (Naval Group) future submarine project. This has included numerous site visits, briefings, technical and quality audits and reviews. We expect to be in a position to make further announcements about these opportunities during the latter part of 2017.
The traditional resources market is currently stable, albeit at a relatively moderate level compared to historic levels, and this is expected to continue into FY18. Good opportunities exist in the repair and maintenance of mining plant and equipment. An agile and aggressive approach is needed to address
these opportunities in the current climate. Bisalloy has been actively readjusting its operation to accommodate these customer needs with very good results.
There are opportunities for the supply of Bisalloy Q&T to international markets through mining fabricators and we have started to supply spot orders for evaluation. Entry into other non-resources markets is well underway; this will require an addition of products to satisfy grade, thickness and length requirements which Bisalloy is actively working on supplying.
In an exciting new development for Bisalloy, we recently launched a new range of armour steels, Bisalloy Protection Steels, for the non-defence, civilian market. These products are expected to be higher in volume compared to defence armour steels and are aimed to address the increasing worldwide need for government and civilian organisations to provide protection for people, valuables and property. This new range of steel is eminently suited to government and civilian applications including light armoured vehicles, land and sea patrol vehicles, cash-in-transit vehicles, safes and strongboxes, security booths, public and private facilities, safe rooms and many other protective applications.
Bisalloy is planning on FY18 sales and production volumes to be significantly higher than in FY17 and is in the process of establishing a permanent third, night shift, operation. Bisalloy is investing in new cutting, stencilling, measurement and handling machinery and processes which will result in a higher quality product to compete in new markets and will be a requirement to participate in future defence steel projects.
The Group’s Co-operative Joint Venture (CJV) for the production of quench & tempered steel plate is entering an exciting new phase of its development. During FY17 the CJV has actively sought to grow in the premium end of the market in China with excellent results. In an initiative to grow this business beyond the China domestic market, on the back of the Group’s other activities in the Asia and Middle Eastern markets, the Group is targeting to supply CJV products into those markets during FY18. The CJV is forecasting a steady increase in its financial contributions to the Group’s result in FY18.
The Group’s distribution subsidiaries in Indonesia and Thailand are expected to operate profitably with both operations showing good growth opportunities in their respective markets. Indonesia in particular is in a growth stage with plans to continue their strong market position through FY18. They will both be adding the Bisalloy Protection Steel and select CJV products to their offerings.
NE W M A RK E T S
One of Bisalloy’s core strategic priorities is to seek partnerships to grow the business beyond the traditional customer base. This has already created opportunities to develop partnerships that can fill product gaps and provide the transfer of technical know-how, and can relatively easily open new markets for the Group’s products both in Australia and internationally.
For example, during the year Bisalloy entered into a partnership in Dubai with Swebor Stål Sevenska AB. Swebor
Bisalloy Steel Group Limited 2017 Annual Report
7
is a small privately owned producer of high strength steels based in Sweden, which specialises in thin grades of armour steel for the non-defence civilian market, which is outside Bisalloy’s plant capabilities. The teaming of the two company’s complimentary products allows both companies to expand into markets and customers which were not able to be accessed previously, such as the transport industry and light gauge protection steels for civilian defence.
In addition Bisalloy also established a distributorship, also based in Dubai, with Eutectic Castolin the world’s leading producer of welding consumables, welding machines and welded wear plates for the supply of Bisalloy Australian and China made wear and structural grade plates to the Middle East, UAE and Africa.
BUSINESS RISK MANAGEMENTThe Group takes a proactive approach to risk management. The board is responsible for ensuring that risks, and also opportunities, are identified on a timely basis and that the Group’s objectives and activities are aligned with the risks and opportunities identified by the board.
The board has established an Audit and Risk Committee comprising non-executive directors, whose meetings are also attended by the executive director. In addition sub-committees are convened as appropriate in response to issues and risks identified by the board, and the sub-committee further examines the issue and reports back to the board.
The board has a number of mechanisms in place to ensure that management’s objectives and activities are aligned with the risks identified by the board. These include the following:
• Board approval of a strategic plan, which encompasses the Group’s vision, mission and strategy statements, designed to meet stakeholders’ needs and manage business risk.
• Implementation of board approved operating plans and budgets and board monitoring of progress against these budgets, including the establishment and monitoring of KPIs of both a financial and non-financial nature.
• Establishment of committees to report on specific business risks, including for example, such matters as environmental issues and concerns and occupational health and safety.
• Board review of financial risks such as the Group’s liquidity, currency, interest rate and credit policies and exposures and monitors management’s actions to ensure they are in line with Group policy.
The major high level business risk with the greatest potential to materially impact on the financial outlook for the Group is continued upward pressure in energy prices. Both electricity, and natural gas in particular, are integral inputs into the Group’s manufacturing process, and affordable energy resources are critical if the Group is to maintain its competitive advantage. Furthermore supply constraints, market dysfunction and higher gas prices may impact many sectors of the economy including the mining and agricultural
sectors on the demand side and the Group’s ability to source competitively priced raw material on the supply side. Bisalloy Australia currently has forward contacts in place for gas supply through to the end of December 2017, and through to December 2018 for electricity.
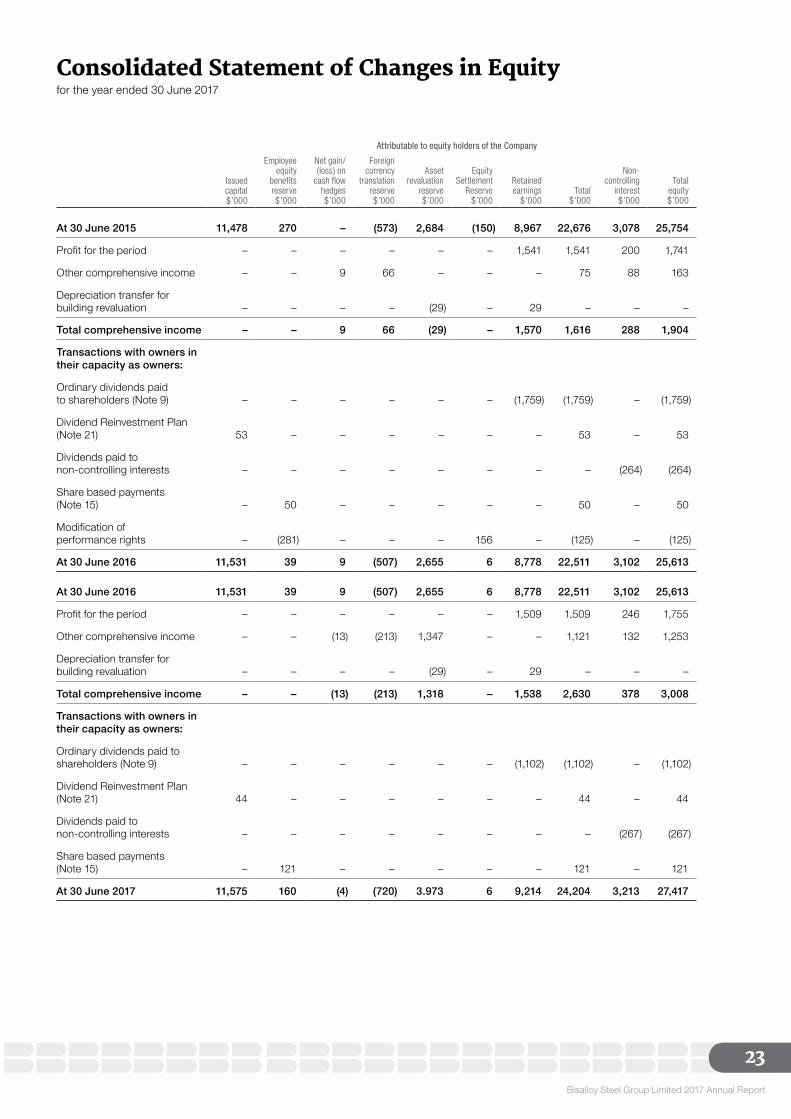
SIGNIFICANT CHANGES IN THE STATE OF AFFAIRSTotal equity increased from $25,613,000 to $27,417,000, an increase of $1,804,000. In addition to the net profit for the year, the Group recorded a revaluation of land and buildings ($1,347,000 net of tax), partially offset by a final dividend totalling $1,102,000 in respect of the year ended 30 June 2016 which was paid to shareholders in November 2016, together with foreign currency translation losses of $518,000 relating to the overseas subsidiaries as a result of the revaluation of the Australian dollar at the end of the year.
SIGNIFICANT EVENTS AF TER THE BAL ANCE DATEThere have been no significant events after the balance date.
INDEMNIFICATION AND INSUR ANCE OF DIRECTORS AND OFFICERSThe Group must, subject to certain exceptions set out in the constitution, indemnify each of its officers on a full indemnity basis and to the full extent permitted by law against all losses, liabilities, costs, charges and expenses incurred by the officer, as an officer of the Group (including all liabilities incurred where the officer acts as an officer of any other body corporate at the request of the Group) including any liability for negligence and for reasonable legal costs.
During the year or since the end of the year, the Group has paid premiums in respect of a directors and officers liability insurance policy. Details of the nature of the liabilities covered or the amount of the premium paid in respect of the policy have not been disclosed, as such disclosure is prohibited under the terms of the contract.
ENVIRONMENTAL REGUL ATIONThe Group’s activities are governed by a range of environmental legislation and regulations. The Group utilises both internal and external environmental assessments to verify its compliance with applicable environmental legislation and regulations.
The Group is registered under National Greenhouse and Energy Reporting Act 2007 under which it is required to report energy consumption and greenhouse gas emissions for its Australian facilities. The Group has implemented systems and processes for the collection and calculation of the data to meet its reporting requirements.
Bisalloy Steel Group Limited 2017 Annual Report
8
Directors’ Report continued
The Board believes that the consolidated entity has adequate systems in place for the management of its environmental requirements and is not aware of any breach of those environmental requirements as they apply to the consolidated entity.
ROUNDINGThe amounts contained in this report and in the financial report have been rounded to the nearest $1,000 (where rounding is applicable) under the option available to the company under ASIC Corporations Instrument 2016/191. The company is an entity to which the Class Order applies.
AUDITOR INDEPENDENCEThe directors received the declaration on page 19 from the auditor of Bisalloy Steel Group Limited which forms part of this report.
INDEMNIFICATION OF AUDITORSTo the extent permitted by law, the Company has agreed to indemnify its auditors, Ernst & Young, as part of the terms of its audit engagement agreement against claims by third parties arising from the audit (for an unspecified amount). No payment has been made to indemnify Ernst & Young during or since the financial year.
NON-AUDIT SERVICESNo non audit services were provided by the Company’s auditor, Ernst & Young in relation to the year ended 30 June 2017.
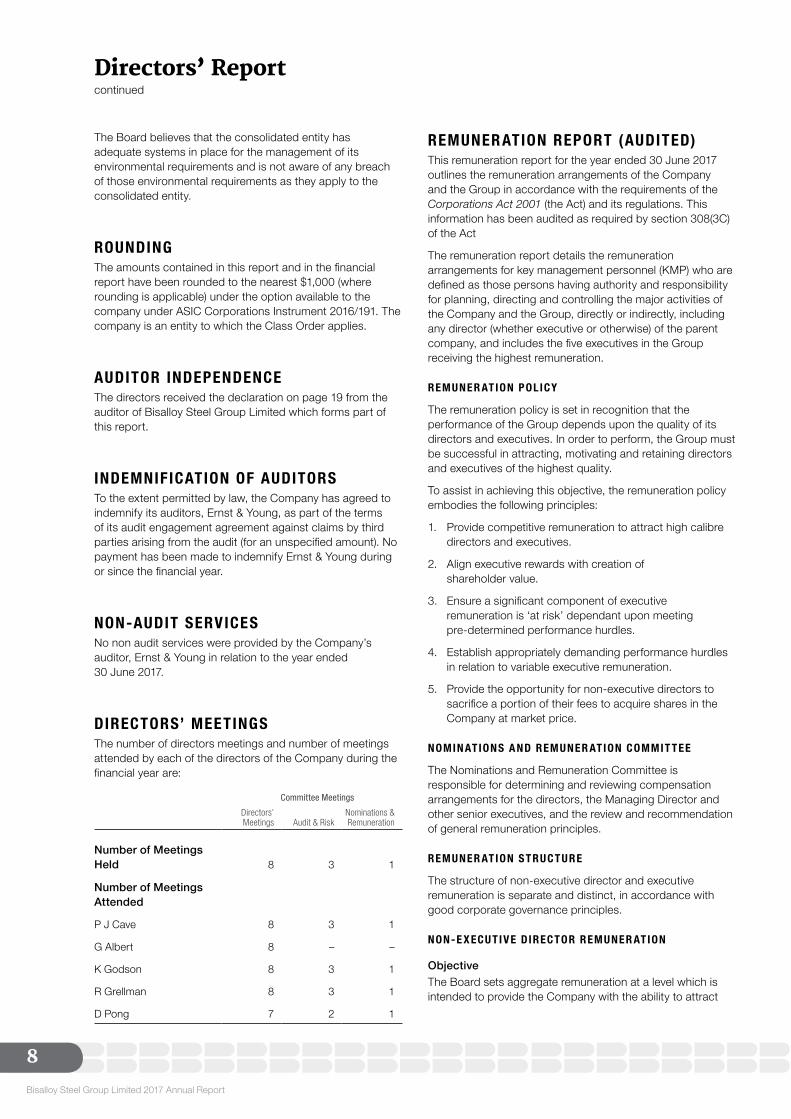
DIRECTORS’ MEETINGSThe number of directors meetings and number of meetings attended by each of the directors of the Company during the financial year are:
Committee Meetings
Directors’Meetings Audit & Risk
Nominations &Remuneration
Number of Meetings Held 8 3 1
Number of Meetings Attended
P J Cave 8 3 1
G Albert 8 – –
K Godson 8 3 1
R Grellman 8 3 1
D Pong 7 2 1
REMUNER ATION REPORT (AUDITED)This remuneration report for the year ended 30 June 2017 outlines the remuneration arrangements of the Company and the Group in accordance with the requirements of the Corporations Act 2001 (the Act) and its regulations. This information has been audited as required by section 308(3C) of the Act
The remuneration report details the remuneration arrangements for key management personnel (KMP) who are defined as those persons having authority and responsibility for planning, directing and controlling the major activities of the Company and the Group, directly or indirectly, including any director (whether executive or otherwise) of the parent company, and includes the five executives in the Group receiving the highest remuneration.
REMUNER ATION POL ICY
The remuneration policy is set in recognition that the performance of the Group depends upon the quality of its directors and executives. In order to perform, the Group must be successful in attracting, motivating and retaining directors and executives of the highest quality.
To assist in achieving this objective, the remuneration policy embodies the following principles:
1. Provide competitive remuneration to attract high calibre directors and executives.
2. Align executive rewards with creation of shareholder value.
3. Ensure a significant component of executive remuneration is ‘at risk’ dependant upon meeting pre-determined performance hurdles.
4. Establish appropriately demanding performance hurdles in relation to variable executive remuneration.
5. Provide the opportunity for non-executive directors to sacrifice a portion of their fees to acquire shares in the Company at market price.
NOMIN ATIONS A ND REMUNER ATION COMMIT TEE
The Nominations and Remuneration Committee is responsible for determining and reviewing compensation arrangements for the directors, the Managing Director and other senior executives, and the review and recommendation of general remuneration principles.
REMUNER ATION STRUCT URE
The structure of non-executive director and executive remuneration is separate and distinct, in accordance with good corporate governance principles.
NON-E XECU T IV E DIRECTOR REMUNER ATION
ObjectiveThe Board sets aggregate remuneration at a level which is intended to provide the Company with the ability to attract
Bisalloy Steel Group Limited 2017 Annual Report
9
and retain non-executive directors of the highest calibre, whilst incurring a cost which is acceptable to shareholders.
StructureThe Company’s constitution and the ASX listing rules specify that the non-executive director fee pool shall be determined from time to time by a general meeting. The non-executive director fee pool is currently set at $500,000. The board will not seek any increase for the fee pool at the 2017 AGM.
The remuneration of non-executive directors must not include a commission on, or a percentage of, profits or operating revenue but non-executive directors are entitled to be reimbursed for travelling and other expenses incurred in attending to the Company’s affairs.
Each non-executive director receives a fee for being a non-executive director of the Company and an additional fee for each Board Committee on which a non-executive director sits. The payment of additional fees for serving on a committee recognises the additional time commitment required by directors who serve on one or more sub committees.
Non-executive directors are encouraged by the Board to hold shares in the Company and are able to participate in the Non-executive Director (“NED”) Share Plan. Under the NED Share Plan a non-executive director can choose to sacrifice up to 100% of their annual director’s fee and instead be allocated shares up to the equivalent value. The value of the allocated shares is determined by reference to the market value on the day they are acquired on market.
The remuneration of non-executive directors for the period ended 30 June 2017 is detailed in the table on page 11 of this report.
E XECU T IV E DIRECTOR A ND E XECU T IV E M A N AGER REMUNER ATION
ObjectiveThe Group aims to reward executives with a level and mix of remuneration commensurate with their duties and responsibilities within the Group and to:
• reward executives for Group, business unit and individual performance measured against targets set by reference to appropriate benchmarks;
• link reward with the achievement of the Group’s strategic goals;
• align the interests of executives with those of shareholders; and
• ensure total remuneration is competitive.
StructureExecutive director and executive manager remuneration consists of the following key components:
1. Fixed Remuneration
2. Variable Remuneration made up of:
– Short Term Incentive (STI); and
– Long Term Incentive (LTI)
The proportion of total remuneration that is fixed or variable (either short term or long term incentives) is determined for each individual executive by the Nominations & Remuneration Committee.
The remuneration of members of management who have the authority and responsibility for planning, directing and controlling the activities of the Group for the year ended 30 June 2017 is detailed in the table on page 11 of this report.
F IXED REMUNER ATION
ObjectiveThe level of fixed remuneration is set so as to provide a base level of remuneration which is both commensurate with the individual’s duties and responsibilities within the Group and competitive in the market.
Fixed remuneration is reviewed annually by the Nominations and Remuneration Committee utilising a process of reviewing group-wide, business unit and individual performance, relevant comparative remuneration in the market and internal and external advice on policies and practice.
StructureExecutive directors and executive managers are provided with the opportunity to receive their fixed remuneration in a variety of forms, including cash, additional superannuation contributions and fringe benefits such as motor vehicles. The aim is to provide payments in a form that is both optimal for the recipient and cost efficient for the Group.
The fixed remuneration component of executive directors and members of management who have the authority and responsibility for planning, directing and controlling the activities of the Group for the year ended 30 June 2017 is detailed in the table on page 11 of this report.
VA RIA BLE REMUNER ATION – SHORT TERM INCENTIV E S (ST I )
ObjectiveThe STI program has been designed to align the remuneration received by executive directors and executive managers with the achievement of the Group’s operational and financial targets. The total potential STI available for payment is determined so as to provide sufficient incentive to executive directors and executive managers to achieve the targets and so that the cost to the Group is reasonable in the circumstances.
StructureThe actual STI payments granted to each executive director and executive manager depends upon the extent to which specific operational and financial targets set at the beginning of the financial year are met. The targets consist of a number of both financial and non-financial Key Performance Indicators (KPIs).
After the end of each financial year, consideration is given to performance against each of these KPIs to determine the extent of any payment to an individual executive director
Bisalloy Steel Group Limited 2017 Annual Report
10
Directors’ Report continued
or executive manager. The aggregate of STI payments and STI payments to individuals is subject to the approval of the Nominations & Remuneration Committee.
Payments made are normally paid as cash but the recipient is also able to elect to receive payment in alternative forms.
VA RIA BLE REMUNER ATION – LONG TERM INCENTIV E S ( LT I )
ObjectiveThe LTI program has been designed to align the remuneration received by executive directors and executive managers with the creation of shareholder wealth.
Consequently LTI grants are only made to executives who are in a position to influence shareholder wealth and thus have the opportunity to influence the company’s performance against the relevant long term performance hurdles.
StructureAt the 2015 Annual General Meeting, a LTI plan was renewed for LTI grants to executives in the form of share rights.
These rights are granted in two equal parts. The first part is based on retention and requires the holder remain an employee for three years from grant date. The second part is based on delivering superior long-term performance as measured by Return on Equity (“ROE”), with each grant of rights divided into three equal tranches. For each tranche, actual ROE is measured against a budget ROE and a stretch ROE as determined annually by the board in respect of the forthcoming year. The proportion of the rights which vest depend on where within this range the Group performs, with 100% vesting on achieving the stretch ROE and no rights vesting if actual ROE is less than 90% of the budgeted ROE. For the 2017 year, the stretch ROE was set at 115% of the budget ROE. Any rights to which the employee may become entitled on achieving the performance criteria, are still subject to the three year retention criteria before they can vest.
Any share rights which do not vest, as a result of the relevant performance condition not being satisfied, lapse. If the holder leaves the business, the unvested rights lapse on the leaving date unless the board determines otherwise. In the event of a change in control of the Group, the vesting date will generally be brought forward to the date of change of control and share rights will vest subject to performance over this shortened period, subject to ultimate board discretion.
Once vested a holder may exercise his share rights and be allocated a fully paid ordinary share of Bisalloy Steel Group Ltd at no cost to the employee.
A total of 400,000 share rights (2016: 2,000,000) were granted under this scheme during the year.
GROUP PERFORM A NCE
The board has determined that whilst the Group did not meet its budgeted ROE for the year, as it did not exceed 90% of the budgeted ROE, 17% of the performance components of the 2017 share rights have vested.
For further detail of historical performance, refer to the shareholder returns section earlier in this Directors’ report.
DE TA IL S OF K E Y M A N AGEMENT PERSONNEL OF THE COMPA N Y A ND GROUP
(i) Directors
P Cave Non-executive Chairman
R Grellman Non-executive Director
K Godson Non-executive Director
D Pong Non-executive Director
G Albert Managing Director
(ii) Executives
D Collins Chief Financial Officer and Company Secretary
S Gleeson General Manager Sales & Marketing (appointed 6 October 2016)
A Huckstepp Operations Manager (appointed 1 July 2016)
T Matinca Business Development and Strategy Manager (ceased 1 July 2016)
M Bradmore Operations Manager (ceased 1 July 2016)
M Sampson Sales and Marketing Manager (resigned 24 February 2017)
E XECU T IV E CONTR ACT S
Remuneration arrangements for the key management personnel are formalised in employment contracts.
Details of these contracts are provided below.
G Albert – Managing Director
• Regular employment contract without fixed term• Participation in STI and LTI schemes• 6 months notice required for termination of employment
by employee• 12 months notice required for termination by company
D Collins – Chief Financial Officer & Company Secretary
• Regular employment contract without fixed term• Participation in STI and LTI schemes• 3 months notice required for termination of employment
by employee• 6 months notice required for termination by company
S Gleeson – General Manager Sales & Marketing
• Regular employment contract without fixed term• Participation in STI and LTI schemes• 3 months notice required for termination of employment
A Huckstepp – Operations manager
• Regular employment contract without fixed term• Participation in STI and LTI schemes• 3 months notice required for termination of employment
Bisalloy Steel Group Limited 2017 Annual Report
11
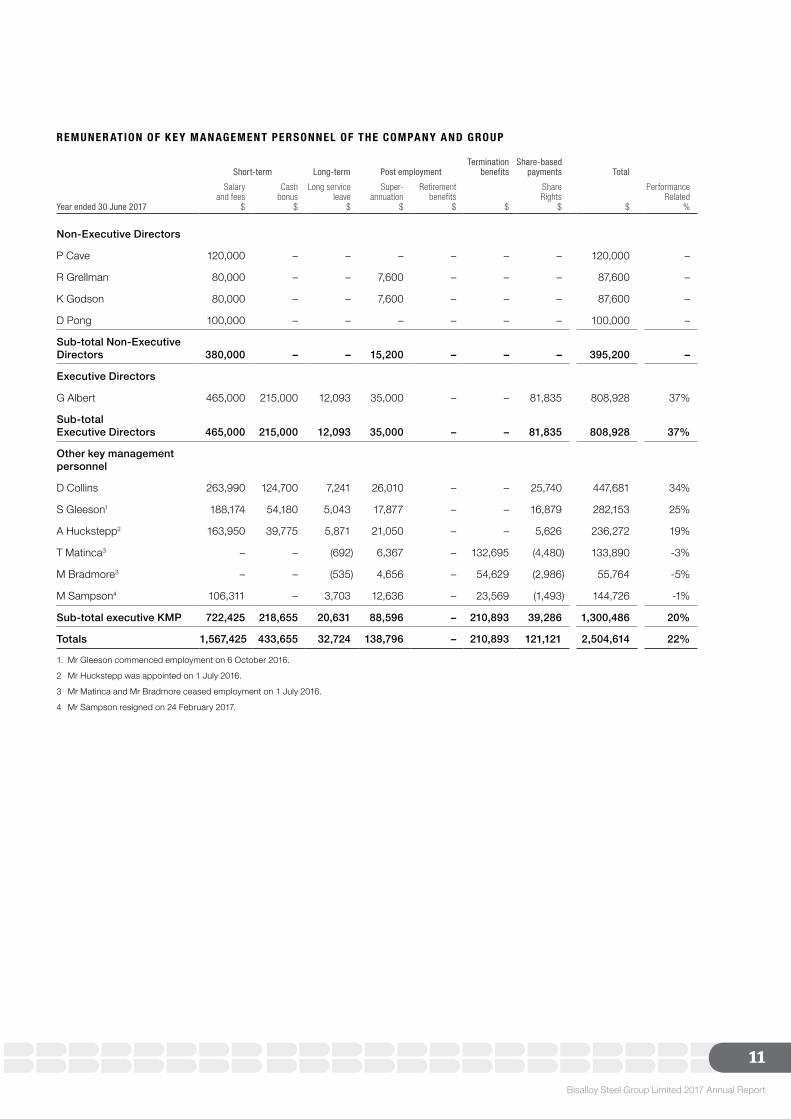
REMUNER ATION OF K E Y M A N AGEMENT PERSONNEL OF THE COMPA N Y A ND GROUP
Short-term Long-term Post employmentTermination
benefitsShare-based
payments Total
Year ended 30 June 2017
Salary and fees
$
Cash bonus
$
Long service leave
$
Super-annuation
$
Retirement benefits
$ $
ShareRights
$ $
Performance Related
%
Non-Executive Directors
P Cave 120,000 – – – – – – 120,000 –
R Grellman 80,000 – – 7,600 – – – 87,600 –
K Godson 80,000 – – 7,600 – – – 87,600 –
D Pong 100,000 – – – – – – 100,000 –
Sub-total Non-Executive Directors 380,000 – – 15,200 – – – 395,200 –
Executive Directors
G Albert 465,000 215,000 12,093 35,000 – – 81,835 808,928 37%
Sub-total Executive Directors 465,000 215,000 12,093 35,000 – – 81,835 808,928 37%
Other key management personnel
D Collins 263,990 124,700 7,241 26,010 – – 25,740 447,681 34%
S Gleeson1 188,174 54,180 5,043 17,877 – – 16,879 282,153 25%
A Huckstepp2 163,950 39,775 5,871 21,050 – – 5,626 236,272 19%
T Matinca3 – – (692) 6,367 – 132,695 (4,480) 133,890 -3%
M Bradmore3 – – (535) 4,656 – 54,629 (2,986) 55,764 -5%
M Sampson4 106,311 – 3,703 12,636 – 23,569 (1,493) 144,726 -1%
Sub-total executive KMP 722,425 218,655 20,631 88,596 – 210,893 39,286 1,300,486 20%
Totals 1,567,425 433,655 32,724 138,796 – 210,893 121,121 2,504,614 22%
1. Mr Gleeson commenced employment on 6 October 2016.
2 Mr Huckstepp was appointed on 1 July 2016.
3 Mr Matinca and Mr Bradmore ceased employment on 1 July 2016.
4 Mr Sampson resigned on 24 February 2017.
Bisalloy Steel Group Limited 2017 Annual Report
12
Directors’ Report continued
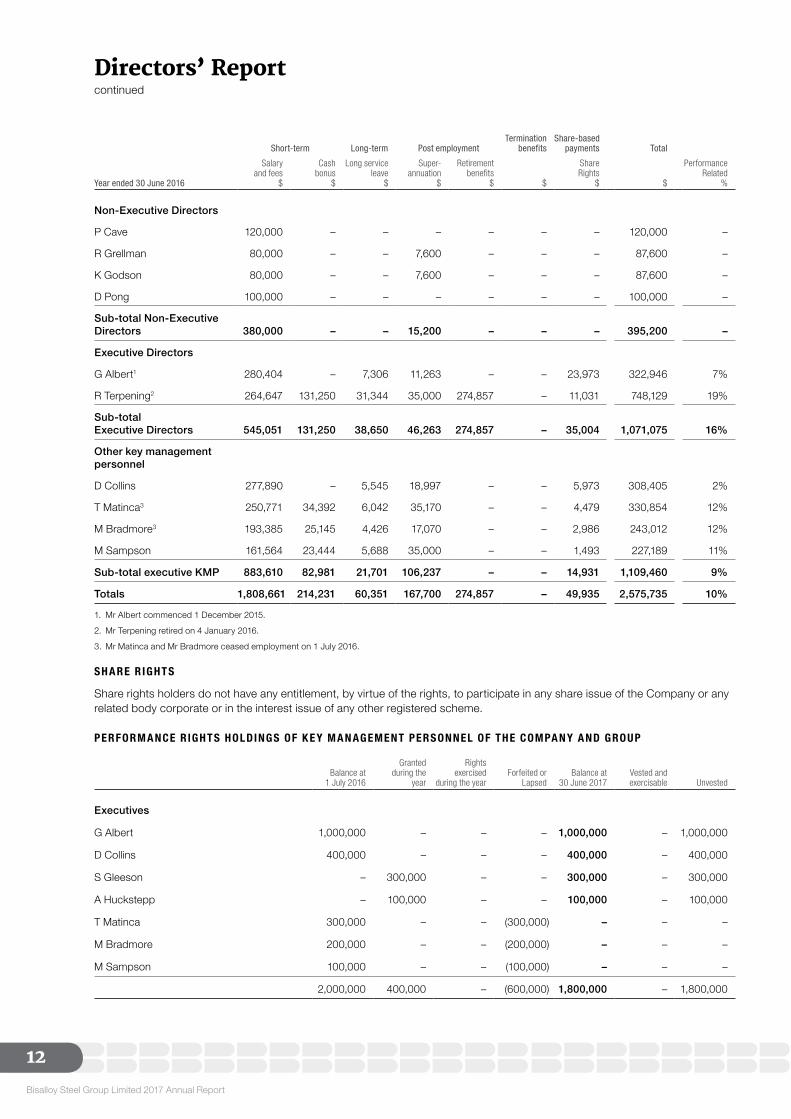
Short-term Long-term Post employmentTermination
benefitsShare-based
payments Total
Year ended 30 June 2016
Salary and fees
$
Cash bonus
$
Long service leave
$
Super-annuation
$
Retirement benefits
$ $
ShareRights
$ $
Performance Related
%
Non-Executive Directors
P Cave 120,000 – – – – – – 120,000 –
R Grellman 80,000 – – 7,600 – – – 87,600 –
K Godson 80,000 – – 7,600 – – – 87,600 –
D Pong 100,000 – – – – – – 100,000 –
Sub-total Non-Executive Directors 380,000 – – 15,200 – – – 395,200 –
Executive Directors
G Albert1 280,404 – 7,306 11,263 – – 23,973 322,946 7%
R Terpening2 264,647 131,250 31,344 35,000 274,857 – 11,031 748,129 19%
Sub-total Executive Directors 545,051 131,250 38,650 46,263 274,857 – 35,004 1,071,075 16%
Other key management personnel
D Collins 277,890 – 5,545 18,997 – – 5,973 308,405 2%
T Matinca3 250,771 34,392 6,042 35,170 – – 4,479 330,854 12%
M Bradmore3 193,385 25,145 4,426 17,070 – – 2,986 243,012 12%
M Sampson 161,564 23,444 5,688 35,000 – – 1,493 227,189 11%
Sub-total executive KMP 883,610 82,981 21,701 106,237 – – 14,931 1,109,460 9%
Totals 1,808,661 214,231 60,351 167,700 274,857 – 49,935 2,575,735 10%
1. Mr Albert commenced 1 December 2015.
2. Mr Terpening retired on 4 January 2016.
3. Mr Matinca and Mr Bradmore ceased employment on 1 July 2016.
SH A RE R IGHT S
Share rights holders do not have any entitlement, by virtue of the rights, to participate in any share issue of the Company or any related body corporate or in the interest issue of any other registered scheme.
PERFORM A NCE R IGHT S HOLDINGS OF K E Y M A N AGEMENT PERSONNEL OF THE COMPA N Y A ND GROUP
Balance at
1 July 2016
Granted during the
year
Rights exercised
during the yearForfeited or
LapsedBalance at
30 June 2017Vested andexercisable Unvested
Executives
G Albert 1,000,000 – – – 1,000,000 – 1,000,000
D Collins 400,000 – – – 400,000 – 400,000
S Gleeson – 300,000 – – 300,000 – 300,000
A Huckstepp – 100,000 – – 100,000 – 100,000
T Matinca 300,000 – – (300,000) – – –
M Bradmore 200,000 – – (200,000) – – –
M Sampson 100,000 – – (100,000) – – –
2,000,000 400,000 – (600,000) 1,800,000 – 1,800,000
Bisalloy Steel Group Limited 2017 Annual Report
13
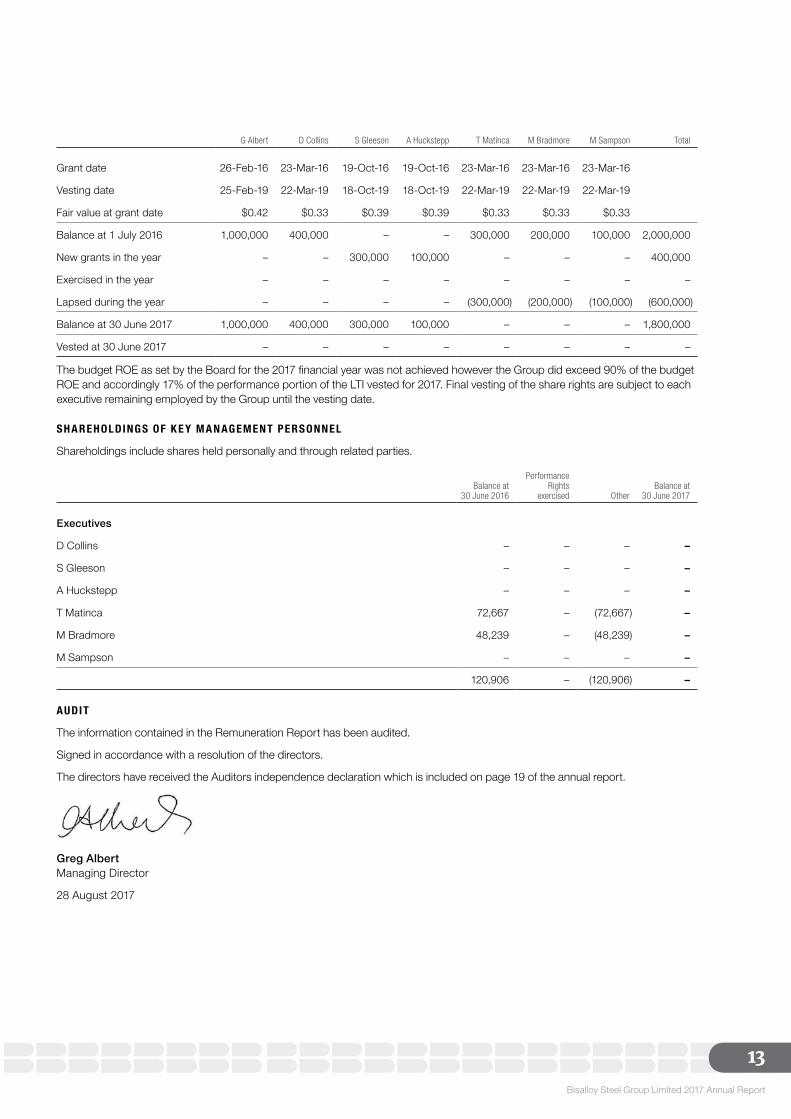
G Albert D Collins S Gleeson A Huckstepp T Matinca M Bradmore M Sampson Total
Grant date 26-Feb-16 23-Mar-16 19-Oct-16 19-Oct-16 23-Mar-16 23-Mar-16 23-Mar-16
Vesting date 25-Feb-19 22-Mar-19 18-Oct-19 18-Oct-19 22-Mar-19 22-Mar-19 22-Mar-19
Fair value at grant date $0.42 $0.33 $0.39 $0.39 $0.33 $0.33 $0.33
Balance at 1 July 2016 1,000,000 400,000 – – 300,000 200,000 100,000 2,000,000
New grants in the year – – 300,000 100,000 – – – 400,000
Exercised in the year – – – – – – – –
Lapsed during the year – – – – (300,000) (200,000) (100,000) (600,000)
Balance at 30 June 2017 1,000,000 400,000 300,000 100,000 – – – 1,800,000
Vested at 30 June 2017 – – – – – – – –
The budget ROE as set by the Board for the 2017 financial year was not achieved however the Group did exceed 90% of the budget ROE and accordingly 17% of the performance portion of the LTI vested for 2017. Final vesting of the share rights are subject to each executive remaining employed by the Group until the vesting date.
SH A REHOLDINGS OF K E Y M A N AGEMENT PERSONNEL
Shareholdings include shares held personally and through related parties.
Balance at
30 June 2016
Performance Rights
exercised OtherBalance at
30 June 2017
Executives
D Collins – – – –
S Gleeson – – – –
A Huckstepp – – – –
T Matinca 72,667 – (72,667) –
M Bradmore 48,239 – (48,239) –
M Sampson – – – –
120,906 – (120,906) –
AUDIT
The information contained in the Remuneration Report has been audited.
Signed in accordance with a resolution of the directors.
The directors have received the Auditors independence declaration which is included on page 19 of the annual report.
Greg Albert Managing Director
28 August 2017
Bisalloy Steel Group Limited 2017 Annual Report
14
The board of directors of Bisalloy Steel Group Limited is responsible for establishing the corporate governance framework of the Group having regard to the ASX Corporate Governance Council (CGC) published guidelines as well as its corporate governance principles and recommendations. The board guides and monitors the business and affairs of Bisalloy on behalf of the shareholders by whom they are elected and to whom they are accountable.
The tables below summarise the Group’s compliance with the CGC’s recommendations.
The Company’s website, from which the documents referred to can be accessed, is at www.bisalloy.com.au
RecommendationComplyYes/No Reference/Explanation
PRINCIPLE 1 – LAY SOLID FOUNDATIONS FOR MANAGEMENT AND OVERSIGHT
1.1 Companies should establish the functions reserved to the board and those delegated to senior executives and disclose those functions.
Yes The board has a formal Corporate Governance Code which sets out the respective roles and responsibilities of the board and management. In addition, the board committees have specific Charters which provide further details on the matters reserved for the board or its committees.
1.2 Companies should disclose the process for evaluating the performance of senior executives.
Yes A formal structured review is undertaken each year for each employee. Senior executives are reviewed by the CEO and input provided by the Chair. This process generally takes place in May each year.
1.3 Additional information. The Corporate Governance Code and other relevant charters are available on the Company’s website.
PRINCIPLE 2 – STRUCTURE THE BOARD TO ADD VALUE
2.1 A majority of the board should be independent directors.
Yes The board currently has five directors, three of whom are considered independent. The board has adopted the CGC’s guidelines as the basis for determining whether a director can be considered independent and has set relevant thresholds for materiality. Whether or not a director meets the CGC guidelines for independence, each director is expected to exercise unfettered and independent judgement.
The following directors are considered independent:
• Mr Grellman• Mr Godson• Mr Pong
2.2 The chair should be an independent director.
No The board believes that while the Chairman is not independent, the current composition of the board with its combined skills and capability, best serves the interests of the shareholders.
2.3 The roles of chair and chief executive officer should not be exercised by the same individual.
Yes The roles of chair and chief executive officer are not exercised by the same individual.
2.4 The board should establish a nomination committee.
Yes The Company has a combined Remuneration & Nominations Committee. The charter can be reviewed on the Company’s website.
Corporate Governance Statement 2017
14
Bisalloy Steel Group Limited 2017 Annual Report
15
RecommendationComplyYes/No Reference/Explanation
2.5 Companies should disclose the process for evaluating the performance of the board, its committees and individual directors.
Yes The Chair monitors the performance of the board and conducts informal meetings with the other directors during the year. The board undertakes a formal review every 12 to 18 months. The review includes:
• examination of the effectiveness and composition of the board, including the required mix of skills, experience and other qualities which the non-executive directors should bring to the board for it to function competently and efficiently;
• review of Bisalloy’s strategic direction and objectives;• assessment of the Managing Director’s performance by the
non-executive directors;• assessment of whether corporate governance practices are
appropriate and reflect “good practice”; and• assessment of whether the expectations of differing
stakeholders have been met.
As part of this process the Chairman also:
• meets with the senior executives to discuss with them their views of the board’s performance and level of involvement;
• discusses each individual director’s contributions face-to-face as appropriate; and
• meets with the other non-executive directors without any management present (this is in addition to the consideration of the Managing Director’s performance and remuneration which is conducted in the absence of the Managing Director).
2.6 Additional information Details of the composition, skills, experience, term in office, attendance at meetings of the members of the board at the date of this statement are set out in the Directors’ Report.
PRINCIPLE 3 – PROMOTE ETHICAL AND RESPONSIBLE DECISION-MAKING
3.1 Companies should establish a code of conduct and disclose the code or a summary of the code as to:
• the practices necessary to maintain confidence in the company’s integrity
• the practices necessary to take into account their legal obligations and the reasonable expectations of their stakeholders
• the responsibility and accountability of individuals for reporting and investigating reports of unethical practices.
Yes The Group has an established Code of Conduct which applies to all employees, officers and directors of the Group. An annual adherence declaration is required of each employee as part of their performance appraisal discussed at Principle 1.2.
The Code of Conduct has four key principles as follows:
1. We respect each other and treat all people fairly
2. We respect the law and act accordingly
3. We act honestly and fairly in all our business activities and relationships
4. We use Bisalloy’s property responsibly and in the best interests of Bisalloy:
The Group also has a number of other policies and standards which underpin the Code of Conduct including policies on Appropriate Workplace Behaviour, Equal Employment Opportunity, Safety, Fitness for Work, Workplace Harassment and Discrimination. Together these form a framework for ethical and responsible decision making and proscribe how the individuals of the Group behave internally and externally.
In addition, the board has an established Corporate Governance Code as discussed under Recommendation 1.
Bisalloy Steel Group Limited 2017 Annual Report
16
Corporate Governance Statement 2017 continued
RecommendationComplyYes/No Reference/Explanation
3.2 Companies should establish a policy concerning diversity and disclose the policy or a summary of that policy. The policy should include requirements for the board to establish measurable objectives for achieving gender diversity for the board to assess annually both the objectives and progress in achieving them.
No The Company has an Equal Employment Opportunity Policy under which it commits to ensuring applicants for employment are drawn from a full cross section of the community and that the merit principle forms the basis of recruitment and promotion. In light of the total number of employees and low turnover levels in all management levels of the Group, the board believes that little effective benefit would be achieved from the setting of measurable objectives for achieving gender diversity and that the interests of the Group are best served in this case by rigorous application of the merit principle in all recruitment and promotion decisions.
3.3 Companies should disclose in each annual report the measurable objectives for achieving gender diversity set by the board in accordance with the diversity policy and progress toward achieving them.
No Measurable objectives for achieving gender diversity are not set by the board as discussed under Principle 3.2.
3.4 Companies should disclose in each annual report the proportion of women employees in the whole organisation, women in senior executive positions and women on the board.
Yes 10% of employees across the organisation are women and there are no women in senior executive positions or on the board.
3.5 Additional information The Equal Employment Opportunity Policy is available on the Company website.
PRINCIPLE 4 – SAFEGUARD INTEGRITY IN FINANCIAL REPORTING
4.1 The board should establish an audit committee.
Yes The Company has an Audit & Risk Committee.
4.2 The audit committee should be structured so that it:
• consists only of non-executive directors
• consists of a majority of independent directors
• is chaired by an independent chair, who is not chair of the board
• has at least three members
Yes At the date of this report and throughout the reporting period the Company’s Audit and Risk Committee was:
• comprised of non-executive directors being Mr Grellman, Mr Cave, Mr Godson and Mr Pong.
• chaired by Mr Grellman• governed by a Charter approved by the Board• sufficiently autonomous to be able to discharge its duties
and responsibilities including the authority to select, retain and terminate external advisers as the Committee considers necessary without seeking approval of the board or management.
4.3 The audit committee should have a formal charter.
Yes The Audit & Risk Committee is governed by a formal Charter and is responsible for ensuring that an effective internal control framework exists within the Group. This includes internal controls for effective reporting of financial information, the appropriate application and amendment of accounting policies and the identification and management of risk.
4.4 Additional information. Full details in relation to names, skills, term of office and attendance at meetings for each member of the Committee are set out in the Directors’ Report.
The Audit & Risk Committee Charter is available on the Company’s website.
Bisalloy Steel Group Limited 2017 Annual Report
17
RecommendationComplyYes/No Reference/Explanation
PRINCIPLE 5 – MAKE TIMELY AND BALANCED DISCLOSURE
5.1 Establish written policies designed to ensure compliance with ASX Listing Rule disclosure requirements and to ensure accountability at a senior executive level for that compliance and disclose those policies or a summary of those policies.
Yes The Group has a formal Continuous Disclosure Policy. The policy aims to ensure that once management becomes aware of any information concerning the Group that a reasonable person would expect to have a material effect on the price or value of the Company’s shares (subject to the relevant exceptions), that such information is released to the market.
The board is committed to ensuring all investors have equal and timely access to material information concerning the Group and that the Group’s announcements are factual and presented in a clear and balanced way.
The Company Secretary is the person responsible for continuous disclosure and communicating with the ASX. This role includes responsibility for ensuring compliance with the continuous disclosure requirements under the ASX Listing Rules and overseeing and co-ordinating information disclosed to the ASX, market participants and the public.
5.2 Additional information The Company’s Continuous Disclosure Policy is available on the Company’s website.
PRINCIPLE 6 – RESPECT THE RIGHTS OF SHAREHOLDERS
6.1 Design a communications policy for promoting effective communication with shareholders and encouraging their participation at general meetings and disclose their policy or a summary of that policy.
Yes In order to facilitate shareholders accessing information about the Group, all Group announcements, briefings, presentations and reports are posted on the Company’s website after release. The website includes additional news items about the activities of the Group which are not market sensitive.
Shareholders are entitled to receive a copy of the Annual Report and can elect the method by which it is delivered. The Group encourages shareholders to elect to receive the Annual Report and other correspondence from the Company electronically and requires shareholders to ‘opt in’ if they wish to receive a hard copy of the report.
Shareholders are encouraged to attend for the Annual General Meeting as full use is made of the occasion to inform shareholders of current developments through presentations and the opportunity to ask questions of management and the Group’s external auditors.
PRINCIPLE 7 – RECOGNISE AND MANAGE RISK
7.1 Companies should establish policies for the oversight and management of material business risks and disclose a summary of those policies.
Yes The board has allocated responsibility to the Audit & Risk Committee to ensure there are adequate polices, procedures and control systems in relation to risk management and compliance.
The Committee reviews and approves polices pertaining to material business risks to ensure they are current and adequately address the necessary aspects of risk management.
Bisalloy Steel Group Limited 2017 Annual Report
18
Corporate Governance Statement 2017 continued
RecommendationComplyYes/No Reference/Explanation
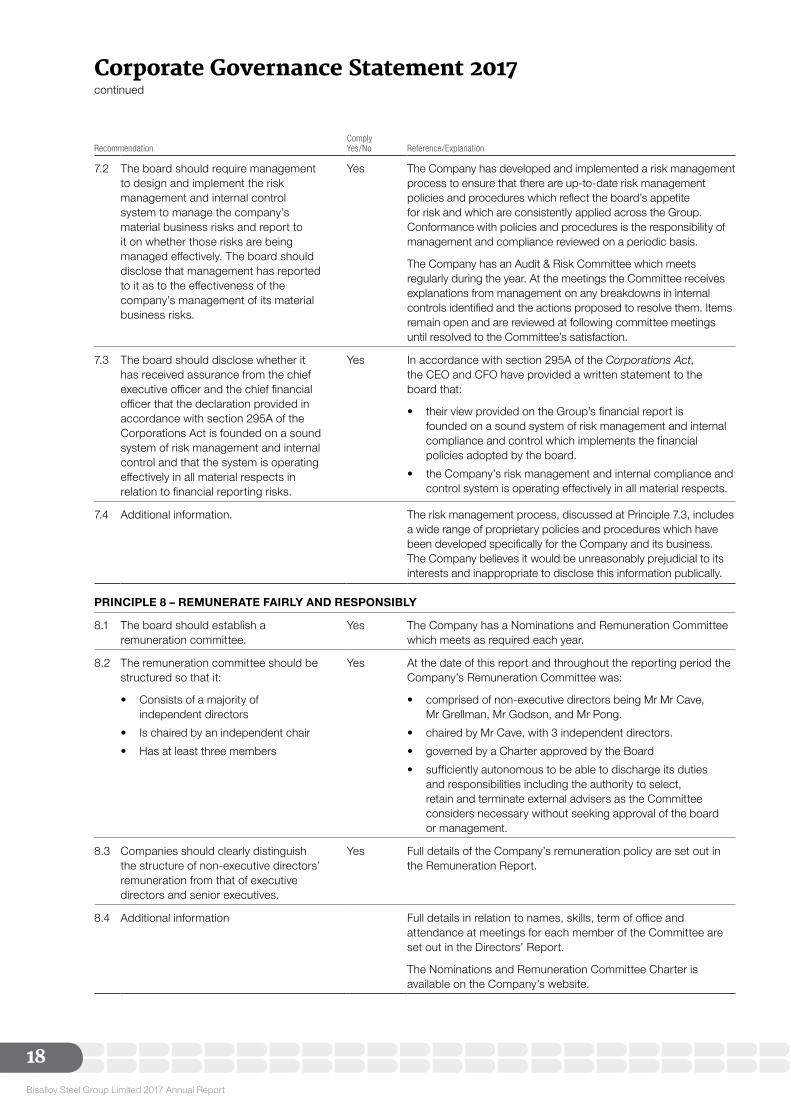
7.2 The board should require management to design and implement the risk management and internal control system to manage the company’s material business risks and report to it on whether those risks are being managed effectively. The board should disclose that management has reported to it as to the effectiveness of the company’s management of its material business risks.
Yes The Company has developed and implemented a risk management process to ensure that there are up-to-date risk management policies and procedures which reflect the board’s appetite for risk and which are consistently applied across the Group. Conformance with policies and procedures is the responsibility of management and compliance reviewed on a periodic basis.
The Company has an Audit & Risk Committee which meets regularly during the year. At the meetings the Committee receives explanations from management on any breakdowns in internal controls identified and the actions proposed to resolve them. Items remain open and are reviewed at following committee meetings until resolved to the Committee’s satisfaction.
7.3 The board should disclose whether it has received assurance from the chief executive officer and the chief financial officer that the declaration provided in accordance with section 295A of the Corporations Act is founded on a sound system of risk management and internal control and that the system is operating effectively in all material respects in relation to financial reporting risks.
Yes In accordance with section 295A of the Corporations Act, the CEO and CFO have provided a written statement to the board that:
• their view provided on the Group’s financial report is founded on a sound system of risk management and internal compliance and control which implements the financial policies adopted by the board.
• the Company’s risk management and internal compliance and control system is operating effectively in all material respects.
7.4 Additional information. The risk management process, discussed at Principle 7.3, includes a wide range of proprietary policies and procedures which have been developed specifically for the Company and its business. The Company believes it would be unreasonably prejudicial to its interests and inappropriate to disclose this information publically.
PRINCIPLE 8 – REMUNERATE FAIRLY AND RESPONSIBLY
8.1 The board should establish a remuneration committee.
Yes The Company has a Nominations and Remuneration Committee which meets as required each year.
8.2 The remuneration committee should be structured so that it:
• Consists of a majority of independent directors
• Is chaired by an independent chair• Has at least three members
Yes At the date of this report and throughout the reporting period the Company’s Remuneration Committee was:
• comprised of non-executive directors being Mr Mr Cave, Mr Grellman, Mr Godson, and Mr Pong.
• chaired by Mr Cave, with 3 independent directors.• governed by a Charter approved by the Board• sufficiently autonomous to be able to discharge its duties
and responsibilities including the authority to select, retain and terminate external advisers as the Committee considers necessary without seeking approval of the board or management.
8.3 Companies should clearly distinguish the structure of non-executive directors’ remuneration from that of executive directors and senior executives.
Yes Full details of the Company’s remuneration policy are set out in the Remuneration Report.
8.4 Additional information Full details in relation to names, skills, term of office and attendance at meetings for each member of the Committee are set out in the Directors’ Report.
The Nominations and Remuneration Committee Charter is available on the Company’s website.
Bisalloy Steel Group Limited 2017 Annual Report
20
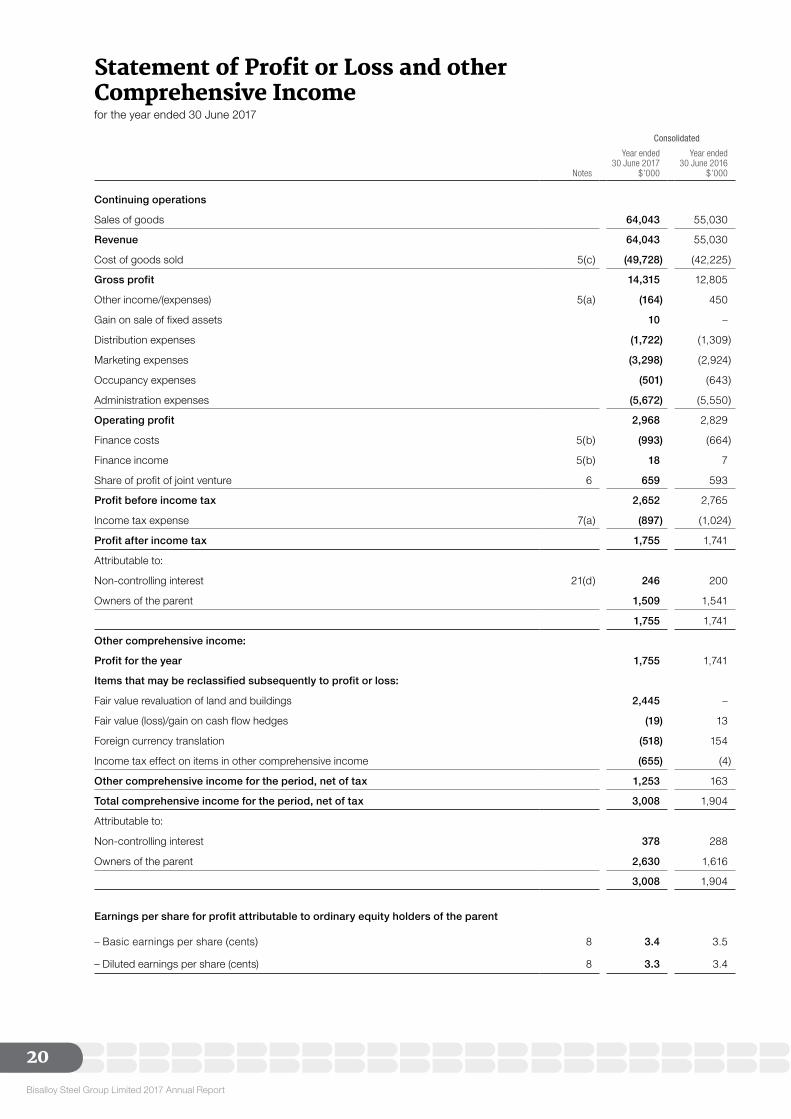
Statement of Profit or Loss and other Comprehensive Incomefor the year ended 30 June 2017
Consolidated
Notes
Year ended30 June 2017
$’000
Year ended30 June 2016
$’000
Continuing operations
Sales of goods 64,043 55,030
Revenue 64,043 55,030
Cost of goods sold 5(c) (49,728) (42,225)
Gross profit 14,315 12,805
Other income/(expenses) 5(a) (164) 450
Gain on sale of fixed assets 10 –
Distribution expenses (1,722) (1,309)
Marketing expenses (3,298) (2,924)
Occupancy expenses (501) (643)
Administration expenses (5,672) (5,550)
Operating profit 2,968 2,829
Finance costs 5(b) (993) (664)
Finance income 5(b) 18 7
Share of profit of joint venture 6 659 593
Profit before income tax 2,652 2,765
Income tax expense 7(a) (897) (1,024)
Profit after income tax 1,755 1,741
Attributable to:
Non-controlling interest 21(d) 246 200
Owners of the parent 1,509 1,541
1,755 1,741
Other comprehensive income:
Profit for the year 1,755 1,741
Items that may be reclassified subsequently to profit or loss:
Fair value revaluation of land and buildings 2,445 –
Fair value (loss)/gain on cash flow hedges (19) 13
Foreign currency translation (518) 154
Income tax effect on items in other comprehensive income (655) (4)
Other comprehensive income for the period, net of tax 1,253 163
Total comprehensive income for the period, net of tax 3,008 1,904
Attributable to:
Non-controlling interest 378 288
Owners of the parent 2,630 1,616
3,008 1,904
Earnings per share for profit attributable to ordinary equity holders of the parent
– Basic earnings per share (cents) 8 3.4 3.5
– Diluted earnings per share (cents) 8 3.3 3.4
Bisalloy Steel Group Limited 2017 Annual Report
21
Consolidated
Notes30 June 2017
$’00030 June 2016
$’000
ASSETS
Current assets
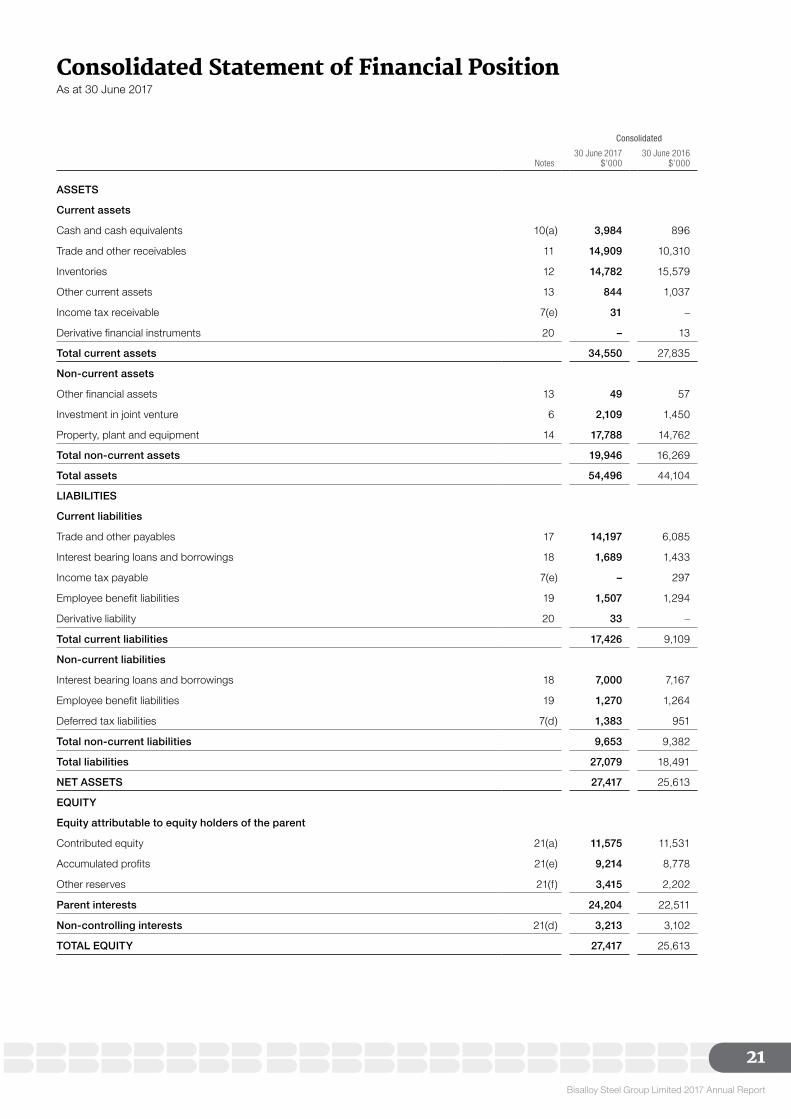
Cash and cash equivalents 10(a) 3,984 896
Trade and other receivables 11 14,909 10,310
Inventories 12 14,782 15,579
Other current assets 13 844 1,037
Income tax receivable 7(e) 31 –
Derivative financial instruments 20 – 13
Total current assets 34,550 27,835
Non-current assets
Other financial assets 13 49 57
Investment in joint venture 6 2,109 1,450
Property, plant and equipment 14 17,788 14,762
Total non-current assets 19,946 16,269
Total assets 54,496 44,104
LIABILITIES
Current liabilities
Trade and other payables 17 14,197 6,085
Interest bearing loans and borrowings 18 1,689 1,433
Income tax payable 7(e) – 297
Employee benefit liabilities 19 1,507 1,294
Derivative liability 20 33 –
Total current liabilities 17,426 9,109
Non-current liabilities
Interest bearing loans and borrowings 18 7,000 7,167
Employee benefit liabilities 19 1,270 1,264
Deferred tax liabilities 7(d) 1,383 951
Total non-current liabilities 9,653 9,382
Total liabilities 27,079 18,491
NET ASSETS 27,417 25,613
EQUITY
Equity attributable to equity holders of the parent
Contributed equity 21(a) 11,575 11,531
Accumulated profits 21(e) 9,214 8,778
Other reserves 21(f) 3,415 2,202
Parent interests 24,204 22,511
Non-controlling interests 21(d) 3,213 3,102
TOTAL EQUITY 27,417 25,613
Consolidated Statement of Financial PositionAs at 30 June 2017
Bisalloy Steel Group Limited 2017 Annual Report
22
Consolidated Statement of Cash Flows for the year ended 30 June 2017
Consolidated
Notes
Year ended30 June 2017
$’000
Year ended30 June 2016
$’000
Cash flows from operating activities
Receipts from customers (inclusive of GST) 62,923 61,121
Payments to suppliers and employees (inclusive of GST) (54,085) (60,864)
Interest received 18 7
Borrowing costs (993) (664)
Income tax paid (1,449) (873)
Net cash inflow/(outflow) from operating activities 10(b) 6,414 (1,273)
Cash flows from investing activities
Proceeds from sale of fixed assets 10 9
Payments for property, plant and equipment (2,086) (958)
Dividends received from investments – 346
Net cash outflow from investing activities (2,076) (603)
Cash flows from financing activities
Increase in borrowings 89 289
Dividends paid to non-controlling interests (267) (264)
Dividends paid to shareholders of the parent (1,058) (1,706)
Net cash outflow from financing activities (1,236) (1,681)
Net increase/(decrease) in cash held 3,102 (3,557)
Net foreign exchange differences (14) 7
Cash at the beginning of the financial year 896 4,446
Cash at the end of the financial year 10(a) 3,984 896
Bisalloy Steel Group Limited 2017 Annual Report
23
Consolidated Statement of Changes in Equity for the year ended 30 June 2017
Attributable to equity holders of the Company
Issuedcapital$’000
Employeeequity
benefitsreserve$’000
Net gain/(loss) on
cash flow hedges$’000
Foreigncurrency
translationreserve$’000
Assetrevaluation
reserve$’000
EquitySettlement
Reserve$’000
Retainedearnings
$’000Total
$’000
Non-controlling
interest $’000
Total equity$’000
At 30 June 2015 11,478 270 – (573) 2,684 (150) 8,967 22,676 3,078 25,754
Profit for the period – – – – – – 1,541 1,541 200 1,741
Other comprehensive income – – 9 66 – – – 75 88 163
Depreciation transfer for building revaluation – – – – (29) – 29 – – –
Total comprehensive income – – 9 66 (29) – 1,570 1,616 288 1,904
Transactions with owners in their capacity as owners:
Ordinary dividends paid to shareholders (Note 9) – – – – – – (1,759) (1,759) – (1,759)
Dividend Reinvestment Plan (Note 21) 53 – – – – – – 53 – 53
Dividends paid to non-controlling interests – – – – – – – – (264) (264)
Share based payments (Note 15) – 50 – – – – – 50 – 50
Modification of performance rights – (281) – – – 156 – (125) – (125)
At 30 June 2016 11,531 39 9 (507) 2,655 6 8,778 22,511 3,102 25,613
At 30 June 2016 11,531 39 9 (507) 2,655 6 8,778 22,511 3,102 25,613
Profit for the period – – – – – – 1,509 1,509 246 1,755
Other comprehensive income – – (13) (213) 1,347 – – 1,121 132 1,253
Depreciation transfer for building revaluation – – – – (29) – 29 – – –
Total comprehensive income – – (13) (213) 1,318 – 1,538 2,630 378 3,008
Transactions with owners in their capacity as owners:
Ordinary dividends paid to shareholders (Note 9) – – – – – – (1,102) (1,102) – (1,102)
Dividend Reinvestment Plan (Note 21) 44 – – – – – – 44 – 44
Dividends paid to non-controlling interests – – – – – – – – (267) (267)
Share based payments (Note 15) – 121 – – – – – 121 – 121
At 30 June 2017 11,575 160 (4) (720) 3.973 6 9,214 24,204 3,213 27,417
Bisalloy Steel Group Limited 2017 Annual Report
24
Notes to the Consolidated Financial Statements For the year ended 30 June 2017
NOTE 1. CORPOR ATE INFORMATIONThe financial report of Bisalloy Steel Group Limited and its subsidiaries (“the Group”) for the year ended 30 June 2017 was authorised for issue in accordance with a resolution of the directors on 28 August 2017.
Bisalloy Steel Group Limited is a company limited by shares incorporated and domiciled in Australia whose shares are publicly traded on the Australian Stock Exchange.
The nature of the operations and principal activities of the Group are described in the Directors’ Report.
NOTE 2 . SUMMARY OF SIGNIFICANT ACCOUNTING POLICIESTA BLE OF CONTENT S
a) Basis of preparation
b) Statement of compliance
c) Basis of consolidation and investments in joint venture
d) Significant accounting judgements, estimates and assumptions
e) Operating segments
f) Taxation
g) Cash and cash equivalents
h) Trade and other receivables
i) Inventories
j) Property, plant and equipment
k) Trade and other payables
l) Contributed equity
m) Employee benefits
n) Share-based payment transactions
o) Provisions
p) Interest bearing loans and borrowings
q) Goods and services tax
r) Revenue recognition
s) Borrowing costs
t) Leases
u) Foreign currency translation
v) Earnings per share (EPS)
w) Derivative financial instruments and hedging
x) Fair value measurement
y) Changes in accounting standards
a) Basis of preparationThe financial report is a general purpose financial report, which has been prepared in accordance
with the requirements of the Corporations Act 2001, Australian Accounting Standards and other authoritative pronouncements of the Australian Accounting Standards Board. The financial report has also been prepared on a historical cost basis, except for land and buildings classified as property, plant and equipment and derivative financial instruments, which are measured at fair value.
The Company is of a kind referred to in ASIC Corporations (Rounding in Financial/Directors’ Reports) Instrument 2016/191 and in accordance with that Instrument, all financial information presented in Australian Dollars has been rounded to the nearest thousand unless otherwise stated.
The consolidated financial statements provide comparative information in respect of the previous period.
New Accounting Standards and InterpretationsThe accounting policies adopted are consistent with those of the previous financial year except the following which the Group adopted from 1 July 2016:
• AASB 2015-1 Amendments to Australian Accounting Standards – Annual Improvements to Australian Accounting Standards 2012–2014 Cycle
• AASB 2015-2 Amendments to Australian Accounting Standards – Disclosure Initiative: Amendments to AASB 101
New Accounting Standards and Interpretations• AASB 2014-10 Amendments to Australian Accounting
Standards – Sale or Contribution of Assets between an Investor and its Associate or Joint Venture
• IAS 16 and 38 Clarification of Acceptable Methods of Depreciation and Amortisation (Amendments to IAS 16 and IAS 38)
Australian Accounting Standards and Interpretations that have recently been issued or amended but are not yet effective have not been adopted by the Group for the annual reporting period ended 30 June 2017.
Comparative informationCertain comparative information was amended in these financial statements to conform to the current year presentation. These amendments do not impact the group’s financial result and do not have any significant impact on the Group’s balance sheet.
b) Statement of complianceThe financial report complies with Australian Accounting Standards as issued by the Australian Accounting Standards Board and International Financial Reporting Standards as issued by the International Accounting Standards Board.
c) Basis of consolidation and investments in joint ventureThe consolidated financial statements comprise the financial statements of the Company, being Bisalloy Steel Group Limited, and its subsidiaries (“the Group”) as at the reporting date.
24
Bisalloy Steel Group Limited 2017 Annual Report
25
Control is achieved when the Group is exposed, or has rights, to variable returns from its involvement with the investee and has the ability to affect those returns through its power over the investee. Specifically, the Group controls an investee if and only if the Group has:
• Power over the investee (i.e. existing rights that give it the current ability to direct the relevant activities of the investee)
• Exposure, or rights, to variable returns from its involvement with the investee, and
• The ability to use its power over the investee to affect its returns.
The Group re-assesses whether or not it controls an investee if facts and circumstances indicate that there are changes to one or more of the three elements of control. Consolidation of a subsidiary begins when the Group obtains control over the subsidiary and ceases when the Group loses control of the subsidiary.
The financial statements of the subsidiaries are prepared for the same reporting period as the parent company, using consistent accounting policies. Adjustments are made to bring into line any dissimilar accounting policies that may exist. All intercompany balances and transactions, including unrealised profits arising from intra-group transactions, have been eliminated in full. Unrealised losses are eliminated unless costs cannot be recovered.
Non-controlling interests represent the portion of profit or loss and net assets in subsidiaries not held by the Group, and are presented separately in the consolidated statement of comprehensive income and within equity in the consolidated statement of financial position, separately from the equity of the owners of the parent.
The Group has an interest in a joint venture, which is a jointly controlled entity, whereby the venturers have a contractual arrangement that establishes joint control over the economic activities of the entity. The Group’s investment in the joint venture is accounted for using the equity method and is not part of the consolidated Group.
Under the equity method, the investment in the joint venture is initially recognised at cost. The carrying amount of the investment is adjusted to recognise changes in the Group’s share of net assets of the joint venture since the acquisition date. Goodwill relating to the joint venture is included in the carrying amount of the investment and is neither amortised nor individually tested for impairment.
The statement of profit or loss and other comprehensive income reflects the Group’s share of the results of operations of the joint venture. When there has been a change recognised directly in the equity of the joint venture, the Group recognises its share of any changes, when applicable, in the statement of changes in equity. Unrealised gains and losses resulting from transactions between the Group and the joint venture are eliminated to the extent of the interest in the joint venture.
The Group’s share of profit of the joint venture is shown on the face of the statement of profit or loss and other
comprehensive income outside operating profit or loss after tax and non-controlling interests in the subsidiaries of the joint venture.
The financial statements of the joint venture are prepared for the same reporting period as the Group. When necessary, adjustments are made to bring the accounting policies in line with those of the Group.
d) Significant accounting judgements, estimates and assumptionsIn the application of the Group’s accounting policies as described below, management is required to make judgements, estimates and assumptions about carrying values of assets and liabilities that are not readily apparent from other sources. The estimates and associated assumptions are based on historical experience and various other factors that are believed to be reasonable under the circumstances. These estimates and underlying assumptions are reviewed on an ongoing basis.
Significant accounting judgementsIn applying the Group’s accounting policies, management have not made any significant accounting judgements which affect the amounts recognised in the financial statements.
Significant accounting estimates and assumptionsThe carrying amounts of certain assets and liabilities are often determined based on estimates and assumptions of future events. The key estimates and assumptions that have a significant risk of causing material adjustment to the carrying amounts of certain assets and liabilities within the next annual reporting period are:
Net realisable value of inventory The Group undertakes a detailed review of its inventory by major product category to ensure its provisions reflect inventory at the lower of cost and net realisable value. This review takes into consideration management’s assessment of current and forecast market conditions, including drivers of the price of quenched and tempered steel and alloyed steel plate.
Fair value of freehold land and freehold buildingsThe Group’s land and buildings are measured at fair value for financial reporting purposes. In estimating the fair value of the assets, the Group engages third party qualified valuers to perform the valuation. Valuations are performed every three years, or sooner should there be a significant change in market conditions, to ensure that the fair value of a revalued asset does not differ materially from its carrying amount. Further details of the nature of any assumptions and conditions may be found in the relevant notes to the financial statements, in particular, Note 14 b): Property, plant and equipment
Impairment of other non-financial assets Non-financial assets other than goodwill and indefinite life intangibles are tested for impairment whenever events or changes in circumstances indicate that the carrying amount may not be recoverable.
Bisalloy Steel Group Limited 2017 Annual Report
26
Notes to the Consolidated Financial Statements For the year ended 30 June 2017 (continued)
The Group conducts an annual review of asset values, which is used as a source of information to assess for any indicators of impairment. External factors, such as changes in expected future processes, technology and economic conditions, are also monitored to assess for indicators of impairment. If any indication of impairment exists, an estimate of the asset’s recoverable amount is calculated.
An impairment loss is recognised for the amount by which the asset’s carrying amount exceeds its recoverable amount. Recoverable amount is the higher of an asset’s fair value less costs to sell and value in use. For the purposes of assessing impairment, assets are grouped at the lowest levels for which there are separately identifiable cash inflows that are largely independent of the cash inflows from other assets or group of assets (cash-generating units). Non-financial assets other than goodwill that suffered an impairment are tested for possible reversal of the impairment whenever events or changes in circumstances indicate that the impairment may have been reversed.
Share-based payment transactionsThe Group measures the cost of equity-settled transactions with employees (including directors and other senior executives) by reference to the fair value at the date on which they are granted. The fair value is determined by an external valuer using discounted cash flow models using the assumptions dealt with in note 2(n).
e) Operating segmentsAn operating segment is a component of an entity that engages in business activities from which it may earn revenues and incur expenses (including revenues and expenses relating to transactions with other components of the same entity), whose operating results are regularly reviewed by the entity’s chief operating decision maker to make decisions about resources to be allocated to the segment and assess its performance and for which discrete financial information is available. This includes start-up operations which are yet to earn revenues. Management will also consider other factors in determining operating segments such as the existence of a line manager and the level of segment information presented to the board of directors.
Operating segments have been identified and based on the information provided to the chief operating decision makers – being the executive management team.
The Group aggregates two or more operating segments when they have similar economic characteristics, and the segments are similar in each of the following respects:
• nature of the products and services,• nature of production processes,• type or class of customer for their products and services,• methods use to distribute their products or provide their
services, and if applicable• nature of the regulatory environment.
Operating segments that meet the quantitative criteria as prescribed by AASB 8 are reported separately. However, an operating segment that does not meet the quantitative criteria is still reported separately where information about the segment would be useful to users of the financial statements.
f) Taxation
Current income taxCurrent income tax assets and liabilities are measured at the amount expected to be recovered from or paid to the taxation authorities. The tax rates and tax laws used to compute the amount are those that are enacted or substantively enacted by the reporting date in the countries where the Group operates and generates taxable income.
Deferred taxDeferred tax is provided using the liability method on temporary differences between the tax bases of assets and liabilities and their carrying amounts for financial reporting purposes at the reporting date.
Deferred tax liabilities are recognised for all taxable temporary differences except:
• when the deferred income tax liability arises from the initial recognition of goodwill or an asset or liability in a transaction that is not a business combination and, at the time of the transaction, affects neither the accounting profit nor taxable profit or loss; or
• in respect of taxable temporary differences associated with investments in subsidiaries, associates or interests in joint ventures, when the timing of the reversal of the temporary difference can be controlled and it is probable that the temporary difference will not reverse in the foreseeable future.
Deferred tax assets are recognised for all deductible temporary differences, the carry-forward of unused tax credits and any unused tax losses. Deferred tax assets are recognised to the extent that it is probable that taxable profit will be available against which the deductible temporary differences, and the carry-forward of unused tax credits and unused tax losses can be utilised, except:
• when the deferred tax asset relating to the deductible temporary difference arises from the initial recognition of an asset or liability in a transaction that is not a business combination and, at the time of the transaction, affects neither the accounting profit nor taxable profit or loss; or
• in respect of deductible temporary difference is associated with investments in subsidiaries, associates or interests in joint ventures, deferred tax asset are recognised only to the extent that it is probable that the temporary difference will reverse in the foreseeable future and taxable profit will be available against which the temporary difference can be utilised.
The carrying amount of deferred tax assets is reviewed at each reporting date and reduced to the extent that it is no longer probable that sufficient taxable profit will be available to allow all or part of the deferred tax asset to be utilised.
NOTE 2 . SUMMARY OF SIGNIFICANT ACCOUNTING POLICIES (CONTINUED)
Bisalloy Steel Group Limited 2017 Annual Report
27
Unrecognised deferred tax assets are reassessed at each reporting date and are recognised to the extent that it has become probable that future taxable profit will allow the deferred tax asset to be recovered.
Deferred tax assets and liabilities are measured at the tax rates that are expected to apply to the year when the asset is realised or the liability is settled, based on tax rates (and tax laws) that have been enacted or substantively enacted at the reporting date.
Deferred tax relating to items recognised outside profit or loss is recognised outside profit or loss. Deferred tax items are recognised in correlation to the underlying transaction either in other comprehensive income or directly in equity.
Deferred tax assets and deferred tax liabilities are offset if a legally enforceable right exists to set off current tax assets against current tax liabilities and the deferred tax assets and liabilities relate to the same taxable entity and the same taxation authority.
g) Cash and cash equivalentsCash and short term deposits in the statement of financial position and the cash flow statement is comprised of cash at bank and on hand and short-term deposits with a maturity of three months or less, which are subject to an insignificant risk of changes in value.
h) Trade and other receivablesTrade and other receivables are carried at amounts due less an allowance for any uncollectible amounts. The collectability of debts is assessed at balance date and provision is made when there is objective evidence that the Group will not be able to collect the debts. Bad debts are written off when identified. Trade debtors are generally on 30-60 day terms. These are non-interest bearing.
i) InventoriesRaw materials, work in progress and finished goods are valued at the lower of cost and net realisable value.
Costs incurred in bringing each product to its present location and condition are accounted for as follows:
Raw materials • Purchase cost is on an average cost basis.
Work in progress and finished goods • Cost of direct materials, labour and an appropriate
proportion of manufacturing overheads is based on normal operating capacity, but excluding borrowing costs.
Net realisable value is the estimated selling price in the ordinary course of business, less estimated costs of completion and the estimated costs necessary to make the sale.
j) Property, plant and equipmentPlant and equipment is stated at historical cost, net of accumulated depreciation and accumulated impairment losses, if any. Such cost includes the cost of replacing parts that are eligible for capitalisation when the cost of replacing the parts is incurred. Similarly, when each major
inspection is performed, its cost is recognised in the carrying amount of the plant and equipment as a replacement only if the recognition criteria are satisfied. All other repairs and maintenance are recognised in the profit or loss as incurred.
Land and buildings are measured at fair value using the revaluation model, less accumulated depreciation on buildings and any impairment losses recognised after the date of the revaluation. Valuations are performed every three years, or sooner should there be a significant change in market conditions, to ensure that the fair value of a revalued asset does not differ materially from its carrying amount.
Depreciation is calculated on a straight-line basis over the estimated useful life of the specific assets as follows:
• Land not depreciated• Buildings 50 years• Plant and equipment 5 – 10 years• Leasehold improvements 5 – 10 years or lease life,
if shorter.
The assets’ residual values, useful lives and amortisation methods are reviewed, and adjusted prospectively if appropriate, at each financial year end.
Revaluations of land and buildingsAny revaluation increment is credited to the asset revaluation reserve in equity, except to the extent that it reverses a revaluation decrement for the same asset previously recognised in profit or loss, in which case the increment is recognised in profit or loss.
Any revaluation decrement is recognised in profit or loss, except to the extent that it offsets a previous revaluation increment for the same asset, in which case the decrement is debited directly to the asset revaluation reserve to the extent of the credit balance existing in the revaluation reserve for that asset.
Any accumulated depreciation as at the revaluation date is eliminated against the gross carrying amounts of the assets and the net amounts are restated to the revalued amounts of the assets.
Gains and losses on disposals are determined by comparing proceeds with the carrying amount. These are included in the profit or loss.
Upon disposal or derecognition, any revaluation reserve relating to the particular asset being sold is transferred to retained earnings.
DerecognitionAn item of property, plant and equipment is derecognised upon disposal or when no future economic benefits are expected from its use or disposal. Any gain or loss arising on derecognition of the asset (calculated as the difference between the net disposal proceeds and the carrying amount of the asset) is included in the profit and loss in the period the item is derecognised.
Information technology costsCosts incurred in developing products or systems and costs incurred in acquiring software and licenses that
Bisalloy Steel Group Limited 2017 Annual Report
28
Notes to the Consolidated Financial Statements For the year ended 30 June 2017 (continued)
will contribute to future period financial benefits through revenue generation and / or cost reduction are capitalised to information technology costs. Amortisation is calculated on a straight line basis over periods not exceeding 10 years.
k) Trade and other payablesTrade and other payables are carried at amortised cost and represent liabilities for goods and services provided to the Group prior to the end of the financial year that are unpaid and arise when the Group becomes obliged to make future payments in respect of the purchase of these goods and services.
l) Contributed equityOrdinary share capital is recognised at the fair value of the consideration received by the Company. Any transaction costs arising on the issue of ordinary shares are recognised directly in equity, net of tax, as a reduction of the share proceeds received.
m) Employee benefitsLiabilities arising in respect of short-term employee benefits such as wages, salaries, annual leave and sick leave represent the amount which the entity has a present obligation to pay resulting from employees’ services provided up to the balance date. Liabilities in respect of short-term employee benefits are measured at their nominal amounts.
Long-term employee benefit liabilities such as long service leave represent the present value of the estimated future cash outflows to be made by the employer resulting from employees’ services provided up to the balance date. Long-term employee benefit liabilities are measured at their present values using corporate bond rates which most closely match the terms of maturity of the related liabilities.
In determining the employee benefit liabilities, consideration has been given to future increases in wage and salary rates, and the consolidated entity’s experience with staff departures. Related on-costs have also been included in the liability.
The Group contributes to several defined contribution superannuation plans, as well as unfunded defined benefit plan in Indonesia. Contributions are charged against income as they are made.
n) Share-based payment transactionsEmployees (including directors and other senior executives) of the Group receive remuneration in the form of a grant of Rights, whereby employees render services as consideration for equity instruments (‘equity-settled transactions’). There is currently a Share Rights Plan in place to provide these benefits.
The cost of equity-settled transactions with employees is measured by reference to the fair value at the date on which they are granted. The fair value is determined by an external valuer using a discounted cash flow methodology. In valuing equity-settled transactions, no account is taken
of any performance conditions, other than conditions linked to the price of the shares of the issuer (‘market conditions’), if applicable.
The cost of equity-settled transactions is recognised, together with a corresponding increase in equity, over the period in which the performance and/or service conditions are fulfilled, ending on the date on which the relevant employees become fully entitled to the award (‘vesting date’). The cumulative expense recognised for equity-settled transactions at each reporting date until vesting date reflects the extent to which the vesting period has expired and the Group’s best estimate of the number of equity instruments that will ultimately vest. This opinion is formed based on the best available information at balance date. The statement of comprehensive income charge or credit for a period represents the movement in cumulative expense recognised as at the beginning and end of that period.
No expense is recognised for Rights that do not ultimately vest. Any Rights that do not become vested Rights, lapse.
The dilutive effect, if any, of outstanding Rights is reflected as additional share dilution in the computation of diluted earnings per share.
o) ProvisionsProvisions are recognised when the Group has a present obligation (legal or constructive) as a result of a past event, it is probable that an outflow of resources embodying economic benefits will be required to settle the obligation and a reliable estimate can be made of the amount of the obligation. Where the Group expects some or all of a provision to be reimbursed, for example under an insurance contract, the reimbursement is recognised as a separate asset but only when the reimbursement is virtually certain. The expense related to any provision is presented in the statement of comprehensive income net of any reimbursement. If the effect of the time value of money is material, provisions are discounted using a current pre-tax rate that reflects, where appropriate, the risks specific to the liability. Where discounting is used, the increase in the provision due to the passage of time is recognised as a borrowing cost.
p) Interest bearing loans and borrowingsAll loans and borrowings are initially recognised at the fair value of the consideration received less directly attributable transaction costs.
Borrowings are classified as current liabilities unless the Group has an unconditional right to defer settlement of the liability for at least 12 months after the reporting date.
q) Goods and services taxRevenues, expenses and assets are recognised net of the amount of goods and services tax (GST), or GST equivalents, such as Value Added Tax, except:
• where the amount of GST incurred is not recoverable from the Australian Tax Office (ATO), or equivalent foreign organisations. In these circumstances the GST is recognised as part of the cost of acquisition of the asset or as part of an item of the expenses;
NOTE 2 . SUMMARY OF SIGNIFICANT ACCOUNTING POLICIES (CONTINUED)
Bisalloy Steel Group Limited 2017 Annual Report
29
• receivables and payables are stated with the amount of GST included.
The net amount of GST recoverable from, or payable to, the ATO is included as part of receivables or payables in the statement of financial position.
Cash flows are included in the statement of cash flows on a gross basis. The GST components of cash flows arising from investing and financing activities which are recoverable from, or payable to, the ATO are classified as operating cash flows.
Commitments and contingencies are disclosed net of the amount of GST recoverable from, or payable to, the taxation authority.
r) Revenue recognitionRevenue is recognised to the extent that it is probable that the economic benefits will flow to the Group and the revenue can be reliably measured, regardless of when the payment is received. Revenue is measured at the fair value of the consideration received or receivable, taking into account contractually defined terms of payment and excluding taxes and duty. The specific recognition criteria described below must also be met before revenue is recognised:
Sale of goodsRevenue from the sale of goods is recognised when the significant risks and rewards of ownership of the goods have passed to the customer, which is on delivery of the goods. Revenue from the sale of goods is measured at fair value of the consideration received or receivable, net of returns and allowances, trade discounts and volume rebates.
Interest incomeInterest income is recognised as it accrues using the effective interest (EIR) method. The EIR is the rate that exactly discounts estimated future cash receipts over the expected life of the financial asset to the net carrying amount of the financial asset. Interest income is included in finance income in the statement of profit or loss and other comprehensive income.
Dividend incomeDividend income is recognised when the Group’s right to receive the payment is established.
s) Borrowing costsBorrowing costs directly attributable to the acquisition, construction or production of an asset that necessarily takes a substantial period of time to get ready for its intended use or sale are capitalised as part of the cost of that asset. All other borrowing costs are expensed in the period in which they occur. Borrowing costs consist of interest and other costs that an entity incurs in connection with the borrowing of funds. Bisalloy Steel Group Limited does not currently hold qualifying assets but, if it did, the borrowing costs directly associated with this asset would be capitalised (including any other associated costs directly attributable to the borrowing and temporary investment income earned on the borrowing).
t) LeasesThe determination of whether an arrangement is, or contains a lease is based on the substance of the arrangement at inception of the lease. The arrangement is, or contains, a lease if fulfilment of the arrangement is dependent on the use of a specific asset or assets or the arrangement conveys a right to use the asset or assets, even if that right is not explicitly specified in an agreement.
Group as a lesseeFinance leases, which transfer to the Group substantially all the risks and benefits incidental to ownership of the leased item, are capitalised at the inception of the lease at the fair value of the leased property or, if lower at the present value of the minimum lease payments. Lease payments are apportioned between the finance charges and a reduction of the lease liability so as to achieve a constant rate of interest on the remaining balance of the liability. Finance charges are included in finance costs in the statement of profit or loss and other comprehensive income.
Capitalised leased assets are depreciated over the shorter of the estimated useful life of the asset and lease term, if there is no reasonable certainty that the Group will obtain ownership by the end of the lease term.
Operating lease payments are recognised as an operating expense in the statement of profit or loss and other comprehensive income on a straight-line basis over the lease term.
u) Foreign currency translationThe Group’s consolidated financial statements are presented in Australian dollars (A$), which is the Company’s functional and presentation currency. Each entity in the Group determines its own functional currency and items included in the financial statements of each entity are measured using that functional currency. Transactions in foreign currencies are initially recorded in the functional currency rate ruling at the date of the transaction. Monetary assets and liabilities denominated in foreign currencies are retranslated at the functional currency rate of exchange ruling at the statement of financial position date. All differences are taken to profit or loss. Non-monetary items that are measured in terms of historical cost in a foreign currency are translated using the exchange rates as at the dates of the initial transactions.
The functional currency of the foreign operations is the currency in circulation in the country they each reside in. As at the reporting date, the assets and liabilities of these subsidiaries are translated into the Company’s presentation currency (A$) at the rate of exchange ruling at balance date, and their income statements are translated at the weighted average exchange rates for the year. The exchange differences arising on the translation are recognised in the foreign currency translation reserve within equity. On disposal of a foreign entity, the deferred cumulative amount recognised in equity relating to that particular foreign operation is recognised in the statement of comprehensive income.
Bisalloy Steel Group Limited 2017 Annual Report
30
Notes to the Consolidated Financial Statements For the year ended 30 June 2017 (continued)
v) Earnings per share (EPS)Basic EPS is calculated as net profit attributable to members, adjusted to exclude costs of servicing equity (other than dividends), divided by the weighted average number of ordinary shares, adjusted for any bonus element.
Diluted EPS is calculated as net profit attributable to members, adjusted for:
• costs of servicing equity (other than dividends);• the after tax effect of dividends and interest associated
with dilutive potential ordinary shares that have been recognised as expenses; and
• other non-discretionary changes in revenues or expenses during the period that would result from the dilution of potential ordinary shares divided by the weighted average number of ordinary shares and dilutive potential ordinary shares, adjusted for any bonus element.
w) Derivative financial instruments and hedgingThe Group uses derivative financial instruments such as forward currency contracts to hedge its risks associated with foreign currency risks. Such derivative financial instruments are initially recognised at fair value on the date on which a derivative contract is entered into and are subsequently remeasured at fair value. Derivatives are carried as financial assets when the fair value is positive and as financial liabilities when the fair value is negative.
Any gains or losses arising from changes in fair value on derivatives that do not qualify for hedge accounting are taken directly to net profit or loss for the year.
The fair value of forward currency contracts is calculated by reference to current forward exchange rates for contracts with similar maturity profiles. The fair value of interest rate swap contracts is determined by reference to market values for similar instruments.
For the purpose of hedge accounting, hedges are classified as:
• fair value hedges: when hedging the exposure to changes in the fair value of a recognised asset or liability; or
• cash flow hedges: when hedging exposure to variability in cash flows that is either attributable to a particular risk associated with a recognised asset or liability or a highly forecast transaction.
A hedge of the foreign currency risk of a firm commitment is accounted for as a cash flow hedge.
At the inception of a hedge relationship, the Group formally designates and documents the hedge relationship to which the Group wishes to apply hedge accounting and the risk management objective and strategy for undertaking the hedge. The documentation includes identification of the hedging instrument, the hedged item or transaction, the nature of the risk being hedged and how the entity will assess the hedging instrument’s effectiveness in offsetting the exposure to changes in the hedged item’s fair value or
cash flows attributable to the hedged risk. Such hedges are expected to be highly effective in achieving offsetting changes in fair value or cash flows and are assessed on an ongoing basis to determine that they actually have been highly effective throughout the financial reporting periods for which they were designated.
Hedges which meet the strict criteria for hedge accounting are accounted for as described below:
Cash Flow HedgesThe effective portion of the gain or loss on the hedging instrument is recognised directly in equity, while the ineffective portion is recognised in profit or loss.
Amounts taken to equity are transferred to the statement of profit or loss and other comprehensive income when the hedged transaction affects profit or loss, such as when hedged financial income or financial expense is recognised or when a forecast sale or purchase occurs. Where the hedged item is the cost of a non-financial asset or liability, the amounts taken to equity are transferred to the initial carrying amount of the non-financial asset or liability.
If the forecast transaction is no longer expected to occur, amounts previously recognised in equity are transferred to profit or loss. If the hedging instrument expires or is sold, terminated or exercised without replacement or rollover, or if its designation as a hedge is revoked, amounts previously recognised in equity remain in equity until the forecast transaction occurs. If the related transaction is not expected to occur, the amount is taken to profit or loss.
Fair Value HedgesThe change in the fair value of the hedged item attributable to the risk hedged is recorded as part of the carrying value of the hedged item and is also recognised in the statement of profit or loss and other comprehensive income as a finance cost.
When an unrecognised firm commitment is designated as a hedged item, the subsequent cumulative change in the fair value of the firm commitment attributable to the hedged risk is recognised as an asset or liability with a corresponding gain or loss recognised in profit or loss.
The Group discontinues fair value hedge accounting if the hedging instrument expires or is sold, terminated or exercised, the hedge no longer meets criteria for hedge accounting or the Group revokes the designation. Any adjustment to the carrying amount of a hedge financial instrument for which the effective interest method is used is amortised to the profit or loss. Amortisation may begin as soon as an adjustment exists and shall begin no later than when the hedged item ceases to be adjusted for changes in its fair value attributable to the risk being hedged.
x) Fair Value MeasurementThe Group measure financial instruments such as derivatives at fair value at each reporting date.
Fair value is the price that would be received to sell an asset or paid to transfer a liability in an orderly transaction between market participants at the measurement date. The
NOTE 2 . SUMMARY OF SIGNIFICANT ACCOUNTING POLICIES (CONTINUED)
Bisalloy Steel Group Limited 2017 Annual Report
31
fair value measurement is based on the presumption that the transaction to sell the asset or transfer the liability takes place either:
• in the principal market for the asset or liability, or• in the absence of a principal market, in the most
advantageous market for the asset or liability.
The principal or the most advantageous market must be accessible by the Group.
The fair value of an asset or a liability is measured using the assumptions that market participants would use when pricing the asset or liability, assuming that market participants act in their economic best interest.
The Group uses valuation techniques that are appropriate in the circumstances and for which sufficient data are available to measure fair value, maximising the use of relevant observable inputs and minimising the use of unobservable inputs.
All assets and liabilities for which fair value is measured or disclosed in the financial statements are categorised within the fair value hierarchy, described as follows, based on the lowest level input that is significant to the fair value measurement as a whole:
• Level 1 – Quoted (unadjusted) market prices in active markets for identical assets or liabilities
• Level 2 – Valuation techniques for which the lowest level input that is significant to the fair value measurement is directly or indirectly observable
• Level 3 – Valuation techniques for which the lowest level input that is significant to the fair value measurement is unobservable.
For assets and liabilities that are recognised in the financial statements on a recurring basis, the Group determines whether transfers have occurred between Levels in the hierarchy by re-assessing categorisation (based on the lowest level input that is significant to the fair value measurement as a whole) at the end of the reporting period.
y) Changes in accounting standardsAustralian Accounting Standards and Interpretations that have recently been issued or amended but are not yet effective have not been adopted by the Group for the annual reporting period ended 30 June 2017. Those that may be applicable to the Group are outlined in the table below.
Reference Title SummaryApplication date of standard
Impact on Group financial report
Application date for Group
AASB 9/IFRS 9 Financial Instruments
On 24 July 2014 The IASB issued the final version of IFRS 9 which replaces IAS 39 and includes a logical model for classification and measurement, a single, forward-looking ‘expected loss’ impairment model and a substantially-reformed approach to hedge accounting.IFRS 9 is effective for annual periods beginning on or after 1 January 2018. However, the Standard is available for early application. The own credit changes can be early applied in isolation without otherwise changing the accounting for financial instruments.The final version of IFRS 9 introduces a new expected-loss impairment model that will require more timely recognition of expected credit losses. Specifically, the new Standard requires entities to account for expected credit losses from when financial instruments are first recognised and to recognise full lifetime expected losses on a more timely basis.The AASB is yet to issue the final version of AASB 9. A revised version of AASB 9 (AASB 2013-9) was issued in December 2013 which included the new hedge accounting requirements, including changes to hedge effectiveness testing, treatment of hedging costs, risk components that can be hedged and disclosures.AASB 9 includes requirements for the classification and measurement of financial assets. It was further amended by AASB 2010-7 to reflect amendments to the accounting for financial liabilities.These requirements improve and simplify the approach for classification and measurement of financial assets compared with the requirements of AASB 139.
1 January 2018 The amendments are not expected to have a significant impact on the financial statements
1 July 2018
Bisalloy Steel Group Limited 2017 Annual Report
32
Notes to the Consolidated Financial Statements For the year ended 30 June 2017 (continued)
Reference Title SummaryApplication date of standard
Impact on Group financial report
Application date for Group
IFRS 15 Revenue from Contracts with Customers
IFRS 15 establishes principles for reporting useful information to users of financial statements about the nature, amount, timing and uncertainty of revenue and cash flows arising from an entity’s contracts with customers.IFRS 15 supersedes:a. IAS 11 Construction Contractsb. IAS 18 Revenuec. IFRIC 13 Customer Loyalty Programmesd. IFRIC 15 Agreements for the Construction of
Real Estatee. IFRIC 18 Transfers of Assets from Customersf. SIC-31 Revenue—Barter Transactions Involving
Advertising ServicesThe core principle of IFRS 15 is that an entity recognises revenue to depict the transfer of promised goods or services to customers in an amount that reflects the consideration to which the entity expects to be entitled in exchange for those goods or services. An entity recognises revenue in accordance with that core principle by applying the following steps:a. Step 1: Identify the contract(s) with a customerb. Step 2: Identify the performance obligations in
the contractc. Step 3: Determine the transaction priced. Step 4: Allocate the transaction price to the
performance obligations in the contracte. Step 5: Recognise revenue when (or as) the entity
satisfies a performance obligationEarly application of this standard is permitted.
1 January 2018 The amendments are not expected to have a significant impact on the financial statements
1 July 2018
AASB16 Leases The key features of AASB 16 are as follows:Lessee accounting• Lessees are required to recognise assets and
liabilities for all leases with a term of more than 12 months, unless the underlying asset is of low value.
• A lessee measures right-of-use assets similarly to other non-financial assets and lease liabilities similarly to other financial liabilities.
• Assets and liabilities arising from a lease are initially measured on a present value basis. The measurement includes non-cancellable lease payments (including inflation-linked payments), and also includes payments to be made in optional periods if the lessee is reasonably certain to exercise an option to extend the lease, or not to exercise an option to terminate the lease.
• AASB 16 contains disclosure requirements for lessees.
Lessor accounting• AASB 16 substantially carries forward the lessor
accounting requirements in AASB 117. Accordingly, a lessor continues to classify its leases as operating leases or finance leases, and to account for those two types of leases differently.
• AASB 16 also requires enhanced disclosures to be provided by lessors that will improve information disclosed about a lessor’s risk exposure, particularly to residual value risk.
AASB 16 supersedes:a. AASB 117 Leasesb. Interpretation 4 Determining whether an Arrangement
contains a Leasec. SIC-15 Operating Leases—Incentivesd. SIC-27 Evaluating the Substance of Transactions
Involving the Legal Form of a LeaseThe new standard will be effective for annual periods beginning on or after 1 January 2019. Early application is permitted, provided the new revenue standard, AASB 15 Revenue from Contracts with Customers, has been applied, or is applied at the same date as AASB 16.
1 January 2019 The amendments are not expected to have a significant impact on the financial statements.
1 July 2019
NOTE 2 . SUMMARY OF SIGNIFICANT ACCOUNTING POLICIES (CONTINUED)
Bisalloy Steel Group Limited 2017 Annual Report
33
NOTE 3. F INANCIAL RISK MANAGEMENTOverviewThe Group has exposure to the following risks from their use of financial instruments:
• Credit risk• Liquidity risk• Market risk
The board is responsible for ensuring that risks, and also opportunities, are identified on a timely basis and that the Group’s objectives and activities are aligned with the risks and opportunities identified by the board.
The board has established an Audit and Risk Committee comprising non-executive directors, whose meetings are also attended by the executive directors. In addition sub-committees are convened as appropriate in response to issues and risks identified by the board, and the sub-committee further examines the issue and reports back to the board.
The board has a number of mechanisms in place to ensure that management’s objectives and activities are aligned with the risks identified by the board. These include the following:
• Board approval of a strategic plan, which encompasses the Group’s vision, mission and strategy statements, designed to meet stakeholders’ needs and manage business risk.
• Implementation of board approved operating plans and budgets and board monitoring of progress against these budgets, including the establishment and monitoring of KPIs of both a financial and non-financial nature.
• The establishment of committees to report on specific business risks, including for example, matters such as environmental issues and concerns and occupational health and safety.
• The board reviews financial risks such as the Group’s liquidity, currency, interest rate and credit policies and exposures and monitors management’s actions to ensure they are in line with Group policy.
Credit riskCredit risk is the risk of financial loss to the Group if a customer fails to meet its contractual obligations, and arises principally from the Group’s receivables from customers.
Trade and other receivablesThe Group’s exposure to credit risk is influenced mainly by the individual characteristics of each customer. The Group has a narrow customer base and has the potential to be exposed to credit risk on a specific customer.
A credit policy is in place, the objective of which is:
• To ensure all credit worthiness checks are carried out prior to opening new credit accounts and appropriate authorisations obtained;
• To ensure the approved credit limit is appropriate to the inherent risk of trading with any particular customer;
• To ensure all orders are converted into cash within trading terms;
• To minimise late payments and any potential bad debts through the constant application of sound commercial debtor management on a continuing basis;
The credit policy requires credit insurance to be taken out against customers where the concentration risk of trading with any specific customer is assessed as high.
Goods are sold subject to retention of title clauses that permit the Group to reclaim stock from a customer up to the value of monies owed in the event:
• Official Manager• Receiver and Manager• Administrator• Liquidator
or similar business administration is appointed to the customer’s business.
The Group has established an allowance for impairment that represents their estimate of incurred losses in respect of trade and other receivables. The main components of this allowance are a specific loss component that relates to individually significant exposures, and a collective loss component established for groups of similar assets in respect of losses that have been incurred but not yet identified. The collective loss is based on historical data of payment statistics for similar financial assets.
The maximum exposure to credit risk for these financial assets is limited to their carrying amounts as disclosed in note 11.
Liquidity riskLiquidity risk is the risk that the Group will not be able to meet its financial obligations as they fall due. The Group’s approach to managing liquidity is to ensure, as far as possible, that it will always have sufficient liquidity to meet its liabilities as and when they fall due without incurring unacceptable losses or risking damaging the Group’s reputation.
On 30 May 2017 the Group entered into a new facility agreement which currently comprises a $7m bank bill facility, a $7m invoice finance facility and a $2m export working capital facility. The drawn invoice finance facility balance is limited to the value of the available collateral being eligible receivables, and fluctuates daily. At reporting date, the carrying amount of assets pledged as collateral was $44.8m (2016: $34.2m).
In addition to the eligible collateral, the Group has several general and financial undertakings which it must comply with including an Equity Ratio covenant, a Leverage Ratio covenant and an Interest Cover Ratio covenant.
Due to the nature of the facility, cashflow is managed on a daily basis, comparing actual against forecast collateral, receipts and payments. Each month a complete review is undertaken of the projected daily cashflow.
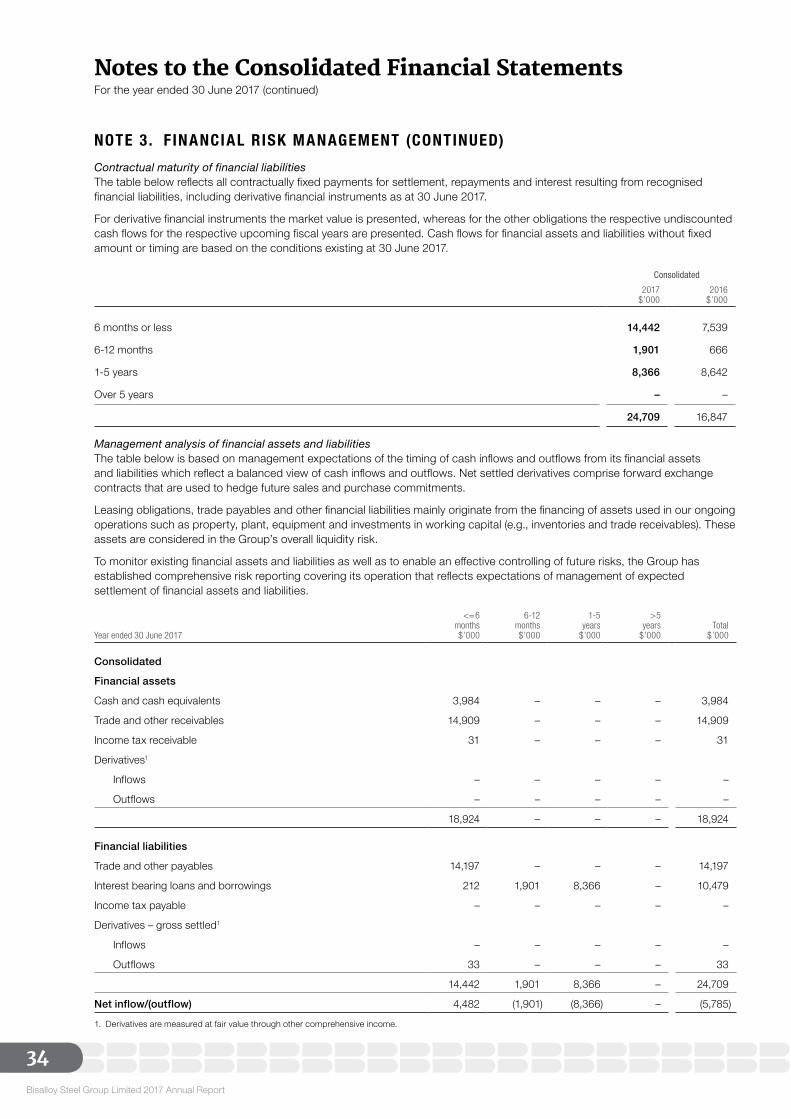
Bisalloy Steel Group Limited 2017 Annual Report
34
Notes to the Consolidated Financial Statements For the year ended 30 June 2017 (continued)
Contractual maturity of financial liabilitiesThe table below reflects all contractually fixed payments for settlement, repayments and interest resulting from recognised financial liabilities, including derivative financial instruments as at 30 June 2017.
For derivative financial instruments the market value is presented, whereas for the other obligations the respective undiscounted cash flows for the respective upcoming fiscal years are presented. Cash flows for financial assets and liabilities without fixed amount or timing are based on the conditions existing at 30 June 2017.
Consolidated
2017$’000
2016$’000
6 months or less 14,442 7,539
6-12 months 1,901 666
1-5 years 8,366 8,642
Over 5 years – –
24,709 16,847
Management analysis of financial assets and liabilitiesThe table below is based on management expectations of the timing of cash inflows and outflows from its financial assets and liabilities which reflect a balanced view of cash inflows and outflows. Net settled derivatives comprise forward exchange contracts that are used to hedge future sales and purchase commitments.
Leasing obligations, trade payables and other financial liabilities mainly originate from the financing of assets used in our ongoing operations such as property, plant, equipment and investments in working capital (e.g., inventories and trade receivables). These assets are considered in the Group’s overall liquidity risk.
To monitor existing financial assets and liabilities as well as to enable an effective controlling of future risks, the Group has established comprehensive risk reporting covering its operation that reflects expectations of management of expected settlement of financial assets and liabilities.
Year ended 30 June 2017
<=6months$’000
6-12months$’000
1-5years
$’000
>5years
$’000Total
$’000
Consolidated
Financial assets
Cash and cash equivalents 3,984 – – – 3,984
Trade and other receivables 14,909 – – – 14,909
Income tax receivable 31 – – – 31
Derivatives1
Inflows – – – – –
Outflows – – – – –
18,924 – – – 18,924
Financial liabilities
Trade and other payables 14,197 – – – 14,197
Interest bearing loans and borrowings 212 1,901 8,366 – 10,479
Income tax payable – – – – –
Derivatives – gross settled1
Inflows – – – – –
Outflows 33 – – – 33
14,442 1,901 8,366 – 24,709
Net inflow/(outflow) 4,482 (1,901) (8,366) – (5,785)
1. Derivatives are measured at fair value through other comprehensive income.
NOTE 3. F INANCIAL RISK MANAGEMENT (CONTINUED)
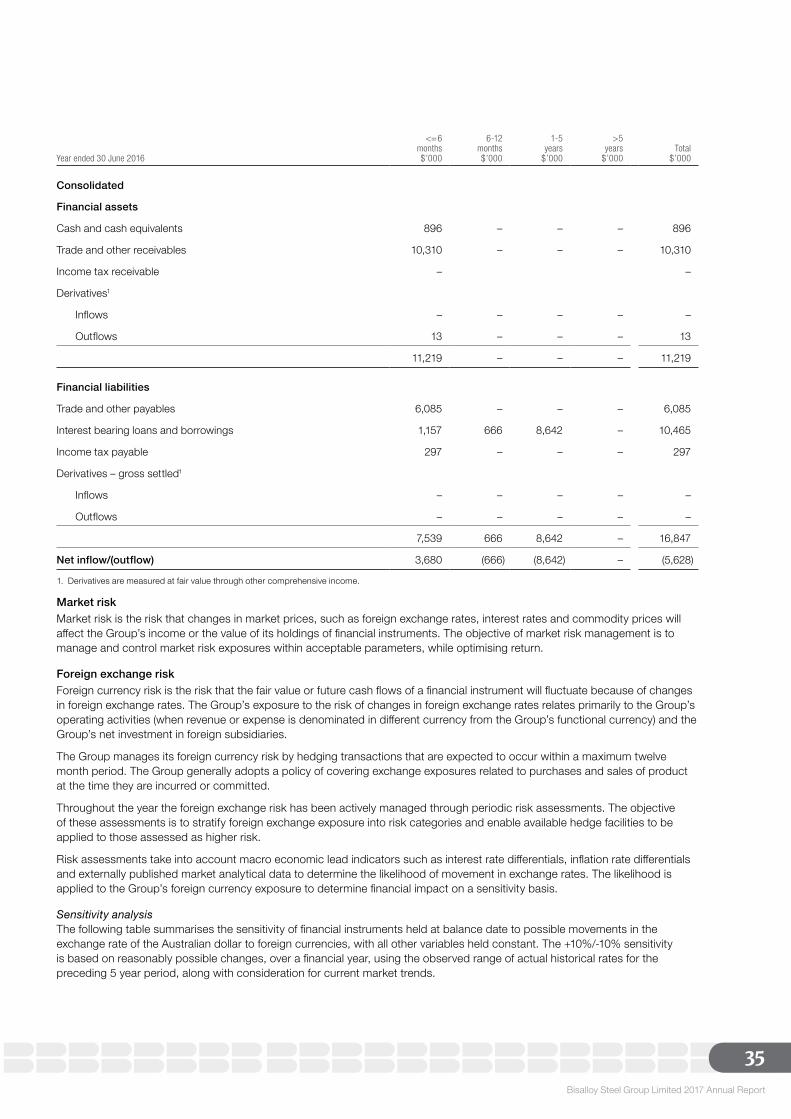
Bisalloy Steel Group Limited 2017 Annual Report
35
Year ended 30 June 2016
<=6months$’000
6-12months$’000
1-5years
$’000
>5years
$’000Total
$’000
Consolidated
Financial assets
Cash and cash equivalents 896 – – – 896
Trade and other receivables 10,310 – – – 10,310
Income tax receivable – –
Derivatives1
Inflows – – – – –
Outflows 13 – – – 13
11,219 – – – 11,219
Financial liabilities
Trade and other payables 6,085 – – – 6,085
Interest bearing loans and borrowings 1,157 666 8,642 – 10,465
Income tax payable 297 – – – 297
Derivatives – gross settled1
Inflows – – – – –
Outflows – – – – –
7,539 666 8,642 – 16,847
Net inflow/(outflow) 3,680 (666) (8,642) – (5,628)
1. Derivatives are measured at fair value through other comprehensive income.
Market riskMarket risk is the risk that changes in market prices, such as foreign exchange rates, interest rates and commodity prices will affect the Group’s income or the value of its holdings of financial instruments. The objective of market risk management is to manage and control market risk exposures within acceptable parameters, while optimising return.
Foreign exchange riskForeign currency risk is the risk that the fair value or future cash flows of a financial instrument will fluctuate because of changes in foreign exchange rates. The Group’s exposure to the risk of changes in foreign exchange rates relates primarily to the Group’s operating activities (when revenue or expense is denominated in different currency from the Group’s functional currency) and the Group’s net investment in foreign subsidiaries.
The Group manages its foreign currency risk by hedging transactions that are expected to occur within a maximum twelve month period. The Group generally adopts a policy of covering exchange exposures related to purchases and sales of product at the time they are incurred or committed.
Throughout the year the foreign exchange risk has been actively managed through periodic risk assessments. The objective of these assessments is to stratify foreign exchange exposure into risk categories and enable available hedge facilities to be applied to those assessed as higher risk.
Risk assessments take into account macro economic lead indicators such as interest rate differentials, inflation rate differentials and externally published market analytical data to determine the likelihood of movement in exchange rates. The likelihood is applied to the Group’s foreign currency exposure to determine financial impact on a sensitivity basis.
Sensitivity analysisThe following table summarises the sensitivity of financial instruments held at balance date to possible movements in the exchange rate of the Australian dollar to foreign currencies, with all other variables held constant. The +10%/-10% sensitivity is based on reasonably possible changes, over a financial year, using the observed range of actual historical rates for the preceding 5 year period, along with consideration for current market trends.
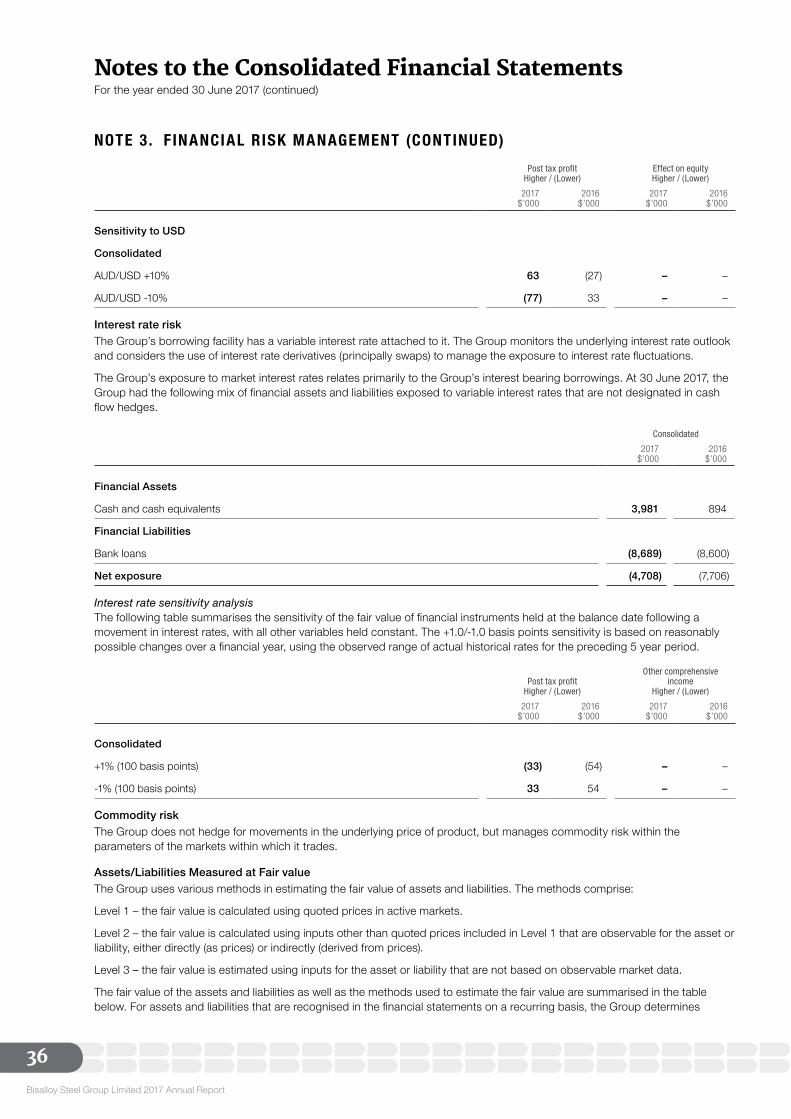
Bisalloy Steel Group Limited 2017 Annual Report
36
Notes to the Consolidated Financial Statements For the year ended 30 June 2017 (continued)
Post tax profit Higher / (Lower)
Effect on equity Higher / (Lower)
2017$’000
2016$’000
2017$’000
2016$’000
Sensitivity to USD
Consolidated
AUD/USD +10% 63 (27) – –
AUD/USD -10% (77) 33 – –
Interest rate riskThe Group’s borrowing facility has a variable interest rate attached to it. The Group monitors the underlying interest rate outlook and considers the use of interest rate derivatives (principally swaps) to manage the exposure to interest rate fluctuations.
The Group’s exposure to market interest rates relates primarily to the Group’s interest bearing borrowings. At 30 June 2017, the Group had the following mix of financial assets and liabilities exposed to variable interest rates that are not designated in cash flow hedges.
Consolidated
2017$’000
2016$’000
Financial Assets
Cash and cash equivalents 3,981 894
Financial Liabilities
Bank loans (8,689) (8,600)
Net exposure (4,708) (7,706)
Interest rate sensitivity analysisThe following table summarises the sensitivity of the fair value of financial instruments held at the balance date following a movement in interest rates, with all other variables held constant. The +1.0/-1.0 basis points sensitivity is based on reasonably possible changes over a financial year, using the observed range of actual historical rates for the preceding 5 year period.
Post tax profit Higher / (Lower)
Other comprehensive income
Higher / (Lower)
2017$’000
2016$’000
2017$’000
2016$’000
Consolidated
+1% (100 basis points) (33) (54) – –
-1% (100 basis points) 33 54 – –
Commodity riskThe Group does not hedge for movements in the underlying price of product, but manages commodity risk within the parameters of the markets within which it trades.
Assets/Liabilities Measured at Fair valueThe Group uses various methods in estimating the fair value of assets and liabilities. The methods comprise:
Level 1 – the fair value is calculated using quoted prices in active markets.
Level 2 – the fair value is calculated using inputs other than quoted prices included in Level 1 that are observable for the asset or liability, either directly (as prices) or indirectly (derived from prices).
Level 3 – the fair value is estimated using inputs for the asset or liability that are not based on observable market data.
The fair value of the assets and liabilities as well as the methods used to estimate the fair value are summarised in the table below. For assets and liabilities that are recognised in the financial statements on a recurring basis, the Group determines
NOTE 3. F INANCIAL RISK MANAGEMENT (CONTINUED)
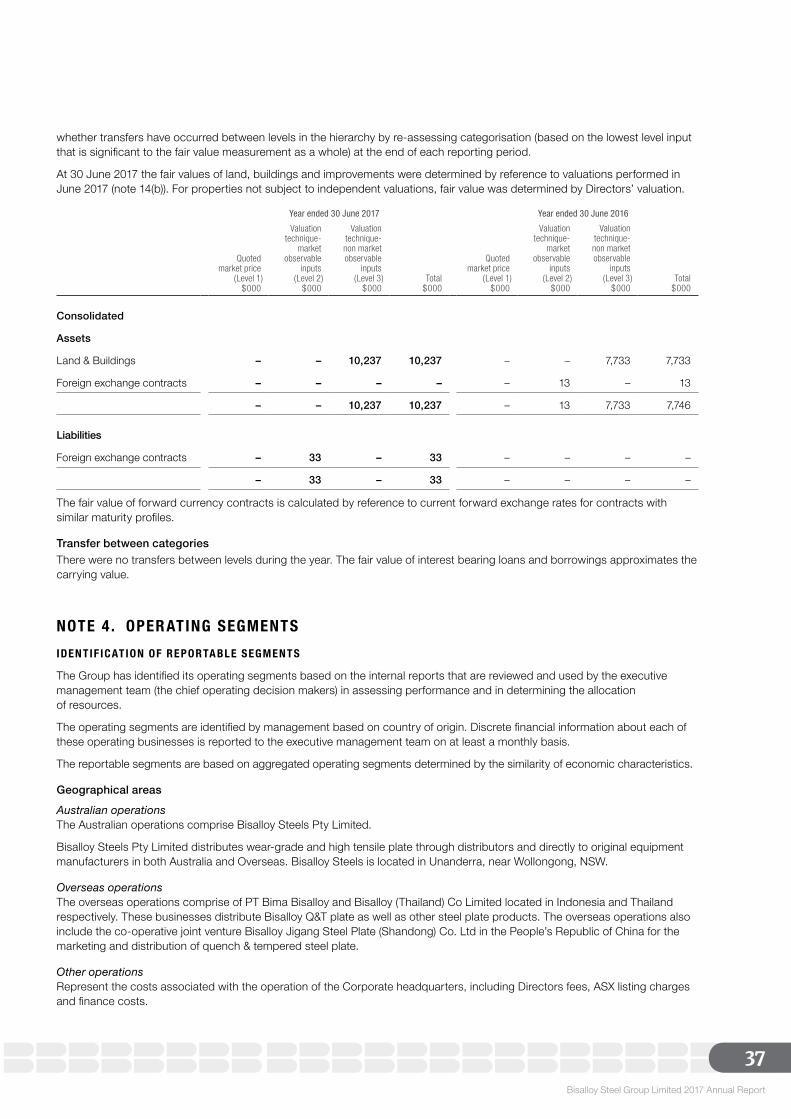
Bisalloy Steel Group Limited 2017 Annual Report
37
whether transfers have occurred between levels in the hierarchy by re-assessing categorisation (based on the lowest level input that is significant to the fair value measurement as a whole) at the end of each reporting period.
At 30 June 2017 the fair values of land, buildings and improvements were determined by reference to valuations performed in June 2017 (note 14(b)). For properties not subject to independent valuations, fair value was determined by Directors’ valuation.
Year ended 30 June 2017 Year ended 30 June 2016
Quoted market price
(Level 1)$000
Valuationtechnique-
marketobservable
inputs (Level 2)
$000
Valuationtechnique-non marketobservable
inputs (Level 3)
$000Total
$000
Quoted market price
(Level 1)$000
Valuationtechnique-
marketobservable
inputs (Level 2)
$000
Valuationtechnique-non marketobservable
inputs (Level 3)
$000Total
$000
Consolidated
Assets
Land & Buildings – – 10,237 10,237 – – 7,733 7,733
Foreign exchange contracts – – – – – 13 – 13
– – 10,237 10,237 – 13 7,733 7,746
Liabilities
Foreign exchange contracts – 33 – 33 – – – –
– 33 – 33 – – – –
The fair value of forward currency contracts is calculated by reference to current forward exchange rates for contracts with similar maturity profiles.
Transfer between categoriesThere were no transfers between levels during the year. The fair value of interest bearing loans and borrowings approximates the carrying value.
NOTE 4 . OPER ATING SEGMENTSIDENTIF ICAT ION OF REPORTA BLE SEGMENT S
The Group has identified its operating segments based on the internal reports that are reviewed and used by the executive management team (the chief operating decision makers) in assessing performance and in determining the allocation of resources.
The operating segments are identified by management based on country of origin. Discrete financial information about each of these operating businesses is reported to the executive management team on at least a monthly basis.
The reportable segments are based on aggregated operating segments determined by the similarity of economic characteristics.
Geographical areas
Australian operationsThe Australian operations comprise Bisalloy Steels Pty Limited.
Bisalloy Steels Pty Limited distributes wear-grade and high tensile plate through distributors and directly to original equipment manufacturers in both Australia and Overseas. Bisalloy Steels is located in Unanderra, near Wollongong, NSW.
Overseas operationsThe overseas operations comprise of PT Bima Bisalloy and Bisalloy (Thailand) Co Limited located in Indonesia and Thailand respectively. These businesses distribute Bisalloy Q&T plate as well as other steel plate products. The overseas operations also include the co-operative joint venture Bisalloy Jigang Steel Plate (Shandong) Co. Ltd in the People’s Republic of China for the marketing and distribution of quench & tempered steel plate.
Other operationsRepresent the costs associated with the operation of the Corporate headquarters, including Directors fees, ASX listing charges and finance costs.
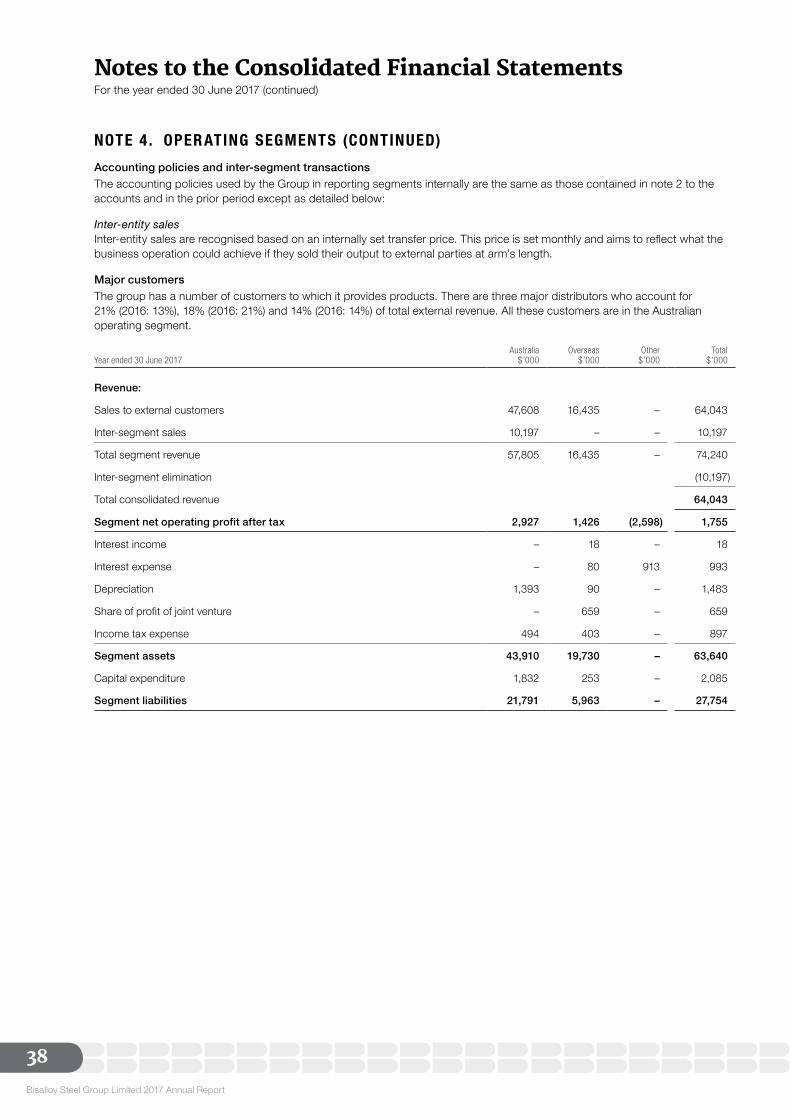
Bisalloy Steel Group Limited 2017 Annual Report
38
Notes to the Consolidated Financial Statements For the year ended 30 June 2017 (continued)
Accounting policies and inter-segment transactionsThe accounting policies used by the Group in reporting segments internally are the same as those contained in note 2 to the accounts and in the prior period except as detailed below:
Inter-entity salesInter-entity sales are recognised based on an internally set transfer price. This price is set monthly and aims to reflect what the business operation could achieve if they sold their output to external parties at arm’s length.
Major customersThe group has a number of customers to which it provides products. There are three major distributors who account for 21% (2016: 13%), 18% (2016: 21%) and 14% (2016: 14%) of total external revenue. All these customers are in the Australian operating segment.
Year ended 30 June 2017Australia
$’000Overseas
$’000Other
$’000Total
$’000
Revenue:
Sales to external customers 47,608 16,435 – 64,043
Inter-segment sales 10,197 – – 10,197
Total segment revenue 57,805 16,435 – 74,240
Inter-segment elimination (10,197)
Total consolidated revenue 64,043
Segment net operating profit after tax 2,927 1,426 (2,598) 1,755
Interest income – 18 – 18
Interest expense – 80 913 993
Depreciation 1,393 90 – 1,483
Share of profit of joint venture – 659 – 659
Income tax expense 494 403 – 897
Segment assets 43,910 19,730 – 63,640
Capital expenditure 1,832 253 – 2,085
Segment liabilities 21,791 5,963 – 27,754
NOTE 4 . OPER ATING SEGMENTS (CONTINUED)
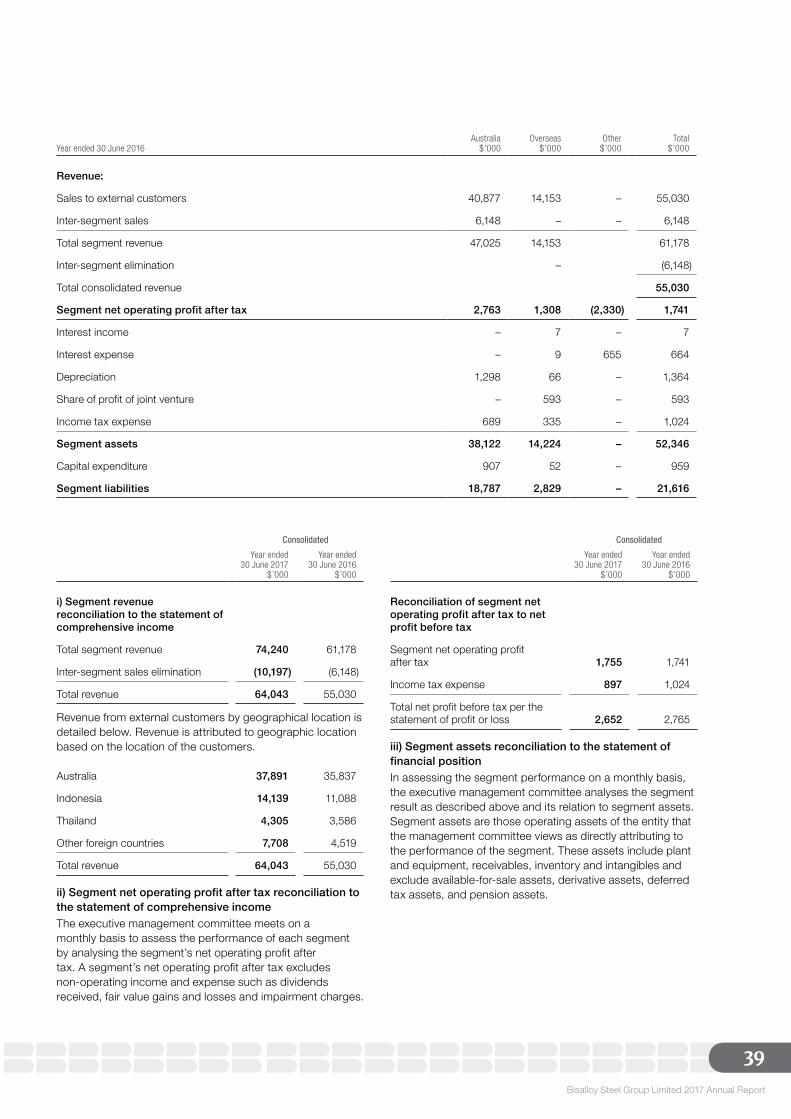
Bisalloy Steel Group Limited 2017 Annual Report
39
Year ended 30 June 2016Australia
$’000Overseas
$’000Other
$’000Total
$’000
Revenue:
Sales to external customers 40,877 14,153 – 55,030
Inter-segment sales 6,148 – – 6,148
Total segment revenue 47,025 14,153 61,178
Inter-segment elimination – (6,148)
Total consolidated revenue 55,030
Segment net operating profit after tax 2,763 1,308 (2,330) 1,741
Interest income – 7 – 7
Interest expense – 9 655 664
Depreciation 1,298 66 – 1,364
Share of profit of joint venture – 593 – 593
Income tax expense 689 335 – 1,024
Segment assets 38,122 14,224 – 52,346
Capital expenditure 907 52 – 959
Segment liabilities 18,787 2,829 – 21,616
Consolidated
Year ended30 June 2017
$’000
Year ended30 June 2016
$’000
i) Segment revenue reconciliation to the statement of comprehensive income
Total segment revenue 74,240 61,178
Inter-segment sales elimination (10,197) (6,148)
Total revenue 64,043 55,030
Revenue from external customers by geographical location is detailed below. Revenue is attributed to geographic location based on the location of the customers.
Australia 37,891 35,837
Indonesia 14,139 11,088
Thailand 4,305 3,586
Other foreign countries 7,708 4,519
Total revenue 64,043 55,030
ii) Segment net operating profit after tax reconciliation to the statement of comprehensive incomeThe executive management committee meets on a monthly basis to assess the performance of each segment by analysing the segment’s net operating profit after tax. A segment’s net operating profit after tax excludes non-operating income and expense such as dividends received, fair value gains and losses and impairment charges.
Consolidated
Year ended30 June 2017
$’000
Year ended30 June 2016
$’000
Reconciliation of segment net operating profit after tax to net profit before tax
Segment net operating profit after tax 1,755 1,741
Income tax expense 897 1,024
Total net profit before tax per the statement of profit or loss 2,652 2,765
iii) Segment assets reconciliation to the statement of financial positionIn assessing the segment performance on a monthly basis, the executive management committee analyses the segment result as described above and its relation to segment assets. Segment assets are those operating assets of the entity that the management committee views as directly attributing to the performance of the segment. These assets include plant and equipment, receivables, inventory and intangibles and exclude available-for-sale assets, derivative assets, deferred tax assets, and pension assets.
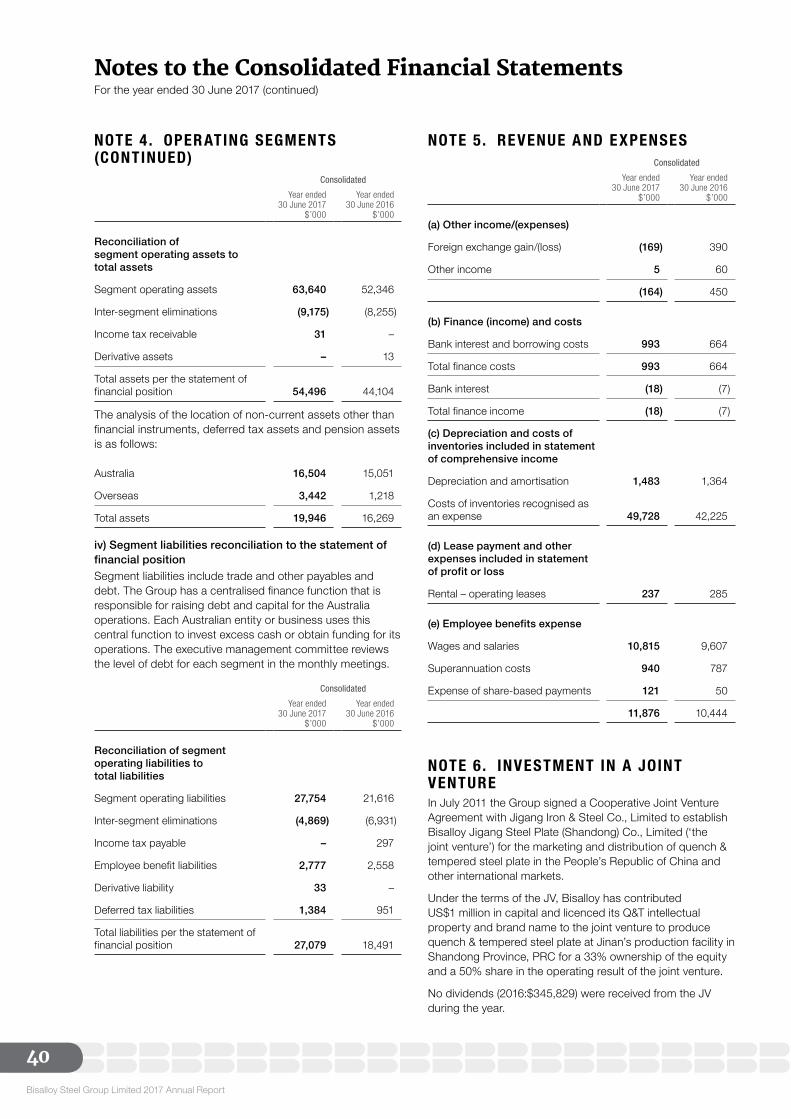
Bisalloy Steel Group Limited 2017 Annual Report
40
Notes to the Consolidated Financial Statements For the year ended 30 June 2017 (continued)
Consolidated
Year ended30 June 2017
$’000
Year ended30 June 2016
$’000
Reconciliation of segment operating assets to total assets
Segment operating assets 63,640 52,346
Inter-segment eliminations (9,175) (8,255)
Income tax receivable 31 –
Derivative assets – 13
Total assets per the statement of financial position 54,496 44,104
The analysis of the location of non-current assets other than financial instruments, deferred tax assets and pension assets is as follows:
Australia 16,504 15,051
Overseas 3,442 1,218
Total assets 19,946 16,269
iv) Segment liabilities reconciliation to the statement of financial positionSegment liabilities include trade and other payables and debt. The Group has a centralised finance function that is responsible for raising debt and capital for the Australia operations. Each Australian entity or business uses this central function to invest excess cash or obtain funding for its operations. The executive management committee reviews the level of debt for each segment in the monthly meetings.
Consolidated
Year ended30 June 2017
$’000
Year ended30 June 2016
$’000
Reconciliation of segment operating liabilities to total liabilities
Segment operating liabilities 27,754 21,616
Inter-segment eliminations (4,869) (6,931)
Income tax payable – 297
Employee benefit liabilities 2,777 2,558
Derivative liability 33 –
Deferred tax liabilities 1,384 951
Total liabilities per the statement of financial position 27,079 18,491
NOTE 5. REVENUE AND E XPENSESConsolidated
Year ended30 June 2017
$’000
Year ended30 June 2016
$’000
(a) Other income/(expenses)
Foreign exchange gain/(loss) (169) 390
Other income 5 60
(164) 450
(b) Finance (income) and costs
Bank interest and borrowing costs 993 664
Total finance costs 993 664
Bank interest (18) (7)
Total finance income (18) (7)
(c) Depreciation and costs of inventories included in statement of comprehensive income
Depreciation and amortisation 1,483 1,364
Costs of inventories recognised as an expense 49,728 42,225
(d) Lease payment and other expenses included in statement of profit or loss
Rental – operating leases 237 285
(e) Employee benefits expense
Wages and salaries 10,815 9,607
Superannuation costs 940 787
Expense of share-based payments 121 50
11,876 10,444
NOTE 6. INVESTMENT IN A JOINT VENTUREIn July 2011 the Group signed a Cooperative Joint Venture Agreement with Jigang Iron & Steel Co., Limited to establish Bisalloy Jigang Steel Plate (Shandong) Co., Limited (‘the joint venture’) for the marketing and distribution of quench & tempered steel plate in the People’s Republic of China and other international markets.
Under the terms of the JV, Bisalloy has contributed US$1 million in capital and licenced its Q&T intellectual property and brand name to the joint venture to produce quench & tempered steel plate at Jinan’s production facility in Shandong Province, PRC for a 33% ownership of the equity and a 50% share in the operating result of the joint venture.
No dividends (2016:$345,829) were received from the JV during the year.
NOTE 4 . OPER ATING SEGMENTS (CONTINUED)
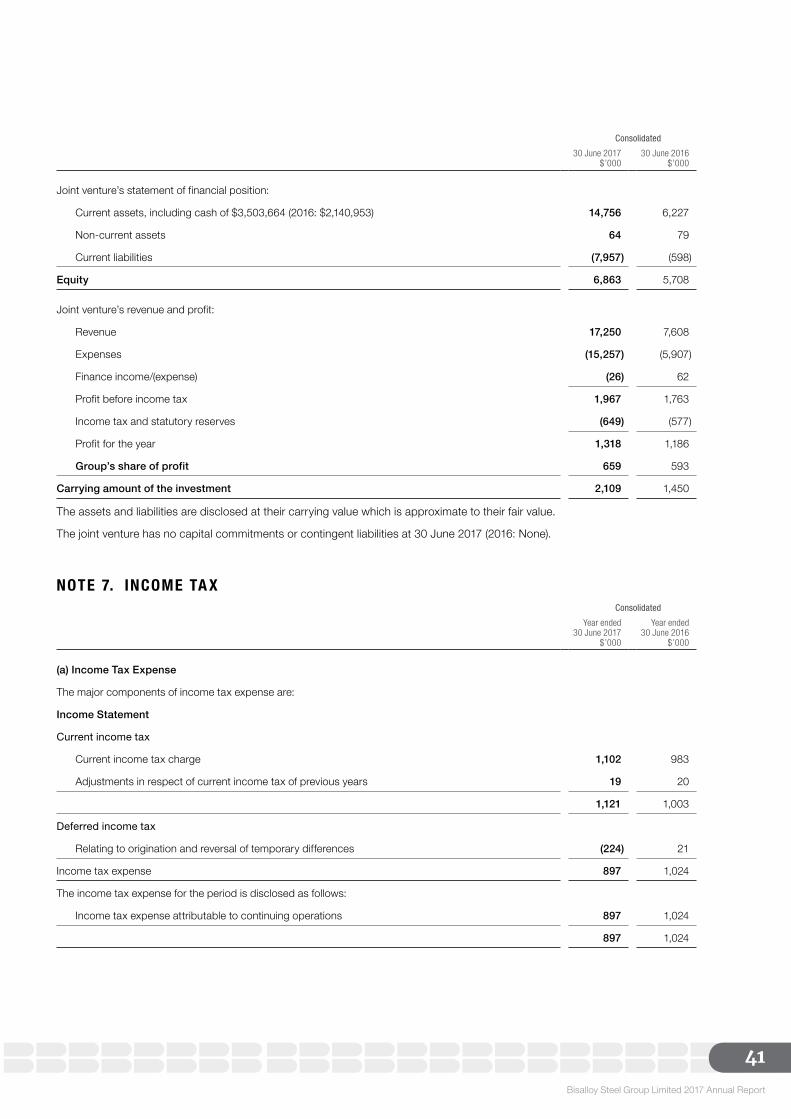
Bisalloy Steel Group Limited 2017 Annual Report
41
Consolidated
30 June 2017$’000
30 June 2016$’000
Joint venture’s statement of financial position:
Current assets, including cash of $3,503,664 (2016: $2,140,953) 14,756 6,227
Non-current assets 64 79
Current liabilities (7,957) (598)
Equity 6,863 5,708
Joint venture’s revenue and profit:
Revenue 17,250 7,608
Expenses (15,257) (5,907)
Finance income/(expense) (26) 62
Profit before income tax 1,967 1,763
Income tax and statutory reserves (649) (577)
Profit for the year 1,318 1,186
Group’s share of profit 659 593
Carrying amount of the investment 2,109 1,450
The assets and liabilities are disclosed at their carrying value which is approximate to their fair value.
The joint venture has no capital commitments or contingent liabilities at 30 June 2017 (2016: None).
NOTE 7. INCOME TA XConsolidated
Year ended30 June 2017
$’000
Year ended30 June 2016
$’000
(a) Income Tax Expense
The major components of income tax expense are:
Income Statement
Current income tax
Current income tax charge 1,102 983
Adjustments in respect of current income tax of previous years 19 20
1,121 1,003
Deferred income tax
Relating to origination and reversal of temporary differences (224) 21
Income tax expense 897 1,024
The income tax expense for the period is disclosed as follows:
Income tax expense attributable to continuing operations 897 1,024
897 1,024
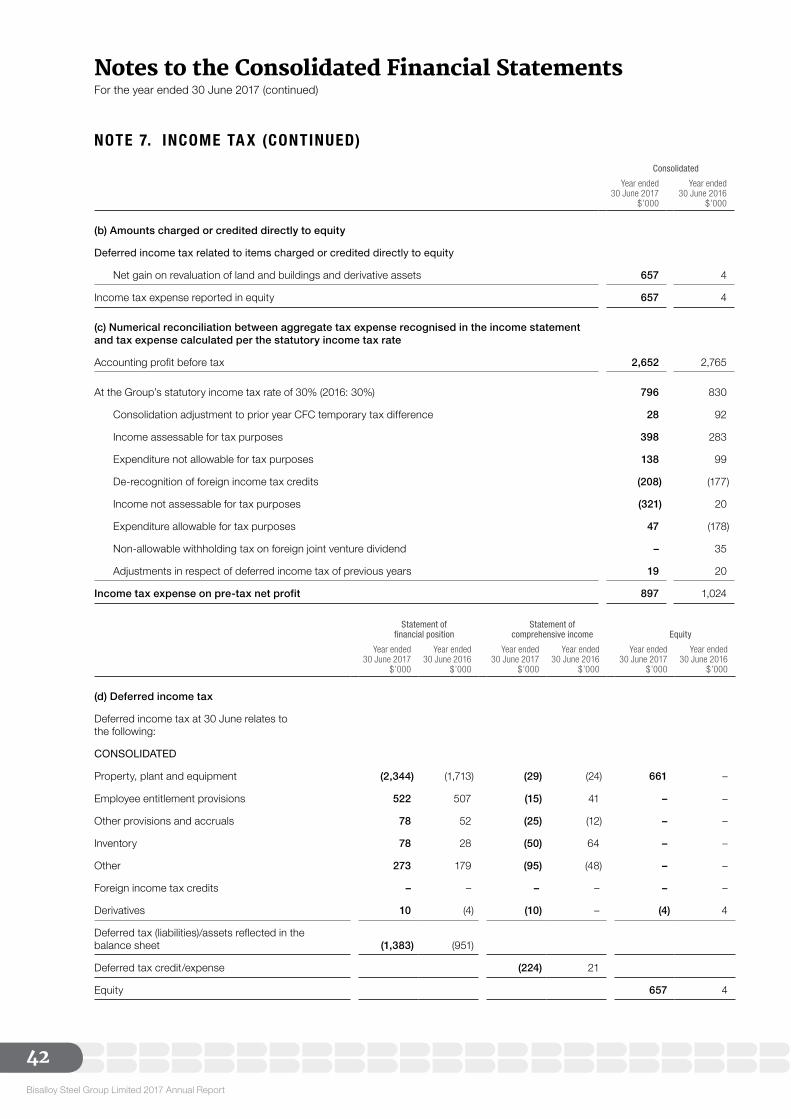
Bisalloy Steel Group Limited 2017 Annual Report
42
Notes to the Consolidated Financial Statements For the year ended 30 June 2017 (continued)
Consolidated
Year ended30 June 2017
$’000
Year ended30 June 2016
$’000
(b) Amounts charged or credited directly to equity
Deferred income tax related to items charged or credited directly to equity
Net gain on revaluation of land and buildings and derivative assets 657 4
Income tax expense reported in equity 657 4
(c) Numerical reconciliation between aggregate tax expense recognised in the income statement and tax expense calculated per the statutory income tax rate
Accounting profit before tax 2,652 2,765
At the Group’s statutory income tax rate of 30% (2016: 30%) 796 830
Consolidation adjustment to prior year CFC temporary tax difference 28 92
Income assessable for tax purposes 398 283
Expenditure not allowable for tax purposes 138 99
De-recognition of foreign income tax credits (208) (177)
Income not assessable for tax purposes (321) 20
Expenditure allowable for tax purposes 47 (178)
Non-allowable withholding tax on foreign joint venture dividend – 35
Adjustments in respect of deferred income tax of previous years 19 20
Income tax expense on pre-tax net profit 897 1,024
Statement of financial position
Statement of comprehensive income Equity
Year ended30 June 2017
$’000
Year ended30 June 2016
$’000
Year ended30 June 2017
$’000
Year ended30 June 2016
$’000
Year ended30 June 2017
$’000
Year ended30 June 2016
$’000
(d) Deferred income tax
Deferred income tax at 30 June relates to the following:
CONSOLIDATED
Property, plant and equipment (2,344) (1,713) (29) (24) 661 –
Employee entitlement provisions 522 507 (15) 41 – –
Other provisions and accruals 78 52 (25) (12) – –
Inventory 78 28 (50) 64 – –
Other 273 179 (95) (48) – –
Foreign income tax credits – – – – – –
Derivatives 10 (4) (10) – (4) 4
Deferred tax (liabilities)/assets reflected in the balance sheet (1,383) (951)
Deferred tax credit/expense (224) 21
Equity 657 4
NOTE 7. INCOME TA X (CONTINUED)
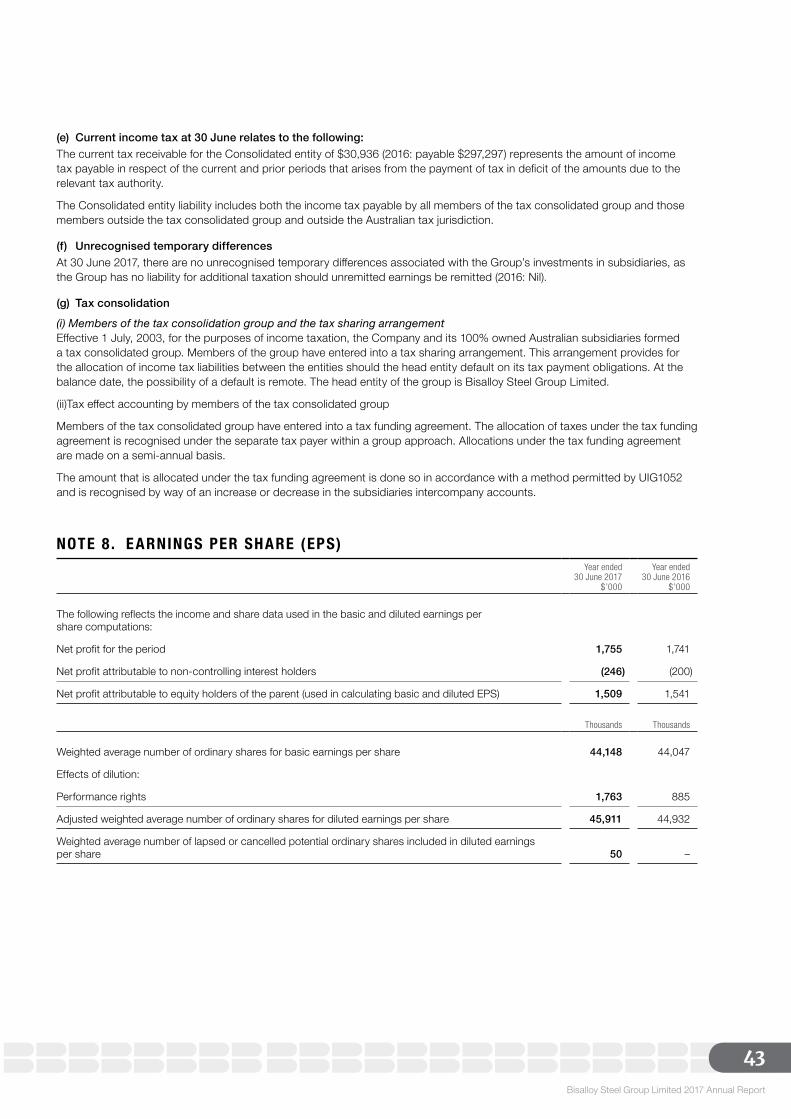
Bisalloy Steel Group Limited 2017 Annual Report
43
(e) Current income tax at 30 June relates to the following:The current tax receivable for the Consolidated entity of $30,936 (2016: payable $297,297) represents the amount of income tax payable in respect of the current and prior periods that arises from the payment of tax in deficit of the amounts due to the relevant tax authority.
The Consolidated entity liability includes both the income tax payable by all members of the tax consolidated group and those members outside the tax consolidated group and outside the Australian tax jurisdiction.
(f) Unrecognised temporary differencesAt 30 June 2017, there are no unrecognised temporary differences associated with the Group’s investments in subsidiaries, as the Group has no liability for additional taxation should unremitted earnings be remitted (2016: Nil).
(g) Tax consolidation
(i) Members of the tax consolidation group and the tax sharing arrangement Effective 1 July, 2003, for the purposes of income taxation, the Company and its 100% owned Australian subsidiaries formed a tax consolidated group. Members of the group have entered into a tax sharing arrangement. This arrangement provides for the allocation of income tax liabilities between the entities should the head entity default on its tax payment obligations. At the balance date, the possibility of a default is remote. The head entity of the group is Bisalloy Steel Group Limited.
(ii)Tax effect accounting by members of the tax consolidated group
Members of the tax consolidated group have entered into a tax funding agreement. The allocation of taxes under the tax funding agreement is recognised under the separate tax payer within a group approach. Allocations under the tax funding agreement are made on a semi-annual basis.
The amount that is allocated under the tax funding agreement is done so in accordance with a method permitted by UIG1052 and is recognised by way of an increase or decrease in the subsidiaries intercompany accounts.
NOTE 8 . E ARNINGS PER SHARE (EPS)Year ended
30 June 2017$’000
Year ended30 June 2016
$’000
The following reflects the income and share data used in the basic and diluted earnings per share computations:
Net profit for the period 1,755 1,741
Net profit attributable to non-controlling interest holders (246) (200)
Net profit attributable to equity holders of the parent (used in calculating basic and diluted EPS) 1,509 1,541
Thousands Thousands
Weighted average number of ordinary shares for basic earnings per share 44,148 44,047
Effects of dilution:
Performance rights 1,763 885
Adjusted weighted average number of ordinary shares for diluted earnings per share 45,911 44,932
Weighted average number of lapsed or cancelled potential ordinary shares included in diluted earnings per share 50 –
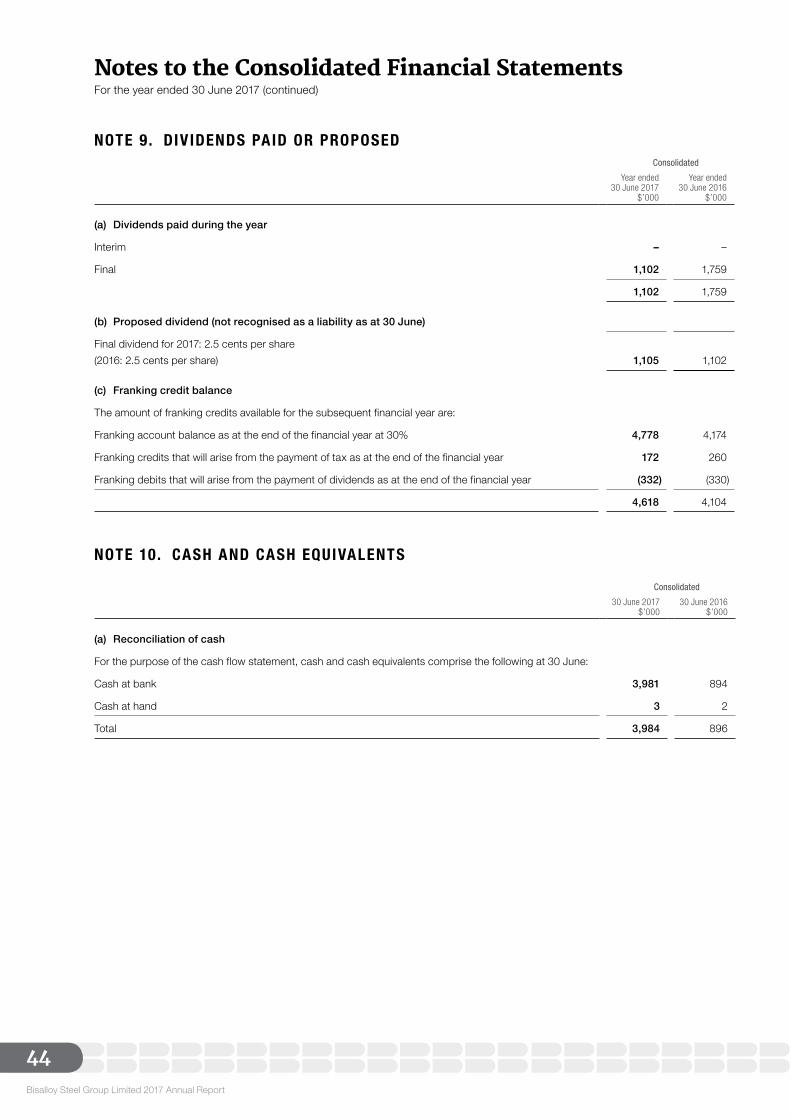
Bisalloy Steel Group Limited 2017 Annual Report
44
Notes to the Consolidated Financial Statements For the year ended 30 June 2017 (continued)
NOTE 9. DIV IDENDS PAID OR PROPOSEDConsolidated
Year ended30 June 2017
$’000
Year ended30 June 2016
$’000
(a) Dividends paid during the year
Interim – –
Final 1,102 1,759
1,102 1,759
(b) Proposed dividend (not recognised as a liability as at 30 June)
Final dividend for 2017: 2.5 cents per share(2016: 2.5 cents per share) 1,105 1,102
(c) Franking credit balance
The amount of franking credits available for the subsequent financial year are:
Franking account balance as at the end of the financial year at 30% 4,778 4,174
Franking credits that will arise from the payment of tax as at the end of the financial year 172 260
Franking debits that will arise from the payment of dividends as at the end of the financial year (332) (330)
4,618 4,104
NOTE 10. CASH AND CASH EQUIVALENTS
Consolidated
30 June 2017$’000
30 June 2016$’000
(a) Reconciliation of cash
For the purpose of the cash flow statement, cash and cash equivalents comprise the following at 30 June:
Cash at bank 3,981 894
Cash at hand 3 2
Total 3,984 896
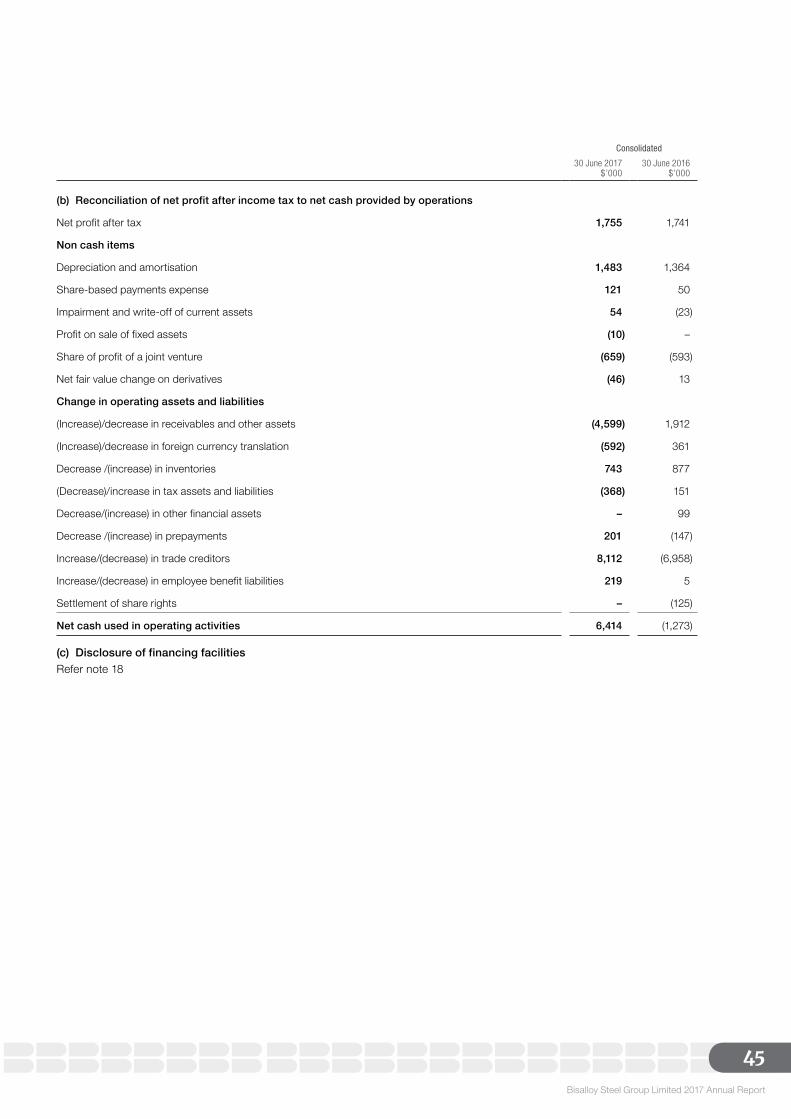
Bisalloy Steel Group Limited 2017 Annual Report
45
Consolidated
30 June 2017$’000
30 June 2016$’000
(b) Reconciliation of net profit after income tax to net cash provided by operations
Net profit after tax 1,755 1,741
Non cash items
Depreciation and amortisation 1,483 1,364
Share-based payments expense 121 50
Impairment and write-off of current assets 54 (23)
Profit on sale of fixed assets (10) –
Share of profit of a joint venture (659) (593)
Net fair value change on derivatives (46) 13
Change in operating assets and liabilities
(Increase)/decrease in receivables and other assets (4,599) 1,912
(Increase)/decrease in foreign currency translation (592) 361
Decrease /(increase) in inventories 743 877
(Decrease)/increase in tax assets and liabilities (368) 151
Decrease/(increase) in other financial assets – 99
Decrease /(increase) in prepayments 201 (147)
Increase/(decrease) in trade creditors 8,112 (6,958)
Increase/(decrease) in employee benefit liabilities 219 5
Settlement of share rights – (125)
Net cash used in operating activities 6,414 (1,273)
(c) Disclosure of financing facilities Refer note 18
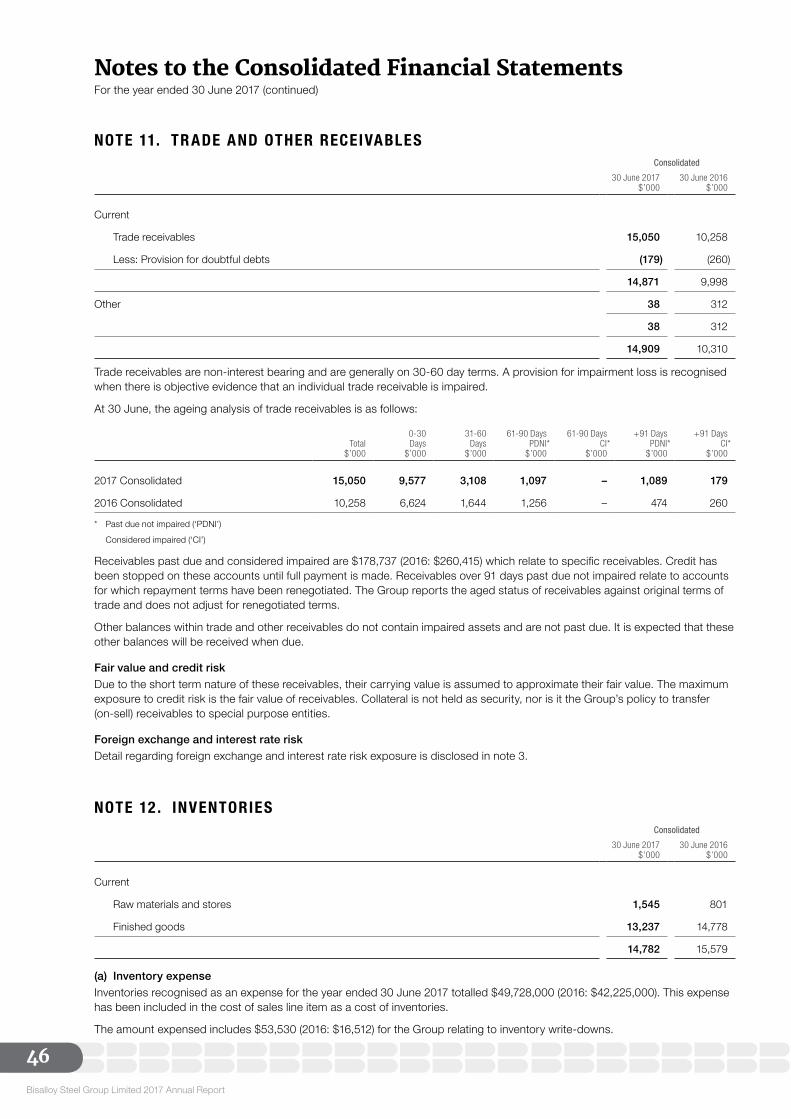
Bisalloy Steel Group Limited 2017 Annual Report
46
Notes to the Consolidated Financial Statements For the year ended 30 June 2017 (continued)
NOTE 11. TR ADE AND OTHER RECEIVABLESConsolidated
30 June 2017$’000
30 June 2016$’000
Current
Trade receivables 15,050 10,258
Less: Provision for doubtful debts (179) (260)
14,871 9,998
Other 38 312
38 312
14,909 10,310
Trade receivables are non-interest bearing and are generally on 30-60 day terms. A provision for impairment loss is recognised when there is objective evidence that an individual trade receivable is impaired.
At 30 June, the ageing analysis of trade receivables is as follows:
Total$’000
0-30Days
$’000
31-60Days
$’000
61-90 DaysPDNI*
$’000
61-90 DaysCI*
$’000
+91 DaysPDNI*
$’000
+91 DaysCI*
$’000
2017 Consolidated 15,050 9,577 3,108 1,097 – 1,089 179
2016 Consolidated 10,258 6,624 1,644 1,256 – 474 260
* Past due not impaired (‘PDNI’)
Considered impaired (‘CI’)
Receivables past due and considered impaired are $178,737 (2016: $260,415) which relate to specific receivables. Credit has been stopped on these accounts until full payment is made. Receivables over 91 days past due not impaired relate to accounts for which repayment terms have been renegotiated. The Group reports the aged status of receivables against original terms of trade and does not adjust for renegotiated terms.
Other balances within trade and other receivables do not contain impaired assets and are not past due. It is expected that these other balances will be received when due.
Fair value and credit riskDue to the short term nature of these receivables, their carrying value is assumed to approximate their fair value. The maximum exposure to credit risk is the fair value of receivables. Collateral is not held as security, nor is it the Group’s policy to transfer (on-sell) receivables to special purpose entities.
Foreign exchange and interest rate riskDetail regarding foreign exchange and interest rate risk exposure is disclosed in note 3.
NOTE 12 . INVENTORIESConsolidated
30 June 2017$’000
30 June 2016$’000
Current
Raw materials and stores 1,545 801
Finished goods 13,237 14,778
14,782 15,579
(a) Inventory expenseInventories recognised as an expense for the year ended 30 June 2017 totalled $49,728,000 (2016: $42,225,000). This expense has been included in the cost of sales line item as a cost of inventories.
The amount expensed includes $53,530 (2016: $16,512) for the Group relating to inventory write-downs.
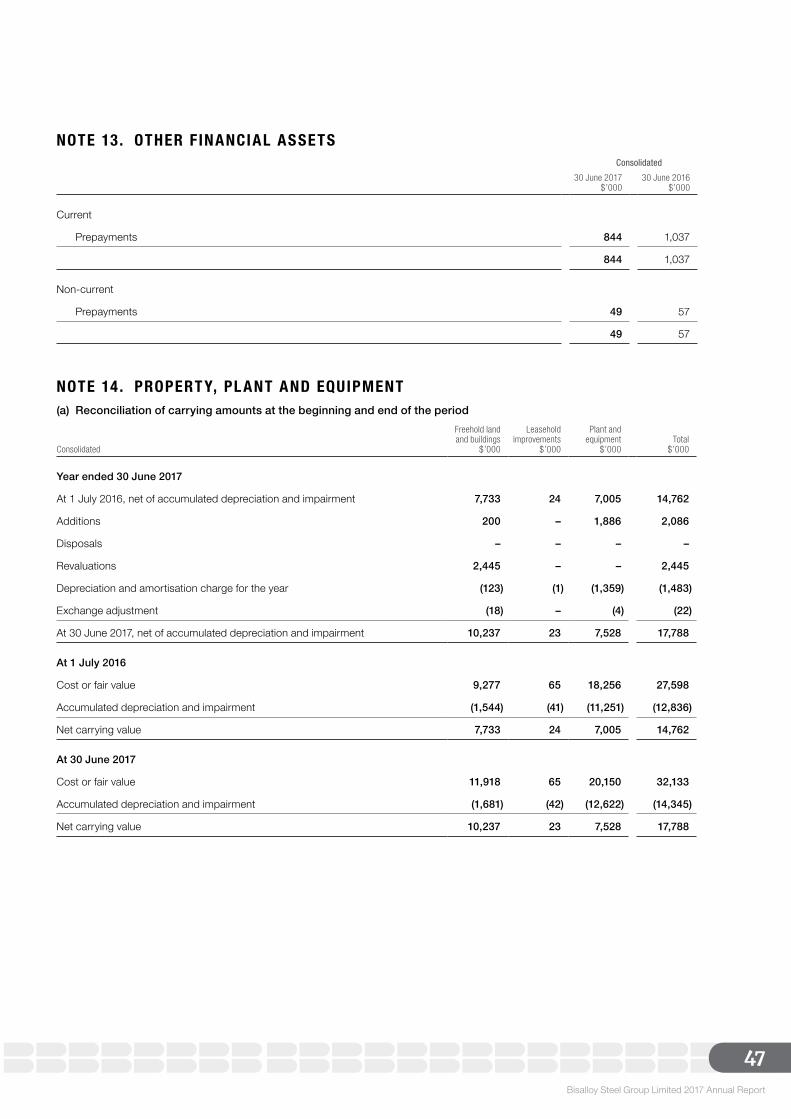
Bisalloy Steel Group Limited 2017 Annual Report
47
NOTE 13. OTHER FINANCIAL ASSETSConsolidated
30 June 2017$’000
30 June 2016$’000
Current
Prepayments 844 1,037
844 1,037
Non-current
Prepayments 49 57
49 57
NOTE 14. PROPERT Y, PL ANT AND EQUIPMENT(a) Reconciliation of carrying amounts at the beginning and end of the period
Consolidated
Freehold landand buildings
$’000
Leaseholdimprovements
$’000
Plant andequipment
$’000Total
$’000
Year ended 30 June 2017
At 1 July 2016, net of accumulated depreciation and impairment 7,733 24 7,005 14,762
Additions 200 – 1,886 2,086
Disposals – – – –
Revaluations 2,445 – – 2,445
Depreciation and amortisation charge for the year (123) (1) (1,359) (1,483)
Exchange adjustment (18) – (4) (22)
At 30 June 2017, net of accumulated depreciation and impairment 10,237 23 7,528 17,788
At 1 July 2016
Cost or fair value 9,277 65 18,256 27,598
Accumulated depreciation and impairment (1,544) (41) (11,251) (12,836)
Net carrying value 7,733 24 7,005 14,762
At 30 June 2017
Cost or fair value 11,918 65 20,150 32,133
Accumulated depreciation and impairment (1,681) (42) (12,622) (14,345)
Net carrying value 10,237 23 7,528 17,788
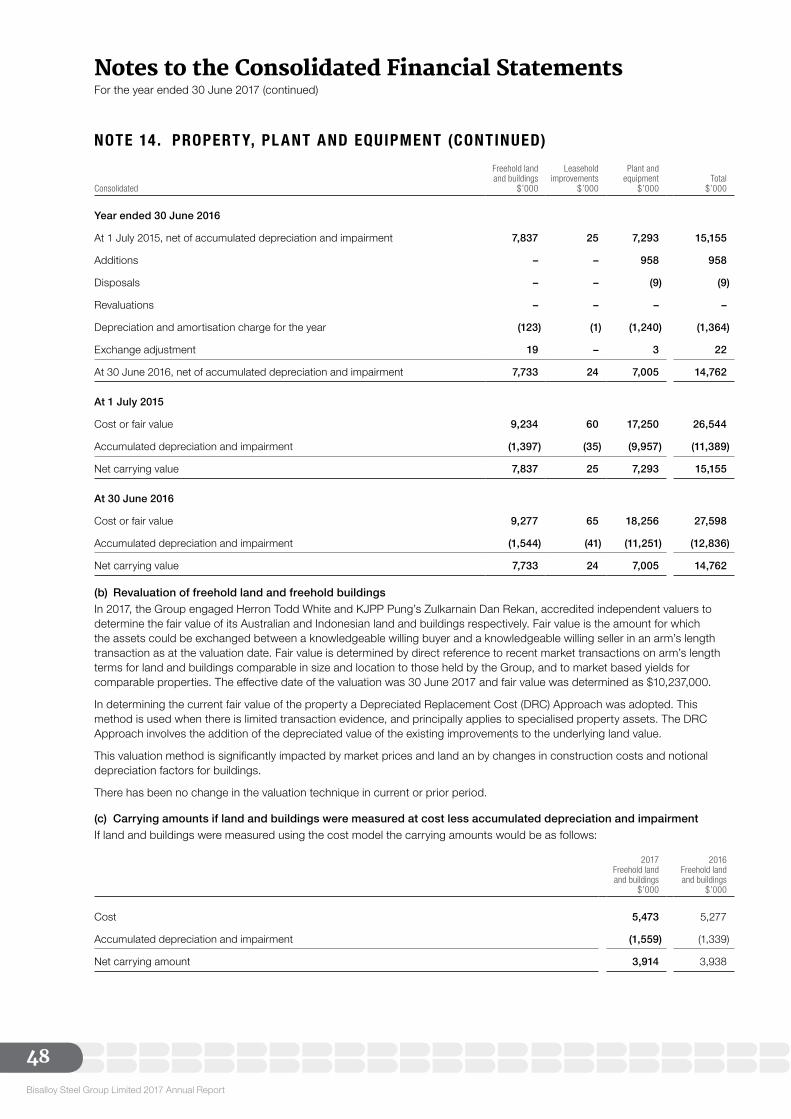
Bisalloy Steel Group Limited 2017 Annual Report
48
Notes to the Consolidated Financial Statements For the year ended 30 June 2017 (continued)
Consolidated
Freehold landand buildings
$’000
Leaseholdimprovements
$’000
Plant andequipment
$’000Total
$’000
Year ended 30 June 2016
At 1 July 2015, net of accumulated depreciation and impairment 7,837 25 7,293 15,155
Additions – – 958 958
Disposals – – (9) (9)
Revaluations – – – –
Depreciation and amortisation charge for the year (123) (1) (1,240) (1,364)
Exchange adjustment 19 – 3 22
At 30 June 2016, net of accumulated depreciation and impairment 7,733 24 7,005 14,762
At 1 July 2015
Cost or fair value 9,234 60 17,250 26,544
Accumulated depreciation and impairment (1,397) (35) (9,957) (11,389)
Net carrying value 7,837 25 7,293 15,155
At 30 June 2016
Cost or fair value 9,277 65 18,256 27,598
Accumulated depreciation and impairment (1,544) (41) (11,251) (12,836)
Net carrying value 7,733 24 7,005 14,762
(b) Revaluation of freehold land and freehold buildingsIn 2017, the Group engaged Herron Todd White and KJPP Pung’s Zulkarnain Dan Rekan, accredited independent valuers to determine the fair value of its Australian and Indonesian land and buildings respectively. Fair value is the amount for which the assets could be exchanged between a knowledgeable willing buyer and a knowledgeable willing seller in an arm’s length transaction as at the valuation date. Fair value is determined by direct reference to recent market transactions on arm’s length terms for land and buildings comparable in size and location to those held by the Group, and to market based yields for comparable properties. The effective date of the valuation was 30 June 2017 and fair value was determined as $10,237,000.
In determining the current fair value of the property a Depreciated Replacement Cost (DRC) Approach was adopted. This method is used when there is limited transaction evidence, and principally applies to specialised property assets. The DRC Approach involves the addition of the depreciated value of the existing improvements to the underlying land value.
This valuation method is significantly impacted by market prices and land an by changes in construction costs and notional depreciation factors for buildings.
There has been no change in the valuation technique in current or prior period.
(c) Carrying amounts if land and buildings were measured at cost less accumulated depreciation and impairmentIf land and buildings were measured using the cost model the carrying amounts would be as follows:
2017Freehold landand buildings
$’000
2016Freehold land and buildings
$’000
Cost 5,473 5,277
Accumulated depreciation and impairment (1,559) (1,339)
Net carrying amount 3,914 3,938
NOTE 14. PROPERT Y, PL ANT AND EQUIPMENT (CONTINUED)
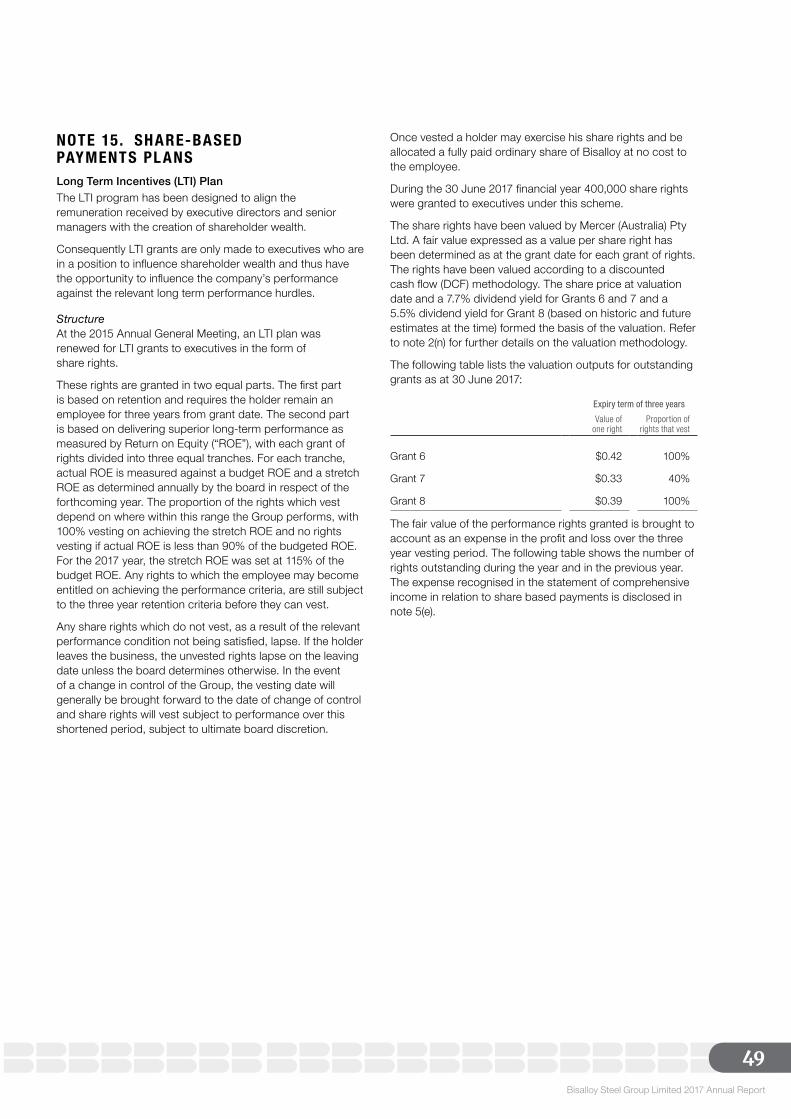
Bisalloy Steel Group Limited 2017 Annual Report
49
NOTE 15. SHARE-BASED PAYMENTS PL ANS Long Term Incentives (LTI) PlanThe LTI program has been designed to align the remuneration received by executive directors and senior managers with the creation of shareholder wealth.
Consequently LTI grants are only made to executives who are in a position to influence shareholder wealth and thus have the opportunity to influence the company’s performance against the relevant long term performance hurdles.
StructureAt the 2015 Annual General Meeting, an LTI plan was renewed for LTI grants to executives in the form of share rights.
These rights are granted in two equal parts. The first part is based on retention and requires the holder remain an employee for three years from grant date. The second part is based on delivering superior long-term performance as measured by Return on Equity (“ROE”), with each grant of rights divided into three equal tranches. For each tranche, actual ROE is measured against a budget ROE and a stretch ROE as determined annually by the board in respect of the forthcoming year. The proportion of the rights which vest depend on where within this range the Group performs, with 100% vesting on achieving the stretch ROE and no rights vesting if actual ROE is less than 90% of the budgeted ROE. For the 2017 year, the stretch ROE was set at 115% of the budget ROE. Any rights to which the employee may become entitled on achieving the performance criteria, are still subject to the three year retention criteria before they can vest.
Any share rights which do not vest, as a result of the relevant performance condition not being satisfied, lapse. If the holder leaves the business, the unvested rights lapse on the leaving date unless the board determines otherwise. In the event of a change in control of the Group, the vesting date will generally be brought forward to the date of change of control and share rights will vest subject to performance over this shortened period, subject to ultimate board discretion.
Once vested a holder may exercise his share rights and be allocated a fully paid ordinary share of Bisalloy at no cost to the employee.
During the 30 June 2017 financial year 400,000 share rights were granted to executives under this scheme.
The share rights have been valued by Mercer (Australia) Pty Ltd. A fair value expressed as a value per share right has been determined as at the grant date for each grant of rights. The rights have been valued according to a discounted cash flow (DCF) methodology. The share price at valuation date and a 7.7% dividend yield for Grants 6 and 7 and a 5.5% dividend yield for Grant 8 (based on historic and future estimates at the time) formed the basis of the valuation. Refer to note 2(n) for further details on the valuation methodology.
The following table lists the valuation outputs for outstanding grants as at 30 June 2017:
Expiry term of three years
Value of one right
Proportion ofrights that vest
Grant 6 $0.42 100%
Grant 7 $0.33 40%
Grant 8 $0.39 100%
The fair value of the performance rights granted is brought to account as an expense in the profit and loss over the three year vesting period. The following table shows the number of rights outstanding during the year and in the previous year. The expense recognised in the statement of comprehensive income in relation to share based payments is disclosed in note 5(e).
Bisalloy Steel Group Limited 2017 Annual Report
50
Notes to the Consolidated Financial Statements For the year ended 30 June 2017 (continued)
Grant 4Vested
Grant 5Unvested
Grant 6Unvested
Grant 7Unvested
Grant 8Unvested Total
Grant date 4 Jan 2013 1 July 2013 26 Feb 2016 23 Mar 2016 19 Oct 2016
Expiry date 4 Jan 2016 30 June 2017 25 Feb 2019 22 Mar 2019 18 Oct 2019
Exercise price $0.00 $0.00 $0.00 $0.00 $0.00
Balance at 30 June 2015 250,000 – – – – 250,000
New grants in the year – – 1,000,000 1,000,000 – 2,000,000
Exercised in the year (250,000) – – – – (250,000)
Lapsed during the year – – – – – –
Balance at 30 June 2016 – – 1,000,000 1,000,000 – 2,000,000
Exercisable at 30 June 2016 – – – – – –
New grants in the year – – – – 400,000 400,000
Exercised in the year – – – – – –
Lapsed during the year – – – (600,000) – (600,000)
Balance at 30 June 2017 – – 1,000,000 400,000 400,000 1,800,000
Exercisable at 30 June 2017 – – – – – –
The weighted average remaining contractual life for the share rights outstanding as at 30 June 2017 is 1.86 years (2016: 2.75 years).
Share Rights PlanThe net amount entered in the Profit or Loss in relation to the above for the current year was a debit of $121,121 (2016: $49,935).
NOTE 16. PENSIONS AND OTHER POST-EMPLOYMENT BENEFIT PL ANSSuperannuation commitmentsThe Group contributes to several externally managed defined contribution superannuation plans, as well as unfunded defined benefit plan in Indonesia. The contributions are defined by the terms of each individual employee’s employment and fully vest at the time the contributions are made.
NOTE 17. TR ADE AND OTHER PAYABLES Consolidated
30 June 2017$’000
30 June 2016$’000
Current
Trade payables 12,436 4,804
Other payables and accruals 1,761 1,281
14,197 6,085
Trade payables are non-interest bearing and are normally settled on 30 day terms.
Other payables and accruals are non-interest bearing and have an average term of three months.
Fair valueDue to the short term nature of these payables, their carrying value is assumed to approximate their fair value.
Interest rate, foreign exchange and liquidity riskInformation regarding interest rate, foreign exchange and liquidity risk exposure is set out in note 3.
NOTE 15. SHARE-BASED PAYMENTS PL ANS (CONTINUED)
Bisalloy Steel Group Limited 2017 Annual Report
51
NOTE 18. INTEREST-BE ARING LOANS AND BORROWINGS
Consolidated
30 June 2017$’000
30 June 2016$’000
Current
Borrowings secured by fixed and floating charges 1,689 1,433
Non-current
Borrowings secured by fixed and floating charges 7,000 7,167
Fair valuesUnless disclosed below, the carrying amount of the Group’s current and non-current borrowings approximate their fair value.
Interest rate, foreign exchange and liquidity riskDetails regarding interest rate, foreign exchange and liquidity risk is disclosed in note 3.
Assets pledged as securityThe fixed and floating charge covers all current and future assets of the Bisalloy Closed Group (note 23).
Consolidated
30 June 2017$’000
30 June 2016$’000
At reporting date, the following financing facilities had been negotiated and were available:
Total facilities
– invoice finance facility (incl. bank guarantees) (i) 7,000 12,000
– bank bill facility (i) 7,000 7,167
– export working capital facility (i) 2,000 –
– Bisalloy Thailand facility (ii) 115 956
– PT Bima facility (iii) 2,698 2,795
18,813 22,918
Facilities used at reporting date
Current
– invoice finance facility (incl. bank guarantees) – 962
– PT Bima facility 1,689 471
1,689 1,433
Non-current
– bank bill facility 7,000 7,167
7,000 7,167
8,689 8,600
Consolidated
30 June 2017$’000
30 June 2016$’000
Facilities unused at reporting date
– invoice finance facility (incl. bank guarantees) 7,000 11,038
– bank bill facility – –
– export working capital facility 2,000 –
– Bisalloy Thailand facility 115 956
– PT Bima facility 1,009 2,324
10,124 14,318
(i) On 30 May 2017 Bisalloy Steel Group Ltd entered into a facility with Westpac Banking Corporation. This facility currently provides Bisalloy Steel Group Limited and Bisalloy Steels Pty Ltd with a:
• $7m invoice finance facility; • $7m bank bill facility; and• $2m export working capital facility
The facility is secured by a fixed and floating charge over all assets of the Closed Group. The facility is subject to usual provisions such as negative covenants and various undertakings, including compliance with an equity ratio covenant, a leverage ratio covenant and an interest coverage ratio. The drawn invoice finance facility balance is limited to the value of the available collateral being eligible receivables, and fluctuates daily. The facility is variable rate linked to an interest rate plus a fixed margin. The average variable interest rate for the year is 5.13% (2016: 4.73%).
(ii) The Group had a THB 3m bank overdraft facility available to its Thailand based subsidiary as at 30 June 2017. This facility is linked to the Minimum Overdraft Rate (MOR), currently 7.125%, and is secured by a guarantee from Bisalloy Steel Group Limited.
(iii) The Group has IDR 1billion and USD$1,500,000 revolver facilities as well as a USD$500,000 Letter of Credit facility available to its Indonesian based subsidiary. The current interest rate for the US$ facility is 6%, while the IDR facility is at 11.5%. These facilities are secured by a charge over the assets of the Indonesian subsidiary and mature on 30 June 2018.
Bisalloy Steel Group Limited 2017 Annual Report
52
Notes to the Consolidated Financial Statements For the year ended 30 June 2017 (continued)
NOTE 19. EMPLOYEE BENEFIT L IABILITIES Consolidated
30 June 2017$’000
30 June 2016$’000
Current
Employee entitlements 1,507 1,294
1,507 1,294
Non-current
Employee entitlements 318 464
Indonesian Defined Benefit Plan 952 800
1,270 1,264
The Group has an unfunded defined benefit plan in Indonesia. This plan provides severance and service benefits pursuant to Indonesian Labor Law No. 13/203 and Company Regulation.
The principal assumptions used in determining the obligation under the defined benefit plan are shown below:
2017%
2016%
Discount rate 7.5 8.0
Future salary increases 8.0 8.0
NOTE 20. DERIVATIVE FINANCIAL INSTRUMENTS Consolidated
30 June 2017$’000
30 June 2016$’000
Current Assets
Forward currency contracts – Cash flow hedges – 13
Forward currency contracts – Fair value hedges – –
– 13
Current Liabilities
Forward currency contracts – Cash flow hedges – –
Forward currency contracts – Fair value hedges 33 –
33 –
Instruments used by the GroupDerivative financial instruments are used by the Group in the normal course of business in order to hedge exposure to fluctuations in foreign exchange rates.
Forward currency contracts
Inventory purchasesDuring the year ended 30 June 2017, in order to protect against exchange rate movements and to manage the inventory costing process, the Group had entered into forward exchange contracts to purchase US$2,125,000. These contracts hedged highly probable forecasted purchases and they were timed to mature when payments are scheduled to be made.
Cash flow hedgesThese hedges are considered cash flow hedges to the point where a purchase invoice is received (and a payable financial liability generated). From this point the hedge protects the financial liability from exchange rate movements and is, therefore, a fair value hedge.
Bisalloy Steel Group Limited 2017 Annual Report
53
The cash flows of these hedges were expected to occur between 1 – 6 months from balance date and the profit and loss will be affected over 12 months as the inventory is either used in production or sold. As at balance date, the details of outstanding contracts in respect of inventory purchases were:
30 June 2017$’000
30 June 2016$’000
30 June 2017Avg Exchange
Rate
30 June 2016Avg Exchange
Rate
Buy US$/Sell Australian $ – 910 – 0.7529
Fair value hedgesAs referred to above, once a purchase invoice has been received for a forecast purchase for which a cash flow hedge was taken out, the hedge now protects the financial liability from exchange rate movements and is, therefore, reclassified as a fair value hedge. As at balance date, the details of outstanding contracts in respect of fair value hedges were:
30 June 2017$’000
30 June 2016$’000
30 June 2017Avg Exchange
Rate
30 June 2016Avg Exchange
Rate
Buy US$/Sell Australian $ 2,796 – 0.7600 –
Interest rate riskInformation regarding interest rate risk exposure is set out in note 3.
Credit riskCredit risk arises from the potential failure of counterparties to meet their obligations at maturity of contracts. This arises on derivative financial instruments with unrealised gains. Management only undertakes such contracts with major Australian banks and financial institutions.
NOTE 21. CONTRIBUTED EQUIT Y AND RESERVES Consolidated
30 June 2017$’000
30 June 2016$’000
(a) Ordinary shares, issued and fully paid 11,575 11,531
Fully paid ordinary shares carry one vote per share and carry the right to dividends. Shares have no par value.
2017 2016
Number ofShares $’000
Number ofShares $’000
(b) Movements in shares on issue
Balance at 1 July 44,082,773 11,531 43,987,234 11,478
Shares issued under Dividend Reinvestment Plan 104,507 44 95,539 53
Balance at 30 June 44,187,280 11,575 44,082,773 11,531
(c) Capital managementWhen managing capital, the Group’s objective is to maintain optimal returns to shareholders and benefits for other stakeholders. The Group also aims to maintain a capital structure that delivers the lowest cost of capital available to its operations.
The Group adjusts the capital structure to take advantage of favourable costs of capital or high returns on assets. As the economic conditions change, the Group may change the amount of dividends to be paid to shareholders, return capital to shareholders, issue new shares or sell assets to reduce debt.
No changes were made in the objectives, policies or processes for managing capital during the years ended 30 June 2017 and 2016.
The Group monitors capital through the gearing ratio (net debt/ total equity plus net debt) and currently targets a gearing ratio of between 10% and 35% while focus remains on reducing the Groups net debt position. The Group includes within net debt interest bearing loans and borrowings less cash and cash equivalents. The gearing ratios based on continuing operations at 30 June 2017 and 2016 were as follows:
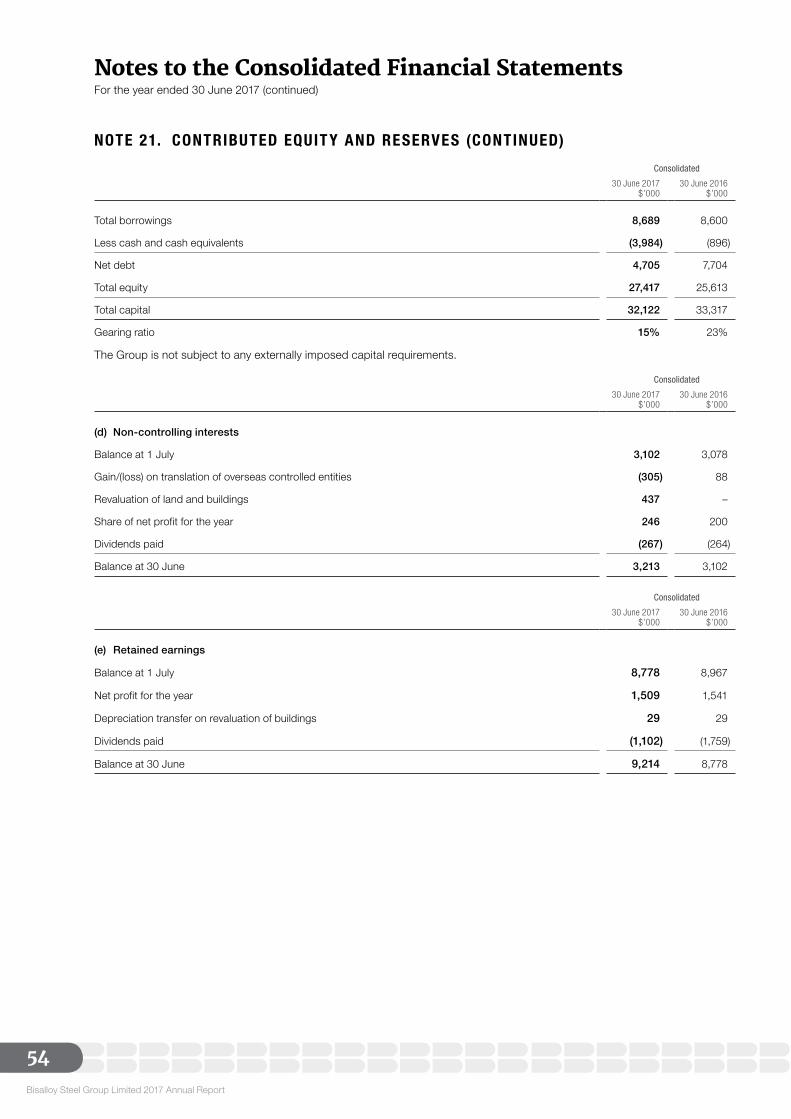
Bisalloy Steel Group Limited 2017 Annual Report
54
Notes to the Consolidated Financial Statements For the year ended 30 June 2017 (continued)
Consolidated
30 June 2017$’000
30 June 2016$’000
Total borrowings 8,689 8,600
Less cash and cash equivalents (3,984) (896)
Net debt 4,705 7,704
Total equity 27,417 25,613
Total capital 32,122 33,317
Gearing ratio 15% 23%
The Group is not subject to any externally imposed capital requirements.
Consolidated
30 June 2017$’000
30 June 2016$’000
(d) Non-controlling interests
Balance at 1 July 3,102 3,078
Gain/(loss) on translation of overseas controlled entities (305) 88
Revaluation of land and buildings 437 –
Share of net profit for the year 246 200
Dividends paid (267) (264)
Balance at 30 June 3,213 3,102
Consolidated
30 June 2017$’000
30 June 2016$’000
(e) Retained earnings
Balance at 1 July 8,778 8,967
Net profit for the year 1,509 1,541
Depreciation transfer on revaluation of buildings 29 29
Dividends paid (1,102) (1,759)
Balance at 30 June 9,214 8,778
NOTE 21. CONTRIBUTED EQUIT Y AND RESERVES (CONTINUED)
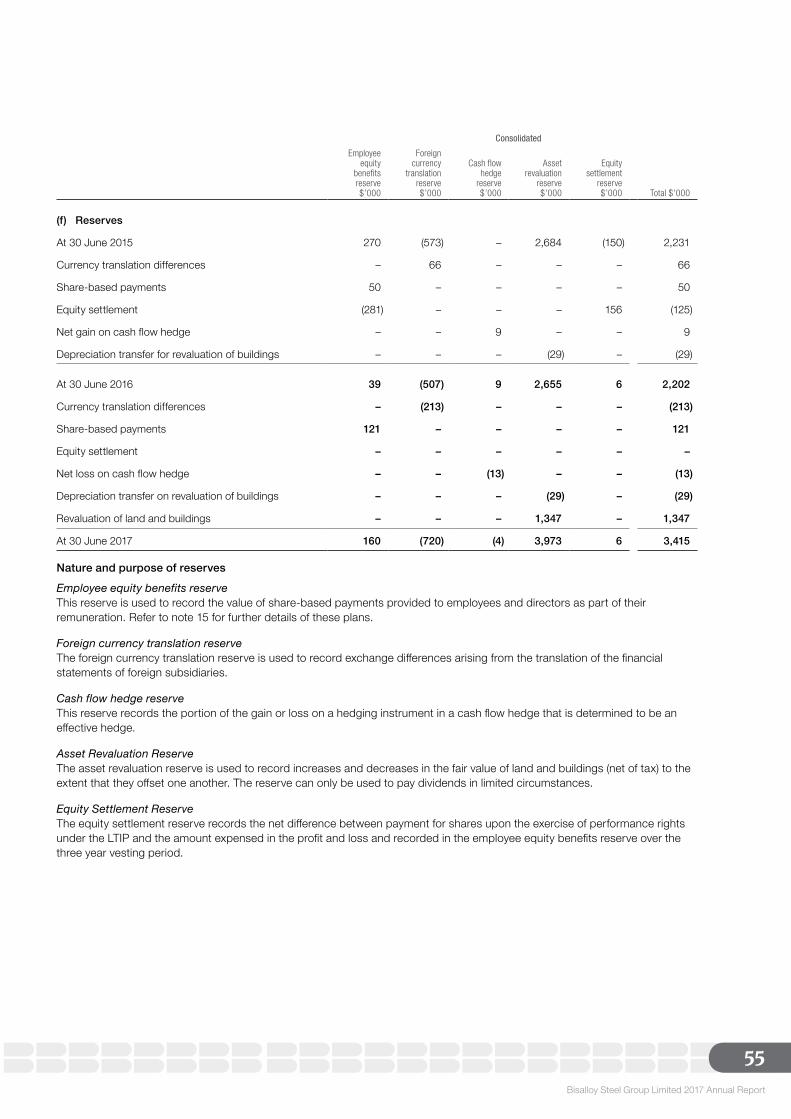
Bisalloy Steel Group Limited 2017 Annual Report
55
Consolidated
Employee equity
benefits reserve$’000
Foreign currency
translationreserve$’000
Cash flow hedge
reserve$’000
Asset revaluation
reserve$’000
Equity settlement
reserve$’000 Total $’000
(f) Reserves
At 30 June 2015 270 (573) – 2,684 (150) 2,231
Currency translation differences – 66 – – – 66
Share-based payments 50 – – – – 50
Equity settlement (281) – – – 156 (125)
Net gain on cash flow hedge – – 9 – – 9
Depreciation transfer for revaluation of buildings – – – (29) – (29)
At 30 June 2016 39 (507) 9 2,655 6 2,202
Currency translation differences – (213) – – – (213)
Share-based payments 121 – – – – 121
Equity settlement – – – – – –
Net loss on cash flow hedge – – (13) – – (13)
Depreciation transfer on revaluation of buildings – – – (29) – (29)
Revaluation of land and buildings – – – 1,347 – 1,347
At 30 June 2017 160 (720) (4) 3,973 6 3,415
Nature and purpose of reserves
Employee equity benefits reserveThis reserve is used to record the value of share-based payments provided to employees and directors as part of their remuneration. Refer to note 15 for further details of these plans.
Foreign currency translation reserveThe foreign currency translation reserve is used to record exchange differences arising from the translation of the financial statements of foreign subsidiaries.
Cash flow hedge reserveThis reserve records the portion of the gain or loss on a hedging instrument in a cash flow hedge that is determined to be an effective hedge.
Asset Revaluation ReserveThe asset revaluation reserve is used to record increases and decreases in the fair value of land and buildings (net of tax) to the extent that they offset one another. The reserve can only be used to pay dividends in limited circumstances.
Equity Settlement ReserveThe equity settlement reserve records the net difference between payment for shares upon the exercise of performance rights under the LTIP and the amount expensed in the profit and loss and recorded in the employee equity benefits reserve over the three year vesting period.
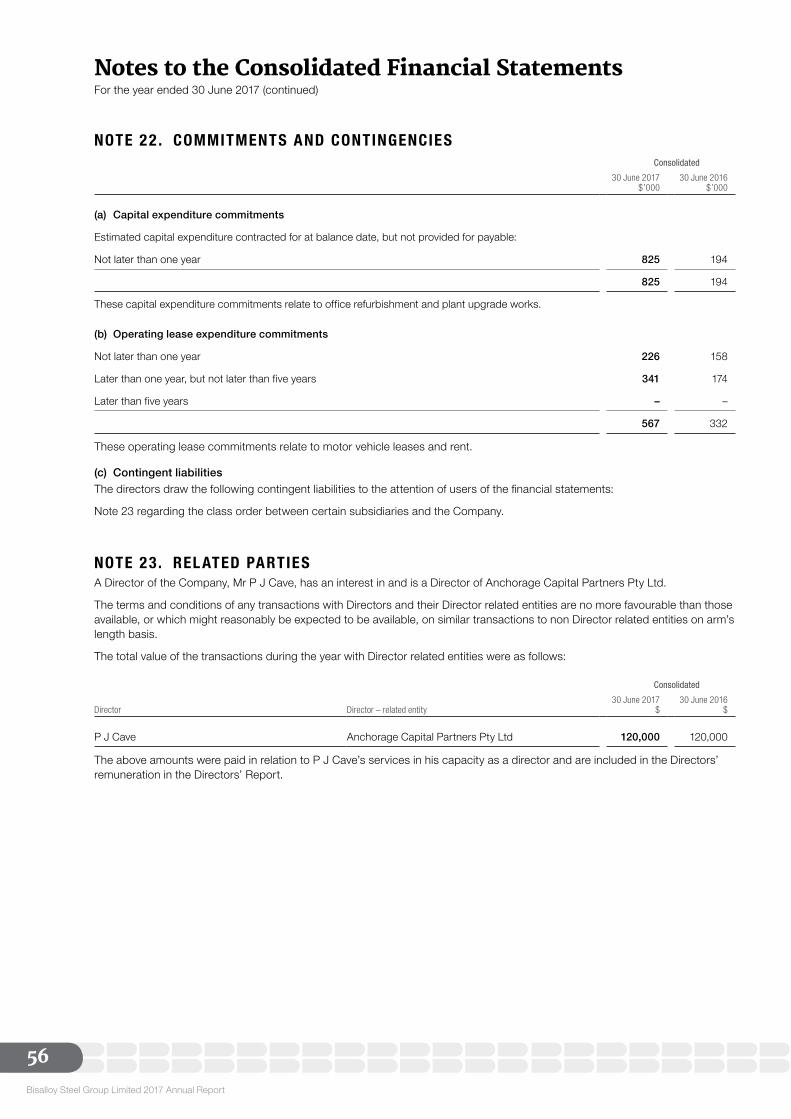
Bisalloy Steel Group Limited 2017 Annual Report
56
Notes to the Consolidated Financial Statements For the year ended 30 June 2017 (continued)
NOTE 22 . COMMITMENTS AND CONTINGENCIESConsolidated
30 June 2017$’000
30 June 2016$’000
(a) Capital expenditure commitments
Estimated capital expenditure contracted for at balance date, but not provided for payable:
Not later than one year 825 194
825 194
These capital expenditure commitments relate to office refurbishment and plant upgrade works.
(b) Operating lease expenditure commitments
Not later than one year 226 158
Later than one year, but not later than five years 341 174
Later than five years – –
567 332
These operating lease commitments relate to motor vehicle leases and rent.
(c) Contingent liabilitiesThe directors draw the following contingent liabilities to the attention of users of the financial statements:
Note 23 regarding the class order between certain subsidiaries and the Company.
NOTE 23. REL ATED PARTIESA Director of the Company, Mr P J Cave, has an interest in and is a Director of Anchorage Capital Partners Pty Ltd.
The terms and conditions of any transactions with Directors and their Director related entities are no more favourable than those available, or which might reasonably be expected to be available, on similar transactions to non Director related entities on arm’s length basis.
The total value of the transactions during the year with Director related entities were as follows:
Consolidated
Director Director – related entity30 June 2017
$30 June 2016
$
P J Cave Anchorage Capital Partners Pty Ltd 120,000 120,000
The above amounts were paid in relation to P J Cave’s services in his capacity as a director and are included in the Directors’ remuneration in the Directors’ Report.
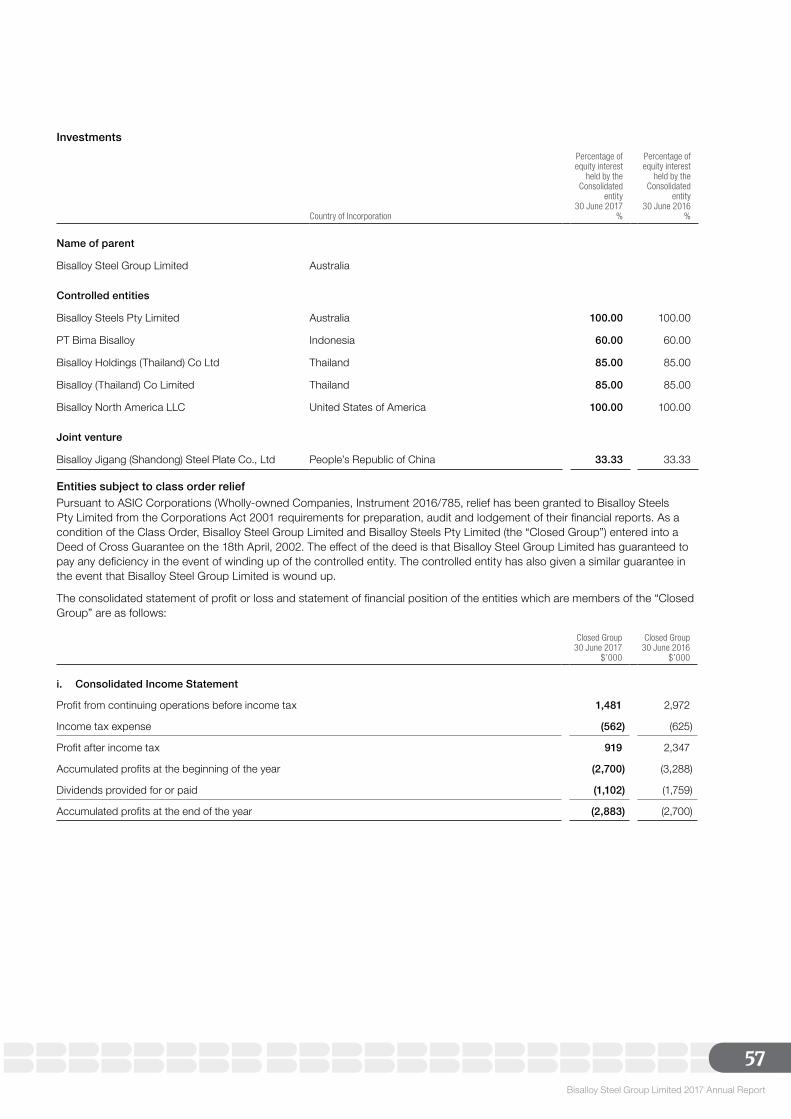
Bisalloy Steel Group Limited 2017 Annual Report
57
Investments
Country of Incorporation
Percentage ofequity interest
held by theConsolidated
entity30 June 2017
%
Percentage ofequity interest
held by theConsolidated
entity30 June 2016
%
Name of parent
Bisalloy Steel Group Limited Australia
Controlled entities
Bisalloy Steels Pty Limited Australia 100.00 100.00
PT Bima Bisalloy Indonesia 60.00 60.00
Bisalloy Holdings (Thailand) Co Ltd Thailand 85.00 85.00
Bisalloy (Thailand) Co Limited Thailand 85.00 85.00
Bisalloy North America LLC United States of America 100.00 100.00
Joint venture
Bisalloy Jigang (Shandong) Steel Plate Co., Ltd People’s Republic of China 33.33 33.33
Entities subject to class order reliefPursuant to ASIC Corporations (Wholly-owned Companies, Instrument 2016/785, relief has been granted to Bisalloy Steels Pty Limited from the Corporations Act 2001 requirements for preparation, audit and lodgement of their financial reports. As a condition of the Class Order, Bisalloy Steel Group Limited and Bisalloy Steels Pty Limited (the “Closed Group”) entered into a Deed of Cross Guarantee on the 18th April, 2002. The effect of the deed is that Bisalloy Steel Group Limited has guaranteed to pay any deficiency in the event of winding up of the controlled entity. The controlled entity has also given a similar guarantee in the event that Bisalloy Steel Group Limited is wound up.
The consolidated statement of profit or loss and statement of financial position of the entities which are members of the “Closed Group” are as follows:
Closed Group30 June 2017
$’000
Closed Group30 June 2016
$’000
i. Consolidated Income Statement
Profit from continuing operations before income tax 1,481 2,972
Income tax expense (562) (625)
Profit after income tax 919 2,347
Accumulated profits at the beginning of the year (2,700) (3,288)
Dividends provided for or paid (1,102) (1,759)
Accumulated profits at the end of the year (2,883) (2,700)
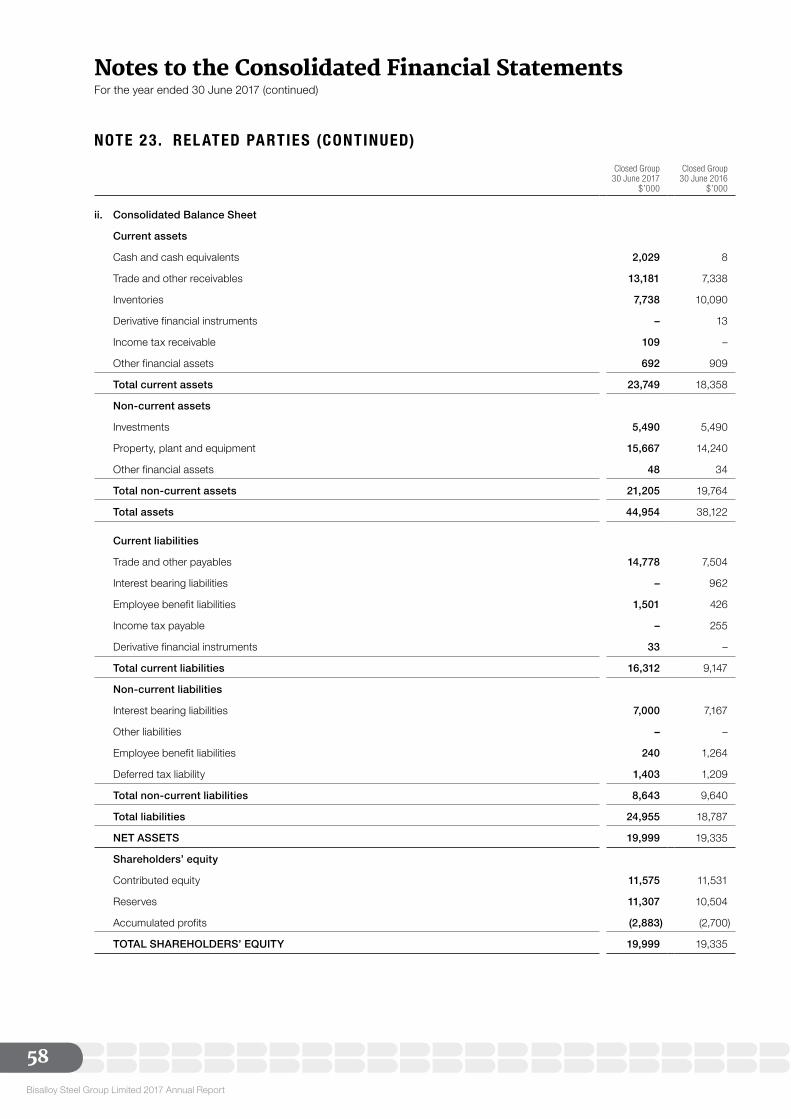
Bisalloy Steel Group Limited 2017 Annual Report
58
Notes to the Consolidated Financial Statements For the year ended 30 June 2017 (continued)
Closed Group30 June 2017
$’000
Closed Group30 June 2016
$’000
ii. Consolidated Balance Sheet
Current assets
Cash and cash equivalents 2,029 8
Trade and other receivables 13,181 7,338
Inventories 7,738 10,090
Derivative financial instruments – 13
Income tax receivable 109 –
Other financial assets 692 909
Total current assets 23,749 18,358
Non-current assets
Investments 5,490 5,490
Property, plant and equipment 15,667 14,240
Other financial assets 48 34
Total non-current assets 21,205 19,764
Total assets 44,954 38,122
Current liabilities
Trade and other payables 14,778 7,504
Interest bearing liabilities – 962
Employee benefit liabilities 1,501 426
Income tax payable – 255
Derivative financial instruments 33 –
Total current liabilities 16,312 9,147
Non-current liabilities
Interest bearing liabilities 7,000 7,167
Other liabilities – –
Employee benefit liabilities 240 1,264
Deferred tax liability 1,403 1,209
Total non-current liabilities 8,643 9,640
Total liabilities 24,955 18,787
NET ASSETS 19,999 19,335
Shareholders’ equity
Contributed equity 11,575 11,531
Reserves 11,307 10,504
Accumulated profits (2,883) (2,700)
TOTAL SHAREHOLDERS’ EQUITY 19,999 19,335
NOTE 23. REL ATED PARTIES (CONTINUED)
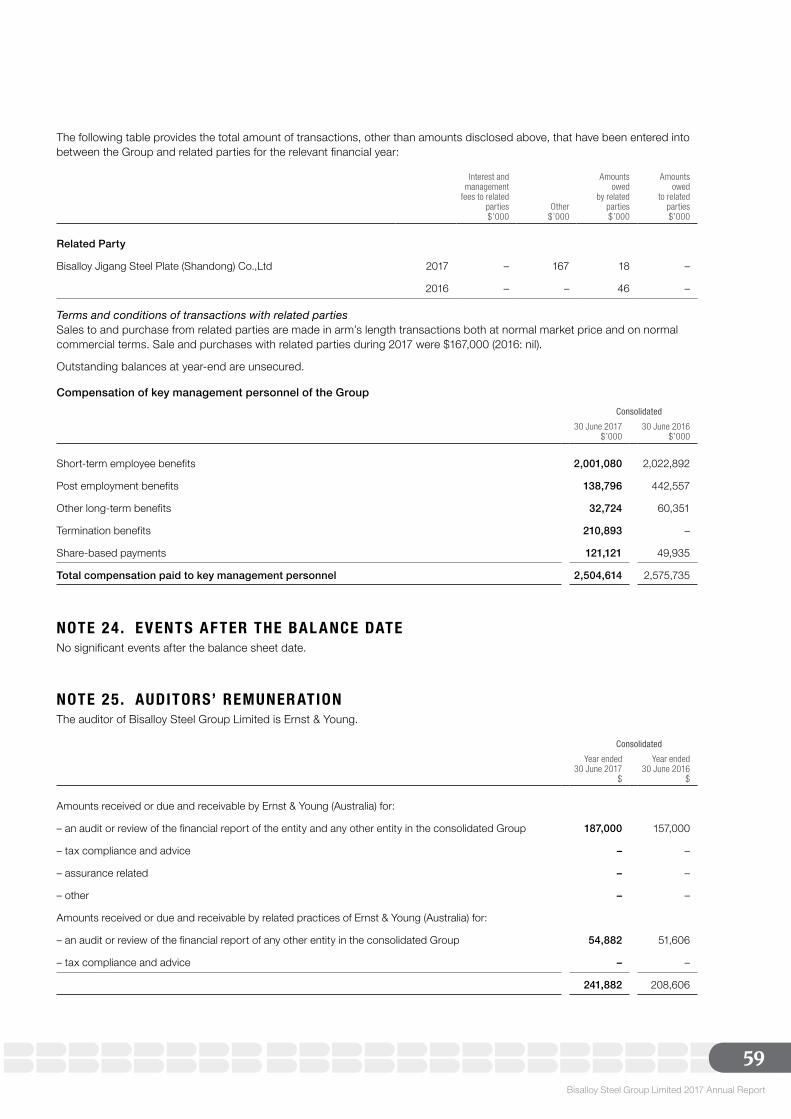
Bisalloy Steel Group Limited 2017 Annual Report
59
The following table provides the total amount of transactions, other than amounts disclosed above, that have been entered into between the Group and related parties for the relevant financial year:
Interest andmanagement
fees to relatedparties$’000
Other$’000
Amounts owed
by relatedparties$’000
Amounts owed
to related parties$’000
Related Party
Bisalloy Jigang Steel Plate (Shandong) Co.,Ltd 2017 – 167 18 –
2016 – – 46 –
Terms and conditions of transactions with related partiesSales to and purchase from related parties are made in arm’s length transactions both at normal market price and on normal commercial terms. Sale and purchases with related parties during 2017 were $167,000 (2016: nil).
Outstanding balances at year-end are unsecured.
Compensation of key management personnel of the GroupConsolidated
30 June 2017$’000
30 June 2016$’000
Short-term employee benefits 2,001,080 2,022,892
Post employment benefits 138,796 442,557
Other long-term benefits 32,724 60,351
Termination benefits 210,893 –
Share-based payments 121,121 49,935
Total compensation paid to key management personnel 2,504,614 2,575,735
NOTE 24. EVENTS AF TER THE BAL ANCE DATENo significant events after the balance sheet date.
NOTE 25. AUDITORS’ REMUNER ATIONThe auditor of Bisalloy Steel Group Limited is Ernst & Young.
Consolidated
Year ended30 June 2017
$
Year ended30 June 2016
$
Amounts received or due and receivable by Ernst & Young (Australia) for:
– an audit or review of the financial report of the entity and any other entity in the consolidated Group 187,000 157,000
– tax compliance and advice – –
– assurance related – –
– other – –
Amounts received or due and receivable by related practices of Ernst & Young (Australia) for:
– an audit or review of the financial report of any other entity in the consolidated Group 54,882 51,606
– tax compliance and advice – –
241,882 208,606
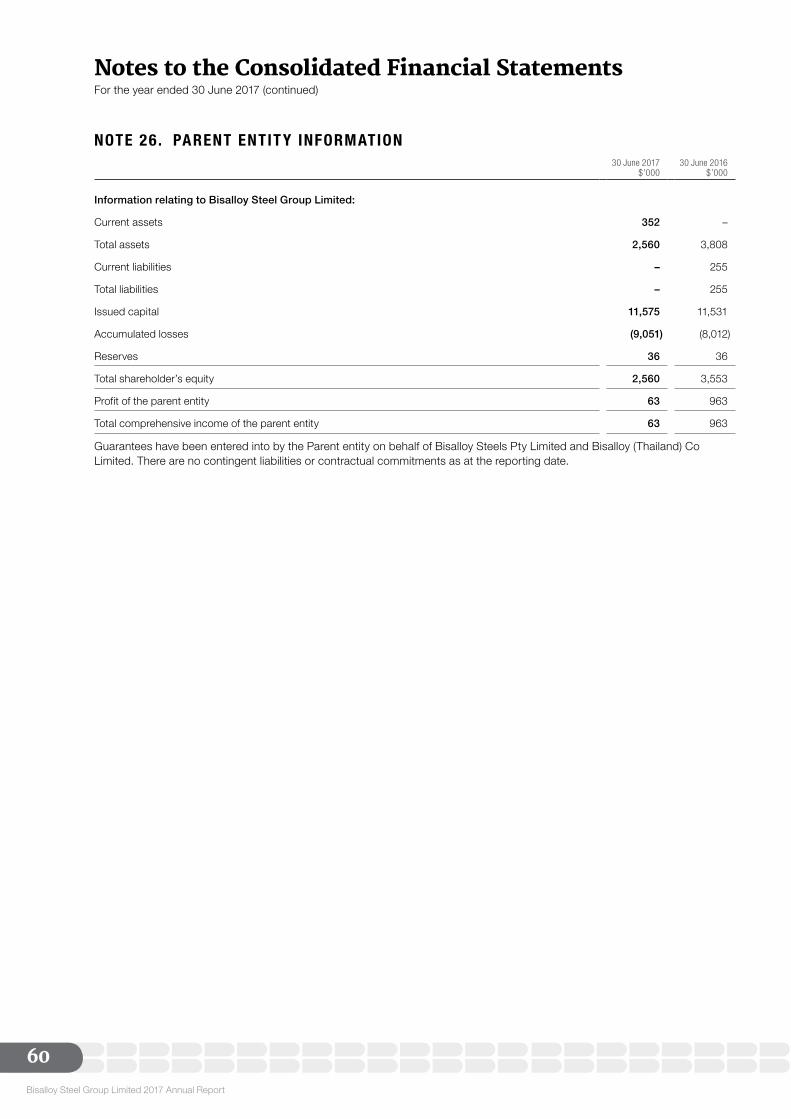
Bisalloy Steel Group Limited 2017 Annual Report
60
Notes to the Consolidated Financial Statements For the year ended 30 June 2017 (continued)
NOTE 26. PARENT ENTIT Y INFORMATION30 June 2017
$’00030 June 2016
$’000
Information relating to Bisalloy Steel Group Limited:
Current assets 352 –
Total assets 2,560 3,808
Current liabilities – 255
Total liabilities – 255
Issued capital 11,575 11,531
Accumulated losses (9,051) (8,012)
Reserves 36 36
Total shareholder’s equity 2,560 3,553
Profit of the parent entity 63 963
Total comprehensive income of the parent entity 63 963
Guarantees have been entered into by the Parent entity on behalf of Bisalloy Steels Pty Limited and Bisalloy (Thailand) Co Limited. There are no contingent liabilities or contractual commitments as at the reporting date.
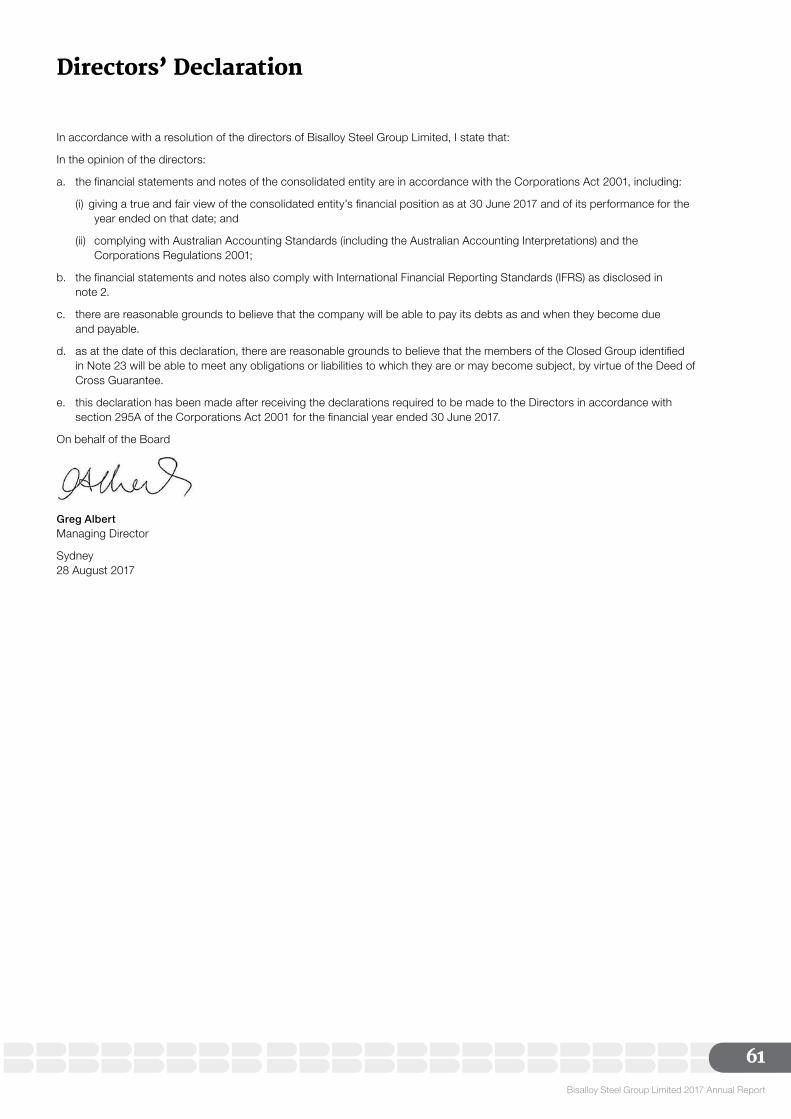
Bisalloy Steel Group Limited 2017 Annual Report
61
In accordance with a resolution of the directors of Bisalloy Steel Group Limited, I state that:
In the opinion of the directors:
a. the financial statements and notes of the consolidated entity are in accordance with the Corporations Act 2001, including:
(i) giving a true and fair view of the consolidated entity’s financial position as at 30 June 2017 and of its performance for the year ended on that date; and
(ii) complying with Australian Accounting Standards (including the Australian Accounting Interpretations) and the Corporations Regulations 2001;
b. the financial statements and notes also comply with International Financial Reporting Standards (IFRS) as disclosed in note 2.
c. there are reasonable grounds to believe that the company will be able to pay its debts as and when they become due and payable.
d. as at the date of this declaration, there are reasonable grounds to believe that the members of the Closed Group identified in Note 23 will be able to meet any obligations or liabilities to which they are or may become subject, by virtue of the Deed of Cross Guarantee.
e. this declaration has been made after receiving the declarations required to be made to the Directors in accordance with section 295A of the Corporations Act 2001 for the financial year ended 30 June 2017.
On behalf of the Board
Greg Albert Managing Director
Sydney 28 August 2017
Directors’ Declaration
A member firm of Ernst & Young Global Limited Liability limited by a scheme approved under Professional Standards Legislation
Ernst & Young 200 George Street Sydney NSW 2000 Australia GPO Box 2646 Sydney NSW 2001
Tel: +61 2 9248 5555 Fax: +61 2 9248 5959 ey.com/au
A member firm of Ernst & Young Global Limited Liability limited by a scheme approved under Professional Standards Legislation
A member firm of Ernst & Young Global Limited Liability limited by a scheme approved under Professional Standards Legislation
A member firm of Ernst & Young Global Limited Liability limited by a scheme approved under Professional Standards Legislation
A member firm of Ernst & Young Global Limited Liability limited by a scheme approved under Professional Standards Legislation
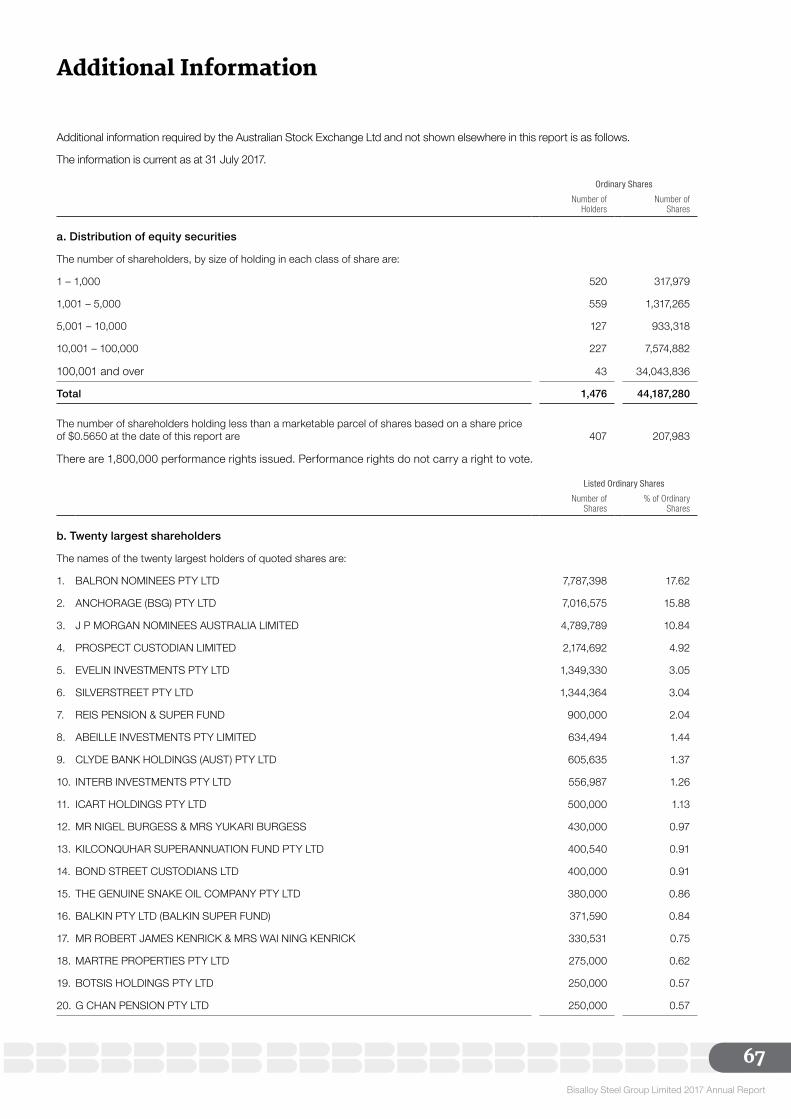
Bisalloy Steel Group Limited 2017 Annual Report
67
Additional Information
Additional information required by the Australian Stock Exchange Ltd and not shown elsewhere in this report is as follows.
The information is current as at 31 July 2017.
Ordinary Shares
Number of Holders
Number of Shares
a. Distribution of equity securities
The number of shareholders, by size of holding in each class of share are:
1 – 1,000 520 317,979
1,001 – 5,000 559 1,317,265
5,001 – 10,000 127 933,318
10,001 – 100,000 227 7,574,882
100,001 and over 43 34,043,836
Total 1,476 44,187,280
The number of shareholders holding less than a marketable parcel of shares based on a share price of $0.5650 at the date of this report are 407 207,983
There are 1,800,000 performance rights issued. Performance rights do not carry a right to vote.
Listed Ordinary Shares
Number of Shares
% of Ordinary Shares
b. Twenty largest shareholders
The names of the twenty largest holders of quoted shares are:
1. BALRON NOMINEES PTY LTD 7,787,398 17.62
2. ANCHORAGE (BSG) PTY LTD 7,016,575 15.88
3. J P MORGAN NOMINEES AUSTRALIA LIMITED 4,789,789 10.84
4. PROSPECT CUSTODIAN LIMITED 2,174,692 4.92
5. EVELIN INVESTMENTS PTY LTD 1,349,330 3.05
6. SILVERSTREET PTY LTD 1,344,364 3.04
7. REIS PENSION & SUPER FUND 900,000 2.04
8. ABEILLE INVESTMENTS PTY LIMITED 634,494 1.44
9. CLYDE BANK HOLDINGS (AUST) PTY LTD 605,635 1.37
10. INTERB INVESTMENTS PTY LTD 556,987 1.26
11. ICART HOLDINGS PTY LTD 500,000 1.13
12. MR NIGEL BURGESS & MRS YUKARI BURGESS 430,000 0.97
13. KILCONQUHAR SUPERANNUATION FUND PTY LTD 400,540 0.91
14. BOND STREET CUSTODIANS LTD 400,000 0.91
15. THE GENUINE SNAKE OIL COMPANY PTY LTD 380,000 0.86
16. BALKIN PTY LTD (BALKIN SUPER FUND) 371,590 0.84
17. MR ROBERT JAMES KENRICK & MRS WAI NING KENRICK 330,531 0.75
18. MARTRE PROPERTIES PTY LTD 275,000 0.62
19. BOTSIS HOLDINGS PTY LTD 250,000 0.57
20. G CHAN PENSION PTY LTD 250,000 0.57
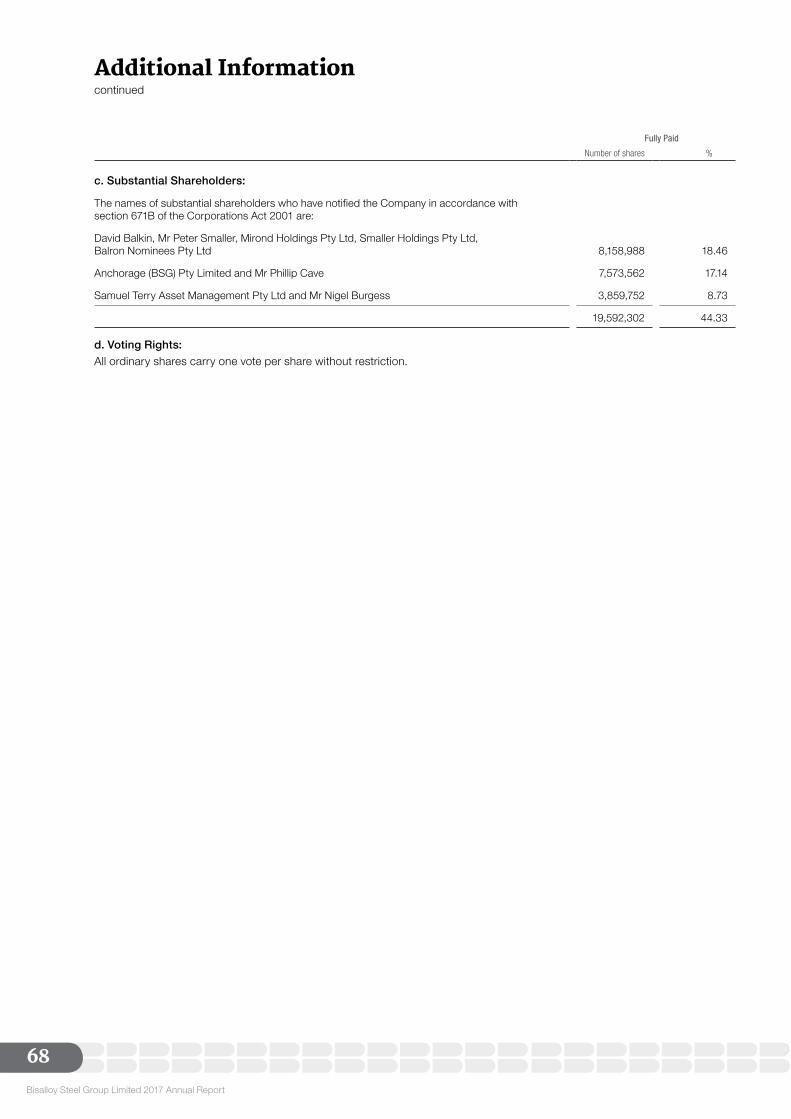
Bisalloy Steel Group Limited 2017 Annual Report
68
Additional Informationcontinued
Fully Paid
Number of shares %
c. Substantial Shareholders:
The names of substantial shareholders who have notified the Company in accordance with section 671B of the Corporations Act 2001 are:
David Balkin, Mr Peter Smaller, Mirond Holdings Pty Ltd, Smaller Holdings Pty Ltd, Balron Nominees Pty Ltd 8,158,988 18.46
Anchorage (BSG) Pty Limited and Mr Phillip Cave 7,573,562 17.14
Samuel Terry Asset Management Pty Ltd and Mr Nigel Burgess 3,859,752 8.73
19,592,302 44.33
d. Voting Rights:All ordinary shares carry one vote per share without restriction.
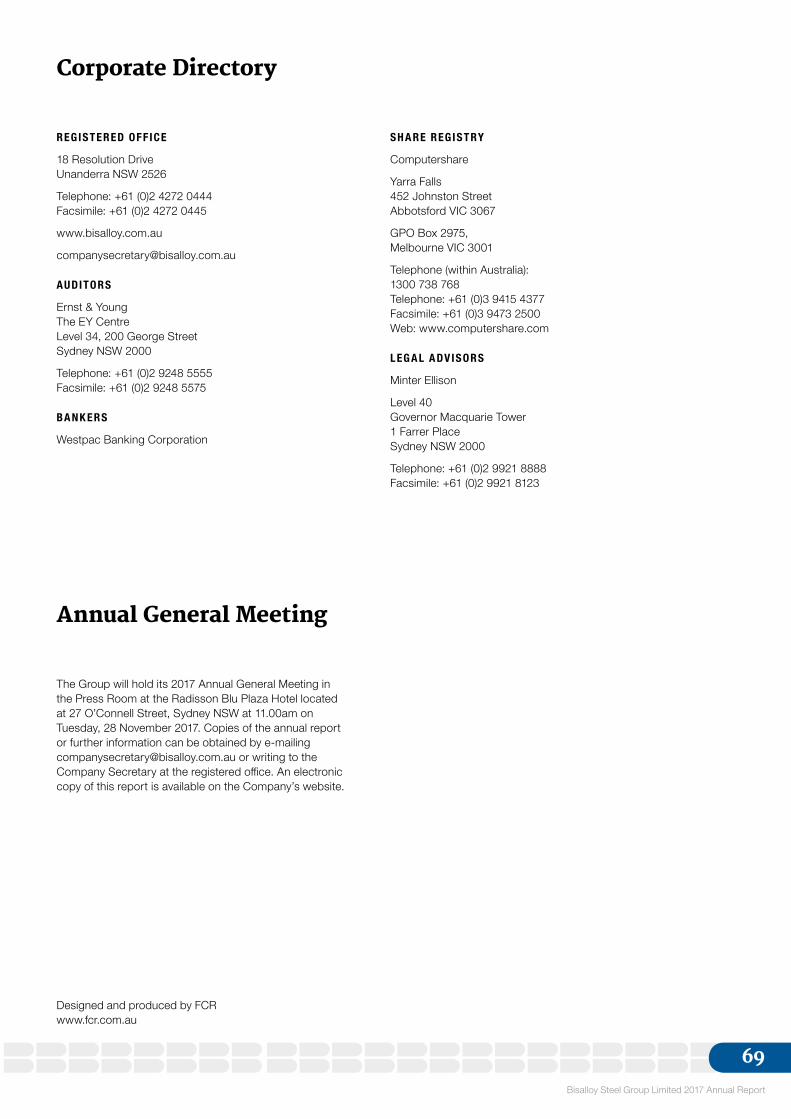
Bisalloy Steel Group Limited 2017 Annual Report
69
REGISTERED OFF ICE
18 Resolution Drive Unanderra NSW 2526
Telephone: +61 (0)2 4272 0444 Facsimile: +61 (0)2 4272 0445
www.bisalloy.com.au
AUDITORS
Ernst & Young The EY Centre Level 34, 200 George Street Sydney NSW 2000
Telephone: +61 (0)2 9248 5555 Facsimile: +61 (0)2 9248 5575
BA NK ERS
Westpac Banking Corporation
SH A RE REGISTRY
Computershare
Yarra Falls 452 Johnston Street Abbotsford VIC 3067
GPO Box 2975, Melbourne VIC 3001
Telephone (within Australia): 1300 738 768 Telephone: +61 (0)3 9415 4377 Facsimile: +61 (0)3 9473 2500 Web: www.computershare.com
LEG A L ADV ISORS
Minter Ellison
Level 40 Governor Macquarie Tower 1 Farrer Place Sydney NSW 2000
Telephone: +61 (0)2 9921 8888 Facsimile: +61 (0)2 9921 8123
Corporate Directory
Annual General Meeting
The Group will hold its 2017 Annual General Meeting in the Press Room at the Radisson Blu Plaza Hotel located at 27 O’Connell Street, Sydney NSW at 11.00am on Tuesday, 28 November 2017. Copies of the annual report or further information can be obtained by e-mailing [email protected] or writing to the Company Secretary at the registered office. An electronic copy of this report is available on the Company’s website.
Designed and produced by FCR www.fcr.com.au