Embed Size (px)
Citation preview
Register for Webinars or Access Recordingshttp://mingleanalytics.com/webinars
Dr. Dan Mingle
2017 Final Rule for MIPS/MACRA
Cost & Practice Improvement Performance Categories
Starting atNoon EST1/10/2017
Register for Webinars or Access Recordingshttp://mingleanalytics.com/webinars
Dr. Dan Mingle
2017 Final Rule for MIPS/MACRA
Advancing Care Information
Agenda
• Of PQRS, MACRA, and a Wild-Card Administration• Brief Review of the Quality Payment Program (QPP)• Cost Performance Category• Practice Improvement Activities Performance Category• Opportunity, Risk, and Strategy
1/10/2017 ©Copyright 2016 Mingle Analytics 3
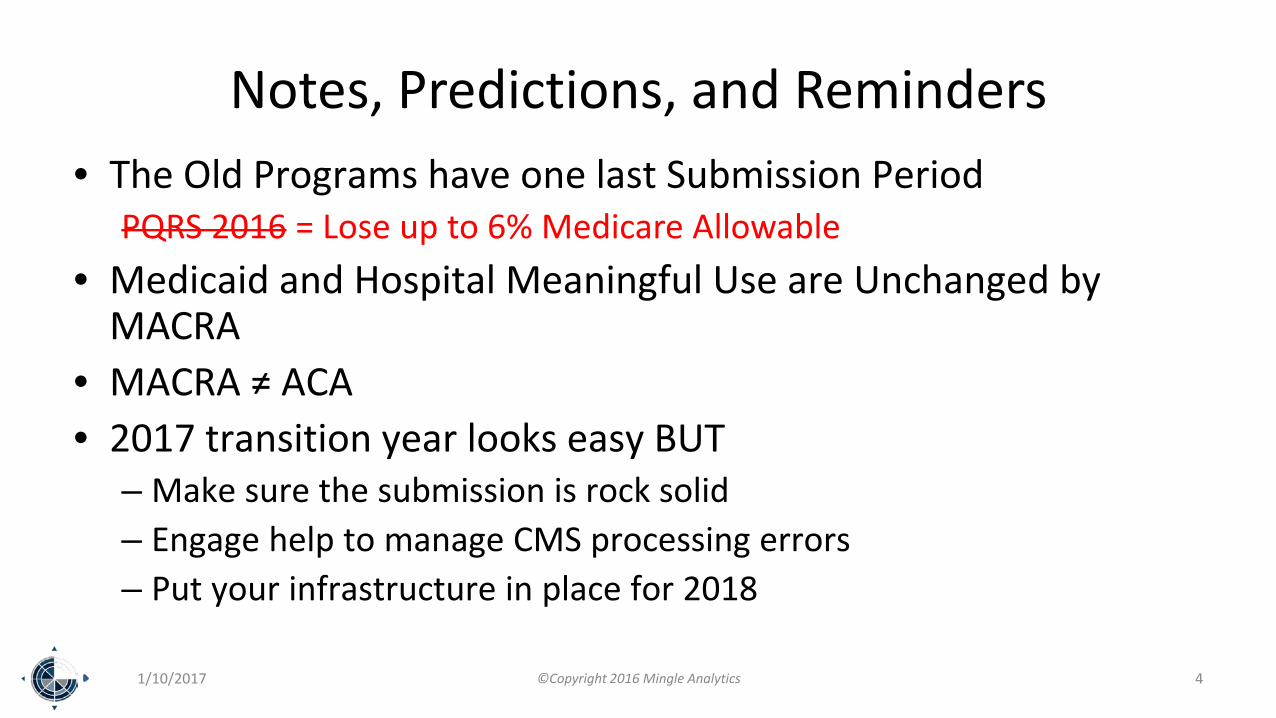
Notes, Predictions, and Reminders• The Old Programs have one last Submission Period
PQRS 2016 = Lose up to 6% Medicare Allowable• Medicaid and Hospital Meaningful Use are Unchanged by
MACRA• MACRA ≠ ACA • 2017 transition year looks easy BUT
– Make sure the submission is rock solid– Engage help to manage CMS processing errors– Put your infrastructure in place for 2018
1/10/2017 ©Copyright 2016 Mingle Analytics 4
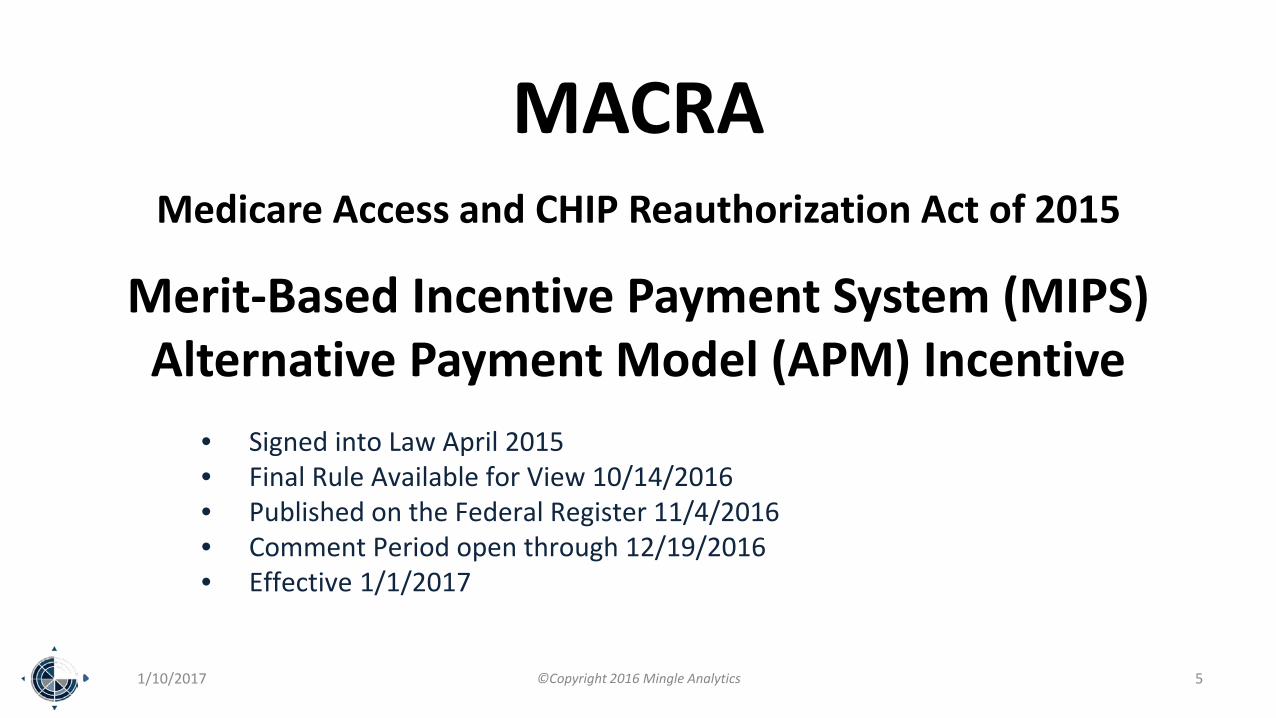
MACRAMedicare Access and CHIP Reauthorization Act of 2015
Merit-Based Incentive Payment System (MIPS) Alternative Payment Model (APM) Incentive
• Signed into Law April 2015• Final Rule Available for View 10/14/2016• Published on the Federal Register 11/4/2016• Comment Period open through 12/19/2016• Effective 1/1/2017
1/10/2017 ©Copyright 2016 Mingle Analytics 5
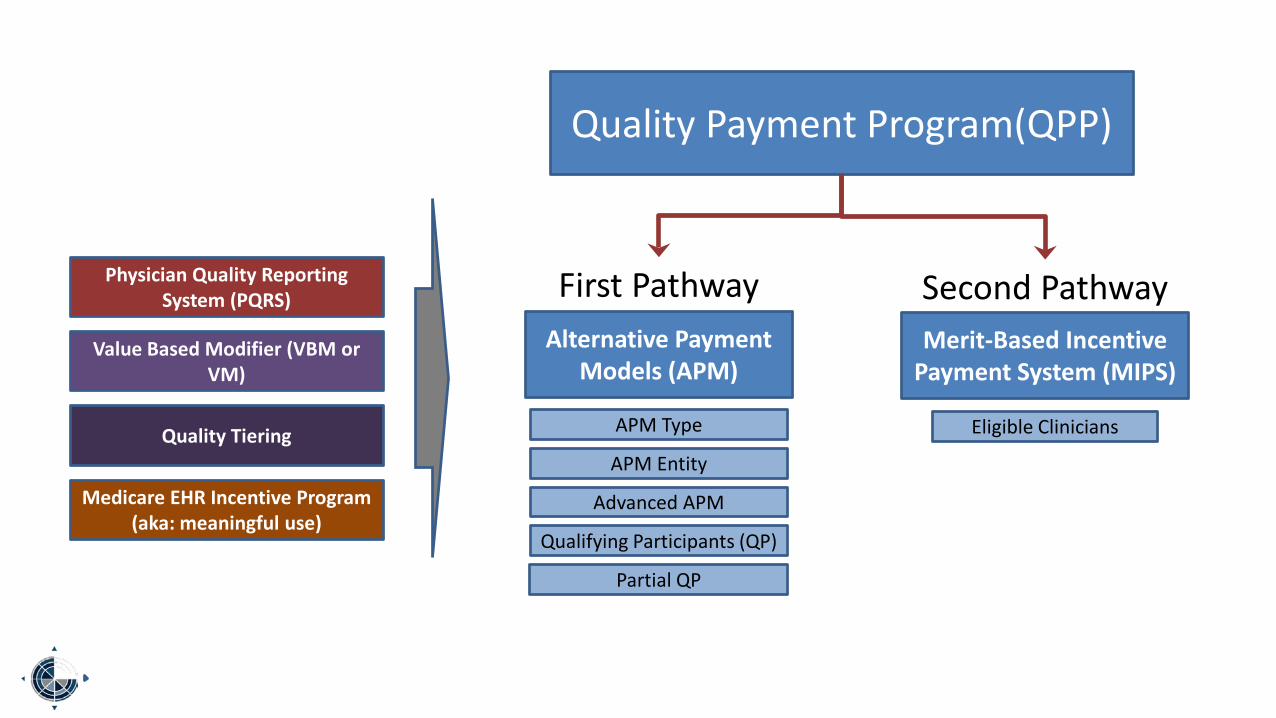
Quality Payment Program(QPP)
Alternative Payment Models (APM)
Qualifying Participants (QP)
APM Type
APM Entity
Advanced APM
Partial QP
Merit-Based Incentive Payment System (MIPS)
Eligible Clinicians
Physician Quality Reporting System (PQRS)
Medicare EHR Incentive Program (aka: meaningful use)
Value Based Modifier (VBM or VM)
Quality Tiering
First Pathway Second Pathway
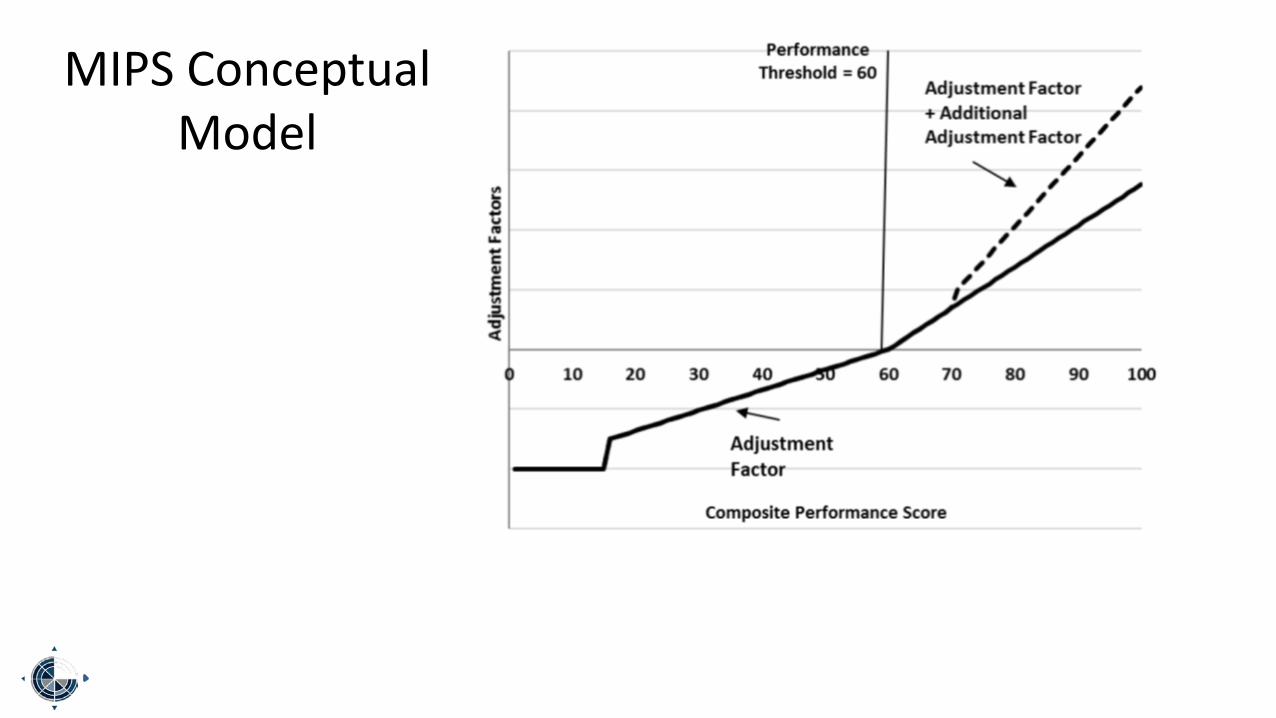
MIPS Conceptual Model
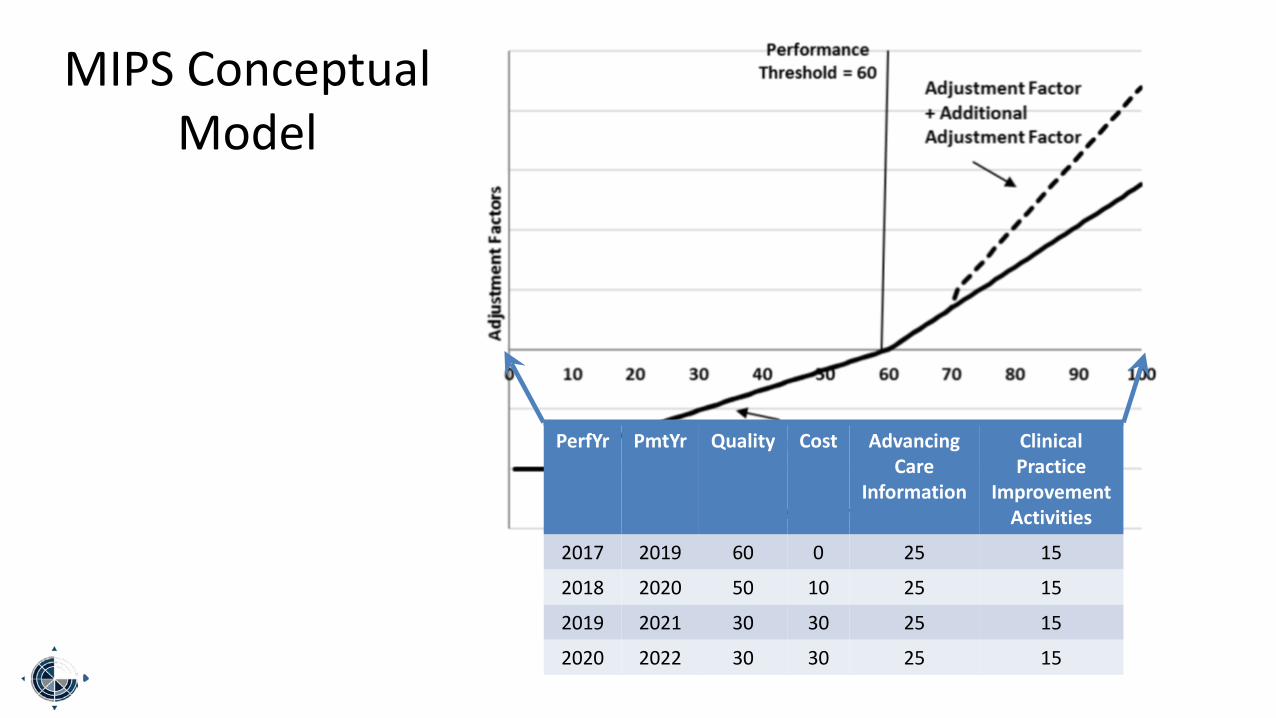
PerfYr PmtYr Quality Cost AdvancingCare
Information
ClinicalPractice
ImprovementActivities
2017 2019 60 0 25 15
2018 2020 50 10 25 15
2019 2021 30 30 25 15
2020 2022 30 30 25 15
MIPS Conceptual Model
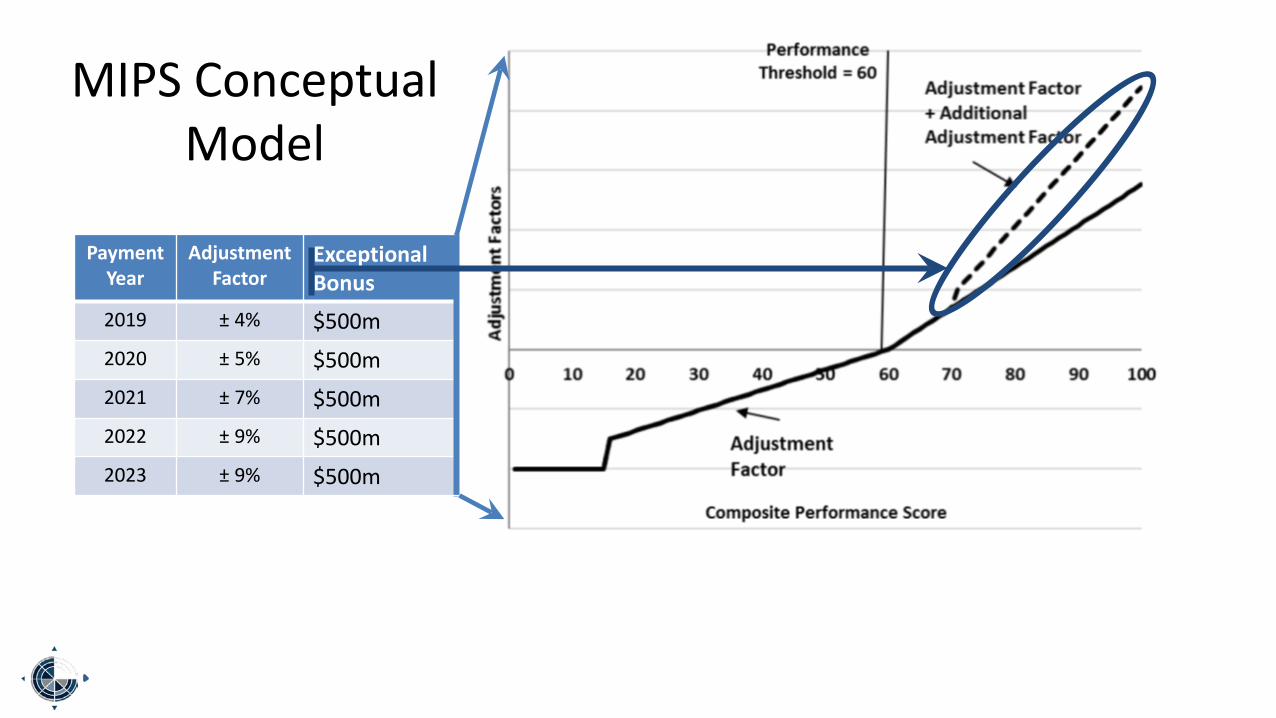
PaymentYear
AdjustmentFactor
Exceptional Bonus
2019 ± 4% $500m2020 ± 5% $500m2021 ± 7% $500m2022 ± 9% $500m2023 ± 9% $500m
MIPS Conceptual Model
2017
“Transition Year and Iterative Learning and Development Period”
1/10/2017 ©Copyright 2016 Mingle Analytics 11
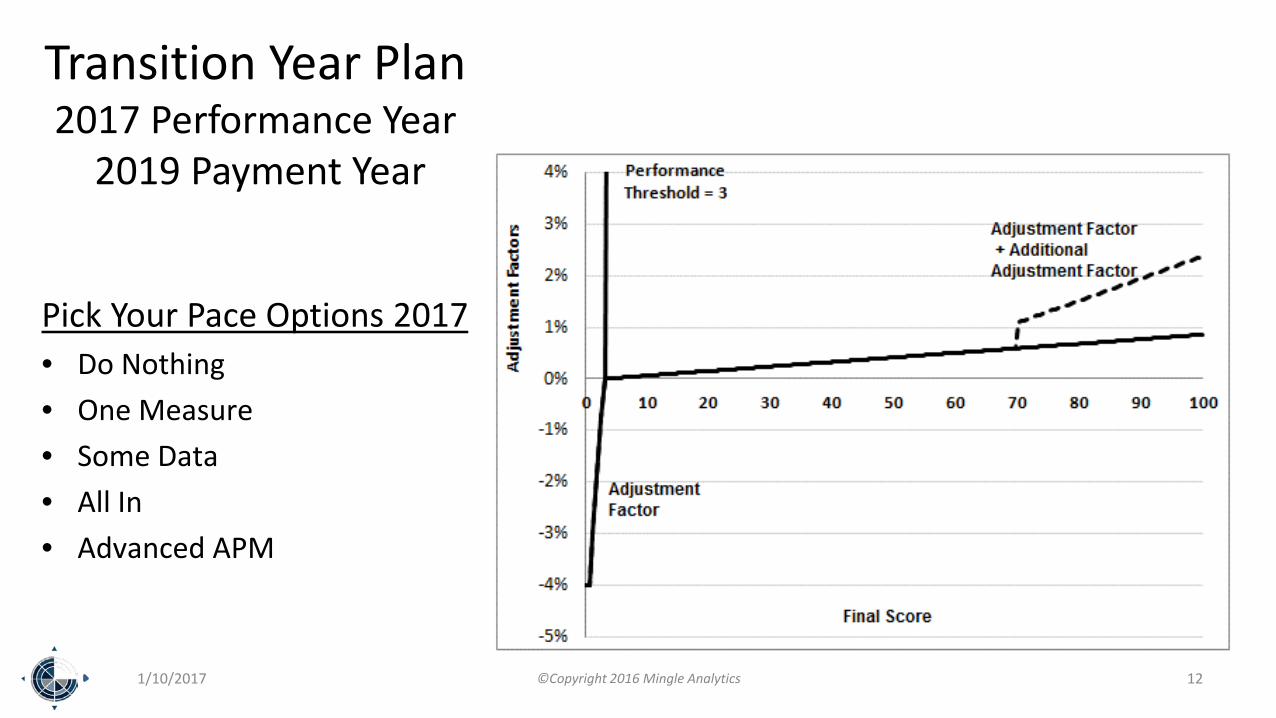
Transition Year Plan2017 Performance Year
2019 Payment Year
Pick Your Pace Options 2017• Do Nothing• One Measure• Some Data• All In• Advanced APM
1/10/2017 ©Copyright 2016 Mingle Analytics 12
Focus on
CostPerformance Category
1/10/2017 ©Copyright 2016 Mingle Analytics 13
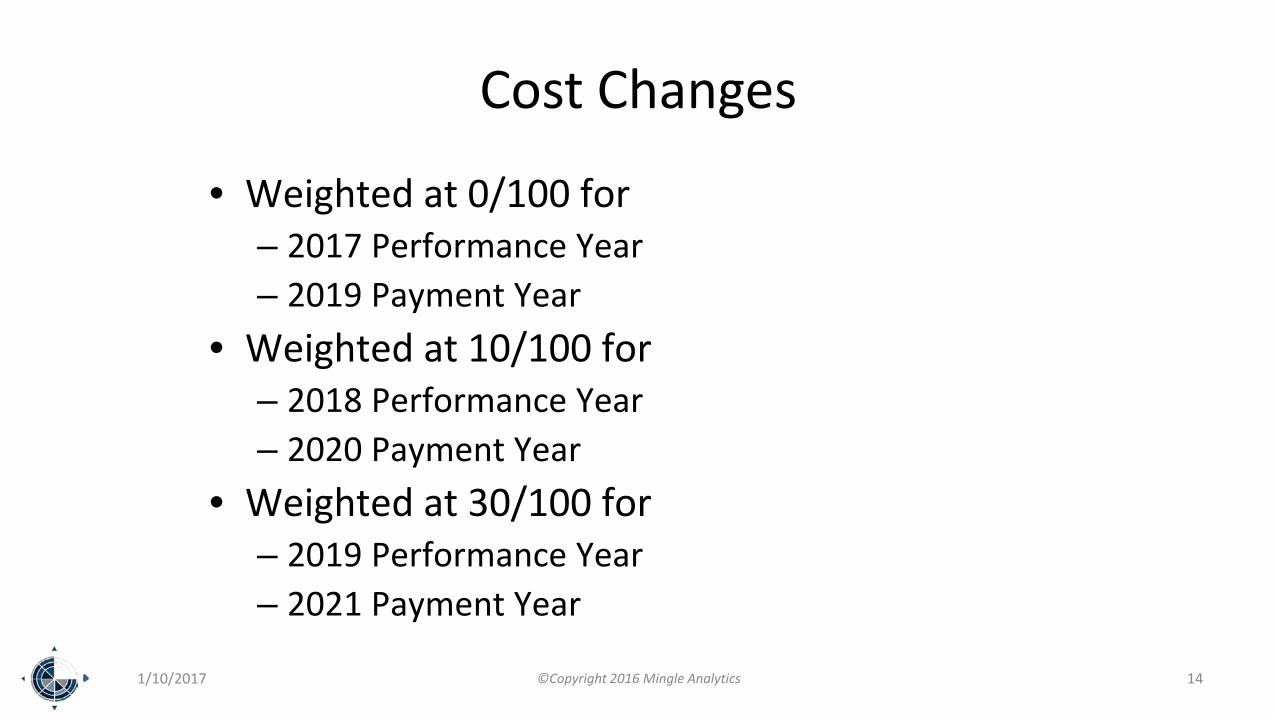
Cost Changes
• Weighted at 0/100 for – 2017 Performance Year– 2019 Payment Year
• Weighted at 10/100 for – 2018 Performance Year– 2020 Payment Year
• Weighted at 30/100 for – 2019 Performance Year– 2021 Payment Year
1/10/2017 ©Copyright 2016 Mingle Analytics 14
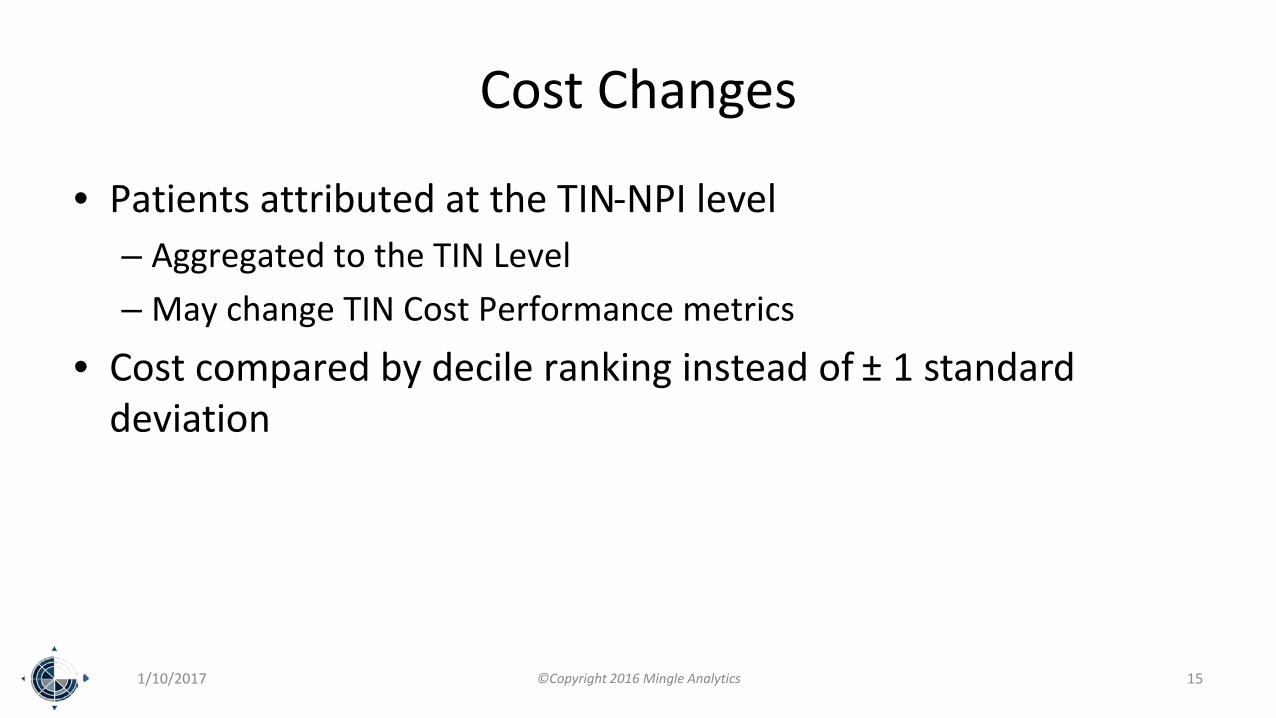
Cost Changes
• Patients attributed at the TIN-NPI level – Aggregated to the TIN Level– May change TIN Cost Performance metrics
• Cost compared by decile ranking instead of ± 1 standard deviation
1/10/2017 ©Copyright 2016 Mingle Analytics 15
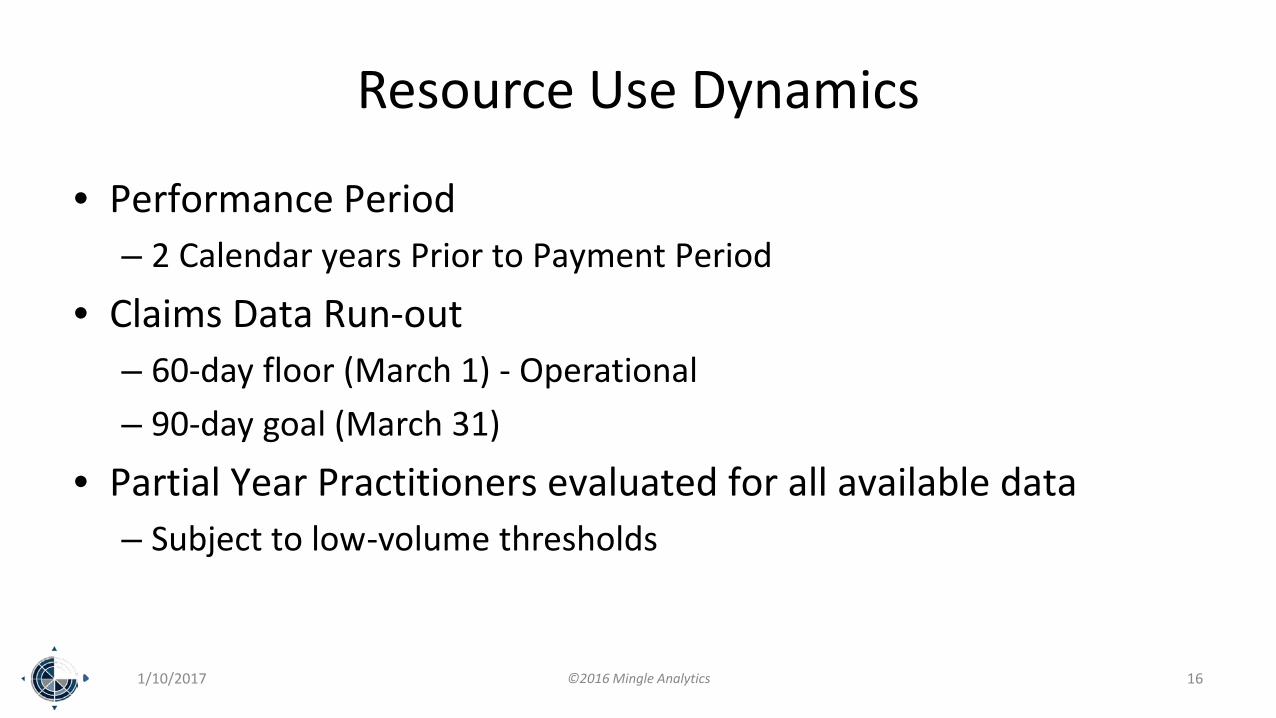
Resource Use Dynamics
• Performance Period– 2 Calendar years Prior to Payment Period
• Claims Data Run-out– 60-day floor (March 1) - Operational– 90-day goal (March 31)
• Partial Year Practitioners evaluated for all available data– Subject to low-volume thresholds
1/10/2017 ©2016 Mingle Analytics 16
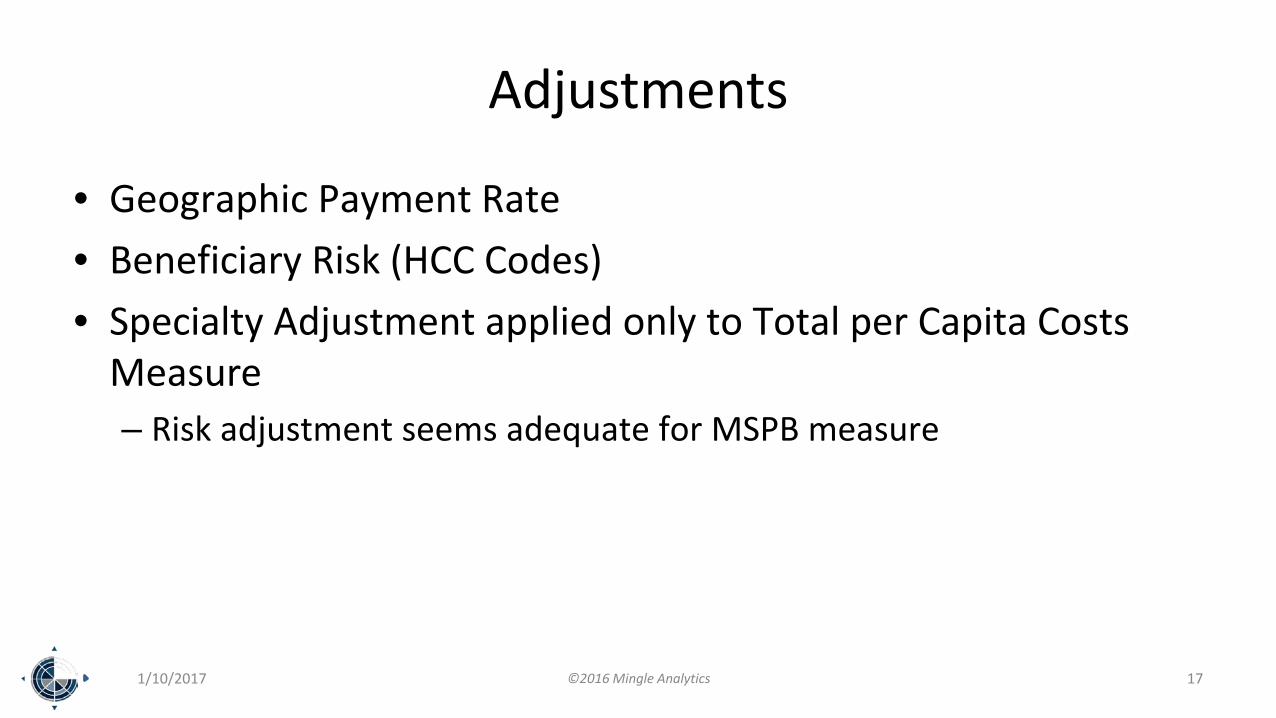
Adjustments
• Geographic Payment Rate• Beneficiary Risk (HCC Codes)• Specialty Adjustment applied only to Total per Capita Costs
Measure– Risk adjustment seems adequate for MSPB measure
1/10/2017 ©2016 Mingle Analytics 17
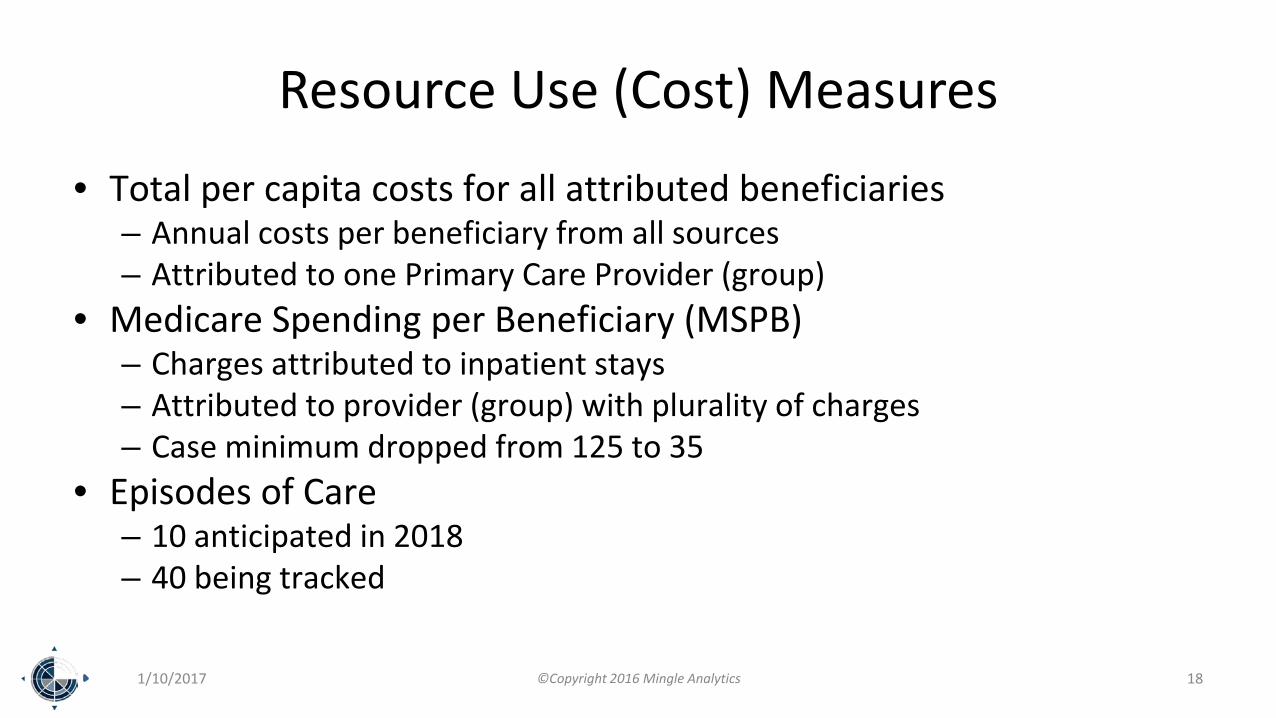
Resource Use (Cost) Measures
• Total per capita costs for all attributed beneficiaries – Annual costs per beneficiary from all sources– Attributed to one Primary Care Provider (group)
• Medicare Spending per Beneficiary (MSPB) – Charges attributed to inpatient stays– Attributed to provider (group) with plurality of charges– Case minimum dropped from 125 to 35
• Episodes of Care – 10 anticipated in 2018– 40 being tracked
1/10/2017 ©Copyright 2016 Mingle Analytics 18
Plans to Develop
• Additional Episode Measures• Additional Patient Condition Groups• Patient Relationship Categories• Risk Adjustment on Socio-Economic Status• Include Part D Costs
1/10/2017 ©2016 Mingle Analytics 19
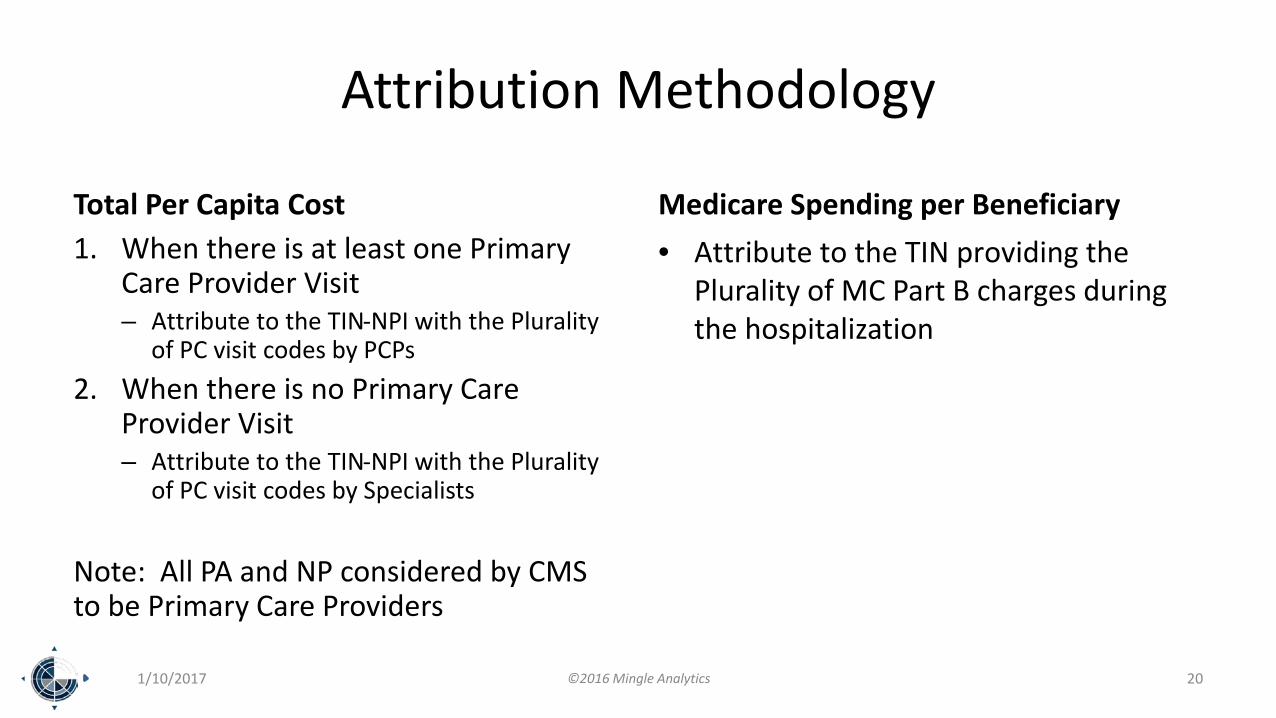
Attribution Methodology
Total Per Capita Cost1. When there is at least one Primary
Care Provider Visit– Attribute to the TIN-NPI with the Plurality
of PC visit codes by PCPs2. When there is no Primary Care
Provider Visit– Attribute to the TIN-NPI with the Plurality
of PC visit codes by Specialists
Note: All PA and NP considered by CMS to be Primary Care Providers
Medicare Spending per Beneficiary• Attribute to the TIN providing the
Plurality of MC Part B charges during the hospitalization
1/10/2017 ©2016 Mingle Analytics 20
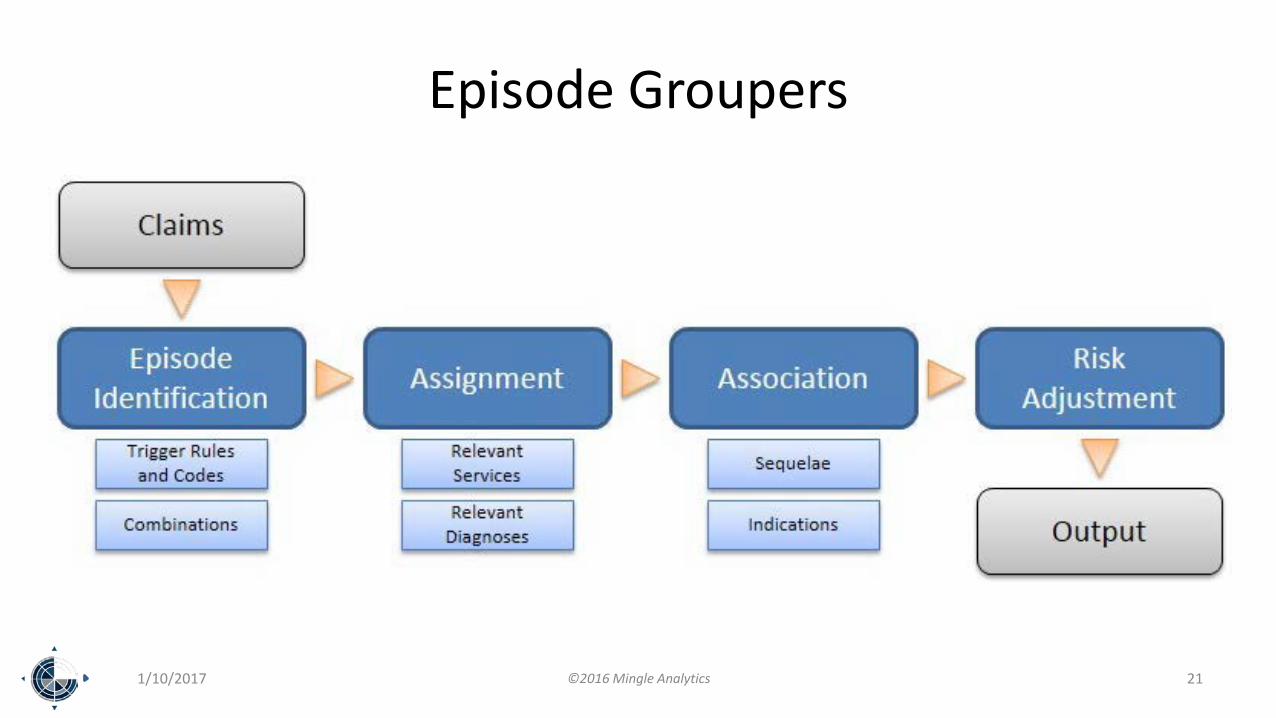
Episode Groupers
1/10/2017 ©2016 Mingle Analytics 21
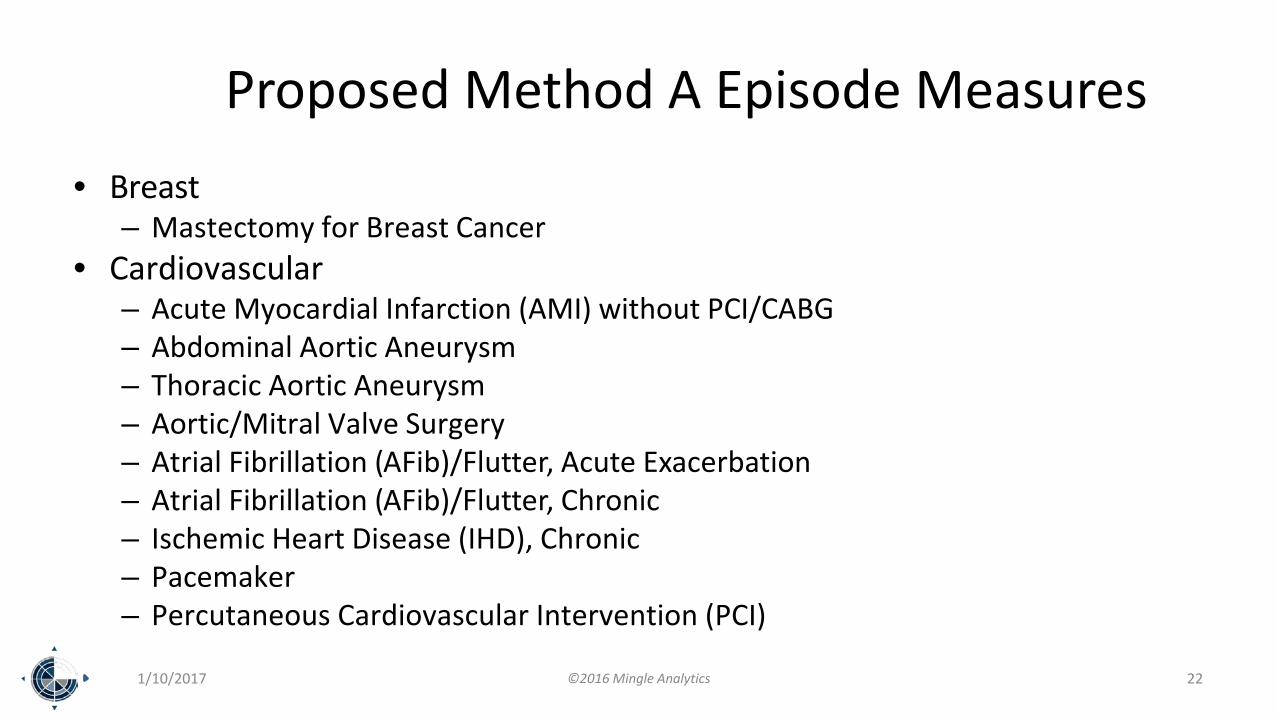
Proposed Method A Episode Measures• Breast
– Mastectomy for Breast Cancer• Cardiovascular
– Acute Myocardial Infarction (AMI) without PCI/CABG– Abdominal Aortic Aneurysm– Thoracic Aortic Aneurysm– Aortic/Mitral Valve Surgery– Atrial Fibrillation (AFib)/Flutter, Acute Exacerbation– Atrial Fibrillation (AFib)/Flutter, Chronic– Ischemic Heart Disease (IHD), Chronic– Pacemaker– Percutaneous Cardiovascular Intervention (PCI)
1/10/2017 ©2016 Mingle Analytics 22
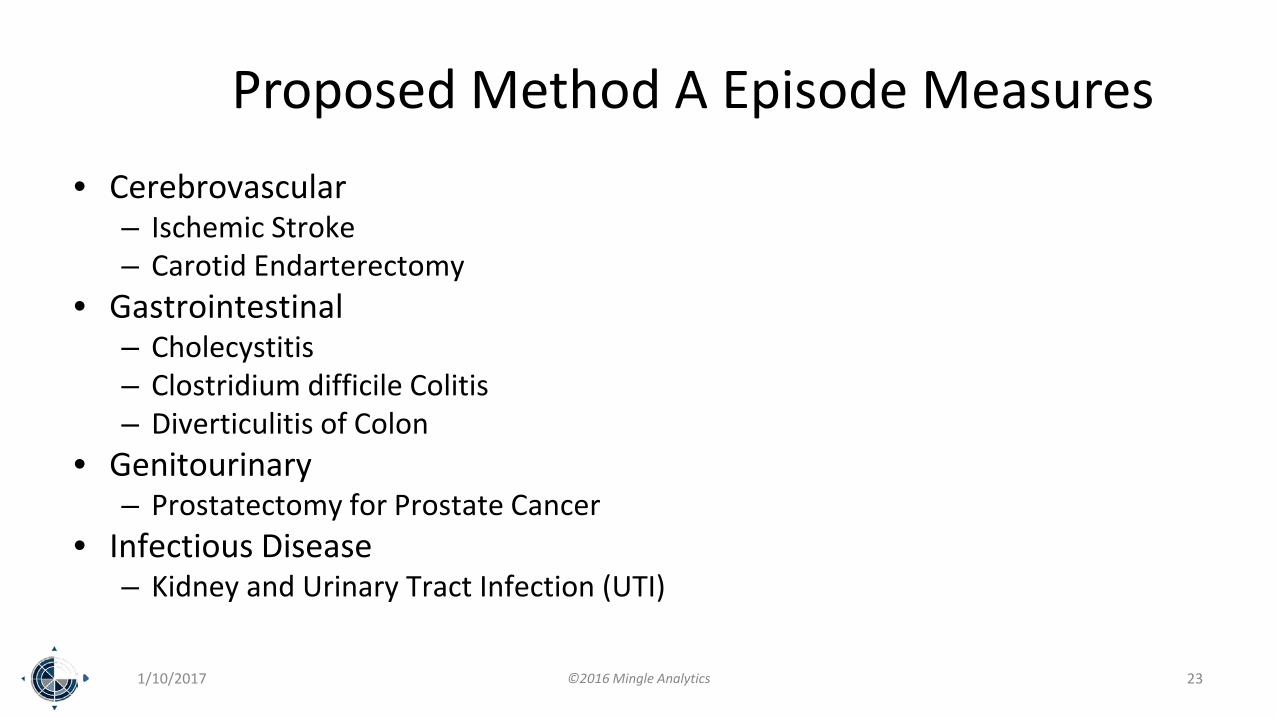
Proposed Method A Episode Measures• Cerebrovascular
– Ischemic Stroke– Carotid Endarterectomy
• Gastrointestinal– Cholecystitis– Clostridium difficile Colitis– Diverticulitis of Colon
• Genitourinary– Prostatectomy for Prostate Cancer
• Infectious Disease– Kidney and Urinary Tract Infection (UTI)
1/10/2017 ©2016 Mingle Analytics 23
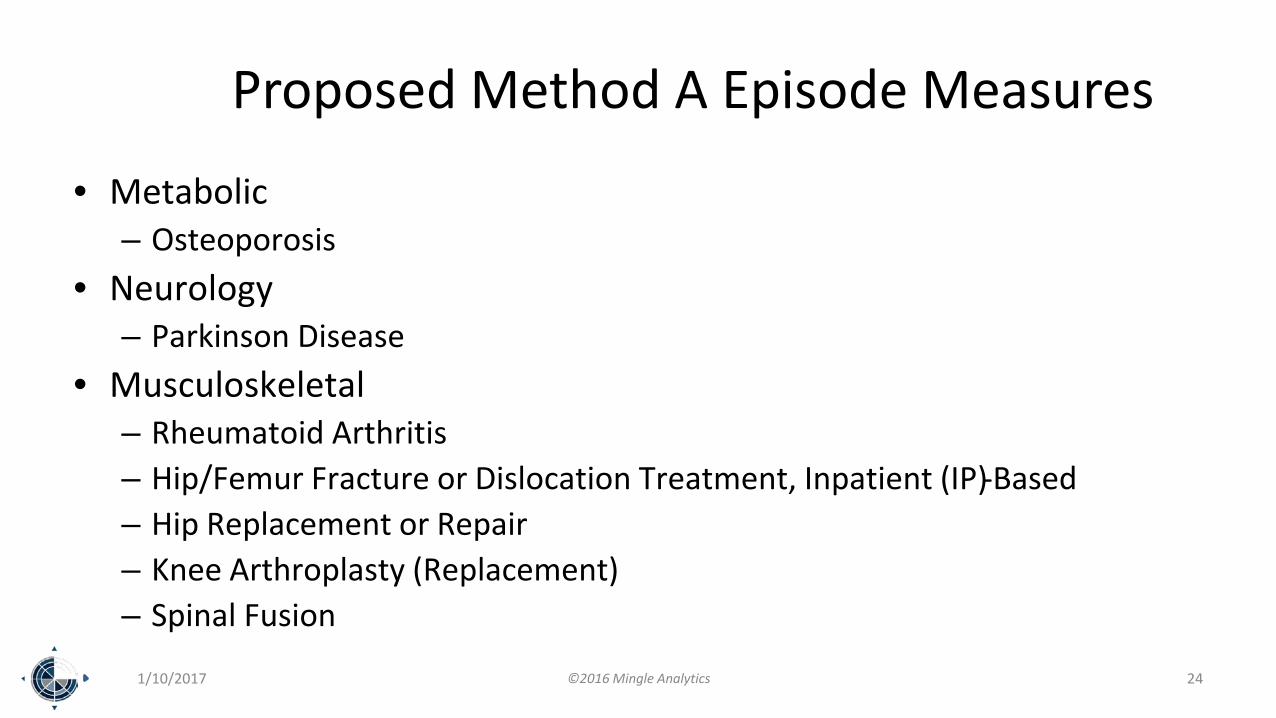
Proposed Method A Episode Measures
• Metabolic– Osteoporosis
• Neurology– Parkinson Disease
• Musculoskeletal– Rheumatoid Arthritis– Hip/Femur Fracture or Dislocation Treatment, Inpatient (IP)-Based– Hip Replacement or Repair– Knee Arthroplasty (Replacement)– Spinal Fusion
1/10/2017 ©2016 Mingle Analytics 24
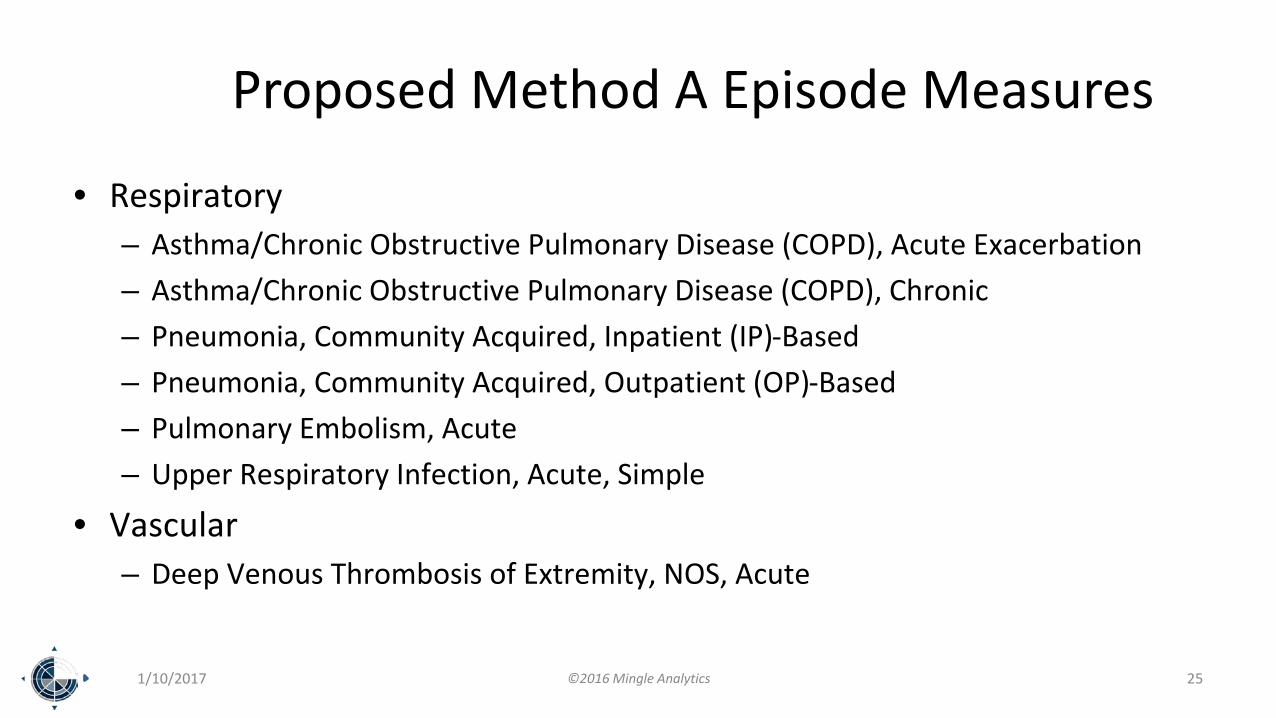
Proposed Method A Episode Measures
• Respiratory– Asthma/Chronic Obstructive Pulmonary Disease (COPD), Acute Exacerbation– Asthma/Chronic Obstructive Pulmonary Disease (COPD), Chronic– Pneumonia, Community Acquired, Inpatient (IP)-Based– Pneumonia, Community Acquired, Outpatient (OP)-Based– Pulmonary Embolism, Acute– Upper Respiratory Infection, Acute, Simple
• Vascular– Deep Venous Thrombosis of Extremity, NOS, Acute
1/10/2017 ©2016 Mingle Analytics 25
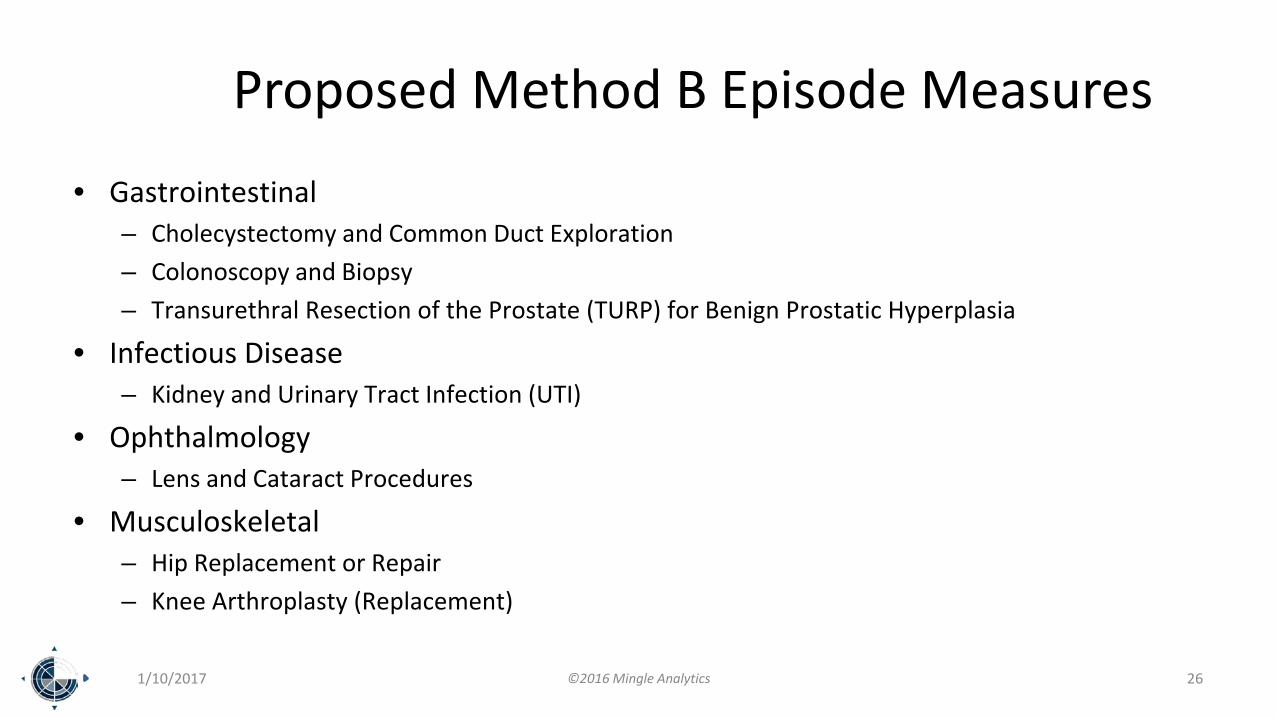
Proposed Method B Episode Measures
• Gastrointestinal– Cholecystectomy and Common Duct Exploration– Colonoscopy and Biopsy– Transurethral Resection of the Prostate (TURP) for Benign Prostatic Hyperplasia
• Infectious Disease– Kidney and Urinary Tract Infection (UTI)
• Ophthalmology– Lens and Cataract Procedures
• Musculoskeletal– Hip Replacement or Repair– Knee Arthroplasty (Replacement)
1/10/2017 ©2016 Mingle Analytics 26
Scoring the Resource Use Performance Category
1/10/2017 ©2016 Mingle Analytics 27
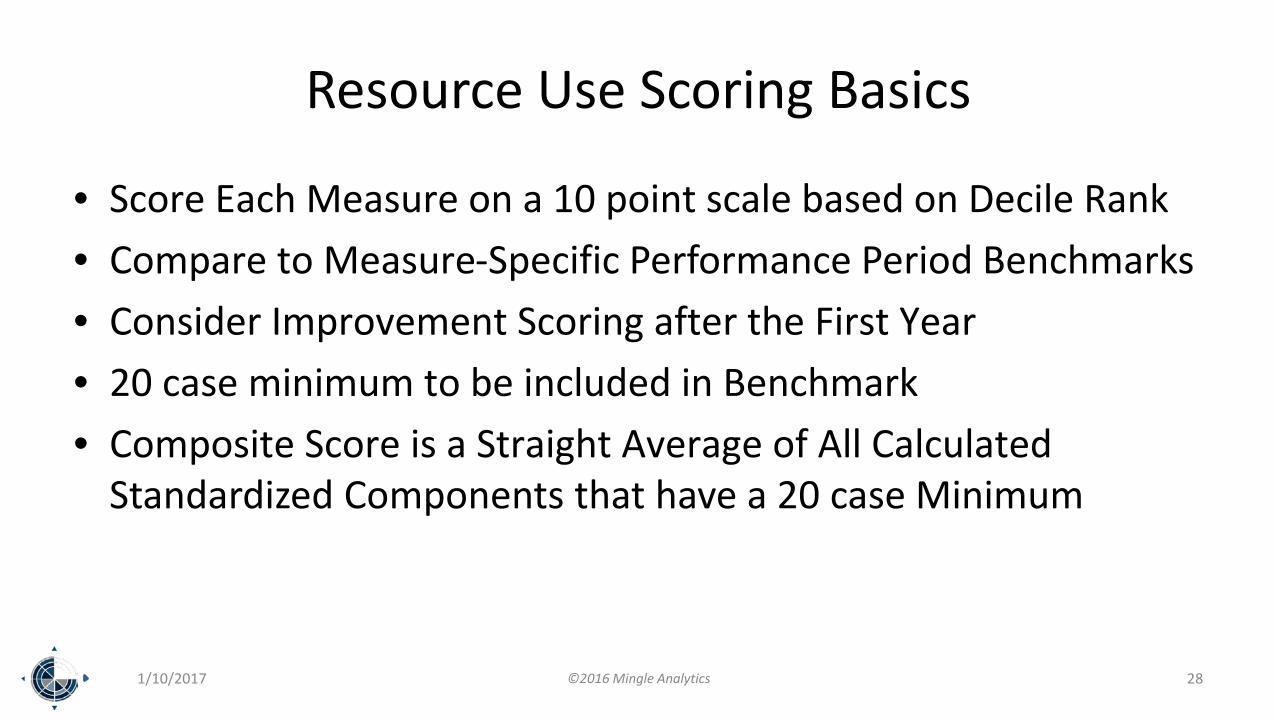
Resource Use Scoring Basics
• Score Each Measure on a 10 point scale based on Decile Rank• Compare to Measure-Specific Performance Period Benchmarks• Consider Improvement Scoring after the First Year• 20 case minimum to be included in Benchmark• Composite Score is a Straight Average of All Calculated
Standardized Components that have a 20 case Minimum
1/10/2017 ©2016 Mingle Analytics 28
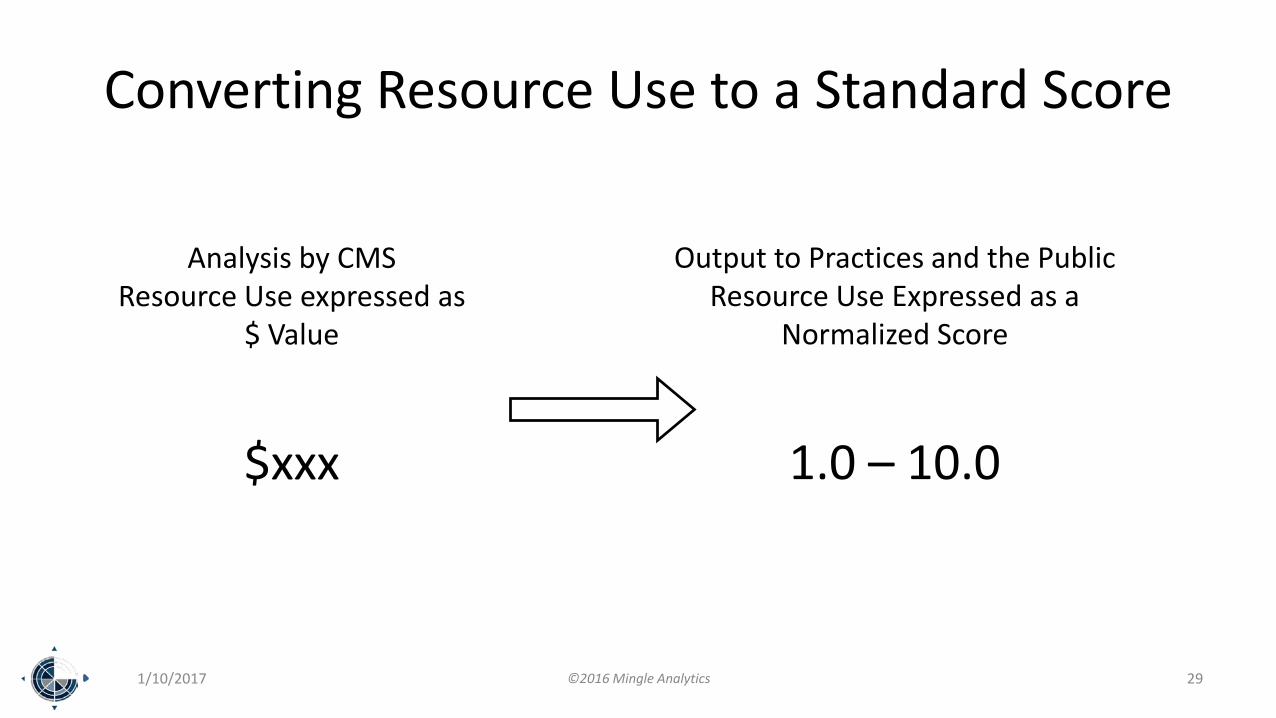
Converting Resource Use to a Standard Score
1/10/2017 ©2016 Mingle Analytics 29
Analysis by CMSResource Use expressed as
$ Value
$xxx
Output to Practices and the PublicResource Use Expressed as a
Normalized Score
1.0 – 10.0
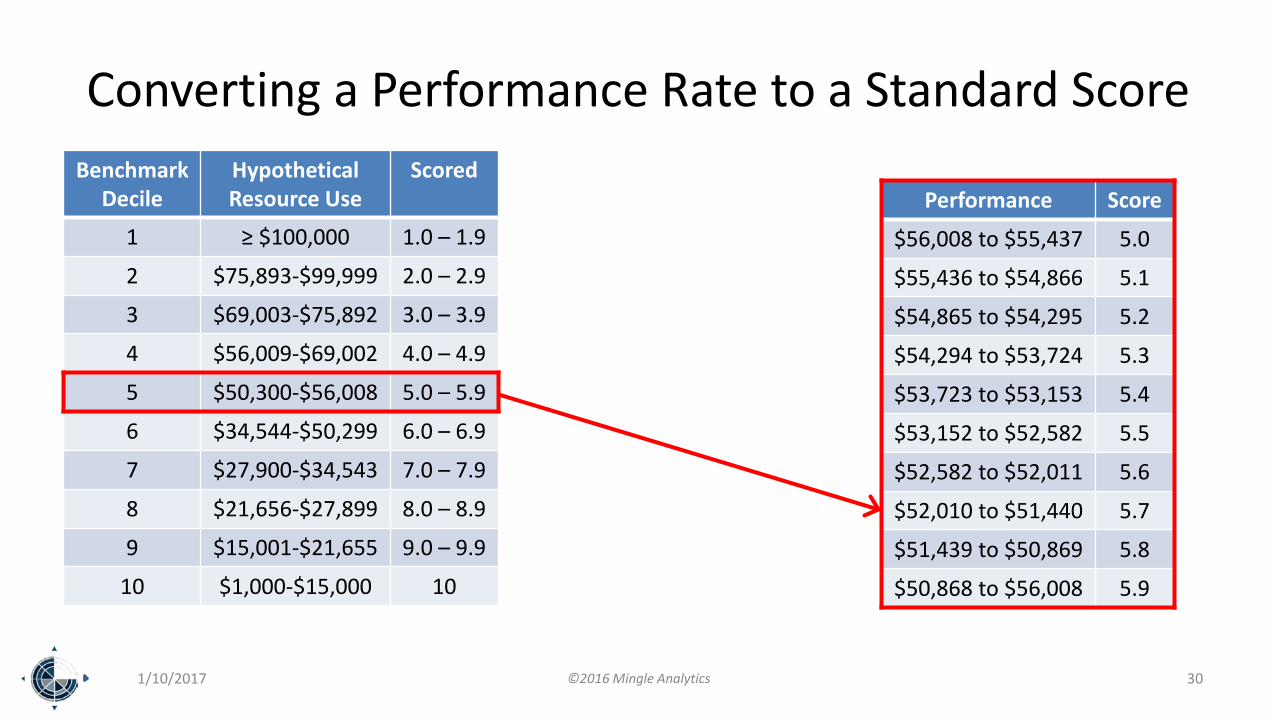
Converting a Performance Rate to a Standard Score
1/10/2017 ©2016 Mingle Analytics 30
BenchmarkDecile
HypotheticalResource Use
Scored
1 ≥ $100,000 1.0 – 1.9
2 $75,893-$99,999 2.0 – 2.9
3 $69,003-$75,892 3.0 – 3.9
4 $56,009-$69,002 4.0 – 4.9
5 $50,300-$56,008 5.0 – 5.9
6 $34,544-$50,299 6.0 – 6.9
7 $27,900-$34,543 7.0 – 7.9
8 $21,656-$27,899 8.0 – 8.9
9 $15,001-$21,655 9.0 – 9.9
10 $1,000-$15,000 10
Performance Score
$56,008 to $55,437 5.0
$55,436 to $54,866 5.1
$54,865 to $54,295 5.2
$54,294 to $53,724 5.3
$53,723 to $53,153 5.4
$53,152 to $52,582 5.5
$52,582 to $52,011 5.6
$52,010 to $51,440 5.7
$51,439 to $50,869 5.8
$50,868 to $56,008 5.9
1/10/2017 ©2016 Mingle Analytics 31
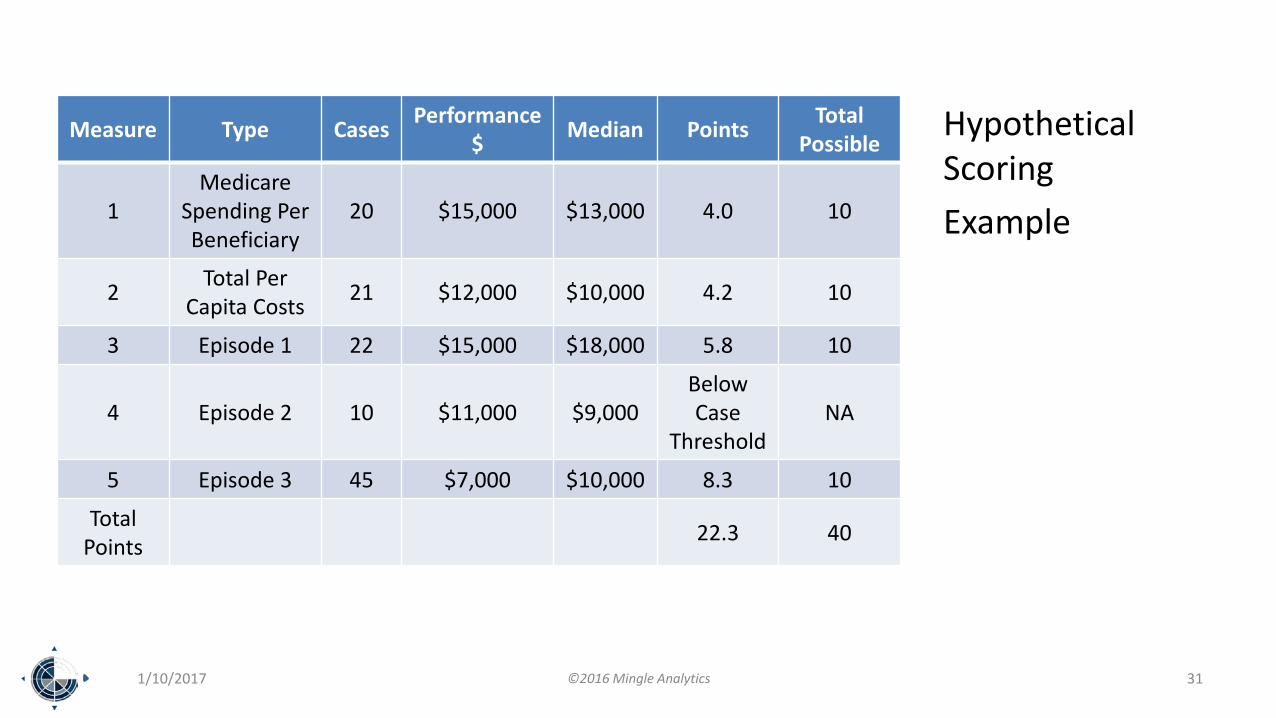
Measure Type Cases Performance$ Median Points Total
Possible
1Medicare
Spending PerBeneficiary
20 $15,000 $13,000 4.0 10
2 Total PerCapita Costs 21 $12,000 $10,000 4.2 10
3 Episode 1 22 $15,000 $18,000 5.8 10
4 Episode 2 10 $11,000 $9,000BelowCase
ThresholdNA
5 Episode 3 45 $7,000 $10,000 8.3 10
TotalPoints 22.3 40
Hypothetical ScoringExample
1/10/2017 ©2016 Mingle Analytics 32
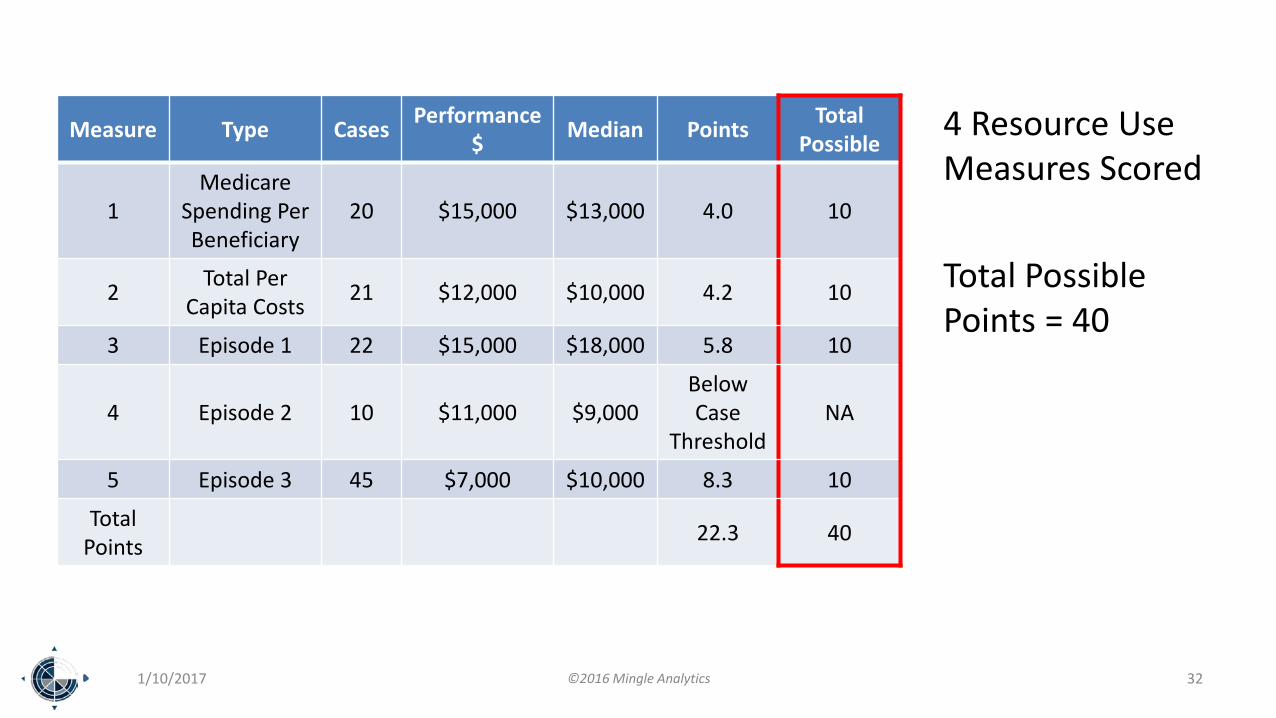
Measure Type Cases Performance$ Median Points Total
Possible
1Medicare
Spending PerBeneficiary
20 $15,000 $13,000 4.0 10
2 Total PerCapita Costs 21 $12,000 $10,000 4.2 10
3 Episode 1 22 $15,000 $18,000 5.8 10
4 Episode 2 10 $11,000 $9,000BelowCase
ThresholdNA
5 Episode 3 45 $7,000 $10,000 8.3 10
TotalPoints 22.3 40
4 Resource Use Measures Scored
Total Possible Points = 40
1/10/2017 ©2016 Mingle Analytics 33
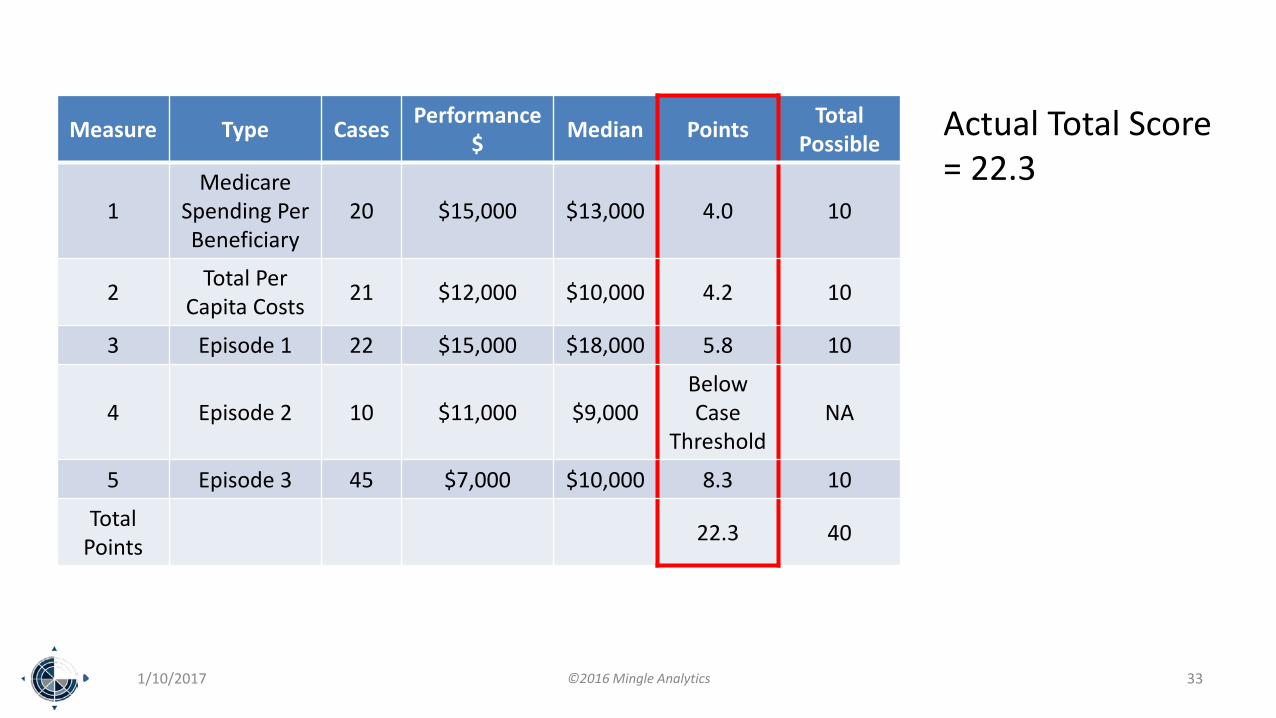
Measure Type Cases Performance$ Median Points Total
Possible
1Medicare
Spending PerBeneficiary
20 $15,000 $13,000 4.0 10
2 Total PerCapita Costs 21 $12,000 $10,000 4.2 10
3 Episode 1 22 $15,000 $18,000 5.8 10
4 Episode 2 10 $11,000 $9,000BelowCase
ThresholdNA
5 Episode 3 45 $7,000 $10,000 8.3 10
TotalPoints 22.3 40
Actual Total Score = 22.3
1/10/2017 ©2016 Mingle Analytics 34
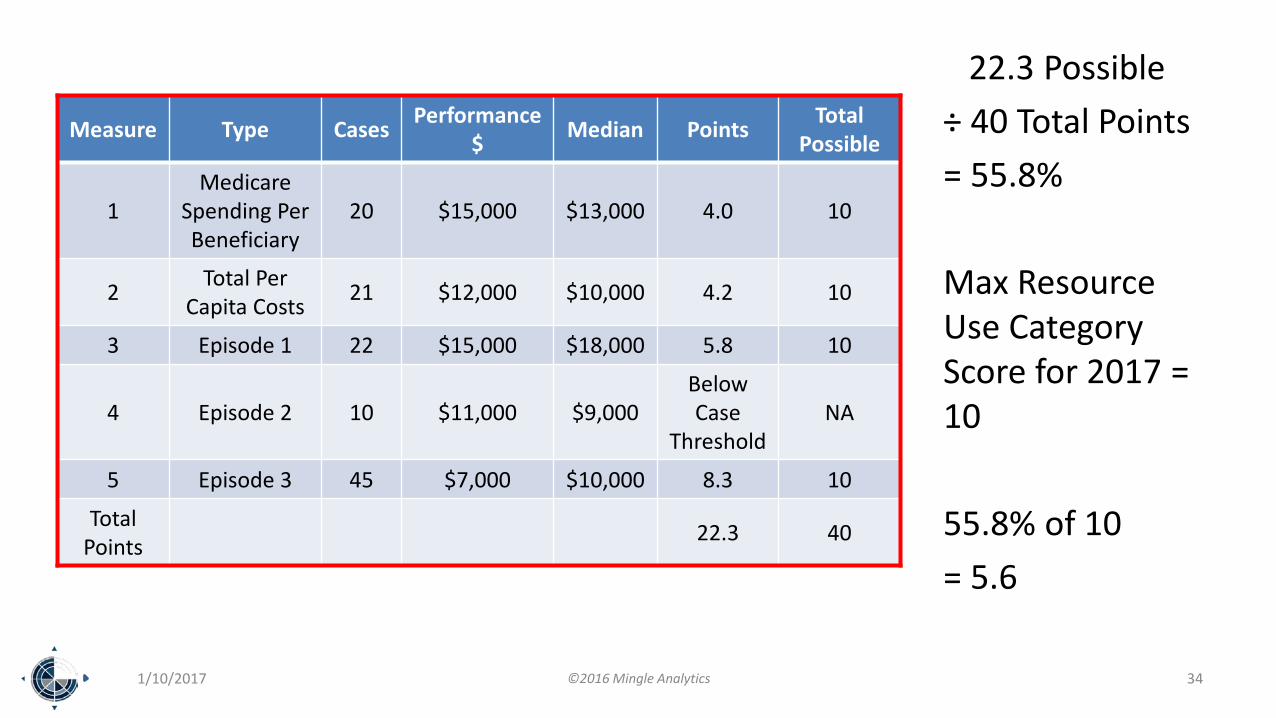
Measure Type Cases Performance$ Median Points Total
Possible
1Medicare
Spending PerBeneficiary
20 $15,000 $13,000 4.0 10
2 Total PerCapita Costs 21 $12,000 $10,000 4.2 10
3 Episode 1 22 $15,000 $18,000 5.8 10
4 Episode 2 10 $11,000 $9,000BelowCase
ThresholdNA
5 Episode 3 45 $7,000 $10,000 8.3 10
TotalPoints 22.3 40
22.3 Possible÷ 40 Total Points= 55.8%
Max Resource Use Category Score for 2017 = 10
55.8% of 10 = 5.6
Focus on
Clinical Practice Improvement Activities
Performance Category
1/10/2017 ©Copyright 2016 Mingle Analytics 35
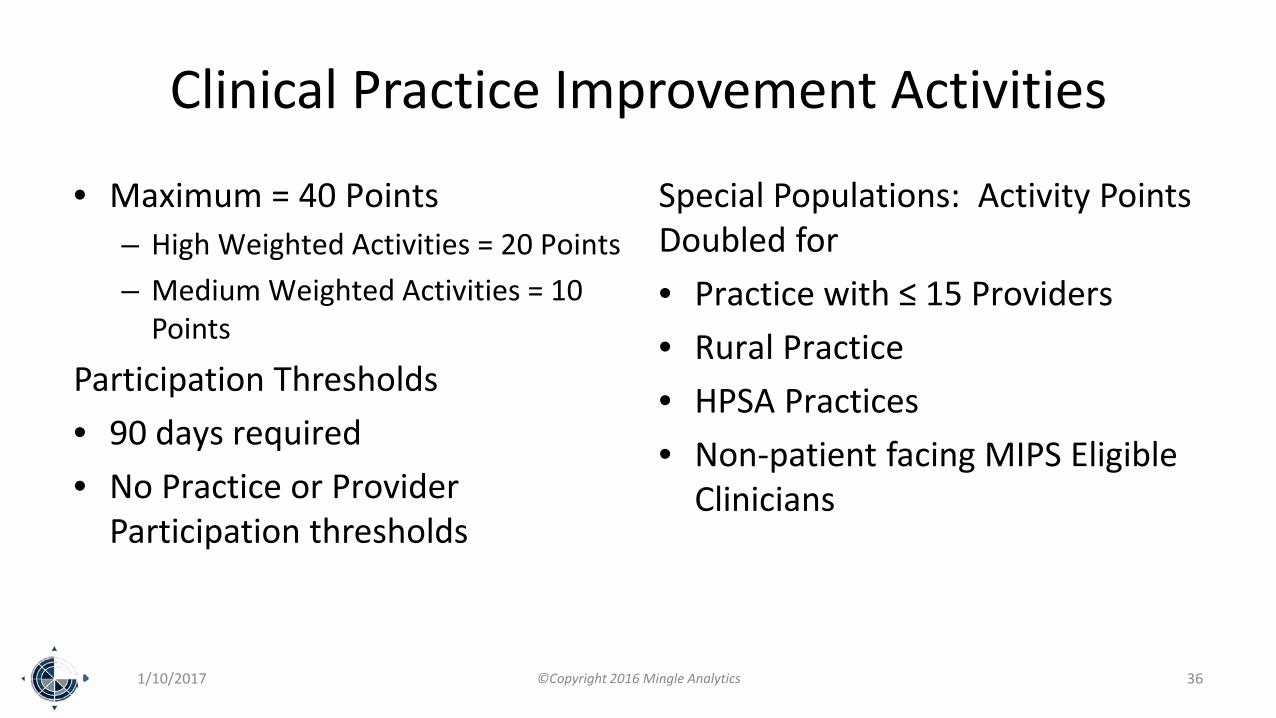
Clinical Practice Improvement Activities
• Maximum = 40 Points– High Weighted Activities = 20 Points– Medium Weighted Activities = 10
Points
Participation Thresholds• 90 days required• No Practice or Provider
Participation thresholds
Special Populations: Activity Points Doubled for• Practice with ≤ 15 Providers• Rural Practice• HPSA Practices• Non-patient facing MIPS Eligible
Clinicians
1/10/2017 ©Copyright 2016 Mingle Analytics 36
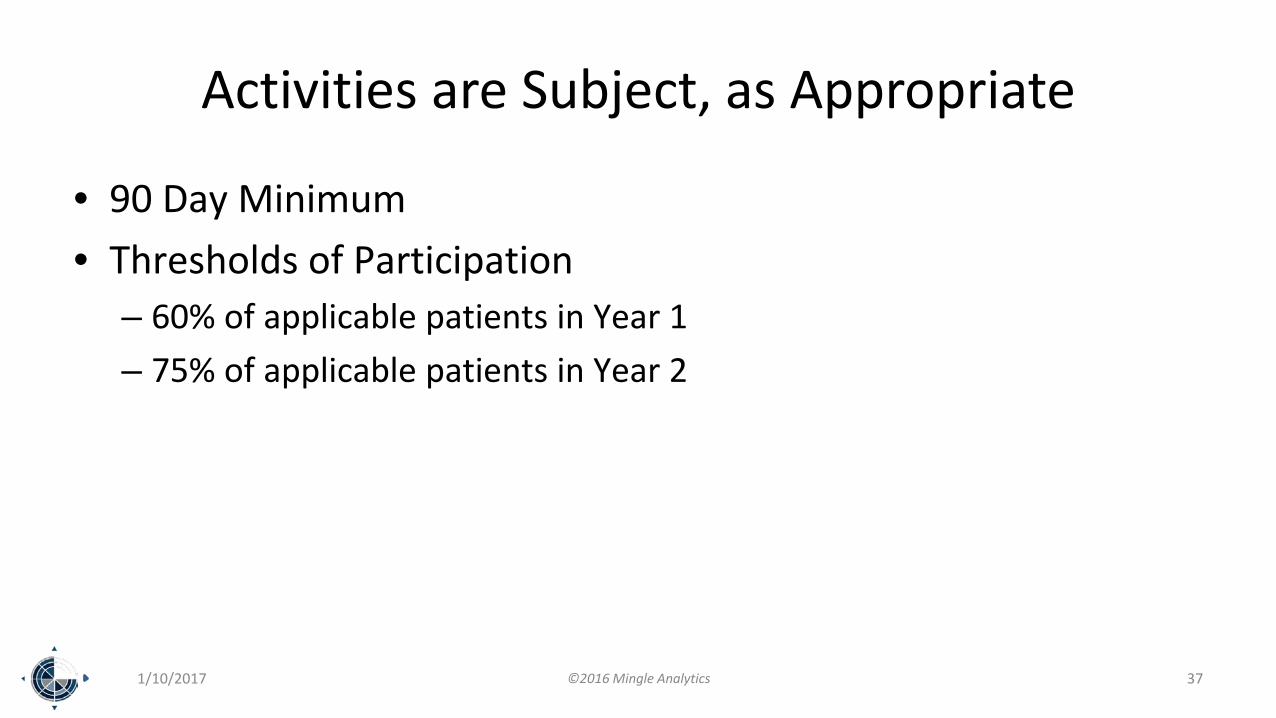
Activities are Subject, as Appropriate
• 90 Day Minimum• Thresholds of Participation
– 60% of applicable patients in Year 1– 75% of applicable patients in Year 2
1/10/2017 ©2016 Mingle Analytics 37
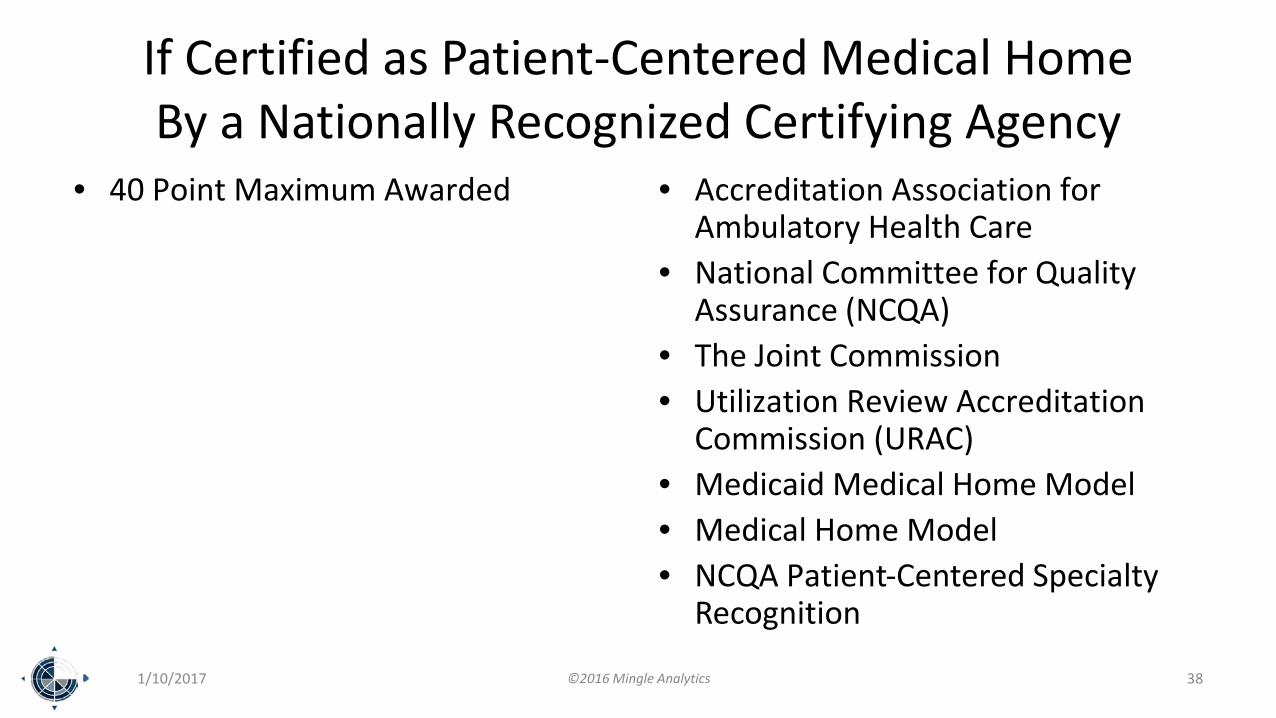
If Certified as Patient-Centered Medical HomeBy a Nationally Recognized Certifying Agency
• 40 Point Maximum Awarded • Accreditation Association for Ambulatory Health Care
• National Committee for Quality Assurance (NCQA)
• The Joint Commission• Utilization Review Accreditation
Commission (URAC)• Medicaid Medical Home Model • Medical Home Model• NCQA Patient-Centered Specialty
Recognition
1/10/2017 ©2016 Mingle Analytics 38
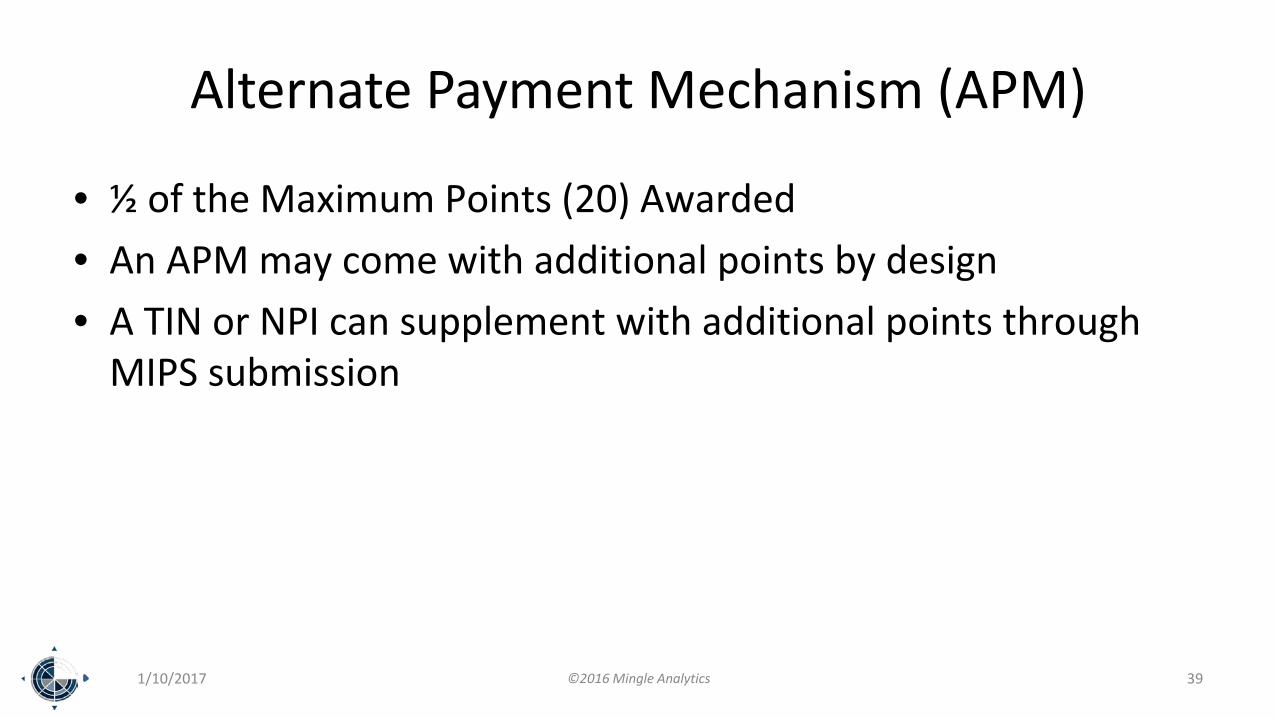
Alternate Payment Mechanism (APM)
• ½ of the Maximum Points (20) Awarded• An APM may come with additional points by design• A TIN or NPI can supplement with additional points through
MIPS submission
1/10/2017 ©2016 Mingle Analytics 39
https://qpp.cms.gov/Specifically: https://qpp.cms.gov/measures/ia
1/10/2017 ©Copyright 2016 Mingle Analytics 40
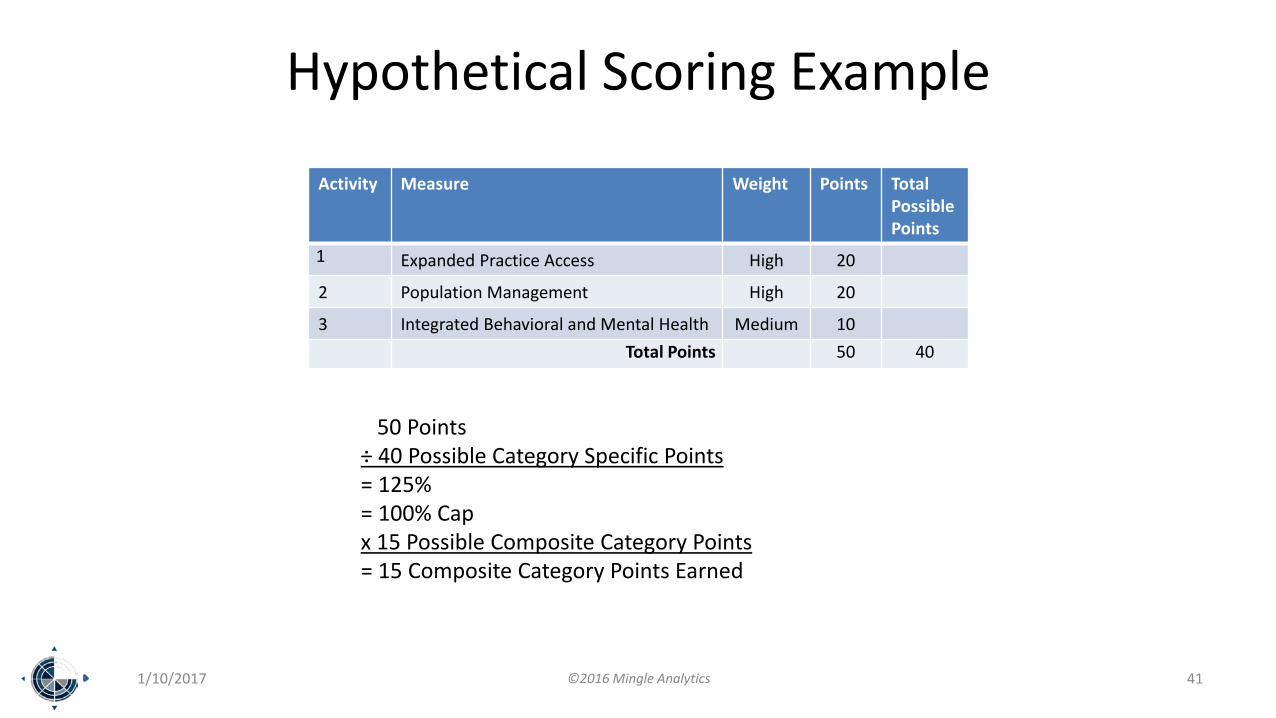
Hypothetical Scoring Example
Activity Measure Weight Points Total PossiblePoints
1 Expanded Practice Access High 20
2 Population Management High 20
3 Integrated Behavioral and Mental Health Medium 10Total Points 50 40
1/10/2017 ©2016 Mingle Analytics 41
50 Points÷ 40 Possible Category Specific Points= 125% = 100% Capx 15 Possible Composite Category Points= 15 Composite Category Points Earned
1/10/2017 ©Copyright 2016 Mingle Analytics 42
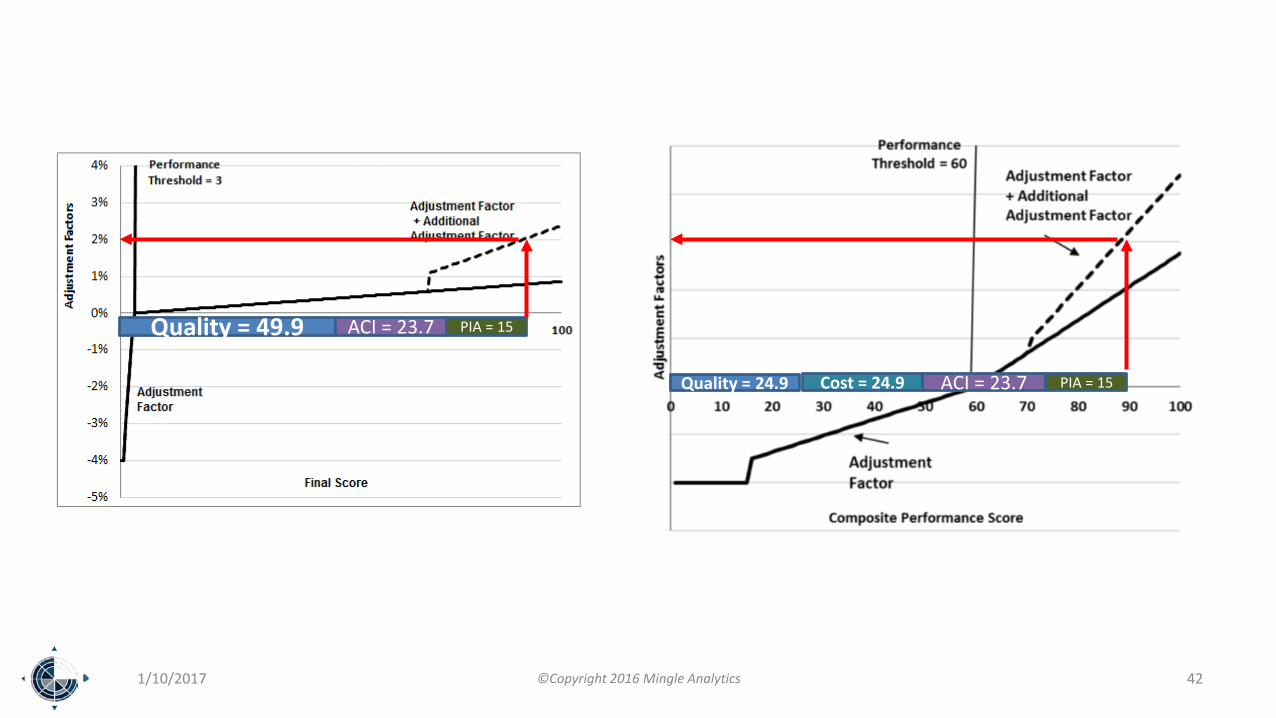
Quality = 49.9 ACI = 23.7 PIA = 15
Quality = 24.9 ACI = 23.7 PIA = 15Cost = 24.9
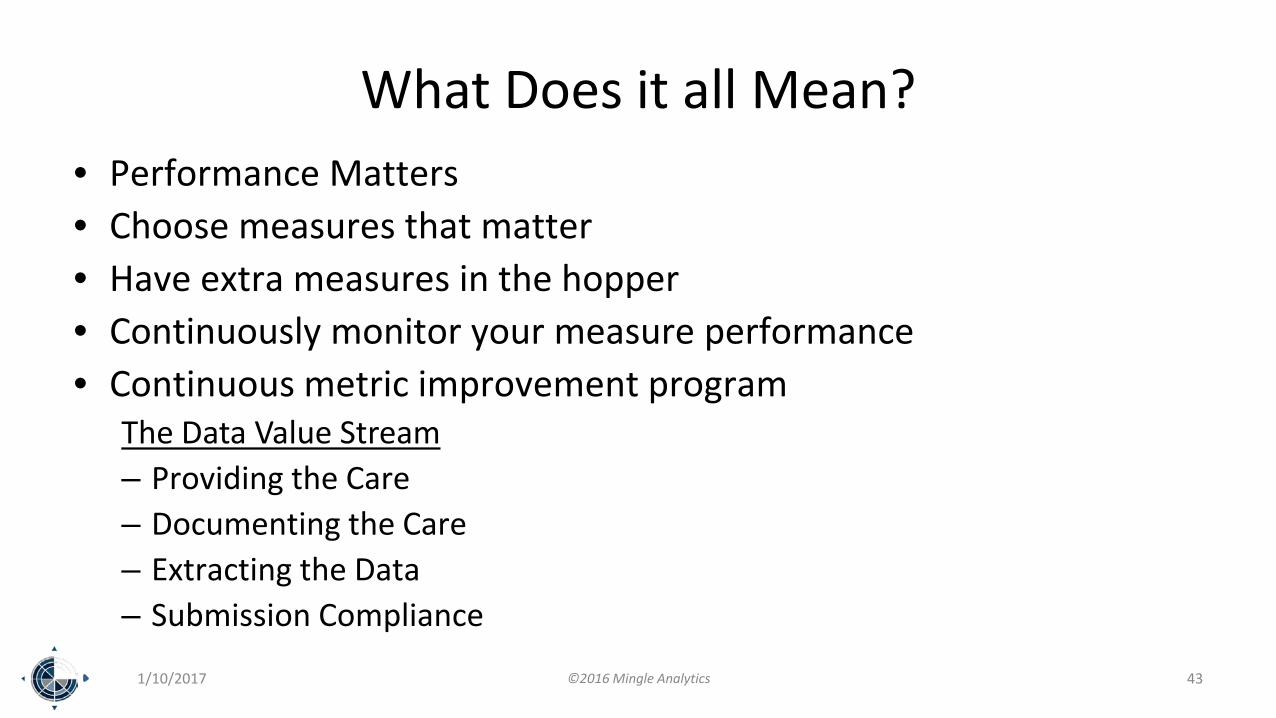
What Does it all Mean?• Performance Matters• Choose measures that matter• Have extra measures in the hopper• Continuously monitor your measure performance• Continuous metric improvement program
The Data Value Stream– Providing the Care– Documenting the Care– Extracting the Data– Submission Compliance
1/10/2017 ©2016 Mingle Analytics 43
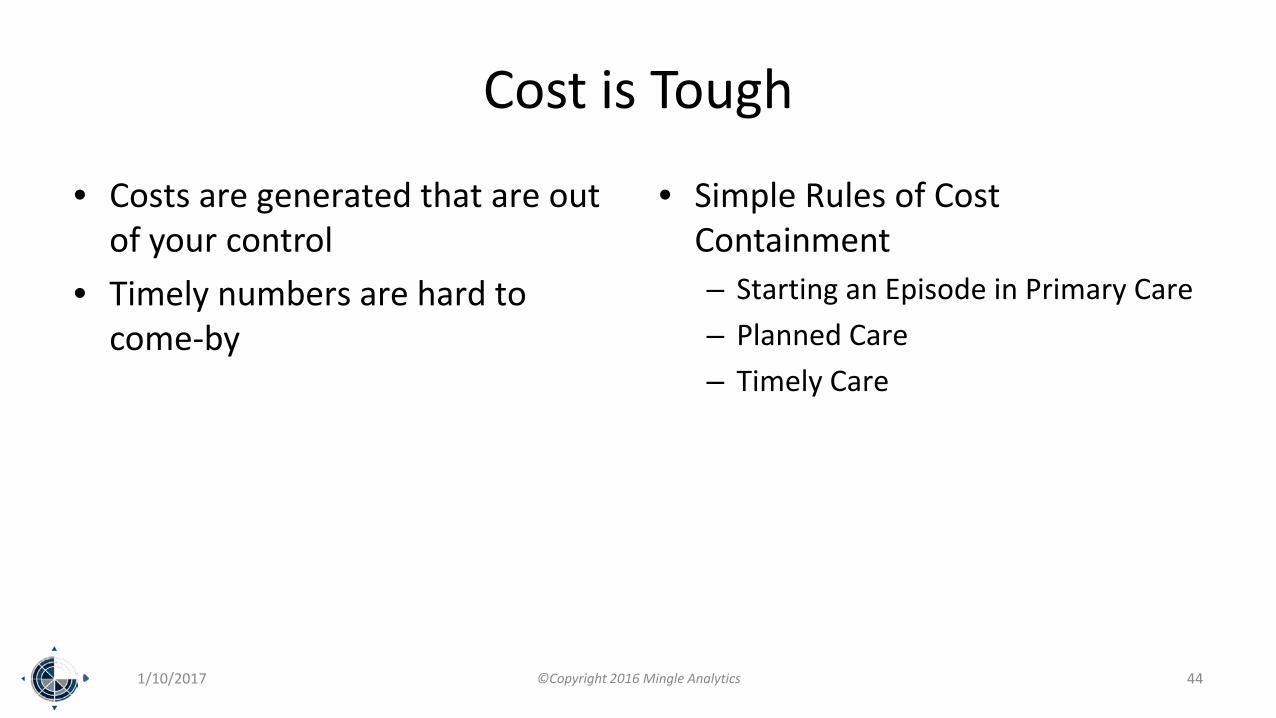
Cost is Tough
• Costs are generated that are out of your control
• Timely numbers are hard to come-by
• Simple Rules of Cost Containment– Starting an Episode in Primary Care – Planned Care– Timely Care
1/10/2017 ©Copyright 2016 Mingle Analytics 44
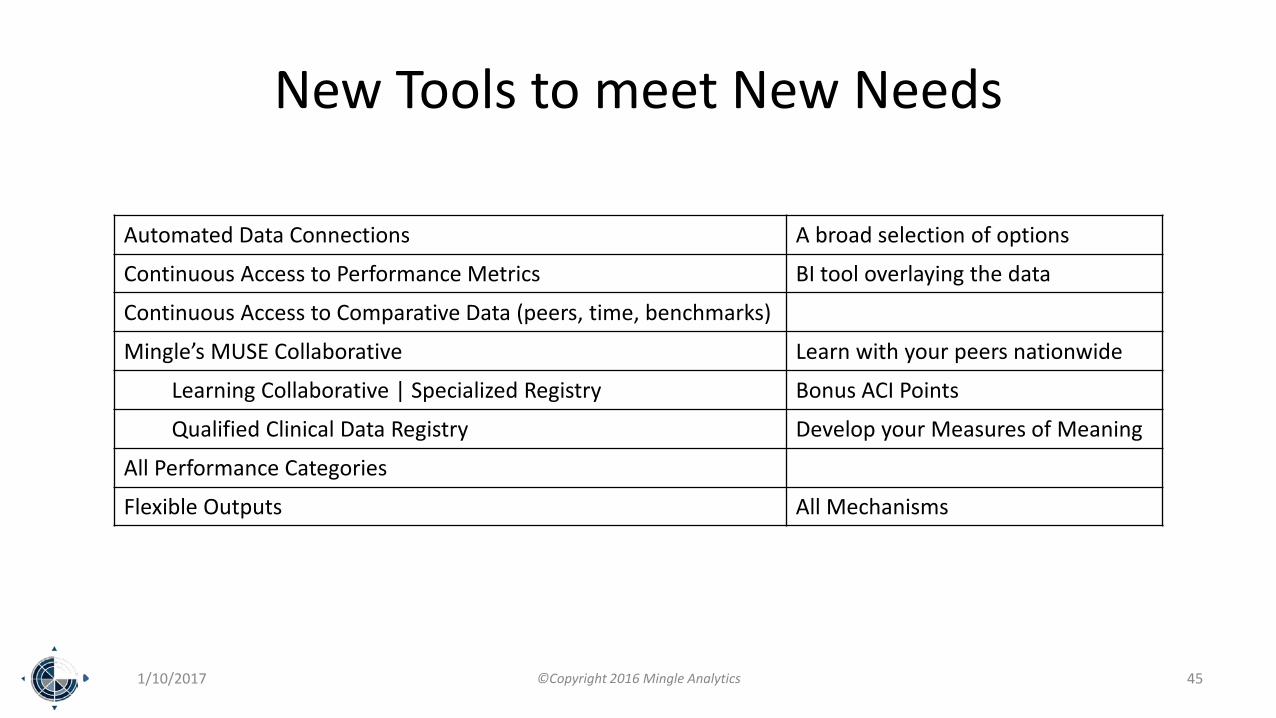
New Tools to meet New Needs
1/10/2017 ©Copyright 2016 Mingle Analytics 45
Automated Data Connections A broad selection of options
Continuous Access to Performance Metrics BI tool overlaying the data
Continuous Access to Comparative Data (peers, time, benchmarks)
Mingle’s MUSE Collaborative Learn with your peers nationwide
Learning Collaborative | Specialized Registry Bonus ACI Points
Qualified Clinical Data Registry Develop your Measures of Meaning
All Performance Categories
Flexible Outputs All Mechanisms
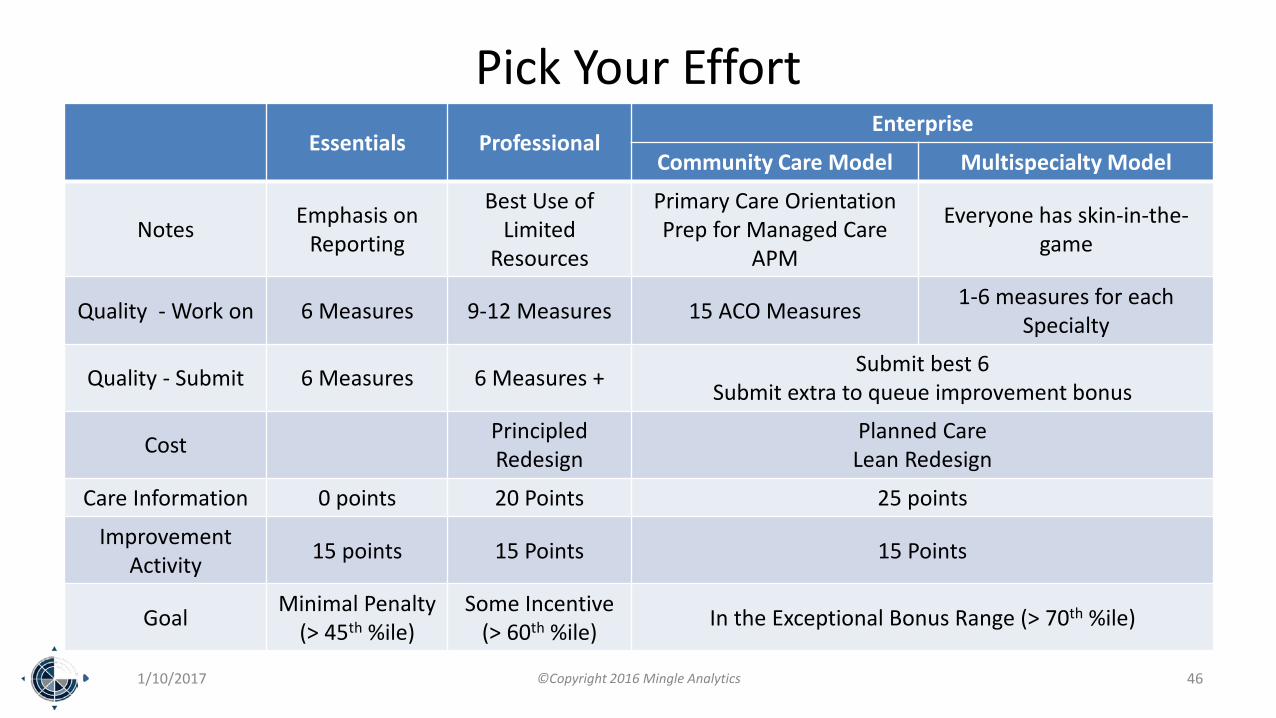
Pick Your Effort
1/10/2017 ©Copyright 2016 Mingle Analytics 46
Essentials ProfessionalEnterprise
Community Care Model Multispecialty Model
Notes Emphasis on Reporting
Best Use of Limited
Resources
Primary Care OrientationPrep for Managed Care
APM
Everyone has skin-in-the-game
Quality - Work on 6 Measures 9-12 Measures 15 ACO Measures 1-6 measures for each Specialty
Quality - Submit 6 Measures 6 Measures + Submit best 6Submit extra to queue improvement bonus
Cost PrincipledRedesign
Planned CareLean Redesign
Care Information 0 points 20 Points 25 points
ImprovementActivity 15 points 15 Points 15 Points
Goal Minimal Penalty (> 45th %ile)
Some Incentive (> 60th %ile) In the Exceptional Bonus Range (> 70th %ile)
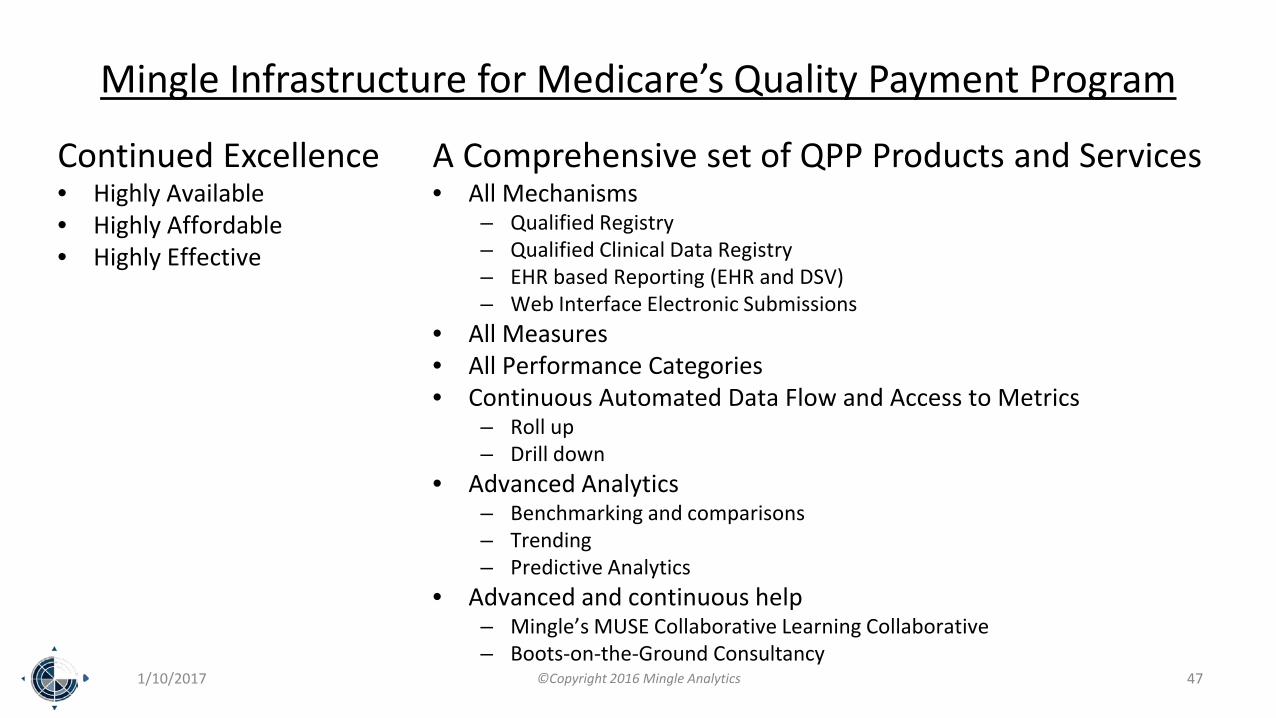
Mingle Infrastructure for Medicare’s Quality Payment Program
Continued Excellence• Highly Available• Highly Affordable• Highly Effective
A Comprehensive set of QPP Products and Services• All Mechanisms
– Qualified Registry– Qualified Clinical Data Registry– EHR based Reporting (EHR and DSV)– Web Interface Electronic Submissions
• All Measures• All Performance Categories• Continuous Automated Data Flow and Access to Metrics
– Roll up– Drill down
• Advanced Analytics– Benchmarking and comparisons– Trending– Predictive Analytics
• Advanced and continuous help– Mingle’s MUSE Collaborative Learning Collaborative– Boots-on-the-Ground Consultancy
1/10/2017 ©Copyright 2016 Mingle Analytics 47
Thank YouAsk your questions now or
Send by email to [email protected]
Register for Webinars or Access Recordings @ http://mingleanalytics.com/webinars
There is still time to engage us to help with your 2016 PQRS and VM Submissions
Join our MUSE Collaborative for a Data-Driven learning and improvement processTo help you rise to earn your highest possible MIPS Adjustment
1/10/2017 ©Copyright 2016 Mingle Analytics 48