Embed Size (px)
Citation preview

Round_3
Master_version_2015 TRA Templates 26102015Bank Name BPER Banca S.p.A.
LEI Code N747OI7JINV7RUUH6190
Country Code IT
BP
2017 EU-wide Transparency Exercise

201612 201706
(mln EUR, %)As of 31/12/2016 As of 30/06/2017 COREP CODE REGULATION
A OWN FUNDS 4,958 5,440 C 01.00 (r010,c010) Articles 4(118) and 72 of CRR
A.1COMMON EQUITY TIER 1 CAPITAL (net of deductions and after applying
transitional adjustments)4,498 4,504 C 01.00 (r020,c010) Article 50 of CRR
A.1.1Capital instruments eligible as CET1 Capital (including share premium and net own capital
instruments)2,367 2,367 C 01.00 (r030,c010) Articles 26(1) points (a) and (b), 27 to 29, 36(1) point (f) and 42 of CRR
A.1.2 Retained earnings 1,840 1,948 C 01.00 (r130,c010) Articles 26(1) point (c), 26(2) and 36 (1) points (a) and (l) of CRR
A.1.3 Accumulated other comprehensive income -14 -12 C 01.00 (r180,c010) Articles 4(100), 26(1) point (d) and 36 (1) point (l) of CRR
A.1.4 Other Reserves 663 663 C 01.00 (r200,c010) Articles 4(117) and 26(1) point (e) of CRR
A.1.5 Funds for general banking risk 0 0 C 01.00 (r210,c010) Articles 4(112), 26(1) point (f) and 36 (1) point (l) of CRR
A.1.6 Minority interest given recognition in CET1 capital 193 188 C 01.00 (r230,c010) Article 84 of CRR
A.1.7 Adjustments to CET1 due to prudential filters -14 -14 C 01.00 (r250,c010) Articles 32 to 35 of and 36 (1) point (l) of CRR
A.1.8 (-) Intangible assets (including Goodwill) -621 -613 C 01.00 (r300,c010) + C 01.00 (r340,c010) Articles 4(113), 36(1) point (b) and 37 of CRR. Articles 4(115), 36(1) point (b) and 37 point (a) of
CCR
A.1.9(-) DTAs that rely on future profitability and do not arise from temporary differences net of
associated DTLs 0 -15 C 01.00 (r370,c010) Articles 36(1) point (c) and 38 of CRR
A.1.10 (-) IRB shortfall of credit risk adjustments to expected losses -39 -32 C 01.00 (r380,c010) Articles 36(1) point (d), 40 and 159 of CRR
A.1.11 (-) Defined benefit pension fund assets 0 0 C 01.00 (r390,c010) Articles 4(109), 36(1) point (e) and 41 of CRR
A.1.12 (-) Reciprocal cross holdings in CET1 Capital 0 0 C 01.00 (r430,c010) Articles 4(122), 36(1) point (g) and 44 of CRR
A.1.13 (-) Excess deduction from AT1 items over AT1 Capital 0 0 C 01.00 (r440,c010) Article 36(1) point (j) of CRR
A.1.14 (-) Deductions related to assets which can alternatively be subject to a 1.250% risk weight 0 0C 01.00 (r450,c010) + C 01.00 (r460,c010) +
C 01.00 (r470,c010) + C 01.00 (r471,c010)+
C 01.00 (r472,c010)
Articles 4(36), 36(1) point (k) (i) and 89 to 91 of CRR; Articles 36(1) point (k) (ii), 243(1) point (b),
244(1) point (b) and 258 of CRR; Articles 36(1) point k) (iii) and 379(3) of CRR; Articles 36(1)
point k) (iv) and 153(8) of CRR and Articles 36(1) point k) (v) and 155(4) of CRR.
A.1.14.1 Of which: from securitisation positions (-) 0 0 C 01.00 (r460,c010) Articles 36(1) point (k) (ii), 243(1) point (b), 244(1) point (b) and 258 of CRR
A.1.15(-) Holdings of CET1 capital instruments of financial sector entities where the institiution does
not have a significant investment0 0 C 01.00 (r480,c010) Articles 4(27), 36(1) point (h); 43 to 46, 49 (2) and (3) and 79 of CRR
A.1.16 (-) Deductible DTAs that rely on future profitability and arise from temporary differences 0 0 C 01.00 (r490,c010) Articles 36(1) point (c) and 38; Articles 48(1) point (a) and 48(2) of CRR
A.1.17(-) Holdings of CET1 capital instruments of financial sector entities where the institiution has a
significant investment0 0 C 01.00 (r500,c010) Articles 4(27); 36(1) point (i); 43, 45; 47; 48(1) point (b); 49(1) to (3) and 79 of CRR
A.1.18 (-) Amount exceding the 17.65% threshold 0 0 C 01.00 (r510,c010) Article 48 of CRR
A.1.19 (-) Additional deductions of CET1 Capital due to Article 3 CRR 0 0 C 01.00 (r524,c010) Article 3 CRR
A.1.20 CET1 capital elements or deductions - other -50 -47 C 01.00 (r529,c010) -
A.1.21 Transitional adjustments 173 70 CA1 {1.1.1.6 + 1.1.1.8 + 1.1.1.26} -
A.1.21.1 Transitional adjustments due to grandfathered CET1 Capital instruments (+/-) 0 0 C 01.00 (r220,c010) Articles 483(1) to (3), and 484 to 487 of CRR
A.1.21.2 Transitional adjustments due to additional minority interests (+/-) 193 77 C 01.00 (r240,c010) Articles 479 and 480 of CRR
A.1.21.3 Other transitional adjustments to CET1 Capital (+/-) -20 -7 C 01.00 (r520,c010) Articles 469 to 472, 478 and 481 of CRR
A.2 ADDITIONAL TIER 1 CAPITAL (net of deductions and after transitional adjustments) 29 33 C 01.00 (r530,c010) Article 61 of CRR
A.2.1 Additional Tier 1 Capital instruments 37 36 C 01.00 (r540,c010) + C 01.00 (r670,c010)
A.2.2 (-) Excess deduction from T2 items over T2 capital 0 0 C 01.00 (r720,c010)
A.2.3 Other Additional Tier 1 Capital components and deductions 0 0C 01.00 (r690,c010) + C 01.00 (r700,c010) +
C 01.00 (r710,c010) + C 01.00 (r740,c010) +
C 01.00 (r744,c010) + C 01.00 (r748,c010)
A.2.4 Additional Tier 1 transitional adjustments -8 -3C 01.00 (r660,c010) + C 01.00 (r680,c010) +
C 01.00 (r730,c010)
A.3 TIER 1 CAPITAL (net of deductions and after transitional adjustments) 4,526 4,536 C 01.00 (r015,c010) Article 25 of CRR
A.4 TIER 2 CAPITAL (net of deductions and after transitional adjustments) 432 903 C 01.00 (r750,c010) Article 71 of CRR
A.4.1 Tier 2 Capital instruments 314 812 C 01.00 (r760,c010) + C 01.00 (r890,c010)
A.4.2 Other Tier 2 Capital components and deductions 85 81
C 01.00 (r910,c010) + C 01.00 (r920,c010) +
C 01.00 (r930,c010) + C 01.00 (r940,c010) +
C 01.00 (r950,c010) + C 01.00 (r970,c010) +
C 01.00 (r974,c010) + C 01.00 (r978,c010)
A.4.3 Tier 2 transitional adjustments 33 10C 01.00 (r880,c010) + C 01.00 (r900,c010) +
C 01.00 (r960,c010)
B TOTAL RISK EXPOSURE AMOUNT 31,622 32,686 C 02.00 (r010,c010) Articles 92(3), 95, 96 and 98 of CRR
B.1 Of which: Transitional adjustments included 0 0 C 05.01 (r010;c040)
C.1 COMMON EQUITY TIER 1 CAPITAL RATIO (transitional period) 14.22% 13.78% CA3 {1} -
C.2 TIER 1 CAPITAL RATIO (transitional period) 14.31% 13.88% CA3 {3} -
C.3 TOTAL CAPITAL RATIO (transitional period) 15.68% 16.64% CA3 {5} -
CET1 Capital
Fully loadedD COMMON EQUITY TIER 1 CAPITAL (fully loaded) 4,325 4,434
[A.1-A.1.13-A.1.21+MIN(A.2+A.1.13-
A.2.2-A.2.4+MIN(A.4+A.2.2-A.4.3,0),0)]-
CET1 RATIO (%)
Fully loaded1 E COMMON EQUITY TIER 1 CAPITAL RATIO (fully loaded) 13.68% 13.56% [D.1]/[B-B.1] -
(1) Fully loaded CET1 capital ratio estimation based on the formulae stated in column “COREP CODE”
2017 EU-wide Transparency Exercise
Capital
BPER Banca S.p.A.
OWN FUNDS
Transitional period
OWN FUNDS
REQUIREMENTS
CAPITAL RATIOS (%)
Transitional period

201612 201706
(mln EUR, %)
As of
31/12/2016
As of
30/06/2017COREP CODE REGULATION
A.1 Tier 1 capital - transitional definition 4,526 4,536 C 47.00 (r320,c010)
A.2 Tier 1 capital - fully phased-in definition 4,362 4,470 C 47.00 (r310,c010)
B.1 Total leverage ratio exposures - using a transitional definition of Tier 1 capital 67,534 73,647 C 47.00 (r300,c010)
B.2 Total leverage ratio exposures - using a fully phased-in definition of Tier 1 capital 67,522 73,639 C 47.00 (r290,c010)
C.1 Leverage ratio - using a transitional definition of Tier 1 capital 6.7% 6.2% C 47.00 (r340,c010)
C.2 Leverage ratio - using a fully phased-in definition of Tier 1 capital 6.5% 6.1% C 47.00 (r330,c010)
2017 EU-wide Transparency ExerciseLeverage ratio
BPER Banca S.p.A.
Article 429 of the CRR; Delegated Regulation (EU) 2015/62 of 10 October 2014 amending
CRR

201612 201706
(mln EUR)
As of
31/12/2016as of 30/06/2017
Risk exposure amounts for credit risk 27,226 28,155
Risk exposure amount for securitisation and re-securitisations in the banking book 374 339
Risk exposure amount for contributions to the default fund of a CCP 2 2
Risk exposure amount Other credit risk 26,851 27,815
Risk exposure amount for position, foreign exchange and commodities (Market risk) 654 805
of which: Risk exposure amount for securitisation and re-securitisations in the trading book1 0 0
Risk exposure amount for Credit Valuation Adjustment 297 194
Risk exposure amount for operational risk 3,444 3,533
Other risk exposure amounts 0 0
Total Risk Exposure Amount 31,622 32,686
(1)
May include hedges, which are not securitisation positions, as per Article 338.3 of CRR
2017 EU-wide Transparency Exercise
Risk exposure amounts
BPER Banca S.p.A.
201612 201706
(mln EUR)
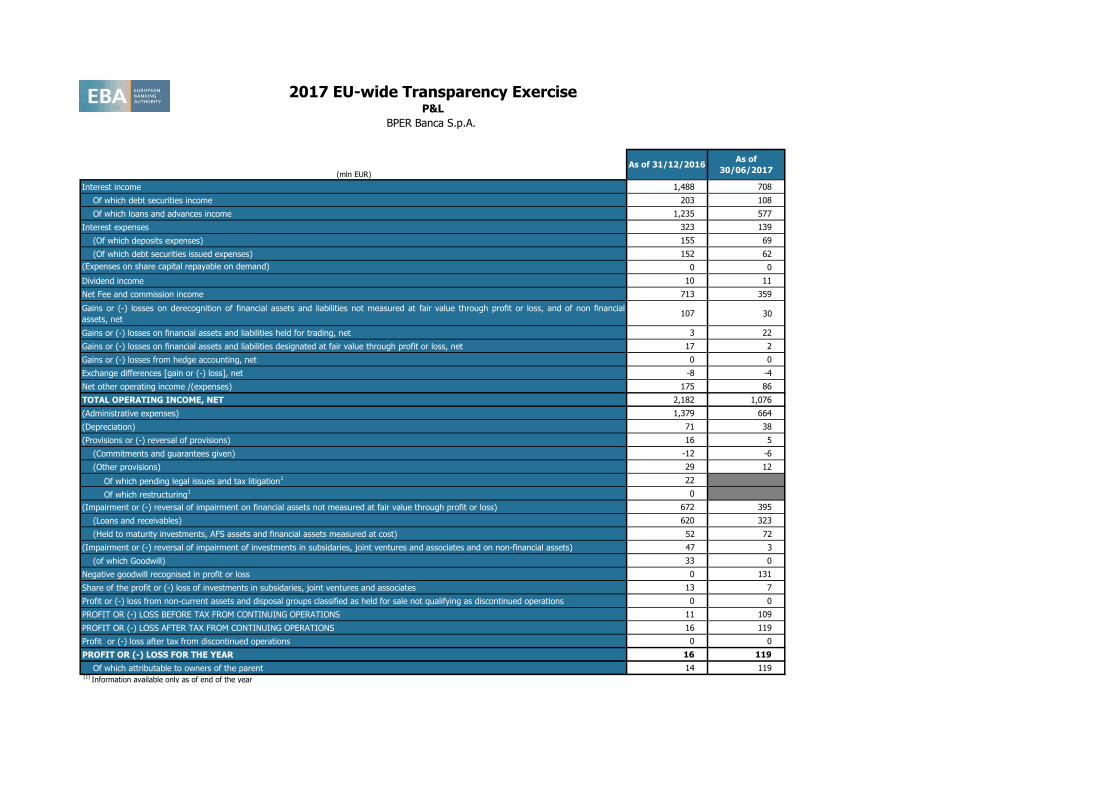
Interest income 1,488 708
Of which debt securities income 203 108
Of which loans and advances income 1,235 577
Interest expenses 323 139
(Of which deposits expenses) 155 69
(Of which debt securities issued expenses) 152 62
(Expenses on share capital repayable on demand) 0 0
Dividend income 10 11
Net Fee and commission income 713 359
Gains or (-) losses on derecognition of financial assets and liabilities not measured at fair value through profit or loss, and of non financial
assets, net107 30
Gains or (-) losses on financial assets and liabilities held for trading, net 3 22
Gains or (-) losses on financial assets and liabilities designated at fair value through profit or loss, net 17 2
Gains or (-) losses from hedge accounting, net 0 0
Exchange differences [gain or (-) loss], net -8 -4
Net other operating income /(expenses) 175 86
TOTAL OPERATING INCOME, NET 2,182 1,076
(Administrative expenses) 1,379 664
(Depreciation) 71 38
(Provisions or (-) reversal of provisions) 16 5
(Commitments and guarantees given) -12 -6
(Other provisions) 29 12
Of which pending legal issues and tax litigation1 22
Of which restructuring1 0
(Impairment or (-) reversal of impairment on financial assets not measured at fair value through profit or loss) 672 395
(Loans and receivables) 620 323
(Held to maturity investments, AFS assets and financial assets measured at cost) 52 72
(Impairment or (-) reversal of impairment of investments in subsidaries, joint ventures and associates and on non-financial assets) 47 3
(of which Goodwill) 33 0
Negative goodwill recognised in profit or loss 0 131
Share of the profit or (-) loss of investments in subsidaries, joint ventures and associates 13 7
Profit or (-) loss from non-current assets and disposal groups classified as held for sale not qualifying as discontinued operations 0 0
PROFIT OR (-) LOSS BEFORE TAX FROM CONTINUING OPERATIONS 11 109
PROFIT OR (-) LOSS AFTER TAX FROM CONTINUING OPERATIONS 16 119
Profit or (-) loss after tax from discontinued operations 0 0
PROFIT OR (-) LOSS FOR THE YEAR 16 119
Of which attributable to owners of the parent 14 119 (1)
Information available only as of end of the year
2017 EU-wide Transparency ExerciseP&L
BPER Banca S.p.A.
As of 31/12/2016As of
30/06/2017

201612 201706 201612 201612 201612 201612 201612 201612 201612 201612 201612 201612 201706 201706 201706 201706 201706 201706 201706 201706 201706 201706
As of
31/12/2016
As of
30/06/2017
(mln EUR)
MULTIPLICATION
FACTOR (mc) x
AVERAGE OF
PREVIOUS 60
WORKING DAYS
(VaRavg)
PREVIOUS
DAY (VaRt-1)
MULTIPLICATION
FACTOR (ms) x
AVERAGE OF
PREVIOUS 60
WORKING DAYS
(SVaRavg)
LATEST
AVAILABLE
(SVaRt-1)
12 WEEKS
AVERAGE
MEASURE
LAST
MEASUREFLOOR
12 WEEKS
AVERAGE
MEASURE
LAST
MEASURE
MULTIPLICATION
FACTOR (mc) x
AVERAGE OF
PREVIOUS 60
WORKING DAYS
(VaRavg)
PREVIOUS
DAY (VaRt-1)
MULTIPLICATION
FACTOR (ms) x
AVERAGE OF
PREVIOUS 60
WORKING DAYS
(SVaRavg)
LATEST
AVAILABLE
(SVaRt-1)
12 WEEKS
AVERAGE
MEASURE
LAST
MEASUREFLOOR
12 WEEKS
AVERAGE
MEASURE
LAST
MEASURE
Traded Debt Instruments 259 327 0 0 0 0 0 0 0 0
Of which: General risk 202 258 0 0 0 0 0 0 0 0
Of which: Specific risk 44 48 0 0 0 0 0 0 0 0
Equities 109 166 0 0 0 0 0 0 0 0
Of which: General risk 53 78 0 0 0 0 0 0 0 0
Of which: Specific risk 55 79 0 0 0 0 0 0 0 0
Foreign exchange risk 0 0 0 0 0 0 0 0 0 0
Commodities risk 8 19 0 0 0 0 0 0 0 0
Total 377 512 0 0 0 0 0 0 0 0 0 0 0 0 0 0 0 0 0 0 0 0
2017 EU-wide Transparency ExerciseMarket Risk
BPER Banca S.p.A.
SA IM IM
TOTAL RISK
EXPOSURE
AMOUNT
TOTAL RISK
EXPOSURE
AMOUNT
VaR (Memorandum item)STRESSED VaR (Memorandum
item)
INCREMENTAL
DEFAULT AND
MIGRATION RISK
CAPITAL CHARGE
STRESSED VaR (Memorandum
item)
INCREMENTAL
DEFAULT AND
MIGRATION RISK
CAPITAL CHARGE
ALL PRICE RISKS CAPITAL
CHARGE FOR CTP
TOTAL RISK
EXPOSURE
AMOUNT
As of 31/12/2016 As of 30/06/2017
ALL PRICE RISKS CAPITAL
CHARGE FOR CTP
TOTAL RISK
EXPOSURE
AMOUNT
VaR (Memorandum item)

201612 201612 201612 201612 201706 201706 201706 201706
(mln EUR, %)
Central governments or central banks 10,736 11,374 1,428 13,182 13,857 1,474
Regional governments or local authorities 865 192 38 659 220 44
Public sector entities 581 287 67 691 391 120
Multilateral Development Banks 735 763 0 753 793 0
International Organisations 50 50 0 194 194 0
Institutions 10,787 5,823 2,045 12,228 6,706 2,498
Corporates 8,043 5,639 5,112 8,665 5,909 5,482
of which: SME 1,882 1,280 1,205 1,896 1,275 1,199
Retail 1,247 673 407 1,745 940 572
of which: SME 973 548 313 1,228 745 426
Secured by mortgages on immovable property 1,169 1,161 486 1,948 1,940 781
of which: SME 561 558 230 764 761 308
Exposures in default 1,960 1,180 1,387 709 2,016 1,143 1,336 783
Items associated with particularly high risk 49 46 69 51 48 72
Covered bonds 1,152 1,152 173 1,526 1,526 364
Claims on institutions and corporates with a ST credit assessment 0 0 0 0 0 0
Collective investments undertakings (CIU) 312 312 312 258 255 255
Equity 618 618 852 607 607 839
Securitisation 197 196 374 190 90 339
Other exposures 370 370 345 540 546 456
Standardised Total 38,872 29,838 13,094 811 45,253 35,166 14,631 895(1)
Original exposure, unlike Exposure value, is reported before taking into account any effect due to credit conversion factors or credit risk mitigation techniques (e.g. substitution effects).
1 (mln EUR, %)
Central governments or central banks 0 0 0 11,823 12,501 1,470
Regional governments or local authorities 0 0 0 659 220 44
Public sector entities 0 0 0 511 210 93
Multilateral Development Banks 0 0 0 0 0 0
International Organisations 0 0 0 0 0 0
Institutions 0 0 0 5,661 3,246 1,624
Corporates 0 0 0 6,990 4,473 4,046
of which: SME 0 0 0 1,863 1,243 1,169
Retail 0 0 0 1,742 939 570
of which: SME 0 0 0 1,228 745 426
Secured by mortgages on immovable property 0 0 0 1,942 1,934 778
of which: SME 0 0 0 763 760 308
Exposures in default 0 0 0 0 1,913 1,093 1,280 550
Items associated with particularly high risk 0 0 0 51 47 71
Covered bonds 0 0 0 444 444 221
Claims on institutions and corporates with a ST credit assessment 0 0 0 0 0 0
Collective investments undertakings (CIU) 0 0 0 185 183 183
Equity 0 0 0 541 541 772
Securitisation
Other exposures 0 0 0 539 546 456
Standardised Total2 0 631
(1) Original exposure, unlike Exposure value, is reported before taking into account any effect due to credit conversion factors or credit risk mitigation techniques (e.g. substitution effects).
(2) Total value adjustments and provisions per country of counterparty does not include Securistisation exposures
2 (mln EUR, %)
Central governments or central banks 0 0 0 705 705 0
Regional governments or local authorities 0 0 0 0 0 0
Public sector entities 0 0 0 88 88 1
Multilateral Development Banks 0 0 0 0 0 0
International Organisations 0 0 0 0 0 0
Institutions 0 0 0 1,861 512 109
Corporates 0 0 0 204 201 201
of which: SME 0 0 0 16 16 16
Retail 0 0 0 0 0 0
of which: SME 0 0 0 0 0 0
Secured by mortgages on immovable property 0 0 0 0 0 0
of which: SME 0 0 0 0 0 0
Exposures in default 0 0 0 0 0 0 0 0
Items associated with particularly high risk 0 0 0 0 0 0
Covered bonds 0 0 0 233 233 28
Claims on institutions and corporates with a ST credit assessment 0 0 0 0 0 0
Collective investments undertakings (CIU) 0 0 0 3 3 3
Equity 0 0 0 10 10 10
Securitisation
Other exposures 0 0 0 0 0 0
Standardised Total2 0 0
(1) Original exposure, unlike Exposure value, is reported before taking into account any effect due to credit conversion factors or credit risk mitigation techniques (e.g. substitution effects).
(2) Total value adjustments and provisions per country of counterparty does not include Securistisation exposures
3 (mln EUR, %)
Central governments or central banks 0 0 0 59 59 0
Regional governments or local authorities 0 0 0 0 0 0
Public sector entities 0 0 0 0 0 0
Multilateral Development Banks 0 0 0 0 0 0
International Organisations 0 0 0 0 0 0
Institutions 0 0 0 1,133 551 118
Corporates 0 0 0 290 174 174
of which: SME 0 0 0 11 11 11
Retail 0 0 0 1 1 0
of which: SME 0 0 0 0 0 0
Secured by mortgages on immovable property 0 0 0 0 0 0
of which: SME 0 0 0 0 0 0
Exposures in default 0 0 0 0 0 0 0 0
Items associated with particularly high risk 0 0 0 1 1 1
Covered bonds 0 0 0 0 0 0
Claims on institutions and corporates with a ST credit assessment 0 0 0 0 0 0
Collective investments undertakings (CIU) 0 0 0 0 0 0
Equity 0 0 0 3 3 3
Securitisation
Other exposures 0 0 0 0 0 0
Standardised Total2 0 0
(1) Original exposure, unlike Exposure value, is reported before taking into account any effect due to credit conversion factors or credit risk mitigation techniques (e.g. substitution effects).
(2) Total value adjustments and provisions per country of counterparty does not include Securistisation exposures
2017 EU-wide Transparency Exercise
Credit Risk - Standardised Approach
BPER Banca S.p.A.
Standardised Approach
As of 31/12/2016 As of 30/06/2017
Risk exposure
amount
Value
adjustments and
provisions
Consolidated data
Standardised Approach
As of 31/12/2016 As of 30/06/2017
Original
Exposure1
Exposure
Value1
Risk exposure
amount
Value
adjustments and
provisions
Original
Exposure1
Exposure
Value1
Risk exposure
amount
Value
adjustments and
provisions2
ITALY
Standardised Approach
As of 31/12/2016 As of 30/06/2017
Original
Exposure1
Exposure
Value1
Risk exposure
amount
Value
adjustments and
provisions2
Original
Exposure1
Exposure
Value1
Risk exposure
amount
Value
adjustments and
provisions2
FRANCE
Standardised Approach
As of 31/12/2016 As of 30/06/2017
Original
Exposure1
Exposure
Value1
Risk exposure
amount
Value
adjustments and
provisions2
Original
Exposure1
Exposure
Value1
Risk exposure
amount
Value
adjustments and
provisions2
UNITED KINGDOM
Original
Exposure1
Exposure
Value1
Risk exposure
amount
Value
adjustments and
provisions2
Original
Exposure1
Exposure
Value1

2017 EU-wide Transparency Exercise
Credit Risk - Standardised Approach
BPER Banca S.p.A.
4 (mln EUR, %)
Central governments or central banks 0 0 0 374 374 0
Regional governments or local authorities 0 0 0 0 0 0
Public sector entities 0 0 0 0 0 0
Multilateral Development Banks 0 0 0 0 0 0
International Organisations 0 0 0 0 0 0
Institutions 0 0 0 360 331 66
Corporates 0 0 0 334 331 331
of which: SME 0 0 0 0 0 0
Retail 0 0 0 0 0 0
of which: SME 0 0 0 0 0 0
Secured by mortgages on immovable property 0 0 0 0 0 0
of which: SME 0 0 0 0 0 0
Exposures in default 0 0 0 0 2 0 0 2
Items associated with particularly high risk 0 0 0 0 0 0
Covered bonds 0 0 0 0 0 0
Claims on institutions and corporates with a ST credit assessment 0 0 0 0 0 0
Collective investments undertakings (CIU) 0 0 0 0 0 0
Equity 0 0 0 9 9 9
Securitisation
Other exposures 0 0 0 0 0 0
Standardised Total2 0 2
(1) Original exposure, unlike Exposure value, is reported before taking into account any effect due to credit conversion factors or credit risk mitigation techniques (e.g. substitution effects).
(2) Total value adjustments and provisions per country of counterparty does not include Securistisation exposures
5 (mln EUR, %)
Central governments or central banks 0 0 0 0 0 0
Regional governments or local authorities 0 0 0 0 0 0
Public sector entities 0 0 0 0 0 0
Multilateral Development Banks 0 0 0 0 0 0
International Organisations 0 0 0 0 0 0
Institutions 0 0 0 577 247 49
Corporates 0 0 0 292 242 242
of which: SME 0 0 0 0 0 0
Retail 0 0 0 0 0 0
of which: SME 0 0 0 0 0 0
Secured by mortgages on immovable property 0 0 0 0 0 0
of which: SME 0 0 0 0 0 0
Exposures in default 0 0 0 0 0 0 0 0
Items associated with particularly high risk 0 0 0 0 0 0
Covered bonds 0 0 0 134 134 13
Claims on institutions and corporates with a ST credit assessment 0 0 0 0 0 0
Collective investments undertakings (CIU) 0 0 0 0 0 0
Equity 0 0 0 15 15 15
Securitisation
Other exposures 0 0 0 0 0 0
Standardised Total2 0 0
(1) Original exposure, unlike Exposure value, is reported before taking into account any effect due to credit conversion factors or credit risk mitigation techniques (e.g. substitution effects).
(2) Total value adjustments and provisions per country of counterparty does not include Securistisation exposures
6 (mln EUR, %)
Central governments or central banks 0 0 0 78 78 0
Regional governments or local authorities 0 0 0 0 0 0
Public sector entities 0 0 0 0 0 0
Multilateral Development Banks 0 0 0 0 0 0
International Organisations 0 0 0 0 0 0
Institutions 0 0 0 455 335 68
Corporates 0 0 0 68 66 66
of which: SME 0 0 0 0 0 0
Retail 0 0 0 0 0 0
of which: SME 0 0 0 0 0 0
Secured by mortgages on immovable property 0 0 0 0 0 0
of which: SME 0 0 0 0 0 0
Exposures in default 0 0 0 0 0 0 0 0
Items associated with particularly high risk 0 0 0 0 0 0
Covered bonds 0 0 0 175 175 18
Claims on institutions and corporates with a ST credit assessment 0 0 0 0 0 0
Collective investments undertakings (CIU) 0 0 0 0 0 0
Equity 0 0 0 6 6 6
Securitisation
Other exposures 0 0 0 0 0 0
Standardised Total2 0 0
(1) Original exposure, unlike Exposure value, is reported before taking into account any effect due to credit conversion factors or credit risk mitigation techniques (e.g. substitution effects).
(2) Total value adjustments and provisions per country of counterparty does not include Securistisation exposures
7 (mln EUR, %)
Central governments or central banks 0 0 0 0 0 0
Regional governments or local authorities 0 0 0 0 0 0
Public sector entities 0 0 0 0 0 0
Multilateral Development Banks 0 0 0 0 0 0
International Organisations 0 0 0 0 0 0
Institutions 0 0 0 0 0 0
Corporates 0 0 0 0 0 0
of which: SME 0 0 0 0 0 0
Retail 0 0 0 0 0 0
of which: SME 0 0 0 0 0 0
Secured by mortgages on immovable property 0 0 0 0 0 0
of which: SME 0 0 0 0 0 0
Exposures in default 0 0 0 0 0 0 0 0
Items associated with particularly high risk 0 0 0 0 0 0
Covered bonds 0 0 0 0 0 0
Claims on institutions and corporates with a ST credit assessment 0 0 0 0 0 0
Collective investments undertakings (CIU) 0 0 0 0 0 0
Equity 0 0 0 0 0 0
Securitisation
Other exposures 0 0 0 0 0 0
Standardised Total2 0 0
(1) Original exposure, unlike Exposure value, is reported before taking into account any effect due to credit conversion factors or credit risk mitigation techniques (e.g. substitution effects).
(2) Total value adjustments and provisions per country of counterparty does not include Securistisation exposures
Standardised Approach
As of 31/12/2016 As of 30/06/2017
Risk exposure
amount
Value
adjustments and
provisions2
UNITED STATES
Standardised Approach
As of 31/12/2016 As of 30/06/2017
Original
Exposure1
Exposure
Value1
Risk exposure
amount
Value
adjustments and
provisions2
Original
Exposure1
Exposure
Value1
Risk exposure
amount
Value
adjustments and
provisions2
NETHERLANDS
Standardised Approach
As of 31/12/2016 As of 30/06/2017
Original
Exposure1
Exposure
Value1
Risk exposure
amount
Value
adjustments and
provisions2
Original
Exposure1
Exposure
Value1
Risk exposure
amount
Value
adjustments and
provisions2
GERMANY
Standardised Approach
As of 31/12/2016 As of 30/06/2017
Original
Exposure1
Exposure
Value1
Risk exposure
amount
Value
adjustments and
provisions2
Original
Exposure1
Exposure
Value1
Risk exposure
amount
Value
adjustments and
provisions2
Country of
Counterpart 7
Original
Exposure1
Exposure
Value1
Risk exposure
amount
Value
adjustments and
provisions2
Original
Exposure1
Exposure
Value1

2017 EU-wide Transparency Exercise
Credit Risk - Standardised Approach
BPER Banca S.p.A.
8 (mln EUR, %)
Central governments or central banks 0 0 0 0 0 0
Regional governments or local authorities 0 0 0 0 0 0
Public sector entities 0 0 0 0 0 0
Multilateral Development Banks 0 0 0 0 0 0
International Organisations 0 0 0 0 0 0
Institutions 0 0 0 0 0 0
Corporates 0 0 0 0 0 0
of which: SME 0 0 0 0 0 0
Retail 0 0 0 0 0 0
of which: SME 0 0 0 0 0 0
Secured by mortgages on immovable property 0 0 0 0 0 0
of which: SME 0 0 0 0 0 0
Exposures in default 0 0 0 0 0 0 0 0
Items associated with particularly high risk 0 0 0 0 0 0
Covered bonds 0 0 0 0 0 0
Claims on institutions and corporates with a ST credit assessment 0 0 0 0 0 0
Collective investments undertakings (CIU) 0 0 0 0 0 0
Equity 0 0 0 0 0 0
Securitisation
Other exposures 0 0 0 0 0 0
Standardised Total2 0 0
(1) Original exposure, unlike Exposure value, is reported before taking into account any effect due to credit conversion factors or credit risk mitigation techniques (e.g. substitution effects).
(2) Total value adjustments and provisions per country of counterparty does not include Securistisation exposures
9 (mln EUR, %)
Central governments or central banks 0 0 0 0 0 0
Regional governments or local authorities 0 0 0 0 0 0
Public sector entities 0 0 0 0 0 0
Multilateral Development Banks 0 0 0 0 0 0
International Organisations 0 0 0 0 0 0
Institutions 0 0 0 0 0 0
Corporates 0 0 0 0 0 0
of which: SME 0 0 0 0 0 0
Retail 0 0 0 0 0 0
of which: SME 0 0 0 0 0 0
Secured by mortgages on immovable property 0 0 0 0 0 0
of which: SME 0 0 0 0 0 0
Exposures in default 0 0 0 0 0 0 0 0
Items associated with particularly high risk 0 0 0 0 0 0
Covered bonds 0 0 0 0 0 0
Claims on institutions and corporates with a ST credit assessment 0 0 0 0 0 0
Collective investments undertakings (CIU) 0 0 0 0 0 0
Equity 0 0 0 0 0 0
Securitisation
Other exposures 0 0 0 0 0 0
Standardised Total2 0 0
(1) Original exposure, unlike Exposure value, is reported before taking into account any effect due to credit conversion factors or credit risk mitigation techniques (e.g. substitution effects).
(2) Total value adjustments and provisions per country of counterparty does not include Securistisation exposures
10 (mln EUR, %)
Central governments or central banks 0 0 0 0 0 0
Regional governments or local authorities 0 0 0 0 0 0
Public sector entities 0 0 0 0 0 0
Multilateral Development Banks 0 0 0 0 0 0
International Organisations 0 0 0 0 0 0
Institutions 0 0 0 0 0 0
Corporates 0 0 0 0 0 0
of which: SME 0 0 0 0 0 0
Retail 0 0 0 0 0 0
of which: SME 0 0 0 0 0 0
Secured by mortgages on immovable property 0 0 0 0 0 0
of which: SME 0 0 0 0 0 0
Exposures in default 0 0 0 0 0 0 0 0
Items associated with particularly high risk 0 0 0 0 0 0
Covered bonds 0 0 0 0 0 0
Claims on institutions and corporates with a ST credit assessment 0 0 0 0 0 0
Collective investments undertakings (CIU) 0 0 0 0 0 0
Equity 0 0 0 0 0 0
Securitisation
Other exposures 0 0 0 0 0 0
Standardised Total2 0 0
(1) Original exposure, unlike Exposure value, is reported before taking into account any effect due to credit conversion factors or credit risk mitigation techniques (e.g. substitution effects).
(2) Total value adjustments and provisions per country of counterparty does not include Securistisation exposures
Standardised Approach
As of 31/12/2016 As of 30/06/2017
Risk exposure
amount
Value
adjustments and
provisions2
Country of
Counterpart 8
Standardised Approach
As of 31/12/2016 As of 30/06/2017
Original
Exposure1
Exposure
Value1
Risk exposure
amount
Value
adjustments and
provisions2
Original
Exposure1
Exposure
Value1
Risk exposure
amount
Value
adjustments and
provisions2
Country of
Counterpart 9
Standardised Approach
As of 31/12/2016 As of 30/06/2017
Original
Exposure1
Exposure
Value1
Risk exposure
amount
Value
adjustments and
provisions2
Original
Exposure1
Exposure
Value1
Risk exposure
amount
Value
adjustments and
provisions2
Country of
Counterpart 10
Original
Exposure1
Exposure
Value1
Risk exposure
amount
Value
adjustments and
provisions2
Original
Exposure1
Exposure
Value1

201612 201612 201612 201612 201612 201612 201706 201706 201706 201706 201706 201706
(mln EUR, %)
Of which:
defaulted
Of which:
defaulted
Of which:
defaulted
Of which:
defaulted
Central banks and central governments 0 0 0 0 0 0 0 0 0 0 0 0
Institutions 0 0 0 0 0 0 0 0 0 0 0 0
Corporates 31,405 0 20,345 9,753 0 2,777 31,368 6,186 20,289 9,331 1,175 2,873
Corporates - Of Which: Specialised Lending 0 0 0 0 0 0 0 0 0 0 0 0
Corporates - Of Which: SME 16,508 0 11,858 3,986 0 2,149 16,214 4,753 11,682 3,734 868 2,255
Retail 21,430 0 19,144 3,334 0 1,632 21,689 2,925 19,450 3,141 757 1,646
Retail - Secured on real estate property 11,929 0 11,914 1,826 0 529 12,240 1,408 12,224 1,707 387 566
Retail - Secured on real estate property - Of Which: SME 3,245 0 3,234 566 0 307 3,238 930 3,225 533 139 344
Retail - Secured on real estate property - Of Which: non-
SME
8,684 0 8,680 1,259 0 222 9,002 479 8,999 1,174 249 222
Retail - Qualifying Revolving 0 0 0 0 0 0 0 0 0 0 0 0
Retail - Other Retail 9,501 0 7,230 1,508 0 1,103 9,448 1,516 7,226 1,434 370 1,080
Retail - Other Retail - Of Which: SME 6,492 0 3,769 897 0 899 6,259 1,284 3,652 839 301 889
Retail - Other Retail - Of Which: non-SME 3,009 0 3,461 611 0 204 3,189 232 3,573 595 69 191
Equity 0 0 0 0 0 0 0 0 0 0
Securitisation 0 0 0 0 0 0 0 0
Other non credit-obligation assets 1,044 1,050
IRB Total 14,130 13,522(1)
Original exposure, unlike Exposure value, is reported before taking into account any effect due to credit conversion factors or credit risk mitigation techniques (e.g. substitution effects).
1 (mln EUR, %)
Of which:
defaulted
Of which:
defaulted
Of which:
defaulted
Of which:
defaulted
Central banks and central governments 0 0 0 0 0 0 0 0 0 0 0 0
Institutions 0 0 0 0 0 0 0 0 0 0 0 0
Corporates 0 0 0 0 0 0 31,230 6,145 20,158 9,211 1,164 2,849
Corporates - Of Which: Specialised Lending 0 0 0 0 0 0 0 0 0 0 0 0
Corporates - Of Which: SME 0 0 0 0 0 0 16,181 4,723 11,649 3,725 860 2,235
Retail 0 0 0 0 0 0 21,651 2,922 19,415 3,132 756 1,644
Retail - Secured on real estate property 0 0 0 0 0 0 12,210 1,407 12,195 1,699 386 565
Retail - Secured on real estate property - Of Which: SME 0 0 0 0 0 0 3,237 929 3,225 533 139 344
Retail - Secured on real estate property - Of Which: non-
SME
0 0 0 0 0 0 8,973 477 8,970 1,166 248 221
Retail - Qualifying Revolving 0 0 0 0 0 0 0 0 0 0 0 0
Retail - Other Retail 0 0 0 0 0 0 9,441 1,516 7,220 1,433 370 1,079
Retail - Other Retail - Of Which: SME 0 0 0 0 0 0 6,259 1,284 3,652 839 301 886
Retail - Other Retail - Of Which: non-SME 0 0 0 0 0 0 3,182 231 3,568 594 68 193
Equity 0 0 0 0 0 0 0 0 0 0 0 0
Securitisation
Other non credit-obligation assets
IRB Total(1)
Original exposure, unlike Exposure value, is reported before taking into account any effect due to credit conversion factors or credit risk mitigation techniques (e.g. substitution effects).
2 (mln EUR, %)
Of which:
defaulted
Of which:
defaulted
Of which:
defaulted
Of which:
defaulted
Central banks and central governments 0 0 0 0 0 0 0 0 0 0 0 0
Institutions 0 0 0 0 0 0 0 0 0 0 0 0
Corporates 0 0 0 0 0 0 0 0 0 0 0 0
Corporates - Of Which: Specialised Lending 0 0 0 0 0 0 0 0 0 0 0 0
Corporates - Of Which: SME 0 0 0 0 0 0 0 0 0 0 0 0
Retail 0 0 0 0 0 0 2 0 2 1 0 0
Retail - Secured on real estate property 0 0 0 0 0 0 2 0 1 0 0 0
Retail - Secured on real estate property - Of Which: SME 0 0 0 0 0 0 0 0 0 0 0 0
Retail - Secured on real estate property - Of Which: non-
SME
0 0 0 0 0 0 2 0 1 0 0 0
Retail - Qualifying Revolving 0 0 0 0 0 0 0 0 0 0 0 0
Retail - Other Retail 0 0 0 0 0 0 1 0 0 0 0 0
Retail - Other Retail - Of Which: SME 0 0 0 0 0 0 0 0 0 0 0 0
Retail - Other Retail - Of Which: non-SME 0 0 0 0 0 0 1 0 0 0 0 0
Equity 0 0 0 0 0 0 0 0 0 0 0 0
Securitisation
Other non credit-obligation assets
IRB Total(1)
Original exposure, unlike Exposure value, is reported before taking into account any effect due to credit conversion factors or credit risk mitigation techniques (e.g. substitution effects).
3 (mln EUR, %)
Of which:
defaulted
Of which:
defaulted
Of which:
defaulted
Of which:
defaulted
Central banks and central governments 0 0 0 0 0 0 0 0 0 0 0 0
Institutions 0 0 0 0 0 0 0 0 0 0 0 0
Corporates 0 0 0 0 0 0 6 6 6 2 2 5
Corporates - Of Which: Specialised Lending 0 0 0 0 0 0 0 0 0 0 0 0
Corporates - Of Which: SME 0 0 0 0 0 0 6 6 6 2 2 5
Retail 0 0 0 0 0 0 6 0 6 1 0 0
Retail - Secured on real estate property 0 0 0 0 0 0 6 0 6 1 0 0
Retail - Secured on real estate property - Of Which: SME 0 0 0 0 0 0 0 0 0 0 0 0
Retail - Secured on real estate property - Of Which: non-
SME
0 0 0 0 0 0 5 0 5 1 0 0
Retail - Qualifying Revolving 0 0 0 0 0 0 0 0 0 0 0 0
Retail - Other Retail 0 0 0 0 0 0 0 0 0 0 0 0
Retail - Other Retail - Of Which: SME 0 0 0 0 0 0 0 0 0 0 0 0
Retail - Other Retail - Of Which: non-SME 0 0 0 0 0 0 0 0 0 0 0 0
Equity 0 0 0 0 0 0 0 0 0 0 0 0
Securitisation
Other non credit-obligation assets
IRB Total(1)
Original exposure, unlike Exposure value, is reported before taking into account any effect due to credit conversion factors or credit risk mitigation techniques (e.g. substitution effects).
2017 EU-wide Transparency Exercise
Credit Risk - IRB Approach
BPER Banca S.p.A.
IRB Approach
As of 31/12/2016 As of 30/06/2017
Risk exposure amount Value
adjustments
and
provisions
Consolidated data
IRB Approach
As of 31/12/2016 As of 30/06/2017
Original Exposure1
Exposure
Value1
Risk exposure amount Value
adjustments
and
provisions
Original Exposure1
Exposure
Value1
Risk exposure amount Value
adjustments
and
provisions
ITALY
IRB Approach
As of 31/12/2016 As of 30/06/2017
Original Exposure1
Exposure
Value1
Risk exposure amount Value
adjustments
and
provisions
Original Exposure1
Exposure
Value1
Risk exposure amount Value
adjustments
and
provisions
FRANCE
IRB Approach
As of 31/12/2016 As of 30/06/2017
Original Exposure1
Exposure
Value1
Risk exposure amount Value
adjustments
and
provisions
Original Exposure1
Exposure
Value1
Risk exposure amount Value
adjustments
and
provisions
UNITED KINGDOM
Original Exposure1
Exposure
Value1
Risk exposure amount Value
adjustments
and
provisions
Original Exposure1
Exposure
Value1

2017 EU-wide Transparency Exercise
Credit Risk - IRB Approach
BPER Banca S.p.A.
4 (mln EUR, %)
Of which:
defaulted
Of which:
defaulted
Of which:
defaulted
Of which:
defaulted
Central banks and central governments 0 0 0 0 0 0 0 0 0 0 0 0
Institutions 0 0 0 0 0 0 0 0 0 0 0 0
Corporates 0 0 0 0 0 0 0 0 0 0 0 0
Corporates - Of Which: Specialised Lending 0 0 0 0 0 0 0 0 0 0 0 0
Corporates - Of Which: SME 0 0 0 0 0 0 0 0 0 0 0 0
Retail 0 0 0 0 0 0 3 0 3 1 0 0
Retail - Secured on real estate property 0 0 0 0 0 0 2 0 3 0 0 0
Retail - Secured on real estate property - Of Which: SME 0 0 0 0 0 0 0 0 0 0 0 0
Retail - Secured on real estate property - Of Which: non-
SME
0 0 0 0 0 0 2 0 3 0 0 0
Retail - Qualifying Revolving 0 0 0 0 0 0 0 0 0 0 0 0
Retail - Other Retail 0 0 0 0 0 0 0 0 0 0 0 0
Retail - Other Retail - Of Which: SME 0 0 0 0 0 0 0 0 0 0 0 0
Retail - Other Retail - Of Which: non-SME 0 0 0 0 0 0 0 0 0 0 0 0
Equity 0 0 0 0 0 0 0 0 0 0 0 0
Securitisation
Other non credit-obligation assets
IRB Total(1)
Original exposure, unlike Exposure value, is reported before taking into account any effect due to credit conversion factors or credit risk mitigation techniques (e.g. substitution effects).
5 (mln EUR, %)
Of which:
defaulted
Of which:
defaulted
Of which:
defaulted
Of which:
defaulted
Central banks and central governments 0 0 0 0 0 0 0 0 0 0 0 0
Institutions 0 0 0 0 0 0 0 0 0 0 0 0
Corporates 0 0 0 0 0 0 0 0 0 0 0 0
Corporates - Of Which: Specialised Lending 0 0 0 0 0 0 0 0 0 0 0 0
Corporates - Of Which: SME 0 0 0 0 0 0 0 0 0 0 0 0
Retail 0 0 0 0 0 0 0 0 0 0 0 0
Retail - Secured on real estate property 0 0 0 0 0 0 0 0 0 0 0 0
Retail - Secured on real estate property - Of Which: SME 0 0 0 0 0 0 0 0 0 0 0 0
Retail - Secured on real estate property - Of Which: non-
SME
0 0 0 0 0 0 0 0 0 0 0 0
Retail - Qualifying Revolving 0 0 0 0 0 0 0 0 0 0 0 0
Retail - Other Retail 0 0 0 0 0 0 0 0 0 0 0 0
Retail - Other Retail - Of Which: SME 0 0 0 0 0 0 0 0 0 0 0 0
Retail - Other Retail - Of Which: non-SME 0 0 0 0 0 0 0 0 0 0 0 0
Equity 0 0 0 0 0 0 0 0 0 0 0 0
Securitisation
Other non credit-obligation assets
IRB Total(1)
Original exposure, unlike Exposure value, is reported before taking into account any effect due to credit conversion factors or credit risk mitigation techniques (e.g. substitution effects).
6 (mln EUR, %)
Of which:
defaulted
Of which:
defaulted
Of which:
defaulted
Of which:
defaulted
Central banks and central governments 0 0 0 0 0 0 0 0 0 0 0 0
Institutions 0 0 0 0 0 0 0 0 0 0 0 0
Corporates 0 0 0 0 0 0 0 0 0 0 0 0
Corporates - Of Which: Specialised Lending 0 0 0 0 0 0 0 0 0 0 0 0
Corporates - Of Which: SME 0 0 0 0 0 0 0 0 0 0 0 0
Retail 0 0 0 0 0 0 2 0 3 1 0 0
Retail - Secured on real estate property 0 0 0 0 0 0 2 0 2 1 0 0
Retail - Secured on real estate property - Of Which: SME 0 0 0 0 0 0 0 0 0 0 0 0
Retail - Secured on real estate property - Of Which: non-
SME
0 0 0 0 0 0 2 0 2 1 0 0
Retail - Qualifying Revolving 0 0 0 0 0 0 0 0 0 0 0 0
Retail - Other Retail 0 0 0 0 0 0 0 0 0 0 0 0
Retail - Other Retail - Of Which: SME 0 0 0 0 0 0 0 0 0 0 0 0
Retail - Other Retail - Of Which: non-SME 0 0 0 0 0 0 0 0 0 0 0 0
Equity 0 0 0 0 0 0 0 0 0 0 0 0
Securitisation
Other non credit-obligation assets
IRB Total(1)
Original exposure, unlike Exposure value, is reported before taking into account any effect due to credit conversion factors or credit risk mitigation techniques (e.g. substitution effects).
7 (mln EUR, %)
Of which:
defaulted
Of which:
defaulted
Of which:
defaulted
Of which:
defaulted
Central banks and central governments 0 0 0 0 0 0 0 0 0 0 0 0
Institutions 0 0 0 0 0 0 0 0 0 0 0 0
Corporates 0 0 0 0 0 0 0 0 0 0 0 0
Corporates - Of Which: Specialised Lending 0 0 0 0 0 0 0 0 0 0 0 0
Corporates - Of Which: SME 0 0 0 0 0 0 0 0 0 0 0 0
Retail 0 0 0 0 0 0 0 0 0 0 0 0
Retail - Secured on real estate property 0 0 0 0 0 0 0 0 0 0 0 0
Retail - Secured on real estate property - Of Which: SME 0 0 0 0 0 0 0 0 0 0 0 0
Retail - Secured on real estate property - Of Which: non-
SME
0 0 0 0 0 0 0 0 0 0 0 0
Retail - Qualifying Revolving 0 0 0 0 0 0 0 0 0 0 0 0
Retail - Other Retail 0 0 0 0 0 0 0 0 0 0 0 0
Retail - Other Retail - Of Which: SME 0 0 0 0 0 0 0 0 0 0 0 0
Retail - Other Retail - Of Which: non-SME 0 0 0 0 0 0 0 0 0 0 0 0
Equity 0 0 0 0 0 0 0 0 0 0 0 0
Securitisation
Other non credit-obligation assets
IRB Total(1)
Original exposure, unlike Exposure value, is reported before taking into account any effect due to credit conversion factors or credit risk mitigation techniques (e.g. substitution effects).
IRB Approach
As of 31/12/2016 As of 30/06/2017
Risk exposure amount Value
adjustments
and
provisions
UNITED STATES
IRB Approach
As of 31/12/2016 As of 30/06/2017
Original Exposure1
Exposure
Value1
Risk exposure amount Value
adjustments
and
provisions
Original Exposure1
Exposure
Value1
Risk exposure amount Value
adjustments
and
provisions
NETHERLANDS
IRB Approach
As of 31/12/2016 As of 30/06/2017
Original Exposure1
Exposure
Value1
Risk exposure amount Value
adjustments
and
provisions
Original Exposure1
Exposure
Value1
Risk exposure amount Value
adjustments
and
provisions
GERMANY
IRB Approach
As of 31/12/2016 As of 30/06/2017
Original Exposure1
Exposure
Value1
Risk exposure amount Value
adjustments
and
provisions
Original Exposure1
Exposure
Value1
Risk exposure amount Value
adjustments
and
provisions
Country of Counterpart 7
Original Exposure1
Exposure
Value1
Risk exposure amount Value
adjustments
and
provisions
Original Exposure1
Exposure
Value1

2017 EU-wide Transparency Exercise
Credit Risk - IRB Approach
BPER Banca S.p.A.
8 (mln EUR, %)
Of which:
defaulted
Of which:
defaulted
Of which:
defaulted
Of which:
defaulted
Central banks and central governments 0 0 0 0 0 0 0 0 0 0 0 0
Institutions 0 0 0 0 0 0 0 0 0 0 0 0
Corporates 0 0 0 0 0 0 0 0 0 0 0 0
Corporates - Of Which: Specialised Lending 0 0 0 0 0 0 0 0 0 0 0 0
Corporates - Of Which: SME 0 0 0 0 0 0 0 0 0 0 0 0
Retail 0 0 0 0 0 0 0 0 0 0 0 0
Retail - Secured on real estate property 0 0 0 0 0 0 0 0 0 0 0 0
Retail - Secured on real estate property - Of Which: SME 0 0 0 0 0 0 0 0 0 0 0 0
Retail - Secured on real estate property - Of Which: non-
SME
0 0 0 0 0 0 0 0 0 0 0 0
Retail - Qualifying Revolving 0 0 0 0 0 0 0 0 0 0 0 0
Retail - Other Retail 0 0 0 0 0 0 0 0 0 0 0 0
Retail - Other Retail - Of Which: SME 0 0 0 0 0 0 0 0 0 0 0 0
Retail - Other Retail - Of Which: non-SME 0 0 0 0 0 0 0 0 0 0 0 0
Equity 0 0 0 0 0 0 0 0 0 0 0 0
Securitisation
Other non credit-obligation assets
IRB Total(1)
Original exposure, unlike Exposure value, is reported before taking into account any effect due to credit conversion factors or credit risk mitigation techniques (e.g. substitution effects).
9 (mln EUR, %)
Of which:
defaulted
Of which:
defaulted
Of which:
defaulted
Of which:
defaulted
Central banks and central governments 0 0 0 0 0 0 0 0 0 0 0 0
Institutions 0 0 0 0 0 0 0 0 0 0 0 0
Corporates 0 0 0 0 0 0 0 0 0 0 0 0
Corporates - Of Which: Specialised Lending 0 0 0 0 0 0 0 0 0 0 0 0
Corporates - Of Which: SME 0 0 0 0 0 0 0 0 0 0 0 0
Retail 0 0 0 0 0 0 0 0 0 0 0 0
Retail - Secured on real estate property 0 0 0 0 0 0 0 0 0 0 0 0
Retail - Secured on real estate property - Of Which: SME 0 0 0 0 0 0 0 0 0 0 0 0
Retail - Secured on real estate property - Of Which: non-
SME
0 0 0 0 0 0 0 0 0 0 0 0
Retail - Qualifying Revolving 0 0 0 0 0 0 0 0 0 0 0 0
Retail - Other Retail 0 0 0 0 0 0 0 0 0 0 0 0
Retail - Other Retail - Of Which: SME 0 0 0 0 0 0 0 0 0 0 0 0
Retail - Other Retail - Of Which: non-SME 0 0 0 0 0 0 0 0 0 0 0 0
Equity 0 0 0 0 0 0 0 0 0 0 0 0
Securitisation
Other non credit-obligation assets
IRB Total(1)
Original exposure, unlike Exposure value, is reported before taking into account any effect due to credit conversion factors or credit risk mitigation techniques (e.g. substitution effects).
10 (mln EUR, %)
Of which:
defaulted
Of which:
defaulted
Of which:
defaulted
Of which:
defaulted
Central banks and central governments 0 0 0 0 0 0 0 0 0 0 0 0
Institutions 0 0 0 0 0 0 0 0 0 0 0 0
Corporates 0 0 0 0 0 0 0 0 0 0 0 0
Corporates - Of Which: Specialised Lending 0 0 0 0 0 0 0 0 0 0 0 0
Corporates - Of Which: SME 0 0 0 0 0 0 0 0 0 0 0 0
Retail 0 0 0 0 0 0 0 0 0 0 0 0
Retail - Secured on real estate property 0 0 0 0 0 0 0 0 0 0 0 0
Retail - Secured on real estate property - Of Which: SME 0 0 0 0 0 0 0 0 0 0 0 0
Retail - Secured on real estate property - Of Which: non-
SME
0 0 0 0 0 0 0 0 0 0 0 0
Retail - Qualifying Revolving 0 0 0 0 0 0 0 0 0 0 0 0
Retail - Other Retail 0 0 0 0 0 0 0 0 0 0 0 0
Retail - Other Retail - Of Which: SME 0 0 0 0 0 0 0 0 0 0 0 0
Retail - Other Retail - Of Which: non-SME 0 0 0 0 0 0 0 0 0 0 0 0
Equity 0 0 0 0 0 0 0 0 0 0 0 0
Securitisation
Other non credit-obligation assets
IRB Total(1)
Original exposure, unlike Exposure value, is reported before taking into account any effect due to credit conversion factors or credit risk mitigation techniques (e.g. substitution effects).
IRB Approach
As of 31/12/2016 As of 30/06/2017
Risk exposure amount Value
adjustments
and
provisions
Country of Counterpart 8
IRB Approach
As of 31/12/2016 As of 30/06/2017
Original Exposure1
Exposure
Value1
Risk exposure amount Value
adjustments
and
provisions
Original Exposure1
Exposure
Value1
Risk exposure amount Value
adjustments
and
provisions
Country of Counterpart 9
IRB Approach
As of 31/12/2016 As of 30/06/2017
Original Exposure1
Exposure
Value1
Risk exposure amount Value
adjustments
and
provisions
Original Exposure1
Exposure
Value1
Risk exposure amount Value
adjustments
and
provisions
Country of Counterpart 10
Original Exposure1
Exposure
Value1
Risk exposure amount Value
adjustments
and
provisions
Original Exposure1
Exposure
Value1
201612 201612 201612 201612 201612 201612 201612 201612 201612 201612 201612 201612 201612 201612 201612 201612 201612 201612
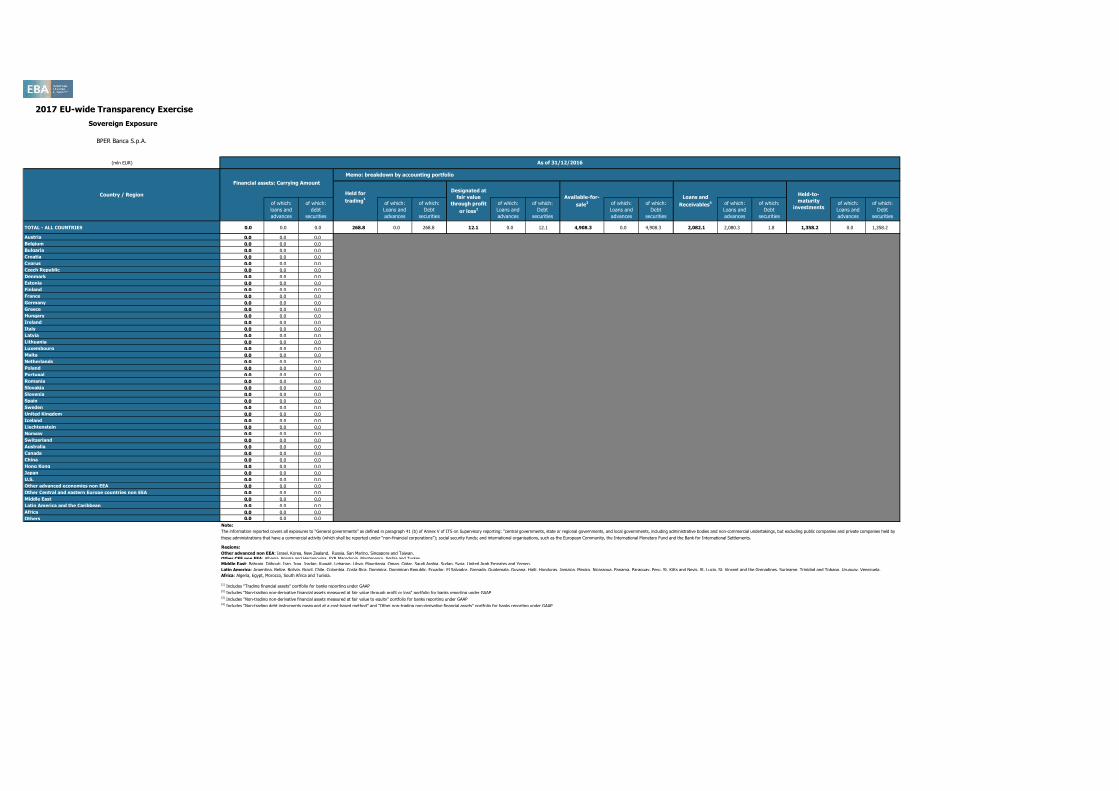
2017 EU-wide Transparency Exercise
Sovereign Exposure
BPER Banca S.p.A.
(mln EUR)
of which:
loans and
advances
of which:
debt
securities
of which:
Loans and
advances
of which:
Debt
securities
of which:
Loans and
advances
of which:
Debt
securities
of which:
Loans and
advances
of which:
Debt
securities
of which:
Loans and
advances
of which:
Debt
securities
of which:
Loans and
advances
of which:
Debt
securities
TOTAL - ALL COUNTRIES 0.0 0.0 0.0 268.8 0.0 268.8 12.1 0.0 12.1 4,908.3 0.0 4,908.3 2,082.1 2,080.3 1.8 1,358.2 0.0 1,358.2
Austria 0.0 0.0 0.0
Belgium 0.0 0.0 0.0
Bulgaria 0.0 0.0 0.0
Croatia 0.0 0.0 0.0
Cyprus 0.0 0.0 0.0
Czech Republic 0.0 0.0 0.0
Denmark 0.0 0.0 0.0
Estonia 0.0 0.0 0.0
Finland 0.0 0.0 0.0
France 0.0 0.0 0.0
Germany 0.0 0.0 0.0
Greece 0.0 0.0 0.0
Hungary 0.0 0.0 0.0
Ireland 0.0 0.0 0.0
Italy 0.0 0.0 0.0
Latvia 0.0 0.0 0.0
Lithuania 0.0 0.0 0.0
Luxembourg 0.0 0.0 0.0
Malta 0.0 0.0 0.0
Netherlands 0.0 0.0 0.0
Poland 0.0 0.0 0.0
Portugal 0.0 0.0 0.0
Romania 0.0 0.0 0.0
Slovakia 0.0 0.0 0.0
Slovenia 0.0 0.0 0.0
Spain 0.0 0.0 0.0
Sweden 0.0 0.0 0.0
United Kingdom 0.0 0.0 0.0
Iceland 0.0 0.0 0.0
Liechtenstein 0.0 0.0 0.0
Norway 0.0 0.0 0.0
Switzerland 0.0 0.0 0.0
Australia 0.0 0.0 0.0
Canada 0.0 0.0 0.0
China 0.0 0.0 0.0
Hong Kong 0.0 0.0 0.0
Japan 0.0 0.0 0.0
U.S. 0.0 0.0 0.0
Other advanced economies non EEA 0.0 0.0 0.0
Other Central and eastern Europe countries non EEA 0.0 0.0 0.0
Middle East 0.0 0.0 0.0
Latin America and the Caribbean 0.0 0.0 0.0
Africa 0.0 0.0 0.0
Others 0.0 0.0 0.0
Note:
The information reported covers all exposures to “General governments” as defined in paragraph 41 (b) of Annex V of ITS on Supervisory reporting: “central governments, state or regional governments, and local governments, including administrative bodies and non-commercial undertakings, but excluding public companies and private companies held by
these administrations that have a commercial activity (which shall be reported under “non-financial corporations”); social security funds; and international organisations, such as the European Community, the International Monetary Fund and the Bank for International Settlements.
Regions:
Other advanced non EEA: Israel, Korea, New Zealand, Russia, San Marino, Singapore and Taiwan.
Other CEE non EEA: Albania, Bosnia and Herzegovina, FYR Macedonia, Montenegro, Serbia and Turkey.
Middle East: Bahrain, Djibouti, Iran, Iraq, Jordan, Kuwait, Lebanon, Libya, Mauritania, Oman, Qatar, Saudi Arabia, Sudan, Syria, United Arab Emirates and Yemen.
Latin America: Argentina, Belize, Bolivia, Brazil, Chile, Colombia, Costa Rica, Dominica, Dominican Republic, Ecuador, El Salvador, Grenada, Guatemala, Guyana, Haiti, Honduras, Jamaica, Mexico, Nicaragua, Panama, Paraguay, Peru, St. Kitts and Nevis, St. Lucia, St. Vincent and the Grenadines, Suriname, Trinidad and Tobago, Uruguay, Venezuela.
Africa: Algeria, Egypt, Morocco, South Africa and Tunisia.
(1) Includes "Trading financial assets" portfolio for banks reporting under GAAP(2) Includes "Non-trading non-derivative financial assets measured at fair value through profit or loss" portfolio for banks reporting under GAAP(3) Includes "Non-trading non-derivative financial assets measured at fair value to equity" portfolio for banks reporting under GAAP(4) Includes "Non-trading debt instruments measured at a cost-based method" and "Other non-trading non-derivative financial assets" portfolio for banks reporting under GAAP
As of 31/12/2016
Country / Region
Financial assets: Carrying Amount
Memo: breakdown by accounting portfolio
Held for
trading1
Designated at
fair value
through profit
or loss2
Available-for-
sale3
Loans and
Receivables4
Held-to-
maturity
investments

2017 EU-wide Transparency Exercise
Sovereign Exposure
BPER Banca S.p.A.
(mln EUR)
TOTAL - ALL COUNTRIES
Austria
Belgium
Bulgaria
Croatia
Cyprus
Czech Republic
Denmark
Estonia
Finland
France
Germany
Greece
Hungary
Ireland
Italy
Latvia
Lithuania
Luxembourg
Malta
Netherlands
Poland
Portugal
Romania
Slovakia
Slovenia
Spain
Sweden
United Kingdom
Iceland
Liechtenstein
Norway
Switzerland
Australia
Canada
China
Hong Kong
Japan
U.S.
Other advanced economies non EEA
Other Central and eastern Europe countries non EEA
Middle East
Latin America and the Caribbean
Africa
Others
Country / Region
201706 201706 201706 201706 201706 201706 201706 201706 201706 201706 201706 201706 201706 201706 201706 201706 201706 201706
of which:
loans and
advances
of which:
debt
securities
of which:
Loans and
advances
of which:
Debt
securities
of which:
Loans and
advances
of which:
Debt
securities
of which:
Loans and
advances
of which:
Debt
securities
of which:
Loans and
advances
of which:
Debt
securities
of which:
Loans and
advances
of which:
Debt
securities
8,753.7 2,291.9 6,461.8 264.4 0.0 264.4 12.1 0.0 12.1 4,751.9 0.0 4,751.9 2,293.7 2,291.9 1.8 1,431.6 0.0 1,431.6
10.6 0.0 10.6
0.0 0.0 0.0
0.0 0.0 0.0
0.0 0.0 0.0
0.0 0.0 0.0
0.0 0.0 0.0
0.0 0.0 0.0
0.0 0.0 0.0
0.0 0.0 0.0
180.9 0.0 180.9
0.0 0.0 0.0
0.0 0.0 0.0
0.0 0.0 0.0
0.0 0.0 0.0
7,833.2 2,287.6 5,545.7
0.0 0.0 0.0
0.0 0.0 0.0
193.7 0.0 193.7
0.0 0.0 0.0
0.0 0.0 0.0
0.1 0.0 0.1
10.6 0.0 10.6
0.0 0.0 0.0
0.0 0.0 0.0
0.0 0.0 0.0
8.8 0.0 8.8
0.0 0.0 0.0
36.8 0.0 36.8
0.0 0.0 0.0
0.0 0.0 0.0
0.0 0.0 0.0
0.0 0.0 0.0
0.0 0.0 0.0
65.1 0.0 65.1
0.0 0.0 0.0
0.0 0.0 0.0
26.9 0.0 26.9
374.0 0.0 374.0
0.0 0.0 0.0
0.0 0.0 0.0
8.6 0.0 8.6
0.0 0.0 0.0
4.4 4.4 0.0
0.0 0.0 0.0
Note:
The information reported covers all exposures to “General governments” as defined in paragraph 41 (b) of Annex V of ITS on Supervisory reporting: “central governments, state or regional governments, and local governments, including administrative bodies and non-commercial undertakings, but excluding public companies and private companies held by
these administrations that have a commercial activity (which shall be reported under “non-financial corporations”); social security funds; and international organisations, such as the European Community, the International Monetary Fund and the Bank for International Settlements.
Regions:
Other advanced non EEA: Israel, Korea, New Zealand, Russia, San Marino, Singapore and Taiwan.
Other CEE non EEA: Albania, Bosnia and Herzegovina, FYR Macedonia, Montenegro, Serbia and Turkey.
Middle East: Bahrain, Djibouti, Iran, Iraq, Jordan, Kuwait, Lebanon, Libya, Mauritania, Oman, Qatar, Saudi Arabia, Sudan, Syria, United Arab Emirates and Yemen.
Latin America: Argentina, Belize, Bolivia, Brazil, Chile, Colombia, Costa Rica, Dominica, Dominican Republic, Ecuador, El Salvador, Grenada, Guatemala, Guyana, Haiti, Honduras, Jamaica, Mexico, Nicaragua, Panama, Paraguay, Peru, St. Kitts and Nevis, St. Lucia, St. Vincent and the Grenadines, Suriname, Trinidad and Tobago, Uruguay, Venezuela.
Africa: Algeria, Egypt, Morocco, South Africa and Tunisia.
(1) Includes "Trading financial assets" portfolio for banks reporting under GAAP(2) Includes "Non-trading non-derivative financial assets measured at fair value through profit or loss" portfolio for banks reporting under GAAP(3) Includes "Non-trading non-derivative financial assets measured at fair value to equity" portfolio for banks reporting under GAAP(4) Includes "Non-trading debt instruments measured at a cost-based method" and "Other non-trading non-derivative financial assets" portfolio for banks reporting under GAAP
As of 30/06/2017
Financial assets: Carrying Amount
Memo: breakdown by accounting portfolio
Held-to-
maturity
investments
Held for
trading1
Designated at
fair value
through profit
or loss2
Available-for-
sale3
Loans and
Receivables4

201612 201612 201612 201612 201612 201612 201612 201706 201706 201706 201706 201706 201706 201706
(mln EUR, %)
Of which:
defaulted
Of which:
defaulted
Debt securities (including at amortised cost and fair value) 12,765 0 1 1 0 0 0 14,001 0 1 1 0 0 0
Central banks 24 0 0 0 0 0 0 22 0 0 0 0 0 0
General governments 6,281 0 0 0 0 0 0 6,197 0 0 0 0 0 0
Credit institutions 4,618 0 0 0 0 0 0 5,526 0 0 0 0 0 0
Other financial corporations 1,450 0 0 0 0 0 0 1,708 0 0 0 0 0 0
Non-financial corporations 393 0 1 1 0 0 0 548 0 1 1 0 0 0
Loans and advances(including at amortised cost and fair value) 51,627 480 11,173 11,173 184 4,976 5,332 55,590 373 11,031 11,031 196 5,173 4,996
Central banks 589 0 0 0 0 0 0 2,512 0 0 0 0 0 0
General governments 2,086 11 6 6 5 1 5 2,304 1 27 27 11 2 8
Credit institutions 702 3 0 0 0 0 0 986 6 0 0 0 0 0
Other financial corporations 2,890 1 343 343 5 201 110 3,208 4 320 320 7 183 96
Non-financial corporations 29,611 249 8,618 8,618 139 3,752 4,195 29,578 187 8,522 8,522 133 3,948 3,946
of which: small and medium-sized enterprises at amortised cost 19,398 218 7,312 7,312 83 3,307 3,576 19,315 163 7,157 7,157 74 3,392 3,363
Households 15,749 215 2,205 2,205 34 1,023 1,022 17,002 176 2,161 2,161 45 1,040 946
DEBT INSTRUMENTS other than HFT 64,392 480 11,174 11,174 184 4,976 5,332 69,591 373 11,032 11,032 196 5,173 4,996
OFF-BALANCE SHEET EXPOSURES 19,379 448 448 14 43 106 20,530 479 479 14 37 90
(1) For the definition of non-performing exposures please refer to COMMISSION IMPLEMENTING REGULATION (EU) 2015/227 of 9 January 2015, ANNEX V, Part 2-Template related instructions, subtitle 29(2) Insitutions report here collective allowances for incurrred but not reported losses (instruments at amortised cost) and changes in fair value of performing exposures due to credit risk and provisions (instruments at fair value other than HFT)(3) Insitutions report here specific allowances for financial assets, individually and collectively estimated (instruments at amortised cost) and changes in fair value of NPE due to credit risk and provisions (instruments at fair value other than HFT)
2017 EU-wide Transparency ExercisePerforming and non-performing exposures
BPER Banca S.p.A.
As of 31/12/2016 As of 30/06/2017
On non-
performing
exposures3
Collaterals and
financial
guarantees
received on non-
performing
exposures
Of which
performing but
past due >30
days and <=90
days
Of which non-performing1
On performing
exposures2
On non-
performing
exposures3
Of which
performing but
past due >30
days and <=90
days
Of which non-performing1
On performing
exposures2
Gross carrying amount
Accumulated impairment,
accumulated changes in fair
value due to credit risk and
provisionsCollaterals and
financial
guarantees
received on non-
performing
exposures
Gross carrying amount
Accumulated impairment,
accumulated changes in fair
value due to credit risk and
provisions

201612 201612 201612 201612 201612 201706 201706 201706 201706 201706
(mln EUR, %)
Debt securities (including at amortised cost and fair value) 0 0 0 0 0 0 0 0 0 0
Central banks 0 0 0 0 0 0 0 0 0 0
General governments 0 0 0 0 0 0 0 0 0 0
Credit institutions 0 0 0 0 0 0 0 0 0 0
Other financial corporations 0 0 0 0 0 0 0 0 0 0
Non-financial corporations 0 0 0 0 0 0 0 0 0 0
Loans and advances (including at amortised cost and fair value) 3,606 2,694 730 714 2,518 3,639 2,743 820 808 2,431
Central banks 0 0 0 0 0 0 0 0 0 0
General governments 12 5 1 1 4 16 4 1 0 3
Credit institutions 0 0 0 0 0 0 0 0 0 0
Other financial corporations 134 120 38 38 77 130 120 39 39 70
Non-financial corporations 2,779 2,123 563 550 1,905 2,802 2,161 630 621 1,855
of which: small and medium-sized enterprises at amortised cost 2,053 1,597 434 425 1,513 2,075 1,618 482 476 1,482
Households 681 446 128 126 532 691 459 150 148 503
DEBT INSTRUMENTS other than HFT 3,606 2,694 730 714 2,518 3,639 2,743 820 808 2,431
Loan commitments given 128 60 0 0 1 116 59 0 0 1
(1) For the definition of forborne exposures please refer to COMMISSION IMPLEMENTING REGULATION (EU) 2015/227 of 9 January 2015, ANNEX V, Part 2-Template related instructions, subtitle 30
2017 EU-wide Transparency ExerciseForborne exposures
BPER Banca S.p.A.
As of 31/12/2016 As of 30/06/2017
Collateral and
financial
guarantees
received on
exposures with
forbearance
measures
Of which non-
performing
exposures with
forbearance
measures
Of which on non-
performing
exposures with
forbearance
measures
Of which non-
performing
exposures with
forbearance
measures
Of which on non-
performing
exposures with
forbearance
measures
Gross carrying amount of
exposures with forbearance
measures
Accumulated impairment,
accumulated changes in fair value
due to credit risk and provisions
for exposures with forbearance
measures
Collateral and
financial
guarantees
received on
exposures with
forbearance
measures
Gross carrying amount of
exposures with forbearance
measures
Accumulated impairment,
accumulated changes in fair value
due to credit risk and provisions
for exposures with forbearance
measures