Embed Size (px)
Citation preview
2017 Epidemiology Capacity Assessment Report
COUNCIL OF STATE AND TERRITORIAL EPIDEMIOLOGISTS

2
20
17
Ep
ide
mio
log
y C
ap
ac
ity A
ss
es
sm
en
t Re
po
rt
Table of ContentsT
ab
le o
f Co
nte
nts
Acknowledgments . . . . . . . . . . . . . . . . . . . . . . . . . . . . . . . . . . . . . . . . . . . . . . . . . 4
Summary: Key Findings of the 2017 Epidemiology
Capacity Assessment . . . . . . . . . . . . . . . . . . . . . . . . . . . . . . . . . . . . . . . . . . . . . 5
Executive Summary . . . . . . . . . . . . . . . . . . . . . . . . . . . . . . . . . . . . . . . . . . . . . . . . 7
Background . . . . . . . . . . . . . . . . . . . . . . . . . . . . . . . . . . . . . . . . . . . . . . . . . . . . 8
Methods . . . . . . . . . . . . . . . . . . . . . . . . . . . . . . . . . . . . . . . . . . . . . . . . . . . . . . . 8
Results and conclusions . . . . . . . . . . . . . . . . . . . . . . . . . . . . . . . . . . . . . . . . . . . 9
Key Findings . . . . . . . . . . . . . . . . . . . . . . . . . . . . . . . . . . . . . . . . . . . . . . . . . . . . 9
Numbers of epidemiologists . . . . . . . . . . . . . . . . . . . . . . . . . . . . . . . . . . . . . 9
EPHS capacity . . . . . . . . . . . . . . . . . . . . . . . . . . . . . . . . . . . . . . . . . . . . . . . 9
Training and the Applied Epidemiology Competencies . . . . . . . . . . . . . . . . 10
Funding . . . . . . . . . . . . . . . . . . . . . . . . . . . . . . . . . . . . . . . . . . . . . . . . . . . . 10
Recruitment and retention . . . . . . . . . . . . . . . . . . . . . . . . . . . . . . . . . . . . . . 11
Epidemiology Leadership . . . . . . . . . . . . . . . . . . . . . . . . . . . . . . . . . . . . . . . 11
The territorial situation . . . . . . . . . . . . . . . . . . . . . . . . . . . . . . . . . . . . . . . . . 12
Overriding issue: alignment of priorities . . . . . . . . . . . . . . . . . . . . . . . . . . . . 12
Recommendations . . . . . . . . . . . . . . . . . . . . . . . . . . . . . . . . . . . . . . . . . . . . . . . 12
Background . . . . . . . . . . . . . . . . . . . . . . . . . . . . . . . . . . . . . . . . . . . . . . . . . . . . . . . 13
Methods . . . . . . . . . . . . . . . . . . . . . . . . . . . . . . . . . . . . . . . . . . . . . . . . . . . . . . . . . . 17
Instrument Development and Distribution . . . . . . . . . . . . . . . . . . . . . . . . . . . . . 18
Definitionsandresponseoptions . . . . . . . . . . . . . . . . . . . . . . . . . . . . . . . . . . . . 19
Analytic techniques . . . . . . . . . . . . . . . . . . . . . . . . . . . . . . . . . . . . . . . . . . . . . . 20
Results . . . . . . . . . . . . . . . . . . . . . . . . . . . . . . . . . . . . . . . . . . . . . . . . . . . . . . . . . . . 22
Epidemiology leadership within the health department . . . . . . . . . . . . . . . . . . . 23
Response rates and characteristics of participating
State and Territorial Epidemiologists . . . . . . . . . . . . . . . . . . . . . . . . . . . . . 23
Program area lead epidemiologists . . . . . . . . . . . . . . . . . . . . . . . . . . . . . . . 24
Trends in the presence of program area leads . . . . . . . . . . . . . . . . . . . . . . . . . 25
Epidemiologystaffingandfundingwithinhealthdepartments . . . . . . . . . . . . . . 26
Staffing . . . . . . . . . . . . . . . . . . . . . . . . . . . . . . . . . . . . . . . . . . . . . . . . . . . . . 26
Funding . . . . . . . . . . . . . . . . . . . . . . . . . . . . . . . . . . . . . . . . . . . . . . . . . . . . 31
State health department capacity in Essential Public Health Services,
access to the literature, and presence of an outbreak management system . 33
Overall capacity . . . . . . . . . . . . . . . . . . . . . . . . . . . . . . . . . . . . . . . . . . . . . . 33
Overall capacity in program areas . . . . . . . . . . . . . . . . . . . . . . . . . . . . . . . . 34
Access to the literature . . . . . . . . . . . . . . . . . . . . . . . . . . . . . . . . . . . . . . . . . 36
Outbreak management system . . . . . . . . . . . . . . . . . . . . . . . . . . . . . . . . . . 36
3
20
17
Ep
ide
mio
log
y C
ap
ac
ity
As
se
ss
me
nt
Re
po
rt
Table of Contents
Salaries for civil service epidemiologists . . . . . . . . . . . . . . . . . . . . . . . . . . . . . . 36
Salaries by degree and career level . . . . . . . . . . . . . . . . . . . . . . . . . . . . . . . . . . 36
Changes in career-level salaries, 2013 and 2017 . . . . . . . . . . . . . . . . . . . . 37
Epidemiology training and the Applied Epidemiology Competencies . . . . . . . . 38
Training in epidemiology . . . . . . . . . . . . . . . . . . . . . . . . . . . . . . . . . . . . . . . 38
Cross-training in informatics . . . . . . . . . . . . . . . . . . . . . . . . . . . . . . . . . . . . . 38
Comparison of training and cross-training activities, 2013 and 2017 . . . . . 39
Training priorities . . . . . . . . . . . . . . . . . . . . . . . . . . . . . . . . . . . . . . . . . . . . . 39
Collaboration in training . . . . . . . . . . . . . . . . . . . . . . . . . . . . . . . . . . . . . . . . 40
Changes in collaborating partners between 2013 and 2017 . . . . . . . . . . . . 40
UseofAppliedEpidemiologyCompetencies(AECs)todefine
epidemiology career paths . . . . . . . . . . . . . . . . . . . . . . . . . . . . . . . . . . . . 41
Existing practices, incentives, and barriers aimed at
strengthening the state epidemiology workforce . . . . . . . . . . . . . . . . . . . . . . . . 42
Obstacles to recruitment . . . . . . . . . . . . . . . . . . . . . . . . . . . . . . . . . . . . . . . 42
Sources for recruitment . . . . . . . . . . . . . . . . . . . . . . . . . . . . . . . . . . . . . . . . 42
Minimum hiring requirements . . . . . . . . . . . . . . . . . . . . . . . . . . . . . . . . . . . . 43
Retention and continuity planning . . . . . . . . . . . . . . . . . . . . . . . . . . . . . . . . . . . 44
Obstacles to retention . . . . . . . . . . . . . . . . . . . . . . . . . . . . . . . . . . . . . . . . . 44
Strategies to minimize staff turnover . . . . . . . . . . . . . . . . . . . . . . . . . . . . . . 45
Maintaining institutional knowledge . . . . . . . . . . . . . . . . . . . . . . . . . . . . . . . 45
Remarks from State and Territorial Epidemiologists on Critical Issues . . . . . . . 46
Discussion . . . . . . . . . . . . . . . . . . . . . . . . . . . . . . . . . . . . . . . . . . . . . . . . . . . . . . . 49
Key Findings . . . . . . . . . . . . . . . . . . . . . . . . . . . . . . . . . . . . . . . . . . . . . . . . . . . . 50
Numbers of epidemiologists . . . . . . . . . . . . . . . . . . . . . . . . . . . . . . . . . . . . . 50
EPHS capacity . . . . . . . . . . . . . . . . . . . . . . . . . . . . . . . . . . . . . . . . . . . . . . . 51
Training and the Applied Epidemiology Competencies . . . . . . . . . . . . . . . . 51
Funding . . . . . . . . . . . . . . . . . . . . . . . . . . . . . . . . . . . . . . . . . . . . . . . . . . . . 51
Recruitment and retention . . . . . . . . . . . . . . . . . . . . . . . . . . . . . . . . . . . . . . 51
Territorial challenges . . . . . . . . . . . . . . . . . . . . . . . . . . . . . . . . . . . . . . . . . . 51
Overriding issues: alignment of priorities . . . . . . . . . . . . . . . . . . . . . . . . . . . 53
Limitations . . . . . . . . . . . . . . . . . . . . . . . . . . . . . . . . . . . . . . . . . . . . . . . . . . . . . 53
Recommendations . . . . . . . . . . . . . . . . . . . . . . . . . . . . . . . . . . . . . . . . . . . . . . . . . 54
References . . . . . . . . . . . . . . . . . . . . . . . . . . . . . . . . . . . . . . . . . . . . . . . . . . . . . . . 57
Appendices . . . . . . . . . . . . . . . . . . . . . . . . . . . . . . . . . . . . . . . . . . . . . . . . . . . . . . . 60
Ta
ble
of
Co
nte
nts

4
20
17
Ep
ide
mio
log
y C
ap
ac
ity A
ss
es
sm
en
t Re
po
rt
The Council of State and Territorial Epidemiologists (CSTE) completed this assessment in cooperation from state and territorial health departments . CSTE acknowledges the contributions of Joseph McLaughlin, Kathy Turner, Patty Quinlisk, Richard Danila, Sara Huston, Sharon Watkins, Mike Landen, Elizabeth Daly, Robert Harrison, and Aaron Fleischauer . Contributing CSTE National OfficeStaffmembersareJessicaArrazola,AmandaMasters,MiaIsrael,JenniferLemmings,Jeffrey Engel, Dhara Shah, Meredith Lichtenstein Cone, Kevin Gibbs, Becky Lampkins, and Jeremy Arieh . Other partners we would like to acknowledge include Emily Holubowich and Nancy Maddox . The primary author is Nancy Binkin, CSTE Consultant .
For more than seven decades, CSTE and the US Centers for Disease Control and Prevention (CDC) have worked together to improve the public’s health by supporting the efforts of epidemiologists working at the state, territorial, and local levels by promoting the effective use of epidemiologic data to guide public health practice and improve health . CSTE and its members represent two basic components of public health – epidemiology and surveillance .
This publication was supported in part by the CDC cooperative agreement numbers 5U38OT000143-04 and 5U38OT000143-05 . Its contents are solely the responsibility of the authors anddonotnecessarilyrepresenttheofficialviewsofCDC.
Ac
kn
ow
led
gm
en
ts
Acknowledgments
Council of State and Territorial Epidemiologists2872 Woodcock Blvd, Suite 250, Atlanta, GA 30341
770.458.3811 (p) | 770.458.8516 (f) | www.cste.org
This publication was supported by Cooperative Agreement Number 1U38OT000143. Its contents are solely the responsibility of the authors
and do not necessarily represent the official views of CDC.
INTRODUCTION
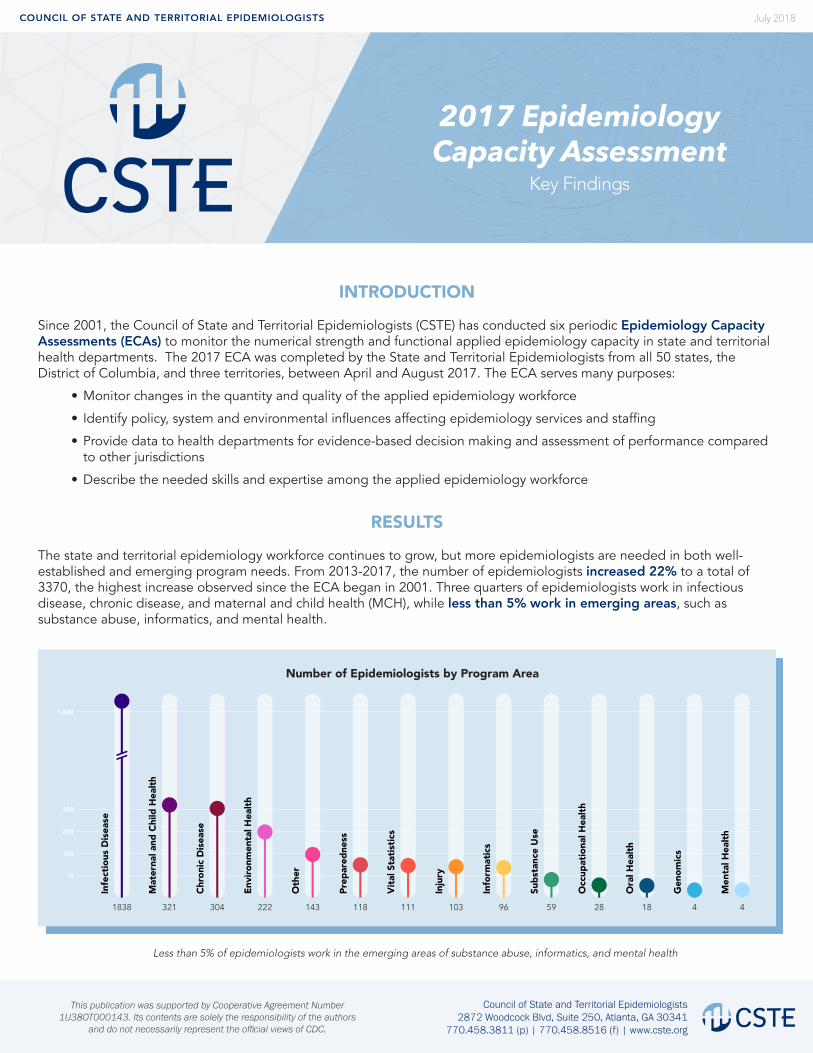
Since 2001, the Council of State and Territorial Epidemiologists (CSTE) has conducted six periodic Epidemiology Capacity Assessments (ECAs) to monitor the numerical strength and functional applied epidemiology capacity in state and territorial health departments. The 2017 ECA was completed by the State and Territorial Epidemiologists from all 50 states, the District of Columbia, and three territories, between April and August 2017. The ECA serves many purposes:
• Monitor changes in the quantity and quality of the applied epidemiology workforce
• Identify policy, system and environmental influences affecting epidemiology services and staffing
• Provide data to health departments for evidence-based decision making and assessment of performance compared to other jurisdictions
• Describe the needed skills and expertise among the applied epidemiology workforce
RESULTS
The state and territorial epidemiology workforce continues to grow, but more epidemiologists are needed in both well-established and emerging program needs. From 2013-2017, the number of epidemiologists increased 22% to a total of 3370, the highest increase observed since the ECA began in 2001. Three quarters of epidemiologists work in infectious disease, chronic disease, and maternal and child health (MCH), while less than 5% work in emerging areas, such as substance abuse, informatics, and mental health.
Infe
ctio
us D
isea
se
3211838
300
1,800
225
150
75
Mat
erna
l and
Chi
ld H
ealth
304
Chro
nic
Dis
ease
222
Envi
ronm
enta
l Hea
lth
143
Oth
er
118
Prep
ared
ness
111
Vita
l Sta
tistic
s
103
Inju
ry
96
Info
rmat
ics
59
Subs
tanc
e U
se
28
Occ
upat
iona
l Hea
lth
18
Ora
l Hea
lth
4
Gen
omic
s
4
Men
tal H
ealth
Number of Epidemiologists by Program Area
Less than 5% of epidemiologists work in the emerging areas of substance abuse, informatics, and mental health
July 2018
2017 Epidemiology Capacity Assessment
Key Findings
Council of State and Territorial Epidemiologists2872 Woodcock Blvd, Suite 250, Atlanta, GA 30341
770.458.3811 (p) | 770.458.8516 (f) | www.cste.org
This publication was supported by Cooperative Agreement Number 1U38OT000143. Its contents are solely the responsibility of the authors
and do not necessarily represent the official views of CDC.
Capacity
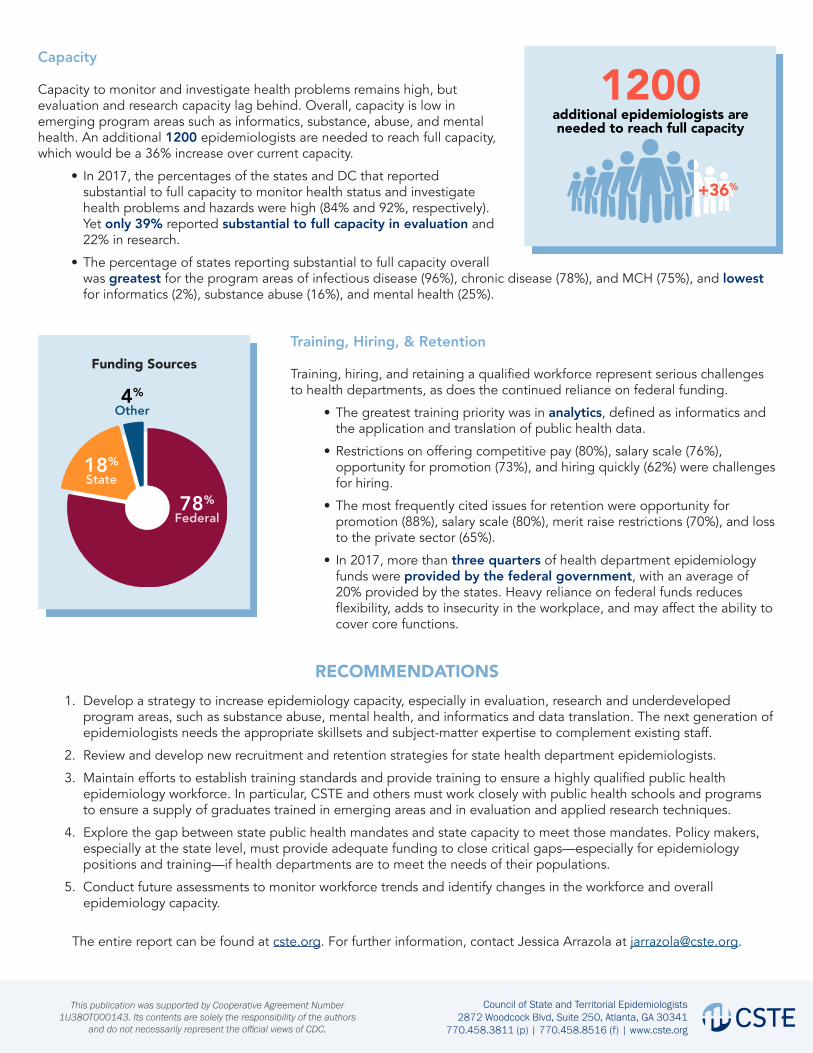
Capacity to monitor and investigate health problems remains high, but evaluation and research capacity lag behind. Overall, capacity is low in emerging program areas such as informatics, substance, abuse, and mental health. An additional 1200 epidemiologists are needed to reach full capacity, which would be a 36% increase over current capacity.
• In 2017, the percentages of the states and DC that reported substantial to full capacity to monitor health status and investigate health problems and hazards were high (84% and 92%, respectively). Yet only 39% reported substantial to full capacity in evaluation and 22% in research.
• The percentage of states reporting substantial to full capacity overall was greatest for the program areas of infectious disease (96%), chronic disease (78%), and MCH (75%), and lowest for informatics (2%), substance abuse (16%), and mental health (25%).
RECOMMENDATIONS1. Develop a strategy to increase epidemiology capacity, especially in evaluation, research and underdeveloped
program areas, such as substance abuse, mental health, and informatics and data translation. The next generation of epidemiologists needs the appropriate skillsets and subject-matter expertise to complement existing staff.
2. Review and develop new recruitment and retention strategies for state health department epidemiologists.
3. Maintain efforts to establish training standards and provide training to ensure a highly qualified public health epidemiology workforce. In particular, CSTE and others must work closely with public health schools and programs to ensure a supply of graduates trained in emerging areas and in evaluation and applied research techniques.
4. Explore the gap between state public health mandates and state capacity to meet those mandates. Policy makers, especially at the state level, must provide adequate funding to close critical gaps—especially for epidemiology positions and training—if health departments are to meet the needs of their populations.
5. Conduct future assessments to monitor workforce trends and identify changes in the workforce and overall epidemiology capacity.
The entire report can be found at cste.org. For further information, contact Jessica Arrazola at [email protected].
Training, Hiring, & Retention
Training, hiring, and retaining a qualified workforce represent serious challenges to health departments, as does the continued reliance on federal funding.
• The greatest training priority was in analytics, defined as informatics and the application and translation of public health data.
• Restrictions on offering competitive pay (80%), salary scale (76%), opportunity for promotion (73%), and hiring quickly (62%) were challenges for hiring.
• The most frequently cited issues for retention were opportunity for promotion (88%), salary scale (80%), merit raise restrictions (70%), and loss to the private sector (65%).
• In 2017, more than three quarters of health department epidemiology funds were provided by the federal government, with an average of 20% provided by the states. Heavy reliance on federal funds reduces flexibility, adds to insecurity in the workplace, and may affect the ability to cover core functions.
1200additional epidemiologists are needed to reach full capacity
+36%
State18%
Other4%
Federal78%
Funding Sources

EXECUTIVE SUMMARY

8
20
17
Ep
ide
mio
log
y C
ap
ac
ity A
ss
es
sm
en
t Re
po
rt
Background
Since 2001, the Council of State and Territorial Epidemiologists (CSTE) has periodically assessed the numeric and functional capacity of epidemiology programs in the United States and its territories . So far, six of these Epidemiology Capacity Assessments (ECAs) have been undertaken: in 2001, 2004, 2006, 2009, 2013 and 2017 .
These assessments serve a wide range of stakeholders, including state and national public health leaders and schools and programs of public health . Workforce data, for example, informs governmental planning for the provision of public health services, as well as comparisons with other jurisdictions withrespecttostaffing,performanceonkeyepidemiology competencies, salary levels, and relative state and federal funding levels . For schools and programs of public health, which train much of the epidemiology workforce, the ECA provides information on the skills and program area expertise needed to respond to current public health priorities, such as substance abuse prevention and control .
In recent years, there has been a move toward greater standardization of public health services . The Ten Essential Public Health Services (EPHS)—a list of core public health responsibilities drafted by a Centers for Disease Control and Prevention (CDC) working group, based on the landmark 1988 Institute of Medicine report The Future of Public Health —constitute the national benchmarks for public health practice (Centers for Disease Control and Prevention, 2017) . Four of the EPHS relate directly to epidemiology: monitoring health status, investigating community health problems and hazards, evaluating the effectiveness of public health interventions, and conducting research . According to the 2013 ECA, overall US capacity for monitoring health status and investigating
health problems was good, but public health capacity for research and evaluation was limited . Moreover, the assessment showed that at least 4,100 additional epidemiologists were needed to achieve adequate capacity to successfully perform these four EPHS . The 2017 ECA provides the opportunity to assess whether these additional epidemiologists have been hired and whether the current ability to provide these four critical public health services has changed .
The 2017 ECA was launched in April 2017 and completed in August 2017 . Building upon recommendations from the 2013 ECA and the 2014 Public Health Workforce Interest and Needs Survey (Liss-Levinson, Bharthapudi, Leider, & Sellers, 2015), the 2017 ECA was designed to achieve four goals:1 . Enumerate and describe the applied
epidemiology workforce .2 . Describe the skills of the applied
epidemiology workforce .3 . Describe the funding supporting the applied
epidemiology workforce .4 . Describe the level of epidemiology capacity
in state health departments .
Methods
The assessment questionnaire was developed into an online format using Qualtrics software and was piloted in February 2017 in three states . After revision, the questionnaire was sent out in electronic format to the State Epidemiologists in 50 states, the District of Columbia, and the US territories .
Most questions were short answer, multiple choice, scales or matrix tables . Wherever possible, questions, response categories, anddefinitionsremainedidenticaltopreviousECA questions to ensure comparability with previousdata.Forthefirsttime,anopen-ended question was included that asked: As the State Epidemiologist, what are the most critical issues you face?
Ex
ec
utiv
e S
um
ma
ry
Executive Summary
9
20
17
Ep
ide
mio
log
y C
ap
ac
ity
As
se
ss
me
nt
Re
po
rt
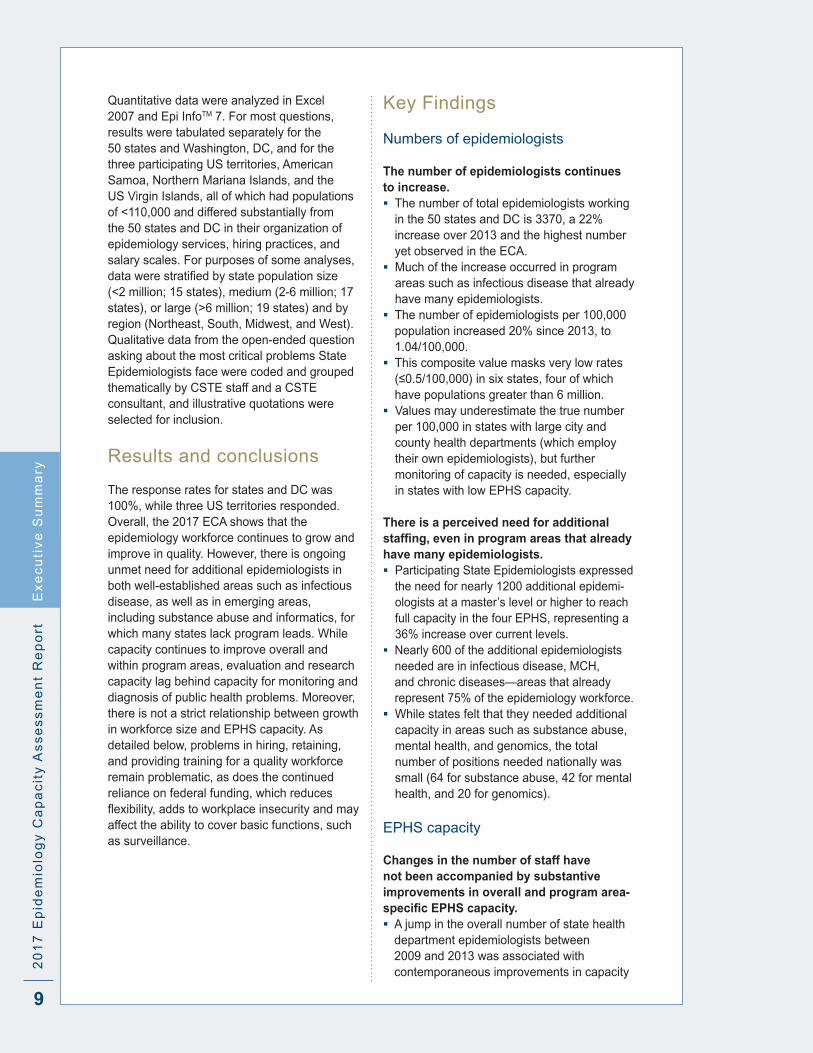
Quantitative data were analyzed in Excel 2007 and Epi InfoTM 7 . For most questions, results were tabulated separately for the 50 states and Washington, DC, and for the three participating US territories, American Samoa, Northern Mariana Islands, and the US Virgin Islands, all of which had populations of <110,000 and differed substantially from the 50 states and DC in their organization of epidemiology services, hiring practices, and salary scales . For purposes of some analyses, datawerestratifiedbystatepopulationsize(<2 million; 15 states), medium (2-6 million; 17 states), or large (>6 million; 19 states) and by region (Northeast, South, Midwest, and West) . Qualitative data from the open-ended question asking about the most critical problems State Epidemiologists face were coded and grouped thematically by CSTE staff and a CSTE consultant, and illustrative quotations were selected for inclusion .
Results and conclusions
The response rates for states and DC was 100%, while three US territories responded . Overall, the 2017 ECA shows that the epidemiology workforce continues to grow and improve in quality . However, there is ongoing unmet need for additional epidemiologists in both well-established areas such as infectious disease, as well as in emerging areas, including substance abuse and informatics, for which many states lack program leads . While capacity continues to improve overall and within program areas, evaluation and research capacity lag behind capacity for monitoring and diagnosis of public health problems . Moreover, there is not a strict relationship between growth in workforce size and EPHS capacity . As detailed below, problems in hiring, retaining, and providing training for a quality workforce remain problematic, as does the continued reliance on federal funding, which reduces flexibility,addstoworkplaceinsecurityandmayaffect the ability to cover basic functions, such as surveillance .
Key Findings
Numbers of epidemiologists
The number of epidemiologists continues to increase . The number of total epidemiologists working
in the 50 states and DC is 3370, a 22% increase over 2013 and the highest number yet observed in the ECA .
Much of the increase occurred in program areas such as infectious disease that already have many epidemiologists .
The number of epidemiologists per 100,000 population increased 20% since 2013, to 1 .04/100,000 .
This composite value masks very low rates (≤0.5/100,000)insixstates,fourofwhichhave populations greater than 6 million .
Values may underestimate the true number per 100,000 in states with large city and county health departments (which employ their own epidemiologists), but further monitoring of capacity is needed, especially in states with low EPHS capacity .
There is a perceived need for additional staffing, even in program areas that already have many epidemiologists . Participating State Epidemiologists expressed
the need for nearly 1200 additional epidemi-ologists at a master’s level or higher to reach full capacity in the four EPHS, representing a 36% increase over current levels .
Nearly 600 of the additional epidemiologists needed are in infectious disease, MCH, and chronic diseases—areas that already represent 75% of the epidemiology workforce .
While states felt that they needed additional capacity in areas such as substance abuse, mental health, and genomics, the total number of positions needed nationally was small (64 for substance abuse, 42 for mental health, and 20 for genomics) .
EPHS capacity
Changes in the number of staff have not been accompanied by substantive improvements in overall and program area-specific EPHS capacity. A jump in the overall number of state health
department epidemiologists between 2009 and 2013 was associated with contemporaneous improvements in capacity
Ex
ec
uti
ve
Su
mm
ary

10
20
17
Ep
ide
mio
log
y C
ap
ac
ity A
ss
es
sm
en
t Re
po
rt
for the four epidemiology-dependent EPHS . This effect, however, was not replicated between 2013 and 2017 .
In 2017, the percentages of the states and DC with substantial to full capacity for EPHS #1 (monitoring health status hazards) and #2 (investigating community health problems and hazards) capacity were high (84% and 92%, respectively), with little change since 2013 .
Only 39% of jurisdictions had substantial to full capacity in EPHS #9 (evaluating the effectiveness of public health interventions), up from 35% in 2013 . For EPHS #10 (conducting research) there was a drop from 29% reporting substantial to full capacity in 2013 to 22% in 2017 . This low capacity may limit health agencies’ ability to respond to funding opportunity announcements .
Therewerenostatisticallysignificantchanges in the percentage of jurisdictions reporting substantial to full capacity in any of the program areas, despite changes in the number of epidemiologists .
Thesefindingssuggestthathiringadditionalstaffisinsufficienttoachievehoped-forimprovements . Instead, states need to place greater emphasis on hiring epidemiologists withspecificskillsets,suchasevaluationandresearch, to attain EPHS capacity goals . The low capacity in evaluation and research may limit the ability of jurisdictions to respond to funding opportunity announcements .
Stakeholders need to work more closely with schools and programs of public health to inform their epidemiology curricula .
Training and the Applied Epidemiology Competencies
By a considerable margin, the greatest training priority was analytics, defined as informatics and the application and translation of public health data . Analytics was mentioned as one of the two
top priorities by 38 states, with 12 states mentioning systems thinking (systems development, change management, strategicplanning,and/orflexibility),persuasive communication, and leadership development .
Although training is readily available in epidemiology, the area of data analytics relevant to a state epidemiology department setting is less well developed . Opportunities
for partnership can be explored to build data analytics and systems thinking skills, especially with academic institutions and entities with experience in workforce training in systems management .
The Applied Epidemiology Competencies have been available since 2008 but a quarter of the jurisdictions have not used them . The AECs, which were developed by CDC
and CSTE, consist of a comprehensive, four-tieredlistofcompetenciesthatdefinesthe discipline of applied epidemiology and describes the skills needed by epidemiologists at each level . They have been used by 76% of the states and DC for one or more purposes .
Use of the AECs has largely been limited to developing or updating position descriptions andjobqualificationstatementsandassessingepidemiologycapacityofspecificpositions; they are far less commonly employed to develop training plans to address knowledge gaps or to develop training or continuing education efforts .
Access to peer-reviewed literature that is not open-access is poor in many states Timely access to peer-reviewed literature is
essential to deal with emerging issues and to ensure that ongoing activities are evidence-based . Yet more than a quarter of states report that they lack access to the literature, and an additional quarter report that access is delayed by more than 24 hours .
Understanding how states with rapid access have arranged to obtain literature may assist states with slow or no access by illuminating potential solutions, such as university partnerships or participation in the National Network of Libraries of Medicine .
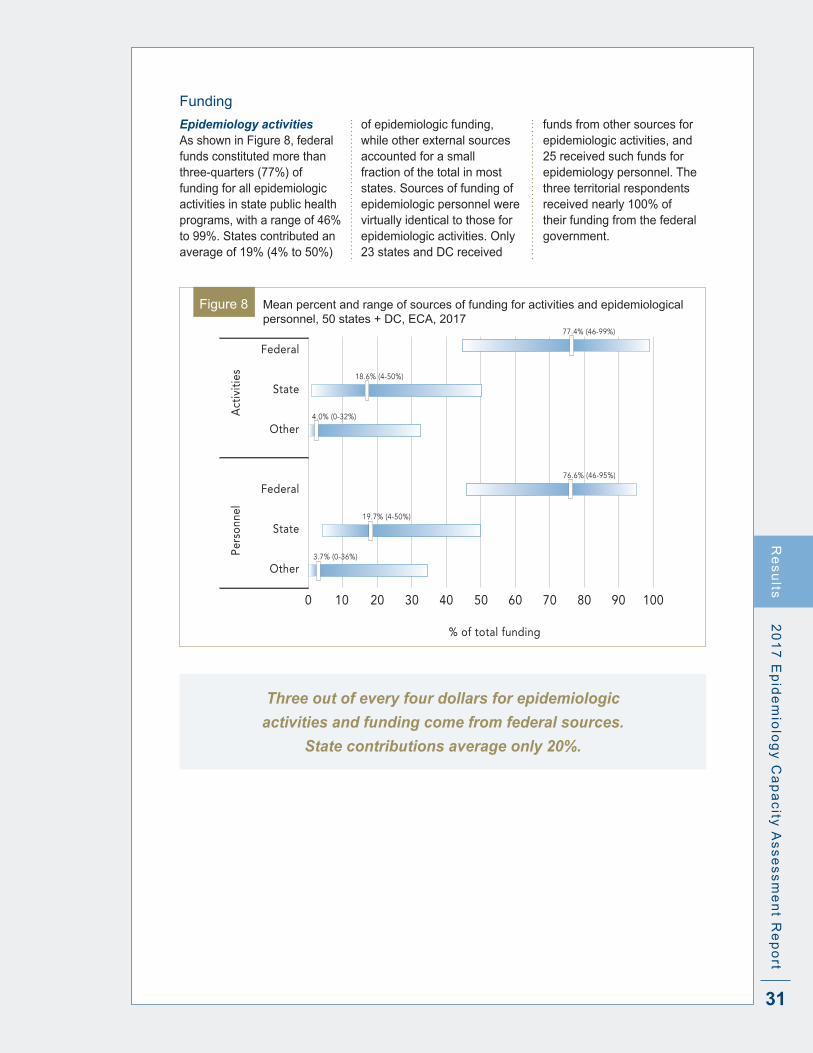
Funding
Federal funding continues to pay for most epidemiology activities and personnel and limits adequate coverage of underserved program areas . More than three quarters (77%) of the
funding for epidemiologic activities and personnel comes from the federal government, primarily from CDC, with 19% coming from the states themselves and the remaining 4% from other sources .
Ex
ec
utiv
e S
um
ma
ry
11
20
17
Ep
ide
mio
log
y C
ap
ac
ity
As
se
ss
me
nt
Re
po
rt
Federal funds constitute the vast majority of funds for virtually all program areas; only in the case of vital statistics did state funding contribute more than 33% .
External funding is perceived to drive programmatic priorities and create silos, leaving some of the broader essential functions, such as maintaining surveillance systems and conducting routine health department investigations, underfunded . It isalsoperceivedtolimitflexibilitytoadjustresources to deal with emerging problems .
Ebola and Zika supplemental funding ends in 2018, and cutbacks are expected in the Affordable Care Act’s Prevention and Public Health Fund, which supports the Epidemiology and Laboratory Capacity for Infectious Diseases and the Public Health Emergency Preparedness cooperative agreements, potentially threatening previous gainsinbothstaffingandcapacity.
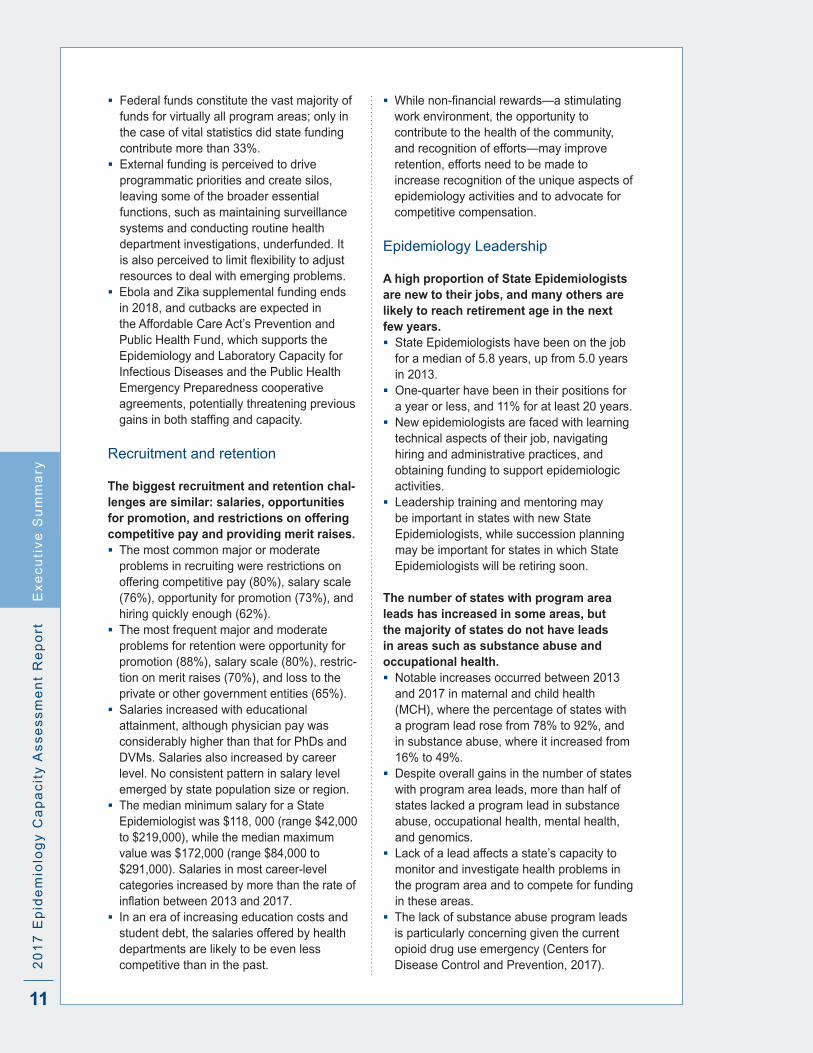
Recruitment and retention
The biggest recruitment and retention chal-lenges are similar: salaries, opportunities for promotion, and restrictions on offering competitive pay and providing merit raises . The most common major or moderate
problems in recruiting were restrictions on offering competitive pay (80%), salary scale (76%), opportunity for promotion (73%), and hiring quickly enough (62%) .
The most frequent major and moderate problems for retention were opportunity for promotion (88%), salary scale (80%), restric-tion on merit raises (70%), and loss to the private or other government entities (65%) .
Salaries increased with educational attainment, although physician pay was considerably higher than that for PhDs and DVMs . Salaries also increased by career level . No consistent pattern in salary level emerged by state population size or region .
The median minimum salary for a State Epidemiologist was $118, 000 (range $42,000 to $219,000), while the median maximum value was $172,000 (range $84,000 to $291,000) . Salaries in most career-level categories increased by more than the rate of inflationbetween2013and2017.
In an era of increasing education costs and student debt, the salaries offered by health departments are likely to be even less competitive than in the past .
Whilenon-financialrewards—astimulatingwork environment, the opportunity to contribute to the health of the community, and recognition of efforts—may improve retention, efforts need to be made to increase recognition of the unique aspects of epidemiology activities and to advocate for competitive compensation .
Epidemiology Leadership
A high proportion of State Epidemiologists are new to their jobs, and many others are likely to reach retirement age in the next few years . State Epidemiologists have been on the job
for a median of 5 .8 years, up from 5 .0 years in 2013 .
One-quarter have been in their positions for a year or less, and 11% for at least 20 years .
New epidemiologists are faced with learning technical aspects of their job, navigating hiring and administrative practices, and obtaining funding to support epidemiologic activities .
Leadership training and mentoring may be important in states with new State Epidemiologists, while succession planning may be important for states in which State Epidemiologists will be retiring soon .
The number of states with program area leads has increased in some areas, but the majority of states do not have leads in areas such as substance abuse and occupational health . Notable increases occurred between 2013
and 2017 in maternal and child health (MCH), where the percentage of states with a program lead rose from 78% to 92%, and in substance abuse, where it increased from 16% to 49% .
Despite overall gains in the number of states with program area leads, more than half of states lacked a program lead in substance abuse, occupational health, mental health, and genomics .
Lack of a lead affects a state’s capacity to monitor and investigate health problems in the program area and to compete for funding in these areas .
The lack of substance abuse program leads is particularly concerning given the current opioid drug use emergency (Centers for Disease Control and Prevention, 2017) .
Ex
ec
uti
ve
Su
mm
ary

12
20
17
Ep
ide
mio
log
y C
ap
ac
ity A
ss
es
sm
en
t Re
po
rt
The territorial situation
Territories face special challenges related to location, high staff turnover, slow hiring processes, and, in some cases, low salaries and poor access to the literature . Only three US territories responded to
the ECA, but based on their experience, maintaining continuity and capacity in these settings represents a particular challenge .
Frequently cited recruitment and retention problems included isolated locations, slow hiring processes, and non-competitive salary scales . These problems, in turn, led to high turnover of senior and staff Territorial Epidemiologists . None of the three responding epidemiologists had been in their positions for more than three years . Two of the three territories had no access to the literature, and the third had access only after 72 hours .
Further efforts are needed to understand what can be done to improve capacity in some of these remote and challenging settings . Examining successful efforts in remote areas of the US may provide some clues .
Overriding issue: alignment of priorities
In many states, there is a misalignment between needs and resources, and, because of external funding and organizational issues, state priorities are not being met . According to State Epidemiologists’
comments on the critical problems they face, a misalignment of needs and resources has resulted from heavy reliance on federal funding,aswellaslackofflexibility,hiringlimitations, and lack of opportunity to step back and re-align state priorities with epidemiological activities .
Periodic examination of priorities based on morbidity, mortality, and state public health mandates could serve as a basis for seeking additional funding from the state or other sources and thus better align workforce capacity to address priority and emerging problems, such as substance abuse .
Recommendations
The results of the 2017 ECA suggest several recommendations—to improve applied epidemiology capacity in state and territorial health departments . 1 . Develop a strategy to increase epidemiology
capacity, especially in evaluation, research and underdeveloped program areas such as substance abuse, mental health, and informatics and data translation . The next generation of epidemiologists needs the appropriate skillsets and subject-matter expertise to complement existing staff .
2 . Review and develop new recruitment and retention strategies for state health department epidemiologists .
3 . Maintain efforts to establish training standards and to provide training to ensure ahighlyqualifiedpublichealthepidemiologyworkforce . In particular, CSTE and others must work closely with public health schools and programs to ensure a supply of graduates trained in emerging areas and in evaluation and applied research techniques .
4 . Explore the gap between state public health mandates and state capacity to meet those mandates . Policy makers, especially at the state level, must provide adequate funding to close critical gaps—especially for epidemiology positions and training—if health departments are to meet the needs of their populations .
5 . Conduct future assessments to monitor workforce trends and illuminate changes in the workforce and overall epidemiology capacity .
Ex
ec
utiv
e S
um
ma
ry

BACKGROUND

14
20
17
Ep
ide
mio
log
y C
ap
ac
ity A
ss
es
sm
en
t Re
po
rt
Protecting and improving population health—the broad goals of public health practice—involve a host of stakeholders from many different sectors of society, including government agencies, nongovernmental organizations, health care providers, and businesses (Frieden, 2015) .
State and local public health agencies play an important role in conducting surveillance and assessing community needs (National Consortium for Public Health Workforce Development, 2017) . Surveillance produces essential information to create effective and efficientpublichealthservices(Groseclose&Buckeridge, 2017), while community needs assessmentspermitidentificationofat-riskgroups and the subsequent prioritization of public health services . Epidemiologists are fundamental to both public health surveillance (Drehobl, Roush, Stover, & Koo, 2012) and community needs assessments .
Understanding the current applied epidemiology workforce situation is critical to state and national public health leaders and schools of public health . Leaders, for example, need timely workforce data to plan the delivery of these basic public health functions and to evaluate their progress . They wish to know how many public health epidemiologists are currently working in their jurisdictions and how they are distributed by programarea.Leadersmayalsofindithelpfulto know how their jurisdiction stacks up against otherswithrespecttostaffing,epidemiologiccompetencies, salary, hiring practices, and staff retention .
Similarly, schools and programs of public health, which provide much of the training of the epidemiology workforce, need to know which program areas need more epidemiologists, the skills that need further strengthening in health departments, and what educational and experiential
qualificationshealthagenciesareseekinginnew epidemiology recruits . This information can inform curricula design and student job counseling .
Public health has entered a period of rapid change, with massive budget and workforce cuts, a growing focus on accountability, health system changes, and the introduction of new technologies (Trust for America’s Health, 2013) . Adaptation to the modern public health landscape requires specialized knowledge and skill sets that promote systems thinking, effective change management, and cultural sensitivity (Brownson et al ., 2015; Kaufman et al ., 2014) . In this context, an understanding of current workforce characteristics and perceived health department challenges is essential for long term planning .
One of the most important recent changes is a move toward greater standardization of public health services . The Ten Essential Public Health Services (EPHS)—a list of core public health responsibilities drafted by a Centers for Disease Control and Prevention (CDC) working group and based on the landmark Institute of Medicine report The Future of Public Health (1988)—constitute the national benchmarks for public health practice (Centers for Disease Control and Prevention, 2017b) . Four of these depend on epidemiology capacity: monitoring health status (EPHS #1), investigating community health problems and hazards (EPHS #2), evaluating the effectiveness of public health interventions (EPHS #9), and conducting research (EPHS #10) . According to the Council of State and Territorial Epidemiologists’ (CSTE’s) 2013 Epidemiology Capacity Assessment (ECA), overall US capacity for monitoring health status and investigating health problems was substantial, but public health capacity for research and evaluation is limited . Moreover, the assessment showed that at least 4,100 additional epidemiologists were needed to
Ba
ck
gro
un
d
Background
15
20
17
Ep
ide
mio
log
y C
ap
ac
ity
As
se
ss
me
nt
Re
po
rt
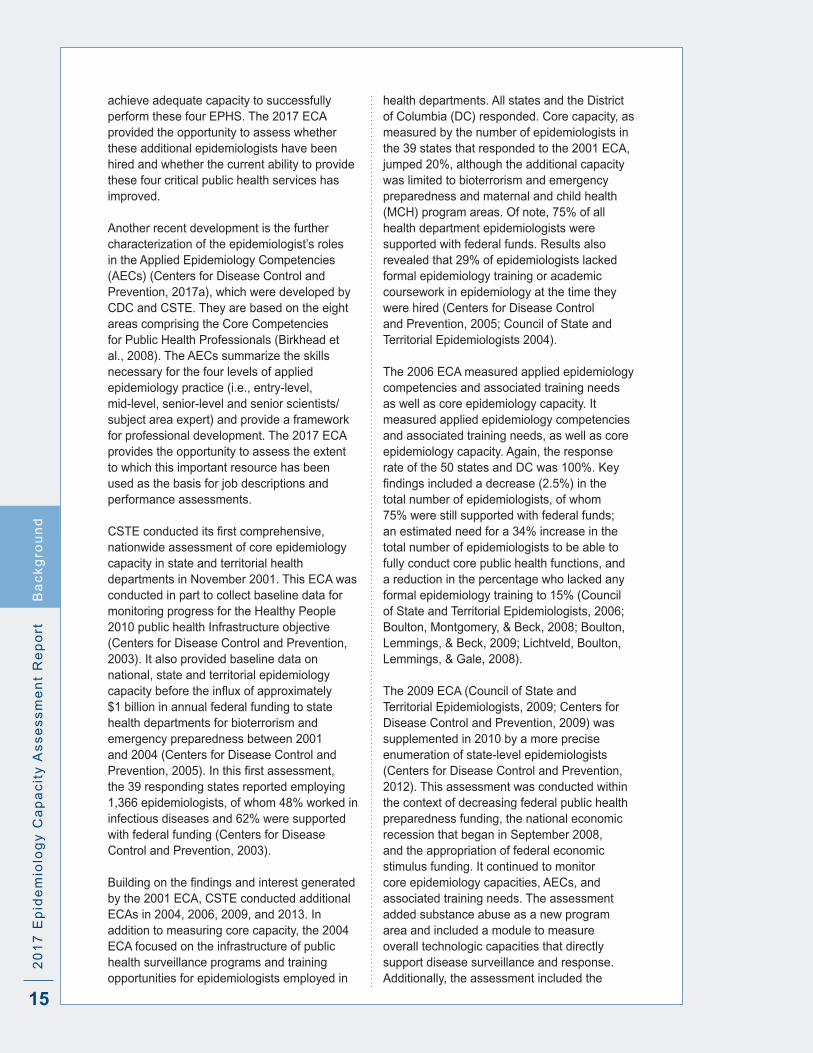
achieve adequate capacity to successfully perform these four EPHS . The 2017 ECA provided the opportunity to assess whether these additional epidemiologists have been hired and whether the current ability to provide these four critical public health services has improved .
Another recent development is the further characterization of the epidemiologist’s roles in the Applied Epidemiology Competencies (AECs) (Centers for Disease Control and Prevention, 2017a), which were developed by CDC and CSTE . They are based on the eight areas comprising the Core Competencies for Public Health Professionals (Birkhead et al ., 2008) . The AECs summarize the skills necessary for the four levels of applied epidemiology practice (i .e ., entry-level, mid-level, senior-level and senior scientists/subject area expert) and provide a framework for professional development . The 2017 ECA provides the opportunity to assess the extent to which this important resource has been used as the basis for job descriptions and performance assessments .
CSTEconducteditsfirstcomprehensive,nationwide assessment of core epidemiology capacity in state and territorial health departments in November 2001 . This ECA was conducted in part to collect baseline data for monitoring progress for the Healthy People 2010 public health Infrastructure objective (Centers for Disease Control and Prevention, 2003) . It also provided baseline data on national, state and territorial epidemiology capacitybeforetheinfluxofapproximately$1 billion in annual federal funding to state health departments for bioterrorism and emergency preparedness between 2001 and 2004 (Centers for Disease Control and Prevention,2005).Inthisfirstassessment,the 39 responding states reported employing 1,366 epidemiologists, of whom 48% worked in infectious diseases and 62% were supported with federal funding (Centers for Disease Control and Prevention, 2003) . Buildingonthefindingsandinterestgeneratedby the 2001 ECA, CSTE conducted additional ECAs in 2004, 2006, 2009, and 2013 . In addition to measuring core capacity, the 2004 ECA focused on the infrastructure of public health surveillance programs and training opportunities for epidemiologists employed in
health departments . All states and the District of Columbia (DC) responded . Core capacity, as measured by the number of epidemiologists in the 39 states that responded to the 2001 ECA, jumped 20%, although the additional capacity was limited to bioterrorism and emergency preparedness and maternal and child health (MCH) program areas . Of note, 75% of all health department epidemiologists were supported with federal funds . Results also revealed that 29% of epidemiologists lacked formal epidemiology training or academic coursework in epidemiology at the time they were hired (Centers for Disease Control and Prevention, 2005; Council of State and Territorial Epidemiologists 2004) .
The 2006 ECA measured applied epidemiology competencies and associated training needs as well as core epidemiology capacity . It measured applied epidemiology competencies and associated training needs, as well as core epidemiology capacity . Again, the response rate of the 50 states and DC was 100% . Key findingsincludedadecrease(2.5%)inthetotal number of epidemiologists, of whom 75% were still supported with federal funds; an estimated need for a 34% increase in the total number of epidemiologists to be able to fully conduct core public health functions, and a reduction in the percentage who lacked any formal epidemiology training to 15% (Council of State and Territorial Epidemiologists, 2006; Boulton, Montgomery, & Beck, 2008; Boulton, Lemmings, & Beck, 2009; Lichtveld, Boulton, Lemmings, & Gale, 2008) . The 2009 ECA (Council of State and Territorial Epidemiologists, 2009; Centers for Disease Control and Prevention, 2009) was supplemented in 2010 by a more precise enumeration of state-level epidemiologists (Centers for Disease Control and Prevention, 2012) . This assessment was conducted within the context of decreasing federal public health preparedness funding, the national economic recession that began in September 2008, and the appropriation of federal economic stimulus funding . It continued to monitor core epidemiology capacities, AECs, and associated training needs . The assessment added substance abuse as a new program area and included a module to measure overall technologic capacities that directly support disease surveillance and response . Additionally, the assessment included the
Ba
ck
gro
un
d

16
20
17
Ep
ide
mio
log
y C
ap
ac
ity A
ss
es
sm
en
t Re
po
rt
firstenumerationoflocal(cityandcounty)epidemiologists.Keyfindingsincluded a further 10% drop in the total number of epidemiologists since 2006, low overall substance abuse epidemiology capacity, and lack of essential technologic capacity in many states . On the plus side, there was a further reduction in the percentage of epidemiologists who lacked formal epidemiology training to 13% . The 2013 ECA—which, like previous assessments had a 100% response rate from DC and the 50 states—revealed continued improvements of epidemiology capacity in multiple program areas, along with further improvements in workforce training (Council of State and Territorial Epidemiologists, 2013) . In fact, surveillance and epidemiology capacity in all well-established program areas were at their highest levels since 2004, likely owing to the increased size and skill level of the epidemiology workforce (Council of State and Territorial Epidemiologists, 2013) . Even so, the assessment documented a lack of capacity in long-established program areas of environmental health, injury, occupational health, and oral health; low capacity in substance abuse and mental health (added forthefirsttimein2013);aneedforadditionalcompetency-specifictraining;alossof11%of health department epidemiologists in 2012; and an increasing dependence on federal funding (Hadler et . al ., 2013; Council of State and Territorial Epidemiologists, 2013) .
ThesefindingswereechoedinthePublicHealth Workforce Interest and Needs Survey (PH WINS) conducted in 2014 by the Association of State and Territorial Health Officials(Liss-Levinson,Bharthapudi,Leider,& Sellers, 2015) . PH WINS, which includes data from epidemiologists and other health department employees, documented a need to boost cross-cutting skills, such as project collaboration and persuasive communication (Liss-Levinson et . al ., 2015); to enhance competency training: to increase investment in on-site training for employees; to strengthen partnerships with academic institutions; and to increase rates of membership in professional organizations such as CSTE (Liss-Levinson et . al ., 2015) . The survey also found that 26% of the state health department workforce intended to leave within the next year (Liss-Levinson et . al ., 2015) .
The 2017 ECA builds upon these earlier workforce assessments and features new questions to document the number of epidemiology vacancies and state health agencies’intentiontofillthem,toelucidatethe impact of supplemental federal funding for recent public health threats, such as the Ebola and Zika viruses, and to assess public health informatics capacity .
Overall, the 2017 ECA was designed to achieve four goals:1 . Enumerate and describe the applied
epidemiology workforce .2 . Describe the skills of the applied
epidemiology workforce .3 . Describe the funding supporting the applied
epidemiology workforce .4 . Describe the level of epidemiology capacity
in state health departments .
Ba
ck
gro
un
d

METHODS
18
20
17
Ep
ide
mio
log
y C
ap
ac
ity A
ss
es
sm
en
t Re
po
rt
Instrument Development and Distribution
Assessment design and distribution were informed by two CSTE-convened focus groups heldInthefallof2016;thefirstwiththeCSTEnationalofficestaffandthesecondwithCSTEmembers . Focus group participants discussed the purpose, value, content, and distribution of the 2017 ECA, as well as the training required to prepare State Epidemiologists to complete the assessment . Ultimately, nine items in the 2013 ECA were excluded from the 2017 ECA, primarily because they duplicated information collected through other CSTE assessments . In addition, nine questions were added, with their wording and response options informed by a literature review . Other changes include renamingthe“bioterrorismandemergencyresponse”programareaas“preparedness”and adding a new program area, informatics . The individual assessment for each epidemiologist, which was part of the 2013 ECA, was not included in the 2017 version . The resulting assessment was developed into an online format using Qualtrics® software and piloted in February 2017 by the Alaska, Massachusetts, and Nevada state health agencies . The pilot instrument was then revised based on their feedback . The final2017ECA(AppendixA)containedtensections:
Section 1: Epidemiology leadership within the state health department
Section2:Epidemiologystaffingandfundingsources within the state health department
Section 3: Epidemiology and surveillance capacity within the state health department
Section 4: Civil service annual salary ranges for epidemiologists in your state health department
Section 5: Epidemiology training and the Applied Epidemiology Competencies (AECs)
Section 6: Existing practices, incentives, and
barriers aimed at strengthening the state epidemiology workforce
Section 7: Vacancies and retention of the state epidemiology workforce
Section 8: Preparedness within the state health department
Section 9: Leadership feedback Section 10: Review of assessment
Most questions were short answer, multiple choice, scales (e .g ., none, minor problem, moderate problem, major problem) or matrix tables, such as the fraction of full-time equivalent positions (FTEs) by program area andfundingsource.Forthefirsttime,twoopen-ended questions were included: (1) As the State Epidemiologist, what are the most critical issues you face? and (2) What other thoughts, comments, concerns or questions would you like to share with CSTE with regard to the epidemiology workforce and training?
On April 24, 2017, CSTE distributed electronic instructions and individual assessment links to the State Epidemiologist in all 50 state health departments,Washington,DC,andthefiveUSterritories (American Samoa, Guam, Northern Mariana Islands, Puerto Rico, and the US Virgin Islands) plus the Federated States of Micronesia, an independent nation that has a Compact of Association with the US . The online assessment also was converted into a PDF (Appendix A) for printing and attached to the instructional email . Additionally, two worksheets (Appendices B and C) were created and attached to the email to assist with information-gathering from other staff in the state health department, namely program area leads and human resources directors . Worksheet instructions were included in the overall assessment instructions provided online .
Each State Epidemiologist was provided a unique link and was asked to complete the online assessment by May 31, 2017 . Potential respondents were also given the email address
Me
tho
ds
Methods

19
20
17
Ep
ide
mio
log
y C
ap
ac
ity
As
se
ss
me
nt
Re
po
rt
and telephone number of CSTE staff, who were available to answer any questions that mightarise.Inaddition,CSTEhosteda“Howto Complete the 2017 ECA Webinar” on May 5,2017andheldtwovirtualECAofficehourssessions on May 12 and 23, 2017 . Each state or territory was also provided with a copy of its 2013 ECA State Reports results to assure responses considered previous staff enumeration methods . Upon request, CSTE provided states their exact responses from 2013 via email .
Because not all states were able to complete the assessment by May 31, the assessment deadline was extended to August 11, 2017 . CSTE staff reached out to states via email to request necessary revisions for data validation and to address incomplete responses . State Epidemiologists were asked to revise and resubmit unclear or incomplete responses using a new electronic link with the previous responses pre-populated .
Definitions and response options
EpidemiologistForpurposesoftheassessment,thedefinitionof an epidemiologist remained unchanged between 2013 and 2017 . State Epidemiologists were instructed to count as epidemiologists “all those employed by the state; all those working at the state level who are either federal assignees (e.g. EISO, CEFO, PHAP) or contract employees (e.g. CSTE trainee, contracted from school of public health to work at or for the State Health Department); and state employees assigned to work at a local or regional level (e.g. to conduct investigations for a region of the state).” The instructions also requested that “[when] considering who should be counted, please focus on the functions performed by the individual rather than the job title. Reference the Applied Epidemiology Competencies (AECs) for examples of epidemiology job functions if you need assistance in determining the status of an employee.”
A pop-up tab link within the assessment instructions contained additional information regarding who should be counted as an epidemiologist . This link opened to a PDF documentreferencingJohnM.Last’sdefinition
(2001), which states that an epidemiologist is “an investigator who studies the occurrence of disease or other health related conditions or events in defined populations. The control of disease in populations is often also considered to be a task for the epidemiologist.” Thedocumentdefinesepidemiologyasthe“study of the distribution and determinants of health-related states or events in specified populations, and the application of this study to control of health problems.”
In some states, epidemiologists are employed by agencies other than the health department . For example, occupational health epidemiology is sometimes housed in the department of labor . In such cases, the epidemiologists working at agencies outside the state health department were excluded from this analysis .
Capacity in the Essential Public Health Services (EPHS) Adequateepidemiologycapacitywasdefinedas that which assures the state health department’s ability to lead activities, provide subject matter expertise, and apply for, receive, and manage resources to conduct key activities . The following scale was used to measure both overall capacity to carry out the four epidemiology-related EPHS (i .e ., monitoring health status, investigating community health problems and hazards, evaluating the effectiveness of public health interventions, and conduct research) and capacitywithinspecificprogramareas: None: 0% adequate epidemiological capacity
to provide this/the four EPHS . Minimal: 1-24% adequate epidemiological
capacity to provide this/the four EPHS . Partial: 25-49% adequate epidemiological
capacity to provide this/the four EPHS . Substantial: 50-74% adequate
epidemiological capacity to provide this/the four EPHS .
Almost full: 75-99% adequate epidemiological capacity to provide this/the four EPHS .
Full: 100% adequate epidemiological capacity to provide this/the four EPHS .
For purposes of analysis and comparability with previous ECAs, responses were grouped as none to minimal, partial, and substantial to full .
Me
tho
ds
20
20
17
Ep
ide
mio
log
y C
ap
ac
ity A
ss
es
sm
en
t Re
po
rt
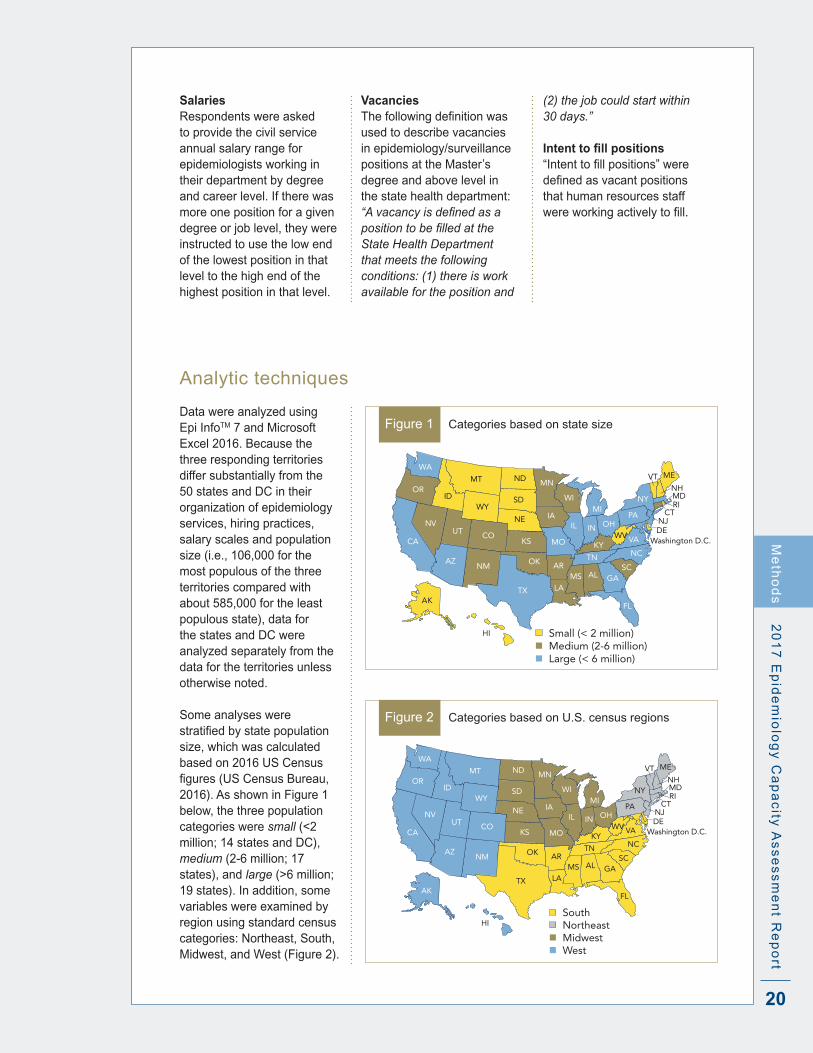
SalariesRespondents were asked to provide the civil service annual salary range for epidemiologists working in their department by degree and career level . If there was more one position for a given degree or job level, they were instructed to use the low end of the lowest position in that level to the high end of the highest position in that level .
VacanciesThefollowingdefinitionwasused to describe vacancies in epidemiology/surveillance positions at the Master’s degree and above level in the state health department: “A vacancy is defined as a position to be filled at the State Health Department that meets the following conditions: (1) there is work available for the position and
Figure 1 Categories based on state size
OK
GA
VA
NY
FL
NM
TX
KS
NE
SD
NDMT
WY
COUT
ID
AZ
NV
WA
CA
OR
KY
ME
PAMI
MD
CT
WVOHINIL
NCTNSC
ALMSAR
LA
MO
IA
MN
WI
NJ
VTNH
Washington D.C.
Small (< 2 million) Medium (2-6 million) Large (< 6 million)
AK
HI
RI
DE
(2) the job could start within 30 days.”
Intent to fill positions“Intenttofillpositions”weredefinedasvacantpositionsthat human resources staff wereworkingactivelytofill.
Analytic techniques
Data were analyzed using Epi InfoTM 7 and Microsoft Excel 2016 . Because the three responding territories differ substantially from the 50 states and DC in their organization of epidemiology services, hiring practices, salary scales and population size (i .e ., 106,000 for the most populous of the three territories compared with about 585,000 for the least populous state), data for the states and DC were analyzed separately from the data for the territories unless otherwise noted .
Some analyses were stratifiedbystatepopulationsize, which was calculated based on 2016 US Census figures(USCensusBureau,2016) . As shown in Figure 1 below, the three population categories were small (<2 million; 14 states and DC), medium (2-6 million; 17 states), and large (>6 million; 19 states) . In addition, some variables were examined by region using standard census categories: Northeast, South, Midwest, and West (Figure 2) .
Figure 2 Categories based on U .S . census regions
OK
GA
VA
NY
FL
NM
TX
KS
NE
SD
NDMT
WY
COUT
ID
AZ
NV
WA
CA
OR
KY
ME
PAMI
MD
CT
WVOHINIL
NCTNSC
ALMSAR
LA
MO
IA
MN
WI
NJ
VTNH
Washington D.C.
South Northeast Midwest West
AK
HI
RI
DE
Me
tho
ds

21
20
17
Ep
ide
mio
log
y C
ap
ac
ity
As
se
ss
me
nt
Re
po
rt
The total number of epidemiologists was derived from a matrix in the questionnaire that asked for the number of FTEs by program area and source of funding . An other category was included for positions that did not fall within one of the 13 program areas . As in previous ECAs, two methods were used to calculate the number of epidemiologists/100,000 population by state population size and by region . In the first,expressedasepidemiologists/100,000,the total number of epidemiologists in the subgroup (e .g ., Midwestern states) was divided by the total population of that subgroup (e .g ., total Midwest population) . In the second method, referred to as median number of epidemiologists/100,000 population, the numberofepidemiologists/100,000wasfirstcalculated for each individual state, and the median for all states in the subgroup was identified.
For some variables, trends were assessed using data from the four ECAs in the past 13 years (i .e ., 2004, 2006, 2009/2010, 2013) plus data from 2017; for other variables, only 2013 and2017findingswereexamined.The2001data were excluded because only 39 states participated, making temporal comparisons problematic . Where relevant, prevalence rate ratios, chi square tests, and the Kruskal-Wallis tests were used to examine differences among groups .
Responses from the open-ended question, As the State Epidemiologist, what are the most critical issues you face?, were coded and grouped thematically by two CSTE staff and by a CSTE consultant . The three separate analyses were compared for intercoder reliability, and differences were discussed and addressed .
Me
tho
ds

RESULTS
23
20
17
Ep
ide
mio
log
y C
ap
ac
ity A
ss
es
sm
en
t Re
po
rt
Results
Epidemiology leadership within the health department
Response rates and characteristics of participating State and Territorial Epidemiologists
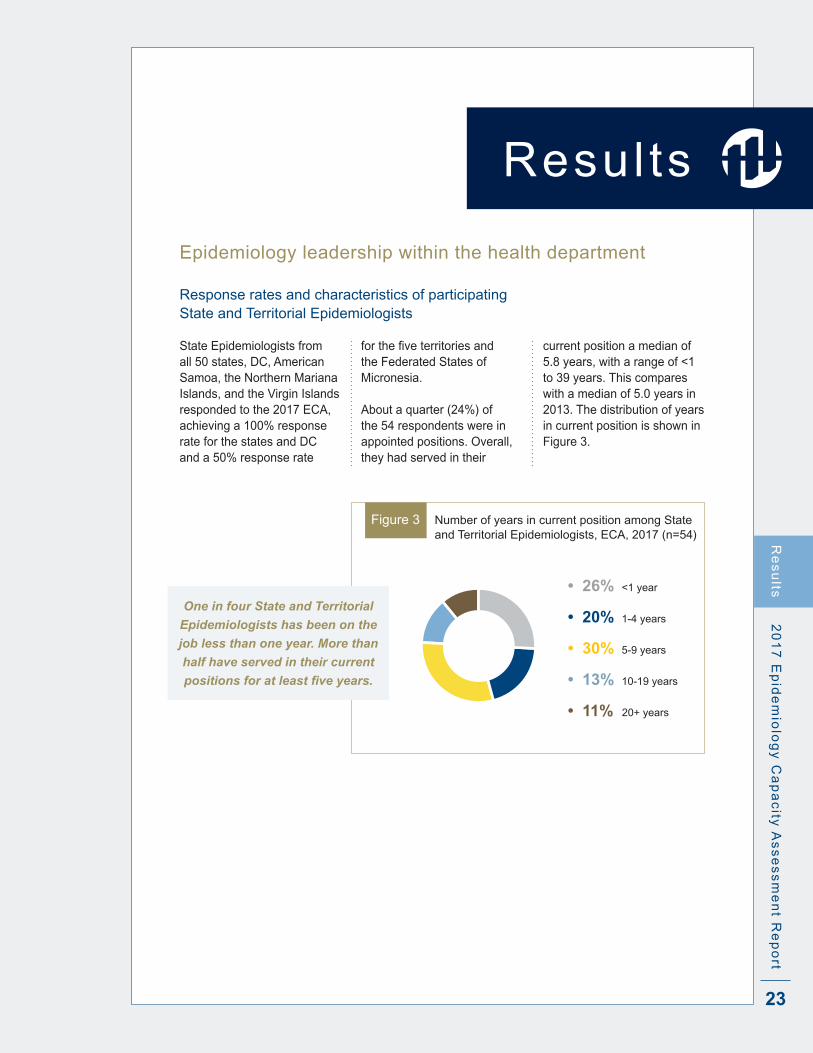
Figure 3 Number of years in current position among State and Territorial Epidemiologists, ECA, 2017 (n=54)
• 26% <1 year
• 20% 1-4 years
• 30% 5-9 years
• 13% 10-19 years
• 11% 20+ years
One in four State and Territorial
Epidemiologists has been on the
job less than one year. More than
half have served in their current
positions for at least five years.
State Epidemiologists from all 50 states, DC, American Samoa, the Northern Mariana Islands, and the Virgin Islands responded to the 2017 ECA, achieving a 100% response rate for the states and DC and a 50% response rate
forthefiveterritoriesandthe Federated States of Micronesia .
About a quarter (24%) of the 54 respondents were in appointed positions . Overall, they had served in their
current position a median of 5 .8 years, with a range of <1 to 39 years . This compares with a median of 5 .0 years in 2013 . The distribution of years in current position is shown in Figure 3 .
Re
su
lts
24
20
17
Ep
ide
mio
log
y C
ap
ac
ity
As
se
ss
me
nt
Re
po
rt
Infectious disease
MCH
Chronic disease
Injuries
Environmental health
Vital statistics
Preparedness
Oral health
Substance abuse
Occupational health
Informatics
Mental Health
Genomics
0 20 40 60 80 100
6%
14%
37%
37%
49%
51%
59%
59%
65%
71%
86%
92%
98%
Figure 4 Presence of lead epidemiologists by program area, 50 states and DC, ECA 2017
Re
su
lts
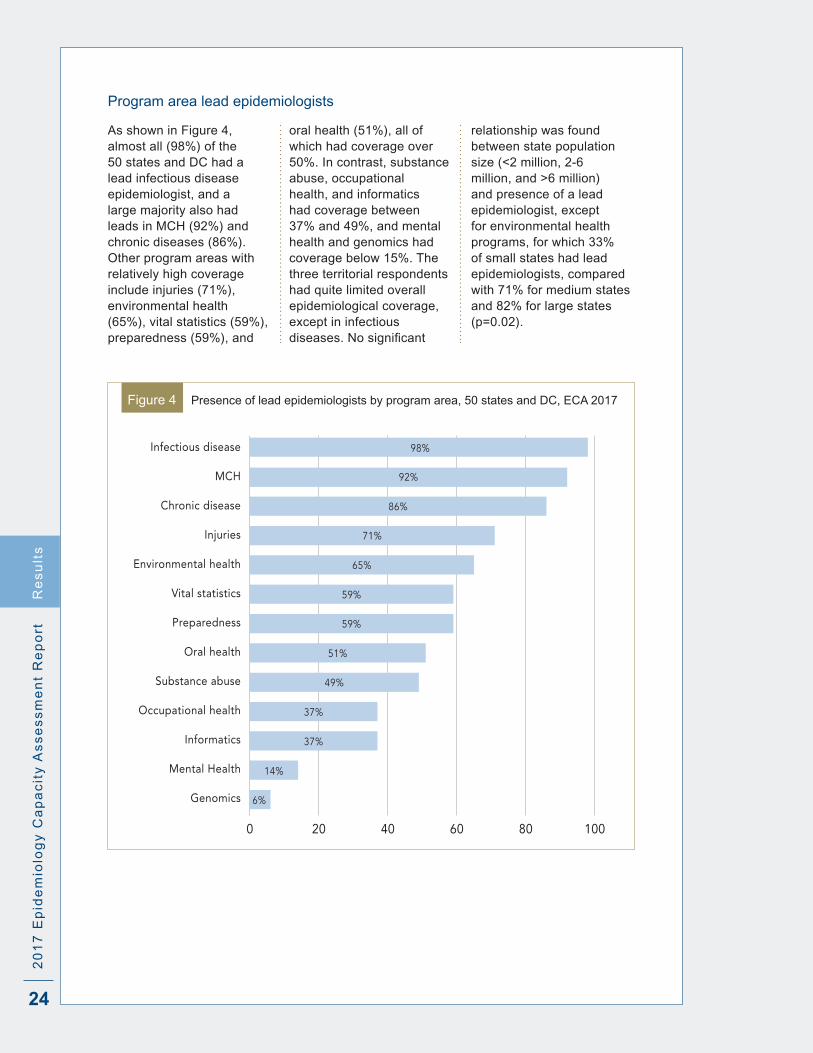
Program area lead epidemiologists
As shown in Figure 4, almost all (98%) of the 50 states and DC had a lead infectious disease epidemiologist, and a large majority also had leads in MCH (92%) and chronic diseases (86%) . Other program areas with relatively high coverage include injuries (71%), environmental health (65%), vital statistics (59%), preparedness (59%), and
oral health (51%), all of which had coverage over 50% . In contrast, substance abuse, occupational health, and informatics had coverage between 37% and 49%, and mental health and genomics had coverage below 15% . The three territorial respondents had quite limited overall epidemiological coverage, except in infectious diseases.Nosignificant
relationship was found between state population size (<2 million, 2-6 million, and >6 million) and presence of a lead epidemiologist, except for environmental health programs, for which 33% of small states had lead epidemiologists, compared with 71% for medium states and 82% for large states (p=0 .02) .

25
20
17
Ep
ide
mio
log
y C
ap
ac
ity A
ss
es
sm
en
t Re
po
rtR
es
ults
Trends in the presence of program area leads
Infectious disease
MCH
Chronic disease
Injuries
Environmental health
Vital statistics
Preparedness
Oral health
Substance abuse
Occupational health
Mental Health
Genomics
0 20 40 60 80 10010 30 50 70 90
98%94%
92%78%
86%78%
71%61%
65%69%
59%61%
59%53%
51%53%
49%16%
37%45%
14%2%
6%6%
20172013
Figure 5 Trends in presence of program area leads, 2013 and 2017, 50 states + DC, ECA
Between 2013 and 2017, the percentage of state jurisdictions with a lead substance abuse epidemiologist rose three-fold, from 16% to 49% (p=0 .0003) (Figure 5) . Similarly, the percentage
of states with a mental health lead rose seven-fold, from 2% to 14% (p=0 .03) . MCH also experienced an increase, from 78% to 92% of states a program lead (p=0 .05) . There have been small but non-
significantincreasesinmostareas,andnon-significantdecreases have occurred in occupational health (from 45% to 37%) and environmental health (from 69% to 65%) .
State substance abuse and mental health programs saw
the greatest increases in lead epidemiologists nationwide.
In contrast, occupational health and environmental health
programs lost epidemiology leads.

26
20
17
Ep
ide
mio
log
y C
ap
ac
ity
As
se
ss
me
nt
Re
po
rt
Epidemiology staffing and funding within health departments
Staffing
Table 1 Number and range of epidemiologists, median number of epidemiologists, rates/100,000 and median rates by state size and region .
Category Number of states
Number of epidemiologists
Range, number epidemiologists/
state
Median number/
state
Rate/ 100,000‡
Median rate/
100,000^
United States 51 3370 5-208 59 1 .0 N/A
State size*
Small# 15 406 8-102 23 2 .4 2 .3
Medium 17 997 5-118 55 1 .5 1 .4
Large 19 1967 29-208 93 0 .8 0 .9
Geographic area
Northeast 9 711 19-208 58 1 .3 1 .8
Midwest 12 684 9-142 61 1 .0 1 .2
South 17 1209 13-136 71 1 .0 1 .2
West 13 766 5-195 59 1 .0 1 .5
*Small:<2million,medium:2-6million;large:>6million;seeFigure1formap.Populationfiguresfrom2016US Census estimates
‡Based on sum of all epidemiologists within a category and total population in that category^Medianofstate-specificrates/100,000#Kruksal-Wallis for difference between median rate/100,000 = 0 .002
Numbers of epidemiologists and rates per 100,000 populationIn 2017, US state health departments employed 3,370
epidemiologists, compared with 2,752 in 2013—a 22% increase (Table 1) . The number of epidemiologists per state ranged from 5 to 208 .
And the overall number per 100,000 population was 1 .04, 20% higher than in 2013, when the ECA documented 0 .87 epidemiologists/100,000 .
As shown in Table 1, more populous states had a higher median number of epidemiologists than less populous states, although the ranges varied widely and overlapped among the three size categories . Moreover, as state population increased, the number of epidemiologists per 100,000 population decreased: small states
had three times as many epidemiologists/100,000 as large states, while medium-sized states had nearly twice as many . Of note, the South had a greater median number of epidemiologists per state, but the Northeast had a higher rate, at 1 .3/100,000 . Sixstateshad≤0.5epidemi-ologists/100,000, four of which had populations over 6 million .
Health departments in American Samoa, the Northern Mariana Islands, and the Virgin Islands reported having a combined total of 16 epidemiologists on staff .
Re
su
lts

27
20
17
Ep
ide
mio
log
y C
ap
ac
ity A
ss
es
sm
en
t Re
po
rt
The number of
epidemiologists increased by
22% between 2013 and 2017,
while the number per 100,000
population increased 20%.
Number of epidemiologists by program areaOverall, the greatest number of state health department epidemiologists—1,838 (55%)—worked in infectious diseases in 2017 (Figure 6) . MCH and chronic diseases each accounted for approximately 9% of the total . In contrast, substance abuse, occupational health, oral health, genomics, and mental health together represented 3% of the total .
Infectious disease
Maternal-child health
Chronic disease
Environmental health
Other
Preparedness
Vital statistics
Injury
Informatics
Substance abuse
Occupational health
Oral health
Genomics
Mental Health
0 400 800 1200 1600 2000
1838
200 600 1000 1400 1800
321
304
222
143
118
111
103
96
59
28
18
Number of epidemiologists
4
4
Figure 6 Number of epidemiologists by program area, 50 States + DC, ECA, 2017 .
2013 ECA data were not available for genomics, vital statistics, and informatics; the firsttwowerecollectedbutwereanalyzedinan“other”category,whileinformaticswasadded in 2017 . Between 2013 and 2017, state health agencies added 487 infectious disease epidemiology positions, a 36% increase and the largest numerical increase by program area . Similarly, health agencies added 48 injury prevention epidemiologists, an 88% increase and the largest relative increase by program area . In contrast, preparedness lost 144 epidemiologists, a 55% decrease . Chronic disease lost 50, representing a 14% decrease, and occupational health lost 10, a 26% decrease since 2013 .
Fifty-five percent of all
state health department
epidemiologists work
in infectious diseases,
representing a 36% increase
since 2013. The number of
preparedness and chronic
disease epidemiologists
decreased since 2013.
Re
su
lts
28
20
17
Ep
ide
mio
log
y C
ap
ac
ity
As
se
ss
me
nt
Re
po
rt
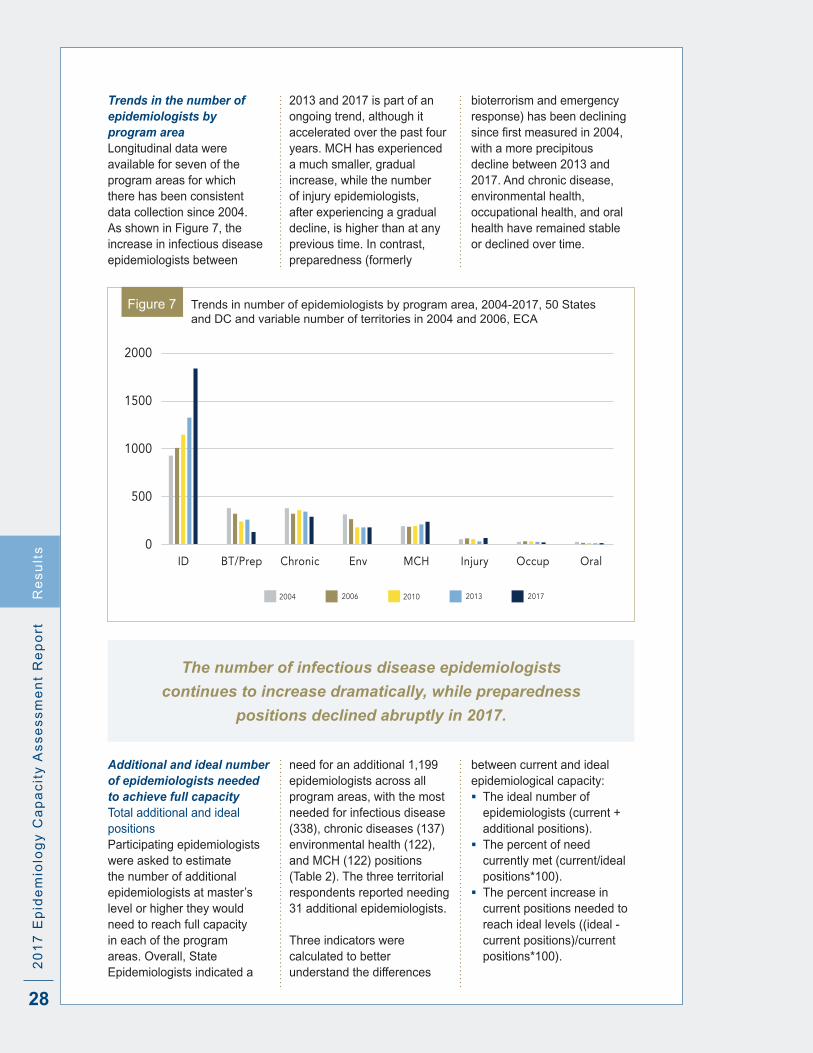
Trends in the number of epidemiologists by program areaLongitudinal data were available for seven of the program areas for which there has been consistent data collection since 2004 . As shown in Figure 7, the increase in infectious disease epidemiologists between
2013 and 2017 is part of an ongoing trend, although it accelerated over the past four years . MCH has experienced a much smaller, gradual increase, while the number of injury epidemiologists, after experiencing a gradual decline, is higher than at any previous time . In contrast, preparedness (formerly
bioterrorism and emergency response) has been declining sincefirstmeasuredin2004,with a more precipitous decline between 2013 and 2017 . And chronic disease, environmental health, occupational health, and oral health have remained stable or declined over time .
2000
1500
1000
500
0Chronic Env MCH Injury Occup Oral
20062004 20132010 2017
BT/PrepID
Figure 7 Trends in number of epidemiologists by program area, 2004-2017, 50 States and DC and variable number of territories in 2004 and 2006, ECA
The number of infectious disease epidemiologists
continues to increase dramatically, while preparedness
positions declined abruptly in 2017.
Additional and ideal number of epidemiologists needed to achieve full capacityTotal additional and ideal positionsParticipating epidemiologists were asked to estimate the number of additional epidemiologists at master’s level or higher they would need to reach full capacity in each of the program areas . Overall, State Epidemiologists indicated a
need for an additional 1,199 epidemiologists across all program areas, with the most needed for infectious disease (338), chronic diseases (137) environmental health (122), and MCH (122) positions (Table 2) . The three territorial respondents reported needing 31 additional epidemiologists .
Three indicators were calculated to better understand the differences
between current and ideal epidemiological capacity: The ideal number of
epidemiologists (current + additional positions) .
The percent of need currently met (current/ideal positions*100) .
The percent increase in current positions needed to reach ideal levels ((ideal - current positions)/current positions*100) .
Re
su
lts
29
20
17
Ep
ide
mio
log
y C
ap
ac
ity A
ss
es
sm
en
t Re
po
rt
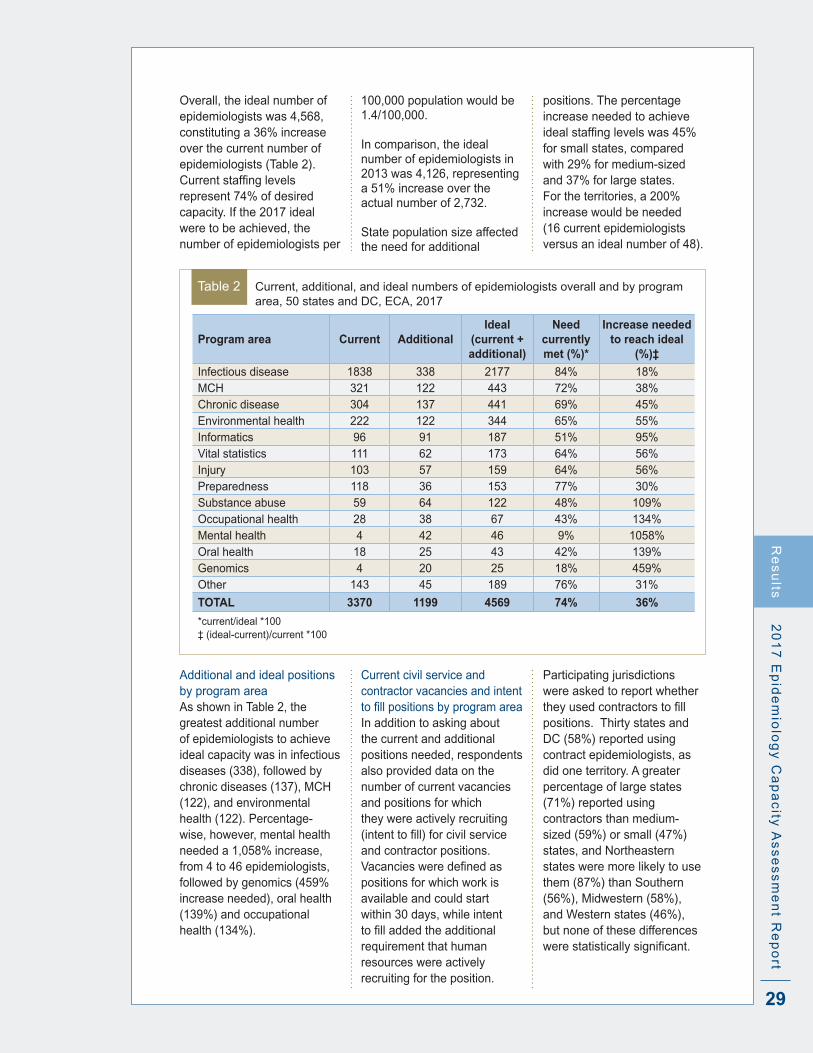
Overall, the ideal number of epidemiologists was 4,568, constituting a 36% increase over the current number of epidemiologists (Table 2) . Currentstaffinglevelsrepresent 74% of desired capacity . If the 2017 ideal were to be achieved, the number of epidemiologists per
100,000 population would be 1 .4/100,000 .
In comparison, the ideal number of epidemiologists in 2013 was 4,126, representing a 51% increase over the actual number of 2,732 . State population size affected the need for additional
positions . The percentage increase needed to achieve idealstaffinglevelswas45%for small states, compared with 29% for medium-sized and 37% for large states . For the territories, a 200% increase would be needed (16 current epidemiologists versus an ideal number of 48) .
Table 2 Current, additional, and ideal numbers of epidemiologists overall and by program area, 50 states and DC, ECA, 2017
Program area Current AdditionalIdeal
(current + additional)
Need currently met (%)*
Increase needed to reach ideal
(%)‡
Infectious disease 1838 338 2177 84% 18%MCH 321 122 443 72% 38%Chronic disease 304 137 441 69% 45%Environmental health 222 122 344 65% 55%Informatics 96 91 187 51% 95%Vital statistics 111 62 173 64% 56%Injury 103 57 159 64% 56%Preparedness 118 36 153 77% 30%Substance abuse 59 64 122 48% 109%Occupational health 28 38 67 43% 134%Mental health 4 42 46 9% 1058%Oral health 18 25 43 42% 139%Genomics 4 20 25 18% 459%Other 143 45 189 76% 31%
TOTAL 3370 1199 4569 74% 36%
*current/ideal *100‡ (ideal-current)/current *100
Additional and ideal positions by program areaAs shown in Table 2, the greatest additional number of epidemiologists to achieve ideal capacity was in infectious diseases (338), followed by chronic diseases (137), MCH (122), and environmental health (122) . Percentage-wise, however, mental health needed a 1,058% increase, from 4 to 46 epidemiologists, followed by genomics (459% increase needed), oral health (139%) and occupational health (134%) .
Current civil service and contractor vacancies and intent tofillpositionsbyprogramareaIn addition to asking about the current and additional positions needed, respondents also provided data on the number of current vacancies and positions for which they were actively recruiting (intenttofill)forcivilserviceand contractor positions . Vacanciesweredefinedaspositions for which work is available and could start within 30 days, while intent tofilladdedtheadditionalrequirement that human resources were actively recruiting for the position .
Participating jurisdictions were asked to report whether theyusedcontractorstofillpositions . Thirty states and DC (58%) reported using contract epidemiologists, as did one territory . A greater percentage of large states (71%) reported using contractors than medium-sized (59%) or small (47%) states, and Northeastern states were more likely to use them (87%) than Southern (56%), Midwestern (58%), and Western states (46%), but none of these differences werestatisticallysignificant.
Re
su
lts

30
20
17
Ep
ide
mio
log
y C
ap
ac
ity
As
se
ss
me
nt
Re
po
rt
Table 3 Vacantandintent-to-fillcivilserviceandcontractorpositions,50statesandDC,ECA, 2017
Civil Service ContractorTotal
VacantTotal Intent
to FillProgram area VacantIntent to Fill
VacantIntent to
Fill
Infectious disease 131 114 28 27 159 141
MCH 41 34 4 4 45 38
Chronic disease 36 32 6 5 42 37
Environmental health 18 13 5 5 23 18
Informatics 14 13 1 1 15 14
Vital statistics 12 12 1 1 13 13
Injury 10 11 1 2 11 13
Preparedness 9 10 0 0 10 11
Substance abuse 9 6 0 0 9 6
Occupational health 6 4 2 2 8 6
Mental health 6 6 0 0 6 6
Oral health 2 1 1 1 3 2
Genomics 1 2 0 1 1 3
Other 10 7 0 0 10 7
TOTAL 305 265 49 49 353 314
Of 353 vacant epidemiology positions nationally, health departments are actively recruiting for 314 (89%), whichthey“intendtofill”—including 87% of the 305 vacant civil service positions and 100% of the 49 vacant contractor positions (Table 3) . Collectively, infectious disease programs have the greatest number of epidemiology vacancies (159), followed by chronic diseases (45) and MCH (42) . All 11 territorial
vacancies were in infectious diseases; 100% were intendedtobefilled.
The 1,199 new positions State Epidemiologists report necessary to achieve full epidemiologic capacity far outnumber the 353 vacancies (Table 3) . Overall, the 314 positions in the process of beingfilledrepresent26%ofthis unmet need . Adding in the 39 vacant positions that health agencies do not intend
tofillwouldraisethisfigureto29% of unmet need .
Filling all current vacancies would eliminate 47% of unmet need for infectious disease programs nationwide, 37% of unmet need for preparedness, 34% for MCH, 33% for chronic disease, 14% for substance abuse, 12% for informatics, 8% for occupational health and 3% for mental health .
If all currently vacant epidemiologist positions were
filled, the gap between current and ideal numbers of
epidemiologists would narrow by almost 30%.
Re
su
lts
31
20
17
Ep
ide
mio
log
y C
ap
ac
ity A
ss
es
sm
en
t Re
po
rt
Funding
Epidemiology activitiesAs shown in Figure 8, federal funds constituted more than three-quarters (77%) of funding for all epidemiologic activities in state public health programs, with a range of 46% to 99% . States contributed an average of 19% (4% to 50%)
of epidemiologic funding, while other external sources accounted for a small fraction of the total in most states . Sources of funding of epidemiologic personnel were virtually identical to those for epidemiologic activities . Only 23 states and DC received
funds from other sources for epidemiologic activities, and 25 received such funds for epidemiology personnel . The three territorial respondents received nearly 100% of their funding from the federal government .
Re
su
lts
Federal
State
Other
Federal
State
Other
0 20 40 60 80 10010 30 50 70 90
% of total funding
Act
iviti
esPe
rson
nel
77.4% (46-99%)
18.6% (4-50%)
4.0% (0-32%)
76.6% (46-95%)
19.7% (4-50%)
3.7% (0-36%)
Figure 8 Mean percent and range of sources of funding for activities and epidemiological personnel, 50 states + DC, ECA, 2017
Three out of every four dollars for epidemiologic
activities and funding come from federal sources.
State contributions average only 20%.
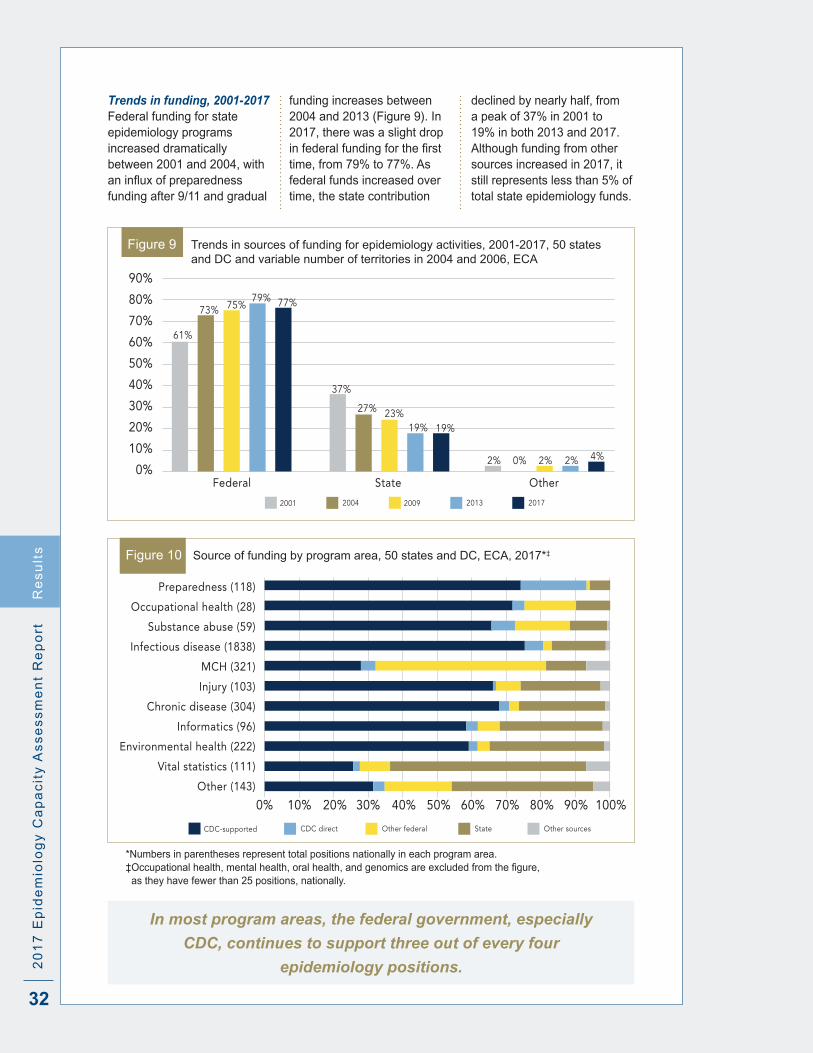
32
20
17
Ep
ide
mio
log
y C
ap
ac
ity
As
se
ss
me
nt
Re
po
rt
Trends in funding, 2001-2017Federal funding for state epidemiology programs increased dramatically between 2001 and 2004, with aninfluxofpreparednessfunding after 9/11 and gradual
funding increases between 2004 and 2013 (Figure 9) . In 2017, there was a slight drop infederalfundingforthefirsttime, from 79% to 77% . As federal funds increased over time, the state contribution
declined by nearly half, from a peak of 37% in 2001 to 19% in both 2013 and 2017 . Although funding from other sources increased in 2017, it still represents less than 5% of total state epidemiology funds .
90%
80%
70%
60%
50%
40%
30%
20%
10%
0%State Other
20042001 20132009 2017
Federal
37%
27% 23%19% 19%
61%
73% 75%79% 77%
2% 2% 2% 4%0%
Figure 9 Trends in sources of funding for epidemiology activities, 2001-2017, 50 states and DC and variable number of territories in 2004 and 2006, ECA
Preparedness (118)
Occupational health (28)
Substance abuse (59)
Infectious disease (1838)
MCH (321)
Injury (103)
Chronic disease (304)
Informatics (96)
Environmental health (222)
Vital statistics (111)
Other (143)
0% 20% 40% 60% 80% 100%10% 30% 50% 70% 90%
CDC directCDC-supported Other federal State Other sources
Figure 10 Source of funding by program area, 50 states and DC, ECA, 2017*‡
*Numbers in parentheses represent total positions nationally in each program area .‡Occupationalhealth,mentalhealth,oralhealth,andgenomicsareexcludedfromthefigure,
as they have fewer than 25 positions, nationally .
In most program areas, the federal government, especially
CDC, continues to support three out of every four
epidemiology positions.
Re
su
lts
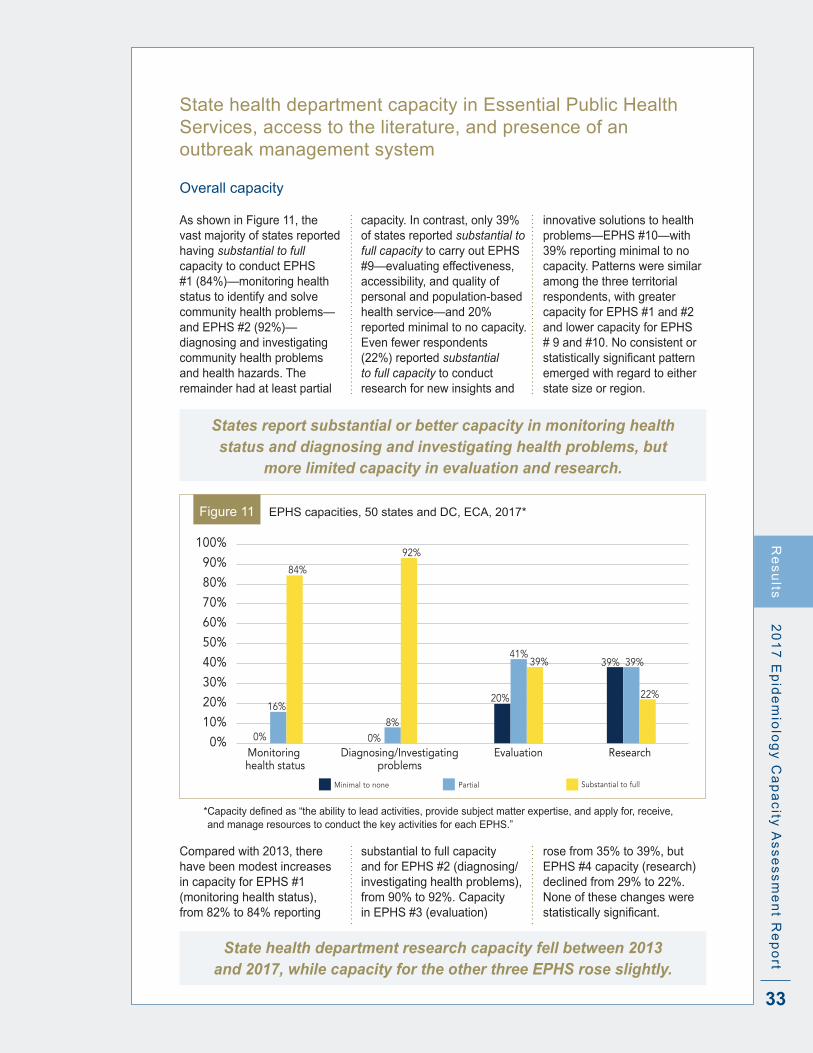
33
20
17
Ep
ide
mio
log
y C
ap
ac
ity A
ss
es
sm
en
t Re
po
rtR
es
ults
State health department capacity in Essential Public Health Services, access to the literature, and presence of an outbreak management system
Overall capacity
As shown in Figure 11, the vast majority of states reported having substantial to full capacity to conduct EPHS #1 (84%)—monitoring health status to identify and solve community health problems—and EPHS #2 (92%)—diagnosing and investigating community health problems and health hazards . The remainder had at least partial
capacity . In contrast, only 39% of states reported substantial to full capacity to carry out EPHS #9—evaluating effectiveness, accessibility, and quality of personal and population-based health service—and 20% reported minimal to no capacity . Even fewer respondents (22%) reported substantial to full capacity to conduct research for new insights and
innovative solutions to health problems—EPHS #10—with 39% reporting minimal to no capacity . Patterns were similar among the three territorial respondents, with greater capacity for EPHS #1 and #2 and lower capacity for EPHS # 9 and #10 . No consistent or statisticallysignificantpatternemerged with regard to either state size or region .
States report substantial or better capacity in monitoring health status and diagnosing and investigating health problems, but
more limited capacity in evaluation and research.
100%
90%
80%
70%
60%
50%
40%
30%
20%
10%
0%Diagnosing/Investigating
problemsEvaluation
Minimal to none Partial Substantial to full
Monitoring health status
0%
16%
84%
Research0%
8%
92%
41%
20%
39% 39%39%
22%
Figure 11 EPHS capacities, 50 states and DC, ECA, 2017*
*Capacitydefinedas“theabilitytoleadactivities,providesubjectmatterexpertise,andapplyfor,receive,and manage resources to conduct the key activities for each EPHS .”
Compared with 2013, there have been modest increases in capacity for EPHS #1 (monitoring health status), from 82% to 84% reporting
substantial to full capacity and for EPHS #2 (diagnosing/investigating health problems), from 90% to 92% . Capacity in EPHS #3 (evaluation)
rose from 35% to 39%, but EPHS #4 capacity (research) declined from 29% to 22% . None of these changes were statisticallysignificant.
State health department research capacity fell between 2013 and 2017, while capacity for the other three EPHS rose slightly.
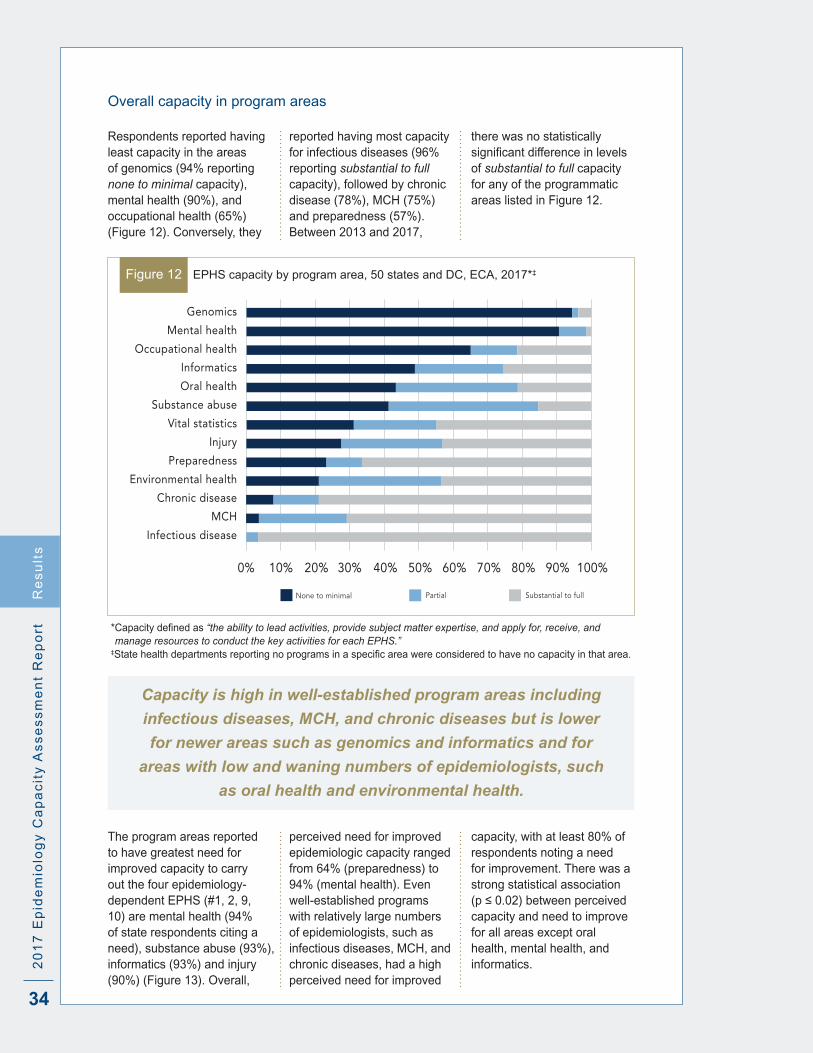
34
20
17
Ep
ide
mio
log
y C
ap
ac
ity
As
se
ss
me
nt
Re
po
rt
Overall capacity in program areas
Respondents reported having least capacity in the areas of genomics (94% reporting none to minimal capacity), mental health (90%), and occupational health (65%) (Figure 12) . Conversely, they
reported having most capacity for infectious diseases (96% reporting substantial to full capacity), followed by chronic disease (78%), MCH (75%) and preparedness (57%) . Between 2013 and 2017,
there was no statistically significantdifferenceinlevelsof substantial to full capacity for any of the programmatic areas listed in Figure 12 .
Genomics
Mental health
Occupational health
Informatics
Oral health
Substance abuse
Vital statistics
Injury
Preparedness
Environmental health
Chronic disease
MCH
Infectious disease
0% 20% 40% 60% 80% 100%10% 30% 50% 70% 90%
PartialNone to minimal Substantial to full
Figure 12 EPHS capacity by program area, 50 states and DC, ECA, 2017*‡
*Capacitydefinedas“the ability to lead activities, provide subject matter expertise, and apply for, receive, and manage resources to conduct the key activities for each EPHS.”
‡ Statehealthdepartmentsreportingnoprogramsinaspecificareawereconsideredtohavenocapacityinthatarea.
Capacity is high in well-established program areas including
infectious diseases, MCH, and chronic diseases but is lower
for newer areas such as genomics and informatics and for
areas with low and waning numbers of epidemiologists, such
as oral health and environmental health.
The program areas reported to have greatest need for improved capacity to carry out the four epidemiology-dependent EPHS (#1, 2, 9, 10) are mental health (94% of state respondents citing a need), substance abuse (93%), informatics (93%) and injury (90%) (Figure 13) . Overall,
perceived need for improved epidemiologic capacity ranged from 64% (preparedness) to 94% (mental health) . Even well-established programs with relatively large numbers of epidemiologists, such as infectious diseases, MCH, and chronic diseases, had a high perceived need for improved
capacity, with at least 80% of respondents noting a need for improvement . There was a strong statistical association (p≤0.02)betweenperceivedcapacity and need to improve for all areas except oral health, mental health, and informatics .
Re
su
lts

35
20
17
Ep
ide
mio
log
y C
ap
ac
ity A
ss
es
sm
en
t Re
po
rt
0% 20% 40% 60% 80% 100%10% 30% 50% 70% 90%
Mental Health (32)Substance abuse (48)
Informatics (47)Injury (51)
Chronic disease (51)Environmental health (49)Occupational health (36)
MCH (51)Infectious disease (51)
Genomics (26)Oral health (48)
Vital statistics (48)Preparedness (50) 64%
73%
74%
80%
80%
84%
85%
88%
88%
90%
93%
93%
94%
Figure 13 Perceived need to improve EPHS capacity by program area, 50 states and DC, ECA, 2017*
*Values in parentheses represent number of states responding .
As shown in Figure 14, the programmatic areas most frequentlyidentifiedasahigh priority for improving capacity were substance abuse (63%) and informatics (53%), while thoseidentifiedleastfrequently
were genomics (12%), oral health (8%), and occupational health (8%) . Perceived need for improvement and high priorities were not closely linked, although programs with greatest perceived need
were, with some exceptions, also accorded high priority status for improvement and those with lower perceived need with lower priority status .
Substance abuse (48)Informatics (47)
Infectious disease (51)Mental Health (32)
Chronic disease (51)MCH (51)
Environmental health (49)Injury (51)
Preparedness (50)Vital statistics (48)
Genomics (26)Oral health (48)
Occupational health (36)
0% 20% 40% 60% 80% 100%10% 30% 50% 70% 90%
Medium priorityHigh priority Low or not a priority
Figure 14 Priority to improve EPHS capacity by program area, 50 states and DC, ECA, 2017*
*Values in parentheses represent number of states responding .
Perceived need for improvement exceeded 60% in all program areas
and was highest for mental health, substance abuse, and informatics.
State Epidemiologists most frequently cite substance abuse and
informatics programs as a “high priority” for improvement.
Re
su
lts

36
20
17
Ep
ide
mio
log
y C
ap
ac
ity
As
se
ss
me
nt
Re
po
rt
Access to the literature
Rapid access to articles from peer-reviewed journals that require a paid subscription (non-open access journals) is essential to research evidence-based practices
and to inform the response to community health problems . However, more than a quarter of respondents (27%) lack access to the non-open access literature . Among
those who did have access, the time required to obtain articles varied considerably, from 2 hours or less to more than 72 hours (Figure 15) .
Figure 15 Time required to access literature, 50 states and DC, ECA, 2017
• 25% ≤2hours
• 22% 12-23 hours
• 20% 24-72 hours
• 6% > 72 hours
• 27% No access
Less than half the states and DC
have access to non-open access
literature within 24 hours, while
more than one in four have no
access at all.
Large states were more likely to lack access to non-open access literature (41%) than medium (29%) or small (13%) states, but the differences are notstatisticallysignificant.The
lowestrateof“noaccess”wasfound in the 12 Midwestern states (8%), while the highest rate was in the 16 Southern states (50%; p=0 .02) . Two of the three territorial
respondents lacked access to the peer-reviewed literature, while the remaining one had access, but only after a delay of at least 72 hours from the time of the initial request .
Outbreak management system
More than half (69%) the states and DC reported using an outbreak management system—a substantial andstatisticallysignificant
increase from the 45% of states reporting such usage in 2013 (p=0 .02) . The three participating territories also used outbreak management
systems.Nosignificantdifferences were noted by state population size or region .
Salaries for civil service epidemiologists
Salaries by degree and career level
Respondents were asked to provide the minimum and maximum salaries for six degree-title categories and fivecareer-levelcategories.Table 4 shows the medians of the minimum and maximum salaries as well as the ranges of the minimum and maximum values in each category . Minimum and maximum epidemiology salaries increased with educational
attainment, although physician pay, which topped out at $291,000/year, was considerably higher than that for PhDs (who earned a maximum of $159,000/year) and DVMs ($180,000/year) . Salaries also increased with increasing career level, though deputy and State Epidemiologists had substantially higher median salary ranges than
epidemiologists at senior level and below . No consistent pattern emerged in minimum and maximum salary levels by state population size or by region . Although data were limited for the three participating territories, in general, territorial epidemiology salaries were lower than those for the states .
Re
su
lts
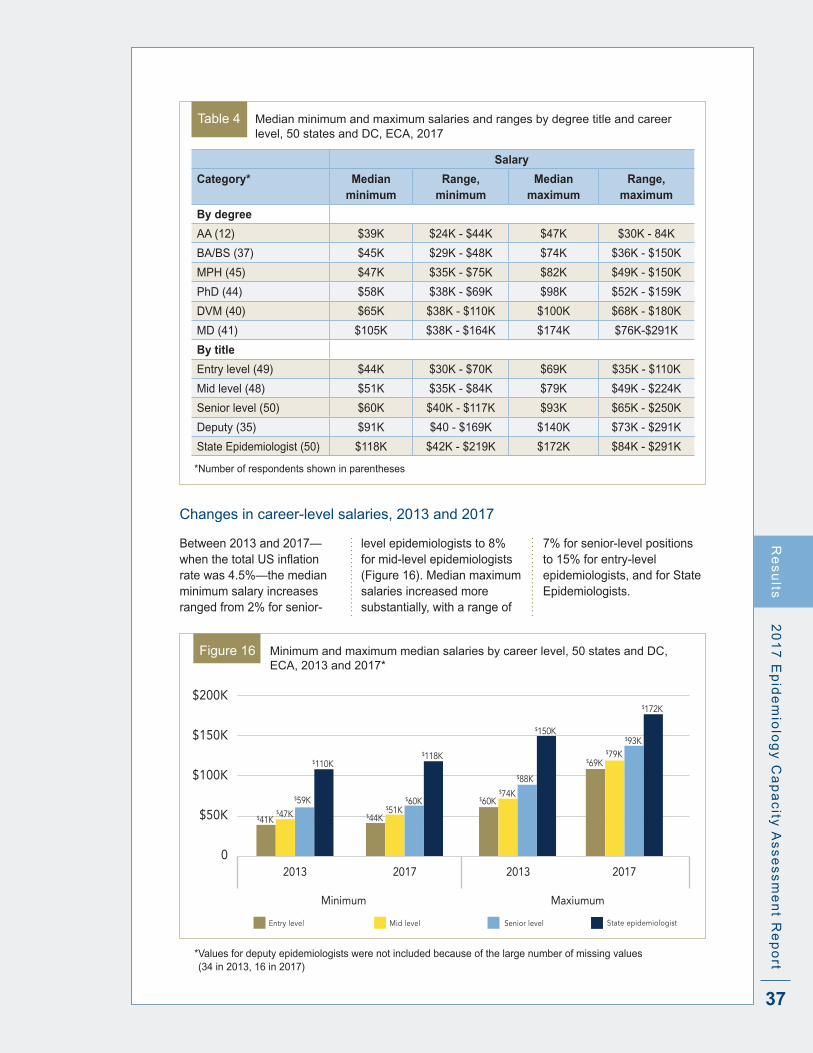
37
20
17
Ep
ide
mio
log
y C
ap
ac
ity A
ss
es
sm
en
t Re
po
rt
Table 4 Median minimum and maximum salaries and ranges by degree title and career level, 50 states and DC, ECA, 2017
Salary
Category* Median minimum
Range, minimum
Median maximum
Range, maximum
By degree
AA (12) $39K $24K - $44K $47K $30K - 84K
BA/BS (37) $45K $29K - $48K $74K $36K - $150K
MPH (45) $47K $35K - $75K $82K $49K - $150K
PhD (44) $58K $38K - $69K $98K $52K - $159K
DVM (40) $65K $38K - $110K $100K $68K - $180K
MD (41) $105K $38K - $164K $174K $76K-$291K
By title
Entry level (49) $44K $30K - $70K $69K $35K - $110K
Mid level (48) $51K $35K - $84K $79K $49K - $224K
Senior level (50) $60K $40K - $117K $93K $65K - $250K
Deputy (35) $91K $40 - $169K $140K $73K - $291K
State Epidemiologist (50) $118K $42K - $219K $172K $84K - $291K
*Number of respondents shown in parentheses
Changes in career-level salaries, 2013 and 2017
Between 2013 and 2017—whenthetotalUSinflationrate was 4 .5%—the median minimum salary increases ranged from 2% for senior-
level epidemiologists to 8% for mid-level epidemiologists (Figure 16) . Median maximum salaries increased more substantially, with a range of
7% for senior-level positions to 15% for entry-level epidemiologists, and for State Epidemiologists .
$200K
$150K
$100K
$50K
02017 2013
Mid level Senior level State epidemiologist
2013 2017
Entry level
Minimum Maxiumum
$41K$47K
$59K
$110K
$44K$51K
$60K
$118K
$60K$74K
$88K
$150K
$69K$79K
$93K
$172K
Figure 16 Minimum and maximum median salaries by career level, 50 states and DC, ECA, 2013 and 2017*
* Values for deputy epidemiologists were not included because of the large number of missing values (34 in 2013, 16 in 2017)
Re
su
lts

38
20
17
Ep
ide
mio
log
y C
ap
ac
ity
As
se
ss
me
nt
Re
po
rt
Epidemiology training and the Applied Epidemiology Competencies
Training in epidemiology
As seen in Table 5, almost all states and DC (94%) reported the availability of health department funding for formal training or education outside the organization, such as at conferences and seminars . On-site staff training (e .g ., seminars) and state health agency training/education for local epidemiologists were also commonly provided (by 86% and 82% of states, respectively), and 39% of states had one or more staff positions responsible for internal training . Three quarters of states (76%) considered education and training objectives in the performance review process; just 6% required continuing education in epidemiology .
In general, epidemiology training practices did not differ by state population size . However, 94% of medium-sized and large population states provided training to local epidemiologists, while only 57% of small states did so (p=0 .009) .
Two of the three responding territories paid for outside training and had staff positions for internal training . One of the three territories provided training for local epidemiologists, and another included education/training objectives in staff performance reviews .
Table 5 Agency efforts to provide and encourage training in epidemiology, 50 states and DC, ECA, 2017
Activity %
Paid outside formal training (conferences/seminars) 94%
On-site training (epidemiology seminars, etc .) 86%
Training or education for local epidemiologists 82%
Staff position(s) for internal training 39%
Education/training objectives in performance review 76%
Required continuing education 6%
Cross-training in informatics
As shown in Table 6, 80% of state health departments pay for formal informatics training . Almost half (47%) provide on-site training, and about a third (32%) provide informatics cross-training for local epidemiologists . In addition, nearly a quarter of state health departments (22%) have staff positions responsible for internal informatics cross-training . However, just 8% of states require cross-training in informatics . Overall, informatics cross-training
practices did not differ by state size, and there was no association between an agency’s perceived informatics capacity and
its support for informatics training . Territorial respondents offered few or no informatics cross-training activities .
Table 6 Agency efforts to provide and encourage cross-training in informatics for epidemiologists, 50 states and DC, ECA, 2017
Table 5 Agency efforts to provide and encourage training in epidemiology, 50 states and DC, ECA, 2017
Activity %
Paid outside formal training (conferences/seminars) 94%
On-site training (epidemiology seminars, etc .) 86%
Training or education for local epidemiologists 82%
Staff position(s) for internal training 39%
Education/training objectives in performance review 76%
Required continuing education 6%
Activity %
Paid outside formal training (conferences/seminars) 80%
Provide on-site informatics training (seminars, etc) 47%
Informatics cross-training for local epidemiologists 32%
Staff position(s) responsible for internal cross-training 22%
Required cross-training in informatics 8%
Re
su
lts
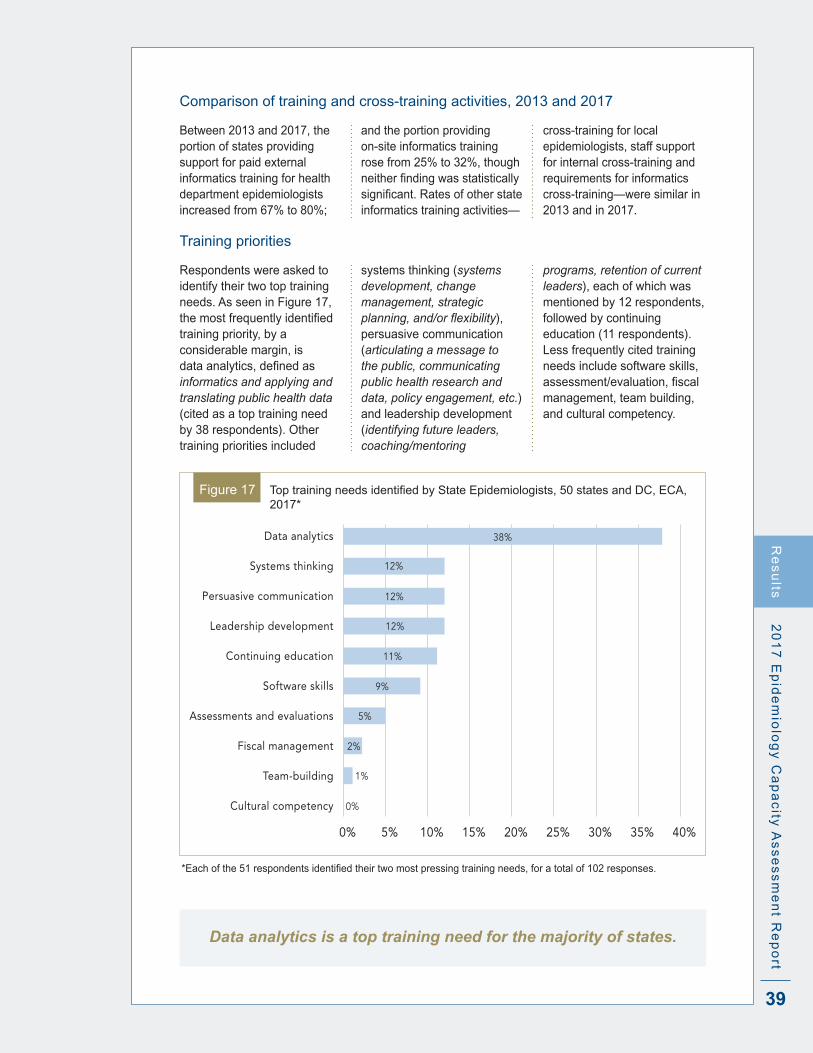
39
20
17
Ep
ide
mio
log
y C
ap
ac
ity A
ss
es
sm
en
t Re
po
rt
Comparison of training and cross-training activities, 2013 and 2017
Between 2013 and 2017, the portion of states providing support for paid external informatics training for health department epidemiologists increased from 67% to 80%;
and the portion providing on-site informatics training rose from 25% to 32%, though neitherfindingwasstatisticallysignificant.Ratesofotherstateinformatics training activities—
cross-training for local epidemiologists, staff support for internal cross-training and requirements for informatics cross-training—were similar in 2013 and in 2017 .
Training priorities
Respondents were asked to identify their two top training needs . As seen in Figure 17, themostfrequentlyidentifiedtraining priority, by a considerable margin, is dataanalytics,definedasinformatics and applying and translating public health data (cited as a top training need by 38 respondents) . Other training priorities included
systems thinking (systems development, change management, strategic planning, and/or flexibility), persuasive communication (articulating a message to the public, communicating public health research and data, policy engagement, etc.) and leadership development (identifying future leaders, coaching/mentoring
programs, retention of current leaders), each of which was mentioned by 12 respondents, followed by continuing education (11 respondents) . Less frequently cited training needs include software skills, assessment/evaluation,fiscalmanagement, team building, and cultural competency .
0% 10% 20% 30% 40%5% 15% 25% 35%
Data analytics
Systems thinking
Persuasive communication
Leadership development
Continuing education
Software skills
Assessments and evaluations
Fiscal management
Team-building
Cultural competency 0%
1%
2%
5%
9%
11%
12%
12%
12%
38%
Figure 17 ToptrainingneedsidentifiedbyStateEpidemiologists,50statesandDC,ECA,2017*
*Eachofthe51respondentsidentifiedtheirtwomostpressingtrainingneeds,foratotalof102responses.
Data analytics is a top training need for the majority of states.
Re
su
lts
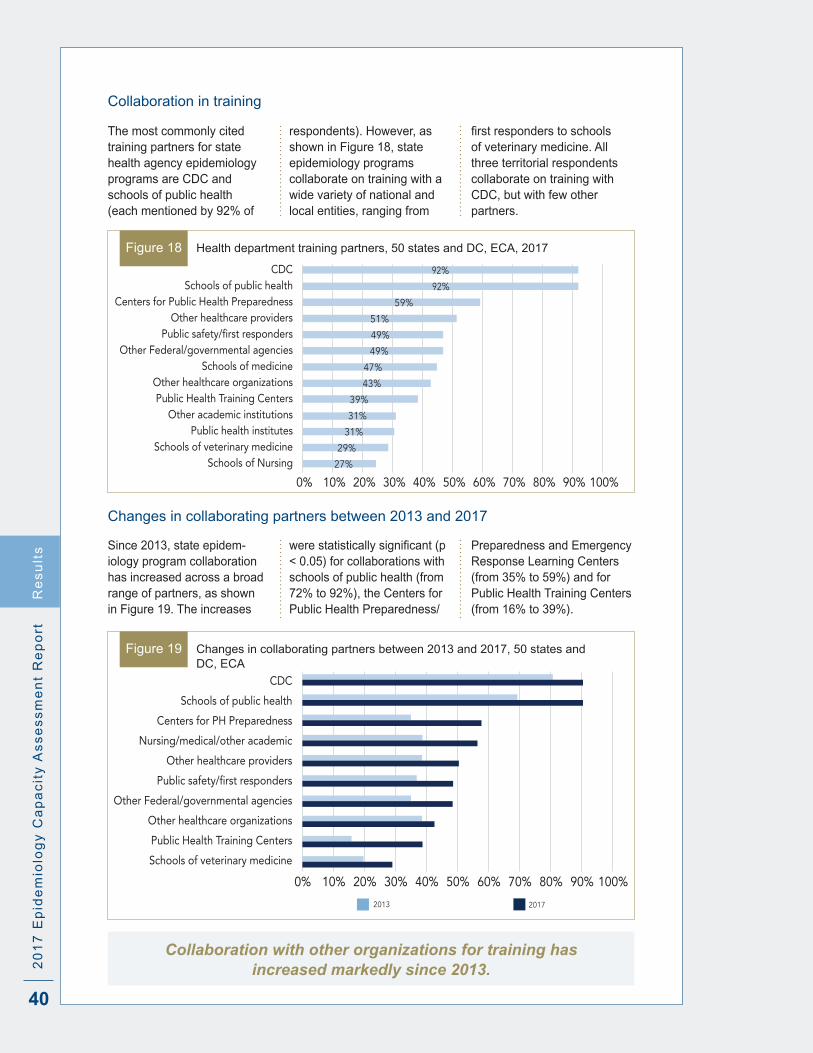
40
20
17
Ep
ide
mio
log
y C
ap
ac
ity
As
se
ss
me
nt
Re
po
rt
Collaboration in training
The most commonly cited training partners for state health agency epidemiology programs are CDC and schools of public health (each mentioned by 92% of
respondents) . However, as shown in Figure 18, state epidemiology programs collaborate on training with a wide variety of national and local entities, ranging from
firstresponderstoschoolsof veterinary medicine . All three territorial respondents collaborate on training with CDC, but with few other partners .
0% 20% 40% 60% 80% 100%10% 30% 50% 70% 90%
CDCSchools of public health
Centers for Public Health PreparednessOther healthcare providers
Public safety/first respondersOther Federal/governmental agencies
Schools of medicineOther healthcare organizationsPublic Health Training Centers
Other academic institutionsPublic health institutes
Schools of veterinary medicineSchools of Nursing 27%
29%
31%
31%
39%
43%
47%
49%
49%
51%
59%
92%
92%
Figure 18 Health department training partners, 50 states and DC, ECA, 2017
Changes in collaborating partners between 2013 and 2017
Since 2013, state epidem-iology program collaboration has increased across a broad range of partners, as shown in Figure 19 . The increases
werestatisticallysignificant(p< 0 .05) for collaborations with schools of public health (from 72% to 92%), the Centers for Public Health Preparedness/
Preparedness and Emergency Response Learning Centers (from 35% to 59%) and for Public Health Training Centers (from 16% to 39%) .
0% 20% 40% 60% 80% 100%10% 30% 50% 70% 90%
CDC
Schools of public health
Centers for PH Preparedness
Nursing/medical/other academic
Other healthcare providers
Public safety/first responders
Other Federal/governmental agencies
Other healthcare organizations
Public Health Training Centers
Schools of veterinary medicine
2013 2017
Figure 19 Changes in collaborating partners between 2013 and 2017, 50 states and DC, ECA
Re
su
lts
Collaboration with other organizations for training has increased markedly since 2013.

41
20
17
Ep
ide
mio
log
y C
ap
ac
ity A
ss
es
sm
en
t Re
po
rt
UseofAppliedEpidemiologyCompetencies(AECs)todefineepidemiology career paths
State Epidemiologists were asked how their health departments used the AECs, which were developed in 2008 by CDC and CSTE, todefinecareerpathsforapplied epidemiologists . About three-quarters of state respondents (76%) reported using the AECs for one or more purposes; the remaining 24% either did not use them or were unsure if they had .
As shown in Figure 20, among the 39 jurisdictions reporting AECs usage, the most common uses were to create or update position descriptions (85%), creating orupdatingjobqualificationstatements (77%), assessing the epidemiological capacity ofspecificpositions(69%),and assessing gaps in knowledge . The AECs were less frequently used
to create/update promotion requirements (41%), develop specifictrainingplanstoaddress knowledge gaps (23%) and to develop curricula for continuing education or training programs (21%) .
Only one of the three participating territories reported using the AECs for any purpose .
0% 20% 40% 60% 100%80%
Create/update position descriptions
Create/update job qualification statements
Assess capacity of specific positions
Assess gaps in knowledge
Create/update promotion requirements
Develop specific training plans
Develop curricula 21%
23%
41%
54%
69%
77%
85%
Figure 20 Uses of AECs by state health departments, 38 states and DC, ECA, 2017*
*Excludes states that did not use or were not sure they used the AECs .
Three quarters of the states and DC have used the AECs,
most commonly for creating and updating position
descriptions and job qualification statements.
Re
su
lts

42
20
17
Ep
ide
mio
log
y C
ap
ac
ity
As
se
ss
me
nt
Re
po
rt
Existing practices, incentives, and barriers aimed at strengthening the state epidemiology workforce
Obstacles to recruitment
The factors State Epidemiolo-gists most frequently cited as major and moderate recruitment problems relate primarily to compensation and advancement opportunity: restrictions on offering competitive pay, salary scale, hiring quickly enough, and
opportunity for promotion (Table 7) . In contrast, required travel, job interest and fulfillment,jobsecurity,andtraining opportunities were either not a problem or only a minor problem for recruitment . All three territorial respondents cited salary, hiring quickly
enough, and recruiting outside the organization as major or moderate problems . Two of the three added to this list competitive pay, promotion opportunities, location, restriction on choosing candidates,benefits,andjobsecurity .
Table 7 Factors affecting recruitment, 50 States and DC, ECA, 2017
Therewerenostatisticallysignificantdifferencesbetweentherecruitmentproblemsnotedin2013andin2017.
Competitive pay, salary scale, hiring delays and lack of promotion
opportunities continue to be serious recruitment obstacles.
Sources for recruitment
As seen in Figure 21, state and local government websites, professional organizations and universities/schools of public health were the most commonly cited recruitment sources, each used by 96% of states . Additionally, public health
career websites and federal programs like the Epidemic Intelligence Service were used by 84% of state health departments . LinkedIn and other online networks were used by 33% of respondents, followed by Facebook (16%) and other social media (14%) .
Compared with previous years, the use of online sources has increased significantly;in2013,onlyone state mentioned social networks (including LinkedIn) as a recruitment vehicle, compared with 17 in 2017 .
FactorMajor
problemModerate problem
Minor problem
Not a problem
Restriction on offering competitive pay 47% 33% 16% 4%
Salary scale 31% 45% 22% 2%
Opportunity for promotion 24% 49% 25% 2%
Hiring quickly enough 31% 31% 25% 12%
Location 16% 31% 16% 37%
Hiring freezes 16% 27% 22% 35%
Personnel policies and procedures 6% 25% 29% 39%
Restriction on choosing best candidate 8% 14% 33% 45%
Opportunities for training 2% 20% 45% 33%
Recruiting outside your organization 4% 14% 45% 37%
Travel permitted 2% 14% 20% 65%
Jobinterest/fulfillment 0% 14% 41% 45%
Job security 2% 10% 35% 53%
Jobbenefits 2% 6% 25% 67%
Travel required 0% 2% 8% 90%
Another factor 15% 15% 0% 71%
Re
su
lts

43
20
17
Ep
ide
mio
log
y C
ap
ac
ity A
ss
es
sm
en
t Re
po
rt
0% 20% 40% 60% 100%80%
State and/or local government websites
Professional organizations
Universities/Schools of public health
Public health career websites
Federal programs (CEFO, EIS, PHAP)
Other health agencies within the state
Periodic epidemiology newsletter
LinkedIn or other online networks
Recruitment job fairs
Local media
Other social media 14%
16%
31%
35%
84%
96%
96%
96%
84%
45%
33%
29%
Figure 21 Recruitment sources, 50 states and DC, ECA, 2017
Recruitment through online networks and social media is
increasing, although conventional mechanisms, such as job
postings on websites and recruitment at meetings and in
academic settings, were more frequently used.
Minimum hiring requirements
Most state health agencies require a bachelor’s degree (59%) or master’s degree (33%) for entry-level epidemi-ologists (Figure 22) . About half of the states (49%) require less than a year’s experience for these entry-level positions, while 26% require two years, and 10% require more than two years . The most commonly cited acceptable experiences were full time work (96%), paid work (94%), internships (71%) and volunteer work (53%) .
Moreover, states accepting bachelor’s-level candidates were more likely to ask for more than one year of experi-ence than states requiring a master’s degree for entry-level epidemiology positions (67% versus 29%; p=0 .01) .
One of the three territories requires only a high school degree for entry-level epidemiology positions, and the remaining two require a master’s degree . All require less than one year of experience .
Figure 22 Minimum educational attainment required for hiring, 50 states and DC, ECA, 2017
• 59% Bachelor’s
• 33% Master’s
• 4% High School
• 4% Associate
Re
su
lts

44
20
17
Ep
ide
mio
log
y C
ap
ac
ity
As
se
ss
me
nt
Re
po
rt
Retention and continuity planning
Obstacles to retention
The factors State Epidemiolo-gists most frequently cite as major and moderate problems for staff retention were salary, opportunity for promotion, restriction on merit raises, and loss to the private or
government sector (Table 8) . In contrast, required travel andjobbenefitsweremostfrequently cited as not a problem . All three of the responding territories report opportunity for promotion as
a major or moderate problem, and two of the three also cite salary, restrictions on raises, location, policies and procedures, and job security as at least a moderate problem.
Table 8 Factors affecting recruitment, 50 States and DC, ECA, 2017
Although there were no statisticallysignificantdifferences in retention obstacles between 2013 and 2017, it is notable that 88%
of 2017 respondents reported opportunity for promotion as a major or moderate problem, compared with 74% in 2013 . Other factors affecting
retention remained stable overthisfive-yearperiodorwere less likely to be cited as problematic .
FactorMajor
problemModerate problem
Minor problem
Not a problem
Salary 39% 41% 16% 4%
Opportunity for promotion 37% 51% 8% 4%
Restrictions on merit raises 35% 35% 25% 4%
Loss to private or government sector 12% 53% 27% 8%
Travel outside jurisdiction 8% 16% 33% 43%
Job location 8% 27% 29% 35%
Personnel policies and procedures 6% 20% 31% 43%
Travel permitted 4% 10% 33% 53%
Job security 4% 6% 39% 51%
Layoffs from budget restrictions 2% 14% 35% 49%
Opportunities for training 2% 20% 47% 31%
Jobbenefits 2% 8% 29% 61%
Jobinterest/fulfillment 0% 14% 63% 24%
Travel required 0% 2% 12% 86%
Re
su
lts
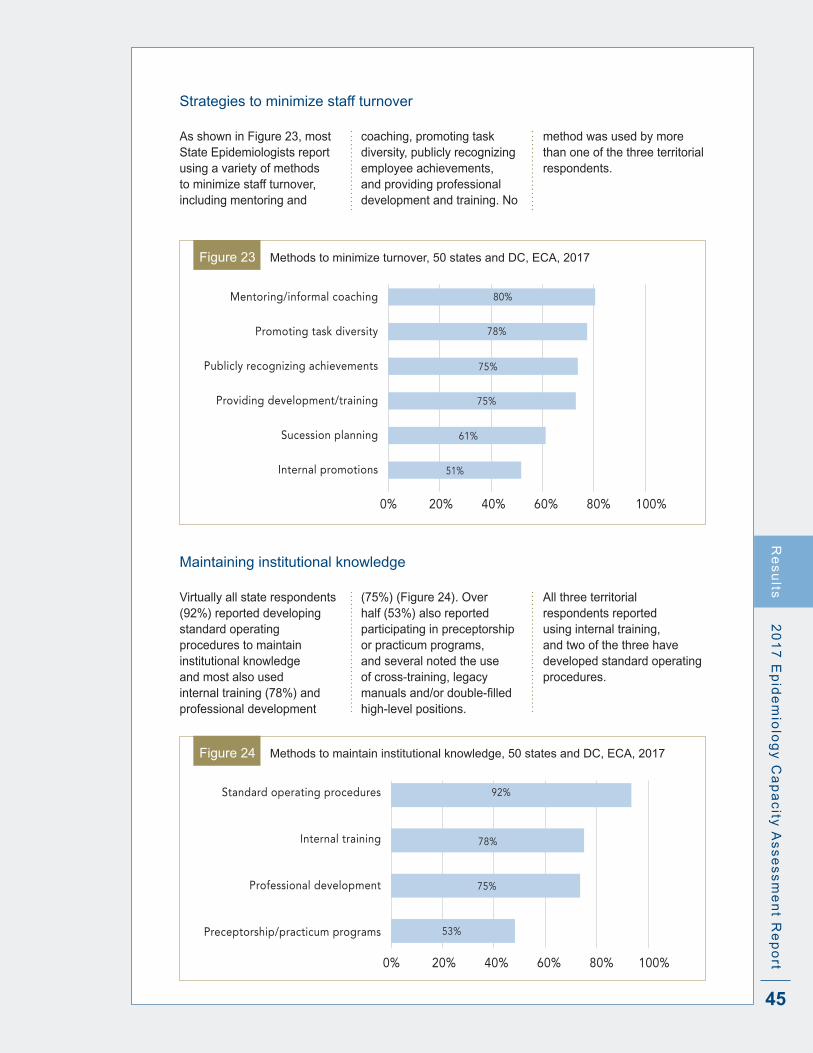
45
20
17
Ep
ide
mio
log
y C
ap
ac
ity A
ss
es
sm
en
t Re
po
rt
Strategies to minimize staff turnover
As shown in Figure 23, most State Epidemiologists report using a variety of methods to minimize staff turnover, including mentoring and
coaching, promoting task diversity, publicly recognizing employee achievements, and providing professional development and training . No
method was used by more than one of the three territorial respondents .
0% 20% 40% 60% 100%80%
Mentoring/informal coaching
Promoting task diversity
Publicly recognizing achievements
Providing development/training
Sucession planning
Internal promotions 51%
61%
75%
75%
78%
80%
Figure 23 Methods to minimize turnover, 50 states and DC, ECA, 2017
Maintaining institutional knowledge
Virtually all state respondents (92%) reported developing standard operating procedures to maintain institutional knowledge and most also used internal training (78%) and professional development
(75%) (Figure 24) . Over half (53%) also reported participating in preceptorship or practicum programs, and several noted the use of cross-training, legacy manualsand/ordouble-filledhigh-level positions .
All three territorial respondents reported using internal training, and two of the three have developed standard operating procedures .
0% 20% 40% 60% 100%80%
Standard operating procedures
Internal training
Professional development
Preceptorship/practicum programs 53%
75%
78%
92%
Figure 24 Methods to maintain institutional knowledge, 50 states and DC, ECA, 2017
Re
su
lts
46
20
17
Ep
ide
mio
log
y C
ap
ac
ity
As
se
ss
me
nt
Re
po
rt
Remarks from State and Territorial Epidemiologists on Critical Issues
Forthefirsttimein2017,theECAincludedan open-ended question: As the State Epidemiologist, what are the most critical issues you face? Several themes emerged from their answers, including recruitment and retention, developing and maintaining a competentandqualifiedworkforce,addressingemerging issues, funding and unfunded mandates, and leadership . The comments in thissectionreinforcethequantitativefindingsas well as provide additional details concerning the magnitude and seriousness of many of these issues . In this section, we summarize some of the responses and provide illustrative quotes .
Overall, current staffing levels are inadequate to meet the needs to maintain basic epidemiological functions and emerging problems .Respondents cited problems with recruitment and retention, heavy reliance on vertical federalfunding,andlackofflexibilitytodealwith changing needs . These challenges appear to be particularly acute in states with hard-to-reach, rural populations and with limited local health department capacity .
“[There is a] lack of funding and state positions
to expand capacity in areas with existing
epidemiologic activities and to create capacity in
areas without current epidemiologic activities.”
“[A challenge is] balancing resources to meet
emerging issues, basic responsibilities and
cooperative agreement deliverables.”
“We are challenged with continued increasing
reporting and work requirements in most
program areas despite level or decreasing
federal funding.”
Recruitment of high-quality epidemiology staff is a challenge . Respondents frequently mentioned hiring freezes, inability to hire quickly, and lack of adequate funds for recruitment . Some reported limited ability to create new positions to address emerging public health problems such as Zika virus and the opioid epidemic . Several
respondents reported having to use contractors because of state hiring restrictions .
An additional issue cited by respondents is findingepidemiologycandidateswithappro-priate skillsets, especially nurses, physicians, individuals with existing public health experience, and individuals with expertise in importantemergingfields,suchasinformatics.
“Our hiring process is too lengthy not only to
fill federally funded positions, but for those
we are hiring, and we lose qualified
candidates due to the process.”
Organizational issues adversely affect retention and turnover and threaten programmatic continuity and institutional memory . Amongthefactorsidentifiedascontributingtohigh staff turnover are limited opportunities for promotion, lack of competitive compensation, loss of pension programs, uncertain funding forstaffpositions,andundefinedcareerpaths . As a result of these organizational problems, respondents report having MPH epidemiologists leave the workforce for PhD programs and both MPH and PhD-level staff leave public health for the private sector . Frequent loss of staff, in turn,leavesinsufficientsupervisory-levelepidemiologists—a problem respondents expect to worsen as a cohort of experienced, long-time staff members retire .
“[A] high level of epidemiologist staff turnover
[is] leaving a workforce of relatively young and
new epidemiologists, with less experience and
institutional knowledge.”
“There is need for attractive salaries, there is
need for job security, there is need for career
pathways for progression.”
“Years of service for our most experienced
[epidemiologists] means that we stand to lose
a great deal of experience to retirement
within the next 5 years.”
Re
su
lts

47
20
17
Ep
ide
mio
log
y C
ap
ac
ity A
ss
es
sm
en
t Re
po
rt
New or different knowledge and skillsets are needed to meet to current gaps in capacity, to respond to emerging public health challenges, and to adapt to new technologies .The need to improve skills in evaluation, communication with the public, and risk communication were frequently cited by respondents.Theyalsofrequentlyidentifiedemergingfieldsofinformaticsanddataanalytics as high priority for training . At the same time, however, respondents stressed the importance of maintaining traditional epidemiological skillsets and developing the ability to step back and look at the bigger picture .
“One of my main concerns is having a
workforce prepared to function in the new
world of public health epidemiology. We are
facing big changes right now in how we receive
information, the volume of data/information,
emerging programs related to [hospital
acquired infections] with large expectations
[and] rapid changes in lab testing…. that
affect the information we receive and the
need to adapt all our investigation protocols
accordingly. It is challenging to keep the
workforce well prepared in the face of so much
change at such a rapid pace.”
“We need improvements in our informatics
abilities, so we can capture and efficiently
utilize all our data…There should be formally
trained informaticians.”
“[Epidemiologists] need to be able to assess
not only the ‘how’ of data analysis, but also
be able to evaluate the work that is being
performed by the various programs they
support to address questions of health impact
and use the published evidence-base to help
direct and steer the work being performed.
This often is in the realm of ‘program
evaluation’ and utilizes a slightly different skill
set, but epidemiologists need to be cross-
trained in these skills as their work overlaps
with that of evaluation.”
“Transitioning from a number of one-off data
systems to a more efficient interoperable
system with enterprise-wide approaches
to data collection, data parsing, data
provisioning, data preparing, data analysis and
data visualization requires additional training
in informatics and data analytics.”
“[Building informatics capacity within the
agency is important to] ensure that we have
data on the health status of the population to
inform programs and policies. For example,
with legalized retail marijuana, we need
surveillance, and use, attitudes and health
impacts. People are increasingly concerned
about the effects of environmental toxins on
health – we need adequate health data on
exposures and outcomes to help address
this issue.”
“The field of ‘informatics,’ while important, is
unintentionally overshadowing how important
bread and butter epidemiology is to our field.”
“There is a need for epidemiologists to be
able to think critically about the diseases
and risk factors under surveillance and to
be able to look beyond the mechanics of
just data analysis.”
Training and mentoring are essential to ensure programmatic continuity, institutional memory, and a high level of expertise (especially in areas requiring unique skillsets) but require considerable resources . Respondents reported that high staff turnover, evolving health department priorities, and emerging disciplines (e .g ., informatics) have all exacerbated the need for training, mentoring and continuing education . At the same time, restrictions on travel and educational funding have created new impediments to training . The reported result is an increased burden on experiencedepidemiologiststofillthetraininggap, sometimes at the expense of carrying out routine activities in understaffed agencies .
“It is challenging to keep the workforce well
prepared in the face of so much change at
such a rapid pace.”
Re
su
lts
48
20
17
Ep
ide
mio
log
y C
ap
ac
ity
As
se
ss
me
nt
Re
po
rt
“Emerging diseases or PH threats would not be
as disruptive if the staff were more seasoned
and more comfortable with the day-to-day
activities before the crisis hits.”
“Constantly training new staff prevents us from
improving upon, or even sustaining key public
health activities.”
“Hiring entry level [epidemiologists] requires
a good deal of training and mentoring
that taxes existing staff. It is vital that new
epidemiologists overlap as much as possible
with our experienced [epidemiologists] in the
next 2-3 years to retain institutional memory
and be public health savvy.”
Dealing with emerging and re-emerging problems that often distract from routine epidemiologic functions represents a serious challenge New and resurgent infectious diseases, healthcare- acquired infections, antimicrobial resistance, violence, and the opioid crisis have gained increasing prominence in recent years . Respondents reported that the ability to deal with these emerging threats is limited by several factors, including lack of staff, lack of training and skills in these areas, and limited financialandhumanresourcemanagementflexibilitytocreatepositions.Inaddition,positions in these areas are vulnerable to changes in federal funding priorities . Finally, although important, some reported that the emphasis on emerging problems distracts from conducting routing critical epidemiological activities .
“We have a small staff overwhelmed with
growing responsibilities, including prescription
drug overdose, syndromic surveillance,
healthcare associated infections, and others.“
“Continuous response mode to ID and other
issues limits time for evaluating effectiveness,
research, publications, disseminating data in
reports etc.”
“Recent public health threats (H1N1, Ebola,
Zika, etc.) have exacerbated the cycle of
increased attention and funding to specific
program areas followed by loss of attention
and funding, but these threats have not results
in acknowledgement of the need to maintain
a basic level of readiness for all existing and
emerging threats.”
“[There is] a lack of flexibly funded senior
level epidemiologists who can take on
emergent issues.”
Uncertain funding for applied epidemiology harms staff morale/retention and public health preparedness . Respondents reported that heavy reliance onfederalfundinginanuncertainfiscalenvironment has a negative impact on perceived job security, job satisfaction, staff morale and staff retention, especially in jurisdictions that are also experiencing their ownbudgetdeficits.Bystrainingthecapacityof existing staff, unfunded—or inconsistently funded—mandates undercut readiness to respond to new threats . Additionally, the public health laboratories that supply critical data to epidemiologists are also experiencing budget problems .
“We have shrinking resources as our
department becomes larger, yet we are
expected to fill roles that we are not
funded for.”
“Increased attention and funding to specific
program areas [is] followed by loss of
attention and funding, but these threats have
not resulted in acknowledgment of the need
to maintain a basic level of readiness for all
existing and emerging threats.”
“The high level of dependency on federal
funding sources limits the flexibility of the state
to respond to emerging public health threats
and increases vulnerability of the workforce to
reductions in federal appropriations.”
Re
su
lts

DISCUSSION

50
20
17
Ep
ide
mio
log
y C
ap
ac
ity A
ss
es
sm
en
t Re
po
rt
Discussion
Dis
cu
ss
ion
Key Findings
Numbers of epidemiologists The overall number of state health
department epidemiologists continues to rise . In 2017, 3,370 epidemiologists were employed by state health agencies (including DC)—a 22% increase over 2013 and the highest number yet observed in the ECA . A parallel 20% increase occurred in the number of epidemiologists per 100,000 population nationwide (now 1 .04/100,000), with a stepwise increase in the number of epidemiologists/100,000 population from small to large states . These composite values,however,maskrates≤0.5/100,000in six states, four of which have with populations greater than 6 million . Although the number of epidemiologists may be higher than reported here in states with large city and county health agencies (which were not assessedaspartoftheECA),thisfindingisnonetheless concerning and merits further monitoring of capacity .
Much of the increase in epidemiology staffing is limited to infectious disease, which already has many epidemiologists . Infectious diseases added 487 positions, compared with 2013 . The only other areas for which added a substantial number of epidemiologists were injury (48) and MCH (39) . In contrast, preparedness, chronic diseases, environmental health, occupational health and a few other areas continued to lose positions as part of an ongoing trend . Since 2014, CDC’s Epidemiology and Laboratory Capacity for Infectious Diseases (ELC) Cooperative Agreement has awarded states supplemental funding for Ebola, Zika, healthcare associated infections, and antimicrobial resistance (Chung, Fischer, O’Connor, & Schultz, 2017) . CDC has also recently increased funding to injury programs for opioid surveillance . These supplemental awards may have contributed to increases in infectious disease and injury epidemiologist positions .
There is a perceived need for additional staffing, even in program areas that already have many epidemiologists . Participating State Epidemiologists expressed the need for nearly 1,200 additional epidemiologists at a master’s level or higher to reach full capacity to carry out EPHS #1, 2, 9 and 10, representing a 36% increase over current levels . Nearly 600 of the additional epidemiologists are needed for infectious disease, MCH, and chronic disease programs, which already represent 75% of the epidemiology workforce . Although the additional need as a percentage of currentstaffinglevelsishighformanyofthesmall program areas, nationally, the number of additional positions perceived necessary is small (e .g ., 64 for substance abuse, 42 for mental health, and 20 for genomics) . While supplemental awards such as the ELC and Public Health Emergency Preparedness (PHEP) Cooperative Agreements have contributed to increases in epidemiologist positions and overall capacity to monitor health status and diagnose public health problems and hazards, their short-term naturemaybereflectedinresponsesindicating that more epidemiologists are needed across all program areas .
Staffing may not be proportionate to needs in emerging areas, such as substance abuse . Substance abuse is now a leading cause of death for US adults, with more than 64,000 substance abuse deaths reported in 2016 (Centers for Disease Control and Prevention, 2016) . Epidemiologic surveillance, investigation, evaluation, and research are critical to describe and control factors contributing to substance abuse . Despite alarming recent trends, however, the area remains poorly staffed, and over 60% of states perceived the need for additional epidemiologic capacity . Of note, in the eight states with 2015 age-adjusted opioid mortality rates exceeding 25 per 100,000 population, the median number of substance abuse epidemiologists was two, with a range of 1-7 .

51
20
17
Ep
ide
mio
log
y C
ap
ac
ity
As
se
ss
me
nt
Re
po
rtD
isc
us
sio
n
EPHS capacity Perceived EPHS capacity by program
area correlates closely with the number of epidemiologists working in that area . More than 90% of jurisdictions reported substantial to full epidemiologic capacity for infectious diseases, MCH, and chronic diseases—areas that employ nearly three-quarters of state health department epidemiologists . In contrast, many of the areas with few epidemiologists report having none, minimal or partial capacity . For example, just 3% of all epidemiologists were employed in substance abuse, occupational health, oral health, genomics, and mental health—areas in which the vast majority of jurisdictions reported insufficientcapacity.
The perceived need for enhanced EPHS capacity exceeded 60% in all program areas, including those that appear to be well staffed . Perceived need was highest for mental health, substance abuse, and informatics, with the latter two most frequently designated as highest priority for improvement . However, respondents’ perceived need for expanded capacity even in areas with substantial numbers of epidemiologists suggests that the current workforce may lack the skillsets needed to achieve adequate EPHS capacity .
EPHS capacity for evaluation and research remains low . In 2017, capacity for EPHS #1 (surveillance) and #2 (public health investigations) was high and little changed since 2013 (84% and 92%, respectively, with substantial to full capacity) . Yet, only 39% of jurisdictions had substantial to full capacity for EPHS #9 (evaluation), up slightly from 35% in 2013, and just 22% had substantial to full capacity for EPHS #10 (research), downfrom29%in2013.Thesefindingsmayimpact jurisdictions’ ability to respond to funding opportunity announcements . They suggest that health agencies focus more on hiring epidemiologists with evaluation and research skills, providing existing staff with evaluation and research training, and diversifying funding to support evaluation and research activities .
Changes in the number of staff have not been accompanied by substantive improvements in overall and program-specific EPHS capacity. A jump in the overall number of state health department epidemiologists between 2009 and 2013 was associated with contemporaneous
improvements in capacity for the four epidemiology-dependent EPHS . This effect, however, was not replicated between 2013 and 2017 . In fact, in 2017, there werenostatisticallysignificantchangesinthe percentage of jurisdictions reporting substantial to full capacityinanyspecificprogram area despite changes (mostly increases) in the number of epidemiologists . Thesefindingssuggestthatthecurrentepidemiology staff shortage is not a problem of numbers alone and that epidemiologists are needed who have different skillsets who can complement existing health department strengths in monitoring, diagnosing and investigating health problems . Moreover, a competent applied epidemiology workforce willbenefitfrompartnershipstoaccesstraining and multi-disciplinary strategies to improve analysis of complex data and efficientresourceutilization.
Access to non-open-access, peer-reviewed literature is suboptimal . More than a quarter of states report that they do nothavefullaccesstothescientificliterature,and an additional quarter report that access was delayed by more than 24 hours . Such access is essential to inform the response to emerging issues and to ensure that ongoing activities are evidence-based . Understanding how states with rapid access have arranged to obtain literature may assist states with slow or no access by illuminating potential solutions, such as university partnerships or participation in the National Network of Libraries of Medicine .
Training and the Applied Epidemiology Competencies By a considerable margin, the greatest
training priority was in analytics, defined as informatics and the application and translation of public health data. Other training priorities included systems thinking, persuasive communication, and leadership development . The 2017 ECA demonstrated that while training is readily available in epidemiology, training in informatics is less well developed . As noted for other training needs, partnerships and collaboration with schools and programs of public health to incorporate analytics into their curricula could contribute to developing these much-needed skills in the applied epidemiology workforce .

52
20
17
Ep
ide
mio
log
y C
ap
ac
ity A
ss
es
sm
en
t Re
po
rt
Collaboration with outside groups increased since 2013, with CDC and schools of public health the most important collaborating partners . As public health practice continues to transcend disciplinary siloes, it becomes ever more important to emphasize inter-professional education and collaboration . Additional exploration is needed to better understand the relationships among collaborating partners to determine how these relationships are initiated and sustained .
A quarter of jurisdictions have not used the 2008 Applied Epidemiology Competencies . The use of the AECs—a comprehensive, four-tiered list of competenciesthatdefinesthedisciplineofapplied epidemiology and describes the skills needed by epidemiologists at progressive levels of practice—not optimal . Their use has been limited primarily to develop or update positiondescriptionsandjobqualificationstatements and to assess epidemiology capacityofspecificpositions.Theywerelesscommonly used to develop training plans to address knowledge gaps or to develop training or continuing education activities . Previous data on AEC use are not available for comparison purposes .
Funding Federal funding continues to pay for most
epidemiology activities and personnel in state health agencies and limits adequate coverage of underserved program areas . Nationwide, nearly 80% of funding for epidemiologic activities and personnel comes from the federal government, primarily from CDC, with less than 20% coming from the states themselves . Although the federal contribution is slightly less than in the past, it constitutes the vast majority of funds for most public health program areas and, according to ECA respondents, drives priorities and createsprogrammatic“silos.”Theoveralleffect is to leave some essential functions—e .g ., maintaining surveillance systems and conducting routine health department investigations—underfunded . Respondents also reported that reliance on federal funds limitsflexibilitytoadjustresourcestodealwith emerging issues, such as the opioid epidemic . Although increased state funding may help solve these problems, the states’ contribution to epidemiology activities and personnel remained unchanged between 2013 and 2017 .
Recruitment and retention The biggest recruitment and retention
challenges are similar: salaries, opportunities for promotion, and restrictions on pay and merit raises . While several states report they are working to improve epidemiology career paths, funding remains a sticking point for salaries and raises . In most, if not all states, salaries and raisesarefixedbythestategovernment.Between 2013 and 2017, salaries increased bymorethantherateofinflation,butforseveral of the career levels, salaries remain low . In an era of increasing student debt, health department salaries are likely to become less and less competitive with other employers (Baum and Ma, 2016) . Although non-financialrewards—stimulatingworkenvironment, the opportunity to contribute to community health, and employee recognition—may improve retention, efforts are needed to both highlight the unique and rewarding aspects of epidemiology practice and to achieve more competitive compensation .
Most state epidemiology positions require a bachelor’s degree or higher, and half require at least one year of experience . Dataonacademicqualificationswerenotcollected in 2017, but in 2013, almost all state health department epidemiologists had at least a master’s degree . Yet even with the requirements of a graduate degree and experience, newer staff may not bring the needed skills in evaluation and research, as well as data analytics and systems thinking, which tend to require advanced training and for which on-the-job training may be difficult.Thus,itislikelythatthetrainingandexperience required for hiring will increase overtime—afindingthatsuggeststheneedto work with schools and programs of public health to strengthen epidemiology curricula in these core areas .
Territorial challenges Territories face special challenges related
to geographic isolation, high turnover, slow hiring, and, in some cases, low salaries and poor access to the literature . Maintaining continuity and capacity in these remote settings represents a particularly difficultchallenge.Furtherefforts,suchasexamining successful epidemiology programs in rural US states, are needed to learn what can be done to improve capacity .
Dis
cu
ss
ion
53
20
17
Ep
ide
mio
log
y C
ap
ac
ity
As
se
ss
me
nt
Re
po
rt
Overriding issues: alignment of priorities In many states, there is a misalignment
between needs and resources. Moreover, heavy reliance on external funding, coupled with internal organizational issues, hamper states as they seek to meet designated priorities . Periodic examination of priorities based on morbidity, mortality, and state public health mandates could serve as a basis for seeking additional funding from state coffers or other sources, and thus better align workforce capacity with state needs .
Limitations
The 2017 ECA has several limitations: Although all states and DC responded to the
assessment, two of the larger territories—Puerto Rico (the largest US territory in terms of population and area) and Guam—did not . Thus, the data do not provide a comprehensive overview of territorial challenges and opportunities .
Because a substantial portion of State Epidemiologists (39%) have been hired since the 2013 ECA, the individuals completing the 2013 and 2017 ECAs may be different, potentiallyinfluencingquestionswithasubjective element, such as perceived epidemiological capacity .
AlthoughtheECAdefinesepidemiologistandthedefinitionhasremainedessentiallyunchanged over time, it does not necessarily align with job titles and has a subjective component to it, which may affect comparisons among states and in the same state over time, especially if there have been changes in the personnel completing the assessment .
If a state did not currently have a program in aspecificarea,theresponsetothequestionregarding whether that program area was aprioritywascodedas“notapriority,”potentially underestimating interest in that area .
Questionsregardingdesiredstaffingwerelimited to epidemiologists at the MPH level or above, which may underestimate total program needs .
It is not possible to determine whether observed changes in the numbers of epidemiologistsinprogramareasreflectgains or losses in previously hired and experienced staff members or changes in the
funding channels used to support them . For example, some epidemiologists previously working in preparedness may have shifted to infectious disease positions because of decreased preparedness funding and the concomitant increases in infectious disease funds .
Counts of the total number of epidemiologists within each state health agency overall, and by program area, may have excluded generalistsnotdedicatedtoaspecificprogram . Additionally, the assessment excludes any epidemiologists working outside the state health agency (e .g ., some states may have separate mental health agencies that employ epidemiologists) .
Calculations of the total number of epidemiologists/100,000 population exclude epidemiologists employed by city and county health departments within the state, and thus should be considered minimum estimates .
Dis
cu
ss
ion

RECOMMENDATIONS

55
20
17
Ep
ide
mio
log
y C
ap
ac
ity A
ss
es
sm
en
t Re
po
rt
Recommendations
Re
co
mm
en
da
tion
s
The2017ECAfindingspointtoseveralwaystoimprove applied epidemiology capacity in state and territorial health departments .
1 . Develop a strategy to increase epidemiology capacity, especially in evaluation and research and in underdeveloped program areas such as substance abuse, mental health, and informatics . Representatives from CDC, CSTE, and
other relevant national, state, and local agenciesshouldmeettobetterdefinea strategy to enhance evaluation and research capacity and develop expertise in emerging program areas . They should definewhatsubjectmatterknowledgeand applied epidemiology skills are needed in these emerging areas and develop model position descriptions that include these skills .
Stakeholders should work closely with schools and programs of public health and other relevant academic programs to encourage the incorporation of evaluation and practical research skills, as well as systems thinking and applied public health informatics training, in degree-granting programs .
CSTE steering committees should collaborate to advise on how informatics can be leveraged and integrated to support applied epidemiology activities .
CSTE should review the status of its recommendations and subcommittee activities in areas such as injury prevention, occupational health, and oral health, and apply the lessons learned to efforts to develop skills in substance abuse and informatics .
2 . Review and develop new recruitment and retention strategies for state health department epidemiologists . Engage a variety of stakeholders—CDC,
CSTE, ASTHO, NACCHO, and others—to further explore causes of high state
epidemiology turnover and to explore possible solutions .
Increase epidemiology internship and fellowship programs to help attract new professionals and aspiring professionals .
RevisithowinformaticsfitsintotheAECsto facilitate the development of position descriptionsthatmightenticequalifiedinformatics candidates from a variety of backgrounds and inspire them to work in governmental public health .
Look to the handful of states that have provided more generous funding for epidemiologic activities to glean useful strategies for how to approach decision-making bodies .
3 . Maintain efforts to establish training standards for applied public health epidemiologists and to provide training to ensure a sustained, qualified and competent public health epidemiology workforce . CSTE should develop a leadership
training and mentoring strategy for new State Epidemiologists and share lessons on successful succession strategies .
Federal, state, and local agencies should more aggressively promote the AECs as a basis for developing training standards and training programs that meet these standards .
As the AECs were developed before the emergence of informatics and data analytics as applied epidemiology tools, the AEC process should be reactivated to defineappropriateskillsetsandtrainingstandards in these important and growing fields.
Working with schools and programs of public health, CSTE and CDC should develop informatics training materials geared for self-study or short courses to increase the informatics skills of the current epidemiology workforce .
CSTE and CDC should work with schools and programs of public health

56
20
17
Ep
ide
mio
log
y C
ap
ac
ity
As
se
ss
me
nt
Re
po
rtR
ec
om
me
nd
ati
on
s
through their national associations and organizations to better ensure that the AECs become an integral part of epidemiology graduate programs .
CSTE and CDC should work with partners to develop opportunities—such as internship programs and short courses taught by health department staff—to expose graduate students to aspects of applied epidemiology that may lie outside the realm of expertise of university programs .
4 . Explore the gap between state public health mandates and state capacity to meet those mandates . Public health is a core state responsibility,
but nationally, states provide less than 20% of funding for epidemiology activities andpersonnel,contributingtodifficultiescarrying out routine public health functions . CDC and CSTE, or a private foundation, should further investigate state public health mandates and the current and projected ability to meet their core mandates . The information gathered could be used for advocacy with key state stakeholders and decision-makers .
5 . Conduct future assessments . CSTE should conduct future
assessments to continue to monitor functional and numeric epidemiology capacity in US states and territories, by program area and overall .
CSTE should consider expanding the ECA—or beginning an analogous, parallel assessment—to document epidemiological capacity at large city and county health departments to better capture true national epidemiological capacity .

REFERENCES

58
20
17
Ep
ide
mio
log
y C
ap
ac
ity A
ss
es
sm
en
t Re
po
rt
References
Re
fere
nc
es
Baum, S ., & Ma, J . (2016) . Trends in Student Aid, 2016 . Retrieved from https://trends.collegeboard.org/sites/default/files/2016-trends-student-aid_0.pdf
Birkhead, G ., Davies, J ., Miner, K ., Lemmings, J ., & Koo, D . (2008) . Developing competencies for applied epidemiology: from process to product . Public Health Reports, 123, 67-118 . doi:10 .1177/00333549081230S114
Boulton, M . L ., Lemmings, J ., & Beck, A . J . (2009) . Assessment of epidemiology capacity in state health departments, 2001-2006 . J Public Health Manag Pract, 15(4), 328-336 . doi:10 .1097/PHH .0b013e3181a01eb3
Boulton, M . L ., Montgomery, J . P ., & Beck, A . (2008) . Epidemiology competencies and preventive medicine residencies: do they mix and map? Public Health Rep, 123 Suppl 1, 136-148 . doi:10 .1177/00333549081230s117
Brownson, R ., Samet, J ., Chavez, G ., Davies, M ., Galea, S ., Hiatt, R ., . . . Yarber, L . (2015) . Charting a future for epidemiologic training . Ann Epidemiol, 25(6), 458-465 . doi:10 .1016/j .annepidem .2015 .03 .002
Centers for Disease Control and Prevention . (2003) . Assessment of the epidemiologic capacity in state and territorial health departments--United States, 2001 . MMWR Morb Mortal Wkly Rep, 52(43), 1049-1051 .
Centers for Disease Control and Prevention . (2005) . Assessment of epidemiologic capacity in state and territorial health departments--United States, 2004 . MMWR Morb Mortal Wkly Rep, 54(18), 457-459 .
Centers for Disease Control and Prevention . (2009) . Assessment of epidemiology capacity in State Health Departments - United States, 2009 . MMWR Morb Mortal Wkly Rep, 58(49), 1373-1377 .
Centers for Disease Control and Prevention . (2012) . The epidemiology workforce in state and local health departments - United States, 2010 . MMWR Morb Mortal Wkly Rep, 61(12), 205-208 .
Centers for Disease Control and Prevention . (2016) . Drug Overdose Death Data . Retrieved from https://www .cdc .gov/drugoverdose/data/statedeaths .html
Centers for Disease Control and Prevention . (2017a, April 18, 2017) . Competencies for Applied Epidemiologists in Governmental Public Health Agencies (AECs) . Retrieved from https://www .cdc .gov/appliedepicompetencies/
Centers for Disease Control and Prevention . (2017b, September 20, 2017) . The public health system and the 10 Essential Public Health Services . Retrieved from http://www .cdc .gov/nphpsp/essentialservices .html
Chung,C.,Fischer,L.,O’Connor,A.,&Shultz,A.(2017).CDC’s“Flexible”Epidemiologist:AStrat-egy for Enhancing Health Department Infectious Disease Epidemiology Capacity . Journal of Public Health Management & Practice May/June, 23(3), 295-301 .
Council of State and Territorial Epidemiologists . (2004) . 2004 National assessment of epidemiologiccapacity:findingsandrecommendations.Retrievedfrom http://www.cste2.org/webpdfs/ECAfinal05.pdf

59
20
17
Ep
ide
mio
log
y C
ap
ac
ity
As
se
ss
me
nt
Re
po
rtR
efe
ren
ce
s
Council of State and Territorial Epidemiologists . (2006) . 2006 National assessment of epidemiologiccapacity:findingsandrecommendations.Retrievedfrom http://www .cste2 .org/webpdfs/2006CSTEECAFINALFullDocument .pdf
Council of State and Territorial Epidemiologists . (2009) . 2009 National assessment of epidemiology capacity:findingsandrecommendations.Retrievedfrom http://www .cste2 .org/webpdfs/2009EpidemiologyCapacityAssessmentReport .pdf
Council of State and Territorial Epidemiologists . (2013) . 2013 National assessment of epidemiology capacity:findingsandrecommendations.Retrievedfrom http://www.cste2.org/2013eca/CSTEEpidemiologyCapacityAssessment2014-final2.pdf
Drehobl, P ., Roush, S ., Stover, B ., & Koo, D . (2012) . Public Health Surveillance Workforce of the Future . MMWR: Morbidity & Mortality Weekly Report, 61, 25-29 .
Frieden, T . R . (2015) . The Future of Public Health . New England Journal of Medicine, 373(18), 1748-1754 . doi:10 .1056/NEJMsa1511248
Groseclose, S . L ., & Buckeridge, D . L . (2017) . Public health surveillance systems: recent advances in their use and evaluation . Annu Rev Public Health, 38, 57-79 . doi:10 .1146/annurev-publhealth-031816-044348
Hadler, J . L ., Lampkins, R ., Lemmings, J ., Lichtenstein, M ., Huang, M ., & Engel, J . (2015) . Assessment of epidemiology capacity in state health departments - United States, 2013 . MMWR Morb Mortal Wkly Rep, 64(14), 394-398 .
Kaufman, N . J ., Castrucci, B . C ., Pearsol, J ., Leider, J . P ., Sellers, K ., Kaufman, I . R ., . . . Sprague, J . B . (2014) . Thinking beyond the silos: emerging priorities in workforce development for state and local government public health agencies . J Public Health Manag Pract, 20(6), 557-565 . doi:10 .1097/PHH .0000000000000076
Last, J . M . (Ed .) (2001) . A Dictionary of Epidemiology (4 ed .) . New York, NY: Oxford University Press, Inc .
Lichtveld, M ., Boulton, M ., Lemmings, J ., & Gale, J . (2008) . From competencies to capacity: assessing the national epidemiology workforce . Public Health Rep, 123 Suppl 1, 128-135 . doi:10 .1177/00333549081230s116
Liss-Levinson, R . P ., Bharthapudi, K . P ., Leider, J . P . P ., & Sellers, K . D . C . P . H . (2015) . Loving and leaving public health: predictors of intentions to quit among state health agency workers . J Public Health Manag Pract, November/December, 21(6), S91-S101 . doi:10 .1097/PHH .0000000000000317
National Consortium for Public Health Workforce Development . (2017) . Building Skills for a More Strategic Public Health Workforce: A Call to Action . Retrieved from http://www .debeaumont .org/wordpress/wp-content/uploads/Building-Skills-for-a-More-Strategic-Public-Health-Workforce .pdf
TrustforAmerica’sHealth.(2013).Define“foundational”capabilitiesofpublichealthdepartments.Retrievedfromhttp://healthyamericans.org/assets/files/Define%20Foundational%20Capa-bilities03 .pdf
U .S . Census Bureau . (2016) . Table 1. Annual Estimates of the Resident Population for the United States, Regions, States, and Puerto Rico: April 1, 2010 to July 1, 2016. Retrieved from https://www .census .gov/data/tables/2016/demo/popest/nation-total .html

APPENDIX A

Assessment Instructions
2017 Epidemiology Capacity AssessmentThe Council of State and Territorial Epidemiologists (CSTE) appreciates your support incompleting the 2017 Epidemiology Capacity Assessment (ECA). The ECA aims to assessthe overall State Health Department epidemiology capacity from the perspective of the StateEpidemiologists. Your responses will be kept confidential and shared only in deidentified,aggregate form.
CSTE has periodically assessed epidemiology capacity in State Health Departments since2001. CSTE's 2017 ECA is a followup to the 2013 ECA and will provide importantinformation about the current capacity of epidemiology programs in State HealthDepartments. For more information about previous ECAs, visit the CSTEwebsite: http://www.cste.org/group/ECA.
Please use the following as guidelines when completing this assessment:
We strongly recommend reviewing and completing the PDF version of the assessmentbefore proceeding with this online form. It may be helpful to consult State Health Departmentstaff, organizational charts, or other documents to complete portions of the ECA.
Assessment Functionality: The link received by the State Epidemiologist may be forwardedto other health department staff to complete. It should not be shared outside of the StateHealth Department. The assessment cannot be completed by two individuals simultaneously.
Using the Online ToolThe assessment is designed so that it can be completed in multiple sittings and/or by severalpeople. Please keep the following in mind as you navigate through the assessment:
It is possible to move back and forth throughout the assessment.

A limited number of questions will "request a response" before allowing you to moveforward.
Messages will appear if question(s) within a section have not been completed, andthe unanswered question(s) will be highlighted in pale blue.It is still possible to move forward to the next section.
For questions that require responses in multiple columns and rows, the TAB key can beused to navigate quickly from cell to cell.
Because no questions require a response to move forward, it is essential that the StateEpidemiologist go though the entire assessment a final time before submission to confirm thatall questions and all parts within questions have been answered. Who completes the ECA? Some State Health Departments will want different staff members,such as program area leads or Human Resources staff, to complete various sections of theassessment. These individuals can record their responses directly in the assessment or theycan be compiled by you or your designee using the worksheets provided below prior tocompleting the assessment online.
Program Area Leads WorksheetHuman Resources Worksheet
Others Adding Directly to the Assessment If multiple staff will assist with completing the assessment online, please adhere to thefollowing guidelines:
The initial recipient should open the assessment, move through the assessment, andrecord responses. Upon completion, the browser tab should be closed. Closing the browser tabautomatically saves all the responses.The email containing the assessment link can be forwarded to other recipients. Onlyone recipient at a time can open the assessment and record responses, and thebrowser tab must then be closed in order for each recipient's responses to berecorded.
Only the State Epidemiologist or their designee should review and submit the completedassessment.
Others Completing the Worksheets for the State Epidemiologist to Add to the Assessment

If you wish to compile the responses from other staff and limit the number of individualsentering information directly in the online assessment, optional worksheets have beenprepared that can be modified according to your needs.
The worksheets contain all possible questions where either information or input fromprogram area leads or from Human Resources may be useful. Those questions to which you prefer to respond yourself or have others respond can bedeleted before sending out the worksheet.One question appears on both worksheets since the necessary information may restwith different groups among health departments.The numbering and format on the worksheets corresponds to what appears on thescreen to facilitate data entry. Instructions for modifcation can be found within the first tab of each worksheet.
Who should be counted as an epidemiologist? Some questions will require an enumerationof the current epidemiology workforce within the State Health Department. Please counteach epidemiologist only once.
State level epidemiologists include:
All those employed by the stateAll those working at the state level who are either federal assignees (e.g. EISO, CEFO,PHAP) or contract employees (e.g. CSTE trainee, contracted from school of publichealth to work at or for the State Health Department)State employees assigned to work at a local or regional level (e.g. to conductinvestigations for a region of the state).
When considering who should be counted, please focus on the functions performed by theindividual rather than the job title. Reference the Applied Epidemiology Competencies(AECs) for examples of epidemiology job functions if you need assistance in determining thestatus of an employee.
Please note that this is the same definition that was used in 2013. You may wish to reviewyour state's individual report from the previous assessment as a point of reference. Furtherinstructions on who should be counted as an epidemiologist can be found here.
The following is an outline of the ten assessment sections:
Section 1: Epidemiology leadership within the State Health DepartmentThis section can be completed by the State Epidemiologist without additional input.
Section 2: Epidemiology staffing and funding sources within the State HealthDepartment
Question 7 (number of epidemiologists and source of funding by program area)and Question 8 (ideal number of epidemiologists by program area) have beenincluded as options in the Program Area Leads worksheet. Question 7 is also included as an option in the Human Resources Worksheet.
Section 3: Epidemiology and surveillance capacity within the State Health DepartmentQuestion 10 (perceived capacity) has been included as an option in the ProgramArea Leads Worksheet.
Section 4: Civil service annual salary ranges for epidemiologists in your State HealthDepartment
Please consult with your Human Resources or other hiring director whencompleting this section.Questions 12 and 13 have been included as options in the Human ResourcesWorksheet.
Section 5: Epidemiology training and the Applied Epidemiology Competencies (AECs)Please consult other State Health Department epidemiologists for questionspertaining to domains not under your area of responsibility. Question 18 (pressing training needs) has been included as an option in theProgram Area Leads Worksheet.
Section 6: Existing practices, incentives and barriers aimed at strengthening the stateepidemiology workforce
All questions within this section should be completed by the State Epidemiologistor a senior level health official within your agency. It may be helpful to consult witha Human Resources or other hiring director. Question 21 (minimum hiring requirements) has been included as an option in theHuman Resources Worksheet.
Section 7: Vacancies and retention of the state epidemiology workforce All questions within this section should be completed by the State Epidemiologistor a designated senior level health official within your agency. It may be helpful toconsult with a Human Resources director or other State Health Department staffby specific program areas.Question 23 (vacancies by program area) has been included as an option in theHuman Resources Worksheet.

Question 24 (obstacles to retention) has been included as an option in theProgram Area Leads Worksheet.
Section 8: Preparedness within the State Health DepartmentThis question should be completed by the State Epidemiologist or a senior levelhealth official within your agency.
Section 9: Leadership feedbackThe two openended questions within this section should be completed by theState Epidemiologist or a senior level health official within your agency.
Section 10: Review of assessmentAll questions within this section should be completed by the State Epidemiologistor a senior level health official within your agency.
The assessment must be completed in its entirety before it can be submitted. A confirmationthat all parts of the assessment have been completed is required.
Please complete the entire assessment by 11:59pm EST on Wednesday, May 31, 2017.
For questions, contact Jessica Arrazola at [email protected].
Section 1: Epidemiology Leadership
Section 1: Epidemiology leadership within the State Health Department (Questions 1-4) This section can be completed by the State Epidemiologist without additional input.
Q1. How long has the State Epidemiologist been in his/her current position?
Please indicate half years in increments of 0.5 Years in current position:

Q2. Is the State Epidemiologist an appointed position in your state?
Q3. Is there a formal lead epidemiologist for each program area below?
If the "Other" category is not relevant to your situation, please select "No."
Q4. Do epidemiologists at the State Health Department have easy access to peerreviewedliterature that is not open access? Open access is defined as available online to the readerwithout financial, legal, or technical barriers other than those inseparable from gaining accessto the internet itself.
Select option from the dropdown scale.
Yes
No
Yes No
Chronic Disease
Environmental Health
Genomics
Infectious Disease
Informatics
Injury
Maternal and Child Health
Mental Health
Occupational Health
Oral Health
Preparedness
Substance Abuse
Vital Statistics
Other (please specify)

Section 2: Epidemiology Funding Sources
Section 2: Epidemiology staffing and funding sources within the State Health Department(Questions 5-8) Question 7 (number of epidemiologists and source of funding by program area) andQuestion 8 (ideal number of epidemiologists by program area) have been included asoptions in the Program Area Leads Worksheet. Question 7 is also included as an option in the Human Resources Worksheet.
Q5. What are the funding sources for all epidemiology activities within the State HealthDepartment?
Note: This question will not automatically validate total percent. Total must equal 100%.Please do not leave any box blank- if necessary, indicate 0%.
Q6. What are the funding sources for all epidemiology personnel within the State HealthDepartment?
For more information on who should be counted as an epidemiologist, please click here.
Note: This question will not automatically validate total percent. Total must equal 100%.Please do not leave any box blank- if necessary, indicate 0%.
Federal Funds % 0
State Funds % 0
Other % 0
Total 0
Federal Funds % 0
State Funds % 0
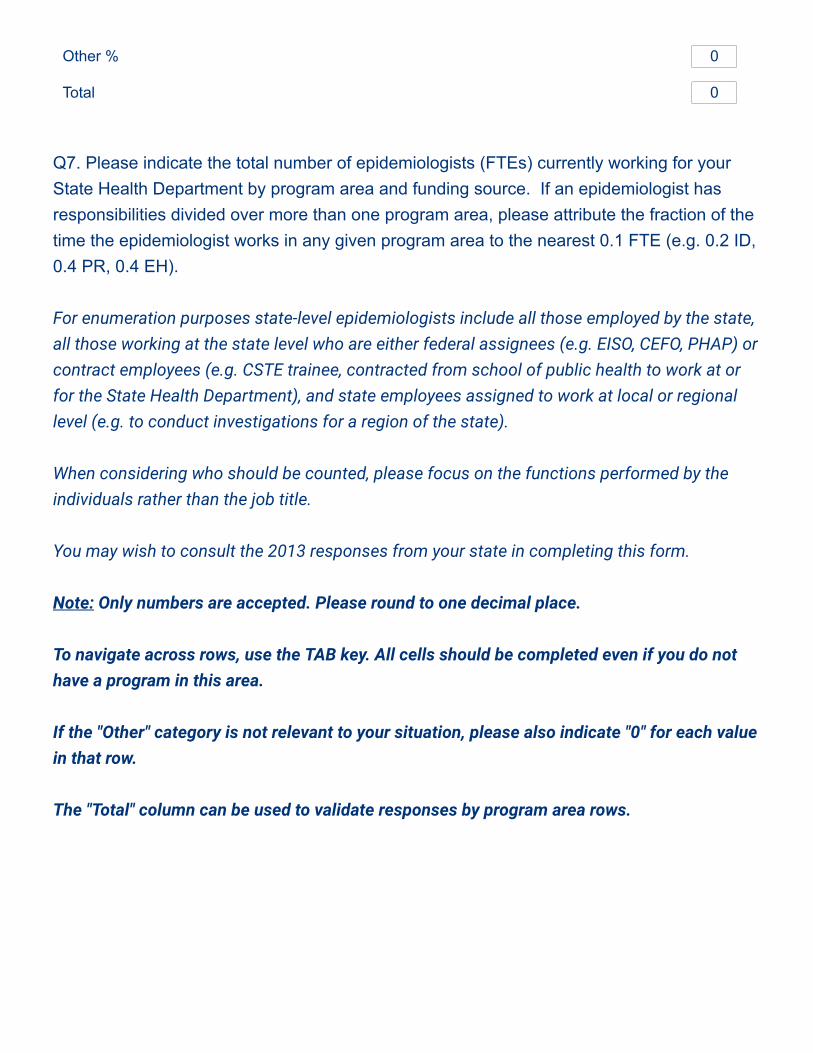
Q7. Please indicate the total number of epidemiologists (FTEs) currently working for yourState Health Department by program area and funding source. If an epidemiologist hasresponsibilities divided over more than one program area, please attribute the fraction of thetime the epidemiologist works in any given program area to the nearest 0.1 FTE (e.g. 0.2 ID,0.4 PR, 0.4 EH).
For enumeration purposes state-level epidemiologists include all those employed by the state,all those working at the state level who are either federal assignees (e.g. EISO, CEFO, PHAP) orcontract employees (e.g. CSTE trainee, contracted from school of public health to work at orfor the State Health Department), and state employees assigned to work at local or regionallevel (e.g. to conduct investigations for a region of the state).
When considering who should be counted, please focus on the functions performed by theindividuals rather than the job title.
You may wish to consult the 2013 responses from your state in completing this form.
Note: Only numbers are accepted. Please round to one decimal place. To navigate across rows, use the TAB key. All cells should be completed even if you do nothave a program in this area.
If the "Other" category is not relevant to your situation, please also indicate "0" for each valuein that row.
The "Total" column can be used to validate responses by program area rows.
Other % 0
Total 0

Q8. Please estimate the ideal number of additional epidemiologists needed to reach fullcapacity for your State Health Department by program area (the number of epidemiologistsin addition to the current number regardless of resources it may be helpful to referenceQuestion 7). Please attribute the fraction of capacity in each program area to the nearest 0.1FTE if less than one FTE is needed.
Note: Only numbers are accepted. Please round to one decimal place.
Numbersupportedwith federalfunds from
CDC
Numberdirectly
funded byCDC (e.g.,CEFO,
EIS, PHAP,etc.)
Numbersupportedwith federalfunds from
otheragencies
Numbersupportedwith statefunds
Numbersupportedwith fundsfrom othersources(e.g.,
foundations) Total
Chronic Disease 0 0 0 0 0 0
Environmental Health 0 0 0 0 0 0
Genomics 0 0 0 0 0 0
Infectious Disease 0 0 0 0 0 0
Informatics 0 0 0 0 0 0
Injury 0 0 0 0 0 0
Maternal and ChildHealth 0 0 0 0 0 0
Mental Health 0 0 0 0 0 0
Occupational Health 0 0 0 0 0 0
Oral Health 0 0 0 0 0 0
Preparedness 0 0 0 0 0 0
Substance Abuse 0 0 0 0 0 0
Vital Statistics 0 0 0 0 0 0
Other (please specify) 0 0 0 0 0 0

To navigate down the column, use the TAB key. All cells should be completed even if you donot have a program in this area.
If the "Other" category is not relevant to your situation, please indicate "0" for that row.
Section 3: Epidemiology and Surveillance Capacity
Section 3: Epidemiology and surveillance capacity within the State Health Department(Questions 9-11)
This section focuses on the four key Essential Public Health Services (EPHS) that havebeen identified as significant for epidemiologists:
EPHS 1: Monitoring health status to identify and solve community health problemsEPHS 2: Diagnosing and investigating health problems and health hazards in thecommunityEPHS 9: Evaluating effectiveness, accessibility and quality of personal andpopulation-based health services
Estimate of ideal number of additional
epidemiologists needed to reach full capacity
Chronic Disease
Environmental Health
Genomics
Infectious Disease
Informatics
Injury
Maternal and Child Health
Mental Health
Occupational Health
Oral Health
Preparedness
Substance Abuse
Vital Statistics
Other (please specify)
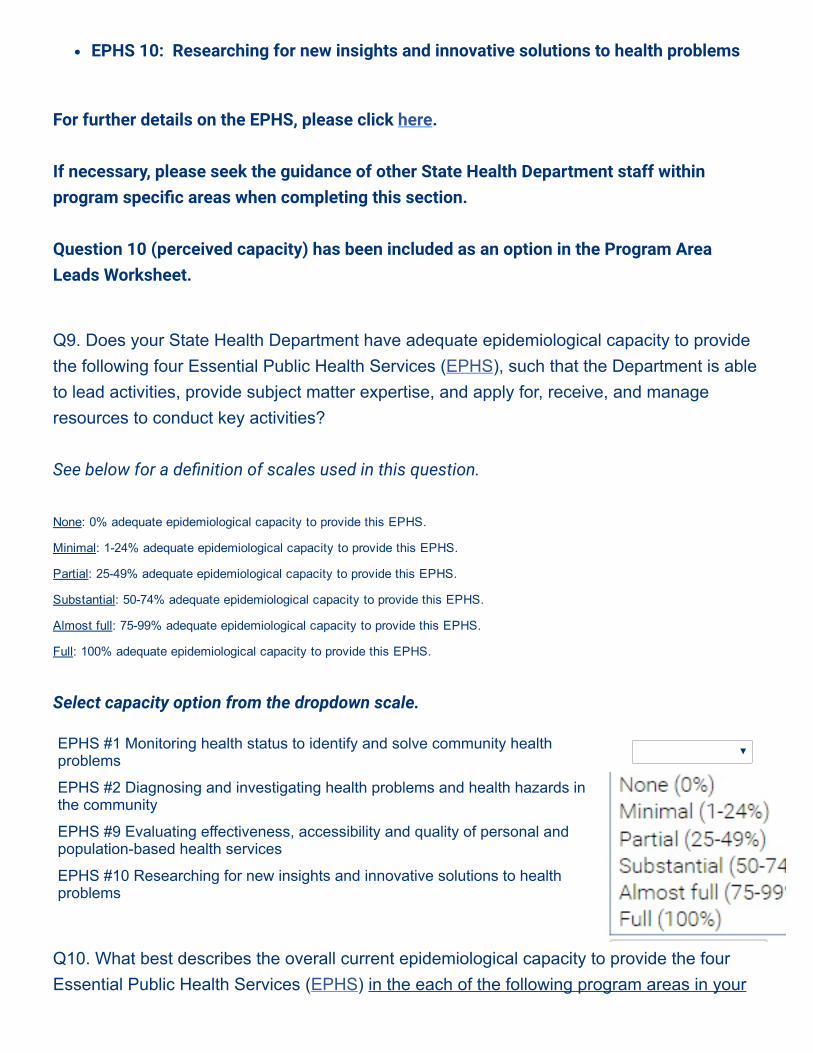
EPHS 10: Researching for new insights and innovative solutions to health problems
For further details on the EPHS, please click here. If necessary, please seek the guidance of other State Health Department staff withinprogram specific areas when completing this section.
Question 10 (perceived capacity) has been included as an option in the Program AreaLeads Worksheet.
Q9. Does your State Health Department have adequate epidemiological capacity to providethe following four Essential Public Health Services (EPHS), such that the Department is ableto lead activities, provide subject matter expertise, and apply for, receive, and manageresources to conduct key activities?
See below for a definition of scales used in this question.
None: 0% adequate epidemiological capacity to provide this EPHS.
Minimal: 124% adequate epidemiological capacity to provide this EPHS.
Partial: 2549% adequate epidemiological capacity to provide this EPHS.
Substantial: 5074% adequate epidemiological capacity to provide this EPHS.
Almost full: 7599% adequate epidemiological capacity to provide this EPHS.
Full: 100% adequate epidemiological capacity to provide this EPHS.
Select capacity option from the dropdown scale.
Q10. What best describes the overall current epidemiological capacity to provide the fourEssential Public Health Services (EPHS) in the each of the following program areas in your
EPHS #1 Monitoring health status to identify and solve community healthproblems
EPHS #2 Diagnosing and investigating health problems and health hazards inthe community
EPHS #9 Evaluating effectiveness, accessibility and quality of personal andpopulationbased health services
EPHS #10 Researching for new insights and innovative solutions to healthproblems

State Health Department, such that the Department is able to lead activities, provide subjectmatter expertise, and apply for, receive, and manage resources to conduct key activities?
See below for a definition of scales used in this question.
None: 0% epidemiological and surveillance capacity to provide the four EPHS.
Minimal: 124% epidemiological and surveillance capacity to provide the four EPHS.
Partial: 2549% epidemiological and surveillance capacity to provide the four EPHS.
Substantial: 5074% epidemiological and surveillance capacity to provide the four EPHS.
Almost full: 7599% epidemiological and surveillance capacity to provide the four EPHS.
Full: 100% epidemiological and surveillance capacity to provide the four EPHS.
We do not have this program area.
Select capacity option from the dropdown scale. If the "Other" category is not relevant to your situation, please select "We do not have thisprogram area."
Q11. From your perspective as State Epidemiologist, please identify:A. If there is a need to improve capacity for the four Essential Public Health Services(EPHS) in each of the following program areas in your State Health Department.
Chronic Disease
Environmental Health
Genomics
Infectious Disease
Informatics
Injury
Maternal and Child Health
Mental Health
Occupational Health
Oral Health
Preparedness
Substance Abuse
Vital Statistics
Other (please specify)
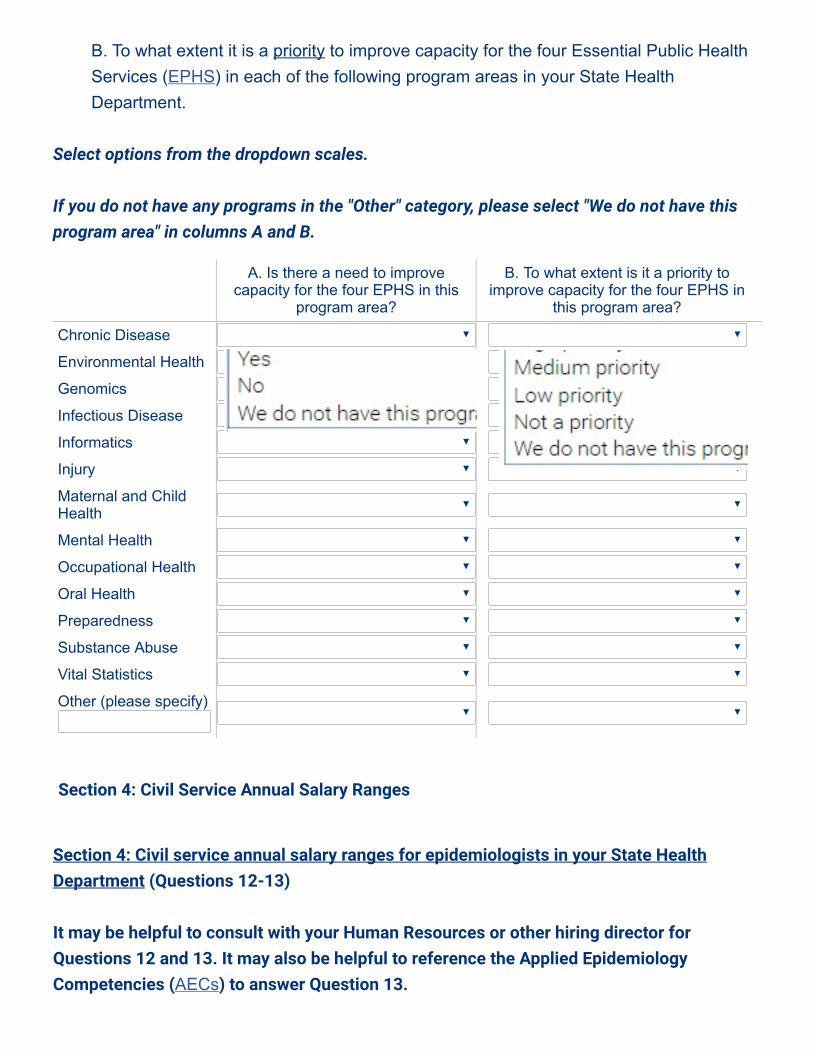
B. To what extent it is a priority to improve capacity for the four Essential Public HealthServices (EPHS) in each of the following program areas in your State HealthDepartment.
Select options from the dropdown scales.
If you do not have any programs in the "Other" category, please select "We do not have thisprogram area" in columns A and B.
Section 4: Civil Service Annual Salary Ranges
Section 4: Civil service annual salary ranges for epidemiologists in your State HealthDepartment (Questions 12-13)
It may be helpful to consult with your Human Resources or other hiring director forQuestions 12 and 13. It may also be helpful to reference the Applied EpidemiologyCompetencies (AECs) to answer Question 13.
A. Is there a need to improvecapacity for the four EPHS in this
program area?
B. To what extent is it a priority toimprove capacity for the four EPHS in
this program area?
Chronic Disease
Environmental Health
Genomics
Infectious Disease
Informatics
Injury
Maternal and ChildHealth
Mental Health
Occupational Health
Oral Health
Preparedness
Substance Abuse
Vital Statistics
Other (please specify)
Questions 12 and 13 have been included as options in the Human Resources Worksheet.
Please include only civil service employees. Further instructions for who should be countedas an epidemiologist can be found here.
Q12. Describe the civil service annual salary range for epidemiologists working in your StateHealth Department by degree (state employees only). If you have more than one position fora given degree below, please use the low end of the lowest position in that level to the highend of the highest position in that level. Example: If an entry level epidemiologist with an MDmakes $75,000 to $100,000 and a senior level epidemiologist with an MD makes $125,000 to$150,000 the salary scale is: $75,000-$150,000.
Please include only civil service employees.
Note: Commas are not permitted in response boxes. Only numbers are accepted. Pleaseround to the nearest whole number.
Q13. Describe the official Human Resources civil service annual salary range forepidemiologists working in your State Health Department by career level according to theApplied Epidemiology Competencies (AECs). If you have more than one position in a givencareer level below, please use the low end of the lowest position in that level to the high endof the highest position in that level.
Please include only civil service employees.
Salary Range (Minimum) Salary Range (Maximum)
MD, DO
DVM
PhD, DrPH, otherdoctoral
MPH, MSPH, otherMaster
BA, BS, BSN, otherBachelor
Associate or no posthigh school degree

Note: Commas are not permitted in response boxes. Only numbers are accepted. Pleaseround to the nearest whole number.
Section 5: Epidemiology Training and the AECs
Section 5: Epidemiology training and the Applied Epidemiology Competencies(AECs) (Questions 14-18)
Please consult other State Health Department epidemiologists for questions pertaining todomains not under your area of responsibility.
Question 18 (pressing training needs) has been included as an option in the Program AreaLeads Worksheet.
Q14. Does your public health agency do the following in order to provide access to training inepidemiology?
Salary Range (Minimum) Salary Range (Maximum)
State Epidemiologist
Deputy StateEpidemiologist
Senior LevelEpidemiologist
Mid LevelEpidemiologist
Entry LevelEpidemiologist
Yes No
Include education andtraining objectives inperformance review?
Pay for formal trainingor education outsideyour organization(conferences orseminars)?

Q15. Does your public health agency do the following in order to provide access to crosstraining in informatics?
Q16. Does your public health agency provide epidemiology training in collaboration with anyof the following organizations/groups?
If no "Other" is specified, please select "No."
Yes No
Provide onsite training(epidemiologyseminars, etc)?
Provide epidemiologytraining or education toepidemiologists at thelocal level?
Have staff position(s)responsible for internaltraining?
Require continuingeducation inepidemiology andsurveillance?
Yes No
Require crosstrainingin informatics?
Pay for formalinformatics training oreducation outside yourorganization(conferences orseminars)?
Provide onsiteinformatics training(seminars, etc)?
Provide informaticscrosstraining oreducation toepidemiologists at thelocal level?
Have staff position(s)responsible for internalinformatics crosstraining?

Q17. How does the State Health Department utilize the Applied Epidemiology Competencies(AECs) to define the career path for applied epidemiologists? For more information on who should be counted as an epidemiologist, please click here.
Select all that apply.
Yes No
Centers for Disease Controland Prevention (CDC)
Schools of Public Health
Public Health Institutes
Schools of Medicine
Schools of Nursing
Schools of VeterinaryMedicine
Other Academic Institutions
Centers for Public HealthPreparedness/Preparednessand Emergency ResponseLearning Centers
Public Health TrainingCenters
Other HealthcareOrganizations
Other Federal/governmentalagencies
Public Safety/FirstResponders
Other Healthcare Providers
Other (please specify)
Assess epidemiological capacity of specific positions
Assess gaps in knowledge
Create/update job qualification statements
Create/update position descriptions
Create/update promotion requirements
Develop curricula for continued education/training programs
Q18. From your perspective, what are the most pressing training needs among yourepidemiology staff?
For more information on who should be counted as an epidemiologist, please click here.
Please select the top two most pressing training needs.
Section 6: Existing Practices, Incentives and Barriers of the Workforce
Section 6: Existing practices, incentives and barriers aimed at strengthening the stateepidemiology workforce (Questions 19-21) All questions within this section should be completed by the State Epidemiologist or asenior level health official within your agency. It may be helpful to consult with a HumanResources or other hiring director.
Develop specific training plans to address gaps in knowledge
Not sure if we have used the AECs
We have not used the AECs
Assessments and evaluations (development and distribution)
Continuing education (basic epi refreshers, novel methodologies, updates to thefield/literature, etc.)
Cultural competency (diversity and inclusion, improving knowledge and attitudes to promoteculturally responsive work, community collaboration, etc.)
Data analytics (informatics, translating and applying public health data, etc.)
Fiscal management (planning, budgeting, and/or monitoring resources)
Leadership development (identifying future leaders, coaching/mentoring programs, retentionof current leaders)
Persuasive communication (articulating a message to the public, communicating publichealth research and data, policy engagement, etc.)
Systems thinking (systems development, change management, strategic planning, and/orflexibility)
Software skills (Epi Info, SAS, SPSS, R, etc.)
Teambuilding (improving interpersonal relations and collaboration among staff)
Other (please specify)

Question 21 (minimum hiring requirements) has been included as an option in the HumanResources Worksheet.
Q19. To what extent is each of these factors a problem in recruiting epidemiologists?
If the "Other" category is not relevant to your situation, please select "Not a Problem" in thatrow.
Q20. The following are useful recruitment settings or activities implemented by ourorganization:
If the "Other" category is not relevant to your situation, please select "No" in that row.
Salary scale
Personnel policies and procedures
Job benefits
Job security
Job location
Opportunity for promotion
Travel required
Travel permitted
Job interests/fulfillment
Opportunities for training
Limitations recruiting outside your organization
Restrictions on choosing the best candidate
Restrictions on hiring quickly enough
Restrictions on offering competitive pay
Hiring freezes
Other factor (please specify)
Yes No
Universities/Schools ofPublic Health
Recruitment job fairs
Q21. In general (regardless of program area), what are your minimum hiring requirementsfor entry level epidemiology positions at the State Health Department? For more information on who should be counted as an epidemiologist, please click here.
A. Educational Attainment: Please select option from dropdown list.
B. Years Experience: Please select option from dropdown list.
Yes No
Professionalorganizations (ACE,APHA, ASPPH,ASTHO, CSTE,NACCHO includingnewsletters andconferences)
Federal programs(CEFO, EIS, PHAP)
Other health agencieswithin the state
Local media
Periodic epidemiologynewsletters
State and/or localgovernment websites
Public Health careerwebsites (e.g. EmoryPublic HealthEmploymentConnection)
LinkedIn or other onlinenetworks
Other social media
Other (please specify)

C. What qualifies as experience? Select all that apply.
Section 7: Retention of the Workforce
Section 7: Vacancies and retention of the state epidemiology workforce (Questions 22-26)
All questions within this section should be completed by the State Epidemiologist or adesignated senior level health official within your agency. It may be helpful to consult with aHuman Resources director or other State Health Department staff by specific programareas.
Question 23 (vacancies by program area) has been included as an option in the HumanResources Worksheet.
Question 24 (obstacles to retention) has been included as an option in the Program AreaLeads Worksheet.
Q22. Does your State Health Department utilize contractors to fill vacancies forepidemiology/surveillance positions at the Master's degree and above level?
A vacancy is defined as a position to be filled at the State Health Department that meets thefollowing conditions: (1) there is work available for the position and (2) the job could startwithin 30 days.
Internships
Volunteering
Paid work
Full time experience
Other (please specify)
Yes

Q23. For epidemiology/surveillance positions at the Master's degree and above level, pleaseestimate the number of vacancies by program area in civil service positions (columns A andB) and contract employees (columns C and D). Please attribute the fraction of time forvacancy by program area to the nearest 0.1 FTE if there is vacancy for a position overmultiple program areas.
A vacancy is defined as a position to be filled at the State Health Department that meets thefollowing conditions: (1) there is work available for the position and (2) the job could startwithin 30 days. Do not include positions that are required to be left vacant due to hiring freezesor other requirements.
To navigate across rows, use the TAB key.
Please do not leave any box blank, indicate "0" instead. For columns C and D, if you do not use contractors, indicate "0."
No
A. What is thenumber ofvacant
epidemiologypositions at the
healthdepartment forcivil serviceemployees?
B. How manycivil
service positionsdo you intend tofill (activelyworking with
HR)?
C. What is the numberof vacant
epidemiology positionsat the healthdepartment for
contract employees?
D. How manycontract
positions doyou intend tofill (activelyworking with
HR)?
Chronic Disease
Environmental Health
Genomics
Infectious Disease
Informatics
Injury
Maternal and ChildHealth
Mental Health
Occupational Health
Oral Health

Q24. To what extent is each of these factors a problem in retaining epidemiologists?
Please include only civil service employees.
If no "Other" is specified, please select "Not a Problem."
A. What is thenumber ofvacant
epidemiologypositions at the
healthdepartment forcivil serviceemployees?
B. How manycivil
service positionsdo you intend tofill (activelyworking with
HR)?
C. What is the numberof vacant
epidemiology positionsat the healthdepartment for
contract employees?
D. How manycontract
positions doyou intend tofill (activelyworking with
HR)?
Preparedness
Substance Abuse
Vital Statistics
Other (please specify)
Salary scale
Personnel policies and procedures
Job benefits
Job security
Job location
Opportunity for promotion
Travel required
Travel permitted
Job interests/fulfillment
Opportunities for training
Loss to private or government sector
Restrictions on merit raises
Restrictions on travel outside jurisdiction
Layoffs from budget restrictions
Other factor (please specify)

Q25. In light of the projected public health workforce shortage, how are you currently workingwith staff to minimize turnover?
Select all that apply.
Q26. In light of the projected public health workforce shortage, how are you working withstaff to maintain institutional knowledge?
Select all that apply.
Section 8: Preparedness
Section 8: Preparedness within the State Health Department (Question 27)
This question should be completed by the State Epidemiologist or a senior level healthofficial within your agency.
Q27. Do you utilize an Outbreak Management System?
Internal promotions
Mentoring/informal coaching
Promoting task diversity in assignments
Providing professional development and training
Publicly recognizing employee achievements
Succession planning
Other (please specify)
Documenting standard operating procedures
Participating in preceptorship/practicum programs
Providing internal training
Providing professional development
Other (please specify)
An outbreak management system supports the initial characterization, investigation, response,and containment of outbreaks through the collection and analysis of data.
Section 9: Leadership Feedback
Section 9: Leadership feedback (Questions 28-29)
All questions within this section should be completed by the State Epidemiologist or adesignated senior level health official within your agency.
Q28. As the State Epidemiologist, what are the most critical issues you face?
Q29. What other thoughts, comments, concerns or questions would you like to share withCSTE with regard to the epidemiology workforce and training?
Section 10: Review Assessment
Yes
No

Powered by Qualtrics
Section 10: Review of assessment (Questions 30-31)
All questions within this section should be completed by the State Epidemiologist or adesignated senior level health official within your agency.
Please review the previous 9 sections of the assessment prior to completing this section toconfirm all questions have been answered accurately.
Q30. As the State Epidemiologist, I confirm that all questions within this assessment havebeen answered.
Q31. As the State Epidemiologist, I confirm that all parts of this assessment have beencompleted accurately, to the best of my knowledge. I have consulted with other State HealthDepartment staff as needed.
Submit Assessment
After you have completed a review of the responses to the 2017 Epidemiology CapacityAssessment and confirm that the assessment has been completed accurately to the best of
your knowledge, please click the forward arrow below to submit your responses. Yourresponses cannot be reviewed after submission.
Click the next arrow to submit your responses.
If you have any additional questions or comments, please email Jessica Arrazola [email protected].
Click here to confirm
Click here to confirm

APPENDIX B
Human Resources Worksheet
State Epidemiologist Instructions:
1. To facilitate feedback from your human resources group, we have created this worksheet, which allows you
to gather information on specific questions of your choosing. These include (1) question 7, which examines
the numbers of FTEs in each program area by funding source; (2) questions 12 and 13, which include salary
ranges by highest degree and by job category; (3) question 21 (minimum hiring criteria), and (4) question 23
(vacancies by program area).
2. If you prefer not to obtain input from human resources on some of these topics, you may simply delete the
individual worksheets. Question 7 might be filled out by the program area leads or by human resources. For
large health departments with multiple epidemologists, the question 7 worksheet allows the development of
a line listing for each epidemiologist including their program area and their funding, and provides an
automatically generated table and sums the total FTEs by program area for inclusion on the actual assessment
form.
3. Click the tabs at the bottom of the spreadsheet to navigate between questions. Note that some of the tabs
include content outside the view from 100% zoom, so it is necessary to scroll down.
4. Please remove this tab before sending out. Do not remove the tab marked "DO NOT DELETE" since it
contains the code to facilitate automatic entry of the program lead information.
5. If you wish to print this spreadsheet, please scale to one page to preserve formatting.
HR Lead Name:
HR Lead Email:
Human Resources Worksheet, Epidemiology Capacity Assessment
Identify HR Lead
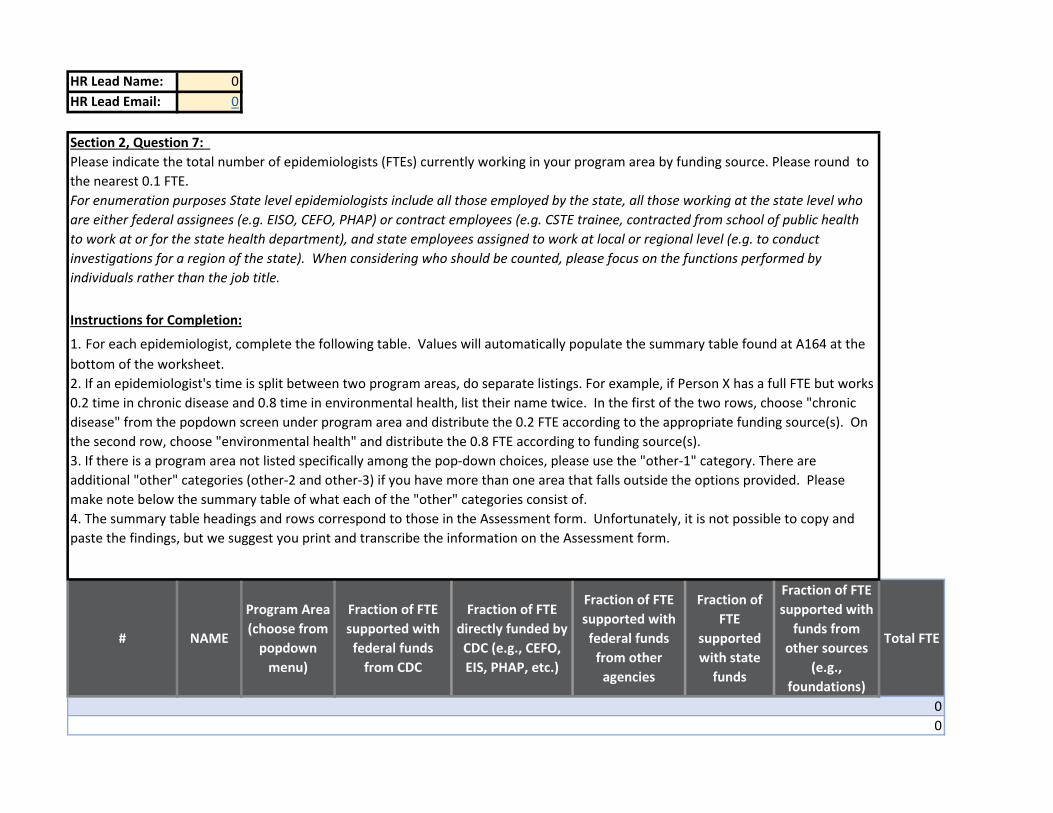
HR Lead Name: 0
HR Lead Email: 0
# NAME
Program Area
(choose from
popdown
menu)
Fraction of FTE
supported with
federal funds
from CDC
Fraction of FTE
directly funded by
CDC (e.g., CEFO,
EIS, PHAP, etc.)
Fraction of FTE
supported with
federal funds
from other
agencies
Fraction of
FTE
supported
with state
funds
Fraction of FTE
supported with
funds from
other sources
(e.g.,
foundations)
Total FTE
0
0
Section 2, Question 7:
Please indicate the total number of epidemiologists (FTEs) currently working in your program area by funding source. Please round to
the nearest 0.1 FTE.
For enumeration purposes State level epidemiologists include all those employed by the state, all those working at the state level who
are either federal assignees (e.g. EISO, CEFO, PHAP) or contract employees (e.g. CSTE trainee, contracted from school of public health
to work at or for the state health department), and state employees assigned to work at local or regional level (e.g. to conduct
investigations for a region of the state). When considering who should be counted, please focus on the functions performed by
individuals rather than the job title.
Instructions for Completion:
1. For each epidemiologist, complete the following table. Values will automatically populate the summary table found at A164 at the
bottom of the worksheet.
2. If an epidemiologist's time is split between two program areas, do separate listings. For example, if Person X has a full FTE but works
0.2 time in chronic disease and 0.8 time in environmental health, list their name twice. In the first of the two rows, choose "chronic
disease" from the popdown screen under program area and distribute the 0.2 FTE according to the appropriate funding source(s). On
the second row, choose "environmental health" and distribute the 0.8 FTE according to funding source(s).
3. If there is a program area not listed specifically among the pop-down choices, please use the "other-1" category. There are
additional "other" categories (other-2 and other-3) if you have more than one area that falls outside the options provided. Please
make note below the summary table of what each of the "other" categories consist of.
4. The summary table headings and rows correspond to those in the Assessment form. Unfortunately, it is not possible to copy and
paste the findings, but we suggest you print and transcribe the information on the Assessment form.
SUMMARY TABLE
then open Analzye, and hit Refresh
Row Labels
Sum of
Fraction
of FTE
supporte
d with
federal
funds
from CDC
Sum of
Fraction of
FTE directly
funded by
CDC (e.g.,
CEFO, EIS,
PHAP, etc.)
Sum of Fraction of
FTE supported
with federal funds
from other
agencies
Sum of Fraction of
FTE supported
with state funds
Sum of Fraction
of FTE supported
with funds from
other sources
(e.g.,
foundations)
Sum of Total
FTE
(blank) 0.0
Grand Total 0.0
If no values appear in SUMMARY TABLE or if you have added or removed names, click on the table, which brings up Pivot Table tabs

HR Lead Name: 0
HR Lead Email: 0
Degree Salary Range (Minimum) Salary Range
(Maximum)
MD, DO $ - $ -
DDS $ - $ -
If no values appear in SUMMARY
TABLE or if you have added or
removed names, click on the table,
which brings up Pivot Table tabs
$ - $ -
then open Analzye, and hit Refresh $ - $ -
MPH, MSPH, other Master $ - $ -
BA, BS, BSN, other Bachelor $ - $ -
Associate or no post high school
degree $ - $ -
Section 4, Question 12:
Describe the civil service annual salary range for epidemiologists working in your State Health Department
by degree (State employees only). If you have more than one position for a given degree below, please use
the low end of the lowest position in that level to the high end of the highest position in that level.
Example: If an entry level epidemiologist with an MD makes $75,000 to $100,000 and a senior level
epidemiologist with an MD makes $125,000 to $150,000 the salary scale is: $75,000-$150,000. Please
include only civil service employees.
Instructions for Completion:
1. Click each cell to enter the minimum or maximum value of the range. Values will automatically appear as
currency.
2. Only numbers are accepted. Please round to the nearest whole number.
3. Please do not leave any cell blank.
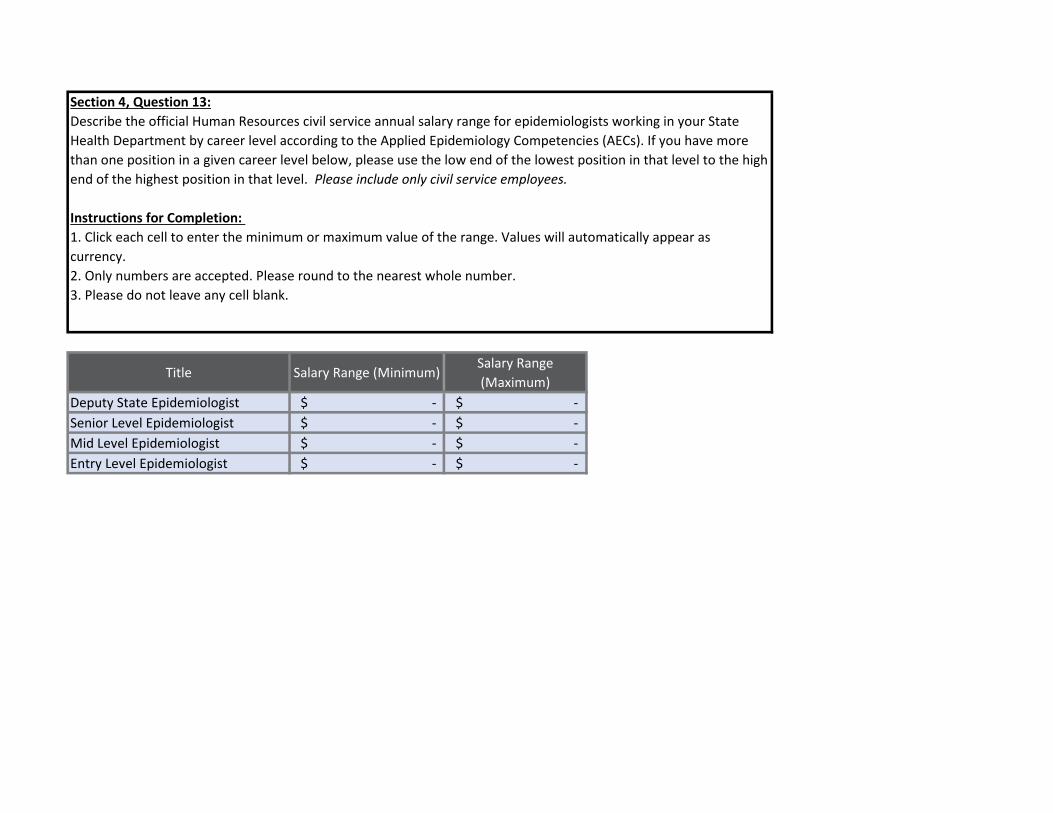
Title Salary Range (Minimum) Salary Range
(Maximum)
Deputy State Epidemiologist $ - $ -
Senior Level Epidemiologist $ - $ -
Mid Level Epidemiologist $ - $ -
Entry Level Epidemiologist $ - $ -
Section 4, Question 13:
Describe the official Human Resources civil service annual salary range for epidemiologists working in your State
Health Department by career level according to the Applied Epidemiology Competencies (AECs). If you have more
than one position in a given career level below, please use the low end of the lowest position in that level to the high
end of the highest position in that level. Please include only civil service employees.
Instructions for Completion:
1. Click each cell to enter the minimum or maximum value of the range. Values will automatically appear as
currency.
2. Only numbers are accepted. Please round to the nearest whole number.
3. Please do not leave any cell blank.
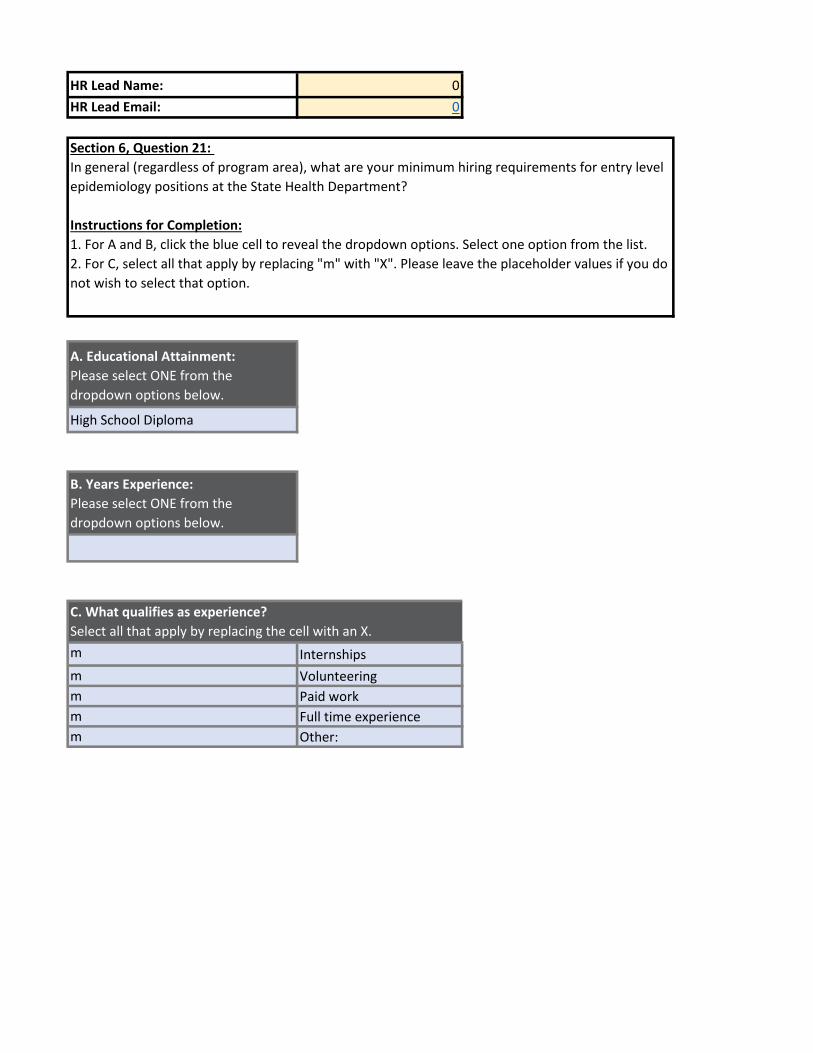
HR Lead Name: 0
HR Lead Email: 0
A. Educational Attainment:
Please select ONE from the
dropdown options below.
High School Diploma
B. Years Experience:
Please select ONE from the
dropdown options below.
m Internships
m Volunteering
m Paid work
m Full time experience
m Other:
C. What qualifies as experience?
Select all that apply by replacing the cell with an X.
Section 6, Question 21:
In general (regardless of program area), what are your minimum hiring requirements for entry level
epidemiology positions at the State Health Department?
Instructions for Completion:
1. For A and B, click the blue cell to reveal the dropdown options. Select one option from the list.
2. For C, select all that apply by replacing "m" with "X". Please leave the placeholder values if you do
not wish to select that option.

HR Lead Name: 0
HR Lead Email: 0
Section 7, Question 23:
For epidemiology/surveillance positions at the Master's degree and above level, please estimate the number of vacancies by
program area in civil service positions (columns A and B) and contract employees (columns C and D).
A vacancy is defined as a position to be filled at the State Health Department that meets the following conditions: (1) there is
work available for the position and (2) the job could start within 30 days. Do not include positions that are required to be left
vacant due to hiring freezes or other requirements.
Instructions for Completion:
1. Cells within the table are restricted to numbers only.
2. Please attribute the fraction of time for vacancy by program area to the nearest 0.1 FTE if there is vacancy for a position
over multiple program areas.
3. Please do not leave any cell blank, indicate "0" instead.
4. For columns C and D, if you do not use contractors, indicate "0."
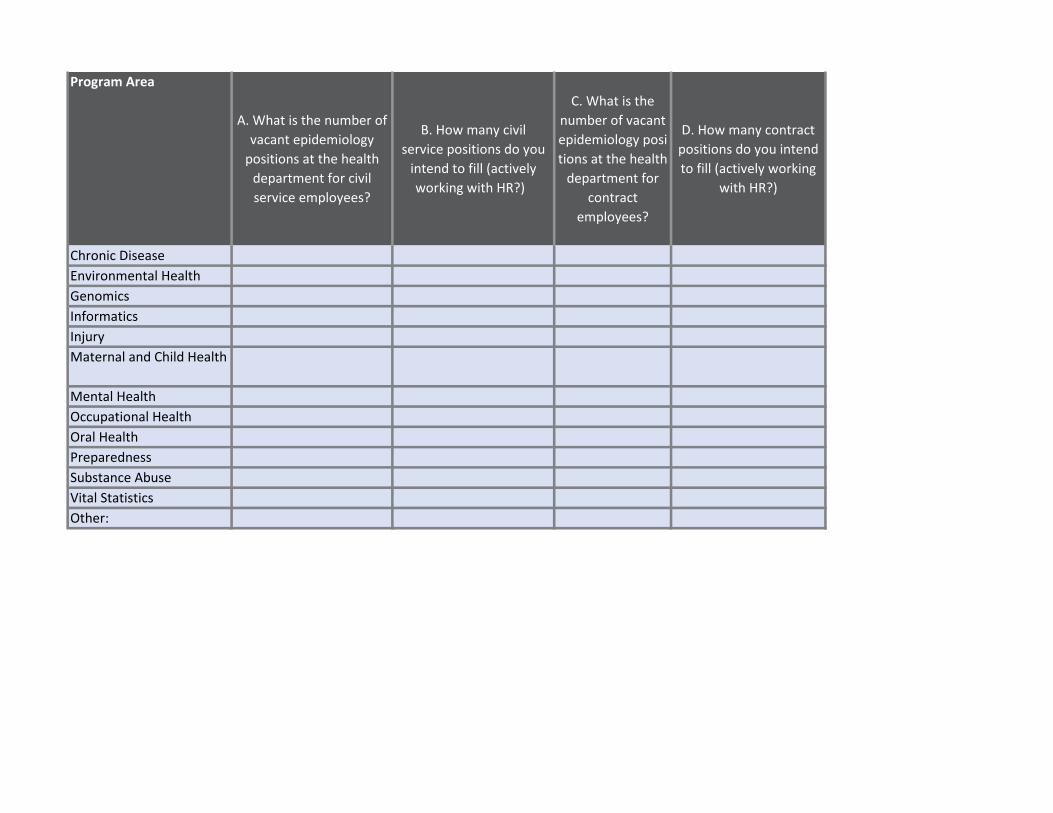
Program Area
A. What is the number of
vacant epidemiology
positions at the health
department for civil
service employees?
B. How many civil
service positions do you
intend to fill (actively
working with HR?)
C. What is the
number of vacant
epidemiology posi
tions at the health
department for
contract
employees?
D. How many contract
positions do you intend
to fill (actively working
with HR?)
Chronic Disease
Environmental Health
Genomics
Informatics
Injury
Maternal and Child Health
Mental Health
Occupational Health
Oral Health
Preparedness
Substance Abuse
Vital Statistics
Other:

APPENDIX C

Program Area Leads Worksheet
State Epidemiologist Instructions:
1. To facilitate feedback from your program area leads, we have created this worksheet, which allows
you to gather information on specific questions of your choosing. These include (1) question 7, which
examines the numbers of FTEs in each program area by funding source; (2) question 8, which
concerns the ideal number of epidemiologists in the program area; (3) question 10, which concerns
the capacity of each program area to achieve the four Essential Public Health Services most closely
linked to epidemiology; and (4) question 24, which asks about problems with staff retention.
2. If you prefer not to obtain input from the program leads on some of these topics, you may simply
delete the individual worksheets. For large health departments or program areas with multiple
epidemologists, the question 7 worksheet allows the program area leads to develop a line listing for
each epidemiologist in their group and sums the total FTEs for inclusion on the actual assessment
form.
3. Click the tabs at the bottom of the spreadsheet to navigate between questions. Note that some of
the tabs include content outside the view from 100% zoom, so it is necessary to scroll down.
4. Please remove this tab before sending out. Do not remove the tab marked "DO NOT DELETE" since
it contains the code to facilitate automatic entry of the program lead information, as well as code for
dropdown lists.
5. If you wish to print this spreadsheet, please scale to one page to preserve formatting.
Your name:
Your email:
Program Area (click cell to
view list):
Program Area Lead Worksheet, Epidemiology Capacity Assessment
Identify Program Area Lead

Your name: 0
Your email: 0
Program Area (click
cell to view list): 0
TABLE A
Number supported
with federal funds
from CDC
Number directly
funded by CDC (e.g.,
CEFO, EIS, PHAP, etc.)
Number supported
with federal funds
from other agencies
Number supported
with state funds
Number supported with
funds from other sources
(e.g., foundations)
Total
TOTAL EPIS IN
PROGRAM AREA 0
Section 2, Question 7:
Please indicate the total number of epidemiologists (FTEs) currently working in your program area by funding source. Please round to the nearest
0.1 FTE.
For enumeration purposes State level epidemiologists include all those employed by the state, all those working at the state level who are either
federal assignees (e.g. EISO, CEFO, PHAP) or contract employees (e.g. CSTE trainee, contracted from school of public health to work at or for the
state health department), and state employees assigned to work at local or regional level (e.g. to conduct investigations for a region of the state).
When considering who should be counted, please focus on the functions performed by individuals rather than the job title.
Instructions for Completion:
1. Table A below should reflect the total number of epidemiologists in the program area (last column) broken down by funding source (column
categories).
2. Table B below should reflect individual staff members and their amount of FTE support in each funding source category. See specific Table B
instructions in the box directly above it.
3. Please make sure that the first row from Table B (TOTALS) matches that of Table A (TOTAL EPIS IN PROGRAM AREA) exactly.

TABLE B
Fraction of FTE
supported with
federal funds from
CDC
Fraction of FTE
directly funded by
CDC (e.g., CEFO, EIS,
PHAP, etc.)
Fraction of FTE
supported with
federal funds from
other agencies
Fraction of FTE
supported with
state funds
Fraction of FTE supported
with funds from other
sources (e.g.,
foundations)
Total FTE
TOTALS 0 0 0 0 0 0
Name 1 0
Name 2 0
Name 3 0
Name 4 0
Name 5 0
Name 6 0
Name 7 0
Name 8 0
Name 9 0
Name 10 0
If there are multiple epidemiologists in your program area, you may wish to develop a line list with the individual names of your staff members and
the amount of FTE support in each category. The sums will appear automatically in line 13 above. If there are more than 10 epidemiologists in the
group, please adjust the AutoSum formula to include all.

Your name: 0
Your email: 0
Program Area (click cell
to view list): 0
Section 2, Question 8:
Please estimate of ideal number of additional epidemiologists needed to reach full capacity in your program area (the number of
epidemiologists in addition to the current number regardless of resources. Please attribute the fraction of capacity ito the nearest
0.1 FTE if less than one FTE is needed.
Instructions for Completion:
1. Insert estimated number into the blue cell.
2. Only numbers are accepted. Please round to one decimal place.
Estimate ideal number of additional
epidemiologists needed to reach full capacity

Your name: 0
Your email: 0
Program Area (click cell
to view list): 0
Substantial: 50-74% epidemiological and surveillance capacity to provide the four EPHS.
Select capacity option for
your program area: None (0%)
Section 3, Question 10:
What best describes the current epidemiological capacity to provide the four Essential Public Health Services (EPHS), such that the
Department is able to lead activities, provide subject matter expertise, and apply for, receive, and manage resources to conduct key
activities in the each of the following program areas in your State Health Department?
Instructions for Completion:
1. Please answer only for your program area.
2. The four EPHS and the capacity scale response options are listed in the two tables immediately below.
3. Select capacity option from the dropdown scale of the third table below. Click on the cell to see the dropdown list.
Essential Public Health Services:
EPHS #2 Diagnosing and investigating health problems and health hazards in the community (2)
EPHS #9 Evaluating effectiveness, accessibility and quality of personal and population-based health services (3)
EPHS #10 Researching for new insights and innovative solutions to health problems (4)
EPHS #1 Monitoring health status to identify and solve community health problems (1)
Capacity scale response options:
Minimal: 1-24% epidemiological and surveillance capacity to provide the four EPHS.
Partial: 25-49% epidemiological and surveillance capacity to provide the four EPHS.
Almost full: 75-99% epidemiological and surveillance capacity to provide the four EPHS.
Full: 100% epidemiological and surveillance capacity to provide the four EPHS.
None: 0% epidemiological and surveillance capacity to provide the four EPHS.

Your name: 0
Your email: 0
Program Area (click cell to
view list): 0
m
m
m
m
m
m
m
m
m
m
m
Section 5, Question 18:
What are the most pressing training needs among your epidemiology staff?
Instructions for Completion:
1. This question is included so that program leads can provide input to the State
Epidemiologist. The State Epidemiologist will answer in the Assessment from their
perspective.
2. Please select the top two most pressing training needs from the list.
3. Select by replacing "m" with "X". Please leave the placeholder values in the options you
do not wish to select.
Assessments and evaluations (development and
distribution)
Continuing education (basic epi refreshers, novel
methodologies, updates to the field/literature, etc.)
Cultural competency (diversity and inclusion, improving
knowledge and attitudes to promote culturally responsive
work, community collaboration, etc.)
Data analytics (informatics, translating and applying public
health data, etc.)
Other (please specify)
What are the top two most pressing training needs?
Fiscal management (planning, budgeting, and/or monitoring
resources)
Leadership development (identifying future leaders,
coaching/mentoring programs, retention of current leaders)
Persuasive communication (articulating a message to the
Systems thinking (systems development, change
Software skills (Epi Info, SAS, SPSS, R, etc.)
Team-building (improving interpersonal relations and
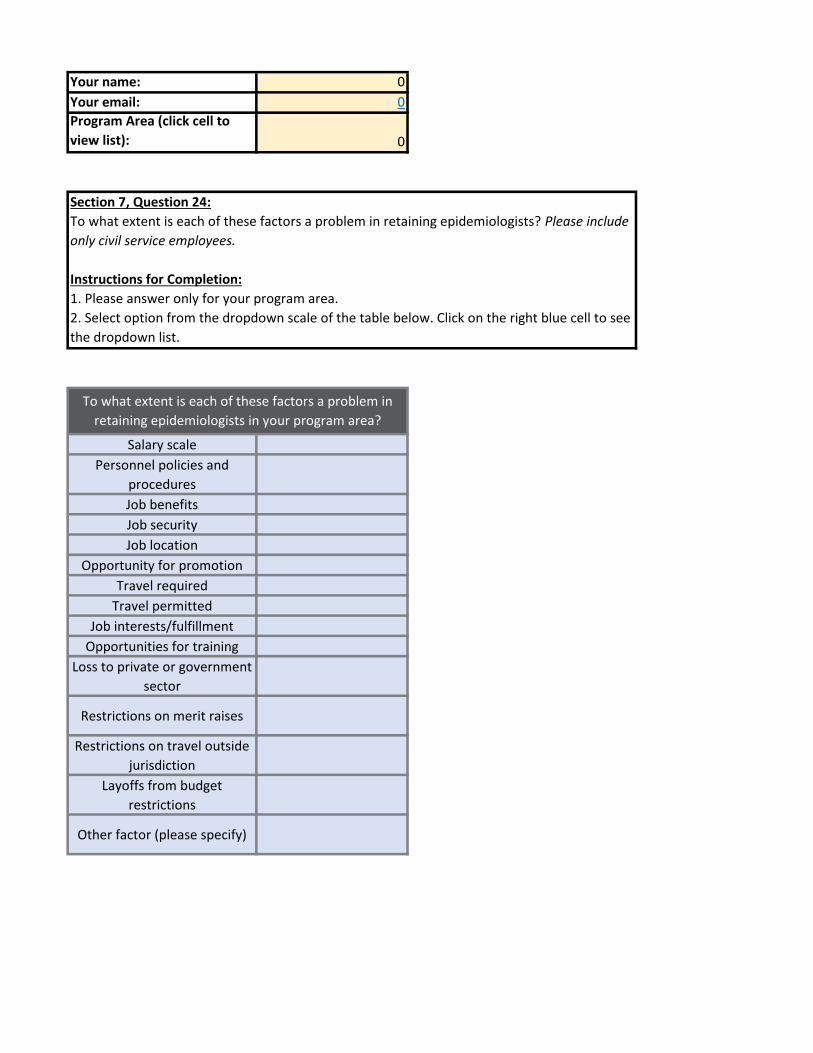
Your name: 0
Your email: 0
Program Area (click cell to
view list): 0
Salary scale
Personnel policies and
procedures
Job benefits
Job security
Job location
Opportunity for promotion
Travel required
Travel permitted
Job interests/fulfillment
Opportunities for training
Loss to private or government
sector
Restrictions on merit raises
Restrictions on travel outside
jurisdiction
Layoffs from budget
restrictions
Other factor (please specify)
Section 7, Question 24:
To what extent is each of these factors a problem in retaining epidemiologists? Please include
only civil service employees.
Instructions for Completion:
1. Please answer only for your program area.
2. Select option from the dropdown scale of the table below. Click on the right blue cell to see
the dropdown list.
3. If the "Other" category is not relevant to your situation, please select "Not a Problem" in
To what extent is each of these factors a problem in
retaining epidemiologists in your program area?


![ECA [UandiStar.org]](https://img.pdfslide.us/doc/110x75/55cf9008550346703ba28dee/eca-uandistarorg.jpg)