Embed Size (px)
Citation preview

STATE OF WISCONSIN
DETI-17957-RAC-P (R. 3/2018)
2017 ECONOMIC ANDWORKFORCE PROFILE
Racine County
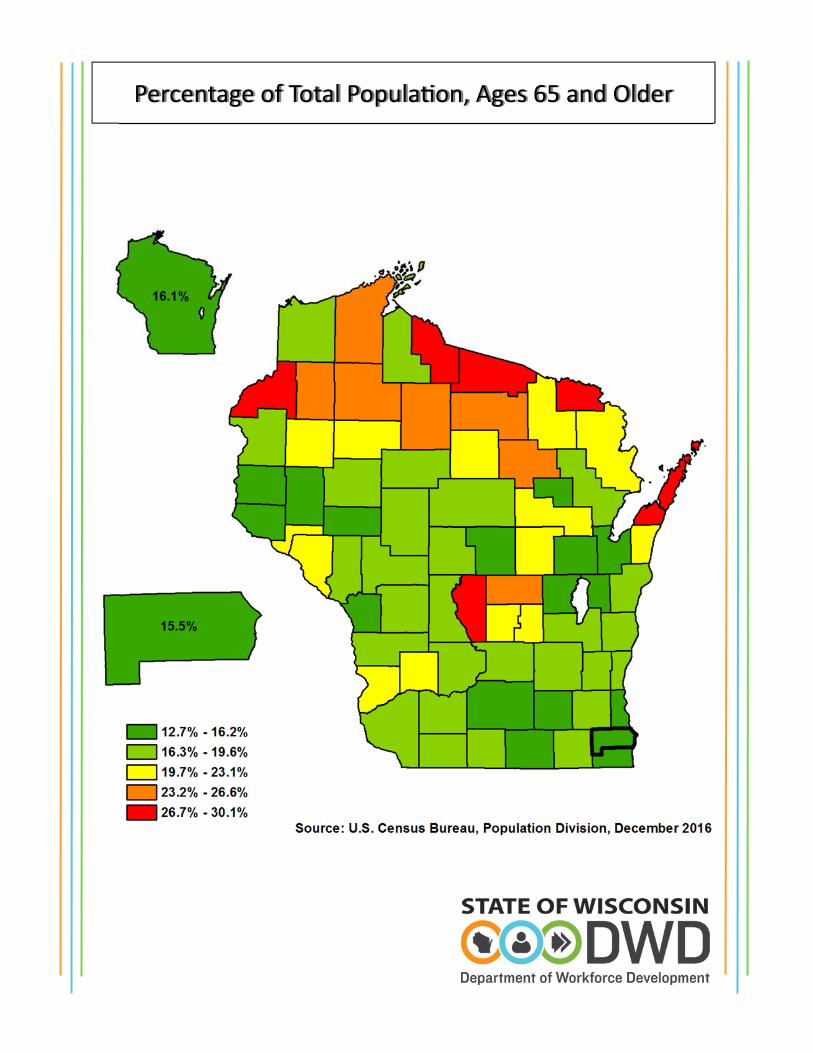
Percentage of Total Popula on, Ages 65 and Older
1
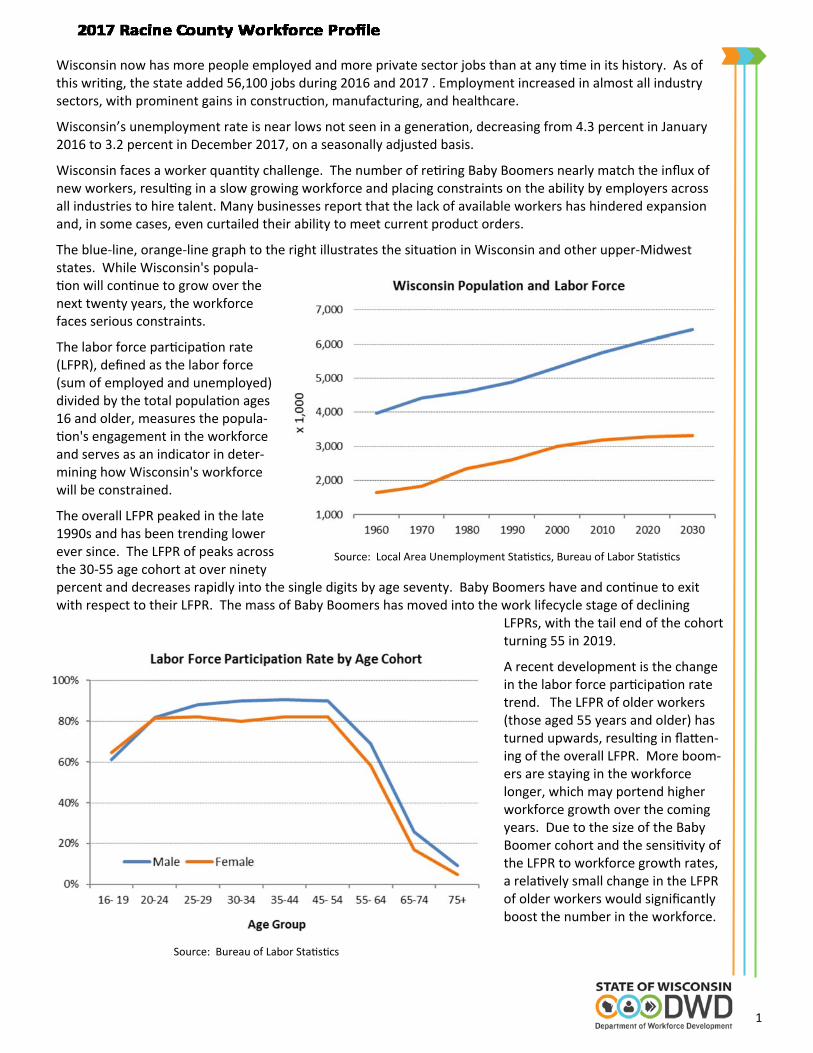
Wisconsin now has more people employed and more private sector jobs than at any me in its history. As of this wri ng, the state added 56,100 jobs during 2016 and 2017 . Employment increased in almost all industry sectors, with prominent gains in construc on, manufacturing, and healthcare.
Wisconsin’s unemployment rate is near lows not seen in a genera on, decreasing from 4.3 percent in January 2016 to 3.2 percent in December 2017, on a seasonally adjusted basis.
Wisconsin faces a worker quan ty challenge. The number of re ring Baby Boomers nearly match the influx of new workers, resul ng in a slow growing workforce and placing constraints on the ability by employers across all industries to hire talent. Many businesses report that the lack of available workers has hindered expansion and, in some cases, even curtailed their ability to meet current product orders.
The blue‐line, orange‐line graph to the right illustrates the situa on in Wisconsin and other upper‐Midwest states. While Wisconsin's popula‐
on will con nue to grow over the next twenty years, the workforce faces serious constraints.
The labor force par cipa on rate (LFPR), defined as the labor force (sum of employed and unemployed) divided by the total popula on ages 16 and older, measures the popula‐
on's engagement in the workforce and serves as an indicator in deter‐mining how Wisconsin's workforce will be constrained.
The overall LFPR peaked in the late 1990s and has been trending lower ever since. The LFPR of peaks across the 30‐55 age cohort at over ninety percent and decreases rapidly into the single digits by age seventy. Baby Boomers have and con nue to exit with respect to their LFPR. The mass of Baby Boomers has moved into the work lifecycle stage of declining
LFPRs, with the tail end of the cohort turning 55 in 2019.
A recent development is the change in the labor force par cipa on rate trend. The LFPR of older workers (those aged 55 years and older) has turned upwards, resul ng in fla en‐ing of the overall LFPR. More boom‐ers are staying in the workforce longer, which may portend higher workforce growth over the coming years. Due to the size of the Baby Boomer cohort and the sensi vity of the LFPR to workforce growth rates, a rela vely small change in the LFPR of older workers would significantly boost the number in the workforce.
Source: Local Area Unemployment Sta s cs, Bureau of Labor Sta s cs
Source: Bureau of Labor Sta s cs
2
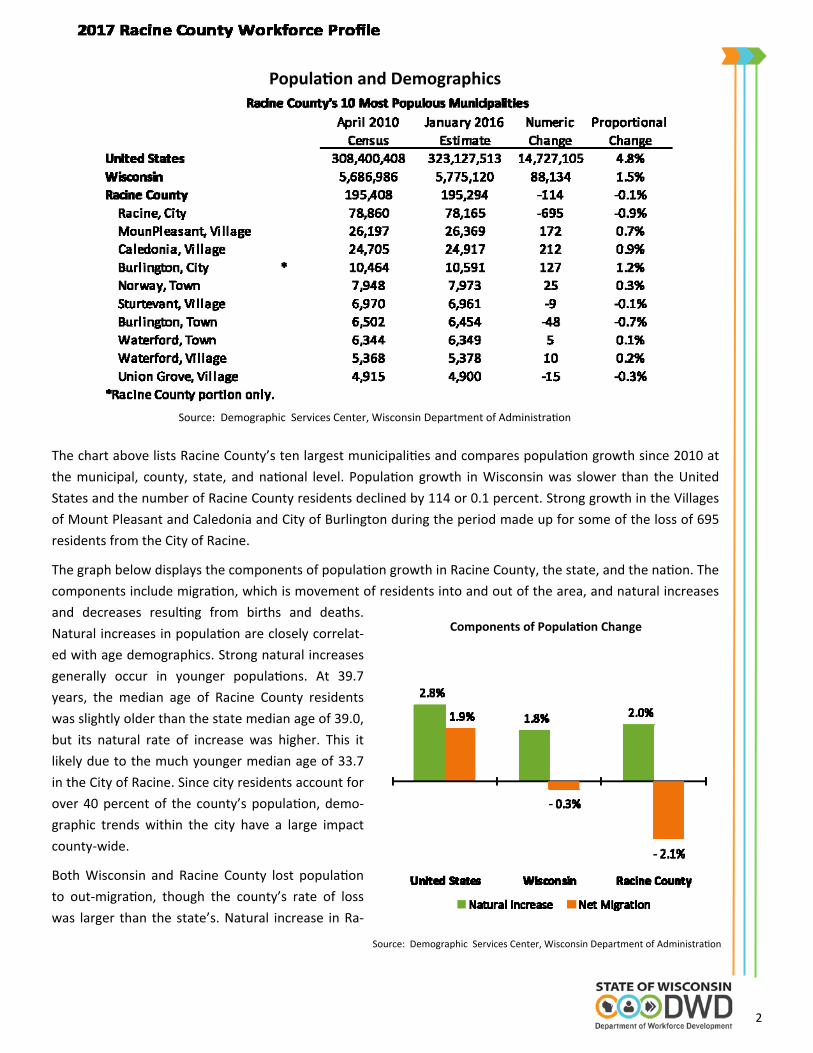
Popula on and Demographics
The chart above lists Racine County’s ten largest municipali es and compares popula on growth since 2010 at
the municipal, county, state, and na onal level. Popula on growth in Wisconsin was slower than the United
States and the number of Racine County residents declined by 114 or 0.1 percent. Strong growth in the Villages
of Mount Pleasant and Caledonia and City of Burlington during the period made up for some of the loss of 695
residents from the City of Racine.
The graph below displays the components of popula on growth in Racine County, the state, and the na on. The
components include migra on, which is movement of residents into and out of the area, and natural increases
and decreases resul ng from births and deaths.
Natural increases in popula on are closely correlat‐
ed with age demographics. Strong natural increases
generally occur in younger popula ons. At 39.7
years, the median age of Racine County residents
was slightly older than the state median age of 39.0,
but its natural rate of increase was higher. This it
likely due to the much younger median age of 33.7
in the City of Racine. Since city residents account for
over 40 percent of the county’s popula on, demo‐
graphic trends within the city have a large impact
county‐wide.
Both Wisconsin and Racine County lost popula on
to out‐migra on, though the county’s rate of loss
was larger than the state’s. Natural increase in Ra‐
Source: Demographic Services Center, Wisconsin Department of Administra on
Source: Demographic Services Center, Wisconsin Department of Administra on
Components of Popula on Change
3
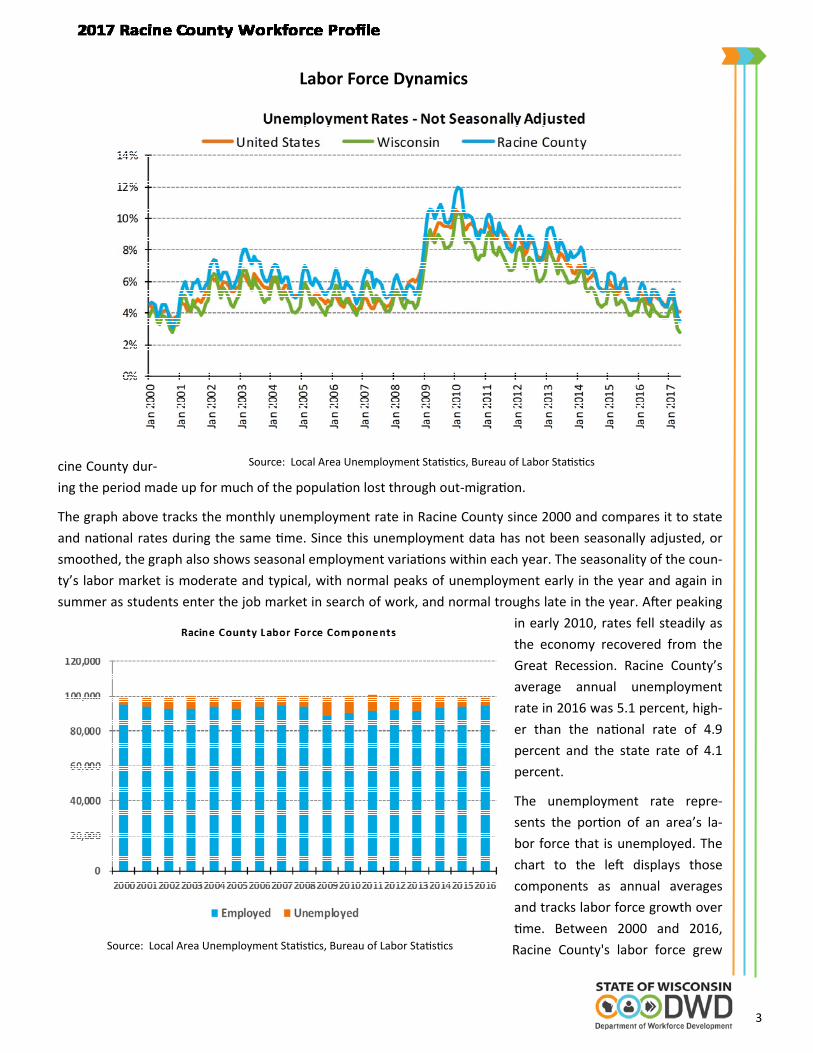
Labor Force Dynamics
cine County dur‐
ing the period made up for much of the popula on lost through out‐migra on.
The graph above tracks the monthly unemployment rate in Racine County since 2000 and compares it to state
and na onal rates during the same me. Since this unemployment data has not been seasonally adjusted, or
smoothed, the graph also shows seasonal employment varia ons within each year. The seasonality of the coun‐
ty’s labor market is moderate and typical, with normal peaks of unemployment early in the year and again in
summer as students enter the job market in search of work, and normal troughs late in the year. A er peaking
in early 2010, rates fell steadily as
the economy recovered from the
Great Recession. Racine County’s
average annual unemployment
rate in 2016 was 5.1 percent, high‐
er than the na onal rate of 4.9
percent and the state rate of 4.1
percent.
The unemployment rate repre‐
sents the por on of an area’s la‐
bor force that is unemployed. The
chart to the le displays those
components as annual averages
and tracks labor force growth over
me. Between 2000 and 2016,
Racine County's labor force grew
Source: Local Area Unemployment Sta s cs, Bureau of Labor Sta s cs
Source: Local Area Unemployment Sta s cs, Bureau of Labor Sta s cs
4
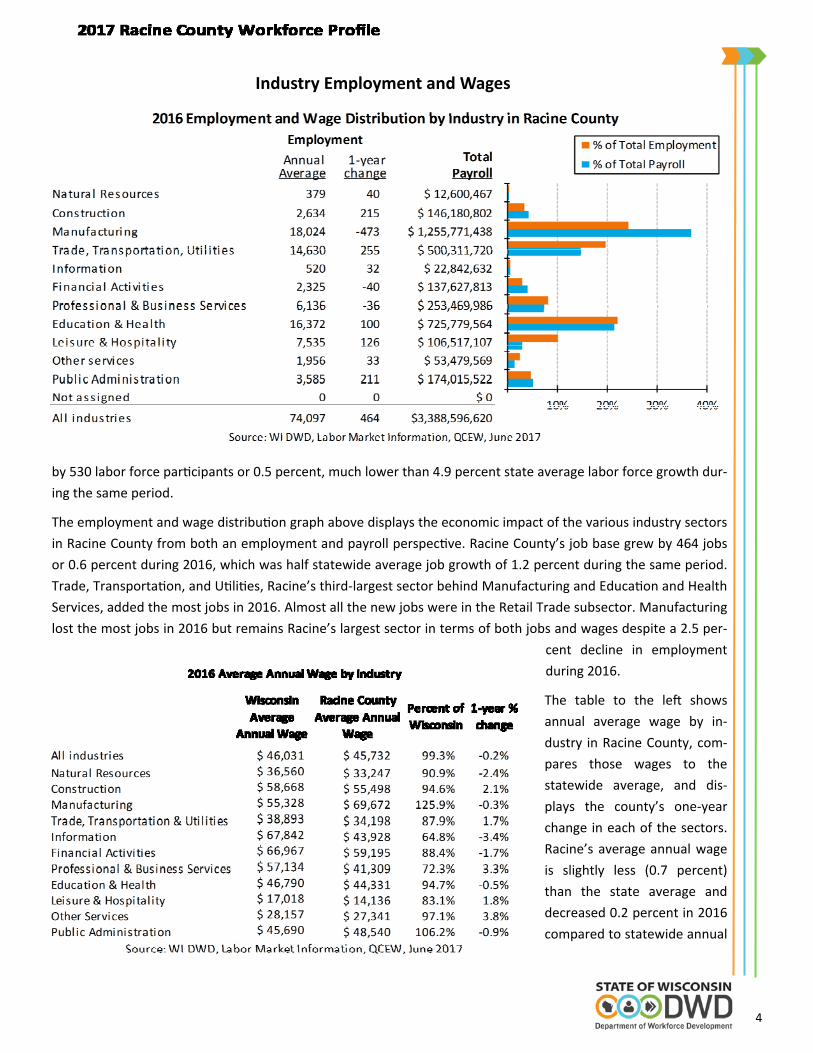
Industry Employment and Wages
by 530 labor force par cipants or 0.5 percent, much lower than 4.9 percent state average labor force growth dur‐
ing the same period.
The employment and wage distribu on graph above displays the economic impact of the various industry sectors
in Racine County from both an employment and payroll perspec ve. Racine County’s job base grew by 464 jobs
or 0.6 percent during 2016, which was half statewide average job growth of 1.2 percent during the same period.
Trade, Transporta on, and U li es, Racine’s third‐largest sector behind Manufacturing and Educa on and Health
Services, added the most jobs in 2016. Almost all the new jobs were in the Retail Trade subsector. Manufacturing
lost the most jobs in 2016 but remains Racine’s largest sector in terms of both jobs and wages despite a 2.5 per‐
cent decline in employment
during 2016.
The table to the le shows
annual average wage by in‐
dustry in Racine County, com‐
pares those wages to the
statewide average, and dis‐
plays the county’s one‐year
change in each of the sectors.
Racine’s average annual wage
is slightly less (0.7 percent)
than the state average and
decreased 0.2 percent in 2016
compared to statewide annual
5
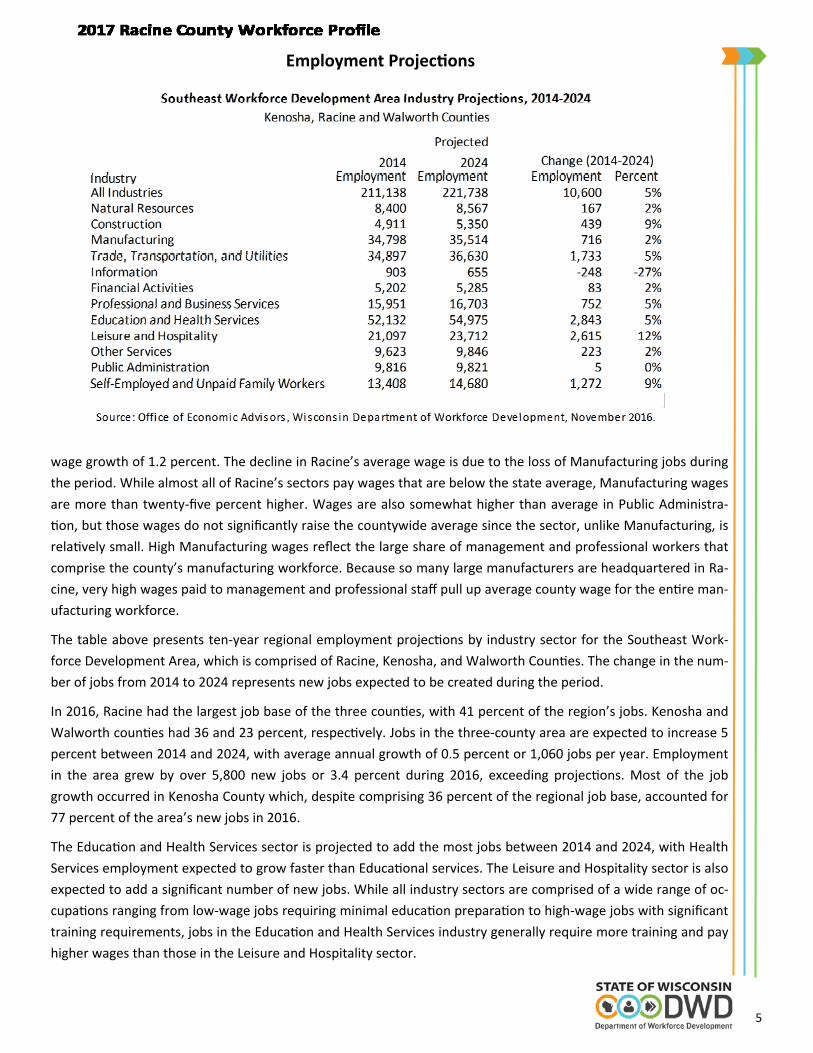
Employment Projec ons
wage growth of 1.2 percent. The decline in Racine’s average wage is due to the loss of Manufacturing jobs during
the period. While almost all of Racine’s sectors pay wages that are below the state average, Manufacturing wages
are more than twenty‐five percent higher. Wages are also somewhat higher than average in Public Administra‐
on, but those wages do not significantly raise the countywide average since the sector, unlike Manufacturing, is
rela vely small. High Manufacturing wages reflect the large share of management and professional workers that
comprise the county’s manufacturing workforce. Because so many large manufacturers are headquartered in Ra‐
cine, very high wages paid to management and professional staff pull up average county wage for the en re man‐
ufacturing workforce.
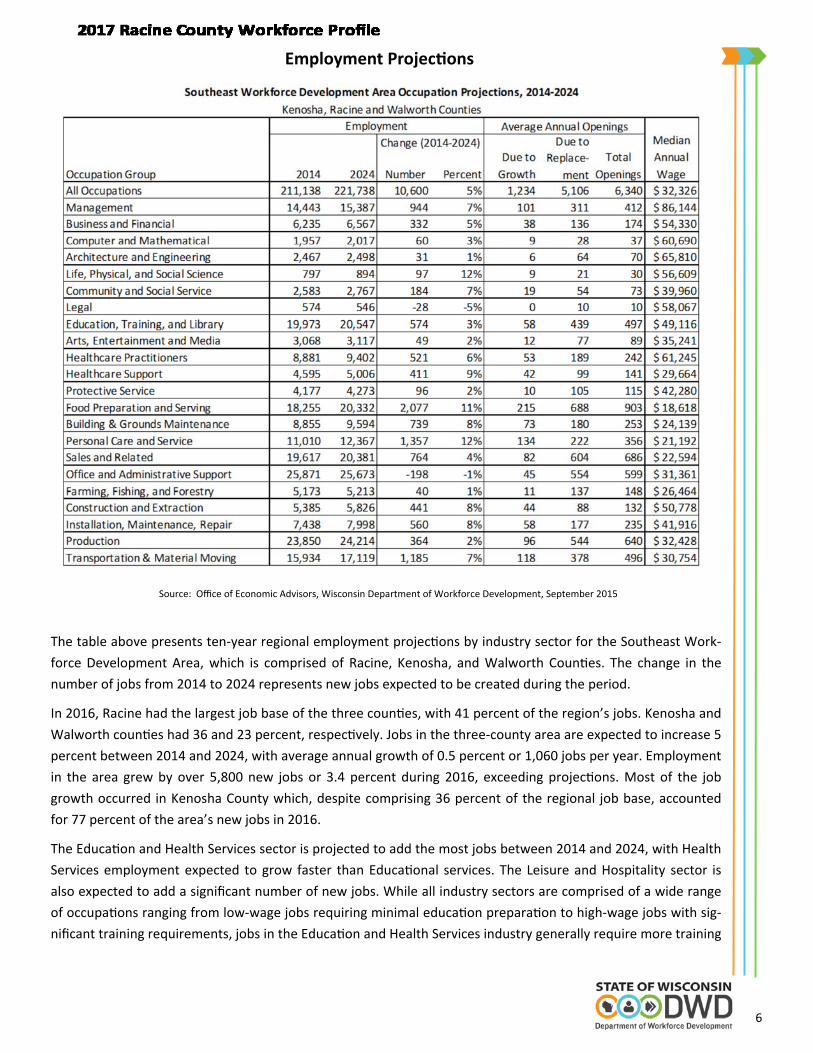
The table above presents ten‐year regional employment projec ons by industry sector for the Southeast Work‐
force Development Area, which is comprised of Racine, Kenosha, and Walworth Coun es. The change in the num‐
ber of jobs from 2014 to 2024 represents new jobs expected to be created during the period.
In 2016, Racine had the largest job base of the three coun es, with 41 percent of the region’s jobs. Kenosha and
Walworth coun es had 36 and 23 percent, respec vely. Jobs in the three‐county area are expected to increase 5
percent between 2014 and 2024, with average annual growth of 0.5 percent or 1,060 jobs per year. Employment
in the area grew by over 5,800 new jobs or 3.4 percent during 2016, exceeding projec ons. Most of the job
growth occurred in Kenosha County which, despite comprising 36 percent of the regional job base, accounted for
77 percent of the area’s new jobs in 2016.
The Educa on and Health Services sector is projected to add the most jobs between 2014 and 2024, with Health
Services employment expected to grow faster than Educa onal services. The Leisure and Hospitality sector is also
expected to add a significant number of new jobs. While all industry sectors are comprised of a wide range of oc‐
cupa ons ranging from low‐wage jobs requiring minimal educa on prepara on to high‐wage jobs with significant
training requirements, jobs in the Educa on and Health Services industry generally require more training and pay
higher wages than those in the Leisure and Hospitality sector.
6
Employment Projec ons
The table above presents ten‐year regional employment projec ons by industry sector for the Southeast Work‐
force Development Area, which is comprised of Racine, Kenosha, and Walworth Coun es. The change in the
number of jobs from 2014 to 2024 represents new jobs expected to be created during the period.
In 2016, Racine had the largest job base of the three coun es, with 41 percent of the region’s jobs. Kenosha and
Walworth coun es had 36 and 23 percent, respec vely. Jobs in the three‐county area are expected to increase 5
percent between 2014 and 2024, with average annual growth of 0.5 percent or 1,060 jobs per year. Employment
in the area grew by over 5,800 new jobs or 3.4 percent during 2016, exceeding projec ons. Most of the job
growth occurred in Kenosha County which, despite comprising 36 percent of the regional job base, accounted
for 77 percent of the area’s new jobs in 2016.
The Educa on and Health Services sector is projected to add the most jobs between 2014 and 2024, with Health
Services employment expected to grow faster than Educa onal services. The Leisure and Hospitality sector is
also expected to add a significant number of new jobs. While all industry sectors are comprised of a wide range
of occupa ons ranging from low‐wage jobs requiring minimal educa on prepara on to high‐wage jobs with sig‐
nificant training requirements, jobs in the Educa on and Health Services industry generally require more training
Source: Office of Economic Advisors, Wisconsin Department of Workforce Development, September 2015
7
and pay higher wages than those in the Leisure and Hospitality sector.
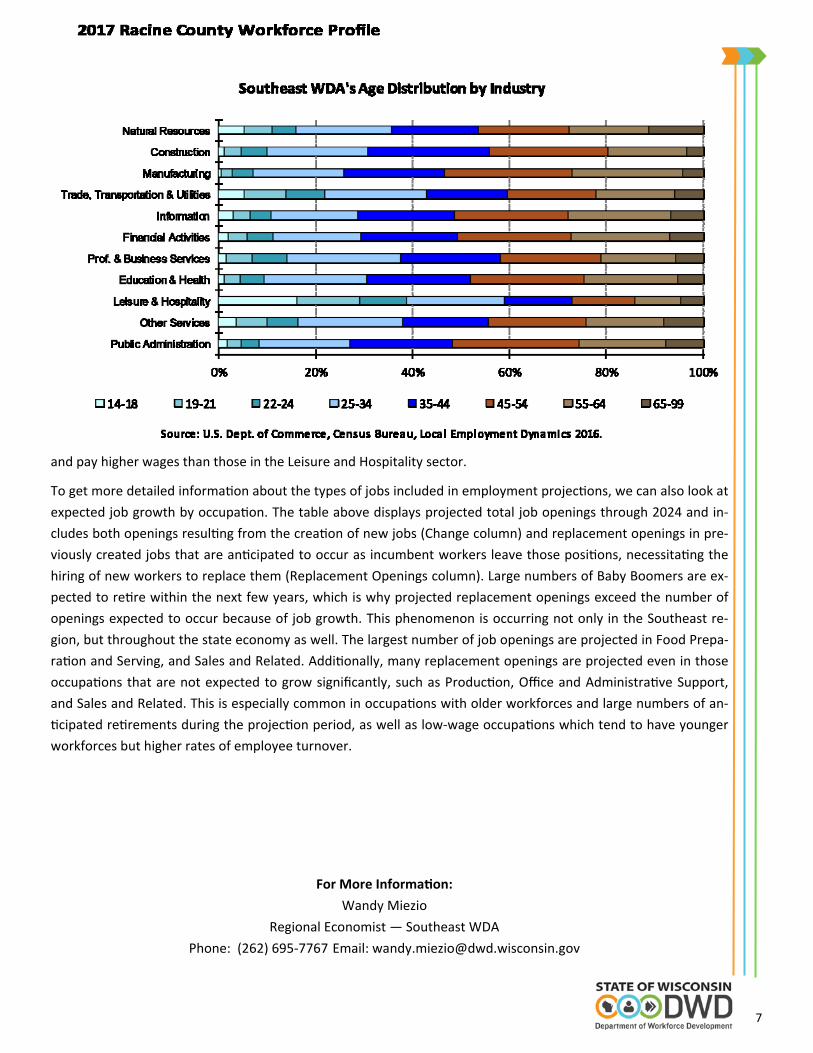
To get more detailed informa on about the types of jobs included in employment projec ons, we can also look at
expected job growth by occupa on. The table above displays projected total job openings through 2024 and in‐
cludes both openings resul ng from the crea on of new jobs (Change column) and replacement openings in pre‐
viously created jobs that are an cipated to occur as incumbent workers leave those posi ons, necessita ng the
hiring of new workers to replace them (Replacement Openings column). Large numbers of Baby Boomers are ex‐
pected to re re within the next few years, which is why projected replacement openings exceed the number of
openings expected to occur because of job growth. This phenomenon is occurring not only in the Southeast re‐
gion, but throughout the state economy as well. The largest number of job openings are projected in Food Prepa‐
ra on and Serving, and Sales and Related. Addi onally, many replacement openings are projected even in those
occupa ons that are not expected to grow significantly, such as Produc on, Office and Administra ve Support,
and Sales and Related. This is especially common in occupa ons with older workforces and large numbers of an‐
cipated re rements during the projec on period, as well as low‐wage occupa ons which tend to have younger
workforces but higher rates of employee turnover.
For More Informa on:
Wandy Miezio
Regional Economist — Southeast WDA
Phone: (262) 695‐7767 Email: [email protected]