Embed Size (px)
Citation preview

SCIEN
TIFIC A
DVA
NC
ES IN C
TBT M
ON
ITOR
ING
AN
D VER
IFICATIO
N2017
SnT2017
CTBT SCIENCE AND TECHNOLOGY SERIES
In order to build and strengthen its relationship with the broader science community in support of the Comprehensive Nuclear-Test-Ban Treaty, the Preparatory Commission for the Comprehensive Nuclear-Test-Ban Treaty Organization invites the international scientific community to conferences on a regular basis; SnT2017 was the sixth such conference since 2006.
These conferences contribute to a process whose aim is to ensure that the CTBTO’s verification regime can benefit from current scientific and technological developments in relevant fields. The Conference Goals define in more detail the scope of topics covered.
These multidisciplinary scientific conferences attract scientists and experts from the broad range of the CTBT’s verification technologies, from national agencies involved in the CTBTO’s work to independent academic and research institutions. Members of the diplomatic community, international media and civil society also take an active interest.
SnT2017 was held in Vienna’s Hofburg Palace on 26−30 June 2017, in cooperation with the Austrian Federal Ministry for Europe, Integration and Foreign Affairs. This report provides an overview of the scientific contributions presented at the Conference, and identifies some highlights and potential focus areas for the future.
WWW.CTBTO.ORG
Scientific Advances in CTBT Monitoring and Verification2017
REVIEW OF PRESENTATIONS AND OUTCOMES OF THE COMPREHENSIVE NUCLEAR-TEST-BAN TREATY:SCIENCE AND TECHNOLOGY 2017CONFERENCE

THE PREPARATORY COMMISSION AND THE CTBTO
The Preparatory Commission for the Comprehensive Nuclear-Test-Ban Organization was set up by Resolu-tion CTBT/MSS/RES/1, adopted by the States Signatories on 19 November 1996. It was established to prepare for the Treaty’s entry into force, and to build up the functionality specified under the Treaty, including the International Moni-toring System (IMS) and the Internation-al Data Centre (IDC). Its Secretariat is referred to as the Provisional Technical Secretariat (PTS).
After entry into force, the Preparatory Commission will be replaced by the Comprehensive Nuclear-Test-Ban Trea-ty Organization (CTBTO) as specified in the Treaty, and the PTS will be replaced by the Technical Secretariat (TS). For simplicity, the term ‘CTBTO’ is generally used in this report for both the current and future organizations, except where distinction between the various organs is important to the context.
DISCLAIMER
The views expressed are those of the authors and do not reflect the positions and policies of the CTBTO Preparatory Commission.
REPORT CONCEPT Lassina Zerbo
WRITTEN AND COORDINATED BYRobert G. Pearce
LAYOUT Aida Rodriguez
PHOTOGRAPHS AND ILLUSTRATIONS are at the courtesy of the authors and the Pro-visional Technical Secretariat. Authors are grate-fully acknowledged for providing high-resolution images from their SnT2017 oral presentations and posters. Additional photographs by Anna Rauchenberger.
ISSUED BY the Provisional Technical Secretariat of the Preparatory Commission for the Comprehensive Nuclear-Test-Ban Treaty Organization (CTBTO)
Vienna International Centre P.O. Box 1200, 1400 Vienna, Austria [email protected] www.ctbto.org
©2017 CTBTO Preparatory Commission

Scientific Advances in CTBT Monitoring and Verification 2017
REVIEW OF PRESENTATIONS AND OUTCOMES OF THE COMPREHENSIVE NUCLEAR-TEST-BAN TREATY:SCIENCE AND TECHNOLOGY 2017CONFERENCE
26-30 June 2017, Hofburg Palace, Vienna


CONTENTS iii
Contents
List of Figures Vii
Abbreviations Viii
Opening Remarks from the Executive Secretary of the CTBTO Preparatory Commission 1
Welcome from the Host Country 3
1 Introduction 5
1.1 PURPOSE OF THIS REPORT 5
1.2 SnT AS A CONTINUOUS PROCESS 5
1.3 CONFERENCE GOALS AND THEMES 5
1.3.1 Conference Goals 51.3.2 Conference Scientific Themes and Topics 6
1.4 RELATED MATERIAL 6
1.5 REPORT STRUCTURE 7
2 Keynotes 9
2.1 HRH PRINCESS SUMAYA BINT EL HASSAN, PRESIDENT OF THE ROYAL SCIENTIFIC SOCIETY OF JORDAN 9
2.2 MARIA CÂNDIDA PEREIRA TEIXEIRA, MINISTER OF SCIENCE AND TECHNOLOGY, ANGOLA 11
2.3 PASCALE ULTRÉ-GUÉRARD, NATIONAL CENTRE FOR SPACE STUDIES, FRANCE 13
2.4 DES BROWNE, LORD BROWNE OF LADYTON, VICE CHAIRMAN, NUCLEAR THREAT INITIATIVE, AND FORMER UK SECRETARY OF DEFENCE 17
3 Data Acquisition 22
3.1 SENSORS AND MEASUREMENTS 23
3.1.1 Seismic 23
3.1.2 Hydroacoustic 23
3.1.3 Infrasound 24
3.1.4 Seismic, Hydroacoustic and Infrasound as a Group 26
3.1.5 Radionuclide 26
3.1.6 Satellite Based and Other 28
3.2 MONITORING FACILITIES 30
3.2.1 IMS Stations and Laboratories 30
3.2.2 Non-IMS Stations and Networks 32
3.3 STRATEGIES FOR ON-SITE INSPECTION 32
3.3.1 General 32
3.3.2 Seismic 33
3.3.3 Radionuclide 34
3.3.4 Remote Imagery 36
3.3.5 Drilling 36
4 Data Transmission, Storage and Format 37
4.1 DATA TRANSMISSION 38
4.2 DATA FORMATS 38

SCIENTIFIC ADVANCES IN CTBT MONITORING AND VERIFICATION 2017iV
5 Data Processing and Synthesis 39
5.1 CREATING SEISMOACOUSTIC EVENT LISTS 40
5.1.1 Introduction 40
5.1.2 Events from Seismic Data 40
5.1.3 Events from Hydroacoustic Data 44
5.1.4 Events from Infrasound Data 44
5.1.5 Fusing of Waveform Observations 46
5.2 RADIONUCLIDE DATA PROCESSING AND ANALYSIS 46
5.3 FUSING WAVEFORM WITH RADIONUCLIDE AND OTHER OBSERVATIONS 46
6 Earth Characterization 49
6.1 SOLID EARTH 50
6.1.1 Seismic Wave Speed 50
6.1.2 Anelastic Attenuation 51
6.1.3 Tectonic Stress 51
6.1.4 Seismicity and Seismic Hazard, Including Tsunami Hazard 51
6.1.5 Subsurface Fluid Transport and Radionuclides 52
6.2 OCEANS 54
6.3 ATMOSPHERE 54
6.3.1 Acoustic Wave Speed 54
6.3.2 Acoustic Attenuation 54
6.3.3 Atmospheric Transport 54
7 Interpretation 57
7.1 GEOPHYSICAL SIGNATURES 58
7.1.1 Explosion 58
7.1.2 Earthquake 60
7.1.3 Volcano 61
7.1.4 Other sources 61
7.2 RADIONUCLIDE SIGNATURES 61
7.2.1 Nuclear Explosion 61
7.2.2 Nuclear Reactor 61
7.2.3 Medical and Industrial Isotope Production Plant 62
7.3 IDENTIFICATION OF NUCLEAR EXPLOSIONS 63
7.3.1 Identification of Explosions Using Waveform Data 63
7.3.2 Identification of Nuclear Explosions Using Radionuclide Data 64
7.3.3 Event Screening for IDC Products 64
7.3.4 Novel Methods for Source Identification 65

CONTENTS V
8 Capability, Performance and Sustainment 67
8.1 BACKGROUND SIGNALS AND NOISE 68
8.1.1 Seismoacoustic 68
8.1.2 Radionuclide 68
8.2 NETWORK CAPABILITY 70
8.2.1 Seismoacoustic Event Location Thresholds 70
8.2.2 Radionuclide Network Capability 70
8.3 PERFORMANCE, QUALITY AND VALIDATION 71
8.4 SUSTAINMENT 73
9 Sharing Data and Knowledge 75
9.1 BUILDING GLOBAL CAPACITY 76
9.2 COLLABORATION IN TRAINING INITIATIVES 77
9.3 NATIONAL EXPERIENCES 77
9.4 DATA AND INFORMATION PLATFORMS 78
10 Policy and Advocacy 81
10.1 SCIENCE IN SUPPORT OF POLICYMAKING 82
10.2 ADVOCACY AND OUTREACH 82
10.3 CTBTO IN A BROADER CONTEXT 83
11 Closing 85
11.1 JOACHIM SCHULZE, CHAIRPERSON OF WORKING GROUP B, CTBTO PREPARATORY COMMISSION: HIGHLIGHTS 85
11.2 OMAR AL-RAWI, MEMBER OF THE VIENNA CITY COUNCIL AND THE VIENNA PROVINCIAL PARLIAMENT 86
11.3 WOLFGANG HOFFMANN, EXECUTIVE SECRETARY EMERITUS, CTBTO PREPARATORY COMMISSION 88
11.4 TIBOR TÓTH, EXECUTIVE SECRETARY EMERITUS, CTBTO PREPARATORY COMMISSION 89
11.5 LASSINA ZERBO, EXECUTIVE SECRETARY, CTBTO PREPARATORY COMMISSION 90
12 RELEVANCE TO CTBTO ACTIVITIES AND VERIFICATION SCIENCE 93
12.1 DISTRIBUTION OF PRESENTATIONS AMONG SUBJECT HEADINGS 93
12.2 CATEGORIZATION SCHEME 93
12.3 DATA ACQUISITION 97
12.4 DATA TRANSMISSION, STORAGE AND FORMAT 100
12.5 DATA PROCESSING AND SYNTHESIS 100
12.6 EARTH CHARACTERIZATION 101
12.7 INTERPRETATION 103
12.8 CAPABILITY, PERFORMANCE AND SUSTAINMENT 105
12.9 SHARING DATA AND KNOWLEDGE 107
12.10 POLICY AND ADVOCACY 108

SCIENTIFIC ADVANCES IN CTBT MONITORING AND VERIFICATION 2017Vi
Appendix 1: Oral and Poster Presentations 109
Appendix 2: Panel Discussions 137
Appendix 3: Exhibition of Activities, Achievements and Needs 139
Index of Contributing Authors and Panel Discussion Participants 141
Index of Cited Contributions 145
Notes 149

ViiFIGURES
FIGURES
2.1 Monthly average sea level anomaly (in cm) for November each year since 1993 for the Equatorial Pacific, from the El Niño Bulletin ................................................................................................................................................................................... 13
2.2 United Nations Sustainable Development Goals ............................................................................................................................... 132.3 Essential climate variables. Satellite observations have made a major contribution to the study of those in bold ........................ 142.4 Carbon dioxide and methane observations from space .................................................................................................................... 142.5 Contribution of SWOT to monitoring the level of oceans and inland waters ..................................................................................... 152.6 Hydrology: a new application of altimetry satellites .......................................................................................................................... 152.7 Image of Fiji from Sentinel 2 satellite ................................................................................................................................................ 163.1 3C optical seismometer using Moiré fringes ..................................................................................................................................... 233.2 Deployment of the final hydrophone node of the north HA04 triplet ................................................................................................. 243.3 Comparison between the classical magnet-and-coil transducer design of microbarometer with an optical microbarometer
using an interferometer ..................................................................................................................................................................... 253.4 Infrasound isolation chamber for improved infrasound calibration.................................................................................................. 263.5 New generation SPALAX .................................................................................................................................................................... 273.6 SiPIN diode detector for the ARIX noble gas measurement system ................................................................................................. 273.7 Fine increment soil collector for subsurface radionuclide sampling ............................................................................................... 283.8 Topographic map showing the area of subsidence after the 6 January 2016 DPRK event determined using radar
interferometry .................................................................................................................................................................................... 293.9 Concept of a SMART cable, in which sensor packages are attached to a submarine communications cable for environmental
monitoring in oceanic regions ............................................................................................................................................................ 293.10 Status of the IMS infrasound network in June 2017 .......................................................................................................................... 303.11 IMS radionuclide stations installed in Argentina. RN01 (ARP01) Buenos Aires, and RN03 (ARP03) Bariloche ............................... 313.12 Field-portable argon-37 equipment – gas processing stages ........................................................................................................... 343.13 Sampling component of the SLARS mobile sampling and measuring system for subsurface argon .............................................. 353.14 The Mobile Russian Installation for Noble Gas Analysis ................................................................................................................... 355.1 Software development steps used in IDC re-engineering Phase 2 and future Phase 3 ................................................................... 405.2 Scheme to allow analysts to select those events automatically built by NET-VISA, in addition to those offered by the current
automatic Standard Event List SEL3 .................................................................................................................................................. 415.3 Aftershocks of the Wenchuan (China) earthquake of 12 May 2008 detected and located using cross-correlation methods on data
from a composite regional seismic network ...................................................................................................................................... 425.4 Schematic flow chart of seismic data processing at the USGS National Earthquake Information Center ...................................... 435.5 Maps of all infrasound only events in the REB in the European region between 2010 and 2015 ..................................................... 455.6 Improvements in the automatic processing of radionuclide particulate data implemented between 2015 and 2017,
expressed with reference to analyst reviewed products .................................................................................................................... 476.1 Mechanisms for subsurface gas fluxes following an underground nuclear explosion ..................................................................... 536.2 An elevated concentration of xenon-133 was observed at the IMS noble gas station JPX38, Takasaki, Japan ............................... 567.1 Moment tensors with uncertainties for earthquakes, volcanic events and nuclear explosions estimated from the
comparison of synthetic and observed seismograms ....................................................................................................................... 587.2 Seismic source discrimination using amplitude ratios of Pg and Lg ................................................................................................ 597.3 Xenon isotopic ratios used to discriminate between weapons-related and other sources .............................................................. 627.4 Moment tensor inversions of seismograms recorded at eight regional stations from four announced DPRK nuclear tests ......... 637.5 Flow chart of ionospheric wave monitoring system using GPS data ................................................................................................ 658.1 Some anthropogenic radioactive xenon sources in the European region ......................................................................................... 688.2 Stack monitors for measuring radioactive xenon releases from isotope production facilities ........................................................ 698.3 New research reactor for medical isotope production in Argentina ................................................................................................. 698.4 Growth of the archive of the IRIS Data Management Center ............................................................................................................. 718.5 Airborne AISA Eagle hyperspectral optical sensor ............................................................................................................................ 729.1 Outreach efforts between 2012 and 2016 to improve the RSTT model using local and regional seismic data in different
parts of the world ............................................................................................................................................................................... 769.2 A schematic showing the elements of physics-based monitoring technologies used by Maceira et al ........................................... 769.3 The European Infrasound Bulletin ..................................................................................................................................................... 79

SCIENTIFIC ADVANCES IN CTBT MONITORING AND VERIFICATION 2017Viii
ABBREVIATIONS
3D three dimensionalAFTAC Air Force Technical Applications CenterALMERA Analytical Laboratories for the Measurement of
Environmental RadioactivityARIX Analyser of Radioxenon IsotopesATM atmospheric transport modellingCLYC caesium, lithium, yttrium and chlorineCOP Conference of the Parties (to the United Nations
Framework Convention on Climate Change)CTBT Comprehensive Nuclear-Test-Ban TreatyCTBTO Comprehensive Nuclear-Test-Ban Treaty OrganizationDInSAR Differential Interferometry Synthetic Aperture RadarDONET Dense Ocean-floor Network System for Earthquakes
and TsunamisDPRK Democratic People’s Republic of KoreaEMP electromagnetic pulseEU European UnionFLEXPART Flexible Particle Dispersion ModelGCI Global Communications InfrastructureGIS geographic information systemGNSS global navigation satellite systemGPS Global Positioning SystemHEU highly enriched uraniumHPGe high purity germaniumHYSPLIT Hybrid Single Particle Lagrangian Integrated TrajectoryIAEA International Atomic Energy AgencyIDC International Data CentreIFE14 Integrated Field Exercise 2014IMS International Monitoring SystemICAO International Civil Aviation OrganizationINVAP Investigaciones Aplicadas Sociedad del EstadoIRIS Incorporated Research Institutions for SeismologyISC International Seismological CentreISS09 CTBT International Scientific Studies Conference 2009JAMSTEC Japan Agency for Marine-Earth Science and TechnologyLADAS Lagrangian Atmospheric Dose Assessment SystemLEU low-enriched uraniumMDC minimum detectable concentrationMOOC massive open online courseNDC National Data CentreNET-VISA Network Vertically Integrated Seismic AnalysisNNSS Nevada National Security Site
NPE NDC Preparedness ExerciseNPT Nuclear Non-Proliferation TreatyOVSICORI Observatorio Vulcanológico y Sismológico de Costa RicaOPCW Organisation for the Prohibition of Chemical WeaponsOSI On-Site InspectionOSIRIS OSI radioisotopic spectroscopyPTE proficiency test exercisePTS Provisional Technical SecretariatPNNL Pacific Northwest National LaboratoryRASA Radionuclide Aerosol Sampler/AnalyzerREB Reviewed Event BulletinRSS Royal Scientific Society of JordanRSTT regional seismic travel timeSALSA3D Sandia and Los Alamos 3D seismic tomography modelSAMS Seismic Aftershock Monitoring SystemSAUNA Swedish Automatic System for Noble Gas AcquisitionSCoTSS Silicon Photomultiplier-Based Compton Telescope for
Safety and SecuritySESAME Synchrotron-light for Experimental Science and Appli-
cations in the Middle EastSIG-VISA Signal Vertically Integrated Seismic AnalysisSIMPAX Simulated Impact of XenonSiPIN silicon positive intrinsic negativeSLARS Subsoil Liquefied Argon ScintillationsSMART Science Monitoring and Reliable CommunicationsSnT CTBT: Science and TechnologySnT2011 CTBT: Science and Technology 2011 conferenceSnT2013 CTBT: Science and Technology 2013 conferenceSnT2015 CTBT: Science and Technology 2015 conferenceSPALAX Système de prélèvement d’air automatique en ligne
avec l’analyse des radio-xénonsSPE source physics experimentsSTAX Source Term Analysis of XenonSWOT surface water and ocean topographyUAV unmanned aerial vehicleUSGS United States Geological SurveyvDEC Virtual Data Exploitation CentreWGB Working Group BWOSMIP Workshops on Signatures of Medical and Industrial
Isotope ProductionWRF weather research and forecasting


Opening Remarks from the Executive Secretary of the CTBTO Preparatory Commission
Lassina Zerbo
Executive Secretary Preparatory Commission for the Comprehensive Nuclear-Test-Ban Treaty Organization
Your Royal Highness Princess Sumaya, Minister Pereira Teixeira, Minister Dissa, Undersecretary Cancela, Deputy Minister Santana Núñez, Secretary-General Linhart, Director-General Al-Herbish, excellencies, distinguished scientists, ladies and gentlemen,
Thank you to the Project Executives, Nurcan andRandy,foryourintroduction.AndthanksindeedforallyouhavedonetoensureasuccessfulCTBT:ScienceandTechnology2017conference.
Thisisthefirstyearwehavetwo‘conferenceleaders’insteadofone:awomanandaman.Infact,womenandmenfeatureprominentlyasspeakersthismorningandthroughouttheweek.
This is no accident. When she spoke at the lastSnTconference,SouthAfricanScienceandTechnologyMinisterNalediPandorcalledformoreefforttoempowerand encourage women. So we have tried our best toavoidso-called‘manels’onthisoccasion.
Lookingaroundtheroom,Iamhappytoseefamiliarfaces from all the way back to our first conference in2006.ButIamalsoveryexcitedtoseesomanynewones,includinganumberofyoungscientistsandmembersoftheCTBTOYouthGroup.
Itfillsmewithinspirationtoseeseniorpolicymakersandexpertscomingtogetherwiththe‘newkidsontheblock’,theyouth.
TheCTBT:ScienceandTechnologyconferenceshavealwaysbeenunique.Whereelsewouldyoufindsomanyscientists and experts coming together to collaborateon nuclear test monitoring science and technology?However,thisyearIamparticularlyenthusiasticaboutthe‘youthstrand’thathasbeenintegratedthroughouttheprogramme.
TheCTBTOYouthGroupwaslaunchedlastyearwithonlyninemembers.Todaywehavearound200.About70ofthemareattendingthisconference–andtheyarealreadyshakingthingsupwiththeiractiveparticipation!
This year we also have a number of sessions thatbringtogetherthediplomacysideoftheCTBTwiththescientificside.Ihavealwayssaidthatbothofthesearecloselylinked.
Increasing the recognition of the CTBT in bothscienceanddiplomacyisapassionforme.AndI’msurethisissomethingeveryoneherecanunderstand.
Of course, at its heart the SnT conference seriesremainsaforumforexchangingknowledgeandsharinginformation on nuclear test monitoring science andtechnology. It is also about enlarging the scientificcommunity engaged in test-ban monitoring, includingamongyoungscientists.
OPENING REMARKS FROM THE EXECUTIVE SECRETARY OF THE CTBTO PREPARATORY COMMISSION 1

Around 1000 participants from over 120 countrieshaveregisteredtotakepartthisyear.Wereceivedmorethan650abstracts,nearly400posters,andover100oralpresentations.
Byanymeasure,theCTBT’ssciencebasedverificationregime is an enormous success. The performance ofthe International Monitoring System already exceedsall expectations at 92% completion. Proof of itseffectiveness came with each of the five nuclear testsconductedbytheDemocraticPeople’sRepublicofKorea(DPRK),includingthetwotestsconductedlastyear.
In each case we detected and transmitted reliableand verifiable data to States in near real time, andprovidedbriefingswithinhoursoftheevents.Tomorrowmorning therewillbeapaneldiscussionon theDPRKtestsfeaturingfivewellknownscientistsactiveinCTBTmonitoringtechnologies.
MemberStatesalsogainfromthecivilandscientificapplicationsofIMSdata.Wehavetheonlyinternationalsystemofmonitoringstationsspanningtheentireglobe.Our sensors are constantly scanning the earth andcollectingdata that canbeused in scientific studies toadvanceourunderstandingoftheearthanditsprocesses.
TheSnTisauniqueopportunitytoconsiderhowtomake the verification regime even more successful infuture. I look forward to hearing about this and othertopicsfromthededicatedscientistsinthisroomoverthecourseoftheweek.
Excellencies,ladiesandgentlemen,
LastmonthIaddressedthePreparatoryCommitteefortheNuclearNon-ProliferationTreaty(NPT)ReviewConference, emphasizing that the status quo is notsecureenough inanunstablegeopolitical climate.Thiswas a key point on which NPT States Parties were inagreement.
However, I also made clear that simply voicingagreement isnotenough.TobringtheCTBT intoforcewemustinsistonactionoverwords.
So it is encouraging that scientists from all of theremainingAnnex2States,withonenotableexception,areparticipatinginthisconferenceandworkingtogethertorefinetheCTBTverificationregime.Iearnestlyhope
that through scientific advancement and collaborationwecaninspirediplomaticaction.
Wemustfocusonadvancingourcommonobjectivesinscienceandtechnologytoincreasetrustandmutualunderstanding. Scientific collaboration is essential toachievingaworldfreefromthenuclearthreat.Itisalsovital for making progress on other global challenges,such as disaster risk reduction and mitigation, climatechange,andsustainabledevelopment.
This is the message that I want you to take awayfromthisconference:collaborativescienceforpeaceanddevelopment.
Iwishtohighlightinparticularourkeynotespeakerswho are helping deliver that message this morning:HerRoyalHighnessPrincessSumayaofJordan,PresidentoftheRoyalScientificSocietyofJordan;MariaCândidaPereira Teixeira, Minister for Science and Technology,Angola;andPascaleUltréGuérard,NationalCentreforSpaceStudies,France.
I also look forward to our distinguished panel thismorning on opportunities and challenges facing theCTBT, as well as to the address on Friday morning byJoséFidelSantanaNúñez,DeputyMinisterofScience,TechnologyandEnvironment,Cuba.
Finally, I would like to draw your attention to theclosing session on Friday afternoon. Lord Des Brownewill deliver a closing keynote address, and formerExecutive Secretaries Wolfgang Hoffmann and TiborTóth will reflect on the twentieth anniversary of theestablishment of the Preparatory Commission for theCTBTO.
Thediscussionsoverthenextfewdayswillfocusonnuclear test monitoring technologies and their variousapplications. But we are all part of something muchbigger.
Theprogress thatwemakeon the implementationoftheCTBT,onboththescientificanddiplomaticfronts,willcontributetoglobaleffortstomaketheworldmoresafe,secureandprosperous.
Thankyou.
2 SCIENTIFIC ADVANCES IN CTBT MONITORING AND VERIFICATION 2017

Welcome from the Host Country
Michael Linhart
Secretary General for Foreign Affairs of the Federal Ministry for Europe, Integration and Foreign Affairs
Good morning.
Dear Executive Secretary; dear Ambassador. Thank you first for this very impressive and dynamic introduction and opening of today’s conference. It was quite different to show Vienna as a town of music in a different way – young, dynamic. You woke us up I think!
Your Royal Highness, ministers, excellencies, distinguished delegates, ladies and gentlemen.
LetmefirstwelcomeyoutoVienna,toourbeautifulcapital of Austria, and I am pleased to welcome youhere on the occasion of this conference. For many ofyouVienna,asthehostcityofCTBTO,mightbeaplaceof regular meeting – a regular destination. Others aremaybehereforthefirsttime,soIwishyouaverygoodweekhere–asuccessful,fruitfulconference,butIhopethatyouwillbeabletoenjoyabitofVienna.
As the title of the conference suggests, the focusof our deliberations will be scientific and technicalopportunities to further enhance monitoring andverification in the framework of the ComprehensiveNuclear-Test-Ban Treaty. I am sure that this gatheringof the first class experts from all over the world willproduceinterestingnewideas,andwillopenprospectsforfurtheradvances.
The high political relevance of this endeavour hasrecentlybeenhighlightedbythenucleartestsconductedbytheDemocraticPeople’sRepublicofKorea.Thesetestsareutterlyunacceptableanddrewstrong internationalcondemnation, including from our Foreign Minister,SebastianKurz.
In connection with the tests, the CTBTO hasimpressively proven its ability to provide fast, reliableandcomprehensivedata.Nevertheless,thefactthatonenation continues to conduct nuclear test explosions inthe21stcenturyisastarkreminderthatorganizations’monitoring and verification capabilities need to bemaintained at the level of the most advanced level ofscientificandtechnologicalcapacityavailable.
Ladiesandgentlemen, lastyearwecommemorated20years since theCTBTOwasopened for signature in1996.Overthelast20yearstheTreatyanditssecretariathavebeenmakingtremendouscontributionstonuclearnon-proliferation and disarmament, and therefore tointernationalpeaceandsecuritymorebroadly.
However,whatisstilllackingistheentryintoforceoftheCTBT.Themoratoriacannotsubstitutefortheentry
WELCOME FROM THE HOST COUNTRY 3

into forceof theCTBT.TheTreaty canonly liveup toitsfullpotential,includingthepossibilitytoconducton-siteinspections,ifitislegallybinding.Letmethereforecall again on all remainingAnnex 2 States to take thenecessary steps for ratification as soon as possible.ConsequentlyallAnnex2Statescan,andshould,showleadership on this important treaty without attachingconditions to their own ratification. We commend thegreateffortsundertakenbytheExecutiveSecretary inthis regard,andareconvincedthathewillcontinuetodoso.
Ladies and gentlemen, the lack of progress ofthe CTBT’s entry into force is also a reflection of theunfavourableinternationalenvironmentforprogressinnucleardisarmamentinrecentyears.Nevertheless–ormaybeexactlybecauseofthisstateofaffairs–theyear2017hasseensomenewmomentum.WhileIamspeaking,Member States of the United Nations are negotiatingin New York a legally binding instrument for theprohibitionofnuclearweapons.Withthesenegotiationsthedeadlockinmultilateralnucleardisarmament,whichhaspersistedever since the conclusionof theCTBT in1996, has finally been broken. Currently there is stilldebate,attimesacontroversialone,overthemeritsof
theprohibitiontreatyinitiative.However,inthecomingmonthsandyears,itshouldbecomeincreasinglyvisiblethatthenewtreatywillnotweakentheexistingnuclearnon-proliferationanddisarmamentarchitecture,but infact strengthen it.There is reasonable hope that someofthepositivemomentumcreatedbythisinitiativewilleventuallyspillovertootherdisarmamentissues,and–whynot–settingtheCTBTonafirmcoursetowardsitsentryintoforce.
Ladies and gentlemen, this is the political contextofyourwork.Yournewfindings anddeliberations areindispensable to keep the CTBT at the cutting edgeof monitoring and verification technologies. Soundscientific analysis and working technological solutionsare the indispensablebasis for theachievementof theCTBT’spoliticalgoals.
In concluding, ladies and gentlemen, I wish youfruitful deliberations throughout the course of thisweek,andIreallyhopethatyouwillfindalsosometimetoenjoyVienna.
Thankyouverymuch.
4 SCIENTIFIC ADVANCES IN CTBT MONITORING AND VERIFICATION 2017
1 Introduction
1.1 PURPOSEOFTHISREPORT
This report contributes to the written archive of progress made in Comprehensive Nuclear-Test-Ban Treaty (CTBT) verification science and related activities under the SnT process. As such, its intended audience comprises the Preparatory Commission, as well as all those active in the field, or who may be contemplating relevant research and development. The report is also of interest to policy makers and others who are not scientific specialists. To this end reference is made in SECTION1.4 to overviews of specific topics that were included in the published version of past SnT conference reports in the form of ‘focus boxes’. It is also hoped that this report will help to facilitate the assessment of progress in implementing ideas presented, and to foster new work among the concerned community of scientists.
This published version of this report will be added to the SnT section of the CTBTO website, where the abstracts, programme, oral and poster presentations, video record and other material related to this and all previous SnT conferences can be found, together with the conference reports. As the SnT process evolves, the online record is moving towards an integrated repository of past SnT conferences. This will be especially useful for tracking the progress of relevant research initiatives and projects.
1.2 SnTASACONTINUOUSPROCESS
The SnT conferences are part of a continuous process of engaging the global scientific community. Presentations on specific scientific developments from SnT, delivered to the CTBTO’s verification working group (Working Group B (WGB)) is one facet of this process. WGB experts’ groups on verification-related topics, the progressive enhancement of CTBTO’s technical capabilities within its verification mandate, and CTBTO’s programme of
workshops and training all interact with the SnT process in various ways.
The SnT process takes into account the Treaty’s recognition of the need to progressively enhance the efficiency and cost-effectiveness of its verification regime1. It also takes into account the Treaty’s recognition that it may be appropriate to have a formal mechanism after its entry into force, to solicit external scientific advice on the enhancement of the verification regime’s technical capabilities2.
Many of the same scientific instruments, methods and ideas feature in contributions of successive SnT conferences, often in presentations by the same authors or from the same research institutes. Where appropriate, the ideas may make their way through development and testing, with a view to incorporation into Provisional Operations at CTBTO. In other cases, taking note of Treaty provisions, the ideas may be more appropriate for development by States Signatories in support of their own verification efforts. With a focus on the specific needs of the CTBT verification regime, specific contributions are identified accordingly in SECTION12.
1.3 CONFERENCEGOALSANDTHEMES
1.3.1 CONFERENCEGOALS
SnT2017 had the following four goals:
• Enlarge the scientific community engaged in test-ban monitoring, including among young scientists
• Promote the wider scientific application of data that are used for test-ban verification
• Enhance the exchange of knowledge and ideas between the CTBTO and the broader scientific community
• Present to the scientific community the needs of nuclear test monitoring and verification.
These goals expand upon the three goals of SnT2015 in two ways: the first goal places specific emphasis on the incorporation of young scientists into the test-ban monitoring community, and the additional fourth goal highlights the need to present to the wider community the scientific and technological needs of nuclear test monitoring and verification.
INTRODUCTION 5

1.3.2 CONFERENCESCIENTIFICTHEMES ANDTOPICS
Under each of five scientific themes, several topics were identified as shown below. Authors were required to submit each of their abstracts under one of these topics, and under each topic both oral and poster presentations were invited.
THEME1. THEEARTHASACOMPLEXSYSTEM T1.1 Infrasound and Atmospheric Dynamics T1.2 Solid Earth Structure T1.3 Atmospheric and Subsurface Radionuclide Dispersion and Depletion T1.4 Hydroacoustics and Physical Properties of the Oceans T1.5 Civil, Scientific and Industrial Applications of IMS data and IDC Products
THEME2. EVENTSANDNUCLEARTESTSITES T2.1 Treaty-Relevant Events T2.2 Characterization of Events Through On
Site Inspection T2.3 Seismoacoustic Sources in Theory and
Practice T2.4 Atmospheric Background of Radioxenon T2.5 Historical Data from Nuclear Test
Monitoring
THEME3. ADVANCESINSENSORS,NETWORKSAND PROCESSING T3.1 Design of Sensor Systems and Advanced Sensor Technologies T3.2 Laboratories Including Mobile and Field Based Facilities T3.3 Remote Sensing, Satellite Imagery and Data Acquisition Platforms T3.4 Geophysical Methods for On-Site Inspection T3.5 Data Processing and Interpretation T3.6 Fusion of Data from Different Monitoring Technologies T3.7 Algorithms
THEME4.PERFORMANCEOPTIMIZATIONANDSYSTEMS ENGINEERING T4.1 Systems Engineering for Globally Distributed Networks T4.2 Operations Research and Systems Analysis T4.3 Logistics and Lifecycle Management
T4.4 Quality Management and Business Process Optimization in an Operational Environment T4.5 Network Optimization and Error Analysis
THEME5.MONITORINGFORNUCLEAREXPLOSIONSINA GLOBALCONTEXT T5.1 Science in Support of Global Policy Decisions T5.2 Science in Support of International Treaties and Sustainable Development Goals T5.3 Comparative Roles of Global Verification and On-Site Verification T5.4 Capacity Building, Education and Public Awareness
The themes and topics were designed to encompass all fields of work relevant to nuclear test monitoring and verification, separated in a logical way. To this end some modifications and additions were made to the list used for SnT2015, for example to introduce systems engineering and network optimization as explicit titles, and to include the interface between science and policy in a new fifth theme.
The range of abstracts submitted inevitably saw more emphasis on some topics than others. Following the process adopted for SnT2015, topics that received few abstracts were discontinued, with any submitted abstracts reassigned to cognate topics; this promoted a balanced conference programme. Specifically, abstracts from topics T5.2 and T5.3 were reassigned and these topics removed from the programme, and all topics under theme 4 were combined under a single topic T4.1 entitled “Performance Optimization and Systems Engineering”.
1.4 RELATEDMATERIAL
All the materials mentioned below are available on the CTBTO’s public website at www.ctbto.org.
The SnT2017 Conference Programme and Book of Abstracts are complementary to this report and can be referenced for additional material. For example, the Book of Abstracts includes an index of all contributing authors (not only the first). Also listed there is membership of the Scientific Programme Committee, slides of oral presentations and images of poster presentations, as well as a video record of all the sessions. This complementary
6 SCIENTIFIC ADVANCES IN CTBT MONITORING AND VERIFICATION 2017
information is also available for the five previous conferences in the series. Also included are reports of previous conferences in the SnT series 3,4,5,6,7.
Non-specialists are considered an important sector of the readership. ‘Focus boxes’ in the published versions of past reports provide background summaries, explanations and graphical material on specific verification-related subjects covered in the scientific contributions. TABLE1.1 gives a list of these for ease of reference.
1.5 REPORTSTRUCTURE
The structure of this report follows closely that of the SnT2015 report7. Although the scientific part of the conference programme was, by convention, divided according to the conference Themes, and Topics within those Themes as listed in SECTION1.3.2, the account of scientific contributions in these reports (SECTIONS3 to 10 in this report) is organized by data flow, from data acquisition through data transmission, data processing and analysis, to interpretation; additional sections cover properties of the earth that are necessary to support the verification science, as well as performance monitoring, capacity building and training. This report also has a section on policy and advocacy to reflect the introduction of these aspects into the programme.
Each of these sections includes relevant material on global monitoring using the IMS, as well as local scale activities for on-site inspection (OSI), and non-CTBTO or novel methodologies as appropriate. These sections are followed by a report on the closing session (SECTION
11) and a section on conference highlights and potential focus areas for the future (SECTION 12). The opening speeches and keynote addresses from both the opening and closing sessions are reproduced at the front of the report (SECTION2) to provide a context.
SECTIONS3 to 10 each begin with an introduction that defines the scope of that section, and explains the demarcation of topics among related sections. In this way it is intended that all topics covered under the SnT umbrella are represented in one, and only one, of these sections. Only a few minor adjustments have been made to this structure compared with that of the 2015 report7. Many contributions contain material relevant to more than one section, so many contributions are cited multiple times. SECTIONS3to10 cite all oral presentations that were presented, plus all poster presentations for which an electronic file was submitted on the registration platform.
APPENDIX 1 contains a list of all oral and poster presentations that were presented. APPENDIX2 lists the Panel Discussions and APPENDIX3 lists a selection of the posters in the Exhibition of Activities, Achievements and Needs.
An index of first authors including panel discussion participants and an index of abstract identifiers are provided to facilitate cross-referencing.
SECTIONS3 to 10 and their subsections vary greatly in length. This reflects the spread of topics covered by submitted abstracts and may itself suggest areas where effort should be focused towards the encouragement of more active interest in the external scientific community. More information is presented in SECTION12.
INTRODUCTION 7

TABLE 1.1 Background Information Provided in ‘Focus Boxes’ in the Published Versions of Previous SnT Reports.
REPORT PAGE TITLE
ISS095 10 The IMS Seismological Network in a World Context
ISS095 12 Data Transmission and Data Storage
ISS095 14 Increasing Size of the Daily Reviewed Event Bulletin
ISS095 15 The Problem of Locating Waveform Events
ISS095 16 Measuring Event Location Thresholds
ISS095 19 The Importance of Seismoacoustic Wave Speeds
ISS095 20 Emergence of the Network of IMS Radionuclide Particulate Stations
ISS095 21 The Cooling of Gamma Ray Detectors at IMS Radionuclide Stations
ISS095 22 Event Screening
ISS095 24 Test-Ban Verification and Gas Transport Beneath the Earth’s Surface
ISS095 26 The Relative Contribution of IMS Stations to Verification
SnT20116 31 The Role of Radioactive Noble Gases in CTBT Verification
SnT20116 43 The Impact of Smaller Seismic Events
SnT20116 48 An Integrated Approach to Seismoacoustic Data
SnT20116 52–53 Determination of Seismic Wave Speeds
SnT20116 59 Infrasound Calibration
SnT20116 61 Locating the Source of Observed Radionuclides
SnT20116 71 Tohoku and Fukushima: Their Verification Relevance
SnT20116 74 Radionuclide Particulates and Verification
SnT20116 88 Spin-off Applications of IMS Data
SnT20116 91 Combining IMS Data With Non-IMS Data
SnT20157 28 Evolution of the IMS
SnT20157 36 Data Transmission and Data Storage [update]
SnT20157 37 The Authentication of IMS Data
SnT20157 40 Event Definition Criteria
SnT20157 67 Signal Background
SnT20157 77 Virtual Data Exploitation Centre
8 SCIENTIFIC ADVANCES IN CTBT MONITORING AND VERIFICATION 2017

2 Keynotes
2.1 HRHPRINCESSSUMAYABINT ELHASSAN
HRHPrincessSumayaBintElHassan
PresidentoftheRoyalScientificSocietyofJordan
Ladies and gentlemen,
It is a pleasure, and a great privilege to address you all at the Science and Technology conference 2017. This gathering, which represents a great and enduring coming together of science and policy, highlights to all that a commitment to peace through science and technology delivers results that other forms of international engagement may never achieve.
Indeed, the needs and objectives of CTBTO are so heavily reliant on the innovative capacity of our global scientific community. Through your invaluable work, you demonstrate how dependent we all are as a human family, on the abilities of those amongst us who have the talent and training to progress our technological capacity. CTBTO ensures that innovation is deployed for verification and monitoring so that we may all feel more secure, and your model of collaboration and cross-
border cooperation, in the form of a unique International Monitoring System, ensures that stations distributed globally can detect nuclear tests and unbiasedly report activities that might pose a threat to all of us.
Perhaps the most inspiring aspect of your work is that those technologies which are deployed to avert man-made disasters and dangerous conflict also have such vitally important civilian applications. For those seismic stations are uniquely placed to detect earthquakes, and to act as early-warning systems for tsunamis. The underwater facilities can also be used to track whale migration and to inform us of important developments in our natural world.
Whichever form of detection you seek to improve in order to help keep us safe and informed – from seismic to hydroacoustic and from radionuclide to infrasound – we must all agree that we need a fully supported and independent science community to bring our societies safely into a future freed from conflict and filled with opportunity. Indeed, monitoring and verification will become far more important to our people and our planet as we progress through a rather uncertain century.
The CTBT is of course a prime example of a treaty born out of the collaborative efforts of diplomats and scientists – each community operating with drive and determination in their own spheres of expertise. While committed diplomats spent so many years negotiating the Treaty, the scientific community worked tirelessly to develop the technologies that were essential to make the Treaty work beyond the negotiating table. This was a wonderful example of science and policy working together to make our world safer and more hopeful.
I am delighted to note that your organization has gone from strength to strength since those early days of innovation and negotiation. As we join together here today, I believe that I may allow myself to say that Dr Zerbo, the Executive Director of CTBTO, and myself are very much in agreement that security issues cannot be de-coupled from developmental issues, and that yours is one of those few vital organizations that work tirelessly to enable change through good science and committed diplomacy. For unheeded development challenges must inevitably become security challenges. The true path to sustainable development is through a serious commitment and investment in science and technology that enables opportunity and empowers prosperity.
I hope that I may claim my country of Jordan as a firm ally in this mission. Indeed, we are committed to making science a core part of our regional diplomatic
SECTION 2 — KEYNOTES 9

efforts and our national development objectives. In this regard, we were delighted to host the official opening of SESAME, the Synchrotron-light for Experimental Science and Applications in the Middle East, just over a month ago. I know that Dr Zerbo and so many of you in this room today will understand me when I say that we are truly excited to have such a cutting-edge research facility on our doorstep so that we may strive to develop a model for Open Science that suits and supports our nation and our region. It is through Open Science, backed by regional diplomacy, that we will embrace all of our people and help to create opportunity through ingenuity and innovation.
For science offers so much more than necessary responses to our many challenges – it promises a bold and uniting journey towards finding innovative solutions to those shared challenges. We very much hope that we can make much of the research that will be conducted at SESAME, and elsewhere in Jordan, comprehensible and relevant to a wider audience. Science is humanity’s greatest endowment as we strive to manage our challenged resources and to care for, and heal, our threatened environment.
SESAME is now a beacon of cooperative science in a region where political collaboration is so often absent or thwarted. But it also has the potential to help shine a light into all our communities, one that will illuminate the vast potential of creative innovation to solve problems, to make life better for all of us, and to teach us so much more about ourselves. It is through that process that we may lay the groundwork for durable progress in our communities.
Of course, we must also note the place of science in our cultural identities and our national and tribal memories. For science must be seen as a shared resource and a common gift for all our human family. For all of us, our cultural heritage is a creation of the innovative spirits of many, diverse ancestors.
On the evening of the opening of SESAME, I was delighted to host our international and Jordanian guests at the Jordan Museum, so that we could remember that those of us who call ourselves Jordanian today, are descended from so many tribes, races and civilisations, who have been at the centre of timeless conversations on innovation and the application of knowledge for so many thousands of years. We lie at the heart of a region where countless communities and cultures have had to innovate to survive. Today, it is incumbent on all of us to embrace nations where science has lost its place of honour, or where science is seen as alien and unfamiliar. The truth is, science belongs to all humankind and it
must bring its creative benefits to all who need them.
Ladies and Gentlemen: In our fractious world, we seem to face new and especially daunting challenges that often make science seem like a force for division rather than unity. Yet it should not be so – and CTBTO exemplifies that very fact. For so many thousands of generations, creative adaptation and cultural exchange have gone hand in hand in our human story.
I believe that SESAME follows in that tradition and the Jordan Museum, of which I have the honour to be Vice-Chairman, reminds us of what we must strive to do for our families and our communities. We occupy our space on this planet for such a short period and what we build and what we leave behind will create our legacy. Our lives and legacies must deserve space in our descendants’ halls of history and so we must show them that we were worthy of our human gift of innovation.
I am proud to be a partner with the CTBTO through my own organization, the Royal Scientific Society (RSS). We greatly value our friendship with you and we share with you that deep commitment to science for peace and for prosperity. Jordan was honoured to host the Integrated Field Exercise (IFE14) in December 2014, which was facilitated by The Middle East Scientific Institute for Security (MESIS), our sister organization which is hosted on the RSS campus. The purpose of the exercise was to test the CTBTO’s ability to conduct an on-site inspection in the event that one of their stations detected a nuclear test and was required to verify it. Of course, an on-site Inspection would only be possible if the Treaty comes into force and that seems like a distant hope today. However, this vital exercise tested the CTBTO’s ability to conduct such a test from a logistical viewpoint. It included an enormous deployment of equipment, establishing a command and control ops centre, and setting up a media centre. From a technical perspective, the exercise tested 15 out of the 17 techniques that might normally be used in an on-site inspection.
Perhaps the most important aspect of this historic Integrated Field Exercise was that fact that it demonstrated how a country with no active stage in the nuclear fuel cycle, was able to play host to the largest verification exercise to date. I am proud to note that as a result of Jordan’s commitment, our international community can now share the knowledge that an on-site inspection can be conducted. It further highlights that we all have a collective responsibility to ensure the safety and security of our world, regardless of nuclear or other capabilities. Indeed, ladies and gentlemen, we are all in this together.
10 SCIENTIFIC ADVANCES IN CTBT MONITORING AND VERIFICATION 2017

My small nation is very much committed to supporting diplomacy and to sustaining scientific engagement. This year, we celebrate a wonderful year for Science in Jordan, and the region, as we are privileged to host World Science Forum 2017 at the Dead Sea in November. And our theme could not be more resonant with the mission of CTBTO – we will convene under the banner of ‘Science for Peace’.
I firmly believe that the practice of science and the deployment of scientific knowledge have never been more central to our regional and global conversations. Many of our region’s conflicts have roots in scientific or resource challenges, or have vital scientific dimensions. The human tragedy of migration, the acute and increasing competition over resources, increasing radicalization due to poor and inadequate education, and a stultifying lack of economic opportunities, all require input from our scientific communities, with support from our politicians and diplomats. Climate change will not be averted or mitigated by ideology or political jockeying, while the plight of vast numbers of displaced people can only be tackled by the collaborative input of natural and social scientists.
In Jordan, I believe we are ensuring that those conversations are central to our national debates. But we are combatting the same forces as so many of you here today experience in your own societies. Our science communities have been vilified by political pundits and mocked by much of the media. As populism shouts down the evidence-based methods that are urgently required to plan progress and ensure the stable management of challenges and change, we must fight evermore determinedly for reason to prevail. The ‘emotionalization’ of our political spaces will do little to give our children the future we truly owe them.
Ladies and gentlemen, we look forward to welcoming many of you to World Science Forum 2017, where so many conversations that may begin here today will be expanded and empowered. I wish you every success at this vital conference and in your future work and I assure you that we are your partners on this path to balanced and durable progress.
2.2 MARIACÂNDIDA PEREIRATEIXEIRA
MariaCândidaPereiraTeixeira
MinisterofScienceandTechnology,Angola
Excellency Dr Lassina Zerbo, Executive Secretary of CTBTO, Dear Mr. Michael Linhart, Secretary General of the Ministry for Europe, Integration and Foreign Affairs of Austria, Your Highness Princess Sumaya Bint Hassan, President of the Royal Scientific Society of Jordan,distinguished delegates and scientists, dear guests, ladies and gentlemen,
Allow me, first of all, to greet everyone present at this conference and thank the Executive Secretary for his friendship and kind invitation to this important event, organized by the Comprehensive Nuclear-Test-Ban Treaty Organization.
It is an honour, for me and my country, to share knowledge and I am sure that this event will provide important conclusions for the scientific and technical community in various fields.
Distinguished delegates,
The earth as a complex system needs increasingly more the integration of our joint efforts with the objective of improving our knowledge of it.
Science and technology have been considered since the beginning of times, crucial elements in the search for answers pertaining to several problems.
Understanding that the propagation of electrical waves in different devices could be an important factor
SECTION 2 — KEYNOTES 11

in palaeoenvironmental reconstruction or to formulate the hypothesis on the depth and composition of earth’s mantle and nucleus was truly beautiful.
Excellencies,
The diverse natural and anthropogenic phenomena occurring in different latitudes, their distribution and temporal frequencies force us to collect, treat and store data and to create robust and innovative systems integrated into international monitoring networks that allow us to control in real time monitoring of phenomena mentioned above.
We have appreciated the importance of these conferences that allow the increase of the dialogue and cooperation between the CTBTO and the international scientific and technical community. CTBTO’s global monitoring system and verification capabilities are of considerable value and interest to the scientific community in the world. At the same time, the CTBTO needs this constant exchange in order to remain at the forefront of compliance with the CTBTO verification mandate.
In this regard, I would like to take this opportunity to congratulate the CTBTO for the dynamics that they have created in the establishment of ideal platforms that allow the creation and transfer of knowledge in the vast domains of science, technology and innovation, with special emphasis to those related to nuclear tests.
The issues selected for this conference clearly show the enormous importance that the CTBTO attributes to the search for technical solutions the greatest political problems that affect the humanity, particularly peacekeeping and international security.
Ladies and Gentlemen,
As clearly evidenced by the objectives that this conference aims to achieve, and I will highlight one that proposes ‘the expansion of the involvement of the scientific community and especially of the young scientist in the monitoring of the prohibition of Test’. And here once again, I would like to take this occasion to stress that the youth are the real guarantee of the future and getting them involved in these tasks is really the most sage and noble act of the CTBTO.
The training and capacity building of young people
in different areas of knowledge has been the focus of CTBTO. The slogan ‘From the Youth for the Youth’ used by the CTBTO Youth Group, that is made up of 150 students and young professionals from all over the world, joins the mix of initiatives of the CTBTO geared towards the youth, whose orientation session of the Youth Group was held yesterday.
We have also appreciated the efforts of the CTBTO in relation to gender and we are seeing more participation of women in these events on science and technology, and the example of this is the presence of many women here, including the three personalities who will be speaking at this session of the conference, contributing to the development of the scientific community and seeking solutions to the practical problems in the world.
Ladies and gentlemen,
Angola signed the Treaty in 1996, ratified this important instrument on 20 March 2015 and hopes that more countries will ratify this important international instrument, especially those States in Annex 2. Our country has benefited from the capacity building activities and training for its human resources.
Therefore, we face several challenges and one of the biggest handicaps that we aim to overcome with the technical assistance of CTBTO is the establishment in Angola of a Center for Monitoring Radioisotopes, which will be intended to connect with the International Monitoring System that is currently linked to more than three hundred stations around the world.
Excellencies and distinguished delegates,
Today, more than ever, we should continue creating synergies on a world scale, not only in the political field, but also in the technical area as it is at this Conference, so that the maintenance of international peace and security becomes a reality.
Finally, I am sure that during the five days that we are here discussion issues of great importance and with the participation of such eminent personalities as you, we will find wise answers that will help us to improve our knowledge and practices that are the basis to ensure the technical solutions for the sustainable development of Nations.
Thank you very much.
12 SCIENTIFIC ADVANCES IN CTBT MONITORING AND VERIFICATION 2017

2.3 PASCALEULTRÉ-GUÉRARD
PascaleUltré-Guérard
NationalCentreforSpaceStudies,France
Good morning excellencies, distinguished guests, ladies and gentlemen, young and less-young scientists.
I will give you today a very short overview of what is possible from space with respect to climate change studies. I will show you some examples of success stories and also the big new challenges that the space agencies are facing now.
When we talk about earth observation from space, or from other sensors (in-situ measurements), we should not forget that the first objective is to understand our planet – our very complex planet; to understand it from the inner core to the upper atmosphere, and also the interactions between all the layers of this planet, and the
big cycles like the carbon cycle and water cycle.
Another objective is to inform decision makers, in addressing some social benefit areas like pollution, desertification, disaster management, the ozone hole and so on. This can also bring new applications and services, and also some business development.
So let me start with some success stories. The first one – a very well-known success story – is numerical weather prediction. About 80% of the data used for numerical weather predictions are coming from satellites. And also this gives us very long term data records of a number of parameters that are also very useful to study climate change. We now have more than 50 years of this kind of data, which is a powerful tool to understand climate change and the global change of our planet.
Another well known success is the study of sea level with altimetry satellites like the Jason series and now the Sentinel satellites from the Copernicus European programme. FIGURE2.1 illustrates many El Niño and La Niña phenomena that have been caught by altimetry data over many years. We can see, for instance, that we have had a very high El Niño phenomenon in 2015. So this kind of phenomena are very well studied from space, and you have to realize that we are able to study these phenomena because we are able to measure about one centimetre anomaly in sea level. That is really a challenge because you are doing these measurements at several hundred kilometres from the earth; this is a really innovative and powerful tool that we have in our hands.This is what we are able to do right now, and we all know that sea level rise is one of the most obvious indicators of climate change on our planet.
And now we are facing new challenges. One of these challenges is of course climate change, and FIGURE2.2shows the United Nations Sustainable Development Goals. Climate is one of these goals, but climate is also
FIGURE2.2 United Nations Sustainable Development Goals.
FIGURE2.1 Monthly average sea level anomaly (in cm) for November each year since 1993 for the Equatorial Pacific, from the El Niño Bulletin.
6
Seasonnal variations El Niño/La Niña using altimetry data
Monthly averages maps (in cm) on Novembers each year since 1993, over the Equatorial Pacific from the El Niño Bulletin. The time series of the standardized Sea Level Anomalies is also displayed and updated on the Indicator page. Credits CLS/CNES
8
UN Sustainable Development Goals
SECTION 2 — KEYNOTES 13

included in many other sustainable development goals. So climate is a really important point that we have to better understand and to monitor.
One of the challenges that we are facing now is greenhouse gas observation from space, and of course this is related to the COP21 (the 21st Session of the Conference of the Parties to the United Nations Framework Convention on Climate Change) and the Paris agreement. We would like to know better what is coming from the earth and from human activities with respect to greenhouse gases.
In FIGURE2.3 you have about 50 essential climate variables that have been defined by scientists in the global climate observing system. By the way, 26 of these essential climate variables are very well known because we have space data.
Let me now focus on two of these essential climate variables – greenhouse gases like carbon dioxide, and methane. So now we would like to measure these parameters from space with enough accuracy to better understand the carbon cycle, the life of these greenhouse
gases, and the emissions, sources and sinks of these gases.
We know that there is a growing interest in carbon dioxide and methane observations from space (FIGURE 2.4). Japan has its own satellite, GOSAT. The USA has also its own satellite OCO-3 and many plans, and China has launched last year its satellite TanSat to measure carbon dioxide. In FIGURE2.4 we can also see carbon dioxide and methane molecules just to show you what these missions are intended to measure.
In Europe we have several projects. In particular, in the Copernicus programme we have the Sentinel 5P and Sentinel 5 which aim to measure methane. We have two satellites – I will come back to this later – led by France, and we have also the Sentinel 7 project to measure carbon dioxide from space in the Copernicus programme.
A few words about two satellites that CNES is developing right now with its partners. We have MICROCARB for carbon dioxide measurements from space. MICROCARB will be launched in 2020. It is very challenging to measure carbon dioxide from space. As you know, carbon dioxide is the most important greenhouse gas in our atmosphere, but is it very difficult to measure the small variations of this greenhouse gas because we would like to measure one part per million with respect to the total concentration in the atmosphere, which is 400 parts per million. So it is a very small variation that interests us, and it really is a challenge to measure such small variations from space at about 800 km from the earth’s surface.
MICROCARB is a cooperation with the UK Space Agency, and again what is very important is to have accurate measurements to deliver some very interesting data for the scientists to really understand the system. It is important to understand the carbon dioxide that we have now and the status of the greenhouse gas
FIGURE2.3 Essential climate variables. Satellite observations have made a major contribution to the study of those in bold.
FIGURE2.4 Carbon dioxide and methane observations from space.
10
14 SCIENTIFIC ADVANCES IN CTBT MONITORING AND VERIFICATION 2017

evolution during the seasons. It is also important to understand what will happen with climate change; with an increase of temperature in the atmosphere, what will be the reaction of natural ecosystems? Will forests have the same behaviour under global warming? We have to monitor this very carefully in the long term.
The MERLIN satellites are dedicated to methane measurement from space. It is a cooperation with the German space agency DLR (Deutsche Zentrum für Luft- und Raumfahrt), and it will be launched in 2021. What is very important for methane, the second most important greenhouse gas, is to understand what happens at high latitude, when permafrost is melting. Scientists think that it will release a large quantity of methane, so we have to study the high latitudes with respect to methane emissions. That is the reason why with Germany we have proposed to have lidar on both of these satellites. Lidar uses a laser, and is able to measure in all seasons for
several years, to study the evolution of what happens in particular at high latitudes. This is a big challenge because we need to have very accurate measurements to understand exactly what happens with respect to methane in the atmosphere.
Another big challenge that we have is to study the water cycle and to evaluate freshwater resources. In a globally changing world we know that water resources will be a more and more important topic for humankind. So it is really important to have tools to study this evolution. Again we have the essential climate variables, and now we will focus on three of them: sea level, river discharge and water use, and lakes.
This leads me to talk about one important project that we have with the National Aeronautics and Space Administration (NASA), the UK space agency and the Canadian space agency, called SWOT (surface water and
FIGURE2.5 Contribution of SWOT to monitoring the level of oceans and inland waters.
FIGURE2.6 Hydrology: a new application of altimetry satellites.
SECTION 2 — KEYNOTES 15

ocean topography). SWOT is a very particular altimetry satellite. Thanks to its big antenna it will be possible to have some three dimensional (3-D) mapping of the water level at the earth’s surface, not only ocean but also inland water. So this will really be a breakthrough in the knowledge of the water system on the earth’s surface. This satellite will be launched in 2021.
In FIGURE2.5 you have an example of what it will be possible to measure as far as sea level is concerned thanks to the SWOT mission. We will be able to study very small scale eddies in the oceans. A lot of the energy in the oceans is included in these small-scale dynamic systems. So it will be very important to be able to measure this kind of small scale eddies to better understand the dynamics of the ocean, and also to better understand life below the oceans, which is also related to this kind of dynamic system.
This is one of the first objectives of the SWOT mission. Another objective is to address a new topic, which is hydrology. This is a new application of altimetry using a new generation of satellites.
So with altimetry on the left in FIGURE2.6 you have an example of what is possible with classical altimetry satellites like Jason or Sentinel 3, and you see that you can measure the ocean surface on a fixed grid. So we
have some holes in the measurements. As shown on the right in FIGURE2.6, with wide swath altimetry it will be possible to have a continuous coverage of the earth’s surface, and also of the oceans. So this will be a major breakthrough in the knowledge of our planet.
In FIGURE2.6 you can also see that all the rivers that can be monitored by the SWOT mission from space – we will monitor all rivers with more than 100 m width and lakes of more than 250 m by 250 m. So this will be a really advanced tool to have better knowledge of inland fresh waters.
What is also important in space activities is international cooperation, because one nation or one space agency cannot address all topics alone. So it is really important to coordinate our efforts and to have this international cooperation between all the space agencies of the world. This effort is coordinated for instance with CEOS (Committee of Earth Observation Satellites) and with GEO (Group of Earth Observations).
On the occasion of COP21 the space agencies have proposed a new declaration which aims to coordinate the effort of the space agencies with respect to greenhouse gas measurements from space. It is a very big challenge; all the state of the art knowledge has to be shared and all the measurement systems have to be coordinated.
19
Fiji, Sentinel 2FIGURE2.7 Image of Fiji from Sentinel 2 satellite.
16 SCIENTIFIC ADVANCES IN CTBT MONITORING AND VERIFICATION 2017

SECTION 2 — KEYNOTES 17
During COP22 in Marrakesh we also discussed and proposed the Marrakesh declaration to coordinate our efforts for water cycle systems to understand better also fresh water resources. And of course we are waiting for COP23 organized by Fiji in Bonn this year (2017). This will be a very important rendezvous for tackling climate change.
I thank you for your attention, and in FIGURE2.7 you have a beautiful picture of Fiji by Sentinel 2. Sentinel 2 is part of the Copernicus European programme for the study of the environment and security.
Thank you very much.
2.4 DESBROWNE
DesBrowne
LordBrowneofLadyton,ViceChairman,NuclearThreatInitiative,andformerUKSecretaryofDefence
Introduction and Thanks
Your excellencies, distinguished delegates, ladies and gentlemen, and, in particular, members of the CTBT Youth Group.
Thank you very much for your kind introduction.
Thank you for the opportunity to be here today. It is always a pleasure for me to be back in Vienna and I am honoured to be asked to provide the closing keynote address for what I know has been an important and productive conference.
And to be back among friends. I am pleased to see so many people in this room whom I have come to know and many of whom I have worked with on issues which are very dear to me. I am always happy to join my friend, Lassina Zerbo – a true visionary and creative thinker, and a tremendous colleague. I know we are all grateful for your leadership Lassina.
Words about the Conference
The solutions to many of the world’s major problems rely upon a combination of policy change and scientific or technical innovation. A significant challenge is to ensure that as scientific innovation advances it does so, at least in part, by addressing the policy issues at every step; an innovation with no prospect of making a real impact will simply remain a nice piece of science. Conversely,

a policy introduced in the absence of scientific and technical substantiation will at best flounder. By bringing these two disciplines together real and positive change can be achieved.
Governments worldwide rely on scientific advice on issues such as the impact of climate change, the consequences of an ageing population, water security, sustainability and cybersecurity. In the UK there are 11 chief scientific advisers embedded within Government departments, in the USA there is a Government sponsored group of independent elite scientists, the so-called JASON group, that meet for an intensive period annually to report on specific science/policy issues. In Singapore scientists and technologists occupy senior Government posts ensuring that public impact of science is a fundamental driver to policy.
The value of bringing together these key areas cannot be underestimated. During my time serving in cabinet positions I frequently found myself depending on the advice of government experts for issues of a technical and scientific nature. Looking back, however, I am concerned increasingly about the reliability of this advice and, more broadly, the lack of infrastructure for developing sound policies based on truly independent and reliable evidence. I am convinced that government policies will be much sounder if government has the benefit of reliable, independent, expert advice to answer key policy questions and review evidence.
Nowhere is this truer than the arms control world. Thankfully, the CTBTO has built a reputation for providing that reliability, independence and expert advice.
In particular, CTBTO’s Science and Technology conferences provide an opportunity for the world’s scientists to exchange knowledge, including knowledge about advances in monitoring and verification technologies, ensuring that the Treaty’s unique global verification regime remains at the forefront of scientific and technical innovation.
Since their inception, the SnT conferences have evolved. In the early days, it was purely a scientific and technological conference among scientists. In 2015, it was expanded to include academia and policy/diplomacy elements. And this year – the sixth in a series of multidisciplinary conferences designed to “further enhance the strong relationship between the scientific and technological community and the Comprehensive Nuclear-Test-Ban-Treaty Organization (CTBTO) as well as with policy-makers” – a new fifth
theme involving civil society, entitled “Monitoring for Nuclear Explosions in a Global Context” including “Capacity Building, Education and Public Awareness”, has been added to the traditional four scientific themes.
Also, SnT2017 has had a special focus on youth and young scientists. It is the first major CTBTO event to include CTBTO Youth Group members. On the one hand, their inclusion provides the CTBTO Youth Group members with a unique opportunity to deepen their knowledge of the CTBT verification technologies and, on the other, provides the CTBTO with the opportunity to introduce the Group to the wider community, promoting a fuller understanding of the Youth Group initiative and its objectives.
I was particularly pleased to be here in 2016 at the inauguration of the CTBT Youth Group. As I said then “I have invested a significant amount of hope and optimism in the younger generation that they will be able to undo some of the difficulties that we have created for you. You are going to inherit a very complicated and difficult world”.
The Achievement of the CTBTO
As I have said many times before, the CTBTO is an extraordinary organization – and that is due in large part to its extraordinarily capable staff.
There should be no question that what has been accomplished to date is extraordinary. You have demonstrated to the world that it is indeed possible to build a robust and reliable global monitoring and verification surveillance system – and one that has life saving applications that go beyond its original intent.
Thanks to your good work:
• A verification regime to monitor the globe for nuclear explosions is nearing completion with around 90% of the 337 planned International Monitoring System facilities already in operation;
• The system has proved its capabilities to detect even small nuclear tests;
• In addition to nuclear test monitoring, scientists use CTBTO data in a wide range of applications, from observing volcanoes and icebergs, to studying marine mammals and improving disaster mitigation strategies, and much more;
• The CTBT is the most broadly supported arms control treaty with 183 signatories and 164 ratifications;
18 SCIENTIFIC ADVANCES IN CTBT MONITORING AND VERIFICATION 2017

• The world now has a de facto moratorium on testing, the DPRK notwithstanding.
You have every reason to be proud – and I am proud to be here and to be associated with this very fine organization.
There is a lot to be proud of – and as I say repeatedly the scientists and technical experts responsible for so much of this success must be recognized for all they have achieved and can achieve. But they must also accept their responsibility that they have to do all they can to share the story of the CTBTO’s success to help the officials and politicians working to convince the remaining Annex 2 States that it is in their best interests – and the world’s best interest – to support the Treaty.
Today’s Difficult Environment
But the Treaty has yet to enter into force. We are, of course, in a very different place than we were more than 20 years ago, when the Treaty was opened for signature.
Today:
In the recently published words of Daryl Kimball of the Arms Control Association:
“Nearly five decades ago, the 1968 nuclear Non-proliferation Treaty (NPT) established the requirement that states-parties pursue “effective measures” to end the nuclear arms race and to achieve nuclear disarmament. The United States and Russia have reduced their Cold War stockpiles and verifiably banned nuclear explosive testing. But some 15 000 weapons remain, additional nuclear-armed states have emerged, and the risk of nuclear weapons use is rising. Key NPT disarmament commitments made in 2010 are unfulfilled. The future of key nuclear arms control treaties, including the New Strategic Arms Reduction Treaty and the Intermediate-Range Nuclear Forces Treaty, are in doubt. The 1996 Comprehensive Test Ban Treaty (CTBT) has not formally entered into force. Global fissile material stocks remain very substantial. Worse still, the world’s nine nuclear-armed states are replacing, upgrading, or in some cases expanding their arsenals.”
Today:
The relationship between Russia and the West – still crucial in today’s world – is at its lowest point in 25 years. Trust and communication between leaders has
all but disappeared, and the threat of conflict escalation has become increasingly real, creating a very dangerous situation in a region and among countries with a high concentration of both conventional and nuclear forces.
The Middle East is in turmoil. The Israeli-Palestinian peace process is moribund. Syria is in chaos. Instability in Iraq is growing. Brutal terrorist attacks by ISIL, al Qaeda, Boko Haram and other organizations are on the rise in the region and beyond, raising the spectre of radiological or catastrophic nuclear terrorism if terrorist groups get control of dangerous materials.
In the United States, even before the presidential race got underway, relations between the two major political parties were so poisonous that it was hard to imagine them coming together on any issue at all – much less one involving national and international security.
And the DPRK, as we are all painfully aware, has recently conducted its fourth nuclear test since 2006 – exhibiting continued rejection of global norms and reinforcing its complete disinterest in taking a place in the global community. Its actions are a sobering reminder of continued nuclear dangers from state actors, as well as the ongoing threat of nuclear proliferation.
The consequences of a global erosion of trust and cooperation – as well as escalating dangers – can be devastating. According to a recent survey of leading security experts from the USA, Russia and Europe recently conducted by my colleagues at the Nuclear Threat Initiative, the deterioration of relations in particular has led to very dangerous conditions under which the use of a nuclear weapon – whether by intent, misuse, miscalculation or accident – has become higher than at any time since the end of the Cold War. Though still unlikely, the notion that the risk of nuclear use today is rising is – and ought to be – profoundly disturbing.
Usually, when I get to this stage in a speech about the these issues or more particularly about the Comprehensive Nuclear-Test-Ban Treaty and its entry into force, having just described a deteriorating global geo-political environment, I remind my audience of the need to retain a degree of optimism, even in the face of what may appear to be overwhelming odds.
Typically, my argument goes something like this: “We will not always live in this moment and change can happen very quickly”. I then go on to give you examples of change, my recent favourite is that the Ukraine crisis came out of virtually nowhere. Then, I will argue that even if the current circumstances prevail and
SECTION 2 — KEYNOTES 19

worsen, it is still possible to make progress on difficult matters, especially disarmament, arms control or non-proliferation issues. As examples, I can draw on the Joint Comprehensive Plan of Action – the Iran Deal, the removal of chemical weapons and their materials from Syria or the continued success of President Obama’s nuclear materials security initiative.
Finally, I have become adept at winding up my speeches by finding some new way of approaching the challenges we face and arguing for its promotion by members of my audience. So, variously, I have encouraged commitment to an engagement with international verification; joint work on cyber security – in our common interests; moving from persuasive mode to listening mode with recalcitrant nation states who are holding back on signature or ratification of the Treaty; or just plain appeal to the self-interest of those countries supported by scientists, or those technically able to persuade decision makers that the international monitoring system is a technical and scientific improvement of proven merits and bound to improve everyone’s security. A favourite is to appeal to those countries that have ratified to make entry into force a diplomatic priority.
I can do that again today, if that is what you want me to do. I can draw on words and ideas that I have deployed here in this great city in many different environments, but for a reason that I shall explain, I would rather not do so. But I ask you to consider those arguments and challenges to have been advanced.
There is something significantly different about this Science and Technology conference and that is the significant presence of and involvement of CTBT Youth Group in the conference. As I have already reminded you, I was here in February 2016 at the inauguration of the CTBT Youth Group and shared my faith in the potential of the optimism of youth with those who were present.
I am delighted that my optimism has been justified by the presence and the contribution of the young people who have been with us over the last week.
Unfortunately, many of us old hands have become inured to the optimism of youth. Over the years, the inevitable maturing process has driven us into the politics of realism. We have fallen prey to the arguments that hope and optimism are naivety. Consequently, we have become adept at describing the problem, rather than working to solve it.
In short, the problem here is that we, as a generation of leaders, have lost the ability to be able to describe the world we want to live in and to show the leadership necessary to get us to that place. But, the youth of this world – younger people who live part of their lives in a virtual borderless environment and who have gotten used to living in a world with much broader horizons and a significantly greater tolerance of diversity – are beginning to show us the way back to that form of politics and leadership. For some years now, as I travel the world, I have been confused by my own observations that the people who want to live free of the threat of nuclear weapons and their materials, the people who want to live in a world of mutual security rather than deterrence, the people who want to live in a world of hope, rather than despair, of diversity, rather than narrow national interests – those people are in the majority. While, at the same time, they are seldom in leadership.
I have observed this phenomenon in many countries. I lived and worked for the last three years in the USA. It is present there.
In my own country, the United Kingdom, we have just had a General Election. In that election, younger people have, for the first time in my political life, through social media engagement, become an active and significant force in a General Election. Their votes did not win a majority, but it stopped the expected majority. That is always the first step towards power, denying a majority to your opposition. About a million young people registered to vote for the first time in the lead up to the election and using their own preferred form of communication, shared the fact that they were a large group, with each other, jointly reinforcing their desire to reject a politics of austerity, for a politics of hope and opportunity.
I have no doubt that the young people who are with us now in this conference, who are building their capacity to make the case for the hope and opportunity of a world free of nuclear weapons can deploy similar skills in the same space to a similar effect.
And it is our duty to support them wholeheartedly in that endeavour.
Sahil Shah, a member of the CTBT Youth Group addressed you earlier this week and he shared his speech with me.
I want to close with Sahil’s words, because he makes the case better than I can make it.
20 SCIENTIFIC ADVANCES IN CTBT MONITORING AND VERIFICATION 2017

“We (the youth) need you to share with us the ways in which we can better understand (how) arguments rooted in science and technology can be socialized to inform our politics. If we do not
work together, we will lose the chance to turn scientific and technical expertise into a radical agent for change…Together we must create more meaningful outcomes.”
SECTION 2 — KEYNOTES 21

22 SCIENTIFIC ADVANCES IN CTBT MONITORING AND VERIFICATION 2017
3 DataAcquisition
Sensors for the detection of relevant signals are an essential feature of data acquisition, but modern data acquisition infrastructure includes a lot more besides. SECTION 3 is concerned with the equipment used to acquire data and its method of installation, as well as methodologies for making the measurements, recording them and if necessary digitizing them. The calibration of sensors and recording systems including digitizers is also within scope, as is the design and configuration of sensor arrays and networks intended for both portable and permanent deployment. Sensors and recording systems for ancillary data such as meteorological or environmental, which may or may not be relevant to the primary data, are also within the scope of SECTION 3, as is ancillary equipment in support of data acquisition such as power supplies, timing systems, cooling and vacuum systems.
Data processing is included in SECTION 3 only when it is integral to the process of measurement or recording of the data; methods of combining and processing data recorded by different sensors of an array are considered ‘data processing’ so are included under SECTION 5.
Instrumental self-noise, and other instrument characteristics are within the scope of SECTION 3, as well as methods to reduce noise during the recording process. However, studies of background signals and noise originating externally to the recording system, and their effect on instrument performance and detection thresholds, are considered in SECTION 8 as background noise. Although studies
of instrument capability are included in SECTION 3, studies of instrument performance are included along with other performance-related topics in SECTION 8.
Diverse measurement platforms are becoming important, and can have a major effect on instrument design. These platforms include satellites, aircraft and unmanned aerial vehicles (UAVs or drones), and SECTION 3 includes them. Matters related to the authentication, encryption and security of data are considered part of data transmission, so are covered by SECTION 4. Data storage is only included in SECTION 3 if it is integral to recording equipment; other data storage issues are considered in SECTION 4 or, in the case of shared data platforms, SECTION 9.4.
The acquisition equipment covered under SECTION 3 includes that used in IMS facilities (following the Treaty text (Article IV, paragraph 16), ‘facilities’ refers to IMS stations plus IMS radionuclide laboratories), as well as equipment used for OSI, and equipment of any other verification technology that is used, or might be usable, in the CTBTO verification regime or as national technical means by entities outside the CTBTO.
Strategies for OSI are also within the scope of SECTION 3 because such strategies are intimately related to the technological possibilities and limitations of data acquisition. Indeed these strategies are leading to bespoke designs for acquisition equipment tailored to the special needs of field deployment under strict procedures imposed by the Treaty or the draft OSI Operational Manual.
INTRODUCTION

SECTION 3 — DATA ACQUISITION 23
3.1 SENSORS AND MEASUREMENTS
3.1.1 SEISMIC
The basic principle of a seismometer is simple – it is a mass connected to a housing by means of a damped spring. The output signal can be the relative displacement of mass and housing resulting from the passage of seismic waves. The output of seismometers is generally an analogue signal that needs to be digitized, with the result that digitizers have become a key component of the overall seismic detection equipment. Hence there have been various studies aimed at developing intrinsically digital seismometers, with a view to eliminating the digitizer. One approach is to use an interferometer to measure the relative motion, offering the prospect of an output that counts fringes. Ansari and Esmaeili (T3.1−P3) describe a novel three component optical seismometer that uses Moiré fringes (FIGURE 3.1).
There has been much discussion on the use of inexpensive accelerometers, that are routinely built into mobile electronic devices including smartphones, to detect earthquakes or even nuclear explosions. These devices are intended to detect and mitigate impacts or other abuse of the mobile device. They are a class of microelectromechanical systems (MEMs) and have in particular been used for crowd sourced earthquake early warning systems (in which seismic waves close to the source are detected and used to warn those further
away). Gholami and Seif Pour Abolhassani (T3.1−P16) report on the development of a microelectromechanical based accelerometer.
Borehole seismometers offer advantages over those emplaced at the surface – in particular lower background noise and a more stable physical environment. The practical limit on sensor size imposed by borehole emplacement can pose particular difficulties for seismometers designed to record over a very wide bandwidth. Guralp et al. (T3.1−O3) report on the performance of a very broad band borehole instrumentation system.
The calibration of seismic stations is essential to ensure the correct measurement of signal amplitude and period. The same is true of the seismic stations used in the IMS as T-phase stations to record hydroacoustic waves that have been converted to seismic waves at the ocean-land interface (typically at a steep submarine continental slope). Otsuka et al. (T3.1−P35) report on methods to calibrate both station types.
Wind represents an important source of noise on both seismic and infrasound signals. Martysevich and Starovoyt (T3.5−P56) study the transfer mechanisms of wind to the recording system at co-located IMS seismic and infrasound stations. The mitigation of any noise source will serve to improve the detection threshold and the quality of the signals recorded. Improved signal quality results in fewer errors when measuring the parameters of signals. This problem is considered by Brouwer and Kitov (T4.1−P12).
Arrays of multiple seismometers are in widespread use because of their ability to suppress seismic noise and to measure the direction of incoming signals. Woodward et al. (T3.1−O6) describe experiments to determine the best strategies for recording the full seismic wavefield at a seismic array.
3.1.2 HYDROACOUSTIC
The six hydrophone stations and five T-phase stations of the IMS hydroacoustic network provide the capacity to detect potential nuclear explosions in the oceans. This requirement can be met with a small number of stations because of the great efficiency with which acoustic waves travel horizontally in the sound fixing and ranging (SOFAR) channel, at a depth of about 1 km and within which the hydrophones are placed. It follows that each hydroacoustic station in the IMS network is
FIGURE 3.1 3C optical seismometer using Moiré fringes. From Ansari and Esmaeili (T3.1−P3).

24 SCIENTIFIC ADVANCES IN CTBT MONITORING AND VERIFICATION 2017
important in the maintenance of a global coverage, since a single station outage is enough to seriously compromise this coverage. Hence there is a need for especially high reliability and long mean time between failures for hydrophone stations.
The rebuilding of HA03 at Juan Fernandez Islands, Chile, was reported in detail at SnT2015 following its destruction by the tsunami associated with an earthquake in Chile on 27 February 2010. SnT2017 took place around the same time as the installation of the final hydrophone station in the IMS network: HA04 (Crozet Islands, France). The establishment of this station is described by Haralabus et al. (T1.4−P2) (FIGURE 3.2).
Completion of the hydroacoustic network has allowed extensive analysis of the many and varied signal detections made at these stations. Brouwer et al. (T1.4−P3) report a study of detections made at HA03 (Juan Fernández Island, Chile) and HA11 (Wake Island, USA). Bittner et al. (T2.3−P10) report on events detected by the IMS hydroacoustic stations in the Indian Ocean, while Saceanu et al. (T1.4−P5) focus on signals recorded at one of these stations – HA08, Diego Garcia, United Kingdom (UK).
A wealth of experience has been gained during the installation of the IMS hydroacoustic stations, and technological advances are continuing to impact upon designs for the future replacement of stations as they become due for recapitalization. Zampolli et al. (T1.4−P6) describe progress on studies in support of the next generation of these stations.
3.1.3 INFRASOUND
A new optical microbarometer for potential use at IMS infrasound arrays is described by Olivier et al. (T3.1−O2) (FIGURE 3.3). Associated with the microbarometer is always a physical wind noise reduction system, usually including a system of pipes to average the signal over short length scales in an attempt to reduce this source of noise. Kramer and Marty (T3.1−P41) describe the wind noise reduction systems used in the IMS infrasound network. Specific problems related to the wind noise reduction system at the IMS station IS48 (I48TN) are described by Friha (T4.1−P22). Czanik and Bondar (T1.1−P23) describe the first infrasound array to be installed in Hungary, and Merchant et al. (T3.1−P26) describe an isolation chamber for improved calibration of infrasound sensors (FIGURE 3.4).
The processing of data recorded at an infrasound array seeks to maximize the directional information that array observations offer. Robertson and Charbit (T3.1−P21) describe developments in IMS array geometry tools.
Portable infrasound arrays may be useful for site surveys, or for the temporary replacement of a malfunctioning permanent station. Ratiu et al. (T3.1−P7) report on the addition of wireless capabilities to an IMS portable infrasound array.
FIGURE 3.2 Deployment of the final hydrophone node of the north HA04 triplet from the cable ship C/S Decisive, 29 December 2016, photographed from a drone. From Haralabus et al. (T1.4−P2).

SECTION 3 — DATA ACQUISITION 25
FIGURE 3.3 Comparison between the classical magnet-and-coil transducer design of microbarometer (top) with an optical microbarometer using an interferometer (bottom). From Olivier et al. (T3.1−O2).

26 SCIENTIFIC ADVANCES IN CTBT MONITORING AND VERIFICATION 2017
3.1.4 SEISMIC, HYDROACOUSTIC AND INFRASOUND AS A GROUP
There are many cases where IMS stations of more than one technology are co-located, as specified in the Treaty. Although the design of the IMS primary seismic network was influenced by the location of pre-existing seismic stations, the design of the IMS infrasound network suffered no such constraint because very few infrasound stations pre-existed. When designing future equipment for IMS stations, many requirements and challenges are common to all three of the IMS waveform technologies. Such challenges are considered by Starovoyt et al. (T3.1−P25).
3.1.5 RADIONUCLIDE
There continues to be a focus on the development or enhancement of equipment for detecting radioactive noble gases in the atmosphere, both in a global context using IMS radionuclide stations, and in the OSI context using mobile equipment. Noble gas detection equipment is scheduled to be installed at 40 of the 80 IMS radionuclide stations. Most noble gas detection systems are designed for the detection of xenon isotopes. Various projects are in progress to enhance IMS capabilities in the area of radioactive noble gas detection, and these are described by Plenteda et al. (T3.1−P28).
One xenon measurement system is the Swedish Automatic System for Noble Gas Acquisition (SAUNA), and the project to develop SAUNA III is reported by Ringbom et al. (T3.1−O7). A proposal for radioactive
xenon detection using arrays of detectors (the SAUNA CUBE project) is described by Ringbom et al. (T3.1−P38). The performance of new beta detectors used in the SAUNA system is reported by Fritioff et al. (T3.1−P31). Ringbom et al. (T2.4−P1) analyse data from a comparison between SAUNA II and SAUNA III systems.
The système de prélèvement d’air automatique en ligne avec l’analyse des radio-xénons (SPALAX) from France is another established noble gas detection system. The deployment, operation and performance of a new generation SPALAX system (FIGURE 3.5) are described by Topin et al. (T3.1−O5).
A third noble gas detection system is the Analyser of Radioxenon Isotopes (ARIX), from the Russian Federation, and Lashaev et al. (T3.1−P19) describe the development of a silicon positive intrinsic negative (SiPIN) diode detection unit for ARIX. A SiPIN beta detector (FIGURE 3.6) replaces the plastic scintillator in a beta–gamma coincidence measurement system, and offers improved electron energy resolution. This facilitates isotope discrimination and consequently increases the ability to identify the source of xenon using the ratio of isotope concentrations. Xenon International is a relatively new noble gas detection system developed in the United States of America (USA) at the Pacific Northwest National Laboratory (PNNL). It is described by Hayes et al. (T3.1−P42). Xenon is not the only noble gas relevant to the detection of nuclear tests using radionuclides.
Another possibility is argon, and Hayes (T3.1−P18) describes the development of a field-portable argon-37 monitoring capability. Bowyer (T1.3−O8) considers the use of argon-37 as a coincident signature with radioactive xenon in order to improve detection in high background environments.
The Radionuclide Aerosol Sampler/Analyzer (RASA) is a radionuclide particulate detection system from the USA. Bustillo et al. (T3.1−P9) focus on hardware sustainability and automated testing, and the RASA software environment. Improving the minimum detectable concentration (MDC) capability is a quest for all radionuclide detection systems, and for the RASA system this is reported by Hong et al. (T3.1−P23). Calibration of the associated detectors is another important topic, and for the detectors used in the RASA system Tillistrand et al. (T4.1−P18) report on the automation of field-based calibration, and the potential for factory calibration to replace field calibration. Rulev (T4.1−P23) presents a thermal insulation system and automatic air sampler for IMS stations operating at low temperatures.
FIGURE 3.4 Infrasound isolation chamber for improved infrasound calibration. From Merchant et al. (T3.1−P26).
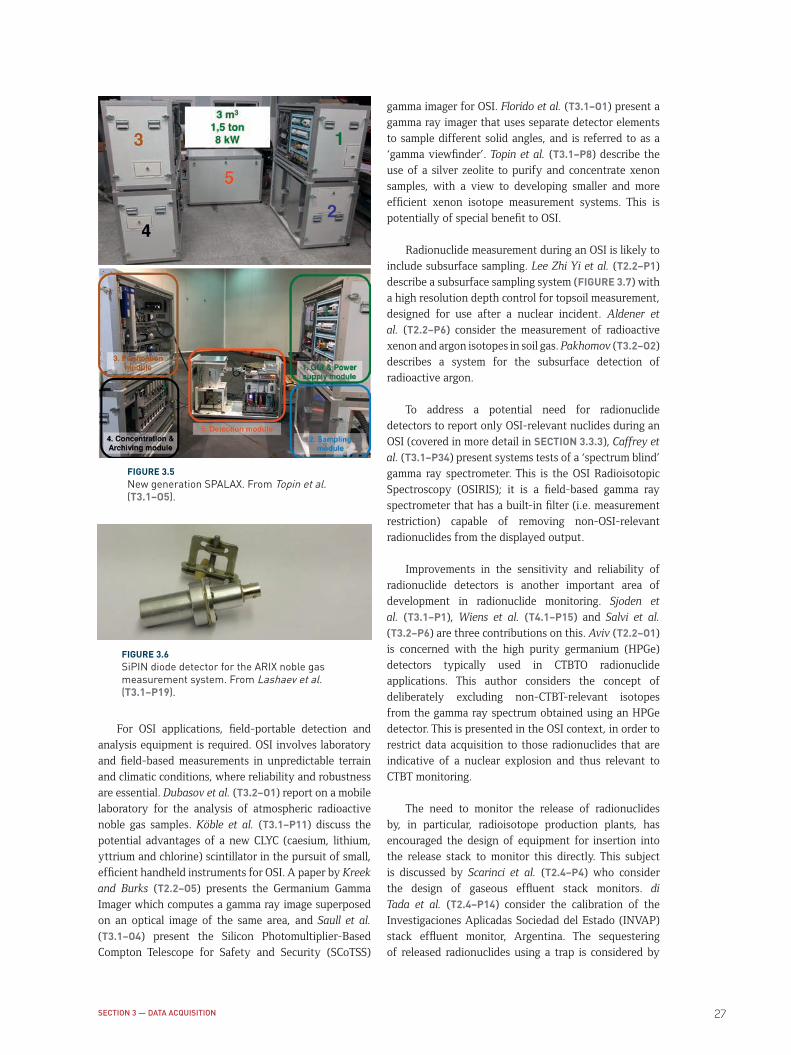
SECTION 3 — DATA ACQUISITION 27
For OSI applications, field-portable detection and analysis equipment is required. OSI involves laboratory and field-based measurements in unpredictable terrain and climatic conditions, where reliability and robustness are essential. Dubasov et al. (T3.2−O1) report on a mobile laboratory for the analysis of atmospheric radioactive noble gas samples. Köble et al. (T3.1−P11) discuss the potential advantages of a new CLYC (caesium, lithium, yttrium and chlorine) scintillator in the pursuit of small, efficient handheld instruments for OSI. A paper by Kreek and Burks (T2.2−O5) presents the Germanium Gamma Imager which computes a gamma ray image superposed on an optical image of the same area, and Saull et al. (T3.1−O4) present the Silicon Photomultiplier-Based Compton Telescope for Safety and Security (SCoTSS)
gamma imager for OSI. Florido et al. (T3.1−O1) present a gamma ray imager that uses separate detector elements to sample different solid angles, and is referred to as a ‘gamma viewfinder’. Topin et al. (T3.1−P8) describe the use of a silver zeolite to purify and concentrate xenon samples, with a view to developing smaller and more efficient xenon isotope measurement systems. This is potentially of special benefit to OSI.
Radionuclide measurement during an OSI is likely to include subsurface sampling. Lee Zhi Yi et al. (T2.2−P1) describe a subsurface sampling system (FIGURE 3.7) with a high resolution depth control for topsoil measurement, designed for use after a nuclear incident. Aldener et al. (T2.2−P6) consider the measurement of radioactive xenon and argon isotopes in soil gas. Pakhomov (T3.2−O2) describes a system for the subsurface detection of radioactive argon.
To address a potential need for radionuclide detectors to report only OSI-relevant nuclides during an OSI (covered in more detail in SECTION 3.3.3), Caffrey et al. (T3.1−P34) present systems tests of a ‘spectrum blind’ gamma ray spectrometer. This is the OSI Radioisotopic Spectroscopy (OSIRIS); it is a field-based gamma ray spectrometer that has a built-in filter (i.e. measurement restriction) capable of removing non-OSI-relevant radionuclides from the displayed output.
Improvements in the sensitivity and reliability of radionuclide detectors is another important area of development in radionuclide monitoring. Sjoden et al. (T3.1−P1), Wiens et al. (T4.1−P15) and Salvi et al. (T3.2−P6) are three contributions on this. Aviv (T2.2−O1) is concerned with the high purity germanium (HPGe) detectors typically used in CTBTO radionuclide applications. This author considers the concept of deliberately excluding non-CTBT-relevant isotopes from the gamma ray spectrum obtained using an HPGe detector. This is presented in the OSI context, in order to restrict data acquisition to those radionuclides that are indicative of a nuclear explosion and thus relevant to CTBT monitoring.
The need to monitor the release of radionuclides by, in particular, radioisotope production plants, has encouraged the design of equipment for insertion into the release stack to monitor this directly. This subject is discussed by Scarinci et al. (T2.4−P4) who consider the design of gaseous effluent stack monitors. di Tada et al. (T2.4−P14) consider the calibration of the Investigaciones Aplicadas Sociedad del Estado (INVAP) stack effluent monitor, Argentina. The sequestering of released radionuclides using a trap is considered by
FIGURE 3.5 New generation SPALAX. From Topin et al. (T3.1−O5).
FIGURE 3.6 SiPIN diode detector for the ARIX noble gas measurement system. From Lashaev et al. (T3.1−P19).

28 SCIENTIFIC ADVANCES IN CTBT MONITORING AND VERIFICATION 2017
Baré et al. (T2.4−P8), who report on the validation of a prototype radioactive xenon trap.
The many changes in the acquisition and processing of gamma ray data as a result of the move from analogue to digital systems are reviewed by Delaune et al. (T3.5−P14).
As with many experimental measurements, the ability to detect a radionuclide signal of interest is compromised by the existence of many interfering signals with multiple unrelated origins. Generally referred to as ‘background’, these other signals receive
much attention from designers of detectors and measurement systems, with the aim of finding methods to reduce the background, and thereby reveal signals of interest at a lower concentration. The simplest way of reducing background is by shielding. By surrounding the detector with a radiation shield, the flux of gamma rays reaching the detector from decay events outside the system is reduced (passive shielding). Other methods of background reduction exploit differences between the products of irrelevant decays from those of interest (active shielding). Ilie et al. (T3.1−P17) consider steps to mitigate background in order to better detect low concentrations in samples. They describe a cosmic guard system to mitigate cosmic background and a Compton suppression system.
Livesay and Dallas (T3.3−P6) consider a potential role in CTBT verification of radiation portal monitors. These are walk-through or drive-through radiation detection systems that are widely deployed by government agencies.
3.1.6 SATELLITE BASED AND OTHER
The Treaty foresees that additional monitoring technologies may be added to the CTBTO verification system in the future, and satellite monitoring is specifically mentioned in this context1. The increasing range of observational applications to which satellites are being put, together with the lowering of their cost, has resulted in much work on the use of open source or other satellite data for CTBT verification purposes. Rowlands et al. (T3.3−P4) present work on the detection of OSI-relevant features using time series radar imagery from satellites. The use of radar interferometry to observe permanent ground displacement resulting from a seismic event (FIGURE 3.8) is discussed by Hartmann et al. (T3.3−O1); this uses Differential Interferometry Synthetic Aperture Radar (DInSAR). Shah and Shah (T3.1−P10) propose autonomous ground based sensor systems controlled via satellites, which can also be used for data transfer. These authors point out the advent of large constellations of relatively inexpensive small earth observation satellites, which might be appropriate for this purpose. Rutkowski et al. (T3.3−O2) discuss satellite-borne video processing and reporting techniques for imagery analysis.
Airborne measurements are permitted under the Treaty in the context of OSI. For example, a testing environment for airborne optical sensors is described by Szalay et al. (T3.1−P6); anomaly detection in remote
FIGURE 3.7 Fine increment soil collector for subsurface radionuclide sampling. From Lee Zhi Yi et al. (T2.2−P1), adapted from Mabit et al. Journal of Soils and Sediments 14(3) 630-636, (2014).

SECTION 3 — DATA ACQUISITION 29
(airborne) optical imagery is discussed by Anderson et al. (T3.3−P3). Iliev et al. (T3.3−P2) present airborne gamma spectrometry mapping, and Blanchard et al. (T3.1−P13) consider the cross-calibration of such a survey with ground based gamma ray surveys under OSI conditions.
Garrison et al. (T3.1−P32) consider the sensing of ionospheric disturbances using a large global navigation satellite system (GNSS) network. This finds application in the detection of atmospheric gravity waves or infrasound arising from a seismic event, and is discussed in more detail in SECTION 7.3.4.
The combined use of seismic shear (S) waves and geoelectric methods to investigate a remedial sink hole is described by Polgár et al. (T3.4−P6), while Lipshtat et al. (T3.5−P48) consider theoretical and experimental aspects of combining infrasound and electromagnetic data. Syirojudin et al. (T1.2−P23) consider the use of ultra-low frequency geomagnetic data to find earthquake precursors, with an application to the Sumatera region, Indonesia.
The use of gravity surveying is reported by Gadirov et al. (T1.2−P36). In this case it is applied to the analysis of tides in the Caspian Sea, but elsewhere gravity has been used for the detection of underground cavities.
Of potential relevance to CTBT verification is an initiative described by Howe et al. (T1.4−O4) to place multiple types of sensor on transoceanic commercial submarine cables (FIGURE 3.9). This is referred to as SMART – Science Monitoring and Reliable Telecommunications.
FIGURE 3.8 Topographic map showing the area of subsidence after the 6 January 2016 DPRK event determined using radar interferometry. Locations of the five nuclear tests estimated from seismological observations using relative hypocentre determination are marked in red. From Hartmann et al. (T3.3−O1).
FIGURE 3.9 Concept of a SMART cable, in which sensor packages are attached to a submarine communications cable for environmental monitoring in oceanic regions. From Howe et al. (T1.4−O4).

30 SCIENTIFIC ADVANCES IN CTBT MONITORING AND VERIFICATION 2017
3.2 MONITORING FACILITIES
3.2.1 IMS STATIONS AND LABORATORIES
Many SnT2017 contributions feature data recorded at IMS stations used for a wide variety of purposes. A selection of these presentations is referred to in this section in order to illustrate the range of uses that have been made of IMS data by SnT2017 authors.
Marty (T1.1−O4) describes the design of the IMS infrasound stations and network (FIGURE 3.10). Presentations using data from individual IMS seismic stations include a study of volcanic risk by Gutierrez Jimenez (T3.5−P47), a review by Peters et al. (T2.1−P1) of data from the eight years since the UK Eskdalemuir seismic array AS104 (EKA) was upgraded, and an investigation of events near nuclear test sites recorded at the IMS auxiliary seismic station AS060 (AKK) in Kyrgyzstan by Berezina and Sokolova (T2.5−P9). Madu and Bisallah (T1.5−P18) provide a teleseismic study of an Ecuador earthquake using IMS stations in Africa, and Mesaad and Olimat (T5.4−P15) report on the use of IMS seismic data by the Jordan Seismological Observatory.
Events detected using IMS hydroacoustic stations in the Indian Ocean are examined by Bittner et al. (T2.3−P10), and Haralabus et al. (T1.4−P2) describe the establishment of the IMS hydroacoustic station HA04 at Crozet Islands (France). Brouwer et al. (T1.4−P3) report on the range of signals detected at HA03 (Juan Fernández Island, Chile) and HA11 (Wake Island, USA), while Saceanu et al. (T1.4−P5) report on signal detections at HA08, Diego Garcia.
The installation of an IMS hydrophone station is a major undertaking. Cekada and Cummins (T1.4−P7) describe risk management and programme execution in the project to install the station HA04 in Crozet Islands, Indian Ocean.
One use of data from IMS infrasound stations is in the detection of volcanic activity. Matoza et al. (T1.1−P5) describe the automatic detecting and cataloguing of explosive volcanism, while Matos et al. (T1.1−P16) describe long range infrasound detections of volcanic activity at IS42 (I42PT) in the Azores, Portugal. Volcanic activity in Chile recorded at IS13 (I13CL) at Easter Island, and IS14 (I14CL) at Juan Fernández Island, both in Chile, is reported by De Negri et al. (T1.1−P24).
The location of microbaroms detected by IS17 (I17CI) and IS11 (I11CV) is reported by Kouassi et al. (T1.1−P15), and Koch and Pilger. (T1.1−P8) describe detections at two IMS stations in the vicinity of the Democratic People’s Republic of Korea (DPRK) nuclear test site.
Wind noise reduction is an important topic in the context of infrasound stations. Problems with the wind noise reduction system of the IMS infrasound station IS48 (I48TN), Tunisia, and its mitigation are described by Friha (T4.1−P22), and Kramer and Marty (T3.1−P41) describe wind noise reduction systems at IMS infrasound stations in general.
Data from IMS radionuclide stations are also used for a wide variety of purposes. Atmospheric radioactivity monitoring following the Fukushima Daiichi nuclear power plant accident in Japan is reported by Watt and Kalinowski (T1.5−P19). Al-Qadeeri et al. (T1.3−P21)
FIGURE 3.10 Status of the IMS infrasound network in June 2017. Stations certified, installed, under construction and planned are shown in green, blue, orange and red respectively. From Marty (T1.1−O4).

SECTION 3 — DATA ACQUISITION 31
report on sources and concentrations of caesium-137 in Kuwait.
Nadalut and Plenteda (T3.1−P22) describe the implementation of new technologies at IMS radionuclide particulate stations, and Seibert et al. (T4.1−P17) consider the quality of meteorological data that are recorded as ancillary data at IMS radionuclide stations. dela Cruz et al. (T4.1−P7) describe the establishment of a radioactivity database in the Philippines, and emphasize the contribution of IMS radionuclide station RN52
(PHP52). Nava et al. (T4.1−P21) describe the quality control programme of the IMS radionuclide network in general.
Rulev (T4.1−P23) describes the thermal insulation system and automatically heated air sampler for IMS radionuclide stations, including RN61 (RUP61) in Dubna, Russian Federation. Ferro and Pantín (T5.4−O2) describe the operation of IMS stations RN01 (ARP01) and RN03 (ARP03) (FIGURE 3.11) in Argentina, and the plans to install station RN02 (ARP02).
FIGURE 3.11 IMS radionuclide stations installed in Argentina. RN01 (ARP01) Buenos Aires (top and middle), and RN03 (ARP03) Bariloche (bottom). From Ferro and Pantín (T5.4−O2).

32 SCIENTIFIC ADVANCES IN CTBT MONITORING AND VERIFICATION 2017
The IMS network includes radionuclide laboratories, and the laboratory analysis of radioactive xenon samples in support of the IMS is described by Douysset et al. (T3.2−P4). Buhmann et al. (T4.1−P6) describe problems related to the analysis of low activity samples and IMS radionuclide laboratories.
Necmioglu et al. (T4.1−P19) describe the IMS stations operated by the National Data Centre (NDC) of Turkey, while Erkan (T3.5−P24) presents a study of the seismic background noise at the Turkey IMS station PS43 (BRTR). Kentuo et al. (T5.4−P12) describe the IMS stations in Papua New Guinea, and their benefits to the local and regional monitoring systems of that country.
3.2.2 NON-IMS STATIONS AND NETWORKS
Many seismic networks were well established long before the IMS, whereas the hydroacoustic, infrasound and radionuclide networks have no previous analogues as global networks. In the context of CTBT verification, non-IMS stations and networks may be valuable in offering additional evidence of potentially suspicious events, in the form of national technical means. The many non-IMS stations and networks that appear in SnT2017 presentations are used in a wide range of applications. Most of the cited contributions are also referred to in appropriate sections elsewhere in this report.
Beginning with seismological stations and networks, the national network of Kazakhstan and its applications are described by Sokolova (T1.2−P24), and Mikhailova (T1.5−P7) presents results from data recorded by Kazakhstan seismic arrays. The seismicity of the former Semipalatinsk nuclear test site in Kazakhstan is described by Mikhailova et al. (T1.5−P15). The recording of events in the DPRK nuclear test site by the facilities of the Main Center of Special Monitoring, Russian Federation, is described by Kolesnykov et al. (T2.1−P14). The integrated use of IMS and non-IMS seismic stations is described by Villalobos Villalobos and Quintero Quintero (T3.6−P4), referring to the Observatorio Vulcanológico y Sismológico de Costa Rica (OVSICORI) network in Costa Rica.
Kysel et al. (T2.5−P5) report on nuclear tests recorded by the seismic stations of the Slovak Academy of Sciences, while Gok et al. (T3.5−P39) describe seismic monitoring using arrays in the Middle East. In South America Gomez Gomez et al. (T3.1−P12) describe the seismograph network of Colombia. In Africa, an earthquake in South Sudan on 20 May 1990 is studied by Mulwa and Kimata
(T1.5−P16), and the Malawi seismic network from 1900 is described by Mphepo (T5.4−P16). In a general context, Burk and Mackey (T3.1−P24) emphasize the need to improve the accuracy of metadata (such as calibration parameters) for seismic networks.
Kanao et al. (T1.1−P13) locate the source of infrasound signals recorded at a temporary array deployed in East Antarctica in 2015, and Czanik and Bondar (T1.1−P23) describe a new infrasound array in Hungary. Pilger et al. (T1.1−P7) describe the detection and interpretation of signals recorded at infrasound stations in Germany.
Few presentations refer to non-IMS radionuclide stations. Nugraha et al. (T1.5−P9) describe the profile of radionuclide particulate monitoring in Indonesia.
The Dense Ocean-floor Network System for Earthquakes and Tsunamis (DONET) seafloor observatory network off Japan incorporates many sensor types. Its modular design architecture is described by Kaneda and Kawaguchi (T1.4−O3), while Kaneda et al. (T1.4−O6) report simulation research for earthquake and tsunami hazard mitigation. The installation of sensors on transoceanic telecommunications cables is proposed by Rowe et al. (T1.2−P21).
3.3 STRATEGIES FOR ON-SITE INSPECTION
3.3.1 GENERAL
The conduct of OSIs under the CTBT is governed by the Treaty and the draft OSI Operational Manual, which impose strict limitations on the technologies to be used and the manner in which they are deployed, as well as upon the timescale of the inspection, the number of inspectors and related matters. Many strategic questions arise in the development of OSI capabilities. There are questions concerning the optimization of the OSI inspection itself but, while the capabilities are still being developed and refined, there are many more questions on the conduct of field exercises and tabletop exercises, and the development and testing of realistic scenarios in ways that will maximize the benefits for OSI after entry into force. These questions are not only scientific and logistical, but also concern the conduct of meetings of the CTBTO Executive Council that will be the focus of decision making leading up to and during an OSI.

SECTION 3 — DATA ACQUISITION 33
The SnT2015 conference benefitted from a large number of presentations on the 2014 OSI field exercise in Jordan (IFE14). Much practical experience was gained during this exercise that could inform further preparation for OSI readiness after entry into force of the Treaty. Many presentations at SnT2017 address issues that arose during IFE14 as requiring improvement, or changes in OSI equipment, procedures or supporting software and analysis tools. MacLeod et al. (T2.2−P10) revisit the OSI concept of operations in the light of IFE14 and inspection team functionality.
There are many other general issues that are not related to a specific technology. Palmer and Stevanovic (T3.5−P1) address the challenges of displaying geotechnical information in three dimensional environments, while Stevanovic and Palmer (T3.5−P8) contrast three dimensional visualization of different OSI data types with more standard two dimensional representations. Options for visualizing the technical data generated during an OSI are also investigated by Stevanovic and Palmer (T3.6−O2), and Palmer and Stevanovic (T3.5−O4) consider the integration of OSI data into an active three dimensional environment to aid inspection activities.
Some presentations consider strategies using technologies not falling under SECTIONS 3.3.2 to 3.3.5. Rowlands et al. (T3.3−P4) consider the integration of time series radar imagery, used to detect OSI-relevant features and Polgár et al. (T3.4−P6) consider the use of geoelectric methods. Limitations on time and staff complement impose a need for fast and efficient data acquisition, and Kreek and Trombino (T3.1−P29) consider the use of a carborne survey instrument developed for CTBTO under a contribution in kind from the USA.
Current investigations of former nuclear test sites can provide valuable information for the development of OSI capabilities. Sussman et al. (T3.3−P8) present subsurface, surface and remote observations of former nuclear test sites, and Suprunov et al. (T2.5−P8) present work on potentially dangerous objects at the former Soviet test site at Semipalatinsk, Kazakhstan. Dovbysh (T2.5−P10) discusses the sites of nuclear tests in the Ukraine during the period 1972 to 1979.
A suspicious event under the Treaty, once located and identified, needs to be attributed to a State if further action is to be contemplated. Particular difficulties arise if the event occurs outside the jurisdiction of any one State, for example in or above an ocean. Such a situation poses not only special technical and logistical challenges for the conduct of a successful OSI, but also challenges for attribution. Moore (T2.1−O4) considers the CTBTO
response to an underwater or surface nuclear test in international waters.
OSI is normally thought of as a means to confirm the nature of a suspicious event that has been identified using available global monitoring methods. de Silva (T5.1−O2) considers the comparative roles of global verification and on-site verification, and de Silva (T2.2−O3) considers how events can indeed be characterized through OSI.
3.3.2 SEISMIC
The Seismic Aftershock Monitoring System (SAMS) is the passive seismic system developed for use by CTBTO during OSI for recording any aftershocks or other seismic activity that may follow an underground nuclear test. The system has been under continuous development, and Walter et al. (T3.4−P9) describe recent software functionality enhancements. Kriegerowski et al. (T3.4−O3) describe new insights into the seismicity of the Dead Sea transform fault obtained from the SAMS recordings made during IFE14.
Active seismological studies are aimed at detecting and identifying subsurface cavities or other structures relevant to an OSI. Bujdosó et al. (T3.4−P5) report experiments to record and process shear (S) wave data above a tunnel, and Polgár et al. (T3.4−P6) investigate a remediated sink hole with S-wave and geoelectric methods. Abbott et al. (T2.2−P5) consider the geophysical imaging of an uncollapsed nuclear test. Seismic signatures of underground nuclear tests at the former Semipalatinsk nuclear test site, Kazakhstan, for OSI purposes are presented by Belyashov et al. (T2.2−P11). Yassin et al. (T3.4−P4) use refraction profiles to determine soil characteristics in the Atbara area of Sudan.
Some papers present studies related to resonance seismometry. Theoretical studies including numerical simulations are aimed at investigating the detectability of specific features related to the presence of observables derived from an underground nuclear explosion. Moczo et al. (T3.4−O1) present numerical modelling of the effects of the cavity, rubble zone or fracture zone on the seismic wavefield, for the purpose of developing resonance seismometry for OSI. Esterhazy et al. (T3.4−O2) present numerical results designed to understand seismic wave propagation inside and around an underground cavity. Schneider et al. (T3.4−P8) describe the purpose of resonance seismometry, in particular in detecting resonances resulting from the reverberation of seismic

34 SCIENTIFIC ADVANCES IN CTBT MONITORING AND VERIFICATION 2017
waves within an underground cavity. Woodward et al. (T3.1−O6) consider strategies for recording the full seismic wavefield at close distances.
3.3.3 RADIONUCLIDE
The central aim of radionuclide measurement during an OSI is the location and identification of any nuclear explosion. The gathering of subsurface and airborne radionuclide evidence during an OSI requires a strategy for narrowing down the search areas and selecting sampling sites, together with methodologies and procedures for sampling. Samples must then be analysed in a mobile radionuclide laboratory located in the field area, with capabilities for both particulate and noble gas sample analysis.
Authors present several instruments tailored to the special needs of OSI handheld, airborne, subsurface or autonomous sampling. Saull et al. (T3.1−O4) describe the SCoTSS gamma-ray imager for OSI, and Lee Zhi Yi et al. (T2.2−P1) present a standardized and accurate sampling device for OSI and other verification purposes designed to be used after a nuclear incident. Kettunen and Heininen (T3.1−P39) propose unmanned radionuclide measurements taken on a UAV, and suggest a measurement system appropriate for this application. Kaiser et al. (T3.3−P9) also consider UAV-based mobile gamma ray spectrometry. Rizzo et al. (T2.2−P8) describe the measurement of carbon dioxide and stable isotopes to support OSI subsurface gas sampling.
The development of a field-portable argon-37 monitoring capability (FIGURE 3.12) is presented by Hayes (T3.1−P18). Bearing in mind that OSI gamma
ray surveys may be both ground based and airborne, Blanchard et al. (T3.1−P13) consider their cross-calibration under OSI conditions. Pakhomov (T3.2−O2) presents the mobile sampling and measurement system Subsoil Liquefied Argon Scintillations (SLARS) (FIGURE 3.13).
Florido et al. (T3.1−O1) present a detector design concept that uses multiple elements to sample different solid angles, thus creating a map of observations without the need for a traditional ‘gamma camera’, that is unsuitable for field applications. This is referred to as a gamma ‘viewfinder’.
CLYC detectors, so named because the scintillation material incorporates caesium, lithium, yttrium and chlorine, allow detection of both gamma rays and neutrons, and offer the potential to develop small, efficient handheld detectors. Köble et al. (T3.1−P11) consider their application to OSI.
Mobile laboratories for radionuclide sample analysis in the field have special requirements to ensure reliability, portability, power and stand-alone capabilities. Dubasov et al. (T3.2−O1) describe a mobile laboratory for the analysis of noble gas radioactive isotopes in atmospheric air (FIGURE 3.14). Salvi et al. (T3.2−P6) present tests of an HPGe detector for use in a stand-alone configuration suitable for a OSI laboratory, and consider the provision of dedicated shielding to reduce radionuclide background. Friese and Pierson (T2.2−P9) analyse various OSI laboratory detector responses.
The Treaty requires that OSI activities be limited to the specific task of investigating whether a Treaty violation may have occurred8. This raises the question of whether information on radioisotopes not relevant to CTBT verification should be made invisible to OSI inspectors. Caffrey et al. (T3.1−P34) present system tests of OSIRIS, a spectrum-blind gamma ray spectrometer that could be used for OSI. Aviv (T2.2−O1) also presents a method of applying measurement restrictions to an HPGe detector for the purpose of OSI.
Location and identification of the site of an underground nuclear test from OSI radionuclide observations may not be straightforward, and would depend strongly upon the migration pathways of radionuclides from the emplacement site to the surface. Ustselemov et al. (T2.2−O4) describe an express method of identifying an explosion induced radionuclide seepage area during an OSI. Carrigan et al. (T2.2−P3) discuss the possibility of a delayed telltale signature of an underground nuclear explosion observed at a remote
FIGURE 3.12 Field-portable argon-37 equipment - gas processing stages. From Hayes (T3.1−P18).

SECTION 3 — DATA ACQUISITION 35
FIGURE 3.13 Schematic of the sampling component of the SLARS mobile sampling and measuring system for subsurface argon. Sampling is based on short-cycle pressure swing adsorption, with tandem elements (2), (4), (5) and (15) working alternately. A subsoil air sample is pumped by the compressor (1) to gas holder (2), and by means of the compressor (3) moves to one set of dividing columns (4) and (5). Column (4), volume 15 litres, is filled with NaX zeolite. Column (5), 5 litres, is filled with a carbon molecular sieve, and is initially disconnected from column (4). After filling under the required pressure, (4) is connected to (5). The working cycle of (5) is connected to a buffer reservoir (6). The compressor (7) pumps the argon fraction to the receiving cylinder (8). After the cycle is completed (4) and (5) are regenerated by means of the pump (15). Products of regeneration are accumulated in the opposite gas holder (2) for repeated processing. 100 litres of air are processed in each 1-minute cycle, and 20 working cycles are typical. As the efficiency of extraction is not high, the processing is repeated several times, resulting in an argon concentration of about 60%. The raw argon is pumped from the storage cylinder (8) by compressor (9) into the chemical absorbers of nitrogen (10) and of oxygen (11). Further purification is achieved with the purification device (12). The resulting argon sample, with less than 1ppm impurities, is pumped by the compressor (13) into the final storage cylinder (14). From Pakhomov (T3.2−O2).
FIGURE 3.14 The Mobile Russian Installation for Noble Gas Analysis. Sampling and processing unit (top left); portable chromatograph (top right); beta-gamma spectrometers using HPGe detector (bottom left) and sodium iodide NaI(Tl) detector (bottom right). From Dubasov et al. (T3.2−O1).

36 SCIENTIFIC ADVANCES IN CTBT MONITORING AND VERIFICATION 2017
location. Gamma ray imaging for the assessment of radiation source distributions in OSI is considered by Kreek and Burks (T2.2−O5).
Legacy examples of radionuclide observations following a nuclear test may be of value in developing OSI capability. Milbrath and Burnett (T2.5−O1) consider the interpretation of radionuclide observations from the Platte underground nuclear test at the former US nuclear test site in Nevada on 14 April 1962. Pitois et al. (T2.2−P2) describe analytical procedures developed by the International Atomic Energy Agency’s (IAEA) network of Analytical Laboratories for the Measurement of Environmental Radioactivity (ALMERA) that may be applicable to the characterization of legacy nuclear test sites.
The training of OSI inspectors will require a major and continuing effort, especially considering the formal requirements that are imposed by the Treaty and draft OSI Operational Manual. Kreek et al. (T3.1−P37) describe a radiological field training simulator for radiation detection training which does not involve the use of radioactive sources.
3.3.4 REMOTE IMAGERY
In the CTBTO context, remotely acquired data from satellite platforms are usually thought of as providing support for OSI, while airborne platforms may be used during an OSI to carry OSI-relevant sensors. In terms of satellite-based sensors there is also the potential for remote imagery to assist directly in locating ground displacements and mass movements triggered by shallow seismic events. For example, remote radar interferometry (DInSAR) has been used in the past to identify surface displacement associated with large earthquakes, and Hartmann et al. (T3.3−O1) report a 10 cm persistent surface displacement associated with the 6 January 2016 DPRK announced nuclear test, observed using DInSAR. Also using radar data, Rowlands et al. (T3.3−P4) report on the detection of OSI-relevant features using time series radar imagery. As well as static data, the acquisition and processing of remotely acquired satellite-borne video is reported by Rutkowski et al. (T3.3−O2).
While the application of optical remote sensing can be from an airborne platform as reported by Anderson et al. (T3.3−P3), such data can also be acquired by handheld snapshot hyperspectral imaging sensors, as described by Jung et al. (T3.1−P33). The application of airborne gamma spectrometry mapping during an OSI is discussed by Iliev et al. (T3.3−P2).
As well as data acquisition and processing, the visualization of spatial data was discussed. Stevanovic and Palmer (T3.5−P8) describe contrasting three dimensional visualization of different OSI data types against standard two dimensional representations. Experience from the IAEA of a system in which the inspected State provides geographical information system (GIS) data for integration into an inspection dataset is provided by Rutkowski et al. (T3.3−P7).
3.3.5 DRILLING
Drilling for radioactive samples during an OSI could potentially provide irrefutable evidence of a nuclear explosion having taken place. At any time during an inspection, the inspection team may submit a proposal to conduct drilling to the Executive Council through the Director-General, as provided for under the Treaty9. So provision for such drilling will need to be included under the OSI umbrella.
Moreover, the challenges posed by OSI drilling to safely recover relevant radiological samples from an underground nuclear explosion are considerable. Some of these were addressed in SnT2015 sessions, when there was a particular emphasis on OSI as a result of the IFE14 that had been conducted the previous year. It was emphasized then, that this type of drilling was not a routine industrial activity, and so would need extensive dedicated preparation. The main point of reference is an expert meeting on Drilling and Subsoil Sampling that was held during November 2011 in Edinburgh, UK, where the development and implementation of drilling in the framework of an OSI were discussed (CTBT/PTS/INF.1166). No further presentations on OSI drilling were offered in SnT2017 and readers are referred to the SnT2015 report7 for contributions in this field to the SnT process.
SECTION 4 — DATA TRANSMISSION, STORAGE AND FORMAT 37
4DataTransmission,StorageandFormat
The management of data, once recorded, covers a range of specialized fields that are included in SECTION 4. This focuses on the handling of verification data from the time it is recorded, through data transmission, to data archiving and data access. This includes data formats, data authentication, data encryption (not envisaged for IMS data), data surety and data security.
One indication of the importance of data transmission in the CTBTO verification regime is its Global Communications Infrastructure (GCI), whose role in providing secure near real time data transmission from IMS stations or NDCs to the IDC in Vienna is enshrined in the Treaty. Since the Treaty was negotiated, fundamental changes in the technologies and costs of data transmission have been
accompanied by conceptual changes in the options for mass data storage and retrieval, with a tendency towards having massive volumes of data available in the data processing environment. This may point towards a need for more emphasis on such topics in the future, as discussed in SECTION 11.
The transmission and storage of OSI data is another aspect of data management covered in SECTION 4. Although there has been a tendency towards the central processing of field data over the last decade, limitations on how and where OSI data are processed are imposed by the Treaty10.
Data platforms and data centres external to the CTBT verification system and the Treaty provisions are considered in SECTION 9.4 under data sharing.
INTRODUCTION

38 SCIENTIFIC ADVANCES IN CTBT MONITORING AND VERIFICATION 2017
4.1 DATA TRANSMISSION
It is perhaps paradoxical that, although the Treaty imposes challenging requirements for the prompt, secure and reliable transmission of data from a global network of facilities, presentations in this field have been few in number at all the SnT conferences. The GCI, as the platform for IMS data communication, has been a major component of the CTBTO infrastructure since its inception.
Here, Shah and Shah (T3.1−P10) explore the potential for autonomous sensors that comes with real time data connection via satellite that the GCI offers. Shah (T4.1−O5) considers economies that can be made by reducing data redundancy and by selecting for transmission only those features of (especially waveform) data that are of relevance to subsequent processing. Although the Treaty imposes requirements for the retention of IMS data unmodified, contributions such as this help to show the kind of efficiencies that might be feasible in appropriate circumstances.
4.2 DATA FORMATS
The challenge posed by the increasing volume and diversity of data and messages associated with the IMS and transmitted over the GCI is considered by Laban et al. (T4.1−P25). They propose a new approach using unified data distribution. They present a framework designed to optimize reliability and performance, while retaining the necessary flexibility to cope with the full range of IMS requirements.

SECTION 5 — DATA PROCESSING AND SYNTHESIS 39
5 DataProcessingandSynthesis
INTRODUCTION
Once data have been acquired, transmitted to a processing centre and stored, a data processing stage normally follows. Accordingly, SECTION 5 is concerned with the processing of data in order to retrieve the maximum useful information, and to present the data in a form suitable for interpretation. Such processing of data includes methods specific to one type of data, whether or not it is used in the CTBTO verification regime, as well as methods used to combine data from different ‘technologies’, for example seismic and infrasound. Combining different types of data, either at the processing or interpretation stage, is called ‘data fusion’ in the CTBT verification community. Also included is the processing of the many types of data that may be acquired during an OSI.
The processing of seismoacoustic waveform data includes methods for the detection of signals, for associating signals that are common to each event, for the location of events, and for the determination of event parameters such as magnitude. Also included are methods for determining event characterization parameters that are used for interpretation. Some methods may combine or eliminate some of these conventional data-processing steps, or indeed they may approach the whole problem in some other way.
The processing of radionuclide observations includes the identification of energy peaks and their associated radionuclides in gamma ray spectra, together with their concentrations, and any calculation of their ratios.
The process of ‘event screening’, which is defined in the Treaty as the use of approved methods to identify events of natural or non-nuclear manmade (anthropogenic) origin11, is part of interpretation, so is considered in SECTION 7. This applies both to event screening used for events located using seismic, hydroacoustic and infrasound data, and to the methods used to categorize radionuclide spectra according to the presence or absence of
CTBT-relevant radionuclides; such activities are considered part of interpretation.
Most data processing is computer based and performed automatically. A crucial component of the preparation of seismoacoustic event lists and the processing of radionuclide spectra at the CTBTO is interactive analysis by expert analysts; this is conventionally referred to as data analysis, and is included in SECTION 5 together with data processing.
The processing of verification data, as well as its interpretation, rely in many ways upon knowledge of the structure of the earth, its oceans and its atmosphere. For example, the location of events within the earth relies upon the seismic wave-speed field; the location of events in the atmosphere relies upon the acoustic wave-speed field in the atmosphere, and mapping the source of an atmospheric radionuclide observation requires knowledge of atmospheric transport. These requirements apply equally to the global scale, applicable to IMS data, and to the local scale for OSI data. Studies that investigate properties of the earth, either in support of the processing or interpretation of verification data, or for other purposes, are covered in SECTION 6.
Atmospheric transport is an example of a property that varies widely from timescales of hours to seasons. Although studies of atmospheric dynamics are included in SECTION 6 as a property of the earth, the use of atmospheric transport modelling (ATM) to investigate any specific radionuclide observations is classed as interpretation, and so is included in SECTION 7.
Ambient background and noise, such as microseismic noise, microbarometric noise and radionuclide background, arise from a combination of earth properties and anthropogenic effects. They relate to the detectability and performance of verification methods, so are covered in SECTION 8.

40 SCIENTIFIC ADVANCES IN CTBT MONITORING AND VERIFICATION 2017
5.1 CREATING SEISMOACOUSTIC EVENT LISTS
5.1.1 INTRODUCTION
An initiative is being pursued to replace the waveform processing and analysis software used at the IDC. This covers the processing of seismic, hydroacoustic and infrasound data as well as software supporting data transmission, storage and other functions necessary for the management of waveform data. This project is referred to as ‘IDC re-engineering’. The current Phase 2 of this project is outlined by Breitenfellner et al. (T3.5−P46) (FIGURE 5.1), and the software architecture and data model are described by Breitenfellner et al. (T3.5−P22). Improvements to the interface for interactive analysis planned for the IDC re-engineering are presented by Brown et al. (T3.5−P21).
Two other presentations relate to data processing in all three waveform technologies. First results from a new automatic signal association algorithm are presented
by Kushida et al. (T3.5−P26) (FIGURE 5.2). Sucic et al. (T3.7−P7) describe a method for detecting and representing waveform signals, and for removing artefacts from these signals.
5.1.2 EVENTS FROM SEISMIC DATA
The cross-correlation of seismic signals has emerged as a strong focus of attempts to improve the detection and association of seismic signals, and the estimation of event location and depth. A variety of approaches has been used to address several different problems. Given that both automatic processing and analyst review are challenged by the plethora of signals during aftershock sequences, the expected similarity of signals recorded from closely spaced events lends itself to the application of cross-correlation methods. Kitov et al. (T3.5−P19) describe methods designed to find aftershock signals using waveform cross-correlation. Kværna and Gibbons (T3.5−O9) propose additional strategies for coping with large aftershock sequences.
FIGURE 5.1 Software development steps used in IDC re-engineering Phase 2 and future Phase 3. System requirements: declarative statements describing system requirements. System specs: similar to system requirements, but more complete and formally correct. Use case model: full use case descriptions, starting with architecturally significant ones. Analysis model (data model): abstract classes that identify major objects in the system, together with attributes and relationships. Use case realizations: analysis classes and how they interact to enable the system to support the functionality specified in the use cases. System architecture: captures the general principles used throughout the design of the system; serves as a guide for further development. In addition, component interface specifications specify the software interfaces between major components of the system. Main dependencies between elements are shown in red. From Breitenfellner et al. (T3.5−P46).

SECTION 5 — DATA PROCESSING AND SYNTHESIS 41
More generally, the waveforms of signals recorded at a particular station from two events at almost the same location may be expected to be similar. Waveform templates may be established as a starting point for searching continuous waveforms for appropriate detections. Sergeev et al. (T3.5−O10) present work on the selection and preparation of waveform templates for the detection of signals by cross-correlation. Master events may be defined against which to seek additional detections. Rozhkov and Kitov (T3.5−P20) describe work on the design of master events for use with cross-correlation algorithms. Cross-correlation has also been used by Kitov and Rozhkov (T4.1−O2) to assess the consistency, quality and completeness of the IDC Reviewed Event Bulletin (REB). In another presentation focused on the REB, Kitov et al. (T3.7−P6) address the
automatic identification of repeated industrial seismicity in that bulletin.
At regional distances, in an application to high seismicity regions of east Asia, Schaff et al. (T3.7−O2) (FIGURE 5.3) use cross-correlation of the Lg phase, and Ben Horin et al. (T3.7−P12) use waveform cross-correlation for the detection, relative location and magnitude estimation of repeated mining blasts in the Eshidiya phosphate mine, Jordan. Sundermier et al. (T3.7−P4) apply cross-correlation to regional monitoring in eastern Asia.
Studies of the DPRK announced nuclear tests have also been made using cross-correlation. Kitov et al. (T2.1−P3) compute the absolute and relative location of
FIGURE 5.2 Above: Scheme to allow analysts to select those events automatically built by NET-VISA, in addition to those offered by the current automatic Standard Event List SEL3. All reviewed events are saved to the analyst work area referred to as the Late Event Bulletin (LEB). Left: Venn diagram showing NET-VISA-only events (yellow) and events also in SEL3 (red). Events in the LEB that are not derived from either SEL3 or NET-VISA are those that have been added by analysts. From Kushida et al. (T3.5−P26).

42 SCIENTIFIC ADVANCES IN CTBT MONITORING AND VERIFICATION 2017
five such events, and Kitov et al. (T2.1−P2) determine absolute and relative body-wave magnitudes for these events.
The measurement of amplitude, and its use to determine earthquake magnitude, after applying appropriate corrections for the seismic travel path, has resulted in many schemes to apply corrections to improve the consistency of magnitude estimates. Radzyner et al. (T1.2−P3) describe a scheme to improve magnitudes with station specific correction terms and Phillips et al. (T1.2−O5) consider the prediction of the amplitudes of local and regional seismic phases.
The use of cepstral processing, in particular to determine more accurate focal depths, is the subject of several presentations. Kemerait and Tibuleac (T3.5−P44) describe the benefits of using regional seismic data at high sampling rate for determining the depths of shallow events, and Tibuleac et al. (T3.5−O5) describe metrics for an algorithm to determine focal depth using cepstra. The identification of surface reflections from shallow low magnitude explosions using a cepstral method is presented by Saikia et al. (T3.5−P43). Kemerait et al. (T3.7−P9) describe enhancements to cepstral methods for the improved processing of seismic data.
The location of seismic events is the subject of several other presentations. Wilkins et al. (T3.5−P42) describe static corrections to improve the detection, location and the measurement of seismic discriminants at IMS seismic
arrays, and Gibbons et al. (T2.1−O11) describe source array analysis for accurate event location at the DPRK nuclear test site. Aguiar Moya and Myers (T1.2−P22) present improved seismic travel times in central and northern Costa Rica for accurate earthquake location.
Procedures to improve seismic wave-speed estimates in order to improve event location often employ ground truth events, whose location and origin time are accurately known. Karasozen et al. (T1.2−P2) describe a framework of ground truth event locations in Iran using a multi-event location approach. A ground truth procedure to improve the locations, wave-speed model and focal mechanism bulletin for Bolivia is described by Fernandez and Ryan (T1.2−P19). A procedure to determine the local stress state and relative locations of small earthquakes in the Sea of Marmara is presented by Korkusuz Öztürk (T1.2−P33).
Computation of synthetic seismograms finds many applications in the interpretation of seismic waveforms, especially to determine seismic source parameters and complex effects of the medium through which the seismic waves pass. Tsuboi et al. (T1.2−P35) present synthetic seismograms of explosive sources calculated by the earth simulator system of the Japan Agency for Marine-Earth Science and Technology (JAMSTEC). Gholami (T1.2−P4) presents a method for the near source modelling of seismic waves from earthquakes, and Rabin et al. (T3.7−P10) present non-linear kernel methods for seismic event characterization. Bregman et al. (T3.7−P3) apply diffusion maps to the problem of seismic event characterization in Israel.
The IMS primary seismic network consists mainly of seismic arrays, offering reliable directional information (azimuth and slowness) on incoming signals, and consequently an ability to determine a single station location as a starting point in the process of determining the optimum event location. Another way of determining the direction of a signal arriving at a station is from polarization analysis; indeed this is the only way for a single three component station. Polarization analysis is generally far less precise or reliable than array processing, while polarization analysis is not possible with arrays that have only vertical component seismometers. Labonne et al. (T3.5−O11) propose joint array and polarisation processing for both IMS three component stations and arrays.
Network Vertically Integrated Seismic Analysis (NET-VISA) is a new waveform data processing method that has been evolving for several years as a potential replacement to the conventional processing pipeline
FIGURE 5.3 Aftershocks of the Wenchuan (China) earthquake of 12 May 2008 detected and located using cross-correlation methods on data from a composite regional seismic network. Light grey segments indicate events also in the LEB of IDC. (The LEB contains all analyst reviewed events, including any that have been reviewed that do not meet the event definition criteria for the Reviewed Event Bulletin (REB).) From Schaff et al. (T3.7−O2).

SECTION 5 — DATA PROCESSING AND SYNTHESIS 43
currently used for waveform data. Bondar et al. (T1.2−O3) evaluate the performance of NET-VISA signal association and event location, using travel times with source-specific station corrections (SSSCs) determined from the regional seismic travel time (RSTT) model.
NET-VISA starts from a list of signal detections. A further evolution of the method, Signal Vertically Integrated Seismic Analysis (SIG-VISA), operates on the full waveforms to perform signal detection. Moore et al. (T3.5−O3) present initial evaluations of SIG-VISA.
The application of various processing methods to the DPRK announced nuclear tests is the subject of several presentations. Kim (T2.1−P7) estimates the relative depth and yield of the 12 February 2013 and 6 January 2016 announced DPRK nuclear tests, while Fang (T2.5−P11) attempts to establish the precise location of the 9 September 2016 DPRK announced nuclear test. Accurate depth estimates of the DPRK announced nuclear tests using regional and teleseismic arrays are presented by Kim et al. (T2.1−O1). Jo et al. (T2.1−O5) present work on the detection and discrimination of small earthquakes and explosions near the DPRK nuclear test site, and
FIGURE 5.4 Schematic flow chart of seismic data processing at the USGS National Earthquake Information Center. Grey arrows on the left indicate inputs from acquisition. Pale blue arrows on the right indicate outputs to products and services. From Benz et al. (T3.5−P7).

44 SCIENTIFIC ADVANCES IN CTBT MONITORING AND VERIFICATION 2017
Park et al. (T2.1−O2) analyse regional seismic and infrasound data from five of the six DPRK announced nuclear tests.
Seismic data processing follows the same principles in the OSI context, but with some different issues to address. Enhancements to the software used to process the CTBTO’s SAMS are described by Walter et al. (T3.4−P9), while Moczo et al. (T3.4−O1) describe finite difference modelling applied to the analysis of seismic wavefields in the OSI context.
Some presentations discuss various alternative approaches to the processing of IMS seismic data to generate a global bulletin of seismic events. The CTBTO requirement is unique in that it must monitor globally without intentional geographic bias, while it also needs to detect small events. Other agencies that produce bulletins of seismic events either focus on large events globally, or are national or regional agencies that include smaller events over a defined geographic region only. Benz et al. (T3.5−P7) describe developments in data processing for comprehensive seismic monitoring at the US Geological Survey (USGS) (FIGURE 5.4). Johnson et al. (T3.5−P15) describe methods for distributed seismic event detection that are associated with a USGS initiative.Pearce and Kitov (T3.5−P30) point out that negative evidence is seldom used in seismic data processing, and that negative evidence (in particular the absence of a signal) can provide strong evidence against the preferred event hypothesis that results from automatic processing, and may offer an alternative hypothesis more consistent with the data.
Larsen et al. (T5.4−O3) focus on the benefits of synergy between IMS data and local data for detection and verification. Carvalho and Barros (T1.2−O8) consider the determination of focal mechanisms in the absence of a well-determined wave-speed model, and propose a method using the inversion of waveform envelopes. Shah (T1.5−P5) applies pattern informatics to global seismological data in support of disaster prediction.
Although most presentations on seismic data processing focus on automatic processing, Pearce and Edwald (T3.5−P51) point out that the visual interface between seismic analyst and seismogram has hardly changed in concept since analysts made measurements on the earliest paper seismograms. These authors suggest several major ways in which the interactive environment could be changed to promote the more efficient and consistent review of waveform data and of automatically generated event lists.
5.1.3 EVENTS FROM HYDROACOUSTIC DATA
The IMS hydroacoustic network is primarily intended to detect and locate Treaty-relevant events in the oceans. However, most signals recorded at IMS hydroacoustic stations that appear in IDC standard products are T phases recorded from earthquakes; there are few in-water events built by multiple detections at IMS hydroacoustic stations. No contributions in SnT2017 directly address the processing of hydroacoustic data to build in-water events.
5.1.4 EVENTS FROM INFRASOUND DATA
The conventional waveform processing ‘pipeline’ comprising signal detection, signal association and event location has been the standard method to process infrasound data to form events, as it has been for seismic and hydroacoustic data. Although alternatives to this are beginning to emerge, improvement of the standard pipeline processing continues. Mialle et al. (T1.1−P9) describe advances in global infrasound signal association at the IDC, and the measurement of its performance. The outcome of this processing, after analyst review, is the REB. Kebede et al. (T1.1−P2) assess infrasound events in the REB for the year 2016 and Nippress and Green (T3.5−P16) focus on the evaluation of clusters of infrasound arrivals in west Eurasia (FIGURE 5.5) that contribute to REB events. An open source infrasonic ray tracing tool, referred to as InfraGA/GEOAc, is described by Whitaker and Blom (T1.1−P12).
The detection of infrasound from earthquakes has been a focus of attention as experience has been gained from the IMS infrasound network. Campus et al. (T1.1−P6) present comparative near-field and far-field studies made using IMS infrasound data. Madu et al. (T3.6−P3) report on infrasound detections of earthquakes in Chile. There is a wide variety of sources of infrasound signals, and some of these are still not well understood. Kanao et al. (T1.1−P13) consider infrasound signals and their source location determined using a temporary infrasound array deployment in the Lützow-Holm Bay, east Antarctica, in 2015. Infrasound signals from volcanoes can be applied to the identification of ash cloud hazards to aviation, and Mialle et al. (T1.1−P1) describe advances in the volcanic parameter system with infrasound data.
As used in seismology, ground truth events whose location and origin time are accurately known, are valuable in helping to determine ray path characteristics,

SECTION 5 — DATA PROCESSING AND SYNTHESIS 45
FIGURE 5.5 Maps of all infrasound only events in the REB in the European region between 2010 and 2015, shown in blue. (a) to (d) each identify a cluster of these events within a green box. IMS infrasound stations are shown as circles (colour coded by station according to the bar on the right) with radius proportional to the number of contributing arrivals from the chosen cluster (see yellow legends for value ranges). Graphs show back-azimuth of these arrivals plotted against time. From Nippress and Green (T3.5−P16).

46 SCIENTIFIC ADVANCES IN CTBT MONITORING AND VERIFICATION 2017
in particular the acoustic wave-speed profile. Millet et al. (T1.1−O1) describe a method to calibrate ground-truth events using a Bayesian approach.
A major source of noise on infrasound recording is microbaroms. The location of microbaroms recorded at the IMS infrasound stations IS11 (I11CV), Cape Verde, and IS17 (I17CI), Côte d’Ivoire, is presented by Kouassi et al. (T1.1−P15).
5.1.5 FUSING OF WAVEFORM OBSERVATIONS
The ‘fusing’ of waveform observations refers to the use of signals from more than one of the three waveform technologies to form an event. Although the seismic, hydroacoustic and infrasound networks were primarily designed to detect explosions in the solid earth, oceans and atmosphere respectively, seismoacoustic waves are transmitted across the boundaries between these three media, enabling a signal generated in one medium to be detected in the other two. The fusing of waveform data can provide additional information on the nature of specific events, especially if an event occurs close to the boundary between two media – for example close to the water-air boundary or in the case of an underground event close to the surface.
Kolesnykov and Liashchuk (T3.5−P23) consider the identification of both explosions and earthquakes using a combination of seismic and infrasound data. Smirnov (T2.3−P4) uses seismic data to compile an infrasound ground truth database. More specifically, Assink et al. (T2.1−O10) consider the use of seismic and infrasound data from DPRK underground nuclear tests to estimate source depth. Heyburn et al. (T2.3−P13) consider seismic and hydroacoustic observations from underwater explosions off the coast of Florida, USA.
5.2 RADIONUCLIDE DATA PROCESSING AND ANALYSIS
Several presentations focus on the software used for the routine processing and interactive analysis of radionuclide data. Gheddou et al. (T3.7−O1) report enhancements to the IDC radionuclide processing pipeline for particulate samples to achieve a significant improvement in automatic IDC standard products (FIGURE 5.6). Sivels et al. (T3.5−P6) compare different analysis methods for the identification of radioactive xenon isotopes. Liu et al. (T3.7−P11) describe peak
search and filtering techniques for radioactive xenon beta–gamma coincidence spectra. Goodwin (T3.5−P13) describes developments at the UK NDC in radionuclide data analysis, and McIntyre et al. (T3.5−O8) describe a proposed new platform, named Sentry, for the analysis of IMS radionuclide datasets.
Other presentations cover radionuclide time series. Benito Diaz et al. (T3.5−O1) describe an approach to radionuclide time series reconstruction based on autoregressive analysis, while Benito Diaz et al. (T3.5−P50) use time series analysis as a preventive maintenance tool for IMS radionuclide data.
A model of radioactive xenon measurements in a noble gas system with a long sampling cycle is presented by Kamentsev et al. (T3.5−P57). Fan (T3.5−P45) considers correction for the coincidence summing effect in filter sample measurement with an HPGe spectrometer. Yamba et al. (T3.5−P32) consider the usability of zero-time determination of events using xenon isotopic activity ratios, given the real atmospheric background observations. Kalinowski et al. (T2.1−P11) present the methodologies used in the IMS radioactive xenon monitoring after the DPRK announced nuclear tests on 6 January and 9 September 2016.
The 2015 NDC Preparedness Exercise (NPE2015) required processing to set up the chosen scenario. Gheddou et al. (T3.6−P1) describe the generation of synthetic radionuclide spectra in support of NPE2015, and Ross et al. (T3.6−O1) describe ATM and radionuclide analysis methods for the NPE2015 scenario. Plastino et al. (T3.5−O2) report on a new methodology for ATM at all scales.
5.3 FUSING WAVEFORM WITH RADIONUCLIDE AND OTHER OBSERVATIONS
The three CTBTO waveform technologies are primarily focused on the detection and location of events, whether on the surface, underground, in the oceans or atmosphere. The fusion of data from different waveform technologies is covered in SECTION 5.1.5. Data fusion allows us to combine data and the results obtained from different waveform technologies and radionuclide samples. Relating an event to radionuclide or any other remote observations is also referred to as data ‘fusion’. This is of particular importance in event identification, because the detection of CTBT-relevant radionuclides may provide strong evidence of an event of interest, but

SECTION 5 — DATA PROCESSING AND SYNTHESIS 47
FIGURE 5.6 Improvements in the automatic processing of radionuclide particulate data implemented between 2015 and 2017, expressed with reference to analyst reviewed products. Top: categorization of spectra in the Automatic Radionuclide Reports is corrected during analyst review, so a reduction in the rate of correction indicates improved automatic categorization. Middle: errors in automatic processing that increase the burden on analysts were also rectified, increasing the latency in issuing Reviewed Radionuclide Reports. Bottom: Improved consistency between automatic and reviewed categorization of spectra implies higher quality automatic categorization. From Gheddou et al. (T3.7−O1).
not its location. By associating such radionuclides with an event located using one or more of the waveform technologies, both location and event identification may be achieved. Significant work has been done pursuing methodologies for correlating events located using seismic, hydroacoustic and/or infrasound signals with anomalous radionuclide observations, though this subject was less prominent at SnT2017 than in past SnT conferences.
One presentation considers the fusion of infrasound data with electromagnetic measurements. Detection of the electromagnetic pulse associated with atmospheric nuclear explosions was excluded from the verification regime under the Treaty. Lipshtat et al. (T3.5−P48) propose combining infrasound data with non-IMS electromagnetic measurements to assist in the identification of potential atmospheric nuclear tests (see SECTION 7.3.4).

48 SCIENTIFIC ADVANCES IN CTBT MONITORING AND VERIFICATION 2017

SECTION 6 — EARTH CHARACTERIZATION 49
6 EarthCharacterization
INTRODUCTION
The interpretation of CTBT verification data depends crucially upon properties of the earth, or of its oceans or atmosphere. For example, the processing and interpretation of seismic and acoustic signals relies crucially on our understanding of the media through which those signals have passed, in particular the variation of wave speed along the signal ray paths. Seismoacoustic events such as earthquakes and explosions cannot be located, or their signals interpreted, without that information. Likewise, natural sources of radioactivity affect the interpretation of radionuclide observations. All atmospheric radionuclide observations depend upon knowledge of atmospheric transport in order to narrow down the geographic origin of such signals.
Other earth properties that support the interpretation of verification-related data include subsurface permeability and near-surface barometric pressure variations, both of which, along with many other factors, can influence the transport of radioactive material from an underground nuclear explosion to the earth’s surface.
SECTION 6 includes all contributions on the study of the properties of the earth. Although many studies characterizing properties of the earth may be aimed
at supporting CTBT verification methods, many are aimed at supporting other civil, scientific and industrial uses of data from the IMS. For example, seismic hazard estimation depends upon studies of earthquake seismicity and tectonic strain rates; volcanic ash hazard estimation relies upon the monitoring of volcanoes, and tsunami warning depends upon knowledge of earthquake seismicity, earthquake mechanisms and the effect of subsea seismogenic fault displacement on the transport of water in the oceans. Such topics are therefore included in SECTION 6. Where seismoacoustic sources are investigated in the context of discriminating between different types of source in order to identify explosions, results are classed as interpretation and so appear in SECTION 7. Studies that cover both data interpretation and the determination of the properties of the earth, such as earthquake moment tensors used to infer tectonic stress, are cited in both SECTION 6 and SECTION 7.
Where civil and scientific uses of IMS data do not depend directly upon earth properties, they appear in other sections. For example, the use of infrasound data to identify meteorites and other non-CTBT-relevant sources is considered data interpretation and hence is covered in SECTION 7.
50 SCIENTIFIC ADVANCES IN CTBT MONITORING AND VERIFICATION 2017
6.1 SOLID EARTH
6.1.1 SEISMIC WAVE SPEED
The speed at which seismic waves travel in different regions and at different depths is one of the most important properties of the earth for CTBT verification. This knowledge is essential to locate seismic events accurately. Although the seismic wave speed deep within the earth (alternatively expressed as the travel time of seismic waves) depends, to a very close approximation, only upon depth, there are significant lateral variations nearer the surface, and these can greatly complicate the determination of accurate seismic source locations and, equally importantly, it can complicate the determination of errors in those locations.
It is normal to classify such errors as either relating to the measurement of signal arrival time, azimuth and slowness (‘measurement errors’) or relating to the inadequate definition of the 3D wave-speed model (‘model errors’). Because lateral variations (which create deviations in azimuth and slowness) are largest near the surface, they tend to affect signals recorded at closer distances (because those signals follow shallower ray paths). This can lead to the paradox of greater location errors for events determined from regional observations than those determined from teleseismic observations. Nevertheless, regional observations remain important for small events (because such events may not be detected at greater distances), and for source identification. Regional observations are also important in helping to constrain event depth. They also offer the prospect of greater location accuracy when the wave-speed model at shallower depths is indeed accurately known.
The RSTT initiative aims to refine travel times as far as epicentral distances of 15° or 18°, corresponding to the seismic wave propagation distances that involve rays traversing the more heterogeneous shallower layers of the earth. The RSTT effort requires data from selected events whose locations are known very precisely, and these are required for every region in which the model is to be refined. Such events are referred to as ‘ground truth’ (GT) events. GT5 events are those whose epicentre is known to within 5 km, and GT0 those man-made events whose location is known precisely. Many national or regional studies can provide input to the refinement of the RSTT model for their respective regions. Begnaud et al. (T1.2−O1) report on the development and validation
of path dependent uncertainty estimates for use with the RSTT model.
The RSTT model has also been used to determine SSSCs which are travel time corrections that can be applied to a two dimensional model to allow for lateral wave-speed differences beneath different source and station locations. Bondar et al. (T1.2−O3) evaluate the NET-VISA signal association algorithm and event location performance using a wave-speed model that incorporates these SSSCs.
Another initiative to improve global seismic wave-speed models is described by Ballard et al. (T1.2−O6). The resulting model, referred to as the Sandia and Los Alamos 3D seismic tomography model (SALSA3D), is a three dimensional model for improved seismic event location in nuclear explosion monitoring. A further wave-speed model initiative, presented by Simmons and Myers (T1.2−P18), uses joint body-wave and surface-wave tomography and allows limited anisotropy (vertical transverse isotropy).
Many studies are local or regional, using observations from national or regional networks to infer crustal and/or upper mantle wave-speed profiles. For example, Najafipour et al. (T3.5−P55) determine a wave-speed model for the Seymareh region, southwest Iran, using local seismic network data. Tcydypova et al. (T1.2−O4) describe a P- and S-wave study of the crust and upper mantle structure beneath the Transbaikalia in the Baikal rift zone, Russian Federation. Sokolova (T1.2−P24) describes seismograms recorded from the peaceful nuclear explosions of the former Soviet Union, together with quarry blasts and earthquakes, that can be used for refining seismic travel times in western Kazakhstan. Seismograms recorded from this peaceful nuclear explosion programme are also addressed by Dobrynina and Chechelnitsky (T2.5−P4).
Seismic surface-wave tomography is used by Ouattara et al. (T1.2−P27) in a study of the seismic wave-speed structure of West Africa. Also in Africa, Kadiri and Ezomo (T1.2−P11) study the crust and upper mantle structure in Nigeria.
Structure of the lithosphere in north-west South America is reported by Vargas et al. (T1.2−O2), and Farrapo Albuquerque et al. (T1.2−P13) report on the crustal structure of the Amazon craton, Brazil. Improved seismic travel times in central and north Costa Rica are described by Aguiar Moya and Myers (T1.2−P22).

SECTION 6 — EARTH CHARACTERIZATION 51
6.1.2 ANELASTIC ATTENUATION
The loss of elastic energy to the medium that seismic waves pass through is referred to as anelastic attenuation and has important implications for CTBT monitoring. This attenuation results in a reduction of signal amplitude, with consequences for the signal detection threshold. Because signal amplitude is reduced, this also affects the calculation of seismic magnitude, and this in turn affects event identification; the
m
b:M
S
screening criterion is an important criterion used in IDC standard products. Anelastic attenuation also affects the dominant frequency of the propagating signal, owing to the preferential loss of higher frequencies.
Anelastic attenuation can vary widely in different regions and at different depths. Although this topic does not figure prominently in SnT2017 presentations, Phillips et al. (T1.2−O5) consider the prediction of the amplitudes of different seismic phases at local and regional distances, and Dobrynina et al. (T1.2−P28) report on seismic attenuation in the Baikal Rift System.
Seismic shear (S) waves typically experience greater attenuation than compressional (P) waves as a result of the different mechanism of energy loss. Semin and Ozel (T1.2−O7) report a study to estimate the shear-wave attenuation of central Anatolia.
6.1.3 TECTONIC STRESS
The state of tectonic stress may be inferred from earthquake focal mechanisms (more generally referred to as moment tensors) or from crustal deformation studies. Seismicity, covered in SECTION 6.1.4, can itself provide information on tectonic stresses, so there is some overlap between these two sections.
Some presentations focus on the seismotectonics inferred from regional seismological studies, Korkusuz Öztürk (T1.2−P33) in the Sea of Marmara, Turkey, Babiker et al. (T1.2−P29) in Sudan and South Sudan, and Tahir et al. (T1.2−P32) in the Phalla (Islamabad) area of Pakistan.
Kalindekafe et al. (T1.5−P2) combine mapping of active lineaments with seismological data to infer information on the East African rift system in the Karonga area, on the border of Malawi and Tanzania, and Fernandez et al. (T1.5−P22) combine geological fault mapping with earthquake focal mechanisms in western Bolivia. Using a different approach to infer stress,
Safarov et al. (T1.2−P12) estimate crustal deformation in the Grater Caucasus, Azerbaijan, from global positioning system (GPS) measurements.
6.1.4 SEISMICITY AND SEISMIC HAZARD, INCLUDING TSUNAMI HAZARD
It is well known that the global distribution of earthquakes follows closely the boundaries of the tectonic plates, but isolated earthquakes can occur anywhere. This global distribution of earthquakes, referred to as earthquake seismicity, is important in CTBT verification in several ways. First, the vast majority of seismic disturbances (seismic events) are earthquakes recorded by regional and global seismic networks, including the IMS, so earthquakes are ubiquitous in underground nuclear test monitoring. Secondly, large earthquakes are often followed by aftershock sequences, which may contain hundreds or even thousands of additional events capable of being detected by the IMS and located; this poses a special challenge for both automatic processing and for interactive analysis. It also makes it more time consuming to ensure that near simultaneous events in other regions are not missed. Moreover, the global seismic noise originating from the largest earthquakes temporarily degrades the global detection threshold. All this poses challenges for analyst workload, and in particular the workload dedicated to ensuring that events are not missed.
Station performance is another way in which earthquake seismicity is relevant to CTBT monitoring. Indeed there can be a distortion in the apparent station performance arising from the highly non-uniform global distribution of earthquakes. This arises because some IMS stations contribute vastly more detections to the REB than others, simply as a result of the non-uniform geographic distribution of earthquakes. Approximately one third of natural seismicity occurs in the western Pacific, so that IMS primary seismic stations in Australia contribute an inordinately large proportion of signal detections. Given that all events meeting the event definition criteria should be detected and located in the REB, it follows that such stations are especially important. But this, of itself, is not a measure of these stations’ contribution to nuclear test monitoring, because a nuclear explosion can occur anywhere. A high noise station contributing little to the REB may have a special role in detecting a small nuclear explosion that occurs in an otherwise aseismic area. This fact cannot be over-emphasized in any discussion concerning the relative ‘importance’ of particular IMS seismic stations.

52 SCIENTIFIC ADVANCES IN CTBT MONITORING AND VERIFICATION 2017
The study of seismic hazard is intimately related to seismicity, because the preponderance of large earthquakes in a particular region gives rise to a higher earthquake hazard. However, vulnerability to this hazard has other components which can predominate, such as building standards, near-surface geology and population density; CTBT monitoring can provide valuable data in support of the study of seismic hazard.
Many of the SnT2017 contributions on seismicity and seismic hazard relate to national or local datasets and examples. Mikhailova et al. (T1.5−P15) consider the seismicity around the former Soviet test site at Semipalatinsk, using the Kazakhstan monitoring network, and Sokolova et al. (T2.3−P11) consider induced seismicity in Kazakhstan. Tsereteli et al. (T1.5−O3) describe the production of seismic hazard maps for the republic of Georgia, while Shanker et al. (T1.5−O4) present the quantification of future earthquake hazard in the Hindu Kush and Pamir regions of the Himalayas using IMS data.
In the Middle East, several studies focus on Jordan. Olimat (T1.2−P15) presents a microzonation study for Zarqa City and the Hashemite University campus. Olimat (T1.2−P31) determines site effects in the archaeological city of Jerash, and Olimat (T1.2−P26) makes site effect estimations using microtremor studies of Jerash. Kriegerowski et al. (T3.4−O3) offer new insights into the Dead Sea transform fault gained from the IFE14 seismological recordings, Jordan.
Several studies focus on regions in Africa. Fergany (T3.5−P37) reports on seismic monitoring and the seismicity of Egypt. Souayeh (T4.1−P26) considers the detection of earthquakes and the determination of seismicity in Tunisia. Babiker et al. (T1.2−P29) presents the seismicity and seismotectonics of Sudan and South Sudan, while the seismotectonic implications of the 20 May 1990 South Sudan earthquake are presented by Mulwa and Kimata (T1.5−P16). Mphepo (T5.4−P16) describes the Malawi seismic network and Malawi seismicity from 1900 to 2016, while Marimira et al. (T1.5−P3) consider the assessment of seismic hazard in Zimbabwe. Seismic hazard studies for national planning and development in Nigeria are presented by Kadiri and Ezomo (T1.2−P11).
Seismic precursors are considered by Rezaei and Maleki (T2.3−P12). They present a physical model of the Ahar-Varzaghan doublet earthquakes in northwest Iran. Syirojudin et al. (T1.2−P23) describe progress in the detection of earthquake precursors using ultra-low frequency geomagnetic data.
Some presentations consider theoretical aspects of seismic hazard. Shanker (T1.5−P1) considers the concept of the seismic cycle and the occurrence of large earthquakes. Shah (T1.5−P5) considers disaster prediction through pattern informatics applied to global seismological data, while Amartey et al. (T1.5−P6) consider the contribution that IMS seismic monitoring data make to studies of earthquake hazard.
The correlation of individual earthquakes with known geological faults has received much attention, especially since this is often more difficult than expected. Fernandez et al. (T1.5−P22) consider the upgrading of geological fault information using the most recent shallow seismic events.
Volcanic activity can be monitored using infrasound stations, but such activity is often accompanied by microseismic events. The use of the IMS seismic network to support and mitigate volcanic risk is proposed by Gutierrez Jimenez (T3.5−P47).
Some very large earthquakes located beneath the sea generate tsunamis, in some cases with major loss of life and property. Tsunamis are generated by some large undersea earthquakes, depending in part upon the source mechanism, which in turn depends upon the tectonic stress regime. So a tsunami warning centre must first locate large earthquakes rapidly, then apply further tests to minimize the frequency of false alarms being issued.
Tsunami hazard is considered by several authors. Kaneda et al. (T1.4−O6) describe simulation research in Japan for earthquake and tsunami disaster mitigation using real time monitoring data. Dimova et al. (T1.4−P8) compute tsunami waves generated by landslides using numerical simulations in the western Black Sea. Rohadi et al. (T1.5−P24) consider the validation of tsunami potency using the calculation of rupture duration and other earthquake parameters. Liashchuk et al. (T1.5−P23) consider the use of IMS infrasound stations for tsunami warning on the Antarctic Peninsula.
6.1.5 SUBSURFACE FLUID TRANSPORT AND RADIONUCLIDES
The transport of gases in the subsurface is especially relevant to the detection of underground nuclear tests through the venting of radionuclides into the atmosphere. An understanding of the migration of radioactive noble gases from the site of an underground

SECTION 6 — EARTH CHARACTERIZATION 53
nuclear explosion to the surface, and hence into the atmosphere, is of particular importance, both in the correct interpretation of anomalous detections, and in the correct interpretation of non-detections. Such subsurface migration is essential if the radionuclides are to be detected by the IMS, and the design of atmospheric and soil sampling during an OSI is also dependent upon an understanding of subsurface transport.
Many factors influence the migration of gases in the subsurface, including geological and hydrological conditions, rock porosity, atmospheric pressure above, and the effect on surrounding material of an underground nuclear test. Broome et al. (T1.3−P10) consider the geological control of subsurface noble gas migration, and Lowrey et al. (T1.3−P20) consider the sorption of noble gases in porous media and its impact on nuclear explosion
signatures. Subbotin et al. (T2.5−P7) consider the possibility of determining the location of an underground nuclear test from the presence of artificial radionuclides present in groundwater, with a case study from the former Soviet test site at Semipalatinsk, Kazakhstan.
The measurement of radionuclides in the subsurface is an integral part of OSI. Aldener et al. (T2.2−P6) consider the measurement of radioactive xenon and argon in soil gas. Pili et al. (T2.2−O2) consider the theory of gas fluxes in the subsurface (FIGURE 6.1), and how best to tailor sampling methodology to this. The measurement of carbon dioxide and stable isotopes in the support of OSI subsurface gas sampling is considered by Rizzo et al. (T2.2−P8), and Rosianna et al. (T3.2−P1) consider the determination of fission radionuclides strontium-90 and plutonium-242 in water samples.
FIGURE 6.1 Mechanisms for subsurface gas fluxes following an underground nuclear explosion. Top: expected gas fluxes. Bottom: a more complete picture showing additional mechanisms. From Pili et al. (T2.2−O2).

54 SCIENTIFIC ADVANCES IN CTBT MONITORING AND VERIFICATION 2017
Simulations of subsurface gas migration in different geological and environmental conditions can be useful. Filistovic et al. (T1.3−P18) present a non-equilibrium model of multiphase radionuclide transport in a system comprising lake water and sediment. Lowrey et al. (T2.2−P12) present a tool for simulating shallow subsurface noble gas transport in multiple phases, referred to as Subsurface Transport Over Multiple Phases (STOMP).
The time limitations imposed by the Treaty and draft OSI Operational Manual on the conduct of an OSI make it imperative that any source of delay in the measurement, processing and interpretation of OSI data are minimized. Ustselemov et al. (T2.2−O4) describe an express method for the identification of nuclear explosion-induced radionuclide seepage during an OSI. However, the subsurface migration process of gaseous radioactive isotopes from an underground nuclear test may be slow, and the possibility exists that radioactive noble gas is detected in the atmosphere after a significant delay, as discussed by Carrigan et al. (T2.2−P3).
6.2 OCEANS
Ocean temperature and salinity are the main factors governing the acoustic wave-speed field, and variation with depth is additionally governed by pressure. A detailed local study of the acoustic wave-speed field in the Fram Strait, between the Arctic and Atlantic Oceans, is reported by Sagen et al. (T1.4−O1).
Lateral variation in the wave speed results in lateral refraction of oceanic acoustic waves. This in turn affects whether signals between a given source and recording station are blocked by intervening land masses. Moreover, blockage may not be total, and Dall’Osto (T1.4−O2) reports on situations where incomplete blockage can result in signals detected where none would otherwise be expected, thereby augmenting the list of signal detections.
Bathymetry governs a tsunami’s progress from the tsunamigenic earthquake towards the coast. Shallow coastal bathymetry, and the shape of the coastline, can have a dominant effect, with major amplification caused by such features as narrow inlets and coves. The assessment of tsunami hazards therefore depends crucially upon our ability to model these effects. Dimova et al. (T1.4−P8) present numerical simulations for the western Black Sea.
6.3 ATMOSPHERE
6.3.1 ACOUSTIC WAVE SPEED
The seismic wave-speed field remains constant over the timescale of interest, whereas the dynamics of the atmosphere result in variations of the acoustic wave speed, in particular diurnally and seasonally. Further complexity arises near the earth’s surface as a result of the earth’s topography.
The acoustic velocity field (speed combined with direction) in the atmosphere is mainly determined by temperature and wind. A study of the temperature and wind-speed vertical profiles in the atmosphere is presented by Kulichkov et al. (T1.1−O2). Kulichkov et al. (T1.1−O2) consider the civilian application of IMS infrasound data in the study of the temperature and wind velocity vertical profiles in the atmosphere. The detection and interpretation of infrasound also depends crucially on atmospheric dynamics, and Blanc et al. (T1.1−O7) consider uncertainties in atmospheric dynamics estimates in this context.
When an estimate of the acoustic wave-speed field has been determined, ray tracing or other methods can be used to model the propagation of infrasound. Khodr et al. (T1.1−P11) consider the use of realistic terrain boundary conditions in numerical infrasound modelling. An open source infrasound raytracing tool is described by Whitaker and Blom (T1.1−P12).
6.3.2 ACOUSTIC ATTENUATION
Acoustic attenuation in the atmosphere is more complicated than anelastic attenuation in the solid earth, because it has a less direct relationship to signal detection. Seasonal variations in the azimuthal dependence of infrasound signal detection depends much upon stratospheric winds and the refraction of infrasound away from detecting stations at the earth’s surface. Gibbons et al. (T1.1−P20) analyse the detectability of signals at infrasound stations in the European Arctic from a historical list of many thousands of explosions.
6.3.3 ATMOSPHERIC TRANSPORT
The location and origin time of an event detected by a network of seismic stations can in principle be determined

SECTION 6 — EARTH CHARACTERIZATION 55
given the arrival times of the detected signals, provided that the (static) wave-speed field is known. Knowledge of this wave-speed field is sufficient, in principle, to determine the ray path (or multiple ray paths) between the source and receiver, and their associated travel times.
The analogous quest for the location and origin time of a release that gives rise to anomalous radionuclide observations at a network of stations poses very different problems. Instead of a propagating wave in an unchanging solid medium, the information travels from source to receiver with the moving air mass, which is dynamic and ever changing. The velocity field (speed plus direction) of the atmospheric air mass must therefore be estimated, using a synthesis of massive sets of meteorological observations, and taking into account relevant atmospheric processes.
Several software systems are well established for use in ATM and are constantly upgraded and evaluated. ATMs need high-quality meteorological fields to generate their guidance. One ATM system is the Hybrid Single Particle Lagrangian Integrated trajectory (HYSPLIT). Suarez Mullins (T1.3−P7) evaluates the inline weather research and forecasting (WRF)-HYSPLIT model for mesoscale atmospheric transport and dispersion. Abdollahnejad (T1.3−P5) analyses the capability of the HYSPLIT dispersion model used for the Fukushima Daiichi nuclear power plant accident, Japan, and Chai et al. (T1.3−O4) present a HYSPLIT inverse modelling investigation using data from the Cross Appalachian Tracer Experiment, with ensemble dispersion simulations. Ensemble modelling is a technique involving the comparison of a range of model calculations as a means of estimating uncertainty. Comparison of atmospheric transport models used for supporting decisions in the framework of the Austrian radiological emergency response system is presented by Skomorowski et al. (T1.3−P6).
The importance of the release of radioactive xenon isotopes from radioisotope production facilities in the context of the IMS network capability is explained in SECTION 7.2.3. Gheddou et al. (T2.4−P12) present a prototype software application, named Simulated Impact of Xenon (SIMPAX), for simulating the impact of radioactive xenon emissions from civil sources at IMS stations.
The estimation of atmospheric transport models relevant to the DPRK announced underground nuclear tests is of special interest. The work of the CTBTO based on the Lagrangian Flexible Particle Dispersion Model (FLEXPART) for the 6 January and 9 September 2016 announced nuclear tests is described by
Kusmierczyk-Michulec and Kalinowski (T2.1−P6) (FIGURE 6.2). Ross and Ceranna (T2.1−P5) use ATM to assess the likelihood of detecting radionuclides released from the known DPRK test site.
Another example of interest concerns anomalous radionuclide releases detected in northeast Asia in 2010. These are considered by Suh et al. (T1.3−P3) using the Lagrangian Atmospheric Dose Assessment System (LADAS).
There has been much work on the estimation of uncertainties in ATM calculations. The inadequate estimation of errors can result in an erroneous conclusion as to whether a given set of anomalous observations is consistent with a postulated radionuclide source; a correct answer to such a question is vital in CTBTO verification. The evaluation of uncertainty in meteorological analyses and forecasts using ensemble forecasts is presented by Rodwell (T1.1−O3). Quantification of uncertainties in atmospheric modelling is considered by Mekhaimr (T1.3−O7). De Meutter et al. (T1.3−O5) present work to quantify uncertainties in the determination of source location, the nature and concentration of the source (referred to conventionally as the ‘source term’) using FLEXPART and ensemble forecasts.
The distribution of specific radionuclides in the atmosphere can be closely related to atmospheric dynamics. Terzi et al. (T1.5−O6) consider the worldwide seasonal variation of beryllium-7 related to large scale atmospheric circulation dynamics.
Kusmierczyk-Michulec et al. (T1.3−O6) consider the long-range transport of xenon-133 emissions under convective and non-convective conditions, and Terzi et al. (T2.4−P19) consider the use of IMS data for research through global noble gas concentration maps. Purtschert et al. (T1.3−O2) consider the distribution of argon-37, beryllium-7 and xenon-133 in the atmosphere.
The precision of ATM calculations depends upon the spatial and temporal resolution of the meteorological data, with higher resolution expected to provide more reliable results. However, the benefit depends upon the spatial scale of the variations in the meteorological parameters, and their speed of change. Performance assessment of the high resolution ATM at the CTBTO is presented by Schoeppner et al. (T1.3−P19). High resolution is especially important near the earth’s surface, where irregular topography can exert a major influence; this is especially relevant in the context of OSI, and presents additional issues in the measurement of uncertainty. Glascoe et al. (T1.3−P12) consider uncertainty in this context.

56 SCIENTIFIC ADVANCES IN CTBT MONITORING AND VERIFICATION 2017
The preparedness of NDCs to analyse anomalous observations and make informed judgements on possible violations of the Treaty is tested regularly in exercises referred to as NDC Preparedness Exercises (NPEs). The use of ATM in support of the interpretation of anomalous radionuclide observations forms an important part of these exercises and is based on data from a scenario that NDCs are requested to analyse. ATM and radionuclide analysis for the NPE15 scenario are described by Ross et al. (T3.6−O1).
Another means of testing ATM readiness is ATM ‘challenges’, in which a challenge is issued to the research community to undertake specific processing, analysis or interpretation tasks on a particular data set. Such challenges are commonly found in the industrial research community as a means to advance difficult topics. The second ATM challenge, held in 2016, is described by Maurer et al. (T1.3−O1), and Seibert and Philipp (T1.3−P13) report on the influence of resolution on the performance of the ATM software FLEXPART under the 2016 ATM challenge.
(a)
(c)
(b)
(d)
(e)
FIGURE 6.2 An elevated concentration of xenon-133 was observed at the IMS noble gas station JPX38, Takasaki, Japan, in five consecutive 12-hourly samples beginning 17 Feb 2016 2100 UTC. ATM backtracking can be used to estimate the geographic distribution (‘source receptor sensitivity’) of possible release points at any time prior to an observation at a given station. Such ATM results can be computed for multiple observations at one or more stations and, when combined with observed radionuclide measurements, can reveal a ‘possible source region’, represented by the cross-correlation coefficient of observed and calculated concentrations as a function of location and time. This figure shows results for the five observations described above. (a):distribution of correlation coefficients for the best-fitting hypothetical release time window (16 February 0300–0600 UTC). (b) the number of measurements (out of the five) contributing to this possible source region at each point. (c) and (d) equivalent results for the time window 5 February 0900–1200 UTC, indicating that although there is a well-defined possible source region around DPRK for 16 February, a more dispersed range of possible sources at an earlier time is also consistent with the observations. (e) forward ATM showing the time at which a prompt release (9 September 2016 0000–0300 UTC) at the time and place of the DPRK announced nuclear test would be expected to arrive at the station (16 September). No elevated concentrations of xenon-133 were observed at this time. From Kusmierczyk-Michulec and Kalinowski (T2.1−P6).

SECTION 7 — INTERPRETATION 57
7 Interpretation
INTRODUCTION
The ultimate purpose of data interpretation in the CTBT verification context is the detection, location and characterization of events, to facilitate the reliable identification of any nuclear test explosion. Studies of the nuclear explosion source and how it can be identified are therefore one aspect of interpretation. Most interpretation exercises focus on observations that are naturally occurring, such as earthquakes, meteorites, or naturally occurring radioactivity, or that are of non-nuclear anthropogenic origin, such as chemical explosions. SECTION 7 contains all such contributions, including those that are theoretical or that report simulation studies.
Although CTBTO is not mandated to make a final decision on the nature of any event recorded (under the Treaty this is the prerogative of States12), the Treaty provides that ‘event screening’ be performed11. This is the application of approved methods to specific features of located seismoacoustic events and radionuclide spectra, in order to ‘screen out’ phenomena believed to be consistent with natural or non-nuclear man-made (anthropogenic) activity. Experimental event screening criteria are being applied and reported in IDC standard products, and are subject to further development and extension. SECTION 7 includes contributions on this topic.

58 SCIENTIFIC ADVANCES IN CTBT MONITORING AND VERIFICATION 2017
7.1 GEOPHYSICAL SIGNATURES
7.1.1 EXPLOSION
For seismic events, the determination of moment tensors is one basis upon which different types of source can in principle be discriminated. The equivalent force system at the seismic source is different for earthquakes and explosions, and in the ideal case a pure explosion generates no shear (S) waves. The estimation of uncertainties in moment tensor estimates is often neglected, but for nuclear explosion monitoring it is crucial, since the key issue is whether the results exclude, or do not exclude, the possibility that the source was an explosion.
Alvizuri et al. (T2.3−P8) (FIGURE 7.1) estimate full moment tensors, with uncertainties, for a range of sources including explosions. Saikia et al. (T2.3−P9) estimate source parameters of underground chemical explosions at the Nevada National Security Site (NNSS) in the USA as part of the Nevada source physics experiments (SPE), again with uncertainties. Walter et al. (T2.1−P10) (FIGURE 7.2) also present results from these experiments, designed to improve our understanding of seismic waves recorded from explosions, and Preston et al. (T1.1−P21) present results on explosion acoustic signatures from these tests. Steedman et al. (T2.3−P3) present studies under the SPE which combine experiment and numerical modelling to explain non-ideal behaviour including the generation of shear waves from large explosions. The experiments incorporate near-source accelerometers and airborne photogrammetry.
FIGURE 7.1 Alvizuri et al. (T2.3−P8) present a method to estimate moment tensors with uncertainties, and show its usefulness to discriminate between explosions, earthquakes and volcanic events. For any given event, the method performs a complete search over all possible seismic source mechanisms, defined by their moment tensors. For each moment tensor, synthetic seismograms are computed with a given Earth model and compared with observed seismograms. The ensemble of mechanisms examined is then used to compute moment tensor uncertainties, which are characterized in terms of goodness of fit VR(Λ) (displayed on a lune), a probability density function, and a confidence curve. Focal mechanisms of different events such as nuclear tests and earthquakes clearly separate into distinct groups, and the ability to discriminate depends upon obtaining localized uncertainties. Left: The HOYA nuclear explosion at the former Nevada Test Site, USA. Centre: an earthquake in south-central Alaska, USA. Right: a volcanic event at Uturuncu volcano, Bolivia. For any given solution, the lune displays the range of mechanisms examined, coloured by goodness of fit between observed and synthetic waveforms. As in the source type plot used in FIGURE 7.4, a pure explosion is at the top and the double couple is at the centre. (The lune displays moment tensors in a qualitatively similar way to the source type plot.)

SECTION 7 — INTERPRETATION 59
FIGURE 7.2 Source physics experiments (SPEs) at NNSS are a series of chemical explosions designed to improve the understanding of seismic wave generation and propagation from explosions. One question addressed is whether the ratio the amplitudes of the seismic phases Pg and Lg, which has been shown to discriminate between normal-depth earthquakes and nuclear explosions buried near their containment depth, can be applied to shallow earthquakes or to over-buried explosions. Left: Details of sources for SPE Phase 1. Below top: Pg/Lg against magnitude for regional earthquakes, nuclear explosions at the former Nevada Test Site, and SPE explosions, recorded at the station MNV (see map). Below bottom: Similar plots showing regional earthquakes and DPRK announced nuclear tests recorded at the station TJN (see map). From Walter et al. (T2.1−P10).

60 SCIENTIFIC ADVANCES IN CTBT MONITORING AND VERIFICATION 2017
In its simplest case, a moment tensor is determined for what is considered a point source in space and time. In practice, sources have a finite duration and extent, and for large earthquakes this has a major influence on the recorded signals; the largest earthquakes may involve a rupture that propagates over more than 100 km at a speed somewhat less than the S-wave speed in the medium. Saikia (T2.3−P15) determines time-domain source functions for nuclear and chemical explosions at the NNSS, and Ziolkowski (T2.1−O6) estimates source-time functions and explosive yields for the 25 May 2009 and 12 February 2013 announced DPRK nuclear tests directly from seismograms. Supriyanto Rohadi et al. (T2.1−P4) analyse spectra of signals recorded from the DPRK announced nuclear test on 6 January 2016, and determine a focal mechanism.
Several other presentations focus on the DPRK announced nuclear tests, in particular the estimation of their depths, locations and magnitudes. Relative depth and yield of the 12 February 2013 and 6 January 2016 tests are estimated by Kim (T2.1−P7), and depth estimates are also presented by Assink et al. (T2.1−O10). Absolute and relative locations of DPRK nuclear tests estimated using cross-correlation are presented by Kitov et al. (T2.1−P3). Cross-correlation methods are also used by Kitov et al. (T2.1−P2) to determine the absolute and relative body-wave magnitudes of these events.
Studies of seismic records from the DPRK announced nuclear tests are also presented by Liashchuk et al. (T2.1−P9) and by Zheng (T2.1−O8). Results of a study of the 9 September 2016 announced test are presented by Dovbysh (T2.1−P18).
Signals from DPRK nuclear tests have also been recorded at IMS and non-IMS infrasound stations; these are studied by Koch and Pilger. (T1.1−P8). Green and Nippress (T1.1−P4) consider the general question of whether the measurement of infrasound signal duration is useful in the context of nuclear explosion monitoring.
One paper looks at seismograms recorded at central Asia stations from nuclear explosions at the Lop Nor test site, China. These results are presented by Sokolova and Kopnichev (T2.5−P2).
The nature of seismic sources is often studied by computing synthetic seismograms, given a representation of the seismic source and the seismic structure of the
medium through which seismic waves travel to the recording station. Tsuboi et al. (T1.2−P35) present synthetic seismograms of explosive sources calculated by the Earth Simulator of JAMSTEC, Japan.
7.1.2 EARTHQUAKE
The identification and description of an earthquake source using seismic data usually involves the determination of a moment tensor, with the double couple being the established indicator of an earthquake, and the orientation of this being indicative of the fault plane orientation and slip direction. Other source parameters such as fault size and shape, rupture speed and the direction of rupture may also be determined.
Some SnT2017 presentations estimate parameters for specific earthquakes. Tahir et al. (T1.2−P32) present the source processes of the Phalla (Islamabad) earthquake on 24 July 2015 and its tectonic perspective. Dobrynina et al. (T2.3−P14) present the seismoacoustic effects of the Khubsugul earthquake of 5 December 2014, Mongolia. Ntibinyane and Kwadiba (T1.5−P4) study the 28 March 2016 earthquake in the Okavango Delta area, Botswana, and Rezaei and Maleki (T2.3−P12) present a study of the Ahar-Varzaghan doublet earthquakes in 2012 in northwest Iran.
Other contributions are focused on a methodology, in some cases with application to multiple earthquakes. Alvizuri et al. (T2.3−P8) estimate full moment tensors, with uncertainties, for volcanic events and nuclear explosions as well as for earthquakes. Fernandez and Ryan (T1.2−P19) use ground truth information to improve the focal mechanisms and other source parameters determined using seismic observations from earthquakes in Bolivia. Rohadi et al. (T1.5−P24) use estimates of rupture duration, dominant period and other source parameters as indicators of whether an earthquake is likely to be tsunamigenic.
There has been much debate about whether in some cases large earthquakes recur with regular periodicity at a specific location, and this has given rise to the concept of a ‘seismic cycle’. Shanker et al. (T1.5−P1) presents a study of this topic with applications to an example in Gujurat, India

SECTION 7 — INTERPRETATION 61
7.1.3 VOLCANO
The mechanisms associated with volcanic eruptions are many, and depend upon the type of volcano and other factors. Signals may be recorded by infrasound or seismic stations, depending upon the nature of the activity. Explosive volcanism is the subject of Matoza et al. (T1.1−P5), who describe its automatic detection and cataloguing using signals from the IMS infrasound network. Matos et al. (T1.1−P16) report on long range infrasound detections of volcanic activity at the IMS infrasound station IS42 (I42PT), Azores, and Garces et al. (T1.5−O2) describe infrasound surveillance of hazardous volcanic eruptions in Asia. De Negri et al. (T1.1−P24) use IMS infrasound stations IS13 (I13CL) at Easter Island and IS14 (I14CL) at Juan Fernández Island, Chile, to analyse strong seismic and volcanic activity there.
The determination of full moment tensors for volcanic events using seismic observations is presented by Alvizuri et al. (T2.3−P8), along with moment tensors for earthquakes and nuclear explosions.
Submarine volcanism may be detected on the IMS hydrophone network, as presented by Metz et al. (T1.4−O5); the consequences for ocean noise are discussed.
By making assumptions about the eruption mechanism, simulations can be computed to estimate the impact of different scenarios. Park et al. (T1.3−P11) present such simulations for hypothetical eruptions around the Korean peninsula.
7.1.4 OTHER SOURCES
Most papers that present work on other sources focus on infrasound data. Medinskaya et al. (T1.1−P10) present IMS infrasound signals recorded from announced rocket launches, while Haynes and Millet (T1.1−O6) describe methods of characterizing meteors from infrasound signals. Pilger et al. (T1.1−P7) describe the detection and interpretation of a range of seismoacoustic events recorded at infrasound stations in Germany. Evers and Smets (T1.1−O5) describe infrasound signals recorded from glacial activity in northwest Greenland. Nippress and Green (T3.5−P16) evaluate west Eurasian clusters of infrasound arrivals in the REB.
It has long been known that whale sounds are frequently recorded by hydrophones. Rogers et al.
(T1.5−O1) describe the application of infrasound data to the search for populations of the endangered blue whale.
Madi (T1.5−P21) uses seismic recordings of earthquakes in the Comoros islands as a proxy for the study of associated landslides. This is used to make inferences about future landslide hazards.
7.2 RADIONUCLIDE SIGNATURES
7.2.1 NUCLEAR EXPLOSION
Gordon et al. (T3.5−O6) consider how to optimize the chances of detecting nuclear test signatures when using radioactive xenon isotopic ratios from prompt and early releases. Subbotin et al. (T2.5−P7) consider the observation of artificial radionuclides in groundwater as evidence for the location of an underground nuclear test.
Some presentations focus on ways in which the identification of radionuclides as originating from a nuclear explosion can be compromised by external factors. At the source itself, gas-magma interactions in the nuclear cavity affect xenon isotope ratios; this is discussed by Pili et al. (T1.3−P8). During migration of noble gases to the surface, sorption of the gas in porous media can also impact on the nuclear explosion signature, and this is discussed by Lowrey et al. (T1.3−P20). The use of xenon-133 to iodine-131 ratios to discriminate nuclear explosions from operational releases emanating from nuclear facilities is considered by Kalinowski and Buhmann (T2.4−P2).
An example of an underground nuclear test that vented is used by Milbrath and Burnett (T2.5−O1) to estimate the detectability of various radionuclides during an OSI from a vent of that magnitude.
7.2.2 NUCLEAR REACTOR
Radionuclide emissions from nuclear power plants must be discriminated from those of a nuclear test in support of source identification. Rocchi et al. (T2.4−P21) consider xenon radioactive isotope signatures from nuclear power plants and their impact on the CTBTO verification regime. Wang and Kalinowski (T2.4−P5) consider how atmospheric xenon observations related to the Fukushima Daiichi nuclear power plant accident, Japan,

62 SCIENTIFIC ADVANCES IN CTBT MONITORING AND VERIFICATION 2017
can be used to better understand IMS observations. Kalinowski and Buhmann (T2.4−P2) consider isotopic ratios of xenon-133 and iodine-131 for discriminating between the signatures of nuclear test explosions and those of operational releases from nuclear facilities.
Calculations of the production of argon-37 in nuclear power plants, and their implications for Treaty verification, are presented by Heise and Kirchner (T1.3−O3), and reactor simulations characterizing xenon isotopic ratios in nuclear power plants are presented by Ross et al. (T2.4−P9).
Quintana (T2.4−P6) describes a new research reactor for medical isotope production in Argentina, and Purtschert et al. (T1.3−O2) discuss the role and origins of argon-37, beryllium-7 and xenon-133 in the atmosphere.
7.2.3 MEDICAL AND INDUSTRIAL ISOTOPE PRODUCTION PLANT
Medical and industrial isotope production facilities are important in CTBT verification because the release of radioactive isotopes from these facilities contributes to the global background, thereby potentially impacting on the detectability of Treaty-relevant radionuclides. Releases from such facilities also represent radionuclide sources that must be discounted in the search for suspicious events. A prime focus is on measuring and mitigating the contribution of radioactive xenon releases to the global radioactive xenon background (see SECTION 8.1.2), and meetings of the Workshops on Signatures of Medical and Industrial Isotope Production (WOSMIP) are held for this purpose. In this context Bollhöfer et al. (T2.4−O1) discuss the identification of civil xenon emissions ‘from source to receiver’. Friese et al. (T2.4−O2) (FIGURE 7.3) explore methods for understanding radioactive xenon civilian source terms under the programme ‘Source Term Analysis of Xenon’ (STAX).
The emission of radionuclides from isotope production facilities can be monitored – this is conventionally referred to as stack monitoring. Baré et al. (T2.4−P13) discuss the analysis of stack monitoring data and its expected outcomes. di Tada et al. (T2.4−P14) describe the start-up and calibration of the INVAP stack monitor, Argentina. Carranza (T2.4−P7) also considers radioisotope production in Argentina, including improvements to reduce the emission of radioactive xenon.
When steps are taken to sequester radionuclides (in particular noble gases) at source, this is often referred to as a radionuclide ‘trap’. Baré et al. (T2.4−P8) describes a prototype radioactive xenon trap and its validation, and Gueibe et al. (T2.4−P10) describe results and outcomes in xenon mitigation under the same project.
Releases can also be inferred from simulations. Gheddou et al. (T2.4−P12) present SIMPAX, a prototype software application simulating the impact of radioactive xenon emissions from civil sources on IMS stations.
Releases from known sources contribute to the global radionuclide background. Simulation of activity concentrations can be made, based upon estimated annual releases from such sources. Gueibe et al. (T2.4−P11) present results for four radioactive xenon isotopes. Shah et al. (T2.4−P15) describe a statistical method for estimating global isotope releases and their effect on nuclear test detection.
FIGURE 7.3 Xenon isotopic ratios can be used to discriminate between weapons-related and other sources using the Kalinowski discrimination line shown in red. Nuclear weapons related data are shown in blue, and data from nuclear reactors and medical isotope production in green. However, Friese et al. (T2.4−O2) point out that signatures of medical isotope production facilities can overlap the discrimination line (see figure), and can be difficult to clearly separate from weapons-related sources. The authors conclude that xenon background arising from medical isotope production reduces the IMS monitoring sensitivity and ability to clearly distinguish Treaty-relevant sources. From Friese et al. (T2.4−O2). Graph reproduced from M. Matthews et al., “Workshop on Signatures of Medical and Industrial Isotope Production—A Review”. PNNL-19294, 2010.

SECTION 7 — INTERPRETATION 63
7.3 IDENTIFICATION OF NUCLEAR EXPLOSIONS
7.3.1 IDENTIFICATION OF EXPLOSIONS USING WAVEFORM DATA
The identification of nuclear explosions from waveform data depends upon recognizing the differences between the waveform signatures of explosions and those of other sources (chiefly earthquakes), and if possible excluding these other sources as a possible origin of the observations. An overlap between this section and
SECTION 7.1 is therefore inevitable. The term ‘event characterization’ is often used to mean the identification of a source as an explosion (or earthquake), and this term appears in the title of many relevant presentations.
Papers on methods of event characterization include those of Rabin et al. (T3.7−P10), who present non-linear kernel methods, and Bregman et al. (T3.7−P3) who apply diffusion maps to event characterization in Israel. Classification of individual seismograms using covariance is presented by Winsala et al. (T3.5−P49).
It is natural that many presentations focus on the announced DPRK nuclear tests, since few large underground explosions are available for observational
FIGURE 7.4 Moment tensor inversions of seismograms recorded at eight regional stations (red triangles on map) from four announced DPRK nuclear tests, using three P- and S-wave velocity models (red, green and blue at top right) and depth set at 1km, presented by Guilhem Trilla and Cano (T2.1−O3). These reveal sources that are predominantly explosive, and the authors confirm this using sensitivity tests made by testing random moment tensors against the seismic data (lower image), in which moment tensor space is displayed on source type plots according to Hudson, Pearce and Rogers, J. Geophys. Res. 94, 765–774, (1989). (The source type plot displays moment tensors in a qualitatively similar way to the lune used in FIGURE 7.1.).

64 SCIENTIFIC ADVANCES IN CTBT MONITORING AND VERIFICATION 2017
testing of theoretical concepts proposed for source identification. Guilhem Trilla and Cano (T2.1−O3) consider the use of moment tensor inversions of regional seismic observations to constrain the explosive nature of the DPRK nuclear tests (FIGURE 7.4). Ziolkowski (T2.1−O6) estimates the source time functions and explosive yields of the 9 October 2006 and 25 May 2009 DPRK nuclear tests. Rohadi et al. (T2.1−P4) consider the focal mechanism of the 6 January 2016 announced test. Kim et al. (T2.1−O1) use teleseismic array observations to determine source characteristics and accurate depth estimates of the DPRK nuclear tests, and Assink et al. (T2.1−O10) use seismic and infrasound observations to estimate their depth.
Of special interest are any small earthquakes that occur near the DPRK nuclear test site, since differences related to the media through which the seismic waves travel are then minimized. Jo et al. (T2.1−O5) consider the detection and discrimination of small earthquakes and explosions around the DPRK nuclear test site. The possibility that one of these nuclear tests triggered aftershocks has received some attention, but Jin et al. (T2.1−O9) infer that the tests may have triggered immediate non-explosive events, superposed on the recordings of the explosion. This is inferred from estimated moment tensors, which suggest a non-explosive component.
Identification of chemical explosions carried out at NNSS from their source parameters determined using an equalization technique is presented by Saikia et al. (T2.3−P9), and the comparison of moment tensors estimated for earthquakes, volcanic events and nuclear explosions by Alvizuri et al. (T2.3−P8) provide an assessment of the identification of explosions by this means. The influence of the type of explosive on the seismic signature of chemical explosions, and hence upon the ability to characterize the source, is studied by Stroujkova et al. (T2.3−P1) who present experimental results from a field study.
Infrasound can also contribute to the identification of underground explosions. This is considered by Kolesnykov and Liashchuk (T3.5−P23).
7.3.2 IDENTIFICATION OF NUCLEAR EXPLOSIONS USING RADIONUCLIDE DATA
Radionuclide observations offer the prospect of identifying a nuclear explosion unequivocally. However, in the case of a nuclear explosion underground, this depends upon the escape of radionuclides from the site of
the explosion into the atmosphere, and their subsequent detection at one or more radionuclide stations, followed by a reliable attribution of the observations to a time and place consistent with other evidence. The release of radionuclides from underground nuclear tests has therefore become the focus of much work, with particular importance placed upon radioactive noble gases, which offer the best prospect for migration of radionuclides to the surface. The radionuclide signature of a nuclear explosion is considered in SECTION 7.2.1, so an overlap with this section is expected.
For IDC radionuclide products from IMS stations, an initial indication of whether a radionuclide observation may be from a nuclear explosion is provided by the category assigned to the gamma ray spectrum. Le Petit et al. (T2.4−P17) consider possible improvements to the IMS categorization scheme for noble gas spectra.
The attribution of radionuclide observations to a source location and time depends crucially upon ATM, which is covered in SECTION 6.3.3. Kusmierczyk-Michulec and Kalinowski (T2.1−P6) present ATM performed in response to the DPRK tests on 6 January and 9 September 2016, and Ross and Ceranna (T2.1−P5) consider the assessment of the likelihood of detecting radionuclides released from the DPRK test site. The ratio of concentration of isotopes can in principle be used to infer the origin time of a nuclear explosion, but such calculations must correct for the background concentrations of these radionuclides. Yamba et al. (T3.5−P32) consider the use of xenon isotope activity ratios to determine event origin time in the knowledge of atmospheric background.
7.3.3 EVENT SCREENING FOR IDC PRODUCTS
Event screening is the application of approved criteria to identify, and hence ‘screen out’ events that are considered to be consistent with a natural, or non-nuclear man-made event11. Experimental event screening criteria have always been applied to appropriate events in IDC processing, to generate the Standard Screened Event Bulletin, but it is recognized that further work is needed to strengthen these criteria, and to ensure that decision lines do not allow the screening out of any potentially suspicious event under the Treaty.
There were no presentations at SnT2017 dedicated to waveform event screening methods, but ‘expert technical analysis’, which is provided for under the Treaty13
according to defined procedures to further analyse an

SECTION 7 — INTERPRETATION 65
event that is suspicious, is a related obligation that the IDC must be prepared for after entry into force of the Treaty. Stachnik et al. (T3.5−P17) describe improvements that have been made to the IDC’s capability to provide expert technical analysis.
The categorization of radionuclide spectra, also performed using approved criteria, is a concept analogous to waveform event screening, because it provides an indication of whether a spectrum may be potentially suspicious. The categorization of radioactive noble gas spectra is less mature than for particulate spectra because of the shorter time the network has been operating. Le Petit et al. (T2.4−P17) discuss possible improvements to the noble gas categorization scheme based upon the analysis of ten years of data by NDCs.
7.3.4 NOVEL METHODS FOR SOURCE IDENTIFICATION
Infrasound and atmospheric gravity waves may be excited by large earthquakes. These can propagate to high altitude, and if large enough can penetrate the ionosphere, creating perturbations in electron density that in turn perturb the velocity of electromagnetic waves. This can be measured through the time delay of GPS signals that pass through the ionosphere by detecting the carrier wave. Results are normally expressed as the total electron content (of the ray path from source to receiver) which can thus act as a proxy for the waves of interest. Rohadi et al. FIGURE 7.5 (T3.3−P5) investigate the possibility of applying this to the detection and identification of underground nuclear tests, though the effect may be much smaller than for a large earthquake. Garrison et al. (T3.1−P32) describe how detectability can be improved using a large GNSS receiver network, which would also allow the passage of the disturbances to be followed in more detail.
The direct observation of ground displacement associated with large earthquakes, using remote-sensing radar interferometry, can in principle be used to refine the location of the causative event. Hartmann et al. (T3.3−O1) apply this to the DPRK announced nuclear tests.
Nuclear explosions are characterized by the emission of an electromagnetic pulse (EMP) via the Compton effect, in which photons are inelastically scattered by electrons. EMP provides a discriminant between nuclear explosions and chemical explosions. However, non-explosive sources of EMP are dominated by lightning
strikes, which are omnipresent worldwide. Lipshtat et al. (T3.5−P48) propose overcoming this problem by combining EMP measurements with infrasound, to eliminate the lightning strikes.
Dalnoki Veress et al. (T3.1−P40) consider the feasibility of detecting antineutrinos as an alternative means of identifying a nuclear test. Practical problems with the necessary detector infrastructure are considered, with suggestions for their mitigation.
FIGURE 7.5 Flow chart of ionospheric wave monitoring system using GPS data. Acoustic coupling from the lithosphere, creating atmospheric gravity waves that couple into the ionosphere, can be detected in the ionosphere using GPS signals (specifically receiver independent exchange format (RINEX) files as referred to above) to calculate the total electron content (TEC). From Rohadi et al. (T3.3-P5).

66 SCIENTIFIC ADVANCES IN CTBT MONITORING AND VERIFICATION 2017
SECTION 8 — CAPABILITY, PERFORMANCE AND SUSTAINMENT 67
8 Capability,PerformanceandSustainment
INTRODUCTION
SECTION 8 deals with issues that relate to the quality, performance and sustainability of the CTBT verification system, and its overall effectiveness. The topics in this section are addressed from an independent standpoint, standing back and taking a broad approach. The overall capability of the verification system, together with analysis of factors that affect its performance and sustainment, are considered separately following the convention of modern performance assessment. SECTION 8 covers both performance-related methodologies, and results from studies of the system’s capability, performance and reliability.
Contributions on the accuracy and validity of results obtained from methods to determine properties of the earth, or the validity of the methods themselves, are considered together with the description of those methods in SECTION 6. This applies, for example to the determination of seismoacoustic wave-speed fields.

68 SCIENTIFIC ADVANCES IN CTBT MONITORING AND VERIFICATION 2017
8.1 BACKGROUND SIGNALS AND NOISE
8.1.1 SEISMOACOUSTIC
Seismic noise may be classified as naturally occurring, (dominated by the oceanic microseismic noise peaks at periods if 2 s and 6 s) or anthropogenic ‘cultural’ noise, which is typically of high frequency with a relatively short range. An important new source of anthropogenic seismoacoustic noise is wind turbines, which are typically installed in large numbers to create the wind farms that are now common in rural areas and which have become a significant issue at several IMS stations. Erkan (T3.5−P24) considers the importance of noise levels at various types of IMS facility, and Mackey et al. (T3.1−P5) describe a seismic noise survey in western Kazakhstan.
For the hydroacoustic network, and hydrophone stations in particular, submarine volcanic activity can introduce noise, and Metz et al. (T1.4−O5) study submarine volcanic activity and its implications for ocean acoustic noise.
Background noise at infrasound stations is dominated by that from wind, and various devices are routinely used in the design of the station to mitigate such noise. Kramer and Marty (T3.1−P41) provide a review of the wind noise reduction systems employed in the IMS infrasound network. Wind noise can affect seismic stations as well as infrasound stations, and Martysevich and Starovoyt (T3.5−P56) consider the transfer mechanism that results in the appearance of wind noise on seismic signals.
Another source of noise in infrasound signals can arise from the fracturing of glaciers as they flow, and this is considered by Evers and Smets (T1.1−O5) applied to northwest Greenland. Atmospheric weather fronts can introduce another source of infrasound noise, in addition to gravity waves, and this is considered by Golikova and Kulichkov (T1.1−P19).
8.1.2 RADIONUCLIDE
The major factor to be considered in the radionuclide background is alternative sources of CTBT-relevant radionuclides. The IMS noble gas network has become a particular focus of attention in view of its potentially prominent role in the identification of underground nuclear tests, and this attention has focused especially on the background of radioactive xenon, partly in
view of the significant contribution from radioisotope production facilities. This is turn has led to discussions on the measurement of radioactive xenon releases from such facilities, and on the possibility of reducing such releases, for example by sequestering radioactive xenon before it is released. The measurement of such releases provides valuable data to test atmospheric transport models and other processes to identify and locate radionuclide sources; the reduction of such releases impacts favourably on the global radioactive xenon background, thereby improving the global detection threshold for potentially Treaty-relevant observations of radioactive xenon isotopes (SECTION 8.2.2).
Elbahrawy and Mekhaimr (T2.4−P3) present a description and analysis of the global background of CTBT-relevant radioactive xenon isotopes between 2010 and 2016, and Gheddou et al. (T2.4−P18) provide an updated global background of CTBT-relevant radioactive xenon isotopes.
The influence of small scale sources of radioactive xenon on the background levels at IMS stations is considered by Schoeppner et al. (T1.3−P14). Bollhöfer et al. (T2.4−O1) (FIGURE 8.1) present a contribution on the identification of radioactive xenon emissions from source to receiver. The understanding of civilian sources of radioactive xenon emissions is pursued by Friese et al. (T2.4−O2) (FIGURE 8.2).
The Fukushima Daiichi nuclear power plant accident in Japan provided an unplanned source of radioactive xenon. Wang and Kalinowski (T2.4−P5) consider how observations of this can be used to better understand IMS observations more generally.
FIGURE 8.1 Some anthropogenic radioactive xenon sources in the European region: nuclear power plants and research reactors, with a medical isotope production facility circled in orange. (Some collaborating institutions relevant to the authors are shown in blue.) From Bollhöfer et al. (T2.4−O1).

SECTION 8 — CAPABILITY, PERFORMANCE AND SUSTAINMENT 69
Carranza (T2.4−P7) describe radioisotope production in Argentina, with a focus on improvements to reduce the emission of radioactive xenon. A new research reactor for medical isotope production in Argentina is described by Quintana (T2.4−P6) (FIGURE 8.3).
The measurement of radioactive xenon emission from radioisotope production facilities may be achieved by installing measuring equipment in the emission stack. Scarinci et al. (T2.4−P4) describe the design of such a monitor as used in a radioisotope production facility in Argentina, and experience of its operation. The analysis of data obtained from stack monitoring, and the expected outcomes from such analysis, are discussed by Baré et al. (T2.4−P13).
Projects to investigate the background of radioactive xenon and means to mitigate it, have been funded by the European Union (EU). Results and outcomes in regard to radioactive xenon background mitigation funded under EU Council Decision V are described by Gueibe et al. (T2.4−P10). Baré et al. (T2.4−P8) describe the validation of a prototype radioactive xenon trap designed to reduce the amount released.
The simulation of activity concentrations based upon estimates of the annual release from known sources is presented by Gueibe et al. (T2.4−P11), and Gheddou et al. (T2.4−P12) present a prototype software application to simulate the impact of radioactive xenon emissions from civil sources on IMS stations.
The seasonal variation of xenon-133 atmospheric background is discussed by Generoso et al. (T2.4−O3), with implications for the performance of the IMS radionuclide network.
The ratio of concentrations of a pair of isotopes can provide information on the time of a radioactivity release. Yamba et al. (T3.5−P32) explore the use of xenon isotopic activity ratios, given the level of atmospheric background observations. Plastino et al. (T3.5−O2) report on beryllium and xenon time series analysis, and present a new approach to ATM at all scales.
Xenon is not the only CTBT-relevant noble gas, especially in the context of OSI; another is argon. McIntyre (T2.2−P7) presents measurements of argon-37 background at the NNSS, USA, and Heise and Kirchner (T1.3−O3) present calculations on the production of argon-37 in nuclear power plants, bearing in mind the contribution of this to the background. In the presence of high background, it might be useful to seek a coincident signature of argon-37 and radioactive xenon isotopes as an indicator of a nuclear test; this possibility
is considered by Bowyer (T1.3−O8). In any case, the background of these noble gases has a bearing on the detectability of an anomalous observation indicative of a release from a nuclear test. Purtschert et al. (T1.3−O2) consider the background of argon-37, beryllium-7 and xenon-133 in the atmosphere.
Another radioactive noble gas isotope is krypton-85. Dubasov et al. (T2.5−P1) report on krypton-85 monitoring in the north-western region of the Russian Federation. Terzi et al. (T2.4−P19) consider radioactive noble gas
35% HPGe Stack Monitoring System
Lead shield100mmLid 75 mmcopper lining
FIGURE 8.2 Stack monitors for measuring radioactive xenon releases from isotope production facilities. Upper left: Batan, Indonesia. Upper right: Australian Nuclear Science and Technology Organization. Lower left: Institute for Radioelements, Belgium. Lower right: INVAP, Argentina. The last three were presented at WOSMIP 2012 by Hoffmann, Deconnick and Di Tada respectively. From Friese et al. (T2.4−O2).
FIGURE 8.3 New research reactor for medical isotope production in Argentina, scheduled to be commissioned in 2020. From Quintana (T2.4−P6).
70 SCIENTIFIC ADVANCES IN CTBT MONITORING AND VERIFICATION 2017
concentration maps determined from IMS data, and their possible research uses.
The atmospheric background of other radionuclides, in particular radionuclide particulates, is also of importance in the interpretation of anomalous measurements at IMS stations, or in the context of OSI radionuclide measurements. Dubasov and Gavrilin (T2.2−P14) consider variations in the background of caesium-137 in the context of OSI measurements, while Al-Qadeeri et al. (T1.3−P21) consider sources and concentrations of caesium-137 in Kuwait. Global seasonal variations in atmospheric beryllium-7, related to variations in large-scale atmospheric circulation, are discussed by Terzi et al. (T1.5−O6). Sanogo and Yamba (T1.3−P16) study the lanthanum-140 and barium-140 background at IMS radionuclide particulate stations.
Contributions to the global background of isotope releases, and their effect on the detection of nuclear tests by radionuclide observations, is studied statistically by Shah (T2.4−P15). Additional studies of radionuclide background in specific locations include the detection of background gamma radiation in the northern Marshall Islands by Bordner (T2.5−P3), and the profile of radionuclide particulate monitoring in Indonesia by Nugraha et al. (T1.5−P9). Watt and Kalinowski (T1.5−P19) consider the use of IMS data in the monitoring of atmospheric radioactivity following the Fukushima Daiichi nuclear power plant accident in Japan, and Puzas et al. (T2.1−P13) consider radioactive fallout inhomogeneity over small and medium scales in meadows and forests. The potential detection of low-level particulate isotopes from new civilian nuclear processes is considered by Miley et al. (T2.1−O7).
8.2NETWORK CAPABILITY
8.2.1 SEISMOACOUSTIC EVENT LOCATION THRESHOLDS
Whereas an individual station offers a signal detection capability that depends upon the background noise level at the station and the properties of that noise, the event location threshold is a property of the whole seismic network, and depends additionally upon the distribution of stations within the network. This is discussed by Gaebler and Ceranna (T3.5−P12), taking the status of the IMS seismic network in 2013. The event location threshold can of course be enhanced by incorporating additional stations. Larsen et al. (T5.4−O3) identify a
range of benefits in combining data recorded at IMS seismic stations with those from local stations. Also of importance is assuring that metadata, for example calibration parameters, are not in error. Burk and Mackey (T3.1−P24) consider this aspect.
The question of event location threshold is equally important on a local scale, for example in an OSI exercise in which a seismic network is deployed. Kriegerowski et al. (T3.4−O3) consider the example of IFE14, where the SAMS seismic network was deployed. This gave an opportunity to examine small earthquakes recorded along the Dead Sea transform fault.
8.2.2 RADIONUCLIDE NETWORK CAPABILITY
The capability of the IMS radionuclide network is intimately related not only to the detection thresholds at each station but also to the prevailing atmospheric transport, since it is the atmospheric transport that determines the subset of stations that receive air from the location and time of a given source. Although atmospheric transport is highly dynamic, it is dominated by (largely seasonal) patterns that may favour the transport of air from particular source locations to specific stations. Simulations have shown that a uniform distribution of stations may therefore not be optimal as a result, though variability in prevailing atmospheric transport patterns may render it difficult to design an optimum network of stations. Glascoe and Lucas (T3.5−P33) describe a process to optimize the distribution of stations within a network using Bayesian methods and genetic algorithms.
Nevertheless, a precondition is that detection thresholds at individual stations do not deteriorate, and to that end, quality control over the whole network is important. Nava et al. (T4.1−P21) describe the IMS radionuclide network quality control programme.
Various steps can be taken to enhance network capability through better analysis of individual samples. Gheddou et al. (T2.1−P17) consider the summing of particulate and noble gas gamma ray spectra to improve detection sensitivity and to reduce statistical uncertainty. Potentially relevant anomalous radionuclide observations may be sent for reanalysis at one or more IMS radionuclide laboratories, under procedures elaborated in the draft Operational Manuals. Buhmann et al. (T4.1−P6) consider constraints imposed by the length of transport time and minimum detectable activity on the analysis of low activity samples at IMS radionuclide laboratories.

SECTION 8 — CAPABILITY, PERFORMANCE AND SUSTAINMENT 71
8.3PERFORMANCE, QUALITY AND VALIDATION
Performance, quality and validation comprise a range of steps that must be taken to ensure that the whole system, from data recording to the interpretation of results, is compliant and meets all relevant specifications and requirements. This may include addressing individual components such as sensors, software or analyst activity, or may take a ‘whole pipeline’ approach by focusing on IDC standard products given the data that have been recorded. Many diverse methods may be required to assess the performance and quality of complex functions such as those of the IMS, IDC and OSI components. The Treaty and draft Operational Manuals themselves impose strict requirements in the fields of performance, quality and validation.
The relevant SnT2017 contributions can be classified in various ways, but it is simplest to classify them by technology. Beginning with seismology, Guralp et al. (T3.1−O3) measure the performance of a multi-parameter borehole instrumentation system (Marsite). Brouwer and Kitov (T4.1−P12) consider means to measure and improve the detection quality of IMS primary seismic stations. Ahern et al. (T4.1−O6) (FIGURE 8.4) consider the quality assurance of ground motion data using the Incorporated Research Institutions for Seismology (IRIS)
MUSTANG system. Jih and Wagner (T3.5−P52) describe opportunities for the evaluation and calibration of USGS and IMS seismic networks using the US Navy’s ‘full ship shock trials’. Otsuka et al. (T3.1−P35) consider the calibration of IMS seismic and hydroacoustic T-phase stations (which also use seismometers).
The RSTT model that is being refined with the incorporation of regional wave-speed model variations is undergoing evaluation. This is described by Myers et al. (T5.4−O5). Another quality control initiative is to improve the accuracy of metadata (such as calibration factors) associated with seismic networks; this is described by Burk and Mackey (T3.1−P24).
On infrasound, the wind noise reduction systems are essential in the optimization of data quality. Measuring the effectiveness of the wind-noise reduction system of IS48 (I48TN) in Tunisia is considered by Friha (T4.1−P22).
The REB is the main reviewed IDC product in the waveform technologies. Kitov and Rozhkov (T4.1−O2) describe work to assess the consistency, quality and completeness of the REB using waveform cross-correlation. An assessment of the quality of interactive analysis contributing to the REB for September 2016 is presented by Vila Codina et al. (T4.1−P2).
FIGURE 8.4 The archive of the IRIS Data Management Center contains 444 terabytes of data as of 1 June 2017, and is growing by 75 terabytes per year. It contains over 22 million station day files. The archive begins in 1970 and contains data from 34,019 stations, of which data are received in real time from 3,500 stations as of 15 June 2017. The assessment of data quality is necessarily automated. From Ahern et al. (T4.1−O6).

72 SCIENTIFIC ADVANCES IN CTBT MONITORING AND VERIFICATION 2017
FIGURE 8.5 Upper left: airborne AISA Eagle hyperspectral optical sensor. Upper right: testing and operating an airborne optical system under laboratory conditions. The testing environment offers precise system calibration, system integration tests, hands-on training and fundamental research. Lower from left: full colour (RGB) images taken of wheat grass; RGB images converted to colour infrared (CIR); greyscale images based on normalized difference vegetation index (NDVI); NDVI-based background removal. From Szalay et al. (T3.1−P6).
Also important in quality control is timeliness in the servicing of requests from authorized users for IMS waveform data, as specified in the draft IDC Operational Manual. Difficulties in the measurement of this timeliness are presented by Mulwa (T4.1−P24).
The quality control programme for the IMS radionuclide network is described by Nava et al. (T4.1−P21). RASA is one system used in the IMS for the detection and analysis of particulate radionuclides. Bustillo et al. (T3.1−P9) describe the automated testing of the RASA software development environment. Performance monitoring of the radionuclide noble gas measurement system SPALAX is described by Topin et al. (T3.1−O5). Ringbom et al. (T2.4−P1) analyse performance data from an intercomparison between a SAUNA II radioactive xenon detection system and a SAUNA III system running in parallel. A comparison of analysis methods used to identify radioactive xenon isotopes is presented by Sivels et al. (T3.5−P6).
The performance of radionuclide detectors is considered by Fritioff et al. (T3.1−P31) in relation to
the new beta detector in SAUNA III, and by Wiens et al. (T4.1−P15), who consider the failure of HPGe detectors. The examination of OSI radionuclide laboratory detector response is described by Friese and Pierson (T2.2−P9).
Quality assessment of meteorological data gathered at IMS radionuclide stations is described by Seibert et al. (T4.1−P17). A performance assessment of the high resolution ATM used at the IDC is presented by Schoeppner et al. (T1.3−P19), and Szalay et al. (T3.1−P6) describe a testing environment for airborne optical sensors (FIGURE 8.5).
Several presentations consider generic issues in the monitoring of performance. Junek et al. (T3.1−P20) describe the development of performance metrics at the NDC of the USA through large scale analysis of system log files using distributed file-system-based tools. The performance of IMS stations and of the transmission of data can be measured through data availability. Poindexter et al. (T4.1−O1) describe a new approach to data availability, pointing out that it has uses other than as a performance metric.
SECTION 8 — CAPABILITY, PERFORMANCE AND SUSTAINMENT 73
Suarez et al. (T4.1−P1) present advances in state of health analysis of IMS facilities. The most expensive IMS facilities to install are hydrophone stations, and Cekada and Cummins (T1.4−P7) provide an example of risk management and programme execution for the project to install the IMS hydroacoustic station HA04, Crozet Islands, France. Edwald et al. (T4.1−P3) consider the potential applications of business intelligence software to support performance monitoring and other CTBTO functions. Sharp (T4.1−O4) presents an aid to system design and support in the form of a ‘digital twin’, which acts as a simulation of an equipment item to support the operation of the real entity.
Annual NPEs provide an opportunity for NDC led performance measurement of NDCs. These exercises have included hypothetical scenario events that utilize real IDC signals and events combined with simulated data, usually radionuclide observations. Ross et al. (T3.6−O1) present ATM and radionuclide analysis for the NPE2015 scenario, and Gestermann et al. (T3.4−P10) present seismological investigations for NPE2016.
Annual proficiency test exercises (PTEs) are carried out for IMS radionuclide laboratories. Britton and Davies (T3.2−P2) describe gamma–gamma coincidence analysis of the 2015 proficiency test exercise (PTE) at the UK IMS radionuclide laboratory.
8.4 SUSTAINMENT
Maintaining IMS, IDC and OSI infrastructure to the standards and reliability required by the draft Operational Manuals presents a range of challenges. This subject has not traditionally formed a major part
of SnT contributions, though at SnT2017 there was an increased interest. Central to sustainment is the reliability and durability of equipment. Starovoyt et al. (T3.1−P25) describe IMS equipment challenges in the three waveform technologies.
The life cycle of specific equipment items, and of whole installations, is closely aligned to sustainment, as decisions must be made on the point at which it becomes desirable or necessary, either for technical reasons or for reasons of cost, to replace or upgrade rather than repair. Given such descriptors as mean-time between failure, the life cycle can be modelled, and Benicsak and Foster (T4.1−P14) consider the data required for life cycle modelling in the context of the IMS.
The operators of IMS stations have essential practical experience of equipment reliability. Ferro and Pantín (T5.4−O2) describe the experience of Autoridad Regulatoria Nuclear (ARN) in operating and maintaining IMS radionuclide stations in Argentina, and Akech (T4.1−O3) considers cost optimization in the maintenance of the IMS primary seismic station PS24 (KMBO) and infrasound station IS32 (I32KE) in Kenya.
One of the largest station operators is the Air Force Technical Applications Center (AFTAC), USA, and Poindexter and Martin (T4.1−P11) consider the optimization of their configuration management process in the context of sustainment.
It is possible to develop a model of the operability and reliability of equipment items; this can be useful for testing and for developing a sustainment strategy. Sharp (T4.1−O4) describes the concept of a ‘digital twin’ for use in system design and support.

74 SCIENTIFIC ADVANCES IN CTBT MONITORING AND VERIFICATION 2017

SECTION 9 — SHARING OF DATA AND KNOWLEDGE 75
9 SharingDataandKnowledge
INTRODUCTION
Verification of the CTBT after it enters into force will be the responsibility of CTBTO Member States. It is therefore essential that all Member States have the capacity to play their full part in both the technical and political aspects of the verification regime. In particular, Member States on the CTBT Executive Council will receive challenges under the Treaty, and have to take decisions on how to proceed, including the procedure of Consultation and Clarification14, and potentially whether an OSI should be conducted.
For these purposes the CTBTO has a major role in building global capacity in CTBT verification-related science and technology. This goes hand in hand with the training of station operators, who are responsible for operating IMS stations and whose work is essen-tial to ensure the reliable flow of high quality data to IDC and to States Signatories. Contributions in sup-port of these aims are included in SECTION 9. The broader issues of science and technology in support of policymaking are covered in SECTION 10.

76 SCIENTIFIC ADVANCES IN CTBT MONITORING AND VERIFICATION 2017
9.1 BUILDING GLOBAL CAPACITY
The RSTT initiative aims at an improved seismic wave-speed field, especially for shallower depths that determine the travel times of seismic waves at local and regional distances. The initiative depends upon the collation of existing estimates of seismic wave speed in different regions, and the use of seismological and other data to compute new or improved estimates. These efforts offer a good opportunity to engage with experts for the purpose of capacity building, outreach and training, while at the same time maximizing the regional wave-speed data that can be incorporated into the RSTT model. Myers et al. (T5.4−O5) describe this work (FIGURE 9.1).
Capacity building can take many forms. Gok et al. (T3.5−P39) describe a capacity building initiative in the USA which saw the installation of seismic arrays in Saudi Arabia and Oman. Ouedraogo (T5.4−P22) focuses on the role of capacity building in increasing public awareness, while Muturi (T5.4−P23) considers public awareness specifically of NDCs in Africa. The significance of NDCs that have been established in West Africa is outlined by Amponsah and Akor (T5.4−P31). NDCs are closely linked to the work of CTBTO, and Moutinho Silva et al. (T5.4−O1) present a proposed new framework for expanding NDC capacity building.
Other authors refer to sources of information for building up the state of knowledge on CTBTO related science. Maceira et al. (T5.4−O7) (FIGURE 9.2) refer to the US report “Trends in Ground-Based Nuclear Explosion
FIGURE 9.1 Outreach efforts between 2012 and 2016 to improve the RSTT model using local and regional seismic data in different parts of the world. CTBTO workshops and training courses are shown in blue, and special sessions on 3D seismic wave-speed models at external scientific meetings are shown in green. From Myers et al. (T5.4−O5).
FIGURE 9.2 A schematic showing the elements of physics-based monitoring technologies used by Maceira et al. (T5.4−O7).

SECTION 9 — SHARING OF DATA AND KNOWLEDGE 77
Monitoring Research & Development – A Physics Perspective”, a lengthy publicly available assessment of the state of knowledge in this field published by the US Department of Energy. Doll et al. (T2.4−P20) refer to the outcomes of WOSMIP 6, in which results from cooperation between the nuclear explosion monitoring and radioactive isotope production communities have been made available.
A further contribution in the field of capacity building is provided by Edwald et al. (T4.1−P3), who propose that business intelligence software could be used as a self-service data analysis platform, especially for performance monitoring, making such work feasible in the absence of specialist information technology support.
9.2 COLLABORATION IN TRAINING INITIATIVES
The provision of training is an important part of CTBTO’s activity, for example to ensure high quality maintenance of IMS stations, to effectively operate IMS facilities, to empower NDCs to perform effective data processing and analysis of IMS data in support of Treaty verification, and to ensure informed contributions by the widest range of Member States to the deliberations of the Executive Council after the Treaty has entered into force. This involves not only technical training, but education on legal aspects of the Treaty, and the political context of the processes of monitoring and verification.
Many NDCs use educational tools provided by CTBTO. Amartey et al. (T5.4−P7) explain the use of CTBTO materials in NDC training, and Agrebi et al. (T5.4−P19) present a contribution on the NDC training of analysts. Bisallah and Madu (T5.4−P10) consider how to expand the use of CTBTO educational resources in West Africa, and Nadine Yolande and Tjombe (T5.4−P6) describe cooperation between Cameroon, CTBTO and others in capacity building, training and public awareness.
To improve education on the political and diplomatic context of CTBT verification issues, simulations in which participants are required to develop a discussion and outcome based on an initial international relations scenario have become popular. Mikhaylenko and Muratshina (T5.4−P2) describe a semester-long simulation course as a method of developing students’ professional skills.
The ‘massive online open course’ (MOOC) is an internet based education method that can be used to promote the expertise of CTBTO related topics. Sens and Yedlin (T5.4−O4) report on such a course covering nuclear weapons and arms control.
9.3 NATIONAL EXPERIENCES
A review of the experiences of authors in different States serves to provide anecdotal evidence of the level of engagement in nuclear monitoring in different regions and in different communities. As the following examples show, there are many ways in which the data, products, training programmes and other outputs of CTBTO can have an influence on NDCs and on other stakeholders around the world.
Beginning with Europe, Kysel et al. (T2.5−P5) describe the use of the seismic stations of the Slovak Academy of Sciences to record nuclear test explosions, and Goodwin (T3.5−P13) describes developments in radionuclide analysis at the UK NDC.
In the USA, configuration management of the large monitoring network within AFTAC is the focus of Poindexter and Martin (T4.1−P11), who consider the identification and evaluation of resource constraints in its configuration management system. In South America Gomez Gomez (T3.1−P12) describes the Colombia seismological network and its challenges, and Amierali (T3.5−P10) consider the support to CTBT monitoring practised by the NDC of Suriname. Ferro and Pantín (T5.4−O2) describe their experience of operating and maintaining IMS radionuclide stations RN01 (ARP01) and RN03 (ARP03), and plans for the installation of RN02 (ARP03).
Selected research activities of the NDC of Turkey are described by Necmioglu et al. (T4.1−P19). Ghalib et al. (T3.5−P2) describe the advancing of seismological practice in Iraq, while Al-Abboodi (T5.4−P21) describe potential benefits of the CTBTO to that country. Activities at the Jordan Seismological Observatory are reported by Mesaad and Olimant (T5.4−P15).
Zasimov et al. (T5.4−P11) describe activities related to the NDC of the Russian Federation. Also in the Russian Federation, Mikhaylenko and Muratshina (T5.4−P2) describe a course run by the Urals Federal University in international relations, in the context of CTBT verification.

78 SCIENTIFIC ADVANCES IN CTBT MONITORING AND VERIFICATION 2017
CTBTO data processing software designed for use by NDCs is referred to as ‘NDC in a box’. Kolesnykov et al. (T3.5−P11) report on their use of this software, and its installation on a cloud platform.
Aben (T5.4−P30) considers the general question of the role of small States in the monitoring of nuclear explosions, from the perspective of Kazakhstan. Two presentations are devoted to activities in Kyrgyzstan: Pershina and Berezina (T5.4−P26) describe seismic monitoring and data analysis, while Berezina and Sokolova (T2.5−P9) focus on seismic observations of events near to nuclear test sites in Asia recorded at the IMS seismic station AS060 (AKK) in that country. Dovbysh (T2.1−P18) describes the recording of the 9 September 2016 announced nuclear test in the DPRK at seismic stations in the Ukraine.
A more fundamental topic is addressed by Neog (T5.4−P4), who considers steps to educating the next generation of nuclear experts in India. The value of CTBT-related education to students in Myanmar is the focus of Win (T5.4−P27), and Liu (T5.4−P9) describes education in CTBTO activities at the Beijing Language and Culture University, China. Wang et al. (T4.1−O7) describe the use of a private cloud platform to host the waveform data processing system at the China NDC.
Many contributions address experiences in Africa. Fergany (T3.5−P37) describes the development of seismic monitoring in Egypt, in the context of its extensive seismicity. The value and significance of NDCs established in West Africa are considered by Amponsah and Akor (T5.4−P31), and the implementation of IMS facilities specifically in Senegal is described by Dath et al. (T5.4−P5), including the challenges posed. Mphepo (T5.4−P16) describes the history of the seismic network in Malawi, and the country’s seismicity, while capacity building in Zambia’s NDC is described by Chafwa (T5.4−P24). One aspect of CTBT-related activities is in training and education, and Kadiri et al. (T5.4−P3) describe relevant academic curricula in South Nigeria.
9.4 DATA AND INFORMATION PLATFORMS
At SnT2015 there was a focus on the digitization of historical analogue seismograms relevant to CTBT monitoring. By contrast, SnT2017 saw a broad range of presentations relating to the archiving and sharing of different types of data for different purposes.
Some well established initiatives are included in this field. The CTBTO’s own Virtual Data Exploitation Centre (vDEC) provides IMS data access to researchers; Bisallah et al. (T1.5−P17) describe a strategy to promote the use of vDEC in West Africa. Storchak et al. (T5.4−P32) report on the status of a link established between the International Seismological Centre (ISC) and the CTBTO; the ISC is responsible for the world’s most comprehensive global bulletin of earthquakes and other seismic events.
Several initiatives on infrasound data are reported. These include the European Infrasound Bulletin, described by Pilger et al. (T1.1−P22) (FIGURE 9.3); the automatic detection and cataloguing of global explosive volcanism using the IMS infrasound network, by Matoza et al. (T1.1−P5), and the compilation of an infrasound ground truth database described by Smirnov (T2.3−P4). Garces et al. (T1.5−O2) describe acoustic surveillance and recording of hazardous volcanic eruptions in Asia.
The integration of IMS data with other sources of data forms an important part of the CTBT verification process for NDCs and other entities. Gholami (T4.1−P20) describes the sharing of data from local seismic networks to fill gaps in data coverage that might arise in the IMS network, while Benz et al. (T3.5−P7) describe comprehensive seismic monitoring developments at the USGS National Earthquake Information Centre, USA.
One source of data of importance to radionuclide monitoring is from the isotope production community. Reporting work presented at WOSMIP 6, Doll et al. (T2.4−P20) describe intensified cooperation between the nuclear explosion monitoring and isotope production communities. Galan and Kalinowski (T3.5−P53) report on the recording of updates to parameters related to nuclear decay such as isotope half-lives, which are of particular importance in CTBT monitoring. The establishment of a radioactivity database in the Philippines, in particular the contribution of IMS station RN52 (PHR52) to this, is reported by dela Cruz et al. (T4.1−P7).
Cloud solutions are increasingly used for data storage and data processing. Synytsky and Kolesnykov (T3.5−P25) consider the optimization of service availability that can potentially be achieved using a combination of different cloud service providers.
Following from the use of sensors in smartphones to provide data for earthquake early warning systems, Hertzog et al. (T1.5−O5) consider the wider use of novel data sources, including social media, to corroborate event parameters determined from seismic data.

SECTION 9 — SHARING OF DATA AND KNOWLEDGE 79
FIGURE 9.3 The European Infrasound Bulletin is a compilation of events located using data from non-IMS and IMS infrasound stations in Europe (top left). The distribution of events from 2000 to 2015 is summarised on an event detection density map (top right). Similar plots showing subsets of these reflect the dominance of man-made events (including mine blasts) in the dataset. Second row left: summer (June to August). Second row right: winter (December to February). Third row left: weekdays (Monday to Friday). Third row right: weekend (Saturday and Sunday). Bottom row left: daytime (dawn to dusk). Bottom row right: night time (dusk to dawn). From Pilger et al. (T1.1−P22).

80 SCIENTIFIC ADVANCES IN CTBT MONITORING AND VERIFICATION 2017

SECTION 10 — POLICY AND ADVOCACY 81
10 PolicyandAdvocacy
INTRODUCTION
The fourth SnT conference goal introduced in SnT2017, together with the participation of the CTBTO Youth Group in SnT2017, has helped to give increased prominence to the relationship between science and policy in the CTBT context, and to create a recognition of the importance of advocacy among a broader range of stakeholders. SnT2017 contributions in these fields are covered under this section. There is a close
connection to SECTION 9.1, which focuses on global capacity specifically related to CTBT verification science, including the requirements for operation and sustainment of the CTBT verification system before and after entry into force of the Treaty. SECTION 10 covers the broader issues of public awareness; the relation of CTBT with other treaties; promotion of the CTBT, and other policy issues linked to the science.

82 SCIENTIFIC ADVANCES IN CTBT MONITORING AND VERIFICATION 2017
10.1 SCIENCE IN SUPPORT OF POLICYMAKING
Questions over the verifiability of a CTBT were evident in negotiations since the Conference of Experts was set up in 1958. The recognition that reliable detection, identification and attribution of nuclear tests would require a global technical monitoring network was clear at the beginning, so science inevitably had a prominent role in policymaking.
The interface between the science of nuclear monitoring and relevant policy issues including disarmament policy, has received much attention at recent SnT conferences. Forman (T5.1−O1) presents experience of this from the perspective of a cognate organization, the Organisation for the Prohibition of Chemical Weapons (OPCW).
Saenz and Sánchez Cano (T5.1−P1) consider government policies and global strategic governance for planetary sustainability, control of nuclear energy and the elimination of nuclear tests. Sanchez Cano and Saenz (T5.1−P2) consider a range of public policy issues relating to nuclear energy and the lack of strategic governance for the elimination of nuclear explosions, and associated collateral risks. de Silva (T5.1−P5) focuses on the support for international treaties and the United Nations Sustainable Development Goals, while de Silva (T5.1−O2) considers the comparative roles of global verification and on-site verification.
10.2 ADVOCACY AND OUTREACH
Capacity building, covered in SECTION 9.1, is closely related to both advocacy and outreach. These subjects have a place in the SnT process partly because efforts to achieve universal signature and ratification of the CTBT are crucially dependent upon the role and feasibility of verification, which relies essentially on scientific and technical arguments. Moreover, the verification system itself is global, so must depend upon the support of States worldwide to install, operate and maintain IMS facilities and the associated infrastructure. Awareness of the wide range of additional uses to which IMS data can be put is an integral part of the awareness that must be created of the verification system.
One established way to promote the Treaty is to increase awareness through the dissemination of information and through training courses, and international collaboration
to this end is covered in SECTION 9.2. Mikhaylenko and Muratshina (T5.4−P2) describe a course run by the Urals Federal University in international relations, in the context of CTBT verification, and Nadine Yolande and Tjombe (T5.4−P6) describe cooperation between Cameroon, CTBTO and others in capacity building, training and public awareness. Amartey et al. (T5.4−P7) explain the use of CTBTO materials in NDC training, and Liu (T5.4−P9) describes education in CTBTO activities at the Beijing Language and Culture University, China. Bisallah and Madu (T5.4−P10) consider how to expand the use of CTBTO educational resources in West Africa, and Agrebi et al. (T5.4−P19) present a contribution on the NDC training of analysts. Al-Abboodi (T5.4−P21) describes potential benefits of the CTBTO to Iraq.
Ouedraogo (T5.4−P22) focuses on the role of capacity building in increasing public awareness, while Muturi (T5.4−P23) considers public awareness specifically of NDCs in Africa. The value and significance of NDCs established in West Africa are considered by Amponsah and Akor (T5.4−P31).
The value of CTBT-related education for students in Myanmar is the focus of Win (T5.4−P27), and Aben (T5.4−P30) considers the general question of the role of small States in the monitoring of nuclear explosions, from the perspective of Kazakhstan.
Recent SnT conferences have placed special emphasis on the role of youth in the promotion of the CTBT, and McCarter et al. (T5.4−P34) consider methods to enhance public awareness of the Treaty and the Treaty organization among the world’s youth.
NDCs are closely linked to the work of CTBTO, and Moutinho Silva et al. (T5.4−O1) present a proposed new framework for expanding NDC capacity building.
To promote expertise of CTBTO related topics, the MOOC, an internet based education method, can be used. Sens and Yedlin (T5.4−O4) report on such a course on nuclear weapons and arms control.
In French Polynesia, nuclear tests were conducted at Muraroa and Fangataufa atolls. Ahmed (T5.4−P20) describes a project to gather historical data and artifacts relevant to that nuclear testing programme. One aim is to provide evidence to support public awareness of the effects of nuclear tests, and to support the case for more CTBT ratifications.

SECTION 10 — POLICY AND ADVOCACY 83
10.3 CTBTO IN A BROADER CONTEXT
CTBT is one of many arms control treaties that have been negotiated, either multilaterally, or between States within a region, or bilaterally. The CTBT is different from many such treaties in that it focuses specifically on the testing of potential weapons, and not explicitly upon their prohibition. The relationship of CTBT with cognate treaties such as the Treaty on the Non-Proliferation of Nuclear Weapons forms part of the broader context in which the CTBT exists.
The CTBT sits in the context of several pre-existing treaties that have restricted nuclear testing, either to certain environments (Limited Test Ban Treaty, Seabed Arms Control Treaty, Outer Space Treaty), or to a maximum explosive yield (Threshold Test Ban Treaty), or to certain geographic regions (Antarctic Treaty, Treaty of Tlatelolco, South Pacific Nuclear-Free Zone Treaty, Central Asia Nuclear-Weapon-Free-Zone Treaty, Southeast Asian Nuclear-Weapon-Free Zone Treaty, Treaty of Pelindaba). Dath et al. (T5.1−P3) consider this last treaty, and in particular the potential contributions of CTBTO towards its full implementation.
The interface between the science of verifying a particular treaty, and relevant policy issues, is specific to each treaty and so poses treaty specific challenges. Forman (T5.1−O1) presents experience of this from the OPCW, which is responsible for implementing the provisions of the Chemical Weapons Convention.
The CTBT provides for a verification system comprising the global IMS complemented by OSI. It is envisaged that the IMS, perhaps together with other evidence obtained through national technical means, would identify a potential suspicious event, and the CTBTO Executive Council would consider whether to call for an OSI. de Silva (T5.1−O2) considers the comparative roles of global verification and on-site verification.
Ifft (T5.4−O6) considers the relationship between the CTBT and the decision by the United Nations General Assembly to authorize the negotiation of a treaty to ban nuclear weapons. The need for public awareness of the differences is highlighted, and the possible consequences of this new initiative are reviewed.


SECTION 11 — CLOSING 85
11 Closing
11.1 JOACHIMSCHULZE:HIGHLIGHTS
JoachimSchulze
ChairpersonofWorkingGroupBCTBTOPreparatoryCommission
Ladies and gentlemen. A wonderful conference is coming to a close. There was a series of conferences, and it was improved every time, every two years, and we see that it was improved because many of the very important scientists still come here. They all come here again and again, and this is an indication of how excellent this conference is. I will come back to this at the end.
The famous English physicist Freeman Dyson has written a book in 2001: ‘The Sun, the Genome and the Internet’. The main point of this book is that a scientific revolution is very often due to tools rather than to scientific concepts. So tools play an important role, and the verification system is our tool.
So I come now to the conference and what was said about our tool. The tool consists of sensors, of algorithms, of the OSI system, and of system performance.
What did we hear on the sensors? We just had a report on the SPALAX noble gas system. There was
another new xenon system, now in its third generation: SAUNA. There was also a new particulate system. When we started there was one argon-37 system that filled a huge room. Now we have argon-37 systems that are transportable. So you can see in 20 years how it has evolved.
Talking about seismic detection, I heard a lot of contributions on cross-correlation, which serves to improve the location of events, but can also perhaps reduce the workload of analysts.
On infrasound, we heard an interesting talk on vertical air vibrations which influence the propagation velocity of infrasound. So many laboratories are working on this improvement in all its aspects.
On hydroacoustics we had the impressive film on the installation of the station at Crozet Island. But there were also other events that came from hydroacoustics. For example, there was the result from the installation of the ocean-floor network DONET, to have early warning of tsunamis. So we come closer to the civil use of this system.
We also have to take care that the performance of the network is always optimized, and we heard many talks about the monitoring of the performance of the network. Also the other way around, how data are checked to see whether the monitoring of the status of the network is good enough.
Now I leave the tools and say something about the results. There were presentations on the nuclear explosions in the DPRK, and we saw how impressive the results were – the location, the calculation of the depth of the events, and their identification; satellite imagery is of help. When we started in 1994 in Geneva, we talked about satellites but there was no idea that satellite imagery would meanwhile become so cheap; at that time it seemed to be very expensive.
And then we heard many presentations useful for civil science and for civil security. Civil science included a paper on blue whale populations – this was very impressive. And it was only possible with the IMS network to identify these blue whale populations.
Beryllium-7 in the atmosphere can give early warning of monsoons or other atmospheric events. So we will follow all this: tsunamis, glacier calving, landslides; this we are aware of for a long time.
It was not only the scientific part of this conference but there were many side events: the Omniglobe; the

86 SCIENTIFIC ADVANCES IN CTBT MONITORING AND VERIFICATION 2017
film ‘Collisions’ which was very impressive. All this was a lot of work. And members of the Secretariat did all the work in addition to their day to day work. And we should really praise this. I would like to name a couple of people who were very heavily involved, Nadine Parsi and Cinthia Echavarria. Bob Pearce and Martin Kalinowski did a lot of scientific work for this conference. Certainly the whole organization was with the two directors – the two project executives – Randy Bell and Nurcan Meral Özel, and last but not least the Executive Secretary Lassina Zerbo.
Please join me in congratulating the Secretariat for this outstanding conference at this marvellous place. Please join me for this applause. Thank you very much.
11.2 OMARAL-RAWI
OmarAlRawi
MemberoftheViennaCityCouncilandtheViennaProvincialParliament
Good afternoon ladies and gentlemen, excellencies, distinguished guests.
I have the honour, the privilege and the pleasure to welcome you on behalf of the mayor of the City of Vienna, the Governor of the State of Vienna, Dr Michael Haupl, who asked me to forward his best wishes, and I am also very glad to give some perspective on what cities do to improve all these things. Because in terms of international relations, bilateral, multilateral, between States, I think there is really a big chance for the future if the cities and the regions becomes a more important view even in terms of the European Union. And I really recommend to read the book of Benjamin Barber: ‘If Mayors Ruled the World’.
In fact Vienna is a centre for international dialogue. This is a fact. It is not only a wish, it is a fact. And our policy, not only in the Federal Government, but also the City of Vienna, is to promote peace, security, sustainable development, but also disarmament, and non-proliferation of nuclear weapons; further emphasis is given to fight against crime, drug abuse and terrorism.
Here is a very short story I want to tell you. How do you reach this goal? How can you improve and make Vienna the hub of all these things? You need a tradition; you need the infrastructure, and you need the soft facts and the hard facts.
Talking about the traditions: the Viennese Congress of Prince Eugen, when all Europe gathered – the so-called

SECTION 11 — CLOSING 87
dancing Congress – to improve peace after the war with Napoleon.
But even during the cold war, as history gave us the chance to be a neutral city, Vienna was the hub of meetings, and maybe there are a lot of young people sitting here, just to remember that Khrushchev and Kennedy met in Vienna after the Cuban crisis.
When I came to Vienna – as somebody who was born in Baghdad – when I came to study in Vienna in 1979 I was impressed to see how Brezhnev and Carter were meeting in Vienna to negotiate the Strategic Arms Limitation Treaty – SALT II; it was signed in Vienna. When the Helsinki closing acts were signed in Vienna, George Schulz and Gromyko met here.
When Shevardnadze became the new secretary of the Soviet Union he met with James Baker in Vienna. At that time I was still a student and I was working to finance my studies as a driver, and I was one of those who were working with a delegation and being at the United States Embassy and Residence where this meeting had happened. And then we could all continue to see that the talks of the Iranian nuclear treaty were finalized in Vienna. We started the talks of how to solve the Syrian crisis.
So in tradition we can give a lot.
What about the soft facts? To improve, and to have all these organizations come to Vienna, you have to have a city policy to improve all the things that make Vienna attractive. We are the number one in life quality. We have confidence in our city. For eight years we have always had big cities like Auckland, Zürich, Montreal, Vancouver living behind us, and I say very proudly that we have done it.
We have a very fantastic medical care system. We have political stability. We have a lot of bilingual schools. We have a fantastic offer in cultural terms. We have a city that has 1.8 million inhabitants but we have a cultural budget that would fit to a city with nearly four million. We have four opera houses for example. We have a tradition of balls. All this that gives the city its importance.
And the hard facts are that we became one of the first four cities that are the headquarters of the United Nations. And we are number one in tourism – not only tourism but also in congress tourism For instance, last year there were seven million incoming guests, but in congress tourism alone we had 1.7 million overnight stays. And we decided that with the enlargement of the European Union
when Vienna was moved from the edge of Europe to the centre of Europe – to the middle of Europe – we decided we can now not concur with low wage production costs. We decided to be a city of knowledge, to attract all the heads to come to the city. That is why Vienna has from its 1.8 million, 200 000 students living in the city; we have 18 universities, and this gives us a lot of chances for the world.
Why am I emphasizing these things? What of CTBTO? We have managed to offer all these things. You have your headquarters in Vienna. That’s what we want. You are improving peace and dialogue. That’s what we want. And looking at the congress, you are also helping us to become number one in congress tourism. Also you are the one we have to deal with a lot with scientific governance and achievements. So CTBTO is the one that matches all these four pillars.
Thank you very much again for choosing Vienna, and I can assure you that you will also have the support of the Government of the City of Vienna and the Mayor of the City of Vienna.
And I hope that all of you enjoyed the stay in Vienna. I am looking forward to seeing you again as a guest, as a friend, as a student, as someone who chooses this city.
Thank you very much and thank you for the invitation.

88 SCIENTIFIC ADVANCES IN CTBT MONITORING AND VERIFICATION 2017
11.3 WOLFGANGHOFFMANN
WolfgangHoffmann
ExecutiveSecretaryEmeritus,CTBTOPrreparatoryCommission
Ladies and Gentlemen,
Twenty years CTBTO. This is just a little moment in history. But for me, it is a quarter of my lifetime! And a very important one.
After negotiating the Treaty in Geneva, we started work in Vienna in 1997 with just a handful of people. We were helped by the Government of Austria, and by the International Organizations here in Vienna. We made use of an existing seismic network. With a growing number of competent staff, it was therefore easy to detect all nuclear explosions in South Asia in 1998.
Today the whole detection system is almost complete. Exercises show that we are also able to do on-site inspections. We have now several hundred staff. Thanks to the political and financial help of Member States we are well positioned.
We also thank the science community for their strong engagement. Thanks to our common efforts, no nuclear explosion goes undetected, and the Security Council of the United Nations takes action. Data collected belong to the Member States. They allow us to use them also for civil purposes, like tsunami warning. In this way, States that have not even signed the CTBT also participate in the results.
Legally speaking, the Treaty is not yet in force. We are working on it, under the leadership of Lassina Zerbo.
Practically, from the very beginning, we had no problem concluding Treaty arrangements with international organizations and States.
CTBT is working, thanks to all of you.
Thank you.

SECTION 11 — CLOSING 89
11.4 TIBORTÓTH
TiborTóth
ExecutiveSecretaryEmeritus,CTBTOPreparatoryCommission
Dear friends,
In 2013 at the Science and Technology conference my concluding words were “I will be back” and thanks to Lassina I am back, so thank you so much! I love the Treaty; I love the Organization, and I love this community, and quickly I would like to explain why.
My love for the Treaty and the Ban? Whenever the world was in trouble there was this Ban and Treaty to help out. Three quick examples. One was the 1962 Cuban missile crisis. I call it a crash in international security. A day after the Cuban missile crisis fateful day in October, the first communication between the US and the Soviet Union was about a comprehensive test-ban treaty. This was the medicine. This was to restore confidence after this crash.
When there was a security – what I should call panic – in the early 1980s, again the Comprehensive Test Ban was the source of confidence, with the negotiations started, aiming eyes at the Treaty.
My feeling is that we are in a downward trajectory right now in international security, and I would hope that we will come out after hitting the bottom, and again there will be this Treaty; the entry into force of the Treaty, which hopefully will restore the confidence in joint and common security.
My love for the organization? Quite frequently the question is asked “CTBTO – what is it?” and people ask
“Is it an NGO?”, and I say “No it is not an NGO”. “Is it an IGO?” I say “sort of”. And my answer is “It is an NNO”. And the question is “What is an NNO?” And I say “A No-Nonsense Organization; an NNO”. And I stand by, and the organization stands by, those words. Just imagine – this organization is where multilateralism is really at its best. You heard from climate change that you cannot do business with 190 players around the table. And with nearly 190 players around the table this unprecedented monitoring system, coupled with this unprecedented political arrangement, was delivered – and it is working. It is working as we speak, and this is the most complex technical monitoring system around the world, with all the 337 stations and the more than 200 communications assets. And it is ticking, and proving again that yes, there is an important role for organizations like P2, P5, G5, G8, G20, G40, but there is an important complementary role of an arrangement which I call the G200, and this is the G200 at its best.
Why do I love this community? This community has been always there to help out. Referring again back to the post Cuban missile crisis: thanks to the quiet work of experts, in the trilateral setting, and the Geneva setting from 1962, when the moment came, there was already a blueprint to restore the confidence after the meltdown. And again in 1978 the work started in the Group of Scientific Experts. And if you recall these were the worst times – no confidence, but more than 100 scientists were gathering a couple of times each and every year to move the whole idea and the dream forward, and they had to work for nearly 20 years until the organization emerged. With all the ups and downs of the political world, this community and the experts were a bedrock, the strongest bedrock, for an idea.
When we launched in 2006 the whole Science and Technology process, I personally did not expect this ‘carry-away’ success. But again this is a reminder of how much this community, which goes back not for the last five years or ten years, but goes back for the last 60 years, has remained this bedrock, and this bedrock is very much needed in the years to come.
So I think this is the perspective within which you have to think about your work. On this 20th anniversary, of course I cannot but pay attention not just to the work of the scientific community, but to the people in the Secretariat. This is a meritocracy for me; this is a group of people – not a small one – a group of people that goes through daily labour, adding layers and layers and layers to what is emerging as this amazing and unparalleled system. And of course many of us love the Treaty, and the Treaty for me is like notes for a symphony.
90 SCIENTIFIC ADVANCES IN CTBT MONITORING AND VERIFICATION 2017
But the real music is what the organization, with you as the scientific community, and the technical people, is delivering as amazing music. So I would like to thank you for this amazing music, to turn the notes into something which is an ode to the future.
Thank you so much.
11.5 LASSINAZERBO
LassinaZerbo
ExecutiveSecretary,CTBTOPreparatoryCommission
Let me start by thanking our speakers this afternoon. Des Browne, Lord Browne, delivered a phenomenal closing keynote. Des, thank you for being a true friend of the CTBT, and for reminding us that there is good reason to believe that a world without nuclear testing is in reach.
I am also grateful to our two Executive Secretaries Emeritus for reflecting on the last twenty years of our Organization’s work and their belief in our future. Thanks also to Mr Al-Rawi for representing the City of Vienna. Vienna is our home, and indeed the home of non-proliferation and disarmament. And of course thanks to my good friend Joachim Schulze for his technical summary.
We have heard during this conference about optimism and pessimism. But there is also realism – the simple fact that a return to nuclear testing would be so destabilizing on so many fronts that locking in the test ban is a matter of common sense. Whatever your political persuasion.
All the attendees, speakers, panellists, scientists and participants here this week have been part of this common sense movement to end nuclear testing. And this has been the biggest SnT yet. Over a thousand registrations. Actual check-ins approach 800, more than ever before. And of course scores of members of the VIC and diplomatic communities attended in addition.
It has also been the biggest SnT in terms of social media. #SnT2017 was already trending on Twitter in

SECTION 11 — CLOSING 91
Austria on day one and has now reached well over 10 million impressions. It has been our second most viewed Instagram story ever with around 76 000 views. Facebook is filled with the CTBTO Youth Group’s 'vlogs'.
This proves there is an appetite for the CTBT. The message is getting out and hitting home.
Much of this has to do with the enthusiasm of our newest band of supporters, the youth. Young scientists at this Conference have shown their passion for using and enhancing CTBT technologies for the greater good.
Meanwhile the Youth Group has evolved into a dedicated, effective and growing advocacy network. You may have come to learn at this SnT, but believe me, we have also learned from you. You have helped to refresh and renew the SnT experience!
On that note, we bring SnT2017 to a close. I have no doubt that we will be back in two years’ time, bigger and better than ever.
For now, please enjoy our closing reception. I look forward to seeing you in 2019!

92 SCIENTIFIC ADVANCES IN CTBT MONITORING AND VERIFICATION 2017

SECTION 12 — RELEVANCE TO CTBTO ACTIVITIES AND VERIFICATION SCIENCE 93
12
Relevance to CTBTO Activities and Verification Science
12.1 DISTRIBUTIONOFPRESENTATIONS AMONGSUBJECTHEADINGS
The organization of presentations in this reportacrossSECTIONS3to10isdescribedinSECTION1.5.Thestrength of contributions under different sections haschanged significantly as the SnT process has evolved,and these changes are summarized in TABLE12.1.Thelackofcontributions toSECTION4 (DataTransmission,Storage and Format) is striking, while OSI (SECTION3.3)receivedasustainedincreaseininterestassociatedwith IFE14. The increased interest in radionuclidebackground(SECTION8.1.2)inSnT2017ispartlyaresultof interest in theglobal radioactivexenonbackgroundand its measurement and mitigation, and in particularthe contribution to this background from radioisotopeproductionfacilities.
Whereas TABLE 12.1 provides an indication ofthe research areas of SnT contributors, this must becomplementedbyameasureoffittoCTBTOneeds.Forthispurposeacategorizationschemehasbeendesigned(SECTION12.2)andinSECTIONS12.3to12.10selectedpresentationsareassignedtooneofthefourcategoriesaccordingtotheirrelevancetoCTBTOandthedegreeofitsinvolvement.
12.2 CATEGORIZATIONSCHEME
A scheme for categorizing SnT presentationsaccordingtotheirrelationshipwithCTBTO’sverificationneeds,was introduced inapresentationtotheFiftiethSession of WGB (ECS/PRES/WGB-50/4) under theTechnology Refreshment task. This scheme identifiedfour types of relationship, each suggesting a different
typeof follow-upactivityunder theSnTprocess.Thisschemehassincebeenrefined,stillbaseduponthefourcategoriespreviouslyintroduced.
Under this schemeapresentationmaybeassignedto one of four categories, according to whether thepresentationreportsworkthatis:
• Highly relevant and has CTBTO activeinvolvement(CATEGORY1),
• Highly relevant and is ready for adoption byCTBTO(CATEGORY2),
• Highly relevant, with CTBTO taking an activeinterest(CATEGORY3),
• Potentially highly relevant, with CTBTOcontinuingtoobserve(CATEGORY4).
By way of example, some presentations wereassigned to a category in the abovementionedpresentationtotheFiftiethSessionofWGB.Thisisnowextended to some 20% of the presentations.Althoughmanypresentationshavenotbeenassignedtoacategoryatthistime,thisdoesnotimplythatthesepresentationsareoutofscopeornotofinterest;theremustnecessarilybe a prioritization of the focus areas of CTBTO, givenresourcelimitationsandaneedtoconsiderthelevelofmaturityofspecificdevelopments.
Some presentations report work that is not withintheCTBTOmandate,butwhichisneverthelessrelevanttotheroleofStatesSignatoriesintheirCTBTverificationactivities; examples might be work on verificationtechnologies not included in the Treaty; magnitudeyieldrelationsforundergroundnucleartests,ornuclearsecurity. Such presentations have not generally beenassignedtoacategory.
The categorization scheme has been introduced

94 SCIENTIFIC ADVANCES IN CTBT MONITORING AND VERIFICATION 2017
TABLE 12.1 Representation of Different Fields of CTBT Verification Science Among SnT Conference Contributions. (Subject headings that were not separately identified in the SnT2011 or SnT2015 reports are shown with an asterisk.)
SECTION SUBJECTHEADING 2011 2015 2017
3 DATAACQUISITION 70 152 170
3.1 SensorsandMeasurements 36 58 67
3.1.1 Seismic 6 8 6
3.1.2 Hydroacoustic 1 2 4
3.1.3 Infrasound 1 10 7
3.1.4 Seismic,HydroacousticandInfrasoundasaGroup 3 2 1
3.1.5 Radionuclide 13 30 35
3.1.6 Satellite-BasedandOther 12 6 14
3.2 MonitoringFacilities 25 43 49
3.2.1 IMSStationsandLaboratories 9 14 31
3.2.2 Non-IMSStationsandNetworks 16 29 18
3.3 StrategiesforOn-SiteInspection 9 51 54
3.3.1 General * 10 14
3.3.2 Seismic * 7 11
3.3.3 Radionuclide * 22 21
3.3.4 RemoteImagery * 7 8
3.3.5 Drilling * 5 0
4 DATATRANSMISSION,STORAGEANDFORMAT 8 5 3
4.1 DataTransmission 2 3 2
4.2 DataFormats 6 2 1
5 DATAPROCESSINGANDSYNTHESIS 57 55 78
5.1 CreatingSeismoacousticEventLists 53 46 63
5.1.1 Introduction 5 3 5
5.1.2 EventsfromSeismicData 34 31 44
5.1.3 EventsFromHydroacousticData 1 0 0
5.1.4 EventsfromInfrasoundData 9 8 10
5.1.5 FusingofWaveformObservations 4 4 4
5.2 RadionuclideDataProcessingandAnalysis 4 6 14
5.3 FusingWaveformwithRadionuclideandOtherObservations * 3 1
to provide general guidance on the level of relevanceof projects to CTBTO activities. Assignment of apresentationtoacategoryisascientificjudgmentmadeinthelightofverificationneedsandhasbeenmadebyindividualspecialistswithoutanyformalreviewprocess.Assignmenttoacategoryisunrelatedtoanyprospectoffinancialsupport,contractualarrangement,contributionin kind or other relationship between CTBTO and theauthorsofthepresentationortheirinstitutions.Neitherdoes it imply that specific actions will necessarily betaken by CTBTO in regard to the subject presented.PresentationsatsuccessiveSnTconferencesthatreport
on a continuing project may naturally change as thatprojectevolves,forexamplewhencircumstancesfavoura more direct CTBTO involvement, or when a projectbecomesclosetocompletion.
SECTIONS 12.3 to 12.10 describe the assignmentsthathavebeenmade to categories, arrangedaccordingto SECTIONS 3 to 10 of this report. Each categorizedpresentation is assigned to the section that is mostrelevant to CTBTO’s interests. TABLE 12.2 provides asummaryoftheseassignments.

SECTION 12 — RELEVANCE TO CTBTO ACTIVITIES AND VERIFICATION SCIENCE 95
SECTION SUBJECTHEADING 2011 2015 2017
6 EARTHCHARACTERIZATION 64 86 88
6.1 SolidEarth 36 61 59
6.1.1 SeismicWaveSpeed 11 16 13
6.1.2 AnelasticAttenuation 5 4 3
6.1.3 TectonicStress 3 2 6
6.1.4 SeismicityandSeismicHazard,IncludingTsunamiHazard 13 25 26
6.1.5 SubsurfaceFluidTransportandRadionuclides 4 14 11
6.2 Oceans 8 2 3
6.3 Atmosphere 19 23 26
6.3.1 AcousticWaveSpeed 10 9 5
6.3.2 AcousticAttenuation 2 1 1
6.3.3 AtmosphericTransport 7 13 20
7 INTERPRETATION 77 48 79
7.1 GeophysicalSignatures 44 21 41
7.1.1 Explosion 7 8 19
7.1.2 Earthquake 9 3 8
7.1.3 Volcano 12 8 7
7.1.4 Othersources 16 2 7
7.2 RadionuclideSignatures 17 13 13
7.2.1 NuclearExplosion 5 2 6
7.2.2 NuclearReactor 10 3 7
7.2.3 MedicalandIndustrialIsotopeProductionPlant 2 8 10
7.3 IdentificationofNuclearExplosions 16 14 25
7.3.1 IdentificationofExplosionsUsingWaveformData 6 3 14
7.3.2 IdentificationofNuclearExplosionsUsingRadionuclideData 3 6 4
7.3.3 EventScreeningforIDCProducts 7 4 2
7.3.4 NovelMethodsforSourceIdentification * 1 5
8 CAPABILITY,PERFORMANCEANDSUSTAINMENT 56 44 115
8.1 BackgroundSignalsandNoise 19 12 39
8.1.1 Seismoacoustic 10 7 7
8.1.2 Radionuclide 9 5 32
8.2 NetworkCapability 16 10 39
8.2.1 SeismoacousticEventLocationThresholds 10 7 4
8.2.2 RadionuclideNetworkCapability 6 3 4
8.3 Performance,QualityandValidation 17 16 31
8.4 Sustainment 4 6 6
9 SHARINGDATAANDKNOWLEDGE 38 64 54
9.1 BuildingGlobalCapacity 4 7 9
9.2 CollaborationinTrainingInitiatives 10 27 6
9.3 NationalExperiences 8 19 26
9.4 DataandInformationPlatforms 16 11 13
10 POLICYANDADVOCACY * * 25
10.1 ScienceinSupportofPolicymaking * * 5
10.2 AdvocacyandOutreach * * 16
10.3 CTBTOinaBroaderContext * * 4
TABLE12.1 (cont.)

96 SCIENTIFIC ADVANCES IN CTBT MONITORING AND VERIFICATION 2017
TABLE12.2 Assignment of Oral and Poster Presentations to the Four Categories Defined in SECTION12.2, Arranged by Subject Heading. (Where a presentation is relevant to additional subject headings, it is shown with an asterisk.)
SECTIONSUBJECTHEADING CATEGORY1 CATEGORY2 CATEGORY3 CATEGORY4
12.3 DATAACQUISITION T1.1−P5*T1.4−P2T3.1−O3*T3.5−O6
T1.4−O3T1.4−P6T2.5−O1*T5.1−O2*T5.4−O2T5.4−O3*
T2.2−O1T3.1−O4T3.1−O5T3.1−O6T3.1−O7T3.1−P42T3.2−O2T3.3−O1*T3.3−P8T3.3−P9T3.4−O1
T1.4−O4 T1.4−O6*T1.4−P3 T1.4−P5T1.5−O1* T2.1−O4T3.1−O2 T3.2−O1T3.6−O2 T4.1−P18
12.4 DATATRANSMISSION,STORAGEANDFORMAT
12.5 DATAPROCESSINGANDSYNTHESIS
T1.1−O1T1.1−P1T3.6−P1T3.7−O1
T2.3−P13T3.6−O1*T5.4−O3*
T2.3−P4T3.4−O1T3.5−O9
T1.2−P4T1.2−P35*
12.6 EARTHCHARACTERIZATION
T1.3−O1T1.3−O2*
T2.5−P7*T3.6−O1*
T1.3−O5T1.3−O7
T1.2−O1T1.2−O6T1.2−P18T1.4−O1T1.4−O6T1.4−P8T2.2−O2
12.7 INTERPRETATION T1.1−P5T1.3−O2T2.1−O9
T2.4−O2*T2.5−O1T2.5−P7
T1.5−O2*T3.3−O1
T1.2−P35T1.4−O5*T1.5−O1T2.3−P9T2.4−O1T2.5−P2
12.8 CAPABILITY,PERFORMANCEANDSUSTAINMENT
T1.3−O2*T3.1−O3T4.1−P1
T2.4−O2T2.4−O3T3.6−O1T5.4−O2*T5.4−O3T5.4−O5*
T3.1−O5*T3.2−P2T4.1−O6
T1.4−O5T2.3−P8T2.4−O1*T2.5−P1T4.1−O1T4.1−P3*
12.9 SHARINGDATAANDKNOWLEDGE
T3.5−P52T5.1−O1*T5.4−O1T5.4−O2*T5.4−O5
T1.5−O2T2.3−P4*T3.5−P11T3.5−P25T4.1−O7
T4.1−P3
12.10 POLICYANDADVOCACY T5.1−O1T5.1−O2T5.4−O1*
T5.1−P5

SECTION 12 — RELEVANCE TO CTBTO ACTIVITIES AND VERIFICATION SCIENCE 97
12.3 DATAACQUISITION
CATEGORY1
T1.4−P2: EstablishmentoftheIMSHydroacousticStationHA04,CrozetIslands,France G.Haralabus,J.Stanley,M.Zampolli,J.Mattila,N.Meral-Özel,P.Grenard,P.Nielsen,R.LeBras,
D.Brown,P.Bittner,H.Wang,J.Gore,M.Amir,S.Bereza
TheworkpresentedinT1.4−P2marksthecompletionofthehydroacousticcomponentoftheIMSnetwork.Althoughmajorhydroacousticsustainmentprojectsarestillpending,hydroacousticsisthefirstofthefourIMStechnologiestohaveallitsstationscertified.
EXHIBITION Successful installationofthehydroacousticstationHA04(Crozet Islands,France)alsofeatured inthe Exhibition of Activities, Achievements and Needs (see APPENDIX 3). The exhibit included ademonstration,videosandphotographsoftheinstallationcampaigns,acolouredbathymetricmapcarpetofBaieduMarinatCrozetIslands,andilluminatedsimulatedunderwatercables.
T3.5−O6: OptimizingtheChancesforDetectingNuclearTestSignaturesofPromptandEarlyReleasesUsingRadioxenonIsotopicRatios
E.Gordon,M.Kalinowski,H.Gheddou,J.Kusmierczyk-Michulec,B.Liu,MSchoeppner
A goal of T3.5−O6 is to enhance the screening flags for isotopic ratios in IDC standard products(automaticradionuclidereportsandreviewedradionuclidereports).
CATEGORY2
T1.4−O3: ModularDesignArchitectureofDONETSea-FloorObservatoryNetwork Y.Kaneda,K.Kawaguchi
T1.4−O3 is related to the modular design of ocean observatories and the potential of adoptingelementsof thisdesign in thenextgenerationof IMShydroacoustic stations,asdescribed in thefollowingpresentationT1.4−P6.
T1.4−P6: ProgressintheStudiesontheNextGenerationCabledIMSHydroacousticStations M.Zampolli,G.Haralabus,J.Stanley,J.Mattila
T5.4−O2: ARN’sExperienceinOperatingandMaintainingRN01andRN03TowardstheInstallationofRN02 N.Ferro,A.Pantín
T5.4−O2demonstratesthehighvalueofbuildingonexperienceintheinstallationandoperationofradionuclidestationswhendesigningandbuildingnewstations.
CATEGORY3
T3.1−O6: StrategiesforRecordingtheFullSeismicWavefield R.Woodward,C.Langston,J.Sweet,K.Anderson
T3.1−O6highlightstheavailabilityofarobustandeasy-to-deployseismicmonitoringsystemwithlargepowerautonomyandwithpotentialapplicationstoOSIaftershockmonitoring.

98 SCIENTIFIC ADVANCES IN CTBT MONITORING AND VERIFICATION 2017
T3.1−O5: SPALAX-NewGeneration:Deployment,OperationandPerformances S.Topin, G. Le Petit, J. Piwowarczyk, T. Philippe,A. Cagniant, O. Delaune, P. Gross, G. Douysset,
C.Moulin
T3.1−O5, and the two followingpresentations T3.1−O7 and T3.1−P42, reporton threeof thenewnoblegassystemsthatarenearingthestageofsystemsacceptancetestingofindustrialprototypes.
T3.1−O7: TheSAUNAIIIProject A.Ringbom,M.Aldener,A.Axelsson,T.Fritioff,J.Kastlander,A.Mörtsell,H.Olsson
T3.1−P42: XenonInternational:ANewCapabilityforRadioxenonMeasurements J.Hayes,T.Bowyer,M.Panisko,W.Harper,M.Howard
T3.3−P8: Subsurface,SurfaceandRemoteObservationsofLegacyNuclearExplosionSites A. Sussman, D. Anderson, C. Burt, J. Craven, C. Kimblin, I. McKenna, E. Miller, C. Rowe,
E.Schultz-Fellenz,S.Vigil,D.Yocky
T3.3−P8presentscasestudiesoflegacynuclearexplosionsitesusedtostudyundergroundnuclearexplosionsignaturesonawiderangeofscales.
T3.4−O1: Accurate andEfficientViscoelastic Finite-differenceModelling forAnalysis of SeismicWavefieldsAppliedtoOn-SiteInspection
P.Moczo,J.Kristek,M.Kristekova
T3.4−O1 contributes to the development of resonance seismometry for OSI. The presentationcontributestotheunderstandingofthemodificationoftheseismicwavefieldduetothepresenceofcavity,rubblezoneandfracturezone.Theresultshaveanimpactondevelopmentoftheconceptofoperationsforresonanceseismometry.
T3.3−P9: UAV-BasedMobileGammaSpectrometry R.Kaiser,I.Darby,M.Matos,M.Bogovac
IAEAhasdevelopedaUAV-basedmobilegammaspectrometrysystemforenvironmentalmonitoringandmapping(T3.3−P9);thisispotentiallyrelevanttoOSI.
T2.2−O1: AMethodforApplyingMeasurementRestrictionstoaHigh-PurityGermaniumDetectorWithintheFrameworkofOn-SiteInspections
O.Aviv
ThereiscurrentlynoapprovedmethodforapplyingrestrictionstoOSIradioactivitymeasurements;T2.2−O1providesaproposal.
T3.1−O4: SCoTSSGammaImagerforCTBTOn-SiteInspection P. Saull, L. Sinclair, A. MacLeod, J. Hovgaard, B. Krupskyy, P. Drouin, A. McCann, H. Seywerd,
D.Waller,L.Erhardt
T3.1−O4 describes a mission ready, compact and user friendly gamma imager that opens newpossibilitiesforOSI.
T3.2−O2: MobileSamplingandMeasuringComplex“SLARS” S.Pakhomov
T3.2−O2presentsanewdesigntomeetthechallengesofseparationandmeasurementofairborneargon-37inthefieldwithperformancesuitableforoperationduringanOSI.

SECTION 12 — RELEVANCE TO CTBTO ACTIVITIES AND VERIFICATION SCIENCE 99
CATEGORY4
T2.1−O4: CTBTOResponsetoanUnderwaterorSurfaceTestinInternationalWaters G.Moore
T2.1−O4considersanextremelyrelevanttopicforCTBTO,yetmuchneedstobedonetounderstandthephenomenologyofunderwaterexplosionsaswellastheimplicationsfordetectionandOSI.
T1.4−P3: ExploitingRecentPlentifulDetectionsatH03andH11 A.Brouwer,R.LeBras,P.Bittner
T1.4−P3 investigates the many detections at two IMS hydroacoustic stations and the followingpresentation T1.4−P5 considers signals recorded at another. Classifying these detections andidentifying their origin is an important aspect of monitoring the oceans.These presentations arerelatedtothelongtermoceanmonitoringcapabilityofferedbytheIMShydroacousticnetworkthatprovidesdatafortsunamiwarningaswellasforawiderangeofscientificstudies.
T1.4−P5: ObservationsofaCoherentSignalintheHigh-FrequencyRangeofIMSHydrophones(105-108Hz)atStationHA08,DiegoGarcia,IndianOcean
C.Saceanu,R.LeBras,M.Zampolli
T1.4−O4: SMARTCablesSensingthePulseofthePlanet B.M.Howe
T1.4−O4 describes a major proposal under development to use instrumented undersea cables forenvironmentalmonitoring.InthelongtermthismayhavesignificantimplicationsintheCTBTcontext.
T3.1−O2: NewOpticalMicrobarometer S.Olivier,N.Olivier,A.Hue,S.LeMallet
T3.1−O2describestheuseofaninterferometerasdisplacementtransducerwithininfrasoundsensorstofurtherimprovesensordynamicrangeandresolution.
T4.1−P18: RASADetectorCalibrations:FieldAutomationandPotentialforFactoryCalibrationstoReplaceFieldCalibrations
E.Tillistrand,D.Bustillo,B.Hosticka,H.Rada,M.Wright
TheprocessofcalibratinganHPGedetectorislabourintensiveanderrorprone.Automationoftheprocess,andmaking itfieldbased,aspresented inT4.1−P18,wouldresult in faster restorationofRASAsystemstooperationalstatus.Alsomethodsarebeingcomparedinordertodeterminewhetherfactorycalibrationscouldreplacethefieldcalibrationprocessinthefuture.
T3.2−O1: MobileLaboratoryforNobleGasesAnalysisinAtmosphericAir Y.Dubasov,V.Golubev,A.Kamentsev,S.Pakhomov
T3.2−O1presentscapabilitiesforxenonandkryptonsamplingfromatmosphericair,andprocessingthroughcryogenicsorptiononcharcoal.Analysisimplementsbeta–gammacoincidencesbetweenasodiumiodide(thallium)(NaI(Tl))scintillatorandSi-PINdiodes.Thisportableequipmentachieveshigh collection efficiency and minimum detectable concentration of 0.35 mBq/m3 for xenon-133,suitableforatmosphericairanalysesduringanOSI.

100 SCIENTIFIC ADVANCES IN CTBT MONITORING AND VERIFICATION 2017
T3.6−O2: InvestigatingOptionstoVisualizetheTechnicalDataGeneratedDuringanOSI J.Stevanovic,J.Palmer
T3.6−O2 discusses the challenges of visualizing and integrating, in its geographic context, a largequantityofmulti-variatedatacollectedduringanOSI.
12.4 DATATRANSMISSION,STORAGEAND FORMAT
AspointedoutinSECTION12.1,therehavebeenfewpresentationsinthefieldsofdatatransmission,storageandformatsatSnTconferences.Nopresentationsunderthissectionhavebeencategorized.
12.5 DATAPROCESSINGANDSYNTHESIS
CATEGORY1
T1.1−O1: BayesianCalibrationofGround-TruthEventsfromStochasticModels C.Millet,M.Bertin,J.Vergoz,P.Mialle
T1.1−O1ispartofacontinuouseffortonatopicofinterestfrompastSnTconferencestowardsthepossibleintegrationofpropagationmodellingintotheIDCprocessingsystem.
PANELDISCUSSION
Thepaneldiscussionentitled“ProcessingandAnalysisofSeismicAftershockSequences:ProtectingOperational Performance at the IDC” (see APPENDIX 2) demonstrated major gain in accuracy andcompleteness of seismological bulletins, as well as a reduction in analyst workload in interactiveprocessingoflargeaftershocksequences.
T1.1−P1: AdvancesontheVolcanicParameterSystemwithInfrasoundData P.Mialle,P.Gaillard,P.Husson,N.Brachet,E.Blanc
T1.1−P1 demonstrates the usefulness of infrasound technology for monitoring volcanic activityand informing Volcanic Ash Advisory Centres, as mandated by the International Civil AviationOrganization(ICAO).
T3.6−P1: CTBTO Generation of Synthetic Radionuclide Spectra to Support the NDC Preparedness ExerciseNPE15
H.Gheddou,M.Kalinowski,B.Liu,R.Plenteda
T3.6−P1describestheproductionofalargenumberofsyntheticradionuclidegammarayspectraforNPE15.
T3.7−O1: EnhancementstotheCTBTOIDCRadionuclideProcessingPipelineforParticulateSamplesAchievingSignificantImprovementofAutomaticProducts
H.Gheddou,M.Kalinowski,E.Tomuta
T3.7−O1describessoftwareenhancementsthatwereimplementedintheIDCoperationalradionuclidepipelinebetweenJanuary2015andJanuary2017.TheseenhancementsachievedimprovedqualityofIDCstandardautomaticproducts,lowerworkloadonradionuclideanalystsandimprovedtimeli-nessofreviewedproducts.Asaresult,thekeyperformanceindicatormeasuringtheconsistencyrateofautomaticcategorizationofradionuclidesampleswasraisedfrom40%to80%.

SECTION 12 — RELEVANCE TO CTBTO ACTIVITIES AND VERIFICATION SCIENCE 101
CATEGORY2
T2.3−P13: SeismicandHydroacousticObservationsfromUnderwaterExplosionsofftheEastCoastofFlorida R.Heyburn,D.Bowers,S.Nippress
The controlled source experiments investigated in T2.3−P13 provide useful information on theprocessingofdatafromin-waterexplosions,andarealsovaluableforperformanceassessmentofIMSstations.
CATEGORY3
T3.5−O9: StrategiesforCopingwithLargeAftershockSequences T.Kværna,S.J.Gibbons
T3.5−O9describesanautomaticproceduretoaccuratelylocateaftershocksfollowingmajorearthquakesinadefinedregionofactivitywithoutusingwaveformcharacteristics.Ithasthepotentialtogreatlyreducetheworkloadofwaveformanalysts.
T2.3−P4: CompilationofInfrasoundGround-TruthDatabaseUsingSeismicData A.Smirnov
Therehasbeenmuchworktobuildanarchiveofinfrasoundeventswhosecauseisknownandthatarewelllocated.Thisisimportanttoassistinimprovingdataprocessingmethodsinthecontextofeventdiscrimination,aswellasinimprovingourknowledgeofinfrasoundsourcesandtraveltimes.T2.3−P4isanimportantcontributiontothiseffort.
CATEGORY4
T1.2−P4: AnInnovatedEarthquakeModellingTechniqueforNearSourceModelling V.Gholami
Improvementsinforwardearthquakemodellingmethods(T1.2−P4)potentiallyleadtothedefinitionofsyntheticseismogramscomparabletonaturalorman-madeevents,andisconsequentlyofinteresttoCTBTO.
12.6 EARTHCHARACTERIZATION
CATEGORY1
T1.3−O1: 2ndATMChallenge2016 C.Maurer,M.Kalinowski,J.Kusmierczyk-Michulec,J.Baré,T.Bowyer
T1.3−O1ispartofaninitiativetoascertainthelevelofagreementonecanachievebetweensimulatedconcentrationsandIMSmeasurementsusingonlystackemissiondataandanatmospherictransportmodel.

102 SCIENTIFIC ADVANCES IN CTBT MONITORING AND VERIFICATION 2017
CATEGORY3
T1.3−O5: InverseAtmosphericTransport Modelling: Determining the Source Location, SourceTerm and ItsUncertaintyQuantification
P.DeMeutter,J.Camps,A.Delcloo,P.Termonia
T1.3−O5, and the following presentation T1.3−O7, describe work towards establishing methods toquantify the uncertainties associated with the estimation of a radionuclide source term and itslocation.
T1.3−O7: SourceEstimationandAtmosphericModellingUncertaintiesQuantification S.Mekhaimr
CATEGORY4
T1.2−O1: DevelopingandValidatingPath-DependentUncertaintyEstimatesforUsewiththeRegionalSeismicTravelTime(RSTT)Model
M.Begnaud,D.Anderson,W.S.Phillips,S.Myers,S.Ballard
TheimprovementofRSTT(T1.2−O1),anditsextensiontoareaswhereitispoorlyconstrained,mayleadtotheimprovementofevent locationaccuracyasmaytheuseofalternative3Dmodels(thefollowingtwopresentations,T1.2−O1andT1.2−P18).ThisissueishighlyrelevanttoCTBTOsinceitpotentiallyresultsinimprovedlocationofseismicsources.
T1.2−O6: SALSA3D:AGlobal3DVelocityModelfor ImprovedSeismicEventLocation inNuclearExplosionMonitoring
S.Ballard,M.Begnaud,J.Hipp,C.J.Young,A.Encarnacao,W.S.Phillips,E.Chael
T1.2−P18: Global-ScaleJointBodyandSurfaceWaveTomographywithVerticalTransverseIsotropyforSeismicMonitoringApplications
N.Simmons,S.Myers
T1.4−O1: AcousticCharacteristicsoftheFramStrait H.Sagen,P.F.Worcester,M.Dzieciuch,B.D.Dushaw,E.Storheim,F.Geyer
T1.4−O1, and the following presentation T1.4−O6, are related to the long term ocean monitoringcapabilityofferedbytheIMShydroacousticnetworkthatprovidesdatafortsunamiwarningaswellasforawiderangeofscientificstudies.
T1.4−O6: Real Time Monitoring Data Application and Simulation Researches for Earthquake and TsunamiDisasterMitigation
Y.Kaneda,N.Takahashi,T.Hori
T2.2−O2: AboutGasFluxesintheSubsurfaceandSampling:FromSciencetoTechnology E.Pili,S.Guillon,P.M.Adler
T2.2−O2 contributes to a better understanding of subsurface processes, providing an example ofadaptingsubsurfacegassamplingtechniquesaccordingly.

SECTION 12 — RELEVANCE TO CTBTO ACTIVITIES AND VERIFICATION SCIENCE 103
PANELDISCUSSION
Thepaneldiscussion“UncertaintyMeasurementinAtmosphericTransportModellingandAtmosphericDynamics”(seeAPPENDIX2)demonstratedthatthethemeofuncertaintyquantificationinthisfieldisverycomplex,andthatthescientificcommunityisworkingtowardscombiningATMandensemblemodellingforthepurposeofprovidinguncertaintyestimatesforsourcelocation.Italsodemonstratedmaturityoftheinfrasoundtechnology,thepivotalroleoftheCTBTOandtechnicaladvancementsofinteresttotheCTBTO.
12.7 INTERPRETATION
CATEGORY1
T2.1−O9: SecondarySeismicSourcesofNorthKoreanNuclearTestsandItsMeaningforEventIdentification P.Jin,H.Xu,H.Wang,C.Pan,X.Xu
T2.1−O9representsacontinuingeffortonatopicofinterestfrompastSnTconferencestowardsthepossibleintegrationofseismicsourcemodellingintotheIDCprocessingsystem.
PANELDISCUSSION
Thepaneldiscussion“GlobalVerificationCapability:TheFiveAnnouncedDPRKNuclearTests”(seeAPPENDIX2)demonstratedconvergenceandsolidunderstandingofnucleartestparametersfromthisspecificsite.Fieldswereidentifiedforfutureprogress,suchasthecontributionofinfrasound,theestimationofsourcedepthandscreeningmethods.
T1.1−P5: Automated Detection and Cataloging of Global Explosive Volcanism Using the IMS InfrasoundNetwork
R.S.Matoza,D.Green,A.LePichon,P.Shearer,D.Fee,P.Mialle,L.Ceranna
T1.1−P5demonstratestheusefulnessoftheinfrasoundtechnologyformonitoringvolcanicactivitythatisrelevantforVolcanicAshAdvisoryCentresasmandatedbytheICAO.
T1.3−O2: Ar-37,Be-7andXe-133intheAtmosphere R. Purtschert, M. Kalinowski, J.S.E. Wieslander, X. Blanchard, R. Riedmann, L. Raghoo,
J.Kusmierczyk-Michulec,H.Gheddou,Y.Tomita
T1.3−O2describesworktowardscomparisonandidentificationofanypotentialcommonsourcesoftheseisotopes.
CATEGORY2
T2.5−O1: ExtrapolatingRadionuclideObservablesfromthePlatteUndergroundNuclearExplosiveTest B.Milbrath,J.Burnett
T2.5−O1,andthefollowingpresentationT2.5−P7,reporttechniquesthathavebeendevelopedthatareapplicabletoOSI.
T2.5−P7: PossibilityAssessmentofDeterminationofthePlaceoftheUndergroundNuclearTestsbyMeansofArtificialRadionuclidesPresenceinGroundwaterwithSTSExample
S.Subbotin,S.Lukashenko,K.Zelenskiy,V.Romanenko,V.Suprunov

104 SCIENTIFIC ADVANCES IN CTBT MONITORING AND VERIFICATION 2017
CATEGORY3
T3.3−O1: Remote Sensing Radar Interferometry and Precise Localization of the North Korean NuclearExplosions
G.Hartmann,M.Frei,I.Grünberg
T3.3−O1 demonstrates that satellite based radars can accurately locate underground nuclearexplosions.
CATEGORY4
T1.2−P35: SyntheticSeismogramsofExplosiveSourcesCalculatedbytheEarthSimulator S.Tsuboi,H.Matsumoto,M.Rozhkov,J.Stachnik,B.Baker
Syntheticseismogramsfromexplosionsources(T1.2−P35)potentiallyassistintheidentificationofsuchsources,soareofinteresttoCTBTO.
T2.5−P2: AnalysisoftheWavePatternofNuclearExplosionsRecordsfromLopNorTestSitebyCentralAsiaStations
I.Sokolova,Y.Kopnichev
T2.5−P2offersanalysisofobserveddatafromnuclearexplosions,whichisimportantinthecontextofsourcediscrimination.
T2.3−P9: EstimationofSourceParameters andTheirUncertaintiesofExplosionSourcesUsingEqualizationTechnique:“ApplicationtotheSPEChemicalExplosionsatNNSS
C.Saikia,M.Woods,J.Dwyer
Thedeterminationofmomenttensorsandothersourceparametersoffersonemethodofdiscriminatingbetweenexplosionsandothersources.T2.3−P9contributestothisfield.
T1.5−O1: AcousticMonitoring:FindingNewPopulationsoftheEndangeredBlueWhale T.Rogers,J.Tripovich,G.Truong,N.Balcazar
Besides thescientificcontributionaffordedbyT1.5−O1,CTBTObenefits fromhavingbeenakeenobserverofthedata.Ifonecanidentifywhalespeciesandlocatepopulations,thisitselfsaysmuchaboutthedetectionanddiscriminationcapabilitiesofthenetworkinthecontextofnuclearexplosionmonitoring.Methodsofpositivelyidentifyingandlabellingwhalecallswhichformasignificantpartofhydroacousticnoisearerelevanttotheidentificationofothersourcesuchasearthquakes.
T2.4−O1: IdentifyingCivilXe-Emissions:FromSourcetoReceptor A. Bollhöfer, P. De Meutter, F. Gubernator, B. Deconninck, C. Schlosser, U. Stöhlker, G. Kirchner,
C.Strobl,A.Delcloo,J.Camps
T2.4−O1enhancesourunderstandingoftheimpactthatradioactivexenonreleasesfromcivilnuclearfacilitieshaveonIMSnoblegasmonitoring.

SECTION 12 — RELEVANCE TO CTBTO ACTIVITIES AND VERIFICATION SCIENCE 105
12.8 CAPABILITY,PERFORMANCEAND SUSTAINMENT
CATEGORY1
T3.1−O3: PerformanceofMulti-ParameterBoreholeInstrumentationSystem(Marsite) C.Guralp,O.Ozel,S.Tunc
T3.1−O3confirmstheaddedvalueofinstallingbroadbandseismometersinboreholesforenhancingthedetectioncapabilityatlowfrequencies.
T4.1−P1: AdvancesinStateofHealthAnalysisforInternationalMonitoringSystems R.Suarez,J.Hayes,I.Cameron,T.Heimbigner,C.Hubbard,D.Keller
EnhancementstothestateofhealthofsystemsthataredeployedintheIMSarebeneficialtotheoperationandqualityofdatathatareproduced;T4.1−P1describessuchenhancements.
PANELDISCUSSION
The panel discussion “The International Monitoring System: Challenges from InstallationThroughCertificationtoSustainmentofthisUniqueGlobalNetwork”(seeAPPENDIX2)emphasizedthatthesuccessfuloperationoftheIMSisthecollectiveworkofStatesSignatoriesandtheirstationoperators,andthePTSanditsequipmentsuppliersandcontractors.ItemphasizedthattechnologyrefreshmentisfundamentaltothereliabilityandrelevanceoftheIMS,andthatStatesSignatoriesalsovaluetheIMSinregardtothedevelopmentofscienceintheircountries,aswellasinregardtoitscivilandscientificbenefits.ItwasrecognizedthatIMSenhancesregionalcooperationandscientificcollaboration.
CATEGORY2
T5.4−O3: Creating Synergy Between IMS Data and Local Data:Verification, DetectionThreshold and LocalApplications
T.B.Larsen,P.H.Voss,T.Dahl-Jensen
T5.4−O3 shows that combining data from local networks with IMS data using NDC in a box hasexpandedthecapabilityofNDCs.
T3.6−O1: AtmosphericTransportModellingandRadionuclideAnalysisfortheNPE2015Scenario J.O.Ross,A.Bollhöfer,V.Heidmann,R.Krais,C.Schlosser,N.Gestermann,L.Ceranna
T3.6−O1describeshowseveralGermanorganizationsinteractwiththeGermanNDCtoparticipateinNPEs.
T2.4−O2: PNNL-4:SourceTermAnalysisofXenon(STAX)–ExploringMethodsforUnderstandingRadioxenonCivilianSourceTerms
J.Friese,L.Metz,C.Doll,T.Bowyer
T2.4−O2contributestotheimportanttaskofunderstandingradioactivereleasesfromcivilfacilities.
T2.4−O3: SeasonalVariabilityofXe-133AtmosphericBackground:CharacterizationandImplicationsfortheInternationalMonitoringSystemoftheComprehensiveNuclear-Test-BanTreaty
S.Generoso,P.Achim,M.Morin,P.Gross,G.LePetit
T2.4−O3 is relevant to the determination of the atmospheric radionuclide background, which isimportanttothedetectionofCTBT-relevantsignals.

106 SCIENTIFIC ADVANCES IN CTBT MONITORING AND VERIFICATION 2017
CATEGORY3
T4.1−O6: QualityAssuranceofGroundMotionDataUsingtheIRISMUSTANGAnalyticsSystem T.Ahern,R.Casey,J.Callahan,G.Sharer,L.Keyson,M.Templeton
IRIShasput inplaceastrongqualityassuranceprogrammetoassessthequalityofthedatathatitreceives.(T4.1−O6).CTBTOcouldtakeadvantageofthelatestdevelopmentstoenhanceitsownqualityassuranceprogramme.
T3.2−P2: Gamma-GammaCoincidenceAnalysisofthe2015ProficiencyTestExercise(PTE) R.Britton,A.Davies
T3.2−P2 demonstrates increased sensitivities of CTBTO-relevant fission and activation productsachievableusingcoincidencemeasurementsbetweentwoHPGedetectorscomparedtogammasingles.Onepotentialapplicationwouldbetheimplementationof‘measurementrestriction’duringanOSI.
CATEGORY4
T2.3−P8: EstimationofFullMomentTensors, IncludingUncertainties,forEarthquakes,VolcanicEventsandNuclearExplosions
C.Alvizuri,V.Silwal,L.Krischer,C.Tape
As one method of discriminating between explosions and other types of seismic source, thedetermination of moment tensors is relevant to source discrimination in the context of nuclearexplosionmonitoring.T2.3−P8providesanexampleofsuchwork.
T4.1−O1: DifferentApproachtoDataAvailability:It’sMoreThanJustaPerformanceMetric! S.Poindexter,D.Kallus,R.Martin
T4.1−O1 describes the characterization of time series data gaps and their use as indicators ofupcominghardwarefailure,thusallowingpre-emptiveactiontopreventlargeroutage.Thistypeofcharacterizationgivesfurtherinsightintolessvisiblebutimportantfactorsthatcontributetodataoutagesatstations.
T1.4−O5: StudyingSubmarineVolcanicActivityUsingIMSHydrophoneData:DetectionandImplicationsforOceanNoise
D.Metz,A.B.Watts,I.Grevemeyer,M.Rodgers
Submarinevolcanicactivityformsacomponentofhydroacousticnoise,sohasimplicationsforsignaldetectionthresholds.T1.4−O5presentsarelevantstudy.
T2.5−P1: Kr-85MonitoringinNorth-WesternRegionofRussianFederation Y.Dubasov,N.Okunev,A.Orlov
T2.5−P1isrelevanttothedeterminationofrelevantatmosphericradionuclidebackground.

SECTION 12 — RELEVANCE TO CTBTO ACTIVITIES AND VERIFICATION SCIENCE 107
12.9 SHARINGDATAANDKNOWLEDGE
CATEGORY2
T3.5−P52: USNavy’s“FullShipShockTrials”asOpportunitiesforUSGSandCTBTOSeismicSystemEvaluationandCalibration.
R.Jih,R.Wagner
Results fromthecontrolledsourceexperimentsdescribed inT3.5−P52aremadeavailableandarevaluablefortheperformanceassessmentofCTBTstations.
T5.4−O5: RegionalSeismicTravelTimeEvaluation,TrainingandOutreach S.Myers,M.Begnaud,S.Ballard,A.C.AguiarMoya,I.Bondar,R.LeBras
T5.4−O5describesthevalueoftheRSTToutreachprogrammetosecure localandregionaldata insupportoftheimprovementintheRSTTmodelinseveralregionsoftheworldwiththecooperationofnationalobservatories.CTBTOhasaddedRSTTtoitsinternationaltrainingprogramme.
T5.4−O1: ANovelFrameworkforExpandingNDCCapacityBuilding M.MoutinhoSilva,U.H.Mitterbauer,N.P.Titus
T5.4−O1 demonstrates cooperation between advanced and emerging NDCs for supporting theirdevelopment.
CATEGORY3
T4.1−O7: TheWaveformDataProcessingSystemEstablishmentBasedonthePrivateCloudPlatform X.Wang,J.Li,J.Shang,W.Tang,Z.Liu,J.Liu,B.Zhang,H.Qiu,G.Zhu,J.Wang,Y.Wang,C.Zu
T4.1−O7,andthefollowingtwopresentationsT3.5−P11andT3.5−P25,considerusingcloudplatformsfordatastorageandprocessingindifferentcontexts.
NDCMEETING
ThemeetingofNDCsheldatSnT2017showedthatNDCshavemadeprogress incloudcomputingresources for operating NDCs and to mitigate the effects of poor Internet and lack of adequatecomputing power.The following two presentations T3.5−P11 and T3.5−P25 also describe relevantcloudbasedapplications.
T3.5−P11: DeployingENIABinCloudPlatform L.Kolesnykov,O.Liashchuk,R.Synytsky
T3.5−P25: ImprovingGeophysicalDataProcessingandResearchWithMulti-CloudEnvironments R.Synytsky
T1.5−O2: ASHEV4R4:AcousticSurveillanceofHazardousVolcanicEruptionsinAsia M.Garces,B.Taisne,T.Murayama,E.Blanc,J.Vergoz,A.Tupper,P.Mialle,M.Ngemaes,F.Shaw
T1.5−O2showsthevalueofinfrasound,includingtheIMSinfrasoundstations,inthemonitoringofvolcaniceruptionsinAsiainsupportofnaturalhazardsincludingthatposedtoaviation.

108 SCIENTIFIC ADVANCES IN CTBT MONITORING AND VERIFICATION 2017
CATEGORY4
T4.1−P3: BusinessIntelligenceSoftwareasaSelf-ServiceDataAnalysisPlatformfortheCTBTO T.Edwald,R.LeBras,Y.Kotselko,E.Tomuta
T4.1−P3 proposes further exploration of the applicability of business intelligence applications toyieldimprovementsinperformancemonitoringoftheIMS,andimprovedaccessanduseofdatabyexternalusers.
12.10 POLICYANDADVOCACY
CATEGORY2
T5.1−O2: ComparativeRolesofGlobalVerificationandOn-SiteVerification N.deSilva
T5.1−O2considerstherolesofglobalandon-siteverificationofinternationaltreaties.
T5.1−O1: Bringing Scientific Insights into Disarmament Policy: Science Advice at the Organisation for theProhibitionofChemicalWeapons
J.Forman
T5.1−O1 considers the interactionof scienceandpolicy from theperspectiveof theOPCW.SomeaspectsmaybeofvalueintheCTBTOcontext.
CATEGORY4
T5.1−P5: ScienceinSupportofInternationalTreatiesandSustainableDevelopmentGoals N.deSilva
T5.1−P5considerstheroleofscienceinsupportofinternationaltreaties,andfocusesespeciallyonthesustainabledevelopmentgoalsoftheUnitedNations.

APPENDIX 1 — ORAL AND POSTER PRESENTATIONS 109
Appendix 1Oral and Poster Presentations
THEME 1: THE EARTH AS A COMPLEX SYSTEM
T1.1 INFRASOUNDANDATMOSPHERICDYNAMICS
Oral Presentations
T1.1−O1: Bayesian Calibration of Ground-Truth Events from Stochastic Models C. Millet, M. Bertin, J. Vergoz, P. Mialle
T1.1−O2: Temperature and Wind Velocity Vertical Profiles in the Atmosphere S. Kulichkov, I. Chunchuzov, O. Popov, E. Golikova, P. Mialle, E. Blanc, A. Le Pichon, L. Evers, L. Ceranna
T1.1−O3: Evaluating Analysis and Forecast Uncertainty M. Rodwell
T1.1−O4: IMS Infrasound Network: Status and State-of-the-Art Design J. Marty
T1.1−O5: Listening to Glacial Infrasound in Northwestern Greenland L. Evers, P. Smets
T1.1−O6: Methods for Characterizing Meteors from Infrasound Signals C. Haynes, C. Millet
T1.1−O7: Uncertainties in Atmospheric Dynamics and Infrasound Monitoring E. Blanc, A. Le Pichon, A. Hauchecorne, A. Charlton-Perez, P. Smets, D. Tailpied
Poster Presentations
T1.1−P1: Advances on the Volcanic Parameter System with Infrasound Data P. Mialle, P. Gaillard, P. Husson, N. Brachet, E. Blanc
T1.1−P2: An Assessment of Infrasound Events in the REBs Produced in the Year 2016 F. Kebede, E. Jonathan, J. Gore
T1.1−P4: Are Measurements of Infrasonic Signal Duration Useful in the Context of Nuclear Explosion Monitoring?
D. Green, A. Nippress
T1.1−P5: Automated Detection and Cataloging of Global Explosive Volcanism Using the IMS Infrasound Network
R.S. Matoza, D. Green, A. Le Pichon, P. Shearer, D. Fee, P. Mialle, L. Ceranna
T1.1−P6: Comparative Near-Field and Far-Field Studies Using IMS Infrasound Data P. Campus, M. Ripepe, E. Marchetti

110 SCIENTIFIC ADVANCES IN CTBT MONITORING AND VERIFICATION 2017
T1.1−P7: Detection and Interpretation of Seismoacoustic Events at German Infrasound Stations C. Pilger, K. Koch, L. Ceranna
T1.1−P8: Detection Patterns for Two IMS Infrasound Stations in the Vicinity of the North Korean Test Site K. Koch, C. Pilger
T1.1−P9: Global Infrasound Association at the IDC: Advances and Performances P. Mialle, N. Arora, J. Vergoz, C. Pilger, L. Ceranna
T1.1−P10: IMS Infrasound Records of Announced Rocket Launches T. Medinskaya, P. Bittner, P. Polich, P. Mialle, J. Gore
T1.1−P11: Incorporating Realistic Terrain Boundary Conditions into Numerical Infrasound Propagation Modelling C. Khodr, D. Green, M. Azarpeyvand
T1.1−P12: InfraGA/GeoAc: An Open Source Infrasonic Ray Tracing Tool R. Whitaker, P. Blom
T1.1−P13: Infrasound Signals and Their Source Location Inferred from Array Deployment in the Lützow-Holm Bay, East Antarctica: 2015
M. Kanao, T. Murayama, M. Yamamoto, Y. Ishihara
T1.1−P14: Joint Processing of Pressure Pulsations and Wind Velocity Data at Infrasound Stations I. Rybin
T1.1−P15: Localization of Microbaroms Detected by I17CI and I11CV in IMS Data K.B. Kouassi, A. Diawara, F. Yoroba
T1.1−P16: Long-Range Infrasound Detections of Volcanic Activity by IS42 Station, Azores, Portugal S. Matos, N.M. Berquó de Aguiar Wallenstein, E. Marchetti, M. Ripepe
T1.1−P17: Optimization Methods of Network Parametric Selection of Infrasound Signal Sources I. Rybin, A. Rogovoi, D. Dolgov
T1.1−P18: PTS Portable Infrasound Array in Romania D.V. Ghica, M. Popa, C. Ionescu
T1.1−P19: Some Results of Recording Infrasound and Internal Gravity Waves from Atmospheric Fronts E. Golikova, S. Kulichkov
T1.1−P20: Temporal Variability of Infrasound Propagation and Detectability in the European Arctic S.J. Gibbons, S.P. Näsholm, T. Kværna, M. Blixt
T1.1−P21: The Acoustic Signature of Underground Chemical Explosions During the Source Physics Experiment L. Preston, D. Bowman, R. Waxler, R. Whitaker, K. Jones, S. Albert
T1.1−P22: The European Infrasound Bulletin C. Pilger, L. Ceranna, J.O. Ross, J. Vergoz, A. Le Pichon, P. Mialle
T1.1−P23: The First Infrasound Array in Hungary C. Czanik, I. Bondar
T1.1−P24: Using IMS IS13 and IS14 Stations to Analyse Strong Seismic and Volcanic Activity in Chile R. De Negri, P.S. García Peña, J. Campos

APPENDIX 1 — ORAL AND POSTER PRESENTATIONS 111
T1.2 SOLIDEARTHSTRUCTURE
Oral Presentations
T1.2−O1: Developing and Validating Path-Dependent Uncertainty Estimates for Use with the Regional Seismic Travel Time (RSTT) Model
M. Begnaud, D. Anderson, W.S. Phillips, S. Myers, S. Ballard
T1.2−O2: Estimate of the Lithospheric Structure in the Northwest South America from Receiver Functions Analysis
C.A. Vargas, G. Monsalve, F. Blanco, E. Poveda
T1.2−O3: Evaluation of NetVisa Association and Location Performance Using Ground Truth Events and RSTT Model Based SSSCs
I. Bondar, R. Le Bras, N. Arora, E. Tomuta
T1.2−O4: P- and S-Wave Receiver Function Study of the Crust and Mantle Structure Beneath the Transbaikalia L. Tcydypova, T. Tubanov, S. Oreshin, P. Predein
T1.2−O5: Predicting Local and Regional Phase Amplitudes W.S. Phillips, M.D. Fisk, X. Yang, M. Begnaud, R.J. Stead, S. Ballard
T1.2−O6: SALSA3D: A Global 3D Velocity Model for Improved Seismic Event Location in Nuclear Explosion Monitoring
S. Ballard, M. Begnaud, J. Hipp, C.J. Young, A. Encarnacao, W.S. Phillips, E. Chael
T1.2−O7: Shear-wave Attenuation Structure of Central Anatolia Using Full Seismogram Envelope K. Semin, N.M. Özel
T1.2−O8: Towards Focal Mechanisms in Poorly Known Velocity Models: Inverting Waveform Envelopes J. Carvalho, L. Barros
Poster Presentations
T1.2−P1: 3D Shear Velocity Model of the Eastern and Southern Alps from Ambient Noise Tomography E. Qorbani, D. Zigone, G. Bokelmann, AlpArray-EASI Working Group
T1.2−P2: A Framework of Ground Truth Event Locations Across Iran from a Two Tiered Multi-Event Relocation Approach
E. Karasozen, E. Bergman, E. Nissen
T1.2−P3: Amplitude-Dependent Station Magnitude Y. Radzyner, Y. Ben Horin, D.M. Steinberg
T1.2−P4: An Innovated Earthquake Modelling Technique for Near Source Modelling V. Gholami
T1.2−P6: Analysis of Stress State of Caucasus (Azerbaijan) Based on the Maximum Horizontal Stress Orientations and “World Stress Map” Technique
G. Babayev, B. Müller, E. Akhmedova, E. Babayev
T1.2−P7: Analysis of Variations in the Earthquakes Effects Based on the Bouguer Anomaly Map A. Adi Martha, T. Suroyo, T. Ismoyo, D. Damayanti
T1.2−P11: Crust-Upper Mantle Structure and Seismic Hazards Studies for National Planning and Development in Nigeria
U.A. Kadiri, F.O. Ezomo
T1.2−P12: Crustal Deformation Revealed by GPS in Greater Caucasus, Azerbaijan R. Safarov, F. Kadirov, S. Mammadov

112 SCIENTIFIC ADVANCES IN CTBT MONITORING AND VERIFICATION 2017
T1.2−P13: Crustal Structure of the Amazon Craton, Brazil D. Farrapo Albuquerque, G. Sand França, L. Vieira Barros, L. Paes Moreira
T1.2−P15: Determination Site Effect of Zarqa City and Hashemite University Campus Based on Microtremors Field Measurements: A Microzonation Study
W. Olimat
T1.2−P18: Global-Scale Joint Body and Surface Wave Tomography with Vertical Transverse Isotropy for Seismic Monitoring Applications
N. Simmons, S. Myers
T1.2−P19: Ground Truth Procedure to Improve the Seismic Locations, Velocity Model and Focal Mechanics Bulletin for Bolivia
G.A. Fernandez, J. Ryan
T1.2−P20: Identification of the Existences of the Mud Volcanoes Beneath East Java-Indonesia Region Using Ambient Noise Tomography Method
A. Adi Martha, E. Saygin, P. Cummins, S. Widiyantoro, M. Masturyono
T1.2−P21: Illuminating More of the Earth Via Sensors on Transoceanic Telecommunications Cables C. Rowe, N. Ranasinghe, E. Syracuse, C. Larmat, M. Begnaud
T1.2−P22: Improved Seismic Travel Times in Central and Northern Costa Rica for Accurate Earthquake Location A.C. Aguiar Moya, S. Myers
T1.2−P23: Improving the Analysis Method of ULF Geomagnetic Data for Earthquake Precursor Monitoring in the Sumatera Region
M.S. Syirojudin, M. Masturyono, J.M. Murjaya, S.A. Ahadi, A.Y. Yoshikawa
T1.2−P24: Investigations Aimed at Enhancing the Effectiveness of Seismic Monitoring in West Kazakhstan I. Sokolova
T1.2−P26: Seismic Site Effect Estimation Using Microtremor Studies in the Archaeological City Jerash in Jordan W. Olimat
T1.2−P27: Seismic Structure of West Africa from Surface Wave Tomography Using Regional Earthquakes and Ambient Seismic Noise
Y. Ouattara, D. Zigone, A. Maggi
T1.2−P28: Seismic wave attenuation in the Baikal Rift System A. Dobrynina, V. Sankov, V. Chechelnitsky
T1.2−P29: Seismicity and Seismotectonics of the Sudan and South Sudan N. Babiker, A.H. El Nadi, A.H. Gad Elmula, A. Eisawi
T1.2−P31: Site Effect in Archaeological City Jerash in Jordan W. Olimat
T1.2−P32: Source Process of the Mw = 5.1, Phalla (Islamabad) Earthquake and Its Tectonic Perspective M. Tahir, M. Ali Shah, T. Iqbal, F. Khanum
T1.2−P33: States of Local Stresses and Relative Locations of Small Earthquakes in the Sea of Marmara Y. Korkusuz Öztürk
T1.2−P35: Synthetic Seismograms of Explosive Sources Calculated by the Earth Simulator S. Tsuboi, H. Matsumoto, M. Rozhkov, J. Stachnik, B. Baker
T1.2−P36: The Preliminary Tidal Analysis Based on the CG-5 AUTOGRAV Gravity Measurements at Lenkaran Station (Azerbaijan)
F. Gadirov, S. Mammadov, G. Yetirmishli, A. Ismaylova

APPENDIX 1 — ORAL AND POSTER PRESENTATIONS 113
T1.3 ATMOSPHERICANDSUBSURFACERADIONUCLIDEDISPERSIONANDDEPLETION
Oral Presentations
T1.3−O1: 2nd ATM Challenge 2016 C. Maurer, M. Kalinowski, J. Kusmierczyk-Michulec, J. Baré, T. Bowyer
T1.3−O2: Ar-37, Be-7 and Xe-133 in the Atmosphere R. Purtschert, M. Kalinowski, J.S.E. Wieslander, X. Blanchard, R. Riedmann, L. Raghoo, J. Kusmierczyk-
Michulec, H. Gheddou, Y. Tomita
T1.3−O3: First Calculations on the Production of Ar-37 in Nuclear Power Plants in Regard to the Verification of the Nuclear-Test-Ban Treaty
A.C. Heise, G. Kirchner
T1.3−O4: HYSPLIT Inverse Modeling: Investigation Using Cross Appalachian Tracer Experiment (CAPTEX) Data and Ensemble Dispersion Simulations
T. Chai, A. Stein, F. Ngan
T1.3−O5: Inverse Atmospheric Transport Modelling: Determining the Source Location, Source Term and Its Uncertainty Quantification
P. De Meutter, J. Camps, A. Delcloo, P. Termonia
T1.3−O6: Long-Range Transport of Xe-133 Emissions Under Convective and Non-Convective Conditions J. Kusmierczyk-Michulec, M. Krysta, M. Kalinowski, E. Hoffmann, J. Baré
T1.3−O7: Source Estimation and Atmospheric Modelling Uncertainties Quantification S. Mekhaimr
T1.3−O8: The Use of Argon-37 Measurements as a Coincident Signature with Radioxenon and in High Background Environments in the International Monitoring System
T. Bowyer
Poster Presentations
T1.3−P3: Atmospheric Transport Modelling for the Radionuclides Detection of Northeast Asia in 2010 K. Suh, K. Park, B. Min, S. Kim
T1.3−P4: AtmosphericTransport Model Applied to the Design of Medical Isotope Production Facilities M. Alessi
T1.3−P5: Capability of HYPSLIT Dispersion Model in Fukushima Disaster H. Abdollahnejad
T1.3−P6: Comparison of Atmospheric Transport Models (ATM) Used in Decision Support in the Framework of the Austrian Radiological Emergency Response Preparedness
P. Skomorowski, K. Baumann-Stanzer, E. Polreich
T1.3−P7: Evaluation of the Inline WRF-HYSPLIT Model for Mesoscale Atmospheric Transport and Dispersion A. Suarez Mullins
T1.3−P8: Gas–Magma Interactions in Nuclear Cavities and Their Effects on the Xenon Isotope Ratios E. Pili, L. Pannecoucke, S. Guillon, D. Neuville
T1.3−P10: Geologic Control on Noble Gas Migration S. Broome, J. Feldman, A. Sussman, E. Swanson, J. Wilson
T1.3−P11: Impacts of Eruptions of Volcanoes Around Korean Peninsula: Simulation for Hypothetic Eruptions by Using LADAS-VA Model
K. Park, B. Min, S. Kim, K. Suhi
114 SCIENTIFIC ADVANCES IN CTBT MONITORING AND VERIFICATION 2017
T1.3−P12: Improved Evaluation of Atmospheric Flow and Transport over Complex Terrain at Multiple-Scales with Uncertainty
L. Glascoe, K. Lundquist, D. Lucas, D. Jensen, J. Mirocha, M. Simpson
T1.3−P13: Influence of Resolution on the Performance of FLEXPART with ECMWF Data in the ATM Challenge 2016
P. Seibert, A. Philipp
T1.3−P14: Influence of Small-Scale Radioxenon Sources on the Background Levels at CTBT IMS Monitoring Stations
M. Schoeppner, M. Kalinowski, J. Kusmierczyk-Michulec
T1.3−P15: Intercomparison Study Between Different Types of Models for the Dry Deposition of I-131 A. Delcloo, P. De Meutter, J. Camps, G. Olyslaegers
T1.3−P16: La-140 and Ba-140 Background from IMS Particles Stations O. Sanogo, K. Yamba
T1.3−P18: Non-Equilibrium Model of Multi-Phase Radionuclide Transport in Lake Water-Sediment System V. Filistovic, A. Puzas, D. Baltrunas, E. Maceika, N. Tarasiuk, B. Luksiene, M. Konstantinova,
S. Buivydas, E. Koviazina
T1.3−P19: Performance Assessment of the High-Resolution Atmospheric Transport Model at the IDC of the CTBTO
M. Schoeppner, M. Kalinowski, J. Kusmierczyk-Michulec, G. Klinkl
T1.3−P20: Sorption of Noble Gases in Porous Media and the Impact on Nuclear Explosion Signatures J. Lowrey, M. Paul, C. Johnson, S. Biegalski, D. Haas, M. Rockhold, M. Oostrom
T1.3−P21: Sources and Concentrations of Cs-137 in Kuwait G. Al-Qadeeri, M. Al-Rashidi, M. Al-Sudairawi
T1.4 HYDROACOUSTICSANDPHYSICALPROPERTIESOFTHEOCEANS
Oral Presentations
T1.4−O1: Acoustic Characteristics of the Fram Strait H. Sagen, P.F. Worcester, M. Dzieciuch, B.D. Dushaw, E. Storheim, F. Geyer
T1.4−O2: Directional Information from Signals Undergoing Hydroacoustic Blockage D. Dall’Osto
T1.4−O3: Modular Design Architecture of DONET Sea-Floor Observatory Network Y. Kaneda, K. Kawaguchi
T1.4−O4: SMART Cables Sensing the Pulse of the Planet B.M. Howe
T1.4−O5: Studying Submarine Volcanic Activity Using IMS Hydrophone Data: Detection and Implications for Ocean Noise
D. Metz, A.B. Watts, I. Grevemeyer, M. Rodgers
T1.4−O6: Real Time Monitoring Data Application and Simulation Researches for Earthquake and Tsunami Disaster Mitigation
Y. Kaneda, N. Takahashi, T. Hori

APPENDIX 1 — ORAL AND POSTER PRESENTATIONS 115
Poster Presentations
T1.4−P1: Data Processing Technique for T-phase and Tsunami Signals Recorded by IMS Hydrophone Triplets H. Matsumoto, G. Halarabus, M. Zampolli, N.M. Özel
T1.4−P2: Establishment of the IMS Hydroacoustic Station HA04, Crozet Islands, France. G. Haralabus, J. Stanley, M. Zampolli, J. Mattila, N. Meral-Özel, P. Grenard, P. Nielsen, R. Le Bras,
D. Brown, P. Bittner, H. Wang, J. Gore, M. Amir, S. Bereza
T1.4−P3: Exploiting Recent Plentiful Detections at H03 and H11 A. Brouwer, R. Le Bras, P. Bittner
T1.4−P5: Observations of a Coherent Signal in the High-Frequency Range of IMS Hydrophones (105-108 Hz) at Station HA08, Diego Garcia, Indian Ocean
C. Saceanu, R. Le Bras, M. Zampolli
T1.4−P6: Progress in the Studies on the Next Generation Cabled IMS Hydroacoustic Stations M. Zampolli, G. Haralabus, J. Stanley, J. Mattila
T1.4−P7: Risk Management and Program Execution G. Cekada, J. Cummins
T1.4−P8: Tsunami Waves Generated by Earthquakes and Landslides: Computed by Means of Numerical Simulations in the Western Black Sea
L. Dimova, A. Armigliato, G. Pagnoni, F. Zaniboni, S. Tinti, R. Raykova
T1.5 CIVIL,SCIENTIFICANDINDUSTRIALAPPLICATIONSOFIMSDATAANDIDCPRODUCTS
Oral Presentations
T1.5−O1: Acoustic Monitoring: Finding New Populations of the Endangered Blue Whale T. Rogers, J. Tripovich, G. Truong, N. Balcazar
T1.5−O2: ASHE V4R4: Acoustic Surveillance of Hazardous Volcanic Eruptions in Asia M. Garces, B. Taisne, T. Murayama, E. Blanc, J. Vergoz, A. Tupper, P. Mialle, M. Ngemaes, F. Shaw
T1.5−O3: Development of Seismic Hazard Maps for Georgia N. Tsereteli, A. Askan,O. Varazanashvili, V. Alania, N. Kvavadze
T1.5−O4: Quantification of Future Earthquake Hazard and Risk in Hindukush-Pamir Himalaya Using IMS Network Data
D. Shanker, M. Singh, S. Mohamed ALI
T1.5−O5: Using Social Media to Aid in the Refinement and Understanding of Seismic and Acoustic Ground Truth Information
J. Hertzog, R. Brogan, S. Nava, J. Etrick
T1.5−O6: Worldwide Seasonal Variation of Be-7 Related to Large-Scale Atmospheric Circulation Dynamics L. Terzi, M. Kalinowski, M. Schoeppner
Poster Presentations
T1.5−P1: ‘Seismic Cycle’ and Occurrence of Large Earthquakes D. Shanker
T1.5−P2: Active Lineaments Mapping Within Karonga Area L. Kalindekafe, F.C.D. Mphepo, H. Mdala, C. Chisenga, P. Chindandali

116 SCIENTIFIC ADVANCES IN CTBT MONITORING AND VERIFICATION 2017
T1.5−P3: Assessment of Seismic Hazard Potentials in Zimbabwe K. Marimira, B. Manzunzu, V. Midzi, L. Nare
T1.5−P4: Contribution of the IMS Seismic Stations and Products in Localization of the 28 March 2016 Okavango Delta Event
O. Ntibinyane, M.T. Kwadiba
T1.5−P5: Disaster Prediction Through Pattern Informatics Applied on Global Seismological Data S.M.A. Shah
T1.5−P6: Earthquake Safety: An Important Contribution of CTBT Seismic Monitoring Data E.O. Amartey, R.A. Annan, E.T. Mensah
T1.5−P7: Important Results Obtained from Data of Kazakhstan Seismic Arrays N. Mikhailova
T1.5−P9: Profile of Radionuclide Particulate Monitoring in Indonesia E.D. Nugraha, S. Syarbaini, D. Iskandar, E. Pudjadi
T1.5−P11: Seismic Hazard Assessment of the Caucasus T. Godoladze, R. Gok, T. Onur
T1.5−P15: Seismicity of Semipalatinsk Test Site Territory by Data of Kazakhstan Monitoring Network N. Mikhailova, I. Sokolova, N. Poleshko, A. Velikanov
T1.5−P16: Seismotectonic Implications of the 20 May 1990 South Sudan Earthquake J. Mulwa, F. Kimata
T1.5−P17: Strategy for the Popularization of the Virtual Data Exploitation Centre (vDEC) in West Africa A. Bisallah, U.O. Madu, M. Auta
T1.5−P18: Teleseismic Study of Ecuador Earthquake Using IMS Stations in Africa U.O. Madu, A. Bisallah
T1.5−P19: The Use of CTBTO IMS Data on Atmospheric Radioactivity Monitoring Following the Fukushima Dai-ichi Nuclear Power Plant Accident
R. Watt, M. Kalinowski
T1.5−P20: Trend Analysis of Cesium-137 Concentrations Observed in Kuwait Before and After Fukushima Nuclear Disaster
M. Al-Rashidi, M. Al-Sudairawi, G. Al-Qadeeri, M. Shlash
T1.5−P21: Understanding Future Landslide Hazards: 12 March Earthquake, West, and 29 March 2014 Landslide, East of Anjouan-Island, Comoros.
M. Madi
T1.5−P22: Upgrading Geological Fault Information Using the Last Shallow Seismic Events G.A. Fernandez, T. Griffiths, M. Nieto
T1.5−P23: Using of IMS Infrasound Stations for Tsunami Warning in the Antarctic Peninsula O. Liashchuk, Y. Karyagin, L. Kolesnykov
T1.5−P24: Validation of Tsunami Potency Determination Using Calculation of Rupture Duration (Tdur), Dominant Period (Td) and T50Ex
S. Rohadi, T.H. Thomas Hardy, M. Madlazim

APPENDIX 1 — ORAL AND POSTER PRESENTATIONS 117
THEME 2: EVENTS AND NUCLEAR TEST SITES
T2.1 TREATY-RELEVANTEVENTS
Oral Presentations
T2.1−O1: Accurate Depth Determination and Source Characteristics of the DPRK Nuclear Tests (2006, 2009, 2013, 2016J (01/06/2016) and 2016S (09/09/2016)) Using Regional and Teleseismic Arrays
S.G. Kim, Y. Gitterman, S. Lee, V. Vavrycuk
T2.1−O2: Analyses of Regional Seismic and Infrasound Data from Five North Korean Nuclear Explosions J. Park, I. Che, C. Hayward, B. Stump
T2.1−O3: Constraining the Explosive Nature of the DPRK Nuclear Events at Regional Scale Using Moment Tensor Inversions and MSVMAX
A. Guilhem Trilla, Y. Cano
T2.1−O4: CTBTO Response to an Underwater or Surface Test in International Waters G. Moore
T2.1−O5: Detection and Discrimination of Small Earthquakes and Explosions around North Korean Nuclear Test Site
E. Jo, Y. Roo, W. Kim
T2.1−O6: Estimation of NK09 and NK13 Source Time Functions and Yields Directly from Seismograms A. Ziolkowski
T2.1−O7: Potential Detection of Low- Level Aerosol Isotopes from New Civilian Nuclear Processes H. Miley, J. Lowrey, J. Burnett, M. Foxe, M. Mayer
T2.1−O8: Relative Energy and Aperture Estimation of the Five Explosions in North Korea Z. Zheng
T2.1−O9: Secondary Seismic Sources of North Korean Nuclear Tests and Its Meaning for Event Identification P. Jin, H. Xu, H. Wang, C. Pan, X. Xu
T2.1−O10: Seismo-Acoustic Analyses of the DPRK Underground Nuclear Tests for the Estimation of Source Depth
J. Assink, G. Averbuch, P. Smets, L. Evers
T2.1−O11: Source Array Analysis for Accurate Relative Event Location at the North Korea Nuclear Test Site S.J. Gibbons, T. Kværna, S.P. Näsholm, S. Mykkeltveit
Poster Presentations
T2.1−P1: Eight Years on Since the Upgrade of the Eskdalemuir, UK, Seismic Array: Network Advances and New Observations
H. Peters, N. Watkiss, M. McGowan, S. Poole, P. Bartholomew
T2.1−P2: Absolute and Relative Body Wave Magnitudes of Five DPRK Events as Measured by the IDC I. Kitov, D. Bobrov, M. Rozhkov
T2.1−P3: Absolute and Relative Location at the IDC: Five DPRK Events I. Kitov, D. Bobrov, M. Rozhkov
T2.1−P4: Analysis Spectral and Focal Mechanism of Likely Nuclear Explosion in North Korea January 2016 S. Supriyanto Rohadi, B. Bambang Sunardi, R. Rasmid

118 SCIENTIFIC ADVANCES IN CTBT MONITORING AND VERIFICATION 2017
T2.1−P5: Atmospheric Transport Modelling Assessing Chances to Detect Radionuclides Released from the Known DPRK Test Site
J.O. Ross, L. Ceranna
T2.1−P6: Atmospheric Transport Modelling for Radionuclide Monitoring after the Nuclear Tests of the DPRK on 6 January and 9 September 2016
J. Kusmierczyk-Michulec, M. Kalinowski
T2.1−P7: Estimation of a Relative Depth and Yield of DPRK’s Third and Fourth UNE T.S. Kim
T2.1−P9: Identification of Seismic Signals from Underground Nuclear Explosion Produced at DPRK Test Site O. Liashchuk, Y. Andrushchenko, Y. Karyagin, L. Kolesnykov, Y. Gordienko
T2.1−P10: Improving Our Understanding of Explosion Seismic Waves from the Nevada Source Physics Experiments
W. Walter, R. Mellors, A. Pitarka, S. Ford, S. Myers, M.L. Pyle, T. Chen, C. Snelson
T2.1−P11: IMS Radioxenon Monitoring after the Announced Nuclear Tests of the DPRK on 6 January and 9 September 2016
M. Kalinowski, M. Auer, H. Gheddou, H. Gohla, M. Krysta, J. Kusmierczyk-Michulec, B. Liu, E. Nava, R. Plenteda
T2.1−P13: Nuclear Event Fallout Inhomogeneity on Small- and Medium-Scale in Meadows and Forests A. Puzas, D. Baltrunas, M. Konstantinova, A. Gudelis, R. Gvozdaite, J. Sapolaite, R. Druteikiene, E.
Lagzdina, D. Lingis, V. Juzikiene, V. Remeikis
T2.1−P14: Registration of Events from DPRK Test Site in 2016 by Facilities of Main Center of Special Monitoring L. Kolesnykov, O. Liashchuk, Y. Andrushchenko
T2.1−P16: Romania National Data Centre Contribution to Nuclear Test Monitoring D.V. Ghica, M. Popa
T2.1−P17: Summing Particulates and Noble Gas Spectra to Improve Detection Sensitivity and Reduce Statistical Uncertainty
H. Gheddou, M. Kalinowski, R. Plenteda, J. Kusmierczyk-Michulec
T2.1−P18: The Seismic Event in North Korea 9 September 2016 S. Dovbysh
T2.2 CHARACTERIZATIONOFEVENTSTHROUGHON-SITEINSPECTION
Oral Presentations
T2.2−O1: A Method for Applying Measurement Restrictions to a High-Purity Germanium Detector Within the Framework of On-Site Inspections
O. Aviv
T2.2−O2: About Gas Fluxes in the Subsurface and Sampling: From Science to Technology E. Pili, S. Guillon, P.M. Adler
T2.2−O3: Characterization of Events Through On-Site Inspection N. de Silva
T2.2−O4: Express-Method for Identification of Underground Nuclear Explosion-Induced Radionuclide Seepage Area During On-Site Inspection
A. Ustselemov, I. Markov, S. Dmitry, G. Orlov
APPENDIX 1 — ORAL AND POSTER PRESENTATIONS 119
T2.2−O5: Gamma-Ray Imaging for Assessing Radiation Source Distributions in On-Site Inspection S. Kreek, M. Burks
Poster Presentations
T2.2−P1: A Standardized and Accurate Sampling Device for On-Site Inspection and Verification Purposes after a Nuclear Incident
A. Lee Zhi Yi, T. Arsenio, M. Lionel
T2.2−P2: Analytical Procedures Developed by the IAEA’s ALMERA Network Applicable to the Characterization of Legacy Nuclear Test Sites
A. Pitois, I. Osvath, S. Tarjan, M. Groening, D. Osborn
T2.2−P3: Delayed Telltale Signature of an Underground Nuclear Explosion C. Carrigan, Y. Sun, M. Simpson
T2.2−P5: Geophysical Imaging of an Uncollapsed Nuclear Explosive Test R. Abbott, E. Matzel, C. Rowe, C. Gammans, J. Hampshire II, P. Eick, L. Worthington, R. White,
R. Keegan, P. Lee
T2.2−P6: Measurement of Radioargon and Radioxenon in Soil Gas M. Aldener, T. Fritioff, J. Kastlander, L. Raghoo, R. Purtschert
T2.2−P7: Measurements of Ar-37 Backgrounds at the Nevada National Security Site J.J. McIntyre
T2.2−P8: On-Site Carbon Dioxide and Stable Isotopologues Measurement to Support OSI Subsurface Gas Sampling
A. Rizzo, C. Telloli, C. Vaccaro, P. Bartolomei, S. Salvi, R. Lorenzelli
T2.2−P9: PNNL-2: On-Site Inspection Capabilities – Examination of Laboratory Detector Response J. Friese, B. Pierson
T2.2−P10: Revisiting the On-site Inspection (OSI) Concept of Operations in Light of Integrated Field Exercise 2014 (IFE14) and Inspection Team Functionality
G.A. MacLeod, W. Hawkins, P. Labak, A. Sussman
T2.2−P11: Semipalatinsk Test Site: Underground Nuclear Explosions Signatures in the Velocity Field on P- and S- Waves (for the OSI Purposes)
A. Belyashov, V. Suvorov, E. Melnik
T2.2−P12: Simulation of Shallow Subsurface Noble Gas Transport Using Subsurface Transport over Multiple Phases (STOMP)
J. Lowrey, C. Johnson, M. Rockhold, S. Biegalski, D. Haas
T2.2−P14: Variations of Cs-137 Background of Global Fallout at OSI Site as the Signature to Search for Radiation Anomaly or the Artefact
Y. Dubasov, S. Gavrilin
T2.3 SEISMOACOUSTICSOURCESINTHEORYANDPRACTICE
Poster Presentations
T2.3−P1: A New Experimental Field Study of the Effects of Explosive Detonation Products on Seismic Radiation A. Stroujkova, M. Leidig, J. Lewkowicz, T. Rath

120 SCIENTIFIC ADVANCES IN CTBT MONITORING AND VERIFICATION 2017
T2.3−P3: Combined Experiment and Numerical Modelling to Understand Response Near Chemical Explosions D. Steedman, E. Schultz-Fellenz, S. Ezzedine, O. Vorobiev
T2.3−P4: Compilation of Infrasound Ground-Truth Database Using Seismic Data A. Smirnov
T2.3−P5: December 7th Earthquake F. Khairina, T.A. Prakoso, S. Wei
T2.3−P6: Dynamics of Reservoir Induced Seismicity in Aswan, Egypt M. ElGabry, L. Telesca, R. Fat Elbary, T. Stabile, H. Mohamed
T2.3−P7: Earthquakes Mechanisms in Egypt M. Abdelazim Abdalla Metwally, H. Hussein, M. ElGabry
T2.3−P8: Estimation of Full Moment Tensors, Including Uncertainties, for Earthquakes, Volcanic Events and Nuclear Explosions
C. Alvizuri, V. Silwal, L. Krischer, C. Tape
T2.3−P9: Estimation of Source Parameters and Their Uncertainties of Explosion Sources Using Equalization Technique: “Application to the SPE Chemical Explosions at NNSS
C. Saikia, M. Woods, J. Dwyer
T2.3−P10: Events Detected by the Indian Ocean Network of Hydroacoustic IMS Stations P. Bittner, J. Gore, H. Wang, R. Le Bras, P. Nielsen, D. Brown, G. Haralabus
T2.3−P11: Induced Seismicity on the Territory of Kazakhstan I. Sokolova, N. Mikhailova, A. Velikanov, N. Poleshko
T2.3−P12: Precursor Study by a Physical Model of the Ahar-Varzaghan Doublet Earthquakes (6.5, 6.3) 2012 at the Northwest of Iran
R. Rezaei, M. Maleki
T2.3−P13: Seismic and Hydroacoustic Observations from Underwater Explosions off the East Coast of Florida R. Heyburn, D. Bowers, S. Nippress
T2.3−P14: Seismoacoustic Effects of the Khubsugul Earthquake of 5 December 2014, Mw = 4.9, Mongolia A. Dobrynina, A. Sorokin, V. Sankov, V. Chechelnitsky, E. Chernykh, L. Tsidipova, T. Tubanov, V. German,
U. Munkhuu
T2.3−P15: Time-Domain Source Function (TDSF) for Nuclear and Chemical Explosions: Analysis Around Nevada National Security Site (NNSS)
C. Saikia
T2.4 ATMOSPHERICBACKGROUNDOFRADIOXENON
Oral Presentations
T2.4−O1: Identifying Civil Xe-Emissions: From Source to Receptor A. Bollhöfer, P. De Meutter, F. Gubernator, B. Deconninck, C. Schlosser, U. Stöhlker, G. Kirchner,
C. Strobl, A. Delcloo, J. Camps
T2.4−O2: PNNL-4: Source Term Analysis of Xenon (STAX) – Exploring Methods for Understanding Radioxenon Civilian Source Terms
J. Friese, L. Metz, C. Doll, T. Bowyer

APPENDIX 1 — ORAL AND POSTER PRESENTATIONS 121
T2.4−O3: Seasonal Variability of Xe-133 Atmospheric Background: Characterization and Implications for the International Monitoring System of the Comprehensive Nuclear-Test-Ban Treaty
S. Generoso, P. Achim, M. Morin, P. Gross, G. Le Petit
Poster Presentations
T2.4−P1: Analysis of Data from an Intercomparison Between a SAUNA II and a SAUNA III System A. Ringbom, M. Aldener, A. Axelsson, T. Fritioff, J. Kastlander, A. Mörtsell, H. Olsson
T2.4−P2: Considerations of Xenon-133 to Iodine-131 Ratios for Discriminating Signatures of Nuclear Test Explosions Against Normal Operational Releases from Nuclear Facilities
M. Kalinowski, E. Buhmann
T2.4−P3: Description and Analysis of CTBT-Relevant Xe Isotopes Global Background Between 2010 and 2016 M. Elbahrawy, S. Mekhaimr
T2.4−P4: Experience as a Significant Tool for the Design of Gaseous Effluents Stack Monitors I. Scarinci, F. Fernandez Baldis, R. Pino, E.L. Nassif, M.L. di Tada
T2.4−P5: How Can We Use Atmospheric Radioxenon Observations Related to the Daiichi Nuclear Power Plant Accident at Fukushima to Better Understand IMS Observations?
J. Wang, M. Kalinowski
T2.4−P6: RA10 New Research Reactor for Medical Isotope Production in Argentina E.E. Quintana
T2.4−P7: Radioisotopes Production in Argentina: Change of HEU to LEU and Improvements to Reduce the Emissions of Radioxenon
E.C. Carranza
T2.4−P8: Radioxenon Prototype Trap Validation and Controlled Source Experiments Under the EU Council Decision VI Project
J. Baré, M. Kalinowski, C. Gueibe, J. Rutten, J. Camps, K. van der Meer, D. Moyaux, B. Deconninck, J. Kusmierczyk-Michulec, M. Schoeppner
T2.4−P9: Reactor Simulations Characterizing Xenon Isotopic Ratios in Nuclear Power Plants J.O. Ross, M. Englert, C. Pistner, L. Ceranna
T2.4−P10: Results and Outcomes in Xenon Mitigation under the EU Council Decision V C. Gueibe, J. Rutten, J. Camps, K. van der Meer, D. Moyaux, B. Deconninck, M. Auer, J. Baré,
M. Kalinowski
T2.4−P11: Setting the 2014 Baseline for Simulated Activity Concentrations of Four Radioxenon Isotopes at IMS Sites Based on Estimated Annual Releases of Known Sources
C. Gueibe, M. Kalinowski, J. Baré, H. Gheddou, M. Krysta, J. Kusmierczyk-Michulec
T2.4−P12: SIMPAX: A Prototype Software Application Simulating the Impact of Radioxenon Emissions from Civil Sources on IMS Stations
H. Gheddou, C. Gueibe, M. Kalinowski, J. Kusmierczyk-Michulec, J. Baré
T2.4−P13: Stack Release Data Analysis: Progress and Expected Outcomes J. Baré, H. Gheddou, M. Kalinowski
T2.4−P14: Start-Up and Calibration of INVAP Stack Air Effluent Monitor M.L. di Tada, F. Fernandez Baldis, E.L. Nassif, R. Pino, I. Scarinci
T2.4−P15: Statistical Technique for Estimation of Global Isotopes Releases Affecting Test Detection S.M.A. Shah

122 SCIENTIFIC ADVANCES IN CTBT MONITORING AND VERIFICATION 2017
T2.4−P17: Towards a Better Noble Gas Characterization Scheme Based on 10 Years of National Data Centers (NDC) Analysis
G. Le Petit, A. Axelsson, K. Ungar, P. Achim, P. Gross, S. Generoso, M. Morin, A. Ringbom
T2.4−P18: Updated Worldwide Background of CTBT-Relevant Xenon Isotopes H. Gheddou, M. Kalinowski, J. Kusmierczyk-Michulec, J. Baré
T2.4−P19: Use of IMS Data and Its Potential for Research Through Global Noble Gas Concentration Maps L. Terzi, M. Kalinowski, C. Gueibe, J. Camps, H. Gheddou, J. Kusmierczyk-Michulec, M. Schoeppner
T2.4−P20: WOSMIP 6: Harvesting Results from Intensified Cooperation Between the Nuclear Explosion Monitoring and Isotope Production Communities
C. Doll, L. Metz, J. Friese, I. Cameron, T. Bowyer, M. Kalinowski, J. Kusmierczyk-Michulec, J. Baré, R. Plenteda, E.L. Nassif, M.L. di Tada, R. Sagarzazu
T2.4−P21: Xenon Radioisotope Signatures from NPP Power Variations and Their Impact on the CTBTO Verification Regime
F. Rocchi, G. Ottaviano, D.M. Castelluccio, A. Rizzo, G. Grasso, F. Padoani, M. Kalinowski
T2.5 HISTORICALDATAFROMNUCLEARTESTMONITORING
Oral Presentations
T2.5−O1: Extrapolating Radionuclide Observables from the Platte Underground Nuclear Explosive Test B. Milbrath, J. Burnett
Poster Presentations
T2.5−P1: Kr-85 Monitoring in North-Western Region of Russian Federation Y. Dubasov, N. Okunev, A. Orlov
T2.5−P2: Analysis of the Wave Pattern of Nuclear Explosions Records from Lop Nor Test Site by Central Asia Stations
I. Sokolova, Y. Kopnichev
T2.5−P3: Measurement of Background Gamma Radiation in the Northern Marshall Islands A. Bordner
T2.5−P4: Nuclear Explosions in the Eastern Siberia (the Former USSR) in 1976-1987 A. Dobrynina, V. Chechelnitsky
T2.5−P5: Nuclear Test Explosions Recorded by Seismic Stations of the Slovak Academy of Sciences R. Kysel, Z. Margocova, K. Csicsay, A. Cipciar, L. Grajcarova
T2.5−P6: Observation of Infrasound Signals from the 1920s U.H. Mitterbauer
T2.5−P7: Possibility Assessment of Determination of the Place of the Underground Nuclear Tests by Means of Artificial Radionuclides Presence in Groundwater with STS Example
S. Subbotin, S. Lukashenko, K. Zelenskiy, V. Romanenko, V. Suprunov
T2.5−P8: Potentially Dangerous Technogenic Objects at Semipalatinsk Test Site V. Suprunov, S. Subbotin, V. Romanenko, S. Lukashenko
T2.5−P9: Some features of wave forms of seismic events from the areas of nuclear Asia Test Sites according to the data of AS60 seismic station (AAK, Ala-Archa, Kyrgyzstan)
A. Berezina, I. Sokolova

APPENDIX 1 — ORAL AND POSTER PRESENTATIONS 123
T2.5−P10: The Nuclear Tests in Ukraine (the Ukrainian SSR) in the Period of 1972-1979 Years S. Dovbysh
T2.5−P11: The Precise Location of the Fifth Nuclear Test in North Korea L. Fang
THEME 3: ADVANCES IN SENSORS, NETWORKS AND PROCESSING
T3.1 DESIGNOFSENSORSYSTEMSANDADVANCEDSENSORTECHNOLOGIES
Oral Presentations
T3.1−O1: New Gamma Viewfinder Concept P.C. Florido, E.L. Nassif, M. Marchioni, A.E. De María
T3.1−O2: New Optical Microbarometer S. Olivier, N. Olivier, A. Hue, S. Le Mallet
T3.1−O3: Performance of Multi-Parameter Borehole Instrumentation System (Marsite) C. Guralp, O. Ozel, S. Tunc
T3.1−O4: SCoTSS Gamma Imager for CTBT On-Site Inspection P. Saull, L. Sinclair, A. MacLeod, J. Hovgaard, B. Krupskyy, P. Drouin, A. McCann, H. Seywerd,
D. Waller, L. Erhardt
T3.1−O5: SPALAX-New Generation: Deployment, Operation and Performances S. Topin, G. Le Petit, J. Piwowarczyk, T. Philippe, A. Cagniant, O. Delaune, P. Gross, G. Douysset,
C. Moulin
T3.1−O6: Strategies for Recording the Full Seismic Wavefield R. Woodward, C. Langston, J. Sweet, K. Anderson
T3.1−O7: The SAUNA III Project A. Ringbom, M. Aldener, A. Axelsson, T. Fritioff, J. Kastlander, A. Mörtsell, H. Olsson
Poster Presentations
T3.1−P1: ‘CARD’: Characterization of Adjoint Response for Ge Detectors G. Sjoden, J. Petrosky, J. Fee, B. O’Day
T3.1−P3: A Novel Three Component Optical Seismometer Based on the Moiré Technique A. Ansari, S. Esmaeili
T3.1−P5: A Seismic Noise Survey of Western Kazakhstan K. Mackey, I. Sokolova, D. Burk, A. Abishev, A. Belyashov, R. Jih
T3.1−P6: A Testing Environment for Airborne Optical Sensors K. Szalay, F. Safranyik, G. Bércesi, A. Bablena, J. Nagy, B. Szabó, L. Kovács, J. Deákvári, A. Rowlands
T3.1−P7: Adding Wireless Capabilities to an IMS Portable Infrasound Array O. Ratiu, P. Dolea, P. Mialle
T3.1−P8: Ag@zeolite: Toward the Miniaturization of the NG Process S. Topin, L. Deliere, G. Couchaux, A. Monpezat, A. Cagniant, M. Bean, R. Berg, K. Ungar
T3.1−P9: Automated Testing and Our RASA Software Development Environment D. Bustillo, J. Volle, E. Tillistrand, M. Wright

124 SCIENTIFIC ADVANCES IN CTBT MONITORING AND VERIFICATION 2017
T3.1−P10: Autonomous Intelligent Sensor Systems S.M.A. Shah, S.M.T. Shah
T3.1−P11: CLYC Scintillators: A Possible Enhancement for Handheld OSI Detectors T. Köble, C. Bornhöft, O. Schumann, M. Risse, H. Friedrich, W. Berky, W. Rosenstock
T3.1−P12: Colombian Seismological Network and Its Challenges A.F. Gomez Gomez
T3.1−P13: Cross-Calibration of Airborne and Ground Based Gamma Radiation Survey Techniques Under On-Site Inspection Conditions
X. Blanchard, J. Buckle, A. Rowlands, K. Motschka, E. Toth, B. Nadalut, A. Baumgartner
T3.1−P14: Design and Simulation of a Leaser-Interferometer Broadband Seismometer E.L.Z. Habbak, H.N. Nofal, Z.N. Nossair
T3.1−P16: Developing a Low Cost Shout Down MEMS Base Accelerometer Suitable for Rapid Response and Structural Applications
V. Gholami, A. Seif Pour Abolhassani
T3.1−P17: Development and Performance of Cosmic Guard and Compton Suppression System for Environmental Radiological Analysis
G. Ilie, L. De Baerdemaeker, H. Jaderstrom, W. Mueller
T3.1−P18: Development of a Field Portable Ar-37 Monitoring Capability J. Hayes
T3.1−P19 Development of Si-PIN Diodes Detection Unit for Noble Gas Systems ARIX S. Lashaev, Y. Dubasov, V. Dushin, A. Kamentsev
T3.1−P20: Development of U.S. NDC Performance Metrics Through Large Scale Analysis of System Log Files With Hadoop Distributed File System Based Tools
W.N. Junek, C.A. Houchin, J.A. Wehlen III, A. Poffenberger, R. Kemerait
T3.1−P21: Developments in IMS Infrasound Array Geometry Tools J.S. Robertson, M. Charbit
T3.1−P22: Implementation of New Technologies at the IMS Radionuclide Particulate Stations B. Nadalut, R. Plenteda
T3.1−P23: Improving MDC in the Radionuclide Particulate RASA System R. Hong, B. Hosticka, G. Shipman, M. Wright
T3.1−P24: Improving Metadata Accuracy Within Seismic Networks D. Burk, K. Mackey
T3.1−P25: IMS Equipment Challenges for Waveform Technologies Y. Starovoyt, J. Marty, I. Dricker
T3.1−P26: Infrasound Isolation Chamber for Improved Sensor Calibration B.J. Merchant, G. Slad, R. Rembold
T3.1−P27: Installation and Testing of a Cosmic Veto System at the IMS Station RN67, St Helena A. Davies, R. Britton, B. Nadalut, M. Le Maillot
T3.1−P28: Next Generation Noble Gas System for the IMS Network R. Plenteda, H. Gohla, B. Wernsperger
T3.1−P29: Operational Interface and Capability of a Carborne Survey Instrument Developed for the PTS Under US CiK
S. Kreek, D. Trombino

APPENDIX 1 — ORAL AND POSTER PRESENTATIONS 125
T3.1−P31: SAUNA III New Beta Detector Performance T. Fritioff, A. Axelsson, A. Mörtsell, A. Ringbom
T3.1−P32: Sensing Ionospheric Disturbances Using a Large GNSS Network J. Garrison, A. Komanduru, M.P. Hickey, J. Snively
T3.1−P33: Snapshot Hyperspectral Imaging – Hand-Held Image Acquisition for Ground Inspection A. Jung, F. Dénes, G. Nagy, L. Kovács, R. Rák, B. Szabó, J. Nagy, J. Deákvári, A. Rowlands, K. Szalay
T3.1−P34: System Tests of OSIRIS: A Spectrum-Blind Gamma-Ray Spectrometer for On-Site Inspections under the Comprehensive Nuclear-Test-Ban Treaty
G. Caffrey, W. Alston, A. Egger, K. Krebs, B. Milbrath, S. Padgett, G. Warren, M. Wetzel, J. Wharton, N. Wimer, M. Zalavadia
T3.1−P35: The Calibration of IMS Seismic and Hydroacoustic T-Phase Stations R. Otsuka, K. Aktas, M. Malakhova, H. Malephane, S. Nikolova
T3.1−P37: The Radiological Field Training Simulator (RaFTS)/Spectroscopic Injection Pulser (SIP) for Radiation Detection Training Without Radiation Sources in On-Site Inspection
S. Kreek, D. Trombino, J. Oakgrove, G. White
T3.1−P38: The SAUNA CUBE Project: A New Concept in Radioxenon Detection Using Noble Gas System Arrays A. Ringbom, M. Aldener, A. Axelsson, T. Fritioff, J. Kastlander, A. Mörtsell, H. Olsson
T3.1−P39: Unmanned Radiation Measurements M.J. Kettunen, T. Heininen
T3.1−P40: Using Antineutrinos to Verify the Nuclear Nature of a Suspect Nuclear Test Based on Seismic Event Coincidence
J.R.F. Dalnoki Veress, R. Carr, A. Bernstein
T3.1−P41: Wind Noise Reduction Systems in the International Monitoring System Infrasound Network A. Kramer, J. Marty
T3.1−P42: Xenon International: A New Capability for Radioxenon Measurements J. Hayes, T. Bowyer, M. Panisko, W. Harper, M. Howard
T3.2 LABORATORIESINCLUDINGMOBILEANDFIELD-BASEDFACILITIES
Oral Presentations
T3.2−O1: Mobile Laboratory for Noble Gases Analysis in Atmospheric Air Y. Dubasov, V. Golubev, A. Kamentsev, S. Pakhomov
T3.2−O2: Mobile Sampling and Measuring Complex “SLARS” S. Pakhomov
Poster Presentations
T3.2−P1: Determination of Fission Radionuclides Sr-90 and Pu-242 in Water Samples I. Rosianna, E.D. Nugraha, Y. Yurfida, A. Warsona
T3.2−P2: Gamma-Gamma Coincidence Analysis of the 2015 Proficiency Test Exercise (PTE) R. Britton, A. Davies
T3.2−P4: Laboratory Analysis of Radioxenon Samples as a Support of the IMS Network G. Douysset, P. Gross, J. Fontaine, O. Delaune

126 SCIENTIFIC ADVANCES IN CTBT MONITORING AND VERIFICATION 2017
T3.2−P6: Shielding of Portable High Purity Germanium Detectors for Use in Stand Alone Configuration S. Salvi, R. Lorenzelli, P. Parente, P. Bartolomei, A. Rizzo
T3.3 REMOTESENSING,SATELLITEIMAGERYANDDATAACQUISITIONPLATFORMS
Oral Presentations
T3.3−O1: Remote Sensing Radar Interferometry and Precise Localization of the North Korean Nuclear Explosions
G. Hartmann, M. Frei, I. Grünberg
T3.3−O2: Satellite-borne Video Processing and Reporting Techniques for Imagery Analysis J. Rutkowski, P. d’Angelo, I. Niemeyer
Poster Presentations
T3.3−P1: Aerial Gamma Spectroscopy for On-Site Inspections in Winter Environments H. Seywerd, J. Buckle, M. Coyle, R. Fortin, L. Sinclair, B. Harvey, R. Van Brabant, D. Oneschuck,
X. Blanchard, A. Rowlands, G. Malich
T3.3−P2: Airborne Gamma-Spectrometry Mapping I. Iliev, V. Vasilev, M. Mladenova
T3.3−P3: Anomaly Detection in Remote Optical Imagery D. Anderson, J. Craven, A. Rowlands, M. Zelinski, E. Schultz-Fellenz
T3.3−P4: Detection of OSI-Relevant Features Using Time-Series Radar Imagery A. Rowlands, A. Charlton, K. Johnson, C. Waugh
T3.3−P5: Ionospheric Waves Associated of Earthquakes and Nuclear Explosions Using Total Electron Content (TEC)
S. Rohadi, B. Bambang Sunardi, B.M. Buldan Muslim
T3.3−P6: Repurposing the Global Network of Radiation Portal Monitors R. Livesay, L. Dallas
T3.3−P7: State Provided GIS Data Sources for Treaty Verification J. Rutkowski, A. Keskinen, I. Niemeyer, J. Idinger, A. Rialhe
T3.3−P8: Subsurface, Surface and Remote Observations of Legacy Nuclear Explosion Sites A. Sussman, D. Anderson, C. Burt, J. Craven, C. Kimblin, I. McKenna, E. Miller, C. Rowe,
E. Schultz-Fellenz, S. Vigil, D. Yocky
T3.3−P9: UAV-Based Mobile Gamma Spectrometry R. Kaiser, I. Darby, M. Matos, M. Bogovac
T3.4 GEOPHYSICALMETHODSAPPLIEDTOON-SITEINSPECTION
Oral Presentations
T3.4−O1: Accurate and Efficient Viscoelastic Finite-difference Modelling for Analysis of Seismic Wavefields Applied to On-Site Inspection
P. Moczo, J. Kristek, M. Kristekova
T3.4−O2: Exciting Cavities: Understanding the Seismic Wave Propagation Inside and Around an Underground Cavity
S. Esterhazy, F.M. Schneider, I. Perugia, G. Bokelmann

APPENDIX 1 — ORAL AND POSTER PRESENTATIONS 127
T3.4−O3: New Insights into the Dead Sea Transform Fault Seismicity Gained from the IFE2014 Seismological Recordings
M. Kriegerowski, N. Gestermann, L. Passarelli, A. Mohsen, T. Dahm, M. Weber
Poster Presentations
T3.4−P3: Application of the On-site Inspection Geophysical Techniques for the Detection and Identification of Subsurface Features
P. Labak, G. Malich, C. Cuenca-Garcia
T3.4−P4: Dynamic Characteristics of Soil Using Geophysical Techniques in Atbara Area, Sudan K. Yassin, A.H. Gad Elmula, A.E. Amin, I. Babiker
T3.4−P5: Experimental S-wave Data Acquisition and Processing Above a Tunnel É.Á. Bujdosó, T. Gúthy, E. Takács, R. Csabafi, G. Szöts, A.C. Kovács, E. Hegedüs
T3.4−P6: Investigation of a Remediated Sink Hole with S-Wave Seismic and Geoelectric Methods D.E. Polgár, M. Bauer, É.Á. Bujdosó, R. Csabafi, A.C. Kovács, Z. Plank, G. Szöts, E. Hegedüs
T3.4−P7: Near Surface Geophysical Observations on the Great Cavern, Felsöpetény Testing Area, near Budapest, Hungary
E.A.M. Issawy, E. Hegedüs
T3.4−P8: Resonance Seismometry: A Toolbox for OSI F.M. Schneider, S. Esterhazy, E. Qorbani, I. Perugia, G. Bokelmann
T3.4−P9: SAMS Software Functionality Enhancement M. Walter, R. Häfner, M. Joswig
T3.4−P10: Seismological Investigations of the National Data Centre Preparedness Exercise 2015 (NPE2015) N. Gestermann, G. Hartmann, J.O. Ross
T3.4−P11: The Guide for Tunnels and Voids Detection Using High Resolution Microgravity E.A.M. Issawy
T3.4−P12: Use of Data from Seismic Measurements in the Kylylahti Region, Finland, in 2016 for Further Development of Geophysical Seismic Techniques for CTBT On-Site Inspections
P. Labak, P. Lindblom, G. Malich
T3.5 DATAPROCESSINGANDINTERPRETATION
Oral Presentations
T3.5−O1: An Approach to Radionuclide Time Series Reconstruction Based on Autoregressive Analysis G. Benito Diaz, J. Blázquez, J.C. Sáez, J. Quiñones
T3.5−O2: Beryllium and Xenon Time Series Analysis: A New Methodological Approach for Atmospheric Transport Modelling at Small, Synoptic and Global Scales
W. Plastino, S. Bianchi, A. Longo
T3.5−O3: Initial Evaluations of Signal-Based Bayesian Seismic Monitoring (SIGVISA) D. Moore, M. Stephen, M. Kevin, R. Stuart
T3.5−O4: Integrating OSI Data into an Interactive 3D Environment to Aid Inspection Activities J. Palmer, J. Stevanovic
T3.5−O5: New Metrics Developed for Our Complex Cepstrum Depth Program I. Tibuleac, J. Pascual-Amadeo, R. Kemerait, J. Hertzog, M. Thursby

128 SCIENTIFIC ADVANCES IN CTBT MONITORING AND VERIFICATION 2017
T3.5−O6: Optimizing the Chances for Detecting Nuclear Test Signatures of Prompt and Early Releases Using Radioxenon Isotopic Ratios
E. Gordon, M. Kalinowski, H. Gheddou, J. Kusmierczyk-Michulec, B. Liu, M. Schoeppner
T3.5−O7: Seismic Event Bulletin Construction for a Global Sparse Network Using Waveform Correlation S. Ballard, A. Gonzales, A. Encarnacao, C.J. Young, R. Tibi, R. Brogan
T3.5−O8: Sentry: A Proposed Platform for Analysis of International Monitoring System Radionuclide Data Sets J.J. McIntyre, T. Suckow, M. Keillor, N. Mileson, T. Stavenger
T3.5−O9: Strategies for Coping with Large Aftershock Sequences T. Kværna, S.J. Gibbons
T3.5−O10: The Selection and Preparation of Waveform Templates for Cross-Correlation Detection of Seismic Events
S. Sergeev, I. Kitov, K. Sergeev
T3.5−O11: Toward a Joint Array and Polarization Processing from IMS 3-Component Stations and Arrays: Seismic Wavefield Polarization and Its Spatial Coherency
C. Labonne, O. Sèbe, S. Gaffet, F. Schindele
Poster Presentations
T3.5−P1: Addressing the Challenges of Displaying Geotechnical Information in 3D Environments J. Palmer, J. Stevanovic
T3.5−P2: Advancing the Practice of Seismology in Iraq H. Ghalib, G. Aleqabi, F. Khudhur, B. Ali, A. Tawfiq, B. Salih
T3.5−P6: Comparison of Analysis Methods to Identify Radioxenon Isotopes C. Sivels, A. Prinke, J.J. McIntyre, S. Clarke, S. Pozzi
T3.5−P7: Comprehensive Seismic Monitoring: Developments at the USGS National Earthquake Information Center
H. Benz, J. Patton, P. Earle, G. Hayes, W. Yeck, M. Guy, E. Bergman, C.E. Johnson
T3.5−P8: Contrasting 3D Visualization of Different OSI Data Types with More Standard 2D Representation J. Stevanovic, J. Palmer
T3.5−P9: Correlation Detection of Uncertain Seismic Signals D. Harris
T3.5−P10: Data Analysing for Supporting the CTBTO’s Treaty by the National Data Center Suriname M.F. Amierali
T3.5−P11: Deploying ENIAB in Cloud Platform L. Kolesnykov, O. Liashchuk, R. Synytsky
T3.5−P12: Detection Capability of the IMS Seismic Network in 2013 P.J. Gaebler, L. Ceranna
T3.5−P13: Developments at the UK National Data Centre for Radionuclide Analysis M. Goodwin
T3.5−P14: Digital Revolution in Gamma Acquisition Systems: Costs and Benefits O. Delaune, A. Cagniant, G. Douysset, P. Gross, G. Le Petit
T3.5−P15: Distributed Seismic Event Detection Analytics at the Edge C.E. Johnson, K. Aikin, H. Benz

APPENDIX 1 — ORAL AND POSTER PRESENTATIONS 129
T3.5−P16: Evaluating West Eurasian Clusters of Infrasound Arrivals in Analyst-Reviewed Bulletins of the International Data Centre
A. Nippress, D. Green
T3.5−P17: Expert Technical Analysis Improvements at the International Data Center, CTBTO J. Stachnik, B. Baker, M. Rozhkov, M. Hagerty, P. Friberg
T3.5−P19: Finding Aftershocks with Waveform Cross-Correlation I. Kitov, D. Bobrov, M. Rozhkov
T3.5−P20: Hypercomplex and High-Order Master Event Design for CTBT Monitoring M. Rozhkov, I. Kitov
T3.5−P21: IDC Re-Engineering Phase 2: Analysis Interface Improvements D. Brown, J.F. Burns, D. Carr, J. Coram, J.M. Harris, R. Le Bras, P. Mialle, E. Peiszer, E. Tomuta,
C.J. Young
T3.5−P22: IDC Re-Engineering Phase 2: Software Architecture and Data Model H. Breitenfellner, D. Brown, J.F. Burns, B.R. Hamlet, J.M. Harris, R. Le Bras, P. Mialle, E. Peiszer,
R. Prescott, E. Tomuta, C.J. Young
T3.5−P23: Identification of Explosions and Earthquakes Using Infrasound and Seismic Data L. Kolesnykov, O. Liashchuk
T3.5−P24: Importancy of Noise Level at CTBTO Facilities M.E. Erkan
T3.5−P25: Improving Geophysical Data Processing and Research With Multi-Cloud Environments R. Synytsky
T3.5−P26: Introduction of the Results of a New Automatic Association System for Waveform Data Analysis N. Kushida, F. Kebede, P. Feitio, R. Le Bras
T3.5−P29: Monitoring of Tropical Cyclones Using Seismic and Infrasonic Stations Surrounding the South-Western Indian Ocean
J.B. Andrianaivoarisoa, G. Barruol, A. LePichon, G. Rambolamanana
T3.5−P30: Negative Evidence: The Non-Use of Non-Detections in IDC Seismic Data Processing R.G. Pearce, I. Kitov
T3.5−P31: Observing the Variability of Earth’s Microseisms Through Signal Coherency Analysis A. Gerner, W. Lenhardt, B. Grasemann
T3.5−P32: On the Usability of Event Zero Time Determinations Using Xenon Isotopic Activity Ratios Given the Real Atmospheric Background Observations
K. Yamba, M. Kalinowski, O. Sanogo, J. Koulidiati
T3.5−P33: Optimizing Atmospheric Monitoring Networks Using Bayesian Methods and Genetic Algorithms for Multiple Objectives
L. Glascoe, D. Lucas
T3.5−P34: Real Time Monitoring Data Application and Simulation Researches for Earthquake and Tsunami Disaster Mitigation
Y. Kaneda, N. Takahashi, T. Hori
T3.5−P35: Relocation of Seismicity in Northern East of Egypt: Contribution of Different Regional Seismic Networks
A. Faried, O. Novotný

130 SCIENTIFIC ADVANCES IN CTBT MONITORING AND VERIFICATION 2017
T3.5−P37: Seismic Monitoring Evolution and Extensive Seismicity of Egypt E.A.M. Fergany
T3.5−P39: Seismic Monitoring Using Arrays in the Middle East R. Gok, M.L. Pyle, I. El-Hussain, A. Al-Amri, D.B. Harris, D.A. Dodge
T3.5−P42: Static Corrections to Improve Detection, Location and Measurement of Seismic Discriminants at IMS Arrays
N. Wilkins, J. Wookey, N. Selby
T3.5−P43: Surface Reflection Arrivals from Shallow Small Magnitude Explosions Using the Cepstrum Technique: A Numerical Analysis
C. Saikia, I. Tibuleac, M. Woods, J. Dwyer, R. Kemerait
T3.5−P44: The Benefit of Using Higher Sampled Regional Seismic Data for Determining Cepstral Depths of Shallow Events
R. Kemerait, I. Tibuleac
T3.5−P45: The Correction of Coincidence Summing Effect in Filter Sample Measurement with HPGe Spectrometer Y. Fan
T3.5−P46: The IDC Re-Engineering Project, Phase 2 H. Breitenfellner, D. Brown, J.F. Burns, D. Carr, J. Coram, B.R. Hamlet, J.M. Harris, R. Le Bras, P. Mialle,
E. Peiszer, R. Prescott, E. Tomuta, C.J. Young
T3.5−P47: The IMS Seismic Network Used to Support and Mitigate Volcanic Risk with One Single Station Method
A.J. Gutierrez Jimenez
T3.5−P48: Theoretical and Experimental Analyses of Infrasound-Electromagnetic Data Fusion E. Lipshtat, J. Ashkenazy, M. Kushnir
T3.5−P49: Time Series Classification Using Covariance Descriptors O. Winsala, A. Peter, D. Clauter
T3.5−P50: Time Series Reconstruction as a Preventive Maintenance Tool for the Radionuclide IMS Data G. Benito Diaz, J. Blázquez, J.C. Sáez, J. Quiñones
T3.5−P51: Towards a New Paradigm for the Interactive Analysis of Waveform Data R.G. Pearce, T. Edwald
T3.5−P52: US Navy’s “Full Ship Shock Trials” as Opportunities for USGS and CTBTO Seismic System Evaluation and Calibration
R. Jih, R. Wagner
T3.5−P53: Update of the Evaluated Radioxenon Nuclear Decay Data M. Galan, M. Kalinowski
T3.5−P54: Using Reflection Green’s Functions Extracted from Ambient Seismic Noise and Signal for IMS Seismic Station Site Crustal Reflector Characterization
I. Tibuleac, C. Saikia, M. Woods, J. Dwyer, D. Clauter, R. Kemerait, C. Zeiler
T3.5−P55: Velocity Model of Seymareh Region: Southwest of Iran Using Local Seismic Network Data N. Najafipour, A. Masihi, H. Rahimi
T3.5−P56: Wind Seismic Noise Introduced by External Infrastructure: Field Data and Transfer Mechanism P. Martysevich, Y. Starovoyt
T3.5−P57: Model of Xe Radionuclides Measurements on Noble Gas System with a Long Cycle of Sampling A. Kamentsev, Y. Dubasov, V. Dushin

APPENDIX 1 — ORAL AND POSTER PRESENTATIONS 131
T3.6 FUSIONOFDATAFROMDIFFERENTMONITORINGTECHNOLOGIES
Oral Presentations
T3.6−O1: Atmospheric Transport Modelling and Radionuclide Analysis for the NPE 2015 Scenario J.O. Ross, A. Bollhöfer, V. Heidmann, R. Krais, C. Schlosser, N. Gestermann, L. Ceranna
T3.6−O2: Investigating Options to Visualize the Technical Data Generated During an OSI J. Stevanovic, J. Palmer
Poster Presentations
T3.6−P1: CTBTO Generation of Synthetic Radionuclide Spectra to Support the NDC Preparedness Exercise NPE15
H. Gheddou, M. Kalinowski, B. Liu, R. Plenteda
T3.6−P3: Infrasound Detection of Earthquakes in Chile U.O. Madu, A. Bisallah, R.A. Annan
T3.6−P4: Integration Geophysical Network OVSICORI and Seismic Stations of IMS Network CTBTO H. Villalobos Villalobos, R. Quintero Quintero
T3.7 ALGORITHMS
Oral Presentations
T3.7−O1: Enhancements to the CTBTO IDC Radionuclide Processing Pipeline for Particulate Samples Achieving Significant Improvement of Automatic Products
H. Gheddou, M. Kalinowski, E. Tomuta
T3.7−O2: Lg-Wave Cross Correlation Applied to Detection and Location of Events in High-Seismicity Regions of Mainland East Asia
D.P. Schaff, M. Slinkard, A. Sundermier, S. Heck, P.G. Richards, C.J. Young
Poster Presentations
T3.7−P1: Method To Improve Relative Earthquake Locations Using Surface Waves M. Howe, G. Ekström
T3.7−P3: Application of Diffusion Maps for Seismic Event Characterization in Israel Y. Bregman, N. Rabin, O. Lindenbaum, Y. Ben Horin, A. Averbuch
T3.7−P4: Automated Techniques for Waveform Correlation Applied to Regional Monitoring of Eastern Asia A. Sundermier, M. Slinkard, J. Perry, D.P. Schaff, C.J. Young, P.G. Richards
T3.7−P5: Automatic Classification of Seismic P and S Wave Signals Using Multiple Parameters, Frequency Ranges and Artificial Neural Network
T. Tiira
T3.7−P6: Automatic Identification of Repeated Industrial Seismicity in the Reviewed Event Bulletin I. Kitov, D. Bobrov, M. Rozhkov, M. Yedlin
T3.7−P7: Compressive Sensing and Sparsity Based Method for Time-Frequency Distribution Optimization V. Sucic, I. Volaric, G. Bokelmann, R. Le Bras
T3.7−P9: Enhancement of Cepstral Methods for the Improved Processing of Seismic Data R. Kemerait, I. Tibuleac, M. Thursby

132 SCIENTIFIC ADVANCES IN CTBT MONITORING AND VERIFICATION 2017
T3.7−P10: Non-Linear Kernel Methods for Seismic Event Characterization N. Rabin, Y. Bregman, O. Lindenbaum, Y. Ben Horin, A. Averbuch
T3.7−P11: Peak Search and Fitting Techniques for Analysis of the Radioxenon Beta-Gamma Coincidence Spectra B. Liu, H. Gheddou, M. Kalinowski
T3.7−P12: The Use of Waveform Cross-Correlation for Detection, Relative Location and Magnitude Estimation of Repeated Mining Blasts: The Jordan Phosphate Mine Eshidiya
Y. Ben Horin, D. Bobrov, I. Kitov, M. Rozhkov, M. Yedlin
THEME 4: PERFORMANCE OPTIMIZATION AND SYSTEMS ENGINEERING
T4.1 PERFORMANCEOPTIMIZATIONANDSYSTEMSENGINEERING
Oral Presentations
T4.1−O1: Different Approach to Data Availability: It’s More Than Just a Performance Metric! S. Poindexter, D. Kallus, R. Martin
T4.1−O2: Assessing the Consistency, Quality and Completeness of the Reviewed Event Bulletin with Waveform Cross Correlation
I. Kitov, M. Rozhkov
T4.1−O3: Cost Reduction in Operation and Maintenance of IMS Stations (IS32 and PS24) J.O. Akech
T4.1−O4: Creating a ‘Digital Twin’ for Use in System Design and Support J. Sharp
T4.1−O5: Near Real Time Data Dissemination and Warehousing Protocol S.M.A. Shah
T4.1−O6: Quality Assurance of Ground Motion Data Using the IRIS MUSTANG Analytics System T. Ahern, R. Casey, J. Callahan, G. Sharer, L. Keyson, M. Templeton
T4.1−O7: The Waveform Data Processing System Establishment Based on the Private Cloud Platform X. Wang, J. Li, J. Shang, W. Tang, Z. Liu, J. Liu, B. Zhang, H. Qiu, G. Zhu, J. Wang, Y. Wang, C. Zu
Poster Presentations
T4.1−P1: Advances in State of Health Analysis for International Monitoring Systems R. Suarez, J. Hayes, I. Cameron, T. Heimbigner, C. Hubbard, D. Keller
T4.1−P2: Assessment of the Quality of the Interactive Analysis and Reviewed Event Bulletin During the September 2016 Experiment
J. Vila Codina, F.K. Alamneh, E.D. Ndubi, G. Graham
T4.1−P3: Business Intelligence Software as a Self-Service Data Analysis Platform for the CTBTO T. Edwald, R. Le Bras, Y. Kotselko, E. Tomuta
T4.1−P6: Constraints from Transport Times and Minimum Detectable Activity on the Analysis of Low-Activity Samples at CTBT Radionuclide Laboratories
E. Buhmann, M. Kalinowski, E. Nava, H. Gheddou
T4.1−P7: Contribution of RN-52 Generated Data in the Establishment of Radioactivity Data Base in the Philippines
F. dela Cruz, L.J.H. Palad, A. Bulos

APPENDIX 1 — ORAL AND POSTER PRESENTATIONS 133
T4.1−P10: Free Space Optics (FSO) Systems as Alternative Back-Up Links for NDCs and IMS Stations C.A.B. Dath, M. Mbaye, A. Niane, N.A.B. Faye
T4.1−P11: Identification and Evaluation of Resource Constraints: Optimization of AFTAC’s Configuration Management Process
S. Poindexter, R. Martin
T4.1−P12: Improving Detection Quality of Primary IMS Seismic Stations A. Brouwer, I. Kitov
T4.1−P13: IMS Reporting System and Incident Management in Operations Centre K. Aktas, T. Edwald, G. Garcia, T. Dorde
T4.1−P14: Life Cycle Modelling Data Required to Sustain the International Monitoring System P. Benicsak, D. Foster
T4.1−P15: Monitoring Indications of High-Purity Germanium Detector Failure A. Wiens, G. Beziat, W. Hamani, C. Johannsen, N. Mascarenhas
T4.1−P17: Quality Assessment of Meteorological Data from CTBTO/IMS Radionuclide Stations P. Seibert, C. Jank, A. Philipp
T4.1−P18: RASA Detector Calibrations: Field Automation and Potential for Factory Calibrations to Replace Field Calibrations
E. Tillistrand, D. Bustillo, B. Hosticka, H. Rada, M. Wright
T4.1−P19: Selected Research Activities of Turkish NDC O. Necmioglu, K. Semin, M.U. Teoman, S. Altuncu Poyraz, S. Kocak, C.T. Destici
T4.1−P20: Sharing Local Seismic Network Data to Complete Instrumental Gaps of CTBTO Global Network V. Gholami
T4.1−P21: The Radionuclide Network Quality Control Programme E. Nava, K. Elmgren, D. Han, M.H. Lee, S. Mickevicius
T4.1−P22: The WNRS of IS48TN Infrasound Station: Problems and Solutions N. Friha
T4.1−P23: Thermal Insulation System and Automatic Heating of Air Sampler “SNOW WHITE” for IMS Radionuclide Station (for example Station RN61 (Dubna)).
I. Rulev
T4.1−P24: Times for IMS Waveform Data Requested/Queried from the CTBT Secure Web Portal (SWP) Different from the Time Specified in the Query/Request
J. Mulwa
T4.1−P25: uniDDS: A Unified Data Distribution Approach for the International Monitoring System S. Laban, A. Sudakov, T. Edwald, G. Kuzmenko
T4.1−P26: Importance of Local Network in Processing Discrimination of Sources S. Souayeh
134 SCIENTIFIC ADVANCES IN CTBT MONITORING AND VERIFICATION 2017
THEME 5: MONITORING FOR NUCLEAR EXPLOSIONS IN A GLOBAL CONTEXT
T5.1 SCIENCEINSUPPORTOFGLOBALPOLICYDECISIONS
Oral Presentations
T5.1−O1: Bringing Scientific Insights into Disarmament Policy: Science Advice at the Organisation for the Prohibition of Chemical Weapons
J. Forman
T5.1−O2: Comparative Roles of Global Verification and On-Site Verification N. de Silva
Poster Presentations
T5.1−P1: Government Policies and Global Strategic Governance for Planetary Sustainability, Control of Nuclear Energy and the Elimination of Nuclear Tests
E.A. Saenz, J.E. Sánchez Cano
T5.1−P2: Impacts of Nuclear Energy and the Lack of Strategic Governance for the Elimination of the Explosions and the Decrease of Collateral Risks
J.E. Sanchez Cano, E.A. Saenz S.
T5.1−P3: Potential Contributions of CTBTO to the Full Implementation and Complement of the Pelindaba Treaty
C.A.B. Dath, M. Mbaye, A. Niane, N.A.B. Faye
T5.1−P5: Science in Support of International Treaties and Sustainable Development Goals N. de Silva
T5.4 CAPACITYBUILDING,EDUCATIONANDPUBLICAWARENESS
Oral Presentations
T5.4−O1: A Novel Framework for Expanding NDC Capacity Building M. Moutinho Silva, U.H. Mitterbauer, N.P. Titus
T5.4−O2: ARN’s Experience in Operating and Maintaining RN01 and RN03 Towards the Installation of RN02 N. Ferro, A. Pantín
T5.4−O3: Creating Synergy Between IMS Data and Local Data: Verification, Detection Threshold and Local Applications
T.B. Larsen, P.H. Voss, T. Dahl-Jensen
T5.4−O4: Developing a Massive Online Open Course on Nuclear Weapons and Arms Control A. Sens, M. Yedlin
T5.4−O5: Regional Seismic Travel Time Evaluation, Training and Outreach S. Myers, M. Begnaud, S. Ballard, A.C. Aguiar Moya, I. Bondar, R. Le Bras
T5.4−O6: The CTBT and the Ban Treaty E. Ifft
T5.4−O7: Trends in Ground-Based Nuclear Explosion Monitoring Research and Development M. Maceira, D. Anderson, S. Arrowsmith, M. Begnaud, P. Blom, L. Casey, G. Euler, S. Ford, M. Foxe,
J. MacCarthy, O. Marcillo, J. Merchant, S. Myers, G. Orris, M. Pasyanos, W.S. Phillips, M. Slinkard, R. Whitaker, X.D. Yang

APPENDIX 1 — ORAL AND POSTER PRESENTATIONS 135
Poster Presentations
T5.4−P2: CTBTO Semester-Long Simulation Course in International Relations Curriculum as a Method of Developing the Students’ Professional Skills
E. Mikhaylenko, K. Muratshina
T5.4−P3: Advancement of CTBT Academic Curricula in South-South Nigeria U.A. Kadiri, D. Osahon, J. Nnambo
T5.4−P4: Back to Basics: Building the Next Generation of Indian Nuclear Experts R. Neog
T5.4−P5: Challenges and Advances in Implementation of CTBTO Facilities and Supports in Senegal C.A.B. Dath, M. Mbaye, A. Niane, N.A.B. Faye
T5.4−P6: Cooperation Between Cameroon, CTBTO and Other Parties: Capacity Building, Education and Public Awareness
D.S. Nadine Yolande, B. Tjombe
T5.4−P7: CTBT Educational Materials as a Tool for Sensitization and Internal Training E.O. Amartey, R.A. Annan, E.T. Mensah
T5.4−P9: Diversified Education on CTBT in Beijing Language and Culture University H. Liu
T5.4−P10: Expanding the Use of the CTBT Educational Resources Among the Academics in West Africa A. Bisallah, U.O. Madu
T5.4−P11: FSUE VNIIA Activities Related to CTBT Technologies G. Zasimov, Y. Kraev, M. Chernov
T5.4−P12: IMS Network in Papua New Guinea and the Utilization for the Benefits of the Local and Regional Monitoring Systems
N. Kentuo, C. McKee, M. Moihoi
T5.4−P15: Jordan Seismological Observatory and IMS W.T. Mesaad, W. Olimat
T5.4−P16: Malawi Seismicity and Seismic Network from 1900–2016 F.C.D. Mphepo
T5.4−P17: Mongolian National Data Centre B. Jargalsaikhan
T5.4−P19: NDC Training 2.0: From Training Analysts to Training NDCs A. Agrebi, R. Al-Dulaimi, N. Perfilyev, M. Villagran-Herrera, W. Allan, A. Poplavskiy
T5.4−P20: Nuclear Pacific: An International Public Inquiry on French Nuclear Weapons Testing in French Polynesia
N. Ahmed
T5.4−P21: Potential Benefits of CTBTO to Iraq R.H.M. Al-Abboodi
T5.4−P22: Public Awareness and Capacity Building A. Ouedraogo
T5.4−P23: Public Awareness Creation of National Data Centres in Africa H.M.M. Muturi

136 SCIENTIFIC ADVANCES IN CTBT MONITORING AND VERIFICATION 2017
T5.4−P24: Relevance of the Capacity Building System (CBS) in Zambia’s NDC G. Chafwa
T5.4−P26: Seismic Monitoring and its Analysis in Kyrgyzstan E. Pershina, A. Berezina
T5.4−P27: The CTBT as a Useful Tool for Myanmar’s Students in Nuclear Age T.Z. Win
T5.4−P29: The IS35 and AS067 IMS Infrasound and Auxilliary Seismic Station in Tsumeb, Namibia E. Shiweda, F. Diergaardt, N.P. Titus
T5.4−P30: The Role of Small States in Monitoring Nuclear Explosions: The Case of Kazakhstan D. Aben
T5.4−P31: The Significance of National Data Centres Established in West Africa P.E. Amponsah, P. Akor
T5.4−P32: The Status of the CTBTO Link to the ISC Database D. Storchak, K. Lentas, J. Harris
T5.4−P34: Enhancing Public Awareness of the CTBTO/CTBT Among Youth B. McCarter, V. Ruskova, V. Tjokro, J. Bustamante
ESSAYS SUBMITTED BY MEMBERS OF THE CTBTO YOUTH GROUP
E−1: Catalysts of Raising Public Awareness about CTBT S. Kuramitsu
E−2: Current and New Strategies of Youth Outreach Z. Bai
E−3: IMS Monitoring Stations as an Interim Step to Ratifying the CTBT in the Middle East and Southern Asia
S. Bidgood, S. Mishra
E−4: Marshalling Methods: Using Art and Science to Explore the Nuclear Legacy of the Marshall Islands A. Bordne
E−5: New Angle for Promoting Nuclear Test Ban A. Shavrova
E−6: Representation of the CTBTO at the Country’s National Parliament S. Sharma
E−7: Role of Scientific Community in Promoting the CTBT S.C. Sazak
E−8: Tackling the Status Quo K. El-Baz
E−9: Tapping into the Power: Public Awareness of the CTBT Through Grassroots Coalition Building B. Gautam
E−10: The CTBT as a Confidence Building Tool in South Asia D. Kumari
E−11: Increasing Knowledge Sharing Between Young Scientists and Policy Makers S. Taheran, A. Sanders-Zakre
APPENDIX 2 — PANEL DISCUSSIONS 137
Appendix 2Panel Discussions
HIGH LEVEL OPENING PANEL DISCUSSION: SEIZING OPPORTUNITIES AND OVERCOMING CHALLENGES: THE CTBT’S RELEVANCE IN A DYNAMIC GLOBAL CONTEXT MODERATOR: Sanam Shantyaei, France 24 PANELLISTS: José Luis Cancela, Undersecretary of Foreign Affairs, Uruguay Grigory Berdennikov, Ambassador at Large, Russian Federation Shorna-Kay Richards, Director, Bilateral Relations Department, Ministry of Foreign Affairs and Foreign Trade, Jamaica William Potter, Sam Nunn and Richard Lugar Professor of Non-proliferation Studies, Monterey Institute of International Studies, USA
MOBILE DEVICES AS GEOPHYSICAL SENSORS: PROMISING PATHS AND BLIND ALLEYS MODERATOR: Sofi Esterhazy PANELLISTS: Milton Garces, Stephen Myers, Paul Richards
THE INTERNATIONAL MONITORING SYSTEM: CHALLENGES FROM INSTALLATION THROUGH CERTIFICATION TO SUSTAINMENT OF THIS UNIQUE GLOBAL NETWORK MODERATOR: Nurcan Meral Özel PANELLISTS: Helena Berglund, Naima Friha, Michelle Grobbelaar, Zeinabou Mindaoudou Souley
GLOBAL VERIFICATION CAPABILITY: THE FIVE ANNOUNCED DPRK NUCLEAR TESTS MODERATOR:W. Randy Bell PANELLISTS: Steven Gibbons, Chiappini Massimo, Öcal Necmioglu, Anders Ringbom, Kim Won-Young
TRAINING, EDUCATION AND PUBLIC ADVOCACY FOR THE CTBT: THE ROLE OF ACADEMIA IN SECURING THE TREATY’S ENTRY INTO FORCE AND UNIVERSALIZATION MODERATOR: William Potter PANELLISTS: Duyeon Kim, Allen Sens, Sahil Shah, Jo-Ansie van Wyck, Matthew Yedlin
PROCESSING AND ANALYSIS OF SEISMIC AFTERSHOCK SEQUENCES: PROTECTING OPERATIONAL PERFORMANCE IN THE IDC MODERATOR: John (Jay) Zucca PANELLISTS: Ivan Kitov, Tormod Kværna, Paul Richards, Megan Slinkard
UNCERTAINTY MEASUREMENT IN ATMOSPHERIC TRANSPORT MODELLING AND ATMOSPHERIC DYNAMICS MODERATOR: Julien Marty PANELLISTS:Elisabeth Blanc, Jolanta Kusmierczyk-Michulec, Christian Maurer, Mark Rodwell, Petra Seibert
ADVANCING THE CTBT WITH SCIENCE DIPLOMACY: LEARNING FROM THE PAST TO ENABLE CONFIDENCE BUILDING ACROSS SCIENTIFIC COMMUNITIES MODERATOR: Grigory Berdennikov PANELLISTS:Anatoli Diakov, Jonathan Forman, William Potter
138 SCIENTIFIC ADVANCES IN CTBT MONITORING AND VERIFICATION 2017
UTILIZING MONITORING TECHNOLOGIES FOR GLOBAL DEVELOPMENT: EXPLORING POTENTIAL APPLICATIONS OF IMS DATA TO SUPPORT THE SUSTAINABLE DEVELOPMENT GOALS, THE PARIS CLIMATE AGREEMENT, AND DISASTER RISK REDUCTION MODERATOR: Patrick Grenard OPENING ADDRESS: José Fidel Santana Núñez, Deputy Minister of Science, Technology and Environment, Cuba PANELLISTS: Abel Adelakun Ayoko, Bruce Howe, Yoshiyuki Kaneda, Gérard Rambolamanana
CTBTO YOUTH GROUP PANEL DISCUSSION: NUCLEAR TESTING AND USE MODERATOR: Kyle Pilutti
CTBTO YOUTH GROUP PANEL DISCUSSION: THE CTBT AS A CONFIDENCE BUILDING MEASURE MODERATOR: Rizwan Asghar
CTBTO YOUTH GROUP PANEL DISCUSSION: ADVOCACY AND OUTREACH MODERATOR: Aditi Malhotra

APPENDIX 3 — EXHIBITION OF ACTIVITIES, ACHIEVEMENTS AND NEEDS 139
Appendix 3Exhibition of Activities, Achievements and Needs
The CTBTO Exhibition was distinct from the scientific posters, and was conceived in response to a request from the SnT2017 Scientific Programme Committee to address a perceived lack of focus on the verification needs of the CTBTO in previous SnT conferences. Selected activities and achievements were seen as an important context for the presentation of future scientific and technological needs under the CTBTO’s mission.
The exhibition was organized under the following sections, which broadly follow the structure of this report:
• General • Data Acquisition (including On-Site Inspection) • Data Transmission, Storage and Format • Data Processing and Synthesis • Earth Characterization • Interpretation • Capability, Performance and Sustainment • Sharing of Data and Knowledge
Much of the exhibition was presented as visual displays, but it also included equipment, videos and short presentations on particular exhibits. One exhibit was dedicated to OSI data acquisition, and another to the installation of the hydroacoustic stations of the IMS. A selected list of the exhibition posters follows.
GENERAL
• Waveform Analysis at the International Data Centre: 1 January 2000 to 31 December 2016 • Radionuclide Analysis at the International Data Centre: 1 January 2000 to 31 December 2016 • Trends in Waveform Data Processing and Analysis at the International Data Centre
DATA ACQUISITION
• Calibration of IMS Seismic and Hydroacoustic Stations using Standard Station Interface (SSI) Software • Status and Development of the Calibration Programme • Enhancements to the CTBTO IDC Radionuclide Processing Pipeline for Particulate Samples Achieving
Significant Improvement of Automatic Products • IMS Meteorological Data, Current Status and Improvement of Data Quality • Geophysical Techniques for CTBT On-Site Inspections • Application of Airborne Multispectral Remote Sensing for On-Site Inspection • CTBT On-Site Inspection in Different Environments • Protection of Sensitive Information Related to On-Site Inspections • Re-establishment of the IMS Hydroacoustic Station HA04, Crozet Islands, France (December 2016)

140 SCIENTIFIC ADVANCES IN CTBT MONITORING AND VERIFICATION 2017
DATA TRANSMISSION, STORAGE AND FORMAT
• Technology and the Treaty: Data Transmission and Data Storage
DATA PROCESSING AND SYNTHESIS
• On Similarities and Differences of Signals Measured by IMS Stations from Five DPRK Underground Tests • Seismic Arrays: Method and Applications • Infrasound Magnitude and Network Performance • Regional Seismic Travel Times (RSTT) – Error Estimates • The Complex Relationship Between Automatic Waveform Data Processing and Analyst Workload • Waveform Detection, Phase Identification, Association, Event Location and Characterization Techniques • Recent Enhancements in NDC in a Box • Infrasound in and Towards IDC Operations • The Impact of Event Definition Criteria in IDC Waveform Data Processing • ‘False Events’ and Their Role in the Logic of Automatic Processing
EARTH CHARACTERIZATION
• Towards Inclusion of Atmospheric Dynamic into Infrasound Processing • Convective Transport in ATM simulations • Influence of Precipitation on Be-7 Concentrations in Air • Web-Grape: Web-connected Graphics Engine
INTERPRETATION
• Towards a Volcanic Parameter System with Infrasound Data
CAPABILITY, PERFORMANCE AND SUSTAINMENT
• 2nd ATM Challenge from CTBTO Perspective: an Approach to Quantify Uncertainties in Forward and Backward Modelling
• New Developments in Quality Assurance/Quality Control for IMS Radionuclide Laboratories • Operation of the International Monitoring System • Station Information Management: Enhancing the Sustainment of the International Monitoring System • Failure Analysis of IMS Stations – November 2011 to November 2016
SHARING DATA AND KNOWLEDGE
• vDEC: Virtual Data Exploitation Centre • Use of IMS Data and IDC Products to Mitigate the Impact of Natural and Other Catastrophes

INDEX OF CONTRIBUTING AUTHORS AND PANEL DISCUSSION PARTICIPANTS 141
Index of Contributing Authors and Panel Discussion Participants
Only the first author (who may not be the presenter) of each cited contribution in included. For other authors, reference can be made to the Books of Abstracts and its index. Authorship follows that submitted with the abstract.
Abbott, R 33, 119Abdelazim Abdalla
Metwally, M120
Abdollahnejad, H 55, 113Aben, D 78, 82, 136Adi Martha, A 111, 112Agrebi, A 77, 82, 135Aguiar Moya, A 42, 50, 112Ahern, T 71, 106, 132Ahmed, N 82, 135Akech, J 73, 132Aktas, K 133Al-Abboodi, R 77, 82, 135Aldener, M 27, 53, 119Alessi, M 113Al-Qadeeri, G 30, 70, 114Al-Rashidi, M 116Al-Rawi, O 86Alvizuri, C 58, 60, 61, 64, 106, 120Amartey, E 52, 77, 82, 116, 135Amierali, M 77, 128Amponsah, P 76, 78, 82, 136Anderson, D 29, 36, 126Andrianaivoarisoa, J 129Ansari, A 23, 123Asghar, R 138Assink, J 46, 60, 64, 117Aviv, O 27, 34, 98, 118Ayoko, A 138Babayev, G 111Babiker, N 51, 52, 112Bai, Z 136Ballard, S 50, 102, 111, 128Baré, J 28, 62, 69, 121Begnaud, M 50, 102, 111Bell, R 137Belyashov, A 33, 119Ben Horin, Y 41, 132Benicsak, P 73, 133Benito Diaz, G 46, 127, 130Benz, H 43, 44, 78, 128Berdennikov, G 137Berezina, A 30, 78, 122Berglund, H 137Bidgood, S 136Bisallah, A 77, 78, 82, 116, 135Bittner, P 24, 30, 120Blanc, E 54, 109, 137Blanchard, X 29, 34, 124Bollhöfer, A 62, 68, 104, 120Bondar, I 43, 50, 111Bordner, A 70, 122Bowyer, T 26, 69, 113Bregman, Y 42, 63, 131Breitenfellner, H 40, 129, 130Britton, R 73, 106, 125Broome, S 53, 113Brouwer, A 23, 24, 30, 71, 99, 115, 133
Brown, D 40, 129Browne, D., Lord Browne
of Ladyton 17
Buhmann, E 32, 70, 132Bujdosó, É 33, 127Burk, D 32, 70, 71, 124Bustillo, D 26, 72, 123Caffrey, G 27, 34, 125Campus, P 44, 109Cancela, J 137Carranza, E 62, 69, 121Carrigan, C 34, 54, 119Carvalho, J 44, 111Cekada, G 30, 73, 115Chafwa, G 78, 136Chai, T 55, 113Czanik, C 24, 32, 110Dall’Osto, D 54, 114Dalnoki Veress, J 65, 125Dath, C 78, 83, 133, 134, 135Davies, A 124dela Cruz, F 31, 78, 132Delaune, O 28, 128Delcloo, A 114De Meutter, P 55, 102, 113De Negri, R 30, 61, 110de Silva, N 33, 82, 83, 108, 118, 134Diakov, A 137Dimova, L 52, 54, 115di Tada, M 27, 62, 121Dobrynina, A 50, 51, 60, 112, 120, 122Doll, C 77, 78, 122Douysset, G 32, 125Dovbysh, S 33, 60, 78, 118, 123Dubasov, Y 27, 34, 35, 69, 70, 99, 106,
119, 122, 125Edwald, T 73, 77, 108, 132Elbahrawy, M 68, 121El-Baz, K 136Erkan, M 32, 68, 129Esterhazy, S 33, 126, 137Evers, L 61, 68, 109Fang, L 43, 123Fan, Y 46, 130Faried, A 129Farrapo Albuquerque, D 50, 112Fergany, E 52, 78, 130Fernandez, G 42, 51, 52, 60, 112, 116Ferro, N 31, 73, 77, 97, 134Filistovic, V 54, 114Florido, P 27, 34Florido, P.C 123Forman, J 82, 83, 108, 134, 137Friese, J 34, 62, 68, 69, 72, 105, 119,
120Friha, N 24, 30, 71, 133, 137Fritioff, T 26, 72, 125Gadirov, F 29, 112

142 SCIENTIFIC ADVANCES IN CTBT MONITORING AND VERIFICATION 2017
Gaebler, P 70, 128Galan, M 78, 130Garces, M 61, 78, 107, 115, 137Garrison, J 29, 65, 125Gautam, B 136Generoso, S 69, 105, 121Gerner, A 129Gestermann, N 73, 127Ghalib, H 77, 128Gheddou, H 46, 47, 55, 62, 68, 69, 70, 100,
118, 121, 122, 131Ghica, D 110, 118Gholami, V 23, 42, 78, 101, 111, 124Gibbons, S 42, 54, 110, 117, 137Glascoe, L 55, 70, 114, 129Godoladze, T 116Gok, R 32, 76, 130Golikova, E 68, 110Gomez Gomez, A 32, 77, 124Goodwin, M 46, 77, 128Gordon, E 61, 97, 128Green, D 60, 109Grenard, P 138Grobbelaar, M 137Gueibe, C 62, 69, 121Guilhem Trilla, A 63, 64, 117Guralp, C 23, 71, 105, 123Gutierrez Jimenez, A 30, 52, 130Habbak, E 124Haralabus, G 24, 30, 97, 115Harris, D 128Hartmann, G 28, 29, 36, 65, 104, 126Hayes, J 26, 34, 98, 124, 125Haynes, C 61, 109Heise, A 62, 69, 113Hertzog, J 78, 115Heyburn, R 46, 101, 120Hoffman, W 88Hong, R 26, 124Howe, B 29, 99, 114, 138Howe, M 131Ifft, E 83, 134Ilie, G 28, 124Iliev, I 29, 36, 126Issawy, E 127Jargalsaikhan, B 135Jih, R 71, 107, 130Jin, P 64, 103, 117Jo, E 43, 64, 117Johnson, C 44, 128Junek, W 72, 124Jung, A 36, 125Kadiri, U 50, 52, 78, 111, 135Kaiser, R 34, 98, 126Kalindekafe, L 51, 115Kalinowski, M 46, 61, 62, 118, 121Kamentsev, A 46, 130Kanao, M 32, 44, 110Kaneda, Y 32, 52, 97, 102, 114, 129, 138Karasozen, E 42, 111Kebede, F 44, 109Kemerait, R 42, 130, 131Kentuo, N 32, 135Kettunen, M 34, 125Khairina, F 120Khodr, C 54, 110Kim, D 137Kim, S 43, 64, 117Kim, T 43, 60, 118Kim, W 137Kitov, I 40, 41, 42, 60, 71, 117, 129,
130, 131, 132, 137Köble, T 27, 34, 124Koch, K 30, 60, 110Kolesnykov, L 32, 46, 64, 78, 107, 118, 128,
129
Korkusuz Öztürk, Y 42, 51, 112Kouassi, K 30, 46, 110Kramer, A 24, 30, 68, 125Kreek, S 27, 33, 36, 119, 124, 125Kriegerowski, M 33, 52, 70, 127Kulichkov, S 54, 109Kumari, D 136Kuramitsu, S 136Kushida, N 40, 41, 129Kusmierczyk-Michulec, J 55, 56, 64, 113, 118, 137Kværna, T 40, 101, 128, 137Kysel, R 32, 77, 122Labak, P 127Laban, S 38, 133Labonne, C 42, 128Larsen, T 44, 70, 105, 134Lashaev, S 26, 27, 124Lee Zhi Yi, A 27, 28, 34, 119Le Petit, G 64, 65, 122Liashchuk, O 52, 60, 116, 118Lipshtat, E 29, 47, 65, 130Liu, B 46, 132Liu, H 78, 82, 135Livesay, R 28, 126Lowrey, J 53, 54, 61, 114, 119Maceira, M 76, 134Mackey, K 68, 123MacLeod, G 33, 119Madi, M 61, 116Madu, U 30, 44, 116, 131Malhotra, A 138Marimira, K 52, 116Marty, J 30, 109, 137Martysevich, P 23, 68, 130Massimo, C 137Matos, S 30, 61, 110Matoza, R 30, 61, 78, 103, 109Matsumoto, H 115Maurer, C 56, 101, 113, 137McCarter, B 82, 136McIntyre, J 46, 69, 119, 128Medinskaya, T 61, 110Mekhaimr, S 55, 102, 113Meral Özel, N 137Merchant, B 24, 26, 124Mesaad, W 30, 77, 135Metz, D 61, 68, 106, 114Mialle, P 44, 100, 109, 110Mikhailova, N 32, 52, 116Mikhaylenko, E 77, 82, 135Milbrath, B 36, 61, 103, 122Miley, H 70, 117Millet, C 46, 100, 109Mitterbauer, U 122Moczo, P 33, 44, 98, 126Moore, D 43, 127Moore, G 33, 99, 117Moutinho Silva, M 76, 82, 107, 134Mphepo, F 32, 52, 78, 135Mulwa, J 32, 52, 72, 116, 133Muturi, H 76, 82, 135Myers, S 71, 76, 107, 134, 137Nadalut, B 31, 124Nadine Yolande, D 77, 82, 135Najafipour, N 50, 130Nava, E 31, 70, 72, 133Necmioglu, O 32, 77, 133, 137Neog, R 78, 135Nippress, A 44, 45, 61, 129Ntibinyane, O 60, 116Nugraha, E 32, 70, 116Núñez, J 138Olimat, W 52, 112Olivier, S 24, 25, 99, 123Otsuka, R 23, 71, 125Ouattara, Y 50, 112
INDEX OF CONTRIBUTING AUTHORS AND PANEL DISCUSSION PARTICIPANTS 143
Ouedraogo, A 76, 82, 135Pakhomov, S 27, 34, 35, 98, 125Palmer, J 33, 127, 128Park, J 44, 117Park, K 61, 113Pearce, R 44, 129, 130Pereira Teixeira, M 11Pershina, E 78, 136Peters, H 30, 117Phillips, W 42, 51, 111Pilger, C 32, 61, 78, 110Pili, E 53, 61, 102, 113, 118Pilutti, K 138Pitois, A 36, 119Plastino, W 46, 69, 127Plenteda, R 26, 124Poindexter, S 72, 73, 77, 106, 132, 133Polgár, D 29, 33, 127Potter, W 137Preston, L 58, 110Purtschert, R 55, 62, 69, 103, 113Puzas, A 70, 118Qorban, E 111Quintana, E 62, 69, 121Rabin, N 42, 63, 132Radzyner, Y 42, 111Rambolamanana, G 138Ratiu, O 24, 123Rezaei, R 52, 60, 120Richards, P 137Richards, S 137Ringbom, A 26, 72, 98, 121, 123, 125, 137Rizzo, A 34, 53, 119Robertson, J 24, 124Rocchi, F 61, 122Rodwell, M 55, 109, 137Rogers, T 61, 104, 115Rohadi, S 52, 60, 64, 65, 116, 126Rosianna, I 53, 125Ross, J 46, 55, 56, 62, 64, 73, 105,
118, 121, 131Rowe, C 32, 112Rowlands, A 28, 33, 36, 126Rozhkov, M 41, 129Rulev, I 26, 31, 133Rutkowski, J 28, 36, 126Rybin, I 110Saceanu, C 24, 30, 99, 115Saenz, E 82, 134Safarov, R 51, 111Sagen, H 54, 102, 114Saikia, C 42, 58, 60, 64, 104, 120, 130Salvi, S 27, 34, 126Sanchez Cano, J 82, 134Sanogo, O 70, 114Saull, P 27, 34, 98, 123Sazak, S 136Scarinci, I 27, 69, 121Schaff, D 41, 42, 131Schneider, F 33, 127Schoeppner, M 55, 68, 72, 114Schulze, J. 85Seibert, P 31, 56, 72, 114, 133, 137Semin, K 51, 111Sens, A 77, 82, 134, 137Sergeev, S 41, 128Seywerd, H 126Shah, S 28, 38, 44, 52, 62, 70, 116,
121, 124, 132, 137Shanker, D 52, 60, 115Shantyaei, S 137Sharma, S 136Sharp, J 73, 132Shavrova, A 136Shiweda, E 136Simmons, N 50, 102, 112
Sivels, C 46, 72, 128Sjoden, G 27, 123Skomorowski, P 55, 113Slinkard, M 137Smirnov, A 46, 78, 101, 120Sokolova, I 32, 50, 52, 60, 104, 112, 120,
122Souayeh, S 52, 133Souley, Z 137Stachnik, J 65, 129Starovoyt, Y 26, 73, 124Steedman, D 58, 120Stevanovic, J 33, 36, 100, 128, 131Storchak, D 78, 136Stroujkova, A 64, 119Suarez Mullins, A 55, 113Suarez, R 73, 105, 132Subbotin, S 53, 61, 103, 122Sucic, V 40, 131Suh, K 55, 113Sumaya bint El Hassan,
HRH Princess 9
Sundermier, A 41, 131Supriyanto Rohadi, S 60, 117Suprunov, V 33, 122Sussman, A 33, 98, 126Syirojudin, M 29, 52, 112Synytsky, R 78, 107, 129Szalay, K 28, 72, 123Taheran, S 136Tahir, M 51, 60, 112Tcydypova, L 50, 111Terzi, L 55, 69, 70, 115, 122Tibuleac, I 42, 127, 130Tiira, T 131Tillistrand, E 26, 99, 133Topin, S 26, 27, 72, 98, 123Tóth, T 89Tsereteli, N 52, 115Tsuboi, S 42, 60, 104, 112Ultré-Guérard, P 13Ustselemov, A 34, 54, 118van Wyck, J 137Vargas, C 50, 111Vila Codina, J 71, 132Villalobos Villalobos, H 32, 131Walter, M 33, 44, 127Walter, W 58, 59, 118Wang, J 61, 68, 121Wang, X 78, 107, 132Watt, R 30, 70, 116Whitaker, R 44, 54, 110Wiens, A 27, 72, 133Wilkins, N 42, 130Winsala, O 63, 130Win, T 78, 82, 136Woodward, R 23, 34, 97, 123Yamba, K 46, 64, 69, 129Yassin, K 33, 127Yedlin, M 137Zampolli, M 24, 97, 115Zasimov, G 77, 135Zerbo, L 1, 90Zheng, Z 60, 117Ziolkowski, A 60, 64, 117Zucca, J 137

INDEX OF CITED CONTRIBUTIONS 145
Index of Cited Contributions
T1.1−O1 46, 96, 100, 109T1.1−O2 54, 109T1.1−O3 55, 109T1.1−O4 30, 109T1.1−O5 61, 68, 109T1.1−O6 61, 109T1.1−O7 54, 109T1.1−P1 44, 96, 100, 109T1.1−P2 44, 109T1.1−P4 60, 109T1.1−P5 30, 61, 78, 96, 103, 109T1.1−P6 44, 109T1.1−P7 32, 61, 110T1.1−P8 30, 60, 110T1.1−P9 44, 110T1.1−P10 61, 110T1.1−P11 54, 110T1.1−P12 44, 54, 110T1.1−P13 32, 44, 110T1.1−P14 110T1.1−P15 30, 46, 110T1.1−P16 30, 61, 110T1.1−P17 110T1.1−P18 110T1.1−P19 68, 110T1.1−P20 54, 110T1.1−P21 58, 110T1.1−P22 78, 79, 110T1.1−P23 24, 32, 110T1.1−P24 30, 61, 110T1.2−O1 50, 96, 102, 111T1.2−O2 50, 111T1.2−O3 43, 50, 111T1.2−O4 50, 111T1.2−O5 42, 51, 111T1.2−O6 50, 96, 102, 111T1.2−O7 51, 111T1.2−O8 44, 111T1.2−P1 111T1.2−P2 42, 111T1.2−P3 42, 111T1.2−P4 42, 96, 101, 111T1.2−P6 111T1.2−P7 111T1.2−P11 50, 52, 111T1.2−P12 51, 111T1.2−P13 50, 112
T1.2−P15 52, 112T1.2−P18 50, 96, 102, 112T1.2−P19 42, 60, 112T1.2−P20 112T1.2−P21 32, 112T1.2−P22 42, 50, 112T1.2−P23 29, 52, 112T1.2−P24 32, 50, 112T1.2−P26 52, 112T1.2−P27 50, 112T1.2−P28 51, 112T1.2−P29 51, 52, 112T1.2−P31 52, 112T1.2−P32 51, 60, 112T1.2−P33 42, 51, 112T1.2−P35 42, 60, 96, 104, 112T1.2−P36 29, 112T1.3−O1 56, 96, 101, 113T1.3−O2 55, 62, 69, 96, 103, 113T1.3−O3 62, 69, 113T1.3−O4 55, 113T1.3−O5 55, 96, 102, 113T1.3−O6 55, 113T1.3−O7 55, 96, 102, 113T1.3−O8 26, 69, 113T1.3−P3 55, 113T1.3−P4 113T1.3−P5 55, 113T1.3−P6 55, 113T1.3−P7 55, 113T1.3−P8 61, 113T1.3−P10 53, 113T1.3−P11 61, 113T1.3−P12 55, 114T1.3−P13 56, 114T1.3−P14 68, 114T1.3−P15 114T1.3−P16 70, 114T1.3−P18 54, 114T1.3−P19 55, 72, 114T1.3−P20 53, 61, 114T1.3−P21 30, 70, 114T1.4−O1 54, 96, 102, 114T1.4−O2 54, 114T1.4−O3 32, 96, 97, 114T1.4−O4 29, 96, 99, 114T1.4−O5 61, 68, 96, 106, 114
T1.4−O6 32, 52, 96, 102, 114T1.4−P1 115T1.4−P2 24, 30, 96, 97, 115T1.4−P3 24, 30, 96, 99, 115T1.4−P5 24, 30, 96, 99, 115T1.4−P6 24, 96, 97, 115T1.4−P7 30, 73, 115T1.4−P8 52, 54, 96, 115T1.5−O1 61, 96, 104, 115T1.5−O2 61, 78, 96, 107, 115T1.5−O3 52, 115T1.5−O4 52, 115T1.5−O5 78, 115T1.5−O6 55, 70, 115T1.5−P1 52, 60, 115T1.5−P2 51, 115T1.5−P3 52, 116T1.5−P4 60, 116T1.5−P5 44, 52, 116T1.5−P6 52, 116T1.5−P7 32, 116T1.5−P9 32, 70, 116T1.5−P11 116T1.5−P15 32, 52, 116T1.5−P16 32, 52, 116T1.5−P17 78, 116T1.5−P18 30, 116T1.5−P19 30, 70, 116T1.5−P20 116T1.5−P21 61, 116T1.5−P22 51, 52, 116T1.5−P23 52, 116T1.5−P24 52, 60, 116T2.1−O1 43, 64, 117T2.1−O2 44, 117T2.1−O3 63, 64, 117T2.1−O4 33, 96, 99, 117T2.1−O5 43, 64, 117T2.1−O6 60, 64, 117T2.1−O7 70, 117T2.1−O8 60, 117T2.1−O9 64, 96, 103, 117T2.1−O10 46, 60, 64, 117T2.1−O11 42, 117T2.1−P1 30, 117T2.1−P2 42, 60, 117T2.1−P3 41, 60, 117

146 SCIENTIFIC ADVANCES IN CTBT MONITORING AND VERIFICATION 2017
T2.1−P4 60, 64, 117T2.1−P5 55, 64, 118T2.1−P6 55, 56, 64, 118T2.1−P7 43, 60, 118T2.1−P9 60, 118T2.1−P10 58, 59, 118T2.1−P11 46, 118T2.1−P13 70, 118T2.1−P14 32, 118T2.1−P16 118T2.1−P17 70, 118T2.1−P18 60, 78, 118T2.2−O1 27, 34, 96, 98, 118T2.2−O2 53, 96, 102, 118T2.2−O3 33, 118T2.2−O4 34, 54, 118T2.2−O5 27, 36, 119T2.2−P1 27, 28, 34, 119T2.2−P2 36, 119T2.2−P3 34, 54, 119T2.2−P5 33, 119T2.2−P6 27, 53, 119T2.2−P7 69, 119T2.2−P8 34, 53, 119T2.2−P9 34, 72, 119T2.2−P10 33, 119T2.2−P11 33, 119T2.2−P12 54, 119T2.2−P14 70, 119T2.3−P1 64, 119T2.3−P3 58, 120T2.3−P4 46, 78, 96, 101, 120T2.3−P5 120T2.3−P6 120T2.3−P7 120T2.3−P8 58, 60, 61, 64, 96, 106,
120T2.3−P9 58, 64, 96, 104, 120T2.3−P10 24, 30, 120T2.3−P11 52, 120T2.3−P12 52, 60, 120T2.3−P13 46, 96, 101, 120T2.3−P14 60, 120T2.3−P15 60, 120T2.4−O1 62, 68, 96, 104, 120T2.4−O2 62, 68, 69, 96, 105, 120T2.4−O3 69, 96, 105, 121T2.4−P1 26, 72, 121T2.4−P2 61, 62, 121T2.4−P3 68, 121T2.4−P4 27, 69, 121T2.4−P5 61, 68, 121T2.4−P6 62, 69, 121T2.4−P7 62, 69, 121T2.4−P8 28, 62, 69, 121T2.4−P9 62, 121T2.4−P10 62, 69, 121
T2.4−P11 62, 69, 121T2.4−P12 55, 62, 69, 121T2.4−P13 62, 69, 121T2.4−P14 27, 62, 121T2.4−P15 62, 70, 121T2.4−P17 64, 65, 122T2.4−P18 68, 122T2.4−P19 55, 69, 122T2.4−P20 77, 78, 122T2.4−P21 61, 122T2.5−O1 36, 61, 96, 103, 122T2.5−P1 69, 96, 106, 122T2.5−P2 60, 96, 104, 122T2.5−P3 70, 122T2.5−P4 50, 122T2.5−P5 32, 77, 122T2.5−P6 122T2.5−P7 53, 61, 96, 103, 122T2.5−P8 33, 122T2.5−P9 30, 78, 122T2.5−P10 33, 123T2.5−P11 43, 123T3.1−O1 27, 34, 123T3.1−O2 24, 25, 96, 99, 123T3.1−O3 23, 71, 96, 105, 123T3.1−O4 27, 34, 96, 98, 123T3.1−O5 26, 27, 72, 96, 98, 123T3.1−O6 23, 34, 96, 97, 123T3.1−O7 26, 96, 98, 123T3.1−P1 27, 123T3.1−P3 23, 123T3.1−P5 68, 123T3.1−P6 28, 72, 123T3.1−P7 24, 123T3.1−P8 27, 123T3.1−P9 26, 72, 123T3.1−P10 28, 38, 124T3.1−P11 27, 34, 124T3.1−P12 32, 77, 124T3.1−P13 29, 34, 124T3.1−P14 124T3.1−P16 23, 124T3.1−P17 28, 124T3.1−P18 26, 34, 124T3.1−P19 26, 27, 124T3.1−P20 72, 124T3.1−P21 24, 124T3.1−P22 31, 124T3.1−P23 26, 124T3.1−P24 32, 70, 71, 124T3.1−P25 26, 73, 124T3.1−P26 24, 26, 124T3.1−P27 124T3.1−P28 26, 124T3.1−P29 33, 124T3.1−P31 26, 72, 125T3.1−P32 29, 65, 125
T3.1−P33 36, 125T3.1−P34 27, 34, 125T3.1−P35 23, 71, 125T3.1−P37 36, 125T3.1−P38 26, 125T3.1−P39 34, 125T3.1−P40 65, 125T3.1−P41 24, 30, 68, 125T3.1−P42 26, 96, 98, 125T3.2−O1 27, 34, 35, 96, 99, 125T3.2−O2 27, 34, 35, 96, 98, 125T3.2−P1 53, 125T3.2−P2 73, 96, 106, 125T3.2−P4 32, 125T3.2−P6 27, 34, 126T3.3−O1 28, 29, 36, 65, 96, 104,
126T3.3−O2 28, 36, 126T3.3−P1 126T3.3−P2 29, 36, 126T3.3−P3 29, 36, 126T3.3−P4 28, 33, 36, 126T3.3−P5 65, 126T3.3−P6 28, 126T3.3−P7 36, 126T3.3−P8 33, 96, 98, 126T3.3−P9 34, 96, 98, 126T3.4−O1 33, 44, 96, 98, 126T3.4−O2 33, 126T3.4−O3 33, 52, 70, 127T3.4−P3 127T3.4−P4 33, 127T3.4−P5 33, 127T3.4−P6 29, 33, 127T3.4−P7 127T3.4−P8 33, 127T3.4−P9 33, 44, 127T3.4−P10 73, 127T3.4−P11 127T3.4−P12 127T3.5−O1 46, 127T3.5−O2 46, 69, 127T3.5−O3 43, 127T3.5−O4 33, 127T3.5−O5 42, 127T3.5−O6 61, 96, 97, 128T3.5−O7 128T3.5−O8 46, 128T3.5−O9 40, 96, 101, 128T3.5−O10 41, 128T3.5−O11 42, 128T3.5−P1 33, 128T3.5−P2 77, 128T3.5−P6 46, 72, 128T3.5−P7 43, 44, 78, 128T3.5−P8 33, 36, 128T3.5−P9 128
INDEX OF CITED CONTRIBUTIONS 147
T3.5−P10 77, 128T3.5−P11 78, 96, 107, 128T3.5−P12 70, 128T3.5−P13 46, 77, 128T3.5−P14 28, 128T3.5−P15 44, 128T3.5−P16 44, 45, 61, 129T3.5−P17 65, 129T3.5−P19 40, 129T3.5−P20 41, 129T3.5−P21 40, 129T3.5−P22 40, 129T3.5−P23 46, 64, 129T3.5−P24 32, 68, 129T3.5−P25 78, 96, 107, 129T3.5−P26 40, 41, 129T3.5−P29 129T3.5−P30 44, 129T3.5−P31 129T3.5−P32 46, 64, 69, 129T3.5−P33 70, 129T3.5−P34 129T3.5−P35 129T3.5−P37 52, 78, 130T3.5−P39 32, 76, 130T3.5−P42 42, 130T3.5−P43 42, 130T3.5−P44 42, 130T3.5−P45 46, 130T3.5−P46 40, 130T3.5−P47 30, 52, 130T3.5−P48 29, 47, 65, 130T3.5−P49 63, 130T3.5−P50 46, 130T3.5−P51 44, 130T3.5−P52 71, 96, 107, 130T3.5−P53 78, 130T3.5−P54 130T3.5−P55 50, 130T3.5−P56 23, 68, 130T3.5−P57 46, 130T3.6−O1 46, 56, 73, 96, 105, 131T3.6−O2 33, 96, 100, 131T3.6−P1 46, 96, 100, 131T3.6−P3 44, 131T3.6−P4 32, 131T3.7−O1 46, 47, 96, 100, 131T3.7−O2 41, 42, 131T3.7−P1 131T3.7−P3 42, 63, 131T3.7−P4 41, 131T3.7−P5 131T3.7−P6 41, 131T3.7−P7 40, 131T3.7−P9 42, 131T3.7−P10 42, 63, 132T3.7−P11 46, 132
T3.7−P12 41, 132T4.1−O1 72, 96, 106, 132T4.1−O2 41, 71, 132T4.1−O3 73, 132T4.1−O4 73, 132T4.1−O5 38, 132T4.1−O6 71, 96, 106, 132T4.1−O7 78, 96, 107, 132T4.1−P1 73, 96, 105, 132T4.1−P2 71, 132T4.1−P3 73, 77, 96, 108, 132T4.1−P6 32, 70, 132T4.1−P7 31, 78, 132T4.1−P10 133T4.1−P11 73, 77, 133T4.1−P12 23, 71, 133T4.1−P13 133T4.1−P14 73, 133T4.1−P15 27, 72, 133T4.1−P17 31, 72, 133T4.1−P18 26, 96, 99, 133T4.1−P19 32, 77, 133T4.1−P20 78, 133T4.1−P21 31, 70, 72, 133T4.1−P22 24, 30, 71, 133T4.1−P23 26, 31, 133T4.1−P24 72, 133T4.1−P25 38, 133T4.1−P26 52, 133T5.1−O1 82, 83, 96, 108, 134T5.1−O2 33, 82, 83, 96, 108, 134T5.1−P1 82, 134T5.1−P2 82, 134T5.1−P3 83, 134T5.1−P5 82, 96, 108, 134T5.4−O1 76, 82, 96, 107, 134T5.4−O2 31, 73, 77, 96, 97, 134T5.4−O3 44, 70, 96, 105, 134T5.4−O4 77, 82, 134T5.4−O5 71, 76, 96, 107, 134T5.4−O6 83, 134T5.4−O7 76, 134T5.4−P2 77, 82, 135T5.4−P3 78, 135T5.4−P4 78, 135T5.4−P5 78, 135T5.4−P6 77, 82, 135T5.4−P7 77, 82, 135T5.4−P9 78, 82, 135T5.4−P10 77, 82, 135T5.4−P11 77, 135T5.4−P12 32, 135T5.4−P15 30, 77, 135T5.4−P16 32, 52, 78, 135T5.4−P17 135T5.4−P19 77, 82, 135T5.4−P20 82, 135
T5.4−P21 77, 82, 135T5.4−P22 76, 82, 135T5.4−P23 76, 82, 135T5.4−P24 78, 136T5.4−P26 78, 136T5.4−P27 78, 82, 136T5.4−P29 136T5.4−P30 78, 82, 136T5.4−P31 76, 78, 82, 136T5.4−P32 78, 136T5.4−P34 82, 136E−1 136E−2 136E−3 136E−4 136E−5 136E−6 136E−7 136E−8 136E−9 136E−10 136E−11 136


Notes1 CTBT,ArticleIV,paragraph11,andPartIoftheProtocol,paragraph(b),finalsentence.2 CTBT,ArticleII,paragraph26(f).3 “CTBT:SynergieswithScience1996-2006andBeyond”.CTBTO,2006.ISBN:92-95021-34-7.4 “ScienceforSecurity:VerifyingtheComprehensiveNuclear-Test-BanTreaty”.CTBTO,September2009.5 “PossibleProjectsfortheCTBTOarisingfromthe2009InternationalScientificStudiesConference,10-12June2009”.
CTBTO,May2011.6 “ScientificAdvancesinCTBTMonitoringandVerification.ReviewofPresentationsandOutcomesoftheComprehensive
Nuclear-Test-BanTreaty:ScienceandTechnology2011Conference”.CTBTO,June2013.ISBN:92-95021-52-5.7 “ScientificAdvancesinCTBTMonitoringandVerification2015.ReviewofPresentationsandOutcomesoftheComprehensive
Nuclear-Test-BanTreaty:ScienceandTechnology2015Conference”.CTBTO,June2017.ISBN:978-92-95021-56-3.8 CTBT,ArticleIV,paragraph35.9 CTBT,ArticleIV,paragraph48.10 Forexample,CTBTProtocol,PartII,paragraph102.11 CTBTProtocol,PartI,paragraph18(b).12 CTBTProtocol,PartI,paragraph18.13 CTBTProtocol,PartI,paragraphs19and20(c).14 CTBT,ArticleIV,paragraphs29–33.
NOTES 149


THE PREPARATORY COMMISSION AND THE CTBTO
The Preparatory Commission for the Comprehensive Nuclear-Test-Ban Organization was set up by Resolu-tion CTBT/MSS/RES/1, adopted by the States Signatories on 19 November 1996. It was established to prepare for the Treaty’s entry into force, and to build up the functionality specified under the Treaty, including the International Moni-toring System (IMS) and the Internation-al Data Centre (IDC). Its Secretariat is referred to as the Provisional Technical Secretariat (PTS).
After entry into force, the Preparatory Commission will be replaced by the Comprehensive Nuclear-Test-Ban Trea-ty Organization (CTBTO) as specified in the Treaty, and the PTS will be replaced by the Technical Secretariat (TS). For simplicity, the term ‘CTBTO’ is generally used in this report for both the current and future organizations, except where distinction between the various organs is important to the context.
DISCLAIMER
The views expressed are those of the authors and do not reflect the positions and policies of the CTBTO Preparatory Commission.
REPORT CONCEPT Lassina Zerbo
WRITTEN AND COORDINATED BYRobert G. Pearce
LAYOUT Aida Rodriguez
PHOTOGRAPHS AND ILLUSTRATIONS are at the courtesy of the authors and the Pro-visional Technical Secretariat. Authors are grate-fully acknowledged for providing high-resolution images from their SnT2017 oral presentations and posters. Additional photographs by Anna Rauchenberger.
ISSUED BY the Provisional Technical Secretariat of the Preparatory Commission for the Comprehensive Nuclear-Test-Ban Treaty Organization (CTBTO)
Vienna International Centre P.O. Box 1200, 1400 Vienna, Austria [email protected] www.ctbto.org
©2017 CTBTO Preparatory Commission
SCIEN
TIFIC A
DVA
NC
ES IN C
TBT M
ON
ITOR
ING
AN
D VER
IFICATIO
N2017
SnT2017
CTBT SCIENCE AND TECHNOLOGY SERIES
In order to build and strengthen its relationship with the broader science community in support of the Comprehensive Nuclear-Test-Ban Treaty, the Preparatory Commission for the Comprehensive Nuclear-Test-Ban Treaty Organization invites the international scientific community to conferences on a regular basis; SnT2017 was the sixth such conference since 2006.
These conferences contribute to a process whose aim is to ensure that the CTBTO’s verification regime can benefit from current scientific and technological developments in relevant fields. The Conference Goals define in more detail the scope of topics covered.
These multidisciplinary scientific conferences attract scientists and experts from the broad range of the CTBT’s verification technologies, from national agencies involved in the CTBTO’s work to independent academic and research institutions. Members of the diplomatic community, international media and civil society also take an active interest.
SnT2017 was held in Vienna’s Hofburg Palace on 26−30 June 2017, in cooperation with the Austrian Federal Ministry for Europe, Integration and Foreign Affairs. This report provides an overview of the scientific contributions presented at the Conference, and identifies some highlights and potential focus areas for the future.
WWW.CTBTO.ORG
Scientific Advances in CTBT Monitoring and Verification2017
REVIEW OF PRESENTATIONS AND OUTCOMES OF THE COMPREHENSIVE NUCLEAR-TEST-BAN TREATY:SCIENCE AND TECHNOLOGY 2017CONFERENCE