Embed Size (px)
Citation preview

2017
2017 CPA PROFESSION
COMPENSATION STUDY
REPORT
FALL 2017
2017 CPA Profession Compensation Study
Table of Contents Contents
..............................................................................................................................
.................................................................................................................................................
........................................................................................................................................
...........................................................
...............................................................................................................................
................................................................................................................
......................................................................................................................
..................................................................................................................................
............................................................................................
......................................................................................
..............................................................................................................................
....................................................................................................................
.......................................................................................................
....................................................................................................................................
...................................................................................................................................................
...................................................................................................................
............................................................................................................................................
..................................................................................................................................
..............................................
......................................................................................................................
............................................................................
.............................................................
..............................................................................................................................
.......................................................................................................................
................................................................................................................................
..................................................................................................................
...................................................................................................................................
......................................................................................
......................................................................................................................................................
Summary of Key Findings 2
Methodology 4
Note on Reporting 4
Interpreting Differences in Compensation Between 2016 and 2014 5
Feedback on this Report 5
Structure of the Summary Report 5
Permission to Store or Reprint 5
Overall Compensation 6
All CPA Members (National & International) 6
Total Compensation by Industry – 2016 vs 2014 8
Owners Compensation 9
Non-Owners Compensation 10
Compensation by Province/Country 10
Sole Practitioners 12
Partners 12
Owners of Other Businesses 13
Non-Owners 14
Prospects for 2017 15
Compensation by Census Metropolitan Areas / Census Agglomerations 16
Compensation by Job Title 20
Compensation by Area of Focus among Non-Owners 21
Compensation by Years of Post-Designation Work Experience 23
Vacation Entitlement 24
Benefits by Employer Size 25
Benefits by Industry 26
Benefits by Industry (cont’d) 27
Work/Life Balance 28
Work/Life Balance Programs Used by Industry 29
Leaves 29
1

2017 CPA Profession Compensation Study
Summary of Key FindingsThe findings of this report are based on a sample of 33,709 professional accountants and may not, in all
cases, represent the profession as a whole. Please refer to the Methodology section for more details.
Overall Compensation
Findings from the 2017 Member Compensation Study (which reviews self-reported 2016
compensation figures provided by members of the CPA profession) reveal that members holding
the Chartered Professional Accountant (CPA) designation have a median annual compensation
of $107K, and an average of $146K among members.
The previously reported compensation levels for 2014 (from the 2015 study) included a median
of $108K and a mean of $151K, showing a 1% decrease in median and a 3% decrease in mean
compensation. This result should be interpreted with caution however, due to changes in
methodology between 2015 and 2017 studies, particularly in terms of how data about non-base
compensation was collected.
Compensation by Province/Country and Industry
From a provincial standpoint, median compensation within the provinces was highest in Alberta
($125K), followed by Ontario and Saskatchewan ($110K in both cases). Alberta also had the
highest average compensation of $162K, but experienced a decrease compared to the 2014
average of $184K. A substantial portion of the net decrease in average compensation is
attributable to Alberta.
In Census Metropolitan Areas (CMAs) with over 100 members reporting, the highest median
compensation can be found among CPA members residing in Calgary, Toronto, and Edmonton,
with medians of $133K, $118K, and $116K respectively.
CPAs who work internationally have significantly higher median compensation than those in
Canada, with the median compensation of international workers $175K compared to $105K for
those working in Canada. The highest median compensation is among those working in Hong
Kong, Switzerland, and the United Arab Emirates with $250K, $249K and $248K respectively.
Median income among those working in the United States was also higher than Canada at $185K.
Among industries with at least 100 members reporting, the highest median compensation can
be found in holding companies, mining, and oil & gas (with $164K, $145K, and $144K
respectively). The industry with the highest median compensation gain (based on the
percentage increase between 2014 and 2016) was holding/conglomerate, with an increase of
12%.
Looking ahead, the majority of members expect their compensation to increase in 2017 with at
least half of those in all industries believing that would be the case. The lowest confidence in
future compensation increase among industries with at least 100 members reporting was again
in the Oil & Gas industry, where half believe they will experience an increase in compensation,
and 13% believe they will experience a decrease.
2

2017 CPA Profession Compensation Study
Owner & Non-Owner Compensation
Just over one in twenty (7%) professional accountants reported owning a business in 2016, the
bulk – approximately three quarters or 74% – of these professional accountants owned
accounting firms, while the rest owned another form of business. Those who owned other
businesses had a median compensation of $200K, and an average compensation of $309K.
Comparatively, owners of accounting firms earned a median of $180 and an average of $249K.
Partners tend to earn more on average than sole practitioners – partners made a median of
$250K in 2016 compared to sole practitioners who made a median of $110K.
The median compensation for partners within the provinces was highest in Alberta at $315K,
followed by Ontario and Nova Scotia ($284K and $255K respectively).
Non-owners earned a median of $105K in total compensation in 2016, consistent with 2014. The
majority of that, $98K, came from base compensation. A bonus was the most frequent form of
non-base compensation with over half of professional accountants indicating they received one
in 2016. The median non-base compensation was $5K, identical to the $5K reported for 2014.
Members focusing in portfolio management have the highest median and average compensation
per area of focus for members, followed by investments. For focus areas with at least 100
members reporting, marketing/sales is associated with the highest median compensation at
$177K.
Professional accountants with the titles of Senior Vice President and President and/or CEO earned
the highest median compensation (each received $320K and $230K, respectively) with Non-Equity
Partner close behind with a median of $217K. Among companies with over 1,000 employees,
President and/or CEOs had significantly higher median compensation of $651K.
Vacation, Leave, Benefits, and Work/Life Balance
The bulk of professional accountants were entitled to a vacation of about 3-5 weeks (15 to 24
working days) in 2016 with less than one in twenty (4%) entitled to fewer than 3 weeks (15
days). There is, however, a gap in usage, with 17% of members having taken 14 days of vacation
or less, despite being entitled to more days.
Medical benefits, life insurance, and long-term disability insurance are the most common benefits
for professional accountants earning T4 income – over 60% received each of them. Members in
larger companies (100 or more employees) were more likely than employees of smaller firms to
receive medical benefits, life insurance, long term disability insurance, and pension benefits.
Internal professional development programs and flexible working hours were among the most
commonly offered to promote work/life balance. These were also among the most commonly
taken programs by members. Work from home was offered by 55% of employers, and taken by
83% of those who were offered.
Slightly less than half of all members have taken any kind of leave. The most common leave taken
by members is maternity/paternity/parental leave at 28%, followed by medical leave at 16%.
3

2017 CPA Profession Compensation Study
IntroductionCPA Canada commissioned Nielsen to conduct a compensation survey of 33,709 Chartered Professional
Accountants between June 23, 2017 and July 18, 2017. This report relies on self-reported compensation
from professional accountants answering the survey. Although attempts were made to minimize
respondents’ data entry errors by removing inconsistent data, no attempts were made to independently
verify the data they provided.
When reviewing the mean averages it is important to consider that a small portion of responses may skew
the mean average quite higher than it would be otherwise. In most cases a better measure of a typical
compensation level is the median.
Methodology CPA Canada commissioned Nielsen to conduct quantitative research among its active and retired
members. Survey invitations were sent to 199,306 via email, with 2,686 bounce backs for a total of
196,620 members receiving the email. There were 33,709 members who responded for a response rate
of 17%. Of those, 1,686 did not report working at least 1 month in 2016 for a total of 32,023 members
who were asked about employment information. In addition, 431 respondents were excluded for either
missing key information, or giving answers that may have been entered in error. In total, compensation
data is reported for a total of 31,592 members, while some individual topics report on smaller groups.
It should be noted that findings in this report are representative of those responding and may not precisely
represent the CPA profession as a whole.
Unless otherwise specified, compensation figures shown in this report include annualized data for
members who worked at least two months, either part-time or full-time during 2016.
For the reporting on Canadian cities, this report uses Statistics Canada-defined Census Metropolitan
Areas (CMAs) and Census Agglomerations (CAs) for the purposes of analysis. These represent both
urban cores as well as any adjacent municipalities that are closely integrated. Full definitions of these
terms can be found by following this link: http://www.statcan.gc.ca/pub/92-195-x/2011001/geo/cma
rmr/def-eng.htm
Note on Reporting To protect the privacy of respondents and to avoid misleading results, the mean and median for
compensation data is only presented when there are at least 10 respondents in a subcategory and upper
and lower quartile information is only shown when there are at least 20 respondents in a subcategory.
Definitions of the four statistical measures used in this report are provided below for reference:
• Median: (or 50th percentile) is the value above and below which half the cases fall. If there
is an even number of cases, then it is the average of the two middle cases. As compared to
the mean, the median is not sensitive to outlying (a few very high or very low) values. In some
cases this may make it a more reliable measure to compare individual compensation.
4

2017 CPA Profession Compensation Study
• Mean: (also called average) is the sum of all cases divided by the total number of cases
• 25th Percentile: is the value above which 75% of the cases fall
• 75th Percentile: is the value below which 75% of the cases fall
Interpreting Differences in Compensation Between 2016 and 2014 Although there are comparisons between 2016 and 2014, compensation figures made throughout the
report, these differences should be interpreted with caution due to methodological changes in the survey
design, weighting and reporting of results made between each iteration of the study.
Feedback on this Report Questions or comments related to this report can be directed to Paul Long ([email protected]).
Structure of the Summary Report This report is organized into two sections; “Section 1: Compensation” includes overall compensation data
and compensation data broken out by demographic information; “Section 2: Vacation, Leave, Benefits
and Work/Life Balance” includes statistics on vacation received, leaves taken, benefits provided, and
work/life balance options offered and used.
Permission to Store or Reprint This publication is protected by copyright and written permission is required to reproduce, store in a
retrieval system or transmit in any form or by any means (electronic, mechanical, photocopying, recording
or otherwise).
For information regarding permission, please contact [email protected]
5

6
2017 CPA Profession Compensation Study
Section 1: Compensation
Overall Compensation All CPA Members (National & International)
Table 1a below shows the median (middle), mean (average) and top and bottom quartiles for
compensation broken down by Industry. Figures below include accountants who worked at least two full
months in the previous year. Compensation of those who worked less than full-time for 12 months was
annualized based on a 35-hour workweek.
The median compensation for members in 2016 was $107K, while the mean was $146K.
In comparison, the recorded median compensation for members in the study 2014 was $108K, while the
mean compensation was $151K.
Among industries with at least 100 members reporting, the highest median compensation can be found
in holding companies, mining, and oil & gas (with $164K, $145K, and $144K respectively).
Table 1a: Total Compensation—By Industry Employed ($ in 000’s)
Industry of Employment Count Median Mean Percentile 25 Percentile 75
Holding, Conglomerate 184 $164 $275 $105 $253
Mining 488 $145 $226 $105 $227
Oil & Gas 1,347 $144 $183 $105 $201
Financial Services (including banks, trusts,
insurance, credit unions, etc.) 3,473 $127 $191 $93 $200
Pharmaceuticals and Chemicals 277 $127 $161 $94 $192
Technology/IT 148 $120 $159 $82 $167
Transportation, Distribution 759 $120 $157 $88 $180
Software 602 $120 $153 $88 $175
Professional Services firm - other - (eg.,
Consulting, legal, etc.) 1,219 $117 $153 $83 $170
Utilities 597 $117 $153 $97 $160
Telecommunications 419 $114 $149 $83 $150
Real Estate/Building Management 863 $112 $163 $83 $180
Manufacturing 2,620 $112 $146 $85 $160
Retail, Wholesale 1,680 $108 $153 $82 $163

7
2017 CPA Profession Compensation Study
Industry of Employment Count Median Mean Percentile 25 Percentile 75
Construction 1,095 $106 $140 $81 $151
Travel/tourism 32 $106 $134 $73 $155
Educational Institution (e.g., university,
college, primary or secondary school, etc.) 1,171 $106 $122 $86 $142
Agriculture, Forestry, Fisheries 509 $105 $146 $80 $152
Private Sector - Healthcare 35 $105 $138 $85 $145
Public Sector - Crown corporation 763 $105 $117 $89 $127
Arts, Entertainment, Leisure 266 $104 $158 $84 $164
Marketing/advertising 36 $104 $118 $82 $131
Automotive services 51 $102 $129 $79 $156
Aerospace/aviation 54 $102 $119 $78 $141
Media, Communications, Publishing 304 $101 $138 $77 $156
Public Sector - Hospital, library, health
organization, or social services organization 852 $101 $122 $84 $130
Hotels and Restaurants 230 $100 $137 $75 $150
Public Sector - Federal, provincial, first
nations or municipal government including
ministries, departments, etc.
3,887 $100 $107 $83 $118
Not for profit (eg., trade association, charity,
religious group, etc.) 1,097 $97 $113 $76 $130
Public Sector - Office of the auditor general
(federal, provincial, or municipal) 241 $94 $104 $76 $119
Professional Services firm - public practice (a
firm that primarily delivers accounting,
auditing and/or tax services)
5,875 $91 $137 $66 $144
Other 404 $108 $143 $81 $158
Total 31,592 $107 $146 $82 $153
*14 members did not specify their Industry of Employment
8
2017 CPA Profession Compensation Study
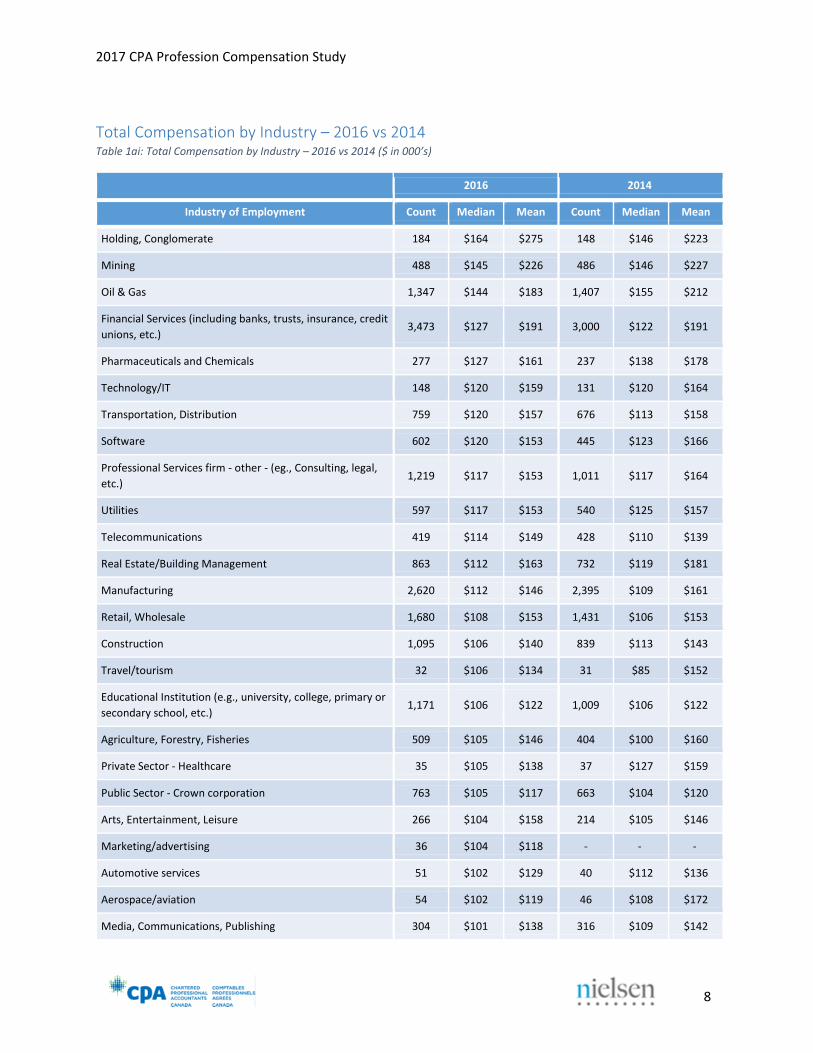
Total Compensation by Industry – 2016 vs 2014 Table 1ai: Total Compensation by Industry – 2016 vs 2014 ($ in 000’s)
2016 2014
Industry of Employment Count Median Mean Count Median Mean
Holding, Conglomerate 184 $164 $275 148 $146 $223
Mining 488 $145 $226 486 $146 $227
Oil & Gas 1,347 $144 $183 1,407 $155 $212
Financial Services (including banks, trusts, insurance, credit
unions, etc.) 3,473 $127 $191 3,000 $122 $191
Pharmaceuticals and Chemicals 277 $127 $161 237 $138 $178
Technology/IT 148 $120 $159 131 $120 $164
Transportation, Distribution 759 $120 $157 676 $113 $158
Software 602 $120 $153 445 $123 $166
Professional Services firm - other - (eg., Consulting, legal,
etc.) 1,219 $117 $153 1,011 $117 $164
Utilities 597 $117 $153 540 $125 $157
Telecommunications 419 $114 $149 428 $110 $139
Real Estate/Building Management 863 $112 $163 732 $119 $181
Manufacturing 2,620 $112 $146 2,395 $109 $161
Retail, Wholesale 1,680 $108 $153 1,431 $106 $153
Construction 1,095 $106 $140 839 $113 $143
Travel/tourism 32 $106 $134 31 $85 $152
Educational Institution (e.g., university, college, primary or
secondary school, etc.) 1,171 $106 $122 1,009 $106 $122
Agriculture, Forestry, Fisheries 509 $105 $146 404 $100 $160
Private Sector - Healthcare 35 $105 $138 37 $127 $159
Public Sector - Crown corporation 763 $105 $117 663 $104 $120
Arts, Entertainment, Leisure 266 $104 $158 214 $105 $146
Marketing/advertising 36 $104 $118 - - -
Automotive services 51 $102 $129 40 $112 $136
Aerospace/aviation 54 $102 $119 46 $108 $172
Media, Communications, Publishing 304 $101 $138 316 $109 $142

9
2017 CPA Profession Compensation Study
2016 2014
Industry of Employment Count Median Mean Count Median Mean
Public Sector - Hospital, library, health organization, or
social services organization 852 $101 $122 670 $97 $123
Hotels and Restaurants 230 $100 $137 222 $112 $143
Public Sector - Federal, provincial, first nations or
municipal government including ministries, departments,
etc.
3,887 $100 $107 3,183 $100 $110
Not for profit (eg., trade association, charity, religious
group, etc.) 1,097 $97 $113 942 $95 $115
Public Sector - Office of the auditor general (federal,
provincial, or municipal) 241 $94 $104 188 $97 $107
Professional Services firm - public practice (a firm that
primarily delivers accounting, auditing and/or tax services) 5,875 $91 $137 5,545 $94 $137
Other 404 $108 $143 309 $110 $169
Total 31,592 $107 $146 27,863 $108 $151
*14 members did not specify their Industry of Employment in 2016
Owners Compensation About 7% of professional accountants reported owning a business in 2016. The bulk – approximately
three quarters or 74% – of these professional accountants owned accounting firms, while the rest owned
another form of business. Those who owned other businesses had a median compensation of $200K, and
an average compensation of $309K. Partners made a median of $250K in 2016 compared to sole
practitioners who made a median of $110K. Those who reported being part of multiple categories i.e.
employees earning T4 income and/or owners were not counted as part of this analysis.
Table 1b: Owner Compensation – 2016 vs 2014 ($ in 000’s)
Owner of an Accounting Firm (Sole & Partner)
Sole Partner Owner of Another Business
Measure 2016 2014 2016 2014 2016 2014 2016 2014
Count 1,536 2,031 648 946 888 1,085 541 677
Median $180 $160 $110 $108 $250 $232 $200 $160
Mean $249 $211 $150 $136 $320 $276 $309 $316
Percentile 25 $100 $96 $70 $70 $158 $150 $115 $100
Percentile 75 $311 $267 $175 $165 $400 $333 $336 $286
*479 members classified themselves as independent contractors/consultants only (earning income not covered on a T4), 878
members were grouped into multiple categories, with the remainder i.e. 28,158 categorized as Non-Owners (an
employee/contractor/consultant of an organization/firm/company earning T4 income)

10
2017 CPA Profession Compensation Study
Non-Owners Compensation Table 1c below shows base, total non-base, and total compensation statistics for professional accountants
who did not own their own business in 2016. (These non-owners make up the bulk of the profession.)
Non-owners earned a median of $105K in total compensation in 2016, consistent with 2014. The majority
of that, $98K, came from base compensation. A bonus was the most frequent form of non-base
compensation with over half of professional accountants indicating they received one in 2016. The
median non-base compensation was $5K, identical to the $5K reported for 2014.
Table 1c: Non-Owner Compensation – 2016 vs 2014 ($ in 000’s)
2016 2014
Measure Base
Compensation Total Non -Base Compensation
Total Compensation
Base Compensation
Total Non -Base Compensation
Total Compensation
Count 28,158 28,158 28,158 24,861 24,990 24,863
Median $98 $5 $105 $97 $5 $105
Mean $113 $23 $135 $114 $27 $141
Percentile 25 $77 $0 $80 $75 $0 $80
Percentile 75 $127 $16 $145 $129 $18 $150
Compensation by Province/Country Looking at all professional accountants, median compensation within the provinces was highest in Alberta
($125K), followed by Ontario and Saskatchewan ($110K in both cases). Median compensation was also
high in the three Territories at $134K (Northwest Territories), $135K (Yukon), and $139K (Nunavut).
CPAs who work internationally have significantly higher median compensation than those in Canada, with
the median compensation of international workers $175K compared to $105K for those working in
Canada. The highest median compensation is among those working in Hong Kong, Switzerland, and the
United Arab Emirates with $250K, $249K and $248K respectively. Median income among those working
in the United States was also higher than Canada at $185K.
Table 2a: All Members by Province/Country in 2016 ($ in 000's)
Count Median Mean Percentile 25 Percentile 75
BC 4,129 $100 $133 $76 $140
Alberta 4,207 $125 $162 $92 $178
Saskatchewan 1,063 $110 $144 $88 $150
Manitoba 1,332 $101 $126 $79 $134
Ontario 10,870 $110 $150 $85 $159
Quebec 6,529 $98 $122 $74 $132

11
2017 CPA Profession Compensation Study
PEI 129 $85 $110 $69 $115
Newfoundland and Labrador 354 $100 $120 $78 $130
New Brunswick 591 $94 $117 $74 $121
Nova Scotia 699 $95 $116 $75 $129
Yukon 25 $135 $142 $104 $150
Northwest Territories 43 $134 $145 $119 $169
Nunavut 15 $139 $147 - -
Total Canada 30,230 $105 $140 $81 $150
Australia 52 $139 $178 $101 $202
Barbados 38 $104 $148 $66 $157
Bermuda 105 $222 $348 $135 $340
Cayman Islands 60 $183 $259 $125 $293
China 63 $100 $181 $60 $171
Germany 13 $146 $256 - -
Hong Kong 81 $250 $430 $122 $575
Saudi Arabia 14 $137 $198 - -
Singapore 19 $240 $301 - -
Switzerland 37 $249 $326 $175 $300
Trinidad And Tobago 11 $140 $162 - -
United Arab Emirates 31 $248 $426 $100 $338
United Kingdom 66 $174 $326 $98 $280
United States 532 $185 $266 $132 $301
Total International 1,333 $175 $271 $114 $296
*244 members working in Canada did not specify their province of employment, 211 members working outside of Canada did
not specify their country of employment and 29 members failed to provide their country of employment
12
2017 CPA Profession Compensation Study
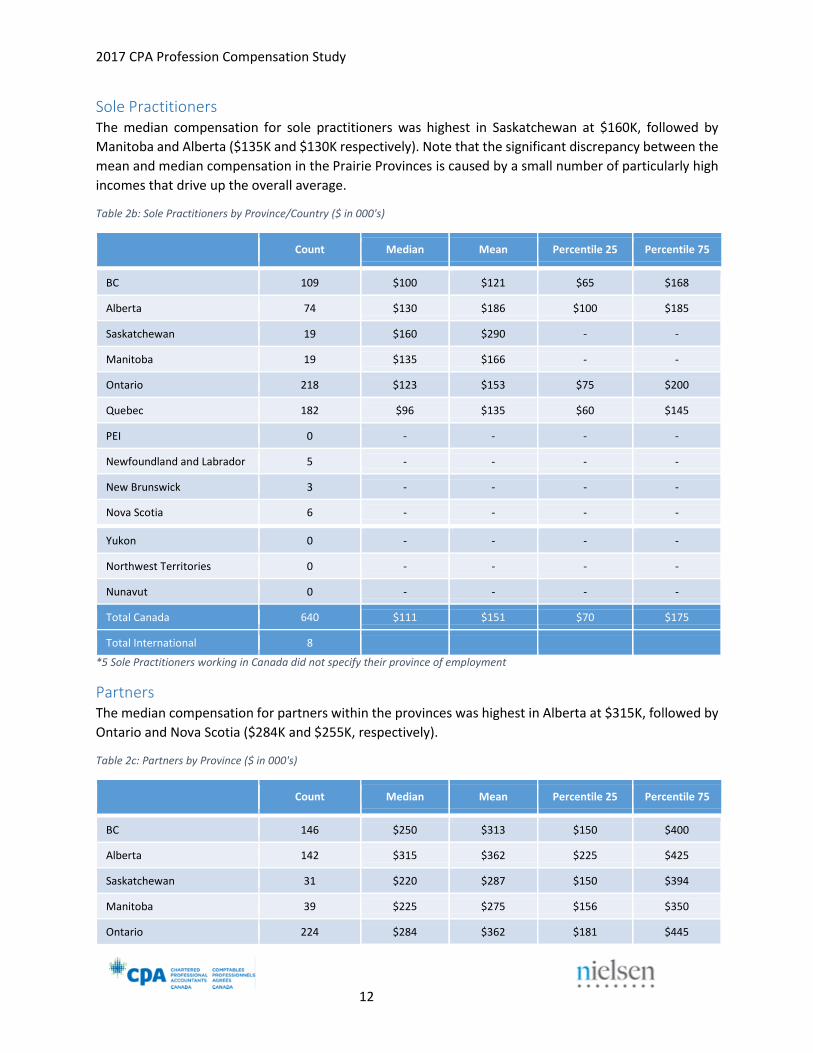
Sole Practitioners The median compensation for sole practitioners was highest in Saskatchewan at $160K, followed by
Manitoba and Alberta ($135K and $130K respectively). Note that the significant discrepancy between the
mean and median compensation in the Prairie Provinces is caused by a small number of particularly high
incomes that drive up the overall average.
Table 2b: Sole Practitioners by Province/Country ($ in 000's)
Count Median Mean Percentile 25 Percentile 75
BC 109 $100 $121 $65 $168
Alberta 74 $130 $186 $100 $185
Saskatchewan 19 $160 $290 - -
Manitoba 19 $135 $166 - -
Ontario 218 $123 $153 $75 $200
Quebec 182 $96 $135 $60 $145
PEI 0 - - - -
Newfoundland and Labrador 5 - - - -
New Brunswick 3 - - - -
Nova Scotia 6 - - - -
Yukon 0 - - - -
Northwest Territories 0 - - - -
Nunavut 0 - - - -
Total Canada 640 $111 $151 $70 $175
Total International 8 - - - -
*5 Sole Practitioners working in Canada did not specify their province of employment
Partners The median compensation for partners within the provinces was highest in Alberta at $315K, followed by
Ontario and Nova Scotia ($284K and $255K, respectively).
Table 2c: Partners by Province ($ in 000's)
Count Median Mean Percentile 25 Percentile 75
BC 146 $250 $313 $150 $400
Alberta 142 $315 $362 $225 $425
Saskatchewan 31 $220 $287 $150 $394
Manitoba 39 $225 $275 $156 $350
Ontario 224 $284 $362 $181 $445

13
2017 CPA Profession Compensation Study
Quebec 221 $179 $235 $120 $300
PEI 4 - - - -
Newfoundland and Labrador 4 - - - -
New Brunswick 18 $159 $205 - -
Nova Scotia 14 $255 $243 - -
Yukon 2 - - - -
Northwest Territories 1 - - - -
Nunavut 0 - - - -
Total Canada 852 $250 $308 $155 $386
Total International 34 $438 $632 $245 $720
* 6 Partners working in Canada did not specify their province of employment and 2 failed to provide their country of
employment
Owners of Other Businesses The median compensation for owners of other businesses was highest in Saskatchewan at $240K,
followed by Ontario, and Alberta ($232K and $220K, respectively). Saskatchewan also had by far the
highest average compensation, but the figure of $478K was impacted by a small subset of high outliers
and may not necessarily represent the provincial compensation well overall.
Table 2d: Owners of another Business by Province ($ in 000's)
Count Median Mean Percentile 25 Percentile 75
BC 75 $185 $240 $120 $270
Alberta 73 $220 $280 $125 $324
Saskatchewan 23 $240 $478 $163 $600
Manitoba 30 $140 $230 $92 $247
Ontario 167 $232 $335 $120 $400
Quebec 105 $151 $222 $100 $280
PEI 1 - - - -
Newfoundland and Labrador 5 - - - -
New Brunswick 5 - - - -
Nova Scotia 10 $128 $154 - -
Yukon 1 - - - -
Northwest Territories 0 - - - -
Nunavut 0 - - - -

14
2017 CPA Profession Compensation Study
Total Canada 495 $200 $282 $110 $316
Total International 44 $328 $618 $155 $525
* 2 Owners of Other Businesses did not specify their country of employment.
Non-Owners The median compensation for non-owners within the provinces was highest in Alberta at $120K, followed
by Ontario, and Saskatchewan. ($108K, $106K, respectively). Nunavut, Northwest Territories and Yukon,
had higher median compensation than the national average, at $142K, $134K and $130K respectively.
Table 2e: Non-Owners by Province ($ in 000's)
Count Median Mean Percentile 25 Percentile 75
BC 3,565 $96 $122 $75 $131
Alberta 3,702 $120 $151 $91 $168
Saskatchewan 944 $106 $123 $87 $136
Manitoba 1,175 $99 $116 $78 $125
Ontario 9,846 $108 $141 $85 $150
Quebec 5,789 $95 $115 $74 $127
PEI 118 $84 $103 $65 $113
Newfoundland and Labrador 326 $99 $118 $77 $125
New Brunswick 551 $92 $112 $73 $118
Nova Scotia 634 $92 $110 $73 $121
Yukon 22 $130 $129 $104 $150
Northwest Territories 41 $134 $145 $119 $168
Nunavut 14 $142 $147 - -
Total Canada 26,944 $103 $131 $80 $141
Australia 48 $134 $163 $100 $187
Barbados 30 $97 $117 $66 $156
Bermuda 92 $214 $331 $134 $309
Cayman Islands 47 $152 $204 $122 $222
China 53 $101 $138 $60 $171
Germany 13 $146 $256 - -
Hong Kong 71 $205 $371 $116 $575
Saudi Arabia 12 $137 $201 - -

15
2017 CPA Profession Compensation Study
Singapore 16 $234 $312 - -
Switzerland 36 $247 $299 $175 $291
Trinidad And Tobago 9 - - - -
United Arab Emirates 30 $251 $435 $100 $338
United Kingdom 60 $163 $309 $98 $270
United States 490 $180 $246 $130 $296
Total International 1,189 $168 $246 $113 $275
* 217 Non-Owners working in Canada did not specify their province of employment, 182 Non-Owners working outside of Canada
did not specify their country of employment and 25 failed to provide their country of employment
Prospects for 2017 In all industries at least half of respondents expect their compensation to increase (at least 50%) with the
lowest proportion expecting an increase in Oil & Gas (51%) where 13% expect a decrease.
Table 3: Prospects for 2017
Count Don ’t
know
Decrease
by 10% or
more
Decrease
by less
than 10%
Same
Increase by
less than
10%
Increase by
10% or more
Professional Services firm public practice (a firm that primarily delivers accounting, auditing and/or tax services)
5,875 3% 5% 3% 15% 50% 25%
Public Sector - Federal, provincial, first nations or municipal government including ministries, departments, etc.
3,887 3% 3% 2% 19% 68% 5%
Financial Services (including banks, trusts, insurance, credit unions, etc.)
3,473 3% 4% 2% 14% 60% 16%
Manufacturing 2,620 3% 4% 3% 15% 61% 14%
Retail, Wholesale 1,680 3% 4% 3% 20% 54% 16%
Oil & Gas 1,347 4% 8% 4% 33% 39% 12%
Professional Services firm other - (e.g., Consulting, legal, etc.)
1,219 4% 6% 3% 19% 46% 22%
Educational Institution (e.g., university, college, primary or secondary school, etc.)
1,171 2% 4% 3% 20% 64% 7%

16
2017 CPA Profession Compensation Study
Not for profit (e.g., trade association, charity, religious group, etc.)
1,097 3% 3% 1% 16% 66% 11%
Construction 1,095 3% 5% 3% 23% 48% 17%
Real Estate/Building Management
863 4% 4% 2% 15% 58% 17%
Public Sector - Hospital, library, health organization, or social services organization
852 4% 2% 3% 27% 57% 8%
Public Sector - Crown corporation
763 2% 1% 4% 17% 71% 5%
Transportation, Distribution 759 4% 5% 2% 18% 57% 14%
Software 602 3% 5% 1% 17% 52% 21%
Utilities 597 2% 4% 2% 18% 63% 10%
Agriculture, Forestry, Fisheries
509 2% 4% 4% 15% 60% 15%
Mining 488 5% 7% 3% 19% 49% 18%
Telecommunications 419 3% 5% 4% 26% 48% 14%
Media, Communications, Publishing
304 4% 6% 1% 19% 53% 17%
Pharmaceuticals and Chemicals
277 3% 4% 1% 16% 60% 17%
Arts, Entertainment, Leisure 266 1% 3% 3% 18% 56% 18%
Public Sector - Office of the auditor general (federal, provincial, or municipal)
241 3% 1% 2% 20% 66% 9%
Hotels and Restaurants 230 3% 8% 0% 26% 46% 17%
Holding, Conglomerate 184 5% 5% 2% 24% 46% 17%
Technology/IT 148 5% 7% 5% 15% 49% 18%
Aerospace/aviation 54 0% 7% 6% 11% 65% 11%
Automotive services 51 4% 4% 2% 25% 37% 27%
*Only industries with a base of greater than 50 are shown above
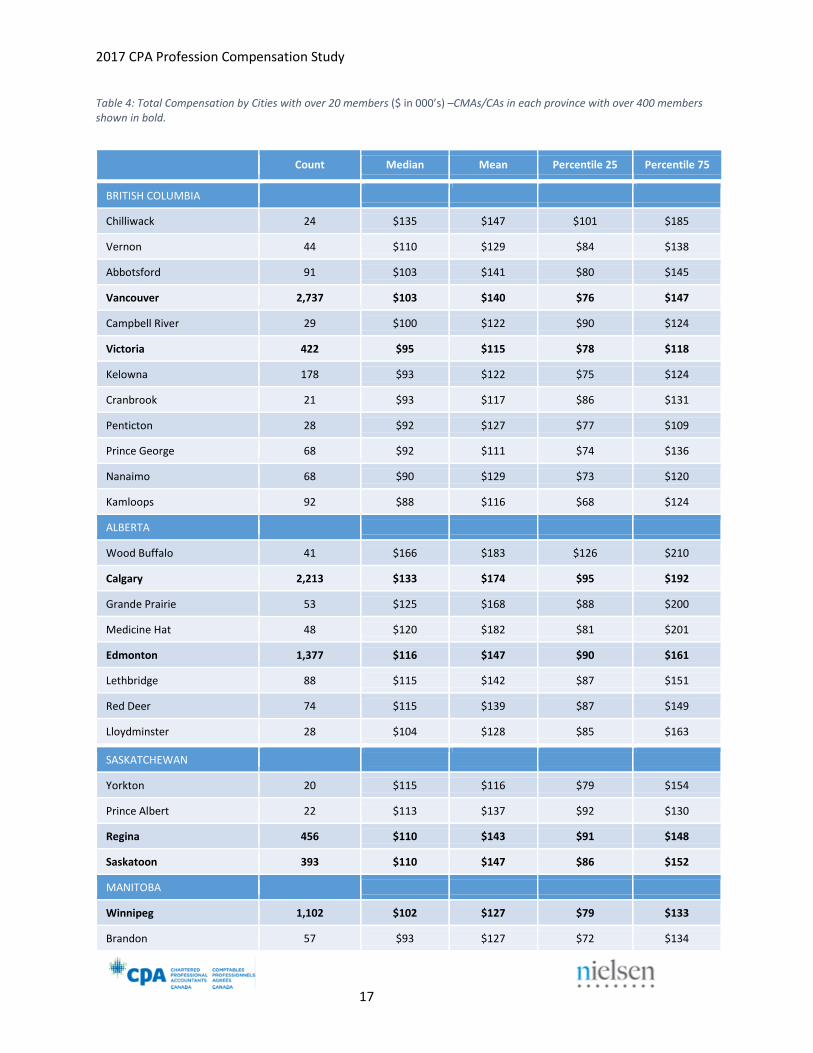
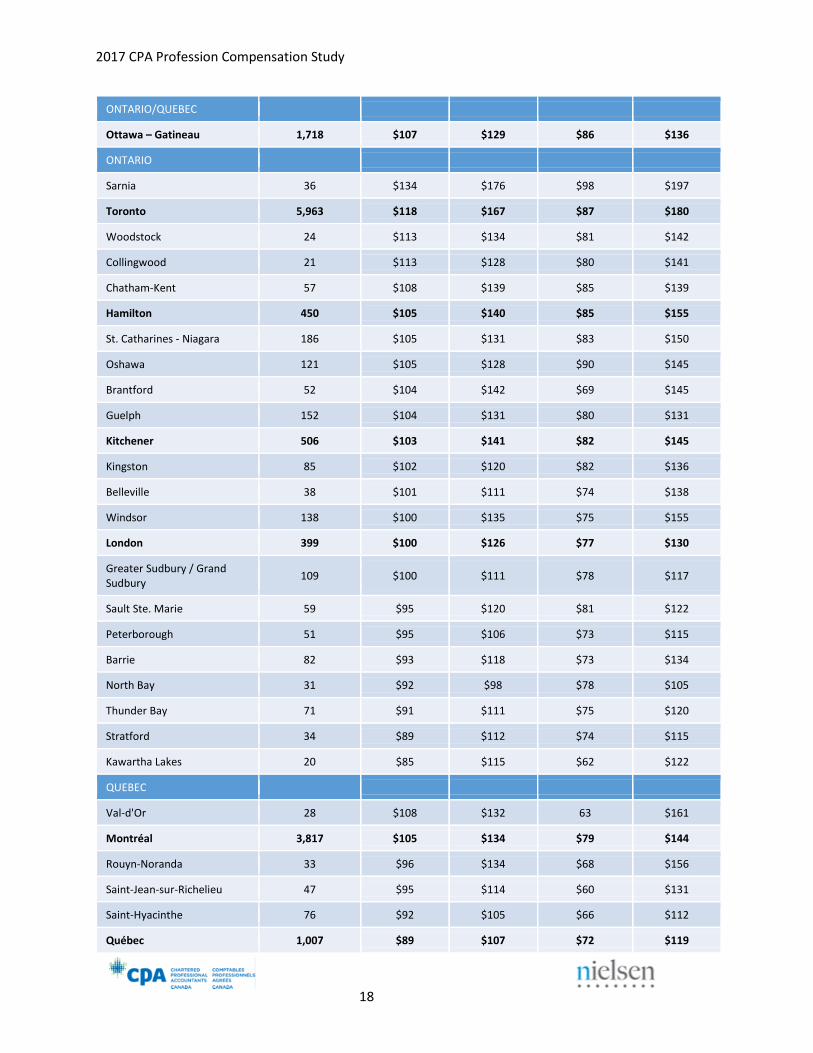
Compensation by Census Metropolitan Areas / Census Agglomerations The four CMAs/CAs with the highest median compensation are Wood Buffalo (Fort McMurray) with
$166K, Chilliwack and Whitehorse with $135K each, as well as Sarnia and Yellowknife with $134K each.
Of cities with over 400 members responding, the cities that have the highest median reported
compensation are Calgary with $133K, followed by Toronto with $118K, and Edmonton with $116K.
17
2017 CPA Profession Compensation Study
Table 4: Total Compensation by Cities with over 20 members ($ in 000’s) –CMAs/CAs in each province with over 400 members shown in bold.
Count Median Mean Percentile 25 Percentile 75
BRITISH COLUMBIA
Chilliwack 24 $135 $147 $101 $185
Vernon 44 $110 $129 $84 $138
Abbotsford 91 $103 $141 $80 $145
Vancouver 2,737 $103 $140 $76 $147
Campbell River 29 $100 $122 $90 $124
Victoria 422 $95 $115 $78 $118
Kelowna 178 $93 $122 $75 $124
Cranbrook 21 $93 $117 $86 $131
Penticton 28 $92 $127 $77 $109
Prince George 68 $92 $111 $74 $136
Nanaimo 68 $90 $129 $73 $120
Kamloops 92 $88 $116 $68 $124
ALBERTA
Wood Buffalo 41 $166 $183 $126 $210
Calgary 2,213 $133 $174 $95 $192
Grande Prairie 53 $125 $168 $88 $200
Medicine Hat 48 $120 $182 $81 $201
Edmonton 1,377 $116 $147 $90 $161
Lethbridge 88 $115 $142 $87 $151
Red Deer 74 $115 $139 $87 $149
Lloydminster 28 $104 $128 $85 $163
SASKATCHEWAN
Yorkton 20 $115 $116 $79 $154
Prince Albert 22 $113 $137 $92 $130
Regina 456 $110 $143 $91 $148
Saskatoon 393 $110 $147 $86 $152
MANITOBA
Winnipeg 1,102 $102 $127 $79 $133
Brandon 57 $93 $127 $72 $134
18
2017 CPA Profession Compensation Study
ONTARIO/QUEBEC
Ottawa – Gatineau 1,718 $107 $129 $86 $136
ONTARIO
Sarnia 36 $134 $176 $98 $197
Toronto 5,963 $118 $167 $87 $180
Woodstock 24 $113 $134 $81 $142
Collingwood 21 $113 $128 $80 $141
Chatham-Kent 57 $108 $139 $85 $139
Hamilton 450 $105 $140 $85 $155
St. Catharines - Niagara 186 $105 $131 $83 $150
Oshawa 121 $105 $128 $90 $145
Brantford 52 $104 $142 $69 $145
Guelph 152 $104 $131 $80 $131
Kitchener 506 $103 $141 $82 $145
Kingston 85 $102 $120 $82 $136
Belleville 38 $101 $111 $74 $138
Windsor 138 $100 $135 $75 $155
London 399 $100 $126 $77 $130
Greater Sudbury / Grand Sudbury
109 $100 $111 $78 $117
Sault Ste. Marie 59 $95 $120 $81 $122
Peterborough 51 $95 $106 $73 $115
Barrie 82 $93 $118 $73 $134
North Bay 31 $92 $98 $78 $105
Thunder Bay 71 $91 $111 $75 $120
Stratford 34 $89 $112 $74 $115
Kawartha Lakes 20 $85 $115 $62 $122
QUEBEC
Val-d'Or 28 $108 $132 63 $161
Montréal 3,817 $105 $134 $79 $144
Rouyn-Noranda 33 $96 $134 $68 $156
Saint-Jean-sur-Richelieu 47 $95 $114 $60 $131
Saint-Hyacinthe 76 $92 $105 $66 $112
Québec 1,007 $89 $107 $72 $119

19
2017 CPA Profession Compensation Study
Rimouski 44 $90 $111 $68 $111
Saguenay 107 $85 $106 $63 $120
Saint-Georges 38 $85 $105 $59 $104
Trois-Rivières 130 $85 $96 $60 $113
Sherbrooke 163 $83 $99 $65 $108
Granby 51 $82 $104 $65 $115
Victoriaville 46 $81 $119 $57 $117
Joliette 29 $78 $84 $65 $93
Drummondville 72 $76 $100 $58 $111
NEW BRUNSWICK
Moncton 175 $86 $100 $69 $109
Saint John 173 $96 $140 $75 $130
Fredericton 131 $96 $107 $75 $123
NOVA SCOTIA
Halifax 515 $96 $118 $75 $130
Truro 20 $92 $101 $72 $119
Cape Breton 28 $88 $103 $77 $107
New Glasgow 36 $87 $120 $68 $121
PRINCE EDWARD ISLAND
Charlottetown 98 $89 $114 $70 $117
NEWFOUNDLAND AND LABRADOR
St. John's 300 $101 $124 $80 $134
Corner Brook 22 $79 $97 72 121
TERRITORIES
Whitehorse 25 $135 $143 $104 $150
Yellowknife 33 $134 $149 $119 $169

20
2017 CPA Profession Compensation Study
Compensation by Job Title among Non-Owners Professional accountants with the titles of Senior Vice President and President and/or CEO earned the
highest median compensation (each received $320K and $230K, respectively) with Non-Equity Partner
close behind with a median of $217K. Among companies with over 1,000 employees, President and/or
CEOs had significantly higher median compensation of $651K.
Table 5: Total Compensation by Job Title among Non-Owners ($ by 000’s)
TOTAL
n =28,155
Median Mean
Size of Employer By Number of Staff
<100
n =7,069
Median Mean
100 -999
n =7,747
Median Mean
1,000+
n =13,297
Median Mean
Senior Vice President $320 $408 $220 $276 $245 $340 $412 $507
President and/or CEO $230 $372 $175 $229 $265 $335 $651 $981
Non-Equity Partner $217 $226 $151 $180 $204 $217 $235 $251
Vice President $210 $254 $166 $195 $197 $226 $270 $313
Assistant Vice President $191 $196 - - $171 $170 $200 $206
Other Executive Management (COO, CIO, EVP, etc.)
$190 $293 $152 $194 $200 $259 $217 $415
Senior Director $160 $185 $120 $136 $140 $155 $175 $207
Chief Financial Officer (CFO) $157 $214 $137 $169 $165 $216 $194 $306
Principal $145 $162 $126 $135 $145 $177 $161 $171
Director $137 $159 $112 $127 $132 $142 $149 $178
General Manager $125 $146 $105 $121 $130 $144 $172 $190
Senior Manager $123 $136 $108 $115 $121 $135 $128 $143
Associate/Assistant Director $117 $125 $99 $113 $115 $128 $120 $127
Treasurer $113 $140 $89 $93 $115 $124 $175 $231
Professor/Lecturer/Teacher $112 $134 - - $105 $120 $125 $149
Project Manager $108 $132 - - - - $111 $140
Specialist $106 $117 - - - - $108 $119
Controller and/or Comptroller $106 $120 $95 $106 $110 $122 $125 $149
Advisor/Investment Advisor $102 $164 $124 $215 $94 $104 $103 $169
Team Leader $101 $107 - - $110 $114 $103 $107
Manager $100 $111 $89 $99 $100 $107 $104 $116
Consultant $100 $118 $95 $105 $110 $115 $100 $125

21
2017 CPA Profession Compensation Study
Supervisor $96 $105 $74 $82 $88 $105 $102 $109
Internal Auditor $95 $104 $103 $113 $90 $106 $95 $102
Tax Specialist $92 $103 $75 $89 $92 $105 $94 $104
Administrator $91 $115 $67 $117 - - $107 $101
Coordinator $91 $90 - - - - $94 $96
Financial Analyst $89 $90 - - $96 $99 $89 $89
Investigator $86 $105 - - - - $83 $88
Analyst $84 $90 $80 $95 $80 $85 $85 $91
Associate/Assistant Manager $83 $95 $80 $91 $82 $91 $85 $98
Assistant Controller $78 $92 $69 $73 $85 $100 - -
Senior Auditor/Accountant $75 $83 $69 $76 $76 $86 $80 $87
Finance officer $73 $90 - - - - $80 $87
Auditor/Accountant $68 $74 $60 $67 $67 $74 $75 $82
Junior Auditor/Accountant $53 $59 $48 $55 $56 $58 $56 $67
Other $105 $171 $93 $105 $123 $178 $103 $183
* 8 Non-Owners did not specify their Job Title
Compensation by Area of Focus among Non-Owners Members focusing in portfolio management have the highest median and average compensation per area
of focus for members, followed by investments. For focus areas with at least 100 members reporting,
marketing/sales is associated with the highest median compensation at $177K.
Table 5b: Compensation by Area of Focus among Non-Owners ($ by 000’s)
Count Median Mean Percentile
25
Percentile
75
Portfolio management 12 $290 $528 - -
Investments 55 $215 $343 $130 $412
Leadership 12 $192 $240 - -
Marketing/Sales 102 $177 $205 $110 $250
Business Development/Management 48 $168 $222 $129 $234
Strategy & Governance 1,544 $159 $225 $116 $237
Supply/Supply Chain 20 $158 $166 $114 $203
Restructuring 18 $156 $176 - -
Management/General Management 79 $155 $221 $107 $245
Operations 157 $155 $212 $103 $225

22
2017 CPA Profession Compensation Study
Procurement/Acquisition/Mergers/M&A 48 $154 $300 $91 $289
Consulting 59 $152 $161 $96 $205
Human Resources 34 $137 $193 $102 $191
Managing staff 1,132 $135 $194 $105 $200
Investigation 14 $132 $144 - -
Financial Planning/Financial Planning and
Analysis/FP&A/Wealth Management 76 $126 $199 $102 $212
Administration 31 $125 $127 $79 $160
Software 23 $125 $121 $90 $155
Regulatory 35 $121 $139 $99 $150
Insolvency 31 $120 $140 $95 $159
IT 167 $120 $156 $97 $162
Systems/System
Management/Integration/Implementation 33 $116 $123 $97 $145
ERP systems/implementation 15 $115 $117 - -
Education 58 $115 $122 $94 $137
Risk management/Control/Internal audit 1,010 $114 $143 $90 $152
Project (unspecified) 21 $113 $135 $95 $140
Compliance 23 $111 $120 $89 $135
Finance 5,840 $110 $146 $86 $157
Valuation 52 $110 $143 $85 $136
Contracts/Contracting 19 $108 $129 - -
Policy/Policy Analysis 21 $108 $117 $102 $130
Treasury 31 $108 $138 $85 $200
Advisory 47 $107 $169 $65 $185
Financial Systems/Financial Systems Support 36 $102 $108 $87 $122
Project Management 85 $102 $126 $90 $130
Financial and/or Non-Financial Reporting 6,862 $100 $121 $80 $134
Management Accounting 3,672 $100 $115 $80 $128
Taxation 2,206 $98 $120 $75 $132
Forensic/Forensic Accounting 46 $98 $121 $78 $117
Budget 50 $97 $104 $83 $114
Business Analysis/Intelligence 18 $94 $105
- -

23
2017 CPA Profession Compensation Study
Payroll 19 $93 $104 - -
Accounting/Bookkeeping 106 $86 $108 $65 $118
Audit and Assurance 3,495 $81 $94 $64 $105
Compilations 11 $74 $89 - -
*8 Non-Owners did not specify their Area of Focus
Compensation by Years of Post-Designation Work Experience There is a wide range of post-designation experience, with approximately a fifth of all members having 5
9 years of experience, the most common bracket. Those with 10-14 years of experience are the closest to
the total average at with a mean compensation of $147K.
Table 6: Total Compensation by Years of Work Experience
Count Median Mean Percentile 25 Percentile 75
Less than 3 years 4,464 $71 $84 $60 $88
3-4 years 3,668 $85 $96 $70 $104
5-9 years 6,896 $101 $118 $83 $130
10-14 years 4,344 $117 $147 $94 $161
15-19 years 3,690 $128 $169 $100 $186
20-24 years 2,980 $140 $198 $105 $210
25 years and over 5,278 $154 $223 $110 $240
Total 31,592 $107 $146 $82 $153
*272 members did not specify their Years of Work Experience

24
2017 CPA Profession Compensation Study
Section 2: Vacation, Leave, Benefits, and Work/Life Balance Vacation Entitlement
The bulk of professional accountants were entitled to a vacation of about 3-5 weeks (15 to 24 working
days) in 2016 with less than one in twenty (4%) entitled to fewer than 3 weeks (15 days). There is,
however, a gap in usage, with 17% of members having taken 14 days of vacation or less, despite being
entitled to more days.
Table 7: Vacation entitlement and vacation taken in 2016
Vacation Entitlement
Count %
Vacation Taken
Count %
Less than 10 working days 153 1% 1,095 4%
10-14 working days 1,075 4% 4,151 14%
15-19 working days 7,860 26% 9,261 31%
20-24 working days 12,162 40% 9,586 32%
25-29 working days 5,589 19% 3,956 13%
30-34 working days 2,567 9% 1,566 5%
35+ working days 656 2% 447 1%
Total 30,062 100% 30062 100%
*1,530 members did not specify both their Vacation Entitlement and Vacation Taken

25
2017 CPA Profession Compensation Study
Benefits by Employer Size among Non-Owners Medical benefits, life insurance, and long-term disability insurance are the most common benefits for
professional accountants – over 60% received them. Members in larger companies (100 or more
employees) were more likely than employees of smaller firms to receive medical benefits, life insurance,
long term disability insurance, and pension benefits.
Table 8a: Benefits by Number of Employees among Non-Owners, 2016
Count
Size of Employer By Number of Staff
<100
7,071
100 -999
7,747
1,000+
13,298
Total
28,158
Medical (health and dental) benefits 79% 86% 85% 84%
Life Insurance 62% 71% 69% 68%
Long Term Disability Insurance 57% 68% 67% 65%
Out of Country Travel Insurance 35% 45% 47% 44%
Defined Benefit Pension Plan 10% 26% 41% 29%
Group RRSPs 25% 31% 27% 28%
Defined Contribution Pension Plan 13% 26% 36% 28%
Parking 26% 27% 23% 25%
Health/Fitness Club Memberships 13% 21% 24% 20%
Professional Membership dues other than for my accounting designation(s)
13% 16% 17% 16%
Stock or Stock Options Purchase Program
6% 11% 22% 15%
Car Allowances 10% 13% 9% 10%
Deferred Profit Sharing Plans 4% 9% 11% 9%
Parental/ Maternal/ Caregiver Leave Top Ups
2% 5% 9% 6%
Credit Card Fees 1% 2% 3% 2%
Mobile phone 2% 1% 1% 1%
Education/ training/ professional development (PD) courses
1% 1% 1% 1%
Other 3% 4% 4% 4%
I did not receive any benefits 8% 3% 2% 4%
*168 Non-Owners were omitted from the benefits line of questioning, while 42 did not specify their size of employer by number
of staff

26
2017 CPA Profession Compensation Study
Benefits by Industry among Non-Owners Medical benefits, life insurance, and long term disability insurance are consistently the most offered type of benefit offered across Public Sector, Professional Services, and Financial Services. Defined benefit pension plans are considerably more likely to be offered in the Public Sector compared other industries, and least likely to be offered in Professional Services.
Table 8b: Benefits by Area of Practice and Number of Employees among Non-Owners, categories <1% overall are not shown
Count
Public Sector
<100 100 -999 1,000+
380 914 2,500
Professional Services
<100 100 -999 1,000+
1,787 613 1,698
Financial Services
<100 100 -999 1,000+
574 682 1,987
Medical (health and dental) benefits 87% 85% 86% 69% 80% 82% 85% 85% 84%
Life Insurance 74% 70% 65% 47% 54% 60% 63% 73% 69%
Long Term Disability Insurance 70% 70% 66% 45% 54% 59% 60% 67% 67%
Out of Country Travel Insurance 42% 41% 37% 18% 29% 42% 40% 45% 51%
Defined Benefit Pension Plan 56% 72% 80% 2% 4% 7% 16% 25% 50%
Group RRSPs 15% 5% 2% 18% 34% 46% 25% 29% 29%
Defined Contribution Pension Plan 25% 20% 12% 6% 20% 47% 23% 40% 36%
Parking 19% 23% 13% 24% 31% 29% 30% 31% 20%
Health/Fitness Club Memberships 11% 11% 5% 14% 43% 55% 23% 32% 27%
Professional Membership dues other than for my accounting designation(s)
19% 17% 12% 8% 12% 15% 25% 29% 24%
Stock or Stock Options Purchase Program
0% 0% 0% 0% 1% 0% 11% 20% 48%
Car Allowances 6% 5% 4% 7% 10% 9% 10% 10% 9%
Deferred Profit Sharing Plans 1% 0% 0% 2% 11% 13% 7% 12% 22%
Parental/ Maternal/ Caregiver Leave Top Ups
4% 9% 13% 2% 6% 10% 1% 7% 8%
Credit Card Fees 1% 0% 0% 0% 1% 2% 3% 5% 13%
Mobile phone 1% 0% 0% 2% 2% 2% 1% 1% 1%
Education/ training/ professional development (PD) courses
1% 1% 0% 1% 1% 0% 1% 0% 0%
Other 2% 3% 2% 2% 3% 4% 4% 6% 6%
I did not receive any benefits 3% 2% 2% 14% 2% 1% 5% 3% 1%

27
2017 CPA Profession Compensation Study
Benefits by Industry among Non-Owners (cont’d) Medical benefits, life insurance, and long term disability insurance are consistently the most offered type of benefit across Manufacturing, Oil & Gas, and Retail/Wholesale industries.
Table 8c: Benefits by Area of Practice and Number of Employees among Non-Owners
Count
Manufacturing
<100 100 -999 1,000+
566 927 1,006
Oil & Gas
<100 100 -999 1,000+
249 335 695
Retail/Wholesale
<100 100 -999 1,000+
437 497 600
Medical (health and dental) benefits 81% 88% 90% 86% 84% 86% 79% 85% 83%
Life Insurance 71% 74% 75% 70% 70% 75% 63% 73% 65%
Long Term Disability Insurance 61% 69% 71% 67% 66% 71% 59% 66% 62%
Out of Country Travel Insurance 44% 53% 56% 42% 44% 52% 42% 45% 42%
Defined Benefit Pension Plan 4% 10% 22% 7% 8% 29% 1% 7% 17%
Group RRSPs 36% 45% 36% 28% 50% 41% 28% 37% 35%
Defined Contribution Pension Plan 16% 30% 54% 11% 23% 51% 13% 28% 43%
Parking 19% 18% 27% 41% 34% 29% 17% 23% 27%
Health/Fitness Club Memberships 8% 15% 22% 23% 33% 30% 7% 15% 18%
Professional Membership dues other than for my accounting designation(s)
9% 11% 15% 18% 17% 19% 9% 11% 15%
Stock or Stock Options Purchase Program
7% 12% 23% 34% 32% 46% 3% 10% 31%
Car Allowances 13% 15% 13% 11% 13% 7% 17% 22% 17%
Deferred Profit Sharing Plans 9% 18% 18% 4% 11% 15% 6% 12% 21%
Parental/ Maternal/ Caregiver Leave Top Ups
1% 1% 5% 3% 4% 7% 1% 3% 6%
Credit Card Fees 2% 3% 3% 1% 1% 2% 2% 2% 2%
Mobile phone 1% 1% 1% 1% 0% 0% 2% 1% 1%
Education/ training/ professional development (PD) courses
1% 1% 1% 0% 1% 0% 1% 0% 1%
Other 1% 3% 2% 6% 5% 6% 2% 4% 4%
I did not receive any benefits 6% 2% 2% 4% 3% 2% 10% 3% 3%

28
2017 CPA Profession Compensation Study
Work/Life Balance among Non-Owners Internal professional development programs and flexible working hours were most commonly offered to
promote work/life balance. These were also the most commonly taken programs by members. Work
from home was offered by 55% of employers, but taken by 83% of those who were offered. This is echoed
across industry as seen in Table 9b.
Table 9a: Work/Life Balance Programs among Non-Owners
Work/Life Balance Programs
Offered
Count %
Taken
Count %
Internal Professional Development 19,234 69% 16,426 85%
Flexible working hours 19,081 68% 14,904 78%
Leaves for Personal Reasons 19,011 68% 8,129 43%
Funding of Externally Offered Professional Development
18,424 66% 13,627 74%
Employee Assistance Programs 18,123 65% 2,326 13%
Work from home 15,507 55% 12,854 83%
Time off for volunteer work 9,062 32% 4,412 49%
Compressed Work Weeks 6,656 24% 2,910 44%
Sabbaticals 5,431 19% 325 6%
Childcare benefits (subsidy, available on site etc.) 2,123 8% 225 11%
Other 1585 6% 817 52%
*168 Non-Owners were omitted from the Work/Life Balance Programs line of questioning

29
2017 CPA Profession Compensation Study
Work/Life Balance Programs Used by Industry among Non-Owners Internal professional development, flexible working hours, and work from home are the programs most
used by members in all six of the large industry groupings shown below.
Table 9b: Work/Life Balance Programs Used by Industry among Non-Owners
Count
Work/Life Balance Programs Used
Public
Sector
3,613
Professional
Services
3,688
Financial
Services
2,928
Manufact -
uring
2,150
Oil &
Gas
1,113
Retail/
Wholesale
1,281
Internal Professional Development 86% 90% 83% 84% 84% 85%
Flexible working hours 72% 82% 73% 82% 74% 82%
Leaves for Personal Reasons 59% 47% 36% 42% 23% 43%
Funding of Externally Offered Professional Development
76% 69% 68% 74% 68% 73%
Employee Assistance Programs 15% 12% 13% 13% 12% 13%
Work from home 71% 84% 83% 88% 76% 87%
Time off for volunteer work 57% 52% 44% 41% 47% 47%
Compressed Work Weeks 48% 40% 23% 47% 54% 57%
Sabbaticals 5% 7% 5% 5% 3% 10%
Childcare benefits (subsidy, available on site etc.)
11% 6% 12% 16% 12% 11%
Other 49% 57% 45% 47% 65% 62%
*Counts shown include members in each specific industry that indicated they used at least one Work/Life Balance Program –
base sizes vary dependent on programs used and industry
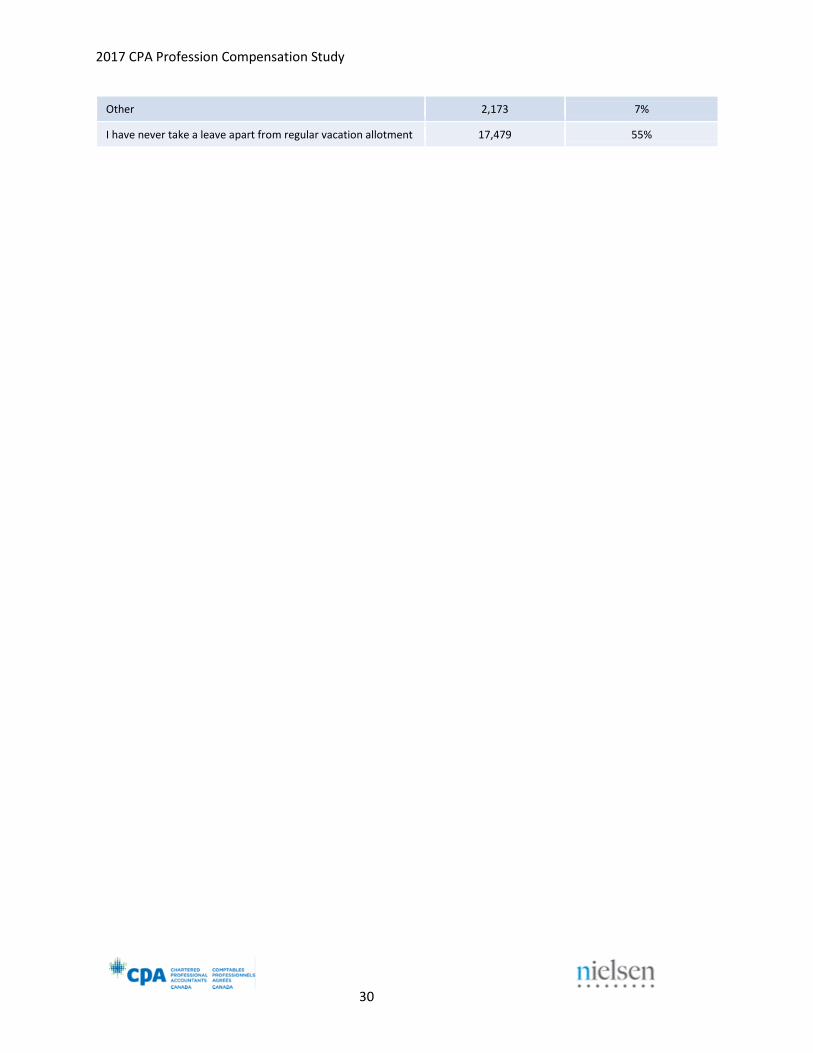
Leaves Slightly less than half of all members (45%) have taken any kind of leave in their careers. The most
common leave taken by members is maternity/paternity/parental leave at 28%, followed by medical leave
at 16%.
Table 9c: Leave taken
Type of Leave Taken
Count %
Maternity/paternity/parental leave 8,742 28%
Medical leave 4,924 16%
Compassionate care leave/additional time beyond amount of time legally allotted to care for sick family members
1,271 4%
Sabbatical leave 721 2%
2017 CPA Profession Compensation Study
Other 2,173 7%
I have never take a leave apart from regular vacation allotment 17,479 55%
30


![CPA Vision project · CPA Vision Project [ 1 ] The CPAVision Project 2011 and Beyond The CPAVision Process is an unprecedented, profession-wide initiative undertaken by one of the](https://img.pdfslide.us/doc/110x75/5afbd1d17f8b9a446590d1be/cpa-vision-vision-project-1-the-cpavision-project-2011-and-beyond-the-cpavision.jpg)