Embed Size (px)
Citation preview

APRIL 23
SANTA CLARA VALLEY TRANSPORTATION
AUTHORITY
Authored by: John Sighamony
2017 CMP MONITORING & CONFORMANCE REPORT

TABLE OF CONTENTS EXECUTIVE SUMMARY 1
1 | INTRODUCTION 5
2 | LAND USE 7
3 | USING BIG DATA 17
4 | FREEWAY FINDINGS 26
5 | GATEWAYS 61
A | APPENDIX 70

LIST OF TABLES TABLE 1.1 | Level of Service (LOS) Standards 6
TABLE 2.1 | Commercial and Industrial Job Densities (JOBS PER 1,000 SQ. FT.) 8
TABLE 2.2 | Approved Residential Units, 2012-2017 10
TABLE 2.3 | Job Change Estimates Based on Commercial/Industrial Approvals, 2012-2017 11
TABLE 2.4 | Land Use Approvals Near Cores, Corridors and Station Areas, 2014-2017 12
TABLE 3.1 | Freeway Level of Service Definitions 19
TABLE 4.1 | Exempt Mixed-Flow Segments Operating at LOS F in 2017 (AM PEAK) 28
TABLE 4.2 | Exempt Mixed-Flow Segments Operating at LOS F in 2017 (PM PEAK) 31
TABLE 4.3 | Non-Exempt Mixed-Flow Segments Operating at LOS F in 2017 (AM PEAK) 34
TABLE 4.4 | Non-Exempt Mixed-Flow Segments Operating at LOS F in 2017 (PM PEAK) 40
TABLE 4.5 | Total HOV Miles with LOS F Categorized by Freeway Facility 46
TABLE 4.6 | HOV Segments at LOS F – AM Peak Period 47
TABLE 4.7 | HOV Segments at LOS F – PM Peak Period 51
TABLE 5.1 | AM Peak Hour Inflow and Outflow Comparison Between 2016 & 2017 63
TABLE 5.2 | PM Peak Hour Inflow and Outflow Comparison Between 2016 & 2017 66

LIST OF FIGURES
Figure 2.1 | Approved Land Use Changes, 2013-2017 9
Figure 2.2 | Approved Residential Units Near VTA’S Cores, Corridors and Station Areas (2015 Net Change)
13
Figure 2.3 | Job Change Estimates Near VTA’s Cores, Corridors, and Station Areas (2015 Net Change)
14
Figure 2.4 | Residential Approvals Near VTA’s Cores, Corridors, and Station Areas (2012-2017) 15
Figure 2.5 | Job Change Estimates Near VTA’s Cores, Corridors, and Station Areas (2012-2017) 16
Figure 3.1 | Speed Density Curve 21
Figure 4.1 | 2017 Freeway Mixed-Flow Lane Mile Operation 27
Figure 4.2 | 2017 Freeway HOV Lane Mile Operation 45
Figure 4.3 | Santa Clara Freeway Congestion Stratified by Duration of Congestion 55
Figure 4.4 | Santa Clara Freeway Congestion Duration as a Percent of Total Dir. Miles 56
Figure 4.5 | Congestion Duration as a Percent of Total Dir. Miles (SR 87 & 237) 57
Figure 4.6 | Congestion Duration as a Percent of Total Dir. Miles (SR 17 & I-280)
58
Figure 4.7 | Congestion Duration as a Percent of Total Dir. Miles (I-880 & I-680) 59
Figure 4.8 | Congestion Duration as a Percent of Total Dir. Miles (SR 85 & US 101) 60
Figure 5.1 | AM Peak Hour Gateway Inflows, 2010-2017 64
Figure 5.2 | AM Peak Hour Gateway Outflows, 2010-2017 64
Figure 5.3 | 2017 AM Gateway Inflow vs. Outflow 65
Figure 5.4 | PM Peak Hour Gateway Inflows, 2010-2017 67
Figure 5.5 | PM Peak Hour Gateway Outflows, 2010-2017 67
Figure 5.6 | 2017 PM Gateway Inflow vs. Outflow 68


2017 MONITORING AND
CONFORMANCE REPORT
EXECUTIVE SUMMARY

Executive Summary Introduction
State Statute 65089 requires Congestion Management Agencies (CMAs) to conduct analysis of all
Congestion Management Program (CMP) roadways every two years to ensure Member Agencies –
the cities, towns and county – are developing in a manner consistent with the CMP level of service
standard of Level of Service (LOS) E. As the responsible CMA for Santa Clara County, the Valley
Transportation Authority (VTA) undertakes this analysis on an annual basis. VTA prepares the annual
Monitoring and Conformance Report which documents the CMP conformance findings.
The scope of data collection is reduced every other year during odd‐numbered years to minimize the
costs of analyzing the CMP network annually. During the “off‐years,” the reduced scope of work
includes only land use and freeway level of service data, and Deficiency Plan Status Reports. All other
CMP elements are collected biennially as part of the full scope.
The 2017 Monitoring and Conformance Report features the reduced scope of data collection and
analysis of each CMP element. The following summarizes the results of the 2017 Monitoring
Program.
Land Use
VTA’s Member Agencies, the cities, towns and County of Santa Clara, submit land use data to VTA in
the form of residential and commercial/industrial project approvals for the prior fiscal year. The data
reflects changes in residential dwelling units for approvals as well as estimate changes in
commercial/industrial job approvals. Job change estimates are determined by applying job density
values to square footage and land use type of commercial/industrial projects in order to estimate
how many jobs are likely created or lost as a result of the land use approval.
All Member Agencies submitted land use data as required. Compared with 2016, commercial and
industrial approvals in 2015 resulted in an estimated decrease of 3,048 jobs. In 2017 Member
Agencies approved 5,918 residential units, representing decrease from 2016 of 1,407. Nearly half of
the total residential units and one quarter of jobs approved were nears VTA’s Cores, Corridors and
Station areas. This represents moderate decrease from 2016.
Transition to Big Data
Since 1997, VTA has used aerial photography to collect traffic data for freeway segments on a limited
number of days. To address the limited data that could be obtained from aerial photography and to

make use of commercially available data sources, VTA decided to switch from aerial photography to
Big Data. With Big Data, VTA is able to get much more refined data that is based on speed and can
capture multiple days of information. VTA worked through the Systems Operations & Management
(SOM) Working Group to develop a methodology for using Big Data through data provided by INRIX.
INRIX is one of the leading providers of real‐time, historical, and predictive traffic information. The
travel speed data collected by INRIX covered the entirety of Santa Clara County’s freeway system and
was reported for 513 roadway segments called Traffic Message Channels (TMC). INRIX reports the
travel speed and travel time data for each TMC.
Freeway
Santa Clara County has approximately 155 miles of freeway, which constitute roughly 310 directional
miles over eight freeways. These 310 directional miles can be divided into two groups: mixed flow
and High Occupancy Vehicle (HOV) miles. Mixed flow miles account for all 310 miles of freeway in
Santa Clara County, while the HOV miles account for 188 miles of freeway. The VTA annual CMP
monitoring study monitors both the mixed flow and HOV miles for vehicle speeds and density along
all freeways within the county. All freeways were evaluated during both the AM and PM peak
periods. The primary findings of the freeway evaluation include:
Mixed‐Flow Lanes
108 miles (35%) operate at LOS F (speeds less than 30 mph) for at least 15 minutes between
5:00 AM and 12:00 Noon. 97 miles (31%) operate at LOS F for at least 15 minutes between
noon and 9:00 PM.
The percentage of miles operating at LOS D, E, or F (speeds less than 62 mph) for at least 15
minutes were about 82% during the AM period and 71% for the PM period.
Of the 108 congested freeway miles during the AM period, 20.4 miles are congested for less
than an hour, 59.2 miles are congested for one to three hours, and 28.3 miles are congested
for more than three hours.
During the PM period, 13.4 miles are congested for less than one hour, 34.2 miles are
congested one to three hours, and 49.5 miles are congested more than three hours.
High‐Occupancy Vehicle (HOV) Lanes
56 miles (30%) operate at speeds less than 30 miles per hour during the AM period and 49
miles (26%) operate at less than 30 miles per hour for the PM period.
The percentage of HOV directional miles operating at LOS D, E, or F (speeds less than 62 miles
per hour) were 50% and 55% for the AM and PM periods, respectively.

Gateway Volumes
Compared to 2016, the 3‐hour counts for vehicles entering Santa Clara County during the AM
period decreased by 2.5% but are similar to what was recorded in 2015.
Vehicles exiting Santa Clara County during the AM 3‐hour period increased by about 1,300
vehicles or 1.8%.
Vehicles entering and exiting Santa Clara County during the PM 3‐hour period both increased
by 2.2% and 0.5%, respectively compared to 2016.
Conformance Findings
The 2017 Monitoring and Conformance Report find all Member Agencies in compliance with the CMP
monitoring requirements.

2017 MONITORING AND
CONFORMANCE REPORT
CHAPTER 1 INTRODUCTION
Chapter One - Introduction Level of Service
Traffic congestion is monitored on the CMP roadway network which is comprised of freeways, state
highways, expressways and principal arterials. Congestion is monitored in terms of level of service
(LOS), a sliding scale from A though F where LOS A represents best traffic flow and LOS F represents
significant traffic delay. Santa Clara County’s LOS standard is LOS E. Table 1.1 provides a description
of LOS standards.
TABLE 1.1 | LEVEL OF SERVICE DESCRIPTION
Level of Service Description
A | B | C Traffic can move relatively freely without significant delay
D Delay becomes more noticeable
E Traffic volumes are at or close to capacity, resulting in significant delays and average speeds that are no more than about one‐third the uncongested speed
F Traffic demand exceeds available capacity. Very slow speeds (stop‐and‐go), long delays (over one minute) and standing queues at signalized intersections.
Conformance Standard
To comply with the CMP standard, Member Agencies must demonstrate that all CMP roadways
(excluding freeways) within their jurisdictions are operating at or above the CMP traffic level of
service standard of LOS E. Member Agencies that do not maintain the CMP LOS standard risk having
their Proposition 111 (1991) gas tax subvention withheld. If the LOS standard cannot be met, a
deficiency plan must be approved by VTA. Freeway segments and CMP intersections that operated at
LOS F when monitoring began in 1991 are exempt from meeting the LOS E standard. Freeway LOS
thresholds are taken from the Highway Capacity Manual with the exception of D/E and E/F thresholds
which are selected by VTA for Santa Clara County conditions.
2017 Monitoring and Conformance Report 6 4/23
2017 MONITORING AND
CONFORMANCE REPORT
CHAPTER 2 LAND USE
Chapter Two – Land Use Introduction
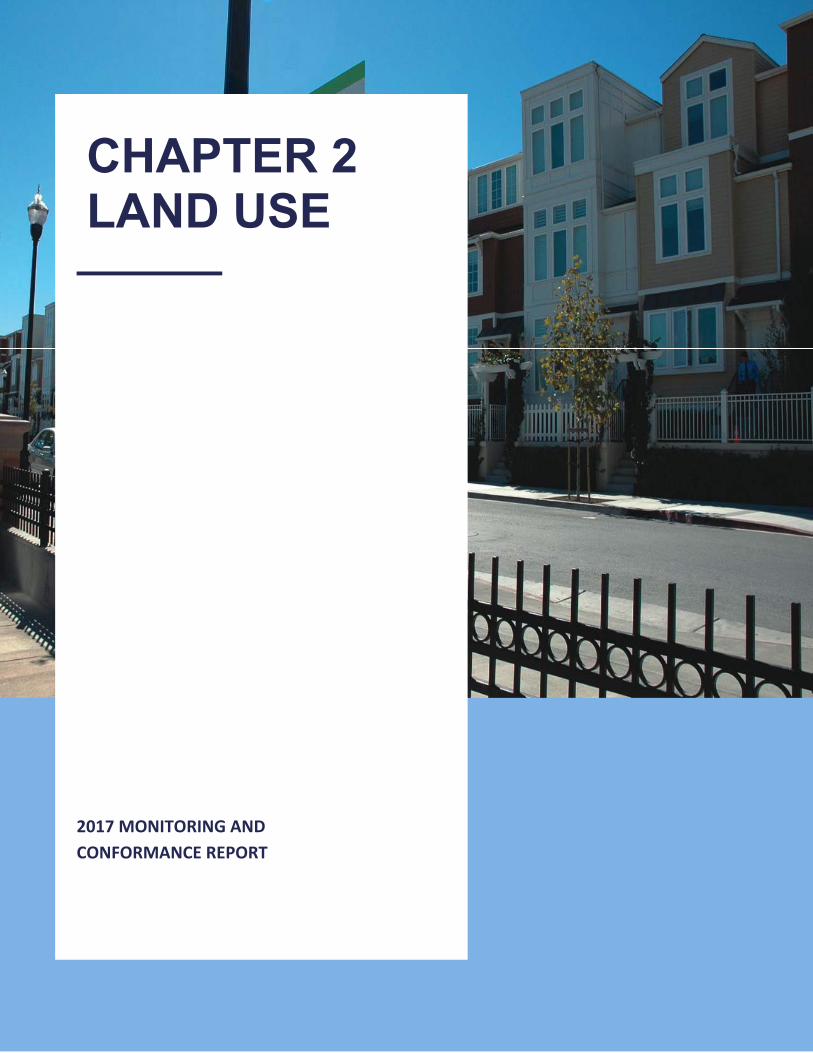
California State CMA legislation requires Congestion Management Agencies to monitor land use
changes within its jurisdiction. Each year, VTA monitors land use changes within Santa Clara County
by requesting land use data from Member Agencies in terms of residential and commercial/industrial
projects that have been approved.
Methodology
VTA collects land use data from Member Agencies each year to track decisions jurisdictions are
making about land use. Member Agencies submit land use data for the prior fiscal year in the form of
changes in dwelling units for residential approvals and changes in square footage for commercial and
industrial approvals. This data is limited to tracking approvals only if those approvals do not result in
construction during the reporting year or at all.
For commercial and industrial approvals, changes in square footage are used to estimate the number
of jobs created or lost. Jobs are estimated by applying a job density value (measured in jobs per
1,000 sq. ft.) to the size of the site. Job density values vary depending on the specific land use type.
The appropriate job density is multiplied by the square footage of each site to determine the number
of estimated jobs. Table 2.1 shows the job density values per type of land use.
TABLE 2.1 | COMMERCIAL AND INDUSTRIAL JOB DENSITIES (JOBS PER 1,000 SQ. FT.)
Density Land Use
3.4 Office/Educational/Institutional/Hospital
3.1 Transportation
2.5 R&D Office
2.0 Hotel/Motel
1.75 Retail/Manufacturing
0.75 Non‐Manufacturing
0 Park/Recreation/Agriculture/Cemetery/Urban Reserve
The focus of VTA’s land use analysis are development approvals that provide the capacity to
accommodate population and employment growth. The data is not a reflection in actual changes in
residents or job creation. Rather, it is a measure of the trend in allocation of land for different
purposes. In addition to the analyses included in this report, the data can be used to understand the
current and projected demand in housing and employment. To better understand the employment
data it is helpful to understand limitations that affect the data quality but are beyond the control of
VTA and the Member Agencies:
2017 Monitoring and Conformance Report 8 4/23

It is assumed commercial and industrial sites were fully occupied for employment uses.
It is assumed that all jobs that can be accommodated on the existing site are lost when a
commercial or industrial site is converted to a different type of land use. Under this
methodology, commercial/industrial sites that are either underutilized or unoccupied assume
a full reduction in employment even if few or any jobs are actually lost. To compensate for
this, VTA requests Member Agencies to indicate in their land use data submittal whether jobs
were lost during conversions to a different use. Since not all Member Agencies provided this
data, our methodology assumes full employment for commercial/industrial conversions,
which may negatively impact the job change estimate for 2017.
Despite these limitations, the analysis provides valuable information to illustrate the trend of land use
development and where housing and employment growth is likely to occur, and where Member
Agencies are actually targeting growth.
Land Use Approvals
As shown in Table 2.2, Member Agencies approved 5,262 residential units in 2017, a moderate
decrease from the previous year when 9,630 units were approved. Notably, the Cities of Mountain
View and Sunnyvale saw a large increase in approvals in 2017. San Jose and Santa Clara saw land use
approvals trend downwards, although they still maintained the most number of residential approvals
in the County.
4,012
12,670
7,377
28,644
5,918
25,136
9,630
24,247
5,262
20,014
0
5,000
10,000
15,000
20,000
25,000
30,000
35,000
Dwelling Units Approved Estimated Jobs Approved
Approved Land Use Changes, 2013‐2017
2013 2014 2015 2016 2017
Figure 2.1 Approved Land Use Changes, 2013‐2017
2017 Monitoring and Conformance Report 9 4/23

TABLE 2.2 | APPROVED RESIDENTIAL UNITS, 2012‐2017
As shown in Table 2.3, commercial and industrial approvals in 2017 resulted in an estimated net
decrease of 20,014. Compared to the previous year, job change estimates have decreased by
approximately 4,233 when 24,247 jobs were estimated in 2016. While this is considered a moderate
decrease, the figures still rank fairly high since the past five years. There has been considerable
growth in Sunnyvale due to the Peary Park Development, in Santa Clara due to the growth at the City
Place site, and in San Jose where there continues to be redevelopment in the downtown core and on
North First Street.
Member Agency 2012 2013 2014 2015 2016 2017
Campbell 195 12 21 273 23 24
Cupertino 0 ‐30 15 15 788 19
Gilroy 101 278 350 646 810 810
Los Altos 204 20 0 4 4 27
Los Altos Hills 1 7 0 3 20 0
Los Gatos 116 20 23 53 6 18
Milpitas 2,243 793 466 857 0 177
Monte Sereno 0 0 0 0 0 0
Morgan Hill 268 544 103 241 372 84
Mountain View 298 537 399 1,051 277 344
Palo Alto 1 2 311 18 38 15
San Jose 536 729 3,182 2,112 4,127 1,662
Santa Clara 48 140 1,363 572 2,512 1,117
Santa Clara County 2 8 0 0 0 0
Saratoga 321 583 0 0 0 13
Sunnyvale 0 369 1,144 73 653 952
Total 4,334 4,012 7,377 5,918 9,630 5,262
2017 Monitoring and Conformance Report 10 4/23

TABLE 2.3 | JOB CHANGE ESTIMATES BASED ON COMMERCIAL/INDUSTRIAL APPROVALS, 2012‐2017
PROXIMITY TO CORES, CORRIDORS, AND STATION AREAS
In 2003, VTA in partnership with Member Agencies developed the Community Design &
Transportation (CDT) program to craft best practices for land use and transportation. The CDT
program established a framework of Cores, Corridors and Station Areas as priority areas identified by
VTA and Member Agencies for targeting future growth and transportation investments. These areas
are most likely to benefit from concentrated development due to its location near major transit
corridors.
Spatial analysis was conducted on the land use data submitted by Member Agencies to determine the
proximity of approved developments to the Cores, Corridors and Station Areas. Proximity is defined
as a 1/3 mile within major transit stations and ¼ mile buffer from the cores, and future Bus Rapid
Transit (BRT) corridors. The purpose of the spatial analysis is to illustrate where housing and
employment growth is likely to occur and trend over time.
As shown in Table 2.4, there were 5,262 total residential units approved in 2016. Of these, 2,421
residential approvals, or 46 percent were located within the Cores, Corridors and Station Areas. This
is an increase from 2016 when 37 percent of the potential growth in housing was planned near the
targeted areas for development.
Member Agency 2012 2013 2014 2015 2016 2017
Campbell ‐140 0 9 ‐120 6 445
Cupertino 432 277 700 21 144 5
Gilroy 0 39 639 10 250 250
Los Altos 50 211 0 19 1 ‐6
Los Altos Hills 0 0 0 0 0 0
Los Gatos 70 555 23 12 2 9
Milpitas ‐1,176 ‐399 0 0 0 18
Monte Sereno 0 0 0 0 0 0
Morgan Hill 0 57 0 968 170 133
Mountain View 798 1,151 2,304 1,698 3,017 3,017
Palo Alto 585 924 ‐993 1,840 1,809 1,257
San Jose 1,247 4,211 7,913 3,510 6,215 6,325
Santa Clara 2,583 3,394 13,700 14,245 5,733 2,090
Santa Clara County 0 1,071 318 1,302 0 304
Saratoga 2,524 0 0 0 0 0
Sunnyvale 80 1,179 4,031 1,631 6,900 6,167
Total 7,053 12,670 28,644 25,136 24,247 20,014
2017 Monitoring and Conformance Report 11 4/23

Of the 20,014 estimated jobs due to commercial/industrial development, 5,004 jobs or 25 percent
were located within the Cores, Corridors and Station Areas. This is a decrease from 2014 when 41
percent of the commercial/industrial approvals were within the Cores, Corridors and Station Areas.
TABLE 2.4 | LAND USE APPROVALS NEAR CORES, CORRIDORS AND STATION AREAS, 2014‐2017
2017 2016 2015 2014
Residential Unit Approvals within CCSAs 2,421 3,586 2,755 2,855
Total Units 5,262 9,630 5,918 7,325
% near CCSAs 46% 37% 47% 66%
Job Change Estimates within CCSAs 5,004 9,929 5,442 2,610
Total Estimated Jobs 20,014 24,247 25,136 28,644
% near CCSAs 25% 41% 22% 37%
2017 Monitoring and Conformance Report 12 4/23
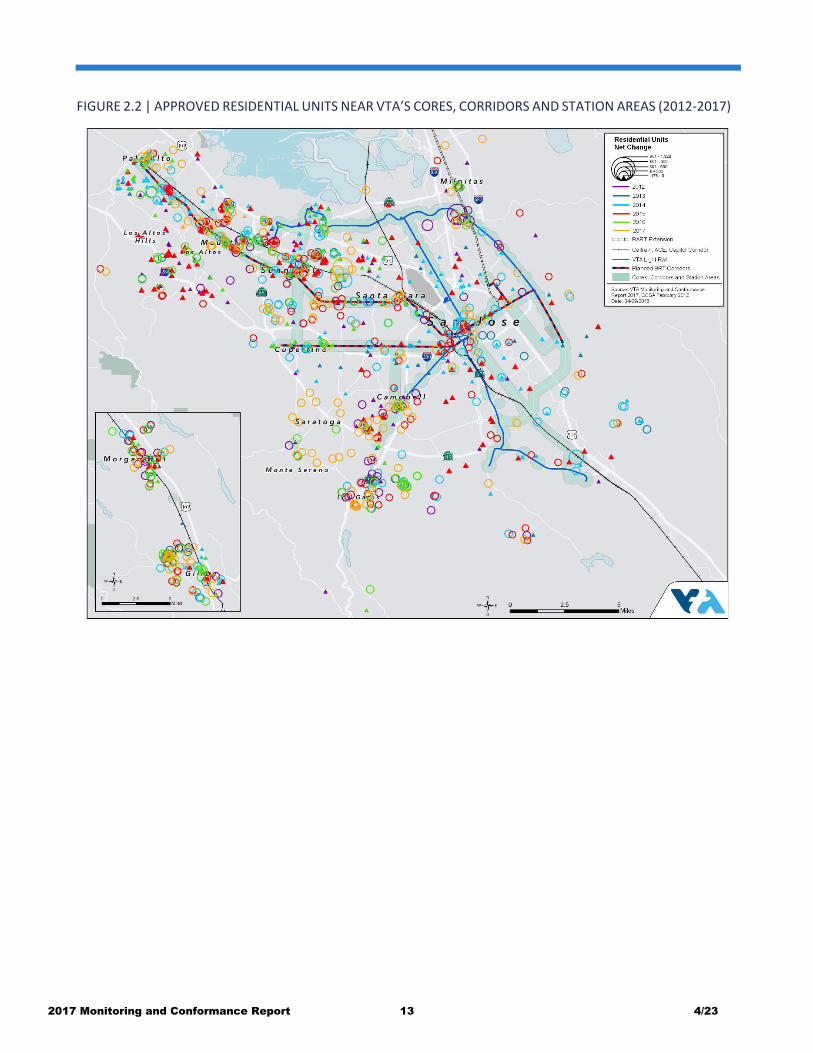
FIGURE 2.2 | APPROVED RESIDENTIAL UNITS NEAR VTA’S CORES, CORRIDORS AND STATION AREAS (2012‐2017)
2017 Monitoring and Conformance Report 13 4/23

FIGURE 2.3 | APPROVED RESIDENTIAL UNITS NEAR VTA’S CORES, CORRIDORS AND STATION AREAS (2017 NET
CHANGE)
2017 Monitoring and Conformance Report 14 4/23

FIGURE 2.4 | JOB CHANGE ESTIMATES NEAR VTA’S CORES, CORRIDORS AND STATION AREAS (2012‐2017)
2017 Monitoring and Conformance Report 15 4/23

FIGURE 2.5 | JOB CHANGE ESTIMATES NEAR VTA’S CORES, CORRIDORS AND STATION AREAS (2017 NET
CHANGE)
2017 Monitoring and Conformance Report 16 4/23
2017 MONITORING AND
CONFORMANCE REPORT
CHAPTER 3 USING BIG DATA

Chapter 3 – Using Big Data Performance Measures
Performance measures are a critical component of the CMP. Levels of acceptable transportation
system performance vary among state and local agencies. Therefore, performance measures must be
tailored to the specific needs of each area or jurisdiction and established in cooperation with the
state agencies as well as the local agencies within the area boundaries. For the CMP, the quality of
traffic service is based on performance measures such as speed and/or traffic density. The Highway
Capacity Manual (HCM) defines level of service (LOS) as a quantitative stratification of performance
measures that represent quality of service. The HCM also notes that the density is the official
performance measure of freeway LOS as measured in passenger cars per mile per lane.
Level of Service (LOS)
Santa Clara VTA has adopted freeway LOS thresholds based on traffic density. The thresholds are
from the HCM 2000 density values from LOS A through LOS C. For LOS D through F, the HCM
thresholds have been modified to better describe local conditions in Santa Clara County. A related
performance measure to density is travel speed which may be easier to understand from the driver’s
perspective. LOS A represents the best travel conditions from the driver’s perspective where
roadways are free flow, and LOS F represents congested or stop‐and‐go conditions.
Table 3.1 lists the level of service descriptions used for freeway segments and the corresponding
density thresholds. This table also shows the approximate speed thresholds related to the density
ranges. These speed thresholds and their relationship to density and LOS are based on data collected
at four freeway locations in Santa Clara County in 2013.
In this study, the LOS determinations are based on travel speed data for both mixed flow and HOV
lanes. However, density and flow are also estimated based on a mathematical relationship between
speeds, density, and flow calibrated to Santa Clara County conditions.
Duration of Congestion
One of the goals of the CMP is to improve the reliability of the transportation system. The variability
or change in congestion on a day‐to‐day basis provides a measure of reliability. There are two types
of congestion: recurring and non‐recurring congestion. Recurring congestion is generally predictable,
regularly occurring, and typically caused by excess demand compared to the capacity of the freeway
system. Non‐recurring congestion is caused by traffic crashes, weather conditions, work zones, or
special events. This study calculated the recurrent traffic congestion which refers to recurring delays
during commute hours when vehicle demand exceeds capacity on certain freeways and/or routes in
the county.

The duration of recurring congestion was calculated for each freeway segment using the LOS
standards and the reported travel speeds. For any segment, the time interval for which travel speed
was less than 30 miles per hour (i.e. LOS F) was classified as a “congested time interval.”
TABLE 3.1 – FREEWAY LEVEL OF SERVICE DEFINITIONS
Level of Service
Density (passenger cars/mile/lane)
Travel Speed (MPH) Description
A ≤ 11 ≥ 67 Free Flow. Vehicles are completely unimpeded in their ability to maneuver within the traffic stream. The effects of minor incidents are easily absorbed.
B 11 < density ≤ 18 65 ≤ speed < 67
Reasonably Free Flow. The ability to maneuver within the traffic stream is only slightly restricted, and the general level of physical and psychological comfort provided to drivers is still high. The effects of minor incidents are easily absorbed.
C 18 < density ≤ 26 62 ≤ speed < 65
Stable Flow. Flows are approaching the range where small increases in traffic flows will cause substantial deterioration in service. Freedom to maneuver within the traffic stream is noticeably restricted, and lane changes require additional care and vigilance by the driver. Minor incidents may still be absorbed, but the local deterioration in service will be substantial. Queues may be expected to form behind any significant blockage.
D 26 < density ≤ 46 42 ≤ speed < 62
Unstable Flow. Small increases in traffic flows cause substantial deterioration in service. Freedom to maneuver within the traffic stream is severely limited, and the driver experiences drastically reduced physical and psychological comfort levels. Even minor incidents can be expected to create substantial queuing because the traffic stream has little space to absorb disruptions.
E 46 < density ≤ 58 30 ≤ speed < 42
Capacity Flow. Operations are extremely unstable, because there are virtually no usable gaps in the traffic stream. Any incident can be expected to produce a serious breakdown with extensive queuing.
F > 58 < 30
Forced Flow. Level of service F describes forced or breakdown flow. Such conditions generally exist within queues forming behind breakdown points. Such breakdowns occur for a number of reasons: a temporary reduction in capacity caused by a traffic incident, or a recurring point of congestion caused by a merge, a weave segment, or lane drop.
Source: Density thresholds are from the “Traffic Level of Service Analysis Guidelines,” Santa Clara VTA Congestion Management Program, 2003. Speed thresholds, rounded to the nearest whole number, were estimated based on the mathematical relationship between density and speed calibrated to Santa Clara County conditions based on data collection in the Fall of 2013.

Density‐Speed‐Flow Relationship
According to traffic flow theory, freeways can carry the highest volumes when traffic is moving at
speeds between 30 and 35 miles per hour (mph). Above this speed, the increasing gaps between
vehicles results in a decrease in the density of cars and, therefore, the flow. Below this speed, the
traffic stream is dense, but does not move fast enough to produce optimal flow. Therefore, travel
speeds less than 30 to 35 mph may indicate that the freeway segment is operating under congested
conditions and that any traffic count observed during the peak hour may not represent the actual
traffic demand. To determine the relationship between density, speed, and volumes, data must be
collected and calibration of the relationships established.
Data Collection
Prior to the 1997 CMP Monitoring and Conformance Report, floating vehicle survey techniques were
used to collect the travel speed data needed to monitor freeway operations. In addition to the travel
speed data, mainline freeway traffic counts were manually collected for HOV and mixed flow lanes at
40 locations during the PM peak period. A combination of travel speed and mainline volumes enabled
the estimation of vehicle density.
Beginning in 1997 until 2016, aerial photography techniques were used to collect traffic data for
freeway segments, a technique that allows direct measurement of density. Travel speeds and flow
volumes were then estimated using a mathematical relationship between density, speed, and flow.
While aerial photography was the most precise method for collecting freeway density measurements,
the expense of flying airplanes limited the amount of data that could be collected to only one or two
days per year.
To address the limited data that could be obtained from aerial photography and to make use of
commercially available data sources, the 2017 CMP used INRIX speed data. INRIX is one of the leading
providers of real‐time, historical, and predictive traffic information. INRIX works by combining
anonymous, real‐time GPS probe data from more than 70 million devices of commercial fleet,
delivery, taxi vehicles, and smart phone users across the U.S. (INRIX, 2012). This data source allows
Santa Clara VTA to look at a full year of travel speed information at 15‐minute intervals for all
freeway miles in the county.
Speed Model Calibration
Density, speed, and volume are mathematically related and knowing any two of them will allow the
calculation of the third. If an analyst only has one of the three types of data, a mathematical
relationship is needed to estimate the other two. Between 2001 and 2016, the CMP used the Van
Aerde equation to develop a speed‐density curve to estimate speed and vehicle flow from the aerial
photography density measurements. This Van Aerde equation was calibrated to conditions near
Washington D.C. around the year 2000 and at that time was found to reasonably represent
conditions in Santa Clara County.
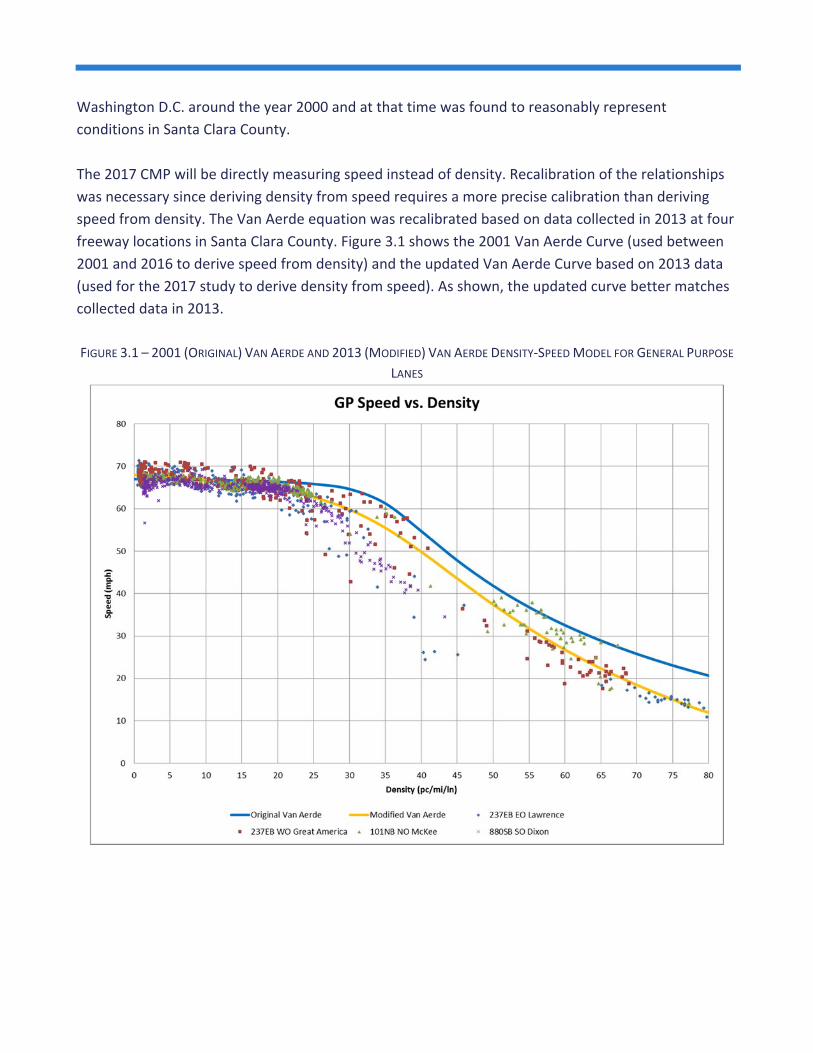
The 2017 CMP will be directly measuring speed instead of density. Recalibration of the relationships
was necessary since deriving density from speed requires a more precise calibration than deriving
speed from density. The Van Aerde equation was recalibrated based on data collected in 2013 at four
freeway locations in Santa Clara County. Figure 3.1 shows the 2001 Van Aerde Curve (used between
2001 and 2016 to derive speed from density) and the updated Van Aerde Curve based on 2013 data
(used for the 2017 study to derive density from speed). As shown, the updated curve better matches
collected data in 2013.
FIGURE 3.1 – 2001 (ORIGINAL) VAN AERDE AND 2013 (MODIFIED) VAN AERDE DENSITY‐SPEED MODEL FOR GENERAL PURPOSE
LANES

Data Processing
Mixed Flow Lanes
The commercial speed data collected by INRIX for 2017 was used as the source for the 2017 CMP
analysis. The travel speed data covered the entirety of Santa Clara County’s freeway system and was
reported for 513 roadway segments called Traffic Message Channels (TMC). INRIX reports the travel
speed and travel time data for each TMC.
Segmentation for previous CMP studies was generally based on easily observable landmarks such as
freeway overpasses. The endpoints for TMC segments are generally the merge and diverge points for
ramps on the freeway rather than the overpasses. Consequently, the TMC segments used in this 2017
study are more detailed than the previous segmentation, allowing for more resolution of the
locations and duration of congestion. It should also be noted that the ends of CMP segments do not
generally align with the ends of the TMC segments. Hence, a TMC segment is either partially or fully
contained within the prior CMP segment.
The open source software R was used for INRIX data processing in this study. This software is widely
used for managing medium size quantities of data, as was the case with this study.
The INRIX data processing for mixed flow lanes consisted of five steps described below.
1. Filter raw data
2. Calculate the 20th percentile speed (i.e. equivalent to 80th percentile travel time)
3. Determine LOS based on travel speeds
4. Calculate the duration of congestion.
Filter Raw Data
The travel speed data from INRIX for all freeway TMC segments in Santa Clara County were extracted
based on the “data quality scores.” INRIX includes a data quality score that accompanies every INRIX
data point:
A score of 30 includes data obtained from real‐time sources;
A score of 20 includes data obtained from a mix of real‐time and historical sources; and
A score of 10 includes data generated exclusively from historical sources.
The travel speed information for all freeway TMC segments that had a score of 30 for the year 2017
was compiled for all the freeways. It was observed that all the freeways had very few or no missing
data for TMC segments using the real time data (score of 30) except for SR 85 Southbound. Since SR
85 Southbound did not have enough real‐time data, the threshold was lowered so that both real‐time
and historic data were used for SR 85 Southbound.

In addition to the travel speed data for each TMC segment, other reported statistics include link
identifier, i.e. TMC code, road number for each TMC code categorized by the facility, start and end
GPS coordinate information for the TMC segment, length of the TMC segment, and travel time for
each TMC segment. These statistics are reported for each 15‐minute time interval throughout the
day, i.e. for 24 hours. After extracting the INRIX data for a year (12 months) for all freeways within
Santa Clara County, the data was then filtered to include only midweek days (i.e. Tuesday through
Thursday) for the months of September and October. This filtering was done to be consistent with
the prior years’ CMP monitoring months.
Calculate the 20th Percentile Speed (80th Percentile Travel Time)
As described above, the travel speed data were extracted for midweek days from September and
October for each 15‐minute time interval during the AM and PM periods for all the freeways. In this
step, the 20th percentile travel speeds were calculated for each TMC segment for each 15‐minute
period for the two months (i.e. September, and October). The 20th percentile speed is defined as the
speed that 20 percent of days during the analysis period do not exceed. In other words, on 80 percent
of the days during the analysis period, vehicles go faster than this speed during a particular 15‐minute
time period, and 20 percent of days go at or below this speed. This measure is selected to avoid the
days with the slowest (i.e. worst) speeds due to collisions, construction, and special events. This 20th
percentile speed is assumed to represent the worst‐case perceived “typical” day for that TMC
segment during that 15‐minute time period. This is in accordance with the assumption that the worst
speeds below the 20th percentile speed values correspond to non‐recurrent congestion.
The 20th percentile speed, representative of the 80th percentile travel time, was selected for each
TMC segment for each 15‐minute period of data. For example, the speed for 7:30 – 7:45 AM for a
TMC segment on a freeway corridor may be based on September 20, 2017 while the speed for 7:45 –
8:00 AM is from October 11, 2017 for the same TMC segment. Hence, the travel speeds selected for
each 15‐minute period for each TMC segment are representative of the “typical congestion” on the
TMC segment during the “typical” CMP monitoring months.
Determine LOS Based on Travel Speeds
The levels of service for the AM and PM peak periods are extracted from the speeds for each TMC
segment of a freeway facility by direction. The minimum value of all of the 20th percentile speed
values for a TMC segment between 5:00 AM and 11:59 AM is used to determine the AM travel speed
and LOS of the respective TMC segment. Similarly, the minimum value of all the 20th percentile speed
values for a TMC segment between 12:00 PM and 8:59 PM is used to extract the PM travel speed,
and thereby the LOS for PM peak hour.

Calculate the Duration of Congestion
The duration of congestion for the AM and PM peak periods was determined from the speed contour
maps for each TMC segment of a freeway facility by direction. The number of 15‐minute periods for
each TMC between 5:00 AM and 11:59 AM operating below 30 mph (LOS F per Table 3.1) is the AM
period duration of congestion. Similarly, the time period between noon and 8:59 PM where the travel
speed values are less than 30 mph are termed as the PM period duration of congestion.
HOV Lanes
The commercial speed data available from INRIX for 2017 are currently not able to separate out HOV
lane performance data, as INRIX compiles mobile device signals for all lanes and there is not enough
geographic specificity to identify separate lanes. Therefore, floating vehicle surveys were performed
for all Santa Clara County freeway facilities with HOV lanes. The floating car surveys used the same
TMC segmentation as the INRIX data to be consistent. The morning surveys were conducted from
6:15 AM to 9:45 AM while the evening surveys were conducted from 3:15 PM to 6:45 PM. The time
periods are generally consistent with the data collection methodology used for the aerial
photography methods performed in previous years.
The floating vehicle surveys were performed for two mid‐week days for each HOV freeway facility.
The surveys were conducted at about 45‐minute time intervals within the survey period during the
morning and evening. The speeds obtained from both survey days were compared to see if there
were significant differences between the travel speeds. In the case where no major differences were
found, the travel speeds were averaged and the resulting travel speed value was estimated for each
TMC segment. In case of significant differences between the two travel speeds, the following checks
were performed:
Checked the INRIX data for both the days to determine if there was a collision,
construction/work zone, and/or special event;
Followed up with the data collection firm to determine if there was unusual activity, or
problems;
Based on the INRIX data check, and discussions with the firm, abnormal data were eliminated
and the resulting travel speed value was associated with the TMC segment.
For the 2017 floating car surveys, the following data were removed from the analysis:
The data for TMC segments on US 101 NB for PM peak period on day 1 were considered
abnormal based on a review of the INRIX travel time data and were removed from the analysis.
The data for TMC segments on I‐880 NB for the PM peak period on day 2 were excluded based
on a review of the INRIX travel times and the floating vehicle findings.

The data for TMC segment 105N04357 (SR 237 off‐ramp to Great Mall Parkway) on I‐880 SB for
the PM peak period on day 2 were considered outliers based on other data sources and were
removed from the analysis.
The data for TMC segment 105‐04833 (Magdalena Avenue On‐Ramp to Foothill Boulevard off‐
ramp) on I‐280 EB for the AM peak period on day 1 were considered outliers and were removed
from the analysis.
The LOS for the HOV facilities were also determined directly from the travel speed values of the TMC
segments, using the thresholds for travel speeds listed in Table 3.1. The HOV lane speed data, LOS,
density, and flow by TMC segment for AM and PM peak periods are included in the appendix.

2017 MONITORING AND
CONFORMANCE REPORT
CHAPTER 4 FREEWAY FINDINGS

Chapter 4 – Freeway Findings Mixed Flow Operations
Directional miles represent the number of miles of freeway for the two travel directions. In 2017,
there were 310 mixed flow directional miles in Santa Clara County. FIGURE 4.1 summarizes the overall
operation of the freeway system, including miles operating at each LOS, regardless of the CMP
exemption. These values are based on the most congested 15‐minute period for the months of
September and October.
FIGURE 4.1 – 2017 MIXED FLOW FREEWAY MILES LEVEL OF SERVICE
In 2017, 108 (35%) and 97 (31%) mixed flow miles operated at LOS F for at least 15‐minutes during
the AM and PM peak periods, respectively. Table (AM Period) and Table 4.24.2 (PM Period) show the
mixed flow freeway segments that operated at LOS F in 2017 and operated at LOS F under the 1991
baseline conditions, making them exempt from CMP conformance requirements. Given the change to
TMC segmentation, the segment is considered exempt in 2017 if the TMC is partially or fully in one of
the previously exempt freeway segments. These exempt segments account for about 25% and 33% of
the 108 miles and 97 miles operating at LOS F for the AM and PM periods, respectively. The average
duration of congestion for each segment is about 2.6 hours for the AM period and 3.4 hours for the
PM period.
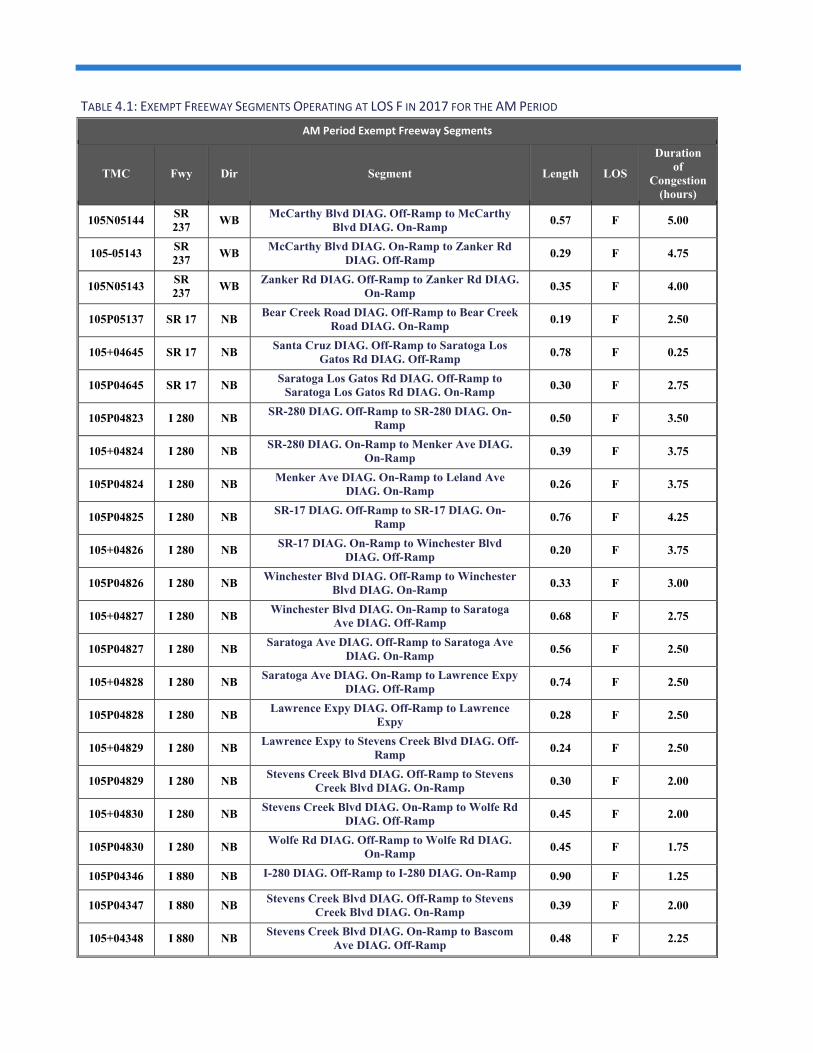
TABLE 4.1: EXEMPT FREEWAY SEGMENTS OPERATING AT LOS F IN 2017 FOR THE AM PERIOD
AM Period Exempt Freeway Segments
TMC Fwy Dir Segment Length LOS
Duration of
Congestion (hours)
105N05144 SR 237
WB McCarthy Blvd DIAG. Off-Ramp to McCarthy
Blvd DIAG. On-Ramp 0.57 F 5.00
105-05143 SR 237
WB McCarthy Blvd DIAG. On-Ramp to Zanker Rd
DIAG. Off-Ramp 0.29 F 4.75
105N05143 SR 237
WB Zanker Rd DIAG. Off-Ramp to Zanker Rd DIAG.
On-Ramp 0.35 F 4.00
105P05137 SR 17 NB Bear Creek Road DIAG. Off-Ramp to Bear Creek
Road DIAG. On-Ramp 0.19 F 2.50
105+04645 SR 17 NB Santa Cruz DIAG. Off-Ramp to Saratoga Los
Gatos Rd DIAG. Off-Ramp 0.78 F 0.25
105P04645 SR 17 NB Saratoga Los Gatos Rd DIAG. Off-Ramp to
Saratoga Los Gatos Rd DIAG. On-Ramp 0.30 F 2.75
105P04823 I 280 NB SR-280 DIAG. Off-Ramp to SR-280 DIAG. On-
Ramp 0.50 F 3.50
105+04824 I 280 NB SR-280 DIAG. On-Ramp to Menker Ave DIAG.
On-Ramp 0.39 F 3.75
105P04824 I 280 NB Menker Ave DIAG. On-Ramp to Leland Ave
DIAG. On-Ramp 0.26 F 3.75
105P04825 I 280 NB SR-17 DIAG. Off-Ramp to SR-17 DIAG. On-
Ramp 0.76 F 4.25
105+04826 I 280 NB SR-17 DIAG. On-Ramp to Winchester Blvd
DIAG. Off-Ramp 0.20 F 3.75
105P04826 I 280 NB Winchester Blvd DIAG. Off-Ramp to Winchester
Blvd DIAG. On-Ramp 0.33 F 3.00
105+04827 I 280 NB Winchester Blvd DIAG. On-Ramp to Saratoga
Ave DIAG. Off-Ramp 0.68 F 2.75
105P04827 I 280 NB Saratoga Ave DIAG. Off-Ramp to Saratoga Ave
DIAG. On-Ramp 0.56 F 2.50
105+04828 I 280 NB Saratoga Ave DIAG. On-Ramp to Lawrence Expy
DIAG. Off-Ramp 0.74 F 2.50
105P04828 I 280 NB Lawrence Expy DIAG. Off-Ramp to Lawrence
Expy 0.28 F 2.50
105+04829 I 280 NB Lawrence Expy to Stevens Creek Blvd DIAG. Off-
Ramp 0.24 F 2.50
105P04829 I 280 NB Stevens Creek Blvd DIAG. Off-Ramp to Stevens
Creek Blvd DIAG. On-Ramp 0.30 F 2.00
105+04830 I 280 NB Stevens Creek Blvd DIAG. On-Ramp to Wolfe Rd
DIAG. Off-Ramp 0.45 F 2.00
105P04830 I 280 NB Wolfe Rd DIAG. Off-Ramp to Wolfe Rd DIAG.
On-Ramp 0.45 F 1.75
105P04346 I 880 NB I-280 DIAG. Off-Ramp to I-280 DIAG. On-Ramp 0.90 F 1.25
105P04347 I 880 NB Stevens Creek Blvd DIAG. Off-Ramp to Stevens
Creek Blvd DIAG. On-Ramp 0.39 F 2.00
105+04348 I 880 NB Stevens Creek Blvd DIAG. On-Ramp to Bascom
Ave DIAG. Off-Ramp 0.48 F 2.25

AM Period Exempt Freeway Segments
TMC Fwy Dir Segment Length LOS
Duration of
Congestion (hours)
105P04348 I 880 NB Bascom Ave DIAG. Off-Ramp to Bascom Ave
DIAG. On-Ramp 0.27 F 2.00
105+04349 I 880 NB Bascom Ave DIAG. On-Ramp to The Alameda
DIAG. Off-Ramp 0.51 F 2.00
105P04349 I 880 NB The Alameda DIAG. Off-Ramp to The Alameda
DIAG. On-Ramp 0.38 F 2.00
105+04350 I 880 NB The Alameda DIAG. On-Ramp to Coleman Ave L.
Off-Ramp 0.30 F 2.50
105P04350 I 880 NB Coleman Ave L. Off-Ramp to Coleman Ave DIAG.
On-Ramp 0.38 F 2.50
105+04351 I 880 NB Coleman Ave DIAG. On-Ramp to 1st St DIAG.
Off-Ramp 0.41 F 2.50
105P04351 I 880 NB 1st St DIAG. Off-Ramp to 1nd St DIAG. On-
Ramp 0.38 F 2.25
105+04352 I 880 NB 1nd St DIAG. On-Ramp to US-101 DIAG. Off-
Ramp 0.14 F 2.25
105P04352 I 880 NB US-101 DIAG. Off-Ramp to US-101 DIAG. On-
Ramp 0.34 F 2.75
105P04353 I 880 NB Old Bayshore Hwy L. Off-Ramp to Old Bayshore
Hwy DIAG. On-Ramp 0.26 F 0.50
105N04354 I 880 SB Brokaw Rd DIAG. Off-Ramp to Brokaw Rd
DIAG. On-Ramp 0.60 F 0.50
105-04353 I 880 SB Brokaw Rd DIAG. On-Ramp to Old Bayshore
Hwy DIAG. Off-Ramp 0.46 F 1.00
105N04353 I 880 SB Old Bayshore Hwy DIAG. Off-Ramp to Old
Bayshore Hwy L. On-Ramp 0.32 F 1.25
105-04352 I 880 SB Old Bayshore Hwy L. On-Ramp to US-101 L. On-
Ramp 0.18 F 2.25
105N04879 I 680 SB Alum Rock Ave L. Off-Ramp to Alum Rock Ave
L. On-Ramp 0.61 F 1.50
105-04878 I 680 SB Capitol Expy L. On-Ramp to Capitol Expy L. On-
Ramp 0.02 F 2.00
105N04878 I 680 SB Capitol Expy L. On-Ramp to Jackson Ave DIAG.
On-Ramp 0.32 F 2.25
105-04877 I 680 SB Jackson Ave DIAG. On-Ramp to US-101 DIAG.
Off-Ramp 0.11 F 2.50
105N04877 I 680 SB US-101 DIAG. Off-Ramp to US-101 DIAG. Off-
Ramp/Bayshore Fwy 0.68 F 2.75
105N04876 I 680 SB US-101 DIAG. Off-Ramp to US-101 DIAG. On-
Ramp 0.87 F 3.50
105+04131 US 101
NB I-680 DIAG. On-Ramp to Alum Rock Ave
0.53 F 4.50
105P04132 US 101
NB Alum Rock Ave DIAG. Off-Ramp to McKee Rd
DIAG. On-Ramp 0.75 F 4.75
105+04133 US 101
NB McKee Rd DIAG. On-Ramp to Oakland Rd
DIAG. Off-Ramp 1.14 F 3.00
105P04133 US 101
NB Oakland Rd DIAG. Off-Ramp to Oakland Rd
DIAG. On-Ramp 0.41 F 3.00

AM Period Exempt Freeway Segments
TMC Fwy Dir Segment Length LOS
Duration of
Congestion (hours)
105+04134 US 101
NB Oakland Rd DIAG. On-Ramp to I-880 DIAG. Off-
Ramp 0.15 F 3.00
105P04134 US 101
NB I-880 DIAG. Off-Ramp to I-880 L. On-Ramp
0.22 F 3.00
105+04135 US 101
NB I-880 L. On-Ramp to Old Bayshore Hwy DIAG.
On-Ramp 0.34 F 3.50
105P04135 US 101
NB Old Bayshore Hwy DIAG. On-Ramp to Old
Bayshore Hwy DIAG. Off-Ramp 0.23 F 3.75
105+04136 US 101
NB Old Bayshore Hwy DIAG. Off-Ramp to Brokaw
Rd DIAG. Off-Ramp 0.20 F 4.00
105P04136 US 101
NB Brokaw Rd DIAG. Off-Ramp to Brokaw Rd
DIAG. On-Ramp 0.63 F 4.25
105P04137 US 101
NB Trimble Rd DIAG. Off-Ramp to SR-87 DIAG. On-
Ramp 0.45 F 4.25
105P04147 US 101
NB Moffett Blvd L. On-Ramp to Shoreline Blvd
DIAG. Off-Ramp 0.25 F 2.00
105P04148 US 101
NB Moffett Blvd L. Off-Ramp to Shoreline Blvd
DIAG. On-Ramp 1.10 F 1.00
105+04321 SR 85 NB I-280 DIAG. Off-Ramp to Homestead Rd 0.73 F 2.50
105+04322 SR 85 NB Homestead Rd On-Ramp to Freemont Ave Off-
Ramp 0.75 F 2.25
105P04322 SR 85 NB Freemont Ave Off-Ramp to Freemont Ave On-
Ramp 0.42 F 1.75
105P04328 SR 85 NB US-101 Off-Ramp to N Shoreline Blvd Off-Ramp 0.50 F 2.00
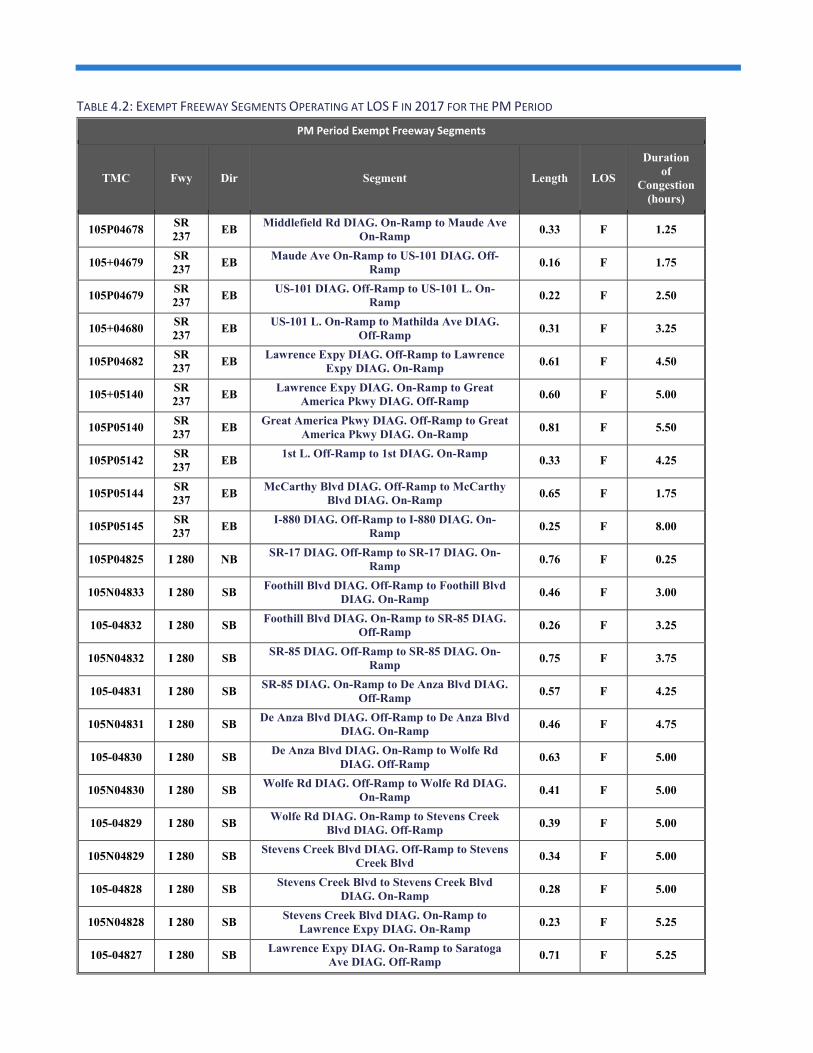
TABLE 4.2: EXEMPT FREEWAY SEGMENTS OPERATING AT LOS F IN 2017 FOR THE PM PERIOD
PM Period Exempt Freeway Segments
TMC Fwy Dir Segment Length LOS
Duration of
Congestion (hours)
105P04678 SR 237
EB Middlefield Rd DIAG. On-Ramp to Maude Ave
On-Ramp 0.33 F 1.25
105+04679 SR 237
EB Maude Ave On-Ramp to US-101 DIAG. Off-
Ramp 0.16 F 1.75
105P04679 SR 237
EB US-101 DIAG. Off-Ramp to US-101 L. On-
Ramp 0.22 F 2.50
105+04680 SR 237
EB US-101 L. On-Ramp to Mathilda Ave DIAG.
Off-Ramp 0.31 F 3.25
105P04682 SR 237
EB Lawrence Expy DIAG. Off-Ramp to Lawrence
Expy DIAG. On-Ramp 0.61 F 4.50
105+05140 SR 237
EB Lawrence Expy DIAG. On-Ramp to Great
America Pkwy DIAG. Off-Ramp 0.60 F 5.00
105P05140 SR 237
EB Great America Pkwy DIAG. Off-Ramp to Great
America Pkwy DIAG. On-Ramp 0.81 F 5.50
105P05142 SR 237
EB 1st L. Off-Ramp to 1st DIAG. On-Ramp
0.33 F 4.25
105P05144 SR 237
EB McCarthy Blvd DIAG. Off-Ramp to McCarthy
Blvd DIAG. On-Ramp 0.65 F 1.75
105P05145 SR 237
EB I-880 DIAG. Off-Ramp to I-880 DIAG. On-
Ramp 0.25 F 8.00
105P04825 I 280 NB SR-17 DIAG. Off-Ramp to SR-17 DIAG. On-
Ramp 0.76 F 0.25
105N04833 I 280 SB Foothill Blvd DIAG. Off-Ramp to Foothill Blvd
DIAG. On-Ramp 0.46 F 3.00
105-04832 I 280 SB Foothill Blvd DIAG. On-Ramp to SR-85 DIAG.
Off-Ramp 0.26 F 3.25
105N04832 I 280 SB SR-85 DIAG. Off-Ramp to SR-85 DIAG. On-
Ramp 0.75 F 3.75
105-04831 I 280 SB SR-85 DIAG. On-Ramp to De Anza Blvd DIAG.
Off-Ramp 0.57 F 4.25
105N04831 I 280 SB De Anza Blvd DIAG. Off-Ramp to De Anza Blvd
DIAG. On-Ramp 0.46 F 4.75
105-04830 I 280 SB De Anza Blvd DIAG. On-Ramp to Wolfe Rd
DIAG. Off-Ramp 0.63 F 5.00
105N04830 I 280 SB Wolfe Rd DIAG. Off-Ramp to Wolfe Rd DIAG.
On-Ramp 0.41 F 5.00
105-04829 I 280 SB Wolfe Rd DIAG. On-Ramp to Stevens Creek
Blvd DIAG. Off-Ramp 0.39 F 5.00
105N04829 I 280 SB Stevens Creek Blvd DIAG. Off-Ramp to Stevens
Creek Blvd 0.34 F 5.00
105-04828 I 280 SB Stevens Creek Blvd to Stevens Creek Blvd
DIAG. On-Ramp 0.28 F 5.00
105N04828 I 280 SB Stevens Creek Blvd DIAG. On-Ramp to
Lawrence Expy DIAG. On-Ramp 0.23 F 5.25
105-04827 I 280 SB Lawrence Expy DIAG. On-Ramp to Saratoga
Ave DIAG. Off-Ramp 0.71 F 5.25

PM Period Exempt Freeway Segments
TMC Fwy Dir Segment Length LOS
Duration of
Congestion (hours)
105N04827 I 280 SB Saratoga Ave DIAG. Off-Ramp to Saratoga Ave
DIAG. On-Ramp 0.49 F 4.25
105-04826 I 280 SB Saratoga Ave DIAG. On-Ramp to Winchester
Blvd DIAG. Off-Ramp 0.85 F 1.00
105N04826 I 280 SB Winchester Blvd DIAG. Off-Ramp to
Winchester Blvd 0.31 F 1.50
105+04358 I 880 NB SR-237 DIAG. On-Ramp to Dixon Landing
DIAG. Off-Ramp 1.03 F 2.00
105P04358 I 880 NB Dixon Landing DIAG. Off-Ramp to Dixon
Landing DIAG. On-Ramp 0.83 F 3.25
105N04355 I 880 SB Montague Expy DIAG. Off-Ramp to Montague
Expy DIAG. On-Ramp 0.74 F 3.00
105-04354 I 880 SB Montague Expy DIAG. On-Ramp to Brokaw Rd
DIAG. Off-Ramp 0.62 F 3.00
105N04354 I 880 SB Brokaw Rd DIAG. Off-Ramp to Brokaw Rd
DIAG. On-Ramp 0.60 F 4.00
105-04353 I 880 SB Brokaw Rd DIAG. On-Ramp to Old Bayshore
Hwy DIAG. Off-Ramp 0.46 F 4.50
105N04353 I 880 SB Old Bayshore Hwy DIAG. Off-Ramp to Old
Bayshore Hwy L. On-Ramp 0.32 F 3.00
105-04352 I 880 SB Old Bayshore Hwy L. On-Ramp to US-101 L.
On-Ramp 0.18 F 3.25
105N04352 I 880 SB US-101 L. On-Ramp to US-101 DIAG. On-Ramp 0.19 F 2.50
105-04351 I 880 SB US-101 DIAG. On-Ramp to 1st St DIAG. Off-
Ramp 0.12 F 2.50
105N04351 I 880 SB 1st St DIAG. Off-Ramp to 1st St DIAG. On-
Ramp 0.40 F 3.25
105-04350 I 880 SB 1st St DIAG. On-Ramp to Coleman Ave DIAG.
Off-Ramp 0.42 F 1.75
105N04350 I 880 SB Coleman Ave DIAG. Off-Ramp to Coleman Ave
DIAG. On-Ramp 0.53 F 1.75
105+04152 US 101
NB San Antonio Rd DIAG. On-Ramp to Embarcadero Rd DIAG. Off-Ramp
1.18 F 3.75
105P04152 US 101
NB Embarcadero Rd DIAG. Off-Ramp to
Embarcadero Rd DIAG. On-Ramp 0.70 F 2.50
105N04152 US 101
SB Embarcadero Rd DIAG. Off-Ramp to
Embarcadero Rd DIAG. Off-Ramp 0.65 F 3.00
105-04151 US 101
SB Oregon Expy DIAG. On-Ramp to San Antonio
Rd DIAG. Off-Ramp 1.37 F 1.75
105-04150 US 101
SB San Antonio Rd L. Off-Ramp to Rengstorff Ave
DIAG. On-Ramp 0.70 F 0.25
105-04149 US 101
SB Rengstorff Ave DIAG. Off-Ramp to Old
Middlefield Way DIAG. Off-Ramp 0.46 F 0.50
105N04149 US 101
SB Old Middlefield Way DIAG. Off-Ramp to Old
Middlefield Way DIAG. On-Ramp 0.15 F 1.00
105-04148 US 101
SB Old Middlefield Way DIAG. On-Ramp to
Shoreline Blvd L. On-Ramp 0.37 F 1.00

PM Period Exempt Freeway Segments
TMC Fwy Dir Segment Length LOS
Duration of
Congestion (hours)
105N04147 US 101
SB Shoreline Blvd L. On-Ramp to SR-85 DIAG.
Off-Ramp 0.36 F 2.00
105-04146 US 101
SB SR-85 DIAG. Off-Ramp to Moffett Blvd L. Off-
Ramp 0.22 F 3.25
105N04140 US 101
SB Bowers Ave DIAG. Off-Ramp to Bowers Ave
DIAG. On-Ramp 0.67 F 6.25
105-04139 US 101
SB Bowers Ave DIAG. On-Ramp to San Thomas
Expy DIAG. Off-Ramp 0.11 F 6.25
105N04139 US 101
SB San Thomas Expy DIAG. Off-Ramp to San
Thomas Expy DIAG. On-Ramp 0.65 F 6.50
105-04138 US 101
SB San Thomas Expy DIAG. On-Ramp to Trimble
Rd DIAG. Off-Ramp 0.78 F 6.50
105N04138 US 101
SB Trimble Rd DIAG. Off-Ramp to Trimble Rd
DIAG. On-Ramp 0.39 F 6.50
105-04137 US 101
SB Trimble Rd DIAG. On-Ramp to SR-87 DIAG.
Off-Ramp 0.41 F 2.00
105N04136 US 101
SB 1st St to 4th St DIAG. On-Ramp
0.37 F 2.25
105-04135 US 101
SB 1st St to 4th St DIAG. On-Ramp
0.38 F 4.00
105N04135 US 101
SB 4th St DIAG. On-Ramp to 4th St DIAG. On-
Ramp 0.26 F 4.75
105-04134 US 101
SB 4th St DIAG. On-Ramp to I-880 DIAG. Off-
Ramp 0.12 F 4.75
105N04134 US 101
SB I-880 DIAG. Off-Ramp to I-880 DIAG. On-
Ramp 0.49 F 5.25
105-04133 US 101
SB I-880 DIAG. On-Ramp to Oakland Rd DIAG.
Off-Ramp 0.10 F 5.50
105N04133 US 101
SB Oakland Rd DIAG. Off-Ramp to Oakland Rd
DIAG. On-Ramp 0.42 F 5.50
105N04132 US 101
SB McKee Rd DIAG. Off-Ramp to Alum Rock Ave
DIAG. Off-Ramp 0.59 F 0.75
105-04131 US 101
SB McKee Rd DIAG. Off-Ramp to Santa Clara St
DIAG. On-Ramp 0.10 F 1.25
105N04324 SR 85 SB SR-237 DIAG. Off-Ramp to SR-237 L. On-
Ramp 0.27 F 3.00
105-04323 SR 85 SB SR-237 L. On-Ramp to El Camino Real L. On-
Ramp 0.34 F 2.75
105N04323 SR 85 SB El Camino Real L. On-Ramp to El Camino Real
DIAG. On-Ramp 0.22 F 2.25
105N04322 SR 85 SB Freemont Ave DIAG. Off-Ramp to Freemont
Ave DIAG. On-Ramp 0.42 F 0.75

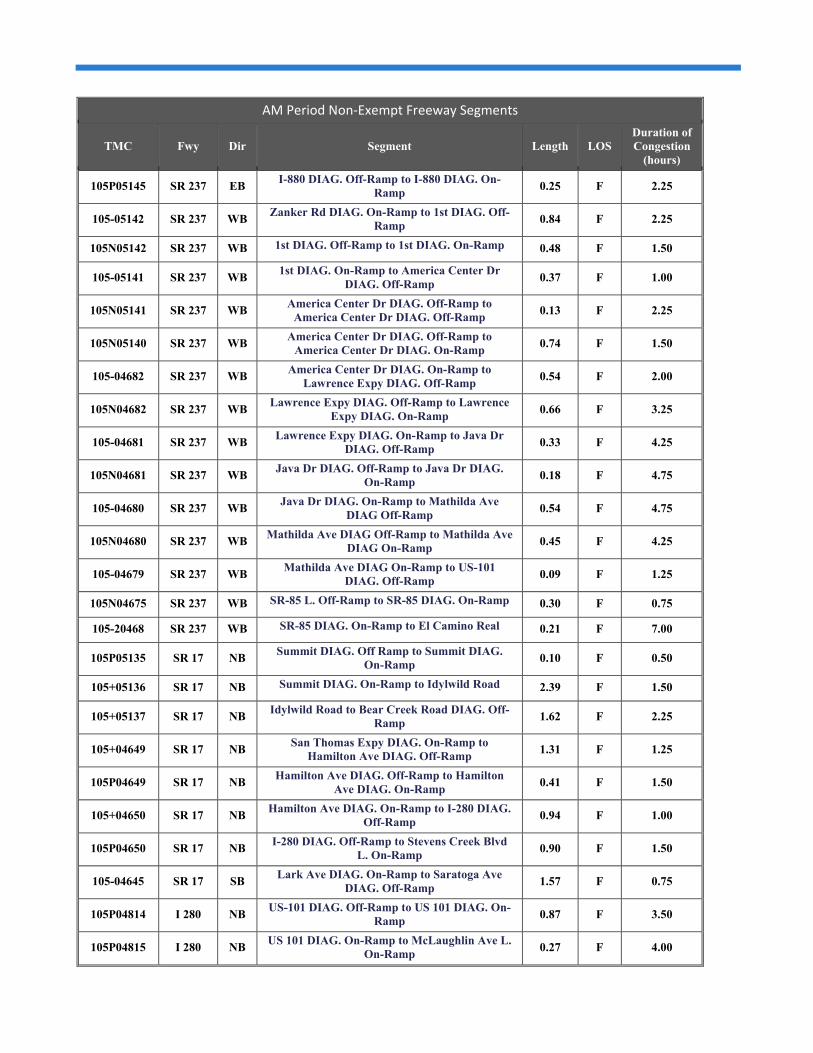
Freeway mixed flow segments operating at LOS F in 2017 but not operating at LOS F in 1991 are
considered non‐exempt from CMP requirements and are shown in Table4.3 and Table for the AM
and PM periods, respectively. These non‐exempt segments account for about 81 miles (75%) of the
total congested AM period miles and 65 miles (67%) of the PM period congested miles. The average
duration of congestion for these segments is 2.1 hours for the AM period and 2.7 hours for the PM
period.
TABLE 4.3: NON‐EXEMPT FREEWAY SEGMENTS OPERATING AT LOS F IN 2017 FOR THE AM PERIOD
AM Period Non‐Exempt Freeway Segments
TMC Fwy Dir Segment Length LOS Duration of Congestion
(hours)
105P04651 SR 87 NB SR-85 DIAG. Off-Ramp to SR-87 DIAG. On-
Ramp 0.27 F 1.75
105+04652 SR 87 NB SR-87 DIAG. On-Ramp to Capitol Expy DIAG.
Off-Ramp 0.68 F 2.50
105P04652 SR 87 NB Capitol Expy DIAG. Off-Ramp to Capitol Expy
DIAG. On-Ramp 0.39 F 3.00
105+04653 SR 87 NB Capitol Expy DIAG. On-Ramp to Curtner Ave
DIAG. Off-Ramp 0.98 F 3.75
105P04653 SR 87 NB Curtner Ave DIAG. Off-Ramp to Curtner Ave
DIAG. On-Ramp 0.56 F 4.50
105+04654 SR 87 NB Curtner Ave DIAG. On-Ramp to Almaden
Expy DIAG. Off-Ramp 0.21 F 5.00
105P04654 SR 87 NB Almaden Expy DIAG. Off-Ramp to Almaden
Expy DIAG. On-Ramp 0.24 F 4.75
105P04656 SR 87 NB I-280 DIAG. Off-Ramp to I-280 DIAG. On-
Ramp 0.80 F 0.50
105P04657 SR 87 NB I-280 DIAG. On-Ramp to Santa Clara St
DIAG. Off-Ramp 0.28 F 2.00
105+04658 SR 87 NB Santa Clara St DIAG. Off-Ramp to Julian St
DIAG. Off-Ramp 0.12 F 2.25
105P04658 SR 87 NB Julian St DIAG. Off-Ramp to Julian St DIAG.
On-Ramp 0.57 F 2.00
105+05602 SR 87 NB Julian St DIAG. On-Ramp to Taylor DIAG.
Off-Ramp 0.13 F 0.25
105P05602 SR 87 NB Taylor DIAG. Off-Ramp to Taylor DIAG. On-
Ramp 0.66 F 0.25
105P05914 SR 87 NB Skyport Dr DIAG. Off-Ramp to Skyport Dr
DIAG. On-Ramp 0.66 F 0.25
105+05605 SR 87 NB Skyport Dr DIAG. On-Ramp to US-101 DIAG.
Off-Ramp 0.36 F 3.75
105P05605 SR 87 NB US-101 DIAG. Off-Ramp to US-101 DIAG. On-
Ramp 0.38 F 5.25
105+04675 SR 237 EB El Camino Real to SR-85 L. Off-Ramp 0.28 F 0.25
105+04676 SR 237 EB SR-85 DIAG. On-Ramp to Dana St. L. Off-
Ramp 0.05 F 1.25
105P04676 SR 237 EB Dana St. L. Off-Ramp to Dana St. DIAG. On-
Ramp 0.38 F 1.50
AM Period Non‐Exempt Freeway Segments
TMC Fwy Dir Segment Length LOS Duration of Congestion
(hours)
105P05145 SR 237 EB I-880 DIAG. Off-Ramp to I-880 DIAG. On-
Ramp 0.25 F 2.25
105-05142 SR 237 WB Zanker Rd DIAG. On-Ramp to 1st DIAG. Off-
Ramp 0.84 F 2.25
105N05142 SR 237 WB 1st DIAG. Off-Ramp to 1st DIAG. On-Ramp 0.48 F 1.50
105-05141 SR 237 WB 1st DIAG. On-Ramp to America Center Dr
DIAG. Off-Ramp 0.37 F 1.00
105N05141 SR 237 WB America Center Dr DIAG. Off-Ramp to
America Center Dr DIAG. Off-Ramp 0.13 F 2.25
105N05140 SR 237 WB America Center Dr DIAG. Off-Ramp to
America Center Dr DIAG. On-Ramp 0.74 F 1.50
105-04682 SR 237 WB America Center Dr DIAG. On-Ramp to
Lawrence Expy DIAG. Off-Ramp 0.54 F 2.00
105N04682 SR 237 WB Lawrence Expy DIAG. Off-Ramp to Lawrence
Expy DIAG. On-Ramp 0.66 F 3.25
105-04681 SR 237 WB Lawrence Expy DIAG. On-Ramp to Java Dr
DIAG. Off-Ramp 0.33 F 4.25
105N04681 SR 237 WB Java Dr DIAG. Off-Ramp to Java Dr DIAG.
On-Ramp 0.18 F 4.75
105-04680 SR 237 WB Java Dr DIAG. On-Ramp to Mathilda Ave
DIAG Off-Ramp 0.54 F 4.75
105N04680 SR 237 WB Mathilda Ave DIAG Off-Ramp to Mathilda Ave
DIAG On-Ramp 0.45 F 4.25
105-04679 SR 237 WB Mathilda Ave DIAG On-Ramp to US-101
DIAG. Off-Ramp 0.09 F 1.25
105N04675 SR 237 WB SR-85 L. Off-Ramp to SR-85 DIAG. On-Ramp 0.30 F 0.75
105-20468 SR 237 WB SR-85 DIAG. On-Ramp to El Camino Real 0.21 F 7.00
105P05135 SR 17 NB Summit DIAG. Off Ramp to Summit DIAG.
On-Ramp 0.10 F 0.50
105+05136 SR 17 NB Summit DIAG. On-Ramp to Idylwild Road 2.39 F 1.50
105+05137 SR 17 NB Idylwild Road to Bear Creek Road DIAG. Off-
Ramp 1.62 F 2.25
105+04649 SR 17 NB San Thomas Expy DIAG. On-Ramp to
Hamilton Ave DIAG. Off-Ramp 1.31 F 1.25
105P04649 SR 17 NB Hamilton Ave DIAG. Off-Ramp to Hamilton
Ave DIAG. On-Ramp 0.41 F 1.50
105+04650 SR 17 NB Hamilton Ave DIAG. On-Ramp to I-280 DIAG.
Off-Ramp 0.94 F 1.00
105P04650 SR 17 NB I-280 DIAG. Off-Ramp to Stevens Creek Blvd
L. On-Ramp 0.90 F 1.50
105-04645 SR 17 SB Lark Ave DIAG. On-Ramp to Saratoga Ave
DIAG. Off-Ramp 1.57 F 0.75
105P04814 I 280 NB US-101 DIAG. Off-Ramp to US 101 DIAG. On-
Ramp 0.87 F 3.50
105P04815 I 280 NB US 101 DIAG. On-Ramp to McLaughlin Ave L.
On-Ramp 0.27 F 4.00

AM Period Non‐Exempt Freeway Segments
TMC Fwy Dir Segment Length LOS Duration of Congestion
(hours)
105+04816 I 280 NB McLaughlin Ave L. On-Ramp to 11th St DIAG.
Off-Ramp 0.45 F 3.00
105P04817 I 280 NB 11th St DIAG. Off-Ramp to 11th St DIAG. On-
Ramp 0.58 F 2.50
105+04818 I 280 NB 11th St DIAG. On-Ramp to 4th St DIAG. On-
Ramp 0.19 F 2.50
105+04819 I 280 NB 4th St DIAG. On-Ramp to 4th St DIAG. On-
Ramp 0.14 F 2.25
105P04819 I 280 NB 4th St DIAG. On-Ramp to 4th St DIAG. On-
Ramp 0.01 F 1.00
105+04820 I 280 NB 4th St DIAG. On-Ramp to SR-87 DIAG. Off-
Ramp 0.17 F 0.75
105P04820 I 280 NB SR-87 DIAG. Off-Ramp to SR-87 DIAG. On-
Ramp 0.76 F 1.00
105+04822 I 280 NB SR-280 DIAG. On-Ramp to Meridian Ave
DIAG. Off-Ramp 0.27 F 2.00
105P04822 I 280 NB Southwest Expy DIAG. Off-Ramp to Meridian
Ave L. On-Ramp 0.47 F 2.50
105+04831 I 280 NB Wolfe Rd DIAG. On-Ramp to De Anza Blvd
DIAG. Off-Ramp 0.61 F 1.25
105P04831 I 280 NB De Anza Blvd DIAG. Off-Ramp to De Anza
Blvd DIAG. On-Ramp 0.46 F 1.25
105+04832 I 280 NB De Anza Blvd DIAG. On-Ramp to SR-85
DIAG. Off-Ramp 0.70 F 1.50
105P04832 I 280 NB SR-85 DIAG. Off-Ramp to SR-85 DIAG. On-
Ramp 0.74 F 2.00
105P04833 I 280 NB Foothill Blvd DIAG. Off-Ramp to Foothill Blvd
L. On-Ramp 0.32 F 1.00
105-04821 I 280 SB Southwest Expy DIAG. On-Ramp to Bird Ave
DIAG. Off-Ramp 0.47 F 0.25
105N04814 I 280 SB McLaughlin Ave DIAG. Off-Ramp to US-101
DIAG. On-Ramp 1.12 F 0.75
105N04358 I 880 SB Dixon Landing DIAG. Off-Ramp to Dixon
Landing DIAG. On-Ramp 0.64 F 2.75
105-04357 I 880 SB Dixon Landing DIAG. On-Ramp to SR-237
DIAG. Off-Ramp 1.13 F 2.25
105N04352 I 880 SB US-101 L. On-Ramp to US-101 DIAG. On-
Ramp 0.19 F 3.00
105-04351 I 880 SB US-101 DIAG. On-Ramp to 1st St DIAG. Off-
Ramp 0.12 F 3.25
105N04351 I 880 SB 1st St DIAG. Off-Ramp to 1st St DIAG. On-
Ramp 0.40 F 3.50
105-04347 I 880 SB Bascom Ave DIAG. On-Ramp to Stevens Creek
Blvd DIAG. Off-Ramp 0.49 F 0.50
105N04347 I 880 SB Stevens Creek Blvd DIAG. Off-Ramp to I-280
DIAG. Off-Ramp 0.42 F 1.25
105-04346 I 880 SB I-280 L. Off-Ramp to I-280 DIAG. Off-Ramp 0.06 F 1.25

AM Period Non‐Exempt Freeway Segments
TMC Fwy Dir Segment Length LOS Duration of Congestion
(hours)
105P04877 I 680 NB US-101 DIAG. Off-Ramp to US-101 DIAG. On-
Ramp 0.59 F 1.00
105+04878 I 680 NB US-101 DIAG. On-Ramp to Capitol Expy
DIAG. Off-Ramp/ Jackson Ave 0.24 F 1.50
105P04878 I 680 NB Capitol Expy DIAG. Off-Ramp/ Jackson Ave to
Capitol Expy DIAG. Off-Ramp 0.33 F 1.75
105P04879 I 680 NB Capitol Expy DIAG. Off-Ramp to Capitol Expy
DIAG. On-Ramp 0.58 F 2.00
105P04880 I 680 NB Alum Rock Ave DIAG. Off-Ramp to Alum
Rock Ave DIAG. On-Ramp 0.61 F 2.00
105+04881 I 680 NB Alum Rock Ave DIAG. On-Ramp to McKee Rd
DIAG. Off-Ramp 0.14 F 1.75
105P04881 I 680 NB McKee Rd DIAG. Off-Ramp to McKee Rd
DIAG. On-Ramp 0.59 F 0.50
105+04886 I 680 NB Montague Expy DIAG. On-Ramp to Calaveras
Blvd DIAG. Off-Ramp 0.75 F 0.50
105P04886 I 680 NB Calaveras Blvd DIAG. Off-Ramp to Calaveras
Blvd DIAG. On-Ramp 0.84 F 0.75
105N04881 I 680 SB McKee Rd DIAG. Off-Ramp to McKee Rd
DIAG. On-Ramp 0.65 F 0.50
105-04880 I 680 SB McKee Rd DIAG. On-Ramp to Alum Rock Ave
DIAG. Off-Ramp 0.11 F 0.75
105N04880 I 680 SB Alum Rock Ave DIAG. Off-Ramp to Capitol
Expy L. On-Ramp 0.61 F 0.75
105P04117 US 101 NB San Martin Ave DIAG. Off-Ramp to San
Martin Ave DIAG. On-Ramp 0.44 F 1.00
105+04118 US 101 NB San Martin Ave DIAG. On-Ramp to Tennant
Ave DIAG. Off-Ramp 2.10 F 2.50
105P04118 US 101 NB Tennant Ave DIAG. Off-Ramp to Tennant Ave
DIAG. On-Ramp 0.59 F 3.00
105+04119 US 101 NB Tennant Ave DIAG. On-Ramp to Dunne Ave
DIAG. Off-Ramp 0.31 F 3.25
105P04119 US 101 NB Dunne Ave DIAG. Off-Ramp to Dunne Ave
DIAG. On-Ramp 0.58 F 2.75
105P04124 US 101 NB Silver Creek Valley Rd DIAG. Off-Ramp to
Silver Creek Valley Rd DIAG. On-Ramp 0.77 F 0.50
105+04125 US 101 NB Silver Creek Valley Rd DIAG. On-Ramp to
Hellyer Ave DIAG. Off-Ramp 1.34 F 2.25
105P04125 US 101 NB Hellyer Ave DIAG. Off-Ramp to Hellyer Ave L.
On-Ramp 0.27 F 2.50
105+04126 US 101 NB Hellyer Ave L. On-Ramp to Yerba Buena Rd L.
Off-Ramp 0.70 F 2.75
105P04126 US 101 NB Yerba Buena Rd L. Off-Ramp to Capitol Expy
DIAG. Off-Ramp 0.18 F 3.00
105P04127 US 101 NB Capitol Expy DIAG. Off-Ramp to Capitol Expy
DIAG. On-Ramp 0.97 F 3.00
105+04128 US 101 NB Capitol Expy DIAG. On-Ramp to Tully Rd
DIAG. Off-Ramp 0.64 F 3.25

AM Period Non‐Exempt Freeway Segments
TMC Fwy Dir Segment Length LOS Duration of Congestion
(hours)
105P04128 US 101 NB Tully Rd DIAG. Off-Ramp to Tully Rd DIAG.
On-Ramp 0.63 F 2.00
105+04129 US 101 NB Tully Rd DIAG. On-Ramp to I-680 DIAG. Off-
Ramp 0.97 F 1.75
105P04129 US 101 NB I-680 DIAG. Off-Ramp to I-680 DIAG. On-
Ramp 0.79 F 3.00
105+04138 US 101 NB SR-87 DIAG. On-Ramp to Trimble Rd DIAG.
Off-Ramp 0.28 F 4.75
105P04138 US 101 NB Trimble Rd DIAG. Off-Ramp to Trimble Rd
DIAG. On-Ramp 0.43 F 4.75
105+04139 US 101 NB Trimble Rd DIAG. On-Ramp to San Tomas
Expy DIAG. Off-Ramp 0.70 F 3.00
105P04139 US 101 NB San Tomas Expy DIAG. Off-Ramp to San
Tomas Expy DIAG. On-Ramp 0.64 F 2.75
105P04140 US 101 NB America Pkwy DIAG. Off-Ramp to America
Pkwy DIAG. On-Ramp 0.65 F 2.75
105+04141 US 101 NB America Pkwy DIAG. On-Ramp to Lawrence
Expy DIAG. Off-Ramp 0.58 F 2.75
105P04141 US 101 NB Lawrence Expy DIAG. Off-Ramp to Lawrence
Expy DIAG. On-Ramp 0.39 F 3.25
105+04142 US 101 NB Lawrence Expy DIAG. On-Ramp to Fair Oaks
Avenue DIAG. Off-Ramp 0.65 F 3.25
105P04142 US 101 NB Fair Oaks Avenue DIAG. Off-Ramp to Fair
Oaks Avenue DIAG. On-Ramp 0.29 F 3.00
105+04143 US 101 NB Fair Oaks Avenue DIAG. On-Ramp to
Mathilda Ave DIAG. Off-Ramp 0.52 F 1.25
105P04143 US 101 NB Mathilda Ave DIAG. Off-Ramp to Mathilda
Ave L. Off-Ramp 0.21 F 0.25
105+04144 US 101 NB Mathilda Ave L. Off-Ramp to Southbay Fwy L.
Off-Ramp 0.43 F 1.00
105P04144 US 101 NB Southbay Fwy L. Off-Ramp to Southbay Fwy
DIAG. Off-Ramp 0.20 F 1.75
105+04145 US 101 NB Southbay Fwy DIAG. Off-Ramp to Ellis St
DIAG. Off-Ramp 0.46 F 0.75
105P04145 US 101 NB Ellis St DIAG. Off-Ramp to Ellis St DIAG. On-
Ramp 0.60 F 0.75
105+04146 US 101 NB Ellis St DIAG. On-Ramp to Moffett Blvd
DIAG. Off-Ramp 0.32 F 1.00
105P04146 US 101 NB Moffett Blvd DIAG. Off-Ramp to Moffett Blvd
L. On-Ramp 0.18 F 0.75
105+04147 US 101 NB Moffett Blvd L. Off-Ramp to Shoreline Blvd
DIAG. Off-Ramp 0.25 F 1.75
105+04151 US 101 NB Rengstorff Ave DIAG. On-Ramp to San
Antonio Rd DIAG. Off-Ramp 0.25 F 0.75
105P04151 US 101 NB San Antonio Rd DIAG. Off-Ramp to San
Antonio Rd DIAG. On-Ramp 0.44 F 1.50
105+04152 US 101 NB San Antonio Rd DIAG. On-Ramp to Embarcadero Rd DIAG. Off-Ramp
1.18 F 2.50

AM Period Non‐Exempt Freeway Segments
TMC Fwy Dir Segment Length LOS Duration of Congestion
(hours)
105P04152 US 101 NB Embarcadero Rd DIAG. Off-Ramp to
Embarcadero Rd DIAG. On-Ramp 0.70 F 0.25
105P04304 SR 85 NB US-101 DIAG. Off-Ramp to Bernal Rd L. On-
Ramp 0.70 F 2.50
105P04307 SR 85 NB Cottle Rd DIAG. Off-Ramp to Cottle Rd DIAG.
On-Ramp 0.58 F 1.50
105+04308 SR 85 NB Cottle Rd DIAG. On-Ramp to Blossom Hill Rd
DIAG. Off-Ramp 1.29 F 0.25
105+04309 SR 85 NB Blossom Hill Rd DIAG. On-Ramp to SR-87
DIAG. Off-Ramp 0.53 F 0.50
105P04309 SR 85 NB SR-87 DIAG. Off-Ramp to SR-87 DIAG. On-
Ramp 0.78 F 2.50
105P04311 SR 85 NB Almaden Expwy DIAG. Off-Ramp to Almaden
Expwy DIAG. On-Ramp 0.53 F 3.50
105+04312 SR 85 NB Almaden Expwy DIAG. On-Ramp to Camden
Ave DIAG. Off-Ramp 1.46 F 3.00
105P04312 SR 85 NB Camden Ave DIAG. Off-Ramp to Camden Ave
DIAG. On-Ramp 0.43 F 3.25
105+04313 SR 85 NB Camden Ave DIAG. On-Ramp to Union Ave
DIAG. Off-Ramp 0.79 F 3.50
105P04313 SR 85 NB Union Ave DIAG. Off-Ramp to Union Ave
DIAG. On-Ramp 0.42 F 2.25
105+04314 SR 85 NB Union Ave DIAG. On-Ramp to S. Bascom Ave
DIAG. Off-Ramp 0.48 F 2.25
105P04315 SR 85 NB S. Bascom Ave DIAG. Off Ramp to Winchester
Blvd DIAG. On-Ramp 1.18 F 4.00
105P04316 SR 85 NB S. Bascom Ave DIAG. On-Ramp to Winchester
Blvd DIAG. On-Ramp 0.28 F 4.75
105+04317 SR 85 NB Winchester Blvd DIAG. On-Ramp to Saratoga
Ave DIAG. Off-Ramp 2.12 F 2.00
105P04317 SR 85 NB Saratoga Ave DIAG. Off-Ramp to Saratoga
Ave DIAG. On-Ramp 0.62 F 1.50
105+04318 SR 85 NB Saratoga Ave DIAG. On-Ramp to S De Anza
Blvd DIAG. Off-Ramp 1.39 F 0.50
105P04318 SR 85 NB S De Anza Blvd DIAG. Off-Ramp to S De Anza
Blvd DIAG. On-Ramp 0.75 F 2.25
105+04319 SR 85 NB S De Anza Blvd DIAG. On-Ramp to Stevens
Creek Blvd DIAG. Off-Ramp 1.28 F 0.50
105P04319 SR 85 NB Stevens Creek Blvd DIAG. Off-Ramp to
Stevens Creek Blvd DIAG. On-Ramp 0.48 F 0.75
105+04320 SR 85 NB Stevens Creek Blvd DIAG. On-Ramp to I-280
DIAG. Off-Ramp 0.21 F 1.00
105+04323 SR 85 NB Freemont Ave On-Ramp to El Camino Real
Off-Ramp 1.45 F 1.00
105P04323 SR 85 NB El Camino Real Off-Ramp to El Camino Real
On-Ramp 0.37 F 0.50

TABLE 4.4: NON‐EXEMPT FREEWAY SEGMENTS OPERATING AT LOS F IN 2017 FOR THE PM PERIOD
PM Period Non‐Exempt Freeway Segments
TMC Fwy Dir Segment Length LOS Duration of Congestion (hours)
105P04654 SR 87 NB Almaden Expy DIAG. Off-Ramp to Almaden Expy
DIAG. On-Ramp0.24 F 0.25
105+04655 SR 87 NB Almaden Expy DIAG. On-Ramp to Alma Ave
DIAG. Off-Ramp0.44 F 0.50
105+04656 SR 87 NB Alma Ave DIAG. Off-Ramp to I-280 DIAG. Off-
Ramp0.67 F 1.00
105N05914 SR 87 SB Skyport Dr DIAG. Off-Ramp to Skyport Dr DIAG.
On-Ramp0.68 F 0.25
105‐05603 SR 87 SB Skyport Dr DIAG. On-Ramp to Hedding St DIAG.
Off-Ramp/Taylor St DIAG. Off-Ramp0.78 F 1.75
105‐05602 SR 87 SB Hedding St DIAG. Off-Ramp/Taylor St DIAG. Off-
Ramp to Taylor St DIAG. Off-Ramp0.11 F 1.50
105N05602 SR 87 SB Taylor St DIAG. Off-Ramp to Taylor St DIAG. On-
Ramp0.56 F 3.00
105‐04658 SR 87 SB Taylor St DIAG. On-Ramp to Coleman Ave/Julian
St DIAG Off-Ramp 0.16 F 0.25
105N04658 SR 87 SB Coleman Ave/Julian St DIAG Off-Ramp to Julian St
DIAG. On-Ramp0.57 F 0.25
105N04657 SR 87 SB Park Ave DIAG. Off-Ramp to I-280 DIAG. Off-
Ramp0.25 F 0.50
105N04656 SR 87 SB I-280 DIAG. Off-Ramp to Alma Ave DIAG Off-
Ramp1.23 F 3.25
105‐04655 SR 87 SB Alma Ave DIAG Off-Ramp to Alma Ave DIAG On-
Ramp0.22 F 2.75
105+04678 SR 237 EB Middlefield Rd DIAG. to Middlefield Rd DIAG.
On-Ramp0.23 F 1.00
105P04680 SR 237 EB Mathilda Ave DIAG. Off-Ramp to Mathilda Ave
DIAG. On-Ramp0.46 F 3.25
105+04681 SR 237 EB Mathilda Ave DIAG. On-Ramp to Fair Oaks Way
DIAG. Off-Ramp0.54 F 2.75
105P04681 SR 237 EB Fair Oaks Way DIAG. Off-Ramp to Fair Oaks Way
L. On-Ramp0.21 F 3.25
105+04682 SR 237 EB Fair Oaks Way L. On-Ramp to Lawrence Expy
DIAG. Off-Ramp0.30 F 3.50
105+05142 SR 237 EB Great America Pkwy DIAG. On-Ramp to 1st L. Off-
Ramp0.55 F 5.50
105‐05143 SR 237 WB McCarthy Blvd DIAG. On-Ramp to Zanker Rd
DIAG. Off-Ramp0.29 F 0.75
105N04682 SR 237 WB Lawrence Expy DIAG. Off-Ramp to Lawrence Expy
DIAG. On-Ramp0.66 F 0.25
105‐04681 SR 237 WB Lawrence Expy DIAG. On-Ramp to Java Dr DIAG.
Off-Ramp 0.33 F 1.00
105N04681 SR 237 WB Java Dr DIAG. Off-Ramp to Java Dr DIAG. On-
Ramp 0.18 F 1.50
105‐04680 SR 237 WB Java Dr DIAG. On-Ramp to Mathilda Ave DIAG
Off-Ramp0.54 F 1.50

PM Period Non‐Exempt Freeway Segments
TMC Fwy Dir Segment Length LOS Duration of Congestion (hours)
105N04680 SR 237 WB Mathilda Ave DIAG Off-Ramp to Mathilda Ave
DIAG On-Ramp0.45 F 2.50
105‐04679 SR 237 WB Mathilda Ave DIAG On-Ramp to US-101 DIAG.
Off-Ramp0.09 F 2.25
105N04679 SR 237 WB US-101 DIAG. Off-Ramp to US-101 L. On-Ramp 0.21 F 1.50
105‐04678 SR 237 WB US-101 L. On-Ramp to Maude Ave DIAG. Off-
Ramp0.48 F 1.50
105N04678 SR 237 WB Maude Ave DIAG. Off-Ramp to Maude Ave DIAG.
On-Ramp0.28 F 2.00
105‐04677 SR 237 WB Maude Ave DIAG. On-Ramp to Middlefield DIAG.
Off-Ramp0.22 F 2.00
105N04677 SR 237 WB Middlefield DIAG. Off-Ramp to Middlefield DIAG.
On-Ramp0.30 F 2.50
105‐04676 SR 237 WB Middlefield DIAG. On-Ramp to Dana St DIAG. Off-
Ramp0.44 F 2.25
105N04676 SR 237 WB Dana St DIAG. Off-Ramp to Dana St L. On-Ramp 0.23 F 3.50
105‐04675 SR 237 WB Dana St L. On-Ramp to SR-85 L. Off-Ramp 0.10 F 2.75
105‐20468 SR 237 WB SR-85 DIAG. On-Ramp to El Camino Real 0.21 F 9.00
105P04645 SR 17 NB Saratoga Los Gatos Rd DIAG. Off-Ramp to
Saratoga Los Gatos Rd DIAG. On-Ramp0.30 F 6.00
105N04646 SR 17 SB Lark Ave DIAG. Off-Ramp to Lark Ave DIAG. On-
Ramp0.21 F 0.75
105P04817 I 280 NB 11th St DIAG. Off-Ramp to 11th St DIAG. On-
Ramp0.58 F 0.25
105+04818 I 280 NB 11th St DIAG. On-Ramp to 4th St DIAG. On-Ramp 0.19 F 0.50
105+04819 I 280 NB 4th St DIAG. On-Ramp to 4th St DIAG. On-Ramp 0.14 F 0.25
105P04819 I 280 NB 4th St DIAG. On-Ramp to 4th St DIAG. On-Ramp 0.01 F 0.50
105+04820 I 280 NB 4th St DIAG. On-Ramp to SR-87 DIAG. Off-Ramp 0.17 F 0.25
105P04820 I 280 NB SR-87 DIAG. Off-Ramp to SR-87 DIAG. On-Ramp 0.76 F 0.50
105+04837 I 280 NB Page Mill Rd DIAG. On-Ramp to Alpine Rd DIAG.
Off-Ramp1.70 F 1.50
105‐04836 I 280 SB Alpine Rd DIAG. On-Ramp to Page Mill Rd DIAG.
Off-Ramp1.58 F 1.50
105N04836 I 280 SB Page Mill Rd DIAG. Off-Ramp to Page Mill Rd
DIAG. On-Ramp0.65 F 2.50
105‐04835 I 280 SB Page Mill Rd DIAG. On-Ramp to El Monte Rd
DIAG. Off-Ramp2.71 F 3.50
105N04835 I 280 SB El Monte Rd DIAG. Off-Ramp to El Monte Rd
DIAG. On-Ramp0.60 F 4.00
105‐04834 I 280 SB El Monte Rd DIAG. On-Ramp to Magdalena Ave
DIAG. Off-Ramp0.36 F 4.50
105N04834 I 280 SB Magdalena Ave DIAG. Off-Ramp to Magdalena Ave
L. On-Ramp0.38 F 0.75

PM Period Non‐Exempt Freeway Segments
TMC Fwy Dir Segment Length LOS Duration of Congestion (hours)
105‐04825 I 280 SB Winchester Blvd to SR-17 DIAG. Off-Ramp 0.11 F 2.75
105N04825 I 280 SB SR-17 DIAG. Off-Ramp to SR-17 DIAG. On-Ramp 0.62 F 3.75
105‐04824 I 280 SB SR-17 DIAG. On-Ramp to Bascom Ave DIAG. Off-
Ramp0.18 F 4.25
105N04824 I 280 SB Bascom Ave DIAG. Off-Ramp to Leland Ave 0.39 F 5.00
105‐04823 I 280 SB Leland Ave to Meridian Ave DIAG. Off-Ramp 0.25 F 5.00
105N04823 I 280 SB Meridian Ave DIAG. Off-Ramp to Meridian Ave
DIAG. On-Ramp0.75 F 5.00
105‐04822 I 280 SB Meridian Ave L. Off-Ramp to Meridian Ave L. Off-
Ramp0.01 F 5.50
105N04822 I 280 SB Meridian Ave L. Off-Ramp to Southwest Expy
DIAG. On-Ramp0.22 F 5.25
105‐04821 I 280 SB Southwest Expy DIAG. On-Ramp to Bird Ave
DIAG. Off-Ramp0.47 F 3.75
105N04821 I 280 SB Bird Ave DIAG. Off-Ramp to Bird Ave DIAG. On-
Ramp0.83 F 4.00
105‐04819 I 280 SB SR-87 DIAG. On-Ramp to 1st St L. On-Ramp 0.20 F 4.75
105N04819 I 280 SB 1st St L. On-Ramp to 6th St DIAG. Off-Ramp 0.10 F 4.25
105‐04818 I 280 SB 1st St L. On-Ramp to 6th St DIAG. Off-Ramp 0.05 F 4.50
105‐04817 I 280 SB 6th St DIAG. Off-Ramp to 10th St DIAG. Off-Ramp 0.21 F 4.75
105N04817 I 280 SB 10th St DIAG. Off-Ramp to 11th St DIAG. On-
Ramp0.54 F 2.00
105+04348 I 880 NB Stevens Creek Blvd DIAG. On-Ramp to Bascom Ave
DIAG. Off-Ramp0.48 F 1.25
105P04348 I 880 NB Bascom Ave DIAG. Off-Ramp to Bascom Ave
DIAG. On-Ramp0.27 F 2.75
105+04349 I 880 NB Bascom Ave DIAG. On-Ramp to The Alameda
DIAG. Off-Ramp0.51 F 3.50
105P04349 I 880 NB The Alameda DIAG. Off-Ramp to The Alameda
DIAG. On-Ramp0.38 F 4.00
105+04350 I 880 NB The Alameda DIAG. On-Ramp to Coleman Ave L.
Off-Ramp0.30 F 5.00
105P04350 I 880 NB Coleman Ave L. Off-Ramp to Coleman Ave DIAG.
On-Ramp0.38 F 5.25
105+04351 I 880 NB Coleman Ave DIAG. On-Ramp to 1st St DIAG. Off-
Ramp0.41 F 3.75
105P04351 I 880 NB 1st St DIAG. Off-Ramp to 1nd St DIAG. On-Ramp 0.38 F 3.25
105‐04355 I 880 SB Great Mall Pkwy DIAG. On-Ramp to Montague
Expy DIAG. Off-Ramp0.42 F 2.25
105‐04349 I 880 SB Coleman Ave DIAG. On-Ramp to The Alameda
DIAG. Off-Ramp0.17 F 0.75
105N04349 I 880 SB The Alameda DIAG. Off-Ramp to The Alameda
DIAG. On-Ramp0.37 F 1.75

PM Period Non‐Exempt Freeway Segments
TMC Fwy Dir Segment Length LOS Duration of Congestion (hours)
105‐04348 I 880 SB The Alameda DIAG. On-Ramp to Bascom Ave
DIAG. Off-Ramp0.45 F 1.75
105N04887 I 680 SB Jacklin Rd DIAG. Off-Ramp to Jacklin Rd DIAG.
On-Ramp0.61 F 0.75
105N04886 I 680 SB Calaveras Blvd DIAG. Off Ramp to Calaveras Blvd
DIAG. On Ramp0.96 F 2.75
105‐04885 I 680 SB Calaveras Blvd DIAG. On Ramp to Montague Expy
DIAG. Off-Ramp0.64 F 3.00
105N04885 I 680 SB Montague Expy DIAG. Off-Ramp to Montague
Expy DIAG. On-Ramp0.70 F 3.25
105‐04884 I 680 SB Montague Expy DIAG. On-Ramp to Capitol Expy
DIAG. Off-Ramp0.43 F 3.25
105N04884 I 680 SB Capitol Expy DIAG. Off-Ramp to Capitol Expy
DIAG. On-Ramp0.53 F 4.00
105‐04883 I 680 SB Capitol Expy DIAG. On-Ramp to Hostetter Rd L.
Off-Ramp0.10 F 4.25
105N04883 I 680 SB Hostetter Rd L. Off-Ramp to Hostetter Rd L. On-
Ramp0.42 F 4.00
105‐04882 I 680 SB Hostetter Rd L. On-Ramp to Berryessa Rd DIAG.
Off-Ramp0.19 F 2.75
105N04882 I 680 SB Berryessa Rd DIAG. Off-Ramp to Berryessa Rd
DIAG. On-Ramp0.63 F 2.25
105‐04881 I 680 SB Berryessa Rd DIAG. On-Ramp to McKee Rd DIAG.
Off-Ramp0.82 F 0.25
105N04881 I 680 SB McKee Rd DIAG. Off-Ramp to McKee Rd DIAG.
On-Ramp0.65 F 0.75
105+04147 US 101 NB Moffett Blvd L. Off-Ramp to Shoreline Blvd DIAG.
Off-Ramp0.25 F 1.00
105P04147 US 101 NB Moffett Blvd L. On-Ramp to Shoreline Blvd DIAG.
Off-Ramp0.25 F 1.25
105P04148 US 101 NB Moffett Blvd L. Off-Ramp to Shoreline Blvd DIAG.
On-Ramp1.10 F 0.50
105N04146 US 101 SB Moffett Blvd L. Off-Ramp to Moffett Blvd DIAG.
On-Ramp0.15 F 4.00
105‐04145 US 101 SB Moffett Blvd DIAG. On-Ramp to Ellis St DIAG. Off-
Ramp 0.41 F 4.50
105N04145 US 101 SB Ellis St DIAG. Off-Ramp to Ellis St DIAG. On-
Ramp 0.54 F 5.25
105‐04144 US 101 SB Ellis St DIAG. On-Ramp to SR-237 L. Off-Ramp 0.60 F 2.50
105N04144 US 101 SB SR-237 L. Off-Ramp to SR-237 DIAG. On-Ramp 0.20 F 1.25
105N04143 US 101 SB Mathilda Ave. DIAG. Off-Ramp to Mathilda Ave.
DIAG. On-Ramp0.33 F 1.75
105‐04142 US 101 SB Mathilda Ave. DIAG. On-Ramp to Fair Oaks Ave
DIAG. Off-Ramp0.52 F 1.25
105N04142 US 101 SB Fair Oaks Ave DIAG. Off-Ramp to Fair Oaks Ave
DIAG. On-Ramp0.41 F 2.50

PM Period Non‐Exempt Freeway Segments
TMC Fwy Dir Segment Length LOS Duration of Congestion (hours)
105‐04141 US 101 SB Fair Oaks Ave DIAG. On-Ramp to Lawrence Expy
DIAG. Off-Ramp0.55 F 4.00
105N04141 US 101 SB Lawrence Expy DIAG. Off-Ramp to Lawrence Expy
DIAG. On-Ramp0.39 F 5.75
105‐04140 US 101 SB Lawrence Expy DIAG. On-Ramp to Bowers Ave
DIAG. Off-Ramp0.58 F 6.00
105N04131 US 101 SB McKee Rd DIAG. On-Ramp to Alum Rock Ave
DIAG. Off-Ramp0.24 F 0.50
105‐04121 US 101 SB Bailey Ave DIAG. On-Ramp to Coyote Creek Golf
Dr DIAG. Off-Ramp1.59 F 1.75
105N04121 US 101 SB Coyote Creek Golf Dr DIAG. Off-Ramp to Coyote
Creek Golf Dr DIAG. On-Ramp0.62 F 2.25
105‐04120 US 101 SB Coyote Creek Golf Dr DIAG. On-Ramp to Cochrane
Rd DIAG. Off-Ramp2.69 F 3.00
105N04120 US 101 SB Cochrane Rd DIAG. Off-Ramp to Cochrane Rd
DIAG. On-Ramp0.77 F 2.75
105N04113 US 101 SB Monterey Rd DIAG. Off-Ramp to Monterey Rd
DIAG. On-Ramp0.50 F 1.50
105‐09872 US 101 SB Monterey Rd DIAG. On-Ramp to Castro Valley Rd 1.04 F 2.00
105‐09871 US 101 SB Castro Valley Rd to SR-25 DIAG. Off-Ramp 0.34 F 0.50
105N04328 SR 85 SB N Shoreline Blvd DIAG. On-Ramp to Moffett Blvd
L. Off-Ramp0.75 F 0.50
105‐04326 SR 85 SB Moffett Blvd L. Off-Ramp to Central Expy DIAG.
Off-Ramp0.47 F 1.75
105N04326 SR 85 SB Central Expy DIAG. Off-Ramp to Central Expy
DIAG. On-Ramp0.26 F 1.75
105N04325 SR 85 SB Evelyn Ave DIAG. Off-Ramp to Evelyn Ave DIAG.
On-Ramp0.24 F 2.00
105‐04320 SR 85 SB Homestead Rd DIAG. On-Ramp to I-280 DIAG. Off-
Ramp0.73 F 3.25
105‐04319 SR 85 SB I-280 DIAG. Off-Ramp to I-280 DIAG. On-Ramp 0.20 F 4.25
105N04319 SR 85 SB Stevens Creek Blvd DIAG. Off-Ramp to Stevens
Creek Blvd DIAG. On-Ramp0.52 F 5.00
105‐04318 SR 85 SB Stevens Creek Blvd DIAG. On-Ramp to S De Anza
Blvd DIAG. Off-Ramp1.29 F 5.00
105N04318 SR 85 SB S De Anza Blvd DIAG. Off-Ramp to S De Anza Blvd
DIAG. On-Ramp0.54 F 4.50
105‐04317 SR 85 SB S De Anza Blvd DIAG. On-Ramp to Saratoga Ave
DIAG. Off-Ramp1.58 F 4.50
105N04317 SR 85 SB Saratoga Ave DIAG. Off-Ramp to Saratoga Ave
DIAG. On-Ramp0.54 F 5.50
105‐04316 SR 85 SB Saratoga Ave DIAG. On-Ramp to Winchester Blvd
DIAG. Off-Ramp 2.19 F 1.00
105N04316 SR 85 SB Winchester Blvd DIAG. Off-Ramp to Winchester
Blvd DIAG. On-Ramp 0.28 F 1.75
105N04315 SR 85 SB SR-17 DIAG. Off-Ramp to SR-17 DIAG. On-Ramp 0.90 F 3.25

PM Period Non‐Exempt Freeway Segments
TMC Fwy Dir Segment Length LOS Duration of Congestion (hours)
105‐04313 SR 85 SB S Bascom Ave DIAG. On-Ramp to Union Ave
DIAG. Off-Ramp0.35 F 5.50
105N04313 SR 85 SB Union Ave DIAG. Off-Ramp to Union Ave DIAG.
On-Ramp0.62 F 4.25
HOV Lane Operations
There are 188 directional miles of HOV lanes throughout the freeway network in Santa Clara County,
Figure.2 shows the results of the HOV lane LOS analysis. About 50% of the HOV miles operate at or
worse than LOS D in the AM peak, while 55% of the HOV miles operate at or worse than LOS D in the
PM peak hour. In addition to the overall system HOV operations, Table 4.5 presents the total HOV
miles operating at LOS F in each freeway with HOV facilities.
FIGURE 4.2: 2017 OVERALL HOV FREEWAY SYSTEM OPERATION

TABLE 4.5 TOTAL HOV MILES WITH LOS F CATEGORIZED BY FREEWAY FACILITY
Fwy Dir Total HOV Miles LOS F AM PeriodMiles (% of Total)
LOS F PM PeriodMiles (% of Total)
SR 87 SB 7.9 4.6 (59%) 0.0 (0%)
SB 8.9 0.0 (0%) 0.2 (2%)
SR 237 EB 6.4 0.0 (0%) 4.4 (69%)
WB 5.5 3.8 (69%) 0.5 (9%)
I‐280 NB 11.8 7.9 (67%) 0.0 (0%)
SB 12.1 0.0 (0%) 8.5 (70%)
I‐880 NB 6.9 0.3 (5%) 1.9 (27%)
SB 7.0 3.0 (44%) 4.0 (58%)
I‐680 SB 2.6 0.0 (0%) 0.0 (0%)
US 101 NB 35.6 21.7 (61%) 3.1 (9%)
SB 34.0 0.0 (0%) 15.7 (46%)
SR 85 NB 24.3 13.1 (54%) 0.0 (0%)
SB 23.8 0.0 (0%) 11.1 (47%)
The results from the table show that SR 87, US 101, and SR 85 have more HOV miles operating at LOS
F in the AM peak period when compared to the PM peak period. However, SR 237, I‐280 and I‐880
have more HOV miles operating at LOS F in the PM peak period when compared to the AM peak
period. These results show the pattern of HOV lanes usage during the AM peak and PM peak periods
across the freeway facilities in the Santa Clara County.
Table4.6 and Table 4.74.7 present the list of HOV segments operating at LOS F in the AM and PM
periods, respectively. All segments in which the HOV lane operated at LOS F also had mixed flow
segments operating at LOS F for 2017 except for the following segments:
I‐280 Northbound between the Magdalena Avenue Off‐Ramp and Magdalena Avenue On‐
Ramp during the AM period
US 101 Northbound between the Bayshore Freeway and Rengstorff Avenue Off‐Ramp in the
AM period
SR 87 Southbound between the US 101 On‐Ramp and Skyport Drive Off‐Ramp during the PM
period
I‐880 Southbound between SR 237 off‐ramp and Great Mall Parkway on‐ramp in the PM
period
US 101 Northbound between the on and off ramps at Cochrane Road and Coyote Creek Gold
Drive in the PM period

US 101 Southbound between the SR 87 Off‐Ramp and Airport Parkway off‐ramp
HOV lanes experience two types of weaving movements: one in which drivers wishing to use the HOV
lane merge from the adjacent mixed flow lanes and one in which HOV drivers wishing to exit the
freeway merge into adjacent mixed flow lanes. When adjacent mixed flow lanes are congested, these
merge movements can slow down vehicles in the HOV lane. The LOS F results in the HOV lanes may
be the result of weaving movements rather than demand exceeding capacity. If this is the case,
conditions could be improved through operational improvements such as direct interchange HOV
lane connections or direct HOV‐lane‐to‐off‐ramp connections.
TABLE 4.6: HOV SEGMENTS OPERATING AT LOS F IN THE AM PERIOD
HOV Segments Operating at LOS F in the AM Period
TMC Fwy Dir Segment Length HOV LOS
105+04653 SR 87 NB Capitol Expy DIAG. On-Ramp to Curtner Ave DIAG. Off-Ramp 0.98 F
105P04653 SR 87 NB Curtner Ave DIAG. Off-Ramp to Curtner Ave DIAG. On-Ramp 0.56 F
105+04654 SR 87 NB Curtner Ave DIAG. On-Ramp to Almaden Expy DIAG. Off-Ramp 0.21 F
105P04654 SR 87 NB Almaden Expy DIAG. Off-Ramp to Almaden Expy DIAG. On-
Ramp0.24 F
105P04656 SR 87 NB I-280 DIAG. Off-Ramp to I-280 DIAG. On-Ramp 0.80 F
105P04657 SR 87 NB I-280 DIAG. On-Ramp to Santa Clara St DIAG. Off-Ramp 0.28 F
105+04658 SR 87 NB Santa Clara St DIAG. Off-Ramp to Julian St DIAG. Off-Ramp 0.12 F
105P04658 SR 87 NB Julian St DIAG. Off-Ramp to Julian St DIAG. On-Ramp 0.57 F
105+05602 SR 87 NB Julian St DIAG. On-Ramp to Taylor DIAG. Off-Ramp 0.13 F
105+05605 SR 87 NB Skyport Dr DIAG. On-Ramp to US-101 DIAG. Off-Ramp 0.36 F
105P05605 SR 87 NB US-101 DIAG. Off-Ramp to US-101 DIAG. On-Ramp 0.38 F
105N05144 SR 237 WB McCarthy Blvd DIAG. Off-Ramp to McCarthy Blvd DIAG. On-
Ramp0.57 F
105‐05143 SR 237 WB McCarthy Blvd DIAG. On-Ramp to Zanker Rd DIAG. Off-Ramp 0.29 F
105N05143 SR 237 WB Zanker Rd DIAG. Off-Ramp to Zanker Rd DIAG. On-Ramp 0.35 F
105‐05142 SR 237 WB Zanker Rd DIAG. On-Ramp to 1st DIAG. Off-Ramp 0.84 F
105‐04682 SR 237 WB America Center Dr DIAG. On-Ramp to Lawrence Expy DIAG.
Off-Ramp0.54 F
105N04682 SR 237 WB Lawrence Expy DIAG. Off-Ramp to Lawrence Expy DIAG. On-
Ramp0.66 F
105‐04681 SR 237 WB Lawrence Expy DIAG. On-Ramp to Java Dr DIAG. Off-Ramp 0.33 F
105N04681 SR 237 WB Java Dr DIAG. Off-Ramp to Java Dr DIAG. On-Ramp 0.18 F
105P04823 I 280 NB SR-280 DIAG. Off-Ramp to SR-280 DIAG. On-Ramp 0.50 F
105+04824 I 280 NB SR-280 DIAG. On-Ramp to Menker Ave DIAG. On-Ramp 0.39 F

HOV Segments Operating at LOS F in the AM Period
TMC Fwy Dir Segment Length HOV LOS
105P04824 I 280 NB Menker Ave DIAG. On-Ramp to Leland Ave DIAG. On-Ramp 0.26 F
105P04825 I 280 NB SR-17 DIAG. Off-Ramp to SR-17 DIAG. On-Ramp 0.76 F
105+04826 I 280 NB SR-17 DIAG. On-Ramp to Winchester Blvd DIAG. Off-Ramp 0.20 F
105P04826 I 280 NB Winchester Blvd DIAG. Off-Ramp to Winchester Blvd DIAG. On-
Ramp0.33 F
105+04827 I 280 NB Winchester Blvd DIAG. On-Ramp to Saratoga Ave DIAG. Off-
Ramp0.68 F
105P04827 I 280 NB Saratoga Ave DIAG. Off-Ramp to Saratoga Ave DIAG. On-Ramp 0.56 F
105+04828 I 280 NB Saratoga Ave DIAG. On-Ramp to Lawrence Expy DIAG. Off-
Ramp0.74 F
105P04828 I 280 NB Lawrence Expy DIAG. Off-Ramp to Lawrence Expy 0.28 F
105+04829 I 280 NB Lawrence Expy to Stevens Creek Blvd DIAG. Off-Ramp 0.24 F
105P04829 I 280 NB Stevens Creek Blvd DIAG. Off-Ramp to Stevens Creek Blvd
DIAG. On-Ramp0.30 F
105+04830 I 280 NB Stevens Creek Blvd DIAG. On-Ramp to Wolfe Rd DIAG. Off-
Ramp0.45 F
105+04831 I 280 NB Wolfe Rd DIAG. On-Ramp to De Anza Blvd DIAG. Off-Ramp 0.61 F
105P04831 I 280 NB De Anza Blvd DIAG. Off-Ramp to De Anza Blvd DIAG. On-Ramp 0.46 F
105+04832 I 280 NB De Anza Blvd DIAG. On-Ramp to SR-85 DIAG. Off-Ramp 0.70 F
105P04834 I 280 NB Magdalena Ave DIAG. Off-Ramp to Magdalena Ave DIAG. On-
Ramp0.47 F
105P04352 I 880 NB US-101 DIAG. Off-Ramp to US-101 DIAG. On-Ramp 0.34 F
105N04358 I 880 SB Dixon Landing DIAG. Off-Ramp to Dixon Landing DIAG. On-
Ramp0.64 F
105‐04357 I 880 SB Dixon Landing DIAG. On-Ramp to SR-237 DIAG. Off-Ramp 1.13 F
105‐04353 I 880 SB Brokaw Rd DIAG. On-Ramp to Old Bayshore Hwy DIAG. Off-
Ramp0.46 F
105N04353 I 880 SB Old Bayshore Hwy DIAG. Off-Ramp to Old Bayshore Hwy L. On-
Ramp0.32 F
105‐04352 I 880 SB Old Bayshore Hwy L. On-Ramp to US-101 L. On-Ramp 0.18 F
105N04352 I 880 SB US-101 L. On-Ramp to US-101 DIAG. On-Ramp 0.19 F
105‐04351 I 880 SB US-101 DIAG. On-Ramp to 1st St DIAG. Off-Ramp 0.12 F
105P04124 US 101 NB Silver Creek Valley Rd DIAG. Off-Ramp to Silver Creek Valley
Rd DIAG. On-Ramp0.77 F
105+04125 US 101 NB Silver Creek Valley Rd DIAG. On-Ramp to Hellyer Ave DIAG.
Off-Ramp1.34 F
105P04125 US 101 NB Hellyer Ave DIAG. Off-Ramp to Hellyer Ave L. On-Ramp 0.27 F
105+04126 US 101 NB Hellyer Ave L. On-Ramp to Yerba Buena Rd L. Off-Ramp 0.70 F
105P04126 US 101 NB Yerba Buena Rd L. Off-Ramp to Capitol Expy DIAG. Off-Ramp 0.18 F
105P04127 US 101 NB Capitol Expy DIAG. Off-Ramp to Capitol Expy DIAG. On-Ramp 0.97 F

HOV Segments Operating at LOS F in the AM Period
TMC Fwy Dir Segment Length HOV LOS
105+04128 US 101 NB Capitol Expy DIAG. On-Ramp to Tully Rd DIAG. Off-Ramp 0.64 F
105+04129 US 101 NB Tully Rd DIAG. On-Ramp to I-680 DIAG. Off-Ramp 0.97 F
105P04129 US 101 NB I-680 DIAG. Off-Ramp to I-680 DIAG. On-Ramp 0.79 F
105+04131 US 101 NB I-680 DIAG. On-Ramp to Alum Rock Ave 0.53 F
105P04132 US 101 NB Alum Rock Ave DIAG. Off-Ramp to McKee Rd DIAG. On-Ramp 0.75 F
105+04133 US 101 NB McKee Rd DIAG. On-Ramp to Oakland Rd DIAG. Off-Ramp 1.14 F
105P04133 US 101 NB Oakland Rd DIAG. Off-Ramp to Oakland Rd DIAG. On-Ramp 0.41 F
105+04134 US 101 NB Oakland Rd DIAG. On-Ramp to I-880 DIAG. Off-Ramp 0.15 F
105P04134 US 101 NB I-880 DIAG. Off-Ramp to I-880 L. On-Ramp 0.22 F
105+04135 US 101 NB I-880 L. On-Ramp to Old Bayshore Hwy DIAG. On-Ramp 0.34 F
105P04135 US 101 NB Old Bayshore Hwy DIAG. On-Ramp to Old Bayshore Hwy DIAG.
Off-Ramp0.23 F
105+04136 US 101 NB Old Bayshore Hwy DIAG. Off-Ramp to Brokaw Rd DIAG. Off-
Ramp0.20 F
105P04136 US 101 NB Brokaw Rd DIAG. Off-Ramp to Brokaw Rd DIAG. On-Ramp 0.63 F
105P04137 US 101 NB Trimble Rd DIAG. Off-Ramp to SR-87 DIAG. On-Ramp 0.45 F
105+04138 US 101 NB SR-87 DIAG. On-Ramp to Trimble Rd DIAG. Off-Ramp 0.28 F
105P04138 US 101 NB Trimble Rd DIAG. Off-Ramp to Trimble Rd DIAG. On-Ramp 0.43 F
105+04139 US 101 NB Trimble Rd DIAG. On-Ramp to San Tomas Expy DIAG. Off-
Ramp0.70 F
105P04139 US 101 NB San Tomas Expy DIAG. Off-Ramp to San Tomas Expy DIAG. On-
Ramp0.64 F
105P04140 US 101 NB America Pkwy DIAG. Off-Ramp to America Pkwy DIAG. On-
Ramp0.65 F
105+04141 US 101 NB America Pkwy DIAG. On-Ramp to Lawrence Expy DIAG. Off-
Ramp0.58 F
105P04141 US 101 NB Lawrence Expy DIAG. Off-Ramp to Lawrence Expy DIAG. On-
Ramp0.39 F
105+04142 US 101 NB Lawrence Expy DIAG. On-Ramp to Fair Oaks Avenue DIAG. Off-
Ramp0.65 F
105P04142 US 101 NB Fair Oaks Avenue DIAG. Off-Ramp to Fair Oaks Avenue DIAG.
On-Ramp0.29 F
105+04143 US 101 NB Fair Oaks Avenue DIAG. On-Ramp to Mathilda Ave DIAG. Off-
Ramp0.52 F
105+04144 US 101 NB Mathilda Ave L. Off-Ramp to Southbay Fwy L. Off-Ramp 0.43 F
105+04145 US 101 NB Southbay Fwy DIAG. Off-Ramp to Ellis St DIAG. Off-Ramp 0.46 F
105P04145 US 101 NB Ellis St DIAG. Off-Ramp to Ellis St DIAG. On-Ramp 0.60 F
105+04146 US 101 NB Ellis St DIAG. On-Ramp to Moffett Blvd DIAG. Off-Ramp 0.32 F
105P04147 US 101 NB Moffett Blvd L. On-Ramp to Shoreline Blvd DIAG. Off-Ramp 0.25 F
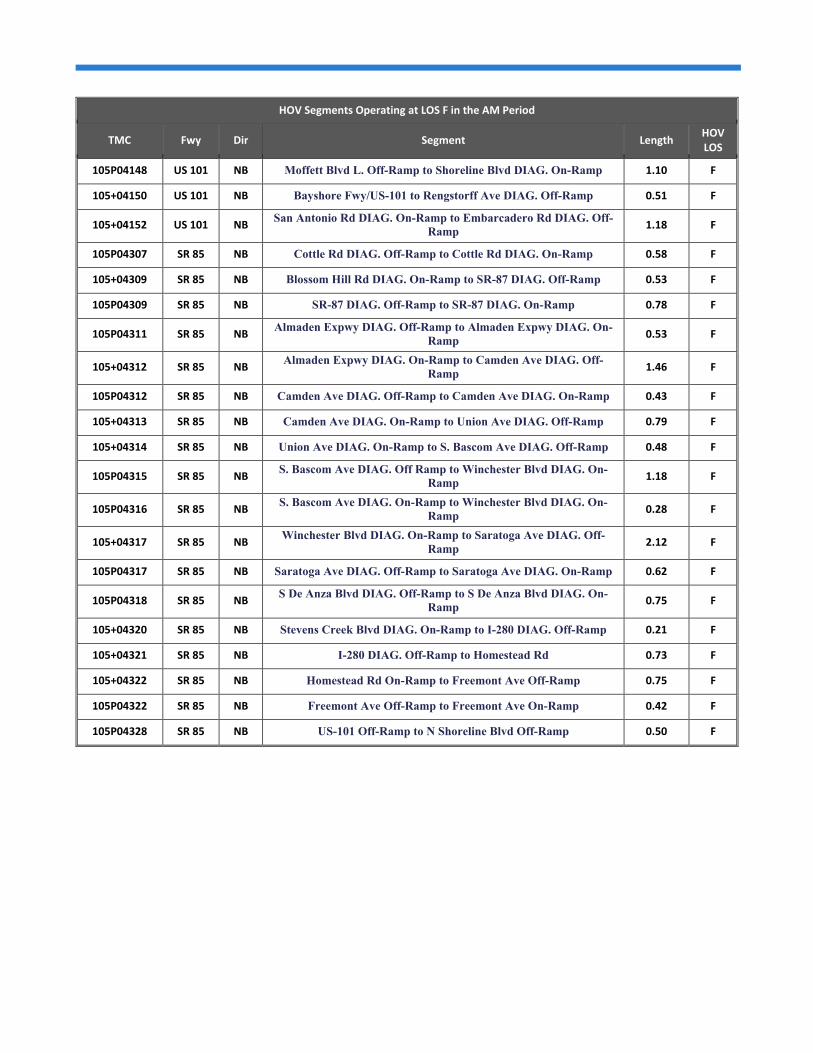
HOV Segments Operating at LOS F in the AM Period
TMC Fwy Dir Segment Length HOV LOS
105P04148 US 101 NB Moffett Blvd L. Off-Ramp to Shoreline Blvd DIAG. On-Ramp 1.10 F
105+04150 US 101 NB Bayshore Fwy/US-101 to Rengstorff Ave DIAG. Off-Ramp 0.51 F
105+04152 US 101 NB San Antonio Rd DIAG. On-Ramp to Embarcadero Rd DIAG. Off-
Ramp1.18 F
105P04307 SR 85 NB Cottle Rd DIAG. Off-Ramp to Cottle Rd DIAG. On-Ramp 0.58 F
105+04309 SR 85 NB Blossom Hill Rd DIAG. On-Ramp to SR-87 DIAG. Off-Ramp 0.53 F
105P04309 SR 85 NB SR-87 DIAG. Off-Ramp to SR-87 DIAG. On-Ramp 0.78 F
105P04311 SR 85 NB Almaden Expwy DIAG. Off-Ramp to Almaden Expwy DIAG. On-
Ramp0.53 F
105+04312 SR 85 NB Almaden Expwy DIAG. On-Ramp to Camden Ave DIAG. Off-
Ramp1.46 F
105P04312 SR 85 NB Camden Ave DIAG. Off-Ramp to Camden Ave DIAG. On-Ramp 0.43 F
105+04313 SR 85 NB Camden Ave DIAG. On-Ramp to Union Ave DIAG. Off-Ramp 0.79 F
105+04314 SR 85 NB Union Ave DIAG. On-Ramp to S. Bascom Ave DIAG. Off-Ramp 0.48 F
105P04315 SR 85 NB S. Bascom Ave DIAG. Off Ramp to Winchester Blvd DIAG. On-
Ramp1.18 F
105P04316 SR 85 NB S. Bascom Ave DIAG. On-Ramp to Winchester Blvd DIAG. On-
Ramp0.28 F
105+04317 SR 85 NB Winchester Blvd DIAG. On-Ramp to Saratoga Ave DIAG. Off-
Ramp2.12 F
105P04317 SR 85 NB Saratoga Ave DIAG. Off-Ramp to Saratoga Ave DIAG. On-Ramp 0.62 F
105P04318 SR 85 NB S De Anza Blvd DIAG. Off-Ramp to S De Anza Blvd DIAG. On-
Ramp0.75 F
105+04320 SR 85 NB Stevens Creek Blvd DIAG. On-Ramp to I-280 DIAG. Off-Ramp 0.21 F
105+04321 SR 85 NB I-280 DIAG. Off-Ramp to Homestead Rd 0.73 F
105+04322 SR 85 NB Homestead Rd On-Ramp to Freemont Ave Off-Ramp 0.75 F
105P04322 SR 85 NB Freemont Ave Off-Ramp to Freemont Ave On-Ramp 0.42 F
105P04328 SR 85 NB US-101 Off-Ramp to N Shoreline Blvd Off-Ramp 0.50 F

TABLE 4.7: HOV SEGMENTS OPERATING AT LOS F IN THE PM PERIOD
HOV Segments Operating at LOS F in the PM Period
TMC Fwy Dir Segment Length HOV LOS
105‐05604 SR 87 SB US-101 DIAG. On-Ramp to Skyport Dr DIAG. Off-Ramp 0.17 F
105P04680 SR 237 EB Mathilda Ave DIAG. Off-Ramp to Mathilda Ave DIAG. On-
Ramp0.46 F
105+04681 SR 237 EB Mathilda Ave DIAG. On-Ramp to Fair Oaks Way DIAG.
Off-Ramp0.54 F
105P04681 SR 237 EB Fair Oaks Way DIAG. Off-Ramp to Fair Oaks Way L. On-
Ramp0.21 F
105+04682 SR 237 EB Fair Oaks Way L. On-Ramp to Lawrence Expy DIAG. Off-
Ramp0.30 F
105P04682 SR 237 EB Lawrence Expy DIAG. Off-Ramp to Lawrence Expy DIAG.
On-Ramp0.61 F
105+05140 SR 237 EB Lawrence Expy DIAG. On-Ramp to Great America Pkwy
DIAG. Off-Ramp0.60 F
105P05140 SR 237 EB Great America Pkwy DIAG. Off-Ramp to Great America
Pkwy DIAG. On-Ramp0.81 F
105+05142 SR 237 EB Great America Pkwy DIAG. On-Ramp to 1st L. Off-Ramp 0.55 F
105P05142 SR 237 EB 1st L. Off-Ramp to 1st DIAG. On-Ramp 0.33 F
105‐04681 SR 237 WB Lawrence Expy DIAG. On-Ramp to Java Dr DIAG. Off-
Ramp0.33 F
105N04681 SR 237 WB Java Dr DIAG. Off-Ramp to Java Dr DIAG. On-Ramp 0.18 F
105N04834 I 280 SB Magdalena Ave DIAG. Off-Ramp to Magdalena Ave L. On-
Ramp0.38 F
105N04833 I 280 SB Foothill Blvd DIAG. Off-Ramp to Foothill Blvd DIAG. On-
Ramp0.46 F
105‐04832 I 280 SB Foothill Blvd DIAG. On-Ramp to SR-85 DIAG. Off-Ramp 0.26 F
105N04832 I 280 SB SR-85 DIAG. Off-Ramp to SR-85 DIAG. On-Ramp 0.75 F
105‐04831 I 280 SB SR-85 DIAG. On-Ramp to De Anza Blvd DIAG. Off-Ramp 0.57 F
105N04831 I 280 SB De Anza Blvd DIAG. Off-Ramp to De Anza Blvd DIAG. On-
Ramp0.46 F
105‐04830 I 280 SB De Anza Blvd DIAG. On-Ramp to Wolfe Rd DIAG. Off-
Ramp0.63 F
105N04830 I 280 SB Wolfe Rd DIAG. Off-Ramp to Wolfe Rd DIAG. On-Ramp 0.41 F
105‐04829 I 280 SB Wolfe Rd DIAG. On-Ramp to Stevens Creek Blvd DIAG.
Off-Ramp0.39 F
105N04829 I 280 SB Stevens Creek Blvd DIAG. Off-Ramp to Stevens Creek Blvd 0.34 F
105‐04828 I 280 SB Stevens Creek Blvd to Stevens Creek Blvd DIAG. On-Ramp 0.28 F
105N04828 I 280 SB Stevens Creek Blvd DIAG. On-Ramp to Lawrence Expy
DIAG. On-Ramp0.23 F
105‐04827 I 280 SB Lawrence Expy DIAG. On-Ramp to Saratoga Ave DIAG.
Off-Ramp0.71 F
105N04826 I 280 SB Winchester Blvd DIAG. Off-Ramp to Winchester Blvd 0.31 F
105‐04825 I 280 SB Winchester Blvd to SR-17 DIAG. Off-Ramp 0.11 F
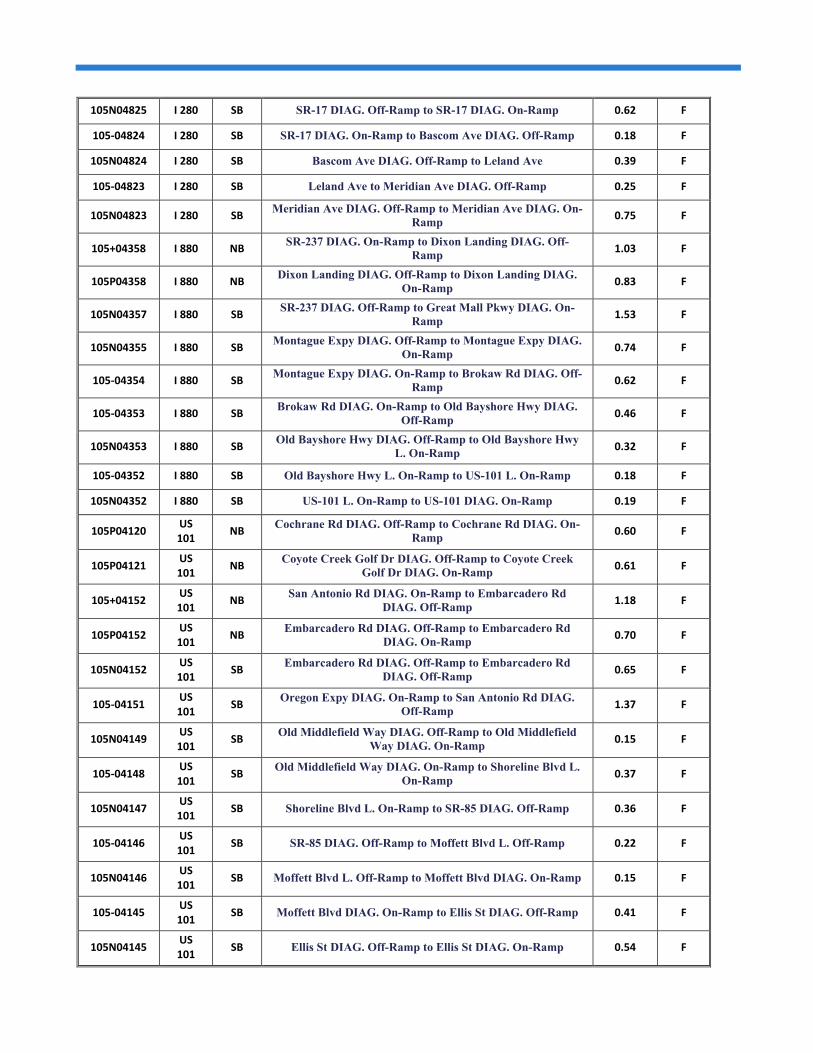
105N04825 I 280 SB SR-17 DIAG. Off-Ramp to SR-17 DIAG. On-Ramp 0.62 F
105‐04824 I 280 SB SR-17 DIAG. On-Ramp to Bascom Ave DIAG. Off-Ramp 0.18 F
105N04824 I 280 SB Bascom Ave DIAG. Off-Ramp to Leland Ave 0.39 F
105‐04823 I 280 SB Leland Ave to Meridian Ave DIAG. Off-Ramp 0.25 F
105N04823 I 280 SB Meridian Ave DIAG. Off-Ramp to Meridian Ave DIAG. On-
Ramp0.75 F
105+04358 I 880 NB SR-237 DIAG. On-Ramp to Dixon Landing DIAG. Off-
Ramp1.03 F
105P04358 I 880 NB Dixon Landing DIAG. Off-Ramp to Dixon Landing DIAG.
On-Ramp0.83 F
105N04357 I 880 SB SR-237 DIAG. Off-Ramp to Great Mall Pkwy DIAG. On-
Ramp1.53 F
105N04355 I 880 SB Montague Expy DIAG. Off-Ramp to Montague Expy DIAG.
On-Ramp0.74 F
105‐04354 I 880 SB Montague Expy DIAG. On-Ramp to Brokaw Rd DIAG. Off-
Ramp0.62 F
105‐04353 I 880 SB Brokaw Rd DIAG. On-Ramp to Old Bayshore Hwy DIAG.
Off-Ramp0.46 F
105N04353 I 880 SB Old Bayshore Hwy DIAG. Off-Ramp to Old Bayshore Hwy
L. On-Ramp0.32 F
105‐04352 I 880 SB Old Bayshore Hwy L. On-Ramp to US-101 L. On-Ramp 0.18 F
105N04352 I 880 SB US-101 L. On-Ramp to US-101 DIAG. On-Ramp 0.19 F
105P04120 US 101
NB Cochrane Rd DIAG. Off-Ramp to Cochrane Rd DIAG. On-
Ramp 0.60 F
105P04121 US 101
NB Coyote Creek Golf Dr DIAG. Off-Ramp to Coyote Creek
Golf Dr DIAG. On-Ramp 0.61 F
105+04152 US 101
NB San Antonio Rd DIAG. On-Ramp to Embarcadero Rd
DIAG. Off-Ramp 1.18 F
105P04152 US 101
NB Embarcadero Rd DIAG. Off-Ramp to Embarcadero Rd
DIAG. On-Ramp 0.70 F
105N04152 US 101
SB Embarcadero Rd DIAG. Off-Ramp to Embarcadero Rd
DIAG. Off-Ramp 0.65 F
105‐04151 US 101
SB Oregon Expy DIAG. On-Ramp to San Antonio Rd DIAG.
Off-Ramp 1.37 F
105N04149 US 101
SB Old Middlefield Way DIAG. Off-Ramp to Old Middlefield
Way DIAG. On-Ramp 0.15 F
105‐04148 US 101
SB Old Middlefield Way DIAG. On-Ramp to Shoreline Blvd L.
On-Ramp 0.37 F
105N04147 US 101
SB Shoreline Blvd L. On-Ramp to SR-85 DIAG. Off-Ramp 0.36 F
105‐04146 US 101
SB SR-85 DIAG. Off-Ramp to Moffett Blvd L. Off-Ramp 0.22 F
105N04146 US 101
SB Moffett Blvd L. Off-Ramp to Moffett Blvd DIAG. On-Ramp 0.15 F
105‐04145 US 101
SB Moffett Blvd DIAG. On-Ramp to Ellis St DIAG. Off-Ramp 0.41 F
105N04145 US 101
SB Ellis St DIAG. Off-Ramp to Ellis St DIAG. On-Ramp 0.54 F
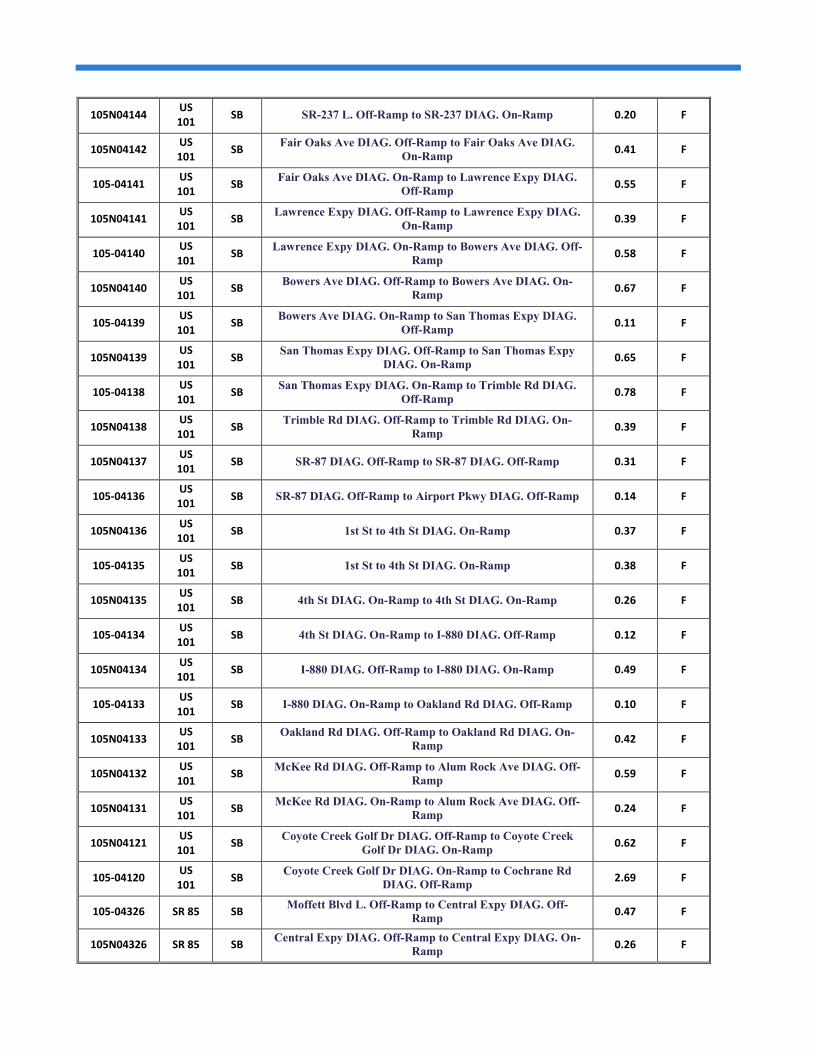
105N04144 US 101
SB SR-237 L. Off-Ramp to SR-237 DIAG. On-Ramp 0.20 F
105N04142 US 101
SB Fair Oaks Ave DIAG. Off-Ramp to Fair Oaks Ave DIAG.
On-Ramp 0.41 F
105‐04141 US 101
SB Fair Oaks Ave DIAG. On-Ramp to Lawrence Expy DIAG.
Off-Ramp 0.55 F
105N04141 US 101
SB Lawrence Expy DIAG. Off-Ramp to Lawrence Expy DIAG.
On-Ramp 0.39 F
105‐04140 US 101
SB Lawrence Expy DIAG. On-Ramp to Bowers Ave DIAG. Off-
Ramp 0.58 F
105N04140 US 101
SB Bowers Ave DIAG. Off-Ramp to Bowers Ave DIAG. On-
Ramp 0.67 F
105‐04139 US 101
SB Bowers Ave DIAG. On-Ramp to San Thomas Expy DIAG.
Off-Ramp 0.11 F
105N04139 US 101
SB San Thomas Expy DIAG. Off-Ramp to San Thomas Expy
DIAG. On-Ramp 0.65 F
105‐04138 US 101
SB San Thomas Expy DIAG. On-Ramp to Trimble Rd DIAG.
Off-Ramp 0.78 F
105N04138 US 101
SB Trimble Rd DIAG. Off-Ramp to Trimble Rd DIAG. On-
Ramp 0.39 F
105N04137 US 101
SB SR-87 DIAG. Off-Ramp to SR-87 DIAG. Off-Ramp 0.31 F
105‐04136 US 101
SB SR-87 DIAG. Off-Ramp to Airport Pkwy DIAG. Off-Ramp 0.14 F
105N04136 US 101
SB 1st St to 4th St DIAG. On-Ramp 0.37 F
105‐04135 US 101
SB 1st St to 4th St DIAG. On-Ramp 0.38 F
105N04135 US 101
SB 4th St DIAG. On-Ramp to 4th St DIAG. On-Ramp 0.26 F
105‐04134 US 101
SB 4th St DIAG. On-Ramp to I-880 DIAG. Off-Ramp 0.12 F
105N04134 US 101
SB I-880 DIAG. Off-Ramp to I-880 DIAG. On-Ramp 0.49 F
105‐04133 US 101
SB I-880 DIAG. On-Ramp to Oakland Rd DIAG. Off-Ramp 0.10 F
105N04133 US 101
SB Oakland Rd DIAG. Off-Ramp to Oakland Rd DIAG. On-
Ramp 0.42 F
105N04132 US 101
SB McKee Rd DIAG. Off-Ramp to Alum Rock Ave DIAG. Off-
Ramp 0.59 F
105N04131 US 101
SB McKee Rd DIAG. On-Ramp to Alum Rock Ave DIAG. Off-
Ramp 0.24 F
105N04121 US 101
SB Coyote Creek Golf Dr DIAG. Off-Ramp to Coyote Creek
Golf Dr DIAG. On-Ramp 0.62 F
105‐04120 US 101
SB Coyote Creek Golf Dr DIAG. On-Ramp to Cochrane Rd
DIAG. Off-Ramp 2.69 F
105‐04326 SR 85 SB Moffett Blvd L. Off-Ramp to Central Expy DIAG. Off-
Ramp0.47 F
105N04326 SR 85 SB Central Expy DIAG. Off-Ramp to Central Expy DIAG. On-
Ramp0.26 F

105N04324 SR 85 SB SR-237 DIAG. Off-Ramp to SR-237 L. On-Ramp 0.27 F
105‐04323 SR 85 SB SR-237 L. On-Ramp to El Camino Real L. On-Ramp 0.34 F
105‐04320 SR 85 SB Homestead Rd DIAG. On-Ramp to I-280 DIAG. Off-Ramp 0.73 F
105‐04319 SR 85 SB I-280 DIAG. Off-Ramp to I-280 DIAG. On-Ramp 0.20 F
105N04319 SR 85 SB Stevens Creek Blvd DIAG. Off-Ramp to Stevens Creek Blvd
DIAG. On-Ramp0.52 F
105‐04318 SR 85 SB Stevens Creek Blvd DIAG. On-Ramp to S De Anza Blvd
DIAG. Off-Ramp1.29 F
105N04318 SR 85 SB S De Anza Blvd DIAG. Off-Ramp to S De Anza Blvd DIAG.
On-Ramp0.54 F
105‐04317 SR 85 SB S De Anza Blvd DIAG. On-Ramp to Saratoga Ave DIAG.
Off-Ramp1.58 F
105N04317 SR 85 SB Saratoga Ave DIAG. Off-Ramp to Saratoga Ave DIAG. On-
Ramp0.54 F
105‐04316 SR 85 SB Saratoga Ave DIAG. On-Ramp to Winchester Blvd DIAG.
Off-Ramp2.19 F
105N04316 SR 85 SB Winchester Blvd DIAG. Off-Ramp to Winchester Blvd
DIAG. On-Ramp0.28 F
105N04315 SR 85 SB SR-17 DIAG. Off-Ramp to SR-17 DIAG. On-Ramp 0.90 F
105‐04313 SR 85 SB S Bascom Ave DIAG. On-Ramp to Union Ave DIAG. Off-
Ramp0.35 F
105N04313 SR 85 SB Union Ave DIAG. Off-Ramp to Union Ave DIAG. On-Ramp 0.62 F

DURATION OF CONGESTION
As the traffic demand increases on the roadway and exceeds the capacity, the peak period must
extend in duration to serve the excess demand. The duration of congestion is a performance measure
that supplements the LOS measure in assessing the congestion levels on the freeway facility. It gives
additional information on how long each segment on a freeway was congested during the AM and
PM periods.
The duration of congestion was calculated as the length of time per day in the AM and PM period
that the travel speeds were less than 30 mph. The 30‐mph threshold for this analysis is equivalent to
the threshold for LOS F conditions on freeway facilities based on Error! Reference source not found..
Figure 1.3 shows the freeway congestion in Santa Clara County stratified by the duration of
congestion. As shown in this figure, 28 miles or 26% of Santa Clara freeway miles are congested for
more than three hours in the AM period between 5 AM and noon. While the PM period has less
overall congestion with 97 miles showing congestion, more than 50% of freeway miles (49.5 miles)
are congested for more than three hours.
Figure 4.4 shows the percent of the freeway system experiencing congestion in the AM and PM
periods. About 65% of the 310‐mile freeway system experiences no congestion in the AM period and
69% experiences none in the PM period. However, 9% and 16% of the freeway miles are congested
for three or more hours during the AM and PM periods, respectively.
FIGURE 1.3: SANTA CLARA FREEWAY CONGESTION STRATIFIED BY DURATION OF CONGESTION

FIGURE 4.4 SANTA CLARA FREEWAY CONGESTION DURATION AS A PERCENT OF TOTAL DIRECTIONAL MILES
In addition to the overall freeway system congestion in Santa Clara County, the number of congested
miles were calculated for each freeway facility, categorized by the duration of congestion. The
findings for the various facilities are shown graphically in pie charts showing the percentage of each
freeway facility miles congested for different time periods in the AM and PM periods in Figure 4.5
through Figure 4.8.
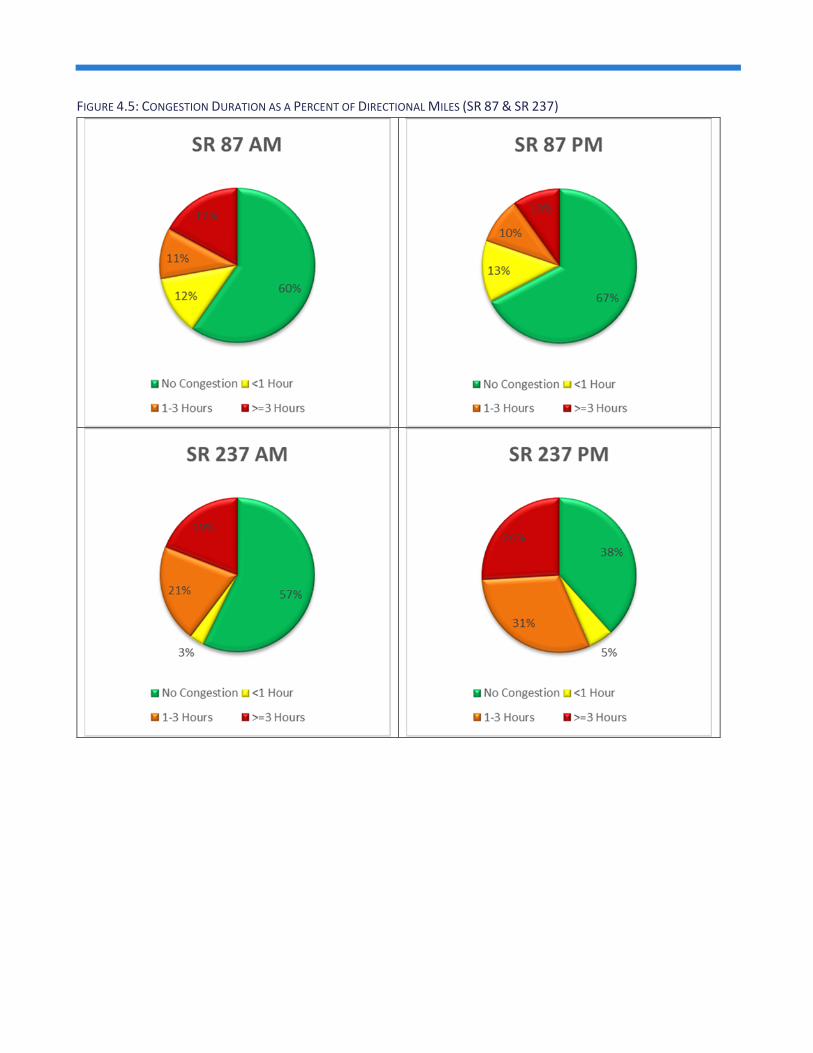
FIGURE 4.5: CONGESTION DURATION AS A PERCENT OF DIRECTIONAL MILES (SR 87 & SR 237)
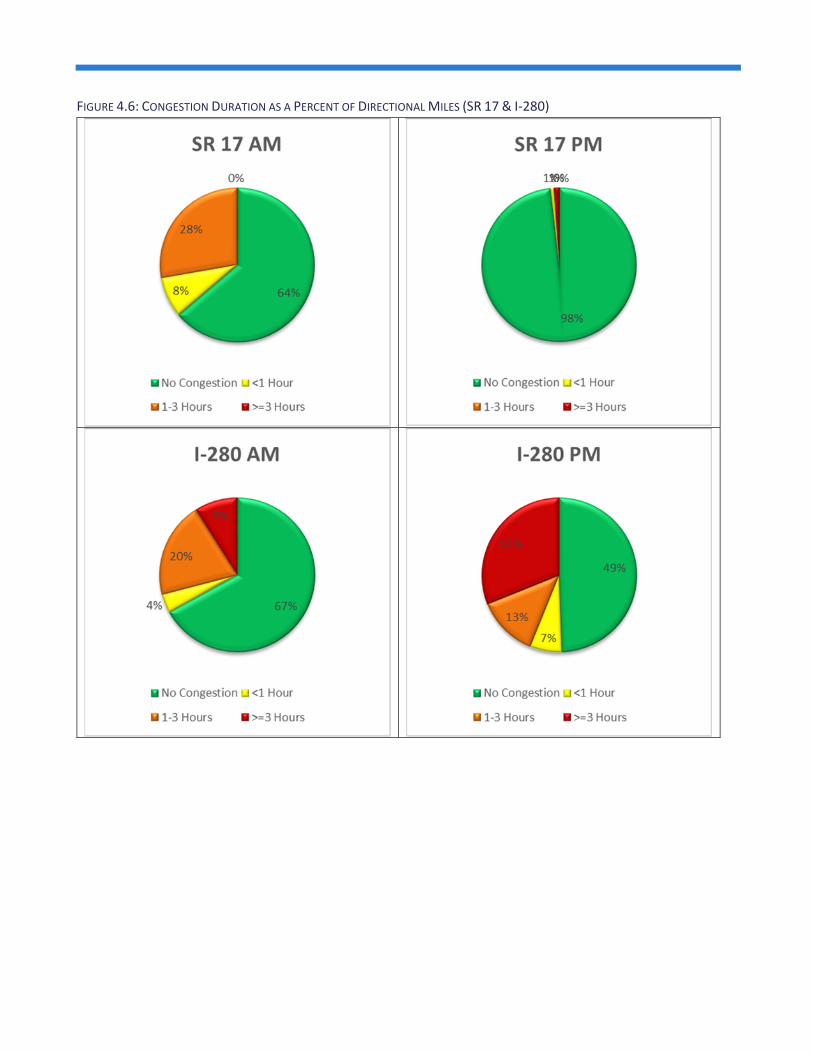
FIGURE 4.6: CONGESTION DURATION AS A PERCENT OF DIRECTIONAL MILES (SR 17 & I‐280)

FIGURE 4.7: CONGESTION DURATION AS A PERCENT OF DIRECTIONAL MILES (I‐880 & I‐680)

FIGURE 4.8: CONGESTION DURATION AS A PERCENT OF DIRECTIONAL MILES (US 101 & SR 85)
2017 MONITORING AND
CONFORMANCE REPORT
CHAPTER 5
GATEWAYS

Chapter Five – Gateway Counts Gateways and Count Methodology
Santa Clara County has, in effect, four “gateways.” These gateways are the locations through which
traffic from other parts of the region enter and exit Santa Clara County. The four gateways and the
freeways that serve them are:
Peninsula: This gateway connects Santa Clara County to destinations on the peninsula
including San Mateo County and San Francisco. The freeways serving this gateway are US 101
and I‐280.
East Bay: Connecting Santa Clara County to the East Bay counties of Alameda and Contra
Costa. This connection is primarily served by I‐680 and I‐880.
Santa Cruz: This gateway connects to the southwest and includes Santa Cruz County. SR 17 is
the primary freeway connection.
Southern: The fourth gateway connects Santa Clara County to the southern counties of San
Benito and Monterey. This connection is primarily served by US 101.
These four gateways are served by six (6) freeways. In addition to the INRIX speed data, direct ground
traffic counts were collected at these freeway locations at or near the county line. Observations were
made using video recording techniques, with manual counts of vehicles conducted via review of the
videos. Counts for 2017 were conducted for four hours while previous studies collected three hours
of data. The reason for this change was to better capture the peak spreading of traffic volumes as
freeways get more congested. The new counts were conducted between 6:00 AM and 10:00 AM and
3:30 PM and 7:30 PM. Counts for previous years were between 6:30 AM and 9:30 AM and 3:30 PM
and 6:30 PM. Since this is the first year the extra hour of counts has been collected, the comparisons
presented below are still based on the original 3‐hour data collection period. As the CMP progresses
to the 2018 study and beyond, the year‐to‐year comparisons are anticipated to use the full 4‐hour
data collection started in 2017.
Freeway Gateway Volumes for the AM Peak Period
Freeway gateway volumes have been separated between inflows and outflows during the AM peak
period since 2010. Table 5.1 presents a comparison between the counts performed in 2016 and those
from 2017. The total inflow gateway volumes during the 2017 AM peak period decreased by 2.5%
compared to 2016 volumes. Total outflow volumes increased by 1.8% overall. The ratio of inflow to
outflow during the AM peak period changed from 1.39 in 2016 to 1.33 in 2017, indicating 2017 is
more balanced between inflows and outflows. These numbers account only for the volumes on
freeways at each gateway and are not intended to represent total gateway flows. A true “screenline”
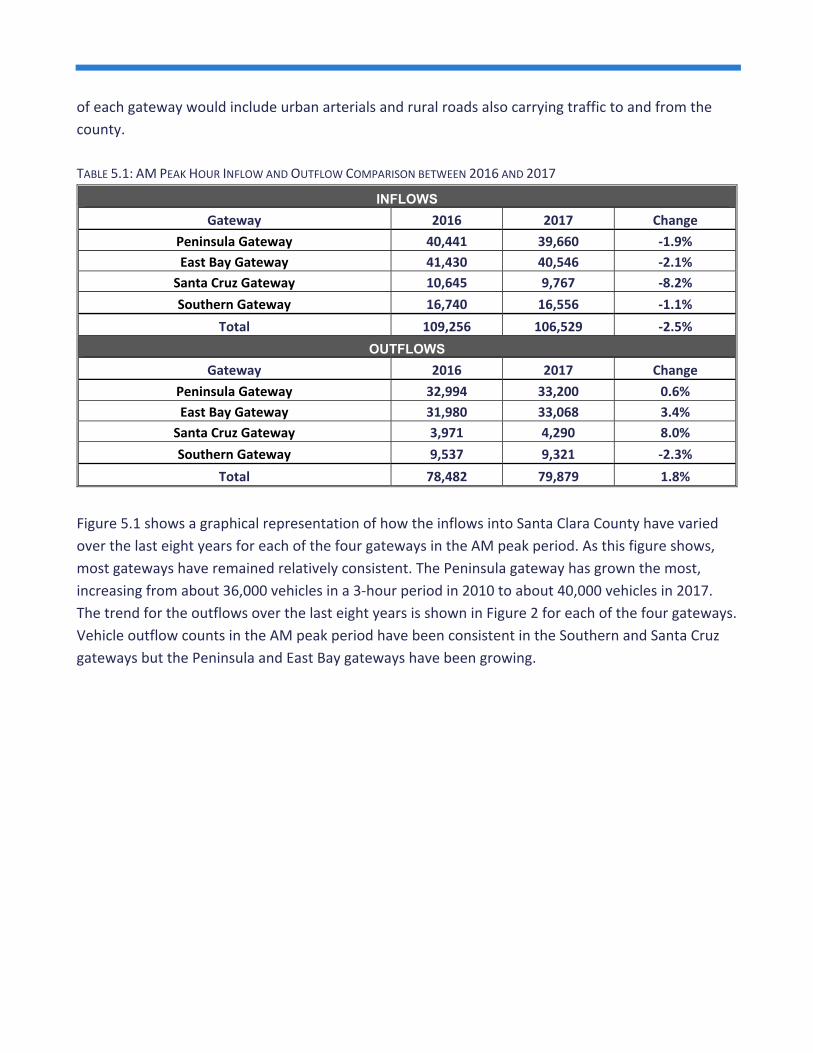
of each gateway would include urban arterials and rural roads also carrying traffic to and from the
county.
TABLE 5.1: AM PEAK HOUR INFLOW AND OUTFLOW COMPARISON BETWEEN 2016 AND 2017
INFLOWS
Gateway 2016 2017 Change
Peninsula Gateway 40,441 39,660 ‐1.9%
East Bay Gateway 41,430 40,546 ‐2.1%
Santa Cruz Gateway 10,645 9,767 ‐8.2%
Southern Gateway 16,740 16,556 ‐1.1%
Total 109,256 106,529 ‐2.5%
OUTFLOWS
Gateway 2016 2017 Change
Peninsula Gateway 32,994 33,200 0.6%
East Bay Gateway 31,980 33,068 3.4%
Santa Cruz Gateway 3,971 4,290 8.0%
Southern Gateway 9,537 9,321 ‐2.3%
Total 78,482 79,879 1.8%
Figure 5.1 shows a graphical representation of how the inflows into Santa Clara County have varied
over the last eight years for each of the four gateways in the AM peak period. As this figure shows,
most gateways have remained relatively consistent. The Peninsula gateway has grown the most,
increasing from about 36,000 vehicles in a 3‐hour period in 2010 to about 40,000 vehicles in 2017.
The trend for the outflows over the last eight years is shown in Figure 2 for each of the four gateways.
Vehicle outflow counts in the AM peak period have been consistent in the Southern and Santa Cruz
gateways but the Peninsula and East Bay gateways have been growing.
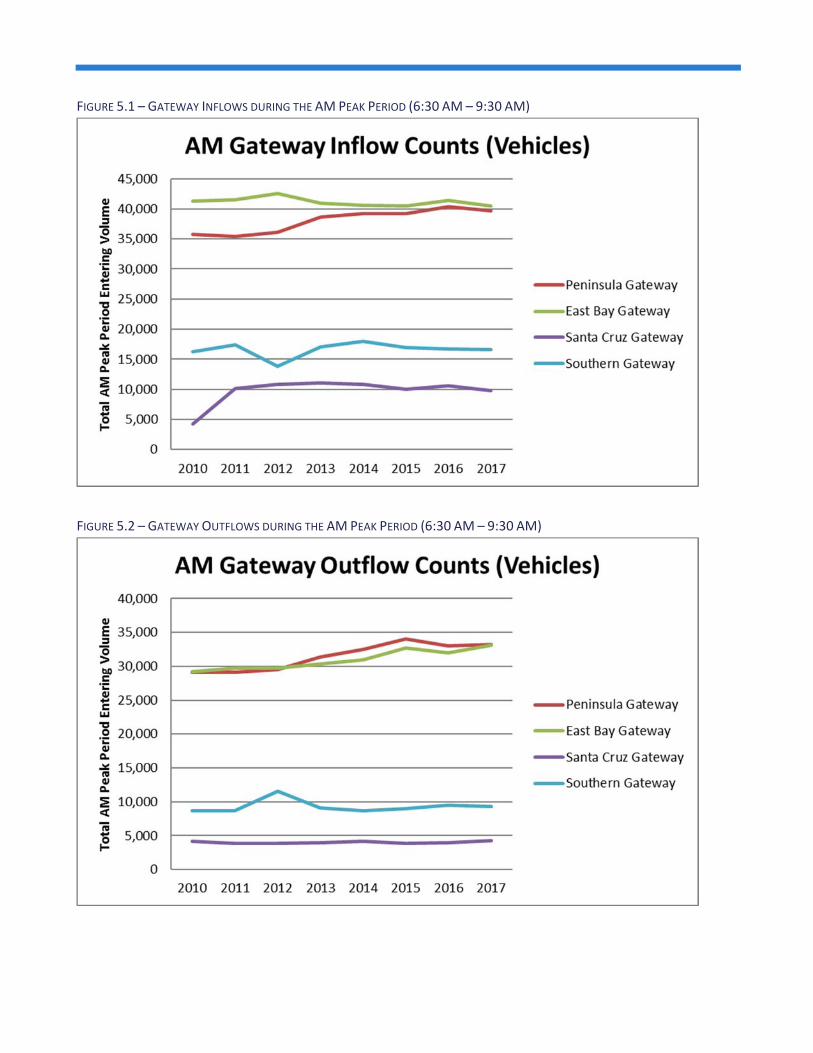
FIGURE 5.1 – GATEWAY INFLOWS DURING THE AM PEAK PERIOD (6:30 AM – 9:30 AM)
FIGURE 5.2 – GATEWAY OUTFLOWS DURING THE AM PEAK PERIOD (6:30 AM – 9:30 AM)

In addition to comparing gateway volumes, Figure 5.3 shows a comparison between the total inflow and
outflow from Santa Clara County at the four gateways during the AM peak period. This figure also shows the
percent difference between inflows and outflows. On average, vehicles entering Santa Clara County in the AM
peak period account for approximately 28% more vehicles than vehicles leaving Santa Clara County.
FIGURE 5.3 – COMPARISON OF TOTAL GATEWAY INFLOWS AND OUTFLOWS IN THE AM PEAK PERIOD (6:30 AM – 9:30 AM)
Freeway Gateway Volumes for the PM Peak Period
PM peak period gateway volume information also been compiled since 2010. Table 5.2 presents a
comparison between the 2017 counts performed for this study and those conducted for 2016. The
total inflow gateway volumes during the PM peak period increased by 2.2% since 2016. Total outflow
volumes also showed an increase of 0.5% in the volume of vehicles leaving Santa Clara County via the
six freeways. This has resulted in a change from about 0.78 entering vehicles for every exiting vehicle
in 2016 to 0.79 in 2017. These numbers account only for the volumes on freeways at each gateway
and are not representative of total gateway flows. A screenline of each gateway would include urban
arterials and rural roads carrying traffic to and from the county.
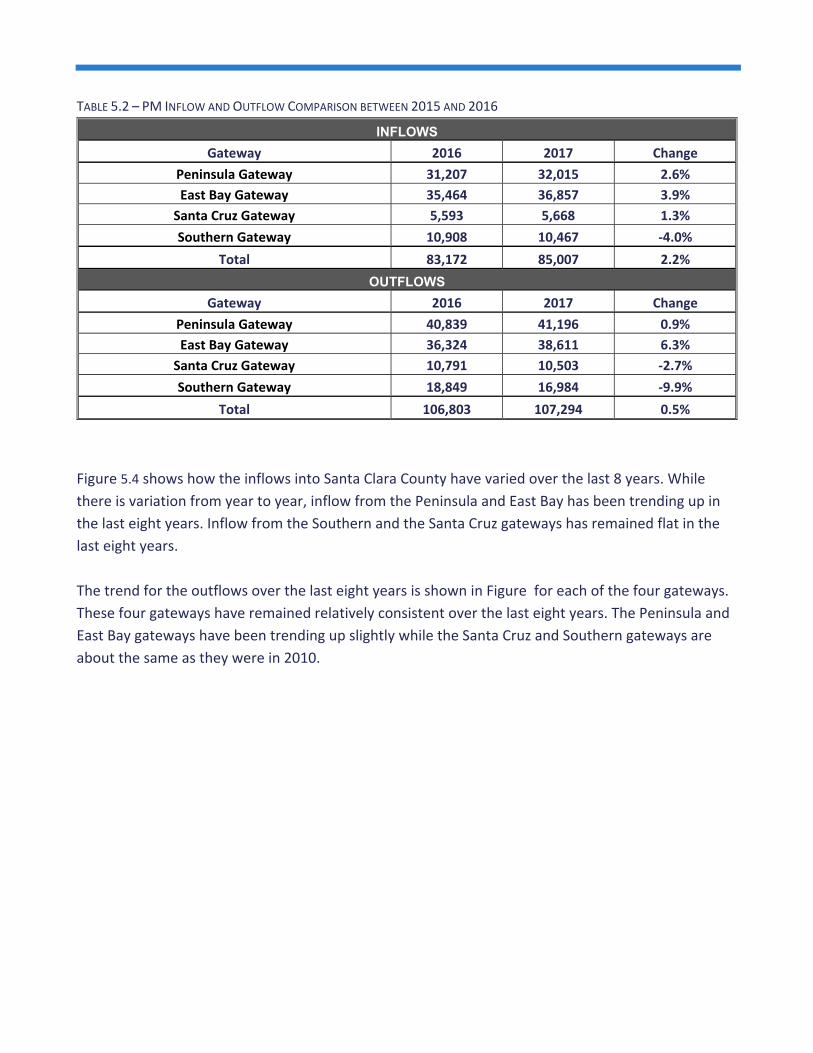
TABLE 5.2 – PM INFLOW AND OUTFLOW COMPARISON BETWEEN 2015 AND 2016
INFLOWS
Gateway 2016 2017 Change
Peninsula Gateway 31,207 32,015 2.6%
East Bay Gateway 35,464 36,857 3.9%
Santa Cruz Gateway 5,593 5,668 1.3%
Southern Gateway 10,908 10,467 ‐4.0%
Total 83,172 85,007 2.2%
OUTFLOWS
Gateway 2016 2017 Change
Peninsula Gateway 40,839 41,196 0.9%
East Bay Gateway 36,324 38,611 6.3%
Santa Cruz Gateway 10,791 10,503 ‐2.7%
Southern Gateway 18,849 16,984 ‐9.9%
Total 106,803 107,294 0.5%
Figure 5.4 shows how the inflows into Santa Clara County have varied over the last 8 years. While
there is variation from year to year, inflow from the Peninsula and East Bay has been trending up in
the last eight years. Inflow from the Southern and the Santa Cruz gateways has remained flat in the
last eight years.
The trend for the outflows over the last eight years is shown in Figure for each of the four gateways.
These four gateways have remained relatively consistent over the last eight years. The Peninsula and
East Bay gateways have been trending up slightly while the Santa Cruz and Southern gateways are
about the same as they were in 2010.

FIGURE 5.4 – GATEWAY INFLOWS DURING THE PM PEAK
FIGURE 5.5 – GATEWAY OUTFLOWS DURING THE PM PEAK

Figure 1 shows a comparison between the total inflow and outflow from Santa Clara County at the
four gateways over the last eight years for the 3‐hour PM peak period. This figure also shows the
percent difference between inflows and outflows. On average, there has been about a 25% difference
between inflows and outflows over the last eight years with outflows being higher during the PM
peak period.
FIGURE 1.6 – COMPARISON OF TOTAL GATEWAY INFLOWS AND OUTFLOWS IN THE PM PEAK HOUR


2017 MONITORING AND
CONFORMANCE REPORT
APPENDIX FREEWAY TABLES

AM Freeway Speed, LOS, Estimated Density, Estimated Flow, and Duration of Congestion by Segment 2017 AM Results (INRIX Data)
Speed (mi/hr) LOS Density
(pc/mi/ln) Flow (pc/hr/ln) Congestion
(hr) TMC Facility Dir From To Miles Mixed HOV Mixed HOV Mixed HOV Mixed HOV
105P04651
SR 87 NB SR‐85 DIAG. Off‐Ramp SR‐87 DIAG. On‐Ramp
0.27 7 8 F F 89.9 87.4 618 704 1.75
105+04652
SR 87 NB SR‐87 DIAG. On‐Ramp Capitol Expy DIAG. Off‐Ramp
0.68 9 8 F F 86.2 88.4 743 669 2.50
105P04652
SR 87 NB Capitol Expy DIAG. Off‐Ramp Capitol Expy DIAG. On‐Ramp
0.39 11 9 F F 81.6 86.1 901 747 3.00
105+04653
SR 87 NB Capitol Expy DIAG. On‐Ramp Curtner Ave DIAG. Off‐Ramp
0.98 14 14 F F 76.7 76.7 1067 1068 3.75
105P04653
SR 87 NB Curtner Ave DIAG. Off‐Ramp Curtner Ave DIAG. On‐Ramp
0.56 16 20 F F 72.8 68.2 1198 1349 4.50
105+04654
SR 87 NB Curtner Ave DIAG. On‐Ramp Almaden Expy DIAG. Off‐Ramp
0.21 18 21 F F 70.5 66.6 1275 1401 5.00
105P04654
SR 87 NB Almaden Expy DIAG. Off‐Ramp Almaden Expy DIAG. On‐Ramp
0.24 25 26 F F 62.3 60.8 1533 1580 4.75
105+04655
SR 87 NB Almaden Expy DIAG. On‐Ramp Alma Ave DIAG. Off‐Ramp
0.44 35 37 E E 51.6 50.0 1831 1869
105+04656
SR 87 NB Alma Ave DIAG. Off‐Ramp I‐280 DIAG. Off‐Ramp
0.67 51 58 D D 39.2 32.7 1990 1886
105P04656
SR 87 NB I‐280 DIAG. Off‐Ramp I‐280 DIAG. On‐Ramp
0.80 28 24 F F 58.4 63.3 1651 1505 0.50
105P04657
SR 87 NB I‐280 DIAG. On‐Ramp Santa Clara St DIAG. Off‐Ramp
0.28 15 21 F F 75.3 66.1 1115 1417 2.00
105+04658
SR 87 NB Santa Clara St DIAG. Off‐Ramp Julian St DIAG. Off‐Ramp
0.12 15 14 F F 75.1 77.3 1123 1048 2.25
105P04658
SR 87 NB Julian St DIAG. Off‐Ramp Julian St DIAG. On‐Ramp
0.57 21 22 F F 66.7 65.4 1397 1438 2.00
105+05602
SR 87 NB Julian St DIAG. On‐Ramp Taylor DIAG. Off‐Ramp
0.13 29 28 F F 58.0 58.9 1679 1636 0.25
105P05602
SR 87 NB Taylor DIAG. Off‐Ramp Taylor DIAG. On‐Ramp
0.66 30 31 F E 58.0 55.5 1724 1731 0.25
105+05914
SR 87 NB Taylor DIAG. On‐Ramp Skyport Dr DIAG. Off‐Ramp
0.80 45 49 D D 44.1 40.3 1969 1992
105P05914
SR 87 NB Skyport Dr DIAG. Off‐Ramp Skyport Dr DIAG. On‐Ramp
0.66 30 42 F E 58.0 46.4 1719 1937 0.25
105+05605
SR 87 NB Skyport Dr DIAG. On‐Ramp US‐101 DIAG. Off‐Ramp
0.36 12 5 F F 79.3 93.6 980 489 3.75
105P05605
SR 87 NB US‐101 DIAG. Off‐Ramp US‐101 DIAG. On‐Ramp
0.38 6 7 F F 92.6 90.3 523 601 5.25
105N05605
SR 87 SB US‐101 DIAG. Off‐Ramp US‐101 DIAG. On‐Ramp
0.45 44 44 D D 44.2 44.7 1967 1962
105‐05604
SR 87 SB US‐101 DIAG. On‐Ramp Skyport Dr DIAG. Off‐Ramp
0.17 52 59 D D 37.8 30.4 1982 1810
105N05914
SR 87 SB Skyport Dr DIAG. Off‐Ramp Skyport Dr DIAG. On‐Ramp
0.68 59 65 D C 31.6 20.3 1852 1310
105‐05603
SR 87 SB Skyport Dr DIAG. On‐Ramp
Hedding St DIAG. Off‐Ramp/Taylor St DIAG. Off‐Ramp
0.78 60 67 D A 30.3 10.1 1805 674
105‐05602
SR 87 SB Hedding St DIAG. Off‐Ramp/Taylor St DIAG. Off‐Ramp Taylor St DIAG. Off‐Ramp
0.11 57 65 D B 33.6 18.0 1909 1176

AM Freeway Speed, LOS, Estimated Density, Estimated Flow, and Duration of Congestion by Segment 2017 AM Results (INRIX Data)
Speed (mi/hr) LOS Density
(pc/mi/ln) Flow (pc/hr/ln) Congestion
(hr) TMC Facility Dir From To Miles Mixed HOV Mixed HOV Mixed HOV Mixed HOV
105N05602
SR 87 SB Taylor St DIAG. Off‐Ramp Taylor St DIAG. On‐Ramp
0.56 58 64 D C 32.6 22.9 1883 1459
105‐04658
SR 87 SB Taylor St DIAG. On‐Ramp Coleman Ave/Julian St DIAG Off‐Ramp
0.16 54 63 D C 36.8 24.5 1970 1541
105N04658
SR 87 SB Coleman Ave/Julian St DIAG Off‐Ramp Julian St DIAG. On‐Ramp
0.57 57 63 D C 33.0 23.8 1893 1506
105N04657
SR 87 SB Park Ave DIAG. Off‐Ramp I‐280 DIAG. Off‐Ramp
0.25 57 64 D C 33.1 20.8 1896 1340
105N04656
SR 87 SB I‐280 DIAG. Off‐Ramp Alma Ave DIAG Off‐Ramp
1.23 59 64 D C 31.1 21.3 1834 1369
105‐04655
SR 87 SB Alma Ave DIAG Off‐Ramp Alma Ave DIAG On‐Ramp
0.22 58 68 D A 32.2 <8.9 1870 601
105‐04654
SR 87 SB Alma Ave DIAG On‐Ramp Almaden Expy DIAG. Off‐Ramp
0.51 59 69 D A 31.1 <8.9 1834 612
105N04654
SR 87 SB Almaden Expy DIAG. Off‐Ramp Almaden Expy DIAG. On‐Ramp
0.19 61 71 D A 28.6 <8.9 1739 628
105‐04653
SR 87 SB Almaden Expy DIAG. On‐Ramp Curtner Ave DIAG. Off‐Ramp
0.26 61 70 D A 28.5 <8.9 1733 627
105N04653
SR 87 SB Curtner Ave DIAG. Off‐Ramp Curtner Ave DIAG. On‐Ramp
0.53 59 69 D A 30.9 <8.9 1827 614
105‐04652
SR 87 SB Curtner Ave DIAG. On‐Ramp Capital Expwy DIAG. Off‐Ramp
0.96 57 70 D A 33.3 <8.9 1902 623
105N04652
SR 87 SB Capital Expwy DIAG. Off‐Ramp Capital Expwy DIAG. On‐Ramp
0.50 61 69 D A 28.2 <8.9 1719 617
105‐04651
SR 87 SB Capital Expwy DIAG. On‐Ramp SR‐87 DIAG. Off‐Ramp
0.62 59 67 D A 30.6 <8.9 1815 598
105N04651
SR 87 SB SR‐87 DIAG. Off‐Ramp SR‐87 DIAG. On‐Ramp
0.16 59 66 D B 30.6 15.2 1817 1004
105P04675
SR 237 EB Valley Fwy DIAG. Off‐Ramp SR‐85 DIAG. On‐Ramp
0.23 31 E 55.4 1736
105+04675
SR 237 EB El Camino Real SR‐85 L. Off‐Ramp
0.28 28 F 59.1 1631 0.25
105+04676
SR 237 EB SR‐85 DIAG. On‐Ramp Dana St. L. Off‐Ramp
0.05 14 F 76.2 1087 1.25
105P04676
SR 237 EB Dana St. L. Off‐Ramp Dana St. DIAG. On‐Ramp
0.38 18 F 71.0 1259 1.50
105+04677
SR 237 EB Dana St. L. On‐Ramp Middlefield Rd DIAG. Off‐Ramp
0.35 33 E 54.3 1764
105P04677
SR 237 EB Middlefield Rd DIAG. Off‐Ramp Middlefield Rd DIAG.
0.29 55 D 35.5 1950
105+04678
SR 237 EB Middlefield Rd DIAG. Middlefield Rd DIAG. On‐Ramp
0.23 58 D 32.0 1864
105P04678
SR 237 EB Middlefield Rd DIAG. On‐Ramp Maude Ave On‐Ramp
0.33 59 D 31.1 1833
105+04679
SR 237 EB Maude Ave On‐Ramp US‐101 DIAG. Off‐Ramp
0.16 57 D 33.9 1917
105P04679
SR 237 EB US‐101 DIAG. Off‐Ramp US‐101 L. On‐Ramp
0.22 48 D 41.3 1990

AM Freeway Speed, LOS, Estimated Density, Estimated Flow, and Duration of Congestion by Segment 2017 AM Results (INRIX Data)
Speed (mi/hr) LOS Density
(pc/mi/ln) Flow (pc/hr/ln) Congestion
(hr) TMC Facility Dir From To Miles Mixed HOV Mixed HOV Mixed HOV Mixed HOV
105+04680
SR 237 EB US‐101 L. On‐Ramp Mathilda Ave DIAG. Off‐Ramp
0.31 36 E 51.1 1842
105P04680
SR 237 EB Mathilda Ave DIAG. Off‐Ramp Mathilda Ave DIAG. On‐Ramp
0.46 50 55 D D 40.1 35.0 1992 1942
105+04681
SR 237 EB Mathilda Ave DIAG. On‐Ramp Fair Oaks Way DIAG. Off‐Ramp
0.54 58 62 D C 32.5 25.9 1878 1611
105P04681
SR 237 EB Fair Oaks Way DIAG. Off‐Ramp Fair Oaks Way L. On‐Ramp
0.21 60 63 D C 29.7 25.0 1781 1569
105+04682
SR 237 EB Fair Oaks Way L. On‐Ramp Lawrence Expy DIAG. Off‐Ramp
0.30 61 66 D B 27.8 16.3 1702 1070
105P04682
SR 237 EB Lawrence Expy DIAG. Off‐Ramp Lawrence Expy DIAG. On‐Ramp
0.61 62 65 D C 27.1 20.1 1671 1301
105+05140
SR 237 EB Lawrence Expy DIAG. On‐Ramp Great America Pkwy DIAG. Off‐Ramp
0.60 58 66 D B 31.8 15.3 1858 1011
105P05140
SR 237 EB Great America Pkwy DIAG. Off‐Ramp Great America Pkwy DIAG. On‐Ramp
0.81 61 67 D B 28.8 11.6 1744 771
105+05142
SR 237 EB Great America Pkwy DIAG. On‐Ramp 1st L. Off‐Ramp
0.55 60 66 D B 29.8 16.3 1785 1069
105P05142
SR 237 EB 1st L. Off‐Ramp 1st DIAG. On‐Ramp
0.33 59 63 D C 31.1 24.0 1833 1514
105+05143
SR 237 EB 1st DIAG. On‐Ramp Zanker Rd DIAG. Off‐Ramp
0.56 57 55 D D 33.8 35.7 1914 1954
105P05143
SR 237 EB Zanker Rd DIAG. Off‐Ramp Zanker Rd DIAG. On‐Ramp
0.50 60 62 D D 30.3 26.9 1805 1662
105+05144
SR 237 EB Zanker Rd DIAG. On‐Ramp McCarthy Blvd DIAG. Off‐Ramp
0.28 58 67 D B 32.8 11.8 1889 785
105P05144
SR 237 EB McCarthy Blvd DIAG. Off‐Ramp McCarthy Blvd DIAG. On‐Ramp
0.65 42 64 D C 46.0 22.5 1943 1436
105P05145
SR 237 EB I‐880 DIAG. Off‐Ramp I‐880 DIAG. On‐Ramp
0.25 24 F 62.8 1518 2.25
105N05144
SR 237 WB McCarthy Blvd DIAG. Off‐Ramp McCarthy Blvd DIAG. On‐Ramp
0.57 5 9 F F 94.1 86.0 470 751 5.00
105‐05143
SR 237 WB McCarthy Blvd DIAG. On‐Ramp Zanker Rd DIAG. Off‐Ramp
0.29 9 12 F F 86.0 79.2 752 985 4.75
105N05143
SR 237 WB Zanker Rd DIAG. Off‐Ramp Zanker Rd DIAG. On‐Ramp
0.35 13 24 F F 78.2 62.5 1017 1530 4.00
105‐05142
SR 237 WB Zanker Rd DIAG. On‐Ramp 1st DIAG. Off‐Ramp
0.84 19 23 F F 69.3 64.2 1313 1477 2.25
105N05142
SR 237 WB 1st DIAG. Off‐Ramp 1st DIAG. On‐Ramp
0.48 21 35 F E 67.1 52.2 1385 1817 1.50
105‐05141
SR 237 WB 1st DIAG. On‐Ramp America Center Dr DIAG. Off‐Ramp
0.37 20 30 F E 67.9 56.6 1357 1702 1.00
105N05141
SR 237 WB America Center Dr DIAG. Off‐Ramp America Center Dr DIAG. Off‐Ramp
0.13 20 33 F E 68.1 54.2 1353 1767 2.25
105N05140
SR 237 WB America Center Dr DIAG. Off‐Ramp America Center Dr DIAG. On‐Ramp
0.74 21 32 F E 66.7 55.2 1396 1740 1.50
105‐04682
SR 237 WB America Center Dr DIAG. On‐Ramp Lawrence Expy DIAG. Off‐Ramp
0.54 22 28 F F 64.8 59.0 1456 1633 2.00

AM Freeway Speed, LOS, Estimated Density, Estimated Flow, and Duration of Congestion by Segment 2017 AM Results (INRIX Data)
Speed (mi/hr) LOS Density
(pc/mi/ln) Flow (pc/hr/ln) Congestion
(hr) TMC Facility Dir From To Miles Mixed HOV Mixed HOV Mixed HOV Mixed HOV
105N04682
SR 237 WB Lawrence Expy DIAG. Off‐Ramp Lawrence Expy DIAG. On‐Ramp
0.66 13 15 F F 78.5 74.9 1009 1127 3.25
105‐04681
SR 237 WB Lawrence Expy DIAG. On‐Ramp Java Dr DIAG. Off‐Ramp
0.33 12 9 F F 80.3 86.0 948 750 4.25
105N04681
SR 237 WB Java Dr DIAG. Off‐Ramp Java Dr DIAG. On‐Ramp
0.18 13 9 F F 77.7 86.2 1034 746 4.75
105‐04680
SR 237 WB Java Dr DIAG. On‐Ramp Mathilda Ave DIAG Off‐Ramp
0.54 15 F 74.4 1146 4.75
105N04680
SR 237 WB Mathilda Ave DIAG Off‐Ramp Mathilda Ave DIAG On‐Ramp
0.45 18 F 70.4 1278 4.25
105‐04679
SR 237 WB Mathilda Ave DIAG On‐Ramp US‐101 DIAG. Off‐Ramp
0.09 25 F 62.4 1531 1.25
105N04679
SR 237 WB US‐101 DIAG. Off‐Ramp US‐101 L. On‐Ramp
0.21 43 D 45.4 1952
105‐04678
SR 237 WB US‐101 L. On‐Ramp Maude Ave DIAG. Off‐Ramp
0.48 50 D 39.5 1991
105N04678
SR 237 WB Maude Ave DIAG. Off‐Ramp Maude Ave DIAG. On‐Ramp
0.28 56 D 34.3 1925
105‐04677
SR 237 WB Maude Ave DIAG. On‐Ramp Middlefield DIAG. Off‐Ramp
0.22 54 D 36.1 1961
105N04677
SR 237 WB Middlefield DIAG. Off‐Ramp Middlefield DIAG. On‐Ramp
0.30 49 D 40.6 1992
105‐04676
SR 237 WB Middlefield DIAG. On‐Ramp Dana St DIAG. Off‐Ramp
0.44 44 D 44.6 1963
105N04676
SR 237 WB Dana St DIAG. Off‐Ramp Dana St L. On‐Ramp
0.23 36 E 50.9 1848
105‐04675
SR 237 WB Dana St L. On‐Ramp SR‐85 L. Off‐Ramp
0.10 33 E 54.3 1765
105N04675
SR 237 WB SR‐85 L. Off‐Ramp SR‐85 DIAG. On‐Ramp
0.30 18 F 70.0 1290 0.75
105‐20468
SR 237 WB SR‐85 DIAG. On‐Ramp El Camino Real
0.21 9 F 84.6 800 7.00
105P05135
SR 17 NB Summit DIAG. Off Ramp Summit DIAG. On‐Ramp
0.10 28 F 59.1 1630 0.50
105+05136
SR 17 NB Summit DIAG. On‐Ramp Idylwild Road
2.39 20 F 67.8 1362 1.50
105+05137
SR 17 NB Idylwild Road Bear Creek Road DIAG. Off‐Ramp
1.62 17 F 71.9 1227 2.25
105P05137
SR 17 NB Bear Creek Road DIAG. Off‐Ramp Bear Creek Road DIAG. On‐Ramp
0.19 17 F 71.5 1240 2.50
105+05138
SR 17 NB Bear Creek Road DIAG. On‐Ramp Santa Cruz DIAG. Off‐Ramp
1.82 39 E 49.0 1890
105+04645
SR 17 NB Santa Cruz DIAG. Off‐Ramp Saratoga Los Gatos Rd DIAG. Off‐Ramp
0.78 29 F 58.0 1671 0.25
105P04645
SR 17 NB Saratoga Los Gatos Rd DIAG. Off‐Ramp Saratoga Los Gatos Rd DIAG. On‐Ramp
0.30 18 F 70.6 1270 2.75
105+04646
SR 17 NB Saratoga Los Gatos Rd DIAG. On‐Ramp Lark Ave DIAG. Off‐Ramp
1.39 49 D 40.9 1991

AM Freeway Speed, LOS, Estimated Density, Estimated Flow, and Duration of Congestion by Segment 2017 AM Results (INRIX Data)
Speed (mi/hr) LOS Density
(pc/mi/ln) Flow (pc/hr/ln) Congestion
(hr) TMC Facility Dir From To Miles Mixed HOV Mixed HOV Mixed HOV Mixed HOV
105P04646
SR 17 NB Lark Ave DIAG. Off‐Ramp Lark Ave DIAG. On‐Ramp
0.53 64 C 20.8 1341
105P04647
SR 17 NB SR‐85 DIAG. Off‐Ramp SR‐85 DIAG. On‐Ramp
0.88 59 D 31.4 1843
105+04648
SR 17 NB SR‐85 DIAG. On‐Ramp Camden Ave DIAG. Off‐Ramp
0.55 50 D 39.9 1992
105P04648
SR 17 NB Camden Ave DIAG. Off‐Ramp San Thomas Expy DIAG. On‐Ramp
0.61 32 E 55.0 1746
105+04649
SR 17 NB San Thomas Expy DIAG. On‐Ramp Hamilton Ave DIAG. Off‐Ramp
1.31 22 F 65.4 1439 1.25
105P04649
SR 17 NB Hamilton Ave DIAG. Off‐Ramp Hamilton Ave DIAG. On‐Ramp
0.41 22 F 65.9 1422 1.50
105+04650
SR 17 NB Hamilton Ave DIAG. On‐Ramp I‐280 DIAG. Off‐Ramp
0.94 25 F 62.4 1531 1.00
105P04650
SR 17 NB I‐280 DIAG. Off‐Ramp Stevens Creek Blvd L. On‐Ramp
0.90 16 F 73.4 1179 1.50
105N04650
SR 17 SB Stevens Creek Blvd DIAG. Off‐Ramp I‐280 DIAG. On‐Ramp
0.69 62 D 26.7 1652
105‐04649
SR 17 SB I‐280 DIAG. On‐Ramp Hamilton Ave DIAG. Off‐Ramp
1.04 60 D 29.0 1753
105N04649
SR 17 SB Hamilton Ave DIAG. Off‐Ramp Hamilton Ave DIAG. On‐Ramp
0.39 62 D 26.8 1659
105‐04648
SR 17 SB Hamilton Ave DIAG. On‐Ramp San Thomas Expy DIAG. Off‐Ramp
1.32 61 D 28.4 1728
105N04648
SR 17 SB San Thomas Expy DIAG. Off‐Ramp San Thomas Expy DIAG. On‐Ramp
0.72 61 D 28.4 1729
105‐04647
SR 17 SB San Thomas Expy DIAG. On‐Ramp SR‐85 DIAG. Off‐Ramp
0.26 60 D 29.4 1769
105N04647
SR 17 SB SR‐85 DIAG. Off‐Ramp SR‐85 DIAG. On‐Ramp
0.69 59 D 31.1 1833
105‐04646
SR 17 SB SR‐85 DIAG. On‐Ramp Lark Ave DIAG. Off‐Ramp
0.15 54 D 36.8 1970
105N04646
SR 17 SB Lark Ave DIAG. Off‐Ramp Lark Ave DIAG. On‐Ramp
0.21 60 D 30.2 1802
105‐04645
SR 17 SB Lark Ave DIAG. On‐Ramp Saratoga Ave DIAG. Off‐Ramp
1.57 21 F 66.5 1404 0.75
105N04645
SR 17 SB Saratoga Ave DIAG. Off‐Ramp Saratoga Ave DIAG. On‐Ramp
0.36 50 D 39.6 1991
105‐05138
SR 17 SB Saratoga Ave DIAG. On‐Ramp Santa Cruz Hwy DIAG. On‐Ramp
0.78 46 D 43.1 1979
105‐05137
SR 17 SB Santa Cruz Hwy DIAG. On‐Ramp Bear Creek Rd DIAG. Off‐Ramp
1.95 48 D 41.4 1989
105N05137
SR 17 SB Bear Creek Rd DIAG. Off‐Ramp Bear Creek Rd DIAG. On‐Ramp
0.11 50 D 39.6 1991
105‐05136
SR 17 SB Bear Creek Rd DIAG. On‐Ramp Idylwild Rd. DIAG. Off‐Ramp
1.55 45 D 44.0 1970
105‐05135
SR 17 SB Idylwild Rd. DIAG. Off‐Ramp Summit Rd. L. Off‐Ramp
2.34 31 E 55.2 1739
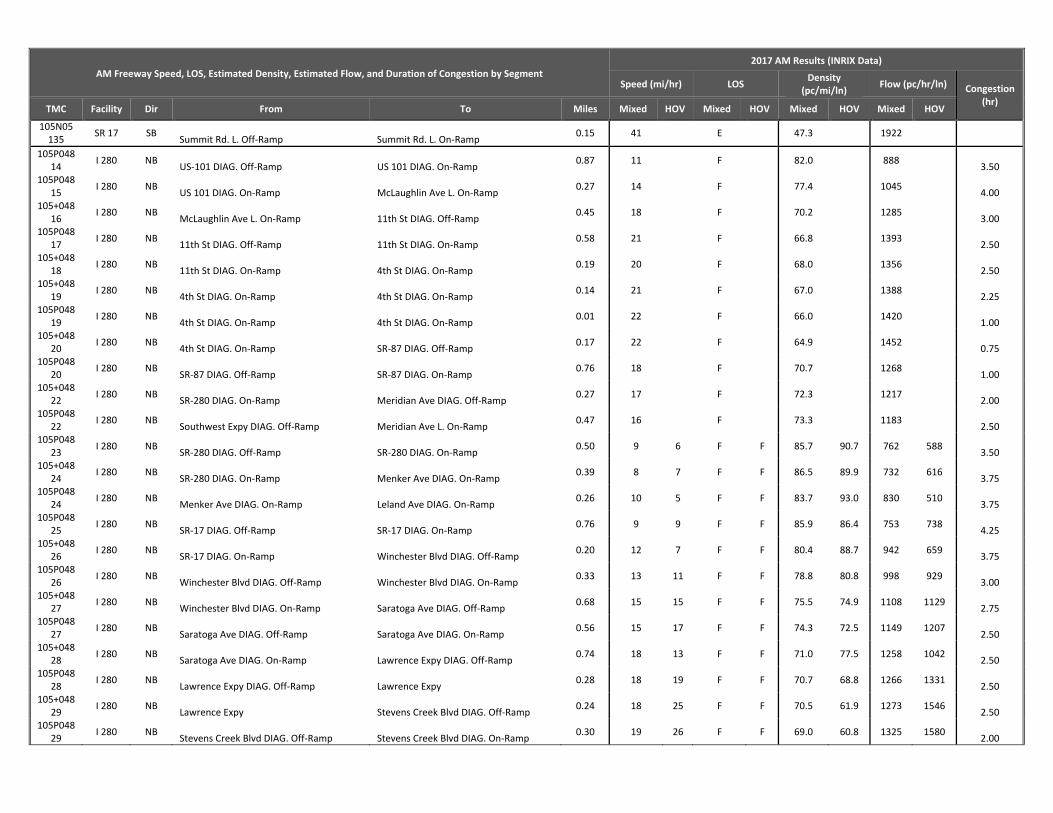
AM Freeway Speed, LOS, Estimated Density, Estimated Flow, and Duration of Congestion by Segment 2017 AM Results (INRIX Data)
Speed (mi/hr) LOS Density
(pc/mi/ln) Flow (pc/hr/ln) Congestion
(hr) TMC Facility Dir From To Miles Mixed HOV Mixed HOV Mixed HOV Mixed HOV
105N05135
SR 17 SB Summit Rd. L. Off‐Ramp Summit Rd. L. On‐Ramp
0.15 41 E 47.3 1922
105P04814
I 280 NB US‐101 DIAG. Off‐Ramp US 101 DIAG. On‐Ramp
0.87 11 F 82.0 888 3.50
105P04815
I 280 NB US 101 DIAG. On‐Ramp McLaughlin Ave L. On‐Ramp
0.27 14 F 77.4 1045 4.00
105+04816
I 280 NB McLaughlin Ave L. On‐Ramp 11th St DIAG. Off‐Ramp
0.45 18 F 70.2 1285 3.00
105P04817
I 280 NB 11th St DIAG. Off‐Ramp 11th St DIAG. On‐Ramp
0.58 21 F 66.8 1393 2.50
105+04818
I 280 NB 11th St DIAG. On‐Ramp 4th St DIAG. On‐Ramp
0.19 20 F 68.0 1356 2.50
105+04819
I 280 NB 4th St DIAG. On‐Ramp 4th St DIAG. On‐Ramp
0.14 21 F 67.0 1388 2.25
105P04819
I 280 NB 4th St DIAG. On‐Ramp 4th St DIAG. On‐Ramp
0.01 22 F 66.0 1420 1.00
105+04820
I 280 NB 4th St DIAG. On‐Ramp SR‐87 DIAG. Off‐Ramp
0.17 22 F 64.9 1452 0.75
105P04820
I 280 NB SR‐87 DIAG. Off‐Ramp SR‐87 DIAG. On‐Ramp
0.76 18 F 70.7 1268 1.00
105+04822
I 280 NB SR‐280 DIAG. On‐Ramp Meridian Ave DIAG. Off‐Ramp
0.27 17 F 72.3 1217 2.00
105P04822
I 280 NB Southwest Expy DIAG. Off‐Ramp Meridian Ave L. On‐Ramp
0.47 16 F 73.3 1183 2.50
105P04823
I 280 NB SR‐280 DIAG. Off‐Ramp SR‐280 DIAG. On‐Ramp
0.50 9 6 F F 85.7 90.7 762 588 3.50
105+04824
I 280 NB SR‐280 DIAG. On‐Ramp Menker Ave DIAG. On‐Ramp
0.39 8 7 F F 86.5 89.9 732 616 3.75
105P04824
I 280 NB Menker Ave DIAG. On‐Ramp Leland Ave DIAG. On‐Ramp
0.26 10 5 F F 83.7 93.0 830 510 3.75
105P04825
I 280 NB SR‐17 DIAG. Off‐Ramp SR‐17 DIAG. On‐Ramp
0.76 9 9 F F 85.9 86.4 753 738 4.25
105+04826
I 280 NB SR‐17 DIAG. On‐Ramp Winchester Blvd DIAG. Off‐Ramp
0.20 12 7 F F 80.4 88.7 942 659 3.75
105P04826
I 280 NB Winchester Blvd DIAG. Off‐Ramp Winchester Blvd DIAG. On‐Ramp
0.33 13 11 F F 78.8 80.8 998 929 3.00
105+04827
I 280 NB Winchester Blvd DIAG. On‐Ramp Saratoga Ave DIAG. Off‐Ramp
0.68 15 15 F F 75.5 74.9 1108 1129 2.75
105P04827
I 280 NB Saratoga Ave DIAG. Off‐Ramp Saratoga Ave DIAG. On‐Ramp
0.56 15 17 F F 74.3 72.5 1149 1207 2.50
105+04828
I 280 NB Saratoga Ave DIAG. On‐Ramp Lawrence Expy DIAG. Off‐Ramp
0.74 18 13 F F 71.0 77.5 1258 1042 2.50
105P04828
I 280 NB Lawrence Expy DIAG. Off‐Ramp Lawrence Expy
0.28 18 19 F F 70.7 68.8 1266 1331 2.50
105+04829
I 280 NB Lawrence Expy Stevens Creek Blvd DIAG. Off‐Ramp
0.24 18 25 F F 70.5 61.9 1273 1546 2.50
105P04829
I 280 NB Stevens Creek Blvd DIAG. Off‐Ramp Stevens Creek Blvd DIAG. On‐Ramp
0.30 19 26 F F 69.0 60.8 1325 1580 2.00

AM Freeway Speed, LOS, Estimated Density, Estimated Flow, and Duration of Congestion by Segment 2017 AM Results (INRIX Data)
Speed (mi/hr) LOS Density
(pc/mi/ln) Flow (pc/hr/ln) Congestion
(hr) TMC Facility Dir From To Miles Mixed HOV Mixed HOV Mixed HOV Mixed HOV
105+04830
I 280 NB Stevens Creek Blvd DIAG. On‐Ramp Wolfe Rd DIAG. Off‐Ramp
0.45 20 26 F F 67.8 60.9 1361 1576 2.00
105P04830
I 280 NB Wolfe Rd DIAG. Off‐Ramp Wolfe Rd DIAG. On‐Ramp
0.45 22 33 F E 65.0 53.8 1449 1777 1.75
105+04831
I 280 NB Wolfe Rd DIAG. On‐Ramp De Anza Blvd DIAG. Off‐Ramp
0.61 23 24 F F 63.9 63.4 1486 1499 1.25
105P04831
I 280 NB De Anza Blvd DIAG. Off‐Ramp De Anza Blvd DIAG. On‐Ramp
0.46 23 28 F F 64.3 58.9 1473 1637 1.25
105+04832
I 280 NB De Anza Blvd DIAG. On‐Ramp SR‐85 DIAG. Off‐Ramp
0.70 24 27 F F 63.1 59.5 1509 1617 1.50
105P04832
I 280 NB SR‐85 DIAG. Off‐Ramp SR‐85 DIAG. On‐Ramp
0.74 25 33 F E 62.3 53.5 1536 1784 2.00
105P04833
I 280 NB Foothill Blvd DIAG. Off‐Ramp Foothill Blvd L. On‐Ramp
0.32 28 34 F E 58.6 52.8 1646 1802 1.00
105+04834
I 280 NB Foothill Blvd L. On‐Ramp Magdalena Ave DIAG. Off‐Ramp
2.37 37 44 E D 50.5 44.7 1856 1961
105P04834
I 280 NB Magdalena Ave DIAG. Off‐Ramp Magdalena Ave DIAG. On‐Ramp
0.47 31 30 E F 55.6 58.0 1728 1713
105+04835
I 280 NB Magdalena Ave DIAG. On‐Ramp El monte Rd DIAG. Off‐Ramp
0.38 34 E 53.3 1790
105P04835
I 280 NB El monte Rd DIAG. Off‐Ramp El monte Rd DIAG. On‐Ramp
0.60 33 E 53.8 1777
105+04836
I 280 NB El monte Rd DIAG. On‐Ramp Page Mill Rd DIAG. Off‐Ramp
2.72 47 D 42.0 1987
105P04836
I 280 NB Page Mill Rd DIAG. Off‐Ramp Page Mill Rd DIAG. On‐Ramp
0.64 64 C 21.4 1372
105+04837
I 280 NB Page Mill Rd DIAG. On‐Ramp Alpine Rd DIAG. Off‐Ramp
1.70 64 C 23.1 1467
105‐04836
I 280 SB Alpine Rd DIAG. On‐Ramp Page Mill Rd DIAG. Off‐Ramp
1.58 65 C 18.8 1221
105N04836
I 280 SB Page Mill Rd DIAG. Off‐Ramp Page Mill Rd DIAG. On‐Ramp
0.65 66 B 14.7 968
105‐04835
I 280 SB Page Mill Rd DIAG. On‐Ramp El Monte Rd DIAG. Off‐Ramp
2.71 63 C 24.0 1514
105N04835
I 280 SB El Monte Rd DIAG. Off‐Ramp El Monte Rd DIAG. On‐Ramp
0.60 65 C 18.8 1221
105‐04834
I 280 SB El Monte Rd DIAG. On‐Ramp Magdalena Ave DIAG. Off‐Ramp
0.36 64 C 21.6 1387
105N04834
I 280 SB Magdalena Ave DIAG. Off‐Ramp Magdalena Ave L. On‐Ramp
0.38 66 63 B C 15.3 23.5 1011 1491
105‐04833
I 280 SB Magdalena Ave L. On‐Ramp Foothill Blvd DIAG. Off‐Ramp
2.34 65 64 C C 18.6 22.5 1210 1434
105N04833
I 280 SB Foothill Blvd DIAG. Off‐Ramp Foothill Blvd DIAG. On‐Ramp
0.46 65 69 C A 19.6 <8.9 1269 618
105‐04832
I 280 SB Foothill Blvd DIAG. On‐Ramp SR‐85 DIAG. Off‐Ramp
0.26 64 70 C A 21.2 <8.9 1360 619
105N04832
I 280 SB SR‐85 DIAG. Off‐Ramp SR‐85 DIAG. On‐Ramp
0.75 62 69 C A 25.7 <8.9 1605 611
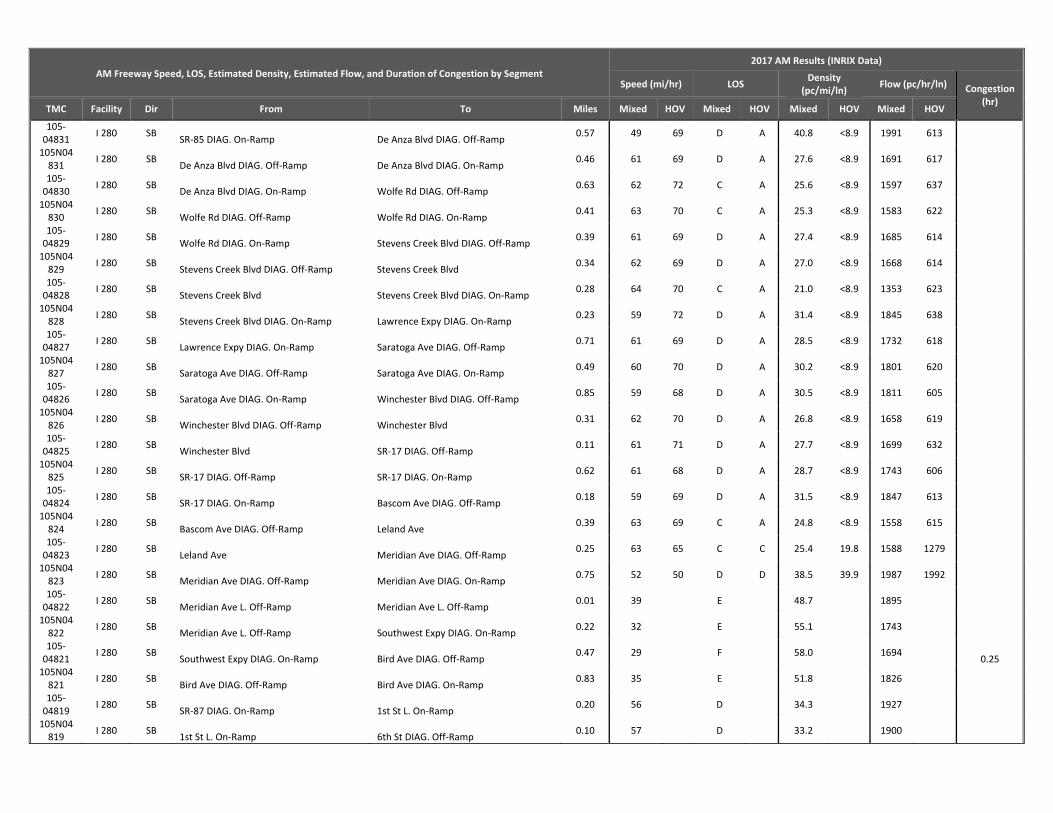
AM Freeway Speed, LOS, Estimated Density, Estimated Flow, and Duration of Congestion by Segment 2017 AM Results (INRIX Data)
Speed (mi/hr) LOS Density
(pc/mi/ln) Flow (pc/hr/ln) Congestion
(hr) TMC Facility Dir From To Miles Mixed HOV Mixed HOV Mixed HOV Mixed HOV
105‐04831
I 280 SB SR‐85 DIAG. On‐Ramp De Anza Blvd DIAG. Off‐Ramp
0.57 49 69 D A 40.8 <8.9 1991 613
105N04831
I 280 SB De Anza Blvd DIAG. Off‐Ramp De Anza Blvd DIAG. On‐Ramp
0.46 61 69 D A 27.6 <8.9 1691 617
105‐04830
I 280 SB De Anza Blvd DIAG. On‐Ramp Wolfe Rd DIAG. Off‐Ramp
0.63 62 72 C A 25.6 <8.9 1597 637
105N04830
I 280 SB Wolfe Rd DIAG. Off‐Ramp Wolfe Rd DIAG. On‐Ramp
0.41 63 70 C A 25.3 <8.9 1583 622
105‐04829
I 280 SB Wolfe Rd DIAG. On‐Ramp Stevens Creek Blvd DIAG. Off‐Ramp
0.39 61 69 D A 27.4 <8.9 1685 614
105N04829
I 280 SB Stevens Creek Blvd DIAG. Off‐Ramp Stevens Creek Blvd
0.34 62 69 D A 27.0 <8.9 1668 614
105‐04828
I 280 SB Stevens Creek Blvd Stevens Creek Blvd DIAG. On‐Ramp
0.28 64 70 C A 21.0 <8.9 1353 623
105N04828
I 280 SB Stevens Creek Blvd DIAG. On‐Ramp Lawrence Expy DIAG. On‐Ramp
0.23 59 72 D A 31.4 <8.9 1845 638
105‐04827
I 280 SB Lawrence Expy DIAG. On‐Ramp Saratoga Ave DIAG. Off‐Ramp
0.71 61 69 D A 28.5 <8.9 1732 618
105N04827
I 280 SB Saratoga Ave DIAG. Off‐Ramp Saratoga Ave DIAG. On‐Ramp
0.49 60 70 D A 30.2 <8.9 1801 620
105‐04826
I 280 SB Saratoga Ave DIAG. On‐Ramp Winchester Blvd DIAG. Off‐Ramp
0.85 59 68 D A 30.5 <8.9 1811 605
105N04826
I 280 SB Winchester Blvd DIAG. Off‐Ramp Winchester Blvd
0.31 62 70 D A 26.8 <8.9 1658 619
105‐04825
I 280 SB Winchester Blvd SR‐17 DIAG. Off‐Ramp
0.11 61 71 D A 27.7 <8.9 1699 632
105N04825
I 280 SB SR‐17 DIAG. Off‐Ramp SR‐17 DIAG. On‐Ramp
0.62 61 68 D A 28.7 <8.9 1743 606
105‐04824
I 280 SB SR‐17 DIAG. On‐Ramp Bascom Ave DIAG. Off‐Ramp
0.18 59 69 D A 31.5 <8.9 1847 613
105N04824
I 280 SB Bascom Ave DIAG. Off‐Ramp Leland Ave
0.39 63 69 C A 24.8 <8.9 1558 615
105‐04823
I 280 SB Leland Ave Meridian Ave DIAG. Off‐Ramp
0.25 63 65 C C 25.4 19.8 1588 1279
105N04823
I 280 SB Meridian Ave DIAG. Off‐Ramp Meridian Ave DIAG. On‐Ramp
0.75 52 50 D D 38.5 39.9 1987 1992
105‐04822
I 280 SB Meridian Ave L. Off‐Ramp Meridian Ave L. Off‐Ramp
0.01 39 E 48.7 1895
105N04822
I 280 SB Meridian Ave L. Off‐Ramp Southwest Expy DIAG. On‐Ramp
0.22 32 E 55.1 1743
105‐04821
I 280 SB Southwest Expy DIAG. On‐Ramp Bird Ave DIAG. Off‐Ramp
0.47 29 F 58.0 1694 0.25
105N04821
I 280 SB Bird Ave DIAG. Off‐Ramp Bird Ave DIAG. On‐Ramp
0.83 35 E 51.8 1826
105‐04819
I 280 SB SR‐87 DIAG. On‐Ramp 1st St L. On‐Ramp
0.20 56 D 34.3 1927
105N04819
I 280 SB 1st St L. On‐Ramp 6th St DIAG. Off‐Ramp
0.10 57 D 33.2 1900
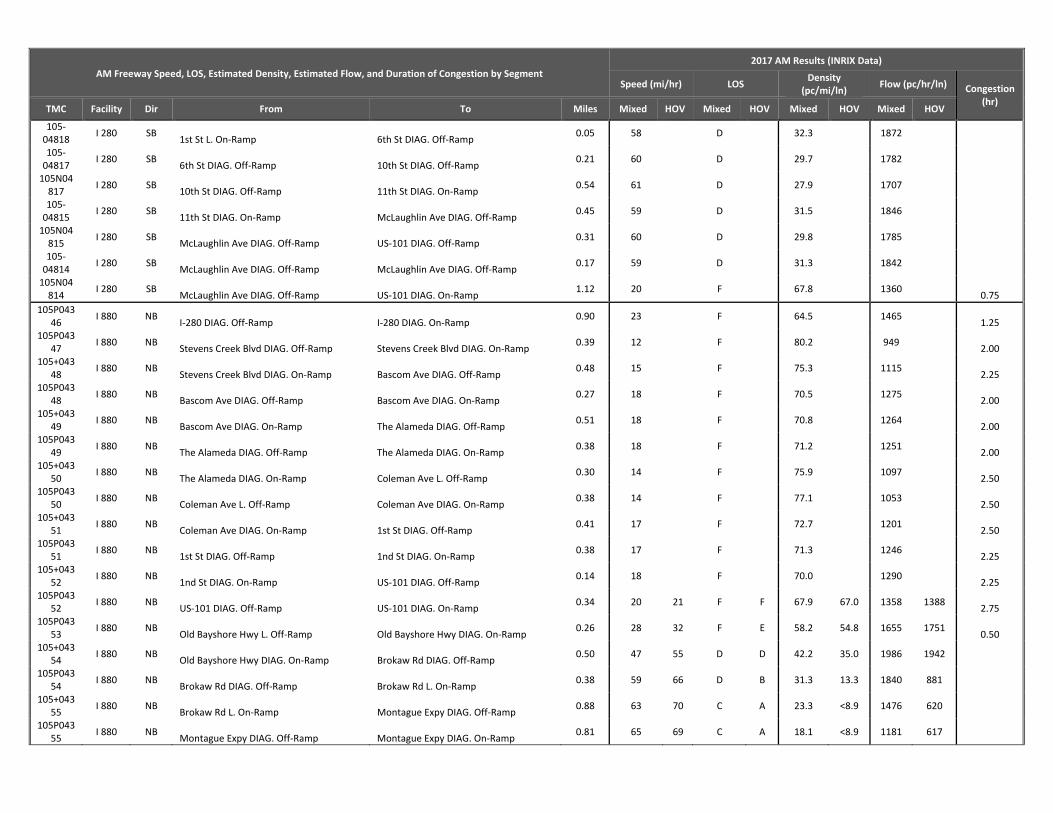
AM Freeway Speed, LOS, Estimated Density, Estimated Flow, and Duration of Congestion by Segment 2017 AM Results (INRIX Data)
Speed (mi/hr) LOS Density
(pc/mi/ln) Flow (pc/hr/ln) Congestion
(hr) TMC Facility Dir From To Miles Mixed HOV Mixed HOV Mixed HOV Mixed HOV
105‐04818
I 280 SB 1st St L. On‐Ramp 6th St DIAG. Off‐Ramp
0.05 58 D 32.3 1872
105‐04817
I 280 SB 6th St DIAG. Off‐Ramp 10th St DIAG. Off‐Ramp
0.21 60 D 29.7 1782
105N04817
I 280 SB 10th St DIAG. Off‐Ramp 11th St DIAG. On‐Ramp
0.54 61 D 27.9 1707
105‐04815
I 280 SB 11th St DIAG. On‐Ramp McLaughlin Ave DIAG. Off‐Ramp
0.45 59 D 31.5 1846
105N04815
I 280 SB McLaughlin Ave DIAG. Off‐Ramp US‐101 DIAG. Off‐Ramp
0.31 60 D 29.8 1785
105‐04814
I 280 SB McLaughlin Ave DIAG. Off‐Ramp McLaughlin Ave DIAG. Off‐Ramp
0.17 59 D 31.3 1842
105N04814
I 280 SB McLaughlin Ave DIAG. Off‐Ramp US‐101 DIAG. On‐Ramp
1.12 20 F 67.8 1360 0.75
105P04346
I 880 NB I‐280 DIAG. Off‐Ramp I‐280 DIAG. On‐Ramp
0.90 23 F 64.5 1465 1.25
105P04347
I 880 NB Stevens Creek Blvd DIAG. Off‐Ramp Stevens Creek Blvd DIAG. On‐Ramp
0.39 12 F 80.2 949 2.00
105+04348
I 880 NB Stevens Creek Blvd DIAG. On‐Ramp Bascom Ave DIAG. Off‐Ramp
0.48 15 F 75.3 1115 2.25
105P04348
I 880 NB Bascom Ave DIAG. Off‐Ramp Bascom Ave DIAG. On‐Ramp
0.27 18 F 70.5 1275 2.00
105+04349
I 880 NB Bascom Ave DIAG. On‐Ramp The Alameda DIAG. Off‐Ramp
0.51 18 F 70.8 1264 2.00
105P04349
I 880 NB The Alameda DIAG. Off‐Ramp The Alameda DIAG. On‐Ramp
0.38 18 F 71.2 1251 2.00
105+04350
I 880 NB The Alameda DIAG. On‐Ramp Coleman Ave L. Off‐Ramp
0.30 14 F 75.9 1097 2.50
105P04350
I 880 NB Coleman Ave L. Off‐Ramp Coleman Ave DIAG. On‐Ramp
0.38 14 F 77.1 1053 2.50
105+04351
I 880 NB Coleman Ave DIAG. On‐Ramp 1st St DIAG. Off‐Ramp
0.41 17 F 72.7 1201 2.50
105P04351
I 880 NB 1st St DIAG. Off‐Ramp 1nd St DIAG. On‐Ramp
0.38 17 F 71.3 1246 2.25
105+04352
I 880 NB 1nd St DIAG. On‐Ramp US‐101 DIAG. Off‐Ramp
0.14 18 F 70.0 1290 2.25
105P04352
I 880 NB US‐101 DIAG. Off‐Ramp US‐101 DIAG. On‐Ramp
0.34 20 21 F F 67.9 67.0 1358 1388 2.75
105P04353
I 880 NB Old Bayshore Hwy L. Off‐Ramp Old Bayshore Hwy DIAG. On‐Ramp
0.26 28 32 F E 58.2 54.8 1655 1751 0.50
105+04354
I 880 NB Old Bayshore Hwy DIAG. On‐Ramp Brokaw Rd DIAG. Off‐Ramp
0.50 47 55 D D 42.2 35.0 1986 1942
105P04354
I 880 NB Brokaw Rd DIAG. Off‐Ramp Brokaw Rd L. On‐Ramp
0.38 59 66 D B 31.3 13.3 1840 881
105+04355
I 880 NB Brokaw Rd L. On‐Ramp Montague Expy DIAG. Off‐Ramp
0.88 63 70 C A 23.3 <8.9 1476 620
105P04355
I 880 NB Montague Expy DIAG. Off‐Ramp Montague Expy DIAG. On‐Ramp
0.81 65 69 C A 18.1 <8.9 1181 617

AM Freeway Speed, LOS, Estimated Density, Estimated Flow, and Duration of Congestion by Segment 2017 AM Results (INRIX Data)
Speed (mi/hr) LOS Density
(pc/mi/ln) Flow (pc/hr/ln) Congestion
(hr) TMC Facility Dir From To Miles Mixed HOV Mixed HOV Mixed HOV Mixed HOV
105+04356
I 880 NB Montague Expy DIAG. On‐Ramp Great Mall Pkwy DIAG. Off‐Ramp
0.24 62 69 D A 26.9 <8.9 1660 614
105P04356
I 880 NB Great Mall Pkwy DIAG. Off‐Ramp Great Mall Pkwy L. On‐Ramp
0.36 62 68 D A 26.3 <8.9 1632 603
105+04357
I 880 NB Great Mall Pkwy L. On‐Ramp SR‐237 DIAG. Off‐Ramp
0.28 61 68 D A 27.5 <8.9 1690 605
105P04357
I 880 NB SR‐237 DIAG. Off‐Ramp SR‐237 DIAG. On‐Ramp
0.93 63 67 C A 23.7 <8.9 1502 598
105+04358
I 880 NB SR‐237 DIAG. On‐Ramp Dixon Landing DIAG. Off‐Ramp
1.03 64 68 C A 21.8 <8.9 1397 609
105P04358
I 880 NB Dixon Landing DIAG. Off‐Ramp Dixon Landing DIAG. On‐Ramp
0.83 64 69 C A 22.5 <8.9 1435 614
105N04358
I 880 SB Dixon Landing DIAG. Off‐Ramp Dixon Landing DIAG. On‐Ramp
0.64 13 10 F F 78.0 82.8 1024 862 2.75
105‐04357
I 880 SB Dixon Landing DIAG. On‐Ramp SR‐237 DIAG. Off‐Ramp
1.13 21 13 F F 66.9 77.8 1392 1032 2.25
105N04357
I 880 SB SR‐237 DIAG. Off‐Ramp Great Mall Pkwy DIAG. On‐Ramp
1.53 42 62 E D 46.1 26.5 1942 1644
105‐04355
I 880 SB Great Mall Pkwy DIAG. On‐Ramp Montague Expy DIAG. Off‐Ramp
0.42 36 62 E D 51.4 26.6 1836 1647
105N04355
I 880 SB Montague Expy DIAG. Off‐Ramp Montague Expy DIAG. On‐Ramp
0.74 52 68 D A 37.9 <8.9 1983 601
105‐04354
I 880 SB Montague Expy DIAG. On‐Ramp Brokaw Rd DIAG. Off‐Ramp
0.62 30 68 E A 56.3 <8.9 1711 602
105N04354
I 880 SB Brokaw Rd DIAG. Off‐Ramp Brokaw Rd DIAG. On‐Ramp
0.60 21 46 F D 66.5 42.8 1402 1982 0.50
105‐04353
I 880 SB Brokaw Rd DIAG. On‐Ramp Old Bayshore Hwy DIAG. Off‐Ramp
0.46 15 18 F F 74.4 70.9 1146 1261 1.00
105N04353
I 880 SB Old Bayshore Hwy DIAG. Off‐Ramp Old Bayshore Hwy L. On‐Ramp
0.32 13 10 F F 78.6 83.1 1005 852 1.25
105‐04352
I 880 SB Old Bayshore Hwy L. On‐Ramp US‐101 L. On‐Ramp
0.18 12 9 F F 80.7 85.6 931 767 2.25
105N04352
I 880 SB US‐101 L. On‐Ramp US‐101 DIAG. On‐Ramp
0.19 11 9 F F 80.9 84.6 926 800 3.00
105‐04351
I 880 SB US‐101 DIAG. On‐Ramp 1st St DIAG. Off‐Ramp
0.12 12 16 F F 80.2 73.6 950 1172 3.25
105N04351
I 880 SB 1st St DIAG. Off‐Ramp 1st St DIAG. On‐Ramp
0.40 15 F 75.0 1124 3.50
105‐04350
I 880 SB 1st St DIAG. On‐Ramp Coleman Ave DIAG. Off‐Ramp
0.42 39 E 48.3 1902
105N04350
I 880 SB Coleman Ave DIAG. Off‐Ramp Coleman Ave DIAG. On‐Ramp
0.53 56 D 34.6 1932
105‐04349
I 880 SB Coleman Ave DIAG. On‐Ramp The Alameda DIAG. Off‐Ramp
0.17 56 D 34.2 1924
105N04349
I 880 SB The Alameda DIAG. Off‐Ramp The Alameda DIAG. On‐Ramp
0.37 58 D 32.4 1875
105‐04348
I 880 SB The Alameda DIAG. On‐Ramp Bascom Ave DIAG. Off‐Ramp
0.45 52 D 38.2 1985

AM Freeway Speed, LOS, Estimated Density, Estimated Flow, and Duration of Congestion by Segment 2017 AM Results (INRIX Data)
Speed (mi/hr) LOS Density
(pc/mi/ln) Flow (pc/hr/ln) Congestion
(hr) TMC Facility Dir From To Miles Mixed HOV Mixed HOV Mixed HOV Mixed HOV
105N04348
I 880 SB Bascom Ave DIAG. Off‐Ramp Bascom Ave DIAG. On‐Ramp
0.27 39 E 48.8 1892
105‐04347
I 880 SB Bascom Ave DIAG. On‐Ramp Stevens Creek Blvd DIAG. Off‐Ramp
0.49 25 F 61.5 1560 0.50
105N04347
I 880 SB Stevens Creek Blvd DIAG. Off‐Ramp I‐280 DIAG. Off‐Ramp
0.42 22 F 65.4 1440 1.25
105‐04346
I 880 SB I‐280 L. Off‐Ramp I‐280 DIAG. Off‐Ramp
0.06 25 F 62.1 1539 1.25
105N04346
I 880 SB Stevens Creek Blvd DIAG. On‐Ramp I‐280 DIAG. On‐Ramp
0.69 62 D 26.7 1652
105P04876
I 680 NB US‐101 DIAG. Off‐Ramp US‐101 DIAG. On‐Ramp
0.93 58 D 32.1 1868
105P04877
I 680 NB US‐101 DIAG. Off‐Ramp US‐101 DIAG. On‐Ramp
0.59 16 F 72.9 1196 1.00
105+04878
I 680 NB US‐101 DIAG. On‐Ramp
Capitol Expy DIAG. Off‐Ramp/ Jackson Ave
0.24 14 F 76.4 1080 1.50
105P04878
I 680 NB Capitol Expy DIAG. Off‐Ramp/ Jackson Ave Capitol Expy DIAG. Off‐Ramp
0.33 16 F 72.9 1194 1.75
105P04879
I 680 NB Capitol Expy DIAG. Off‐Ramp Capitol Expy DIAG. On‐Ramp
0.58 16 F 73.7 1168 2.00
105P04880
I 680 NB Alum Rock Ave DIAG. Off‐Ramp Alum Rock Ave DIAG. On‐Ramp
0.61 19 F 68.6 1335 2.00
105+04881
I 680 NB Alum Rock Ave DIAG. On‐Ramp McKee Rd DIAG. Off‐Ramp
0.14 22 F 64.9 1454 1.75
105P04881
I 680 NB McKee Rd DIAG. Off‐Ramp McKee Rd DIAG. On‐Ramp
0.59 28 F 58.8 1640 0.50
105+04882
I 680 NB McKee Rd DIAG. On‐Ramp Berryessa Rd DIAG. Off‐Ramp
0.80 45 D 44.1 1969
105P04882
I 680 NB Berryessa Rd DIAG. Off‐Ramp Berryessa Rd DIAG. On‐Ramp
0.68 56 D 34.3 1926
105+04883
I 680 NB Berryessa Rd DIAG. On‐Ramp Hostetter Rd DIAG. Off‐Ramp
0.36 60 D 29.7 1783
105P04883
I 680 NB Hostetter Rd DIAG. Off‐Ramp Hostetter Rd DIAG. On‐Ramp
0.33 58 D 32.8 1888
105+04884
I 680 NB Hostetter Rd DIAG. On‐Ramp Capital Ave L. Off‐Ramp
0.08 55 D 35.3 1948
105P04884
I 680 NB Capital Ave L. Off‐Ramp Capital Ave DIAG. On‐Ramp
0.51 47 D 42.0 1987
105+04885
I 680 NB Capital Ave DIAG. On‐Ramp Montague Expy DIAG. Off‐Ramp
0.38 48 D 41.7 1988
105P04885
I 680 NB Montague Expy DIAG. Off‐Ramp Montague Expy DIAG. On‐Ramp
0.70 48 D 41.8 1988
105+04886
I 680 NB Montague Expy DIAG. On‐Ramp Calaveras Blvd DIAG. Off‐Ramp
0.75 30 F 58.0 1722 0.50
105P04886
I 680 NB Calaveras Blvd DIAG. Off‐Ramp Calaveras Blvd DIAG. On‐Ramp
0.84 28 F 58.6 1645 0.75
105+04887
I 680 NB Calaveras Blvd DIAG. On‐Ramp Jacklin Rd DIAG. Off‐Ramp
0.13 33 E 53.5 1786
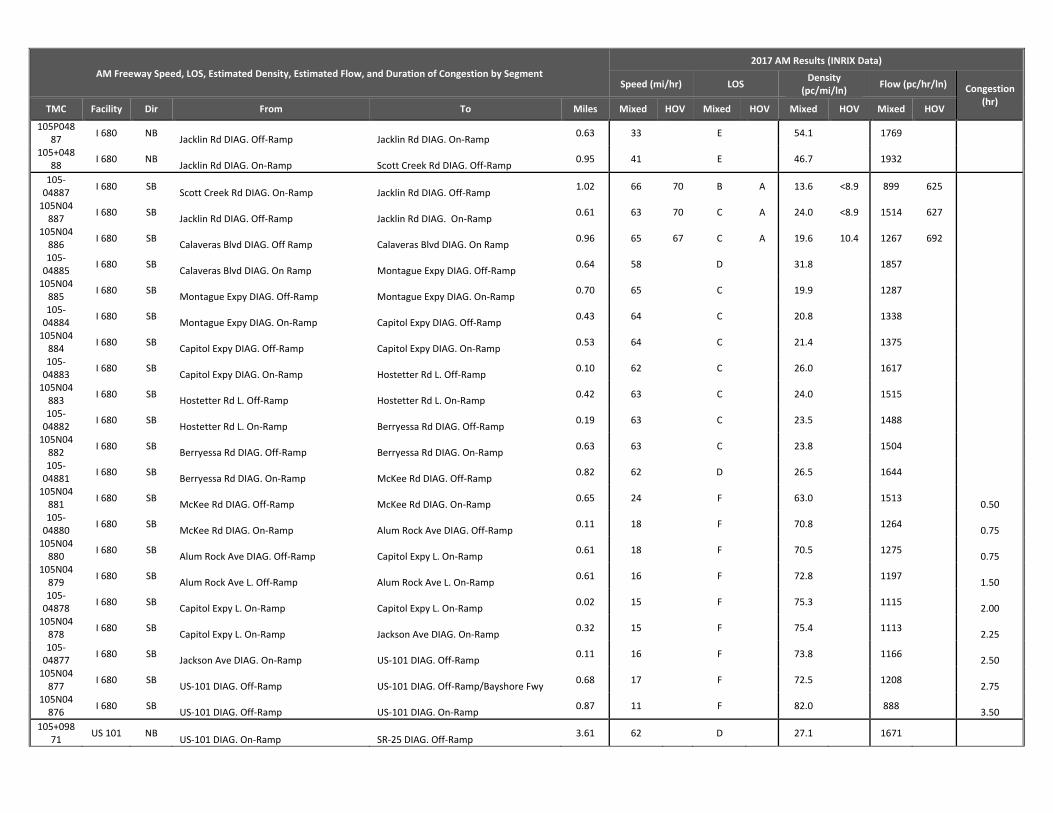
AM Freeway Speed, LOS, Estimated Density, Estimated Flow, and Duration of Congestion by Segment 2017 AM Results (INRIX Data)
Speed (mi/hr) LOS Density
(pc/mi/ln) Flow (pc/hr/ln) Congestion
(hr) TMC Facility Dir From To Miles Mixed HOV Mixed HOV Mixed HOV Mixed HOV
105P04887
I 680 NB Jacklin Rd DIAG. Off‐Ramp Jacklin Rd DIAG. On‐Ramp
0.63 33 E 54.1 1769
105+04888
I 680 NB Jacklin Rd DIAG. On‐Ramp Scott Creek Rd DIAG. Off‐Ramp
0.95 41 E 46.7 1932
105‐04887
I 680 SB Scott Creek Rd DIAG. On‐Ramp Jacklin Rd DIAG. Off‐Ramp
1.02 66 70 B A 13.6 <8.9 899 625
105N04887
I 680 SB Jacklin Rd DIAG. Off‐Ramp Jacklin Rd DIAG. On‐Ramp
0.61 63 70 C A 24.0 <8.9 1514 627
105N04886
I 680 SB Calaveras Blvd DIAG. Off Ramp Calaveras Blvd DIAG. On Ramp
0.96 65 67 C A 19.6 10.4 1267 692
105‐04885
I 680 SB Calaveras Blvd DIAG. On Ramp Montague Expy DIAG. Off‐Ramp
0.64 58 D 31.8 1857
105N04885
I 680 SB Montague Expy DIAG. Off‐Ramp Montague Expy DIAG. On‐Ramp
0.70 65 C 19.9 1287
105‐04884
I 680 SB Montague Expy DIAG. On‐Ramp Capitol Expy DIAG. Off‐Ramp
0.43 64 C 20.8 1338
105N04884
I 680 SB Capitol Expy DIAG. Off‐Ramp Capitol Expy DIAG. On‐Ramp
0.53 64 C 21.4 1375
105‐04883
I 680 SB Capitol Expy DIAG. On‐Ramp Hostetter Rd L. Off‐Ramp
0.10 62 C 26.0 1617
105N04883
I 680 SB Hostetter Rd L. Off‐Ramp Hostetter Rd L. On‐Ramp
0.42 63 C 24.0 1515
105‐04882
I 680 SB Hostetter Rd L. On‐Ramp Berryessa Rd DIAG. Off‐Ramp
0.19 63 C 23.5 1488
105N04882
I 680 SB Berryessa Rd DIAG. Off‐Ramp Berryessa Rd DIAG. On‐Ramp
0.63 63 C 23.8 1504
105‐04881
I 680 SB Berryessa Rd DIAG. On‐Ramp McKee Rd DIAG. Off‐Ramp
0.82 62 D 26.5 1644
105N04881
I 680 SB McKee Rd DIAG. Off‐Ramp McKee Rd DIAG. On‐Ramp
0.65 24 F 63.0 1513 0.50
105‐04880
I 680 SB McKee Rd DIAG. On‐Ramp Alum Rock Ave DIAG. Off‐Ramp
0.11 18 F 70.8 1264 0.75
105N04880
I 680 SB Alum Rock Ave DIAG. Off‐Ramp Capitol Expy L. On‐Ramp
0.61 18 F 70.5 1275 0.75
105N04879
I 680 SB Alum Rock Ave L. Off‐Ramp Alum Rock Ave L. On‐Ramp
0.61 16 F 72.8 1197 1.50
105‐04878
I 680 SB Capitol Expy L. On‐Ramp Capitol Expy L. On‐Ramp
0.02 15 F 75.3 1115 2.00
105N04878
I 680 SB Capitol Expy L. On‐Ramp Jackson Ave DIAG. On‐Ramp
0.32 15 F 75.4 1113 2.25
105‐04877
I 680 SB Jackson Ave DIAG. On‐Ramp US‐101 DIAG. Off‐Ramp
0.11 16 F 73.8 1166 2.50
105N04877
I 680 SB US‐101 DIAG. Off‐Ramp US‐101 DIAG. Off‐Ramp/Bayshore Fwy
0.68 17 F 72.5 1208 2.75
105N04876
I 680 SB US‐101 DIAG. Off‐Ramp US‐101 DIAG. On‐Ramp
0.87 11 F 82.0 888 3.50
105+09871
US 101 NB US‐101 DIAG. On‐Ramp SR‐25 DIAG. Off‐Ramp
3.61 62 D 27.1 1671

AM Freeway Speed, LOS, Estimated Density, Estimated Flow, and Duration of Congestion by Segment 2017 AM Results (INRIX Data)
Speed (mi/hr) LOS Density
(pc/mi/ln) Flow (pc/hr/ln) Congestion
(hr) TMC Facility Dir From To Miles Mixed HOV Mixed HOV Mixed HOV Mixed HOV
105P09871
US 101 NB SR‐25 DIAG. Off‐Ramp SR‐25 DIAG. On‐Ramp
0.12 61 D 28.8 1745
105+09872
US 101 NB SR‐25 DIAG. On‐Ramp Castro Valley Rd
0.43 56 D 34.6 1932
105+04113
US 101 NB Castro Valley Rd Bolsa Rd DIAG. Off‐Ramp
0.98 61 D 28.7 1743
105P04113
US 101 NB Bolsa Rd DIAG. Off‐Ramp Bolsa Rd DIAG. On‐Ramp
0.30 64 C 22.0 1409
105+04114
US 101 NB Bolsa Rd DIAG. On‐Ramp SR‐152 DIAG. Off‐Road
0.89 64 C 22.9 1455
105P04114
US 101 NB SR‐152 DIAG. Off‐Road SR‐152 DIAG. On‐Road
0.47 64 C 21.3 1367
105+04115
US 101 NB SR‐152 DIAG. On‐Road Leavesley Rd DIAG. Off‐Ramp
0.87 62 D 27.2 1674
105P04115
US 101 NB Leavesley Rd DIAG. Off‐Ramp Leavesley Rd DIAG. On‐Ramp
0.68 49 D 40.7 1992
105+04116
US 101 NB Leavesley Rd DIAG. On‐Ramp Masten Ave DIAG. Off‐Ramp
2.07 45 D 44.1 1969
105P04116
US 101 NB Masten Ave DIAG. Off‐Ramp Masten Ave DIAG. On‐Ramp
0.58 44 D 44.5 1964
105+04117
US 101 NB Masten Ave DIAG. On‐Ramp San Martin Ave DIAG. Off‐Ramp
1.71 36 E 51.2 1842
105P04117
US 101 NB San Martin Ave DIAG. Off‐Ramp San Martin Ave DIAG. On‐Ramp
0.44 26 F 60.3 1594 1.00
105+04118
US 101 NB San Martin Ave DIAG. On‐Ramp Tennant Ave DIAG. Off‐Ramp
2.10 13 F 79.1 988 2.50
105P04118
US 101 NB Tennant Ave DIAG. Off‐Ramp Tennant Ave DIAG. On‐Ramp
0.59 9 F 85.7 762 3.00
105+04119
US 101 NB Tennant Ave DIAG. On‐Ramp Dunne Ave DIAG. Off‐Ramp
0.31 9 F 85.0 787 3.25
105P04119
US 101 NB Dunne Ave DIAG. Off‐Ramp Dunne Ave DIAG. On‐Ramp
0.58 13 F 78.8 998 2.75
105+04120
US 101 NB Dunne Ave DIAG. On‐Ramp Cochrane Rd DIAG. Off‐Ramp
1.24 37 E 50.2 1864
105P04120
US 101 NB Cochrane Rd DIAG. Off‐Ramp Cochrane Rd DIAG. On‐Ramp
0.60 60 64 D C 30.2 22.9 1800 1459
105+04121
US 101 NB Cochrane Rd DIAG. On‐Ramp Coyote Creek Golf Dr DIAG. Off‐Ramp
2.89 61 57 D D 27.4 33.6 1686 1908
105P04121
US 101 NB Coyote Creek Golf Dr DIAG. Off‐Ramp Coyote Creek Golf Dr DIAG. On‐Ramp
0.61 60 55 D D 29.3 35.8 1767 1955
105+09288
US 101 NB Coyote Creek Golf Dr DIAG. Off‐Ramp Bailey Ave DIAG. Off‐Ramp
1.42 62 62 C D 25.7 26.9 1605 1662
105P09288
US 101 NB Bailey Ave DIAG. Off‐Ramp Bailey Ave DIAG. On‐Ramp
0.54 59 69 D A 31.3 <8.9 1839 617
105+04122
US 101 NB Bailey Ave DIAG. On‐Ramp SR‐85 DIAG. Off‐Ramp
2.77 63 63 C C 25.3 23.4 1582 1487
105P04122
US 101 NB SR‐85 DIAG. Off‐Ramp Silicon Valley Blvd DIAG. Off‐Ramp
0.51 67 69 A A 9.9 <8.9 664 611

AM Freeway Speed, LOS, Estimated Density, Estimated Flow, and Duration of Congestion by Segment 2017 AM Results (INRIX Data)
Speed (mi/hr) LOS Density
(pc/mi/ln) Flow (pc/hr/ln) Congestion
(hr) TMC Facility Dir From To Miles Mixed HOV Mixed HOV Mixed HOV Mixed HOV
105P04123
US 101 NB Silicon Valley Blvd DIAG. Off‐Ramp Silicon Valley Blvd DIAG. On‐Ramp
0.57 66 69 B A 13.8 <8.9 915 617
105+04124
US 101 NB Silicon Valley Blvd DIAG. On‐Ramp Silver Creek Valley Rd DIAG. Off‐Ramp
0.79 66 65 B C 16.6 18.2 1088 1183
105P04124
US 101 NB Silver Creek Valley Rd DIAG. Off‐Ramp Silver Creek Valley Rd DIAG. On‐Ramp
0.77 26 22 F F 61.2 65.5 1568 1434 0.50
105+04125
US 101 NB Silver Creek Valley Rd DIAG. On‐Ramp Hellyer Ave DIAG. Off‐Ramp
1.34 12 18 F F 79.7 70.2 965 1283 2.25
105P04125
US 101 NB Hellyer Ave DIAG. Off‐Ramp Hellyer Ave L. On‐Ramp
0.27 10 11 F F 82.8 80.9 862 926 2.50
105+04126
US 101 NB Hellyer Ave L. On‐Ramp Yerba Buena Rd L. Off‐Ramp
0.70 13 15 F F 78.3 74.8 1016 1130 2.75
105P04126
US 101 NB Yerba Buena Rd L. Off‐Ramp Capitol Expy DIAG. Off‐Ramp
0.18 14 24 F F 76.4 63.3 1080 1503 3.00
105P04127
US 101 NB Capitol Expy DIAG. Off‐Ramp Capitol Expy DIAG. On‐Ramp
0.97 12 19 F F 79.2 69.6 984 1304 3.00
105+04128
US 101 NB Capitol Expy DIAG. On‐Ramp Tully Rd DIAG. Off‐Ramp
0.64 19 26 F F 69.5 61.0 1308 1573 3.25
105P04128
US 101 NB Tully Rd DIAG. Off‐Ramp Tully Rd DIAG. On‐Ramp
0.63 27 35 F E 59.7 51.6 1613 1830 2.00
105+04129
US 101 NB Tully Rd DIAG. On‐Ramp I‐680 DIAG. Off‐Ramp
0.97 22 25 F F 65.5 61.9 1435 1547 1.75
105P04129
US 101 NB I‐680 DIAG. Off‐Ramp I‐680 DIAG. On‐Ramp
0.79 11 10 F F 82.2 83.5 882 839 3.00
105+04131
US 101 NB I‐680 DIAG. On‐Ramp Alum Rock Ave
0.53 13 12 F F 78.9 79.8 995 964 4.50
105P04132
US 101 NB Alum Rock Ave DIAG. Off‐Ramp McKee Rd DIAG. On‐Ramp
0.75 12 13 F F 79.3 78.7 980 999 4.75
105+04133
US 101 NB McKee Rd DIAG. On‐Ramp Oakland Rd DIAG. Off‐Ramp
1.14 17 17 F F 71.4 71.8 1246 1232 3.00
105P04133
US 101 NB Oakland Rd DIAG. Off‐Ramp Oakland Rd DIAG. On‐Ramp
0.41 16 13 F F 73.6 77.7 1172 1035 3.00
105+04134
US 101 NB Oakland Rd DIAG. On‐Ramp I‐880 DIAG. Off‐Ramp
0.15 16 7 F F 74.1 88.7 1156 656 3.00
105P04134
US 101 NB I‐880 DIAG. Off‐Ramp I‐880 L. On‐Ramp
0.22 16 6 F F 74.0 92.5 1160 527 3.00
105+04135
US 101 NB I‐880 L. On‐Ramp Old Bayshore Hwy DIAG. On‐Ramp
0.34 10 8 F F 84.2 88.5 814 666 3.50
105P04135
US 101 NB Old Bayshore Hwy DIAG. On‐Ramp Old Bayshore Hwy DIAG. Off‐Ramp
0.23 7 7 F F 88.9 88.8 651 655 3.75
105+04136
US 101 NB Old Bayshore Hwy DIAG. Off‐Ramp Brokaw Rd DIAG. Off‐Ramp
0.20 8 7 F F 88.3 90.2 673 605 4.00
105P04136
US 101 NB Brokaw Rd DIAG. Off‐Ramp Brokaw Rd DIAG. On‐Ramp
0.63 7 7 F F 88.6 90.7 662 590 4.25
105P04137
US 101 NB Trimble Rd DIAG. Off‐Ramp SR‐87 DIAG. On‐Ramp
0.45 7 7 F F 89.8 89.2 620 641 4.25
105+04138
US 101 NB SR‐87 DIAG. On‐Ramp Trimble Rd DIAG. Off‐Ramp
0.28 8 5 F F 87.4 93.0 704 509 4.75
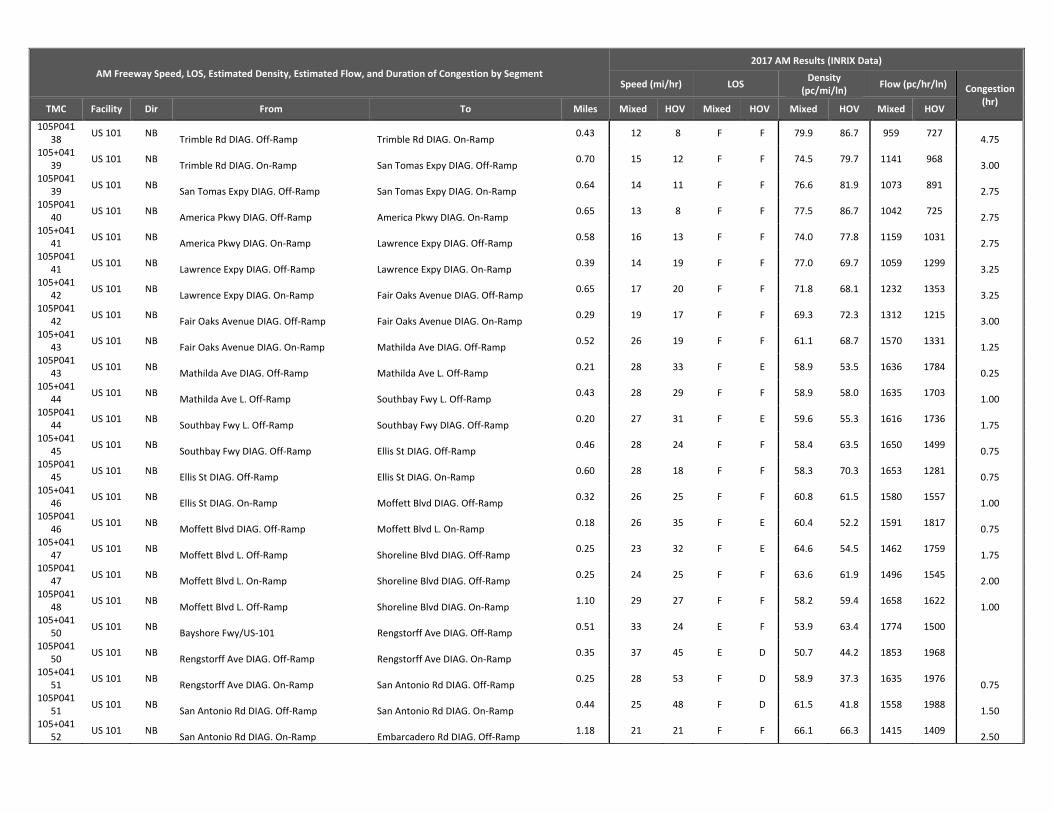
AM Freeway Speed, LOS, Estimated Density, Estimated Flow, and Duration of Congestion by Segment 2017 AM Results (INRIX Data)
Speed (mi/hr) LOS Density
(pc/mi/ln) Flow (pc/hr/ln) Congestion
(hr) TMC Facility Dir From To Miles Mixed HOV Mixed HOV Mixed HOV Mixed HOV
105P04138
US 101 NB Trimble Rd DIAG. Off‐Ramp Trimble Rd DIAG. On‐Ramp
0.43 12 8 F F 79.9 86.7 959 727 4.75
105+04139
US 101 NB Trimble Rd DIAG. On‐Ramp San Tomas Expy DIAG. Off‐Ramp
0.70 15 12 F F 74.5 79.7 1141 968 3.00
105P04139
US 101 NB San Tomas Expy DIAG. Off‐Ramp San Tomas Expy DIAG. On‐Ramp
0.64 14 11 F F 76.6 81.9 1073 891 2.75
105P04140
US 101 NB America Pkwy DIAG. Off‐Ramp America Pkwy DIAG. On‐Ramp
0.65 13 8 F F 77.5 86.7 1042 725 2.75
105+04141
US 101 NB America Pkwy DIAG. On‐Ramp Lawrence Expy DIAG. Off‐Ramp
0.58 16 13 F F 74.0 77.8 1159 1031 2.75
105P04141
US 101 NB Lawrence Expy DIAG. Off‐Ramp Lawrence Expy DIAG. On‐Ramp
0.39 14 19 F F 77.0 69.7 1059 1299 3.25
105+04142
US 101 NB Lawrence Expy DIAG. On‐Ramp Fair Oaks Avenue DIAG. Off‐Ramp
0.65 17 20 F F 71.8 68.1 1232 1353 3.25
105P04142
US 101 NB Fair Oaks Avenue DIAG. Off‐Ramp Fair Oaks Avenue DIAG. On‐Ramp
0.29 19 17 F F 69.3 72.3 1312 1215 3.00
105+04143
US 101 NB Fair Oaks Avenue DIAG. On‐Ramp Mathilda Ave DIAG. Off‐Ramp
0.52 26 19 F F 61.1 68.7 1570 1331 1.25
105P04143
US 101 NB Mathilda Ave DIAG. Off‐Ramp Mathilda Ave L. Off‐Ramp
0.21 28 33 F E 58.9 53.5 1636 1784 0.25
105+04144
US 101 NB Mathilda Ave L. Off‐Ramp Southbay Fwy L. Off‐Ramp
0.43 28 29 F F 58.9 58.0 1635 1703 1.00
105P04144
US 101 NB Southbay Fwy L. Off‐Ramp Southbay Fwy DIAG. Off‐Ramp
0.20 27 31 F E 59.6 55.3 1616 1736 1.75
105+04145
US 101 NB Southbay Fwy DIAG. Off‐Ramp Ellis St DIAG. Off‐Ramp
0.46 28 24 F F 58.4 63.5 1650 1499 0.75
105P04145
US 101 NB Ellis St DIAG. Off‐Ramp Ellis St DIAG. On‐Ramp
0.60 28 18 F F 58.3 70.3 1653 1281 0.75
105+04146
US 101 NB Ellis St DIAG. On‐Ramp Moffett Blvd DIAG. Off‐Ramp
0.32 26 25 F F 60.8 61.5 1580 1557 1.00
105P04146
US 101 NB Moffett Blvd DIAG. Off‐Ramp Moffett Blvd L. On‐Ramp
0.18 26 35 F E 60.4 52.2 1591 1817 0.75
105+04147
US 101 NB Moffett Blvd L. Off‐Ramp Shoreline Blvd DIAG. Off‐Ramp
0.25 23 32 F E 64.6 54.5 1462 1759 1.75
105P04147
US 101 NB Moffett Blvd L. On‐Ramp Shoreline Blvd DIAG. Off‐Ramp
0.25 24 25 F F 63.6 61.9 1496 1545 2.00
105P04148
US 101 NB Moffett Blvd L. Off‐Ramp Shoreline Blvd DIAG. On‐Ramp
1.10 29 27 F F 58.2 59.4 1658 1622 1.00
105+04150
US 101 NB Bayshore Fwy/US‐101 Rengstorff Ave DIAG. Off‐Ramp
0.51 33 24 E F 53.9 63.4 1774 1500
105P04150
US 101 NB Rengstorff Ave DIAG. Off‐Ramp Rengstorff Ave DIAG. On‐Ramp
0.35 37 45 E D 50.7 44.2 1853 1968
105+04151
US 101 NB Rengstorff Ave DIAG. On‐Ramp San Antonio Rd DIAG. Off‐Ramp
0.25 28 53 F D 58.9 37.3 1635 1976 0.75
105P04151
US 101 NB San Antonio Rd DIAG. Off‐Ramp San Antonio Rd DIAG. On‐Ramp
0.44 25 48 F D 61.5 41.8 1558 1988 1.50
105+04152
US 101 NB San Antonio Rd DIAG. On‐Ramp Embarcadero Rd DIAG. Off‐Ramp
1.18 21 21 F F 66.1 66.3 1415 1409 2.50

AM Freeway Speed, LOS, Estimated Density, Estimated Flow, and Duration of Congestion by Segment 2017 AM Results (INRIX Data)
Speed (mi/hr) LOS Density
(pc/mi/ln) Flow (pc/hr/ln) Congestion
(hr) TMC Facility Dir From To Miles Mixed HOV Mixed HOV Mixed HOV Mixed HOV
105P04152
US 101 NB Embarcadero Rd DIAG. Off‐Ramp Embarcadero Rd DIAG. On‐Ramp
0.70 30 31 F E 58.0 55.8 1739 1723 0.25
105N04152
US 101 SB Embarcadero Rd DIAG. Off‐Ramp Embarcadero Rd DIAG. Off‐Ramp
0.65 40 53 E D 48.1 37.6 1907 1980
105‐04151
US 101 SB Oregon Expy DIAG. On‐Ramp San Antonio Rd DIAG. Off‐Ramp
1.37 44 54 D D 45.0 36.1 1958 1961
105N04151
US 101 SB San Antonio Rd DIAG. Off‐Ramp San Antonio Rd L. Off‐Ramp
0.15 49 62 D D 40.4 26.9 1992 1661
105‐04150
US 101 SB San Antonio Rd L. Off‐Ramp Rengstorff Ave DIAG. On‐Ramp
0.70 45 61 D D 43.9 27.7 1971 1697
105N04150
US 101 SB San Antonio Rd L. Off‐Ramp Rengstorff Ave DIAG. Off‐Ramp
0.18 46 61 D D 42.8 28.5 1981 1735
105‐04149
US 101 SB Rengstorff Ave DIAG. Off‐Ramp Old Middlefield Way DIAG. Off‐Ramp
0.46 48 63 D C 41.2 24.5 1990 1542
105N04149
US 101 SB Old Middlefield Way DIAG. Off‐Ramp Old Middlefield Way DIAG. On‐Ramp
0.15 43 60 D D 45.1 29.1 1957 1758
105‐04148
US 101 SB Old Middlefield Way DIAG. On‐Ramp Shoreline Blvd L. On‐Ramp
0.37 46 55 D D 43.3 35.7 1977 1955
105N04147
US 101 SB Shoreline Blvd L. On‐Ramp SR‐85 DIAG. Off‐Ramp
0.36 40 48 E D 48.0 41.2 1909 1990
105‐04146
US 101 SB SR‐85 DIAG. Off‐Ramp Moffett Blvd L. Off‐Ramp
0.22 36 50 E D 51.1 39.5 1843 1991
105N04146
US 101 SB Moffett Blvd L. Off‐Ramp Moffett Blvd DIAG. On‐Ramp
0.15 36 51 E D 51.2 39.0 1840 1989
105‐04145
US 101 SB Moffett Blvd DIAG. On‐Ramp Ellis St DIAG. Off‐Ramp
0.41 35 58 E D 52.0 31.8 1822 1858
105N04145
US 101 SB Ellis St DIAG. Off‐Ramp Ellis St DIAG. On‐Ramp
0.54 36 58 E D 50.9 32.2 1847 1871
105‐04144
US 101 SB Ellis St DIAG. On‐Ramp SR‐237 L. Off‐Ramp
0.60 33 63 E C 53.5 24.5 1784 1541
105N04144
US 101 SB SR‐237 L. Off‐Ramp SR‐237 DIAG. On‐Ramp
0.20 58 66 D B 32.0 13.3 1865 883
105N04143
US 101 SB Mathilda Ave. DIAG. Off‐Ramp Mathilda Ave. DIAG. On‐Ramp
0.33 62 67 C A 25.6 <8.9 1598 598
105‐04142
US 101 SB Mathilda Ave. DIAG. On‐Ramp Fair Oaks Ave DIAG. Off‐Ramp
0.52 62 67 D A 26.3 <8.9 1631 598
105N04142
US 101 SB Fair Oaks Ave DIAG. Off‐Ramp Fair Oaks Ave DIAG. On‐Ramp
0.41 64 69 C A 22.7 <8.9 1448 612
105‐04141
US 101 SB Fair Oaks Ave DIAG. On‐Ramp Lawrence Expy DIAG. Off‐Ramp
0.55 63 68 C A 25.3 <8.9 1582 609
105N04141
US 101 SB Lawrence Expy DIAG. Off‐Ramp Lawrence Expy DIAG. On‐Ramp
0.39 64 68 C A 22.7 <8.9 1448 608
105‐04140
US 101 SB Lawrence Expy DIAG. On‐Ramp Bowers Ave DIAG. Off‐Ramp
0.58 58 66 D B 31.8 16.4 1859 1075
105N04140
US 101 SB Bowers Ave DIAG. Off‐Ramp Bowers Ave DIAG. On‐Ramp
0.67 61 68 D A 28.0 <8.9 1712 607
105‐04139
US 101 SB Bowers Ave DIAG. On‐Ramp San Thomas Expy DIAG. Off‐Ramp
0.11 60 69 D A 29.4 <8.9 1772 617

AM Freeway Speed, LOS, Estimated Density, Estimated Flow, and Duration of Congestion by Segment 2017 AM Results (INRIX Data)
Speed (mi/hr) LOS Density
(pc/mi/ln) Flow (pc/hr/ln) Congestion
(hr) TMC Facility Dir From To Miles Mixed HOV Mixed HOV Mixed HOV Mixed HOV
105N04139
US 101 SB San Thomas Expy DIAG. Off‐Ramp San Thomas Expy DIAG. On‐Ramp
0.65 63 71 C A 24.2 <8.9 1526 628
105‐04138
US 101 SB San Thomas Expy DIAG. On‐Ramp Trimble Rd DIAG. Off‐Ramp
0.78 61 72 D A 28.5 <8.9 1734 640
105N04138
US 101 SB Trimble Rd DIAG. Off‐Ramp Trimble Rd DIAG. On‐Ramp
0.39 56 70 D A 34.2 <8.9 1923 627
105‐04137
US 101 SB Trimble Rd DIAG. On‐Ramp SR‐87 DIAG. Off‐Ramp
0.41 51 70 D A 38.8 <8.9 1988 623
105N04137
US 101 SB SR‐87 DIAG. Off‐Ramp SR‐87 DIAG. Off‐Ramp
0.31 60 68 D A 29.3 <8.9 1764 606
105‐04136
US 101 SB SR‐87 DIAG. Off‐Ramp Airport Pkwy DIAG. Off‐Ramp
0.14 61 68 D A 28.3 <8.9 1725 603
105N04136
US 101 SB 1st St 4th St DIAG. On‐Ramp
0.37 60 69 D A 29.3 <8.9 1768 612
105‐04135
US 101 SB 1st St 4th St DIAG. On‐Ramp
0.38 59 68 D A 30.7 <8.9 1818 609
105N04135
US 101 SB 4th St DIAG. On‐Ramp 4th St DIAG. On‐Ramp
0.26 57 65 D C 33.2 18.1 1899 1180
105‐04134
US 101 SB 4th St DIAG. On‐Ramp I‐880 DIAG. Off‐Ramp
0.12 57 65 D C 33.4 18.8 1905 1221
105N04134
US 101 SB I‐880 DIAG. Off‐Ramp I‐880 DIAG. On‐Ramp
0.49 49 66 D B 40.8 14.1 1991 934
105‐04133
US 101 SB I‐880 DIAG. On‐Ramp Oakland Rd DIAG. Off‐Ramp
0.10 49 65 D B 40.2 17.5 1992 1146
105N04133
US 101 SB Oakland Rd DIAG. Off‐Ramp Oakland Rd DIAG. On‐Ramp
0.42 54 70 D A 36.4 <8.9 1966 621
105‐04132
US 101 SB Oakland Rd DIAG. On‐Ramp McKee Rd DIAG. Off‐Ramp
1.21 59 69 D A 30.6 <8.9 1817 611
105N04132
US 101 SB McKee Rd DIAG. Off‐Ramp Alum Rock Ave DIAG. Off‐Ramp
0.59 61 70 D A 27.6 <8.9 1693 625
105‐04131
US 101 SB McKee Rd DIAG. Off‐Ramp Santa Clara St DIAG. On‐Ramp
0.10 61 73 D A 28.1 <8.9 1715 654
105N04131
US 101 SB McKee Rd DIAG. On‐Ramp Alum Rock Ave DIAG. Off‐Ramp
0.24 60 73 D A 29.3 <8.9 1767 647
105‐04130
US 101 SB Alum Rock Ave DIAG. Off‐Ramp I‐680 DIAG. Off‐Ramp
0.22 60 71 D A 29.4 <8.9 1772 635
105N04130
US 101 SB I‐680 DIAG. Off‐Ramp I‐680 DIAG. On‐Ramp
1.36 61 71 D A 28.2 <8.9 1718 636
105N04128
US 101 SB Tully Rd DIAG. Off‐Ramp Tully Rd DIAG. On‐Ramp
0.47 63 73 C A 24.8 <8.9 1556 647
105‐04127
US 101 SB Tully Rd DIAG. On‐Ramp Capitol Expy DIAG. Off‐Ramp
0.81 62 72 D A 27.1 <8.9 1669 639
105N04127
US 101 SB Capitol Expy DIAG. Off‐Ramp Yerba Buena Rd DIAG. Off‐Ramp
0.74 62 73 C A 25.9 <8.9 1615 653
105‐04126
US 101 SB Yerba Buena Rd DIAG. Off‐Ramp Yerba Buena Rd
0.26 62 72 D A 26.6 <8.9 1646 641
105N04126
US 101 SB Yerba Buena Rd Yerba Buena Rd DIAG. On‐Ramp
0.26 62 71 D A 26.3 <8.9 1631 632
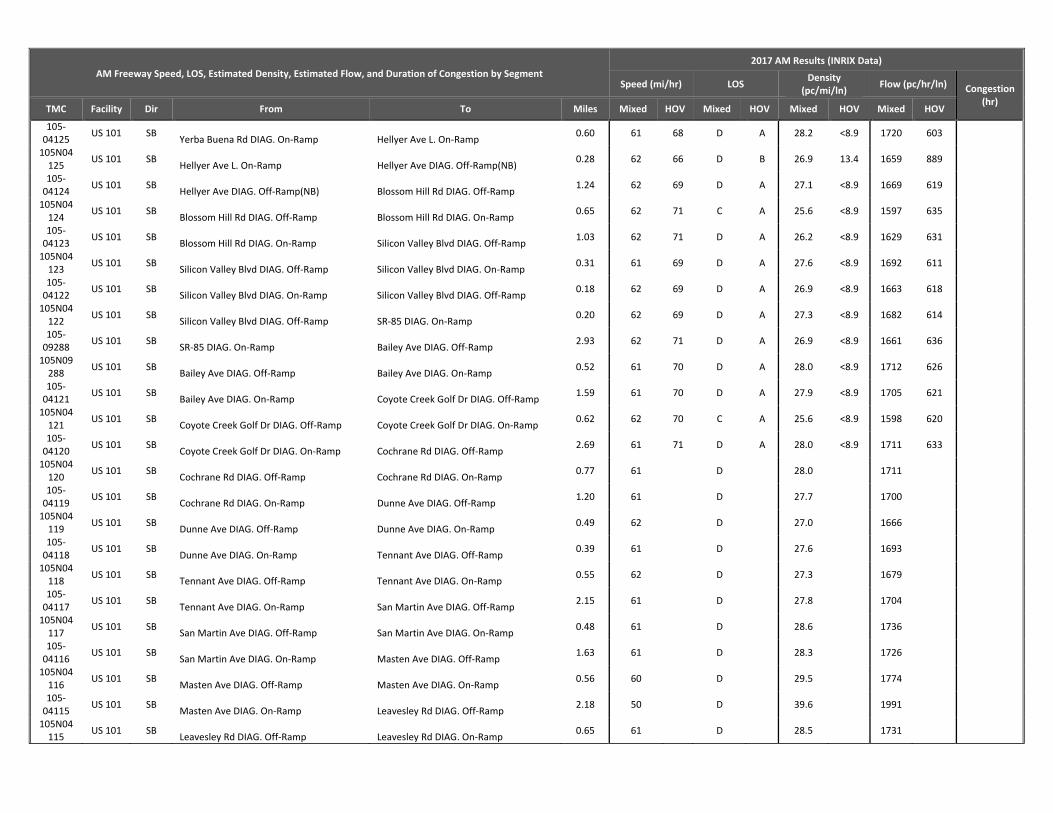
AM Freeway Speed, LOS, Estimated Density, Estimated Flow, and Duration of Congestion by Segment 2017 AM Results (INRIX Data)
Speed (mi/hr) LOS Density
(pc/mi/ln) Flow (pc/hr/ln) Congestion
(hr) TMC Facility Dir From To Miles Mixed HOV Mixed HOV Mixed HOV Mixed HOV
105‐04125
US 101 SB Yerba Buena Rd DIAG. On‐Ramp Hellyer Ave L. On‐Ramp
0.60 61 68 D A 28.2 <8.9 1720 603
105N04125
US 101 SB Hellyer Ave L. On‐Ramp Hellyer Ave DIAG. Off‐Ramp(NB)
0.28 62 66 D B 26.9 13.4 1659 889
105‐04124
US 101 SB Hellyer Ave DIAG. Off‐Ramp(NB) Blossom Hill Rd DIAG. Off‐Ramp
1.24 62 69 D A 27.1 <8.9 1669 619
105N04124
US 101 SB Blossom Hill Rd DIAG. Off‐Ramp Blossom Hill Rd DIAG. On‐Ramp
0.65 62 71 C A 25.6 <8.9 1597 635
105‐04123
US 101 SB Blossom Hill Rd DIAG. On‐Ramp Silicon Valley Blvd DIAG. Off‐Ramp
1.03 62 71 D A 26.2 <8.9 1629 631
105N04123
US 101 SB Silicon Valley Blvd DIAG. Off‐Ramp Silicon Valley Blvd DIAG. On‐Ramp
0.31 61 69 D A 27.6 <8.9 1692 611
105‐04122
US 101 SB Silicon Valley Blvd DIAG. On‐Ramp Silicon Valley Blvd DIAG. Off‐Ramp
0.18 62 69 D A 26.9 <8.9 1663 618
105N04122
US 101 SB Silicon Valley Blvd DIAG. Off‐Ramp SR‐85 DIAG. On‐Ramp
0.20 62 69 D A 27.3 <8.9 1682 614
105‐09288
US 101 SB SR‐85 DIAG. On‐Ramp Bailey Ave DIAG. Off‐Ramp
2.93 62 71 D A 26.9 <8.9 1661 636
105N09288
US 101 SB Bailey Ave DIAG. Off‐Ramp Bailey Ave DIAG. On‐Ramp
0.52 61 70 D A 28.0 <8.9 1712 626
105‐04121
US 101 SB Bailey Ave DIAG. On‐Ramp Coyote Creek Golf Dr DIAG. Off‐Ramp
1.59 61 70 D A 27.9 <8.9 1705 621
105N04121
US 101 SB Coyote Creek Golf Dr DIAG. Off‐Ramp Coyote Creek Golf Dr DIAG. On‐Ramp
0.62 62 70 C A 25.6 <8.9 1598 620
105‐04120
US 101 SB Coyote Creek Golf Dr DIAG. On‐Ramp Cochrane Rd DIAG. Off‐Ramp
2.69 61 71 D A 28.0 <8.9 1711 633
105N04120
US 101 SB Cochrane Rd DIAG. Off‐Ramp Cochrane Rd DIAG. On‐Ramp
0.77 61 D 28.0 1711
105‐04119
US 101 SB Cochrane Rd DIAG. On‐Ramp Dunne Ave DIAG. Off‐Ramp
1.20 61 D 27.7 1700
105N04119
US 101 SB Dunne Ave DIAG. Off‐Ramp Dunne Ave DIAG. On‐Ramp
0.49 62 D 27.0 1666
105‐04118
US 101 SB Dunne Ave DIAG. On‐Ramp Tennant Ave DIAG. Off‐Ramp
0.39 61 D 27.6 1693
105N04118
US 101 SB Tennant Ave DIAG. Off‐Ramp Tennant Ave DIAG. On‐Ramp
0.55 62 D 27.3 1679
105‐04117
US 101 SB Tennant Ave DIAG. On‐Ramp San Martin Ave DIAG. Off‐Ramp
2.15 61 D 27.8 1704
105N04117
US 101 SB San Martin Ave DIAG. Off‐Ramp San Martin Ave DIAG. On‐Ramp
0.48 61 D 28.6 1736
105‐04116
US 101 SB San Martin Ave DIAG. On‐Ramp Masten Ave DIAG. Off‐Ramp
1.63 61 D 28.3 1726
105N04116
US 101 SB Masten Ave DIAG. Off‐Ramp Masten Ave DIAG. On‐Ramp
0.56 60 D 29.5 1774
105‐04115
US 101 SB Masten Ave DIAG. On‐Ramp Leavesley Rd DIAG. Off‐Ramp
2.18 50 D 39.6 1991
105N04115
US 101 SB Leavesley Rd DIAG. Off‐Ramp Leavesley Rd DIAG. On‐Ramp
0.65 61 D 28.5 1731

AM Freeway Speed, LOS, Estimated Density, Estimated Flow, and Duration of Congestion by Segment 2017 AM Results (INRIX Data)
Speed (mi/hr) LOS Density
(pc/mi/ln) Flow (pc/hr/ln) Congestion
(hr) TMC Facility Dir From To Miles Mixed HOV Mixed HOV Mixed HOV Mixed HOV
105‐04114
US 101 SB Leavesley Rd DIAG. On‐Ramp 10th St DIAG. Off‐Ramp
0.86 60 D 29.2 1763
105N04114
US 101 SB 10th St DIAG. Off‐Ramp 10th St DIAG. On‐Ramp
0.56 62 D 26.5 1644
105‐04113
US 101 SB 10th St DIAG. On‐Ramp Monterey Rd DIAG. Off‐Ramp
0.58 60 D 30.2 1802
105N04113
US 101 SB Monterey Rd DIAG. Off‐Ramp Monterey Rd DIAG. On‐Ramp
0.50 61 D 28.6 1739
105‐09872
US 101 SB Monterey Rd DIAG. On‐Ramp Castro Valley Rd
1.04 60 D 29.0 1753
105‐09871
US 101 SB Castro Valley Rd SR‐25 DIAG. Off‐Ramp
0.34 60 D 29.1 1760
105N09871
US 101 SB SR‐25 DIAG. Off‐Ramp SR‐25 DIAG. On‐Ramp
0.40 61 D 28.3 1723
105‐05102
US 101 SB SR‐25 DIAG. On‐Ramp Beatable Rd DIAG. Off‐Ramp
3.60 61 D 28.4 1730
105P04304
SR 85 NB US‐101 DIAG. Off‐Ramp Bernal Rd L. On‐Ramp
0.70 6 60 F D 92.3 29.0 534 1755 2.50
105P04305
SR 85 NB Bernal Rd. L. On‐Ramp Bernal Rd. DIAG. On‐Ramp
0.32 53 67 D A 37.5 <8.9 1979 601
105P04306
SR 85 NB US‐101 DIAG. On‐Ramp Great Oaks Blvd DIAG. On‐Ramp
0.35 63 69 C A 25.1 <8.9 1571 618
105+04307
SR 85 NB Great Oaks Blvd DIAG. On‐Ramp Cottle Rd DIAG. Off‐Ramp
0.80 31 56 E D 55.4 34.3 1734 1927
105P04307
SR 85 NB Cottle Rd DIAG. Off‐Ramp Cottle Rd DIAG. On‐Ramp
0.58 23 29 F F 64.8 58.0 1459 1689 1.50
105+04308
SR 85 NB Cottle Rd DIAG. On‐Ramp Blossom Hill Rd DIAG. Off‐Ramp
1.29 29 33 F E 58.1 53.7 1658 1780 0.25
105P04308
SR 85 NB Blossom Hill Rd DIAG. Off‐Ramp Blossom Hill Rd DIAG. On‐Ramp
0.62 33 37 E E 53.4 50.6 1787 1854
105+04309
SR 85 NB Blossom Hill Rd DIAG. On‐Ramp SR‐87 DIAG. Off‐Ramp
0.53 25 16 F F 62.0 73.7 1544 1168 0.50
105P04309
SR 85 NB SR‐87 DIAG. Off‐Ramp SR‐87 DIAG. On‐Ramp
0.78 12 10 F F 79.8 83.3 964 844 2.50
105P04311
SR 85 NB Almaden Expwy DIAG. Off‐Ramp Almaden Expwy DIAG. On‐Ramp
0.53 11 9 F F 80.9 85.8 925 758 3.50
105+04312
SR 85 NB Almaden Expwy DIAG. On‐Ramp Camden Ave DIAG. Off‐Ramp
1.46 16 16 F F 73.2 73.7 1184 1169 3.00
105P04312
SR 85 NB Camden Ave DIAG. Off‐Ramp Camden Ave DIAG. On‐Ramp
0.43 15 18 F F 74.7 70.6 1136 1270 3.25
105+04313
SR 85 NB Camden Ave DIAG. On‐Ramp Union Ave DIAG. Off‐Ramp
0.79 17 18 F F 72.3 70.3 1214 1282 3.50
105P04313
SR 85 NB Union Ave DIAG. Off‐Ramp Union Ave DIAG. On‐Ramp
0.42 20 31 F E 68.3 56.0 1347 1719 2.25
105+04314
SR 85 NB Union Ave DIAG. On‐Ramp S. Bascom Ave DIAG. Off‐Ramp
0.48 15 8 F F 74.7 87.9 1135 687 2.25
105P04315
SR 85 NB S. Bascom Ave DIAG. Off Ramp Winchester Blvd DIAG. On‐Ramp
1.18 10 9 F F 83.2 84.9 847 788 4.00
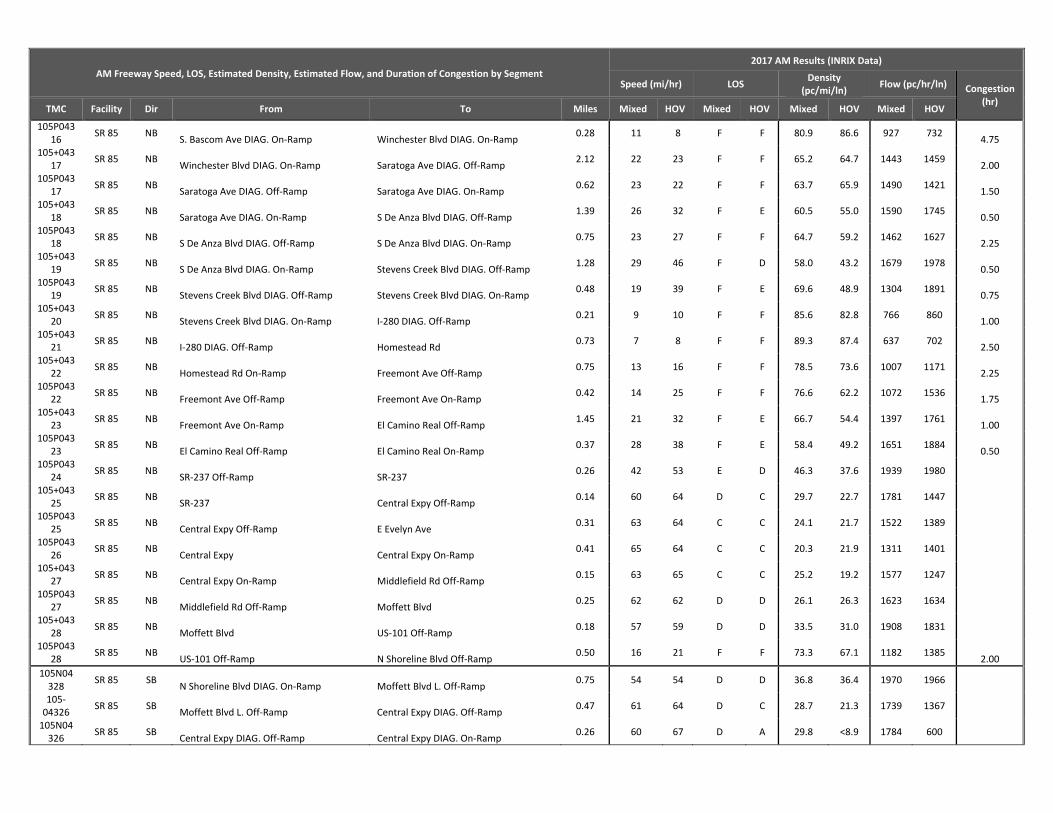
AM Freeway Speed, LOS, Estimated Density, Estimated Flow, and Duration of Congestion by Segment 2017 AM Results (INRIX Data)
Speed (mi/hr) LOS Density
(pc/mi/ln) Flow (pc/hr/ln) Congestion
(hr) TMC Facility Dir From To Miles Mixed HOV Mixed HOV Mixed HOV Mixed HOV
105P04316
SR 85 NB S. Bascom Ave DIAG. On‐Ramp Winchester Blvd DIAG. On‐Ramp
0.28 11 8 F F 80.9 86.6 927 732 4.75
105+04317
SR 85 NB Winchester Blvd DIAG. On‐Ramp Saratoga Ave DIAG. Off‐Ramp
2.12 22 23 F F 65.2 64.7 1443 1459 2.00
105P04317
SR 85 NB Saratoga Ave DIAG. Off‐Ramp Saratoga Ave DIAG. On‐Ramp
0.62 23 22 F F 63.7 65.9 1490 1421 1.50
105+04318
SR 85 NB Saratoga Ave DIAG. On‐Ramp S De Anza Blvd DIAG. Off‐Ramp
1.39 26 32 F E 60.5 55.0 1590 1745 0.50
105P04318
SR 85 NB S De Anza Blvd DIAG. Off‐Ramp S De Anza Blvd DIAG. On‐Ramp
0.75 23 27 F F 64.7 59.2 1462 1627 2.25
105+04319
SR 85 NB S De Anza Blvd DIAG. On‐Ramp Stevens Creek Blvd DIAG. Off‐Ramp
1.28 29 46 F D 58.0 43.2 1679 1978 0.50
105P04319
SR 85 NB Stevens Creek Blvd DIAG. Off‐Ramp Stevens Creek Blvd DIAG. On‐Ramp
0.48 19 39 F E 69.6 48.9 1304 1891 0.75
105+04320
SR 85 NB Stevens Creek Blvd DIAG. On‐Ramp I‐280 DIAG. Off‐Ramp
0.21 9 10 F F 85.6 82.8 766 860 1.00
105+04321
SR 85 NB I‐280 DIAG. Off‐Ramp Homestead Rd
0.73 7 8 F F 89.3 87.4 637 702 2.50
105+04322
SR 85 NB Homestead Rd On‐Ramp Freemont Ave Off‐Ramp
0.75 13 16 F F 78.5 73.6 1007 1171 2.25
105P04322
SR 85 NB Freemont Ave Off‐Ramp Freemont Ave On‐Ramp
0.42 14 25 F F 76.6 62.2 1072 1536 1.75
105+04323
SR 85 NB Freemont Ave On‐Ramp El Camino Real Off‐Ramp
1.45 21 32 F E 66.7 54.4 1397 1761 1.00
105P04323
SR 85 NB El Camino Real Off‐Ramp El Camino Real On‐Ramp
0.37 28 38 F E 58.4 49.2 1651 1884 0.50
105P04324
SR 85 NB SR‐237 Off‐Ramp SR‐237
0.26 42 53 E D 46.3 37.6 1939 1980
105+04325
SR 85 NB SR‐237 Central Expy Off‐Ramp
0.14 60 64 D C 29.7 22.7 1781 1447
105P04325
SR 85 NB Central Expy Off‐Ramp E Evelyn Ave
0.31 63 64 C C 24.1 21.7 1522 1389
105P04326
SR 85 NB Central Expy Central Expy On‐Ramp
0.41 65 64 C C 20.3 21.9 1311 1401
105+04327
SR 85 NB Central Expy On‐Ramp Middlefield Rd Off‐Ramp
0.15 63 65 C C 25.2 19.2 1577 1247
105P04327
SR 85 NB Middlefield Rd Off‐Ramp Moffett Blvd
0.25 62 62 D D 26.1 26.3 1623 1634
105+04328
SR 85 NB Moffett Blvd US‐101 Off‐Ramp
0.18 57 59 D D 33.5 31.0 1908 1831
105P04328
SR 85 NB US‐101 Off‐Ramp N Shoreline Blvd Off‐Ramp
0.50 16 21 F F 73.3 67.1 1182 1385 2.00
105N04328
SR 85 SB N Shoreline Blvd DIAG. On‐Ramp Moffett Blvd L. Off‐Ramp
0.75 54 54 D D 36.8 36.4 1970 1966
105‐04326
SR 85 SB Moffett Blvd L. Off‐Ramp Central Expy DIAG. Off‐Ramp
0.47 61 64 D C 28.7 21.3 1739 1367
105N04326
SR 85 SB Central Expy DIAG. Off‐Ramp Central Expy DIAG. On‐Ramp
0.26 60 67 D A 29.8 <8.9 1784 600

AM Freeway Speed, LOS, Estimated Density, Estimated Flow, and Duration of Congestion by Segment 2017 AM Results (INRIX Data)
Speed (mi/hr) LOS Density
(pc/mi/ln) Flow (pc/hr/ln) Congestion
(hr) TMC Facility Dir From To Miles Mixed HOV Mixed HOV Mixed HOV Mixed HOV
105N04325
SR 85 SB Evelyn Ave DIAG. Off‐Ramp Evelyn Ave DIAG. On‐Ramp
0.24 59 68 D A 30.7 <8.9 1819 609
105N04324
SR 85 SB SR‐237 DIAG. Off‐Ramp SR‐237 L. On‐Ramp
0.27 60 68 D A 29.7 <8.9 1782 607
105‐04323
SR 85 SB SR‐237 L. On‐Ramp El Camino Real L. On‐Ramp
0.34 57 67 D B 33.7 11.9 1911 789
105N04323
SR 85 SB El Camino Real L. On‐Ramp El Camino Real DIAG. On‐Ramp
0.22 60 67 D B 30.0 11.4 1793 760
105‐04322
SR 85 SB El Camino Real DIAG. On‐Ramp Freemont Ave DIAG. Off‐Ramp
1.46 60 68 D A 30.3 <8.9 1804 605
105N04322
SR 85 SB Freemont Ave DIAG. Off‐Ramp Freemont Ave DIAG. On‐Ramp
0.42 61 67 D A 28.2 <8.9 1720 596
105‐04321
SR 85 SB Freemont Ave DIAG. On‐Ramp Homestead Rd DIAG. Off‐Ramp
0.52 58 65 D C 31.8 19.4 1857 1257
105N04321
SR 85 SB Homestead Rd DIAG. Off‐Ramp Homestead Rd DIAG. On‐Ramp
0.30 40 66 E B 48.1 14.7 1907 973
105‐04320
SR 85 SB Homestead Rd DIAG. On‐Ramp I‐280 DIAG. Off‐Ramp
0.73 63 67 C A 25.4 <8.9 1591 599
105‐04319
SR 85 SB I‐280 DIAG. Off‐Ramp I‐280 DIAG. On‐Ramp
0.20 56 63 D C 34.0 24.5 1918 1544
105N04319
SR 85 SB Stevens Creek Blvd DIAG. Off‐Ramp Stevens Creek Blvd DIAG. On‐Ramp
0.52 59 67 D A 30.7 <8.9 1820 598
105‐04318
SR 85 SB Stevens Creek Blvd DIAG. On‐Ramp S De Anza Blvd DIAG. Off‐Ramp
1.29 64 69 C A 21.5 <8.9 1380 613
105N04318
SR 85 SB S De Anza Blvd DIAG. Off‐Ramp S De Anza Blvd DIAG. On‐Ramp
0.54 69 69 A A <8.9 <8.9 610 614
105‐04317
SR 85 SB S De Anza Blvd DIAG. On‐Ramp Saratoga Ave DIAG. Off‐Ramp
1.58 67 68 A A <8.9 <8.9 599 609
105N04317
SR 85 SB Saratoga Ave DIAG. Off‐Ramp Saratoga Ave DIAG. On‐Ramp
0.54 60 67 D A 30.1 9.8 1798 657
105‐04316
SR 85 SB Saratoga Ave DIAG. On‐Ramp Winchester Blvd DIAG. Off‐Ramp
2.19 67 69 A A 9.5 <8.9 634 614
105N04316
SR 85 SB Winchester Blvd DIAG. Off‐Ramp Winchester Blvd DIAG. On‐Ramp
0.28 68 69 A A <8.9 <8.9 606 615
105N04315
SR 85 SB SR‐17 DIAG. Off‐Ramp SR‐17 DIAG. On‐Ramp
0.90 67 69 A A <8.9 <8.9 600 615
105‐04313
SR 85 SB S Bascom Ave DIAG. On‐Ramp Union Ave DIAG. Off‐Ramp
0.35 64 69 C A 21.0 <8.9 1352 616
105N04313
SR 85 SB Union Ave DIAG. Off‐Ramp Union Ave DIAG. On‐Ramp
0.62 67 69 A A 10.3 <8.9 689 616
105‐04312
SR 85 SB Union Ave DIAG. On‐Ramp Camden DIAG. Off‐Ramp
0.80 66 69 B A 13.0 <8.9 865 614
105N04312
SR 85 SB Camden DIAG. Off‐Ramp Camden DIAG. On‐Ramp
0.31 67 69 A A <8.9 <8.9 598 615
105‐04311
SR 85 SB Camden DIAG. On‐Ramp Almaden Expy DIAG. Off‐Ramp
1.43 67 69 B A 11.2 <8.9 748 610
105N04311
SR 85 SB Almaden Expy DIAG. Off‐Ramp Almaden Expy DIAG. On‐Ramp
0.44 66 68 B A 15.7 <8.9 1036 605

AM Freeway Speed, LOS, Estimated Density, Estimated Flow, and Duration of Congestion by Segment 2017 AM Results (INRIX Data)
Speed (mi/hr) LOS Density
(pc/mi/ln) Flow (pc/hr/ln) Congestion
(hr) TMC Facility Dir From To Miles Mixed HOV Mixed HOV Mixed HOV Mixed HOV
105‐04310
SR 85 SB Almaden Expy DIAG. On‐Ramp SR‐87 DIAG. Off‐Ramp
0.50 63 69 C A 23.8 <8.9 1507 610
105N04310
SR 85 SB SR‐87 DIAG. Off‐Ramp SR‐87 DIAG. On‐Ramp
0.52 63 69 C A 25.2 <8.9 1576 618
105‐04308
SR 85 SB SR‐87 DIAG. On‐Ramp Blossom Hill Rd DIAG. Off‐Ramp
0.44 64 69 C A 23.0 <8.9 1460 617
105N04308
SR 85 SB Blossom Hill Rd DIAG. Off‐Ramp Blossom Hill Rd DIAG. On‐Ramp
0.64 66 69 B A 16.9 <8.9 1105 618
105‐04307
SR 85 SB Blossom Hill Rd DIAG. On‐Ramp Cottle Rd DIAG. Off‐Ramp
1.35 65 69 B A 17.2 <8.9 1124 618
105N04307
SR 85 SB Cottle Rd DIAG. Off‐Ramp Cottle Rd DIAG. On‐Ramp
0.69 67 69 A A <8.9 <8.9 596 618
105‐04306
SR 85 SB Cottle Rd DIAG. On‐Ramp Great Oaks Blvd DIAG. Off‐Ramp
0.72 65 69 C A 19.9 <8.9 1289 613
105N04306
SR 85 SB Great Oaks Blvd DIAG. Off‐Ramp Great Oaks Blvd DIAG. On‐Ramp
0.34 65 69 C A 19.2 <8.9 1247 615
105N04305
SR 85 SB US‐101 DIAG. Off‐Ramp US‐101 DIAG. On‐Ramp
0.59 64 66 C B 23.0 16.7 1460 1094
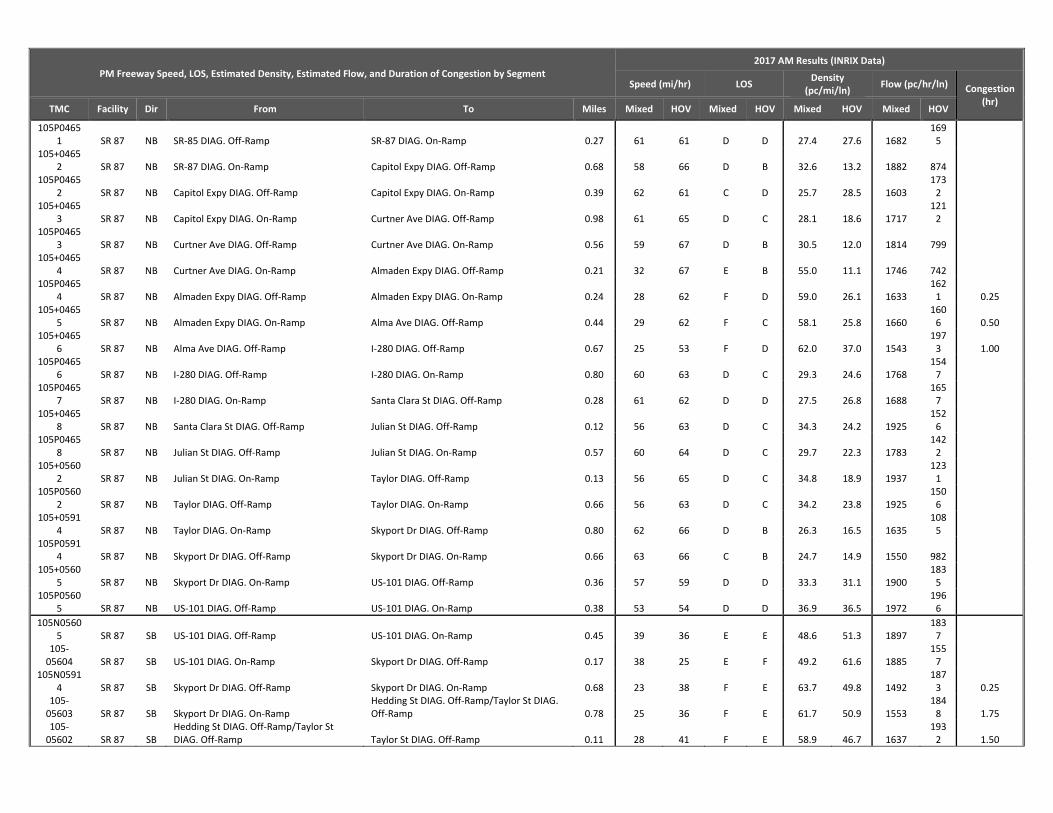
PM Freeway Speed, LOS, Estimated Density, Estimated Flow, and Duration of Congestion by Segment 2017 AM Results (INRIX Data)
Speed (mi/hr) LOS Density
(pc/mi/ln) Flow (pc/hr/ln) Congestion
(hr) TMC Facility Dir From To Miles Mixed HOV Mixed HOV Mixed HOV Mixed HOV
105P04651 SR 87 NB SR‐85 DIAG. Off‐Ramp SR‐87 DIAG. On‐Ramp 0.27 61 61 D D 27.4 27.6 1682
1695
105+04652 SR 87 NB SR‐87 DIAG. On‐Ramp Capitol Expy DIAG. Off‐Ramp 0.68 58 66 D B 32.6 13.2 1882 874
105P04652 SR 87 NB Capitol Expy DIAG. Off‐Ramp Capitol Expy DIAG. On‐Ramp 0.39 62 61 C D 25.7 28.5 1603
1732
105+04653 SR 87 NB Capitol Expy DIAG. On‐Ramp Curtner Ave DIAG. Off‐Ramp 0.98 61 65 D C 28.1 18.6 1717
1212
105P04653 SR 87 NB Curtner Ave DIAG. Off‐Ramp Curtner Ave DIAG. On‐Ramp 0.56 59 67 D B 30.5 12.0 1814 799
105+04654 SR 87 NB Curtner Ave DIAG. On‐Ramp Almaden Expy DIAG. Off‐Ramp 0.21 32 67 E B 55.0 11.1 1746 742
105P04654 SR 87 NB Almaden Expy DIAG. Off‐Ramp Almaden Expy DIAG. On‐Ramp 0.24 28 62 F D 59.0 26.1 1633
1621 0.25
105+04655 SR 87 NB Almaden Expy DIAG. On‐Ramp Alma Ave DIAG. Off‐Ramp 0.44 29 62 F C 58.1 25.8 1660
1606 0.50
105+04656 SR 87 NB Alma Ave DIAG. Off‐Ramp I‐280 DIAG. Off‐Ramp 0.67 25 53 F D 62.0 37.0 1543
1973 1.00
105P04656 SR 87 NB I‐280 DIAG. Off‐Ramp I‐280 DIAG. On‐Ramp 0.80 60 63 D C 29.3 24.6 1768
1547
105P04657 SR 87 NB I‐280 DIAG. On‐Ramp Santa Clara St DIAG. Off‐Ramp 0.28 61 62 D D 27.5 26.8 1688
1657
105+04658 SR 87 NB Santa Clara St DIAG. Off‐Ramp Julian St DIAG. Off‐Ramp 0.12 56 63 D C 34.3 24.2 1925
1526
105P04658 SR 87 NB Julian St DIAG. Off‐Ramp Julian St DIAG. On‐Ramp 0.57 60 64 D C 29.7 22.3 1783
1422
105+05602 SR 87 NB Julian St DIAG. On‐Ramp Taylor DIAG. Off‐Ramp 0.13 56 65 D C 34.8 18.9 1937
1231
105P05602 SR 87 NB Taylor DIAG. Off‐Ramp Taylor DIAG. On‐Ramp 0.66 56 63 D C 34.2 23.8 1925
1506
105+05914 SR 87 NB Taylor DIAG. On‐Ramp Skyport Dr DIAG. Off‐Ramp 0.80 62 66 D B 26.3 16.5 1635
1085
105P05914 SR 87 NB Skyport Dr DIAG. Off‐Ramp Skyport Dr DIAG. On‐Ramp 0.66 63 66 C B 24.7 14.9 1550 982
105+05605 SR 87 NB Skyport Dr DIAG. On‐Ramp US‐101 DIAG. Off‐Ramp 0.36 57 59 D D 33.3 31.1 1900
1835
105P05605 SR 87 NB US‐101 DIAG. Off‐Ramp US‐101 DIAG. On‐Ramp 0.38 53 54 D D 36.9 36.5 1972
1966
105N05605 SR 87 SB US‐101 DIAG. Off‐Ramp US‐101 DIAG. On‐Ramp 0.45 39 36 E E 48.6 51.3 1897
1837
105‐05604 SR 87 SB US‐101 DIAG. On‐Ramp Skyport Dr DIAG. Off‐Ramp 0.17 38 25 E F 49.2 61.6 1885
1557
105N05914 SR 87 SB Skyport Dr DIAG. Off‐Ramp Skyport Dr DIAG. On‐Ramp 0.68 23 38 F E 63.7 49.8 1492
1873 0.25
105‐05603 SR 87 SB Skyport Dr DIAG. On‐Ramp
Hedding St DIAG. Off‐Ramp/Taylor St DIAG. Off‐Ramp 0.78 25 36 F E 61.7 50.9 1553
1848 1.75
105‐05602 SR 87 SB
Hedding St DIAG. Off‐Ramp/Taylor St DIAG. Off‐Ramp Taylor St DIAG. Off‐Ramp 0.11 28 41 F E 58.9 46.7 1637
1932 1.50
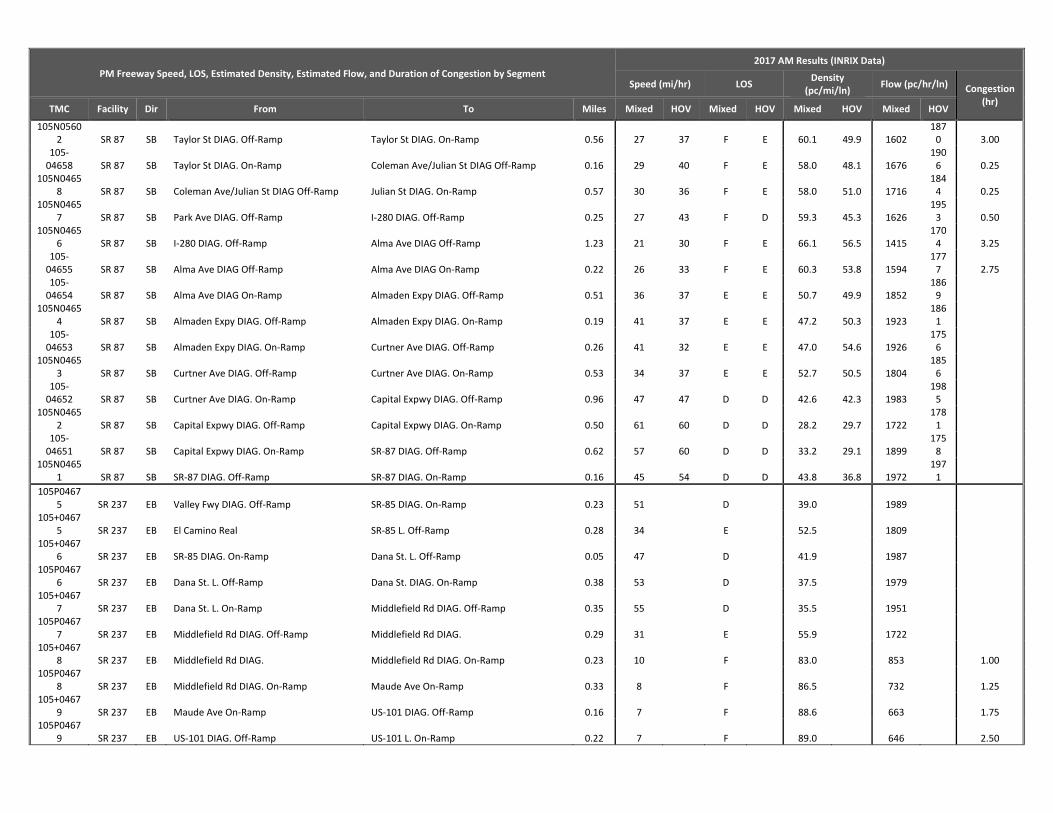
PM Freeway Speed, LOS, Estimated Density, Estimated Flow, and Duration of Congestion by Segment 2017 AM Results (INRIX Data)
Speed (mi/hr) LOS Density
(pc/mi/ln) Flow (pc/hr/ln) Congestion
(hr) TMC Facility Dir From To Miles Mixed HOV Mixed HOV Mixed HOV Mixed HOV
105N05602 SR 87 SB Taylor St DIAG. Off‐Ramp Taylor St DIAG. On‐Ramp 0.56 27 37 F E 60.1 49.9 1602
1870 3.00
105‐04658 SR 87 SB Taylor St DIAG. On‐Ramp Coleman Ave/Julian St DIAG Off‐Ramp 0.16 29 40 F E 58.0 48.1 1676
1906 0.25
105N04658 SR 87 SB Coleman Ave/Julian St DIAG Off‐Ramp Julian St DIAG. On‐Ramp 0.57 30 36 F E 58.0 51.0 1716
1844 0.25
105N04657 SR 87 SB Park Ave DIAG. Off‐Ramp I‐280 DIAG. Off‐Ramp 0.25 27 43 F D 59.3 45.3 1626
1953 0.50
105N04656 SR 87 SB I‐280 DIAG. Off‐Ramp Alma Ave DIAG Off‐Ramp 1.23 21 30 F E 66.1 56.5 1415
1704 3.25
105‐04655 SR 87 SB Alma Ave DIAG Off‐Ramp Alma Ave DIAG On‐Ramp 0.22 26 33 F E 60.3 53.8 1594
1777 2.75
105‐04654 SR 87 SB Alma Ave DIAG On‐Ramp Almaden Expy DIAG. Off‐Ramp 0.51 36 37 E E 50.7 49.9 1852
1869
105N04654 SR 87 SB Almaden Expy DIAG. Off‐Ramp Almaden Expy DIAG. On‐Ramp 0.19 41 37 E E 47.2 50.3 1923
1861
105‐04653 SR 87 SB Almaden Expy DIAG. On‐Ramp Curtner Ave DIAG. Off‐Ramp 0.26 41 32 E E 47.0 54.6 1926
1756
105N04653 SR 87 SB Curtner Ave DIAG. Off‐Ramp Curtner Ave DIAG. On‐Ramp 0.53 34 37 E E 52.7 50.5 1804
1856
105‐04652 SR 87 SB Curtner Ave DIAG. On‐Ramp Capital Expwy DIAG. Off‐Ramp 0.96 47 47 D D 42.6 42.3 1983
1985
105N04652 SR 87 SB Capital Expwy DIAG. Off‐Ramp Capital Expwy DIAG. On‐Ramp 0.50 61 60 D D 28.2 29.7 1722
1781
105‐04651 SR 87 SB Capital Expwy DIAG. On‐Ramp SR‐87 DIAG. Off‐Ramp 0.62 57 60 D D 33.2 29.1 1899
1758
105N04651 SR 87 SB SR‐87 DIAG. Off‐Ramp SR‐87 DIAG. On‐Ramp 0.16 45 54 D D 43.8 36.8 1972
1971
105P04675 SR 237 EB Valley Fwy DIAG. Off‐Ramp SR‐85 DIAG. On‐Ramp 0.23 51 D 39.0 1989
105+04675 SR 237 EB El Camino Real SR‐85 L. Off‐Ramp 0.28 34 E 52.5 1809
105+04676 SR 237 EB SR‐85 DIAG. On‐Ramp Dana St. L. Off‐Ramp 0.05 47 D 41.9 1987
105P04676 SR 237 EB Dana St. L. Off‐Ramp Dana St. DIAG. On‐Ramp 0.38 53 D 37.5 1979
105+04677 SR 237 EB Dana St. L. On‐Ramp Middlefield Rd DIAG. Off‐Ramp 0.35 55 D 35.5 1951
105P04677 SR 237 EB Middlefield Rd DIAG. Off‐Ramp Middlefield Rd DIAG. 0.29 31 E 55.9 1722
105+04678 SR 237 EB Middlefield Rd DIAG. Middlefield Rd DIAG. On‐Ramp 0.23 10 F 83.0 853 1.00
105P04678 SR 237 EB Middlefield Rd DIAG. On‐Ramp Maude Ave On‐Ramp 0.33 8 F 86.5 732 1.25
105+04679 SR 237 EB Maude Ave On‐Ramp US‐101 DIAG. Off‐Ramp 0.16 7 F 88.6 663 1.75
105P04679 SR 237 EB US‐101 DIAG. Off‐Ramp US‐101 L. On‐Ramp 0.22 7 F 89.0 646 2.50

PM Freeway Speed, LOS, Estimated Density, Estimated Flow, and Duration of Congestion by Segment 2017 AM Results (INRIX Data)
Speed (mi/hr) LOS Density
(pc/mi/ln) Flow (pc/hr/ln) Congestion
(hr) TMC Facility Dir From To Miles Mixed HOV Mixed HOV Mixed HOV Mixed HOV
105+04680 SR 237 EB US‐101 L. On‐Ramp Mathilda Ave DIAG. Off‐Ramp 0.31 9 F 86.1 749 3.25
105P04680 SR 237 EB Mathilda Ave DIAG. Off‐Ramp Mathilda Ave DIAG. On‐Ramp 0.46 11 10 F F 81.3 83.2 911 848 3.25
105+04681 SR 237 EB Mathilda Ave DIAG. On‐Ramp Fair Oaks Way DIAG. Off‐Ramp 0.54 11 22 F F 80.9 65.9 927
1423 2.75
105P04681 SR 237 EB Fair Oaks Way DIAG. Off‐Ramp Fair Oaks Way L. On‐Ramp 0.21 10 13 F F 83.9 78.2 822
1016 3.25
105+04682 SR 237 EB Fair Oaks Way L. On‐Ramp Lawrence Expy DIAG. Off‐Ramp 0.30 10 11 F F 84.0 80.9 820 928 3.50
105P04682 SR 237 EB Lawrence Expy DIAG. Off‐Ramp Lawrence Expy DIAG. On‐Ramp 0.61 10 16 F F 82.9 74.1 857
1154 4.50
105+05140 SR 237 EB Lawrence Expy DIAG. On‐Ramp Great America Pkwy DIAG. Off‐Ramp 0.60 13 15 F F 78.5 75.5 1006
1110 5.00
105P05140 SR 237 EB Great America Pkwy DIAG. Off‐Ramp Great America Pkwy DIAG. On‐Ramp 0.81 14 22 F F 76.7 65.6 1067
1432 5.50
105+05142 SR 237 EB Great America Pkwy DIAG. On‐Ramp 1st L. Off‐Ramp 0.55 17 21 F F 72.3 67.0 1214
1388 5.50
105P05142 SR 237 EB 1st L. Off‐Ramp 1st DIAG. On‐Ramp 0.33 21 27 F F 66.2 60.2 1411
1597 4.25
105+05143 SR 237 EB 1st DIAG. On‐Ramp Zanker Rd DIAG. Off‐Ramp 0.56 32 39 E E 54.9 48.2 1747
1905
105P05143 SR 237 EB Zanker Rd DIAG. Off‐Ramp Zanker Rd DIAG. On‐Ramp 0.50 39 43 E D 48.6 45.7 1896
1948
105+05144 SR 237 EB Zanker Rd DIAG. On‐Ramp McCarthy Blvd DIAG. Off‐Ramp 0.28 49 56 D D 40.5 34.1 1992
1921
105P05144 SR 237 EB McCarthy Blvd DIAG. Off‐Ramp McCarthy Blvd DIAG. On‐Ramp 0.65 21 59 F D 66.9 30.5 1391
1812 1.75
105P05145 SR 237 EB I‐880 DIAG. Off‐Ramp I‐880 DIAG. On‐Ramp 0.25 12 F 80.5 940 8.00
105N05144 SR 237 WB McCarthy Blvd DIAG. Off‐Ramp McCarthy Blvd DIAG. On‐Ramp 0.57 34 62 E C 53.3 25.9 1789
1614
105‐05143 SR 237 WB McCarthy Blvd DIAG. On‐Ramp Zanker Rd DIAG. Off‐Ramp 0.29 24 59 F D 63.2 30.5 1508
1813 0.75
105N05143 SR 237 WB Zanker Rd DIAG. Off‐Ramp Zanker Rd DIAG. On‐Ramp 0.35 32 59 E D 54.9 31.4 1748
1844
105‐05142 SR 237 WB Zanker Rd DIAG. On‐Ramp 1st DIAG. Off‐Ramp 0.84 42 62 D D 45.9 26.3 1945
1630
105N05142 SR 237 WB 1st DIAG. Off‐Ramp 1st DIAG. On‐Ramp 0.48 58 67 D A 32.9 <8.9 1889 600
105‐05141 SR 237 WB 1st DIAG. On‐Ramp America Center Dr DIAG. Off‐Ramp 0.37 59 65 D C 30.9 18.8 1828
1220
105N05141 SR 237 WB America Center Dr DIAG. Off‐Ramp America Center Dr DIAG. Off‐Ramp 0.13 59 66 D B 31.0 15.3 1830
1007
105N05140 SR 237 WB America Center Dr DIAG. Off‐Ramp America Center Dr DIAG. On‐Ramp 0.74 62 67 D B 26.3 11.3 1635 752
105‐04682 SR 237 WB America Center Dr DIAG. On‐Ramp Lawrence Expy DIAG. Off‐Ramp 0.54 58 67 D A 31.8 <8.9 1857 598

PM Freeway Speed, LOS, Estimated Density, Estimated Flow, and Duration of Congestion by Segment 2017 AM Results (INRIX Data)
Speed (mi/hr) LOS Density
(pc/mi/ln) Flow (pc/hr/ln) Congestion
(hr) TMC Facility Dir From To Miles Mixed HOV Mixed HOV Mixed HOV Mixed HOV
105N04682 SR 237 WB Lawrence Expy DIAG. Off‐Ramp Lawrence Expy DIAG. On‐Ramp 0.66 29 65 F B 58.0 17.3 1663
1134 0.25
105‐04681 SR 237 WB Lawrence Expy DIAG. On‐Ramp Java Dr DIAG. Off‐Ramp 0.33 13 22 F F 78.2 65.2 1019
1445 1.00
105N04681 SR 237 WB Java Dr DIAG. Off‐Ramp Java Dr DIAG. On‐Ramp 0.18 12 9 F F 80.4 86.0 944 751 1.50
105‐04680 SR 237 WB Java Dr DIAG. On‐Ramp Mathilda Ave DIAG Off‐Ramp 0.54 12 F 80.1 955 1.50
105N04680 SR 237 WB Mathilda Ave DIAG Off‐Ramp Mathilda Ave DIAG On‐Ramp 0.45 15 F 75.4 1112 2.50
105‐04679 SR 237 WB Mathilda Ave DIAG On‐Ramp US‐101 DIAG. Off‐Ramp 0.09 18 F 71.1 1255 2.25
105N04679 SR 237 WB US‐101 DIAG. Off‐Ramp US‐101 L. On‐Ramp 0.21 14 F 76.4 1078 1.50
105‐04678 SR 237 WB US‐101 L. On‐Ramp Maude Ave DIAG. Off‐Ramp 0.48 16 F 72.8 1200 1.50
105N04678 SR 237 WB Maude Ave DIAG. Off‐Ramp Maude Ave DIAG. On‐Ramp 0.28 14 F 76.7 1068 2.00
105‐04677 SR 237 WB Maude Ave DIAG. On‐Ramp Middlefield DIAG. Off‐Ramp 0.22 11 F 81.5 906 2.00
105N04677 SR 237 WB Middlefield DIAG. Off‐Ramp Middlefield DIAG. On‐Ramp 0.30 12 F 80.7 933 2.50
105‐04676 SR 237 WB Middlefield DIAG. On‐Ramp Dana St DIAG. Off‐Ramp 0.44 20 F 67.8 1362 2.25
105N04676 SR 237 WB Dana St DIAG. Off‐Ramp Dana St L. On‐Ramp 0.23 23 F 63.8 1487 3.50
105‐04675 SR 237 WB Dana St L. On‐Ramp SR‐85 L. Off‐Ramp 0.10 23 F 63.9 1485 2.75
105N04675 SR 237 WB SR‐85 L. Off‐Ramp SR‐85 DIAG. On‐Ramp 0.30 38 E 49.4 1881
105‐20468 SR 237 WB SR‐85 DIAG. On‐Ramp El Camino Real 0.21 12 F 80.4 941 9.00
105P05135 SR 17 NB Summit DIAG. Off Ramp Summit DIAG. On‐Ramp 0.10 45 D 44.2 1968
105+05136 SR 17 NB Summit DIAG. On‐Ramp Idylwild Road 2.39 46 D 43.1 1978
105+05137 SR 17 NB Idylwild Road Bear Creek Road DIAG. Off‐Ramp 1.62 45 D 43.8 1972
105P05137 SR 17 NB Bear Creek Road DIAG. Off‐Ramp Bear Creek Road DIAG. On‐Ramp 0.19 51 D 39.2 1990
105+05138 SR 17 NB Bear Creek Road DIAG. On‐Ramp Santa Cruz DIAG. Off‐Ramp 1.82 49 D 40.8 1991
105+04645 SR 17 NB Santa Cruz DIAG. Off‐Ramp Saratoga Los Gatos Rd DIAG. Off‐Ramp 0.78 53 D 37.3 1976
105P04645 SR 17 NB Saratoga Los Gatos Rd DIAG. Off‐Ramp Saratoga Los Gatos Rd DIAG. On‐Ramp 0.30 28 F 58.8 1638 6.00
105+04646 SR 17 NB Saratoga Los Gatos Rd DIAG. On‐Ramp Lark Ave DIAG. Off‐Ramp 1.39 58 D 32.8 1889
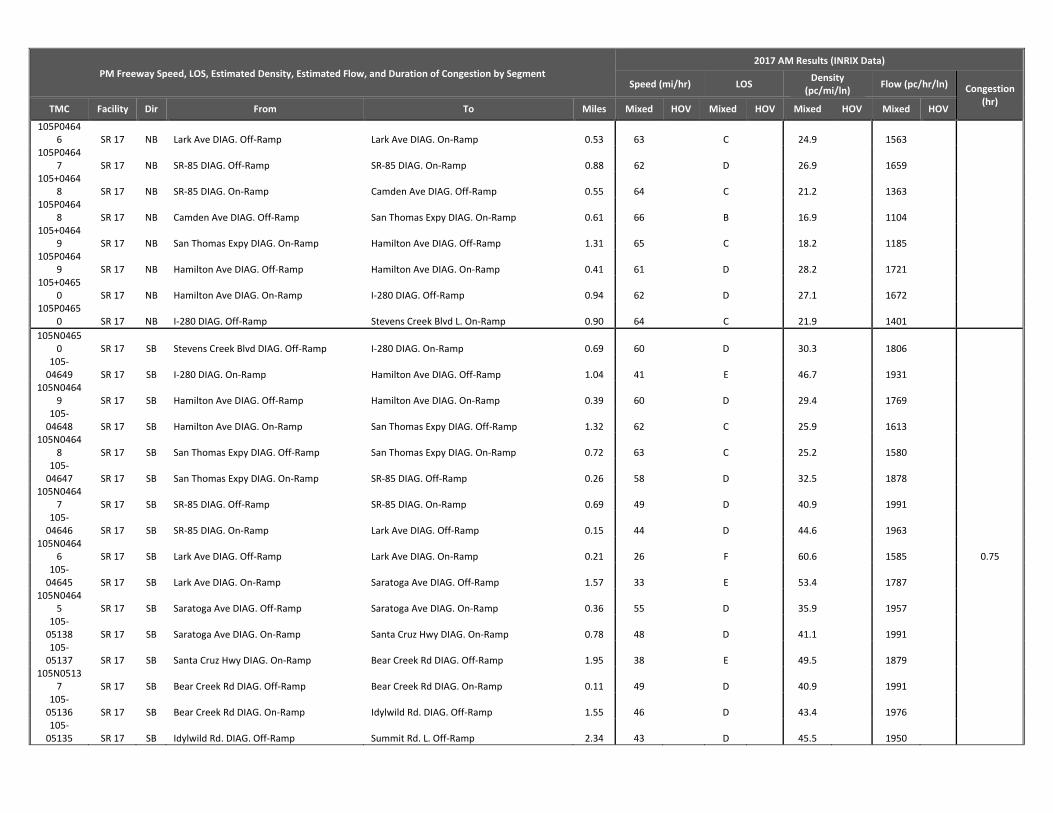
PM Freeway Speed, LOS, Estimated Density, Estimated Flow, and Duration of Congestion by Segment 2017 AM Results (INRIX Data)
Speed (mi/hr) LOS Density
(pc/mi/ln) Flow (pc/hr/ln) Congestion
(hr) TMC Facility Dir From To Miles Mixed HOV Mixed HOV Mixed HOV Mixed HOV
105P04646 SR 17 NB Lark Ave DIAG. Off‐Ramp Lark Ave DIAG. On‐Ramp 0.53 63 C 24.9 1563
105P04647 SR 17 NB SR‐85 DIAG. Off‐Ramp SR‐85 DIAG. On‐Ramp 0.88 62 D 26.9 1659
105+04648 SR 17 NB SR‐85 DIAG. On‐Ramp Camden Ave DIAG. Off‐Ramp 0.55 64 C 21.2 1363
105P04648 SR 17 NB Camden Ave DIAG. Off‐Ramp San Thomas Expy DIAG. On‐Ramp 0.61 66 B 16.9 1104
105+04649 SR 17 NB San Thomas Expy DIAG. On‐Ramp Hamilton Ave DIAG. Off‐Ramp 1.31 65 C 18.2 1185
105P04649 SR 17 NB Hamilton Ave DIAG. Off‐Ramp Hamilton Ave DIAG. On‐Ramp 0.41 61 D 28.2 1721
105+04650 SR 17 NB Hamilton Ave DIAG. On‐Ramp I‐280 DIAG. Off‐Ramp 0.94 62 D 27.1 1672
105P04650 SR 17 NB I‐280 DIAG. Off‐Ramp Stevens Creek Blvd L. On‐Ramp 0.90 64 C 21.9 1401
105N04650 SR 17 SB Stevens Creek Blvd DIAG. Off‐Ramp I‐280 DIAG. On‐Ramp 0.69 60 D 30.3 1806
105‐04649 SR 17 SB I‐280 DIAG. On‐Ramp Hamilton Ave DIAG. Off‐Ramp 1.04 41 E 46.7 1931
105N04649 SR 17 SB Hamilton Ave DIAG. Off‐Ramp Hamilton Ave DIAG. On‐Ramp 0.39 60 D 29.4 1769
105‐04648 SR 17 SB Hamilton Ave DIAG. On‐Ramp San Thomas Expy DIAG. Off‐Ramp 1.32 62 C 25.9 1613
105N04648 SR 17 SB San Thomas Expy DIAG. Off‐Ramp San Thomas Expy DIAG. On‐Ramp 0.72 63 C 25.2 1580
105‐04647 SR 17 SB San Thomas Expy DIAG. On‐Ramp SR‐85 DIAG. Off‐Ramp 0.26 58 D 32.5 1878
105N04647 SR 17 SB SR‐85 DIAG. Off‐Ramp SR‐85 DIAG. On‐Ramp 0.69 49 D 40.9 1991
105‐04646 SR 17 SB SR‐85 DIAG. On‐Ramp Lark Ave DIAG. Off‐Ramp 0.15 44 D 44.6 1963
105N04646 SR 17 SB Lark Ave DIAG. Off‐Ramp Lark Ave DIAG. On‐Ramp 0.21 26 F 60.6 1585 0.75
105‐04645 SR 17 SB Lark Ave DIAG. On‐Ramp Saratoga Ave DIAG. Off‐Ramp 1.57 33 E 53.4 1787
105N04645 SR 17 SB Saratoga Ave DIAG. Off‐Ramp Saratoga Ave DIAG. On‐Ramp 0.36 55 D 35.9 1957
105‐05138 SR 17 SB Saratoga Ave DIAG. On‐Ramp Santa Cruz Hwy DIAG. On‐Ramp 0.78 48 D 41.1 1991 105‐05137 SR 17 SB Santa Cruz Hwy DIAG. On‐Ramp Bear Creek Rd DIAG. Off‐Ramp 1.95 38 E 49.5 1879
105N05137 SR 17 SB Bear Creek Rd DIAG. Off‐Ramp Bear Creek Rd DIAG. On‐Ramp 0.11 49 D 40.9 1991
105‐05136 SR 17 SB Bear Creek Rd DIAG. On‐Ramp Idylwild Rd. DIAG. Off‐Ramp 1.55 46 D 43.4 1976 105‐05135 SR 17 SB Idylwild Rd. DIAG. Off‐Ramp Summit Rd. L. Off‐Ramp 2.34 43 D 45.5 1950

PM Freeway Speed, LOS, Estimated Density, Estimated Flow, and Duration of Congestion by Segment 2017 AM Results (INRIX Data)
Speed (mi/hr) LOS Density
(pc/mi/ln) Flow (pc/hr/ln) Congestion
(hr) TMC Facility Dir From To Miles Mixed HOV Mixed HOV Mixed HOV Mixed HOV
105N05135 SR 17 SB Summit Rd. L. Off‐Ramp Summit Rd. L. On‐Ramp 0.15 45 D 43.9 1971
105P04814 I 280 NB US‐101 DIAG. Off‐Ramp US 101 DIAG. On‐Ramp 0.87 63 C 24.4 1535
105P04815 I 280 NB US 101 DIAG. On‐Ramp McLaughlin Ave L. On‐Ramp 0.27 57 D 33.1 1895
105+04816 I 280 NB McLaughlin Ave L. On‐Ramp 11th St DIAG. Off‐Ramp 0.45 50 D 39.4 1991
105P04817 I 280 NB 11th St DIAG. Off‐Ramp 11th St DIAG. On‐Ramp 0.58 28 F 58.4 1652 0.25
105+04818 I 280 NB 11th St DIAG. On‐Ramp 4th St DIAG. On‐Ramp 0.19 27 F 59.5 1619 0.50
105+04819 I 280 NB 4th St DIAG. On‐Ramp 4th St DIAG. On‐Ramp 0.14 27 F 59.6 1614 0.25
105P04819 I 280 NB 4th St DIAG. On‐Ramp 4th St DIAG. On‐Ramp 0.01 27 F 59.3 1625 0.50
105+04820 I 280 NB 4th St DIAG. On‐Ramp SR‐87 DIAG. Off‐Ramp 0.17 29 F 58.0 1663 0.25
105P04820 I 280 NB SR‐87 DIAG. Off‐Ramp SR‐87 DIAG. On‐Ramp 0.76 27 F 59.3 1625 0.50
105+04822 I 280 NB SR‐280 DIAG. On‐Ramp Meridian Ave DIAG. Off‐Ramp 0.27 34 E 53.2 1792
105P04822 I 280 NB Southwest Expy DIAG. Off‐Ramp Meridian Ave L. On‐Ramp 0.47 52 D 37.7 1981
105P04823 I 280 NB SR‐280 DIAG. Off‐Ramp SR‐280 DIAG. On‐Ramp 0.50 62 63 D C 26.5 23.3 1641
1478
105+04824 I 280 NB SR‐280 DIAG. On‐Ramp Menker Ave DIAG. On‐Ramp 0.39 63 66 C B 24.9 16.1 1562
1056
105P04824 I 280 NB Menker Ave DIAG. On‐Ramp Leland Ave DIAG. On‐Ramp 0.26 59 69 D A 30.4 <8.9 1810 613
105P04825 I 280 NB SR‐17 DIAG. Off‐Ramp SR‐17 DIAG. On‐Ramp 0.76 26 59 F D 60.5 30.8 1587
1824 0.25
105+04826 I 280 NB SR‐17 DIAG. On‐Ramp Winchester Blvd DIAG. Off‐Ramp 0.20 33 59 E D 54.2 30.8 1766
1824
105P04826 I 280 NB Winchester Blvd DIAG. Off‐Ramp Winchester Blvd DIAG. On‐Ramp 0.33 37 62 E D 50.2 26.8 1863
1657
105+04827 I 280 NB Winchester Blvd DIAG. On‐Ramp Saratoga Ave DIAG. Off‐Ramp 0.68 38 60 E D 49.1 29.1 1887
1759
105P04827 I 280 NB Saratoga Ave DIAG. Off‐Ramp Saratoga Ave DIAG. On‐Ramp 0.56 60 67 D A 29.0 <8.9 1753 599
105+04828 I 280 NB Saratoga Ave DIAG. On‐Ramp Lawrence Expy DIAG. Off‐Ramp 0.74 61 69 D A 27.8 <8.9 1700 614
105P04828 I 280 NB Lawrence Expy DIAG. Off‐Ramp Lawrence Expy 0.28 57 69 D A 32.9 <8.9 1891 612
105+04829 I 280 NB Lawrence Expy Stevens Creek Blvd DIAG. Off‐Ramp 0.24 66 67 B A 14.5 <8.9 960 598
105P04829 I 280 NB Stevens Creek Blvd DIAG. Off‐Ramp Stevens Creek Blvd DIAG. On‐Ramp 0.30 67 71 B A 11.2 <8.9 748 630

PM Freeway Speed, LOS, Estimated Density, Estimated Flow, and Duration of Congestion by Segment 2017 AM Results (INRIX Data)
Speed (mi/hr) LOS Density
(pc/mi/ln) Flow (pc/hr/ln) Congestion
(hr) TMC Facility Dir From To Miles Mixed HOV Mixed HOV Mixed HOV Mixed HOV
105+04830 I 280 NB Stevens Creek Blvd DIAG. On‐Ramp Wolfe Rd DIAG. Off‐Ramp 0.45 65 68 C A 19.6 <8.9 1270 608
105P04830 I 280 NB Wolfe Rd DIAG. Off‐Ramp Wolfe Rd DIAG. On‐Ramp 0.45 67 70 A A <8.9 <8.9 597 626
105+04831 I 280 NB Wolfe Rd DIAG. On‐Ramp De Anza Blvd DIAG. Off‐Ramp 0.61 61 69 D A 28.1 <8.9 1716 615
105P04831 I 280 NB De Anza Blvd DIAG. Off‐Ramp De Anza Blvd DIAG. On‐Ramp 0.46 61 70 D A 28.5 <8.9 1734 624
105+04832 I 280 NB De Anza Blvd DIAG. On‐Ramp SR‐85 DIAG. Off‐Ramp 0.70 66 70 B A 16.3 <8.9 1072 623
105P04832 I 280 NB SR‐85 DIAG. Off‐Ramp SR‐85 DIAG. On‐Ramp 0.74 67 69 A A <8.9 <8.9 600 616
105P04833 I 280 NB Foothill Blvd DIAG. Off‐Ramp Foothill Blvd L. On‐Ramp 0.32 65 68 C A 18.1 <8.9 1182 605
105+04834 I 280 NB Foothill Blvd L. On‐Ramp Magdalena Ave DIAG. Off‐Ramp 2.37 69 68 A A <8.9 <8.9 612 608
105P04834 I 280 NB Magdalena Ave DIAG. Off‐Ramp Magdalena Ave DIAG. On‐Ramp 0.47 67 59 A D <8.9 30.7 599
1821
105+04835 I 280 NB Magdalena Ave DIAG. On‐Ramp El monte Rd DIAG. Off‐Ramp 0.38 66 B 15.8 1037
105P04835 I 280 NB El monte Rd DIAG. Off‐Ramp El monte Rd DIAG. On‐Ramp 0.60 68 A <8.9 603
105+04836 I 280 NB El monte Rd DIAG. On‐Ramp Page Mill Rd DIAG. Off‐Ramp 2.72 68 A <8.9 609
105P04836 I 280 NB Page Mill Rd DIAG. Off‐Ramp Page Mill Rd DIAG. On‐Ramp 0.64 40 E 48.0 1909
105+04837 I 280 NB Page Mill Rd DIAG. On‐Ramp Alpine Rd DIAG. Off‐Ramp 1.70 23 F 64.3 1473 1.50
105‐04836 I 280 SB Alpine Rd DIAG. On‐Ramp Page Mill Rd DIAG. Off‐Ramp 1.58 18 F 70.1 1287 1.50
105N04836 I 280 SB Page Mill Rd DIAG. Off‐Ramp Page Mill Rd DIAG. On‐Ramp 0.65 18 F 70.8 1263 2.50
105‐04835 I 280 SB Page Mill Rd DIAG. On‐Ramp El Monte Rd DIAG. Off‐Ramp 2.71 16 F 73.5 1174 3.50
105N04835 I 280 SB El Monte Rd DIAG. Off‐Ramp El Monte Rd DIAG. On‐Ramp 0.60 15 F 75.0 1127 4.00
105‐04834 I 280 SB El Monte Rd DIAG. On‐Ramp Magdalena Ave DIAG. Off‐Ramp 0.36 19 F 69.9 1294 4.50
105N04834 I 280 SB Magdalena Ave DIAG. Off‐Ramp Magdalena Ave L. On‐Ramp 0.38 29 26 F F 58.0 61.3 1690
1565 0.75
105‐04833 I 280 SB Magdalena Ave L. On‐Ramp Foothill Blvd DIAG. Off‐Ramp 2.34 31 43 E D 56.1 45.6 1716
1950
105N04833 I 280 SB Foothill Blvd DIAG. Off‐Ramp Foothill Blvd DIAG. On‐Ramp 0.46 22 26 F F 66.0 60.9 1419
1577 3.00
105‐04832 I 280 SB Foothill Blvd DIAG. On‐Ramp SR‐85 DIAG. Off‐Ramp 0.26 18 11 F F 70.2 81.1 1283 920 3.25
105N04832 I 280 SB SR‐85 DIAG. Off‐Ramp SR‐85 DIAG. On‐Ramp 0.75 10 10 F F 83.8 82.9 827 858 3.75
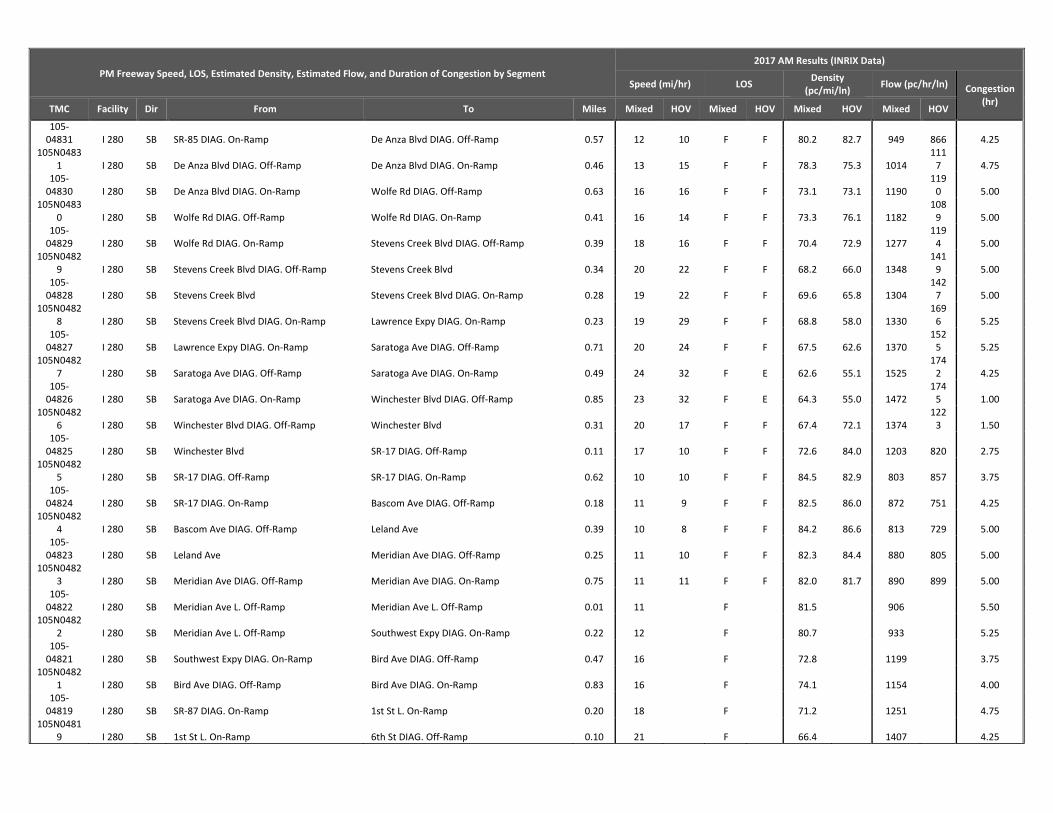
PM Freeway Speed, LOS, Estimated Density, Estimated Flow, and Duration of Congestion by Segment 2017 AM Results (INRIX Data)
Speed (mi/hr) LOS Density
(pc/mi/ln) Flow (pc/hr/ln) Congestion
(hr) TMC Facility Dir From To Miles Mixed HOV Mixed HOV Mixed HOV Mixed HOV
105‐04831 I 280 SB SR‐85 DIAG. On‐Ramp De Anza Blvd DIAG. Off‐Ramp 0.57 12 10 F F 80.2 82.7 949 866 4.25
105N04831 I 280 SB De Anza Blvd DIAG. Off‐Ramp De Anza Blvd DIAG. On‐Ramp 0.46 13 15 F F 78.3 75.3 1014
1117 4.75
105‐04830 I 280 SB De Anza Blvd DIAG. On‐Ramp Wolfe Rd DIAG. Off‐Ramp 0.63 16 16 F F 73.1 73.1 1190
1190 5.00
105N04830 I 280 SB Wolfe Rd DIAG. Off‐Ramp Wolfe Rd DIAG. On‐Ramp 0.41 16 14 F F 73.3 76.1 1182
1089 5.00
105‐04829 I 280 SB Wolfe Rd DIAG. On‐Ramp Stevens Creek Blvd DIAG. Off‐Ramp 0.39 18 16 F F 70.4 72.9 1277
1194 5.00
105N04829 I 280 SB Stevens Creek Blvd DIAG. Off‐Ramp Stevens Creek Blvd 0.34 20 22 F F 68.2 66.0 1348
1419 5.00
105‐04828 I 280 SB Stevens Creek Blvd Stevens Creek Blvd DIAG. On‐Ramp 0.28 19 22 F F 69.6 65.8 1304
1427 5.00
105N04828 I 280 SB Stevens Creek Blvd DIAG. On‐Ramp Lawrence Expy DIAG. On‐Ramp 0.23 19 29 F F 68.8 58.0 1330
1696 5.25
105‐04827 I 280 SB Lawrence Expy DIAG. On‐Ramp Saratoga Ave DIAG. Off‐Ramp 0.71 20 24 F F 67.5 62.6 1370
1525 5.25
105N04827 I 280 SB Saratoga Ave DIAG. Off‐Ramp Saratoga Ave DIAG. On‐Ramp 0.49 24 32 F E 62.6 55.1 1525
1742 4.25
105‐04826 I 280 SB Saratoga Ave DIAG. On‐Ramp Winchester Blvd DIAG. Off‐Ramp 0.85 23 32 F E 64.3 55.0 1472
1745 1.00
105N04826 I 280 SB Winchester Blvd DIAG. Off‐Ramp Winchester Blvd 0.31 20 17 F F 67.4 72.1 1374
1223 1.50
105‐04825 I 280 SB Winchester Blvd SR‐17 DIAG. Off‐Ramp 0.11 17 10 F F 72.6 84.0 1203 820 2.75
105N04825 I 280 SB SR‐17 DIAG. Off‐Ramp SR‐17 DIAG. On‐Ramp 0.62 10 10 F F 84.5 82.9 803 857 3.75
105‐04824 I 280 SB SR‐17 DIAG. On‐Ramp Bascom Ave DIAG. Off‐Ramp 0.18 11 9 F F 82.5 86.0 872 751 4.25
105N04824 I 280 SB Bascom Ave DIAG. Off‐Ramp Leland Ave 0.39 10 8 F F 84.2 86.6 813 729 5.00
105‐04823 I 280 SB Leland Ave Meridian Ave DIAG. Off‐Ramp 0.25 11 10 F F 82.3 84.4 880 805 5.00
105N04823 I 280 SB Meridian Ave DIAG. Off‐Ramp Meridian Ave DIAG. On‐Ramp 0.75 11 11 F F 82.0 81.7 890 899 5.00
105‐04822 I 280 SB Meridian Ave L. Off‐Ramp Meridian Ave L. Off‐Ramp 0.01 11 F 81.5 906 5.50
105N04822 I 280 SB Meridian Ave L. Off‐Ramp Southwest Expy DIAG. On‐Ramp 0.22 12 F 80.7 933 5.25
105‐04821 I 280 SB Southwest Expy DIAG. On‐Ramp Bird Ave DIAG. Off‐Ramp 0.47 16 F 72.8 1199 3.75
105N04821 I 280 SB Bird Ave DIAG. Off‐Ramp Bird Ave DIAG. On‐Ramp 0.83 16 F 74.1 1154 4.00
105‐04819 I 280 SB SR‐87 DIAG. On‐Ramp 1st St L. On‐Ramp 0.20 18 F 71.2 1251 4.75
105N04819 I 280 SB 1st St L. On‐Ramp 6th St DIAG. Off‐Ramp 0.10 21 F 66.4 1407 4.25
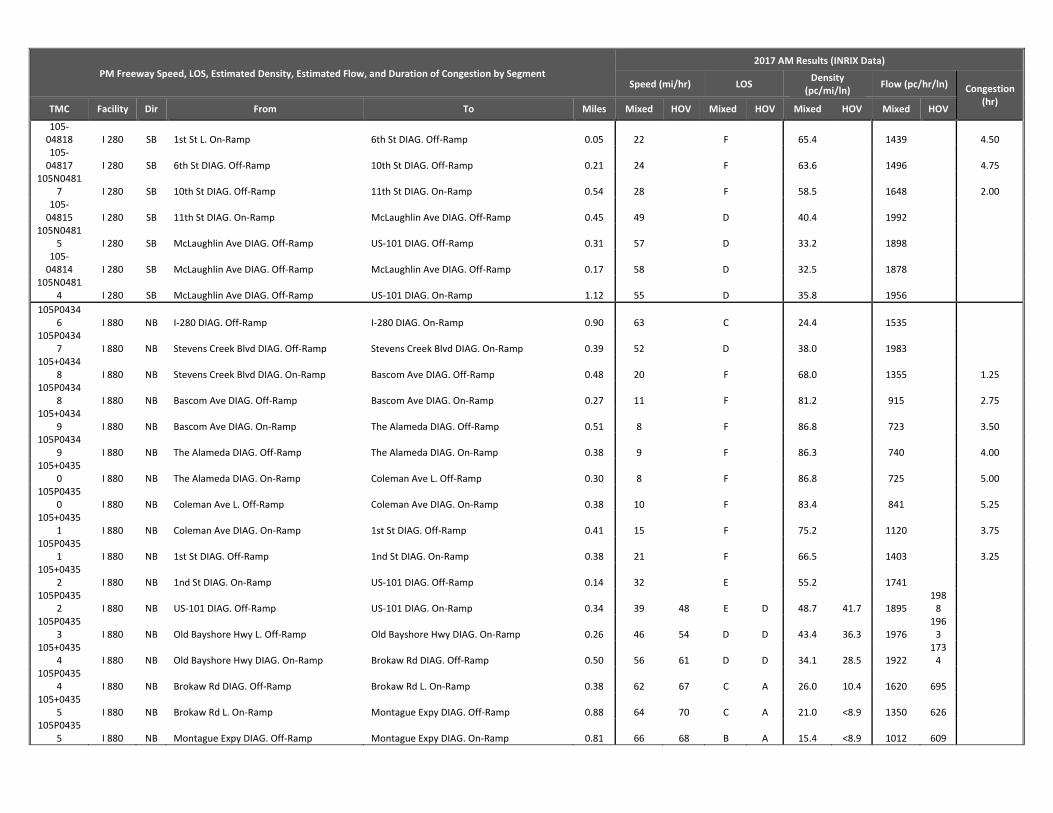
PM Freeway Speed, LOS, Estimated Density, Estimated Flow, and Duration of Congestion by Segment 2017 AM Results (INRIX Data)
Speed (mi/hr) LOS Density
(pc/mi/ln) Flow (pc/hr/ln) Congestion
(hr) TMC Facility Dir From To Miles Mixed HOV Mixed HOV Mixed HOV Mixed HOV
105‐04818 I 280 SB 1st St L. On‐Ramp 6th St DIAG. Off‐Ramp 0.05 22 F 65.4 1439 4.50 105‐04817 I 280 SB 6th St DIAG. Off‐Ramp 10th St DIAG. Off‐Ramp 0.21 24 F 63.6 1496 4.75
105N04817 I 280 SB 10th St DIAG. Off‐Ramp 11th St DIAG. On‐Ramp 0.54 28 F 58.5 1648 2.00
105‐04815 I 280 SB 11th St DIAG. On‐Ramp McLaughlin Ave DIAG. Off‐Ramp 0.45 49 D 40.4 1992
105N04815 I 280 SB McLaughlin Ave DIAG. Off‐Ramp US‐101 DIAG. Off‐Ramp 0.31 57 D 33.2 1898
105‐04814 I 280 SB McLaughlin Ave DIAG. Off‐Ramp McLaughlin Ave DIAG. Off‐Ramp 0.17 58 D 32.5 1878
105N04814 I 280 SB McLaughlin Ave DIAG. Off‐Ramp US‐101 DIAG. On‐Ramp 1.12 55 D 35.8 1956
105P04346 I 880 NB I‐280 DIAG. Off‐Ramp I‐280 DIAG. On‐Ramp 0.90 63 C 24.4 1535
105P04347 I 880 NB Stevens Creek Blvd DIAG. Off‐Ramp Stevens Creek Blvd DIAG. On‐Ramp 0.39 52 D 38.0 1983
105+04348 I 880 NB Stevens Creek Blvd DIAG. On‐Ramp Bascom Ave DIAG. Off‐Ramp 0.48 20 F 68.0 1355 1.25
105P04348 I 880 NB Bascom Ave DIAG. Off‐Ramp Bascom Ave DIAG. On‐Ramp 0.27 11 F 81.2 915 2.75
105+04349 I 880 NB Bascom Ave DIAG. On‐Ramp The Alameda DIAG. Off‐Ramp 0.51 8 F 86.8 723 3.50
105P04349 I 880 NB The Alameda DIAG. Off‐Ramp The Alameda DIAG. On‐Ramp 0.38 9 F 86.3 740 4.00
105+04350 I 880 NB The Alameda DIAG. On‐Ramp Coleman Ave L. Off‐Ramp 0.30 8 F 86.8 725 5.00
105P04350 I 880 NB Coleman Ave L. Off‐Ramp Coleman Ave DIAG. On‐Ramp 0.38 10 F 83.4 841 5.25
105+04351 I 880 NB Coleman Ave DIAG. On‐Ramp 1st St DIAG. Off‐Ramp 0.41 15 F 75.2 1120 3.75
105P04351 I 880 NB 1st St DIAG. Off‐Ramp 1nd St DIAG. On‐Ramp 0.38 21 F 66.5 1403 3.25
105+04352 I 880 NB 1nd St DIAG. On‐Ramp US‐101 DIAG. Off‐Ramp 0.14 32 E 55.2 1741
105P04352 I 880 NB US‐101 DIAG. Off‐Ramp US‐101 DIAG. On‐Ramp 0.34 39 48 E D 48.7 41.7 1895
1988
105P04353 I 880 NB Old Bayshore Hwy L. Off‐Ramp Old Bayshore Hwy DIAG. On‐Ramp 0.26 46 54 D D 43.4 36.3 1976
1963
105+04354 I 880 NB Old Bayshore Hwy DIAG. On‐Ramp Brokaw Rd DIAG. Off‐Ramp 0.50 56 61 D D 34.1 28.5 1922
1734
105P04354 I 880 NB Brokaw Rd DIAG. Off‐Ramp Brokaw Rd L. On‐Ramp 0.38 62 67 C A 26.0 10.4 1620 695
105+04355 I 880 NB Brokaw Rd L. On‐Ramp Montague Expy DIAG. Off‐Ramp 0.88 64 70 C A 21.0 <8.9 1350 626
105P04355 I 880 NB Montague Expy DIAG. Off‐Ramp Montague Expy DIAG. On‐Ramp 0.81 66 68 B A 15.4 <8.9 1012 609

PM Freeway Speed, LOS, Estimated Density, Estimated Flow, and Duration of Congestion by Segment 2017 AM Results (INRIX Data)
Speed (mi/hr) LOS Density
(pc/mi/ln) Flow (pc/hr/ln) Congestion
(hr) TMC Facility Dir From To Miles Mixed HOV Mixed HOV Mixed HOV Mixed HOV
105+04356 I 880 NB Montague Expy DIAG. On‐Ramp Great Mall Pkwy DIAG. Off‐Ramp 0.24 60 71 D A 30.2 <8.9 1801 635
105P04356 I 880 NB Great Mall Pkwy DIAG. Off‐Ramp Great Mall Pkwy L. On‐Ramp 0.36 59 69 D A 31.0 <8.9 1831 612
105+04357 I 880 NB Great Mall Pkwy L. On‐Ramp SR‐237 DIAG. Off‐Ramp 0.28 56 66 D B 34.7 16.1 1934
1060
105P04357 I 880 NB SR‐237 DIAG. Off‐Ramp SR‐237 DIAG. On‐Ramp 0.93 36 52 E D 50.9 38.4 1847
1986
105+04358 I 880 NB SR‐237 DIAG. On‐Ramp Dixon Landing DIAG. Off‐Ramp 1.03 21 19 F F 66.1 69.3 1416
1312 2.00
105P04358 I 880 NB Dixon Landing DIAG. Off‐Ramp Dixon Landing DIAG. On‐Ramp 0.83 17 13 F F 71.4 78.6 1245
1004 3.25
105N04358 I 880 SB Dixon Landing DIAG. Off‐Ramp Dixon Landing DIAG. On‐Ramp 0.64 63 32 C E 23.9 54.5 1508
1759
105‐04357 I 880 SB Dixon Landing DIAG. On‐Ramp SR‐237 DIAG. Off‐Ramp 1.13 64 58 C D 21.7 32.0 1389
1864
105N04357 I 880 SB SR‐237 DIAG. Off‐Ramp Great Mall Pkwy DIAG. On‐Ramp 1.53 35 25 E F 51.8 61.7 1826
1553
105‐04355 I 880 SB Great Mall Pkwy DIAG. On‐Ramp Montague Expy DIAG. Off‐Ramp 0.42 18 32 F E 70.3 54.6 1282
1755 2.25
105N04355 I 880 SB Montague Expy DIAG. Off‐Ramp Montague Expy DIAG. On‐Ramp 0.74 16 23 F F 72.9 64.6 1196
1462 3.00
105‐04354 I 880 SB Montague Expy DIAG. On‐Ramp Brokaw Rd DIAG. Off‐Ramp 0.62 18 27 F F 70.7 60.2 1269
1599 3.00
105N04354 I 880 SB Brokaw Rd DIAG. Off‐Ramp Brokaw Rd DIAG. On‐Ramp 0.60 17 32 F E 72.2 55.2 1220
1740 4.00
105‐04353 I 880 SB Brokaw Rd DIAG. On‐Ramp Old Bayshore Hwy DIAG. Off‐Ramp 0.46 19 23 F F 68.8 64.3 1329
1473 4.50
105N04353 I 880 SB Old Bayshore Hwy DIAG. Off‐Ramp Old Bayshore Hwy L. On‐Ramp 0.32 17 18 F F 71.4 71.3 1245
1248 3.00
105‐04352 I 880 SB Old Bayshore Hwy L. On‐Ramp US‐101 L. On‐Ramp 0.18 15 16 F F 74.7 73.1 1135
1189 3.25
105N04352 I 880 SB US‐101 L. On‐Ramp US‐101 DIAG. On‐Ramp 0.19 16 19 F F 74.0 68.6 1158
1335 2.50
105‐04351 I 880 SB US‐101 DIAG. On‐Ramp 1st St DIAG. Off‐Ramp 0.12 14 38 F E 76.1 49.1 1090
1887 2.50
105N04351 I 880 SB 1st St DIAG. Off‐Ramp 1st St DIAG. On‐Ramp 0.40 11 F 81.0 922 3.25
105‐04350 I 880 SB 1st St DIAG. On‐Ramp Coleman Ave DIAG. Off‐Ramp 0.42 21 F 66.9 1391 1.75
105N04350 I 880 SB Coleman Ave DIAG. Off‐Ramp Coleman Ave DIAG. On‐Ramp 0.53 22 F 65.5 1436 1.75
105‐04349 I 880 SB Coleman Ave DIAG. On‐Ramp The Alameda DIAG. Off‐Ramp 0.17 26 F 61.0 1573 0.75
105N04349 I 880 SB The Alameda DIAG. Off‐Ramp The Alameda DIAG. On‐Ramp 0.37 24 F 62.8 1518 1.75
105‐04348 I 880 SB The Alameda DIAG. On‐Ramp Bascom Ave DIAG. Off‐Ramp 0.45 26 F 60.6 1586 1.75

PM Freeway Speed, LOS, Estimated Density, Estimated Flow, and Duration of Congestion by Segment 2017 AM Results (INRIX Data)
Speed (mi/hr) LOS Density
(pc/mi/ln) Flow (pc/hr/ln) Congestion
(hr) TMC Facility Dir From To Miles Mixed HOV Mixed HOV Mixed HOV Mixed HOV
105N04348 I 880 SB Bascom Ave DIAG. Off‐Ramp Bascom Ave DIAG. On‐Ramp 0.27 32 E 55.1 1743
105‐04347 I 880 SB Bascom Ave DIAG. On‐Ramp Stevens Creek Blvd DIAG. Off‐Ramp 0.49 32 E 54.8 1752
105N04347 I 880 SB Stevens Creek Blvd DIAG. Off‐Ramp I‐280 DIAG. Off‐Ramp 0.42 41 E 47.1 1925
105‐04346 I 880 SB I‐280 L. Off‐Ramp I‐280 DIAG. Off‐Ramp 0.06 51 D 39.3 1991
105N04346 I 880 SB Stevens Creek Blvd DIAG. On‐Ramp I‐280 DIAG. On‐Ramp 0.69 60 D 30.3 1806
105P04876 I 680 NB US‐101 DIAG. Off‐Ramp US‐101 DIAG. On‐Ramp 0.93 58 D 31.8 1857
105P04877 I 680 NB US‐101 DIAG. Off‐Ramp US‐101 DIAG. On‐Ramp 0.59 53 D 37.6 1979
105+04878 I 680 NB US‐101 DIAG. On‐Ramp Capitol Expy DIAG. Off‐Ramp/ Jackson Ave 0.24 47 D 42.6 1983
105P04878 I 680 NB Capitol Expy DIAG. Off‐Ramp/ Jackson Ave Capitol Expy DIAG. Off‐Ramp 0.33 56 D 34.8 1936
105P04879 I 680 NB Capitol Expy DIAG. Off‐Ramp Capitol Expy DIAG. On‐Ramp 0.58 62 D 26.3 1631
105P04880 I 680 NB Alum Rock Ave DIAG. Off‐Ramp Alum Rock Ave DIAG. On‐Ramp 0.61 62 D 26.5 1640
105+04881 I 680 NB Alum Rock Ave DIAG. On‐Ramp McKee Rd DIAG. Off‐Ramp 0.14 62 C 25.9 1614
105P04881 I 680 NB McKee Rd DIAG. Off‐Ramp McKee Rd DIAG. On‐Ramp 0.59 64 C 21.2 1364
105+04882 I 680 NB McKee Rd DIAG. On‐Ramp Berryessa Rd DIAG. Off‐Ramp 0.80 63 C 23.6 1493
105P04882 I 680 NB Berryessa Rd DIAG. Off‐Ramp Berryessa Rd DIAG. On‐Ramp 0.68 65 B 17.5 1142
105+04883 I 680 NB Berryessa Rd DIAG. On‐Ramp Hostetter Rd DIAG. Off‐Ramp 0.36 66 B 15.9 1046
105P04883 I 680 NB Hostetter Rd DIAG. Off‐Ramp Hostetter Rd DIAG. On‐Ramp 0.33 65 B 17.7 1158
105+04884 I 680 NB Hostetter Rd DIAG. On‐Ramp Capital Ave L. Off‐Ramp 0.08 64 C 22.2 1420
105P04884 I 680 NB Capital Ave L. Off‐Ramp Capital Ave DIAG. On‐Ramp 0.51 65 B 17.3 1132
105+04885 I 680 NB Capital Ave DIAG. On‐Ramp Montague Expy DIAG. Off‐Ramp 0.38 64 C 21.6 1387
105P04885 I 680 NB Montague Expy DIAG. Off‐Ramp Montague Expy DIAG. On‐Ramp 0.70 66 B 14.9 983
105+04886 I 680 NB Montague Expy DIAG. On‐Ramp Calaveras Blvd DIAG. Off‐Ramp 0.75 66 B 15.1 995
105P04886 I 680 NB Calaveras Blvd DIAG. Off‐Ramp Calaveras Blvd DIAG. On‐Ramp 0.84 65 B 17.2 1128
105+04887 I 680 NB Calaveras Blvd DIAG. On‐Ramp Jacklin Rd DIAG. Off‐Ramp 0.13 64 C 21.7 1389

PM Freeway Speed, LOS, Estimated Density, Estimated Flow, and Duration of Congestion by Segment 2017 AM Results (INRIX Data)
Speed (mi/hr) LOS Density
(pc/mi/ln) Flow (pc/hr/ln) Congestion
(hr) TMC Facility Dir From To Miles Mixed HOV Mixed HOV Mixed HOV Mixed HOV
105P04887 I 680 NB Jacklin Rd DIAG. Off‐Ramp Jacklin Rd DIAG. On‐Ramp 0.63 64 C 21.4 1374
105+04888 I 680 NB Jacklin Rd DIAG. On‐Ramp Scott Creek Rd DIAG. Off‐Ramp 0.95 62 D 26.5 1644
105‐04887 I 680 SB Scott Creek Rd DIAG. On‐Ramp Jacklin Rd DIAG. Off‐Ramp 1.02 50 73 D A 39.6 <8.9 1991 651
105N04887 I 680 SB Jacklin Rd DIAG. Off‐Ramp Jacklin Rd DIAG. On‐Ramp 0.61 24 66 F B 63.1 16.4 1509
1075 0.75
105N04886 I 680 SB Calaveras Blvd DIAG. Off Ramp Calaveras Blvd DIAG. On Ramp 0.96 12 34 F E 79.3 52.5 981
1809 2.75
105‐04885 I 680 SB Calaveras Blvd DIAG. On Ramp Montague Expy DIAG. Off‐Ramp 0.64 11 F 80.9 925 3.00
105N04885 I 680 SB Montague Expy DIAG. Off‐Ramp Montague Expy DIAG. On‐Ramp 0.70 11 F 81.4 909 3.25
105‐04884 I 680 SB Montague Expy DIAG. On‐Ramp Capitol Expy DIAG. Off‐Ramp 0.43 13 F 77.9 1028 3.25
105N04884 I 680 SB Capitol Expy DIAG. Off‐Ramp Capitol Expy DIAG. On‐Ramp 0.53 13 F 77.5 1042 4.00
105‐04883 I 680 SB Capitol Expy DIAG. On‐Ramp Hostetter Rd L. Off‐Ramp 0.10 15 F 75.0 1125 4.25
105N04883 I 680 SB Hostetter Rd L. Off‐Ramp Hostetter Rd L. On‐Ramp 0.42 17 F 71.7 1234 4.00
105‐04882 I 680 SB Hostetter Rd L. On‐Ramp Berryessa Rd DIAG. Off‐Ramp 0.19 21 F 67.0 1387 2.75
105N04882 I 680 SB Berryessa Rd DIAG. Off‐Ramp Berryessa Rd DIAG. On‐Ramp 0.63 24 F 63.0 1512 2.25
105‐04881 I 680 SB Berryessa Rd DIAG. On‐Ramp McKee Rd DIAG. Off‐Ramp 0.82 29 F 58.0 1699 0.25
105N04881 I 680 SB McKee Rd DIAG. Off‐Ramp McKee Rd DIAG. On‐Ramp 0.65 28 F 58.4 1652 0.75
105‐04880 I 680 SB McKee Rd DIAG. On‐Ramp Alum Rock Ave DIAG. Off‐Ramp 0.11 31 E 55.4 1735
105N04880 I 680 SB Alum Rock Ave DIAG. Off‐Ramp Capitol Expy L. On‐Ramp 0.61 42 D 45.8 1946
105N04879 I 680 SB Alum Rock Ave L. Off‐Ramp Alum Rock Ave L. On‐Ramp 0.61 56 D 34.3 1927
105‐04878 I 680 SB Capitol Expy L. On‐Ramp Capitol Expy L. On‐Ramp 0.02 56 D 34.0 1920
105N04878 I 680 SB Capitol Expy L. On‐Ramp Jackson Ave DIAG. On‐Ramp 0.32 58 D 31.8 1857
105‐04877 I 680 SB Jackson Ave DIAG. On‐Ramp US‐101 DIAG. Off‐Ramp 0.11 58 D 32.2 1870
105N04877 I 680 SB US‐101 DIAG. Off‐Ramp US‐101 DIAG. Off‐Ramp/Bayshore Fwy 0.68 57 D 33.8 1914
105N04876 I 680 SB US‐101 DIAG. Off‐Ramp US‐101 DIAG. On‐Ramp 0.87 63 C 24.4 1535
105+09871 US 101 NB US‐101 DIAG. On‐Ramp SR‐25 DIAG. Off‐Ramp 3.61 62 D 27.1 1671

PM Freeway Speed, LOS, Estimated Density, Estimated Flow, and Duration of Congestion by Segment 2017 AM Results (INRIX Data)
Speed (mi/hr) LOS Density
(pc/mi/ln) Flow (pc/hr/ln) Congestion
(hr) TMC Facility Dir From To Miles Mixed HOV Mixed HOV Mixed HOV Mixed HOV
105P09871 US 101 NB SR‐25 DIAG. Off‐Ramp SR‐25 DIAG. On‐Ramp 0.12 61 D 27.9 1708
105+09872 US 101 NB SR‐25 DIAG. On‐Ramp Castro Valley Rd 0.43 57 D 33.0 1895
105+04113 US 101 NB Castro Valley Rd Bolsa Rd DIAG. Off‐Ramp 0.98 60 D 29.9 1788
105P04113 US 101 NB Bolsa Rd DIAG. Off‐Ramp Bolsa Rd DIAG. On‐Ramp 0.30 61 D 28.1 1716
105+04114 US 101 NB Bolsa Rd DIAG. On‐Ramp SR‐152 DIAG. Off‐Road 0.89 62 D 26.8 1658
105P04114 US 101 NB SR‐152 DIAG. Off‐Road SR‐152 DIAG. On‐Road 0.47 64 C 22.4 1428
105+04115 US 101 NB SR‐152 DIAG. On‐Road Leavesley Rd DIAG. Off‐Ramp 0.87 61 D 27.9 1707
105P04115 US 101 NB Leavesley Rd DIAG. Off‐Ramp Leavesley Rd DIAG. On‐Ramp 0.68 63 C 24.8 1558
105+04116 US 101 NB Leavesley Rd DIAG. On‐Ramp Masten Ave DIAG. Off‐Ramp 2.07 63 C 24.6 1546
105P04116 US 101 NB Masten Ave DIAG. Off‐Ramp Masten Ave DIAG. On‐Ramp 0.58 61 D 28.6 1739
105+04117 US 101 NB Masten Ave DIAG. On‐Ramp San Martin Ave DIAG. Off‐Ramp 1.71 62 D 26.3 1630
105P04117 US 101 NB San Martin Ave DIAG. Off‐Ramp San Martin Ave DIAG. On‐Ramp 0.44 63 C 24.8 1556
105+04118 US 101 NB San Martin Ave DIAG. On‐Ramp Tennant Ave DIAG. Off‐Ramp 2.10 64 C 20.6 1329
105P04118 US 101 NB Tennant Ave DIAG. Off‐Ramp Tennant Ave DIAG. On‐Ramp 0.59 64 C 21.8 1395
105+04119 US 101 NB Tennant Ave DIAG. On‐Ramp Dunne Ave DIAG. Off‐Ramp 0.31 64 C 22.2 1416
105P04119 US 101 NB Dunne Ave DIAG. Off‐Ramp Dunne Ave DIAG. On‐Ramp 0.58 64 C 20.8 1338
105+04120 US 101 NB Dunne Ave DIAG. On‐Ramp Cochrane Rd DIAG. Off‐Ramp 1.24 64 C 22.8 1449
105P04120 US 101 NB Cochrane Rd DIAG. Off‐Ramp Cochrane Rd DIAG. On‐Ramp 0.60 66 25 B F 15.6 62.4 1029
1532
105+04121 US 101 NB Cochrane Rd DIAG. On‐Ramp Coyote Creek Golf Dr DIAG. Off‐Ramp 2.89 67 74 B A 11.8 <8.9 784 657
105P04121 US 101 NB Coyote Creek Golf Dr DIAG. Off‐Ramp Coyote Creek Golf Dr DIAG. On‐Ramp 0.61 66 16 B F 16.9 73.7 1105
1169
105+09288 US 101 NB Coyote Creek Golf Dr DIAG. Off‐Ramp Bailey Ave DIAG. Off‐Ramp 1.42 66 71 B A 13.4 <8.9 888 634
105P09288 US 101 NB Bailey Ave DIAG. Off‐Ramp Bailey Ave DIAG. On‐Ramp 0.54 67 72 A A 9.2 <8.9 618 637
105+04122 US 101 NB Bailey Ave DIAG. On‐Ramp SR‐85 DIAG. Off‐Ramp 2.77 67 74 A A <8.9 <8.9 597 656
105P04122 US 101 NB SR‐85 DIAG. Off‐Ramp Silicon Valley Blvd DIAG. Off‐Ramp 0.51 64 78 C A 22.4 <8.9 1428 697

PM Freeway Speed, LOS, Estimated Density, Estimated Flow, and Duration of Congestion by Segment 2017 AM Results (INRIX Data)
Speed (mi/hr) LOS Density
(pc/mi/ln) Flow (pc/hr/ln) Congestion
(hr) TMC Facility Dir From To Miles Mixed HOV Mixed HOV Mixed HOV Mixed HOV
105P04123 US 101 NB Silicon Valley Blvd DIAG. Off‐Ramp Silicon Valley Blvd DIAG. On‐Ramp 0.57 64 77 C A 22.2 <8.9 1420 682
105+04124 US 101 NB Silicon Valley Blvd DIAG. On‐Ramp Silver Creek Valley Rd DIAG. Off‐Ramp 0.79 64 75 C A 22.8 <8.9 1452 664
105P04124 US 101 NB Silver Creek Valley Rd DIAG. Off‐Ramp Silver Creek Valley Rd DIAG. On‐Ramp 0.77 64 71 C A 23.0 <8.9 1465 636
105+04125 US 101 NB Silver Creek Valley Rd DIAG. On‐Ramp Hellyer Ave DIAG. Off‐Ramp 1.34 63 72 C A 24.2 <8.9 1525 637
105P04125 US 101 NB Hellyer Ave DIAG. Off‐Ramp Hellyer Ave L. On‐Ramp 0.27 63 71 C A 23.3 <8.9 1479 628
105+04126 US 101 NB Hellyer Ave L. On‐Ramp Yerba Buena Rd L. Off‐Ramp 0.70 63 70 C A 24.9 <8.9 1562 622
105P04126 US 101 NB Yerba Buena Rd L. Off‐Ramp Capitol Expy DIAG. Off‐Ramp 0.18 63 71 C A 25.0 <8.9 1568 634
105P04127 US 101 NB Capitol Expy DIAG. Off‐Ramp Capitol Expy DIAG. On‐Ramp 0.97 64 71 C A 22.3 <8.9 1425 633
105+04128 US 101 NB Capitol Expy DIAG. On‐Ramp Tully Rd DIAG. Off‐Ramp 0.64 62 72 D A 27.0 <8.9 1666 639
105P04128 US 101 NB Tully Rd DIAG. Off‐Ramp Tully Rd DIAG. On‐Ramp 0.63 58 67 D A 32.7 <8.9 1884 597
105+04129 US 101 NB Tully Rd DIAG. On‐Ramp I‐680 DIAG. Off‐Ramp 0.97 56 75 D A 34.3 <8.9 1927 671
105P04129 US 101 NB I‐680 DIAG. Off‐Ramp I‐680 DIAG. On‐Ramp 0.79 65 71 C A 19.4 <8.9 1258 633
105+04131 US 101 NB I‐680 DIAG. On‐Ramp Alum Rock Ave 0.53 61 71 D A 28.5 <8.9 1734 633
105P04132 US 101 NB Alum Rock Ave DIAG. Off‐Ramp McKee Rd DIAG. On‐Ramp 0.75 62 71 D A 26.3 <8.9 1633 633
105+04133 US 101 NB McKee Rd DIAG. On‐Ramp Oakland Rd DIAG. Off‐Ramp 1.14 61 68 D A 27.5 <8.9 1687 606
105P04133 US 101 NB Oakland Rd DIAG. Off‐Ramp Oakland Rd DIAG. On‐Ramp 0.41 45 66 D B 43.5 15.1 1975 993
105+04134 US 101 NB Oakland Rd DIAG. On‐Ramp I‐880 DIAG. Off‐Ramp 0.15 34 68 E A 53.0 <8.9 1796 602
105P04134 US 101 NB I‐880 DIAG. Off‐Ramp I‐880 L. On‐Ramp 0.22 57 65 D C 33.5 19.5 1907
1264
105+04135 US 101 NB I‐880 L. On‐Ramp Old Bayshore Hwy DIAG. On‐Ramp 0.34 61 67 D A 28.9 <8.9 1750 599
105P04135 US 101 NB Old Bayshore Hwy DIAG. On‐Ramp Old Bayshore Hwy DIAG. Off‐Ramp 0.23 63 68 C A 24.9 <8.9 1562 602
105+04136 US 101 NB Old Bayshore Hwy DIAG. Off‐Ramp Brokaw Rd DIAG. Off‐Ramp 0.20 62 68 C A 25.8 <8.9 1609 606
105P04136 US 101 NB Brokaw Rd DIAG. Off‐Ramp Brokaw Rd DIAG. On‐Ramp 0.63 63 67 C A 24.5 <8.9 1540 599
105P04137 US 101 NB Trimble Rd DIAG. Off‐Ramp SR‐87 DIAG. On‐Ramp 0.45 64 71 C A 21.7 <8.9 1391 633
105+04138 US 101 NB SR‐87 DIAG. On‐Ramp Trimble Rd DIAG. Off‐Ramp 0.28 63 71 C A 24.0 <8.9 1517 631

PM Freeway Speed, LOS, Estimated Density, Estimated Flow, and Duration of Congestion by Segment 2017 AM Results (INRIX Data)
Speed (mi/hr) LOS Density
(pc/mi/ln) Flow (pc/hr/ln) Congestion
(hr) TMC Facility Dir From To Miles Mixed HOV Mixed HOV Mixed HOV Mixed HOV
105P04138 US 101 NB Trimble Rd DIAG. Off‐Ramp Trimble Rd DIAG. On‐Ramp 0.43 62 70 D A 27.1 <8.9 1669 623
105+04139 US 101 NB Trimble Rd DIAG. On‐Ramp San Tomas Expy DIAG. Off‐Ramp 0.70 61 68 D A 28.9 <8.9 1748 603
105P04139 US 101 NB San Tomas Expy DIAG. Off‐Ramp San Tomas Expy DIAG. On‐Ramp 0.64 65 70 C A 19.1 <8.9 1241 625
105P04140 US 101 NB America Pkwy DIAG. Off‐Ramp America Pkwy DIAG. On‐Ramp 0.65 62 72 D A 26.1 <8.9 1621 643
105+04141 US 101 NB America Pkwy DIAG. On‐Ramp Lawrence Expy DIAG. Off‐Ramp 0.58 62 69 C A 25.6 <8.9 1601 618
105P04141 US 101 NB Lawrence Expy DIAG. Off‐Ramp Lawrence Expy DIAG. On‐Ramp 0.39 65 69 C A 19.9 <8.9 1287 612
105+04142 US 101 NB Lawrence Expy DIAG. On‐Ramp Fair Oaks Avenue DIAG. Off‐Ramp 0.65 63 69 C A 25.2 <8.9 1580 612
105P04142 US 101 NB Fair Oaks Avenue DIAG. Off‐Ramp Fair Oaks Avenue DIAG. On‐Ramp 0.29 63 68 C A 23.4 <8.9 1486 601
105+04143 US 101 NB Fair Oaks Avenue DIAG. On‐Ramp Mathilda Ave DIAG. Off‐Ramp 0.52 61 67 D A 27.4 9.3 1686 619
105P04143 US 101 NB Mathilda Ave DIAG. Off‐Ramp Mathilda Ave L. Off‐Ramp 0.21 61 69 D A 28.2 <8.9 1722 613
105+04144 US 101 NB Mathilda Ave L. Off‐Ramp Southbay Fwy L. Off‐Ramp 0.43 58 63 D C 32.2 23.5 1872
1490
105P04144 US 101 NB Southbay Fwy L. Off‐Ramp Southbay Fwy DIAG. Off‐Ramp 0.20 58 64 D C 32.2 21.3 1871
1366
105+04145 US 101 NB Southbay Fwy DIAG. Off‐Ramp Ellis St DIAG. Off‐Ramp 0.46 45 67 D A 43.8 9.8 1973 656
105P04145 US 101 NB Ellis St DIAG. Off‐Ramp Ellis St DIAG. On‐Ramp 0.60 34 61 E D 53.0 28.5 1798
1733
105+04146 US 101 NB Ellis St DIAG. On‐Ramp Moffett Blvd DIAG. Off‐Ramp 0.32 33 59 E D 54.2 31.5 1765
1847
105P04146 US 101 NB Moffett Blvd DIAG. Off‐Ramp Moffett Blvd L. On‐Ramp 0.18 31 61 E D 55.4 27.6 1736
1691
105+04147 US 101 NB Moffett Blvd L. Off‐Ramp Shoreline Blvd DIAG. Off‐Ramp 0.25 27 58 F D 59.6 32.0 1617
1864 1.00
105P04147 US 101 NB Moffett Blvd L. On‐Ramp Shoreline Blvd DIAG. Off‐Ramp 0.25 24 44 F D 63.0 44.3 1512
1967 1.25
105P04148 US 101 NB Moffett Blvd L. Off‐Ramp Shoreline Blvd DIAG. On‐Ramp 1.10 28 49 F D 59.1 40.4 1631
1992 0.50
105+04150 US 101 NB Bayshore Fwy/US‐101 Rengstorff Ave DIAG. Off‐Ramp 0.51 31 51 E D 56.1 38.9 1715
1989
105P04150 US 101 NB Rengstorff Ave DIAG. Off‐Ramp Rengstorff Ave DIAG. On‐Ramp 0.35 34 42 E E 52.7 46.1 1804
1942
105+04151 US 101 NB Rengstorff Ave DIAG. On‐Ramp San Antonio Rd DIAG. Off‐Ramp 0.25 33 49 E D 53.6 40.7 1781
1992
105P04151 US 101 NB San Antonio Rd DIAG. Off‐Ramp San Antonio Rd DIAG. On‐Ramp 0.44 33 44 E D 53.5 44.4 1785
1965
105+04152 US 101 NB San Antonio Rd DIAG. On‐Ramp Embarcadero Rd DIAG. Off‐Ramp 1.18 21 18 F F 66.8 71.2 1393
1250 3.75

PM Freeway Speed, LOS, Estimated Density, Estimated Flow, and Duration of Congestion by Segment 2017 AM Results (INRIX Data)
Speed (mi/hr) LOS Density
(pc/mi/ln) Flow (pc/hr/ln) Congestion
(hr) TMC Facility Dir From To Miles Mixed HOV Mixed HOV Mixed HOV Mixed HOV
105P04152 US 101 NB Embarcadero Rd DIAG. Off‐Ramp Embarcadero Rd DIAG. On‐Ramp 0.70 25 25 F F 61.5 62.1 1560
1542 2.50
105N04152 US 101 SB Embarcadero Rd DIAG. Off‐Ramp Embarcadero Rd DIAG. Off‐Ramp 0.65 15 17 F F 75.7 71.7 1102
1235 3.00
105‐04151 US 101 SB Oregon Expy DIAG. On‐Ramp San Antonio Rd DIAG. Off‐Ramp 1.37 26 30 F F 60.9 58.0 1575
1717 1.75
105N04151 US 101 SB San Antonio Rd DIAG. Off‐Ramp San Antonio Rd L. Off‐Ramp 0.15 34 48 E D 52.8 41.6 1801
1989
105‐04150 US 101 SB San Antonio Rd L. Off‐Ramp Rengstorff Ave DIAG. On‐Ramp 0.70 30 50 F D 58.0 39.9 1738
1992 0.25
105N04150 US 101 SB San Antonio Rd L. Off‐Ramp Rengstorff Ave DIAG. Off‐Ramp 0.18 30 47 E D 56.3 42.0 1710
1987
105‐04149 US 101 SB Rengstorff Ave DIAG. Off‐Ramp Old Middlefield Way DIAG. Off‐Ramp 0.46 29 46 F D 58.1 43.3 1660
1977 0.50
105N04149 US 101 SB Old Middlefield Way DIAG. Off‐Ramp Old Middlefield Way DIAG. On‐Ramp 0.15 24 16 F F 62.6 73.7 1525
1168 1.00
105‐04148 US 101 SB Old Middlefield Way DIAG. On‐Ramp Shoreline Blvd L. On‐Ramp 0.37 23 12 F F 64.1 79.1 1479 988 1.00
105N04147 US 101 SB Shoreline Blvd L. On‐Ramp SR‐85 DIAG. Off‐Ramp 0.36 16 13 F F 72.9 78.3 1196
1015 2.00
105‐04146 US 101 SB SR‐85 DIAG. Off‐Ramp Moffett Blvd L. Off‐Ramp 0.22 13 12 F F 78.6 80.2 1005 948 3.25
105N04146 US 101 SB Moffett Blvd L. Off‐Ramp Moffett Blvd DIAG. On‐Ramp 0.15 14 18 F F 76.6 71.1 1070
1253 4.00
105‐04145 US 101 SB Moffett Blvd DIAG. On‐Ramp Ellis St DIAG. Off‐Ramp 0.41 16 22 F F 72.8 65.0 1199
1452 4.50
105N04145 US 101 SB Ellis St DIAG. Off‐Ramp Ellis St DIAG. On‐Ramp 0.54 18 23 F F 71.0 64.2 1258
1475 5.25
105‐04144 US 101 SB Ellis St DIAG. On‐Ramp SR‐237 L. Off‐Ramp 0.60 21 33 F E 66.3 54.0 1409
1771 2.50
105N04144 US 101 SB SR‐237 L. Off‐Ramp SR‐237 DIAG. On‐Ramp 0.20 23 28 F F 64.6 59.0 1464
1635 1.25
105N04143 US 101 SB Mathilda Ave. DIAG. Off‐Ramp Mathilda Ave. DIAG. On‐Ramp 0.33 22 31 F E 65.6 55.3 1433
1737 1.75
105‐04142 US 101 SB Mathilda Ave. DIAG. On‐Ramp Fair Oaks Ave DIAG. Off‐Ramp 0.52 25 31 F E 61.5 56.0 1558
1718 1.25
105N04142 US 101 SB Fair Oaks Ave DIAG. Off‐Ramp Fair Oaks Ave DIAG. On‐Ramp 0.41 17 19 F F 71.9 69.0 1229
1323 2.50
105‐04141 US 101 SB Fair Oaks Ave DIAG. On‐Ramp Lawrence Expy DIAG. Off‐Ramp 0.55 14 8 F F 77.2 87.5 1050 699 4.00
105N04141 US 101 SB Lawrence Expy DIAG. Off‐Ramp Lawrence Expy DIAG. On‐Ramp 0.39 8 7 F F 88.4 88.7 668 660 5.75
105‐04140 US 101 SB Lawrence Expy DIAG. On‐Ramp Bowers Ave DIAG. Off‐Ramp 0.58 7 8 F F 89.9 88.5 615 664 6.00
105N04140 US 101 SB Bowers Ave DIAG. Off‐Ramp Bowers Ave DIAG. On‐Ramp 0.67 7 6 F F 89.9 91.5 616 562 6.25
105‐04139 US 101 SB Bowers Ave DIAG. On‐Ramp San Thomas Expy DIAG. Off‐Ramp 0.11 8 7 F F 86.7 90.4 729 598 6.25

PM Freeway Speed, LOS, Estimated Density, Estimated Flow, and Duration of Congestion by Segment 2017 AM Results (INRIX Data)
Speed (mi/hr) LOS Density
(pc/mi/ln) Flow (pc/hr/ln) Congestion
(hr) TMC Facility Dir From To Miles Mixed HOV Mixed HOV Mixed HOV Mixed HOV
105N04139 US 101 SB San Thomas Expy DIAG. Off‐Ramp San Thomas Expy DIAG. On‐Ramp 0.65 9 9 F F 85.8 85.7 759 761 6.50
105‐04138 US 101 SB San Thomas Expy DIAG. On‐Ramp Trimble Rd DIAG. Off‐Ramp 0.78 13 17 F F 77.9 71.7 1029
1234 6.50
105N04138 US 101 SB Trimble Rd DIAG. Off‐Ramp Trimble Rd DIAG. On‐Ramp 0.39 18 26 F F 69.9 61.0 1292
1574 6.50
105‐04137 US 101 SB Trimble Rd DIAG. On‐Ramp SR‐87 DIAG. Off‐Ramp 0.41 28 43 F D 58.6 45.2 1644
1955 2.00
105N04137 US 101 SB SR‐87 DIAG. Off‐Ramp SR‐87 DIAG. Off‐Ramp 0.31 41 22 E F 46.8 65.2 1930
1446
105‐04136 US 101 SB SR‐87 DIAG. Off‐Ramp Airport Pkwy DIAG. Off‐Ramp 0.14 32 11 E F 55.1 82.1 1742 886
105N04136 US 101 SB 1st St 4th St DIAG. On‐Ramp 0.37 12 7 F F 79.9 89.2 961 642 2.25
105‐04135 US 101 SB 1st St 4th St DIAG. On‐Ramp 0.38 8 8 F F 86.6 88.5 730 665 4.00
105N04135 US 101 SB 4th St DIAG. On‐Ramp 4th St DIAG. On‐Ramp 0.26 9 8 F F 86.3 87.6 742 695 4.75
105‐04134 US 101 SB 4th St DIAG. On‐Ramp I‐880 DIAG. Off‐Ramp 0.12 9 9 F F 86.4 86.4 736 736 4.75
105N04134 US 101 SB I‐880 DIAG. Off‐Ramp I‐880 DIAG. On‐Ramp 0.49 9 13 F F 85.5 78.4 767
1011 5.25
105‐04133 US 101 SB I‐880 DIAG. On‐Ramp Oakland Rd DIAG. Off‐Ramp 0.10 13 10 F F 77.5 82.9 1041 857 5.50
105N04133 US 101 SB Oakland Rd DIAG. Off‐Ramp Oakland Rd DIAG. On‐Ramp 0.42 17 19 F F 72.1 68.9 1222
1326 5.50
105‐04132 US 101 SB Oakland Rd DIAG. On‐Ramp McKee Rd DIAG. Off‐Ramp 1.21 30 32 E E 56.4 55.0 1708
1744
105N04132 US 101 SB McKee Rd DIAG. Off‐Ramp Alum Rock Ave DIAG. Off‐Ramp 0.59 30 28 F F 58.0 58.4 1725
1649 0.75
105‐04131 US 101 SB McKee Rd DIAG. Off‐Ramp Santa Clara St DIAG. On‐Ramp 0.10 28 33 F E 58.6 54.0 1646
1771 1.25
105N04131 US 101 SB McKee Rd DIAG. On‐Ramp Alum Rock Ave DIAG. Off‐Ramp 0.24 30 29 F F 58.0 58.0 1727
1675 0.50
105‐04130 US 101 SB Alum Rock Ave DIAG. Off‐Ramp I‐680 DIAG. Off‐Ramp 0.22 37 32 E E 49.9 54.3 1869
1764
105N04130 US 101 SB I‐680 DIAG. Off‐Ramp I‐680 DIAG. On‐Ramp 1.36 45 31 D E 44.1 55.2 1969
1739
105N04128 US 101 SB Tully Rd DIAG. Off‐Ramp Tully Rd DIAG. On‐Ramp 0.47 57 45 D D 33.2 43.7 1898
1973
105‐04127 US 101 SB Tully Rd DIAG. On‐Ramp Capitol Expy DIAG. Off‐Ramp 0.81 61 59 D D 27.7 31.6 1699
1852
105N04127 US 101 SB Capitol Expy DIAG. Off‐Ramp Yerba Buena Rd DIAG. Off‐Ramp 0.74 63 62 C D 23.6 27.0 1497
1666
105‐04126 US 101 SB Yerba Buena Rd DIAG. Off‐Ramp Yerba Buena Rd 0.26 62 62 C D 25.6 26.7 1597
1651
105N04126 US 101 SB Yerba Buena Rd Yerba Buena Rd DIAG. On‐Ramp 0.26 61 62 D D 27.7 26.8 1699
1656

PM Freeway Speed, LOS, Estimated Density, Estimated Flow, and Duration of Congestion by Segment 2017 AM Results (INRIX Data)
Speed (mi/hr) LOS Density
(pc/mi/ln) Flow (pc/hr/ln) Congestion
(hr) TMC Facility Dir From To Miles Mixed HOV Mixed HOV Mixed HOV Mixed HOV
105‐04125 US 101 SB Yerba Buena Rd DIAG. On‐Ramp Hellyer Ave L. On‐Ramp 0.60 61 61 D D 28.1 28.3 1715
1723
105N04125 US 101 SB Hellyer Ave L. On‐Ramp Hellyer Ave DIAG. Off‐Ramp(NB) 0.28 65 65 C C 18.9 18.7 1230
1215
105‐04124 US 101 SB Hellyer Ave DIAG. Off‐Ramp(NB) Blossom Hill Rd DIAG. Off‐Ramp 1.24 55 61 D D 35.1 27.8 1944
1703
105N04124 US 101 SB Blossom Hill Rd DIAG. Off‐Ramp Blossom Hill Rd DIAG. On‐Ramp 0.65 66 66 B B 14.9 15.5 984
1023
105‐04123 US 101 SB Blossom Hill Rd DIAG. On‐Ramp Silicon Valley Blvd DIAG. Off‐Ramp 1.03 66 67 B A 12.5 <8.9 830 598
105N04123 US 101 SB Silicon Valley Blvd DIAG. Off‐Ramp Silicon Valley Blvd DIAG. On‐Ramp 0.31 66 68 B A 14.5 <8.9 955 602
105‐04122 US 101 SB Silicon Valley Blvd DIAG. On‐Ramp Silicon Valley Blvd DIAG. Off‐Ramp 0.18 65 69 C A 19.1 <8.9 1238 617
105N04122 US 101 SB Silicon Valley Blvd DIAG. Off‐Ramp SR‐85 DIAG. On‐Ramp 0.20 65 69 C A 19.4 <8.9 1255 611
105‐09288 US 101 SB SR‐85 DIAG. On‐Ramp Bailey Ave DIAG. Off‐Ramp 2.93 40 68 E A 48.0 <8.9 1908 609
105N09288 US 101 SB Bailey Ave DIAG. Off‐Ramp Bailey Ave DIAG. On‐Ramp 0.52 39 33 E E 48.5 54.1 1900
1769
105‐04121 US 101 SB Bailey Ave DIAG. On‐Ramp Coyote Creek Golf Dr DIAG. Off‐Ramp 1.59 22 32 F E 65.2 55.0 1444
1744 1.75
105N04121 US 101 SB Coyote Creek Golf Dr DIAG. Off‐Ramp Coyote Creek Golf Dr DIAG. On‐Ramp 0.62 20 27 F F 68.1 59.4 1353
1621 2.25
105‐04120 US 101 SB Coyote Creek Golf Dr DIAG. On‐Ramp Cochrane Rd DIAG. Off‐Ramp 2.69 19 24 F F 68.8 62.8 1329
1518 3.00
105N04120 US 101 SB Cochrane Rd DIAG. Off‐Ramp Cochrane Rd DIAG. On‐Ramp 0.77 23 F 64.5 1467 2.75
105‐04119 US 101 SB Cochrane Rd DIAG. On‐Ramp Dunne Ave DIAG. Off‐Ramp 1.20 38 E 49.3 1883
105N04119 US 101 SB Dunne Ave DIAG. Off‐Ramp Dunne Ave DIAG. On‐Ramp 0.49 39 E 48.3 1904
105‐04118 US 101 SB Dunne Ave DIAG. On‐Ramp Tennant Ave DIAG. Off‐Ramp 0.39 36 E 51.3 1838
105N04118 US 101 SB Tennant Ave DIAG. Off‐Ramp Tennant Ave DIAG. On‐Ramp 0.55 34 E 53.0 1797
105‐04117 US 101 SB Tennant Ave DIAG. On‐Ramp San Martin Ave DIAG. Off‐Ramp 2.15 44 D 44.9 1959
105N04117 US 101 SB San Martin Ave DIAG. Off‐Ramp San Martin Ave DIAG. On‐Ramp 0.48 52 D 37.7 1981
105‐04116 US 101 SB San Martin Ave DIAG. On‐Ramp Masten Ave DIAG. Off‐Ramp 1.63 55 D 35.7 1954
105N04116 US 101 SB Masten Ave DIAG. Off‐Ramp Masten Ave DIAG. On‐Ramp 0.56 64 C 20.9 1344
105‐04115 US 101 SB Masten Ave DIAG. On‐Ramp Leavesley Rd DIAG. Off‐Ramp 2.18 65 C 19.4 1259
105N04115 US 101 SB Leavesley Rd DIAG. Off‐Ramp Leavesley Rd DIAG. On‐Ramp 0.65 63 C 24.0 1516

PM Freeway Speed, LOS, Estimated Density, Estimated Flow, and Duration of Congestion by Segment 2017 AM Results (INRIX Data)
Speed (mi/hr) LOS Density
(pc/mi/ln) Flow (pc/hr/ln) Congestion
(hr) TMC Facility Dir From To Miles Mixed HOV Mixed HOV Mixed HOV Mixed HOV
105‐04114 US 101 SB Leavesley Rd DIAG. On‐Ramp 10th St DIAG. Off‐Ramp 0.86 63 C 23.7 1500
105N04114 US 101 SB 10th St DIAG. Off‐Ramp 10th St DIAG. On‐Ramp 0.56 65 C 19.9 1286
105‐04113 US 101 SB 10th St DIAG. On‐Ramp Monterey Rd DIAG. Off‐Ramp 0.58 56 D 34.3 1927
105N04113 US 101 SB Monterey Rd DIAG. Off‐Ramp Monterey Rd DIAG. On‐Ramp 0.50 18 F 70.0 1292 1.50
105‐09872 US 101 SB Monterey Rd DIAG. On‐Ramp Castro Valley Rd 1.04 24 F 63.4 1499 2.00 105‐09871 US 101 SB Castro Valley Rd SR‐25 DIAG. Off‐Ramp 0.34 27 F 59.5 1620 0.50
105N09871 US 101 SB SR‐25 DIAG. Off‐Ramp SR‐25 DIAG. On‐Ramp 0.40 49 D 40.3 1992
105‐05102 US 101 SB SR‐25 DIAG. On‐Ramp Beatable Rd DIAG. Off‐Ramp 3.60 63 C 24.6 1548
105P04304 SR 85 NB US‐101 DIAG. Off‐Ramp Bernal Rd L. On‐Ramp 0.70 63 67 C A 24.7 <8.9 1550 598
105P04305 SR 85 NB Bernal Rd. L. On‐Ramp Bernal Rd. DIAG. On‐Ramp 0.32 65 70 C A 19.5 <8.9 1265 622
105P04306 SR 85 NB US‐101 DIAG. On‐Ramp Great Oaks Blvd DIAG. On‐Ramp 0.35 67 71 A A <8.9 <8.9 597 636
105+04307 SR 85 NB Great Oaks Blvd DIAG. On‐Ramp Cottle Rd DIAG. Off‐Ramp 0.80 60 68 D A 30.1 <8.9 1799 608
105P04307 SR 85 NB Cottle Rd DIAG. Off‐Ramp Cottle Rd DIAG. On‐Ramp 0.58 42 51 D D 46.0 38.8 1943
1988
105+04308 SR 85 NB Cottle Rd DIAG. On‐Ramp Blossom Hill Rd DIAG. Off‐Ramp 1.29 53 63 D C 37.5 25.4 1978
1590
105P04308 SR 85 NB Blossom Hill Rd DIAG. Off‐Ramp Blossom Hill Rd DIAG. On‐Ramp 0.62 64 66 C B 22.4 15.4 1428
1011
105+04309 SR 85 NB Blossom Hill Rd DIAG. On‐Ramp SR‐87 DIAG. Off‐Ramp 0.53 63 69 C A 24.0 <8.9 1514 611
105P04309 SR 85 NB SR‐87 DIAG. Off‐Ramp SR‐87 DIAG. On‐Ramp 0.78 63 67 C A 24.2 9.7 1527 646
105P04311 SR 85 NB Almaden Expwy DIAG. Off‐Ramp Almaden Expwy DIAG. On‐Ramp 0.53 63 67 C A 24.5 <8.9 1545 600
105+04312 SR 85 NB Almaden Expwy DIAG. On‐Ramp Camden Ave DIAG. Off‐Ramp 1.46 62 69 D A 26.7 <8.9 1652 612
105P04312 SR 85 NB Camden Ave DIAG. Off‐Ramp Camden Ave DIAG. On‐Ramp 0.43 65 67 C A 20.0 <8.9 1294 599
105+04313 SR 85 NB Camden Ave DIAG. On‐Ramp Union Ave DIAG. Off‐Ramp 0.79 66 70 B A 15.5 <8.9 1022 619
105P04313 SR 85 NB Union Ave DIAG. Off‐Ramp Union Ave DIAG. On‐Ramp 0.42 65 70 C A 19.9 <8.9 1289 619
105+04314 SR 85 NB Union Ave DIAG. On‐Ramp S. Bascom Ave DIAG. Off‐Ramp 0.48 63 69 C A 24.5 <8.9 1544 617
105P04315 SR 85 NB S. Bascom Ave DIAG. Off Ramp Winchester Blvd DIAG. On‐Ramp 1.18 67 69 A A 10.2 <8.9 680 618

PM Freeway Speed, LOS, Estimated Density, Estimated Flow, and Duration of Congestion by Segment 2017 AM Results (INRIX Data)
Speed (mi/hr) LOS Density
(pc/mi/ln) Flow (pc/hr/ln) Congestion
(hr) TMC Facility Dir From To Miles Mixed HOV Mixed HOV Mixed HOV Mixed HOV
105P04316 SR 85 NB S. Bascom Ave DIAG. On‐Ramp Winchester Blvd DIAG. On‐Ramp 0.28 66 70 B A 12.6 <8.9 837 619
105+04317 SR 85 NB Winchester Blvd DIAG. On‐Ramp Saratoga Ave DIAG. Off‐Ramp 2.12 54 68 D A 36.2 <8.9 1962 601
105P04317 SR 85 NB Saratoga Ave DIAG. Off‐Ramp Saratoga Ave DIAG. On‐Ramp 0.62 65 68 C A 19.3 <8.9 1252 606
105+04318 SR 85 NB Saratoga Ave DIAG. On‐Ramp S De Anza Blvd DIAG. Off‐Ramp 1.39 67 70 A A <8.9 <8.9 600 621
105P04318 SR 85 NB S De Anza Blvd DIAG. Off‐Ramp S De Anza Blvd DIAG. On‐Ramp 0.75 65 69 C A 18.8 <8.9 1223 617
105+04319 SR 85 NB S De Anza Blvd DIAG. On‐Ramp Stevens Creek Blvd DIAG. Off‐Ramp 1.28 65 69 C A 18.8 <8.9 1224 612
105P04319 SR 85 NB Stevens Creek Blvd DIAG. Off‐Ramp Stevens Creek Blvd DIAG. On‐Ramp 0.48 67 69 A A 9.1 <8.9 612 615
105+04320 SR 85 NB Stevens Creek Blvd DIAG. On‐Ramp I‐280 DIAG. Off‐Ramp 0.21 67 69 A A <8.9 <8.9 599 613
105+04321 SR 85 NB I‐280 DIAG. Off‐Ramp Homestead Rd 0.73 67 69 A A 10.1 <8.9 673 613
105+04322 SR 85 NB Homestead Rd On‐Ramp Freemont Ave Off‐Ramp 0.75 50 68 D A 39.9 <8.9 1992 608
105P04322 SR 85 NB Freemont Ave Off‐Ramp Freemont Ave On‐Ramp 0.42 54 69 D A 36.1 <8.9 1960 610
105+04323 SR 85 NB Freemont Ave On‐Ramp El Camino Real Off‐Ramp 1.45 65 68 C A 18.7 <8.9 1213 607
105P04323 SR 85 NB El Camino Real Off‐Ramp El Camino Real On‐Ramp 0.37 61 68 D A 27.9 <8.9 1706 607
105P04324 SR 85 NB SR‐237 Off‐Ramp SR‐237 0.26 63 67 C A 23.4 <8.9 1485 598
105+04325 SR 85 NB SR‐237 Central Expy Off‐Ramp 0.14 63 67 C A 23.3 <8.9 1477 600
105P04325 SR 85 NB Central Expy Off‐Ramp E Evelyn Ave 0.31 63 67 C A 23.4 9.1 1482 608
105P04326 SR 85 NB Central Expy Central Expy On‐Ramp 0.41 66 68 B A 13.4 <8.9 886 603
105+04327 SR 85 NB Central Expy On‐Ramp Middlefield Rd Off‐Ramp 0.15 64 69 C A 22.3 <8.9 1425 615
105P04327 SR 85 NB Middlefield Rd Off‐Ramp Moffett Blvd 0.25 65 66 C B 20.2 15.4 1305
1017
105+04328 SR 85 NB Moffett Blvd US‐101 Off‐Ramp 0.18 63 65 C C 25.3 19.0 1585
1231
105P04328 SR 85 NB US‐101 Off‐Ramp N Shoreline Blvd Off‐Ramp 0.50 43 55 D D 45.6 35.2 1950
1945
105N04328 SR 85 SB N Shoreline Blvd DIAG. On‐Ramp Moffett Blvd L. Off‐Ramp 0.75 22 38 F E 65.5 49.3 1434
1884 0.50
105‐04326 SR 85 SB Moffett Blvd L. Off‐Ramp Central Expy DIAG. Off‐Ramp 0.47 14 20 F F 76.5 67.8 1075
1363 1.75
105N04326 SR 85 SB Central Expy DIAG. Off‐Ramp Central Expy DIAG. On‐Ramp 0.26 17 22 F F 72.4 65.8 1211
1426 1.75

PM Freeway Speed, LOS, Estimated Density, Estimated Flow, and Duration of Congestion by Segment 2017 AM Results (INRIX Data)
Speed (mi/hr) LOS Density
(pc/mi/ln) Flow (pc/hr/ln) Congestion
(hr) TMC Facility Dir From To Miles Mixed HOV Mixed HOV Mixed HOV Mixed HOV
105N04325 SR 85 SB Evelyn Ave DIAG. Off‐Ramp Evelyn Ave DIAG. On‐Ramp 0.24 16 31 F E 73.0 55.9 1193
1721 2.00
105N04324 SR 85 SB SR‐237 DIAG. Off‐Ramp SR‐237 L. On‐Ramp 0.27 17 27 F F 71.8 59.5 1231
1618 3.00
105‐04323 SR 85 SB SR‐237 L. On‐Ramp El Camino Real L. On‐Ramp 0.34 21 20 F F 66.1 68.3 1415
1346 2.75
105N04323 SR 85 SB El Camino Real L. On‐Ramp El Camino Real DIAG. On‐Ramp 0.22 24 31 F E 62.9 55.4 1515
1735 2.25
105‐04322 SR 85 SB El Camino Real DIAG. On‐Ramp Freemont Ave DIAG. Off‐Ramp 1.46 30 32 E E 56.6 54.4 1702
1760
105N04322 SR 85 SB Freemont Ave DIAG. Off‐Ramp Freemont Ave DIAG. On‐Ramp 0.42 28 34 F E 58.6 53.3 1646
1791 0.75
105‐04321 SR 85 SB Freemont Ave DIAG. On‐Ramp Homestead Rd DIAG. Off‐Ramp 0.52 40 43 E D 47.7 45.1 1915
1956
105N04321 SR 85 SB Homestead Rd DIAG. Off‐Ramp Homestead Rd DIAG. On‐Ramp 0.30 38 54 E D 49.4 36.1 1881
1960
105‐04320 SR 85 SB Homestead Rd DIAG. On‐Ramp I‐280 DIAG. Off‐Ramp 0.73 10 11 F F 83.6 81.2 834 917 3.25 105‐04319 SR 85 SB I‐280 DIAG. Off‐Ramp I‐280 DIAG. On‐Ramp 0.20 9 5 F F 85.0 94.7 785 450 4.25
105N04319 SR 85 SB Stevens Creek Blvd DIAG. Off‐Ramp Stevens Creek Blvd DIAG. On‐Ramp 0.52 8 7 F F 86.8 90.3 722 602 5.00
105‐04318 SR 85 SB Stevens Creek Blvd DIAG. On‐Ramp S De Anza Blvd DIAG. Off‐Ramp 1.29 12 13 F F 79.6 77.4 972
1045 5.00
105N04318 SR 85 SB S De Anza Blvd DIAG. Off‐Ramp S De Anza Blvd DIAG. On‐Ramp 0.54 15 16 F F 75.7 73.8 1102
1167 4.50
105‐04317 SR 85 SB S De Anza Blvd DIAG. On‐Ramp Saratoga Ave DIAG. Off‐Ramp 1.58 18 23 F F 70.1 64.2 1286
1475 4.50
105N04317 SR 85 SB Saratoga Ave DIAG. Off‐Ramp Saratoga Ave DIAG. On‐Ramp 0.54 20 26 F F 67.9 61.0 1360
1574 5.50
105‐04316 SR 85 SB Saratoga Ave DIAG. On‐Ramp Winchester Blvd DIAG. Off‐Ramp 2.19 25 29 F F 62.1 58.0 1541
1684 1.00
105N04316 SR 85 SB Winchester Blvd DIAG. Off‐Ramp Winchester Blvd DIAG. On‐Ramp 0.28 25 18 F F 61.4 70.5 1562
1273 1.75
105N04315 SR 85 SB SR‐17 DIAG. Off‐Ramp SR‐17 DIAG. On‐Ramp 0.90 13 15 F F 77.6 75.7 1037
1103 3.25
105‐04313 SR 85 SB S Bascom Ave DIAG. On‐Ramp Union Ave DIAG. Off‐Ramp 0.35 18 20 F F 71.3 68.0 1249
1357 5.50
105N04313 SR 85 SB Union Ave DIAG. Off‐Ramp Union Ave DIAG. On‐Ramp 0.62 27 28 F F 60.1 59.1 1602
1632 4.25
105‐04312 SR 85 SB Union Ave DIAG. On‐Ramp Camden DIAG. Off‐Ramp 0.80 34 39 E E 52.9 48.5 1800
1899
105N04312 SR 85 SB Camden DIAG. Off‐Ramp Camden DIAG. On‐Ramp 0.31 31 34 E E 56.1 52.5 1715
1809
105‐04311 SR 85 SB Camden DIAG. On‐Ramp Almaden Expy DIAG. Off‐Ramp 1.43 45 48 D D 44.0 41.8 1970
1988
105N04311 SR 85 SB Almaden Expy DIAG. Off‐Ramp Almaden Expy DIAG. On‐Ramp 0.44 60 59 D D 29.2 31.0 1764
1832

PM Freeway Speed, LOS, Estimated Density, Estimated Flow, and Duration of Congestion by Segment 2017 AM Results (INRIX Data)
Speed (mi/hr) LOS Density
(pc/mi/ln) Flow (pc/hr/ln) Congestion
(hr) TMC Facility Dir From To Miles Mixed HOV Mixed HOV Mixed HOV Mixed HOV
105‐04310 SR 85 SB Almaden Expy DIAG. On‐Ramp SR‐87 DIAG. Off‐Ramp 0.50 59 64 D C 30.5 22.5 1814
1437
105N04310 SR 85 SB SR‐87 DIAG. Off‐Ramp SR‐87 DIAG. On‐Ramp 0.52 47 57 D D 42.5 32.9 1984
1891
105‐04308 SR 85 SB SR‐87 DIAG. On‐Ramp Blossom Hill Rd DIAG. Off‐Ramp 0.44 35 40 E E 51.9 48.2 1824
1906
105N04308 SR 85 SB Blossom Hill Rd DIAG. Off‐Ramp Blossom Hill Rd DIAG. On‐Ramp 0.64 58 54 D D 32.8 36.0 1887
1959
105‐04307 SR 85 SB Blossom Hill Rd DIAG. On‐Ramp Cottle Rd DIAG. Off‐Ramp 1.35 61 63 D C 28.0 24.6 1712
1546
105N04307 SR 85 SB Cottle Rd DIAG. Off‐Ramp Cottle Rd DIAG. On‐Ramp 0.69 67 65 A C 10.2 20.0 683
1292
105‐04306 SR 85 SB Cottle Rd DIAG. On‐Ramp Great Oaks Blvd DIAG. Off‐Ramp 0.72 65 66 B B 17.7 16.1 1156
1055
105N04306 SR 85 SB Great Oaks Blvd DIAG. Off‐Ramp Great Oaks Blvd DIAG. On‐Ramp 0.34 63 64 C C 23.5 22.5 1491
1434
105N04305 SR 85 SB US‐101 DIAG. Off‐Ramp US‐101 DIAG. On‐Ramp 0.59 63 61 C D 24.0 28.0 1514
1713


![Conformance Checking of Processes Based on Monitoring Real Behaviour [2008]](https://img.pdfslide.us/doc/110x75/577cce331a28ab9e788d89d0/conformance-checking-of-processes-based-on-monitoring-real-behaviour-2008.jpg)