Embed Size (px)
Citation preview

2017
Chief Legal Officer Survey An Altman Weil Flash Survey

Copyright 2017 Altman Weil, Inc. All rights reserved.
No part of this work may be reproduced or copied in any form or by any
means without prior written permission of Altman Weil, Inc.
For reprint permission, contact Altman Weil, Inc.
3959 Welsh Road, Suite 328, Willow Grove, PA 19090
610.886.2000 or [email protected]

SUMMARY & ANALYSIS
© 2017 Altman Weil, Inc. 2017 Chief Legal Officer Survey - i
2017 Chief Legal Officer Survey
Each year since 2000, the Chief Legal Officer Survey has provided insights into the
state of in-house law departments from the perspective of their chief lawyers. Now in its
eighteenth year, the 2017 survey identifies long-term trends, highlights new and
emerging issues, and explores the reasons behind the findings.
The Chief Legal Officer (CLO) position is a complex job encompassing law, business
and leadership roles – and the law departments they lead are not monolithic. They
range from solo shops with one lawyer who wears all hats, to departments with 1,000 or
more lawyers that have a vast array of resources and an equal number of challenges.
This year, for the first time, the survey includes breakouts by department size to provide
more depth and insight on management approaches and spending decisions. In doing
this, we have been able to identify where department size is a factor and where it does
not appear to be material. We also asked not only about the management tactics law
departments are using in a variety of areas, but also whether or not each effort has
resulted in a significant improvement in performance.
The report includes data on department personnel and operations as well as outside
counsel management – and throughout the survey these internal and external elements
intersect. The push and pull of interdependence between law departments (as clients)
and law firms (as their primary service providers) is evident. At the same time, non-law-
firm vendors and evolving technology tools play a growing role, offering new alternatives
to the traditional 'law firm-client' pairing.
Law Department Staffing
Thirty-eight percent of law departments plan to add in-house lawyers in the next 12
months, according to the survey. That is 4.5 times more than the 8% that plan to
decrease their in-house lawyer staff, continuing a recent trend of law department
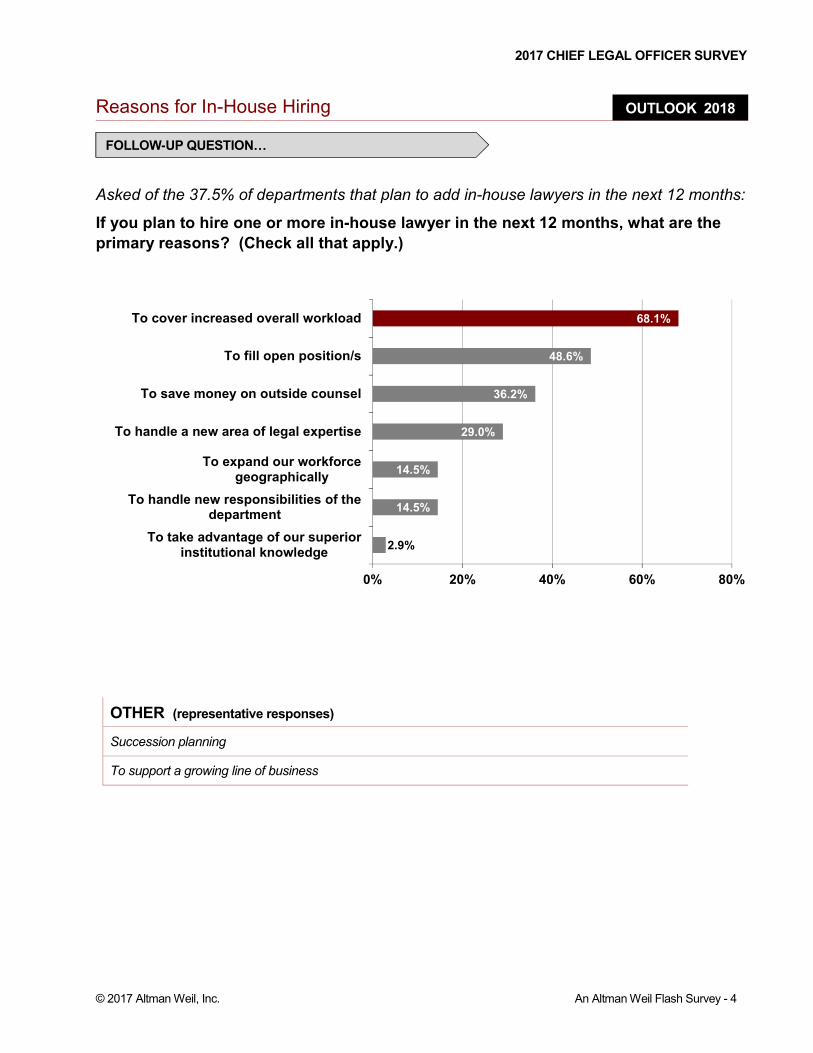
growth. Of those planning an increase, 68% said they plan to add lawyers to cover an
overall increase in workload; 49% will do so to fill open positions, and 29% will hire to
cover new areas of law. A little over a third (36%) of all departments plan to increase
lawyer staff for a more calculated reason – to save money on outside counsel costs.

SUMMARY & ANALYSIS
© 2017 Altman Weil, Inc. 2017 Chief Legal Officer Survey - ii
The Law Department Operations Manager (LDO) position (akin to law firm COOs and
executive directors) is relatively new, but it is gaining traction. This year, 37% of law
departments report having either a full-time or part-time administrator up from 33% last
year. Three quarters of all departments with 50 or more lawyers report having an LDO
on staff. These professionals oversee day-to-day operations in the department and
manage financial issues, including outside counsel spend, technology and people.
For most law departments with even ten lawyers or more, there can be significant value
in transferring administrative functions to a specially qualified professional. Although
many CLOs will default to adding another lawyer if they have added resources, it is
worth assessing the benefits of freeing up lawyer time from administrative tasks to focus
more on practicing law.
Improving Internal Efficiency
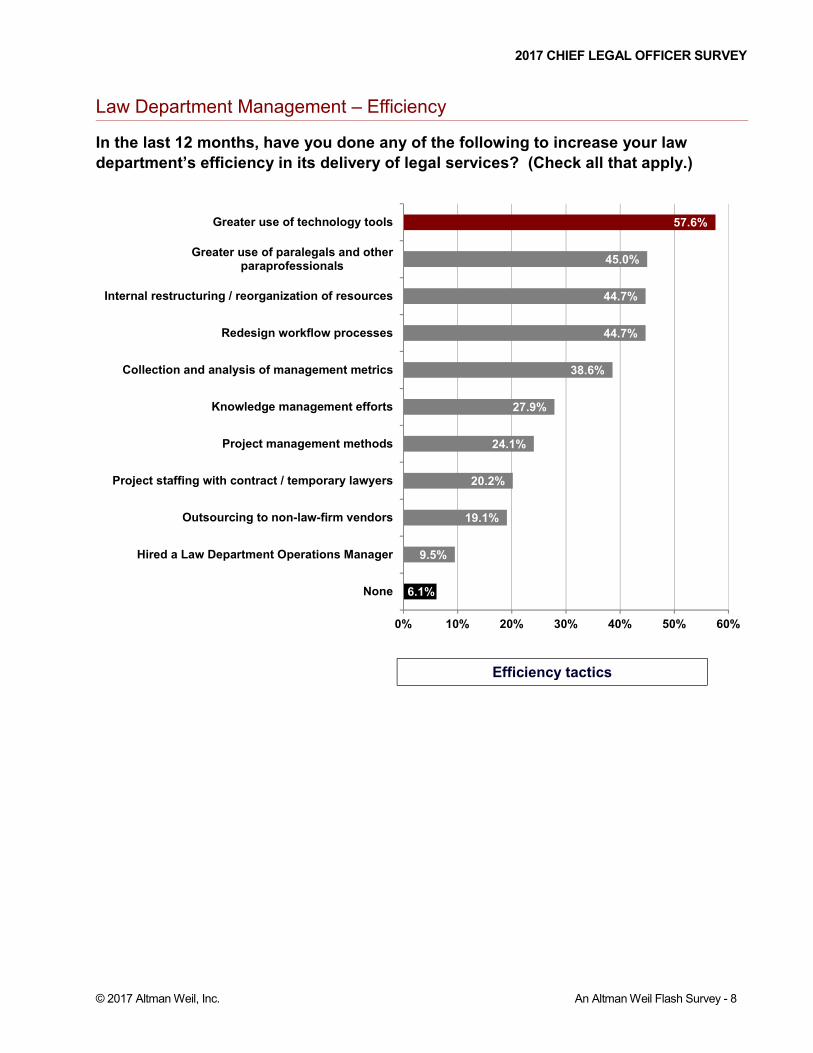
Of ten options to improve law department efficiency, the most common response, from
58% of all respondent departments, is a greater use of technology tools. The
preference for this tactic directly correlates to department size, with 55% of 1-lawyer
departments using it, while 81% do so in departments with over 50 lawyers. This
differential is not surprising considering the investment of money and time required to
purchase and effectively implement new tech tools.
The second most frequently deployed efficiency technique is greater use of paralegals
and other para-professionals, reported by 45% of all departments. Here, there is no
significant difference based on department size.
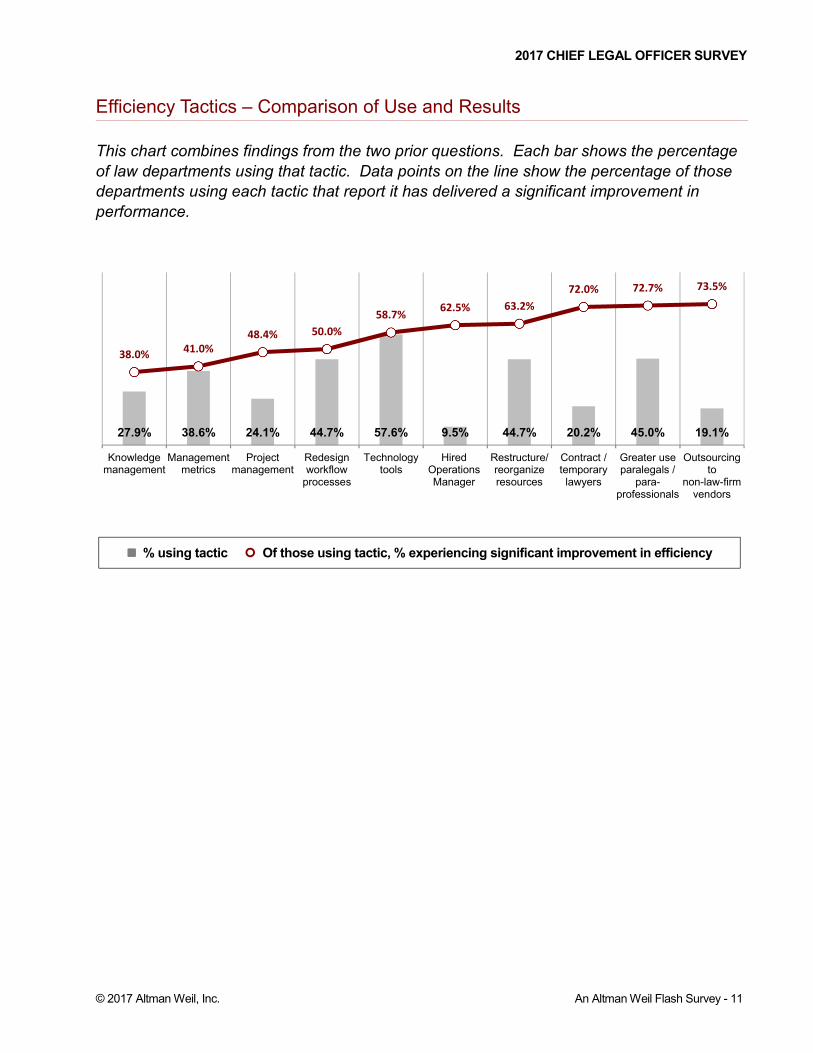
We also asked how effective each of the ten efficiency tactics had been in improving
performance. The tactic with the highest effectiveness score is outsourcing to
non-law-firm vendors – although it was second to last in frequency, used by only 19% of
all departments. This is also a tactic used much more by large departments, likely
because outsourcing also requires a significant up-front investment to set up and
manage and makes most sense if it can be applied to a critical mass of work over an
extended period of time.
In contrast, the second most effective technique is also the second most frequently
used – i.e., a greater use of paralegals and other para-professionals. This is an
effective, familiar, and easy-to-implement tactic available to all law departments.
SUMMARY & ANALYSIS
© 2017 Altman Weil, Inc. 2017 Chief Legal Officer Survey - iii
We recommend that law department leaders look at each pairing of tactic and
effectiveness, considering the investment required and the outcomes reported, in order
to identify where potential opportunities may exist to improve their department’s
performance.
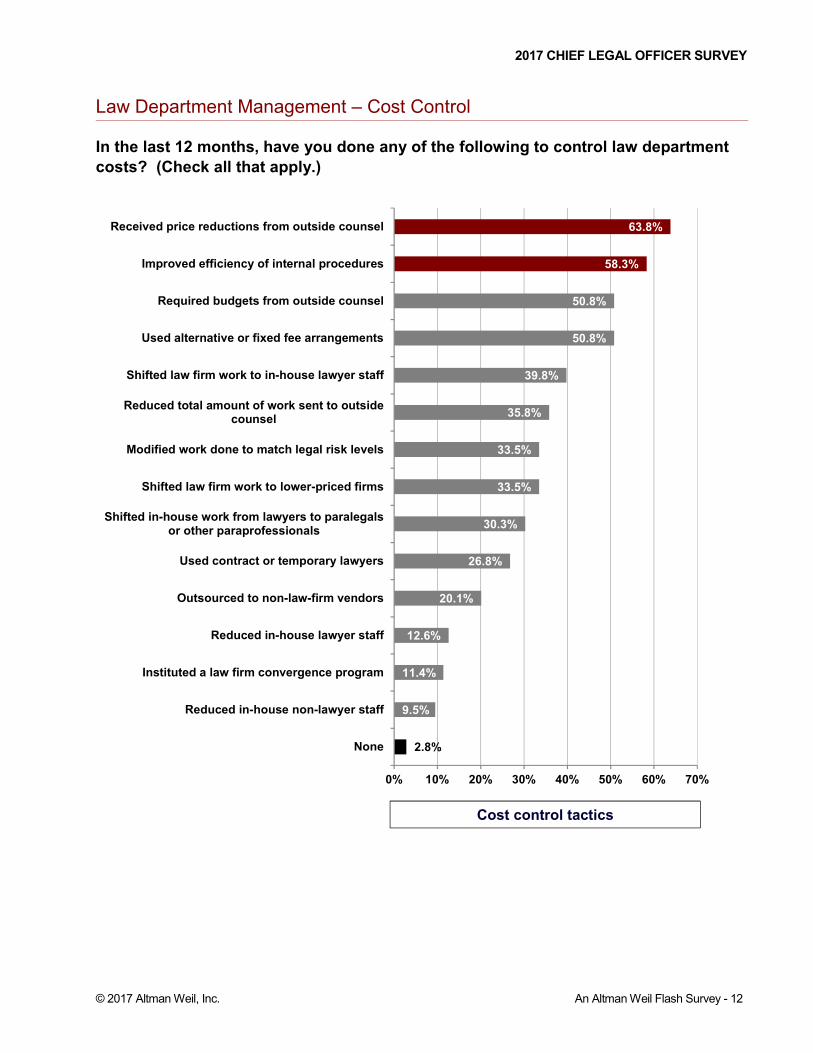
Controlling Costs
We asked Chief Legal Officers about 14 cost control techniques and the effectiveness
of each. In this category, the most frequently used tactics are: price reductions from
outside counsel (named by 64% of departments); improved internal efficiencies (in 58%
of departments), requiring outside counsel budgets; and, alternative or fixed fees (the
latter two in 51% of departments each). The use of all cost control tactics on the list has
a direct correlation with department size, with larger departments more likely to pursue
each option.
Interestingly, outsourcing to non-law-firm vendors again took the top spot as most
effective tactic for those that use it to control costs. For departments in which
outsourcing is a viable option, it clearly has proven potential.
The second, third and fourth most effective cost control tactics all target outside law
firms: shifting law firm work to lower-priced firms, reducing the total amount of work sent
to outside counsel, and shifting law firm work to in-house lawyers. Each of these tactics
is an example of labor arbitrage in which CLOs are rethinking who should do their work
and how it should be done.
The Law Department Budget
We asked CLOs about the change in their total law department budgets from 2016 to
2017, as well as detail on changes to internal spend and spend on outside counsel and
vendors. Overall 45% of departments increased total spend in 2017; 36% decreased
their budgets; and, 19% made no change.
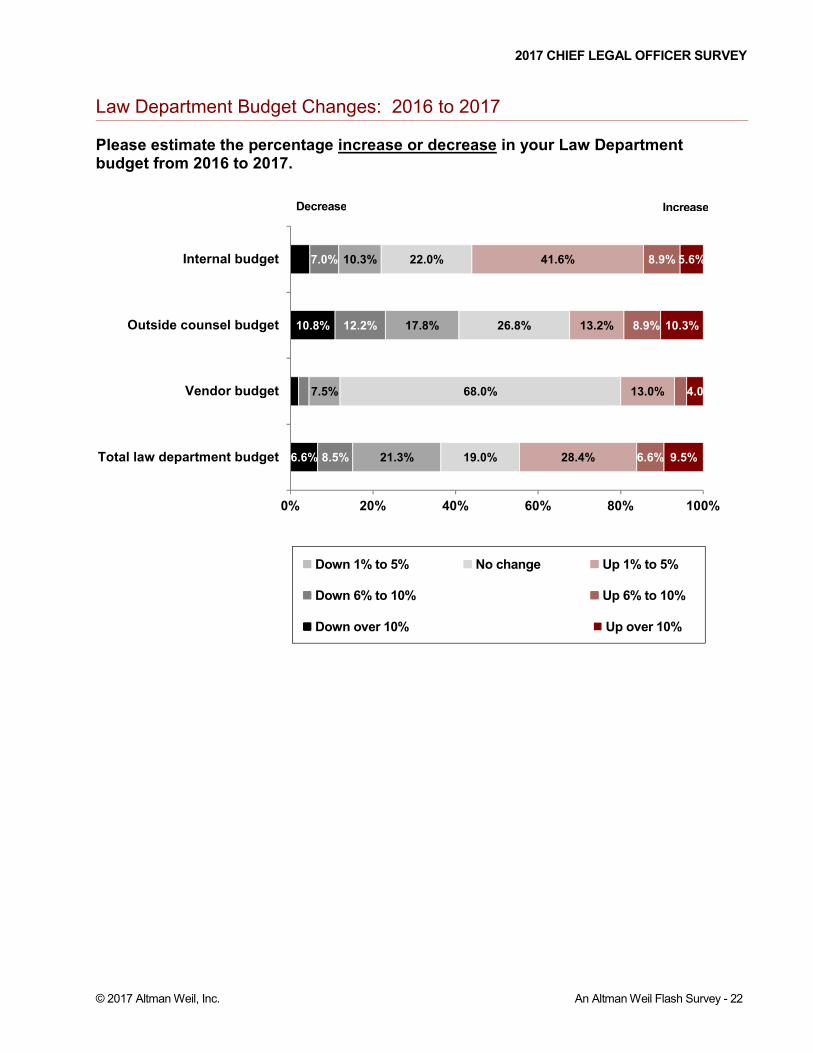
A majority of law departments increased their internal budgets in 2017. Fifty-six percent
of all departments report an increase, while only 22% report a decrease. This continues
a multi-year trend in which increases in this category have significantly outpaced
decreases. For the first time since 2013, law department vendor budgets also saw
more increases than decreases – with 20% of departments upping their vendor spend,
while 12% decreased it.

SUMMARY & ANALYSIS
© 2017 Altman Weil, Inc. 2017 Chief Legal Officer Survey - iv
Outside counsel spend is the only category in which more departments cut their
budgets in 2017 than those that increased it. Forty-one percent of law departments
report decreasing outside counsel spend, while 32% report an increase. However, the
differential between decreases and increases has been narrowing each year since
2015.
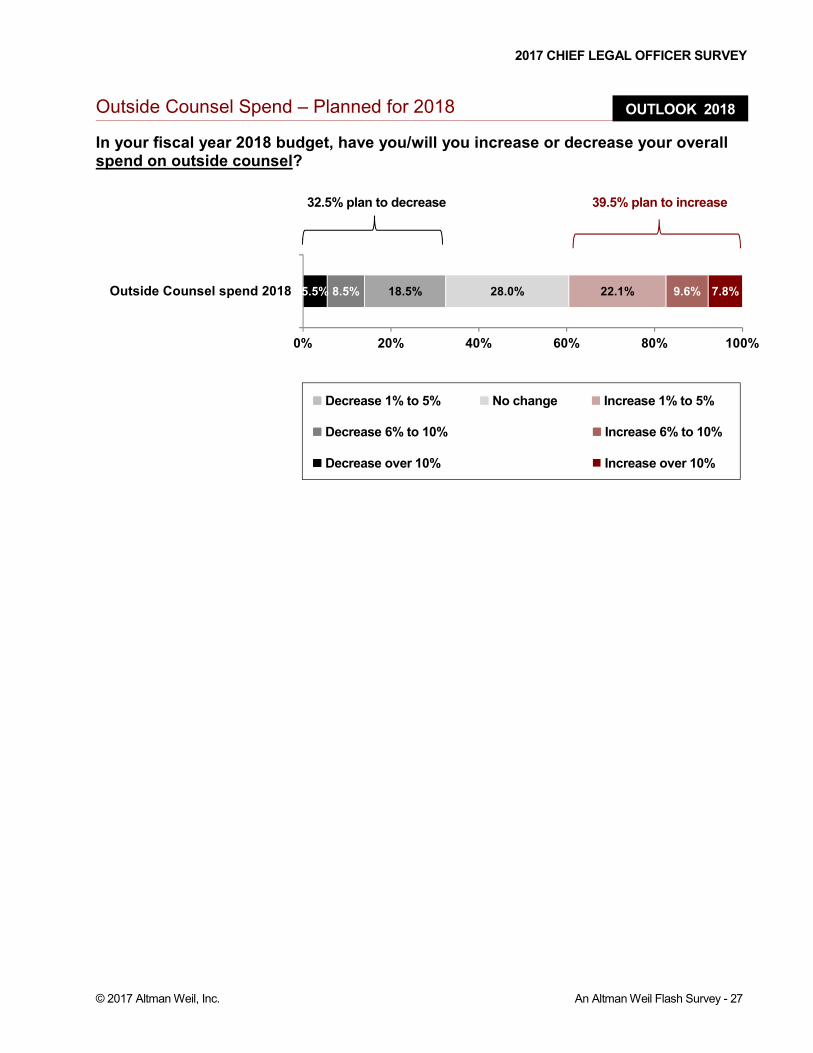
The survey found a noteworthy turnaround in law department predictions about future
outside counsel spending. When asked about their plans for 2018, 40% of law
departments indicate they plan to increase their outside budgets next year as opposed
to 33% that anticipate a decrease. This is the first time since 2007 that more
departments plan increases than decreases in outside counsel spending.
This anticipated change of direction in outside counsel spending in 2018 may be an
extension of the narrowing gap between decreases and increases in actual spending
reported over the last three years. It will be interesting to see if this prediction about
future spending pans out in real changes next year.
Department Size and Spending Trends
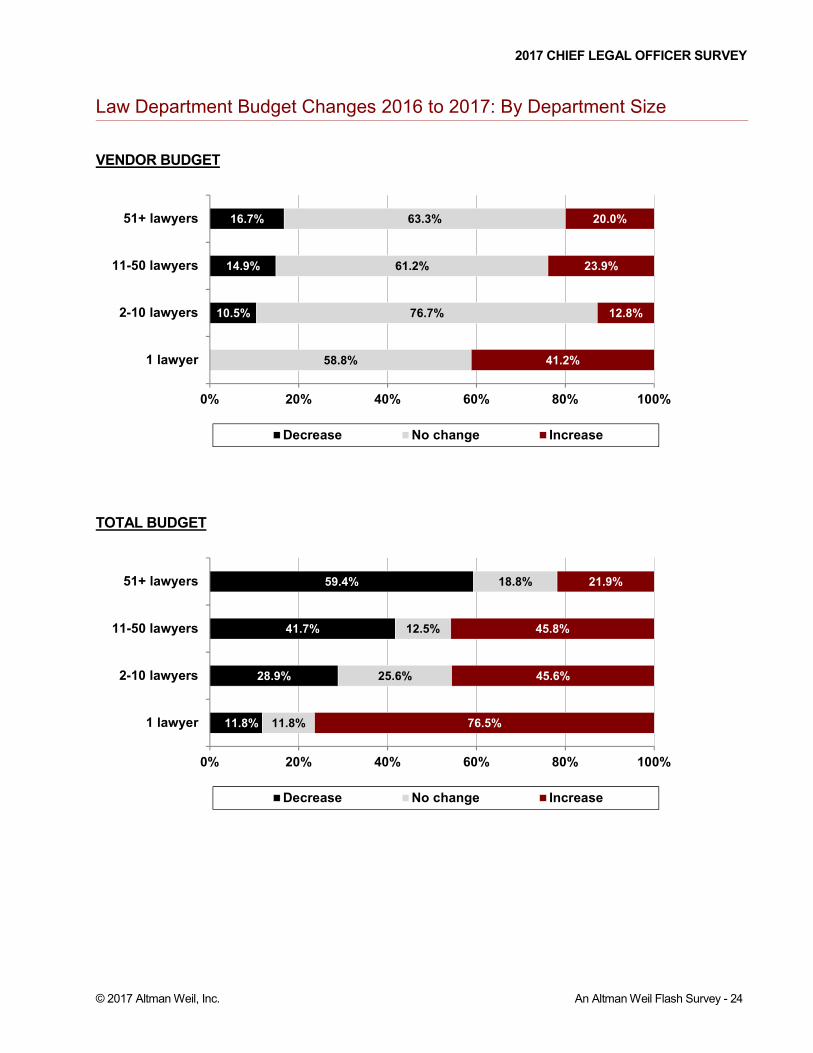
On spending, department size is a clear determinative factor. For total legal spend in
2017 and in each budget sub-category, the largest law departments diverge sharply
from departments of other sizes. For example, in law departments with over 50
lawyers, only 22% increased their total spend in 2017, while 59% decreased the budget.
At the other end of the spectrum in one-lawyer departments, 77% increased total spend
and only 12% decreased spend.
The same pattern holds true for planned outside counsel spending in 2018. While in
aggregate 40% of departments say they plan increases and 33% plan decreases, the
results by department size tell a more nuanced story. In one-lawyer departments, 70%
plan to increase outside spend in 2018, and 5% plan a decrease. In 2 to 10 lawyer
departments, 44% plan to spend more on outside counsel, and 25% plan a decrease;
and, in 11 to 50 lawyer departments, 36% plan an increase and 39% plan a decrease.
In departments with more than 50 lawyers, only 22% plan to increase outside counsel
spend while 53% plan a decrease.
Why are so many more large law departments able to hold the line on spending
increases? Larger departments have more lawyers to cover workloads, can afford
more sophisticated technology, are more likely to have outsourcing capabilities, likely
wield more leverage over law firms, and more often than not employ an LDO and staff

SUMMARY & ANALYSIS
© 2017 Altman Weil, Inc. 2017 Chief Legal Officer Survey - v
to manage processes and metrics. All of these tools equip larger departments to work
more efficiently and to control inside and outside costs more effectively. Smaller
departments are simply less flexible and have fewer tools at their disposal.
Negotiating Power
Virtually all law departments receive discounts on standard law firm rates that range
from an average of 1% to 15% or more, with a median of 10% – a number that holds
true across all department sizes. But what obstacles, if any, do departments face in
getting greater discounts?
The top reason, given by 55% of CLOs, is that they believe they do not have enough
buying power to negotiate more effectively. The next most frequent response, from
51% of departments, is that law firms resist giving greater discounts. An additional 30%
of departments say they don't push harder for discounts because they don't want to
damage good relationships with their outside counsel.
To get a better idea of how much negotiating power law departments really might have,
we asked what percentage of their outside fees last year were for work that could have
been done by many different law firms. The median response across all department
sizes is 41% to 50% of their outside spend. We also asked what percentage of fees
went to work that was not price sensitive, and received a median response of 21% to
30%.
A number of factors are in play here. It seems that law departments do, in fact, have
considerable negotiating power which they may underestimate. However, there are
many costs and considerations in retaining law firms that go beyond pure dollars and
cents. There is value in continuity, institutional knowledge and relationships that may
equal or surpass a few added percentage points on the discount scale. This is an area
where Chief Legal Officers need to thoughtfully assess which law firms merit their
loyalty, and when there may be strategic gain in negotiating more aggressively or
looking for alternative providers.
Outside Counsel Management
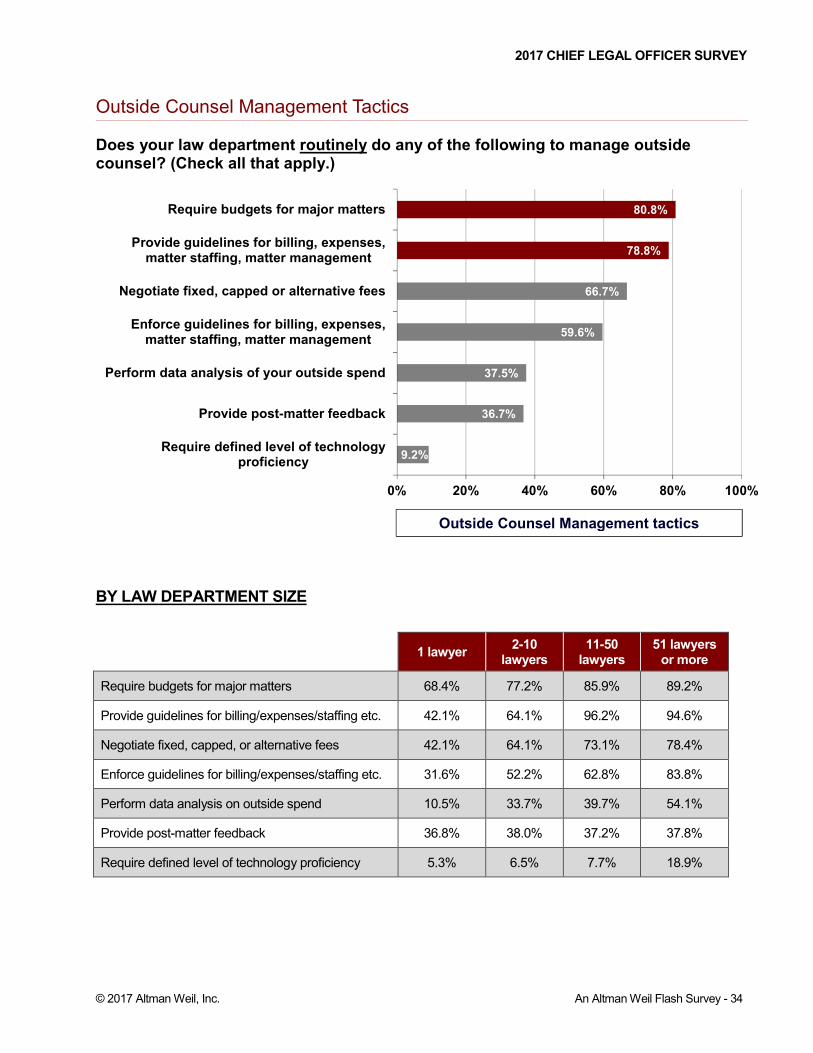
We asked law departments what they routinely do to manage outside counsel. Eighty-
one percent say they require budgets for major matters; 79% provide guidelines for
billing, expenses, matter staffing and matter management; and, 67% negotiate fixed,
capped or alternative fees.
SUMMARY & ANALYSIS
© 2017 Altman Weil, Inc. 2017 Chief Legal Officer Survey - vi
It's noteworthy that although 79% of departments indicate they provide standard billing
and management guidelines to their law firms, only 60% say they routinely enforce the
guidelines provided. When we followed up with a question about which outside counsel
management techniques are most effective, the number one response was to enforce
these guidelines.
To set standards and then fail to enforce them is an obvious and unnecessary omission
– and one that should not stand in any law department that is serious about effectively
managing law firms.
In considering what changes and improvements they would most like to see from
outside counsel, CLOs in departments of all sizes prioritize costs over process. Their
top three choices all focus on containing costs, including: greater overall cost
reductions, identified by 51% of all respondents; improved budget forecasting, chosen
by 46% of CLOs; and, non-hourly pricing structures, chosen by 39% of CLOs. Their
second tier of priorities address how their work is done, including: modification of work
to match legal risk levels (31%), more efficient project management (30%), and more
efficient project staffing (29%).
This preference for cost control over process efficiency is borne out in another question.
Forty-five percent of CLOs say they have shifted a portfolio of work worth $50,000 or
more from one law firm to another in the last year in order to get lower fees. In contrast,
only 28% have made a similar change to achieve greater matter management
efficiency. It is easier for law departments to demand cost reductions from providers
and let them determine how to achieve lower fees.
Understanding Law Department Challenges
In a final question, we asked CLOs to rate three key groups of stakeholders on their
knowledge and understanding of the challenges of leading a law department. Using a
scale of 0 to 10 in which 0 equals 'no understanding, 5 is 'intermediate understanding,'
and 10 equals 'sophisticated understanding,' law department leaders rate non-law-firm
vendors at an average of 4.2, their organization's executives at 5.7, and their outside
counsel at 6.1.
It's striking that neither category of service providers – vendors or law firms – are
perceived to have anything approaching a sophisticated understanding of their
customers and clients, and surely that is a source of dissatisfaction for Chief Legal
Officers. While it should not be the job of the CLO to proactively educate providers on
SUMMARY & ANALYSIS
© 2017 Altman Weil, Inc. 2017 Chief Legal Officer Survey - vii
their department’s needs and priorities, such an understanding is another factor law
departments can and should consider in making future purchasing decisions.
The 2017 Survey
The Chief Legal Officer Survey has been conducted and published annually by Altman
Weil since 2000, most recently in September and October 2017. Two hundred and
eighty responses were received for the 2017 survey, 21% of the 1,332 law departments
invited to participate. Demographic and budgetary data on responding law departments
is included in the survey report.
The survey report follows and is online at www.altmanweil.com/CLO2017.

SUMMARY & ANALYSIS
© 2017 Altman Weil, Inc. 2017 Chief Legal Officer Survey - viii
Survey Methodology
The large majority of survey questions were posed in a multiple-choice format and
responses are reported as received. Question text is transcribed in the following report
exactly as it appeared in the survey. Where there were special instructions, rating
scales, or supplemental definitions, that information is also included.
Free text data submitted by respondents was reviewed and, in a handful of cases,
edited to correct obvious typographical errors. For numeric entries, we made a small
number of corrections where the intended response was clear. In a few instances we
omitted a data point as impossible to derive from the information provided.
About Altman Weil
Founded in 1970, Altman Weil, Inc. is dedicated exclusively to the legal profession. It
provides management consulting services to law firms, law departments and legal
vendors worldwide. The firm is independently owned by its professional consultants,
who have backgrounds in law, industry, finance, marketing, administration and
government.
More information on Altman Weil can be found at www.altmanweil.com.

2017 CHIEF LEGAL OFFICER SURVEY
© 2017 Altman Weil, Inc. An Altman Weil Flash Survey - 1
The Chief Legal Officer Position
Please estimate how your time was allocated over the last 12 months.
(Responses must equal 100%.)
Other corporate management responsibilities defined for this question as: “Compliance, HR, Security, etc.”
OTHER (representative comments)
Risk management
Board activities
Corporate Secretary
Government affairs / legislative advocacy
Professional activities / development
Community activity
35.0%
23.6%
19.6%
18.3%
0%
100%
Other
Managing the Law Department
Other corporate management responsibilities
Practicing law
Advising executives / Corporate strategy
Legend, top to bottom, corresponds to percentages top to bottom
2017 CHIEF LEGAL OFFICER SURVEY
© 2017 Altman Weil, Inc. An Altman Weil Flash Survey - 2
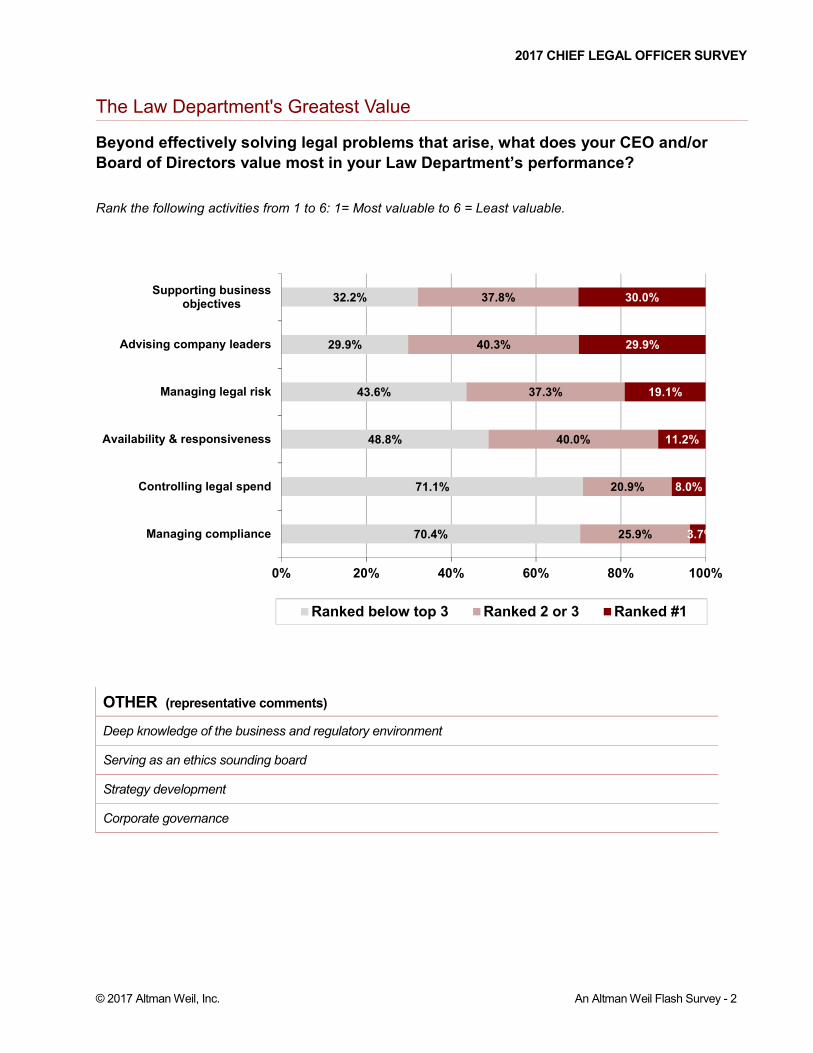
The Law Department's Greatest Value
Beyond effectively solving legal problems that arise, what does your CEO and/or
Board of Directors value most in your Law Department’s performance?
Rank the following activities from 1 to 6: 1= Most valuable to 6 = Least valuable.
OTHER (representative comments)
Deep knowledge of the business and regulatory environment
Serving as an ethics sounding board
Strategy development
Corporate governance
70.4%
71.1%
48.8%
43.6%
29.9%
32.2%
25.9%
20.9%
40.0%
37.3%
40.3%
37.8%
3.7%
8.0%
11.2%
19.1%
29.9%
30.0%
0% 20% 40% 60% 80% 100%
Managing compliance
Controlling legal spend
Availability & responsiveness
Managing legal risk
Advising company leaders
Supporting businessobjectives
Ranked below top 3 Ranked 2 or 3 Ranked #1

2017 CHIEF LEGAL OFFICER SURVEY
© 2017 Altman Weil, Inc. An Altman Weil Flash Survey - 3
Law Department Workforce – Next 12 Months
Within the next 12 months do you plan to increase or decrease your Law Department
workforce?
TREND: Increase or decrease in-house lawyer workforce in the next 12 months
3.9%
5.7%
7.5%
8.4%
76.5%
67.4%
76.0%
51.6%
17.0%
23.5%
12.6%
37.5%
0% 20% 40% 60% 80% 100%
Support staff
Paralegals
Contract lawyers
In-house lawyers
Not sure Decrease No change Increase
41.4%
38.1% 37.7%
42.0% 42.6%
37.9% 37.2% 37.5%
9.2%5.7%
7.4%5.4%
11.5%
6.0%
8.5% 8.4%
0%
10%
20%
30%
40%
50%
2010 2011 2012 2013 2014 2015 2016 2017
Increase Decrease
Trend data compiled from 2010 - 2017 Chief Legal Officer Surveys.
4.5 times as many
departments plan
increases to
in-house lawyer
staff, as plan
decreases in the
next 12 months.
OUTLOOK 2018
2017 CHIEF LEGAL OFFICER SURVEY
© 2017 Altman Weil, Inc. An Altman Weil Flash Survey - 4
Reasons for In-House Hiring
Asked of the 37.5% of departments that plan to add in-house lawyers in the next 12 months:
If you plan to hire one or more in-house lawyer in the next 12 months, what are the
primary reasons? (Check all that apply.)
2.9%
14.5%
14.5%
29.0%
36.2%
48.6%
68.1%
0% 20% 40% 60% 80%
To take advantage of our superiorinstitutional knowledge
To handle new responsibilities of thedepartment
To expand our workforcegeographically
To handle a new area of legal expertise
To save money on outside counsel
To fill open position/s
To cover increased overall workload
OTHER (representative responses)
Succession planning
To support a growing line of business
FOLLOW-UP QUESTION…
OUTLOOK 2018

2017 CHIEF LEGAL OFFICER SURVEY
© 2017 Altman Weil, Inc. An Altman Weil Flash Survey - 5
Law Department Operations Managers Do you have an administrator or other business manager who manages law
department operations?
BY DEPARTMENT SIZE: Department has a Law Department Administrator
26.8%
10.3%59.3%
3.7%
Yes, full-time
Yes, part-time
No
No, but we plan to in the next 12 months
Yes
Full-Time Yes
Part-Time No Plan to
1 lawyer 0.0% 10.0% 90.0% 0.0%
2-5 lawyers 9.1% 5.5% 81.8% 3.6%
6-10 lawyers 9.8% 4.9% 80.5% 4.9%
11-50 lawyers 33.3% 13.6% 49.4% 3.7%
51-100 lawyers 55.0% 25.0% 20.0% 0.0%
100+ lawyers 70.6% 5.9% 11.8% 11.8%
2017 CHIEF LEGAL OFFICER SURVEY
© 2017 Altman Weil, Inc. An Altman Weil Flash Survey - 6
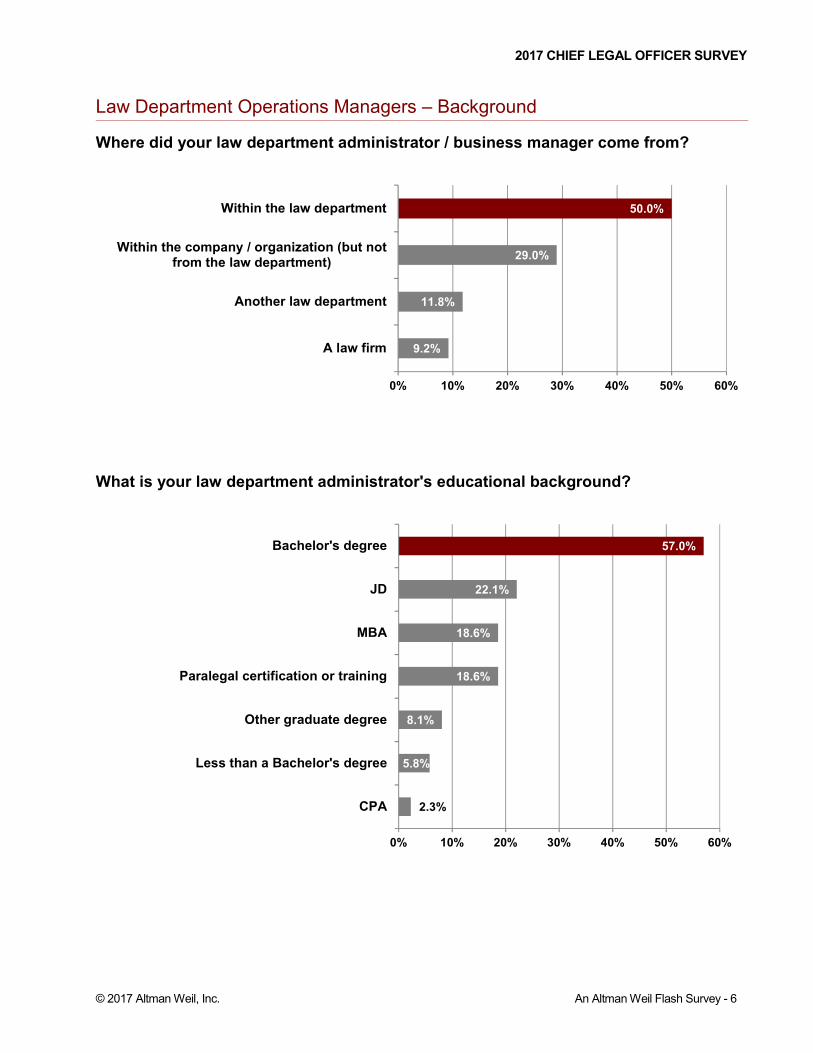
Law Department Operations Managers – Background
Where did your law department administrator / business manager come from?
What is your law department administrator's educational background?
9.2%
11.8%
29.0%
50.0%
0% 10% 20% 30% 40% 50% 60%
A law firm
Another law department
Within the company / organization (but notfrom the law department)
Within the law department
2.3%
5.8%
8.1%
18.6%
18.6%
22.1%
57.0%
0% 10% 20% 30% 40% 50% 60%
CPA
Less than a Bachelor's degree
Other graduate degree
Paralegal certification or training
MBA
JD
Bachelor's degree

2017 CHIEF LEGAL OFFICER SURVEY
© 2017 Altman Weil, Inc. An Altman Weil Flash Survey - 7
Law Department Operations Managers – Time Allocation
Please estimate the percentage of time your department administrator / business
manager spends on each of the following functions.
OTHER (representative responses)
Practicing law
Records management
Outside counsel relationship management
Initiatives to drive down costs, increase efficiency and client satisfaction
Strategy and planning
Paralegal responsibilities
Special projects
24.3%
20.1%
16.9%
15.1%
11.7%
11.9%
0%
100%
Other
People management
Technology management
Outside Counsel spend tracking and analysis
Financial management
Day-to-day operations
Legend, top to bottom, corresponds to percentages top to bottom
2017 CHIEF LEGAL OFFICER SURVEY
© 2017 Altman Weil, Inc. An Altman Weil Flash Survey - 8
Law Department Management – Efficiency
In the last 12 months, have you done any of the following to increase your law
department’s efficiency in its delivery of legal services? (Check all that apply.)
6.1%
9.5%
19.1%
20.2%
24.1%
27.9%
38.6%
44.7%
44.7%
45.0%
57.6%
0% 10% 20% 30% 40% 50% 60%
None
Hired a Law Department Operations Manager
Outsourcing to non-law-firm vendors
Project staffing with contract / temporary lawyers
Project management methods
Knowledge management efforts
Collection and analysis of management metrics
Redesign workflow processes
Internal restructuring / reorganization of resources
Greater use of paralegals and otherparaprofessionals
Greater use of technology tools
Efficiency tactics

2017 CHIEF LEGAL OFFICER SURVEY
© 2017 Altman Weil, Inc. An Altman Weil Flash Survey - 9
Efficiency Tactics – By Department Size
In the last 12 months, have you done any of the following to increase your law
department’s efficiency in its delivery of legal services? (Check all that apply.)
1 lawyer 2-10
lawyers 11-50
lawyers 51 lawyers
or more
Greater use of technology tools 55.0% 50.5% 62.0% 81.1%
Greater use of paralegals / paraprofessionals 40.0% 48.4% 43.0% 37.8%
Restructure / reorganize internal resources 20.0% 35.8% 50.6% 67.6%
Redesign workflow processes 40.0% 36.8% 50.6% 46.0%
Collection and analysis of management metrics 25.0% 30.5% 46.8% 56.8%
Knowledge management efforts 30.0% 19.0% 24.1% 46.0%
Project management methods 15.0% 16.8% 31.7% 27.0%
Project staffing with contract / temporary lawyers 20.0% 14.7% 22.8% 27.0%
Outsource to non-law-firm vendors 10.0% 14.7% 16.5% 37.8%
Hire a Law Department Operations Manager 0.00% 0.00% 12.7% 18.9%

2017 CHIEF LEGAL OFFICER SURVEY
© 2017 Altman Weil, Inc. An Altman Weil Flash Survey - 10
Efficiency Tactics – Resulting in Significant Improvement
For each of the initiatives you’ve undertaken to improve efficiency in the last 12
months, has it resulted in a significant improvement in efficiency of legal service
delivery?
7.0%
9.0%
6.7%
14.0%
54.9%
50.0%
46.8%
48.2%
34.7%
37.5%
33.3%
14.0%
25.6%
26.5%
38.0%
41.0%
48.4%
50.0%
58.7%
62.5%
63.2%
72.0%
72.7%
73.5%
0% 20% 40% 60% 80% 100%
Knowledge management efforts
Collection and analysis of managementmetrics
Project management methods
Redesign workflow processes
Greater use of technology tools
Hired a Law Department OperationsManager
Internal restructuring / reorganizationof resources
Project staffing with contract /temporary lawyers
Greater use of paralegals and otherparaprofessionals
Outsourcing to non-law-firm vendors
No Too soon to tell Yes
2017 CHIEF LEGAL OFFICER SURVEY
© 2017 Altman Weil, Inc. An Altman Weil Flash Survey - 11
Efficiency Tactics – Comparison of Use and Results
This chart combines findings from the two prior questions. Each bar shows the percentage
of law departments using that tactic. Data points on the line show the percentage of those
departments using each tactic that report it has delivered a significant improvement in
performance.
27.9% 38.6% 24.1% 44.7% 57.6% 9.5% 44.7% 20.2% 45.0% 19.1%
38.0%41.0%
48.4% 50.0%
58.7%62.5% 63.2%
72.0% 72.7% 73.5%
Knowledgemanagement
Managementmetrics
Projectmanagement
Redesignworkflow
processes
Technologytools
HiredOperationsManager
Restructure/reorganizeresources
Contract /temporarylawyers
Greater useparalegals /
para-professionals
Outsourcingto
non-law-firmvendors
���� % using tactic � Of those using tactic, % experiencing significant improvement in efficiency
2017 CHIEF LEGAL OFFICER SURVEY
© 2017 Altman Weil, Inc. An Altman Weil Flash Survey - 12
Law Department Management – Cost Control
In the last 12 months, have you done any of the following to control law department
costs? (Check all that apply.)
2.8%
9.5%
11.4%
12.6%
20.1%
26.8%
30.3%
33.5%
33.5%
35.8%
39.8%
50.8%
50.8%
58.3%
63.8%
0% 10% 20% 30% 40% 50% 60% 70%
None
Reduced in-house non-lawyer staff
Instituted a law firm convergence program
Reduced in-house lawyer staff
Outsourced to non-law-firm vendors
Used contract or temporary lawyers
Shifted in-house work from lawyers to paralegalsor other paraprofessionals
Shifted law firm work to lower-priced firms
Modified work done to match legal risk levels
Reduced total amount of work sent to outsidecounsel
Shifted law firm work to in-house lawyer staff
Used alternative or fixed fee arrangements
Required budgets from outside counsel
Improved efficiency of internal procedures
Received price reductions from outside counsel
Cost control tactics

2017 CHIEF LEGAL OFFICER SURVEY
© 2017 Altman Weil, Inc. An Altman Weil Flash Survey - 13
Cost Control Tactics – By Department Size
In the last 12 months, have you done any of the following to control law department costs? (Check all that apply.)
1 lawyer 2-10
lawyers 11-50
lawyers 51 lawyers
or more
Received price reductions from outside counsel 40.0% 60.4% 69.6% 78.4%
Improved efficiency of internal procedures 40.0% 55.2% 67.1% 67.6%
Required budgets from outside counsel 30.0% 52.1% 55.7% 56.8%
Used alternative or fixed fee arrangements 25.0% 40.6% 65.8% 70.3%
Shifted law firm work to in-house lawyers 20.0% 37.5% 40.5% 56.8%
Reduced total work sent to outside counsel 35.0% 34.4% 38.0% 46.0%
Modified work done to match legal risk levels 25.0% 28.1% 43.0% 37.8%
Shifted law firm work to lower-priced firms 15.0% 36.5% 36.7% 32.4%
Shifted in-house work to paralegals 15.0% 31.3% 31.7% 35.1%
Used contract or temporary lawyers 30.0% 15.6% 32.9% 46.0%
Outsourced to non-law-firm vendors 15.0% 12.5% 21.5% 35.1%
Reduced in-house lawyer staff 5.0% 11.5% 16.5% 16.2%
Instituted a law firm convergence program 10.0% 4.2% 17.7% 18.9%
Reduced in-house non-lawyer staff 5.0% 8.3% 10.1% 18.9%

2017 CHIEF LEGAL OFFICER SURVEY
© 2017 Altman Weil, Inc. An Altman Weil Flash Survey - 14
Cost Control Tactics – Resulting in Significant Improvement
For each of the initiatives you’ve undertaken to control costs in the last 12 months, has it resulted in a significant improvement cost control?
8.1%
20.5%
25.0%
12.9%
8.7%
13.1%
49.3%
30.7%
41.4%
36.9%
13.2%
31.9%
22.6%
21.7%
23.3%
15.0%
17.2%
20.2%
13.4%
9.8%
42.6%
48.8%
55.2%
59.5%
61.8%
63.9%
64.5%
69.6%
70.5%
71.9%
78.8%
79.8%
82.9%
84.3%
0% 20% 40% 60% 80% 100%
Improved efficiency of internal procedures
Required budgets from outside counsel
Instituted a law firm convergence program
Modified work done to match legal risk levels
Used contract or temporary lawyers
Shifted in-house work from lawyers to paralegalsor other paraprofessionals
Reduced in-house lawyer staff
Reduced in-house non-lawyer staff
Used alternative or fixed fee arrangements
Received price reductions from outside counsel
Shifted law firm work to in-house lawyer staff
Reduced total amount of work sent to outsidecounsel
Shifted law firm work to lower-priced firms
Outsourced to non-law firm vendors
No Too soon to tell Yes

2017 CHIEF LEGAL OFFICER SURVEY
© 2017 Altman Weil, Inc. An Altman Weil Flash Survey - 15
Cost Control Tactics – Comparison of Use and Results
This chart combines findings from the two prior questions. Each bar shows the percentage
of law departments using that tactic. Data points on the line show the percentage of those
departments using each tactic that report it has delivered a significant improvement in
performance.
58% 51% 11% 34% 27% 30% 13% 10% 51% 64% 40% 36% 34% 20%
43%
49%
55%60%
62%64% 65%
70% 71% 72%
79% 80%83% 84%
Improvedinternal
efficiency
Requireoutsidecounselbudgets
Law firmconver-gence
program
Modifywork
to matchrisk level
Contractor templawyers
Shift workfrom
inhouselawyers
toparalegals
Reduceinhouselawyerstaff
Reduceinhouse
non-lawyerstaff
Alt. orfixedfees
Pricecutsfrom
outsidecounsel
Shift workfrom
law firmsto inhouse
lawyers
Reducework sent
tooutsidecounsel
Shift lawfirm workto lowerpricedfirms
Outsourceto
non-lawfirm
vendors
���� % using tactic � Of those using tactic, % experiencing significant improvement in cost control
2017 CHIEF LEGAL OFFICER SURVEY
© 2017 Altman Weil, Inc. An Altman Weil Flash Survey - 16
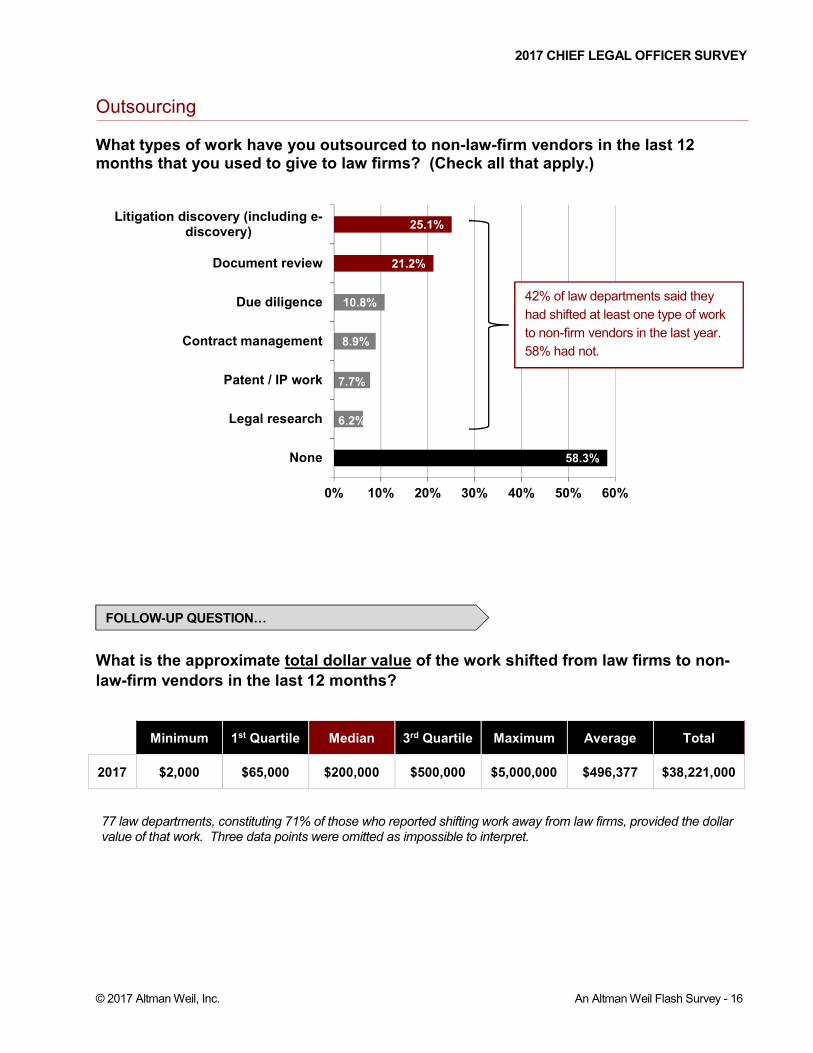
Outsourcing What types of work have you outsourced to non-law-firm vendors in the last 12 months that you used to give to law firms? (Check all that apply.)
What is the approximate total dollar value of the work shifted from law firms to non-
law-firm vendors in the last 12 months?
Minimum 1st Quartile Median 3rd Quartile Maximum Average Total
2017 $2,000 $65,000 $200,000 $500,000 $5,000,000 $496,377 $38,221,000
77 law departments, constituting 71% of those who reported shifting work away from law firms, provided the dollar value of that work. Three data points were omitted as impossible to interpret.
58.3%
6.2%
7.7%
8.9%
10.8%
21.2%
25.1%
0% 10% 20% 30% 40% 50% 60%
None
Legal research
Patent / IP work
Contract management
Due diligence
Document review
Litigation discovery (including e-discovery)
FOLLOW-UP QUESTION…
42% of law departments said they
had shifted at least one type of work
to non-firm vendors in the last year.
58% had not.

2017 CHIEF LEGAL OFFICER SURVEY
© 2017 Altman Weil, Inc. An Altman Weil Flash Survey - 17
Data Analytics – Internal Data Collection
How do you collect data on your law department's outside counsel spending? (Check all that apply.)
BY LAW DEPARTMENT SIZE
6.2%
37.8%
48.6%
57.7%
0% 10% 20% 30% 40% 50% 60%
Other
Excel or other spreadsheets
Accounts payable reports
Matter management software
1 lawyer 2-10
lawyers 11-50
lawyers 51 lawyers
or more
Matter management software 21.1% 37.2% 74.1% 80.6%
Accounts payable reports 63.2% 56.4% 42.0% 47.2%
Excel or other spreadsheets 52.6% 48.9% 32.1% 19.4%
2017 CHIEF LEGAL OFFICER SURVEY
© 2017 Altman Weil, Inc. An Altman Weil Flash Survey - 18
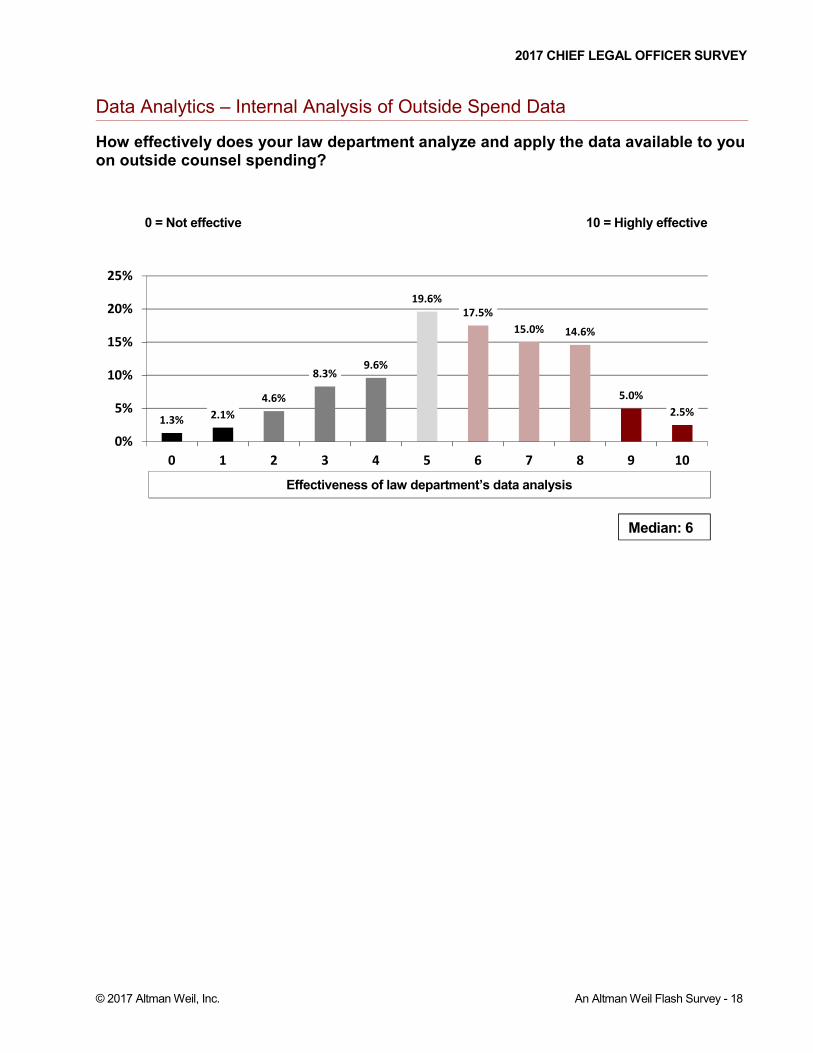
Data Analytics – Internal Analysis of Outside Spend Data
How effectively does your law department analyze and apply the data available to you on outside counsel spending?
1.3%2.1%
4.6%
8.3%9.6%
19.6%
17.5%
15.0% 14.6%
5.0%
2.5%
0%
5%
10%
15%
20%
25%
0 1 2 3 4 5 6 7 8 9 10
0 = Not effective 10 = Highly effective
Effectiveness of law department’s data analysis
Median: 6
2017 CHIEF LEGAL OFFICER SURVEY
© 2017 Altman Weil, Inc. An Altman Weil Flash Survey - 19
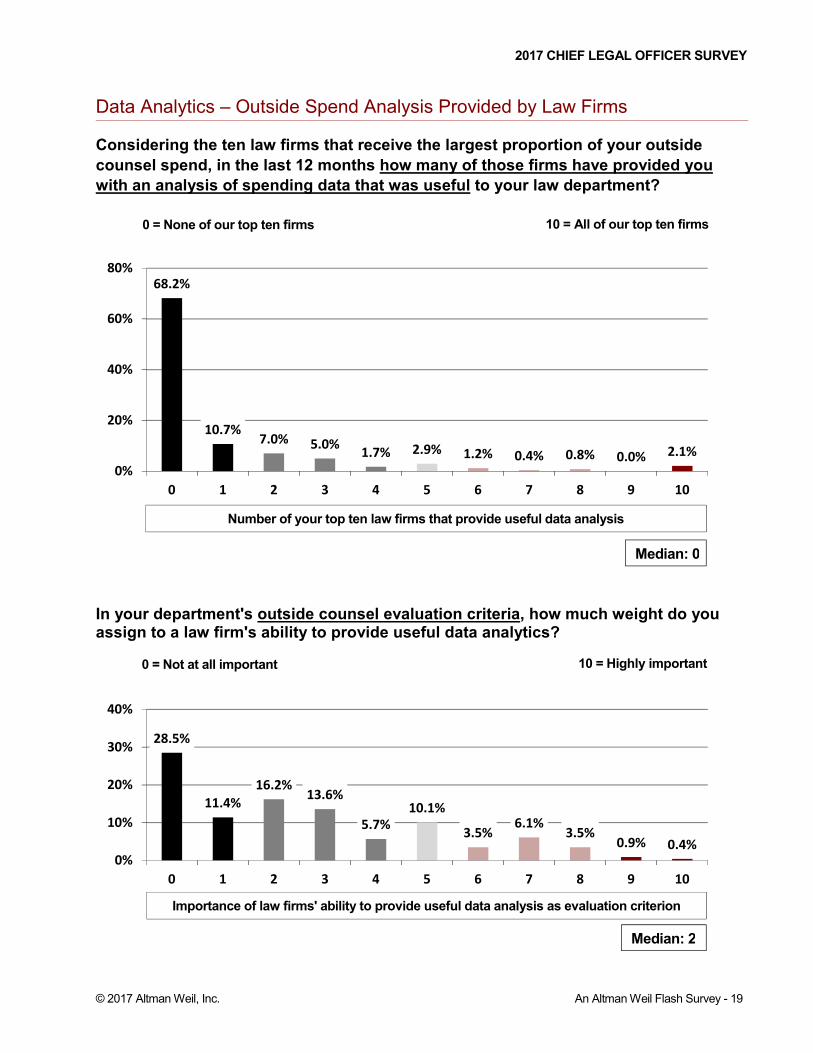
Data Analytics – Outside Spend Analysis Provided by Law Firms Considering the ten law firms that receive the largest proportion of your outside
counsel spend, in the last 12 months how many of those firms have provided you
with an analysis of spending data that was useful to your law department?
In your department's outside counsel evaluation criteria, how much weight do you assign to a law firm's ability to provide useful data analytics?
68.2%
10.7%7.0%
5.0%1.7% 2.9% 1.2% 0.4% 0.8% 0.0%
2.1%
0%
20%
40%
60%
80%
0 1 2 3 4 5 6 7 8 9 10
28.5%
11.4%
16.2%13.6%
5.7%
10.1%
3.5%6.1%
3.5%0.9% 0.4%
0%
10%
20%
30%
40%
0 1 2 3 4 5 6 7 8 9 10
Number of your top ten law firms that provide useful data analysis
0 = None of our top ten firms 10 = All of our top ten firms
Importance of law firms' ability to provide useful data analysis as evaluation criterion
0 = Not at all important 10 = Highly important
Median: 0
Median: 2

2017 CHIEF LEGAL OFFICER SURVEY
© 2017 Altman Weil, Inc. An Altman Weil Flash Survey - 20
Data Security Considering the ten law firms that receive the largest proportion of your outside counsel spend, in the last 12 months how many of those firms have you asked to comply with specific data security measures?
BY DEPARTMENT SIZE: Firms asked to comply with data security measures
61.7%
2.9%5.0% 4.6%
1.7% 1.3% 0.8% 0.8% 0.4% 0.0%
20.8%
0%
20%
40%
60%
80%
0 1 2 3 4 5 6 7 8 9 10
Number of your top ten law firms asked to comply with data security measures
0 = None of our top ten firms 10 = All of our top ten firms
MEDIAN AVERAGE
1 lawyer 0 0.3
2-5 lawyers 0 1.6
6-10 lawyers 0 1.4
11-50 lawyers 0 3.0
51-100 lawyers 0 4.3
100+ lawyers 10 7.5
All departments 0 2.6

2017 CHIEF LEGAL OFFICER SURVEY
© 2017 Altman Weil, Inc. An Altman Weil Flash Survey - 21
Law Department Budget Allocation 2017
Please estimate the percentage of your total 2017 Law Department budget (internal and external legal spend) that each of the following components comprise. (Responses must equal 100%.)
Definitions:
Internal expenditures: e.g., Department compensation and benefits; contract lawyers, facilities, technology
and other operating costs
Outside Counsel: Total expenditures to outside law firms
Non-Law-Firm Vendor: Expenditures for legal matters, e.g., e-discovery, document review, due diligence,
legal research, etc.
TREND – Law Department budget allocation
45.6%
49.3%
5.2%
Internal expenditures
Outside Counsel
Non-law firm vendors
Trend data compiled from the 2013 - 2017 Chief Legal Officer Surveys.
Internal Outside Counsel
Non-firm vendor
2013 44.4% 49.6% 6.0%
2014 42.6% 50.3% 7.1%
2015 41.4% 52.4% 6.1%
2016 44.4% 49.4% 6.2%
2017 45.6% 49.3% 5.2%
2017 CHIEF LEGAL OFFICER SURVEY
© 2017 Altman Weil, Inc. An Altman Weil Flash Survey - 22
Law Department Budget Changes: 2016 to 2017 Please estimate the percentage increase or decrease in your Law Department budget from 2016 to 2017.
6.6%
10.8%
8.5%
12.2%
7.0%
21.3%
7.5%
17.8%
10.3%
19.0%
68.0%
26.8%
22.0%
28.4%
13.0%
13.2%
41.6%
6.6%
8.9%
8.9%
9.5%
4.0%
10.3%
5.6%
0% 20% 40% 60% 80% 100%
Total law department budget
Vendor budget
Outside counsel budget
Internal budget
���� Down 1% to 5% ���� No change ���� Up 1% to 5%
���� Down 6% to 10% ���� Up 6% to 10%
���� Down over 10% � Up over 10%
Decrease Increase

2017 CHIEF LEGAL OFFICER SURVEY
© 2017 Altman Weil, Inc. An Altman Weil Flash Survey - 23
Law Department Budget Changes 2016 to 2017: By Department Size
IN-HOUSE BUDGET
OUTSIDE COUNSEL BUDGET
15.7%
28.0%
36.4%
23.5%
28.1%
16.0%
18.2%
76.5%
56.2%
56.0%
45.5%
0% 20% 40% 60% 80% 100%
1 lawyer
2-10 lawyers
11-50 lawyers
51+ lawyers
Decrease No change Increase
11.8%
34.8%
48.6%
54.5%
29.4%
32.6%
20.3%
24.2%
58.8%
32.6%
31.1%
21.2%
0% 20% 40% 60% 80% 100%
1 lawyer
2-10 lawyers
11-50 lawyers
51+ lawyers
Decrease No change Increase
2017 CHIEF LEGAL OFFICER SURVEY
© 2017 Altman Weil, Inc. An Altman Weil Flash Survey - 24
Law Department Budget Changes 2016 to 2017: By Department Size
VENDOR BUDGET
TOTAL BUDGET
10.5%
14.9%
16.7%
58.8%
76.7%
61.2%
63.3%
41.2%
12.8%
23.9%
20.0%
0% 20% 40% 60% 80% 100%
1 lawyer
2-10 lawyers
11-50 lawyers
51+ lawyers
Decrease No change Increase
11.8%
28.9%
41.7%
59.4%
11.8%
25.6%
12.5%
18.8%
76.5%
45.6%
45.8%
21.9%
0% 20% 40% 60% 80% 100%
1 lawyer
2-10 lawyers
11-50 lawyers
51+ lawyers
Decrease No change Increase

2017 CHIEF LEGAL OFFICER SURVEY
© 2017 Altman Weil, Inc. An Altman Weil Flash Survey - 25
TREND: Change in Law Department Budget
Charts show what percentage of departments increased their budget, and what percentage
decreased their budget in each category. The balance of departments, to total 100%, made
no change in the budget category and is omitted in these charts.
IN-HOUSE BUDGET
OUTSIDE COUNSEL BUDGET
56.2%
46.1%
56.6%54.4%
50.9% 50.1%
56.1%
17.1%
27.6%
17.3%
24.8% 25.2%27.4%
22.0%
0%
10%
20%
30%
40%
50%
60%
70%
2011 2012 2013 2014 2015 2016 2017
Increase Decrease
45.8%
34.2%
28.9%26.1%
31.6% 31.6% 32.4%25.4%
39.0%
47.0% 48.0%
43.5%40.9% 40.8%
0%
10%
20%
30%
40%
50%
60%
70%
2011 2012 2013 2014 2015 2016 2017
Increase Decrease
Trend data compiled from 2011 - 2017 Chief Legal Officer Surveys.
More than twice as
many departments
increased in-house
budgets this year,
as those that made
cuts – continuing a
multi-year trend.
In 2017 more law
departments
decreased outside
counsel spending
than increased
that part of their
budget – but the
differential has
been shrinking
since 2015.

2017 CHIEF LEGAL OFFICER SURVEY
© 2017 Altman Weil, Inc. An Altman Weil Flash Survey - 26
TREND: Change in Law Department Budget Charts show what percentage of departments increased their budget, and what percentage
decreased their budget in each category. The balance of departments, to total 100%, made
no change in the budget category and is omitted in these charts.
VENDOR BUDGET
TOTAL BUDGET
21.9% 20.9%
15.5% 16.3% 16.3%20.0%
12.8% 13.9% 14.8% 15.6% 15.4%12.0%
0%
10%
20%
30%
40%
50%
60%
70%
2012 2013 2014 2015 2016 2017
Increase Decrease
55.8%
46.3%
36.8%
41.7% 41.8%
45.9% 44.5%
25.9%
34.1%36.9%
40.4% 41.6%
36.8% 36.4%
0%
10%
20%
30%
40%
50%
60%
70%
2011 2012 2013 2014 2015 2016 2017
Increase Decrease
Trend data compiled from 2011 - 2017 Chief Legal Officer Surveys.
This year, for the
first time since
2013, significantly
more law
departments made
increases in their
vendor budgets,
compared to those
making decreases.
For the second
year in a row, more
departments report
an increase in their
overall budget,
compared to those
reporting
decreases.
2017 CHIEF LEGAL OFFICER SURVEY
© 2017 Altman Weil, Inc. An Altman Weil Flash Survey - 27
Outside Counsel Spend – Planned for 2018
In your fiscal year 2018 budget, have you/will you increase or decrease your overall spend on outside counsel?
5.5% 8.5% 18.5% 28.0% 22.1% 9.6% 7.8%
0% 20% 40% 60% 80% 100%
Outside Counsel spend 2018
���� Decrease 1% to 5% ���� No change ���� Increase 1% to 5%
���� Decrease 6% to 10% ���� Increase 6% to 10%
���� Decrease over 10% � Increase over 10%
32.5% plan to decrease 39.5% plan to increase
OUTLOOK 2018

2017 CHIEF LEGAL OFFICER SURVEY
© 2017 Altman Weil, Inc. An Altman Weil Flash Survey - 28
Outside Counsel Spend – Planned for 2018
BY DEPARTMENT SIZE: Planned change in outside counsel spend in 2018
BY ORGANIZATION REVENUE: Planned change in outside counsel spend in 2018
5.0%
25.0%
38.5%
52.8%
25.0%
31.3%
25.6%
25.0%
70.0%
43.8%
35.9%
22.2%
0% 20% 40% 60% 80% 100%
1 lawyer
2-10 lawyers
11-50 lawyers
51+ lawyers
Decrease No change Increase
20.4%
23.6%
38.6%
50.0%
76.5%
26.5%
31.5%
27.3%
23.1%
11.8%
53.1%
44.9%
34.1%
26.9%
11.8%
0% 20% 40% 60% 80% 100%
Under $1B
$1B to $5B
$5.1B to 10B
$10.1 B to $20B
Over $20B
Decrease No change Increase
OUTLOOK 2018

2017 CHIEF LEGAL OFFICER SURVEY
© 2017 Altman Weil, Inc. An Altman Weil Flash Survey - 29
TREND: Plan to increase / decrease Outside Counsel spend in the following year This chart shows what percentage of departments planned to increase their outside counsel
spend in the next year, and what percentage planned to decrease outside counsel spend.
The balance of departments, to total 100%, planned no change and is omitted in this chart.
24.4%
15.8%
19.6%
16.3%
13.9%
17.6%
7.9%
12.6% 12.2%
14.5%13.8%
15.0%14.2%
19.8%
21.8%
39.5%
19.1%17.3%
19.6% 19.8%
17.6%
15.9%
26.2%
40.4%
29.1%
34.1%
28.6%
29.1%
26.2%
39.9%
35.2%
32.5%
0%
5%
10%
15%
20%
25%
30%
35%
40%
45%
2002 2003 2004 2005 2006 2007 2008 2009 2010 2011 2012 2013 2014 2015 2016 2017
Increase Decrease
Trend data compiled from 2002 - 2017 Chief Legal Officer Surveys.
For the first time
since 2007,
more law
departments
plan to increase
outside counsel
spend in the
coming year,
compared to
those planning
to decrease
outside counsel
spend.

2017 CHIEF LEGAL OFFICER SURVEY
© 2017 Altman Weil, Inc. An Altman Weil Flash Survey - 30
Reallocation of Outside Counsel Spend
Asked of the 32.5% of departments that plan to decrease outside counsel spend in 2018:
If you plan to decrease your spend on outside counsel in the next 12 months, how
will you cover the work? (Check all that apply.)
6.8%
19.3%
27.3%
45.5%
45.5%
72.7%
0% 20% 40% 60% 80%
Contract lawyers
Non-law-firm vendors
In-house non-lawyer staff
Lower-cost law firms
Less work overall
In-house lawyer staff
Less work overall – "due to changing business priorities, preventative law efforts, higher risk tolerance, etc." Non-law-firm vendors – “e.g., for e-discovery, document review, due diligence, legal research, etc.”
OTHER (representative responses)
Use of technology
FOLLOW-UP QUESTION…
OUTLOOK 2018

2017 CHIEF LEGAL OFFICER SURVEY
© 2017 Altman Weil, Inc. An Altman Weil Flash Survey - 31
Discounts on Outside Counsel Rates If you received discounts on standard rates from outside counsel in the last 12
months, what was the average price reduction received?
TREND: Average Price Reductions from Outside Counsel by year
12.2%
59.7%
21.4%
6.6%
0%
10%
20%
30%
40%
50%
60%
70%
1% to 5% 6% to 10% 11% to 15% Over 15%
7%
61%
24%
8%8%
58%
24%
10%12%
60%
21%
7%
0%
10%
20%
30%
40%
50%
60%
70%
1% to 5% 6% to 10% 11% to 15% Over 15%
2015
2016
2017
Median: 10%

2017 CHIEF LEGAL OFFICER SURVEY
© 2017 Altman Weil, Inc. An Altman Weil Flash Survey - 32
Outside Counsel Rates – Obstacles to Greater Discounts What obstacles, if any, do you face in getting greater discounts from outside counsel? (Check all that apply.)
BY LAW DEPARTMENT SIZE
11.5%
9.8%
12.3%
13.1%
17.2%
30.3%
50.8%
54.9%
0% 10% 20% 30% 40% 50% 60%
None
Too hard to enforce
Not enough internal pressure to pursuegreater discounts
Not fair to push too hard
Not enough time/resources to do more
Don't want to damage goodrelationships
Law firms resist
Not enough buying power to negotiatemore effectively
1 lawyer 2-10
lawyers 11-50
lawyers 51 lawyers
or more
Not enough buying power to negotiate effectively 52.6% 61.1% 61.5% 33.3%
Law firms resist 31.6% 51.6% 50.0% 66.7%
Don't want to damage good relationships 47.4% 28.4% 28.2% 33.3%
Not enough time/resources to do more 21.1% 20.0% 12.8% 19.4%
Not fair to push too hard 10.5% 12.6% 15.4% 11.1%
Not enough internal pressure to pursue 26.3% 11.6% 6.4% 13.9%
Too hard to enforce 5.3% 8.4% 15.4% 2.8%
None 10.5% 8.4% 11.5% 13.9%

2017 CHIEF LEGAL OFFICER SURVEY
© 2017 Altman Weil, Inc. An Altman Weil Flash Survey - 33
Outside Counsel Rates – Negotiating Power Approximately what percentage of your outside counsel fees last year was for work
that could have been done by many different law firms (i.e., work where you had
significant negotiating power over fees)?
Approximately what percentage of your outside counsel fees last year was for work
that was not price sensitive (i.e., work so important that costs were not an issue)?
0.4%2.1%
5.0%7.0%
13.2%10.7%
12.8%
48.8%
0%
10%
20%
30%
40%
50%
0% 1%-5% 6%-10% 11%-20% 21%-30% 31%-40% 41%-50% Over 50%
11.6%
7.0%
14.1%16.1%
17.4%
11.2% 10.7%12.0%
0%
10%
20%
30%
40%
50%
0% 1%-5% 6%-10% 11%-20% 21%-30% 31%-40% 41%-50% Over 50%
Median: 21% - 30%
Median: 41% - 50%
2017 CHIEF LEGAL OFFICER SURVEY
© 2017 Altman Weil, Inc. An Altman Weil Flash Survey - 34
Outside Counsel Management Tactics
Does your law department routinely do any of the following to manage outside counsel? (Check all that apply.)
BY LAW DEPARTMENT SIZE
1 lawyer 2-10
lawyers 11-50
lawyers 51 lawyers
or more
Require budgets for major matters 68.4% 77.2% 85.9% 89.2%
Provide guidelines for billing/expenses/staffing etc. 42.1% 64.1% 96.2% 94.6%
Negotiate fixed, capped, or alternative fees 42.1% 64.1% 73.1% 78.4%
Enforce guidelines for billing/expenses/staffing etc. 31.6% 52.2% 62.8% 83.8%
Perform data analysis on outside spend 10.5% 33.7% 39.7% 54.1%
Provide post-matter feedback 36.8% 38.0% 37.2% 37.8%
Require defined level of technology proficiency 5.3% 6.5% 7.7% 18.9%
9.2%
36.7%
37.5%
59.6%
66.7%
78.8%
80.8%
0% 20% 40% 60% 80% 100%
Require defined level of technologyproficiency
Provide post-matter feedback
Perform data analysis of your outside spend
Enforce guidelines for billing, expenses,matter staffing, matter management
Negotiate fixed, capped or alternative fees
Provide guidelines for billing, expenses,matter staffing, matter management
Require budgets for major matters
Outside Counsel Management tactics

2017 CHIEF LEGAL OFFICER SURVEY
© 2017 Altman Weil, Inc. An Altman Weil Flash Survey - 35
Outside Counsel Management Tactics – Significant Improvement
For each of the outside counsel management techniques your law department uses,
has it resulted in a significant improvement in outside counsel performance?
31.8%
17.8%
18.4%
22.3%
24.9%
13.3%
15.5%
27.3%
27.8%
26.4%
18.1%
12.7%
12.0%
9.2%
40.9%
54.4%
55.2%
59.6%
62.4%
74.7%
75.4%
0% 20% 40% 60% 80% 100%
Require defined level of technologyproficiency
Perform data analysis of your outsidespend
Provide post-matter feedback
Require budgets for major matters
Provide guidelines for billing,expenses, matter staffing, matter
management
Negotiate fixed, capped or alternativefees
Enforce guidelines for billing,expenses, matter staffing, matter
management
No Too soon to tell Yes
2017 CHIEF LEGAL OFFICER SURVEY
© 2017 Altman Weil, Inc. An Altman Weil Flash Survey - 36
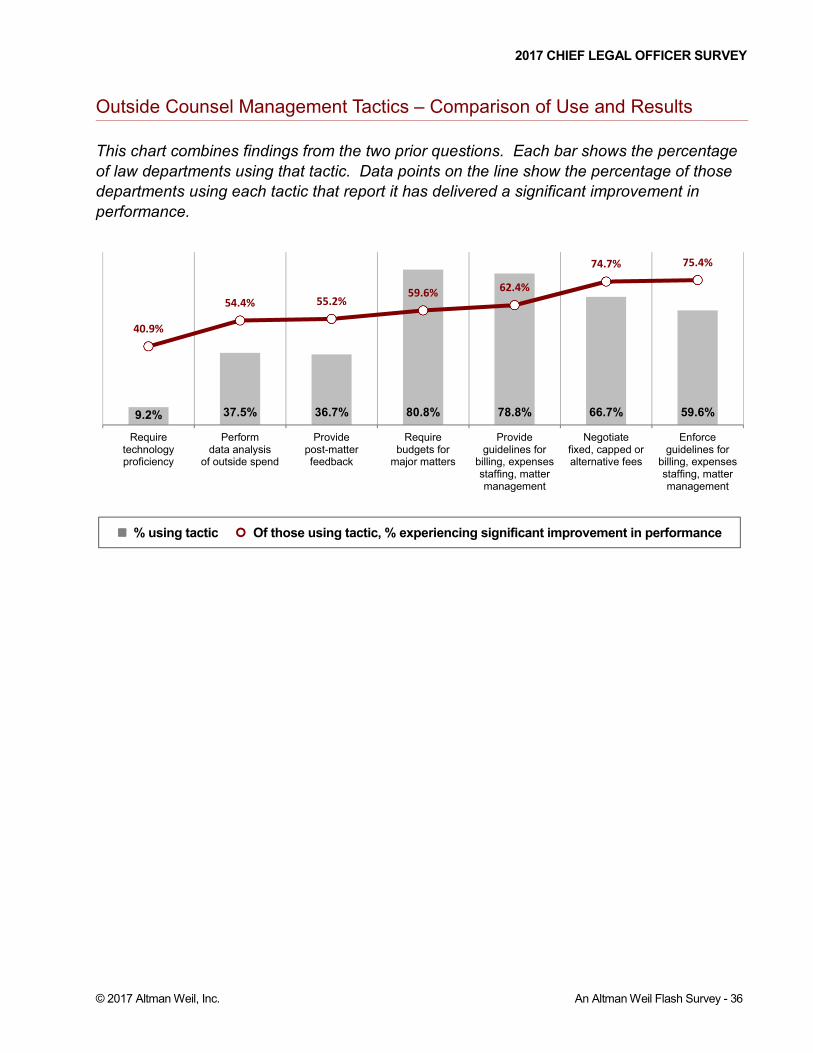
Outside Counsel Management Tactics – Comparison of Use and Results
This chart combines findings from the two prior questions. Each bar shows the percentage
of law departments using that tactic. Data points on the line show the percentage of those
departments using each tactic that report it has delivered a significant improvement in
performance.
9.2% 37.5% 36.7% 80.8% 78.8% 66.7% 59.6%
40.9%
54.4% 55.2%59.6%
62.4%
74.7% 75.4%
Requiretechnologyproficiency
Performdata analysis
of outside spend
Providepost-matterfeedback
Requirebudgets for
major matters
Provideguidelines for
billing, expensesstaffing, mattermanagement
Negotiatefixed, capped oralternative fees
Enforceguidelines for
billing, expensesstaffing, mattermanagement
���� % using tactic � Of those using tactic, % experiencing significant improvement in performance

2017 CHIEF LEGAL OFFICER SURVEY
© 2017 Altman Weil, Inc. An Altman Weil Flash Survey - 37
Law Firm Service Improvements
Of the following service improvements and innovations, please select up to three that
you would most like to see from your outside counsel. (Select up to three.)
12.0%
15.8%
20.1%
25.2%
28.6%
29.9%
31.2%
38.5%
46.2%
51.3%
0% 10% 20% 30% 40% 50% 60%
Technology efficiencies
Preventative law strategies
Improved communication and responsiveness
Greater effort to understand our business
More efficient project staffing
More efficient project management
Modification of work to match our legal risk
Non-hourly based pricing structures
Improved budget forecasting
Greater cost reduction

2017 CHIEF LEGAL OFFICER SURVEY
© 2017 Altman Weil, Inc. An Altman Weil Flash Survey - 38
Reasons for Switching Law Firms In the last 12 months, have you shifted a portfolio of work worth $50,000 or more from
one law firm to another for any of the following reasons? (Check all that apply.)
0.0%
0.0%
6.9%
9.0%
20.0%
22.1%
27.6%
28.3%
42.1%
44.8%
48.3%
0% 10% 20% 30% 40% 50% 60%
Technology sophistication
Data security concerns
Predictable fees
Inability to handle our geographic scope
Size or depth of firm resources
Our key partner(s) changed firms
Conflicts
Managing matter efficiency
Legal expertise
Lower fees
Client service
Reasons for switching law firms
OTHER (representative responses)
Failure to provide practical, actionable, effective advice
Lack of commitment to diversity and inclusion
Consolidation of work to garner leverage and efficiencies

2017 CHIEF LEGAL OFFICER SURVEY
© 2017 Altman Weil, Inc. An Altman Weil Flash Survey - 39
Inside / Outside Relationship – Law Firm Change Efforts
In your opinion, in the current legal market, how serious are law firms about changing
their legal service delivery model to provide greater value to clients (as opposed to
simply cutting costs)?
TREND: Law Firms’ Seriousness About Changing Service Delivery Model
5.6%
11.5%
23.9%
17.1%
12.4%
20.1%
5.1%
3.4%
0.9%0.0% 0.0%
0%
5%
10%
15%
20%
25%
30%
0 1 2 3 4 5 6 7 8 9 10
0 = Not at all serious 10 = Doing everything they can
Trend data compiled from 2013 - 2017 Chief Legal Officer Surveys.
BY YEAR
Median Average
2013 3 3.6
2014 3 3.4
2015 3 3.4
2016 3 3.4
2017 3 3.2
BY DEPARTMENT SIZE
Median Average
1 lawyer 2.5 2.8
2-5 lawyers 3 3.3
6-10 lawyers 3 3.0
11-50 lawyers 3 3.3
50-100 lawyers 3 3.3
100+ lawyers 3 3.4
Median: 3
2017 CHIEF LEGAL OFFICER SURVEY
© 2017 Altman Weil, Inc. An Altman Weil Flash Survey - 40
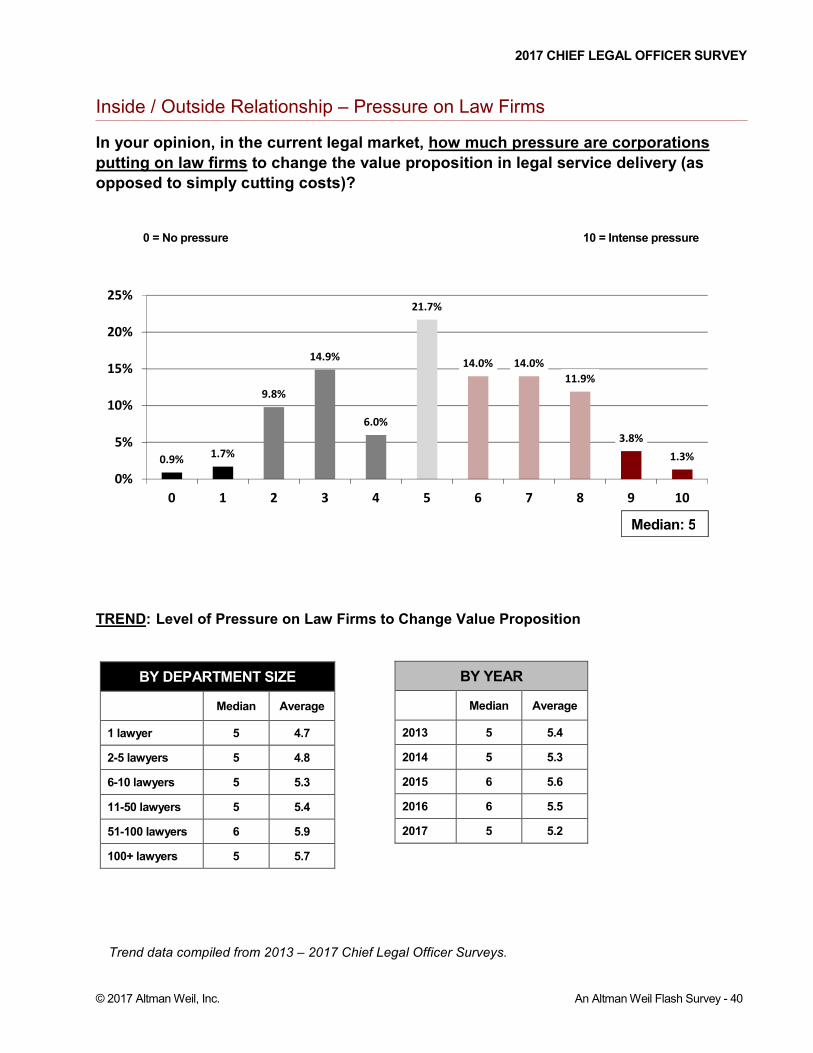
Inside / Outside Relationship – Pressure on Law Firms
In your opinion, in the current legal market, how much pressure are corporations
putting on law firms to change the value proposition in legal service delivery (as
opposed to simply cutting costs)?
TREND: Level of Pressure on Law Firms to Change Value Proposition
0.9%1.7%
9.8%
14.9%
6.0%
21.7%
14.0% 14.0%
11.9%
3.8%
1.3%
0%
5%
10%
15%
20%
25%
0 1 2 3 4 5 6 7 8 9 10
BY YEAR
Median Average
2013 5 5.4
2014 5 5.3
2015 6 5.6
2016 6 5.5
2017 5 5.2
Trend data compiled from 2013 – 2017 Chief Legal Officer Surveys.
BY DEPARTMENT SIZE
Median Average
1 lawyer 5 4.7
2-5 lawyers 5 4.8
6-10 lawyers 5 5.3
11-50 lawyers 5 5.4
51-100 lawyers 6 5.9
100+ lawyers 5 5.7
0 = No pressure 10 = Intense pressure
Median: 5

2017 CHIEF LEGAL OFFICER SURVEY
© 2017 Altman Weil, Inc. An Altman Weil Flash Survey - 41
Law Department Performance – Initiatives Requiring Greater Resources
What is the most important internal task, project or initiative that is going undone
because your law department doesn't have the resources (i.e. funding, people, time,
or corporate support) to address it? (Open-ended question)
We categorized all free-text responses for the following chart.
5.0%
5.0%
1.1%
1.7%
1.7%
1.7%
3.9%
3.9%
3.9%
5.6%
6.1%
6.7%
7.2%
10.6%
11.7%
12.2%
12.2%
0% 5% 10% 15%
None
Other
Intellectual property protection
Departmental restructuring
Knowledge management
Shifting more work in-house
Management metrics
Spend management
Hiring lawyers
Technology improvement
Information governance
Strategy and planning
Compliance
Risk management
Operational efficiency
People development
Contract management
2017 CHIEF LEGAL OFFICER SURVEY
© 2017 Altman Weil, Inc. An Altman Weil Flash Survey - 42
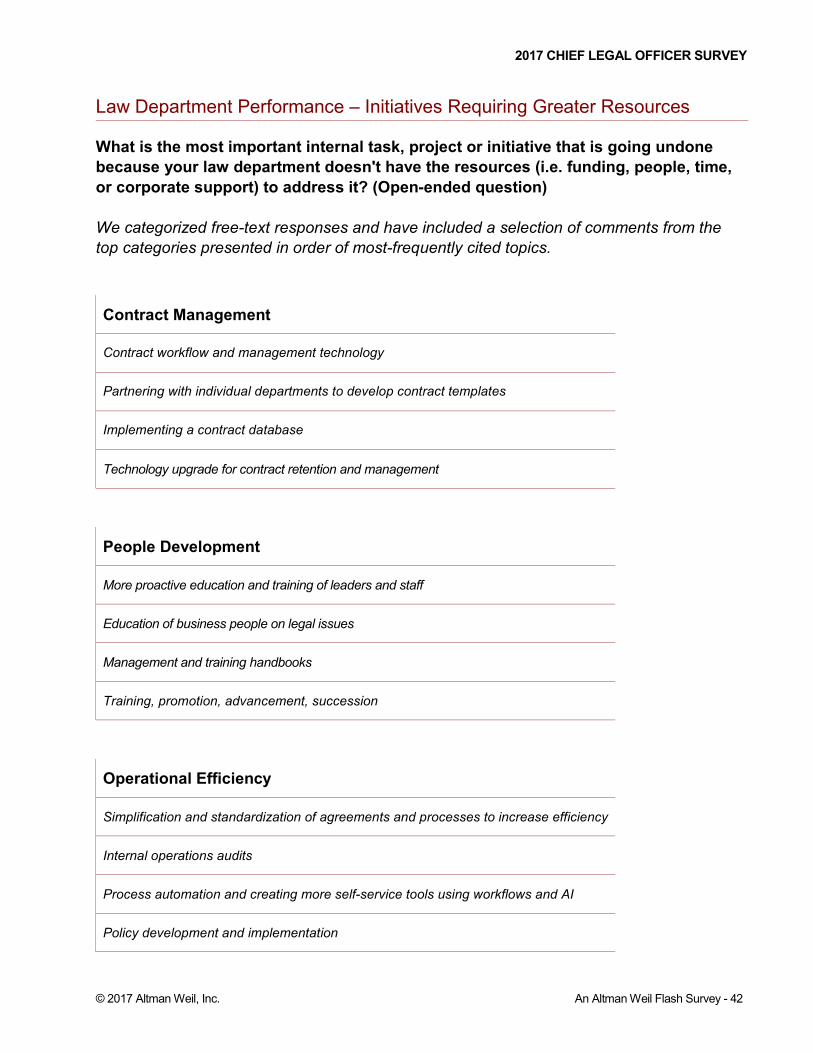
Law Department Performance – Initiatives Requiring Greater Resources
What is the most important internal task, project or initiative that is going undone
because your law department doesn't have the resources (i.e. funding, people, time,
or corporate support) to address it? (Open-ended question)
We categorized free-text responses and have included a selection of comments from the
top categories presented in order of most-frequently cited topics.
Contract Management
Contract workflow and management technology
Partnering with individual departments to develop contract templates
Implementing a contract database
Technology upgrade for contract retention and management
People Development
More proactive education and training of leaders and staff
Education of business people on legal issues
Management and training handbooks
Training, promotion, advancement, succession
Operational Efficiency
Simplification and standardization of agreements and processes to increase efficiency
Internal operations audits
Process automation and creating more self-service tools using workflows and AI
Policy development and implementation
2017 CHIEF LEGAL OFFICER SURVEY
© 2017 Altman Weil, Inc. An Altman Weil Flash Survey - 43
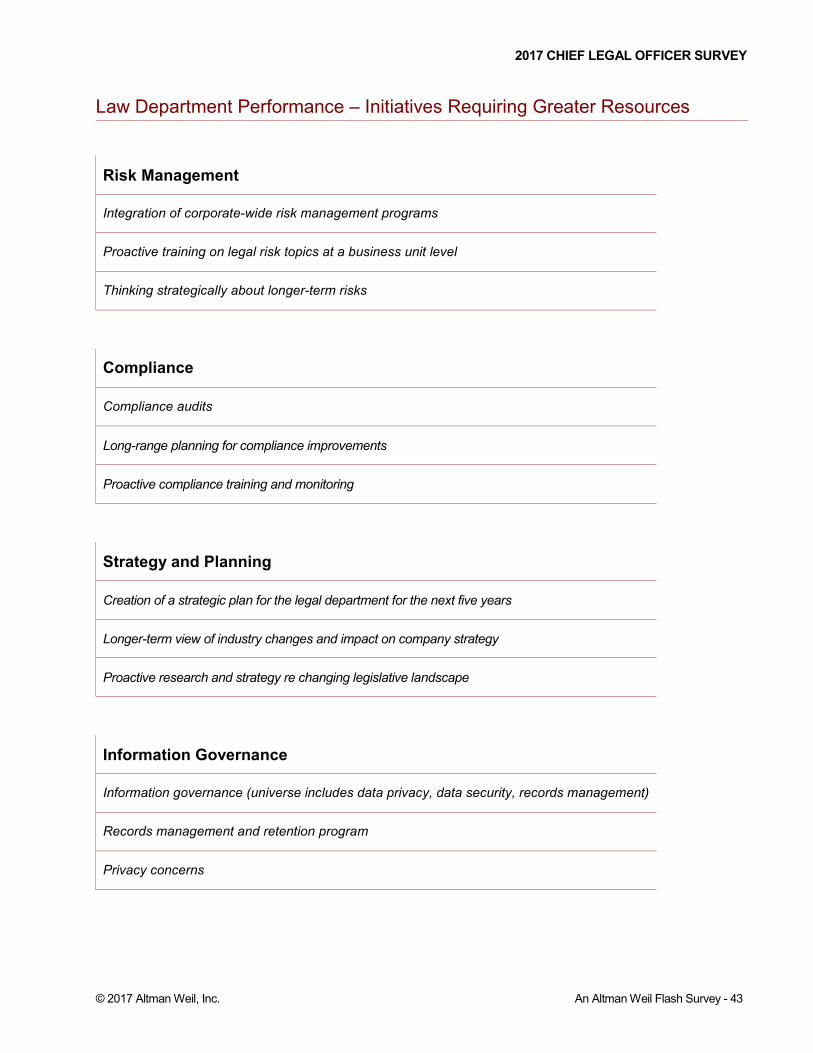
Law Department Performance – Initiatives Requiring Greater Resources
Risk Management
Integration of corporate-wide risk management programs
Proactive training on legal risk topics at a business unit level
Thinking strategically about longer-term risks
Compliance
Compliance audits
Long-range planning for compliance improvements
Proactive compliance training and monitoring
Strategy and Planning
Creation of a strategic plan for the legal department for the next five years
Longer-term view of industry changes and impact on company strategy
Proactive research and strategy re changing legislative landscape
Information Governance
Information governance (universe includes data privacy, data security, records management)
Records management and retention program
Privacy concerns
2017 CHIEF LEGAL OFFICER SURVEY
© 2017 Altman Weil, Inc. An Altman Weil Flash Survey - 44
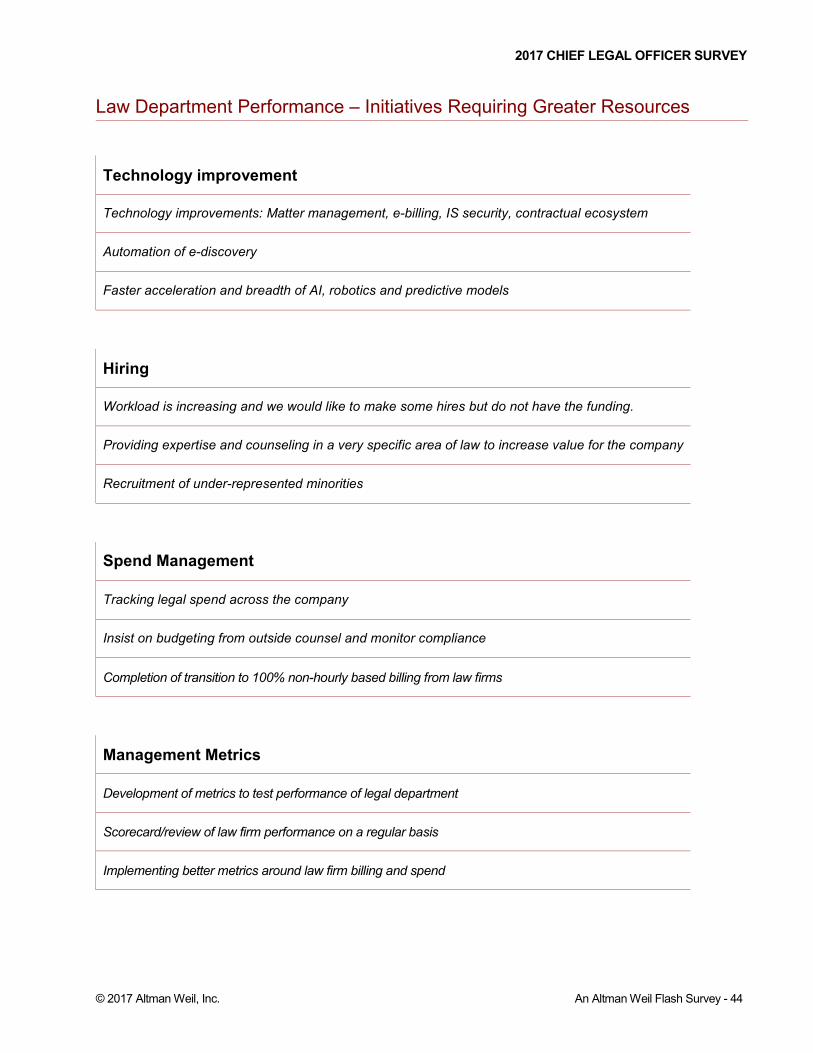
Law Department Performance – Initiatives Requiring Greater Resources
Technology improvement
Technology improvements: Matter management, e-billing, IS security, contractual ecosystem
Automation of e-discovery
Faster acceleration and breadth of AI, robotics and predictive models
Hiring
Workload is increasing and we would like to make some hires but do not have the funding.
Providing expertise and counseling in a very specific area of law to increase value for the company
Recruitment of under-represented minorities
Spend Management
Tracking legal spend across the company
Insist on budgeting from outside counsel and monitor compliance
Completion of transition to 100% non-hourly based billing from law firms
Management Metrics
Development of metrics to test performance of legal department
Scorecard/review of law firm performance on a regular basis
Implementing better metrics around law firm billing and spend

2017 CHIEF LEGAL OFFICER SURVEY
© 2017 Altman Weil, Inc. An Altman Weil Flash Survey - 45
BONUS QUESTION – Understanding Law Department Challenges
On average, how would you characterize each of the following stakeholders'
knowledge and understanding of the challenges of leading a law department?
Rate 0 to 10: 0 = No understanding; 5 = Intermediate understanding; 10 = Sophisticated understanding
0%
5%
10%
15%
20%
25%
0 1 2 3 4 5 6 7 8 9 10
NON-LAW-FIRM VENDORS
0 1 2 3 4 5 6 7 8 9 10
ORGANIZATION EXECUTIVES
0 1 2 3 4 5 6 7 8 9 10
OUTSIDE COUNSEL
NON-LAW-FIRM VENDORS ORGANIZATION EXECUTIVES OUTSIDE COUNSEL
Median Average Median Average Median Average
5 4.2 6 5.7 6 6.1

2017
Chief Legal Officer Survey
Participant Demographics

2017 CLO SURVEY – PARTICIPANT DEMOGRAPHICS
© 2017 Altman Weil, Inc. An Altman Weil Flash Survey - 46
Law Department Demographics – Lawyers
How many in-house attorneys are in your department (in all locations)?
Minimum 1st Quartile Median 3rd Quartile Maximum Average
Lawyers 1 5 11 26 1,400 39
What percentage of the lawyers in your department are based outside the US?
7.3%
8.6%
34.6%
17.5%
23.5%
8.6%
0% 10% 20% 30% 40%
100+ lawyers
51-100 lawyers
11 - 50 lawyers
6 - 10 lawyers
2 - 5 lawyers
1 lawyer
13.7%
12.5%
4.7%
3.4%
4.3%
61.4%
0% 10% 20% 30% 40% 50% 60% 70%
Over 50%
26% - 50%
16% - 25%
11% - 15%
6% - 10%
0% - 5%

2017 CLO SURVEY – PARTICIPANT DEMOGRAPHICS
© 2017 Altman Weil, Inc. An Altman Weil Flash Survey - 47
Law Department Demographics – Organization Revenue
What are your organization’s annual revenues?
Minimum 1st Quartile Median 3rd Quartile Maximum Average
Revenue $8M $1B $3.3B $8B $150B $7.3B
SIZE / REVENUE CORRELATION:
7.4%
11.8%
19.7%
39.3%
21.8%
0% 10% 20% 30% 40%
Over $20B
$10.1B to $20B
$5.1B to $10B
$1B to $5B
Under $1B
32.0%
3.7%
8.9%
24.4%
50.0%
20.0%
29.0%
12.0%
41.2%
40.7%
55.6%
39.0%
6.0%
11.8%
29.6%
8.9%
5.6%
47.1%
25.9%
4.4%
0% 20% 40% 60% 80% 100%
Over $20B
$10.1B to $20B
$5.1B to $10B
$1B to $5B
Under $1B
1 lawyer 2-5 lawyers 6-10 lawyers 11-50 lawyers 51-100 lawyers 100+ lawyers

2017 CLO SURVEY – PARTICIPANT DEMOGRAPHICS
© 2017 Altman Weil, Inc. An Altman Weil Flash Survey - 48
Law Department Demographics – Average Total Legal Spend
What is the average of your law department's total legal spend (inside and outside, including all legal costs borne by the department) over the last two years?
Minimum 1st Quartile Median 3rd Quartile Maximum Average
Spend $60,000 $3M $10M $25M $650M $25M
13.0%
9.9%
24.5%
18.5%
27.2%
7.1%
0% 10% 20% 30% 40%
Over $50M
$25.1M to $50M
$10.1M to $25M
$5.1M to $10M
$1.1M to $5M
Under $1M