Embed Size (px)
Citation preview

2017 Annual Results Presentation
China Pacific Insurance (Group) Co., Ltd.
April 3, 2018
2
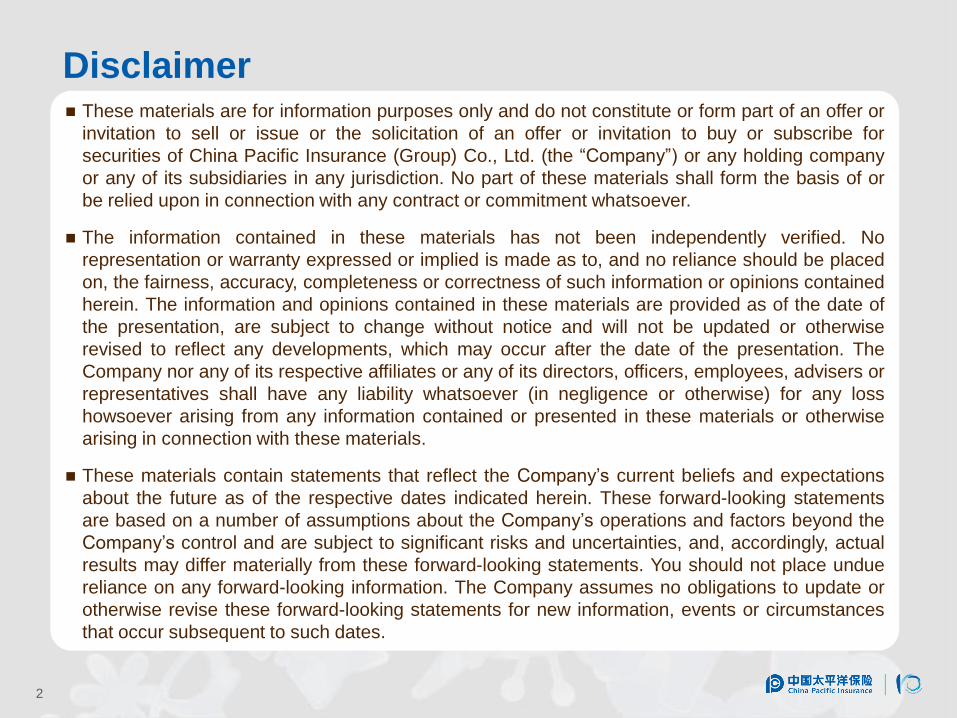
Disclaimer These materials are for information purposes only and do not constitute or form part of an offer or
invitation to sell or issue or the solicitation of an offer or invitation to buy or subscribe for
securities of China Pacific Insurance (Group) Co., Ltd. (the “Company”) or any holding company
or any of its subsidiaries in any jurisdiction. No part of these materials shall form the basis of or
be relied upon in connection with any contract or commitment whatsoever.
The information contained in these materials has not been independently verified. No
representation or warranty expressed or implied is made as to, and no reliance should be placed
on, the fairness, accuracy, completeness or correctness of such information or opinions contained
herein. The information and opinions contained in these materials are provided as of the date of
the presentation, are subject to change without notice and will not be updated or otherwise
revised to reflect any developments, which may occur after the date of the presentation. The
Company nor any of its respective affiliates or any of its directors, officers, employees, advisers or
representatives shall have any liability whatsoever (in negligence or otherwise) for any loss
howsoever arising from any information contained or presented in these materials or otherwise
arising in connection with these materials.
These materials contain statements that reflect the Company’s current beliefs and expectations
about the future as of the respective dates indicated herein. These forward-looking statements
are based on a number of assumptions about the Company’s operations and factors beyond the
Company’s control and are subject to significant risks and uncertainties, and, accordingly, actual
results may differ materially from these forward-looking statements. You should not place undue
reliance on any forward-looking information. The Company assumes no obligations to update or
otherwise revise these forward-looking statements for new information, events or circumstances
that occur subsequent to such dates.

3
2017 was an important year of transition in our history, with smooth
succession of the Board of Directors and senior management.
Under the stewardship of the new Board, we pursued progress on
top of steadiness, and achieved a step-up in development, with
fulfillment of all business targets and continued improvement in
quality, which in turn boosted our long-term growth potential.

Pursued progress on top of steadiness and delivered solid business results
Notes: (1) As at 31 December, 2017
(2) The combined ratio refers only to CPIC P/C
(3) Based on Chinese GAAP
(4) Attributable to shareholders of the parent company
(5) Subject to the approval of shareholders’ general meeting 4
(Unit: RMB million)
Indicators 2017 Change (%)
Value Growth
Group Embedded Value (1) 286,169 16.4
New Business Value Margin 39.4% 6.5pt
New Business Value 26,723 40.3
Combined Ratio (2) 98.8% (0.4pt)
Group AuM (1) 1,418,465 14.8
Financial Results
Operating Revenue (3) 319,809 19.8
Gross Written Premiums 281,644 20.4
CPIC Life 175,628 27.9
CPIC P/C 104,614 8.8
Net Profits (4) 14,662 21.6
Dividend per Share (RMB yuan) (5) 0.80 14.3
Capital Strength
CPIC Group (1) 284% (10pt)
CPIC Life (1) 245% (12pt)
CPIC P/C (1) 267% (29pt)
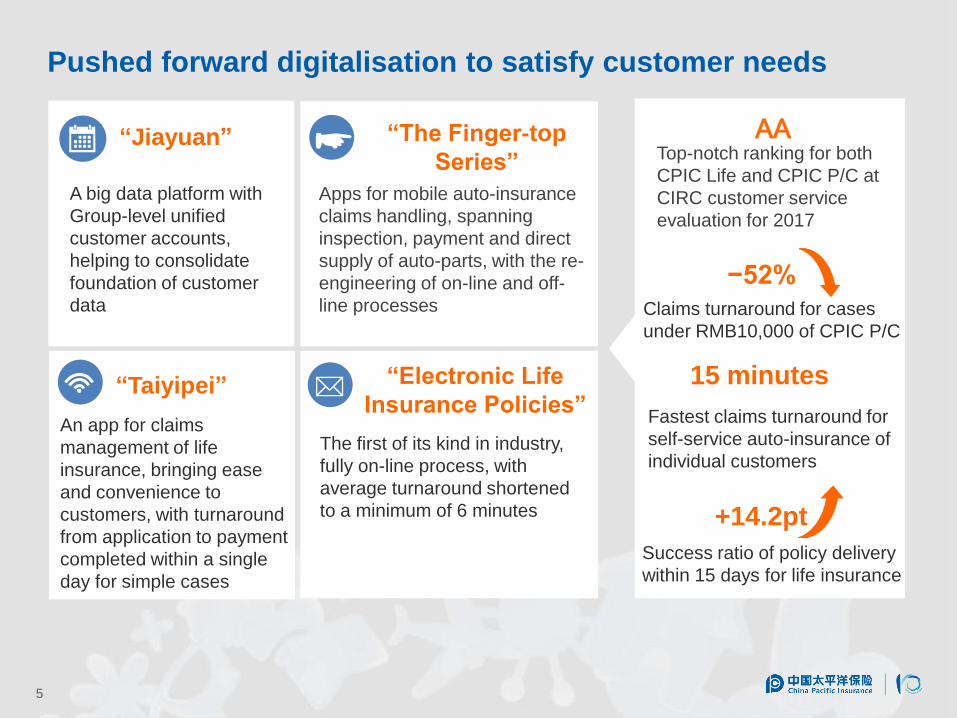
Pushed forward digitalisation to satisfy customer needs
A big data platform with
Group-level unified
customer accounts,
helping to consolidate
foundation of customer
data
“Jiayuan” “The Finger-top
Series”
Apps for mobile auto-insurance
claims handling, spanning
inspection, payment and direct
supply of auto-parts, with the re-
engineering of on-line and off-
line processes
“Electronic Life
Insurance Policies”
The first of its kind in industry,
fully on-line process, with
average turnaround shortened
to a minimum of 6 minutes
Top-notch ranking for both
CPIC Life and CPIC P/C at
CIRC customer service
evaluation for 2017
AA
15 minutes
Claims turnaround for cases
under RMB10,000 of CPIC P/C
−52%
Success ratio of policy delivery
within 15 days for life insurance
+14.2pt
“Taiyipei”
An app for claims
management of life
insurance, bringing ease
and convenience to
customers, with turnaround
from application to payment
completed within a single
day for simple cases
Fastest claims turnaround for
self-service auto-insurance of
individual customers
5
☛
✉

Fulfilled corporate social responsibilities in an all-around way
Serving real economy Cumulatively launched 129
debt investment schemes to
fund major infrastructure
projects, raising RMB207.6
billion. Supporting national strategies Provided over RMB500 billion in SA for the Belt
and Road, comprehensive risk solutions for
China’s advanced equipment such as China’s
first independently designed deep-water manned
submersible, the first Made-in-China deep-diving
scientific expedition equipment, and China’s first
high-orbit, high-flux communications satellite,
facilitating implementation of the “Made in China
2025” Initiative.
Promoting well-being Cumulatively provided
terminal illness program for
urban and rural residents in
277 counties of 19
provinces, benefiting over
75 million people, with total
protection amounting to
tens of trillions of yuan.
6
Contributing to poverty reduction Multiple means of poverty alleviation,
which covered 4.6 million officially-designated people in poverty. Established an e-
commerce platform for impoverished households, boosting their income. Set up
long-term mechanisms, such as donating to schools and organizing volunteer programs to improve
access of under-privileged children to high-quality education , breaking the generational transmission
of poverty.

At the beginning of a new stretch of journey, the continuation of the customer-
oriented transformation is not an option, but a must. Therefore, we launched
Transformation 2.0, in a bid to achieve high-quality development in a new era,
aiming to become the best in customer experience, business quality and risk
control capabilities.
To this end, we will focus on talent and technology to close the gaps and deliver a
shift in the mode of development. A number of key projects have been rolled out,
including those relating human resources management and digital customer
experience.
We are moving firmly on the path of high-quality development, and are determined
to be a “long-distance runner” in this journey. Under the stewardship of the new
Board of Directors, we are full of confidence and will work even harder to achieve
leadership in healthy and sustainable development of the industry.
Embarked on a new journey of high-quality development
7
6
Performance Analysis

9
Group Number of Customers
as of the end of 2017
Note: The number of Group customers refers to the number of applicants or insureds who hold at least one insurance policy within the
insurance period issued by one or any of CPIC subsidiaries as at the end of the reporting period. In the event that the applicants and
insureds are the same person, they shall be deemed as one customer.
Group customers reached 115.53 million, adding 11.09 million in 2017
Long-term life insurance
115.53 million
11.09 million added
Increase in Individual Customers
for Major Products
+5.30 million
Short-term A/H
+3.80 million
Automobile insurance +1.95 million

10
Continued enhancement in customer protection
3,770
6,030
2016 2017
Critical illness
95 122
31 Dec. 2016 31 Dec. 2017
221 241
31 Dec. 2016 31 Dec. 2017
Customers of
critical illness
4.72 million
77%
Customers of
other protection
610,000
Personal accident
Other customers
780,000
Breakdown of New Life Insurance Customers Average SA of Life Insurance Customers
Share of Auto Insurance Customers Taking out Commercial Policies
Number of Customers with SA above One Million for Thirty Party Liability Insurance
79.6 82.8 84.3
2015 2016 2017
Unit: RMB thousand
Unit: % Unit: thousand
10%
13%

17.8 20.7
24.5
29.5
32.9
39.4
2012 2013 2014 2015 2016 2017
7,060 7,499 8,725 12,170
19,041
26,723 5.2% 6.2%
16.3%
39.5%
56.5% 40.3%
2012 2013 2014 2015 2016 2017
NBV NBV Growth
11
Life Business(1/4)
Rapid value growth, with continued margin improvement
Note: NBV margin= NBV/ annualized first year premiums. Figures for NBV margin between 2012 and 2014 were based on the old solvency
regime, and those between 2015 and 2017 under C-ROSS.
New Business Value NBV Margin
Unit: RMB million Unit: %
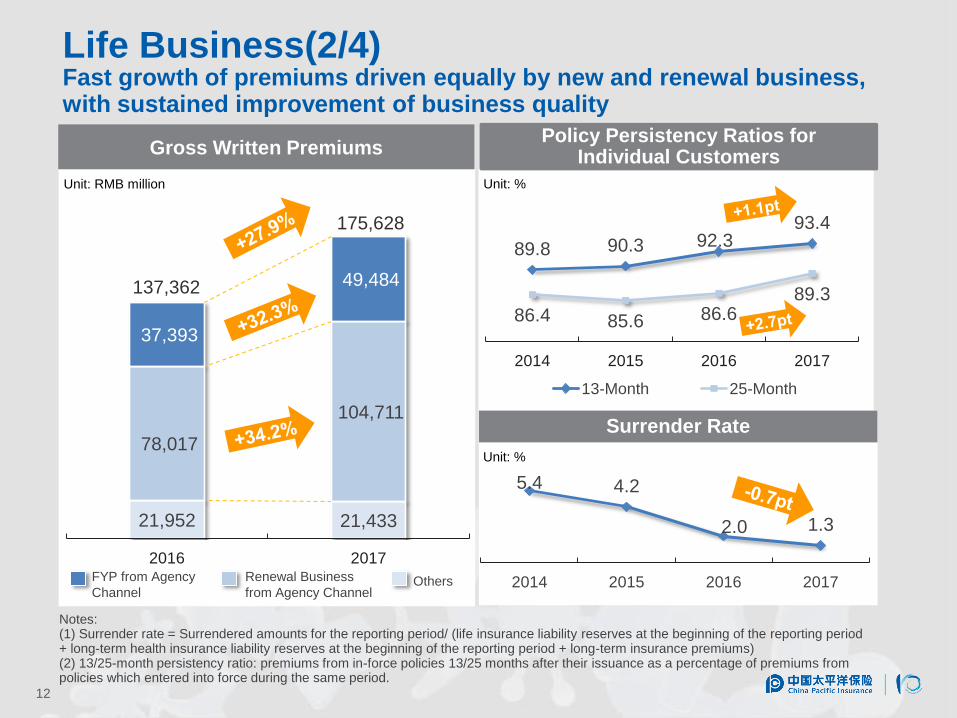
89.8 90.3 92.3 93.4
86.4 85.6 86.6 89.3
2014 2015 2016 2017
13-Month 25-Month
12
Life Business(2/4) Fast growth of premiums driven equally by new and renewal business, with sustained improvement of business quality
Policy Persistency Ratios for Individual Customers Gross Written Premiums
Surrender Rate
21,952 21,433
78,017
104,711
37,393
49,484
2016 2017
137,362
175,628
5.4 4.2
2.0 1.3
2014 2015 2016 2017
Notes: (1) Surrender rate = Surrendered amounts for the reporting period/ (life insurance liability reserves at the beginning of the reporting period + long-term health insurance liability reserves at the beginning of the reporting period + long-term insurance premiums) (2) 13/25-month persistency ratio: premiums from in-force policies 13/25 months after their issuance as a percentage of premiums from policies which entered into force during the same period.
FYP from Agency
Channel
Renewal Business
from Agency Channel Others
Unit: RMB million Unit: %
Unit: %

Life Business(3/4) Rapid growth of long-term protection business, with increase in residual margin
Annualized FYPs from Long-term Protection Business
Residual Margin
21,048
28,313
2016 2017
172,600
228,370
31 Dec. 2016 31 Dec. 2017
13
Note: Long-term protection business includes whole life insurance, term life insurance, long-term health and accident
insurance.
Unit: RMB million Unit: RMB million
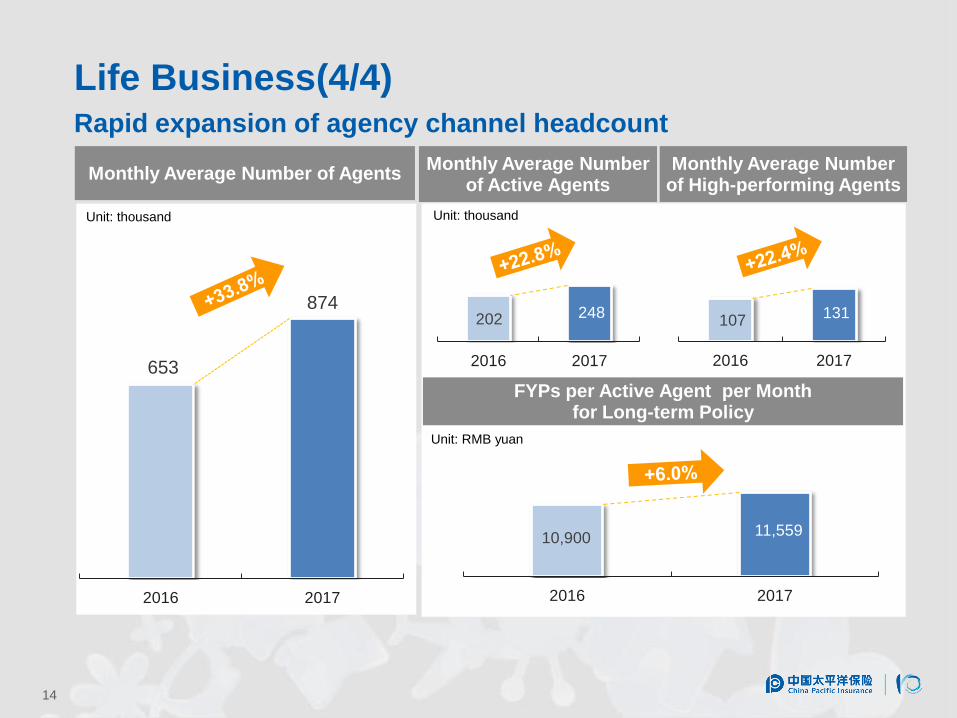
107 131
2016 2017
10,900 11,559
2016 2017
653
874
2016 2017
14
Monthly Average Number of Agents
Unit: thousand
Monthly Average Number of Active Agents
Unit: thousand
Life Business(4/4) Rapid expansion of agency channel headcount
FYPs per Active Agent per Month for Long-term Policy
Unit: RMB yuan
202 248
2016 2017
Monthly Average Number of High-performing Agents
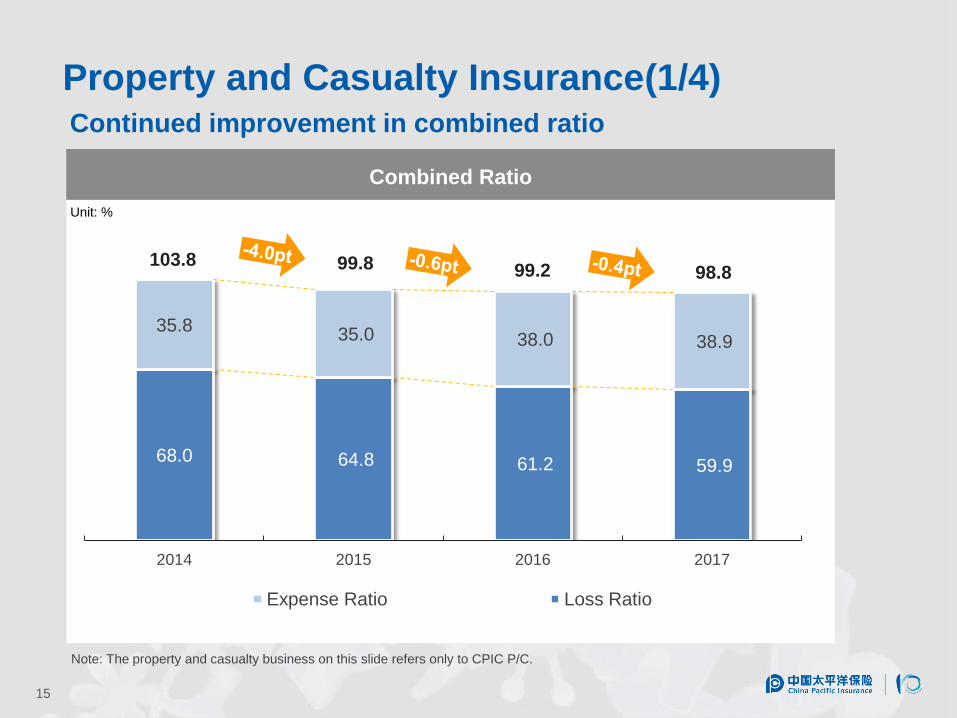
Property and Casualty Insurance(1/4) Continued improvement in combined ratio
Combined Ratio
15
68.0 64.8 61.2 59.9
35.8 35.0 38.0 38.9
2014 2015 2016 2017
Expense Ratio Loss Ratio
98.8 99.2 99.8 103.8
Note: The property and casualty business on this slide refers only to CPIC P/C.
Unit: %
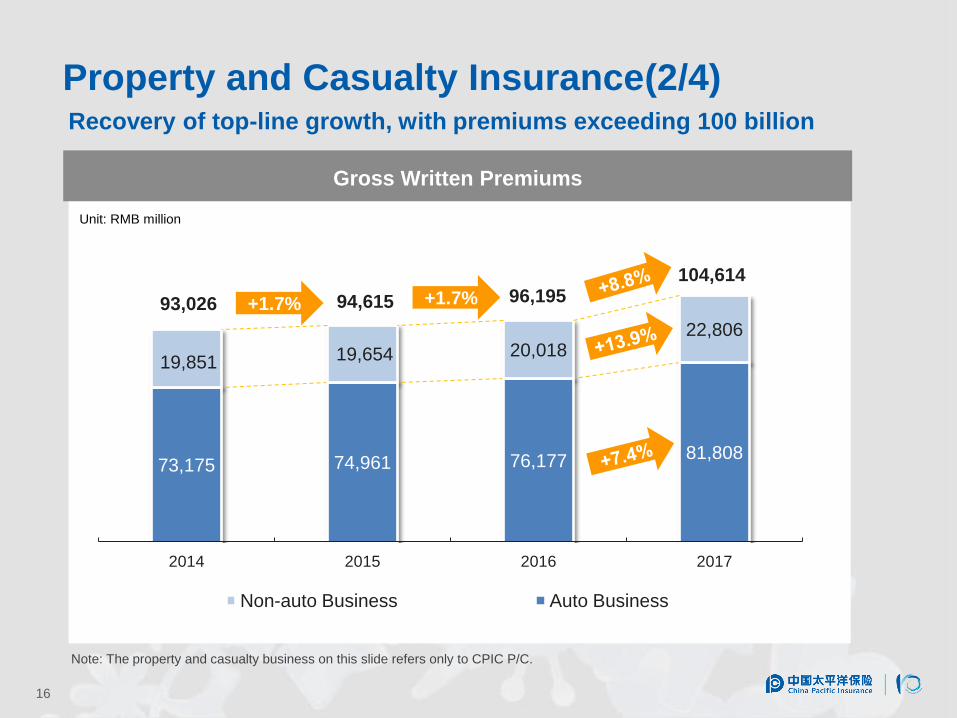
73,175 74,961 76,177 81,808
19,851 19,654 20,018 22,806
2014 2015 2016 2017
Non-auto Business Auto Business
Gross Written Premiums
Unit: RMB million
16
94,615 +1.7% +1.7% 93,026 96,195 104,614
Note: The property and casualty business on this slide refers only to CPIC P/C.
Property and Casualty Insurance(2/4) Recovery of top-line growth, with premiums exceeding 100 billion

97.2 98.7
2016 2017
Property and Casualty Insurance(3/4) Auto business maintained underwriting profitability, with strong
growth of dealerships and cross-sell
Combined Ratio of Auto Business
Unit: % Unit: RMB million
Primary Insurance Premiums from Car Dealerships
17
258
27,881 31,081
2016 2017
Primary Insurance Premiums from Cross-selling
5,635 7,560
2016 2017
Unit: RMB million
Note: The property and casualty business on this slide refers only to CPIC P/C.

109.6 99.6
2016 2017
Combined Ratio of Non-auto Business
Primary Business Premium of Agricultural Insurance
Property and Casualty Insurance(4/4) Non-auto business realized underwriting profits for the first time in 4 years, with rapid growth of agricultural business
18
Unit: %
2,055
3,405
2016 2017
Unit: RMB million
Note: The combined ratio of non-auto business refers only to CPIC P/C. Agricultural insurance premium is based on a consolidated
basis of CPIC P/C and Anxin Agricultural. The consolidation started from September 2016.
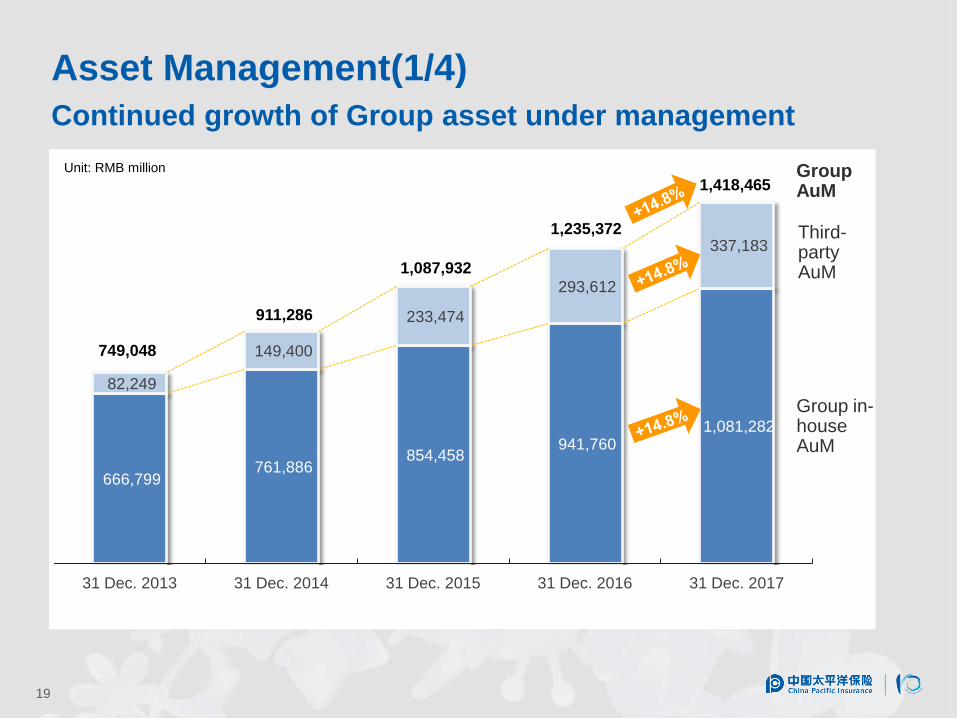
666,799 761,886
854,458 941,760
1,081,282
82,249
149,400
233,474
293,612
337,183
31 Dec. 2013 31 Dec. 2014 31 Dec. 2015 31 Dec. 2016 31 Dec. 2017
Unit: RMB million
1,235,372
1,087,932
Asset Management(1/4)
Continued growth of Group asset under management
19
1,418,465
911,286
749,048
Group in-house AuM
Third-party AuM
Group AuM

Asset Management(2/4)
Steady increase in investment yields
Total Investment Yield
5.2 5.4
+0.2pt
20
2016 2017
Net Investment Yield
5.4 5.4
+0.0pt
Comprehensive Investment Yield
4.0
4.8
+0.8pt
2016 2017 2016 2017
Unit: % Unit: % Unit: %
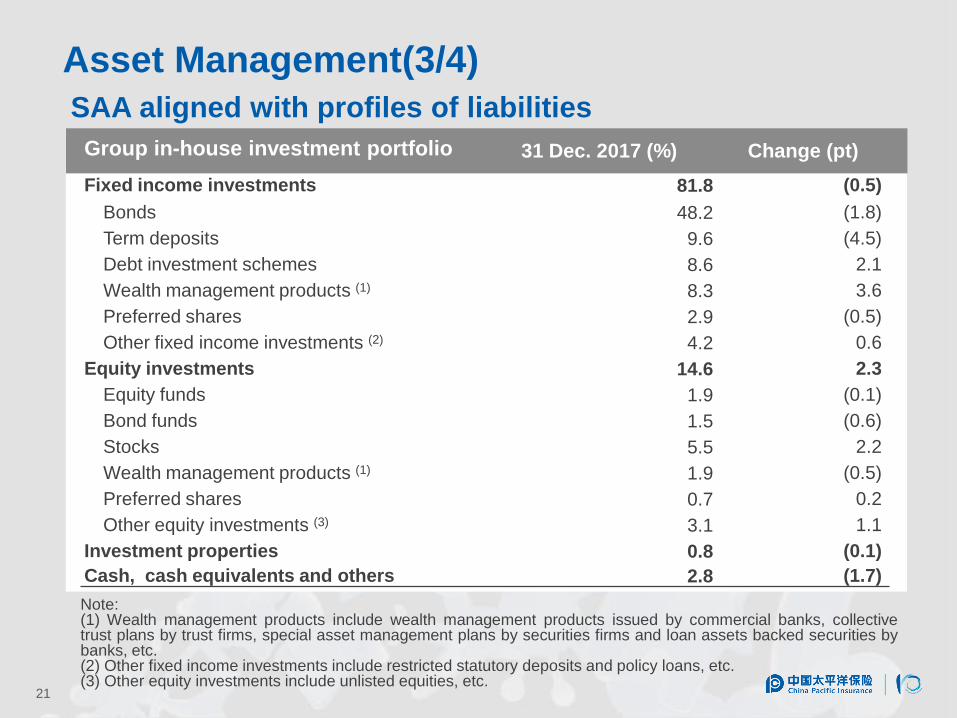
Asset Management(3/4)
SAA aligned with profiles of liabilities
21
Note: (1) Wealth management products include wealth management products issued by commercial banks, collective trust plans by trust firms, special asset management plans by securities firms and loan assets backed securities by banks, etc. (2) Other fixed income investments include restricted statutory deposits and policy loans, etc. (3) Other equity investments include unlisted equities, etc.
Group in-house investment portfolio 31 Dec. 2017 (%) Change (pt)
Fixed income investments 81.8 (0.5)
Bonds 48.2 (1.8)
Term deposits 9.6 (4.5)
Debt investment schemes 8.6 2.1
Wealth management products (1) 8.3 3.6
Preferred shares 2.9 (0.5)
Other fixed income investments (2) 4.2 0.6
Equity investments 14.6 2.3
Equity funds 1.9 (0.1)
Bond funds 1.5 (0.6)
Stocks 5.5 2.2
Wealth management products (1) 1.9 (0.5)
Preferred shares 0.7 0.2
Other equity investments (3) 3.1 1.1
Investment properties 0.8 (0.1)
Cash, cash equivalents and others 2.8 (1.7)

Asset Management(4/4)
Credit risk of non-standard assets under control
22
91.0% 99.7%
Debt investment schemes
All covered by effective credit enhancement measures
including guarantees or pledge of assets
Wealth management products
Mainly issued by major state-owned commercial banks or
national joint-stock commercial banks
Trust plans
Mainly provided financing for major state-owned non-bank
financial institutions and large SOEs
Spanning transport, municipal
infrastructure, energy,
environment protection,
commercial property, land
reserve, resettlement of slums,
water conservancy and
affordable housing
External Credit-rating
Distribution of Underlying Assets
Risk Control
Share of NSA
13.2 18.8
31 Dec. 2016 31 Dec. 2017
Unit: %
Share of AA+ and above
Share of AAA

Group Embedded Value
Group Embedded Value(1/3)
23
144,378 171,294
205,624 245,939
286,169
31 Dec. 2013 31 Dec. 2014 31 Dec. 2015 31 Dec. 2016 31 Dec. 2017
Unit: RMB million
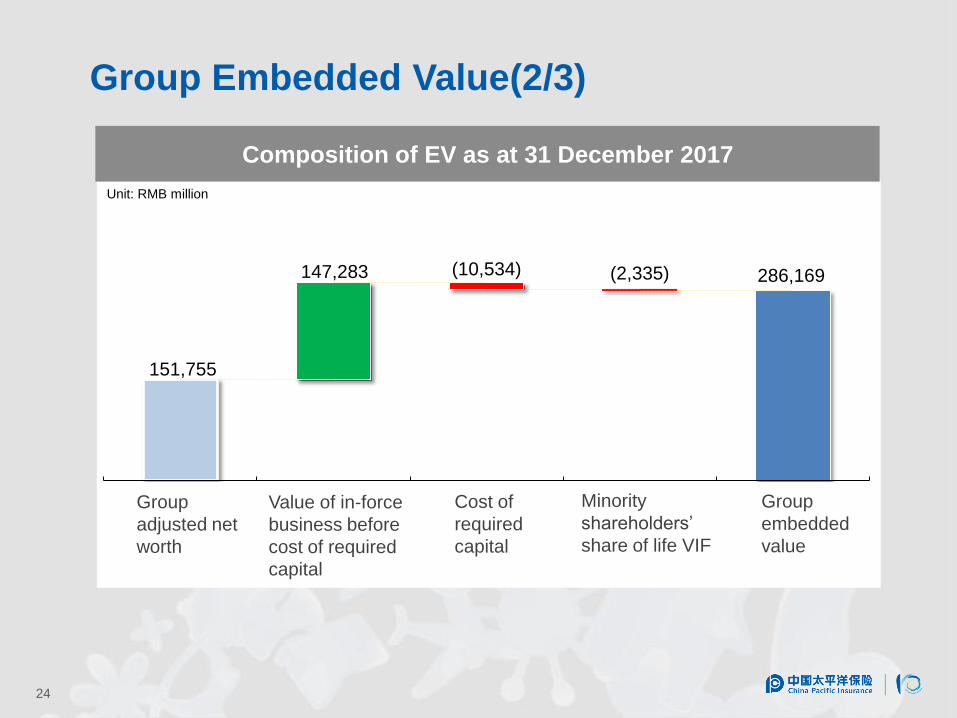
Composition of EV as at 31 December 2017
Unit: RMB million
151,755
147,283 (10,534) (2,335) 286,169
Group
adjusted net
worth
Cost of
required
capital
Group
embedded
value
Value of in-force
business before
cost of required
capital
Minority
shareholders’
share of life VIF
Group Embedded Value(2/3)
24

245,939 17,540
26,723 883 1,890 (2,296) 3,736 (5,075) (6,656) 3,484 286,169
Movement of Embedded Value
Unit: RMB million
EV as of
the end
of 2016
NBV Investment
experience
variance
Operating
experience
variance
Change to
methods,
assumptions,
and models
Change to
market
value
adjustment
Others EV as of
the end
of 2017
Diversification
effect(1)
Group Embedded Value(3/3)
25
Expected
return on
EV
Profit
distribution
Notes:
(1) Diversification effect refers to the impact on cost of requited capital of new business and business change.
(2) Numbers may not totally add up due to rounding.

谢谢
THANK YOU 谢谢
Q & A


![[IJETA-V2I6P5]: NBV Prasad, Dr, Ch. V. S. ParameswaraRao](https://img.pdfslide.us/doc/110x75/5695cf1a1a28ab9b028c9ca0/ijeta-v2i6p5-nbv-prasad-dr-ch-v-s-parameswararao.jpg)