Embed Size (px)
Citation preview

2017 ANNUAL REPORT
20
17 A
NN
UA
L R
EP
OR
T
BOARD OF DIRECTORS
LEADERSHIP TEAM AND OFFICERS
Thomas J. Lynch ‡Executive Chairman TE Connectivity Ltd.
Dr. Pierre R. Brondeau* President, Chairman, and Chief Executive Officer, FMC Corporation
Terrence R. Curtin Director and Chief Executive Officer, TE Connectivity Ltd.
Carol A. “John” Davidson Retired Senior Vice President, Controller and Chief Accounting Officer, Tyco International Ltd.
Dr. William A. Jeffrey Chief Executive Officer,SRI International
Yong Nam Advisor to the CEO, Daelim Industrial Co. Ltd. Former Chief Executive Officer, LG Electronics Inc.
Daniel J. Phelan Retired Chief of Staff, GlaxoSmithKline plc
Mark C. Trudeau President and Chief Executive Officer, Mallinckrodt plc
Paula A. Sneed Chair and Chief Executive Officer, Phelps Prescott Group, LLC Retired Executive Vice President, Kraft Foods Inc.
Abhijit Y. Talwalkar Former President and Chief Executive Officer, LSI Corporation
John C. Van Scoter Former President and Chief Executive Officer, eSolar, Inc.
Laura H. Wright Founder, GSB Advisors Retired Chief Financial Officer, Southwest Airlines Co.
Terrence R. Curtin Chief Executive Officer and Director
Mario Calastri Senior Vice President, Treasurer
Joel Dubs Senior Vice President, Operations
Joseph F. Eckroth, Jr. Senior Vice President, Chief Information Officer
John S. Jenkins, Jr. Executive Vice President, General Counsel
Shad W. Kroeger President, Communications Solutions
Thomas J. Lynch‡Executive Chairman
Steven T. Merkt President, Transportation Solutions
Heath A. Mitts Executive Vice President, Chief Financial Officer
Timothy J. Murphy Senior Vice President, Chief Human Resources Officer
Robert J. OttSenior Vice President,Corporate Controller
Sameer PagnisSenior Vice President, Corporate Strategy
Jeanne QuirkSenior Vice President,Mergers and Acquisitions
Eric J. Resch Senior Vice President, Chief Tax Officer
Kevin N. RockPresident,Industrial Solutions
Amy Summy Senior Vice President,Chief Marketing Officer
Joan E. WainwrightPresident,Channel and Customer Experience
*Lead Independent Director of the TE Connectivity Ltd. Board of Directors
© 2018 TE Connectivity Ltd. All Rights Reserved.001-AR-FY2017
TE Connectivity, TE, TE connectivity (logo) are trademarks of the TE Connectivity family of companies. Other logos, product, and/or company names may be trademarks of their respective owners.
CORPORATE DATAREGISTERED & PRINCIPALEXECUTIVE OFFICETE Connectivity Ltd. Rheinstrasse 20 CH-8200 Schaffhausen Switzerland +41.0.52.633.66.61
INDEPENDENT AUDITORSDeloitte & Touche LLP 1700 Market Street Philadelphia, PA 19103 Deloitte AG General Guisan-Quai 38 CH-8022 Zurich Switzerland
STOCK EXCHANGE The company’s common shares are traded on the New York Stock Exchange (NYSE) under the ticker symbol TEL.
FORM 10-K Copies of the company’s Annual Report on Form 10-K for the fiscal year that ended September 29, 2017 may be obtained by shareholders without charge upon written request to TE Connectivity Ltd. Rheinstrasse 20 CH-8200 Schaffhausen SwitzerlandThe Annual Report on Form 10-K is also available on the company’s website at www.te.com.
SHAREHOLDER SERVICES Registered shareholders (shares held in your own name with our transfer agent) with requests such as change of address or dividend checks should contact TE Connectivity’s transfer agent at: Wells Fargo Shareowner Services 1110 Centre Pointe Curve, Suite 101 Mendota Heights, MN 55120-4100 866.258.4745 www.shareowneronline.com
Beneficial shareholders (shares held with a bank or broker) should contact the bank or brokerage holding their shares with their requests. Other shareholder inquiries may be directed to TE Connectivity Shareholder Services at the company’s registered and principal executive office above.
www.te.com
‡ On December 14, 2017, Mr. Lynch announced his retirement as Executive Chairman of TE Connectivity effective March 14, 2018. Mr. Lynch has been nominated for, and will continue to serve on, the Board of Directors of TE Connectivity and as the Non-Executive Chairman of the Board of Directors, if elected at the Annual General Meeting of Shareholders on March 14, 2018.
i
TE CONNECTIVITY LTD.ANNUAL REPORT
TABLE OF CONTENTS
Page
Business . . . . . . . . . . . . . . . . . . . . . . . . . . . . . . . . . . . . . . . . . . . . . . . . . . . . . . . . . . . . . . . . . 1Market for Registrant’s Common Equity, Related Stockholder Matters and Issuer Purchases of
Equity Securities . . . . . . . . . . . . . . . . . . . . . . . . . . . . . . . . . . . . . . . . . . . . . . . . . . . . . . . . . 8Selected Financial Data . . . . . . . . . . . . . . . . . . . . . . . . . . . . . . . . . . . . . . . . . . . . . . . . . . . . . . 11Management’s Discussion and Analysis of Financial Condition and Results of Operations . . . . . . 12Quantitative and Qualitative Disclosures About Market Risk . . . . . . . . . . . . . . . . . . . . . . . . . . . 34Changes in and Disagreements with Accountants on Accounting and Financial Disclosure . . . . . . 35Controls and Procedures . . . . . . . . . . . . . . . . . . . . . . . . . . . . . . . . . . . . . . . . . . . . . . . . . . . . . 35Consolidated Financial Statements . . . . . . . . . . . . . . . . . . . . . . . . . . . . . . . . . . . . . . . . . . . . . . 37Swiss Statutory Financial Statements . . . . . . . . . . . . . . . . . . . . . . . . . . . . . . . . . . . . . . . . . . . . 105Swiss Statutory Compensation Report . . . . . . . . . . . . . . . . . . . . . . . . . . . . . . . . . . . . . . . . . . . . 121
i
ii
SPECIAL NOTE ABOUT FORWARD-LOOKING STATEMENTS
We have made forward-looking statements in this Annual Report that are based on ourmanagement’s beliefs and assumptions and on information currently available to our management.Forward-looking statements include, among others, the information concerning our possible or assumedfuture results of operations, business strategies, financing plans, competitive position, potential growthopportunities, potential operating performance improvements, acquisitions, divestitures, the effects ofcompetition, and the effects of future legislation or regulations. Forward-looking statements include allstatements that are not historical facts and can be identified by the use of forward-looking terminologysuch as the words ‘‘believe,’’ ‘‘expect,’’ ‘‘plan,’’ ‘‘intend,’’ ‘‘anticipate,’’ ‘‘estimate,’’ ‘‘predict,’’ ‘‘potential,’’‘‘continue,’’ ‘‘may,’’ ‘‘should,’’ or the negative of these terms or similar expressions.
Forward-looking statements involve risks, uncertainties, and assumptions. Actual results may differmaterially from those expressed in these forward-looking statements. Investors should not place unduereliance on any forward-looking statements. We do not have any intention or obligation to updateforward-looking statements after we file this report except as required by law.
The risk factors identified in this Annual Report and those discussed in our Annual Report onForm 10-K for the fiscal year ended September 29, 2017 filed with the United States Securities andExchange Commission (the ‘‘SEC’’) could cause our results to differ materially from those expressed inforward-looking statements. There may be other risks and uncertainties that we are unable to predict atthis time or that we currently do not expect to have a material adverse effect on our business.
ii
1
BUSINESS
General
TE Connectivity Ltd. (‘‘TE Connectivity’’ or the ‘‘Company,’’ which may be referred to as ‘‘we,’’‘‘us,’’ or ‘‘our’’) is a global technology and manufacturing leader creating a safer, sustainable,productive, and connected future. Our connectivity and sensor solutions, proven in the harshestenvironments, have enabled advancements in transportation, industrial applications, medical technology,energy, data communications, and the home.
We became an independent, publicly traded company in 2007; however, through our predecessorcompanies, we trace our foundations in the connectivity business back to 1941. We are organized underthe laws of Switzerland. The rights of holders of our shares are governed by Swiss law, our Swissarticles of association, and our Swiss organizational regulations.
We have a 52- or 53-week fiscal year that ends on the last Friday of September. For fiscal years inwhich there are 53 weeks, the fourth quarter reporting period includes 14 weeks. Fiscal 2017, 2016, and2015 ended on September 29, 2017, September 30, 2016, and September 25, 2015, respectively.Fiscal 2017 and 2015 were 52 weeks in length. Fiscal 2016 was a 53-week year.
Segments
We operate through three reportable segments: Transportation Solutions, Industrial Solutions, andCommunications Solutions. We believe our segments serve a combined market of approximately$180 billion.
Our net sales by segment as a percentage of our total net sales were as follows:
Fiscal
2017 2016 2015
Transportation Solutions . . . . . . . . . . . . . . . . . . . . . . . . . . . . . . . 53% 53% 52%Industrial Solutions . . . . . . . . . . . . . . . . . . . . . . . . . . . . . . . . . . 27 26 26Communications Solutions . . . . . . . . . . . . . . . . . . . . . . . . . . . . . 20 21 22
Total . . . . . . . . . . . . . . . . . . . . . . . . . . . . . . . . . . . . . . . . . . . 100% 100% 100%
Below is a description of our reportable segments and the primary products, markets, andcompetitors of each segment. See Notes 1 and 21 to the Consolidated Financial Statements foradditional information regarding our segments.
Transportation Solutions
The Transportation Solutions segment is a leader in connectivity and sensor technologies. Theprimary products sold by the Transportation Solutions segment include terminals and connector systemsand components; sensors; relays; application tooling; and wire and heat shrink tubing. TheTransportation Solutions segment’s products, which must withstand harsh conditions, are used in thefollowing end markets:
• Automotive (74% of segment’s net sales). We are one of the leading providers of advancedautomobile connectivity solutions. The automotive industry uses our products in automotivetechnologies for body and chassis systems, convenience applications, driver information,infotainment solutions, miniaturization solutions, motor and powertrain applications, and safetyand security systems. Hybrid and electronic mobility solutions include in-vehicle technologies,battery technologies, and charging solutions.
1
2
• Commercial transportation (14% of segment’s net sales). We deliver reliable connectivity productsdesigned to withstand harsh environmental conditions for on- and off-highway vehicles andrecreational transportation, including heavy trucks, construction, agriculture, buses, and othervehicles.
• Sensors (12% of segment’s net sales). We offer a portfolio of intelligent, efficient, andhigh-performing sensor solutions that are used by customers across multiple industries, includingautomotive, industrial equipment, commercial transportation, medical solutions, aerospace anddefense, and consumer applications.
The Transportation Solutions segment’s major competitors include Yazaki, Delphi, Sumitomo,Sensata, Honeywell, Molex, and Amphenol.
Industrial Solutions
The Industrial Solutions segment is a leading supplier of products that connect and distributepower, data, and signals. The primary products sold by the Industrial Solutions segment includeterminals and connector systems and components; heat shrink tubing; relays; and wire and cable. TheIndustrial Solutions segment’s products are used in the following markets:
• Industrial equipment (50% of segment’s net sales). Our products are used in factory automationand process control systems such as industrial controls, robotics, human machine interface,industrial communication, and power distribution. Our intelligent building products are used toconnect lighting, HVAC, elevators/escalators, and security. Our rail products are used inhigh-speed trains, metros, light rail vehicles, locomotives, and signaling switching equipment.Also, our products are used by the solar industry. The medical industry uses our products inimaging, diagnostic, therapeutic, surgical, tubing, and minimally invasive interventionalapplications.
• Aerospace, defense, oil, and gas (31% of segment’s net sales). We provide components andsolutions for the commercial aerospace industry from the initial stages of aircraft design toaftermarket support. Our defense products include ruggedized electronic interconnects servingmilitary aviation, marine, and ground vehicles including electronic warfare and space systems.Our oil and gas products include cables and electronics used for harsh subsea environments inthe offshore oil and gas and civil marine industries and in shipboard, subsea, and sonarapplications.
• Energy (19% of segment’s net sales). Our products are used by OEMs and utility companies inthe electrical power industry and include a wide range of solutions for the electrical powergeneration, transmission, distribution, and industrial markets.
The Industrial Solutions segment competes primarily against Amphenol, Belden, Hubbell, CarlisleCompanies, 3M, Integer Holdings, Esterline, Molex, and Phoenix Contact.
Communications Solutions
The Communications Solutions segment is a leading supplier of electronic components for the dataand devices and the appliances markets. We are also a leader in developing, manufacturing, installing,and maintaining some of the world’s most advanced subsea fiber optic communications systems. Theprimary products sold by the Communications Solutions segment include terminals and connectorsystems and components; undersea telecommunication systems; relays; heat shrink tubing; andantennas. The Communications Solutions segment’s products are used in the following markets:
• Data and devices (38% of segment’s net sales). We deliver products and solutions that are used ina variety of equipment architectures within the networking equipment, data center equipment,
2
3
and wireless infrastructure industries. Additionally, we deliver a range of connectivity solutionsfor the Internet of Things, smart phones, tablet computers, notebooks, and virtual realityapplications to help our customers meet their current challenges and future innovations.
• Subsea communications (36% of segment’s net sales). Our products are used in undersea fiberoptic telecommunication systems. With vertically integrated undersea communications systemsand services, we support the telecommunications and oil and gas industries and other customersseeking marine services.
• Appliances (26% of segment’s net sales). We provide solutions to meet the daily demands ofhome appliances. Our products are used in many household appliances, including washers,dryers, refrigerators, air conditioners, dishwashers, cooking appliances, water heaters, andmicrowaves. Our expansive range of standard products is supplemented by an array of custom-designed solutions.
The Communications Solutions segment’s major competitors include Amphenol, Molex, JST, andKorea Electric Terminal (KET). Also, the Subsea Communications business competes against Nokia(Alcatel-Lucent Submarine Networks) and NEC.
Customers
As an industry leader, we have established close working relationships with many of our customers.These relationships allow us to better anticipate and respond to customer needs when designing newproducts and new technical solutions. By working with our customers in developing new products andtechnologies, we believe we can identify and act on trends and leverage knowledge aboutnext-generation technology across our products.
Our approach to our customers is driven by our dedication to further develop our product familiesand ensure that we are globally positioned to best provide our customers with sales and engineeringsupport. We believe that as electronic component technologies continue to proliferate, our broadproduct portfolio and engineering capability give us a potential competitive advantage when addressingthe needs of our global customers.
We manufacture and sell a broad portfolio of products to customers in various industries. Ourcustomers include many of the leaders in their respective industries, and our relationships with themtypically date back many years. We believe that this diversified customer base provides us anopportunity to leverage our skills and experience across markets and reduce our exposure to individualend markets, thereby reducing the variability of our financial performance. Additionally, we believe thatthe diversity of our customer base reduces the level of cyclicality in our results and distinguishes usfrom our competitors.
No single customer accounted for a significant amount of our net sales in fiscal 2017, 2016, or2015.
3
4
Sales and Distribution
We maintain a strong local presence in each of the geographic regions in which we operate. Ournet sales by geographic region(1) as a percentage of our total net sales were as follows:
Fiscal
2017 2016 2015
Americas(2) . . . . . . . . . . . . . . . . . . . . . . . . . . . . . . . . . . . . . . . . 34% 34% 34%Europe/Middle East/Africa (‘‘EMEA’’) . . . . . . . . . . . . . . . . . . . . 34 34 33Asia–Pacific . . . . . . . . . . . . . . . . . . . . . . . . . . . . . . . . . . . . . . . . 32 32 33
Total . . . . . . . . . . . . . . . . . . . . . . . . . . . . . . . . . . . . . . . . . . . 100% 100% 100%
(1) Net sales to external customers are attributed to individual countries based on the legal entity thatrecords the sale.
(2) The Americas region includes our Subsea Communications business.
See Note 21 to the Consolidated Financial Statements for additional geographic informationrelating to our business.
We sell our products into approximately 150 countries primarily through direct selling efforts tomanufacturers. We also sell our products indirectly via third-party distributors. In fiscal 2017, our directsales represented approximately 80% of total net sales.
We maintain distribution centers around the world. Our global coverage positions us near ourcustomers’ locations and allows us to assist them in consolidating their supply base and lowering theirproduction costs. We believe our balanced sales distribution lowers our exposure to any particulargeography and improves our financial profile.
Products are generally delivered to distribution centers by our manufacturing facilities and thensubsequently delivered to the customer. In some instances, however, products are delivered directlyfrom our manufacturing facility to the customer. We contract with a wide range of transport providersto deliver our products via road, rail, sea, and air.
Seasonality and Backlog
We experience a slight seasonal pattern to our business. Overall, the third and fourth fiscalquarters are typically the strongest quarters of our fiscal year, whereas the first fiscal quarter isnegatively affected by holidays and the second fiscal quarter may be affected by adverse winter weatherconditions in some of our markets.
Certain of our end markets experience some seasonality. Our sales into the automotive market aredependent upon global automotive production, and seasonal declines in European production maynegatively impact net sales in the fourth fiscal quarter. Also, our sales into the energy market typicallyincrease in the third and fourth fiscal quarters as customer activity increases.
4
5
Customer orders typically fluctuate from quarter to quarter based upon business conditions andcancellation of unfilled orders prior to shipment of goods. Backlog by reportable segment was asfollows:
Fiscal Year End
2017 2016
(in millions)
Transportation Solutions . . . . . . . . . . . . . . . . . . . . . . . . . . . . . . . . $1,681 $1,343Industrial Solutions . . . . . . . . . . . . . . . . . . . . . . . . . . . . . . . . . . . 1,032 875Communications Solutions(1) . . . . . . . . . . . . . . . . . . . . . . . . . . . . . 1,157 1,387
Total . . . . . . . . . . . . . . . . . . . . . . . . . . . . . . . . . . . . . . . . . . . . $3,870 $3,605
(1) Includes our Subsea Communications business’ backlog of $739 million and $1,047 million at fiscalyear end 2017 and 2016, respectively. Subsea Communications is a project-based business; its backlogmay fluctuate as a result of program timing.
We expect that the majority of our backlog at fiscal year end 2017 will be filled during fiscal 2018.
Competition
The industries in which we operate are highly competitive, and we compete with thousands ofcompanies that range from large multinational corporations to local manufacturers. Competition isgenerally based on breadth of product offering, product innovation, price, quality, delivery, and service.Our markets have generally been growing but with downward pressure on prices.
Raw Materials
We use a wide variety of raw materials in the manufacture of our products. The principal rawmaterials that we use include plastic resins for molding; precious metals such as gold and silver forplating; and other metals such as copper, aluminum, brass, and steel for manufacturing cable, contacts,and other parts that are used for cable and component bodies and inserts. Many of these raw materialsare produced in a limited number of countries around the world or are only available from a limitednumber of suppliers. The prices of these materials are driven by global supply and demand.
Research and Development
We are engaged in both internal and external research and development in an effort to introducenew products to enhance the effectiveness, ease of use, safety, and reliability of our existing products,and to expand the applications for which the uses of our products are appropriate. We continuallyevaluate developing technologies in areas where we may have technological or marketing expertise forpossible investment or acquisition.
Our research and development expense was as follows:
Fiscal
2017 2016 2015
(in millions)
Transportation Solutions . . . . . . . . . . . . . . . . . . . . . . . . . . . . . $344 $312 $262Industrial Solutions . . . . . . . . . . . . . . . . . . . . . . . . . . . . . . . . 137 136 128Communications Solutions . . . . . . . . . . . . . . . . . . . . . . . . . . . 114 118 150
Total . . . . . . . . . . . . . . . . . . . . . . . . . . . . . . . . . . . . . . . . . $595 $566 $540
5
6
Our capital spending and investment in product and process engineering and development enableus to consistently provide innovative, high-quality products with efficient manufacturing methods. Infiscal 2017, we derived approximately 20% of our net sales from new products, including productextensions, introduced within the previous three fiscal years.
Intellectual Property
Patents and other proprietary rights are important to our business. We also rely upon trade secrets,manufacturing know-how, continuing technological innovations, and licensing opportunities to maintainand improve our competitive position. We review third-party proprietary rights, including patents andpatent applications, as available, in an effort to develop an effective intellectual property strategy, avoidinfringement of third-party proprietary rights, identify licensing opportunities, and monitor theintellectual property claims of others.
We own a large portfolio of patents that relate principally to electrical, optical, and electronicproducts. We also own a portfolio of trademarks and are a licensee of various patents and trademarks.Patents for individual products extend for varying periods according to the date of patent filing or grantand the legal term of patents in the various countries where patent protection is obtained. Trademarkrights may potentially extend for longer periods of time and are dependent upon national laws and useof the trademarks.
While we consider our patents and trademarks to be valued assets, we do not believe that ourcompetitive position or our operations are dependent upon or would be materially impacted by anysingle patent or group of related patents.
TE Connectivity and TE Connectivity (logo) are trademarks. � 2017 TE Connectivity Ltd. AllRights Reserved.
Management Team and Employees
We believe our management team has the experience necessary to effectively execute our strategyand advance our product and technology leadership. Our chief executive officer and segment leadersaverage over 25 years of industry experience. They are supported by an experienced and talentedmanagement team who is dedicated to maintaining and expanding our position as a global leader in theindustry.
Our strong employee base, along with their commitment to uncompromising values, provides thefoundation of our company’s success. We continue to emphasize employee development and training,and we embrace diversity and inclusion.
We have employees located throughout the world. As of fiscal year end 2017, we employedapproximately 78,000 people worldwide, of whom 24,000 were in the Americas region, 29,000 were inthe EMEA region, and 25,000 were in the Asia–Pacific region. Of our total employees, approximately49,000 were employed in manufacturing.
Government Regulation and Supervision
The import and export of products are subject to regulation by the various jurisdictions where weconduct business. A small portion of our products, including defense-related products, may requiregovernmental import and export licenses, whose issuance may be influenced by geopolitical and otherevents. We have a trade compliance organization and other systems in place to apply for licenses andotherwise comply with such regulations. Any failure to maintain compliance with domestic and foreigntrade regulation could limit our ability to import and export raw materials and finished goods into orfrom the relevant jurisdiction.
6
7
Environmental
Our operations are subject to numerous environmental, health, and safety laws and regulations,including those regulating the discharge of materials into the environment, greenhouse gas emissions,hazardous materials in products, and chemical usage. We are committed to complying with these lawsand to the protection of our employees and the environment. We maintain a global environmental,health, and safety program that includes appropriate policies and standards; staff dedicated toenvironmental, health, and safety issues; periodic compliance auditing; training; and other measures.We also have a program for compliance with the European Union (‘‘EU’’) Restriction of HazardousSubstances and Waste Electrical and Electronic Equipment Directives, the China Restriction ofHazardous Substances law, the EU Registration, Evaluation, Authorization, and Restriction ofChemicals (‘‘REACH’’) Regulation, and similar laws.
Compliance with these laws has increased our costs of doing business in a variety of ways and maycontinue to do so in the future. For example, laws regarding product content and chemical registrationrequire extensive and costly data collection, management, and reporting, and laws regulatinggreenhouse gas emissions may increase our costs for energy and certain materials and products. Wealso have projects underway at a number of current and former manufacturing sites to investigate andremediate environmental contamination resulting from past operations. Based upon our experience,available information, and applicable laws, as of fiscal year end 2017, we concluded that it was probablethat we would incur investigation and remediation costs at these sites in the range of $15 million to$43 million, and that the best estimate within this range was $19 million. We do not anticipate anymaterial capital expenditures during fiscal 2018 for environmental control facilities or other costs ofcompliance with laws or regulations relating to greenhouse gas emissions.
Available Information
All periodic and current reports, registration filings, and other filings that we are required to filewith the SEC, including Annual Reports on Form 10-K, Quarterly Reports on Form 10-Q, CurrentReports on Form 8-K, and amendments to those reports filed or furnished pursuant to Section 13(a) or15(d) of the Securities Exchange Act of 1934 (‘‘Exchange Act’’) are available free of charge throughour internet website at www.te.com. Such documents are available as soon as reasonably practicableafter electronic filing or furnishing of the material with the SEC. The information on our website is notincorporated by reference in this Annual Report on Form 10-K.
7
8
MARKET FOR REGISTRANT’S COMMON EQUITY, RELATED STOCKHOLDER MATTERS ANDISSUER PURCHASES OF EQUITY SECURITIES
Market Information
Our common shares are listed and traded on the NYSE under the symbol ‘‘TEL.’’ The followingtable sets forth the high and low closing sales prices of our common shares as reported by the NYSEfor the quarterly periods of fiscal 2017 and 2016:
Market Price Range
Fiscal
2017 2016
High Low High Low
First Quarter . . . . . . . . . . . . . . . . . . . . . . . . . . . . . . . . . . . $71.60 $61.03 $67.61 $56.85Second Quarter . . . . . . . . . . . . . . . . . . . . . . . . . . . . . . . . . 76.53 67.31 65.75 52.27Third Quarter . . . . . . . . . . . . . . . . . . . . . . . . . . . . . . . . . . 80.03 71.93 63.69 57.32Fourth Quarter . . . . . . . . . . . . . . . . . . . . . . . . . . . . . . . . . 83.22 77.61 64.54 54.83
The number of registered holders of our common shares at November 9, 2017 was 21,658.
Dividends
The following table sets forth the dividends paid on our common shares during the quarterlyperiods of fiscal 2017 and 2016:
Fiscal
2017 2016
First Quarter . . . . . . . . . . . . . . . . . . . . . . . . . . . . . . . . . . . $0.37 $0.33Second Quarter . . . . . . . . . . . . . . . . . . . . . . . . . . . . . . . . . 0.37 0.33Third Quarter . . . . . . . . . . . . . . . . . . . . . . . . . . . . . . . . . . 0.40 0.37Fourth Quarter . . . . . . . . . . . . . . . . . . . . . . . . . . . . . . . . . 0.40 0.37
Future dividends on our common shares, if any, must be approved by our shareholders. Inexercising their discretion to recommend to the shareholders that such dividends be approved, ourboard of directors will consider our results of operations, cash requirements and surplus, financialcondition, statutory requirements of applicable law, contractual restrictions, and other factors that theymay deem relevant. We may from time to time enter into financing agreements that contain financialcovenants and restrictions, some of which may limit our ability to pay dividends.
8
21DEC201700315135
9
Performance Graph
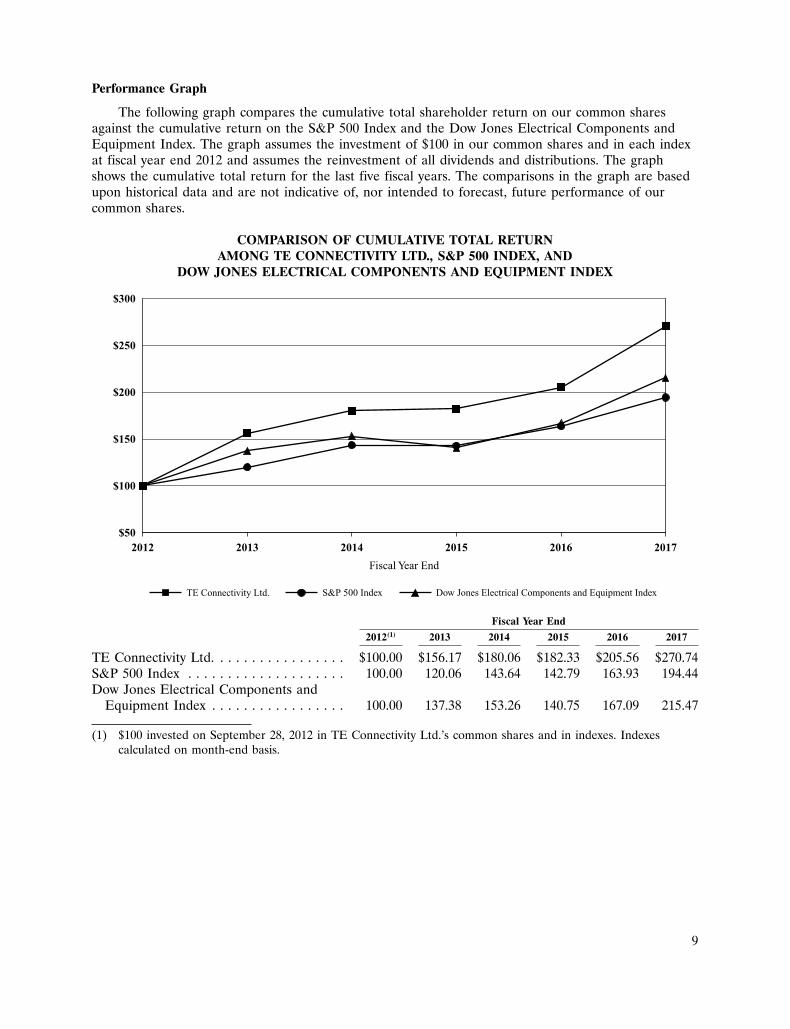
The following graph compares the cumulative total shareholder return on our common sharesagainst the cumulative return on the S&P 500 Index and the Dow Jones Electrical Components andEquipment Index. The graph assumes the investment of $100 in our common shares and in each indexat fiscal year end 2012 and assumes the reinvestment of all dividends and distributions. The graphshows the cumulative total return for the last five fiscal years. The comparisons in the graph are basedupon historical data and are not indicative of, nor intended to forecast, future performance of ourcommon shares.
COMPARISON OF CUMULATIVE TOTAL RETURNAMONG TE CONNECTIVITY LTD., S&P 500 INDEX, AND
DOW JONES ELECTRICAL COMPONENTS AND EQUIPMENT INDEX
$50
$100
$200
$150
$300
$250
2012 20172016201520142013
Fiscal Year End
TE Connectivity Ltd. S&P 500 Index Dow Jones Electrical Components and Equipment Index
Fiscal Year End
2012(1) 2013 2014 2015 2016 2017
TE Connectivity Ltd. . . . . . . . . . . . . . . . . $100.00 $156.17 $180.06 $182.33 $205.56 $270.74S&P 500 Index . . . . . . . . . . . . . . . . . . . . 100.00 120.06 143.64 142.79 163.93 194.44Dow Jones Electrical Components and
Equipment Index . . . . . . . . . . . . . . . . . 100.00 137.38 153.26 140.75 167.09 215.47
(1) $100 invested on September 28, 2012 in TE Connectivity Ltd.’s common shares and in indexes. Indexescalculated on month-end basis.
9
10
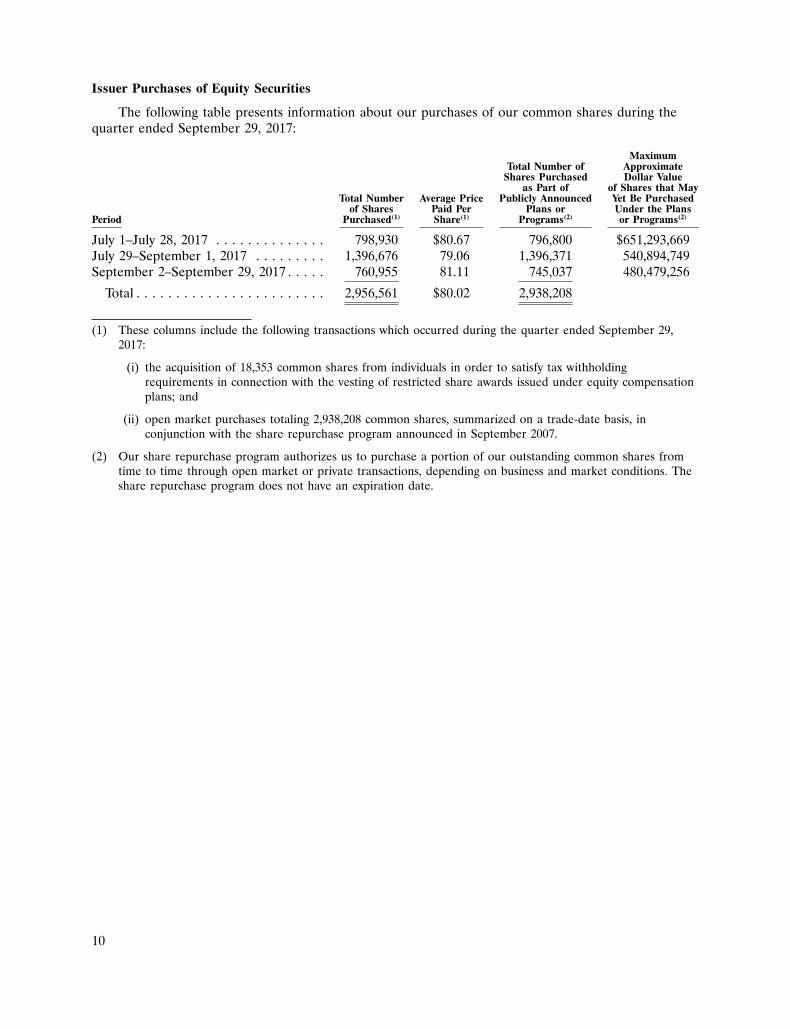
Issuer Purchases of Equity Securities
The following table presents information about our purchases of our common shares during thequarter ended September 29, 2017:
MaximumTotal Number of Approximate
Shares Purchased Dollar Valueas Part of of Shares that May
Total Number Average Price Publicly Announced Yet Be Purchasedof Shares Paid Per Plans or Under the Plans
Period Purchased(1) Share(1) Programs(2) or Programs(2)
July 1–July 28, 2017 . . . . . . . . . . . . . . 798,930 $80.67 796,800 $651,293,669July 29–September 1, 2017 . . . . . . . . . 1,396,676 79.06 1,396,371 540,894,749September 2–September 29, 2017 . . . . . 760,955 81.11 745,037 480,479,256
Total . . . . . . . . . . . . . . . . . . . . . . . . 2,956,561 $80.02 2,938,208
(1) These columns include the following transactions which occurred during the quarter ended September 29,2017:
(i) the acquisition of 18,353 common shares from individuals in order to satisfy tax withholdingrequirements in connection with the vesting of restricted share awards issued under equity compensationplans; and
(ii) open market purchases totaling 2,938,208 common shares, summarized on a trade-date basis, inconjunction with the share repurchase program announced in September 2007.
(2) Our share repurchase program authorizes us to purchase a portion of our outstanding common shares fromtime to time through open market or private transactions, depending on business and market conditions. Theshare repurchase program does not have an expiration date.
10
11
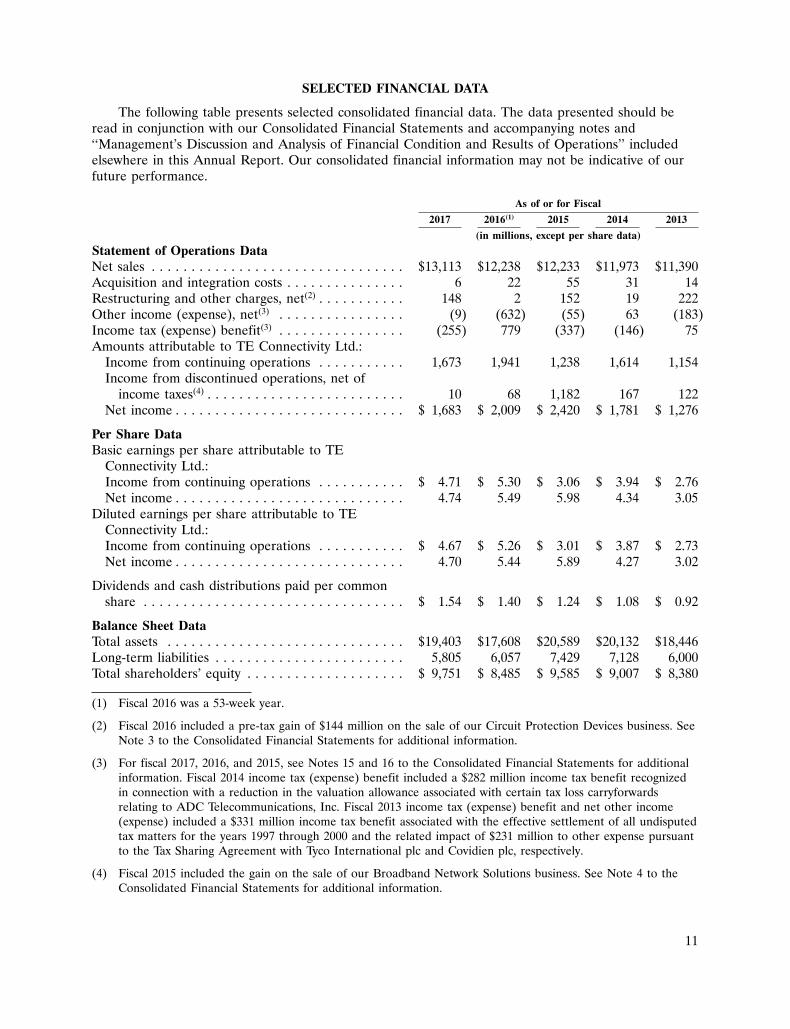
SELECTED FINANCIAL DATA
The following table presents selected consolidated financial data. The data presented should beread in conjunction with our Consolidated Financial Statements and accompanying notes and‘‘Management’s Discussion and Analysis of Financial Condition and Results of Operations’’ includedelsewhere in this Annual Report. Our consolidated financial information may not be indicative of ourfuture performance.
As of or for Fiscal
2017 2016(1) 2015 2014 2013
(in millions, except per share data)
Statement of Operations DataNet sales . . . . . . . . . . . . . . . . . . . . . . . . . . . . . . . . $13,113 $12,238 $12,233 $11,973 $11,390Acquisition and integration costs . . . . . . . . . . . . . . . 6 22 55 31 14Restructuring and other charges, net(2) . . . . . . . . . . . 148 2 152 19 222Other income (expense), net(3) . . . . . . . . . . . . . . . . (9) (632) (55) 63 (183)Income tax (expense) benefit(3) . . . . . . . . . . . . . . . . (255) 779 (337) (146) 75Amounts attributable to TE Connectivity Ltd.:
Income from continuing operations . . . . . . . . . . . 1,673 1,941 1,238 1,614 1,154Income from discontinued operations, net of
income taxes(4) . . . . . . . . . . . . . . . . . . . . . . . . . 10 68 1,182 167 122Net income . . . . . . . . . . . . . . . . . . . . . . . . . . . . . $ 1,683 $ 2,009 $ 2,420 $ 1,781 $ 1,276
Per Share DataBasic earnings per share attributable to TE
Connectivity Ltd.:Income from continuing operations . . . . . . . . . . . $ 4.71 $ 5.30 $ 3.06 $ 3.94 $ 2.76Net income . . . . . . . . . . . . . . . . . . . . . . . . . . . . . 4.74 5.49 5.98 4.34 3.05
Diluted earnings per share attributable to TEConnectivity Ltd.:Income from continuing operations . . . . . . . . . . . $ 4.67 $ 5.26 $ 3.01 $ 3.87 $ 2.73Net income . . . . . . . . . . . . . . . . . . . . . . . . . . . . . 4.70 5.44 5.89 4.27 3.02
Dividends and cash distributions paid per commonshare . . . . . . . . . . . . . . . . . . . . . . . . . . . . . . . . . $ 1.54 $ 1.40 $ 1.24 $ 1.08 $ 0.92
Balance Sheet DataTotal assets . . . . . . . . . . . . . . . . . . . . . . . . . . . . . . $19,403 $17,608 $20,589 $20,132 $18,446Long-term liabilities . . . . . . . . . . . . . . . . . . . . . . . . 5,805 6,057 7,429 7,128 6,000Total shareholders’ equity . . . . . . . . . . . . . . . . . . . . $ 9,751 $ 8,485 $ 9,585 $ 9,007 $ 8,380
(1) Fiscal 2016 was a 53-week year.
(2) Fiscal 2016 included a pre-tax gain of $144 million on the sale of our Circuit Protection Devices business. SeeNote 3 to the Consolidated Financial Statements for additional information.
(3) For fiscal 2017, 2016, and 2015, see Notes 15 and 16 to the Consolidated Financial Statements for additionalinformation. Fiscal 2014 income tax (expense) benefit included a $282 million income tax benefit recognizedin connection with a reduction in the valuation allowance associated with certain tax loss carryforwardsrelating to ADC Telecommunications, Inc. Fiscal 2013 income tax (expense) benefit and net other income(expense) included a $331 million income tax benefit associated with the effective settlement of all undisputedtax matters for the years 1997 through 2000 and the related impact of $231 million to other expense pursuantto the Tax Sharing Agreement with Tyco International plc and Covidien plc, respectively.
(4) Fiscal 2015 included the gain on the sale of our Broadband Network Solutions business. See Note 4 to theConsolidated Financial Statements for additional information.
11
12
MANAGEMENT’S DISCUSSION AND ANALYSIS OF FINANCIAL CONDITION AND RESULTS OFOPERATIONS
The following discussion and analysis of our financial condition and results of operations should beread in conjunction with our Consolidated Financial Statements and the accompanying notes includedelsewhere in this Annual Report. The following discussion may contain forward-looking statements thatreflect our plans, estimates, and beliefs. Our actual results could differ materially from those discussedin these forward-looking statements. Factors that could cause or contribute to these differences includethose factors discussed below and elsewhere in this Annual Report, particularly in ‘‘Forward-LookingInformation,’’ and in ‘‘Part I. Item 1A. Risk Factors’’ of our Annual Report on Form 10-K for the fiscalyear ended September 29, 2017 filed with the SEC.
Our Consolidated Financial Statements have been prepared in U.S. dollars, in accordance withaccounting principles generally accepted in the U.S. (‘‘GAAP’’).
The following discussion includes organic net sales growth which is a non-GAAP financialmeasure. See ‘‘Non-GAAP Financial Measure’’ for additional information regarding this measure.
Overview
We are a global technology and manufacturing leader creating a safer, sustainable, productive, andconnected future. For more than 75 years, our connectivity and sensor solutions, proven in the harshestenvironments, have enabled advancements in transportation, industrial applications, medical technology,energy, data communications, and the home.
Fiscal 2017 highlights included the following:
• Our fiscal 2017 net sales increased 7.1% over fiscal 2016 levels due to growth in theTransportation Solutions and Industrial Solutions segments and, to a lesser degree, theCommunications Solutions segment. On an organic basis, our net sales increased 6.0% in fiscal2017 as compared to fiscal 2016.
• Our net sales by segment were as follows:
• Transportation Solutions—Our net sales increased 8.2% as a result of increased sales in theautomotive and commercial transportation end markets and, to a lesser degree, the sensorsend market.
• Industrial Solutions—Our net sales increased 9.1% due to increased sales in the industrialequipment end market where we benefitted from sales contributions from recentacquisitions, partially offset by decreased sales in the aerospace, defense, oil, and gas andthe energy end markets.
• Communications Solutions—Our net sales increased 1.9% due primarily to sales increases inthe appliances and subsea communications end markets, partially offset by sales declines inthe data and devices end market resulting from the divestiture of our Circuit ProtectionDevices (‘‘CPD’’) business in fiscal 2016.
• During fiscal 2017, our shareholders approved a dividend payment to shareholders of $1.60 pershare, payable in four equal quarterly installments of $0.40 beginning in the third quarter offiscal 2017 and ending in the second quarter of fiscal 2018.
• Net cash provided by continuing operating activities was $2,322 million in fiscal 2017.
12
13
Outlook
In the first quarter of fiscal 2018, we expect our net sales to be between $3.35 billion and$3.45 billion as compared to $3,063 million in the first quarter of fiscal 2017. We expect our net salesto be between $13.7 billion and $14.1 billion in fiscal 2018 as compared to $13,113 million in fiscal2017. These increases reflect sales growth in the Transportation Solutions and Industrial Solutionssegments, and to a lesser degree, the Communications Solutions segment relative to the same periodsof fiscal 2017.
Additional information regarding expectations for our reportable segments for the first quarter offiscal 2018 as compared to the same period of fiscal 2017 and for fiscal 2018 compared to fiscal 2017 isas follows:
• Transportation Solutions—We expect our net sales to increase in the automotive end market dueprimarily to increased content per vehicle and sales contributions from a recent acquisition. Weexpect global automotive production to be flat in the first quarter of fiscal 2018 and to increaseapproximately 1% in fiscal 2018. We also expect continued growth in the commercialtransportation and sensors end markets.
• Industrial Solutions—We expect our net sales to increase in the industrial equipment end marketdue primarily to continued growth in the factory automation and controls market and themedical market.
• Communications Solutions—We expect our net sales growth in the appliances and the data anddevices end markets to be partially offset by sales declines in the subsea communications endmarket.
In the first quarter of fiscal 2018, we expect diluted earnings per share from continuing operationsto be in the range of $1.12 to $1.16 per share. We expect diluted earnings per share from continuingoperations to be in the range of $4.78 to $4.98 per share in fiscal 2018.
The above outlook is based on foreign currency exchange rates and commodity prices that areconsistent with current levels.
We are monitoring the current macroeconomic environment and its potential effects on ourcustomers and the end markets we serve. We continue to closely manage our costs in line witheconomic conditions. Additionally, we are managing our capital resources and monitoring capitalavailability to ensure that we have sufficient resources to fund future capital needs. See furtherdiscussion in ‘‘Liquidity and Capital Resources.’’
Acquisitions
During fiscal 2017, we acquired two businesses for a combined cash purchase price of $250 million,net of cash acquired.
We acquired four businesses, including the Creganna Medical group (‘‘Creganna’’), for a combinedcash purchase price of $1.3 billion, net of cash acquired, during fiscal 2016.
During fiscal 2015, we acquired Measurement Specialties, Inc. (‘‘Measurement Specialties’’), aleading global designer and manufacturer of sensors and sensor-based systems. The total value paid wasapproximately $1.7 billion, net of cash acquired, and included $225 million for the repayment ofMeasurement Specialties’ debt and accrued interest. Also during fiscal 2015, we acquired threeadditional businesses for $241 million in cash, net of cash acquired.
See Note 5 to the Consolidated Financial Statements for additional information regardingacquisitions.
13
14
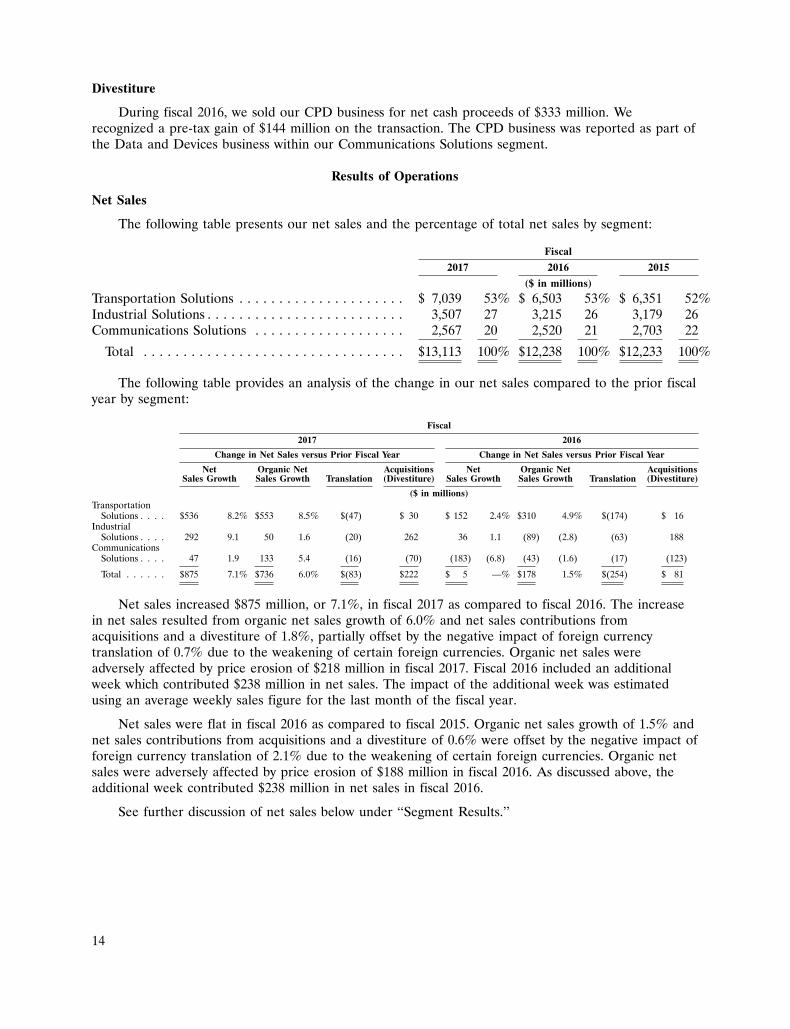
Divestiture
During fiscal 2016, we sold our CPD business for net cash proceeds of $333 million. Werecognized a pre-tax gain of $144 million on the transaction. The CPD business was reported as part ofthe Data and Devices business within our Communications Solutions segment.
Results of Operations
Net Sales
The following table presents our net sales and the percentage of total net sales by segment:
Fiscal
2017 2016 2015
($ in millions)
Transportation Solutions . . . . . . . . . . . . . . . . . . . . . $ 7,039 53% $ 6,503 53% $ 6,351 52%Industrial Solutions . . . . . . . . . . . . . . . . . . . . . . . . . 3,507 27 3,215 26 3,179 26Communications Solutions . . . . . . . . . . . . . . . . . . . 2,567 20 2,520 21 2,703 22
Total . . . . . . . . . . . . . . . . . . . . . . . . . . . . . . . . . $13,113 100% $12,238 100% $12,233 100%
The following table provides an analysis of the change in our net sales compared to the prior fiscalyear by segment:
Fiscal
2017 2016
Change in Net Sales versus Prior Fiscal Year Change in Net Sales versus Prior Fiscal Year
Net Organic Net Acquisitions Net Organic Net AcquisitionsSales Growth Sales Growth Translation (Divestiture) Sales Growth Sales Growth Translation (Divestiture)
($ in millions)Transportation
Solutions . . . . $536 8.2% $553 8.5% $(47) $ 30 $ 152 2.4% $310 4.9% $(174) $ 16Industrial
Solutions . . . . 292 9.1 50 1.6 (20) 262 36 1.1 (89) (2.8) (63) 188Communications
Solutions . . . . 47 1.9 133 5.4 (16) (70) (183) (6.8) (43) (1.6) (17) (123)
Total . . . . . . $875 7.1% $736 6.0% $(83) $222 $ 5 —% $178 1.5% $(254) $ 81
Net sales increased $875 million, or 7.1%, in fiscal 2017 as compared to fiscal 2016. The increasein net sales resulted from organic net sales growth of 6.0% and net sales contributions fromacquisitions and a divestiture of 1.8%, partially offset by the negative impact of foreign currencytranslation of 0.7% due to the weakening of certain foreign currencies. Organic net sales wereadversely affected by price erosion of $218 million in fiscal 2017. Fiscal 2016 included an additionalweek which contributed $238 million in net sales. The impact of the additional week was estimatedusing an average weekly sales figure for the last month of the fiscal year.
Net sales were flat in fiscal 2016 as compared to fiscal 2015. Organic net sales growth of 1.5% andnet sales contributions from acquisitions and a divestiture of 0.6% were offset by the negative impact offoreign currency translation of 2.1% due to the weakening of certain foreign currencies. Organic netsales were adversely affected by price erosion of $188 million in fiscal 2016. As discussed above, theadditional week contributed $238 million in net sales in fiscal 2016.
See further discussion of net sales below under ‘‘Segment Results.’’
14
15
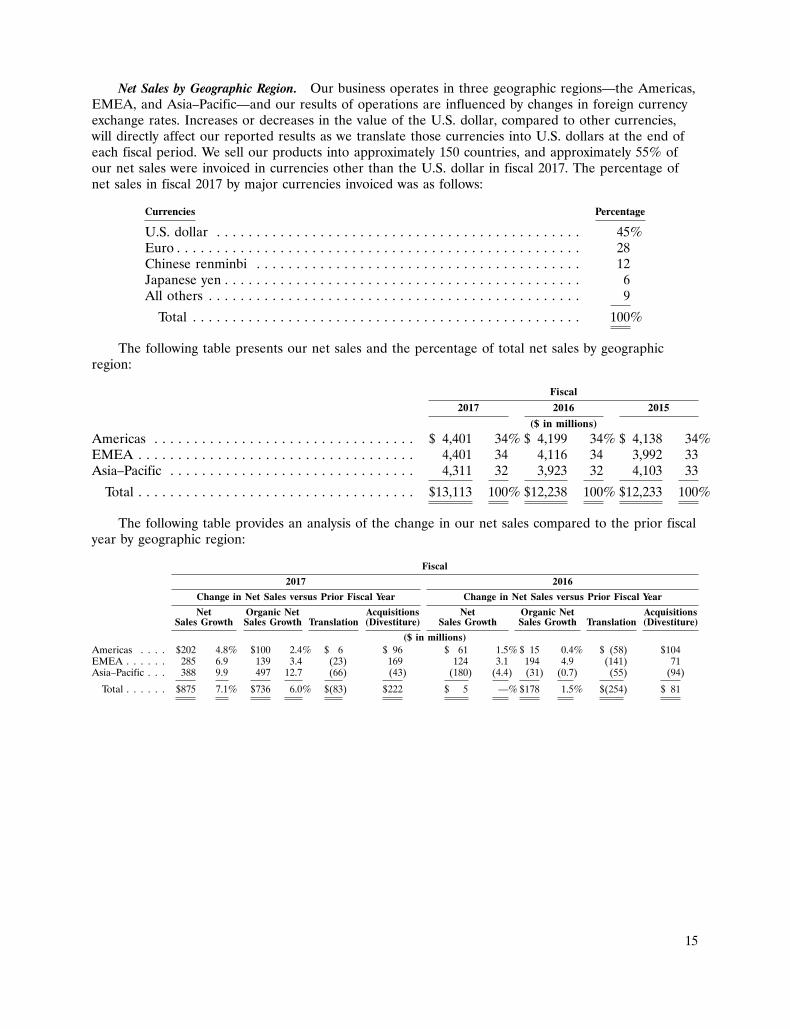
Net Sales by Geographic Region. Our business operates in three geographic regions—the Americas,EMEA, and Asia–Pacific—and our results of operations are influenced by changes in foreign currencyexchange rates. Increases or decreases in the value of the U.S. dollar, compared to other currencies,will directly affect our reported results as we translate those currencies into U.S. dollars at the end ofeach fiscal period. We sell our products into approximately 150 countries, and approximately 55% ofour net sales were invoiced in currencies other than the U.S. dollar in fiscal 2017. The percentage ofnet sales in fiscal 2017 by major currencies invoiced was as follows:
Currencies Percentage
U.S. dollar . . . . . . . . . . . . . . . . . . . . . . . . . . . . . . . . . . . . . . . . . . . . . . 45%Euro . . . . . . . . . . . . . . . . . . . . . . . . . . . . . . . . . . . . . . . . . . . . . . . . . . . 28Chinese renminbi . . . . . . . . . . . . . . . . . . . . . . . . . . . . . . . . . . . . . . . . . 12Japanese yen . . . . . . . . . . . . . . . . . . . . . . . . . . . . . . . . . . . . . . . . . . . . . 6All others . . . . . . . . . . . . . . . . . . . . . . . . . . . . . . . . . . . . . . . . . . . . . . . 9
Total . . . . . . . . . . . . . . . . . . . . . . . . . . . . . . . . . . . . . . . . . . . . . . . . . 100%
The following table presents our net sales and the percentage of total net sales by geographicregion:
Fiscal
2017 2016 2015
($ in millions)
Americas . . . . . . . . . . . . . . . . . . . . . . . . . . . . . . . . . $ 4,401 34% $ 4,199 34% $ 4,138 34%EMEA . . . . . . . . . . . . . . . . . . . . . . . . . . . . . . . . . . . 4,401 34 4,116 34 3,992 33Asia–Pacific . . . . . . . . . . . . . . . . . . . . . . . . . . . . . . . 4,311 32 3,923 32 4,103 33
Total . . . . . . . . . . . . . . . . . . . . . . . . . . . . . . . . . . . $13,113 100% $12,238 100% $12,233 100%
The following table provides an analysis of the change in our net sales compared to the prior fiscalyear by geographic region:
Fiscal
2017 2016
Change in Net Sales versus Prior Fiscal Year Change in Net Sales versus Prior Fiscal Year
Net Organic Net Acquisitions Net Organic Net AcquisitionsSales Growth Sales Growth Translation (Divestiture) Sales Growth Sales Growth Translation (Divestiture)
($ in millions)Americas . . . . $202 4.8% $100 2.4% $ 6 $ 96 $ 61 1.5% $ 15 0.4% $ (58) $104EMEA . . . . . . 285 6.9 139 3.4 (23) 169 124 3.1 194 4.9 (141) 71Asia–Pacific . . . 388 9.9 497 12.7 (66) (43) (180) (4.4) (31) (0.7) (55) (94)
Total . . . . . . $875 7.1% $736 6.0% $(83) $222 $ 5 —% $178 1.5% $(254) $ 81
15
16
Cost of Sales and Gross Margin
The following table presents cost of sales and gross margin information:
Fiscal Fiscal2017 2016Fiscal versus versus
2017 2016 2015 2016 2015
($ in millions)
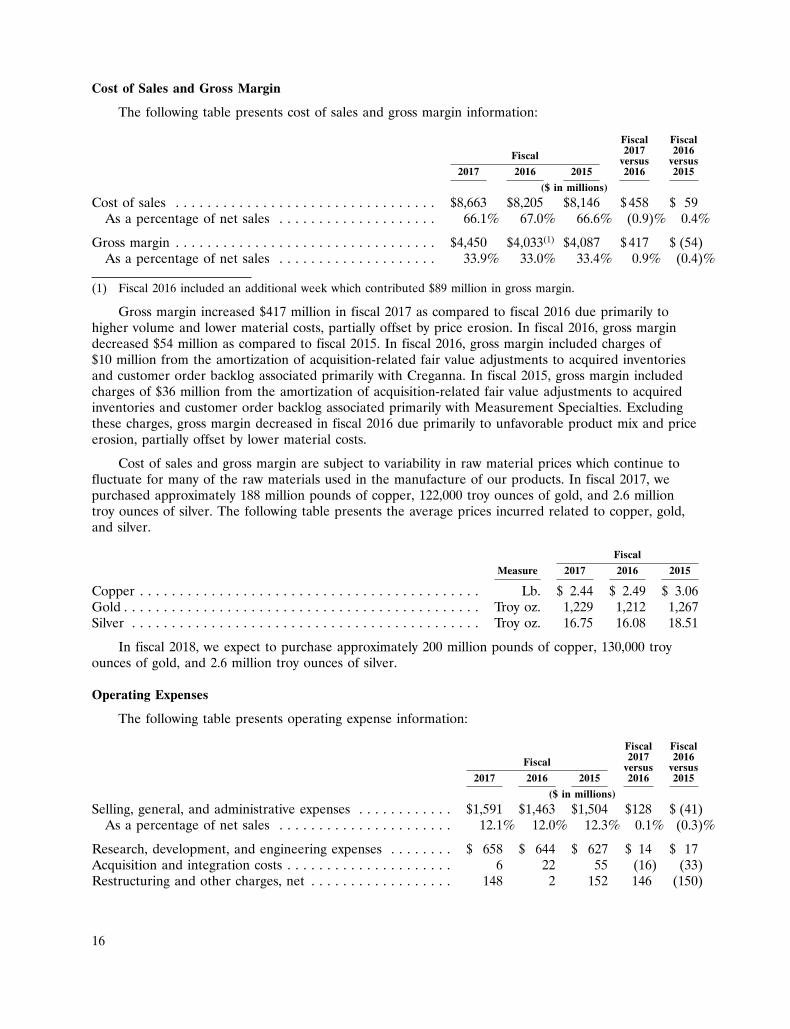
Cost of sales . . . . . . . . . . . . . . . . . . . . . . . . . . . . . . . . . $8,663 $8,205 $8,146 $ 458 $ 59As a percentage of net sales . . . . . . . . . . . . . . . . . . . . 66.1% 67.0% 66.6% (0.9)% 0.4%
Gross margin . . . . . . . . . . . . . . . . . . . . . . . . . . . . . . . . . $4,450 $4,033(1) $4,087 $ 417 $ (54)As a percentage of net sales . . . . . . . . . . . . . . . . . . . . 33.9% 33.0% 33.4% 0.9% (0.4)%
(1) Fiscal 2016 included an additional week which contributed $89 million in gross margin.
Gross margin increased $417 million in fiscal 2017 as compared to fiscal 2016 due primarily tohigher volume and lower material costs, partially offset by price erosion. In fiscal 2016, gross margindecreased $54 million as compared to fiscal 2015. In fiscal 2016, gross margin included charges of$10 million from the amortization of acquisition-related fair value adjustments to acquired inventoriesand customer order backlog associated primarily with Creganna. In fiscal 2015, gross margin includedcharges of $36 million from the amortization of acquisition-related fair value adjustments to acquiredinventories and customer order backlog associated primarily with Measurement Specialties. Excludingthese charges, gross margin decreased in fiscal 2016 due primarily to unfavorable product mix and priceerosion, partially offset by lower material costs.
Cost of sales and gross margin are subject to variability in raw material prices which continue tofluctuate for many of the raw materials used in the manufacture of our products. In fiscal 2017, wepurchased approximately 188 million pounds of copper, 122,000 troy ounces of gold, and 2.6 milliontroy ounces of silver. The following table presents the average prices incurred related to copper, gold,and silver.
Fiscal
Measure 2017 2016 2015
Copper . . . . . . . . . . . . . . . . . . . . . . . . . . . . . . . . . . . . . . . . . . . Lb. $ 2.44 $ 2.49 $ 3.06Gold . . . . . . . . . . . . . . . . . . . . . . . . . . . . . . . . . . . . . . . . . . . . . Troy oz. 1,229 1,212 1,267Silver . . . . . . . . . . . . . . . . . . . . . . . . . . . . . . . . . . . . . . . . . . . . Troy oz. 16.75 16.08 18.51
In fiscal 2018, we expect to purchase approximately 200 million pounds of copper, 130,000 troyounces of gold, and 2.6 million troy ounces of silver.
Operating Expenses
The following table presents operating expense information:
Fiscal Fiscal2017 2016Fiscal versus versus
2017 2016 2015 2016 2015
($ in millions)
Selling, general, and administrative expenses . . . . . . . . . . . . $1,591 $1,463 $1,504 $128 $ (41)As a percentage of net sales . . . . . . . . . . . . . . . . . . . . . . 12.1% 12.0% 12.3% 0.1% (0.3)%
Research, development, and engineering expenses . . . . . . . . $ 658 $ 644 $ 627 $ 14 $ 17Acquisition and integration costs . . . . . . . . . . . . . . . . . . . . . 6 22 55 (16) (33)Restructuring and other charges, net . . . . . . . . . . . . . . . . . . 148 2 152 146 (150)
16
17
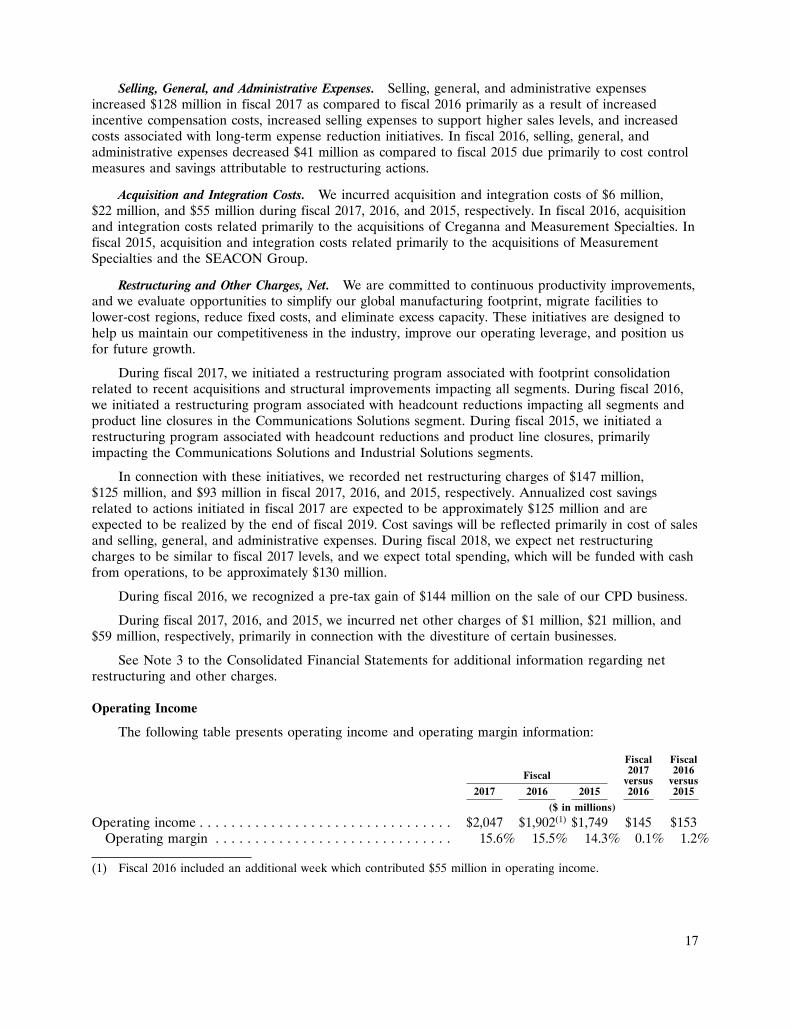
Selling, General, and Administrative Expenses. Selling, general, and administrative expensesincreased $128 million in fiscal 2017 as compared to fiscal 2016 primarily as a result of increasedincentive compensation costs, increased selling expenses to support higher sales levels, and increasedcosts associated with long-term expense reduction initiatives. In fiscal 2016, selling, general, andadministrative expenses decreased $41 million as compared to fiscal 2015 due primarily to cost controlmeasures and savings attributable to restructuring actions.
Acquisition and Integration Costs. We incurred acquisition and integration costs of $6 million,$22 million, and $55 million during fiscal 2017, 2016, and 2015, respectively. In fiscal 2016, acquisitionand integration costs related primarily to the acquisitions of Creganna and Measurement Specialties. Infiscal 2015, acquisition and integration costs related primarily to the acquisitions of MeasurementSpecialties and the SEACON Group.
Restructuring and Other Charges, Net. We are committed to continuous productivity improvements,and we evaluate opportunities to simplify our global manufacturing footprint, migrate facilities tolower-cost regions, reduce fixed costs, and eliminate excess capacity. These initiatives are designed tohelp us maintain our competitiveness in the industry, improve our operating leverage, and position usfor future growth.
During fiscal 2017, we initiated a restructuring program associated with footprint consolidationrelated to recent acquisitions and structural improvements impacting all segments. During fiscal 2016,we initiated a restructuring program associated with headcount reductions impacting all segments andproduct line closures in the Communications Solutions segment. During fiscal 2015, we initiated arestructuring program associated with headcount reductions and product line closures, primarilyimpacting the Communications Solutions and Industrial Solutions segments.
In connection with these initiatives, we recorded net restructuring charges of $147 million,$125 million, and $93 million in fiscal 2017, 2016, and 2015, respectively. Annualized cost savingsrelated to actions initiated in fiscal 2017 are expected to be approximately $125 million and areexpected to be realized by the end of fiscal 2019. Cost savings will be reflected primarily in cost of salesand selling, general, and administrative expenses. During fiscal 2018, we expect net restructuringcharges to be similar to fiscal 2017 levels, and we expect total spending, which will be funded with cashfrom operations, to be approximately $130 million.
During fiscal 2016, we recognized a pre-tax gain of $144 million on the sale of our CPD business.
During fiscal 2017, 2016, and 2015, we incurred net other charges of $1 million, $21 million, and$59 million, respectively, primarily in connection with the divestiture of certain businesses.
See Note 3 to the Consolidated Financial Statements for additional information regarding netrestructuring and other charges.
Operating Income
The following table presents operating income and operating margin information:
Fiscal Fiscal2017 2016Fiscal versus versus
2017 2016 2015 2016 2015
($ in millions)
Operating income . . . . . . . . . . . . . . . . . . . . . . . . . . . . . . . . $2,047 $1,902(1) $1,749 $145 $153Operating margin . . . . . . . . . . . . . . . . . . . . . . . . . . . . . . 15.6% 15.5% 14.3% 0.1% 1.2%
(1) Fiscal 2016 included an additional week which contributed $55 million in operating income.
17
18
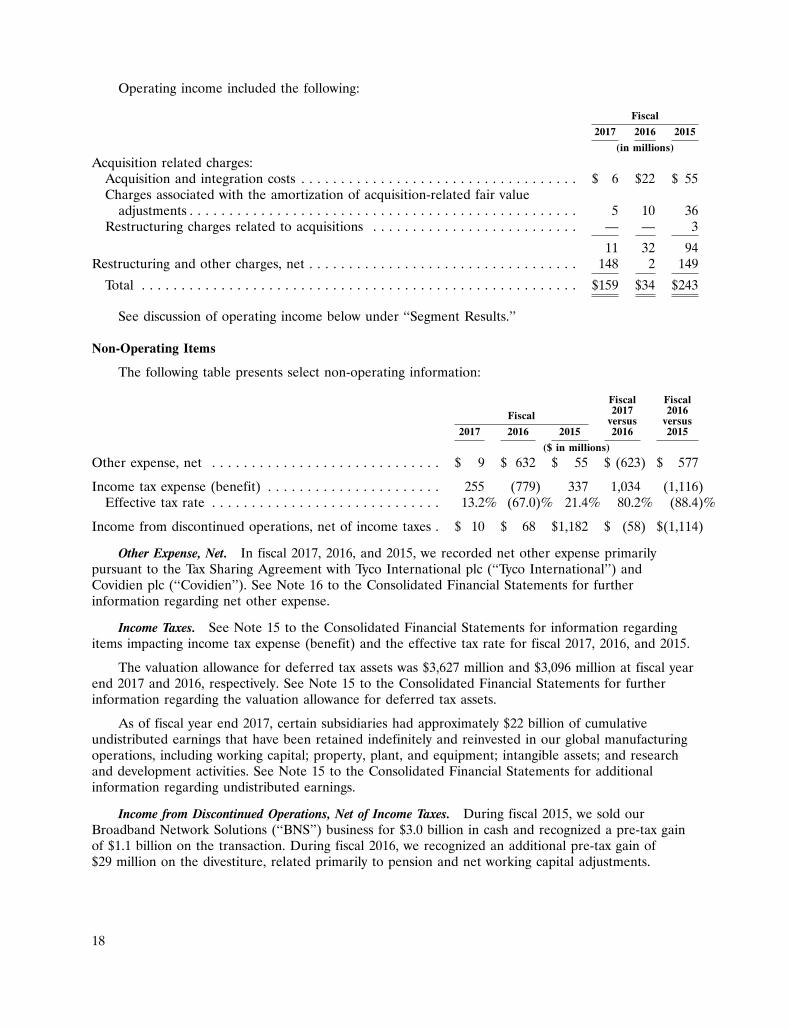
Operating income included the following:
Fiscal
2017 2016 2015
(in millions)
Acquisition related charges:Acquisition and integration costs . . . . . . . . . . . . . . . . . . . . . . . . . . . . . . . . . . . $ 6 $22 $ 55Charges associated with the amortization of acquisition-related fair value
adjustments . . . . . . . . . . . . . . . . . . . . . . . . . . . . . . . . . . . . . . . . . . . . . . . . . 5 10 36Restructuring charges related to acquisitions . . . . . . . . . . . . . . . . . . . . . . . . . . — — 3
11 32 94Restructuring and other charges, net . . . . . . . . . . . . . . . . . . . . . . . . . . . . . . . . . . 148 2 149
Total . . . . . . . . . . . . . . . . . . . . . . . . . . . . . . . . . . . . . . . . . . . . . . . . . . . . . . . $159 $34 $243
See discussion of operating income below under ‘‘Segment Results.’’
Non-Operating Items
The following table presents select non-operating information:
Fiscal Fiscal2017 2016Fiscal versus versus
2017 2016 2015 2016 2015
($ in millions)
Other expense, net . . . . . . . . . . . . . . . . . . . . . . . . . . . . . $ 9 $ 632 $ 55 $ (623) $ 577
Income tax expense (benefit) . . . . . . . . . . . . . . . . . . . . . . 255 (779) 337 1,034 (1,116)Effective tax rate . . . . . . . . . . . . . . . . . . . . . . . . . . . . . 13.2% (67.0)% 21.4% 80.2% (88.4)%
Income from discontinued operations, net of income taxes . $ 10 $ 68 $1,182 $ (58) $(1,114)
Other Expense, Net. In fiscal 2017, 2016, and 2015, we recorded net other expense primarilypursuant to the Tax Sharing Agreement with Tyco International plc (‘‘Tyco International’’) andCovidien plc (‘‘Covidien’’). See Note 16 to the Consolidated Financial Statements for furtherinformation regarding net other expense.
Income Taxes. See Note 15 to the Consolidated Financial Statements for information regardingitems impacting income tax expense (benefit) and the effective tax rate for fiscal 2017, 2016, and 2015.
The valuation allowance for deferred tax assets was $3,627 million and $3,096 million at fiscal yearend 2017 and 2016, respectively. See Note 15 to the Consolidated Financial Statements for furtherinformation regarding the valuation allowance for deferred tax assets.
As of fiscal year end 2017, certain subsidiaries had approximately $22 billion of cumulativeundistributed earnings that have been retained indefinitely and reinvested in our global manufacturingoperations, including working capital; property, plant, and equipment; intangible assets; and researchand development activities. See Note 15 to the Consolidated Financial Statements for additionalinformation regarding undistributed earnings.
Income from Discontinued Operations, Net of Income Taxes. During fiscal 2015, we sold ourBroadband Network Solutions (‘‘BNS’’) business for $3.0 billion in cash and recognized a pre-tax gainof $1.1 billion on the transaction. During fiscal 2016, we recognized an additional pre-tax gain of$29 million on the divestiture, related primarily to pension and net working capital adjustments.
18
19
In fiscal 2006, the former shareholders of Com-Net initiated a lawsuit related to our fiscal 2001acquisition of Com-Net. In connection with the Com-Net case, we recorded a reserve and pre-taxcharges of $127 million during fiscal 2015. During fiscal 2016, we recorded pre-tax credits of$30 million, representing a release of excess reserves. These amounts were reflected in income fromdiscontinued operations on the Consolidated Statements of Operations as the Com-Net case wasassociated with our former Wireless Systems business which was sold in fiscal 2009.
The BNS and Wireless Systems businesses met the discontinued operations criteria and werereported as such in all periods presented on the Consolidated Financial Statements. Prior toreclassification to discontinued operations, the BNS and Wireless Systems businesses were included inthe former Network Solutions and Wireless Systems segments, respectively. See Note 4 to theConsolidated Financial Statements for additional information regarding discontinued operations.
Segment Results
Transportation Solutions
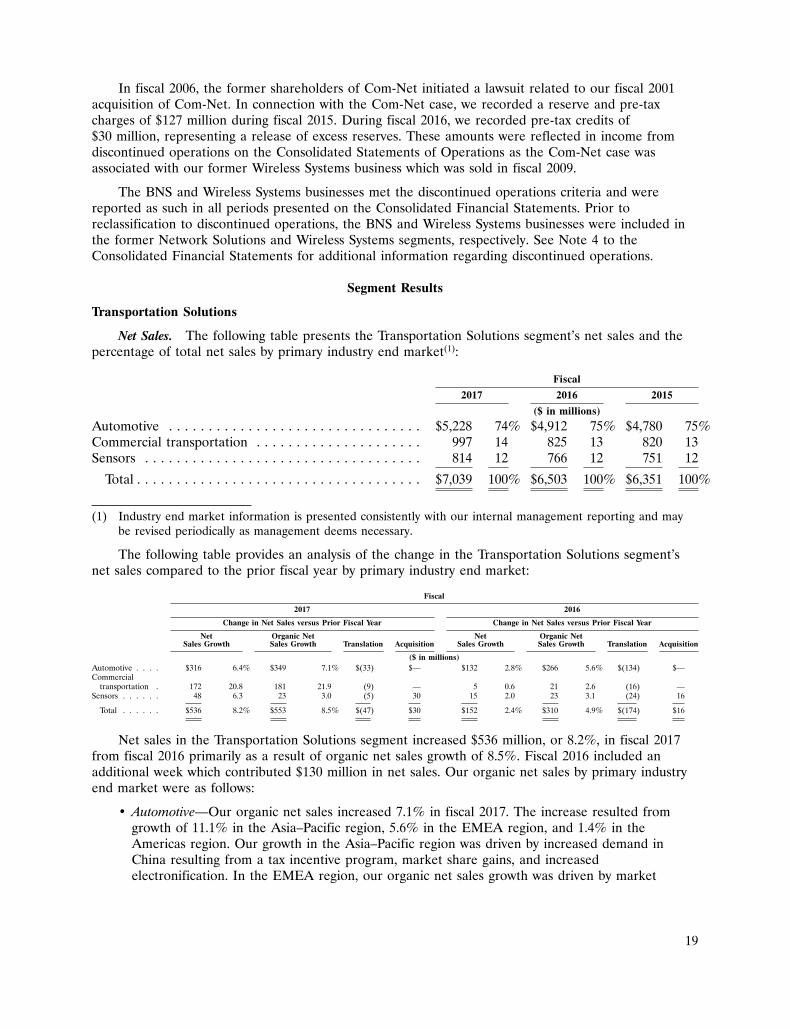
Net Sales. The following table presents the Transportation Solutions segment’s net sales and thepercentage of total net sales by primary industry end market(1):
Fiscal
2017 2016 2015
($ in millions)
Automotive . . . . . . . . . . . . . . . . . . . . . . . . . . . . . . . . $5,228 74% $4,912 75% $4,780 75%Commercial transportation . . . . . . . . . . . . . . . . . . . . . 997 14 825 13 820 13Sensors . . . . . . . . . . . . . . . . . . . . . . . . . . . . . . . . . . . 814 12 766 12 751 12
Total . . . . . . . . . . . . . . . . . . . . . . . . . . . . . . . . . . . . $7,039 100% $6,503 100% $6,351 100%
(1) Industry end market information is presented consistently with our internal management reporting and maybe revised periodically as management deems necessary.
The following table provides an analysis of the change in the Transportation Solutions segment’snet sales compared to the prior fiscal year by primary industry end market:
Fiscal
2017 2016
Change in Net Sales versus Prior Fiscal Year Change in Net Sales versus Prior Fiscal Year
Net Organic Net Net Organic NetSales Growth Sales Growth Translation Acquisition Sales Growth Sales Growth Translation Acquisition
($ in millions)Automotive . . . . $316 6.4% $349 7.1% $(33) $— $132 2.8% $266 5.6% $(134) $—Commercial
transportation . 172 20.8 181 21.9 (9) — 5 0.6 21 2.6 (16) —Sensors . . . . . . 48 6.3 23 3.0 (5) 30 15 2.0 23 3.1 (24) 16
Total . . . . . . $536 8.2% $553 8.5% $(47) $30 $152 2.4% $310 4.9% $(174) $16
Net sales in the Transportation Solutions segment increased $536 million, or 8.2%, in fiscal 2017from fiscal 2016 primarily as a result of organic net sales growth of 8.5%. Fiscal 2016 included anadditional week which contributed $130 million in net sales. Our organic net sales by primary industryend market were as follows:
• Automotive—Our organic net sales increased 7.1% in fiscal 2017. The increase resulted fromgrowth of 11.1% in the Asia–Pacific region, 5.6% in the EMEA region, and 1.4% in theAmericas region. Our growth in the Asia–Pacific region was driven by increased demand inChina resulting from a tax incentive program, market share gains, and increasedelectronification. In the EMEA region, our organic net sales growth was driven by market
19
20
growth, electronification, and new model launches. Our growth in the Americas region resultedfrom continued market recovery in South America.
• Commercial transportation—Our organic net sales increased 21.9% in fiscal 2017 primarily as aresult of growth in the heavy truck market in all regions and content gains in China.
• Sensors—Our organic net sales increased 3.0% in fiscal 2017 due primarily to growth in theindustrial equipment and commercial transportation markets, partially offset by declines in thedata and devices market.
In fiscal 2016, net sales in the Transportation Solutions segment increased $152 million, or 2.4%,from fiscal 2015 due primarily to organic net sales growth of 4.9%, partially offset by the negativeimpact of foreign currency translation of 2.7%. As discussed above, the additional week contributed$130 million in net sales in fiscal 2016. Our organic net sales by primary industry end market were asfollows:
• Automotive—Our organic net sales increased 5.6% in fiscal 2016. The increase was due primarilyto growth of 8.4% in the Asia–Pacific region and 5.9% in the EMEA region, partially offset by adecrease of 0.9% in the Americas region. In the Asia–Pacific region, our growth was driven byincreased electronification and market share gains in China. In the EMEA region, our organicnet sales increased due to electronification and new model launches. The Americas region wasadversely impacted by market weakness in North America and macroeconomic conditions inSouth America.
• Commercial transportation—Our organic net sales increased 2.6% in fiscal 2016 due primarily togrowth in the heavy truck market in the EMEA region and China.
• Sensors—Our organic net sales increased 3.1% in fiscal 2016 primarily as a result of increasedsales in the automotive, aerospace and defense, and industrial equipment markets.
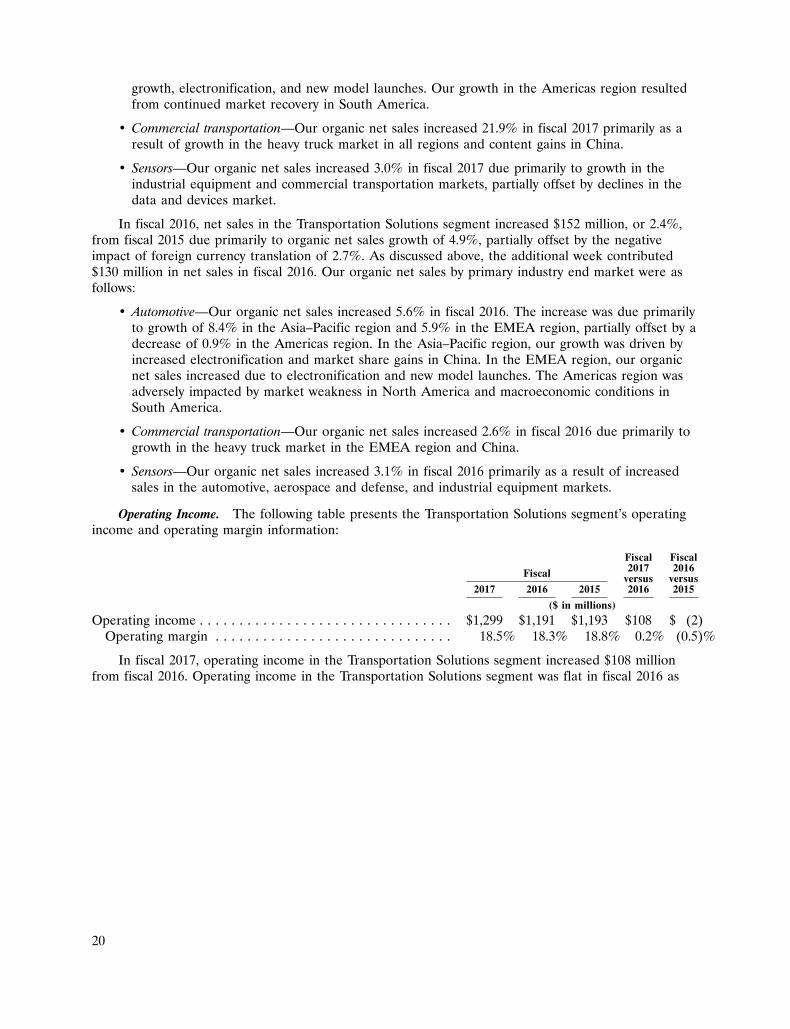
Operating Income. The following table presents the Transportation Solutions segment’s operatingincome and operating margin information:
Fiscal Fiscal2017 2016Fiscal versus versus
2017 2016 2015 2016 2015
($ in millions)
Operating income . . . . . . . . . . . . . . . . . . . . . . . . . . . . . . . . $1,299 $1,191 $1,193 $108 $ (2)Operating margin . . . . . . . . . . . . . . . . . . . . . . . . . . . . . . 18.5% 18.3% 18.8% 0.2% (0.5)%
In fiscal 2017, operating income in the Transportation Solutions segment increased $108 millionfrom fiscal 2016. Operating income in the Transportation Solutions segment was flat in fiscal 2016 as
20
21
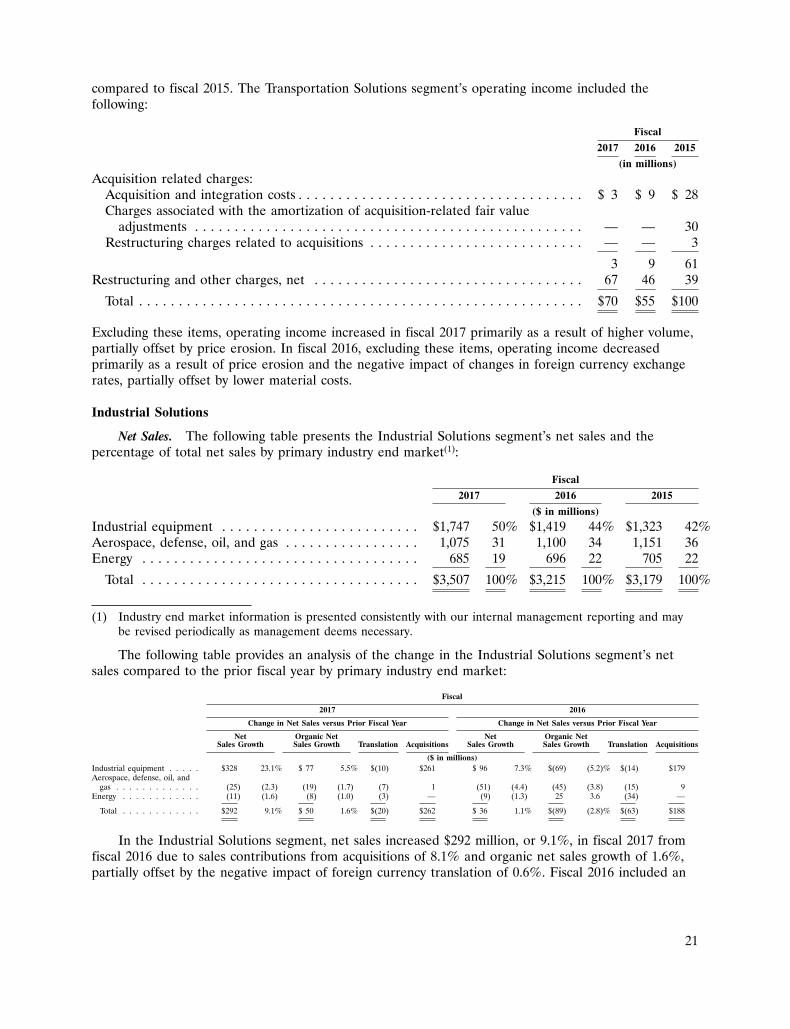
compared to fiscal 2015. The Transportation Solutions segment’s operating income included thefollowing:
Fiscal
2017 2016 2015
(in millions)
Acquisition related charges:Acquisition and integration costs . . . . . . . . . . . . . . . . . . . . . . . . . . . . . . . . . . . . $ 3 $ 9 $ 28Charges associated with the amortization of acquisition-related fair value
adjustments . . . . . . . . . . . . . . . . . . . . . . . . . . . . . . . . . . . . . . . . . . . . . . . . . — — 30Restructuring charges related to acquisitions . . . . . . . . . . . . . . . . . . . . . . . . . . . — — 3
3 9 61Restructuring and other charges, net . . . . . . . . . . . . . . . . . . . . . . . . . . . . . . . . . . 67 46 39
Total . . . . . . . . . . . . . . . . . . . . . . . . . . . . . . . . . . . . . . . . . . . . . . . . . . . . . . . . $70 $55 $100
Excluding these items, operating income increased in fiscal 2017 primarily as a result of higher volume,partially offset by price erosion. In fiscal 2016, excluding these items, operating income decreasedprimarily as a result of price erosion and the negative impact of changes in foreign currency exchangerates, partially offset by lower material costs.
Industrial Solutions
Net Sales. The following table presents the Industrial Solutions segment’s net sales and thepercentage of total net sales by primary industry end market(1):
Fiscal
2017 2016 2015
($ in millions)
Industrial equipment . . . . . . . . . . . . . . . . . . . . . . . . . $1,747 50% $1,419 44% $1,323 42%Aerospace, defense, oil, and gas . . . . . . . . . . . . . . . . . 1,075 31 1,100 34 1,151 36Energy . . . . . . . . . . . . . . . . . . . . . . . . . . . . . . . . . . . 685 19 696 22 705 22
Total . . . . . . . . . . . . . . . . . . . . . . . . . . . . . . . . . . . $3,507 100% $3,215 100% $3,179 100%
(1) Industry end market information is presented consistently with our internal management reporting and maybe revised periodically as management deems necessary.
The following table provides an analysis of the change in the Industrial Solutions segment’s netsales compared to the prior fiscal year by primary industry end market:
Fiscal
2017 2016
Change in Net Sales versus Prior Fiscal Year Change in Net Sales versus Prior Fiscal Year
Net Organic Net Net Organic NetSales Growth Sales Growth Translation Acquisitions Sales Growth Sales Growth Translation Acquisitions
($ in millions)Industrial equipment . . . . . $328 23.1% $ 77 5.5% $(10) $261 $ 96 7.3% $(69) (5.2)% $(14) $179Aerospace, defense, oil, and
gas . . . . . . . . . . . . . (25) (2.3) (19) (1.7) (7) 1 (51) (4.4) (45) (3.8) (15) 9Energy . . . . . . . . . . . . (11) (1.6) (8) (1.0) (3) — (9) (1.3) 25 3.6 (34) —
Total . . . . . . . . . . . . $292 9.1% $ 50 1.6% $(20) $262 $ 36 1.1% $(89) (2.8)% $(63) $188
In the Industrial Solutions segment, net sales increased $292 million, or 9.1%, in fiscal 2017 fromfiscal 2016 due to sales contributions from acquisitions of 8.1% and organic net sales growth of 1.6%,partially offset by the negative impact of foreign currency translation of 0.6%. Fiscal 2016 included an
21
22
additional week which contributed $65 million in net sales. Our organic net sales by primary industryend market were as follows:
• Industrial equipment—Our organic net sales increased 5.5% in fiscal 2017 due primarily togrowth in the factory automation and controls market and the medical market.
• Aerospace, defense, oil, and gas—Our organic net sales decreased 1.7% in fiscal 2017 due tocontinued weakness in the oil and gas market and declines in our sales into the commercialaerospace market, partially offset by growth in the defense market.
• Energy—Our organic net sales decreased 1.0% in fiscal 2017 due to declines in the EMEA andAmericas regions, partially offset by growth in the Asia–Pacific region.
Net sales in the Industrial Solutions segment increased $36 million, or 1.1%, in fiscal 2016 ascompared to fiscal 2015 due to sales contributions from acquisitions of 5.9%, partially offset by organicnet sales declines of 2.8% and the negative impact of foreign currency translation of 2.0%. As discussedabove, the additional week contributed $65 million in net sales in fiscal 2016. Our organic net sales byprimary industry end market were as follows:
• Industrial equipment—Our organic net sales decreased 5.2% in fiscal 2016 as a result ofweakness in industrial markets, particularly in the Americas and Asia–Pacific regions.
• Aerospace, defense, oil, and gas—Our organic net sales decreased 3.8% in fiscal 2016. Thedecrease was attributable to declines in the oil and gas market, partially offset by growth in thecommercial aerospace market and, to a lesser degree, the defense market. In the oil and gasmarket, our organic net sales decrease was due to continued market weakness resulting fromdeclines in oil prices. In the commercial aerospace market, our organic net sales increased dueprimarily to customer growth and market share gains.
• Energy—Our organic net sales increased 3.6% in fiscal 2016 primarily as a result of growth inthe Americas and EMEA regions.
Operating Income. The following table presents the Industrial Solutions segment’s operatingincome and operating margin information:
Fiscal Fiscal2017 2016Fiscal versus versus
2017 2016 2015 2016 2015
($ in millions)
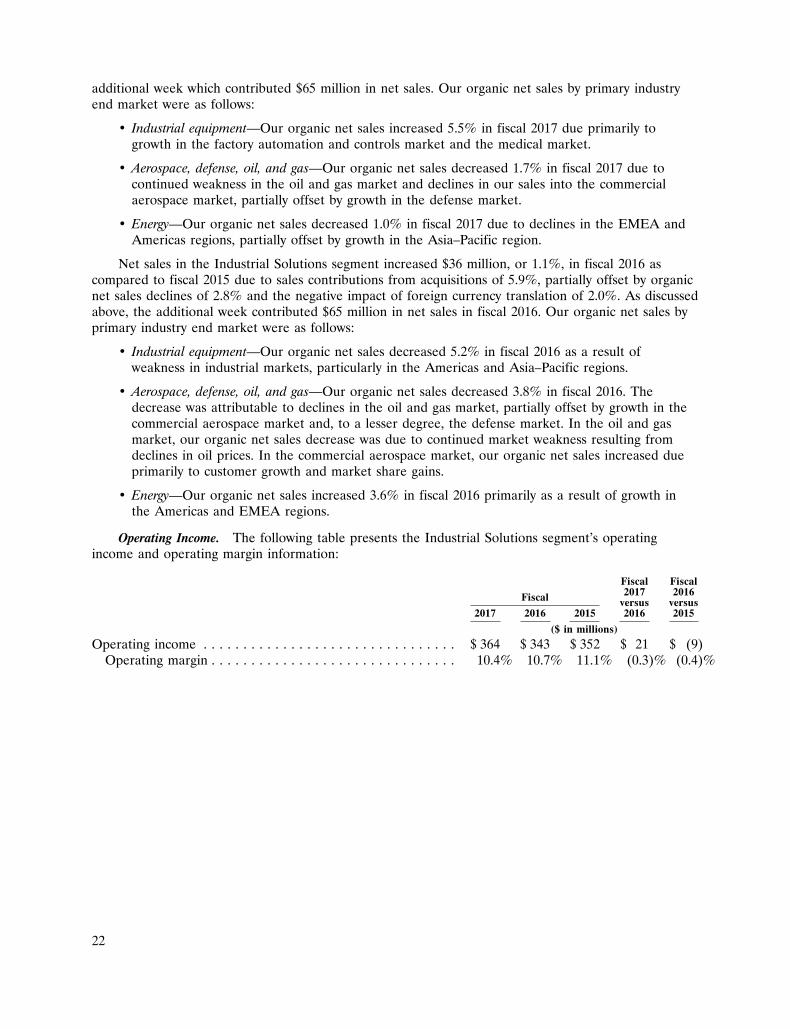
Operating income . . . . . . . . . . . . . . . . . . . . . . . . . . . . . . . . $ 364 $ 343 $ 352 $ 21 $ (9)Operating margin . . . . . . . . . . . . . . . . . . . . . . . . . . . . . . . 10.4% 10.7% 11.1% (0.3)% (0.4)%
22
23
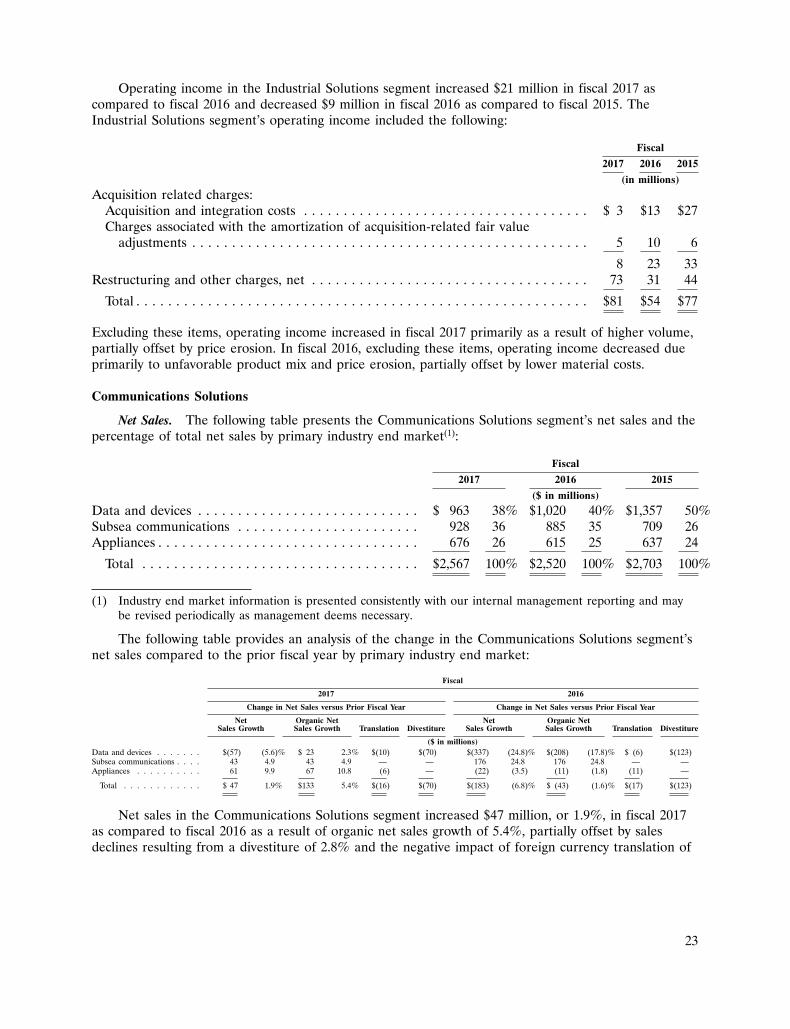
Operating income in the Industrial Solutions segment increased $21 million in fiscal 2017 ascompared to fiscal 2016 and decreased $9 million in fiscal 2016 as compared to fiscal 2015. TheIndustrial Solutions segment’s operating income included the following:
Fiscal
2017 2016 2015
(in millions)
Acquisition related charges:Acquisition and integration costs . . . . . . . . . . . . . . . . . . . . . . . . . . . . . . . . . . . . $ 3 $13 $27Charges associated with the amortization of acquisition-related fair value
adjustments . . . . . . . . . . . . . . . . . . . . . . . . . . . . . . . . . . . . . . . . . . . . . . . . . . 5 10 6
8 23 33Restructuring and other charges, net . . . . . . . . . . . . . . . . . . . . . . . . . . . . . . . . . . . 73 31 44
Total . . . . . . . . . . . . . . . . . . . . . . . . . . . . . . . . . . . . . . . . . . . . . . . . . . . . . . . . . $81 $54 $77
Excluding these items, operating income increased in fiscal 2017 primarily as a result of higher volume,partially offset by price erosion. In fiscal 2016, excluding these items, operating income decreased dueprimarily to unfavorable product mix and price erosion, partially offset by lower material costs.
Communications Solutions
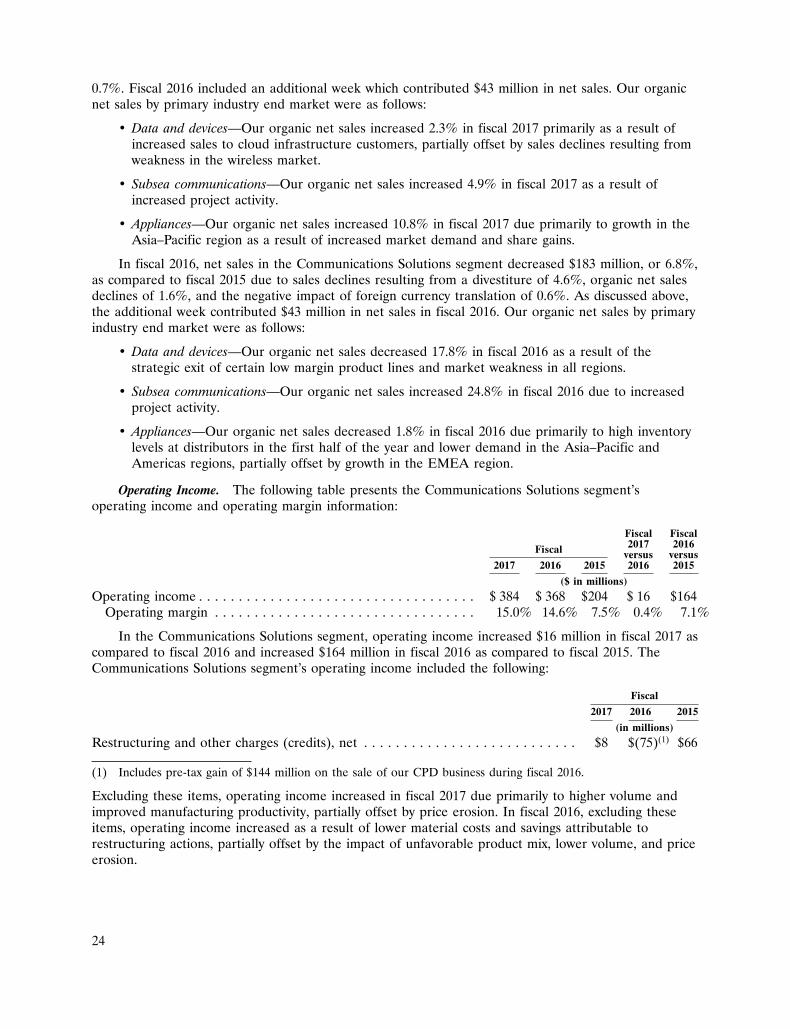
Net Sales. The following table presents the Communications Solutions segment’s net sales and thepercentage of total net sales by primary industry end market(1):
Fiscal
2017 2016 2015
($ in millions)
Data and devices . . . . . . . . . . . . . . . . . . . . . . . . . . . . $ 963 38% $1,020 40% $1,357 50%Subsea communications . . . . . . . . . . . . . . . . . . . . . . . 928 36 885 35 709 26Appliances . . . . . . . . . . . . . . . . . . . . . . . . . . . . . . . . . 676 26 615 25 637 24
Total . . . . . . . . . . . . . . . . . . . . . . . . . . . . . . . . . . . $2,567 100% $2,520 100% $2,703 100%
(1) Industry end market information is presented consistently with our internal management reporting and maybe revised periodically as management deems necessary.
The following table provides an analysis of the change in the Communications Solutions segment’snet sales compared to the prior fiscal year by primary industry end market:
Fiscal
2017 2016
Change in Net Sales versus Prior Fiscal Year Change in Net Sales versus Prior Fiscal Year
Net Organic Net Net Organic NetSales Growth Sales Growth Translation Divestiture Sales Growth Sales Growth Translation Divestiture
($ in millions)Data and devices . . . . . . . $(57) (5.6)% $ 23 2.3% $(10) $(70) $(337) (24.8)% $(208) (17.8)% $ (6) $(123)Subsea communications . . . . 43 4.9 43 4.9 — — 176 24.8 176 24.8 — —Appliances . . . . . . . . . . 61 9.9 67 10.8 (6) — (22) (3.5) (11) (1.8) (11) —
Total . . . . . . . . . . . . $ 47 1.9% $133 5.4% $(16) $(70) $(183) (6.8)% $ (43) (1.6)% $(17) $(123)
Net sales in the Communications Solutions segment increased $47 million, or 1.9%, in fiscal 2017as compared to fiscal 2016 as a result of organic net sales growth of 5.4%, partially offset by salesdeclines resulting from a divestiture of 2.8% and the negative impact of foreign currency translation of
23
24
0.7%. Fiscal 2016 included an additional week which contributed $43 million in net sales. Our organicnet sales by primary industry end market were as follows:
• Data and devices—Our organic net sales increased 2.3% in fiscal 2017 primarily as a result ofincreased sales to cloud infrastructure customers, partially offset by sales declines resulting fromweakness in the wireless market.
• Subsea communications—Our organic net sales increased 4.9% in fiscal 2017 as a result ofincreased project activity.
• Appliances—Our organic net sales increased 10.8% in fiscal 2017 due primarily to growth in theAsia–Pacific region as a result of increased market demand and share gains.
In fiscal 2016, net sales in the Communications Solutions segment decreased $183 million, or 6.8%,as compared to fiscal 2015 due to sales declines resulting from a divestiture of 4.6%, organic net salesdeclines of 1.6%, and the negative impact of foreign currency translation of 0.6%. As discussed above,the additional week contributed $43 million in net sales in fiscal 2016. Our organic net sales by primaryindustry end market were as follows:
• Data and devices—Our organic net sales decreased 17.8% in fiscal 2016 as a result of thestrategic exit of certain low margin product lines and market weakness in all regions.
• Subsea communications—Our organic net sales increased 24.8% in fiscal 2016 due to increasedproject activity.
• Appliances—Our organic net sales decreased 1.8% in fiscal 2016 due primarily to high inventorylevels at distributors in the first half of the year and lower demand in the Asia–Pacific andAmericas regions, partially offset by growth in the EMEA region.
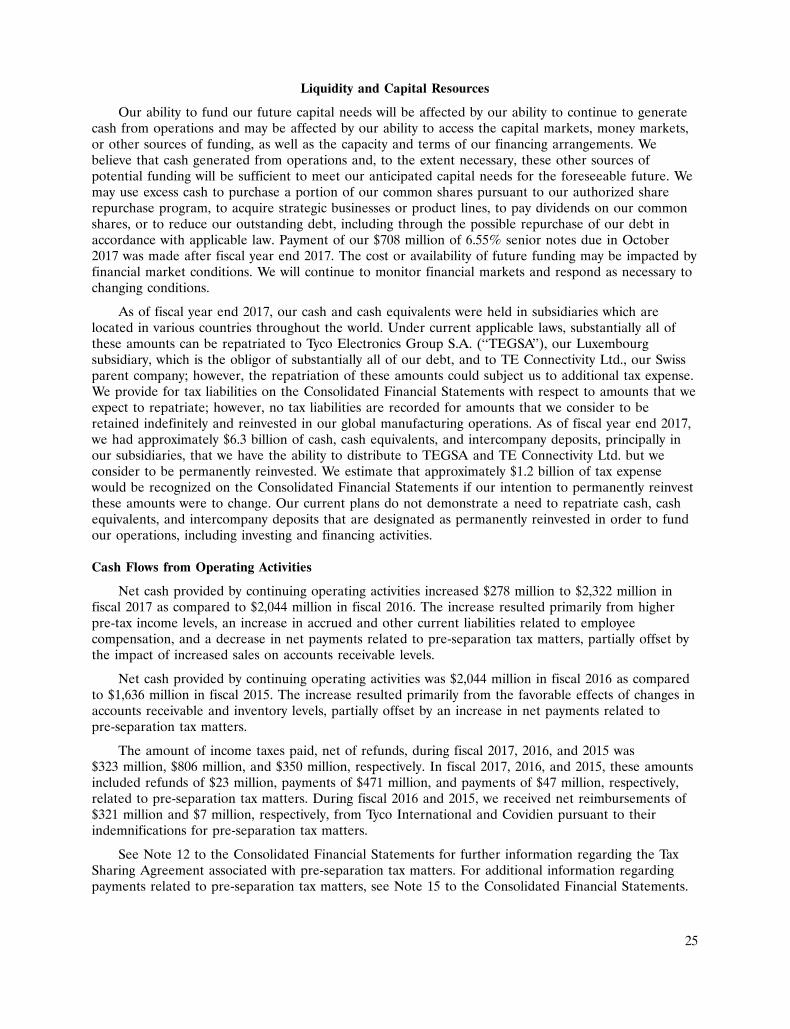
Operating Income. The following table presents the Communications Solutions segment’soperating income and operating margin information:
Fiscal Fiscal2017 2016Fiscal versus versus
2017 2016 2015 2016 2015
($ in millions)
Operating income . . . . . . . . . . . . . . . . . . . . . . . . . . . . . . . . . . . $ 384 $ 368 $204 $ 16 $164Operating margin . . . . . . . . . . . . . . . . . . . . . . . . . . . . . . . . . 15.0% 14.6% 7.5% 0.4% 7.1%
In the Communications Solutions segment, operating income increased $16 million in fiscal 2017 ascompared to fiscal 2016 and increased $164 million in fiscal 2016 as compared to fiscal 2015. TheCommunications Solutions segment’s operating income included the following:
Fiscal
2017 2016 2015
(in millions)
Restructuring and other charges (credits), net . . . . . . . . . . . . . . . . . . . . . . . . . . . $8 $(75)(1) $66
(1) Includes pre-tax gain of $144 million on the sale of our CPD business during fiscal 2016.
Excluding these items, operating income increased in fiscal 2017 due primarily to higher volume andimproved manufacturing productivity, partially offset by price erosion. In fiscal 2016, excluding theseitems, operating income increased as a result of lower material costs and savings attributable torestructuring actions, partially offset by the impact of unfavorable product mix, lower volume, and priceerosion.
24
25
Liquidity and Capital Resources
Our ability to fund our future capital needs will be affected by our ability to continue to generatecash from operations and may be affected by our ability to access the capital markets, money markets,or other sources of funding, as well as the capacity and terms of our financing arrangements. Webelieve that cash generated from operations and, to the extent necessary, these other sources ofpotential funding will be sufficient to meet our anticipated capital needs for the foreseeable future. Wemay use excess cash to purchase a portion of our common shares pursuant to our authorized sharerepurchase program, to acquire strategic businesses or product lines, to pay dividends on our commonshares, or to reduce our outstanding debt, including through the possible repurchase of our debt inaccordance with applicable law. Payment of our $708 million of 6.55% senior notes due in October2017 was made after fiscal year end 2017. The cost or availability of future funding may be impacted byfinancial market conditions. We will continue to monitor financial markets and respond as necessary tochanging conditions.
As of fiscal year end 2017, our cash and cash equivalents were held in subsidiaries which arelocated in various countries throughout the world. Under current applicable laws, substantially all ofthese amounts can be repatriated to Tyco Electronics Group S.A. (‘‘TEGSA’’), our Luxembourgsubsidiary, which is the obligor of substantially all of our debt, and to TE Connectivity Ltd., our Swissparent company; however, the repatriation of these amounts could subject us to additional tax expense.We provide for tax liabilities on the Consolidated Financial Statements with respect to amounts that weexpect to repatriate; however, no tax liabilities are recorded for amounts that we consider to beretained indefinitely and reinvested in our global manufacturing operations. As of fiscal year end 2017,we had approximately $6.3 billion of cash, cash equivalents, and intercompany deposits, principally inour subsidiaries, that we have the ability to distribute to TEGSA and TE Connectivity Ltd. but weconsider to be permanently reinvested. We estimate that approximately $1.2 billion of tax expensewould be recognized on the Consolidated Financial Statements if our intention to permanently reinvestthese amounts were to change. Our current plans do not demonstrate a need to repatriate cash, cashequivalents, and intercompany deposits that are designated as permanently reinvested in order to fundour operations, including investing and financing activities.
Cash Flows from Operating Activities
Net cash provided by continuing operating activities increased $278 million to $2,322 million infiscal 2017 as compared to $2,044 million in fiscal 2016. The increase resulted primarily from higherpre-tax income levels, an increase in accrued and other current liabilities related to employeecompensation, and a decrease in net payments related to pre-separation tax matters, partially offset bythe impact of increased sales on accounts receivable levels.
Net cash provided by continuing operating activities was $2,044 million in fiscal 2016 as comparedto $1,636 million in fiscal 2015. The increase resulted primarily from the favorable effects of changes inaccounts receivable and inventory levels, partially offset by an increase in net payments related topre-separation tax matters.
The amount of income taxes paid, net of refunds, during fiscal 2017, 2016, and 2015 was$323 million, $806 million, and $350 million, respectively. In fiscal 2017, 2016, and 2015, these amountsincluded refunds of $23 million, payments of $471 million, and payments of $47 million, respectively,related to pre-separation tax matters. During fiscal 2016 and 2015, we received net reimbursements of$321 million and $7 million, respectively, from Tyco International and Covidien pursuant to theirindemnifications for pre-separation tax matters.
See Note 12 to the Consolidated Financial Statements for further information regarding the TaxSharing Agreement associated with pre-separation tax matters. For additional information regardingpayments related to pre-separation tax matters, see Note 15 to the Consolidated Financial Statements.
25
26
Pension contributions in fiscal 2017, 2016, and 2015 were $48 million, $67 million, and $66 million,respectively. We expect pension contributions to be $62 million in fiscal 2018, before consideration ofany voluntary contributions. There were no voluntary pension contributions in fiscal 2017, 2016, or2015.
Cash Flows from Investing Activities
Capital expenditures were $702 million, $628 million, and $600 million in fiscal 2017, 2016, and2015, respectively. We expect fiscal 2018 capital spending levels to be approximately 5% of net sales.We believe our capital funding levels are adequate to support new programs, and we continue to investin our manufacturing infrastructure to further enhance productivity and manufacturing capabilities.
We acquired two businesses during fiscal 2017 for a combined cash purchase price of $250 million,net of cash acquired. During fiscal 2016, we acquired four businesses, including Creganna, for acombined cash purchase price of $1.3 billion, net of cash acquired. During fiscal 2015, we acquiredMeasurement Specialties. The total value paid for the transaction was approximately $1.7 billion, net ofcash acquired, and included $225 million for the repayment of Measurement Specialties’ debt andaccrued interest. Also during fiscal 2015, we acquired three additional businesses for $241 million incash, net of cash acquired. See Note 5 to the Consolidated Financial Statements for additionalinformation regarding acquisitions.
During fiscal 2016, we received net cash proceeds of $333 million related to the sale of our CPDbusiness. See Note 3 to the Consolidated Financial Statements for further information. We received netcash proceeds of $3.0 billion related to the sale of our BNS business during fiscal 2015. See Note 4 tothe Consolidated Financial Statements for further information.
Cash Flows from Financing Activities and Capitalization
Total debt at fiscal year end 2017 and 2016 was $4,344 million and $4,070 million, respectively. SeeNote 11 to the Consolidated Financial Statements for additional information regarding debt.
During August 2017, TEGSA, our 100%-owned subsidiary, issued $400 million aggregate principalamount of 3.125% senior notes due August 2027 and $100 million aggregate principal amount of 3.45%senior notes due August 2024. The 3.45% senior notes were issued under an existing indenture underwhich TEGSA had previously issued $250 million aggregate principal amount. The notes are TEGSA’sunsecured senior obligations and rank equally in right of payment with all existing and any futuresenior indebtedness of TEGSA and senior to any subordinated indebtedness that TEGSA may incur.
TEGSA has a five-year unsecured senior revolving credit facility (‘‘Credit Facility’’) with a maturitydate of December 2020 and total commitments of $1,500 million. TEGSA had no borrowings under theCredit Facility at fiscal year end 2017 or 2016.
The Credit Facility contains a financial ratio covenant providing that if, as of the last day of eachfiscal quarter, our ratio of Consolidated Total Debt to Consolidated EBITDA (as defined in the CreditFacility) for the then most recently concluded period of four consecutive fiscal quarters exceeds 3.75 to1.0, an Event of Default (as defined in the Credit Facility) is triggered. The Credit Facility and ourother debt agreements contain other customary covenants. None of our covenants are presentlyconsidered restrictive to our operations. As of fiscal year end 2017, we were in compliance with all ofour debt covenants and believe that we will continue to be in compliance with our existing covenantsfor the foreseeable future.
Periodically, TEGSA issues commercial paper to U.S. institutional accredited investors andqualified institutional buyers in accordance with available exemptions from the registrationrequirements of the Securities Act of 1933 as part of our ongoing effort to maintain financial flexibility
26
27
and to potentially decrease the cost of borrowings. Borrowings under the commercial paper programare backed by the Credit Facility.
TEGSA’s payment obligations under its senior notes, commercial paper, and Credit Facility arefully and unconditionally guaranteed by its parent, TE Connectivity Ltd.
Payments of common share dividends to shareholders were $546 million, $509 million, and$502 million in fiscal 2017, 2016, and 2015, respectively. See Note 18 to the Consolidated FinancialStatements for additional information regarding dividends on our common shares.
Future dividends on our common shares, if any, must be approved by our shareholders. Inexercising their discretion to recommend to the shareholders that such dividends be approved, ourboard of directors will consider our results of operations, cash requirements and surplus, financialcondition, statutory requirements of applicable law, contractual restrictions, and other factors that theymay deem relevant.
During fiscal 2016 and 2015, our board of directors authorized increases of $1.0 billion and$3.0 billion, respectively, in the share repurchase program. We repurchased approximately 8 million ofour common shares for $621 million, 43 million of our common shares for $2,610 million, and18 million of our common shares for $1,163 million under the share repurchase program during fiscal2017, 2016, and 2015, respectively. At fiscal year end 2017, we had $480 million of availabilityremaining under our share repurchase authorization.
Commitments and Contingencies
The following table provides a summary of our contractual obligations and commitments for debt,minimum lease payment obligations under non-cancelable leases, and other obligations at fiscal yearend 2017:
Payments Due by Fiscal Year
Total 2018 2019 2020 2021 2022 Thereafter
(in millions)
Debt(1) . . . . . . . . . . . . . . . . . . . . . . . . . . . . . . . . . . . $4,356 $ 710 $580 $ — $250 $500 $2,316Interest payments on debt(2) . . . . . . . . . . . . . . . . . . . . 1,239 146 119 109 103 88 674Operating leases . . . . . . . . . . . . . . . . . . . . . . . . . . . . 454 110 85 62 51 42 104Purchase obligations(3) . . . . . . . . . . . . . . . . . . . . . . . . 485 460 12 10 — — 3
Total contractual cash obligations(4)(5)(6) . . . . . . . . . . $6,534 $1,426 $796 $181 $404 $630 $3,097
(1) Debt represents principal payments. See Note 11 to the Consolidated Financial Statements for additionalinformation regarding debt.
(2) Interest payments exclude the impact of our interest rate swaps.
(3) Purchase obligations consist primarily of commitments for purchases of goods and services.
(4) The above table does not reflect unrecognized income tax benefits of $501 million and related accruedinterest and penalties of $60 million, the timing of which is uncertain. See Note 15 to the ConsolidatedFinancial Statements for additional information regarding unrecognized income tax benefits, interest, andpenalties.
(5) The above table does not reflect pension obligations to certain employees and former employees. We areobligated to make contributions to our pension plans; however, we are unable to determine the amount ofplan contributions due to the inherent uncertainties of obligations of this type, including timing, interest ratecharges, investment performance, and amounts of benefit payments. We expect to contribute $62 million topension plans in fiscal 2018, before consideration of any voluntary contributions. See Note 14 to the
27
28
Consolidated Financial Statements for additional information regarding these plans and our estimates offuture contributions and benefit payments.
(6) Other long-term liabilities of $482 million are excluded from the above table as we are unable to estimate thetiming of payment for these items.
Legal Proceedings
In the normal course of business, we are subject to various legal proceedings and claims, includingpatent infringement claims, product liability matters, employment disputes, disputes on agreements,other commercial disputes, environmental matters, antitrust claims, and tax matters, includingnon-income tax matters such as value added tax, sales and use tax, real estate tax, and transfer tax.Although it is not feasible to predict the outcome of these proceedings, based upon our experience,current information, and applicable law, we do not expect that the outcome of these proceedings, eitherindividually or in the aggregate, will have a material effect on our results of operations, financialposition, or cash flows.
Off-Balance Sheet Arrangements
In certain instances, we have guaranteed the performance of third parties and provided financialguarantees for uncompleted work and financial commitments. The terms of these guarantees vary withend dates ranging from fiscal 2018 through the completion of such transactions. The guarantees wouldbe triggered in the event of nonperformance, and the potential exposure for nonperformance under theguarantees would not have a material effect on our results of operations, financial position, or cashflows.
In disposing of assets or businesses, we often provide representations, warranties, and/orindemnities to cover various risks including unknown damage to assets, environmental risks involved inthe sale of real estate, liability for investigation and remediation of environmental contamination atwaste disposal sites and manufacturing facilities, and unidentified tax liabilities and legal fees related toperiods prior to disposition. We do not expect that these uncertainties will have a material adverseeffect on our results of operations, financial position, or cash flows.
At fiscal year end 2017, we had outstanding letters of credit, letters of guarantee, and surety bondsof $298 million.
Critical Accounting Policies and Estimates
The preparation of the Consolidated Financial Statements in conformity with GAAP requiresmanagement to make estimates and assumptions that affect the reported amounts of assets andliabilities, the disclosure of contingent assets and liabilities, and the reported amounts of revenue andexpenses. Our significant accounting policies are summarized in Note 2 to the Consolidated FinancialStatements. We believe the following accounting policies are the most critical as they require significantjudgments and assumptions that involve inherent risks and uncertainties. Management’s estimates arebased on the relevant information available at the end of each period.
Revenue Recognition
Our revenue recognition policies are in accordance with Accounting Standards Codification(‘‘ASC’’) 605, Revenue Recognition. Our revenues are generated principally from the sale of ourproducts. Revenue from the sale of products is recognized at the time title and the risks and rewards ofownership pass to the customer. This generally occurs when the products reach the shipping point, thesales price is fixed and determinable, and collection is reasonably assured. A reserve for estimatedreturns is established at the time of sale based on historical return experience and is recorded as areduction of sales. Other allowances include customer quantity and price discrepancies. A reserve for
28
29
other allowances is generally established at the time of sale based on historical experience and also isrecorded as a reduction of sales.
Contract revenues for construction related projects, which are generated in the CommunicationsSolutions segment, are recorded primarily using the percentage-of-completion method. Profitsrecognized on contracts in process are based upon estimated contract revenue and related cost tocomplete. Percentage-of-completion is measured based on the ratio of actual costs incurred to totalestimated costs. Revisions in cost estimates as contracts progress have the effect of increasing ordecreasing profits in the current period. Provisions for anticipated losses are made in the period inwhich they first become determinable. In addition, provisions for credit losses related to unbilledreceivables on construction related projects are recorded as reductions of revenue in the period inwhich they first become determinable.
Goodwill and Other Intangible Assets
Intangible assets include both indeterminable-lived residual goodwill and determinable-livedidentifiable intangible assets. Intangible assets with determinable lives primarily include intellectualproperty, consisting of patents, trademarks, and unpatented technology, and customer relationships.Recoverability estimates range from 1 to 50 years and costs are generally amortized on a straight-linebasis. Evaluations of the remaining useful lives of determinable-lived intangible assets are performed ona periodic basis and when events and circumstances warrant.
We test for goodwill impairment at the reporting unit level. A reporting unit is generally anoperating segment or one level below an operating segment that constitutes a business for whichdiscrete financial information is available and regularly reviewed by segment management. At fiscalyear end 2017, we had six reporting units, five of which contained goodwill. There were two reportingunits in each of our three segments. When changes occur in the composition of one or more reportingunits, goodwill is reassigned to the reporting units affected based on their relative fair values. Wereview our reporting unit structure each year as part of our annual goodwill impairment test, or morefrequently based on changes in our structure.
Goodwill impairment is evaluated by comparing the carrying value of each reporting unit to its fairvalue on the first day of the fourth fiscal quarter of each year or whenever we believe a triggeringevent requiring a more frequent assessment has occurred. In assessing the existence of a triggeringevent, management relies on a number of reporting unit-specific factors including operating results,business plans, economic projections, anticipated future cash flows, transactions, and market place data.There are inherent uncertainties related to these factors and management’s judgment in applying thesefactors to the impairment analysis.
When testing for goodwill impairment, we perform a step I goodwill impairment test to identifypotential impairment by comparing the fair value of a reporting unit with its carrying amount. If thecarrying amount of a reporting unit exceeds its fair value, goodwill may be impaired and a step IIgoodwill impairment test is performed to measure the amount of impairment, if any. In the step IIgoodwill impairment test, we compare the implied fair value of reporting unit goodwill with thecarrying amount of that goodwill. If the carrying amount of reporting unit goodwill exceeds the impliedfair value of that goodwill, an impairment loss is recognized in an amount equal to the excess. Theimplied fair value of goodwill is determined in a manner consistent with how goodwill is recognized ina business combination. We allocate the fair value of a reporting unit to the assets and liabilities of thatunit, including intangible assets, as if the reporting unit had been acquired in a business combination.Any excess of the fair value of a reporting unit over the amounts assigned to its assets and liabilities isthe implied fair value of goodwill.
Fair value estimates used in the step I goodwill impairment tests are calculated using an incomeapproach based on the present value of future cash flows of each reporting unit. The income approach
29
30
generally has been supported by guideline analyses (a market approach). These approaches incorporatea number of assumptions including future growth rates, discount rates, income tax rates, and marketactivity in assessing fair value and are reporting unit specific. Changes in economic and operatingconditions impacting these assumptions could result in goodwill impairments in future periods.
We completed our annual goodwill impairment test in the fourth quarter of fiscal 2017 anddetermined that no impairment existed.
Income Taxes
In determining income for financial statement purposes, we must make certain estimates andjudgments. These estimates and judgments affect the calculation of certain tax liabilities and thedetermination of the recoverability of certain deferred tax assets, which arise from temporarydifferences between the income tax return and financial statement recognition of revenue and expense.
In evaluating our ability to recover our deferred tax assets, we consider all available positive andnegative evidence including our past operating results, the existence of cumulative losses in the mostrecent years, and our forecast of taxable income. In estimating future taxable income, we developassumptions including the amount of pre-tax operating income in various tax jurisdictions, the reversalof temporary differences, and the implementation of feasible and prudent tax planning strategies. Theseassumptions require significant judgment about the forecasts of taxable income and are consistent withthe plans and estimates we are using to manage the underlying businesses.
We currently have recorded significant valuation allowances that we intend to maintain until it ismore likely than not the deferred tax assets will be realized. Our income tax expense recorded in thefuture will be reduced to the extent of decreases in our valuation allowances. The realization of ourremaining deferred tax assets is dependent primarily on future taxable income in the appropriatejurisdictions. Any reduction in future taxable income including any future restructuring activities mayrequire that we record an additional valuation allowance against our deferred tax assets. An increase inthe valuation allowance would result in additional income tax expense in such period and could have asignificant impact on our future earnings.
Changes in tax laws and rates also could affect recorded deferred tax assets and liabilities in thefuture. Management is not aware of any such changes that would have a material effect on our resultsof operations, financial position, or cash flows.
In addition, the calculation of our tax liabilities includes estimates for uncertainties in theapplication of complex tax regulations across multiple global jurisdictions where we conduct ouroperations. Under the uncertain tax position provisions of ASC 740, Income Taxes, we recognizeliabilities for tax and related interest for issues in tax jurisdictions based on our estimate of whether,and the extent to which, additional taxes and related interest will be due. These tax liabilities andrelated interest are reflected net of the impact of related tax loss carryforwards, as such tax losscarryforwards will be applied against these tax liabilities and will reduce the amount of cash taxpayments due upon the eventual settlement with the tax authorities. These estimates may change dueto changing facts and circumstances. Due to the complexity of these uncertainties, the ultimateresolution may result in a settlement that differs from our current estimate of the tax liabilities andrelated interest. These tax liabilities and related interest are recorded in income taxes and accrued andother current liabilities on the Consolidated Balance Sheets.
Pension Liabilities
Our defined benefit pension plan expense and obligations are developed from actuarialassumptions. The funded status of our plans is recognized on the Consolidated Balance Sheets and ismeasured as the difference between the fair value of plan assets and the projected benefit obligation at
30
31
the measurement date. The projected benefit obligation represents the actuarial present value ofbenefits projected to be paid upon retirement factoring in estimated future compensation levels. Thefair value of plan assets represents the current market value of cumulative company and participantcontributions made to irrevocable trust funds, held for the sole benefit of participants, which areinvested by the trustee of the funds. The benefits under our defined benefit pension plans are based onvarious factors, such as years of service and compensation.
Net periodic pension benefit cost is based on the utilization of the projected unit credit method ofcalculation and is charged to earnings on a systematic basis over the expected average remainingservice lives of current participants.
Two critical assumptions in determining pension expense and obligations are the discount rate andexpected long-term return on plan assets. We evaluate these assumptions at least annually. Otherassumptions reflect demographic factors such as retirement, mortality, and employee turnover. Theseassumptions are evaluated periodically and updated to reflect our actual experience. Actual results maydiffer from actuarial assumptions. The discount rate represents the market rate for high-quality fixedincome investments and is used to calculate the present value of the expected future cash flows forbenefit obligations to be paid under our pension plans. A decrease in the discount rate increases thepresent value of pension benefit obligations. At fiscal year end 2017, a 25-basis point decrease in thediscount rate would have increased the present value of our pension obligations by $134 million; a25-basis point increase would have decreased the present value of our pension obligations by$120 million. We consider the current and expected asset allocations of our pension plans, as well ashistorical and expected long-term rates of return on those types of plan assets, in determining theexpected long-term rate of return on plan assets. A 50-basis point decrease or increase in the expectedlong-term return on plan assets would have increased or decreased, respectively, our fiscal 2017 pensionexpense by $11 million.
The long-term target asset allocation in our U.S. plans’ master trust is 10% equity and 90% fixedincome. Asset re-allocation to meet that target is occurring over a multi-year period based on thefunded status. We expect to reach our target allocation when the funded status of the plans exceeds105%. Based on the funded status of the plans as of fiscal year end 2017, our target asset allocation is45% equity and 55% fixed income.
Accounting Pronouncements
See Note 2 to the Consolidated Financial Statements for information regarding recently issued andrecently adopted accounting pronouncements.
Non-GAAP Financial Measure
Organic Net Sales Growth
We present organic net sales growth as we believe it is appropriate for investors to consider thisadjusted financial measure in addition to results in accordance with GAAP. Organic net sales growthrepresents net sales growth (the most comparable GAAP financial measure) excluding the impact offoreign currency exchange rates, and acquisitions and divestitures that occurred in the preceding twelvemonths, if any. Organic net sales growth is a useful measure of our performance because it excludesitems that are not completely under management’s control, such as the impact of changes in foreigncurrency exchange rates, and items that do not reflect the underlying growth of the company, such asacquisition and divestiture activity.
Organic net sales growth provides useful information about our results and the trends of ourbusiness. Management uses organic net sales growth to monitor and evaluate performance. Also,management uses organic net sales growth together with GAAP financial measures in its
31
32
decision-making processes related to the operations of our reportable segments and our overallcompany. It is also a significant component in our incentive compensation plans. We believe thatinvestors benefit from having access to the same financial measures that management uses in evaluatingoperations. The tables presented in ‘‘Results of Operations’’ and ‘‘Segment Results’’ providereconciliations of organic net sales growth to net sales growth calculated in accordance with GAAP.
Organic net sales growth is a non-GAAP financial measure and should not be considered areplacement for results in accordance with GAAP. This non-GAAP financial measure may not becomparable to similarly-titled measures reported by other companies. The primary limitation of thismeasure is that it excludes the financial impact of items that would otherwise either increase ordecrease our reported results. This limitation is best addressed by using organic net sales growth incombination with net sales growth in order to better understand the amounts, character, and impact ofany increase or decrease in reported amounts.
Forward-Looking Information
Certain statements in this Annual Report are ‘‘forward-looking statements’’ within the meaning ofthe U.S. Private Securities Litigation Reform Act of 1995. These statements are based on ourmanagement’s beliefs and assumptions and on information currently available to our management.Forward-looking statements include, among others, the information concerning our possible or assumedfuture results of operations, business strategies, financing plans, competitive position, potential growthopportunities, potential operating performance improvements, acquisitions, divestitures, the effects ofcompetition, and the effects of future legislation or regulations. Forward-looking statements include allstatements that are not historical facts and can be identified by the use of forward-looking terminologysuch as the words ‘‘believe,’’ ‘‘expect,’’ ‘‘plan,’’ ‘‘intend,’’ ‘‘anticipate,’’ ‘‘estimate,’’ ‘‘predict,’’ ‘‘potential,’’‘‘continue,’’ ‘‘may,’’ ‘‘should,’’ or the negative of these terms or similar expressions.
Forward-looking statements involve risks, uncertainties, and assumptions. Actual results may differmaterially from those expressed in these forward-looking statements. Investors should not place unduereliance on any forward-looking statements. We do not have any intention or obligation to updateforward-looking statements after we file this report except as required by law.
The following and other risks, which are described in greater detail in ‘‘Part I. Item 1A. RiskFactors’’ of our Annual Report on Form 10-K for the fiscal year ended September 29, 2017 filed withthe SEC and elsewhere in this Annual Report, could cause our results to differ materially from thoseexpressed in forward-looking statements:
• conditions in the global or regional economies and global capital markets, and cyclical industryconditions;
• conditions affecting demand for products in the industries we serve, particularly the automotiveindustry;
• competition and pricing pressure;
• market acceptance of our new product introductions and product innovations and product lifecycles;
• raw material availability, quality, and cost;
• fluctuations in foreign currency exchange rates;
• financial condition and consolidation of customers and vendors;
• reliance on third-party suppliers;
• risks associated with current and future acquisitions and divestitures;
32
33
• global risks of business interruptions such as natural disasters and political, economic, andmilitary instability;
• risks associated with security breaches and other disruptions to our information technologyinfrastructure;
• risks related to compliance with current and future environmental and other laws andregulations;
• our ability to protect our intellectual property rights;
• risks of litigation;
• our ability to operate within the limitations imposed by our debt instruments;
• the possible effects on us of various U.S. and non-U.S. legislative proposals and other initiativesthat, if adopted, could materially increase our worldwide corporate effective tax rate andnegatively impact our U.S. government contracts business;
• various risks associated with being a Swiss corporation;
• the impact of fluctuations in the market price of our shares; and
• the impact of certain provisions of our articles of association on unsolicited takeover proposals.
There may be other risks and uncertainties that we are unable to predict at this time or that wecurrently do not expect to have a material adverse effect on our business.
33
34
QUANTITATIVE AND QUALITATIVE DISCLOSURES ABOUT MARKET RISK
In the normal course of business, our financial position is routinely subject to a variety of risks,including market risks associated with interest rate and foreign currency movements on outstandingdebt and non-U.S. dollar denominated assets and liabilities and commodity price movements. We utilizeestablished risk management policies and procedures in executing derivative financial instrumenttransactions to manage a portion of these risks.
We do not execute transactions or hold derivative financial instruments for trading or speculativepurposes. Substantially all counterparties to derivative financial instruments are limited to majorfinancial institutions with at least an A/A2 credit rating. There is no significant concentration ofexposures with any one counterparty.
Foreign Currency Exposures
As part of managing the exposure to changes in foreign currency exchange rates, we utilize cross-currency swap contracts, foreign currency forward contracts, and foreign currency swap contracts, aportion of which are designated as cash flow hedges. The objective of these contracts is to minimizeimpacts to cash flows and profitability due to changes in foreign currency exchange rates onintercompany and other cash transactions. A 10% appreciation or depreciation of the underlyingcurrency in our cross-currency swap contracts, foreign currency forward contracts, or foreign currencyswap contracts from the fiscal year end 2017 market rates would have changed the unrealized value ofour contracts by $122 million. A 10% appreciation or depreciation of the underlying currency in ourcross-currency swap contracts, foreign currency forward contracts, or foreign currency swap contractsfrom the fiscal year end 2016 market rates would have changed the unrealized value of our contracts by$112 million. Such gains or losses on these contracts would generally be offset by the losses or gains onthe revaluation or settlement of the underlying transactions.
Interest Rate and Investment Exposures
We issue debt, as needed, to fund our operations and capital requirements. Such borrowings canresult in interest rate exposure. To manage the interest rate exposure, we use interest rate swaps toconvert a portion of fixed-rate debt into variable-rate debt. We use forward starting interest rate swapsand options to enter into interest rate swaps to manage interest rate exposure in periods prior to theanticipated issuance of fixed-rate debt. We also utilize investment swaps to manage earnings exposureon certain nonqualified deferred compensation liabilities.
Based on our floating rate debt balances at fiscal year end 2017 and 2016, an increase in the levelsof the U.S. dollar interest rates by 0.5%, with all other variables held constant, would have resulted inan immaterial increase in interest expense in both fiscal 2017 and 2016.
Commodity Exposures
Our worldwide operations and product lines may expose us to risks from fluctuations in commodityprices. To limit the effects of fluctuations in the future market price paid and related volatility in cashflows, we utilize commodity swap contracts designated as cash flow hedges. We continually evaluate thecommodity market with respect to our forecasted usage requirements over the next eighteen monthsand periodically enter into commodity swap contracts to hedge a portion of usage requirements overthat period. At fiscal year end 2017, our commodity hedges, which related to expected purchases ofgold, silver, and copper, were in a net gain position of $20 million and had a notional value of$314 million. At fiscal year end 2016, our commodity hedges, which related to expected purchases ofgold, silver, and copper, were in a net gain position of $11 million and had a notional value of$232 million. A 10% appreciation or depreciation of the price of a troy ounce of gold, a troy ounce ofsilver, and a pound of copper, from the fiscal year end 2017 prices would have changed the unrealized
34
35
value of our forward contracts by $33 million. A 10% appreciation or depreciation of the price of atroy ounce of gold, a troy ounce of silver, and a pound of copper, from the fiscal year end 2016 priceswould have changed the unrealized value of our forward contracts by $24 million.
See Note 13 to the Consolidated Financial Statements for additional information regardingfinancial instruments.
CHANGES IN AND DISAGREEMENTS WITH ACCOUNTANTS ON ACCOUNTING ANDFINANCIAL DISCLOSURE
None.
CONTROLS AND PROCEDURES
Evaluation of Disclosure Controls and Procedures
Our management, with the participation of our Chief Executive Officer and Chief FinancialOfficer, evaluated the effectiveness of our disclosure controls and procedures (as defined inRule 13a-15(e) under the Exchange Act) as of September 29, 2017. Based on that evaluation, our ChiefExecutive Officer and Chief Financial Officer concluded that our disclosure controls and procedureswere effective as of September 29, 2017.
Management’s Report on Internal Control Over Financial Reporting
Our management is responsible for establishing and maintaining adequate internal control overfinancial reporting (as defined in Rule 13a-15(f) under the Exchange Act). Management, with theparticipation of our Chief Executive Officer and Chief Financial Officer, evaluated the effectiveness ofour internal control over financial reporting based on the framework in Internal Control—IntegratedFramework (2013) issued by the Committee of Sponsoring Organizations of the Treadway Commission.Based on this evaluation, management concluded our internal control over financial reporting waseffective as of September 29, 2017.
Because of its inherent limitations, internal control over financial reporting may not prevent ordetect misstatements. Also, projections of any evaluation of effectiveness to future periods are subjectto the risk that controls may become inadequate because of changes in conditions, or that the degreeof compliance with policies and procedures may deteriorate.
Deloitte & Touche LLP, an independent registered public accounting firm, has issued an attestationreport on our internal control over financial reporting as of September 29, 2017, which is included inthis Annual Report.
Changes in Internal Control Over Financial Reporting
During the quarter ended September 29, 2017, there were no changes in our internal control overfinancial reporting that have materially affected, or are reasonably likely to materially affect, ourinternal control over financial reporting.
35

36
(This page has been left blank intentionally.)
36
37
TE CONNECTIVITY LTD.
INDEX TO CONSOLIDATED FINANCIAL STATEMENTS
Page
Reports of Independent Registered Public Accounting Firm . . . . . . . . . . . . . . . . . . . . . . . . . . . . 38
Consolidated Statements of Operations for the Fiscal Years Ended September 29, 2017,September 30, 2016, and September 25, 2015 . . . . . . . . . . . . . . . . . . . . . . . . . . . . . . . . . . . . . 40
Consolidated Statements of Comprehensive Income for the Fiscal Years Ended September 29,2017, September 30, 2016, and September 25, 2015 . . . . . . . . . . . . . . . . . . . . . . . . . . . . . . . . 41
Consolidated Balance Sheets as of September 29, 2017 and September 30, 2016 . . . . . . . . . . . . . 42
Consolidated Statements of Shareholders’ Equity for the Fiscal Years Ended September 29, 2017,September 30, 2016, and September 25, 2015 . . . . . . . . . . . . . . . . . . . . . . . . . . . . . . . . . . . . . 43
Consolidated Statements of Cash Flows for the Fiscal Years Ended September 29, 2017,September 30, 2016, and September 25, 2015 . . . . . . . . . . . . . . . . . . . . . . . . . . . . . . . . . . . . . 44
Notes to Consolidated Financial Statements . . . . . . . . . . . . . . . . . . . . . . . . . . . . . . . . . . . . . . . 45
Schedule II—Valuation and Qualifying Accounts . . . . . . . . . . . . . . . . . . . . . . . . . . . . . . . . . . . . 101
Report of the Statutory Auditor on the Consolidated Financial Statements of TE ConnectivityLtd. . . . . . . . . . . . . . . . . . . . . . . . . . . . . . . . . . . . . . . . . . . . . . . . . . . . . . . . . . . . . . . . . . . 102
37
38
REPORT OF INDEPENDENT REGISTERED PUBLIC ACCOUNTING FIRM
To the Board of Directors and Shareholders of TE Connectivity Ltd.:
We have audited the accompanying consolidated balance sheets of TE Connectivity Ltd. andsubsidiaries (the ‘‘Company’’) as of September 29, 2017 and September 30, 2016, and the relatedconsolidated statements of operations, comprehensive income, shareholders’ equity, and cash flows foreach of the three fiscal years in the period ended September 29, 2017. Our audits also included thefinancial statement schedule listed in the Index. These consolidated financial statements and financialstatement schedule are the responsibility of the Company’s management. Our responsibility is toexpress an opinion on the consolidated financial statements and financial statement schedule based onour audits.
We conducted our audits in accordance with the standards of the Public Company AccountingOversight Board (United States). Those standards require that we plan and perform the audit to obtainreasonable assurance about whether the financial statements are free of material misstatement. Anaudit includes examining, on a test basis, evidence supporting the amounts and disclosures in thefinancial statements. An audit also includes assessing the accounting principles used and significantestimates made by management, as well as evaluating the overall financial statement presentation. Webelieve that our audits provide a reasonable basis for our opinion.
In our opinion, such consolidated financial statements present fairly, in all material respects, thefinancial position of the Company as of September 29, 2017 and September 30, 2016, and the results ofits operations and its cash flows for each of the three fiscal years in the period ended September 29,2017, in conformity with accounting principles generally accepted in the United States of America.Also, in our opinion, such financial statement schedule, when considered in relation to the basicconsolidated financial statements taken as a whole, presents fairly, in all material respects, theinformation set forth therein.
We have also audited, in accordance with the standards of the Public Company AccountingOversight Board (United States), the Company’s internal control over financial reporting as ofSeptember 29, 2017, based on the criteria established in Internal Control—Integrated Framework (2013)issued by the Committee of Sponsoring Organizations of the Treadway Commission and our reportdated November 14, 2017 expressed an unqualified opinion on the Company’s internal control overfinancial reporting.
/s/ Deloitte & Touche LLP
Philadelphia, PennsylvaniaNovember 14, 2017
38
39
REPORT OF INDEPENDENT REGISTERED PUBLIC ACCOUNTING FIRM
To the Board of Directors and Shareholders of TE Connectivity Ltd.:
We have audited the internal control over financial reporting of TE Connectivity Ltd. andsubsidiaries (the ‘‘Company’’) as of September 29, 2017, based on criteria established in InternalControl—Integrated Framework (2013) issued by the Committee of Sponsoring Organizations of theTreadway Commission. The Company’s management is responsible for maintaining effective internalcontrol over financial reporting and for its assessment of the effectiveness of internal control overfinancial reporting, included in the accompanying Management’s Report on Internal Control OverFinancial Reporting. Our responsibility is to express an opinion on the Company’s internal control overfinancial reporting based on our audit.
We conducted our audit in accordance with the standards of the Public Company AccountingOversight Board (United States). Those standards require that we plan and perform the audit to obtainreasonable assurance about whether effective internal control over financial reporting was maintainedin all material respects. Our audit included obtaining an understanding of internal control overfinancial reporting, assessing the risk that a material weakness exists, testing and evaluating the designand operating effectiveness of internal control based on the assessed risk, and performing such otherprocedures as we considered necessary in the circumstances. We believe that our audit provides areasonable basis for our opinion.
A company’s internal control over financial reporting is a process designed by, or under thesupervision of, the company’s principal executive and principal financial officers, or persons performingsimilar functions, and effected by the company’s board of directors, management, and other personnelto provide reasonable assurance regarding the reliability of financial reporting and the preparation offinancial statements for external purposes in accordance with generally accepted accounting principles.A company’s internal control over financial reporting includes those policies and procedures that(1) pertain to the maintenance of records that, in reasonable detail, accurately and fairly reflect thetransactions and dispositions of the assets of the company; (2) provide reasonable assurance thattransactions are recorded as necessary to permit preparation of financial statements in accordance withgenerally accepted accounting principles, and that receipts and expenditures of the company are beingmade only in accordance with authorizations of management and directors of the company; and(3) provide reasonable assurance regarding prevention or timely detection of unauthorized acquisition,use, or disposition of the company’s assets that could have a material effect on the financial statements.
Because of the inherent limitations of internal control over financial reporting, including thepossibility of collusion or improper management override of controls, material misstatements due toerror or fraud may not be prevented or detected on a timely basis. Also, projections of any evaluationof the effectiveness of the internal control over financial reporting to future periods are subject to therisk that the controls may become inadequate because of changes in conditions, or that the degree ofcompliance with the policies or procedures may deteriorate.
In our opinion, the Company maintained, in all material respects, effective internal control overfinancial reporting as of September 29, 2017, based on the criteria established in Internal Control—Integrated Framework (2013) issued by the Committee of Sponsoring Organizations of the TreadwayCommission.
We have also audited, in accordance with the standards of the Public Company AccountingOversight Board (United States), the consolidated financial statements and financial statement scheduleof the Company as of and for the fiscal year ended September 29, 2017, and our report datedNovember 14, 2017 expressed an unqualified opinion on those consolidated financial statements andfinancial statement schedule.
/s/ Deloitte & Touche LLP
Philadelphia, PennsylvaniaNovember 14, 2017
39
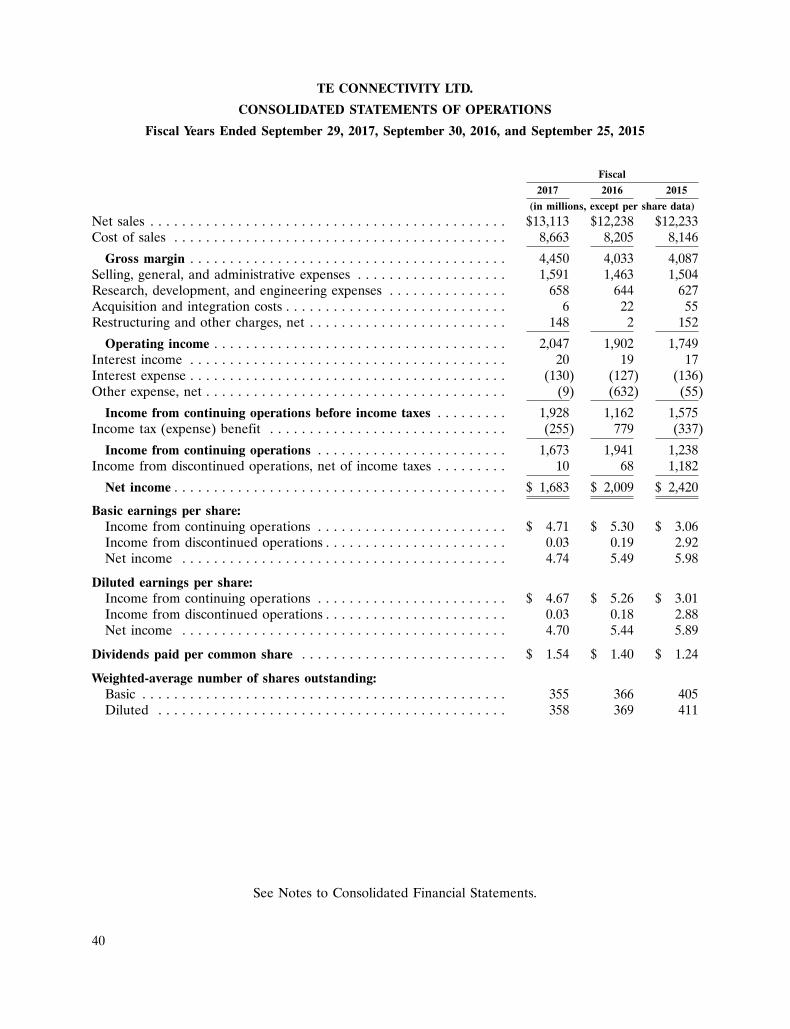
40
TE CONNECTIVITY LTD.
CONSOLIDATED STATEMENTS OF OPERATIONS
Fiscal Years Ended September 29, 2017, September 30, 2016, and September 25, 2015
Fiscal
2017 2016 2015
(in millions, except per share data)
Net sales . . . . . . . . . . . . . . . . . . . . . . . . . . . . . . . . . . . . . . . . . . . . . $13,113 $12,238 $12,233Cost of sales . . . . . . . . . . . . . . . . . . . . . . . . . . . . . . . . . . . . . . . . . . 8,663 8,205 8,146
Gross margin . . . . . . . . . . . . . . . . . . . . . . . . . . . . . . . . . . . . . . . . 4,450 4,033 4,087Selling, general, and administrative expenses . . . . . . . . . . . . . . . . . . . 1,591 1,463 1,504Research, development, and engineering expenses . . . . . . . . . . . . . . . 658 644 627Acquisition and integration costs . . . . . . . . . . . . . . . . . . . . . . . . . . . . 6 22 55Restructuring and other charges, net . . . . . . . . . . . . . . . . . . . . . . . . . 148 2 152
Operating income . . . . . . . . . . . . . . . . . . . . . . . . . . . . . . . . . . . . . 2,047 1,902 1,749Interest income . . . . . . . . . . . . . . . . . . . . . . . . . . . . . . . . . . . . . . . . 20 19 17Interest expense . . . . . . . . . . . . . . . . . . . . . . . . . . . . . . . . . . . . . . . . (130) (127) (136)Other expense, net . . . . . . . . . . . . . . . . . . . . . . . . . . . . . . . . . . . . . . (9) (632) (55)
Income from continuing operations before income taxes . . . . . . . . . 1,928 1,162 1,575Income tax (expense) benefit . . . . . . . . . . . . . . . . . . . . . . . . . . . . . . (255) 779 (337)
Income from continuing operations . . . . . . . . . . . . . . . . . . . . . . . . 1,673 1,941 1,238Income from discontinued operations, net of income taxes . . . . . . . . . 10 68 1,182
Net income . . . . . . . . . . . . . . . . . . . . . . . . . . . . . . . . . . . . . . . . . . $ 1,683 $ 2,009 $ 2,420
Basic earnings per share:Income from continuing operations . . . . . . . . . . . . . . . . . . . . . . . . $ 4.71 $ 5.30 $ 3.06Income from discontinued operations . . . . . . . . . . . . . . . . . . . . . . . 0.03 0.19 2.92Net income . . . . . . . . . . . . . . . . . . . . . . . . . . . . . . . . . . . . . . . . . 4.74 5.49 5.98
Diluted earnings per share:Income from continuing operations . . . . . . . . . . . . . . . . . . . . . . . . $ 4.67 $ 5.26 $ 3.01Income from discontinued operations . . . . . . . . . . . . . . . . . . . . . . . 0.03 0.18 2.88Net income . . . . . . . . . . . . . . . . . . . . . . . . . . . . . . . . . . . . . . . . . 4.70 5.44 5.89
Dividends paid per common share . . . . . . . . . . . . . . . . . . . . . . . . . . $ 1.54 $ 1.40 $ 1.24
Weighted-average number of shares outstanding:Basic . . . . . . . . . . . . . . . . . . . . . . . . . . . . . . . . . . . . . . . . . . . . . . 355 366 405Diluted . . . . . . . . . . . . . . . . . . . . . . . . . . . . . . . . . . . . . . . . . . . . 358 369 411
See Notes to Consolidated Financial Statements.
40
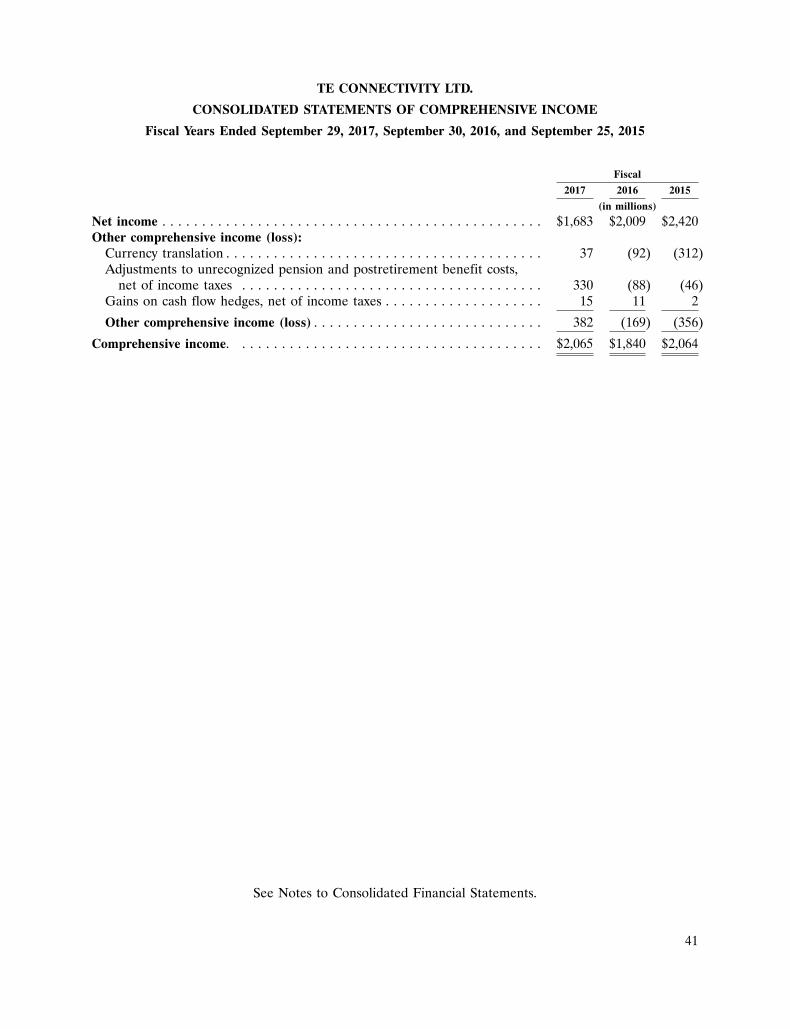
41
TE CONNECTIVITY LTD.
CONSOLIDATED STATEMENTS OF COMPREHENSIVE INCOME
Fiscal Years Ended September 29, 2017, September 30, 2016, and September 25, 2015
Fiscal
2017 2016 2015
(in millions)
Net income . . . . . . . . . . . . . . . . . . . . . . . . . . . . . . . . . . . . . . . . . . . . . . . . $1,683 $2,009 $2,420Other comprehensive income (loss):
Currency translation . . . . . . . . . . . . . . . . . . . . . . . . . . . . . . . . . . . . . . . . 37 (92) (312)Adjustments to unrecognized pension and postretirement benefit costs,
net of income taxes . . . . . . . . . . . . . . . . . . . . . . . . . . . . . . . . . . . . . . 330 (88) (46)Gains on cash flow hedges, net of income taxes . . . . . . . . . . . . . . . . . . . . 15 11 2
Other comprehensive income (loss) . . . . . . . . . . . . . . . . . . . . . . . . . . . . . 382 (169) (356)
Comprehensive income. . . . . . . . . . . . . . . . . . . . . . . . . . . . . . . . . . . . . . . $2,065 $1,840 $2,064
See Notes to Consolidated Financial Statements.
41
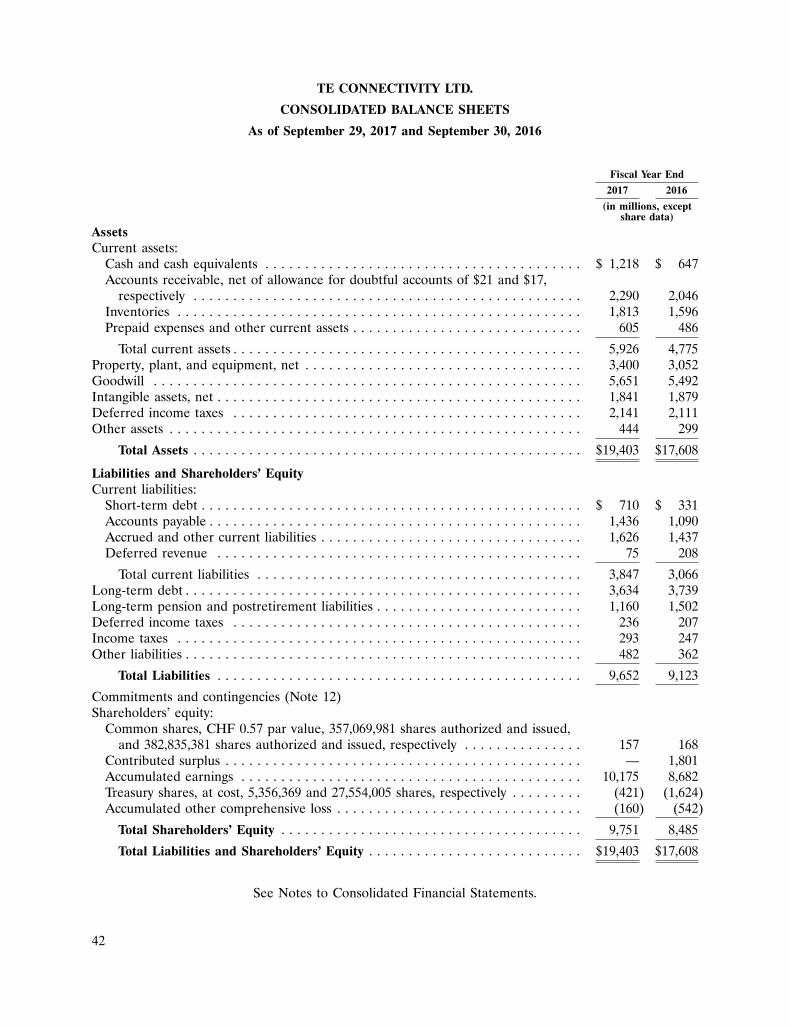
42
TE CONNECTIVITY LTD.
CONSOLIDATED BALANCE SHEETS
As of September 29, 2017 and September 30, 2016
Fiscal Year End
2017 2016
(in millions, exceptshare data)
AssetsCurrent assets:
Cash and cash equivalents . . . . . . . . . . . . . . . . . . . . . . . . . . . . . . . . . . . . . . . . $ 1,218 $ 647Accounts receivable, net of allowance for doubtful accounts of $21 and $17,
respectively . . . . . . . . . . . . . . . . . . . . . . . . . . . . . . . . . . . . . . . . . . . . . . . . . 2,290 2,046Inventories . . . . . . . . . . . . . . . . . . . . . . . . . . . . . . . . . . . . . . . . . . . . . . . . . . . 1,813 1,596Prepaid expenses and other current assets . . . . . . . . . . . . . . . . . . . . . . . . . . . . . 605 486
Total current assets . . . . . . . . . . . . . . . . . . . . . . . . . . . . . . . . . . . . . . . . . . . . 5,926 4,775Property, plant, and equipment, net . . . . . . . . . . . . . . . . . . . . . . . . . . . . . . . . . . . 3,400 3,052Goodwill . . . . . . . . . . . . . . . . . . . . . . . . . . . . . . . . . . . . . . . . . . . . . . . . . . . . . . 5,651 5,492Intangible assets, net . . . . . . . . . . . . . . . . . . . . . . . . . . . . . . . . . . . . . . . . . . . . . . 1,841 1,879Deferred income taxes . . . . . . . . . . . . . . . . . . . . . . . . . . . . . . . . . . . . . . . . . . . . 2,141 2,111Other assets . . . . . . . . . . . . . . . . . . . . . . . . . . . . . . . . . . . . . . . . . . . . . . . . . . . . 444 299
Total Assets . . . . . . . . . . . . . . . . . . . . . . . . . . . . . . . . . . . . . . . . . . . . . . . . . $19,403 $17,608
Liabilities and Shareholders’ EquityCurrent liabilities:
Short-term debt . . . . . . . . . . . . . . . . . . . . . . . . . . . . . . . . . . . . . . . . . . . . . . . . $ 710 $ 331Accounts payable . . . . . . . . . . . . . . . . . . . . . . . . . . . . . . . . . . . . . . . . . . . . . . . 1,436 1,090Accrued and other current liabilities . . . . . . . . . . . . . . . . . . . . . . . . . . . . . . . . . 1,626 1,437Deferred revenue . . . . . . . . . . . . . . . . . . . . . . . . . . . . . . . . . . . . . . . . . . . . . . 75 208
Total current liabilities . . . . . . . . . . . . . . . . . . . . . . . . . . . . . . . . . . . . . . . . . 3,847 3,066Long-term debt . . . . . . . . . . . . . . . . . . . . . . . . . . . . . . . . . . . . . . . . . . . . . . . . . . 3,634 3,739Long-term pension and postretirement liabilities . . . . . . . . . . . . . . . . . . . . . . . . . . 1,160 1,502Deferred income taxes . . . . . . . . . . . . . . . . . . . . . . . . . . . . . . . . . . . . . . . . . . . . 236 207Income taxes . . . . . . . . . . . . . . . . . . . . . . . . . . . . . . . . . . . . . . . . . . . . . . . . . . . 293 247Other liabilities . . . . . . . . . . . . . . . . . . . . . . . . . . . . . . . . . . . . . . . . . . . . . . . . . . 482 362
Total Liabilities . . . . . . . . . . . . . . . . . . . . . . . . . . . . . . . . . . . . . . . . . . . . . . 9,652 9,123
Commitments and contingencies (Note 12)Shareholders’ equity:
Common shares, CHF 0.57 par value, 357,069,981 shares authorized and issued,and 382,835,381 shares authorized and issued, respectively . . . . . . . . . . . . . . . 157 168
Contributed surplus . . . . . . . . . . . . . . . . . . . . . . . . . . . . . . . . . . . . . . . . . . . . . — 1,801Accumulated earnings . . . . . . . . . . . . . . . . . . . . . . . . . . . . . . . . . . . . . . . . . . . 10,175 8,682Treasury shares, at cost, 5,356,369 and 27,554,005 shares, respectively . . . . . . . . . (421) (1,624)Accumulated other comprehensive loss . . . . . . . . . . . . . . . . . . . . . . . . . . . . . . . (160) (542)
Total Shareholders’ Equity . . . . . . . . . . . . . . . . . . . . . . . . . . . . . . . . . . . . . . 9,751 8,485
Total Liabilities and Shareholders’ Equity . . . . . . . . . . . . . . . . . . . . . . . . . . . $19,403 $17,608
See Notes to Consolidated Financial Statements.
42
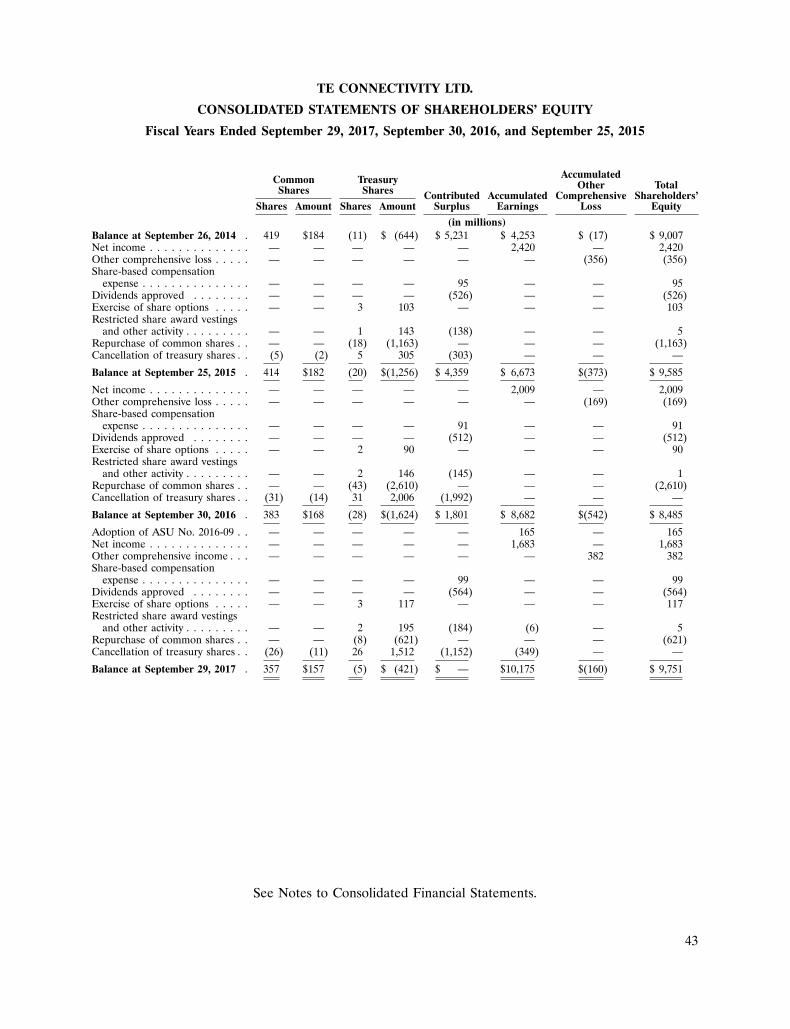
43
TE CONNECTIVITY LTD.
CONSOLIDATED STATEMENTS OF SHAREHOLDERS’ EQUITY
Fiscal Years Ended September 29, 2017, September 30, 2016, and September 25, 2015
AccumulatedCommon Treasury Other TotalShares Shares Contributed Accumulated Comprehensive Shareholders’Shares Amount Shares Amount Surplus Earnings Loss Equity
(in millions)Balance at September 26, 2014 . 419 $184 (11) $ (644) $ 5,231 $ 4,253 $ (17) $ 9,007Net income . . . . . . . . . . . . . . — — — — — 2,420 — 2,420Other comprehensive loss . . . . . — — — — — — (356) (356)Share-based compensation
expense . . . . . . . . . . . . . . . — — — — 95 — — 95Dividends approved . . . . . . . . — — — — (526) — — (526)Exercise of share options . . . . . — — 3 103 — — — 103Restricted share award vestings
and other activity . . . . . . . . . — — 1 143 (138) — — 5Repurchase of common shares . . — — (18) (1,163) — — — (1,163)Cancellation of treasury shares . . (5) (2) 5 305 (303) — — —
Balance at September 25, 2015 . 414 $182 (20) $(1,256) $ 4,359 $ 6,673 $(373) $ 9,585
Net income . . . . . . . . . . . . . . — — — — — 2,009 — 2,009Other comprehensive loss . . . . . — — — — — — (169) (169)Share-based compensation
expense . . . . . . . . . . . . . . . — — — — 91 — — 91Dividends approved . . . . . . . . — — — — (512) — — (512)Exercise of share options . . . . . — — 2 90 — — — 90Restricted share award vestings
and other activity . . . . . . . . . — — 2 146 (145) — — 1Repurchase of common shares . . — — (43) (2,610) — — — (2,610)Cancellation of treasury shares . . (31) (14) 31 2,006 (1,992) — — —
Balance at September 30, 2016 . 383 $168 (28) $(1,624) $ 1,801 $ 8,682 $(542) $ 8,485
Adoption of ASU No. 2016-09 . . — — — — — 165 — 165Net income . . . . . . . . . . . . . . — — — — — 1,683 — 1,683Other comprehensive income . . . — — — — — — 382 382Share-based compensation
expense . . . . . . . . . . . . . . . — — — — 99 — — 99Dividends approved . . . . . . . . — — — — (564) — — (564)Exercise of share options . . . . . — — 3 117 — — — 117Restricted share award vestings
and other activity . . . . . . . . . — — 2 195 (184) (6) — 5Repurchase of common shares . . — — (8) (621) — — — (621)Cancellation of treasury shares . . (26) (11) 26 1,512 (1,152) (349) — —
Balance at September 29, 2017 . 357 $157 (5) $ (421) $ — $10,175 $(160) $ 9,751
See Notes to Consolidated Financial Statements.
43
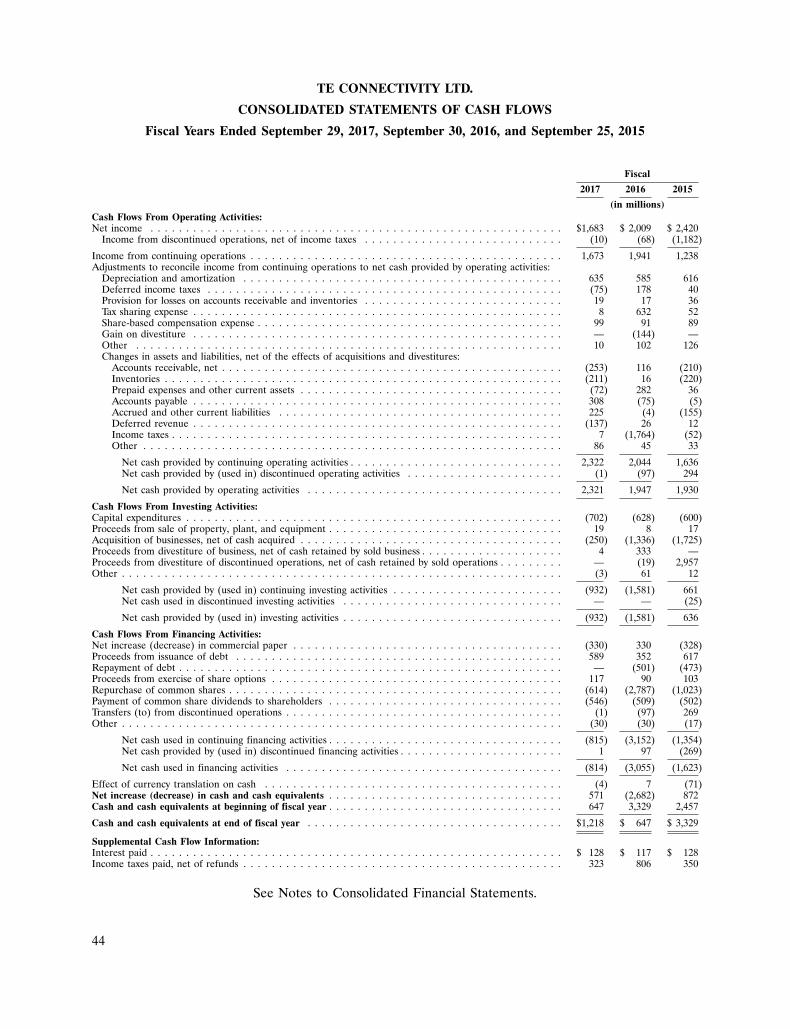
44
TE CONNECTIVITY LTD.
CONSOLIDATED STATEMENTS OF CASH FLOWS
Fiscal Years Ended September 29, 2017, September 30, 2016, and September 25, 2015
Fiscal
2017 2016 2015
(in millions)Cash Flows From Operating Activities:Net income . . . . . . . . . . . . . . . . . . . . . . . . . . . . . . . . . . . . . . . . . . . . . . . . . . . . . . . . . . $1,683 $ 2,009 $ 2,420
Income from discontinued operations, net of income taxes . . . . . . . . . . . . . . . . . . . . . . . . . . . . (10) (68) (1,182)
Income from continuing operations . . . . . . . . . . . . . . . . . . . . . . . . . . . . . . . . . . . . . . . . . . . . 1,673 1,941 1,238Adjustments to reconcile income from continuing operations to net cash provided by operating activities:
Depreciation and amortization . . . . . . . . . . . . . . . . . . . . . . . . . . . . . . . . . . . . . . . . . . . . . 635 585 616Deferred income taxes . . . . . . . . . . . . . . . . . . . . . . . . . . . . . . . . . . . . . . . . . . . . . . . . . . (75) 178 40Provision for losses on accounts receivable and inventories . . . . . . . . . . . . . . . . . . . . . . . . . . . . 19 17 36Tax sharing expense . . . . . . . . . . . . . . . . . . . . . . . . . . . . . . . . . . . . . . . . . . . . . . . . . . . . 8 632 52Share-based compensation expense . . . . . . . . . . . . . . . . . . . . . . . . . . . . . . . . . . . . . . . . . . . 99 91 89Gain on divestiture . . . . . . . . . . . . . . . . . . . . . . . . . . . . . . . . . . . . . . . . . . . . . . . . . . . . — (144) —Other . . . . . . . . . . . . . . . . . . . . . . . . . . . . . . . . . . . . . . . . . . . . . . . . . . . . . . . . . . . . 10 102 126Changes in assets and liabilities, net of the effects of acquisitions and divestitures:
Accounts receivable, net . . . . . . . . . . . . . . . . . . . . . . . . . . . . . . . . . . . . . . . . . . . . . . . . (253) 116 (210)Inventories . . . . . . . . . . . . . . . . . . . . . . . . . . . . . . . . . . . . . . . . . . . . . . . . . . . . . . . . (211) 16 (220)Prepaid expenses and other current assets . . . . . . . . . . . . . . . . . . . . . . . . . . . . . . . . . . . . . (72) 282 36Accounts payable . . . . . . . . . . . . . . . . . . . . . . . . . . . . . . . . . . . . . . . . . . . . . . . . . . . . 308 (75) (5)Accrued and other current liabilities . . . . . . . . . . . . . . . . . . . . . . . . . . . . . . . . . . . . . . . . 225 (4) (155)Deferred revenue . . . . . . . . . . . . . . . . . . . . . . . . . . . . . . . . . . . . . . . . . . . . . . . . . . . . (137) 26 12Income taxes . . . . . . . . . . . . . . . . . . . . . . . . . . . . . . . . . . . . . . . . . . . . . . . . . . . . . . . 7 (1,764) (52)Other . . . . . . . . . . . . . . . . . . . . . . . . . . . . . . . . . . . . . . . . . . . . . . . . . . . . . . . . . . . 86 45 33
Net cash provided by continuing operating activities . . . . . . . . . . . . . . . . . . . . . . . . . . . . . . 2,322 2,044 1,636Net cash provided by (used in) discontinued operating activities . . . . . . . . . . . . . . . . . . . . . . (1) (97) 294
Net cash provided by operating activities . . . . . . . . . . . . . . . . . . . . . . . . . . . . . . . . . . . . 2,321 1,947 1,930
Cash Flows From Investing Activities:Capital expenditures . . . . . . . . . . . . . . . . . . . . . . . . . . . . . . . . . . . . . . . . . . . . . . . . . . . . . (702) (628) (600)Proceeds from sale of property, plant, and equipment . . . . . . . . . . . . . . . . . . . . . . . . . . . . . . . . . 19 8 17Acquisition of businesses, net of cash acquired . . . . . . . . . . . . . . . . . . . . . . . . . . . . . . . . . . . . . (250) (1,336) (1,725)Proceeds from divestiture of business, net of cash retained by sold business . . . . . . . . . . . . . . . . . . . . 4 333 —Proceeds from divestiture of discontinued operations, net of cash retained by sold operations . . . . . . . . . — (19) 2,957Other . . . . . . . . . . . . . . . . . . . . . . . . . . . . . . . . . . . . . . . . . . . . . . . . . . . . . . . . . . . . . . (3) 61 12
Net cash provided by (used in) continuing investing activities . . . . . . . . . . . . . . . . . . . . . . . . (932) (1,581) 661Net cash used in discontinued investing activities . . . . . . . . . . . . . . . . . . . . . . . . . . . . . . . — — (25)
Net cash provided by (used in) investing activities . . . . . . . . . . . . . . . . . . . . . . . . . . . . . . . (932) (1,581) 636
Cash Flows From Financing Activities:Net increase (decrease) in commercial paper . . . . . . . . . . . . . . . . . . . . . . . . . . . . . . . . . . . . . . (330) 330 (328)Proceeds from issuance of debt . . . . . . . . . . . . . . . . . . . . . . . . . . . . . . . . . . . . . . . . . . . . . . 589 352 617Repayment of debt . . . . . . . . . . . . . . . . . . . . . . . . . . . . . . . . . . . . . . . . . . . . . . . . . . . . . . — (501) (473)Proceeds from exercise of share options . . . . . . . . . . . . . . . . . . . . . . . . . . . . . . . . . . . . . . . . . 117 90 103Repurchase of common shares . . . . . . . . . . . . . . . . . . . . . . . . . . . . . . . . . . . . . . . . . . . . . . . (614) (2,787) (1,023)Payment of common share dividends to shareholders . . . . . . . . . . . . . . . . . . . . . . . . . . . . . . . . . (546) (509) (502)Transfers (to) from discontinued operations . . . . . . . . . . . . . . . . . . . . . . . . . . . . . . . . . . . . . . . (1) (97) 269Other . . . . . . . . . . . . . . . . . . . . . . . . . . . . . . . . . . . . . . . . . . . . . . . . . . . . . . . . . . . . . . (30) (30) (17)
Net cash used in continuing financing activities . . . . . . . . . . . . . . . . . . . . . . . . . . . . . . . . . (815) (3,152) (1,354)Net cash provided by (used in) discontinued financing activities . . . . . . . . . . . . . . . . . . . . . . . 1 97 (269)
Net cash used in financing activities . . . . . . . . . . . . . . . . . . . . . . . . . . . . . . . . . . . . . . . (814) (3,055) (1,623)
Effect of currency translation on cash . . . . . . . . . . . . . . . . . . . . . . . . . . . . . . . . . . . . . . . . . . (4) 7 (71)Net increase (decrease) in cash and cash equivalents . . . . . . . . . . . . . . . . . . . . . . . . . . . . . . . . . 571 (2,682) 872Cash and cash equivalents at beginning of fiscal year . . . . . . . . . . . . . . . . . . . . . . . . . . . . . . . . . 647 3,329 2,457
Cash and cash equivalents at end of fiscal year . . . . . . . . . . . . . . . . . . . . . . . . . . . . . . . . . . . . $1,218 $ 647 $ 3,329
Supplemental Cash Flow Information:Interest paid . . . . . . . . . . . . . . . . . . . . . . . . . . . . . . . . . . . . . . . . . . . . . . . . . . . . . . . . . . $ 128 $ 117 $ 128Income taxes paid, net of refunds . . . . . . . . . . . . . . . . . . . . . . . . . . . . . . . . . . . . . . . . . . . . . 323 806 350
See Notes to Consolidated Financial Statements.
44
45
TE CONNECTIVITY LTD.
NOTES TO CONSOLIDATED FINANCIAL STATEMENTS
1. Basis of Presentation
The Consolidated Financial Statements reflect the consolidated operations of TE Connectivity Ltd.and its subsidiaries and have been prepared in United States (‘‘U.S.’’) dollars in accordance withaccounting principles generally accepted in the U.S. (‘‘GAAP’’).
Description of the Business
TE Connectivity Ltd. (‘‘TE Connectivity’’ or the ‘‘Company,’’ which may be referred to as ‘‘we,’’‘‘us,’’ or ‘‘our’’) is a global technology and manufacturing leader creating a safer, sustainable,productive, and connected future. For more than 75 years, our connectivity and sensor solutions,proven in the harshest environments, have enabled advancements in transportation, industrialapplications, medical technology, energy, data communications, and the home.
We operate through three reportable segments:
• Transportation Solutions. The Transportation Solutions segment is a leader in connectivity andsensor technologies. Our products, which must withstand harsh conditions, are used in theautomotive, commercial transportation, and sensors markets.
• Industrial Solutions. The Industrial Solutions segment is a leading supplier of products thatconnect and distribute power, data, and signals. Our products are used in the industrialequipment; aerospace, defense, oil, and gas; and energy markets.
• Communications Solutions. The Communications Solutions segment is a leading supplier ofelectronic components for the data and devices and the appliances markets. We are also a leaderin developing, manufacturing, installing, and maintaining some of the world’s most advancedsubsea fiber optic communications systems.
Use of Estimates
The preparation of the Consolidated Financial Statements in conformity with GAAP requiresmanagement to make estimates and assumptions that affect the reported amounts of assets andliabilities, the disclosure of contingent assets and liabilities, and the reported amounts of revenues andexpenses. Significant estimates in these Consolidated Financial Statements include restructuring andother charges, assets acquired and liabilities assumed in acquisitions, allowances for doubtful accountsreceivable, estimates of future cash flows and discount rates associated with asset impairments, usefullives for depreciation and amortization, loss contingencies, net realizable value of inventories, estimatedcontract revenue and related costs, legal contingencies, tax reserves and deferred tax asset valuationallowances, and the determination of discount and other rate assumptions for pension benefit cost.Actual results could differ materially from these estimates.
Fiscal Year
We have a 52- or 53-week fiscal year that ends on the last Friday of September. For fiscal years inwhich there are 53 weeks, the fourth quarter reporting period includes 14 weeks. Fiscal 2017, 2016, and2015 ended on September 29, 2017, September 30, 2016, and September 25, 2015, respectively.Fiscal 2017 and 2015 were 52 weeks in length. Fiscal 2016 was a 53-week year.
45
46
TE CONNECTIVITY LTD.
NOTES TO CONSOLIDATED FINANCIAL STATEMENTS (Continued)
2. Summary of Significant Accounting Policies
Principles of Consolidation
We consolidate entities in which we own or control more than 50% of the voting shares orotherwise have the ability to control through similar rights. All intercompany transactions have beeneliminated. The results of companies acquired or disposed of are included on the ConsolidatedFinancial Statements from the effective date of acquisition or up to the date of disposal.
Revenue Recognition
Our revenues are generated principally from the sale of our products. Revenue from the sale ofproducts is recognized at the time title and the risks and rewards of ownership pass to the customer.This generally occurs when the products reach the shipping point, the sales price is fixed anddeterminable, and collection is reasonably assured.
Contract revenues for construction related projects, which are generated in the CommunicationsSolutions segment, are recorded primarily using the percentage-of-completion method. Profitsrecognized on contracts in process are based upon estimated contract revenue and related cost tocomplete. Percentage-of-completion is measured based on the ratio of actual costs incurred to totalestimated costs. Revisions in cost estimates as contracts progress have the effect of increasing ordecreasing profits in the current period. Provisions for anticipated losses are made in the period inwhich they first become determinable. In addition, provisions for credit losses related to unbilledreceivables on construction related projects are recorded as reductions of revenue in the period inwhich they first become determinable.
We generally warrant that our products will conform to our, or mutually agreed to, specificationsand that our products will be free from material defects in materials and workmanship for a limitedtime. We limit our warranty to the replacement or repair of defective parts, or a refund or credit of theprice of the defective product. We accept returned goods only when the customer makes a verifiedclaim and we have authorized the return. Generally, a reserve for estimated returns is established atthe time of sale based on historical return experience and is recorded as a reduction of sales.
Additionally, certain of our long-term contracts in the Communications Solutions segment havewarranty obligations. Estimated warranty costs for each contract are determined based on the contractterms and technology-specific considerations. These costs are included in total estimated contract costsand are accrued over the construction period of the respective contracts underpercentage-of-completion accounting.
We provide certain distributors with an inventory allowance for returns or scrap equal to apercentage of qualified purchases. A reserve for estimated returns and scrap allowances is establishedat the time of the sale based on an agreed-upon, fixed percentage of sales to distributors and isrecorded as a reduction of sales.
Other allowances include customer quantity and price discrepancies. A reserve for otherallowances is generally established at the time of sale based on historical experience and is recorded asa reduction of sales. We believe we can reasonably and reliably estimate the amounts of futureallowances.
46
47
TE CONNECTIVITY LTD.
NOTES TO CONSOLIDATED FINANCIAL STATEMENTS (Continued)
2. Summary of Significant Accounting Policies (Continued)
Inventories
Inventories are recorded at the lower of cost or market value using the first-in, first-out costmethod, except for inventoried costs incurred in the performance of long-term contracts primarily bythe Communications Solutions segment.
Property, Plant, and Equipment, Net
Property, plant, and equipment is recorded at cost less accumulated depreciation. Maintenance andrepair expenditures are charged to expense when incurred. Depreciation is calculated using thestraight-line method over the estimated useful lives of the assets, which are 10 to 20 years for landimprovements, 5 to 40 years for buildings and improvements, and 1 to 15 years for machinery andequipment.
We periodically evaluate, when events and circumstances warrant, the net realizable value ofproperty, plant, and equipment and other long-lived assets, relying on a number of factors includingoperating results, business plans, economic projections, and anticipated future cash flows. Whenindicators of potential impairment are present, the carrying values of the asset group are evaluated inrelation to the operating performance and estimated future undiscounted cash flows of the underlyingasset group. Impairment of the carrying value is recognized whenever anticipated future undiscountedcash flow estimates are less than the carrying value of the asset. Fair value estimates are based onassumptions concerning the amount and timing of estimated future cash flows and discount rates,reflecting varying degrees of perceived risk.
Goodwill and Other Intangible Assets
Intangible assets include both indeterminable-lived residual goodwill and determinable-livedidentifiable intangible assets. Intangible assets with determinable lives primarily include intellectualproperty, consisting of patents, trademarks, and unpatented technology, and customer relationships.Recoverability estimates range from 1 to 50 years and costs are generally amortized on a straight-linebasis. Evaluations of the remaining useful lives of determinable-lived intangible assets are performed ona periodic basis and when events and circumstances warrant.
At fiscal year end 2017, we had six reporting units, five of which contained goodwill. There weretwo reporting units in each of our three segments. When changes occur in the composition of one ormore reporting units, goodwill is reassigned to the reporting units affected based on their relative fairvalues.
Goodwill impairment is evaluated by comparing the carrying value of each reporting unit to its fairvalue on the first day of the fourth fiscal quarter of each year or whenever we believe a triggeringevent requiring a more frequent assessment has occurred. In assessing the existence of a triggeringevent, management relies on a number of reporting unit-specific factors including operating results,business plans, economic projections, anticipated future cash flows, transactions, and market place data.There are inherent uncertainties related to these factors and management’s judgment in applying thesefactors to the impairment analysis.
When testing for goodwill impairment, we perform a step I goodwill impairment test to identifypotential impairment by comparing the fair value of a reporting unit with its carrying amount. If thecarrying amount of a reporting unit exceeds its fair value, goodwill may be impaired and a step II
47
48
TE CONNECTIVITY LTD.
NOTES TO CONSOLIDATED FINANCIAL STATEMENTS (Continued)
2. Summary of Significant Accounting Policies (Continued)
goodwill impairment test is performed to measure the amount of impairment, if any. In the step IIgoodwill impairment test, we compare the implied fair value of reporting unit goodwill with thecarrying amount of that goodwill. If the carrying amount of reporting unit goodwill exceeds the impliedfair value of that goodwill, an impairment loss is recognized in an amount equal to the excess. Theimplied fair value of goodwill is determined in a manner consistent with how goodwill is recognized ina business combination. We allocate the fair value of a reporting unit to the assets and liabilities of thatunit, including intangible assets, as if the reporting unit had been acquired in a business combination.Any excess of the fair value of a reporting unit over the amounts assigned to its assets and liabilities isthe implied fair value of goodwill.
Fair value estimates used in the step I goodwill impairment tests are calculated using an incomeapproach based on the present value of future cash flows of each reporting unit. The income approachgenerally has been supported by guideline analyses (a market approach). These approaches incorporatea number of assumptions including future growth rates, discount rates, income tax rates, and marketactivity in assessing fair value and are reporting unit specific. Changes in economic and operatingconditions impacting these assumptions could result in goodwill impairments in future periods.
Research and Development
Research and development expenditures are expensed when incurred and are included in research,development, and engineering expenses on the Consolidated Statements of Operations. Research anddevelopment expenses include salaries, direct costs incurred, and building and overhead expenses. Theamounts expensed in fiscal 2017, 2016, and 2015 were $595 million, $566 million, and $540 million,respectively.
Income Taxes
Income taxes are computed in accordance with the provisions of Accounting StandardsCodification (‘‘ASC’’) 740, Income Taxes. Deferred tax liabilities and assets are recognized for theexpected future tax consequences of events that have been reflected on the Consolidated FinancialStatements. Deferred tax liabilities and assets are determined based on the differences between thebook and tax bases of particular assets and liabilities and operating loss carryforwards using tax rates ineffect for the years in which the differences are expected to reverse. A valuation allowance is providedto offset deferred tax assets if, based upon the available evidence, it is more likely than not that someor all of the deferred tax assets will not be realized.
The calculation of our tax liabilities includes estimates for uncertainties in the application ofcomplex tax regulations across multiple global jurisdictions where we conduct our operations. Underthe uncertain tax position provisions of ASC 740, we recognize liabilities for tax and related interest forissues in tax jurisdictions based on our estimate of whether, and the extent to which, additional taxesand related interest will be due. These tax liabilities and related interest are reflected net of the impactof related tax loss carryforwards, as such tax loss carryforwards will be applied against these taxliabilities and will reduce the amount of cash tax payments due upon the eventual settlement with thetax authorities. These estimates may change due to changing facts and circumstances. Due to thecomplexity of these uncertainties, the ultimate resolution may result in a settlement that differs fromour current estimate of the tax liabilities and related interest.
48
49
TE CONNECTIVITY LTD.
NOTES TO CONSOLIDATED FINANCIAL STATEMENTS (Continued)
2. Summary of Significant Accounting Policies (Continued)
Financial Instruments
Our financial instruments consist primarily of cash and cash equivalents, accounts receivable,accounts payable, debt, and derivative financial instruments.
We account for derivative financial instrument contracts on the Consolidated Balance Sheets at fairvalue. For instruments not designated as hedges under ASC 815, Derivatives and Hedging, the changesin the instruments’ fair value are recognized currently in earnings. For instruments designated as cashflow hedges, the effective portion of changes in the fair value of a derivative is recorded in othercomprehensive income (loss) and reclassified into earnings in the same period or periods during whichthe underlying hedged item affects earnings. Ineffective portions of a cash flow hedge, includingamounts excluded from the hedging relationship, are recognized currently in earnings. Changes in thefair value of instruments designated as fair value hedges affect the carrying value of the asset orliability hedged, with changes in both the derivative instrument and the hedged asset or liability beingrecognized currently in earnings.
We determine the fair value of our financial instruments by using methods and assumptions thatare based on market conditions and risks existing at each balance sheet date. Standard marketconventions are used to determine the fair value of financial instruments, including derivatives.
The cash flows related to derivative financial instruments are reported in the operating activitiessection of the Consolidated Statements of Cash Flows.
Our derivative financial instruments present certain market and counterparty risks. Concentrationof counterparty risk is mitigated, however, by our use of financial institutions worldwide, substantiallyall of which have long-term Standard & Poor’s, Moody’s, and/or Fitch credit ratings of A/A2 or higher.In addition, we utilize only conventional derivative financial instruments. We are exposed to potentiallosses if a counterparty fails to perform according to the terms of its agreement. With respect tocounterparty net asset positions recognized at fiscal year end 2017, we have assessed the likelihood ofcounterparty default as remote. We currently provide guarantees from a wholly-owned subsidiary to thecounterparties to our commodity swap derivatives and exchange cash collateral with the counterpartiesto our cross-currency swap contracts. The likelihood of performance on the guarantees has beenassessed as remote. For all other derivative financial instruments, we are not required to provide, nordo we require counterparties to provide, collateral or other security.
Fair Value Measurements
ASC 820, Fair Value Measurements and Disclosures, specifies a fair value hierarchy based upon theobservable inputs utilized in valuation of certain assets and liabilities. Observable inputs (highest level)reflect market data obtained from independent sources, while unobservable inputs (lowest level) reflectinternally developed market assumptions. Fair value measurements are classified under the followinghierarchy:
• Level 1. Quoted prices in active markets for identical assets and liabilities.
• Level 2. Quoted prices in active markets for similar assets and liabilities, or other inputs that areobservable for the asset or liability, either directly or indirectly, for substantially the full term ofthe asset or liability.
49
50
TE CONNECTIVITY LTD.
NOTES TO CONSOLIDATED FINANCIAL STATEMENTS (Continued)
2. Summary of Significant Accounting Policies (Continued)
• Level 3. Unobservable inputs that are supported by little or no market activity and that aresignificant to the fair value of the assets and liabilities. This includes certain pricing models,discounted cash flows methodologies, and similar techniques that use significant unobservableinputs.
Derivative financial instruments measured at fair value on a recurring basis are generally valuedusing level 2 inputs.
Financial instruments other than derivative instruments include cash and cash equivalents, accountsreceivable, accounts payable, and debt. These instruments are recorded on the Consolidated BalanceSheets at book value. For cash and cash equivalents, accounts receivable, and accounts payable, webelieve book value approximates fair value due to the short-term nature of these instruments. SeeNote 11 for disclosure of the fair value of debt. The following is a description of the valuationmethodologies used for the respective financial instruments:
• Cash and cash equivalents. Cash and cash equivalents are valued at book value, which weconsider to be equivalent to unadjusted quoted prices (level 1).
• Accounts receivable. Accounts receivable are valued based on the net value expected to berealized. The net realizable value generally represents an observable contractual agreement(level 2).
• Accounts payable. Accounts payable are valued based on the net value expected to be paid,generally supported by an observable contractual agreement (level 2).
• Debt. The fair value of debt, including both current and non-current maturities, is derived fromquoted market prices or other pricing determinations based on the results of market approachvaluation models using observable market data such as recently reported trades, bid and offerinformation, and benchmark securities (level 2).
Pension Liabilities
The funded status of our defined benefit pension plans is recognized on the Consolidated BalanceSheets and is measured as the difference between the fair value of plan assets and the projected benefitobligation at the measurement date. The projected benefit obligation represents the actuarial presentvalue of benefits projected to be paid upon retirement factoring in estimated future compensationlevels. The fair value of plan assets represents the current market value of cumulative company andparticipant contributions made to irrevocable trust funds, held for the sole benefit of participants, whichare invested by the trustee of the funds. The benefits under our defined benefit pension plans arebased on various factors, such as years of service and compensation.
Net periodic pension benefit cost is based on the utilization of the projected unit credit method ofcalculation and is charged to earnings on a systematic basis over the expected average remainingservice lives of current participants.
The measurement of benefit obligations and net periodic benefit cost is based on estimates andassumptions determined by our management. These valuations reflect the terms of the plans and useparticipant-specific information such as compensation, age, and years of service, as well as certainassumptions, including estimates of discount rates, expected return on plan assets, rate of compensationincreases, interest crediting rates, and mortality rates.
50
51
TE CONNECTIVITY LTD.
NOTES TO CONSOLIDATED FINANCIAL STATEMENTS (Continued)
2. Summary of Significant Accounting Policies (Continued)
Share-Based Compensation
We determine the fair value of share awards on the date of grant. Share options are valued usingthe Black-Scholes-Merton valuation model; restricted share awards and performance awards are valuedusing our end-of-day share price on the date of grant. The fair value is expensed ratably over theexpected service period, with an allowance made for estimated forfeitures based on historical employeeactivity. Estimates regarding the attainment of performance criteria are reviewed periodically; thecumulative impact of a change in estimate regarding the attainment of performance criteria is recordedin the period in which that change is made.
Earnings Per Share
Basic earnings per share is computed by dividing net income by the basic weighted-average numberof common shares outstanding. Diluted earnings per share is computed by dividing net income by theweighted-average number of common shares outstanding adjusted for the potentially dilutive impact ofshare-based compensation arrangements.
Currency Translation
For our non-U.S. dollar functional currency subsidiaries, assets and liabilities are translated intoU.S. dollars using fiscal year end exchange rates. Sales and expenses are translated at average monthlyexchange rates. Foreign currency translation gains and losses are included as a component ofaccumulated other comprehensive income (loss) within equity.
Gains and losses resulting from foreign currency transactions, which are included in earnings, wereimmaterial in fiscal 2017, 2016, and 2015.
Restructuring Charges
Restructuring activities involve employee-related termination costs, facility exit costs, and assetimpairments resulting from reductions-in-force, migration of facilities or product lines from higher-costto lower-cost countries, or consolidation of facilities within countries. We recognize termination costsbased on requirements established by severance policy, government law, or previous actions. Facilityexit costs generally reflect the cost to terminate a facility lease before the end of its term (measured atfair value at the time we cease using the facility) or costs that will continue to be incurred under thefacility lease without future economic benefit to us. Restructuring activities often result in the disposalor abandonment of assets that require an acceleration of depreciation or impairment reflecting theexcess of the assets’ carrying values over fair value.
The recognition of restructuring costs require that we make certain judgments and estimatesregarding the nature, timing, and amount of costs associated with the planned exit activity. To theextent our actual results differ from our estimates and assumptions, we may be required to revise theestimated liabilities, requiring the recognition of additional restructuring costs or the reduction ofliabilities already recognized. At the end of each reporting period, we evaluate the remaining accruedbalances to ensure these balances are properly stated and the utilization of the reserves are for theirintended purpose in accordance with developed exit plans.
51
52
TE CONNECTIVITY LTD.
NOTES TO CONSOLIDATED FINANCIAL STATEMENTS (Continued)
2. Summary of Significant Accounting Policies (Continued)
Acquisitions
We account for acquired businesses using the acquisition method of accounting. This methodrequires, among other things, that most assets acquired and liabilities assumed be recognized at fairvalue as of the acquisition date. We allocate the purchase price of acquired businesses to the tangibleand intangible assets acquired and liabilities assumed based on estimated fair values, or as required byASC 805, Business Combinations. The excess of the purchase price over the identifiable assets acquiredand liabilities assumed is recorded as goodwill. We may engage independent third-party appraisal firmsto assist us in determining the fair values of assets acquired and liabilities assumed. Such valuationsrequire management to make significant estimates and assumptions, especially with respect tointangible assets.
Contingent Liabilities
We record a loss contingency when the available information indicates it is probable that we haveincurred a liability and the amount of the loss is reasonably estimable. When a range of possible losseswith equal likelihood exists, we record the low end of the range. The likelihood of a loss with respectto a particular contingency is often difficult to predict, and determining a meaningful estimate of theloss or a range of loss may not be practicable based on information available. In addition, it is notuncommon for such matters to be resolved over many years, during which time relevant developmentsand new information must continuously be evaluated to determine whether a loss is probable and areasonable estimate of that loss can be made. When a loss is probable but a reasonable estimate cannotbe made, or when a loss is at least reasonably possible, disclosure is provided.
Recently Issued Accounting Pronouncements
In October 2016, the Financial Accounting Standards Board (‘‘FASB’’) issued AccountingStandards Update (‘‘ASU’’) No. 2016-16, an update to ASC 740, Income Taxes. This new guidancerequires the recognition of the income tax consequences of intra-entity transfers of assets other thaninventory in the period in which the transfer occurs. The update, which we will adopt on a modifiedretrospective basis, is effective for us in the first quarter of fiscal 2019. Based on amounts recorded asof September 29, 2017, adoption would result in approximately a $120 million cumulative-effectadjustment to beginning accumulated earnings and a $120 million decrease in total assets, primarily inother assets. Future transactions prior to adoption of this update could significantly change the impactat adoption.
In February 2016, the FASB issued ASU No. 2016-02 which codified ASC 842, Leases. Thisguidance, which requires lessees to recognize a lease liability and a right-of-use asset for most leases, iseffective for us in the first quarter of fiscal 2020. We will adopt the new standard using a modifiedretrospective transition approach which requires application of the new guidance for all periodspresented. We are currently assessing the impact that adoption will have on our financial position.
In May 2014, the FASB issued ASU No. 2014-09 which codified ASC topic 606, Revenue fromContracts with Customers. This guidance supersedes ASC 605, Revenue Recognition, and introduces asingle, comprehensive, five-step revenue recognition model. ASC 606 also enhances disclosures relatedto revenue recognition. ASC 606, as amended, is effective for us in the first quarter of fiscal 2019 andallows for either a full retrospective or a modified retrospective approach at adoption. We arecontinuing to assess the impact of adopting ASC 606. Based on the initial evaluation of our current
52
53
TE CONNECTIVITY LTD.
NOTES TO CONSOLIDATED FINANCIAL STATEMENTS (Continued)
2. Summary of Significant Accounting Policies (Continued)
contracts and revenue streams, we do not expect that adoption will have a material impact on ourresults of operations or financial position and plan to adopt the new standard using the modifiedretrospective approach. We are in the process of identifying necessary changes to accounting policies,processes, financial statement disclosures, internal controls, and systems to enable compliance with thisnew standard. We believe we are following an appropriate timeline to allow for the proper recognition,reporting, and disclosure of revenue upon adoption of ASC 606 at the beginning of fiscal 2019.
Recently Adopted Accounting Pronouncements
In March 2016, the FASB issued ASU No. 2016-09, an update to ASC 718, Compensation—StockCompensation, to simplify various aspects of accounting for share-based payments to employees. Weelected to early adopt this update in fiscal 2017. The provisions of the update addressing theaccounting for excess tax benefits and deficiencies were adopted using a modified retrospectivetransition approach, with a cumulative-effect adjustment to beginning accumulated earnings and acorresponding increase in deferred tax assets of $165 million. The provision of the update addressingthe presentation on the statement of cash flows of employee taxes paid via the withholding of shareswas applied retrospectively and did not have a material impact on our Consolidated FinancialStatements. Adoption of other provisions, which were applied prospectively, also did not have amaterial impact on our Consolidated Financial Statements.
3. Restructuring and Other Charges, Net
Net restructuring and other charges consisted of the following:
Fiscal
2017 2016 2015
(in millions)
Restructuring charges, net . . . . . . . . . . . . . . . . . . . . . . . . . . . . . . . . . . . . . . . . $147 $ 125 $ 93Gain on divestiture . . . . . . . . . . . . . . . . . . . . . . . . . . . . . . . . . . . . . . . . . . . . . — (144) —Other charges, net . . . . . . . . . . . . . . . . . . . . . . . . . . . . . . . . . . . . . . . . . . . . . . 1 21 59
$148 $ 2 $152
Restructuring Charges, Net
Net restructuring charges by segment were as follows:
Fiscal
2017 2016 2015
(in millions)
Transportation Solutions . . . . . . . . . . . . . . . . . . . . . . . . . . . . . . . . . . . . . . . . . . . $ 67 $ 39 $ 6Industrial Solutions . . . . . . . . . . . . . . . . . . . . . . . . . . . . . . . . . . . . . . . . . . . . . . 72 28 29Communications Solutions . . . . . . . . . . . . . . . . . . . . . . . . . . . . . . . . . . . . . . . . . 8 58 58
Restructuring charges, net . . . . . . . . . . . . . . . . . . . . . . . . . . . . . . . . . . . . . . . . $147 $125 $93
53
54
TE CONNECTIVITY LTD.
NOTES TO CONSOLIDATED FINANCIAL STATEMENTS (Continued)
3. Restructuring and Other Charges, Net (Continued)
Activity in our restructuring reserves is summarized as follows:
Balance at Balance atBeginning Currency End ofof Fiscal Changes in Cash Non-Cash Translation Fiscal
Year Charges Estimate Payments Items and Other Year
(in millions)Fiscal 2017 Activity:
Fiscal 2017 Actions:Employee severance . . . . . . . . . . . $ — $143 $ (5) $(40) $ — $ 5 $103Facility and other exit costs . . . . . . . — 2 — (1) — — 1Property, plant, and equipment . . . . — 9 — — (9) — —
Total . . . . . . . . . . . . . . . . . . . . — 154 (5) (41) (9) 5 104
Fiscal 2016 Actions:Employee severance . . . . . . . . . . . 54 8 (9) (27) — — 26Facility and other exit costs . . . . . . . — 3 — (3) — — —
Total . . . . . . . . . . . . . . . . . . . . 54 11 (9) (30) — — 26
Fiscal 2015 Actions:Employee severance . . . . . . . . . . . 13 — (2) (4) — (1) 6
Pre-Fiscal 2015 Actions:Employee severance . . . . . . . . . . . 12 — (3) (3) — (2) 4Facility and other exit costs . . . . . . . 12 1 — (4) — — 9
Total . . . . . . . . . . . . . . . . . . . . 24 1 (3) (7) — (2) 13
Total fiscal 2017 activity . . . . . . . . . . . $ 91 $166 $(19) $(82) $ (9) $ 2 $149
Fiscal 2016 Activity:Fiscal 2016 Actions:
Employee severance . . . . . . . . . . . $ — $ 86 $ — $(32) $ — $ — $ 54Facility and other exit costs . . . . . . . — 3 — (3) — — —Property, plant, and equipment . . . . — 41 — — (41) — —
Total . . . . . . . . . . . . . . . . . . . . — 130 — (35) (41) — 54
Fiscal 2015 Actions:Employee severance . . . . . . . . . . . 45 3 (4) (31) — — 13Facility and other exit costs . . . . . . . 1 — — (1) — — —
Total . . . . . . . . . . . . . . . . . . . . 46 3 (4) (32) — — 13
Pre-Fiscal 2015 Actions:Employee severance . . . . . . . . . . . 24 — (6) (8) — 2 12Facility and other exit costs . . . . . . . 14 2 — (4) — — 12
Total . . . . . . . . . . . . . . . . . . . . 38 2 (6) (12) — 2 24
Total fiscal 2016 activity . . . . . . . . . . . $ 84 $135 $(10) $(79) $(41) $ 2 $ 91
54
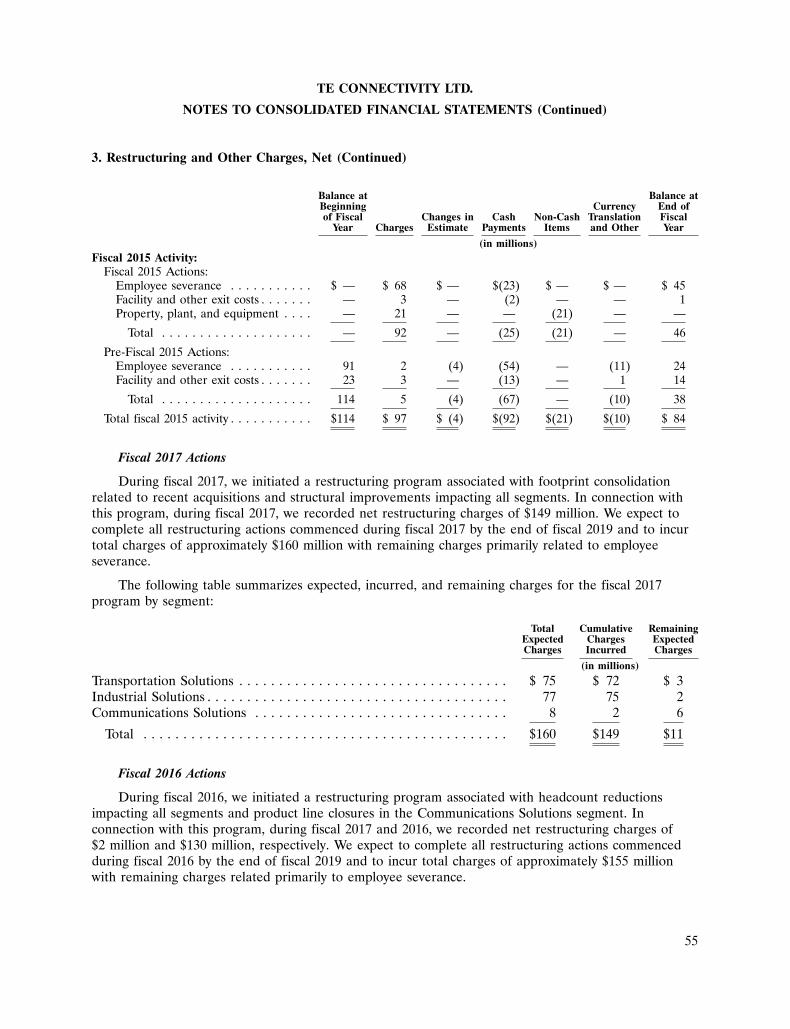
55
TE CONNECTIVITY LTD.
NOTES TO CONSOLIDATED FINANCIAL STATEMENTS (Continued)
3. Restructuring and Other Charges, Net (Continued)
Balance at Balance atBeginning Currency End ofof Fiscal Changes in Cash Non-Cash Translation Fiscal
Year Charges Estimate Payments Items and Other Year
(in millions)Fiscal 2015 Activity:
Fiscal 2015 Actions:Employee severance . . . . . . . . . . . $ — $ 68 $ — $(23) $ — $ — $ 45Facility and other exit costs . . . . . . . — 3 — (2) — — 1Property, plant, and equipment . . . . — 21 — — (21) — —
Total . . . . . . . . . . . . . . . . . . . . — 92 — (25) (21) — 46
Pre-Fiscal 2015 Actions:Employee severance . . . . . . . . . . . 91 2 (4) (54) — (11) 24Facility and other exit costs . . . . . . . 23 3 — (13) — 1 14
Total . . . . . . . . . . . . . . . . . . . . 114 5 (4) (67) — (10) 38
Total fiscal 2015 activity . . . . . . . . . . . $114 $ 97 $ (4) $(92) $(21) $(10) $ 84
Fiscal 2017 Actions
During fiscal 2017, we initiated a restructuring program associated with footprint consolidationrelated to recent acquisitions and structural improvements impacting all segments. In connection withthis program, during fiscal 2017, we recorded net restructuring charges of $149 million. We expect tocomplete all restructuring actions commenced during fiscal 2017 by the end of fiscal 2019 and to incurtotal charges of approximately $160 million with remaining charges primarily related to employeeseverance.
The following table summarizes expected, incurred, and remaining charges for the fiscal 2017program by segment:
Total Cumulative RemainingExpected Charges ExpectedCharges Incurred Charges
(in millions)
Transportation Solutions . . . . . . . . . . . . . . . . . . . . . . . . . . . . . . . . . . $ 75 $ 72 $ 3Industrial Solutions . . . . . . . . . . . . . . . . . . . . . . . . . . . . . . . . . . . . . . 77 75 2Communications Solutions . . . . . . . . . . . . . . . . . . . . . . . . . . . . . . . . 8 2 6
Total . . . . . . . . . . . . . . . . . . . . . . . . . . . . . . . . . . . . . . . . . . . . . . $160 $149 $11
Fiscal 2016 Actions
During fiscal 2016, we initiated a restructuring program associated with headcount reductionsimpacting all segments and product line closures in the Communications Solutions segment. Inconnection with this program, during fiscal 2017 and 2016, we recorded net restructuring charges of$2 million and $130 million, respectively. We expect to complete all restructuring actions commencedduring fiscal 2016 by the end of fiscal 2019 and to incur total charges of approximately $155 millionwith remaining charges related primarily to employee severance.
55
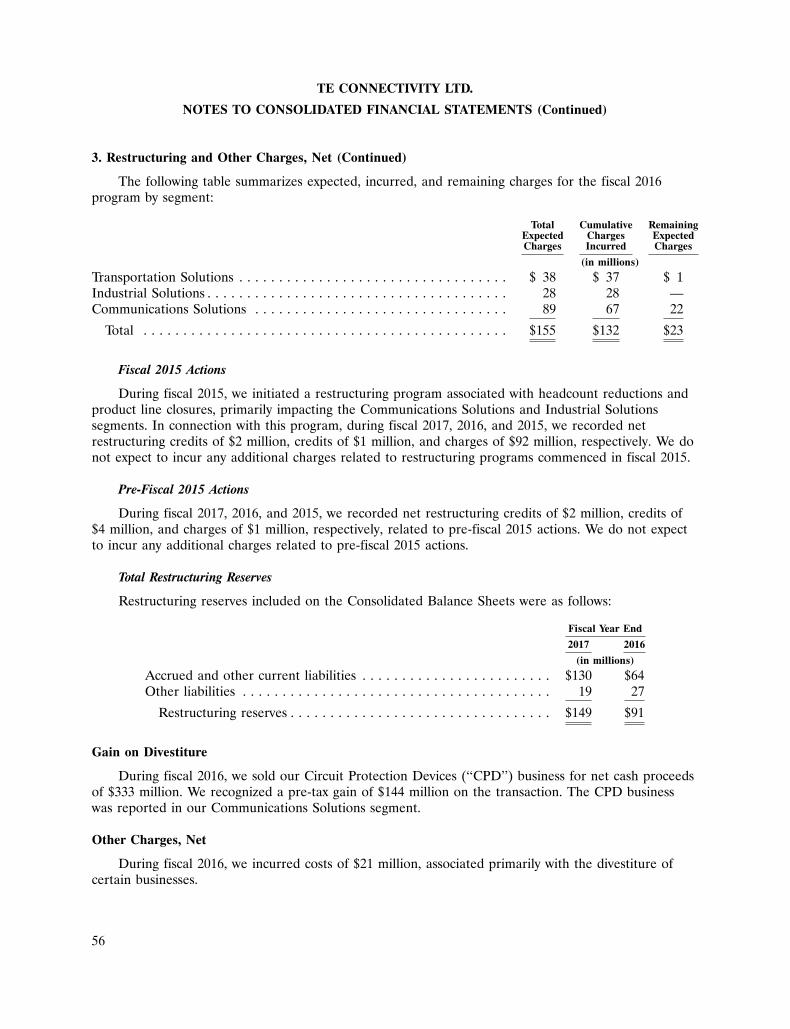
56
TE CONNECTIVITY LTD.
NOTES TO CONSOLIDATED FINANCIAL STATEMENTS (Continued)
3. Restructuring and Other Charges, Net (Continued)
The following table summarizes expected, incurred, and remaining charges for the fiscal 2016program by segment:
Total Cumulative RemainingExpected Charges ExpectedCharges Incurred Charges
(in millions)
Transportation Solutions . . . . . . . . . . . . . . . . . . . . . . . . . . . . . . . . . . $ 38 $ 37 $ 1Industrial Solutions . . . . . . . . . . . . . . . . . . . . . . . . . . . . . . . . . . . . . . 28 28 —Communications Solutions . . . . . . . . . . . . . . . . . . . . . . . . . . . . . . . . 89 67 22
Total . . . . . . . . . . . . . . . . . . . . . . . . . . . . . . . . . . . . . . . . . . . . . . $155 $132 $23
Fiscal 2015 Actions
During fiscal 2015, we initiated a restructuring program associated with headcount reductions andproduct line closures, primarily impacting the Communications Solutions and Industrial Solutionssegments. In connection with this program, during fiscal 2017, 2016, and 2015, we recorded netrestructuring credits of $2 million, credits of $1 million, and charges of $92 million, respectively. We donot expect to incur any additional charges related to restructuring programs commenced in fiscal 2015.
Pre-Fiscal 2015 Actions
During fiscal 2017, 2016, and 2015, we recorded net restructuring credits of $2 million, credits of$4 million, and charges of $1 million, respectively, related to pre-fiscal 2015 actions. We do not expectto incur any additional charges related to pre-fiscal 2015 actions.
Total Restructuring Reserves
Restructuring reserves included on the Consolidated Balance Sheets were as follows:
Fiscal Year End
2017 2016
(in millions)
Accrued and other current liabilities . . . . . . . . . . . . . . . . . . . . . . . . $130 $64Other liabilities . . . . . . . . . . . . . . . . . . . . . . . . . . . . . . . . . . . . . . . 19 27
Restructuring reserves . . . . . . . . . . . . . . . . . . . . . . . . . . . . . . . . . $149 $91
Gain on Divestiture
During fiscal 2016, we sold our Circuit Protection Devices (‘‘CPD’’) business for net cash proceedsof $333 million. We recognized a pre-tax gain of $144 million on the transaction. The CPD businesswas reported in our Communications Solutions segment.
Other Charges, Net
During fiscal 2016, we incurred costs of $21 million, associated primarily with the divestiture ofcertain businesses.
56
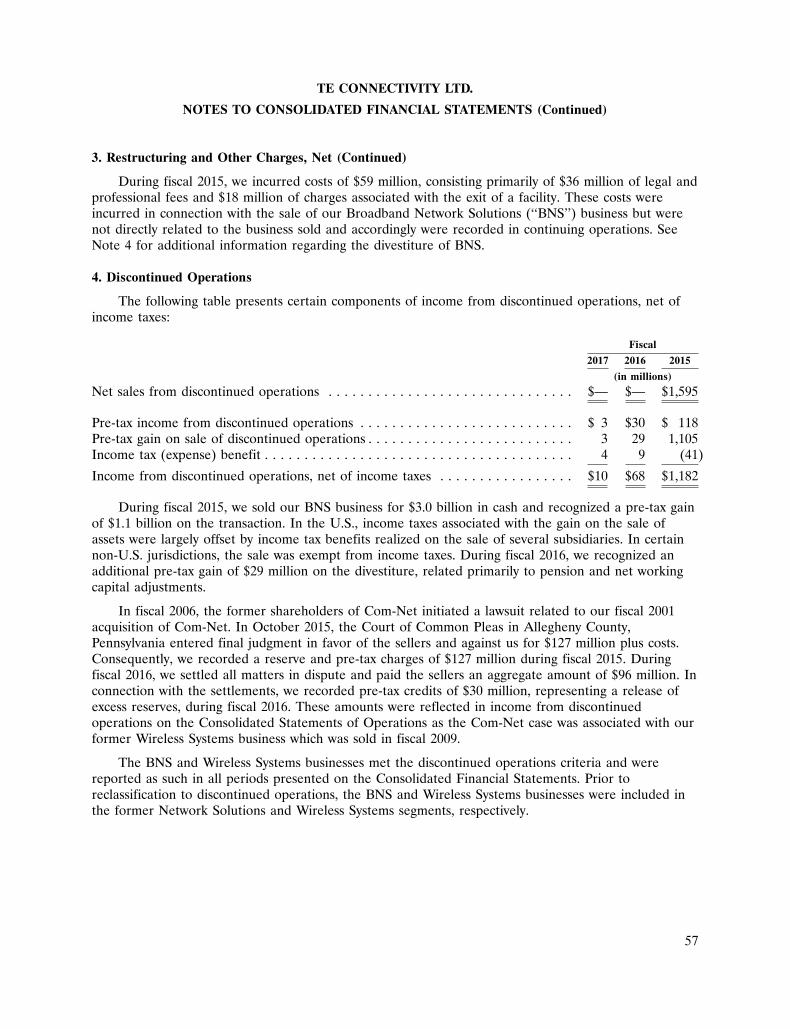
57
TE CONNECTIVITY LTD.
NOTES TO CONSOLIDATED FINANCIAL STATEMENTS (Continued)
3. Restructuring and Other Charges, Net (Continued)
During fiscal 2015, we incurred costs of $59 million, consisting primarily of $36 million of legal andprofessional fees and $18 million of charges associated with the exit of a facility. These costs wereincurred in connection with the sale of our Broadband Network Solutions (‘‘BNS’’) business but werenot directly related to the business sold and accordingly were recorded in continuing operations. SeeNote 4 for additional information regarding the divestiture of BNS.
4. Discontinued Operations
The following table presents certain components of income from discontinued operations, net ofincome taxes:
Fiscal
2017 2016 2015
(in millions)
Net sales from discontinued operations . . . . . . . . . . . . . . . . . . . . . . . . . . . . . . . $— $— $1,595
Pre-tax income from discontinued operations . . . . . . . . . . . . . . . . . . . . . . . . . . . $ 3 $30 $ 118Pre-tax gain on sale of discontinued operations . . . . . . . . . . . . . . . . . . . . . . . . . . 3 29 1,105Income tax (expense) benefit . . . . . . . . . . . . . . . . . . . . . . . . . . . . . . . . . . . . . . . 4 9 (41)
Income from discontinued operations, net of income taxes . . . . . . . . . . . . . . . . . $10 $68 $1,182
During fiscal 2015, we sold our BNS business for $3.0 billion in cash and recognized a pre-tax gainof $1.1 billion on the transaction. In the U.S., income taxes associated with the gain on the sale ofassets were largely offset by income tax benefits realized on the sale of several subsidiaries. In certainnon-U.S. jurisdictions, the sale was exempt from income taxes. During fiscal 2016, we recognized anadditional pre-tax gain of $29 million on the divestiture, related primarily to pension and net workingcapital adjustments.
In fiscal 2006, the former shareholders of Com-Net initiated a lawsuit related to our fiscal 2001acquisition of Com-Net. In October 2015, the Court of Common Pleas in Allegheny County,Pennsylvania entered final judgment in favor of the sellers and against us for $127 million plus costs.Consequently, we recorded a reserve and pre-tax charges of $127 million during fiscal 2015. Duringfiscal 2016, we settled all matters in dispute and paid the sellers an aggregate amount of $96 million. Inconnection with the settlements, we recorded pre-tax credits of $30 million, representing a release ofexcess reserves, during fiscal 2016. These amounts were reflected in income from discontinuedoperations on the Consolidated Statements of Operations as the Com-Net case was associated with ourformer Wireless Systems business which was sold in fiscal 2009.
The BNS and Wireless Systems businesses met the discontinued operations criteria and werereported as such in all periods presented on the Consolidated Financial Statements. Prior toreclassification to discontinued operations, the BNS and Wireless Systems businesses were included inthe former Network Solutions and Wireless Systems segments, respectively.
57
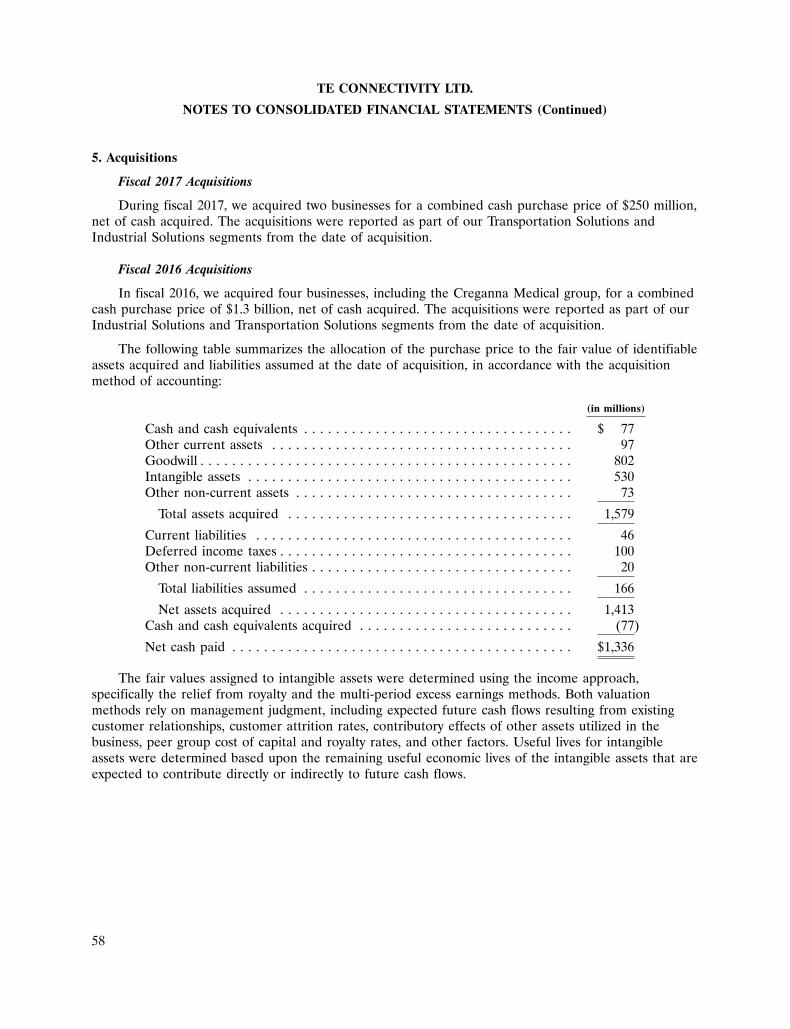
58
TE CONNECTIVITY LTD.
NOTES TO CONSOLIDATED FINANCIAL STATEMENTS (Continued)
5. Acquisitions
Fiscal 2017 Acquisitions
During fiscal 2017, we acquired two businesses for a combined cash purchase price of $250 million,net of cash acquired. The acquisitions were reported as part of our Transportation Solutions andIndustrial Solutions segments from the date of acquisition.
Fiscal 2016 Acquisitions
In fiscal 2016, we acquired four businesses, including the Creganna Medical group, for a combinedcash purchase price of $1.3 billion, net of cash acquired. The acquisitions were reported as part of ourIndustrial Solutions and Transportation Solutions segments from the date of acquisition.
The following table summarizes the allocation of the purchase price to the fair value of identifiableassets acquired and liabilities assumed at the date of acquisition, in accordance with the acquisitionmethod of accounting:
(in millions)
Cash and cash equivalents . . . . . . . . . . . . . . . . . . . . . . . . . . . . . . . . . . $ 77Other current assets . . . . . . . . . . . . . . . . . . . . . . . . . . . . . . . . . . . . . . 97Goodwill . . . . . . . . . . . . . . . . . . . . . . . . . . . . . . . . . . . . . . . . . . . . . . . 802Intangible assets . . . . . . . . . . . . . . . . . . . . . . . . . . . . . . . . . . . . . . . . . 530Other non-current assets . . . . . . . . . . . . . . . . . . . . . . . . . . . . . . . . . . . 73
Total assets acquired . . . . . . . . . . . . . . . . . . . . . . . . . . . . . . . . . . . . 1,579
Current liabilities . . . . . . . . . . . . . . . . . . . . . . . . . . . . . . . . . . . . . . . . 46Deferred income taxes . . . . . . . . . . . . . . . . . . . . . . . . . . . . . . . . . . . . . 100Other non-current liabilities . . . . . . . . . . . . . . . . . . . . . . . . . . . . . . . . . 20
Total liabilities assumed . . . . . . . . . . . . . . . . . . . . . . . . . . . . . . . . . . 166
Net assets acquired . . . . . . . . . . . . . . . . . . . . . . . . . . . . . . . . . . . . . 1,413Cash and cash equivalents acquired . . . . . . . . . . . . . . . . . . . . . . . . . . . (77)
Net cash paid . . . . . . . . . . . . . . . . . . . . . . . . . . . . . . . . . . . . . . . . . . . $1,336
The fair values assigned to intangible assets were determined using the income approach,specifically the relief from royalty and the multi-period excess earnings methods. Both valuationmethods rely on management judgment, including expected future cash flows resulting from existingcustomer relationships, customer attrition rates, contributory effects of other assets utilized in thebusiness, peer group cost of capital and royalty rates, and other factors. Useful lives for intangibleassets were determined based upon the remaining useful economic lives of the intangible assets that areexpected to contribute directly or indirectly to future cash flows.
58
59
TE CONNECTIVITY LTD.
NOTES TO CONSOLIDATED FINANCIAL STATEMENTS (Continued)
5. Acquisitions (Continued)
Acquired intangible assets consisted of the following:
Weighted-AverageAmortization
Amount Period
(in millions) (in years)
Customer relationships . . . . . . . . . . . . . . . . . . . . . . . . $300 18Developed technology . . . . . . . . . . . . . . . . . . . . . . . . . 170 11Trade names and trademarks . . . . . . . . . . . . . . . . . . . . 45 25Customer order backlog . . . . . . . . . . . . . . . . . . . . . . . 15 3
Total . . . . . . . . . . . . . . . . . . . . . . . . . . . . . . . . . . . . $530 16
The acquired intangible assets are being amortized on a straight-line basis over their expecteduseful lives.
Goodwill of $802 million was recognized in these transactions, representing the excess of thepurchase price over the fair value of the tangible and intangible assets acquired and liabilities assumed.This goodwill is attributable primarily to cost savings and other synergies related to operationalefficiencies including the consolidation of manufacturing, marketing, and general and administrativefunctions. The goodwill has been allocated to the Industrial Solutions and Transportation Solutionssegments and is not deductible for tax purposes. However, prior to being acquired by us, one of thefiscal 2016 acquisitions completed certain acquisitions that resulted in goodwill with an estimated valueof $15 million that is deductible primarily for U.S. tax purposes, which we will deduct through 2025.
Fiscal 2016 acquisitions contributed net sales of $167 million and operating income of $8 million toour Consolidated Statement of Operations during fiscal 2016. The operating income included$10 million of acquisition costs, $7 million associated with the amortization of acquisition-related fairvalue adjustments related to acquired inventories and customer order backlog, and $2 million ofintegration costs.
Fiscal 2015 Acquisitions
In October 2014, we acquired 100% of the outstanding shares of Measurement Specialties, Inc.(‘‘Measurement Specialties’’), a leading global designer and manufacturer of sensors and sensor-basedsystems, for $86.00 in cash per share. The total value paid was approximately $1.7 billion, net of cashacquired, and included $225 million for the repayment of Measurement Specialties’ debt and accruedinterest. Measurement Specialties offers a broad portfolio of technologies including pressure, vibration,force, temperature, humidity, ultrasonic, position, and fluid sensors, for a wide range of applicationsand industries. This business has been reported as part of our Transportation Solutions segment fromthe date of acquisition.
59
60
TE CONNECTIVITY LTD.
NOTES TO CONSOLIDATED FINANCIAL STATEMENTS (Continued)
5. Acquisitions (Continued)
The following table summarizes the allocation of the purchase price to the fair value of identifiableassets acquired and liabilities assumed at the date of acquisition, in accordance with the acquisitionmethod of accounting:
(in millions)
Cash and cash equivalents . . . . . . . . . . . . . . . . . . . . . . . . . . . . . . . . . . $ 37Accounts receivable . . . . . . . . . . . . . . . . . . . . . . . . . . . . . . . . . . . . . . . 84Inventories . . . . . . . . . . . . . . . . . . . . . . . . . . . . . . . . . . . . . . . . . . . . . 110Other current assets . . . . . . . . . . . . . . . . . . . . . . . . . . . . . . . . . . . . . . 20Property, plant, and equipment . . . . . . . . . . . . . . . . . . . . . . . . . . . . . . 95Goodwill . . . . . . . . . . . . . . . . . . . . . . . . . . . . . . . . . . . . . . . . . . . . . . . 1,064Intangible assets . . . . . . . . . . . . . . . . . . . . . . . . . . . . . . . . . . . . . . . . . 547Other non-current assets . . . . . . . . . . . . . . . . . . . . . . . . . . . . . . . . . . . 9
Total assets acquired . . . . . . . . . . . . . . . . . . . . . . . . . . . . . . . . . . . . 1,966
Short-term debt . . . . . . . . . . . . . . . . . . . . . . . . . . . . . . . . . . . . . . . . . . 20Accounts payable . . . . . . . . . . . . . . . . . . . . . . . . . . . . . . . . . . . . . . . . 48Other current liabilities . . . . . . . . . . . . . . . . . . . . . . . . . . . . . . . . . . . . 67Long-term debt . . . . . . . . . . . . . . . . . . . . . . . . . . . . . . . . . . . . . . . . . . 203Deferred income taxes . . . . . . . . . . . . . . . . . . . . . . . . . . . . . . . . . . . . . 98Other non-current liabilities . . . . . . . . . . . . . . . . . . . . . . . . . . . . . . . . . 9
Total liabilities assumed . . . . . . . . . . . . . . . . . . . . . . . . . . . . . . . . . . 445
Net assets acquired . . . . . . . . . . . . . . . . . . . . . . . . . . . . . . . . . . . . . 1,521Cash and cash equivalents acquired . . . . . . . . . . . . . . . . . . . . . . . . . . . (37)
Net cash paid . . . . . . . . . . . . . . . . . . . . . . . . . . . . . . . . . . . . . . . . . . . $1,484
The fair values assigned to intangible assets were determined using the income approach,specifically the relief from royalty and the multi-period excess earnings methods. The valuation oftangible assets was derived using a combination of the income, market, and cost approaches. Usefullives for intangible assets were determined based upon the remaining useful economic lives of theintangible assets that are expected to contribute directly or indirectly to future cash flows.
Acquired intangible assets consisted of the following:
Weighted-AverageAmortization
Amount Period
(in millions) (in years)
Customer relationships . . . . . . . . . . . . . . . . . . . . . . . . $370 18Developed technology . . . . . . . . . . . . . . . . . . . . . . . . . 161 9Trade names and trademarks . . . . . . . . . . . . . . . . . . . . 4 1Customer order backlog . . . . . . . . . . . . . . . . . . . . . . . 12 < 1
Total . . . . . . . . . . . . . . . . . . . . . . . . . . . . . . . . . . . . $547 15
60
61
TE CONNECTIVITY LTD.
NOTES TO CONSOLIDATED FINANCIAL STATEMENTS (Continued)
5. Acquisitions (Continued)
The acquired intangible assets are being amortized on a straight-line basis over their expecteduseful lives.
Goodwill of $1,064 million was recognized in the transaction, representing the excess of thepurchase price over the fair value of the tangible and intangible assets acquired and liabilities assumed.This goodwill is attributable primarily to cost savings and other synergies related to operationalefficiencies including the consolidation of manufacturing, marketing, and general and administrativefunctions. The goodwill has been allocated to the Transportation Solutions segment and is notdeductible for tax purposes. However, prior to its merger with us, Measurement Specialties completedcertain acquisitions that resulted in goodwill with an estimated value of $23 million that is deductibleprimarily for U.S. tax purposes, which we will deduct through 2030.
During fiscal 2015, Measurement Specialties contributed net sales of $548 million to ourConsolidated Statement of Operations. Due to the commingled nature of our operations, it is notpracticable to separately identify operating income of Measurement Specialties on a stand-alone basis.
During fiscal 2015, we acquired three additional businesses for $241 million in cash, net of cashacquired.
Pro Forma Financial Information
The following unaudited pro forma financial information reflects our consolidated results ofoperations had the fiscal 2016 acquisitions occurred at the beginning of fiscal 2015 and theMeasurement Specialties acquisition occurred at the beginning of fiscal 2014:
Pro Forma for Fiscal
2016 2015
(in millions, exceptper share data)
Net sales . . . . . . . . . . . . . . . . . . . . . . . . . . . . . . . . . . . . . . . . . $12,471 $12,613Net income . . . . . . . . . . . . . . . . . . . . . . . . . . . . . . . . . . . . . . . 2,038 2,448Diluted earnings per share . . . . . . . . . . . . . . . . . . . . . . . . . . . . $ 5.52 $ 5.96
The pro forma adjustments, which were not significant, included interest expense based on proforma changes in our combined capital structure, charges related to acquired customer order backlog,charges related to the amortization of the fair value of acquired intangible assets, charges related to thefair value adjustment to acquisition-date inventories, and acquisition and other costs, and the relatedtax effects.
Pro forma results do not include any anticipated synergies or other anticipated benefits of theseacquisitions. Accordingly, the unaudited pro forma financial information is not necessarily indicative ofeither future results of operations or results that might have been achieved had these acquisitionsoccurred at the beginning of the preceding fiscal years.
61
62
TE CONNECTIVITY LTD.
NOTES TO CONSOLIDATED FINANCIAL STATEMENTS (Continued)
6. Inventories
Inventories consisted of the following:
Fiscal Year End
2017 2016
(in millions)
Raw materials . . . . . . . . . . . . . . . . . . . . . . . . . . . . . . . . . . . . . . . $ 306 $ 241Work in progress . . . . . . . . . . . . . . . . . . . . . . . . . . . . . . . . . . . . . 580 504Finished goods . . . . . . . . . . . . . . . . . . . . . . . . . . . . . . . . . . . . . . 810 669Inventoried costs on long-term contracts . . . . . . . . . . . . . . . . . . . . 117 182
Inventories . . . . . . . . . . . . . . . . . . . . . . . . . . . . . . . . . . . . . . . . $1,813 $1,596
7. Property, Plant, and Equipment, Net
Net property, plant, and equipment consisted of the following:
Fiscal Year End
2017 2016
(in millions)
Land and improvements . . . . . . . . . . . . . . . . . . . . . . . . . . . . . . $ 178 $ 159Buildings and improvements . . . . . . . . . . . . . . . . . . . . . . . . . . . 1,399 1,272Machinery and equipment . . . . . . . . . . . . . . . . . . . . . . . . . . . . . 7,306 6,890Construction in process . . . . . . . . . . . . . . . . . . . . . . . . . . . . . . . 697 567Gross property, plant, and equipment . . . . . . . . . . . . . . . . . . . . . 9,580 8,888Accumulated depreciation . . . . . . . . . . . . . . . . . . . . . . . . . . . . . (6,180) (5,836)
Property, plant, and equipment, net . . . . . . . . . . . . . . . . . . . . $ 3,400 $ 3,052
Depreciation expense was $466 million, $436 million, and $463 million in fiscal 2017, 2016, and2015, respectively.
8. Goodwill
The changes in the carrying amount of goodwill by segment were as follows:
Transportation Industrial CommunicationsSolutions Solutions Solutions Total
(in millions)
Fiscal year end 2015(1) . . . . . . . . . . . . . . . . . . . . . . . $1,863 $2,253 $ 708 $4,824Acquisitions . . . . . . . . . . . . . . . . . . . . . . . . . . . . 60 776 — 836Divestiture of business . . . . . . . . . . . . . . . . . . . . . — — (117) (117)Currency translation . . . . . . . . . . . . . . . . . . . . . . (20) (24) (7) (51)
Fiscal year end 2016(1) . . . . . . . . . . . . . . . . . . . . . . . 1,903 3,005 584 5,492Acquisitions . . . . . . . . . . . . . . . . . . . . . . . . . . . . 82 14 — 96Currency translation . . . . . . . . . . . . . . . . . . . . . . 26 28 9 63
Fiscal year end 2017(1) . . . . . . . . . . . . . . . . . . . . . . . $2,011 $3,047 $ 593 $5,651
(1) At fiscal year end 2017, 2016, and 2015, accumulated impairment losses for the Transportation Solutions andIndustrial Solutions segments were $2,191 million and $669 million, respectively. Accumulated impairment
62
63
TE CONNECTIVITY LTD.
NOTES TO CONSOLIDATED FINANCIAL STATEMENTS (Continued)
8. Goodwill (Continued)
losses for the Communications Solutions segment were $1,514 million at fiscal year end 2017 and 2016 and$1,626 million at fiscal year end 2015.
During fiscal 2017, we acquired two businesses and recognized goodwill of $130 million, whichbenefitted the Transportation Solutions and Industrial Solutions segments. During fiscal 2016, weacquired four businesses and recognized goodwill of $836 million, which benefited the IndustrialSolutions and Transportation Solutions segments. In fiscal 2017, we finalized the purchase priceallocation of our fiscal 2016 acquisitions, and the associated goodwill was reduced to $802 million. Thisreduction, which was primarily within the Industrial Solutions segment, is reflected in fiscal 2017acquisitions in the above table. See Note 5 for additional information regarding acquisitions.
During fiscal 2016, net goodwill of $117 million was written-off in connection with the sale of ourCPD business. See Note 3 for additional information regarding the divestiture of CPD.
We completed our annual goodwill impairment test in the fourth quarter of fiscal 2017 anddetermined that no impairment existed.
9. Intangible Assets, Net
Intangible assets consisted of the following:
Fiscal Year End
2017 2016
Gross Net Gross NetCarrying Accumulated Carrying Carrying Accumulated CarryingAmount Amortization Amount Amount Amortization Amount
(in millions)
Customer relationships . . . . . . . . . . . $1,433 $(300) $1,133 $1,332 $(212) $1,120Intellectual property . . . . . . . . . . . . . 1,263 (575) 688 1,300 (563) 737Other . . . . . . . . . . . . . . . . . . . . . . . . 36 (16) 20 36 (14) 22
Total . . . . . . . . . . . . . . . . . . . . . . . $2,732 $(891) $1,841 $2,668 $(789) $1,879
Intangible asset amortization expense was $169 million, $149 million, and $153 million for fiscal2017, 2016, and 2015, respectively. The aggregate amortization expense on intangible assets is expectedto be as follows:
(in millions)
Fiscal 2018 . . . . . . . . . . . . . . . . . . . . . . . . . . . . . . . . . . . . . . . . . . . . . $ 184Fiscal 2019 . . . . . . . . . . . . . . . . . . . . . . . . . . . . . . . . . . . . . . . . . . . . . 181Fiscal 2020 . . . . . . . . . . . . . . . . . . . . . . . . . . . . . . . . . . . . . . . . . . . . . 174Fiscal 2021 . . . . . . . . . . . . . . . . . . . . . . . . . . . . . . . . . . . . . . . . . . . . . 171Fiscal 2022 . . . . . . . . . . . . . . . . . . . . . . . . . . . . . . . . . . . . . . . . . . . . . 170Thereafter . . . . . . . . . . . . . . . . . . . . . . . . . . . . . . . . . . . . . . . . . . . . . 961
Total . . . . . . . . . . . . . . . . . . . . . . . . . . . . . . . . . . . . . . . . . . . . . . . . $1,841
63
64
TE CONNECTIVITY LTD.
NOTES TO CONSOLIDATED FINANCIAL STATEMENTS (Continued)
10. Accrued and Other Current Liabilities
Accrued and other current liabilities consisted of the following:
Fiscal Year End
2017 2016
(in millions)
Accrued payroll and employee benefits . . . . . . . . . . . . . . . . . . . . . $ 596 $ 431Dividends payable to shareholders . . . . . . . . . . . . . . . . . . . . . . . . 281 263Income taxes payable . . . . . . . . . . . . . . . . . . . . . . . . . . . . . . . . . . 121 149Restructuring reserves . . . . . . . . . . . . . . . . . . . . . . . . . . . . . . . . . 130 64Interest payable . . . . . . . . . . . . . . . . . . . . . . . . . . . . . . . . . . . . . . 58 56Other . . . . . . . . . . . . . . . . . . . . . . . . . . . . . . . . . . . . . . . . . . . . . 440 474
Accrued and other current liabilities . . . . . . . . . . . . . . . . . . . . . $1,626 $1,437
11. Debt
Debt was as follows:
Fiscal Year End
2017 2016
(in millions)
Commercial paper, at a weighted-average interest rate of 0.69% atfiscal year end 2016 . . . . . . . . . . . . . . . . . . . . . . . . . . . . . . . . . $ — $ 330
6.55% senior notes due 2017 . . . . . . . . . . . . . . . . . . . . . . . . . . . . 708 7082.375% senior notes due 2018 . . . . . . . . . . . . . . . . . . . . . . . . . . . 325 3252.35% senior notes due 2019 . . . . . . . . . . . . . . . . . . . . . . . . . . . . 250 2504.875% senior notes due 2021 . . . . . . . . . . . . . . . . . . . . . . . . . . . 250 2503.50% senior notes due 2022 . . . . . . . . . . . . . . . . . . . . . . . . . . . . 500 5001.10% euro-denominated senior notes due 2023 . . . . . . . . . . . . . . 650 6183.45% senior notes due 2024 . . . . . . . . . . . . . . . . . . . . . . . . . . . . 350 2503.70% senior notes due 2026 . . . . . . . . . . . . . . . . . . . . . . . . . . . . 350 3503.125% senior notes due 2027 . . . . . . . . . . . . . . . . . . . . . . . . . . . 400 —7.125% senior notes due 2037 . . . . . . . . . . . . . . . . . . . . . . . . . . . 477 477Other . . . . . . . . . . . . . . . . . . . . . . . . . . . . . . . . . . . . . . . . . . . . . 96 3
Total principal debt . . . . . . . . . . . . . . . . . . . . . . . . . . . . . . . . . 4,356 4,061Unamortized discounts and debt issuance costs . . . . . . . . . . . . . . . (26) (26)Effects of fair value hedge-designated interest rate swaps . . . . . . . . 14 35
Total debt . . . . . . . . . . . . . . . . . . . . . . . . . . . . . . . . . . . . . . . . $4,344 $4,070
During August 2017, Tyco Electronics Group S.A. (‘‘TEGSA’’), our 100%-owned subsidiary, issued$400 million aggregate principal amount of 3.125% senior notes due August 2027 and $100 millionaggregate principal amount of 3.45% senior notes due August 2024. The 3.45% senior notes wereissued under an existing indenture under which TEGSA had previously issued $250 million aggregateprincipal amount. The notes are TEGSA’s unsecured senior obligations and rank equally in right ofpayment with all existing and any future senior indebtedness of TEGSA and senior to any subordinatedindebtedness that TEGSA may incur.
64
65
TE CONNECTIVITY LTD.
NOTES TO CONSOLIDATED FINANCIAL STATEMENTS (Continued)
11. Debt (Continued)
TEGSA has a five-year unsecured senior revolving credit facility (‘‘Credit Facility’’) with a maturitydate of December 2020 and total commitments of $1,500 million. TEGSA had no borrowings under theCredit Facility at fiscal year end 2017 or 2016.
Borrowings under the Credit Facility bear interest at a rate per annum equal to, at the option ofTEGSA, (1) LIBOR plus an applicable margin based upon the senior, unsecured, long-term debt ratingof TEGSA, or (2) an alternate base rate equal to the highest of (i) Bank of America, N.A.’s base rate,(ii) the federal funds effective rate plus 1⁄2 of 1%, and (iii) one-month LIBOR plus 1%, plus, in eachcase, an applicable margin based upon the senior, unsecured, long-term debt rating of TEGSA. TEGSAis required to pay an annual facility fee ranging from 5.0 to 12.5 basis points based upon the amount ofthe lenders’ commitments under the Credit Facility and the applicable credit ratings of TEGSA.
The Credit Facility contains a financial ratio covenant providing that if, as of the last day of eachfiscal quarter, our ratio of Consolidated Total Debt to Consolidated EBITDA (as defined in the CreditFacility) for the then most recently concluded period of four consecutive fiscal quarters exceeds 3.75 to1.0, an Event of Default (as defined in the Credit Facility) is triggered. The Credit Facility and ourother debt agreements contain other customary covenants.
Periodically, TEGSA issues commercial paper to U.S. institutional accredited investors andqualified institutional buyers in accordance with available exemptions from the registrationrequirements of the Securities Act of 1933 as part of our ongoing effort to maintain financial flexibilityand to potentially decrease the cost of borrowings. Borrowings under the commercial paper programare backed by the Credit Facility.
TEGSA’s payment obligations under its senior notes, commercial paper, and Credit Facility arefully and unconditionally guaranteed by its parent, TE Connectivity Ltd.
Principal payments required for debt are as follows:
(in millions)
Fiscal 2018 . . . . . . . . . . . . . . . . . . . . . . . . . . . . . . . . . . . . . . . . . . . . . $ 710Fiscal 2019 . . . . . . . . . . . . . . . . . . . . . . . . . . . . . . . . . . . . . . . . . . . . . 580Fiscal 2020 . . . . . . . . . . . . . . . . . . . . . . . . . . . . . . . . . . . . . . . . . . . . . —Fiscal 2021 . . . . . . . . . . . . . . . . . . . . . . . . . . . . . . . . . . . . . . . . . . . . . 250Fiscal 2022 . . . . . . . . . . . . . . . . . . . . . . . . . . . . . . . . . . . . . . . . . . . . . 500Thereafter . . . . . . . . . . . . . . . . . . . . . . . . . . . . . . . . . . . . . . . . . . . . . 2,316
Total . . . . . . . . . . . . . . . . . . . . . . . . . . . . . . . . . . . . . . . . . . . . . . . . $4,356
The fair value of our debt, based on indicative valuations, was approximately $4,622 million and$4,424 million at fiscal year end 2017 and 2016, respectively.
65
66
TE CONNECTIVITY LTD.
NOTES TO CONSOLIDATED FINANCIAL STATEMENTS (Continued)
12. Commitments and Contingencies
Legal Proceedings
In the normal course of business, we are subject to various legal proceedings and claims, includingpatent infringement claims, product liability matters, employment disputes, disputes on agreements,other commercial disputes, environmental matters, antitrust claims, and tax matters, includingnon-income tax matters such as value added tax, sales and use tax, real estate tax, and transfer tax.Although it is not feasible to predict the outcome of these proceedings, based upon our experience,current information, and applicable law, we do not expect that the outcome of these proceedings, eitherindividually or in the aggregate, will have a material effect on our results of operations, financialposition, or cash flows.
Environmental Matters
We are involved in various stages of investigation and cleanup related to environmentalremediation matters at a number of sites. The ultimate cost of site cleanup is difficult to predict giventhe uncertainties regarding the extent of the required cleanup, the interpretation of applicable laws andregulations, and alternative cleanup methods. As of fiscal year end 2017, we concluded that it wasprobable that we would incur investigation and remediation costs at these sites in the range of$15 million to $43 million, and that the best estimate within this range was $19 million. We believe thatany potential payment of such estimated amounts will not have a material adverse effect on our resultsof operations, financial position, or cash flows.
Leases
We have facility, land, vehicle, and equipment leases that expire at various dates. Rental expenseunder these operating leases was $153 million, $143 million, and $141 million for fiscal 2017, 2016, and2015, respectively. At fiscal year end 2017, future minimum lease payments under non-cancelableoperating lease obligations were as follows:
(in millions)
Fiscal 2018 . . . . . . . . . . . . . . . . . . . . . . . . . . . . . . . . . . . . . . . . . . . . . $110Fiscal 2019 . . . . . . . . . . . . . . . . . . . . . . . . . . . . . . . . . . . . . . . . . . . . . 85Fiscal 2020 . . . . . . . . . . . . . . . . . . . . . . . . . . . . . . . . . . . . . . . . . . . . . 62Fiscal 2021 . . . . . . . . . . . . . . . . . . . . . . . . . . . . . . . . . . . . . . . . . . . . . 51Fiscal 2022 . . . . . . . . . . . . . . . . . . . . . . . . . . . . . . . . . . . . . . . . . . . . . 42Thereafter . . . . . . . . . . . . . . . . . . . . . . . . . . . . . . . . . . . . . . . . . . . . . 104
Total . . . . . . . . . . . . . . . . . . . . . . . . . . . . . . . . . . . . . . . . . . . . . . . . $454
Guarantees
In disposing of assets or businesses, we often provide representations, warranties, and/orindemnities to cover various risks including unknown damage to assets, environmental risks involved inthe sale of real estate, liability for investigation and remediation of environmental contamination atwaste disposal sites and manufacturing facilities, and unidentified tax liabilities and legal fees related toperiods prior to disposition. We do not expect that these uncertainties will have a material adverseeffect on our results of operations, financial position, or cash flows.
66
67
TE CONNECTIVITY LTD.
NOTES TO CONSOLIDATED FINANCIAL STATEMENTS (Continued)
12. Commitments and Contingencies (Continued)
At fiscal year end 2017, we had outstanding letters of credit, letters of guarantee, and surety bondsof $298 million.
We generally record estimated product warranty costs when contract revenues are recognizedunder the percentage-of-completion method for construction related contracts; other warranty reservesare not significant. The estimation is based primarily on historical experience and actual warrantyclaims. Amounts accrued for warranty claims were $50 million and $48 million at fiscal year end 2017and 2016, respectively.
Tax Sharing Agreement
In fiscal 2007, we became an independent, publicly traded company owning the former electronicsbusinesses of Tyco International plc (‘‘Tyco International’’). On June 29, 2007, Tyco Internationaldistributed all of our shares, as well as its shares of its former healthcare businesses (‘‘Covidien’’), to itscommon shareholders (the ‘‘separation’’). As a result of subsequent transactions, Tyco International andCovidien now operate as part of Johnson Controls International plc and Medtronic plc, respectively.
Upon separation, we entered into a Tax Sharing Agreement, under which we share responsibilityfor certain of our, Tyco International’s, and Covidien’s income tax liabilities based on a sharing formulafor periods prior to and including June 29, 2007. We, Tyco International, and Covidien share 31%,27%, and 42%, respectively, of income tax liabilities that arise from adjustments made by taxauthorities to our, Tyco International’s, and Covidien’s income tax returns. Pursuant to the Tax SharingAgreement, we entered into certain guarantee commitments and indemnifications with TycoInternational and Covidien. We have substantially settled all U.S. federal income tax matters with theInternal Revenue Service (‘‘IRS’’) for periods covered under the Tax Sharing Agreement. Certainshared U.S. state and non-U.S. income tax matters remain open. We do not expect these matters willhave a material effect on our results of operations, financial position, or cash flows.
13. Financial Instruments and Fair Value Measurements
We use derivative and non-derivative financial instruments to manage certain exposures to foreigncurrency, interest rate, investment, and commodity risks.
The effects of derivative instruments on the Consolidated Statements of Operations wereimmaterial for fiscal 2017, 2016, and 2015.
Foreign Exchange Risks and Hedges of Net Investment
As part of managing the exposure to changes in foreign currency exchange rates, we utilize cross-currency swap contracts, foreign currency forward contracts, and foreign currency swap contracts, aportion of which are designated as cash flow hedges. The objective of these contracts is to minimizeimpacts to cash flows and profitability due to changes in foreign currency exchange rates onintercompany and other cash transactions. We expect that significantly all of the balance inaccumulated other comprehensive income (loss) associated with the cash flow hedge-designatedinstruments addressing foreign exchange risks will be reclassified into the Consolidated Statement ofOperations within the next twelve months.
During fiscal 2015, we entered into cross-currency swap contracts with an aggregate notional valueof A1,000 million to reduce our exposure to foreign currency exchange risk associated with certain
67
68
TE CONNECTIVITY LTD.
NOTES TO CONSOLIDATED FINANCIAL STATEMENTS (Continued)
13. Financial Instruments and Fair Value Measurements (Continued)
intercompany loans. Under the terms of these contracts, which have been designated as cash flowhedges, we make quarterly interest payments in euros at 3.50% per annum and receive interest in U.S.dollars at a weighted-average rate of 5.33% per annum. Upon the maturities of these contracts in fiscal2022, we will pay the principal amount of the loans in euros and receive U.S. dollars from ourcounterparties.
We hedge our net investment in certain foreign operations using intercompany non-derivativefinancial instruments denominated in the same currencies. The aggregate notional value of thesehedges was $3,110 million and $3,480 million at fiscal year end 2017 and 2016, respectively. Theimpacts of our hedging program were as follows:
Fiscal
2017 2016 2015
(in millions)
Foreign exchange gains (losses) . . . . . . . . . . . . . . . . . . . . . . . . $(74) $(45) $353
These foreign exchange gains and losses were recorded as currency translation, a component ofaccumulated other comprehensive income (loss), offsetting foreign exchange losses and gainsattributable to the translation of the net investment. See Note 19 for additional information.
Interest Rate and Investment Risk Management
We issue debt, as needed, to fund our operations and capital requirements. Such borrowings canresult in interest rate exposure. To manage the interest rate exposure, we use interest rate swaps toconvert a portion of fixed-rate debt into variable-rate debt. We use forward starting interest rate swapsand options to enter into interest rate swaps to manage interest rate exposure in periods prior to theanticipated issuance of fixed-rate debt. We also utilize investment swaps to manage earnings exposureon certain nonqualified deferred compensation liabilities.
Commodity Hedges
As part of managing the exposure to certain commodity price fluctuations, we utilize commodityswap contracts designated as cash flow hedges. The objective of these contracts is to minimize impactsto cash flows and profitability due to changes in prices of commodities used in production.
At fiscal year end 2017 and 2016, our commodity hedges had notional values of $314 million and$232 million, respectively. We expect that significantly all of the balance in accumulated othercomprehensive income (loss) associated with the commodity hedges will be reclassified into theConsolidated Statement of Operations within the next twelve months.
Fair Value Measurements
Financial instruments recorded at fair value on a recurring basis, which consist of derivativeinstruments and marketable securities, were immaterial at fiscal year end 2017 and 2016.
68
69
TE CONNECTIVITY LTD.
NOTES TO CONSOLIDATED FINANCIAL STATEMENTS (Continued)
14. Retirement Plans
Defined Benefit Pension Plans
We have a number of contributory and noncontributory defined benefit retirement plans coveringcertain of our U.S. and non-U.S. employees, designed in accordance with local customs and practice.
The net periodic pension benefit cost for all U.S. and non-U.S. defined benefit pension plans wasas follows:
U.S. Plans Non-U.S. Plans
Fiscal Fiscal
2017 2016 2015 2017 2016 2015
($ in millions)
Service cost . . . . . . . . . . . . . . . . . . . . . . . . . . . . . . . . . . . . . . $ 12 $ 9 $ 9 $ 50 $ 48 $ 45Interest cost . . . . . . . . . . . . . . . . . . . . . . . . . . . . . . . . . . . . . 43 50 48 35 52 58Expected return on plan assets . . . . . . . . . . . . . . . . . . . . . . . . (53) (59) (67) (68) (68) (72)Amortization of net actuarial loss . . . . . . . . . . . . . . . . . . . . . . 40 40 25 41 36 33Other . . . . . . . . . . . . . . . . . . . . . . . . . . . . . . . . . . . . . . . . . . — — — (4) (6) (5)
Net periodic pension benefit cost . . . . . . . . . . . . . . . . . . . . $ 42 $ 40 $ 15 $ 54 $ 62 $ 59
Weighted-average assumptions used to determine net pensionbenefit cost during the fiscal year:
Discount rate . . . . . . . . . . . . . . . . . . . . . . . . . . . . . . . . . . . . 3.58% 4.38% 4.34% 1.44% 2.50% 2.77%Expected return on plan assets . . . . . . . . . . . . . . . . . . . . . . . . 5.93% 6.97% 7.20% 5.21% 5.98% 6.46%Rate of compensation increase . . . . . . . . . . . . . . . . . . . . . . . . —% —% —% 2.52% 2.81% 2.86%
69
70
TE CONNECTIVITY LTD.
NOTES TO CONSOLIDATED FINANCIAL STATEMENTS (Continued)
14. Retirement Plans (Continued)
The following table represents the changes in benefit obligation and plan assets and the netamount recognized on the Consolidated Balance Sheets for all U.S. and non-U.S. defined benefitpension plans:
U.S. Plans Non-U.S. Plans
Fiscal Fiscal
2017 2016 2017 2016
($ in millions)
Change in benefit obligation:Benefit obligation at beginning of fiscal year . . . . . . . . . . . . . . . . $1,250 $1,170 $2,535 $ 2,188
Service cost . . . . . . . . . . . . . . . . . . . . . . . . . . . . . . . . . . . . . . . 12 9 50 48Interest cost . . . . . . . . . . . . . . . . . . . . . . . . . . . . . . . . . . . . . . 43 50 35 52Actuarial loss . . . . . . . . . . . . . . . . . . . . . . . . . . . . . . . . . . . . . (34) 102 (301) 368Benefits and administrative expenses paid . . . . . . . . . . . . . . . . . (82) (81) (69) (85)Currency translation . . . . . . . . . . . . . . . . . . . . . . . . . . . . . . . . — — 29 (63)Other . . . . . . . . . . . . . . . . . . . . . . . . . . . . . . . . . . . . . . . . . . . 2 — 13 27
Benefit obligation at end of fiscal year . . . . . . . . . . . . . . . . . . . . . 1,191 1,250 2,292 2,535
Change in plan assets:Fair value of plan assets at beginning of fiscal year . . . . . . . . . . . . 929 879 1,371 1,167
Actual return on plan assets . . . . . . . . . . . . . . . . . . . . . . . . . . . 115 130 49 261Employer contributions . . . . . . . . . . . . . . . . . . . . . . . . . . . . . . 1 1 47 66Benefits and administrative expenses paid . . . . . . . . . . . . . . . . . (82) (81) (69) (85)Currency translation . . . . . . . . . . . . . . . . . . . . . . . . . . . . . . . . — — (2) (59)Other . . . . . . . . . . . . . . . . . . . . . . . . . . . . . . . . . . . . . . . . . . . — — 6 21
Fair value of plan assets at end of fiscal year . . . . . . . . . . . . . . . . 963 929 1,402 1,371
Funded status . . . . . . . . . . . . . . . . . . . . . . . . . . . . . . . . . . . . . $ (228) $ (321) $ (890) $(1,164)
Amounts recognized on the Consolidated Balance Sheets:Other assets . . . . . . . . . . . . . . . . . . . . . . . . . . . . . . . . . . . . . . . . $ — $ — $ 50 $ —Accrued and other current liabilities . . . . . . . . . . . . . . . . . . . . . . (5) (5) (22) (20)Long-term pension and postretirement liabilities . . . . . . . . . . . . . . (223) (316) (918) (1,144)
Net amount recognized . . . . . . . . . . . . . . . . . . . . . . . . . . . . . . $ (228) $ (321) $ (890) $(1,164)
Weighted-average assumptions used to determine pension benefitobligation at fiscal year end:
Discount rate . . . . . . . . . . . . . . . . . . . . . . . . . . . . . . . . . . . . . . . 3.77% 3.58% 1.87% 1.44%Rate of compensation increase . . . . . . . . . . . . . . . . . . . . . . . . . . —% —% 2.53% 2.52%
70
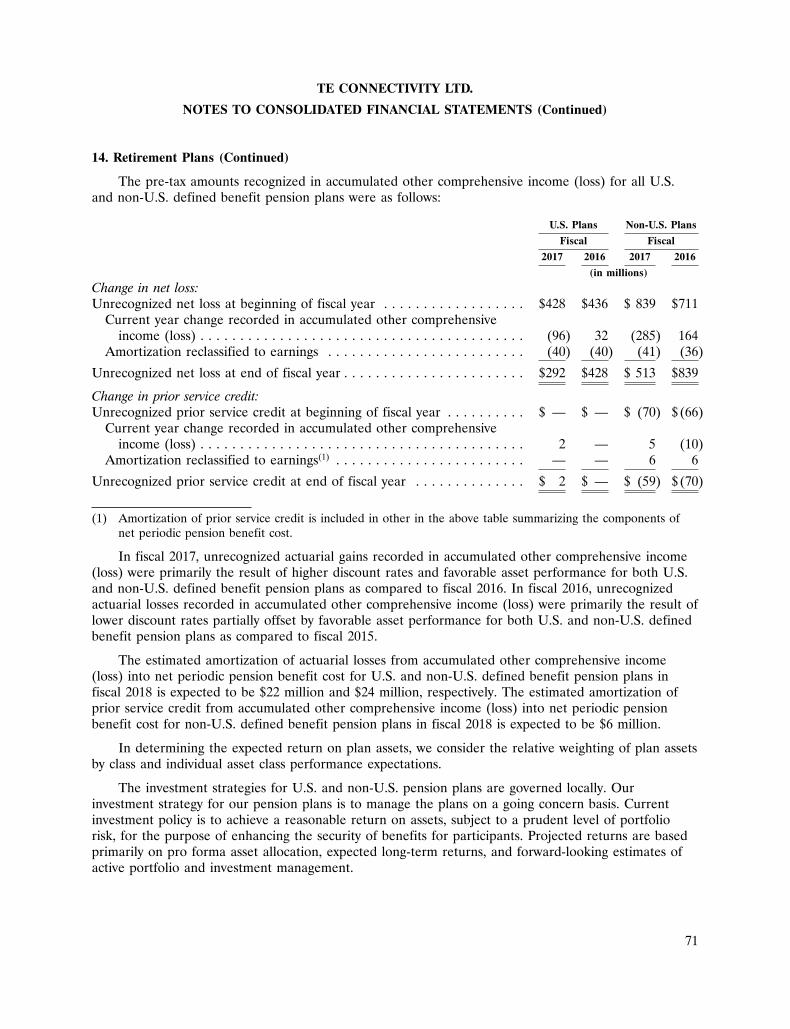
71
TE CONNECTIVITY LTD.
NOTES TO CONSOLIDATED FINANCIAL STATEMENTS (Continued)
14. Retirement Plans (Continued)
The pre-tax amounts recognized in accumulated other comprehensive income (loss) for all U.S.and non-U.S. defined benefit pension plans were as follows:
U.S. Plans Non-U.S. Plans
Fiscal Fiscal
2017 2016 2017 2016
(in millions)
Change in net loss:Unrecognized net loss at beginning of fiscal year . . . . . . . . . . . . . . . . . . $428 $436 $ 839 $711
Current year change recorded in accumulated other comprehensiveincome (loss) . . . . . . . . . . . . . . . . . . . . . . . . . . . . . . . . . . . . . . . . . (96) 32 (285) 164
Amortization reclassified to earnings . . . . . . . . . . . . . . . . . . . . . . . . . (40) (40) (41) (36)
Unrecognized net loss at end of fiscal year . . . . . . . . . . . . . . . . . . . . . . . $292 $428 $ 513 $839
Change in prior service credit:Unrecognized prior service credit at beginning of fiscal year . . . . . . . . . . $ — $ — $ (70) $(66)
Current year change recorded in accumulated other comprehensiveincome (loss) . . . . . . . . . . . . . . . . . . . . . . . . . . . . . . . . . . . . . . . . . 2 — 5 (10)
Amortization reclassified to earnings(1) . . . . . . . . . . . . . . . . . . . . . . . . — — 6 6
Unrecognized prior service credit at end of fiscal year . . . . . . . . . . . . . . $ 2 $ — $ (59) $(70)
(1) Amortization of prior service credit is included in other in the above table summarizing the components ofnet periodic pension benefit cost.
In fiscal 2017, unrecognized actuarial gains recorded in accumulated other comprehensive income(loss) were primarily the result of higher discount rates and favorable asset performance for both U.S.and non-U.S. defined benefit pension plans as compared to fiscal 2016. In fiscal 2016, unrecognizedactuarial losses recorded in accumulated other comprehensive income (loss) were primarily the result oflower discount rates partially offset by favorable asset performance for both U.S. and non-U.S. definedbenefit pension plans as compared to fiscal 2015.
The estimated amortization of actuarial losses from accumulated other comprehensive income(loss) into net periodic pension benefit cost for U.S. and non-U.S. defined benefit pension plans infiscal 2018 is expected to be $22 million and $24 million, respectively. The estimated amortization ofprior service credit from accumulated other comprehensive income (loss) into net periodic pensionbenefit cost for non-U.S. defined benefit pension plans in fiscal 2018 is expected to be $6 million.
In determining the expected return on plan assets, we consider the relative weighting of plan assetsby class and individual asset class performance expectations.
The investment strategies for U.S. and non-U.S. pension plans are governed locally. Ourinvestment strategy for our pension plans is to manage the plans on a going concern basis. Currentinvestment policy is to achieve a reasonable return on assets, subject to a prudent level of portfoliorisk, for the purpose of enhancing the security of benefits for participants. Projected returns are basedprimarily on pro forma asset allocation, expected long-term returns, and forward-looking estimates ofactive portfolio and investment management.
71
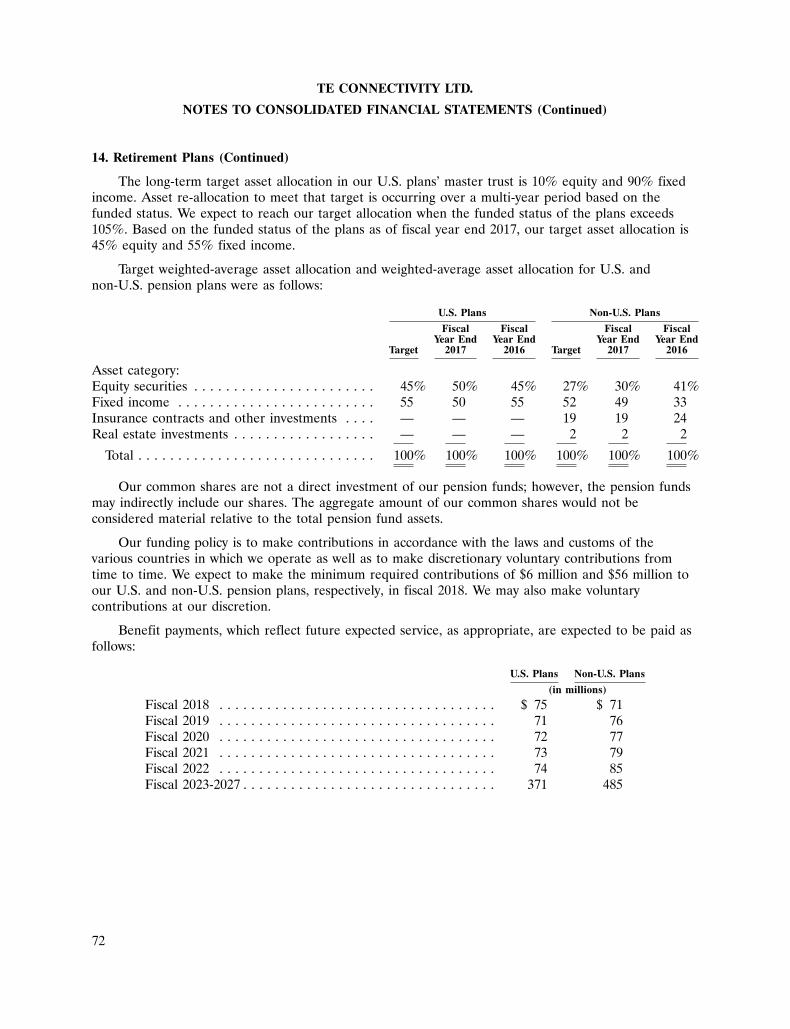
72
TE CONNECTIVITY LTD.
NOTES TO CONSOLIDATED FINANCIAL STATEMENTS (Continued)
14. Retirement Plans (Continued)
The long-term target asset allocation in our U.S. plans’ master trust is 10% equity and 90% fixedincome. Asset re-allocation to meet that target is occurring over a multi-year period based on thefunded status. We expect to reach our target allocation when the funded status of the plans exceeds105%. Based on the funded status of the plans as of fiscal year end 2017, our target asset allocation is45% equity and 55% fixed income.
Target weighted-average asset allocation and weighted-average asset allocation for U.S. andnon-U.S. pension plans were as follows:
U.S. Plans Non-U.S. Plans
Fiscal Fiscal Fiscal FiscalYear End Year End Year End Year End
Target 2017 2016 Target 2017 2016
Asset category:Equity securities . . . . . . . . . . . . . . . . . . . . . . . 45% 50% 45% 27% 30% 41%Fixed income . . . . . . . . . . . . . . . . . . . . . . . . . 55 50 55 52 49 33Insurance contracts and other investments . . . . — — — 19 19 24Real estate investments . . . . . . . . . . . . . . . . . . — — — 2 2 2
Total . . . . . . . . . . . . . . . . . . . . . . . . . . . . . . 100% 100% 100% 100% 100% 100%
Our common shares are not a direct investment of our pension funds; however, the pension fundsmay indirectly include our shares. The aggregate amount of our common shares would not beconsidered material relative to the total pension fund assets.
Our funding policy is to make contributions in accordance with the laws and customs of thevarious countries in which we operate as well as to make discretionary voluntary contributions fromtime to time. We expect to make the minimum required contributions of $6 million and $56 million toour U.S. and non-U.S. pension plans, respectively, in fiscal 2018. We may also make voluntarycontributions at our discretion.
Benefit payments, which reflect future expected service, as appropriate, are expected to be paid asfollows:
U.S. Plans Non-U.S. Plans
(in millions)
Fiscal 2018 . . . . . . . . . . . . . . . . . . . . . . . . . . . . . . . . . . . $ 75 $ 71Fiscal 2019 . . . . . . . . . . . . . . . . . . . . . . . . . . . . . . . . . . . 71 76Fiscal 2020 . . . . . . . . . . . . . . . . . . . . . . . . . . . . . . . . . . . 72 77Fiscal 2021 . . . . . . . . . . . . . . . . . . . . . . . . . . . . . . . . . . . 73 79Fiscal 2022 . . . . . . . . . . . . . . . . . . . . . . . . . . . . . . . . . . . 74 85Fiscal 2023-2027 . . . . . . . . . . . . . . . . . . . . . . . . . . . . . . . . 371 485
72
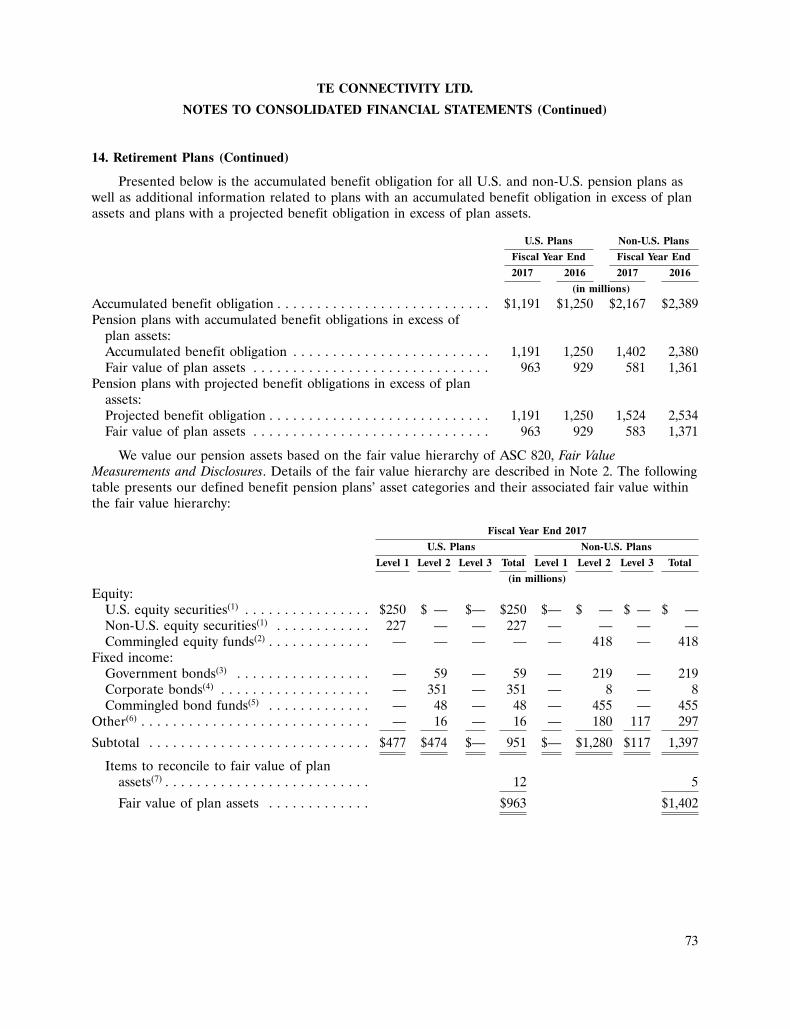
73
TE CONNECTIVITY LTD.
NOTES TO CONSOLIDATED FINANCIAL STATEMENTS (Continued)
14. Retirement Plans (Continued)
Presented below is the accumulated benefit obligation for all U.S. and non-U.S. pension plans aswell as additional information related to plans with an accumulated benefit obligation in excess of planassets and plans with a projected benefit obligation in excess of plan assets.
U.S. Plans Non-U.S. Plans
Fiscal Year End Fiscal Year End
2017 2016 2017 2016
(in millions)
Accumulated benefit obligation . . . . . . . . . . . . . . . . . . . . . . . . . . . $1,191 $1,250 $2,167 $2,389Pension plans with accumulated benefit obligations in excess of
plan assets:Accumulated benefit obligation . . . . . . . . . . . . . . . . . . . . . . . . . 1,191 1,250 1,402 2,380Fair value of plan assets . . . . . . . . . . . . . . . . . . . . . . . . . . . . . . 963 929 581 1,361
Pension plans with projected benefit obligations in excess of planassets:Projected benefit obligation . . . . . . . . . . . . . . . . . . . . . . . . . . . . 1,191 1,250 1,524 2,534Fair value of plan assets . . . . . . . . . . . . . . . . . . . . . . . . . . . . . . 963 929 583 1,371
We value our pension assets based on the fair value hierarchy of ASC 820, Fair ValueMeasurements and Disclosures. Details of the fair value hierarchy are described in Note 2. The followingtable presents our defined benefit pension plans’ asset categories and their associated fair value withinthe fair value hierarchy:
Fiscal Year End 2017
U.S. Plans Non-U.S. Plans
Level 1 Level 2 Level 3 Total Level 1 Level 2 Level 3 Total
(in millions)
Equity:U.S. equity securities(1) . . . . . . . . . . . . . . . . $250 $ — $— $250 $— $ — $ — $ —Non-U.S. equity securities(1) . . . . . . . . . . . . 227 — — 227 — — — —Commingled equity funds(2) . . . . . . . . . . . . . — — — — — 418 — 418
Fixed income:Government bonds(3) . . . . . . . . . . . . . . . . . — 59 — 59 — 219 — 219Corporate bonds(4) . . . . . . . . . . . . . . . . . . . — 351 — 351 — 8 — 8Commingled bond funds(5) . . . . . . . . . . . . . — 48 — 48 — 455 — 455
Other(6) . . . . . . . . . . . . . . . . . . . . . . . . . . . . . — 16 — 16 — 180 117 297
Subtotal . . . . . . . . . . . . . . . . . . . . . . . . . . . . $477 $474 $— 951 $— $1,280 $117 1,397
Items to reconcile to fair value of planassets(7) . . . . . . . . . . . . . . . . . . . . . . . . . . 12 5
Fair value of plan assets . . . . . . . . . . . . . $963 $1,402
73
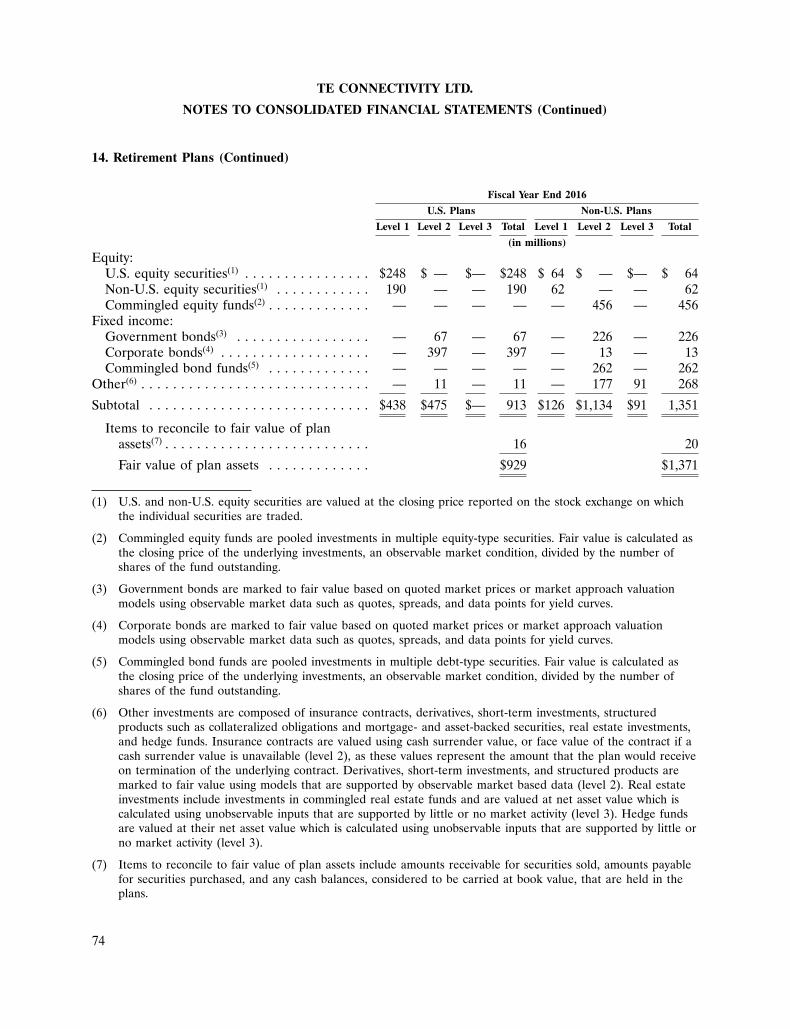
74
TE CONNECTIVITY LTD.
NOTES TO CONSOLIDATED FINANCIAL STATEMENTS (Continued)
14. Retirement Plans (Continued)
Fiscal Year End 2016
U.S. Plans Non-U.S. Plans
Level 1 Level 2 Level 3 Total Level 1 Level 2 Level 3 Total
(in millions)
Equity:U.S. equity securities(1) . . . . . . . . . . . . . . . . $248 $ — $— $248 $ 64 $ — $— $ 64Non-U.S. equity securities(1) . . . . . . . . . . . . 190 — — 190 62 — — 62Commingled equity funds(2) . . . . . . . . . . . . . — — — — — 456 — 456
Fixed income:Government bonds(3) . . . . . . . . . . . . . . . . . — 67 — 67 — 226 — 226Corporate bonds(4) . . . . . . . . . . . . . . . . . . . — 397 — 397 — 13 — 13Commingled bond funds(5) . . . . . . . . . . . . . — — — — — 262 — 262
Other(6) . . . . . . . . . . . . . . . . . . . . . . . . . . . . . — 11 — 11 — 177 91 268
Subtotal . . . . . . . . . . . . . . . . . . . . . . . . . . . . $438 $475 $— 913 $126 $1,134 $91 1,351
Items to reconcile to fair value of planassets(7) . . . . . . . . . . . . . . . . . . . . . . . . . . 16 20
Fair value of plan assets . . . . . . . . . . . . . $929 $1,371
(1) U.S. and non-U.S. equity securities are valued at the closing price reported on the stock exchange on whichthe individual securities are traded.
(2) Commingled equity funds are pooled investments in multiple equity-type securities. Fair value is calculated asthe closing price of the underlying investments, an observable market condition, divided by the number ofshares of the fund outstanding.
(3) Government bonds are marked to fair value based on quoted market prices or market approach valuationmodels using observable market data such as quotes, spreads, and data points for yield curves.
(4) Corporate bonds are marked to fair value based on quoted market prices or market approach valuationmodels using observable market data such as quotes, spreads, and data points for yield curves.
(5) Commingled bond funds are pooled investments in multiple debt-type securities. Fair value is calculated asthe closing price of the underlying investments, an observable market condition, divided by the number ofshares of the fund outstanding.
(6) Other investments are composed of insurance contracts, derivatives, short-term investments, structuredproducts such as collateralized obligations and mortgage- and asset-backed securities, real estate investments,and hedge funds. Insurance contracts are valued using cash surrender value, or face value of the contract if acash surrender value is unavailable (level 2), as these values represent the amount that the plan would receiveon termination of the underlying contract. Derivatives, short-term investments, and structured products aremarked to fair value using models that are supported by observable market based data (level 2). Real estateinvestments include investments in commingled real estate funds and are valued at net asset value which iscalculated using unobservable inputs that are supported by little or no market activity (level 3). Hedge fundsare valued at their net asset value which is calculated using unobservable inputs that are supported by little orno market activity (level 3).
(7) Items to reconcile to fair value of plan assets include amounts receivable for securities sold, amounts payablefor securities purchased, and any cash balances, considered to be carried at book value, that are held in theplans.
74
75
TE CONNECTIVITY LTD.
NOTES TO CONSOLIDATED FINANCIAL STATEMENTS (Continued)
14. Retirement Plans (Continued)
Changes in Level 3 assets in non-U.S. plans were primarily the result of purchases in fiscal 2017and 2016.
Defined Contribution Retirement Plans
We maintain several defined contribution retirement plans, the most significant of which is locatedin the U.S. These plans include 401(k) matching programs, as well as qualified and nonqualified profitsharing and share bonus retirement plans. Expense for the defined contribution plans is computed as apercentage of participants’ compensation and was $68 million, $59 million, and $60 million forfiscal 2017, 2016, and 2015, respectively.
Deferred Compensation Plans
We maintain nonqualified deferred compensation plans, which permit eligible employees to defer aportion of their compensation. A record keeping account is set up for each participant and theparticipant chooses from a variety of measurement funds for the deemed investment of their accounts.The measurement funds correspond to a number of funds in our 401(k) plans and the account balancefluctuates with the investment returns on those funds. Total deferred compensation liabilities were$157 million and $132 million at fiscal year end 2017 and 2016, respectively. See Note 13 for additionalinformation regarding our risk management strategy related to deferred compensation liabilities.
Postretirement Benefit Plans
In addition to providing pension and 401(k) benefits, we also provide certain health care coveragecontinuation for qualifying retirees from the date of retirement to age 65. The accumulatedpostretirement benefit obligation was $20 million and $45 million at fiscal year end 2017 and 2016,respectively, and the underfunded status of the postretirement benefit plans was included primarily inlong-term pension and postretirement liabilities on the Consolidated Balance Sheets. The decrease inthe accumulated postretirement benefit obligation during fiscal 2017 was primarily attributable to aplan curtailment that was recognized on the Consolidated Statement of Operations; activity duringfiscal 2016 and 2015 was not significant.
75
76
TE CONNECTIVITY LTD.
NOTES TO CONSOLIDATED FINANCIAL STATEMENTS (Continued)
15. Income Taxes
Income Tax Expense (Benefit)
Significant components of the income tax expense (benefit) were as follows:
Fiscal
2017 2016 2015
(in millions)
Current income tax expense (benefit):U.S.:
Federal . . . . . . . . . . . . . . . . . . . . . . . . . . . . . . . . . . . . $ (2) $(1,115) $(67)State . . . . . . . . . . . . . . . . . . . . . . . . . . . . . . . . . . . . . . 9 (163) 12
Non-U.S. . . . . . . . . . . . . . . . . . . . . . . . . . . . . . . . . . . . . 323 321 352
330 (957) 297
Deferred income tax expense (benefit):U.S.:
Federal . . . . . . . . . . . . . . . . . . . . . . . . . . . . . . . . . . . . (58) 173 87State . . . . . . . . . . . . . . . . . . . . . . . . . . . . . . . . . . . . . . (9) 20 5
Non-U.S. . . . . . . . . . . . . . . . . . . . . . . . . . . . . . . . . . . . . (8) (15) (52)
(75) 178 40
Income tax expense (benefit) . . . . . . . . . . . . . . . . . . . . . . . $255 $ (779) $337
The U.S. and non-U.S. components of income from continuing operations before income taxeswere as follows:
Fiscal
2017 2016 2015
(in millions)
U.S. . . . . . . . . . . . . . . . . . . . . . . . . . . . . . . . . . . . . . . . $ (75) $ (115) $ (31)Non-U.S. . . . . . . . . . . . . . . . . . . . . . . . . . . . . . . . . . . . . 2,003 1,277 1,606
Income from continuing operations before income taxes $1,928 $1,162 $1,575
76
77
TE CONNECTIVITY LTD.
NOTES TO CONSOLIDATED FINANCIAL STATEMENTS (Continued)
15. Income Taxes (Continued)
The reconciliation between U.S. federal income taxes at the statutory rate and income tax expense(benefit) was as follows:
Fiscal
2017 2016 2015
(in millions)
Notional U.S. federal income tax expense at the statutory rate . . . . . . . . . . . $ 675 $ 407 $ 551Adjustments to reconcile to the income tax expense (benefit):
U.S. state income tax expense (benefit), net . . . . . . . . . . . . . . . . . . . . . . . — (93) 11Other expense—Tax Sharing Agreement(1) . . . . . . . . . . . . . . . . . . . . . . . . 3 221 18Tax law changes . . . . . . . . . . . . . . . . . . . . . . . . . . . . . . . . . . . . . . . . . . . 7 (3) 10Tax credits . . . . . . . . . . . . . . . . . . . . . . . . . . . . . . . . . . . . . . . . . . . . . . . (9) (10) (9)Non-U.S. net earnings(2) . . . . . . . . . . . . . . . . . . . . . . . . . . . . . . . . . . . . . (355) (342) (275)Change in accrued income tax liabilities . . . . . . . . . . . . . . . . . . . . . . . . . . 24 (1,056) (183)Valuation allowance . . . . . . . . . . . . . . . . . . . . . . . . . . . . . . . . . . . . . . . . (1) 97 (3)Legal entity restructuring and intercompany transactions . . . . . . . . . . . . . . (40) 39 211Divestitures . . . . . . . . . . . . . . . . . . . . . . . . . . . . . . . . . . . . . . . . . . . . . . — (31) —Excess tax benefits from share-based payments . . . . . . . . . . . . . . . . . . . . . (40) — —Other . . . . . . . . . . . . . . . . . . . . . . . . . . . . . . . . . . . . . . . . . . . . . . . . . . . (9) (8) 6
Income tax expense (benefit) . . . . . . . . . . . . . . . . . . . . . . . . . . . . . . . . . . . $ 255 $ (779) $ 337
(1) Net other expense pursuant to the Tax Sharing Agreement with Tyco International and Covidien is not taxableor deductible.
(2) Excludes items which are separately presented.
The income tax expense for fiscal 2017 included a $52 million income tax benefit associated withthe tax impacts of certain intercompany transactions and the corresponding reduction in the valuationallowance for U.S. tax loss carryforwards, a $40 million income tax benefit related to share-basedpayments and the adoption of ASU No. 2016-09, and a $14 million income tax benefit associated withpre-separation tax matters. See Note 2 for additional information regarding recently adoptedaccounting pronouncements.
The income tax benefit for fiscal 2016 included a $1,135 million income tax benefit related to theeffective settlement of tax matters for the years 1997 through 2000 which resolved all aspects of thedisputed debt matter with the IRS through the year 2007, partially offset by a $91 million income taxcharge related to an increase to the valuation allowance for certain U.S. deferred tax assets.Additionally, the tax benefit for fiscal 2016 included an $83 million net income tax benefit related totax settlements in certain other tax jurisdictions, partially offset by an income tax charge related tocertain legal entity restructurings.
In fiscal 2016, the increase to the valuation allowance for deferred tax assets primarily related tocertain U.S. federal and state tax loss and credit carryforwards. Based on our forecast of taxableincome for certain U.S. tax reporting groups, U.S. tax loss and credit carryforwards finalized as a resultof settlement of the disputed debt matter with the IRS, and certain tax planning actions and strategies,we believed it was more likely than not that a portion of our deferred tax assets would not be realized.
77
78
TE CONNECTIVITY LTD.
NOTES TO CONSOLIDATED FINANCIAL STATEMENTS (Continued)
15. Income Taxes (Continued)
The income tax expense for fiscal 2015 included a $264 million income tax benefit related to theeffective settlement of all undisputed tax matters for the years 2001 through 2010, partially offset by a$216 million income tax charge associated with the tax impacts of certain intercompany legal entityrestructurings made in connection with our integration of Measurement Specialties. Also, income taxexpense for fiscal 2015 included an income tax charge of $29 million associated with the tax impacts ofcertain intercompany dividends related to the restructuring and sale of our BNS business.
See ‘‘IRS Audits’’ below for additional information regarding settlements with the IRS.
Deferred Tax Assets and Liabilities
Deferred income taxes result from temporary differences between the amount of assets andliabilities recognized for financial reporting and tax purposes. The components of the net deferredincome tax asset were as follows:
Fiscal Year End
2017 2016
(in millions)
Deferred tax assets:Accrued liabilities and reserves . . . . . . . . . . . . . . . . . . . . . . . . $ 356 $ 286Tax loss and credit carryforwards . . . . . . . . . . . . . . . . . . . . . . 5,265 4,656Inventories . . . . . . . . . . . . . . . . . . . . . . . . . . . . . . . . . . . . . . 48 46Pension and postretirement benefits . . . . . . . . . . . . . . . . . . . . 231 349Deferred revenue . . . . . . . . . . . . . . . . . . . . . . . . . . . . . . . . . . 8 11Interest . . . . . . . . . . . . . . . . . . . . . . . . . . . . . . . . . . . . . . . . . 366 470Unrecognized income tax benefits . . . . . . . . . . . . . . . . . . . . . . 10 10Other . . . . . . . . . . . . . . . . . . . . . . . . . . . . . . . . . . . . . . . . . . 22 32
6,306 5,860
Deferred tax liabilities:Intangible assets . . . . . . . . . . . . . . . . . . . . . . . . . . . . . . . . . . (653) (761)Property, plant, and equipment . . . . . . . . . . . . . . . . . . . . . . . . (22) (15)Other . . . . . . . . . . . . . . . . . . . . . . . . . . . . . . . . . . . . . . . . . . (99) (84)
(774) (860)
Net deferred tax asset before valuation allowance . . . . . . . . . . . . 5,532 5,000Valuation allowance . . . . . . . . . . . . . . . . . . . . . . . . . . . . . . . . . (3,627) (3,096)
Net deferred tax asset . . . . . . . . . . . . . . . . . . . . . . . . . . . . . . $ 1,905 $ 1,904
78
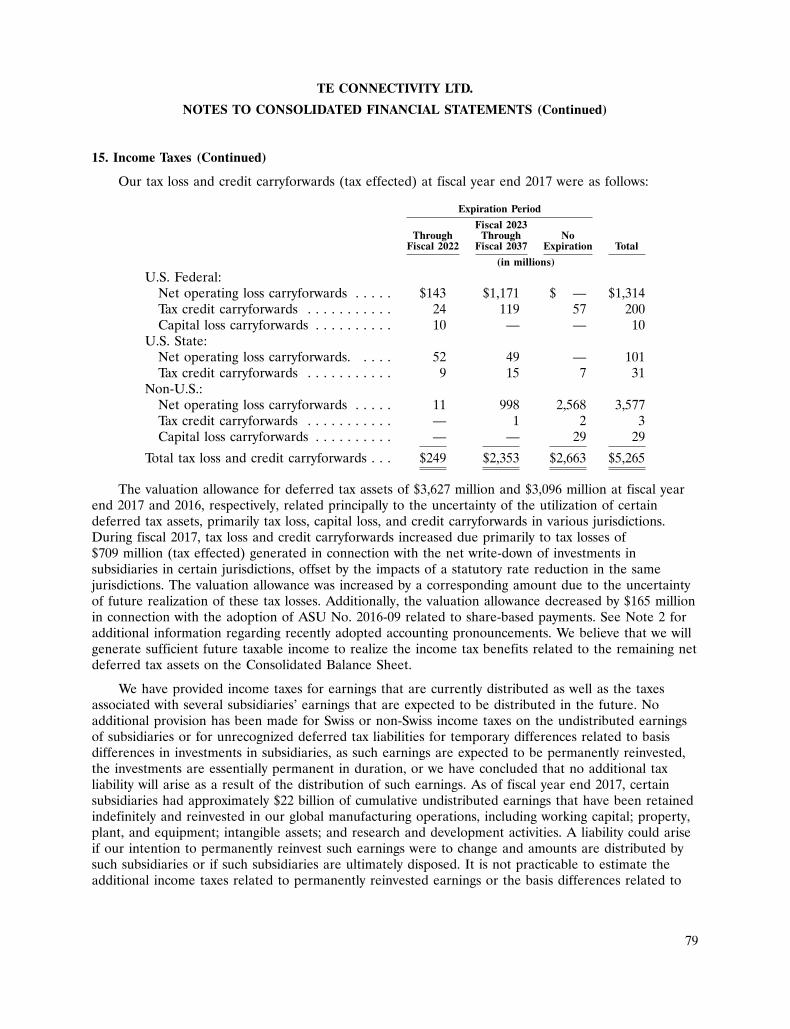
79
TE CONNECTIVITY LTD.
NOTES TO CONSOLIDATED FINANCIAL STATEMENTS (Continued)
15. Income Taxes (Continued)
Our tax loss and credit carryforwards (tax effected) at fiscal year end 2017 were as follows:
Expiration Period
Fiscal 2023Through Through No
Fiscal 2022 Fiscal 2037 Expiration Total
(in millions)
U.S. Federal:Net operating loss carryforwards . . . . . $143 $1,171 $ — $1,314Tax credit carryforwards . . . . . . . . . . . 24 119 57 200Capital loss carryforwards . . . . . . . . . . 10 — — 10
U.S. State:Net operating loss carryforwards. . . . . 52 49 — 101Tax credit carryforwards . . . . . . . . . . . 9 15 7 31
Non-U.S.:Net operating loss carryforwards . . . . . 11 998 2,568 3,577Tax credit carryforwards . . . . . . . . . . . — 1 2 3Capital loss carryforwards . . . . . . . . . . — — 29 29
Total tax loss and credit carryforwards . . . $249 $2,353 $2,663 $5,265
The valuation allowance for deferred tax assets of $3,627 million and $3,096 million at fiscal yearend 2017 and 2016, respectively, related principally to the uncertainty of the utilization of certaindeferred tax assets, primarily tax loss, capital loss, and credit carryforwards in various jurisdictions.During fiscal 2017, tax loss and credit carryforwards increased due primarily to tax losses of$709 million (tax effected) generated in connection with the net write-down of investments insubsidiaries in certain jurisdictions, offset by the impacts of a statutory rate reduction in the samejurisdictions. The valuation allowance was increased by a corresponding amount due to the uncertaintyof future realization of these tax losses. Additionally, the valuation allowance decreased by $165 millionin connection with the adoption of ASU No. 2016-09 related to share-based payments. See Note 2 foradditional information regarding recently adopted accounting pronouncements. We believe that we willgenerate sufficient future taxable income to realize the income tax benefits related to the remaining netdeferred tax assets on the Consolidated Balance Sheet.
We have provided income taxes for earnings that are currently distributed as well as the taxesassociated with several subsidiaries’ earnings that are expected to be distributed in the future. Noadditional provision has been made for Swiss or non-Swiss income taxes on the undistributed earningsof subsidiaries or for unrecognized deferred tax liabilities for temporary differences related to basisdifferences in investments in subsidiaries, as such earnings are expected to be permanently reinvested,the investments are essentially permanent in duration, or we have concluded that no additional taxliability will arise as a result of the distribution of such earnings. As of fiscal year end 2017, certainsubsidiaries had approximately $22 billion of cumulative undistributed earnings that have been retainedindefinitely and reinvested in our global manufacturing operations, including working capital; property,plant, and equipment; intangible assets; and research and development activities. A liability could ariseif our intention to permanently reinvest such earnings were to change and amounts are distributed bysuch subsidiaries or if such subsidiaries are ultimately disposed. It is not practicable to estimate theadditional income taxes related to permanently reinvested earnings or the basis differences related to
79
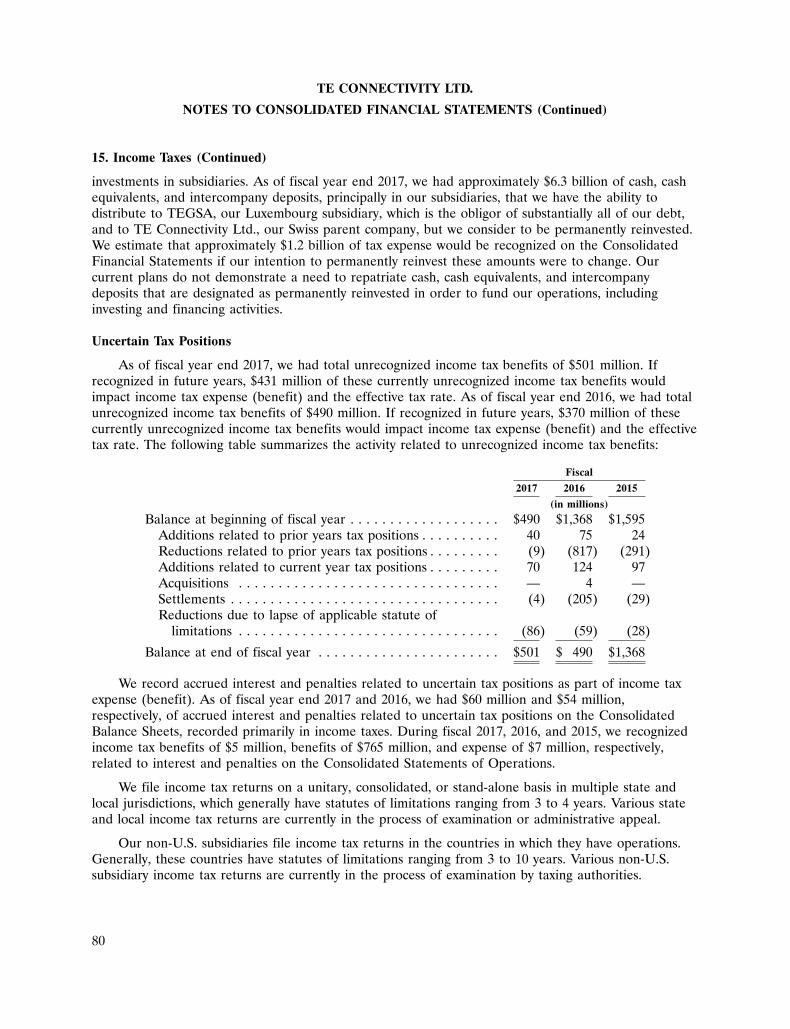
80
TE CONNECTIVITY LTD.
NOTES TO CONSOLIDATED FINANCIAL STATEMENTS (Continued)
15. Income Taxes (Continued)
investments in subsidiaries. As of fiscal year end 2017, we had approximately $6.3 billion of cash, cashequivalents, and intercompany deposits, principally in our subsidiaries, that we have the ability todistribute to TEGSA, our Luxembourg subsidiary, which is the obligor of substantially all of our debt,and to TE Connectivity Ltd., our Swiss parent company, but we consider to be permanently reinvested.We estimate that approximately $1.2 billion of tax expense would be recognized on the ConsolidatedFinancial Statements if our intention to permanently reinvest these amounts were to change. Ourcurrent plans do not demonstrate a need to repatriate cash, cash equivalents, and intercompanydeposits that are designated as permanently reinvested in order to fund our operations, includinginvesting and financing activities.
Uncertain Tax Positions
As of fiscal year end 2017, we had total unrecognized income tax benefits of $501 million. Ifrecognized in future years, $431 million of these currently unrecognized income tax benefits wouldimpact income tax expense (benefit) and the effective tax rate. As of fiscal year end 2016, we had totalunrecognized income tax benefits of $490 million. If recognized in future years, $370 million of thesecurrently unrecognized income tax benefits would impact income tax expense (benefit) and the effectivetax rate. The following table summarizes the activity related to unrecognized income tax benefits:
Fiscal
2017 2016 2015
(in millions)
Balance at beginning of fiscal year . . . . . . . . . . . . . . . . . . . $490 $1,368 $1,595Additions related to prior years tax positions . . . . . . . . . . 40 75 24Reductions related to prior years tax positions . . . . . . . . . (9) (817) (291)Additions related to current year tax positions . . . . . . . . . 70 124 97Acquisitions . . . . . . . . . . . . . . . . . . . . . . . . . . . . . . . . . — 4 —Settlements . . . . . . . . . . . . . . . . . . . . . . . . . . . . . . . . . . (4) (205) (29)Reductions due to lapse of applicable statute of
limitations . . . . . . . . . . . . . . . . . . . . . . . . . . . . . . . . . (86) (59) (28)
Balance at end of fiscal year . . . . . . . . . . . . . . . . . . . . . . . $501 $ 490 $1,368
We record accrued interest and penalties related to uncertain tax positions as part of income taxexpense (benefit). As of fiscal year end 2017 and 2016, we had $60 million and $54 million,respectively, of accrued interest and penalties related to uncertain tax positions on the ConsolidatedBalance Sheets, recorded primarily in income taxes. During fiscal 2017, 2016, and 2015, we recognizedincome tax benefits of $5 million, benefits of $765 million, and expense of $7 million, respectively,related to interest and penalties on the Consolidated Statements of Operations.
We file income tax returns on a unitary, consolidated, or stand-alone basis in multiple state andlocal jurisdictions, which generally have statutes of limitations ranging from 3 to 4 years. Various stateand local income tax returns are currently in the process of examination or administrative appeal.
Our non-U.S. subsidiaries file income tax returns in the countries in which they have operations.Generally, these countries have statutes of limitations ranging from 3 to 10 years. Various non-U.S.subsidiary income tax returns are currently in the process of examination by taxing authorities.
80
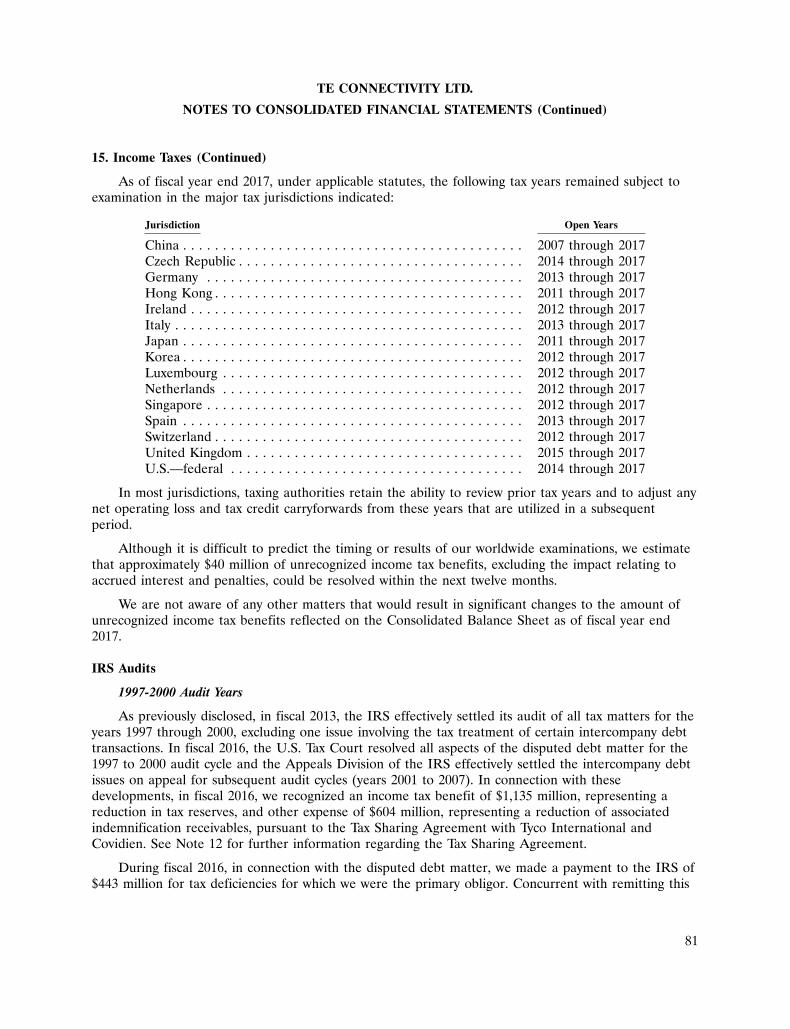
81
TE CONNECTIVITY LTD.
NOTES TO CONSOLIDATED FINANCIAL STATEMENTS (Continued)
15. Income Taxes (Continued)
As of fiscal year end 2017, under applicable statutes, the following tax years remained subject toexamination in the major tax jurisdictions indicated:
Jurisdiction Open Years
China . . . . . . . . . . . . . . . . . . . . . . . . . . . . . . . . . . . . . . . . . . . 2007 through 2017Czech Republic . . . . . . . . . . . . . . . . . . . . . . . . . . . . . . . . . . . . 2014 through 2017Germany . . . . . . . . . . . . . . . . . . . . . . . . . . . . . . . . . . . . . . . . 2013 through 2017Hong Kong . . . . . . . . . . . . . . . . . . . . . . . . . . . . . . . . . . . . . . . 2011 through 2017Ireland . . . . . . . . . . . . . . . . . . . . . . . . . . . . . . . . . . . . . . . . . . 2012 through 2017Italy . . . . . . . . . . . . . . . . . . . . . . . . . . . . . . . . . . . . . . . . . . . . 2013 through 2017Japan . . . . . . . . . . . . . . . . . . . . . . . . . . . . . . . . . . . . . . . . . . . 2011 through 2017Korea . . . . . . . . . . . . . . . . . . . . . . . . . . . . . . . . . . . . . . . . . . . 2012 through 2017Luxembourg . . . . . . . . . . . . . . . . . . . . . . . . . . . . . . . . . . . . . . 2012 through 2017Netherlands . . . . . . . . . . . . . . . . . . . . . . . . . . . . . . . . . . . . . . 2012 through 2017Singapore . . . . . . . . . . . . . . . . . . . . . . . . . . . . . . . . . . . . . . . . 2012 through 2017Spain . . . . . . . . . . . . . . . . . . . . . . . . . . . . . . . . . . . . . . . . . . . 2013 through 2017Switzerland . . . . . . . . . . . . . . . . . . . . . . . . . . . . . . . . . . . . . . . 2012 through 2017United Kingdom . . . . . . . . . . . . . . . . . . . . . . . . . . . . . . . . . . . 2015 through 2017U.S.—federal . . . . . . . . . . . . . . . . . . . . . . . . . . . . . . . . . . . . . 2014 through 2017
In most jurisdictions, taxing authorities retain the ability to review prior tax years and to adjust anynet operating loss and tax credit carryforwards from these years that are utilized in a subsequentperiod.
Although it is difficult to predict the timing or results of our worldwide examinations, we estimatethat approximately $40 million of unrecognized income tax benefits, excluding the impact relating toaccrued interest and penalties, could be resolved within the next twelve months.
We are not aware of any other matters that would result in significant changes to the amount ofunrecognized income tax benefits reflected on the Consolidated Balance Sheet as of fiscal year end2017.
IRS Audits
1997-2000 Audit Years
As previously disclosed, in fiscal 2013, the IRS effectively settled its audit of all tax matters for theyears 1997 through 2000, excluding one issue involving the tax treatment of certain intercompany debttransactions. In fiscal 2016, the U.S. Tax Court resolved all aspects of the disputed debt matter for the1997 to 2000 audit cycle and the Appeals Division of the IRS effectively settled the intercompany debtissues on appeal for subsequent audit cycles (years 2001 to 2007). In connection with thesedevelopments, in fiscal 2016, we recognized an income tax benefit of $1,135 million, representing areduction in tax reserves, and other expense of $604 million, representing a reduction of associatedindemnification receivables, pursuant to the Tax Sharing Agreement with Tyco International andCovidien. See Note 12 for further information regarding the Tax Sharing Agreement.
During fiscal 2016, in connection with the disputed debt matter, we made a payment to the IRS of$443 million for tax deficiencies for which we were the primary obligor. Concurrent with remitting this
81
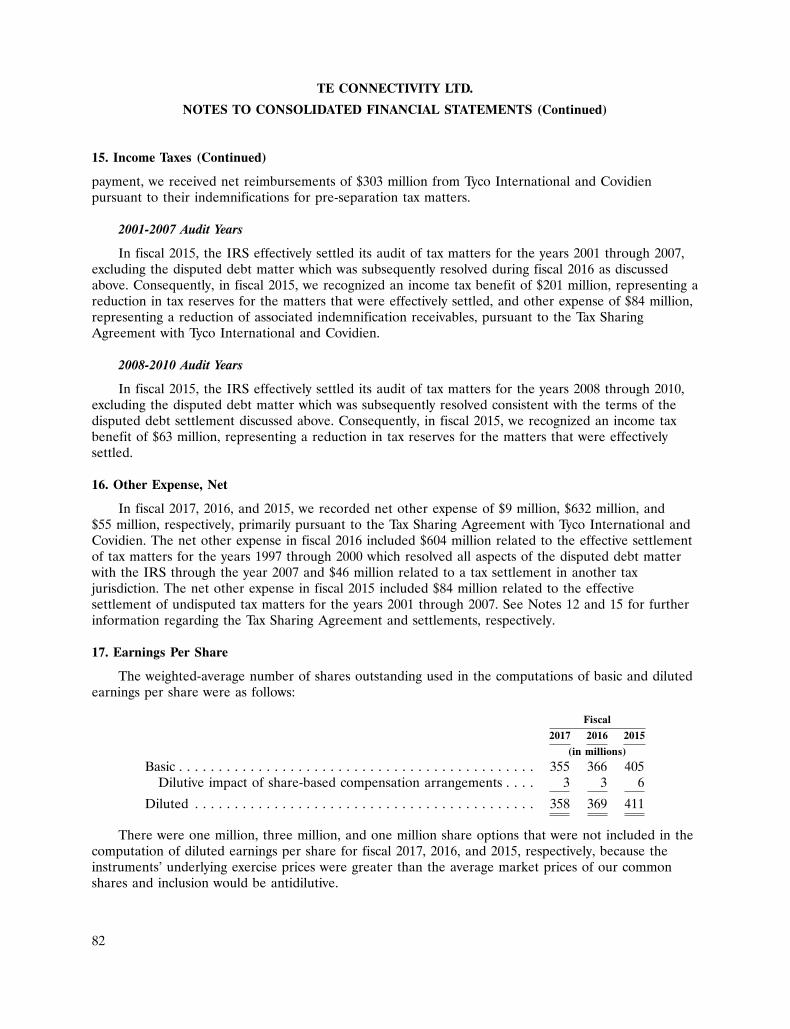
82
TE CONNECTIVITY LTD.
NOTES TO CONSOLIDATED FINANCIAL STATEMENTS (Continued)
15. Income Taxes (Continued)
payment, we received net reimbursements of $303 million from Tyco International and Covidienpursuant to their indemnifications for pre-separation tax matters.
2001-2007 Audit Years
In fiscal 2015, the IRS effectively settled its audit of tax matters for the years 2001 through 2007,excluding the disputed debt matter which was subsequently resolved during fiscal 2016 as discussedabove. Consequently, in fiscal 2015, we recognized an income tax benefit of $201 million, representing areduction in tax reserves for the matters that were effectively settled, and other expense of $84 million,representing a reduction of associated indemnification receivables, pursuant to the Tax SharingAgreement with Tyco International and Covidien.
2008-2010 Audit Years
In fiscal 2015, the IRS effectively settled its audit of tax matters for the years 2008 through 2010,excluding the disputed debt matter which was subsequently resolved consistent with the terms of thedisputed debt settlement discussed above. Consequently, in fiscal 2015, we recognized an income taxbenefit of $63 million, representing a reduction in tax reserves for the matters that were effectivelysettled.
16. Other Expense, Net
In fiscal 2017, 2016, and 2015, we recorded net other expense of $9 million, $632 million, and$55 million, respectively, primarily pursuant to the Tax Sharing Agreement with Tyco International andCovidien. The net other expense in fiscal 2016 included $604 million related to the effective settlementof tax matters for the years 1997 through 2000 which resolved all aspects of the disputed debt matterwith the IRS through the year 2007 and $46 million related to a tax settlement in another taxjurisdiction. The net other expense in fiscal 2015 included $84 million related to the effectivesettlement of undisputed tax matters for the years 2001 through 2007. See Notes 12 and 15 for furtherinformation regarding the Tax Sharing Agreement and settlements, respectively.
17. Earnings Per Share
The weighted-average number of shares outstanding used in the computations of basic and dilutedearnings per share were as follows:
Fiscal
2017 2016 2015
(in millions)
Basic . . . . . . . . . . . . . . . . . . . . . . . . . . . . . . . . . . . . . . . . . . . . . 355 366 405Dilutive impact of share-based compensation arrangements . . . . 3 3 6
Diluted . . . . . . . . . . . . . . . . . . . . . . . . . . . . . . . . . . . . . . . . . . . 358 369 411
There were one million, three million, and one million share options that were not included in thecomputation of diluted earnings per share for fiscal 2017, 2016, and 2015, respectively, because theinstruments’ underlying exercise prices were greater than the average market prices of our commonshares and inclusion would be antidilutive.
82
83
TE CONNECTIVITY LTD.
NOTES TO CONSOLIDATED FINANCIAL STATEMENTS (Continued)
18. Shareholders’ Equity
Common Shares
We are organized under the laws of Switzerland. The rights of holders of our shares are governedby Swiss law, our Swiss articles of association, and our Swiss organizational regulations. Accordingly,the par value of our common shares is stated in Swiss francs (‘‘CHF’’). We continue to use the U.S.dollar, however, as our reporting currency on the Consolidated Financial Statements.
Subject to certain conditions specified in our articles of association, we are authorized to increaseour conditional share capital by issuing new shares in aggregate not exceeding 50% of our authorizedshares. In March 2016, our shareholders approved for a period of two years ending on March 2, 2018,our board of directors’ authorization to issue additional new shares, subject to certain conditionsspecified in the articles of association, in aggregate not exceeding 50% of the amount of our authorizedshares.
Common Shares Held in Treasury
At fiscal year end 2017, approximately 5 million common shares were held in treasury and ownedby one of our subsidiaries. At fiscal year end 2016, approximately 28 million common shares were heldin treasury, of which 2 million were owned by one of our subsidiaries. Shares held both directly by usand by our subsidiary are presented as treasury shares on the Consolidated Balance Sheets.
In fiscal 2017, 2016, and 2015, our shareholders approved the cancellation of 26 million, 31 million,and 5 million shares, respectively, purchased under our share repurchase program. These capitalreductions by cancellation of shares were subject to a notice period and filing with the commercialregister in Switzerland.
Contributed Surplus
During fiscal 2017, cumulative equity transactions, including dividend activity and treasury sharecancellations, reduced our contributed surplus balance to zero with residual activity recorded againstaccumulated earnings as reflected on the Consolidated Statement of Shareholders’ Equity. To theextent that the contributed surplus balance continues to be zero, the impact of future transactions thatnormally would have been recorded as a reduction of contributed surplus will be recorded inaccumulated earnings. Contributed surplus established for Swiss tax and statutory purposes (‘‘SwissContributed Surplus’’), is not impacted by our GAAP treatment.
Swiss Contributed Surplus, subject to certain conditions, is a freely distributable reserve. As offiscal year end 2017 and 2016, Swiss Contributed Surplus was CHF 7,300 million andCHF 7,878 million, respectively (equivalent to $6,420 million and $6,992 million, respectively).
Dividends
Under Swiss law, subject to certain conditions, dividends paid from reserves from capitalcontributions (equivalent to Swiss Contributed Surplus) are exempt from Swiss withholding tax.Dividends on our shares must be approved by our shareholders.
83
84
TE CONNECTIVITY LTD.
NOTES TO CONSOLIDATED FINANCIAL STATEMENTS (Continued)
18. Shareholders’ Equity (Continued)
Our shareholders approved the following dividends on our common shares:
Approval Date Annual Payment Per Share Payment Dates
March 2014 . . . . . . . . . . . . . . . . . CHF 1.04 (equivalent to $1.16), Third quarter of fiscal 2014payable in four quarterly Fourth quarter of fiscal 2014
installments of $0.29 First quarter of fiscal 2015Second quarter of fiscal 2015
March 2015 . . . . . . . . . . . . . . . . . $1.32 (equivalent to CHF 1.27), Third quarter of fiscal 2015payable in four quarterly Fourth quarter of fiscal 2015
installments of $0.33 First quarter of fiscal 2016Second quarter of fiscal 2016
March 2016 . . . . . . . . . . . . . . . . . $1.48 (equivalent to CHF 1.48), Third quarter of fiscal 2016payable in four quarterly Fourth quarter of fiscal 2016
installments of $0.37 First quarter of fiscal 2017Second quarter of fiscal 2017
March 2017 . . . . . . . . . . . . . . . . . $1.60 (equivalent to CHF 1.62), Third quarter of fiscal 2017payable in four quarterly Fourth quarter of fiscal 2017
installments of $0.40 First quarter of fiscal 2018Second quarter of fiscal 2018
Upon shareholders’ approval of a dividend payment, we record a liability with a correspondingcharge to shareholders’ equity. At fiscal year end 2017 and 2016, the unpaid portion of the dividendsrecorded in accrued and other current liabilities on the Consolidated Balance Sheets totaled$281 million and $263 million, respectively.
Share Repurchase Program
During fiscal 2016 and 2015, our board of directors authorized increases of $1.0 billion and$3.0 billion, respectively, in the share repurchase program. Common shares repurchased under theshare repurchase program were as follows:
Fiscal
2017 2016 2015
(in millions)
Number of common shares repurchased . . . . . . . . . . . . . . . 8 43 18Repurchase value . . . . . . . . . . . . . . . . . . . . . . . . . . . . . . . $621 $2,610 $1,163
At fiscal year end 2017, we had $480 million of availability remaining under our share repurchaseauthorization.
84
85
TE CONNECTIVITY LTD.
NOTES TO CONSOLIDATED FINANCIAL STATEMENTS (Continued)
19. Accumulated Other Comprehensive Income (Loss)
The changes in each component of accumulated other comprehensive income (loss) were asfollows:
Unrecognized Gains (Losses) AccumulatedPension and on Cash Other
Currency Postretirement Flow ComprehensiveTranslation(1) Benefit Costs Hedges Income (Loss)
(in millions)
Balance at fiscal year end 2014 . . . . . . . . . . . $ 720 $(692) $(45) $ (17)
Other comprehensive loss beforereclassifications . . . . . . . . . . . . . . . . . . . (536) (147) (44) (727)
Amounts reclassified from accumulatedother comprehensive income (loss) . . . . . 224(2) 75 45 344
Income tax benefit . . . . . . . . . . . . . . . . . . — 26 1 27
Net other comprehensive income (loss),net of tax . . . . . . . . . . . . . . . . . . . . . (312) (46) 2 (356)
Balance at fiscal year end 2015 . . . . . . . . . . . 408 (738) (43) (373)
Other comprehensive loss beforereclassifications . . . . . . . . . . . . . . . . . . . (69) (190) (14) (273)
Amounts reclassified from accumulatedother comprehensive income (loss) . . . . . (23) 70 32 79
Income tax (expense) benefit . . . . . . . . . . — 32 (7) 25
Net other comprehensive income (loss),net of tax . . . . . . . . . . . . . . . . . . . . . (92) (88) 11 (169)
Balance at fiscal year end 2016 . . . . . . . . . . . 316 (826) (32) (542)
Other comprehensive income beforereclassifications . . . . . . . . . . . . . . . . . . . 38 378 32 448
Amounts reclassified from accumulatedother comprehensive income (loss) . . . . . (1) 74 (14) 59
Income tax expense . . . . . . . . . . . . . . . . . — (122) (3) (125)
Net other comprehensive income, net oftax . . . . . . . . . . . . . . . . . . . . . . . . . . 37 330 15 382
Balance at fiscal year end 2017 . . . . . . . . . . . $ 353 $(496) $(17) $(160)
(1) Includes hedges of net investment foreign exchange gains or losses which offset foreign exchange losses orgains attributable to the translation of the net investments.
(2) Represents net currency translation reclassified as a result of the sale of our BNS business. This net loss isincluded in income from discontinued operations on the Consolidated Statement of Operations. See Note 4for additional information regarding the divestiture of BNS.
85
86
TE CONNECTIVITY LTD.
NOTES TO CONSOLIDATED FINANCIAL STATEMENTS (Continued)
20. Share Plans
Our equity compensation plans, of which the TE Connectivity Ltd. 2007 Stock and Incentive Plan,amended and restated as of March 8, 2017 (the ‘‘2017 Plan’’), is the primary plan, provide for theaward of annual performance bonuses and long-term performance awards, including share options;restricted, performance, and deferred share units; and other share-based awards (collectively, ‘‘Awards’’)and allow for the use of unissued shares or treasury shares to be used to satisfy such Awards. In March2017, our shareholders approved an increase of 10 million shares in the number of shares available forawards under the 2017 Plan. As of fiscal year end 2017, our plans provided for a maximum of77 million shares to be issued as Awards, subject to adjustment as provided under the terms of theplans. A total of 23 million shares remained available for issuance under our plans as of fiscal year end2017.
Share-Based Compensation Expense
Share-based compensation expense, which was included in selling, general, and administrativeexpenses on the Consolidated Statements of Operations, was as follows:
Fiscal
2017 2016 2015
(in millions)
Share-based compensation expense . . . . . . . . . . . . . . . . . . . . . . . $99 $91 $89
We recognized a related tax benefit associated with our share-based compensation arrangements of$32 million, $29 million, and $29 million in fiscal 2017, 2016, and 2015, respectively.
Restricted Share Awards
Restricted share awards, which are generally in the form of restricted share units, are grantedsubject to certain restrictions. Conditions of vesting are determined at the time of grant. All restrictionson an award will lapse upon death or disability of the employee. If the employee satisfies retirementrequirements, a portion of the award may vest, depending on the terms and conditions of the particulargrant. Recipients of restricted share units have no voting rights, but do receive dividend equivalents.For grants that vest through passage of time, the fair value of the award at the time of the grant isamortized to expense over the period of vesting. The fair value of restricted share awards is determinedbased on the closing value of our shares on the grant date. Restricted share awards generally vest inincrements over a period of four years as determined by the management development andcompensation committee.
Restricted share award activity was as follows:
Weighted-AverageGrant-Date
Shares Fair Value
Nonvested at fiscal year end 2016 . . . . . . . . . . . . . . . . . 2,287,004 $58.47Granted . . . . . . . . . . . . . . . . . . . . . . . . . . . . . . . . . . 821,016 67.72Vested . . . . . . . . . . . . . . . . . . . . . . . . . . . . . . . . . . . (937,917) 52.89Forfeited . . . . . . . . . . . . . . . . . . . . . . . . . . . . . . . . . (179,319) 63.12
Nonvested at fiscal year end 2017 . . . . . . . . . . . . . . . . . 1,990,784 $64.40
86
87
TE CONNECTIVITY LTD.
NOTES TO CONSOLIDATED FINANCIAL STATEMENTS (Continued)
20. Share Plans (Continued)
The weighted-average grant-date fair value of restricted share awards granted during fiscal 2017,2016, and 2015 was $67.72, $64.88, and $62.45, respectively.
The total fair value of restricted share awards that vested during fiscal 2017, 2016, and 2015 was$50 million, $51 million, and $58 million, respectively.
As of fiscal year end 2017, there was $74 million of unrecognized compensation cost related tononvested restricted share awards. The cost is expected to be recognized over a weighted-averageperiod of 1.7 years.
Performance Share Awards
Performance share awards, which are generally in the form of performance share units, are grantedwith pay-out subject to vesting requirements and certain performance conditions that are determined atthe time of grant. Based on our performance, the pay-out of performance share units can range from0% to 200% of the number of units originally granted. The grant-date fair value of performance shareawards is expensed over the period of performance once achievement of the performance criteria isdeemed probable. Recipients of performance share units have no voting rights but do receive dividendequivalents. Performance share awards generally vest after a period of three years as determined by themanagement development and compensation committee.
Performance share award activity was as follows:
Weighted-AverageGrant-Date
Shares Fair Value
Outstanding at fiscal year end 2016 . . . . . . . . . . . . . . . . 626,625 $60.56Granted . . . . . . . . . . . . . . . . . . . . . . . . . . . . . . . . . . 376,380 62.88Vested . . . . . . . . . . . . . . . . . . . . . . . . . . . . . . . . . . . . (281,417) 51.61Forfeited . . . . . . . . . . . . . . . . . . . . . . . . . . . . . . . . . . (18,181) 65.12
Outstanding at fiscal year end 2017 . . . . . . . . . . . . . . . . 703,407 $65.13
The weighted-average grant-date fair value of performance share awards granted during fiscal2017, 2016, and 2015 was $62.88, $55.15, and $61.65, respectively.
The total fair value of performance share awards that vested during both fiscal 2017 and 2016 was$15 million. The total fair value of performance share awards that vested in fiscal 2015 wasinsignificant.
As of fiscal year end 2017, there was $28 million of unrecognized compensation cost related tononvested performance share awards. The cost is expected to be recognized over a weighted-averageperiod of 1.2 years.
Share Options
Share options are granted to purchase our common shares at prices which are equal to or greaterthan the market price of the common shares on the date the option is granted. Conditions of vestingare determined at the time of grant. All restrictions on the award will lapse upon death or disability ofthe employee. If the employee satisfies retirement requirements, a portion of the award may vest,
87
88
TE CONNECTIVITY LTD.
NOTES TO CONSOLIDATED FINANCIAL STATEMENTS (Continued)
20. Share Plans (Continued)
depending on the terms and conditions of the particular grant. Options generally vest and becomeexercisable in equal annual installments over a period of four years and expire ten years after the dateof grant.
Share option award activity was as follows:
Weighted-AverageWeighted-Average Remaining Aggregate
Exercise Contractual IntrinsicShares Price Term Value
(in years) (in millions)
Outstanding at fiscal year end 2016 . . . . . . . 9,104,380 $45.79Granted . . . . . . . . . . . . . . . . . . . . . . . . . 2,076,300 66.76Exercised . . . . . . . . . . . . . . . . . . . . . . . . (3,313,145) 34.96Expired . . . . . . . . . . . . . . . . . . . . . . . . . (2,307) 45.08Forfeited . . . . . . . . . . . . . . . . . . . . . . . . (180,135) 63.24
Outstanding at fiscal year end 2017 . . . . . . . 7,685,093 $55.70 7.0 $210
Vested and expected to vest at fiscal yearend 2017 . . . . . . . . . . . . . . . . . . . . . . . . 7,228,213 $55.14 7.0 $202
Exercisable at fiscal year end 2017 . . . . . . . . 3,482,445 $44.91 5.4 $133
The weighted-average exercise price of share option awards granted during fiscal 2017, 2016, and2015 was $66.76, $65.70, and $61.70, respectively.
The total intrinsic value of options exercised during fiscal 2017, 2016, and 2015 was $130 million,$67 million, and $107 million, respectively. We received cash related to the exercise of options of$117 million, $90 million, and $103 million in fiscal 2017, 2016, and 2015, respectively.
As of fiscal year end 2017, there was $37 million of unrecognized compensation cost related tononvested share options granted under our share option plans. The cost is expected to be recognizedover a weighted-average period of 1.9 years.
Share-Based Compensation Assumptions
The grant-date fair value of each share option grant was estimated using the Black-Scholes-Mertonoption pricing model. Use of a valuation model requires management to make certain assumptions withrespect to selected model inputs. We employ our historical share volatility when calculating thegrant-date fair value of our share option grants using the Black-Scholes-Merton option pricing model.Currently, we do not have exchange-traded options of sufficient duration to employ an implied volatilityassumption in the calculation and therefore rely solely on the historical volatility calculation. Theaverage expected life was based on the contractual term of the option and expected employee exerciseand post-vesting employment termination behavior. The risk-free interest rate was based on U.S.Treasury zero-coupon issues with a remaining term that approximated the expected life assumed at thedate of grant. The expected annual dividend per share was based on our expected dividend rate. Therecognized share-based compensation expense was net of estimated forfeitures, which are based onvoluntary termination behavior as well as an analysis of actual option forfeitures.
88
89
TE CONNECTIVITY LTD.
NOTES TO CONSOLIDATED FINANCIAL STATEMENTS (Continued)
20. Share Plans (Continued)
The weighted-average grant-date fair value of options granted and the weighted-averageassumptions we used in the Black-Scholes-Merton option pricing model were as follows:
Fiscal
2017 2016 2015
Weighted-average grant-date fair value . . . . . . . . . . . . . . . $12.80 $14.26 $18.77
Assumptions:Expected share price volatility . . . . . . . . . . . . . . . . . . . . . 24% 26% 36%Risk free interest rate . . . . . . . . . . . . . . . . . . . . . . . . . . . 1.9% 2.0% 2.0%Expected annual dividend per share . . . . . . . . . . . . . . . . . $ 1.48 $ 1.32 $ 1.16Expected life of options (in years) . . . . . . . . . . . . . . . . . . 5.6 5.7 6.0
21. Segment and Geographic Data
We operate through three reportable segments: Transportation Solutions, Industrial Solutions, andCommunications Solutions. See Note 1 for a description of the segments in which we operate. Weaggregate our operating segments into reportable segments based upon similar economic characteristicsand business groupings of products, services, and customers.
Segment performance is evaluated based on net sales and operating income. Generally, weconsider all expenses to be of an operating nature and, accordingly, allocate them to each reportablesegment. Costs specific to a segment are charged to the segment. Corporate expenses, such asheadquarters administrative costs, are allocated to the segments based on segment operating income.Intersegment sales were not material and were recorded at selling prices that approximate marketprices. Corporate assets are allocated to the segments based on segment assets.
Net sales and operating income by segment were as follows:
Net Sales Operating Income
Fiscal Fiscal
2017 2016 2015 2017 2016 2015
(in millions)
Transportation Solutions . . . . . . . . . . . . . . . . $ 7,039 $ 6,503 $ 6,351 $1,299 $1,191 $1,193Industrial Solutions . . . . . . . . . . . . . . . . . . . . 3,507 3,215 3,179 364 343 352Communications Solutions . . . . . . . . . . . . . . 2,567 2,520 2,703 384 368(1) 204
Total . . . . . . . . . . . . . . . . . . . . . . . . . . . . . $13,113 $12,238 $12,233 $2,047 $1,902 $1,749
(1) Includes pre-tax gain of $144 million on the sale of our CPD business during fiscal 2016.
No single customer accounted for a significant amount of our net sales in fiscal 2017, 2016, or2015.
As we are not organized by product or service, it is not practicable to disclose net sales by productor service.
89
90
TE CONNECTIVITY LTD.
NOTES TO CONSOLIDATED FINANCIAL STATEMENTS (Continued)
21. Segment and Geographic Data (Continued)
Depreciation and amortization and capital expenditures were as follows:
Depreciation and Amortization Capital Expenditures
Fiscal Fiscal
2017 2016 2015 2017 2016 2015
(in millions)
Transportation Solutions . . . . . . . . . . . . . . . . $359 $337 $347 $471 $429 $400Industrial Solutions . . . . . . . . . . . . . . . . . . . . 165 131 123 122 107 104Communications Solutions . . . . . . . . . . . . . . 111 117 146 109 92 96
Total . . . . . . . . . . . . . . . . . . . . . . . . . . . . . $635 $585 $616 $702 $628 $600
Segment assets and a reconciliation of segment assets to total assets were as follows:
Segment Assets
Fiscal Year End
2017 2016 2015
(in millions)
Transportation Solutions . . . . . . . . . . . . . . . . . . . . . . $ 4,072 $ 3,501 $ 3,310Industrial Solutions . . . . . . . . . . . . . . . . . . . . . . . . . . 1,905 1,720 1,720Communications Solutions . . . . . . . . . . . . . . . . . . . . . 1,526 1,473 1,625
Total segment assets(1) . . . . . . . . . . . . . . . . . . . . . . 7,503 6,694 6,655Other current assets . . . . . . . . . . . . . . . . . . . . . . . . . 1,823 1,133 4,150Other non-current assets . . . . . . . . . . . . . . . . . . . . . . 10,077 9,781 9,784
Total assets . . . . . . . . . . . . . . . . . . . . . . . . . . . . . . $19,403 $17,608 $20,589
(1) Segment assets are composed of accounts receivable, inventories, and net property, plant, andequipment.
90
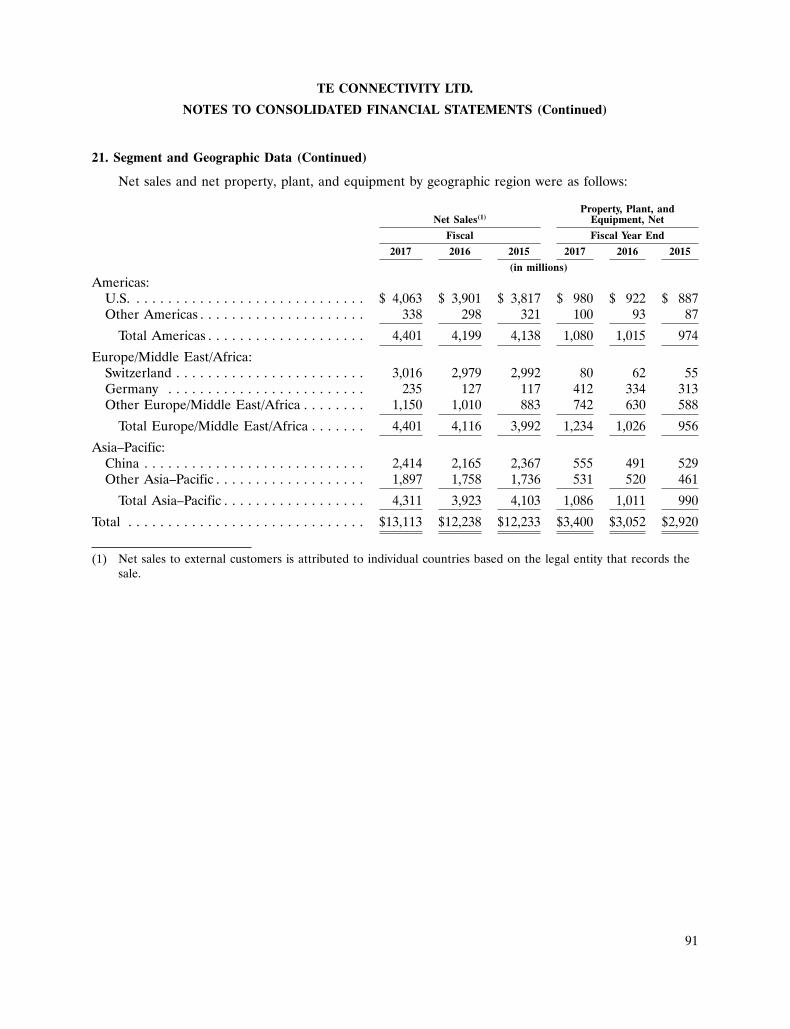
91
TE CONNECTIVITY LTD.
NOTES TO CONSOLIDATED FINANCIAL STATEMENTS (Continued)
21. Segment and Geographic Data (Continued)
Net sales and net property, plant, and equipment by geographic region were as follows:
Property, Plant, andNet Sales(1) Equipment, Net
Fiscal Fiscal Year End
2017 2016 2015 2017 2016 2015
(in millions)
Americas:U.S. . . . . . . . . . . . . . . . . . . . . . . . . . . . . . $ 4,063 $ 3,901 $ 3,817 $ 980 $ 922 $ 887Other Americas . . . . . . . . . . . . . . . . . . . . . 338 298 321 100 93 87
Total Americas . . . . . . . . . . . . . . . . . . . . 4,401 4,199 4,138 1,080 1,015 974
Europe/Middle East/Africa:Switzerland . . . . . . . . . . . . . . . . . . . . . . . . 3,016 2,979 2,992 80 62 55Germany . . . . . . . . . . . . . . . . . . . . . . . . . 235 127 117 412 334 313Other Europe/Middle East/Africa . . . . . . . . 1,150 1,010 883 742 630 588
Total Europe/Middle East/Africa . . . . . . . 4,401 4,116 3,992 1,234 1,026 956
Asia–Pacific:China . . . . . . . . . . . . . . . . . . . . . . . . . . . . 2,414 2,165 2,367 555 491 529Other Asia–Pacific . . . . . . . . . . . . . . . . . . . 1,897 1,758 1,736 531 520 461
Total Asia–Pacific . . . . . . . . . . . . . . . . . . 4,311 3,923 4,103 1,086 1,011 990
Total . . . . . . . . . . . . . . . . . . . . . . . . . . . . . . $13,113 $12,238 $12,233 $3,400 $3,052 $2,920
(1) Net sales to external customers is attributed to individual countries based on the legal entity that records thesale.
91
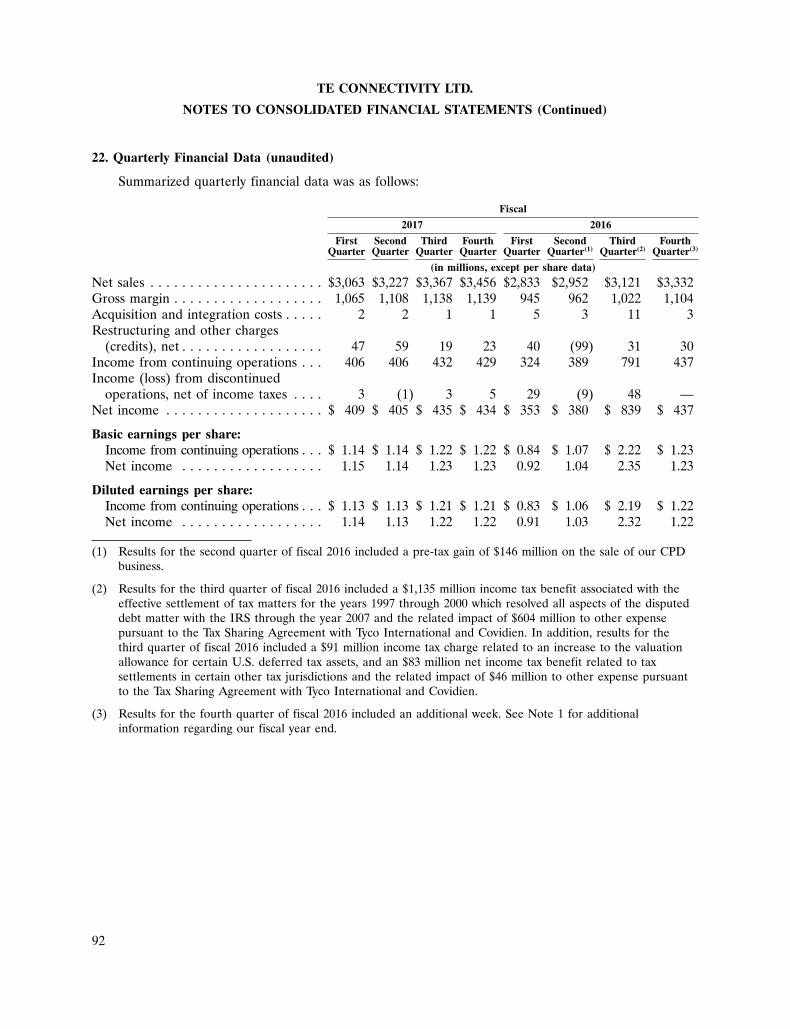
92
TE CONNECTIVITY LTD.
NOTES TO CONSOLIDATED FINANCIAL STATEMENTS (Continued)
22. Quarterly Financial Data (unaudited)
Summarized quarterly financial data was as follows:
Fiscal
2017 2016
First Second Third Fourth First Second Third FourthQuarter Quarter Quarter Quarter Quarter Quarter(1) Quarter(2) Quarter(3)
(in millions, except per share data)
Net sales . . . . . . . . . . . . . . . . . . . . . . $3,063 $3,227 $3,367 $3,456 $2,833 $2,952 $3,121 $3,332Gross margin . . . . . . . . . . . . . . . . . . . 1,065 1,108 1,138 1,139 945 962 1,022 1,104Acquisition and integration costs . . . . . 2 2 1 1 5 3 11 3Restructuring and other charges
(credits), net . . . . . . . . . . . . . . . . . . 47 59 19 23 40 (99) 31 30Income from continuing operations . . . 406 406 432 429 324 389 791 437Income (loss) from discontinued
operations, net of income taxes . . . . 3 (1) 3 5 29 (9) 48 —Net income . . . . . . . . . . . . . . . . . . . . $ 409 $ 405 $ 435 $ 434 $ 353 $ 380 $ 839 $ 437
Basic earnings per share:Income from continuing operations . . . $ 1.14 $ 1.14 $ 1.22 $ 1.22 $ 0.84 $ 1.07 $ 2.22 $ 1.23Net income . . . . . . . . . . . . . . . . . . 1.15 1.14 1.23 1.23 0.92 1.04 2.35 1.23
Diluted earnings per share:Income from continuing operations . . . $ 1.13 $ 1.13 $ 1.21 $ 1.21 $ 0.83 $ 1.06 $ 2.19 $ 1.22Net income . . . . . . . . . . . . . . . . . . 1.14 1.13 1.22 1.22 0.91 1.03 2.32 1.22
(1) Results for the second quarter of fiscal 2016 included a pre-tax gain of $146 million on the sale of our CPDbusiness.
(2) Results for the third quarter of fiscal 2016 included a $1,135 million income tax benefit associated with theeffective settlement of tax matters for the years 1997 through 2000 which resolved all aspects of the disputeddebt matter with the IRS through the year 2007 and the related impact of $604 million to other expensepursuant to the Tax Sharing Agreement with Tyco International and Covidien. In addition, results for thethird quarter of fiscal 2016 included a $91 million income tax charge related to an increase to the valuationallowance for certain U.S. deferred tax assets, and an $83 million net income tax benefit related to taxsettlements in certain other tax jurisdictions and the related impact of $46 million to other expense pursuantto the Tax Sharing Agreement with Tyco International and Covidien.
(3) Results for the fourth quarter of fiscal 2016 included an additional week. See Note 1 for additionalinformation regarding our fiscal year end.
92
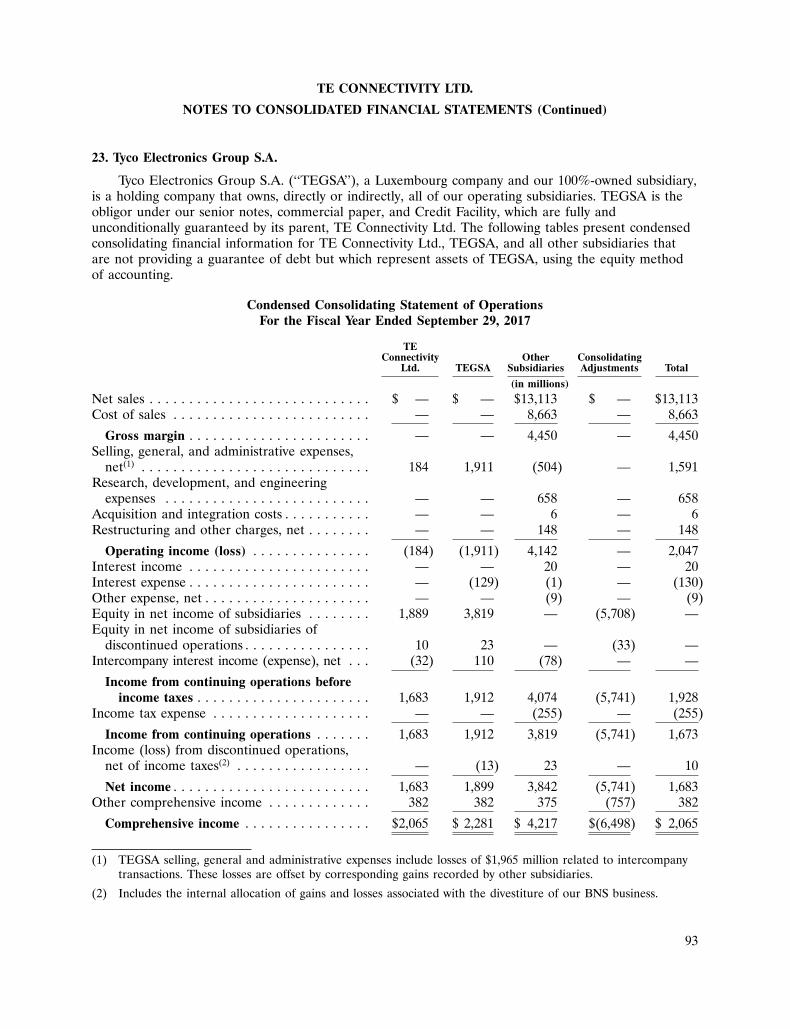
93
TE CONNECTIVITY LTD.
NOTES TO CONSOLIDATED FINANCIAL STATEMENTS (Continued)
23. Tyco Electronics Group S.A.
Tyco Electronics Group S.A. (‘‘TEGSA’’), a Luxembourg company and our 100%-owned subsidiary,is a holding company that owns, directly or indirectly, all of our operating subsidiaries. TEGSA is theobligor under our senior notes, commercial paper, and Credit Facility, which are fully andunconditionally guaranteed by its parent, TE Connectivity Ltd. The following tables present condensedconsolidating financial information for TE Connectivity Ltd., TEGSA, and all other subsidiaries thatare not providing a guarantee of debt but which represent assets of TEGSA, using the equity methodof accounting.
Condensed Consolidating Statement of OperationsFor the Fiscal Year Ended September 29, 2017
TEConnectivity Other Consolidating
Ltd. TEGSA Subsidiaries Adjustments Total
(in millions)
Net sales . . . . . . . . . . . . . . . . . . . . . . . . . . . . $ — $ — $13,113 $ — $13,113Cost of sales . . . . . . . . . . . . . . . . . . . . . . . . . — — 8,663 — 8,663
Gross margin . . . . . . . . . . . . . . . . . . . . . . . — — 4,450 — 4,450Selling, general, and administrative expenses,
net(1) . . . . . . . . . . . . . . . . . . . . . . . . . . . . . 184 1,911 (504) — 1,591Research, development, and engineering
expenses . . . . . . . . . . . . . . . . . . . . . . . . . . — — 658 — 658Acquisition and integration costs . . . . . . . . . . . — — 6 — 6Restructuring and other charges, net . . . . . . . . — — 148 — 148
Operating income (loss) . . . . . . . . . . . . . . . (184) (1,911) 4,142 — 2,047Interest income . . . . . . . . . . . . . . . . . . . . . . . — — 20 — 20Interest expense . . . . . . . . . . . . . . . . . . . . . . . — (129) (1) — (130)Other expense, net . . . . . . . . . . . . . . . . . . . . . — — (9) — (9)Equity in net income of subsidiaries . . . . . . . . 1,889 3,819 — (5,708) —Equity in net income of subsidiaries of
discontinued operations . . . . . . . . . . . . . . . . 10 23 — (33) —Intercompany interest income (expense), net . . . (32) 110 (78) — —
Income from continuing operations beforeincome taxes . . . . . . . . . . . . . . . . . . . . . . 1,683 1,912 4,074 (5,741) 1,928
Income tax expense . . . . . . . . . . . . . . . . . . . . — — (255) — (255)
Income from continuing operations . . . . . . . 1,683 1,912 3,819 (5,741) 1,673Income (loss) from discontinued operations,
net of income taxes(2) . . . . . . . . . . . . . . . . . — (13) 23 — 10
Net income . . . . . . . . . . . . . . . . . . . . . . . . . 1,683 1,899 3,842 (5,741) 1,683Other comprehensive income . . . . . . . . . . . . . 382 382 375 (757) 382
Comprehensive income . . . . . . . . . . . . . . . . $2,065 $ 2,281 $ 4,217 $(6,498) $ 2,065
(1) TEGSA selling, general and administrative expenses include losses of $1,965 million related to intercompanytransactions. These losses are offset by corresponding gains recorded by other subsidiaries.
(2) Includes the internal allocation of gains and losses associated with the divestiture of our BNS business.
93
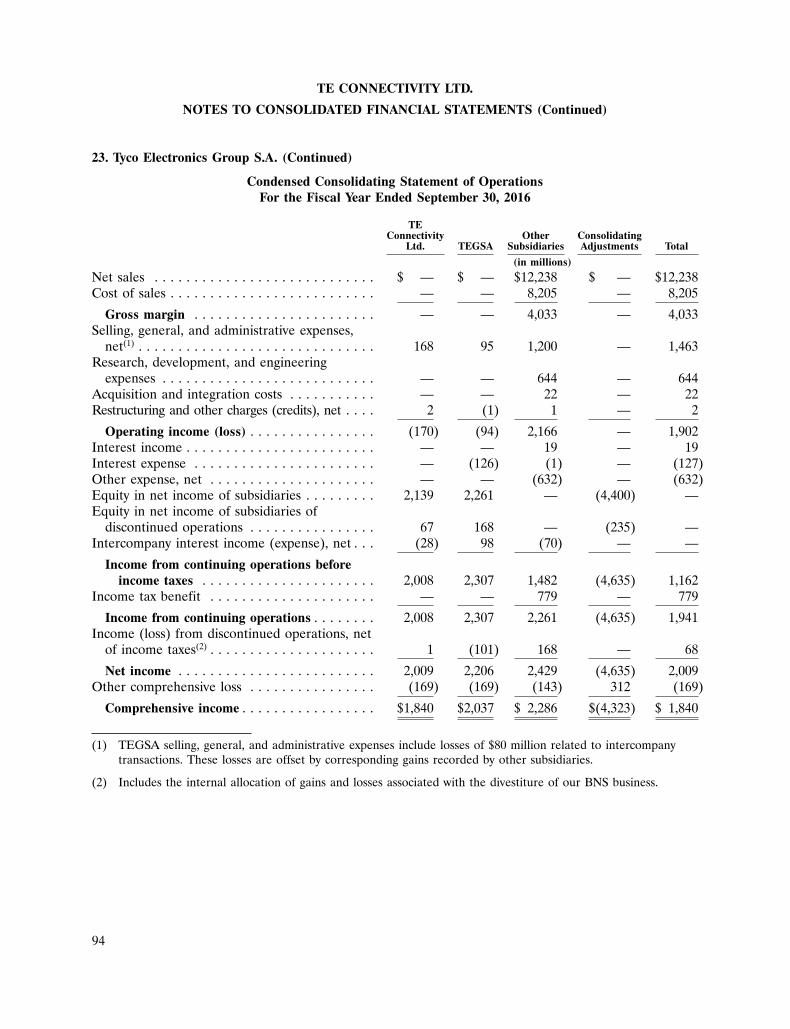
94
TE CONNECTIVITY LTD.
NOTES TO CONSOLIDATED FINANCIAL STATEMENTS (Continued)
23. Tyco Electronics Group S.A. (Continued)
Condensed Consolidating Statement of OperationsFor the Fiscal Year Ended September 30, 2016
TEConnectivity Other Consolidating
Ltd. TEGSA Subsidiaries Adjustments Total
(in millions)
Net sales . . . . . . . . . . . . . . . . . . . . . . . . . . . . $ — $ — $12,238 $ — $12,238Cost of sales . . . . . . . . . . . . . . . . . . . . . . . . . . — — 8,205 — 8,205
Gross margin . . . . . . . . . . . . . . . . . . . . . . . — — 4,033 — 4,033Selling, general, and administrative expenses,
net(1) . . . . . . . . . . . . . . . . . . . . . . . . . . . . . . 168 95 1,200 — 1,463Research, development, and engineering
expenses . . . . . . . . . . . . . . . . . . . . . . . . . . . — — 644 — 644Acquisition and integration costs . . . . . . . . . . . — — 22 — 22Restructuring and other charges (credits), net . . . . 2 (1) 1 — 2
Operating income (loss) . . . . . . . . . . . . . . . . (170) (94) 2,166 — 1,902Interest income . . . . . . . . . . . . . . . . . . . . . . . . — — 19 — 19Interest expense . . . . . . . . . . . . . . . . . . . . . . . — (126) (1) — (127)Other expense, net . . . . . . . . . . . . . . . . . . . . . — — (632) — (632)Equity in net income of subsidiaries . . . . . . . . . 2,139 2,261 — (4,400) —Equity in net income of subsidiaries of
discontinued operations . . . . . . . . . . . . . . . . 67 168 — (235) —Intercompany interest income (expense), net . . . (28) 98 (70) — —
Income from continuing operations beforeincome taxes . . . . . . . . . . . . . . . . . . . . . . 2,008 2,307 1,482 (4,635) 1,162
Income tax benefit . . . . . . . . . . . . . . . . . . . . . — — 779 — 779
Income from continuing operations . . . . . . . . 2,008 2,307 2,261 (4,635) 1,941Income (loss) from discontinued operations, net
of income taxes(2) . . . . . . . . . . . . . . . . . . . . . 1 (101) 168 — 68
Net income . . . . . . . . . . . . . . . . . . . . . . . . . 2,009 2,206 2,429 (4,635) 2,009Other comprehensive loss . . . . . . . . . . . . . . . . (169) (169) (143) 312 (169)
Comprehensive income . . . . . . . . . . . . . . . . . $1,840 $2,037 $ 2,286 $(4,323) $ 1,840
(1) TEGSA selling, general, and administrative expenses include losses of $80 million related to intercompanytransactions. These losses are offset by corresponding gains recorded by other subsidiaries.
(2) Includes the internal allocation of gains and losses associated with the divestiture of our BNS business.
94
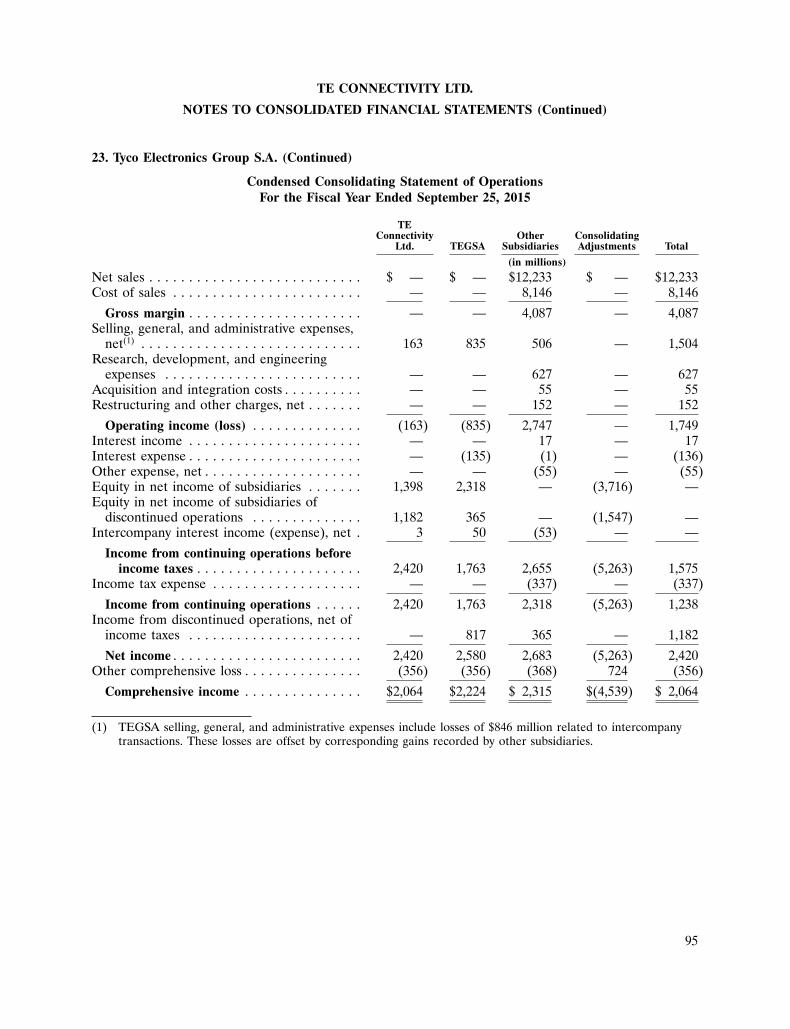
95
TE CONNECTIVITY LTD.
NOTES TO CONSOLIDATED FINANCIAL STATEMENTS (Continued)
23. Tyco Electronics Group S.A. (Continued)
Condensed Consolidating Statement of OperationsFor the Fiscal Year Ended September 25, 2015
TEConnectivity Other Consolidating
Ltd. TEGSA Subsidiaries Adjustments Total
(in millions)
Net sales . . . . . . . . . . . . . . . . . . . . . . . . . . . $ — $ — $12,233 $ — $12,233Cost of sales . . . . . . . . . . . . . . . . . . . . . . . . — — 8,146 — 8,146
Gross margin . . . . . . . . . . . . . . . . . . . . . . — — 4,087 — 4,087Selling, general, and administrative expenses,
net(1) . . . . . . . . . . . . . . . . . . . . . . . . . . . . 163 835 506 — 1,504Research, development, and engineering
expenses . . . . . . . . . . . . . . . . . . . . . . . . . — — 627 — 627Acquisition and integration costs . . . . . . . . . . — — 55 — 55Restructuring and other charges, net . . . . . . . — — 152 — 152
Operating income (loss) . . . . . . . . . . . . . . (163) (835) 2,747 — 1,749Interest income . . . . . . . . . . . . . . . . . . . . . . — — 17 — 17Interest expense . . . . . . . . . . . . . . . . . . . . . . — (135) (1) — (136)Other expense, net . . . . . . . . . . . . . . . . . . . . — — (55) — (55)Equity in net income of subsidiaries . . . . . . . 1,398 2,318 — (3,716) —Equity in net income of subsidiaries of
discontinued operations . . . . . . . . . . . . . . 1,182 365 — (1,547) —Intercompany interest income (expense), net . 3 50 (53) — —
Income from continuing operations beforeincome taxes . . . . . . . . . . . . . . . . . . . . . 2,420 1,763 2,655 (5,263) 1,575
Income tax expense . . . . . . . . . . . . . . . . . . . — — (337) — (337)
Income from continuing operations . . . . . . 2,420 1,763 2,318 (5,263) 1,238Income from discontinued operations, net of
income taxes . . . . . . . . . . . . . . . . . . . . . . — 817 365 — 1,182
Net income . . . . . . . . . . . . . . . . . . . . . . . . 2,420 2,580 2,683 (5,263) 2,420Other comprehensive loss . . . . . . . . . . . . . . . (356) (356) (368) 724 (356)
Comprehensive income . . . . . . . . . . . . . . . $2,064 $2,224 $ 2,315 $(4,539) $ 2,064
(1) TEGSA selling, general, and administrative expenses include losses of $846 million related to intercompanytransactions. These losses are offset by corresponding gains recorded by other subsidiaries.
95

96
TE CONNECTIVITY LTD.
NOTES TO CONSOLIDATED FINANCIAL STATEMENTS (Continued)
23. Tyco Electronics Group S.A. (Continued)
Condensed Consolidating Balance SheetAs of September 29, 2017
TEConnectivity Other Consolidating
Ltd. TEGSA Subsidiaries Adjustments Total
(in millions)AssetsCurrent assets:
Cash and cash equivalents . . . . . . . . . . . . . . $ — $ — $ 1,218 $ — $ 1,218Accounts receivable, net . . . . . . . . . . . . . . . — — 2,290 — 2,290Inventories . . . . . . . . . . . . . . . . . . . . . . . . — — 1,813 — 1,813Intercompany receivables . . . . . . . . . . . . . . 49 1,914 60 (2,023) —Prepaid expenses and other current assets . . . 4 96 505 — 605
Total current assets . . . . . . . . . . . . . . . . . . . 53 2,010 5,886 (2,023) 5,926Property, plant, and equipment, net . . . . . . . . . — — 3,400 — 3,400Goodwill . . . . . . . . . . . . . . . . . . . . . . . . . . . — — 5,651 — 5,651Intangible assets, net . . . . . . . . . . . . . . . . . . . — — 1,841 — 1,841Deferred income taxes . . . . . . . . . . . . . . . . . . — — 2,141 — 2,141Investment in subsidiaries . . . . . . . . . . . . . . . . 11,960 20,109 — (32,069) —Intercompany loans receivable . . . . . . . . . . . . — 4,027 9,700 (13,727) —Other assets . . . . . . . . . . . . . . . . . . . . . . . . . — 6 438 — 444
Total Assets . . . . . . . . . . . . . . . . . . . . . . . . $12,013 $26,152 $29,057 $(47,819) $19,403
Liabilities and Shareholders’ EquityCurrent liabilities:
Short-term debt . . . . . . . . . . . . . . . . . . . . . $ — $ 708 $ 2 $ — $ 710Accounts payable . . . . . . . . . . . . . . . . . . . . 2 — 1,434 — 1,436Accrued and other current liabilities . . . . . . . 286 59 1,281 — 1,626Deferred revenue . . . . . . . . . . . . . . . . . . . . — — 75 — 75Intercompany payables . . . . . . . . . . . . . . . . 1,974 — 49 (2,023) —
Total current liabilities . . . . . . . . . . . . . . . . 2,262 767 2,841 (2,023) 3,847Long-term debt . . . . . . . . . . . . . . . . . . . . . . . — 3,629 5 — 3,634Intercompany loans payable . . . . . . . . . . . . . . — 9,700 4,027 (13,727) —Long-term pension and postretirement
liabilities . . . . . . . . . . . . . . . . . . . . . . . . . . — — 1,160 — 1,160Deferred income taxes . . . . . . . . . . . . . . . . . . — — 236 — 236Income taxes . . . . . . . . . . . . . . . . . . . . . . . . . — — 293 — 293Other liabilities . . . . . . . . . . . . . . . . . . . . . . . — 96 386 — 482
Total Liabilities . . . . . . . . . . . . . . . . . . . . . 2,262 14,192 8,948 (15,750) 9,652
Total Shareholders’ Equity . . . . . . . . . . . . . 9,751 11,960 20,109 (32,069) 9,751
Total Liabilities and Shareholders’ Equity . . $12,013 $26,152 $29,057 $(47,819) $19,403
96
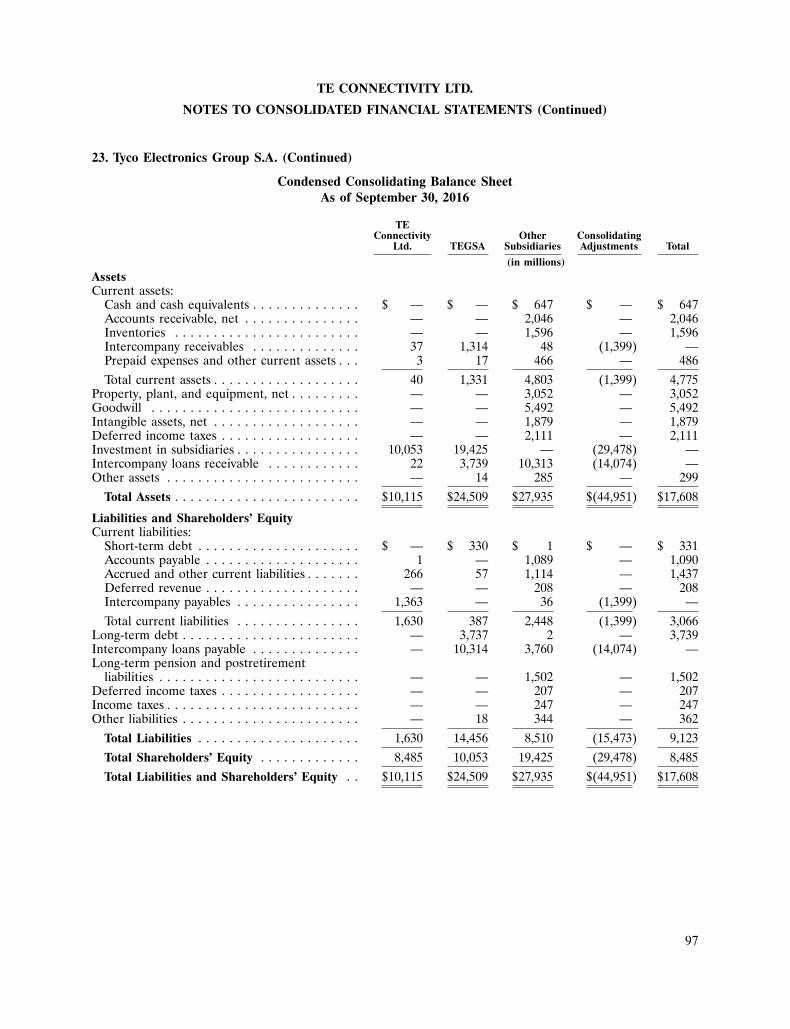
97
TE CONNECTIVITY LTD.
NOTES TO CONSOLIDATED FINANCIAL STATEMENTS (Continued)
23. Tyco Electronics Group S.A. (Continued)
Condensed Consolidating Balance SheetAs of September 30, 2016
TEConnectivity Other Consolidating
Ltd. TEGSA Subsidiaries Adjustments Total
(in millions)AssetsCurrent assets:
Cash and cash equivalents . . . . . . . . . . . . . . $ — $ — $ 647 $ — $ 647Accounts receivable, net . . . . . . . . . . . . . . . — — 2,046 — 2,046Inventories . . . . . . . . . . . . . . . . . . . . . . . . — — 1,596 — 1,596Intercompany receivables . . . . . . . . . . . . . . 37 1,314 48 (1,399) —Prepaid expenses and other current assets . . . 3 17 466 — 486
Total current assets . . . . . . . . . . . . . . . . . . . 40 1,331 4,803 (1,399) 4,775Property, plant, and equipment, net . . . . . . . . . — — 3,052 — 3,052Goodwill . . . . . . . . . . . . . . . . . . . . . . . . . . . — — 5,492 — 5,492Intangible assets, net . . . . . . . . . . . . . . . . . . . — — 1,879 — 1,879Deferred income taxes . . . . . . . . . . . . . . . . . . — — 2,111 — 2,111Investment in subsidiaries . . . . . . . . . . . . . . . . 10,053 19,425 — (29,478) —Intercompany loans receivable . . . . . . . . . . . . 22 3,739 10,313 (14,074) —Other assets . . . . . . . . . . . . . . . . . . . . . . . . . — 14 285 — 299
Total Assets . . . . . . . . . . . . . . . . . . . . . . . . $10,115 $24,509 $27,935 $(44,951) $17,608
Liabilities and Shareholders’ EquityCurrent liabilities:
Short-term debt . . . . . . . . . . . . . . . . . . . . . $ — $ 330 $ 1 $ — $ 331Accounts payable . . . . . . . . . . . . . . . . . . . . 1 — 1,089 — 1,090Accrued and other current liabilities . . . . . . . 266 57 1,114 — 1,437Deferred revenue . . . . . . . . . . . . . . . . . . . . — — 208 — 208Intercompany payables . . . . . . . . . . . . . . . . 1,363 — 36 (1,399) —
Total current liabilities . . . . . . . . . . . . . . . . 1,630 387 2,448 (1,399) 3,066Long-term debt . . . . . . . . . . . . . . . . . . . . . . . — 3,737 2 — 3,739Intercompany loans payable . . . . . . . . . . . . . . — 10,314 3,760 (14,074) —Long-term pension and postretirement
liabilities . . . . . . . . . . . . . . . . . . . . . . . . . . — — 1,502 — 1,502Deferred income taxes . . . . . . . . . . . . . . . . . . — — 207 — 207Income taxes . . . . . . . . . . . . . . . . . . . . . . . . . — — 247 — 247Other liabilities . . . . . . . . . . . . . . . . . . . . . . . — 18 344 — 362
Total Liabilities . . . . . . . . . . . . . . . . . . . . . 1,630 14,456 8,510 (15,473) 9,123
Total Shareholders’ Equity . . . . . . . . . . . . . 8,485 10,053 19,425 (29,478) 8,485
Total Liabilities and Shareholders’ Equity . . $10,115 $24,509 $27,935 $(44,951) $17,608
97
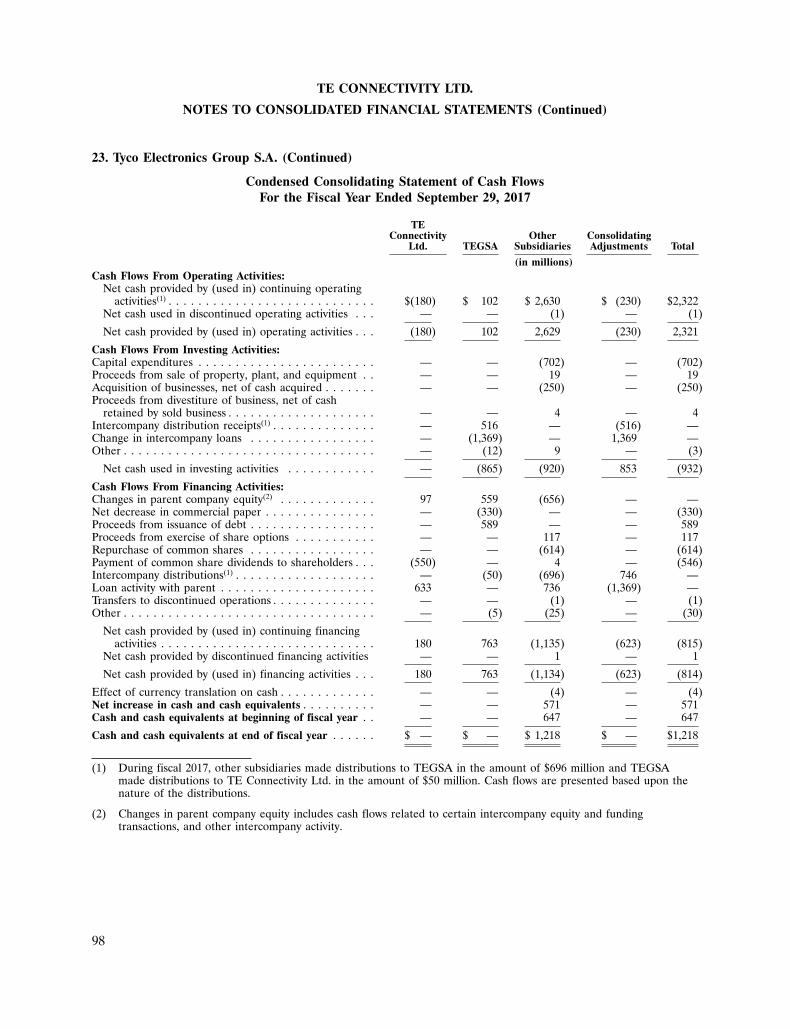
98
TE CONNECTIVITY LTD.
NOTES TO CONSOLIDATED FINANCIAL STATEMENTS (Continued)
23. Tyco Electronics Group S.A. (Continued)
Condensed Consolidating Statement of Cash FlowsFor the Fiscal Year Ended September 29, 2017
TEConnectivity Other Consolidating
Ltd. TEGSA Subsidiaries Adjustments Total
(in millions)Cash Flows From Operating Activities:
Net cash provided by (used in) continuing operatingactivities(1) . . . . . . . . . . . . . . . . . . . . . . . . . . . . $(180) $ 102 $ 2,630 $ (230) $2,322
Net cash used in discontinued operating activities . . . — — (1) — (1)
Net cash provided by (used in) operating activities . . . (180) 102 2,629 (230) 2,321
Cash Flows From Investing Activities:Capital expenditures . . . . . . . . . . . . . . . . . . . . . . . . — — (702) — (702)Proceeds from sale of property, plant, and equipment . . — — 19 — 19Acquisition of businesses, net of cash acquired . . . . . . . — — (250) — (250)Proceeds from divestiture of business, net of cash
retained by sold business . . . . . . . . . . . . . . . . . . . . — — 4 — 4Intercompany distribution receipts(1) . . . . . . . . . . . . . . — 516 — (516) —Change in intercompany loans . . . . . . . . . . . . . . . . . — (1,369) — 1,369 —Other . . . . . . . . . . . . . . . . . . . . . . . . . . . . . . . . . . — (12) 9 — (3)
Net cash used in investing activities . . . . . . . . . . . . — (865) (920) 853 (932)
Cash Flows From Financing Activities:Changes in parent company equity(2) . . . . . . . . . . . . . 97 559 (656) — —Net decrease in commercial paper . . . . . . . . . . . . . . . — (330) — — (330)Proceeds from issuance of debt . . . . . . . . . . . . . . . . . — 589 — — 589Proceeds from exercise of share options . . . . . . . . . . . — — 117 — 117Repurchase of common shares . . . . . . . . . . . . . . . . . — — (614) — (614)Payment of common share dividends to shareholders . . . (550) — 4 — (546)Intercompany distributions(1) . . . . . . . . . . . . . . . . . . . — (50) (696) 746 —Loan activity with parent . . . . . . . . . . . . . . . . . . . . . 633 — 736 (1,369) —Transfers to discontinued operations . . . . . . . . . . . . . . — — (1) — (1)Other . . . . . . . . . . . . . . . . . . . . . . . . . . . . . . . . . . — (5) (25) — (30)
Net cash provided by (used in) continuing financingactivities . . . . . . . . . . . . . . . . . . . . . . . . . . . . . 180 763 (1,135) (623) (815)
Net cash provided by discontinued financing activities — — 1 — 1
Net cash provided by (used in) financing activities . . . 180 763 (1,134) (623) (814)
Effect of currency translation on cash . . . . . . . . . . . . . — — (4) — (4)Net increase in cash and cash equivalents . . . . . . . . . . — — 571 — 571Cash and cash equivalents at beginning of fiscal year . . — — 647 — 647
Cash and cash equivalents at end of fiscal year . . . . . . $ — $ — $ 1,218 $ — $1,218
(1) During fiscal 2017, other subsidiaries made distributions to TEGSA in the amount of $696 million and TEGSAmade distributions to TE Connectivity Ltd. in the amount of $50 million. Cash flows are presented based upon thenature of the distributions.
(2) Changes in parent company equity includes cash flows related to certain intercompany equity and fundingtransactions, and other intercompany activity.
98
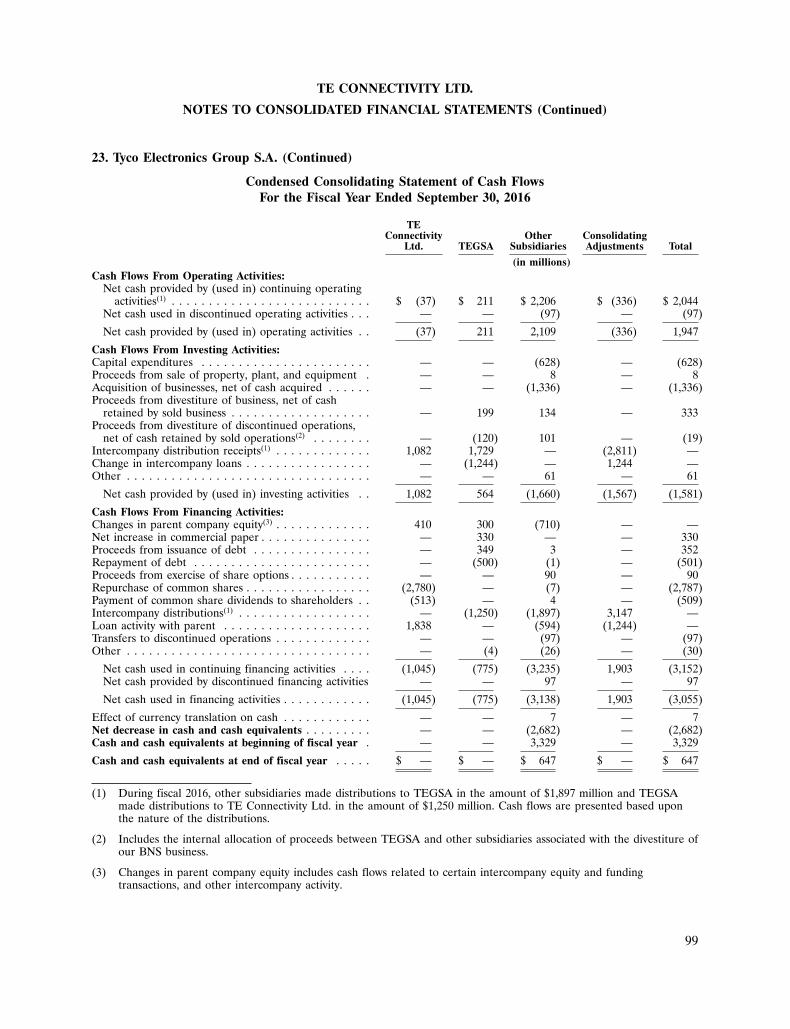
99
TE CONNECTIVITY LTD.
NOTES TO CONSOLIDATED FINANCIAL STATEMENTS (Continued)
23. Tyco Electronics Group S.A. (Continued)
Condensed Consolidating Statement of Cash FlowsFor the Fiscal Year Ended September 30, 2016
TEConnectivity Other Consolidating
Ltd. TEGSA Subsidiaries Adjustments Total
(in millions)Cash Flows From Operating Activities:
Net cash provided by (used in) continuing operatingactivities(1) . . . . . . . . . . . . . . . . . . . . . . . . . . . $ (37) $ 211 $ 2,206 $ (336) $ 2,044
Net cash used in discontinued operating activities . . . — — (97) — (97)
Net cash provided by (used in) operating activities . . (37) 211 2,109 (336) 1,947
Cash Flows From Investing Activities:Capital expenditures . . . . . . . . . . . . . . . . . . . . . . . — — (628) — (628)Proceeds from sale of property, plant, and equipment . — — 8 — 8Acquisition of businesses, net of cash acquired . . . . . . — — (1,336) — (1,336)Proceeds from divestiture of business, net of cash
retained by sold business . . . . . . . . . . . . . . . . . . . — 199 134 — 333Proceeds from divestiture of discontinued operations,
net of cash retained by sold operations(2) . . . . . . . . — (120) 101 — (19)Intercompany distribution receipts(1) . . . . . . . . . . . . . 1,082 1,729 — (2,811) —Change in intercompany loans . . . . . . . . . . . . . . . . . — (1,244) — 1,244 —Other . . . . . . . . . . . . . . . . . . . . . . . . . . . . . . . . . — — 61 — 61
Net cash provided by (used in) investing activities . . 1,082 564 (1,660) (1,567) (1,581)
Cash Flows From Financing Activities:Changes in parent company equity(3) . . . . . . . . . . . . . 410 300 (710) — —Net increase in commercial paper . . . . . . . . . . . . . . . — 330 — — 330Proceeds from issuance of debt . . . . . . . . . . . . . . . . — 349 3 — 352Repayment of debt . . . . . . . . . . . . . . . . . . . . . . . . — (500) (1) — (501)Proceeds from exercise of share options . . . . . . . . . . . — — 90 — 90Repurchase of common shares . . . . . . . . . . . . . . . . . (2,780) — (7) — (2,787)Payment of common share dividends to shareholders . . (513) — 4 — (509)Intercompany distributions(1) . . . . . . . . . . . . . . . . . . — (1,250) (1,897) 3,147 —Loan activity with parent . . . . . . . . . . . . . . . . . . . . 1,838 — (594) (1,244) —Transfers to discontinued operations . . . . . . . . . . . . . — — (97) — (97)Other . . . . . . . . . . . . . . . . . . . . . . . . . . . . . . . . . — (4) (26) — (30)
Net cash used in continuing financing activities . . . . (1,045) (775) (3,235) 1,903 (3,152)Net cash provided by discontinued financing activities — — 97 — 97
Net cash used in financing activities . . . . . . . . . . . . (1,045) (775) (3,138) 1,903 (3,055)
Effect of currency translation on cash . . . . . . . . . . . . — — 7 — 7Net decrease in cash and cash equivalents . . . . . . . . . — — (2,682) — (2,682)Cash and cash equivalents at beginning of fiscal year . — — 3,329 — 3,329
Cash and cash equivalents at end of fiscal year . . . . . $ — $ — $ 647 $ — $ 647
(1) During fiscal 2016, other subsidiaries made distributions to TEGSA in the amount of $1,897 million and TEGSAmade distributions to TE Connectivity Ltd. in the amount of $1,250 million. Cash flows are presented based uponthe nature of the distributions.
(2) Includes the internal allocation of proceeds between TEGSA and other subsidiaries associated with the divestiture ofour BNS business.
(3) Changes in parent company equity includes cash flows related to certain intercompany equity and fundingtransactions, and other intercompany activity.
99
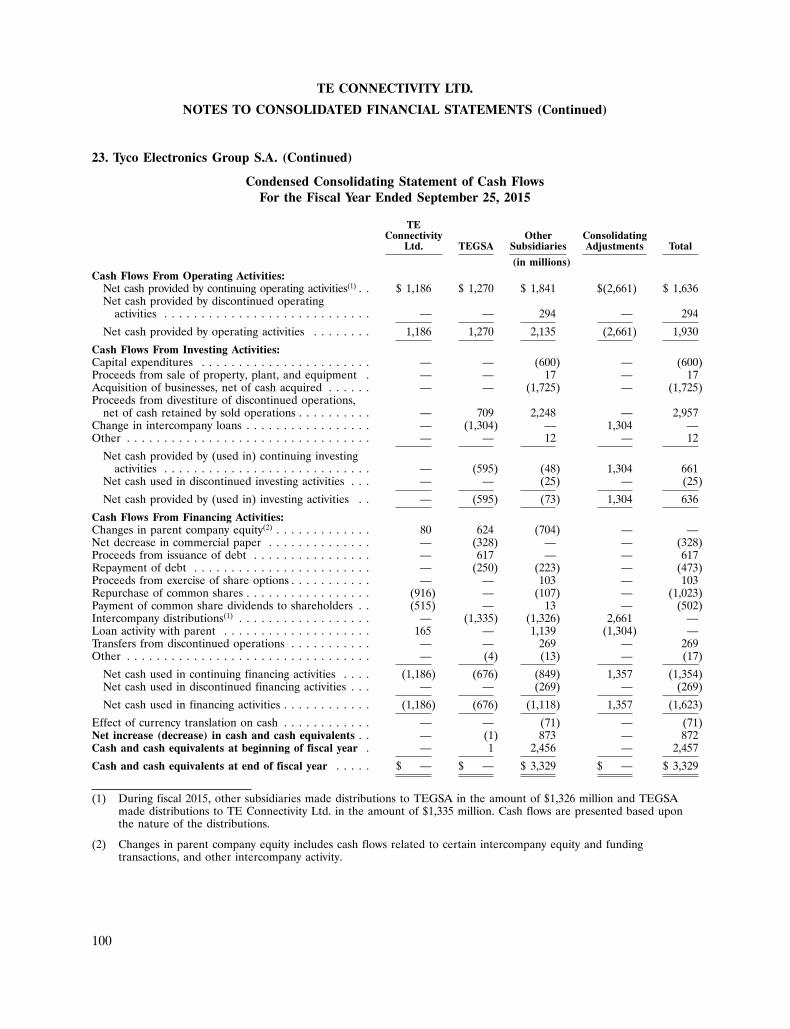
100
TE CONNECTIVITY LTD.
NOTES TO CONSOLIDATED FINANCIAL STATEMENTS (Continued)
23. Tyco Electronics Group S.A. (Continued)
Condensed Consolidating Statement of Cash FlowsFor the Fiscal Year Ended September 25, 2015
TEConnectivity Other Consolidating
Ltd. TEGSA Subsidiaries Adjustments Total
(in millions)Cash Flows From Operating Activities:
Net cash provided by continuing operating activities(1) . . $ 1,186 $ 1,270 $ 1,841 $(2,661) $ 1,636Net cash provided by discontinued operating
activities . . . . . . . . . . . . . . . . . . . . . . . . . . . . — — 294 — 294
Net cash provided by operating activities . . . . . . . . 1,186 1,270 2,135 (2,661) 1,930
Cash Flows From Investing Activities:Capital expenditures . . . . . . . . . . . . . . . . . . . . . . . — — (600) — (600)Proceeds from sale of property, plant, and equipment . — — 17 — 17Acquisition of businesses, net of cash acquired . . . . . . — — (1,725) — (1,725)Proceeds from divestiture of discontinued operations,
net of cash retained by sold operations . . . . . . . . . . — 709 2,248 — 2,957Change in intercompany loans . . . . . . . . . . . . . . . . . — (1,304) — 1,304 —Other . . . . . . . . . . . . . . . . . . . . . . . . . . . . . . . . . — — 12 — 12
Net cash provided by (used in) continuing investingactivities . . . . . . . . . . . . . . . . . . . . . . . . . . . . — (595) (48) 1,304 661
Net cash used in discontinued investing activities . . . — — (25) — (25)
Net cash provided by (used in) investing activities . . — (595) (73) 1,304 636
Cash Flows From Financing Activities:Changes in parent company equity(2) . . . . . . . . . . . . . 80 624 (704) — —Net decrease in commercial paper . . . . . . . . . . . . . . — (328) — — (328)Proceeds from issuance of debt . . . . . . . . . . . . . . . . — 617 — — 617Repayment of debt . . . . . . . . . . . . . . . . . . . . . . . . — (250) (223) — (473)Proceeds from exercise of share options . . . . . . . . . . . — — 103 — 103Repurchase of common shares . . . . . . . . . . . . . . . . . (916) — (107) — (1,023)Payment of common share dividends to shareholders . . (515) — 13 — (502)Intercompany distributions(1) . . . . . . . . . . . . . . . . . . — (1,335) (1,326) 2,661 —Loan activity with parent . . . . . . . . . . . . . . . . . . . . 165 — 1,139 (1,304) —Transfers from discontinued operations . . . . . . . . . . . — — 269 — 269Other . . . . . . . . . . . . . . . . . . . . . . . . . . . . . . . . . — (4) (13) — (17)
Net cash used in continuing financing activities . . . . (1,186) (676) (849) 1,357 (1,354)Net cash used in discontinued financing activities . . . — — (269) — (269)
Net cash used in financing activities . . . . . . . . . . . . (1,186) (676) (1,118) 1,357 (1,623)
Effect of currency translation on cash . . . . . . . . . . . . — — (71) — (71)Net increase (decrease) in cash and cash equivalents . . — (1) 873 — 872Cash and cash equivalents at beginning of fiscal year . — 1 2,456 — 2,457
Cash and cash equivalents at end of fiscal year . . . . . $ — $ — $ 3,329 $ — $ 3,329
(1) During fiscal 2015, other subsidiaries made distributions to TEGSA in the amount of $1,326 million and TEGSAmade distributions to TE Connectivity Ltd. in the amount of $1,335 million. Cash flows are presented based uponthe nature of the distributions.
(2) Changes in parent company equity includes cash flows related to certain intercompany equity and fundingtransactions, and other intercompany activity.
100
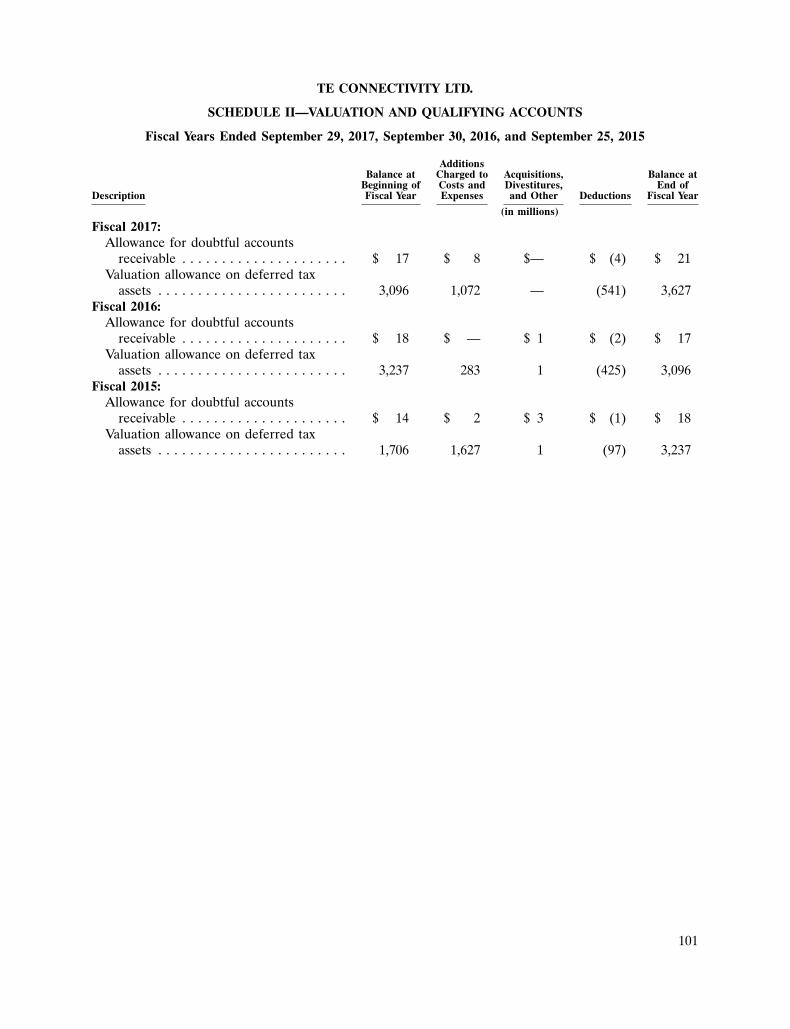
101
TE CONNECTIVITY LTD.
SCHEDULE II—VALUATION AND QUALIFYING ACCOUNTS
Fiscal Years Ended September 29, 2017, September 30, 2016, and September 25, 2015
AdditionsBalance at Charged to Acquisitions, Balance at
Beginning of Costs and Divestitures, End ofDescription Fiscal Year Expenses and Other Deductions Fiscal Year
(in millions)
Fiscal 2017:Allowance for doubtful accounts
receivable . . . . . . . . . . . . . . . . . . . . . $ 17 $ 8 $— $ (4) $ 21Valuation allowance on deferred tax
assets . . . . . . . . . . . . . . . . . . . . . . . . 3,096 1,072 — (541) 3,627Fiscal 2016:
Allowance for doubtful accountsreceivable . . . . . . . . . . . . . . . . . . . . . $ 18 $ — $ 1 $ (2) $ 17
Valuation allowance on deferred taxassets . . . . . . . . . . . . . . . . . . . . . . . . 3,237 283 1 (425) 3,096
Fiscal 2015:Allowance for doubtful accounts
receivable . . . . . . . . . . . . . . . . . . . . . $ 14 $ 2 $ 3 $ (1) $ 18Valuation allowance on deferred tax
assets . . . . . . . . . . . . . . . . . . . . . . . . 1,706 1,627 1 (97) 3,237
101
102
Report of the Statutory Auditor on the Consolidated Financial Statements of TE Connectivity Ltd.
To the General meeting ofTE CONNECTIVITY LTD., SCHAFFHAUSEN
Report of the Statutory Auditor on the consolidated financial statements
As Statutory Auditor, we have audited the accompanying consolidated financial statements of TEConnectivity Ltd. (the ‘‘Company’’), which comprise the consolidated balance sheet as of September 29,2017, and the consolidated statement of operations, statement of comprehensive income, statement ofshareholders’ equity, statement of cash flows and notes for the year then ended.
Board of Directors’ Responsibility
The Board of Directors is responsible for the preparation and fair presentation of the consolidatedfinancial statements in accordance with accounting principles generally accepted in the United States ofAmerica and the requirements of Swiss law. This responsibility includes designing, implementing andmaintaining an internal control system relevant to the preparation and fair presentation of consolidatedfinancial statements that are free from material misstatement, whether due to fraud or error. TheBoard of Directors is further responsible for selecting and applying appropriate accounting policies andmaking accounting estimates that are reasonable in the circumstances.
Auditor’s Responsibility
Our responsibility is to express an opinion on these consolidated financial statements based on ouraudit. We conducted our audit in accordance with Swiss law, Swiss Auditing Standards and auditingstandards generally accepted in the United States of America. Those standards require that we planand perform the audit to obtain reasonable assurance whether the consolidated financial statements arefree from material misstatement.
An audit involves performing procedures to obtain audit evidence about the amounts anddisclosures in the consolidated financial statements. The procedures selected depend on the auditor’sjudgment, including the assessment of the risks of material misstatement of the consolidated financialstatements, whether due to fraud or error. In making those risk assessments, the auditor considers theinternal control system relevant to the entity’s preparation and fair presentation of the consolidatedfinancial statements in order to design audit procedures that are appropriate in the circumstances, butnot for the purpose of expressing an opinion on the effectiveness of the entity’s internal control system.An audit also includes evaluating the appropriateness of the accounting policies used and thereasonableness of accounting estimates made, as well as evaluating the overall presentation of theconsolidated financial statements. We believe that the audit evidence we have obtained is sufficient andappropriate to provide a basis for our audit opinion.
Report on Key Audit Matters based on the circular 1/2015 of the Federal Audit Oversight Authority
Key audit matters are those matters that, in our professional judgement, were of most significancein our audit of the consolidated financial statements of the current period. These matters were
102
103
addressed in the context of our audit of the consolidated financial statements as a whole, and informing our opinion thereon, and we do not provide a separate opinion on these matters.
How the scope of our auditKey Audit Matter (KAM): responded to the key audit matters:
Goodwill Reporting Unit Fair Value Estimates We obtained an understanding of the process forhow management develops forecasts of financial
The Company reviews the carrying amount of its information, evaluated the design of, and performedreporting units annually as of the first day of the tests of controls in this area. Our proceduresfourth quarter or more frequently if impairment included a review of the valuations prepared byindicators are present. The impairment assessment management and related supporting third-partyinvolves a comparison of the estimated fair value of evidence for the fair values of each goodwilleach reporting unit to its carrying amount. reporting unit. We also evaluated management’s
ability to accurately forecast financial resultsThis annual impairment test was significant to ourthrough retrospective analysis and sensitivityaudit because the goodwill balance of $5,651 millionanalysis. Additionally, we evaluated the accountingas of September 29, 2017 is significant to theconclusion on the identification and aggregation offinancial statements representing 29% of the totalreporting units using industry information andassets. In addition, we note that management’shistorical objectively verifiable evidence.assessment process is assumption based, complex
and subject to highly judgmental estimates. We involved our Deloitte internal fair valuespecialists, who assisted us in auditing the valuationFair value estimates used in the step I goodwillassumptions within the Company’s fair valueimpairment tests are calculated using an incomeestimates, including discount rates and long-termapproach based on the present value of future cashgrowth rates in addition to valuation methodology.flows of each reporting unit. This approach
incorporates a number of assumptions includingfuture growth rates, discount rates, income tax rates,and market activity in assessing fair value and arereporting unit specific.
See Note 2 to these consolidated financialstatements for TE Connectivity’s description of theaccounting policy for Goodwill and Other IntangibleAssets.
Income Taxes (Recoverability of Deferred Tax Assets) We obtained an understanding of the process forhow management reviews the valuation allowance,
Significant judgment is involved in determining the including the Company’s estimate of projectedrecoverability of deferred tax amounts and taxable income and tax planning strategies. We willtherefore, the corresponding valuation allowance also evaluated management’s estimate as torecorded. The assessment is complex, since the projected taxable income by comparing suchCompany operates in multiple tax jurisdictions. projections to the Company’s strategic plan andFurthermore, the Company is required to record objectively verifiable information about the priorboth deferred tax assets and liabilities and estimates periods.the recoverability of its deferred tax asset positionrelated to temporary differences and the amount of We also evaluated the key assumptions withtax loss carryforwards that can be applied to future assistance of our tax specialists, including any taxtaxable income. planning strategies, used by management in their
analysis to conclude that the increase in theKey assumptions applied by the Company regarding valuation allowance recorded during the fiscal yearrecoverability of deferred tax assets relate to and that the total valuation allowance at year-end ismanagements budgets and forecasts including appropriate.applicable tax rates whether enacted or substantiallyenacted. Due to the significance of the income taxbalances and the judgment involved in determiningthese, this matter was considered significant to ouraudit. See Note 2 to these consolidated financialstatements for TE Connectivity’s description of theaccounting policy for Income Taxes.
103
104
Opinion
In our opinion, the consolidated financial statements for the year ended September 29, 2017present fairly, in all material respects, the financial position of the Company and the result of itsoperations and its cash flows in accordance with accounting principles generally accepted in the UnitedStates of America, and comply with Swiss law.
Report on Other Legal Requirements
We confirm that we meet the legal requirements on licensing according to the Auditor OversightAct (‘‘AOA’’) and independence (Article 728 Code of Obligations (‘‘CO’’) and Article 11, AOA) andthat there are no circumstances incompatible with our independence.
In accordance with Article 728a, paragraph 1, item 3, CO, and Swiss Auditing Standard 890, weconfirm that an internal control system exists, which has been designed for the preparation of theconsolidated financial statements according to the instructions of the Board of Directors. Werecommend that the consolidated financial statements submitted to you be approved.
Deloitte AG
/s/ Matthias Gschwend /s/ Dominik VoegtliLicensed Audit Expert Licensed Audit ExpertAuditor in charge
Zurich, November 14, 2017
104
105
TE CONNECTIVITY LTD.
INDEX TO SWISS STATUTORY FINANCIAL STATEMENTS
Page
Statements of Operations for the Fiscal Years Ended September 29, 2017 and September 30,2016 . . . . . . . . . . . . . . . . . . . . . . . . . . . . . . . . . . . . . . . . . . . . . . . . . . . . . . . . . . . . . . . . . . 106
Balance Sheets as of September 29, 2017 and September 30, 2016 . . . . . . . . . . . . . . . . . . . . . . . 107Notes to Swiss Statutory Financial Statements . . . . . . . . . . . . . . . . . . . . . . . . . . . . . . . . . . . . . . 108Proposed Appropriation of Available Earnings . . . . . . . . . . . . . . . . . . . . . . . . . . . . . . . . . . . . . 118Report of the Statutory Auditor on the Swiss Statutory Financial Statements of TE
Connectivity Ltd. . . . . . . . . . . . . . . . . . . . . . . . . . . . . . . . . . . . . . . . . . . . . . . . . . . . . . . . . . 119
105
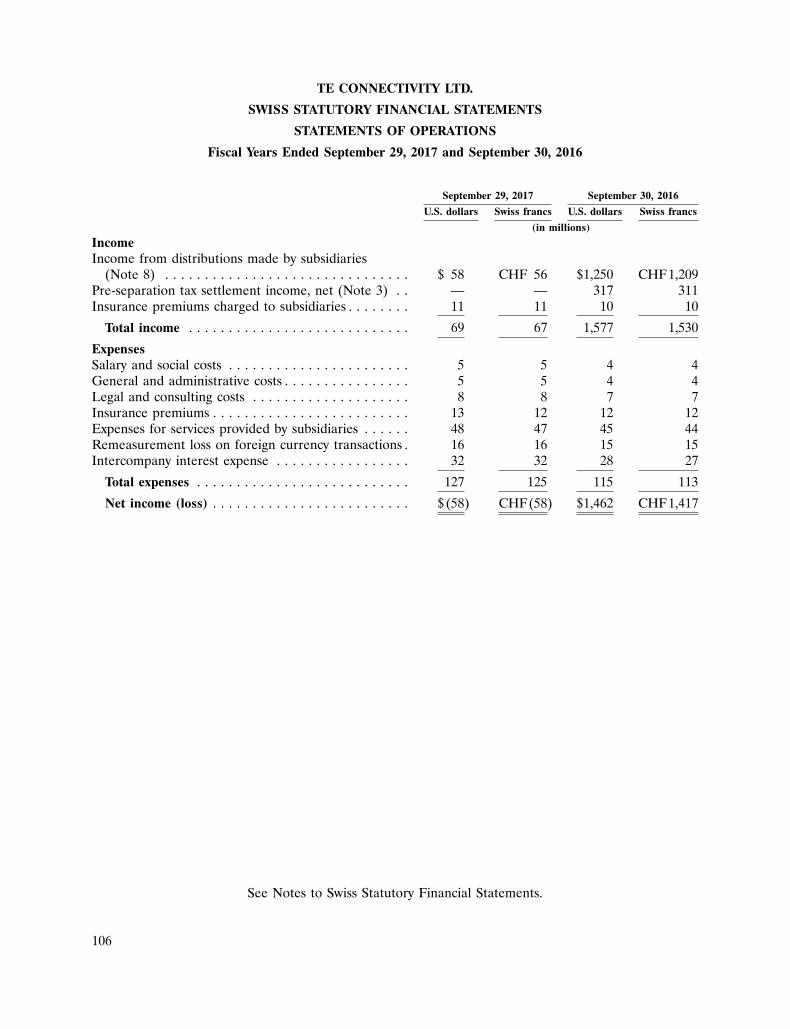
106
TE CONNECTIVITY LTD.
SWISS STATUTORY FINANCIAL STATEMENTS
STATEMENTS OF OPERATIONS
Fiscal Years Ended September 29, 2017 and September 30, 2016
September 29, 2017 September 30, 2016
U.S. dollars Swiss francs U.S. dollars Swiss francs
(in millions)
IncomeIncome from distributions made by subsidiaries
(Note 8) . . . . . . . . . . . . . . . . . . . . . . . . . . . . . . . $ 58 CHF 56 $1,250 CHF1,209Pre-separation tax settlement income, net (Note 3) . . — — 317 311Insurance premiums charged to subsidiaries . . . . . . . . 11 11 10 10
Total income . . . . . . . . . . . . . . . . . . . . . . . . . . . . 69 67 1,577 1,530
ExpensesSalary and social costs . . . . . . . . . . . . . . . . . . . . . . . 5 5 4 4General and administrative costs . . . . . . . . . . . . . . . . 5 5 4 4Legal and consulting costs . . . . . . . . . . . . . . . . . . . . 8 8 7 7Insurance premiums . . . . . . . . . . . . . . . . . . . . . . . . . 13 12 12 12Expenses for services provided by subsidiaries . . . . . . 48 47 45 44Remeasurement loss on foreign currency transactions . 16 16 15 15Intercompany interest expense . . . . . . . . . . . . . . . . . 32 32 28 27
Total expenses . . . . . . . . . . . . . . . . . . . . . . . . . . . 127 125 115 113
Net income (loss) . . . . . . . . . . . . . . . . . . . . . . . . . $ (58) CHF(58) $1,462 CHF1,417
See Notes to Swiss Statutory Financial Statements.
106
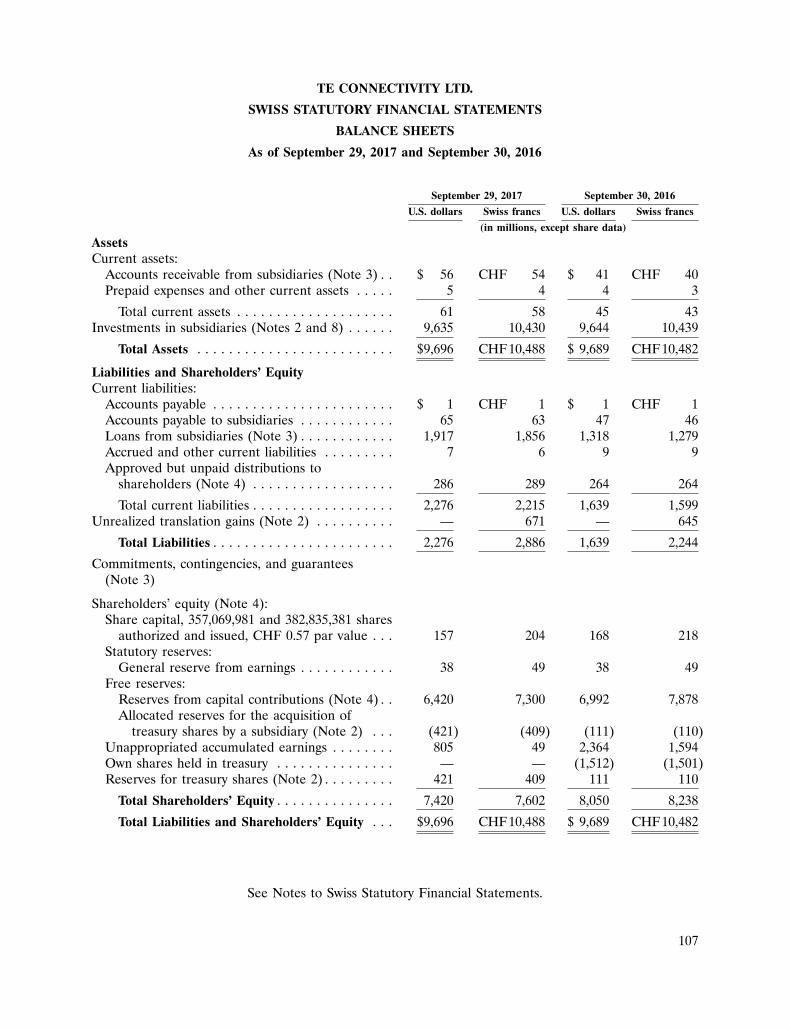
107
TE CONNECTIVITY LTD.
SWISS STATUTORY FINANCIAL STATEMENTS
BALANCE SHEETS
As of September 29, 2017 and September 30, 2016
September 29, 2017 September 30, 2016
U.S. dollars Swiss francs U.S. dollars Swiss francs
(in millions, except share data)
AssetsCurrent assets:
Accounts receivable from subsidiaries (Note 3) . . $ 56 CHF 54 $ 41 CHF 40Prepaid expenses and other current assets . . . . . 5 4 4 3
Total current assets . . . . . . . . . . . . . . . . . . . . 61 58 45 43Investments in subsidiaries (Notes 2 and 8) . . . . . . 9,635 10,430 9,644 10,439
Total Assets . . . . . . . . . . . . . . . . . . . . . . . . . $9,696 CHF10,488 $ 9,689 CHF10,482
Liabilities and Shareholders’ EquityCurrent liabilities:
Accounts payable . . . . . . . . . . . . . . . . . . . . . . . $ 1 CHF 1 $ 1 CHF 1Accounts payable to subsidiaries . . . . . . . . . . . . 65 63 47 46Loans from subsidiaries (Note 3) . . . . . . . . . . . . 1,917 1,856 1,318 1,279Accrued and other current liabilities . . . . . . . . . 7 6 9 9Approved but unpaid distributions to
shareholders (Note 4) . . . . . . . . . . . . . . . . . . 286 289 264 264
Total current liabilities . . . . . . . . . . . . . . . . . . 2,276 2,215 1,639 1,599Unrealized translation gains (Note 2) . . . . . . . . . . — 671 — 645
Total Liabilities . . . . . . . . . . . . . . . . . . . . . . . 2,276 2,886 1,639 2,244
Commitments, contingencies, and guarantees(Note 3)
Shareholders’ equity (Note 4):Share capital, 357,069,981 and 382,835,381 shares
authorized and issued, CHF 0.57 par value . . . 157 204 168 218Statutory reserves:
General reserve from earnings . . . . . . . . . . . . 38 49 38 49Free reserves:
Reserves from capital contributions (Note 4) . . 6,420 7,300 6,992 7,878Allocated reserves for the acquisition of
treasury shares by a subsidiary (Note 2) . . . (421) (409) (111) (110)Unappropriated accumulated earnings . . . . . . . . 805 49 2,364 1,594Own shares held in treasury . . . . . . . . . . . . . . . — — (1,512) (1,501)Reserves for treasury shares (Note 2) . . . . . . . . . 421 409 111 110
Total Shareholders’ Equity . . . . . . . . . . . . . . . 7,420 7,602 8,050 8,238
Total Liabilities and Shareholders’ Equity . . . $9,696 CHF10,488 $ 9,689 CHF10,482
See Notes to Swiss Statutory Financial Statements.
107
108
TE CONNECTIVITY LTD.
NOTES TO SWISS STATUTORY FINANCIAL STATEMENTS
1. Basis of Presentation
TE Connectivity Ltd. (‘‘TE Connectivity’’ or the ‘‘Company,’’ which may be referred to as ‘‘we,’’‘‘us,’’ or ‘‘our’’), incorporated in Schaffhausen, Switzerland, is the ultimate holding company of TEConnectivity Ltd. and its subsidiaries (the ‘‘TE Group’’) with a listing on the New York StockExchange. We employed less than 10 full time positions during the fiscal years ended September 29,2017 and September 30, 2016. For additional information on the TE Group, see our annual report onForm 10-K filed with the United States (‘‘U.S.’’) Securities and Exchange Commission (‘‘SEC’’) for thefiscal year ended September 29, 2017.
The accompanying statements of operations reflect the results of operations for the fiscal yearsended September 29, 2017 and September 30, 2016, and have been prepared in accordance with therequirements of Swiss law for companies, the Swiss Code of Obligations. The financial statementspresent the results of the holding company on a stand-alone basis and do not represent theconsolidated operations of the TE Group.
Fiscal Year
Unless otherwise indicated, references in the financial statements to fiscal 2017 and fiscal 2016 areto our fiscal years ended September 29, 2017 and September 30, 2016. We have a 52- or 53-week fiscalyear that ends on the last Friday of September. Fiscal 2017 was a 52-week year and fiscal 2016 was a53-week year.
2. Summary of Significant Accounting Policies
Currency Translation
Our functional currency is the U.S. dollar. We present our financial statements in both U.S. dollarsand Swiss francs (‘‘CHF’’). Assets and liabilities in U.S. dollars are converted to Swiss francs forpresentation purposes using historical foreign exchange rates (for investments in subsidiaries, sharesheld in treasury, approved but unpaid distributions to shareholders payable, and equity accounts) andcurrent foreign exchange rates (for all other assets and liabilities; at fiscal year end 2017 and 2016,exchange rates were CHF 0.9681:$1 and CHF 0.9694:$1, respectively). Revenue and expenses, excludingincome from distributions made by a subsidiary, are translated using the average exchange rates ineffect for the period presented (exchange rates were CHF 0.9880:$1 and CHF 0.9823:$1 for fiscal 2017and 2016, respectively). Income from distributions made by a subsidiary is translated using the exchangerate in effect on the date that each distribution was made to us. Net unrealized foreign currencytranslation gains are deferred in the balance sheets, while unrealized translation losses and realizedtransactional gains and losses are reflected in the statements of operations. We consider all foreigncurrency transactional gains and losses associated with current assets and liabilities to be realized.
Own Shares Held in Treasury and Allocated Reserves for the Acquisition of Treasury Shares by aSubsidiary
Shares held in treasury that are directly owned by us are recorded at historical cost and presentedas reductions to equity on our balance sheets. Our reserves for treasury shares reflects all treasuryshares held by a subsidiary and is recorded at historical cost.
As management deems appropriate, we can establish reserves for treasury shares by chargingeither accumulated earnings or allocated reserves for the acquisition of treasury shares by a subsidiary.
108
109
TE CONNECTIVITY LTD.
NOTES TO SWISS STATUTORY FINANCIAL STATEMENTS (Continued)
2. Summary of Significant Accounting Policies (Continued)
During fiscal 2017 and 2016, allocated reserves for the acquisition of treasury shares by a subsidiarywere charged to establish reserves. As shares acquired by a subsidiary are re-issued for use in share-based compensation arrangements, we credit the same account impacted by initial acquisition.
Investments in Subsidiaries and Income from Distributions Made by a Subsidiary
Investments in subsidiaries are equity interests held on a long-term basis for the purpose of ourbusiness activities. Investments in subsidiaries are carried at a value no higher than cost lessadjustments for impairment.
Salaries and Social Costs
Salaries and social costs include cash and equity compensation paid to our directors.
3. Commitments, Contingencies, and Guarantees
Affiliated Debt and Loans Receivable
We utilize a cash pooling relationship with a wholly-owned subsidiary (the ‘‘Cash Pool’’). The CashPool does not have an expiration date and accrues interest based on LIBOR. At September 29, 2017,we had a Cash Pool asset and Cash Pool liability of CHF 3 million (equivalent to $3 million) andCHF 1,547 million (equivalent to $1,598 million), respectively, that were included in accounts receivablefrom subsidiaries and loans from subsidiaries, respectively, on our balance sheet. At September 30,2016, we had a Cash Pool asset and Cash Pool liability of CHF 3 million (equivalent to $3 million) andCHF 1,001 million (equivalent to $1,033 million), respectively, that were included in accounts receivablefrom subsidiaries and loans from subsidiaries, respectively, on our balance sheet.
In order to minimize currency exposure related to distributions to shareholders approved in Swissfrancs and paid in U.S. dollars, we enter into arrangements with a wholly-owned subsidiary in which weborrow Swiss francs from, and simultaneously loan U.S. dollars to, the subsidiary. As distributions toshareholders are paid, both the borrowing and the loan receivable are partially settled. As ofSeptember 29, 2017 and September 30, 2016, the borrowing totaled CHF 309 million (equivalent to$319 million) and CHF 278 million (equivalent to $287 million), respectively, and was reflected as loansfrom subsidiaries on our balance sheets. At September 29, 2017 and September 30, 2016, the relatedloan receivable, which approximates the borrowing, was included in the net Cash Pool liability reflectedin loans from subsidiaries on our balance sheets.
We have fully and unconditionally guaranteed the debt of a subsidiary, Tyco ElectronicsGroup S.A., totaling CHF 4,173 million (equivalent to $4,356 million) and CHF 3,961 million(equivalent to $4,086 million) at September 29, 2017 and September 30, 2016, respectively. As ofSeptember 29, 2017, we have not been required to perform on our guarantee.
Tax Sharing Agreement
We are a party to the Tax Sharing Agreement (‘‘TSA’’) with Tyco International plc (‘‘TycoInternational,’’ which now operates as part of Johnson Controls International plc) and Covidien plc(‘‘Covidien,’’ which now operates as part of Medtronic plc), under which we share responsibility forcertain of our, Tyco International’s, and Covidien’s income tax liabilities based on a sharing formula forperiods prior to and including June 29, 2007. We, Tyco International, and Covidien share 31%, 27%,
109
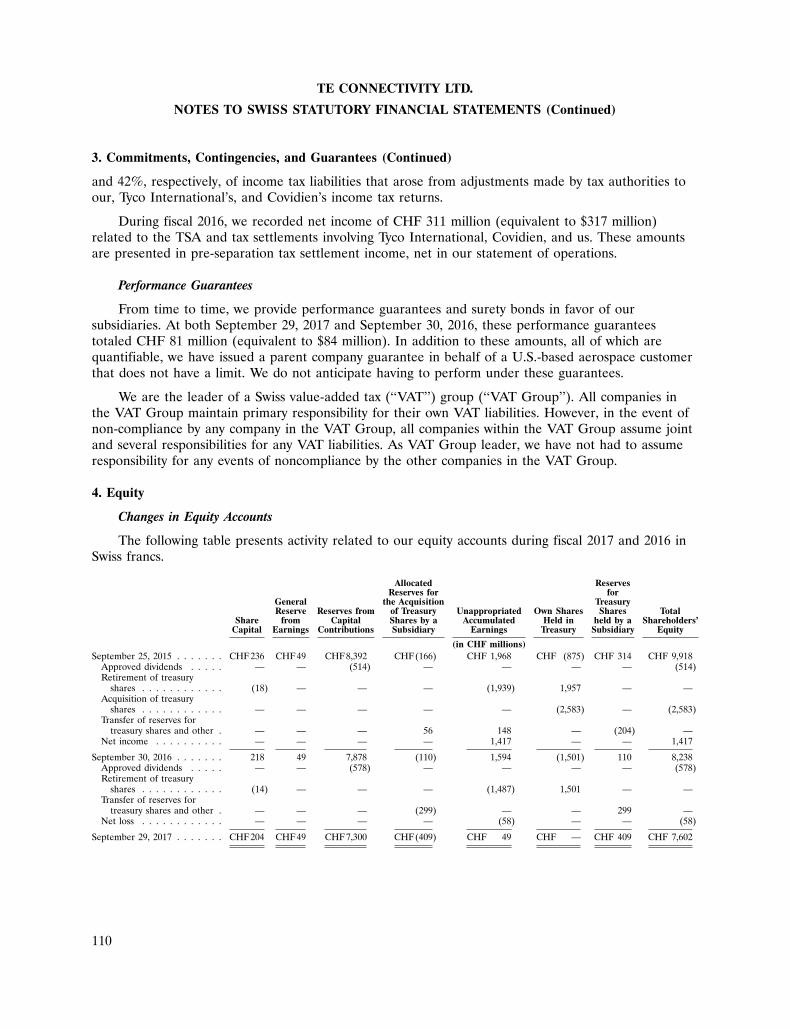
110
TE CONNECTIVITY LTD.
NOTES TO SWISS STATUTORY FINANCIAL STATEMENTS (Continued)
3. Commitments, Contingencies, and Guarantees (Continued)
and 42%, respectively, of income tax liabilities that arose from adjustments made by tax authorities toour, Tyco International’s, and Covidien’s income tax returns.
During fiscal 2016, we recorded net income of CHF 311 million (equivalent to $317 million)related to the TSA and tax settlements involving Tyco International, Covidien, and us. These amountsare presented in pre-separation tax settlement income, net in our statement of operations.
Performance Guarantees
From time to time, we provide performance guarantees and surety bonds in favor of oursubsidiaries. At both September 29, 2017 and September 30, 2016, these performance guaranteestotaled CHF 81 million (equivalent to $84 million). In addition to these amounts, all of which arequantifiable, we have issued a parent company guarantee in behalf of a U.S.-based aerospace customerthat does not have a limit. We do not anticipate having to perform under these guarantees.
We are the leader of a Swiss value-added tax (‘‘VAT’’) group (‘‘VAT Group’’). All companies inthe VAT Group maintain primary responsibility for their own VAT liabilities. However, in the event ofnon-compliance by any company in the VAT Group, all companies within the VAT Group assume jointand several responsibilities for any VAT liabilities. As VAT Group leader, we have not had to assumeresponsibility for any events of noncompliance by the other companies in the VAT Group.
4. Equity
Changes in Equity Accounts
The following table presents activity related to our equity accounts during fiscal 2017 and 2016 inSwiss francs.
Allocated ReservesReserves for for
General the Acquisition TreasuryReserve Reserves from of Treasury Unappropriated Own Shares Shares Total
Share from Capital Shares by a Accumulated Held in held by a Shareholders’Capital Earnings Contributions Subsidiary Earnings Treasury Subsidiary Equity
(in CHF millions)September 25, 2015 . . . . . . . CHF236 CHF49 CHF8,392 CHF(166) CHF 1,968 CHF (875) CHF 314 CHF 9,918
Approved dividends . . . . . — — (514) — — — — (514)Retirement of treasury
shares . . . . . . . . . . . . (18) — — — (1,939) 1,957 — —Acquisition of treasury
shares . . . . . . . . . . . . — — — — — (2,583) — (2,583)Transfer of reserves for
treasury shares and other . — — — 56 148 — (204) —Net income . . . . . . . . . . — — — — 1,417 — — 1,417
September 30, 2016 . . . . . . . 218 49 7,878 (110) 1,594 (1,501) 110 8,238Approved dividends . . . . . — — (578) — — — — (578)Retirement of treasury
shares . . . . . . . . . . . . (14) — — — (1,487) 1,501 — —Transfer of reserves for
treasury shares and other . — — — (299) — — 299 —Net loss . . . . . . . . . . . . — — — — (58) — — (58)
September 29, 2017 . . . . . . . CHF204 CHF49 CHF7,300 CHF(409) CHF 49 CHF — CHF 409 CHF 7,602
110
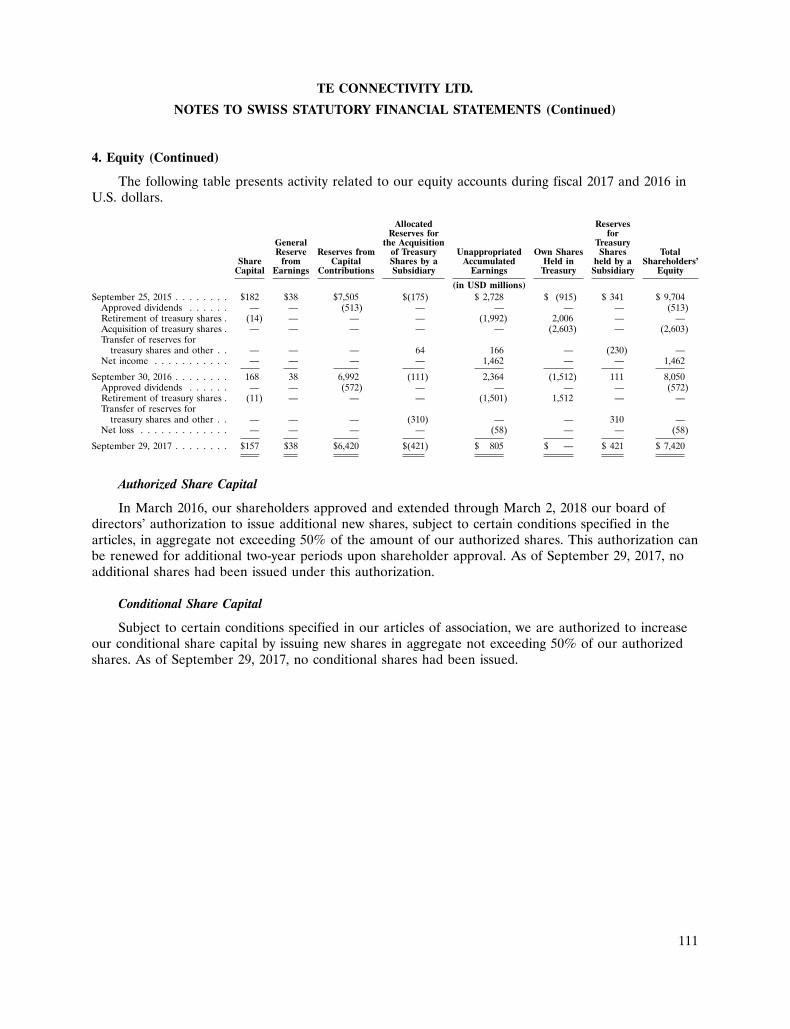
111
TE CONNECTIVITY LTD.
NOTES TO SWISS STATUTORY FINANCIAL STATEMENTS (Continued)
4. Equity (Continued)
The following table presents activity related to our equity accounts during fiscal 2017 and 2016 inU.S. dollars.
Allocated ReservesReserves for for
General the Acquisition TreasuryReserve Reserves from of Treasury Unappropriated Own Shares Shares Total
Share from Capital Shares by a Accumulated Held in held by a Shareholders’Capital Earnings Contributions Subsidiary Earnings Treasury Subsidiary Equity
(in USD millions)September 25, 2015 . . . . . . . . $182 $38 $7,505 $(175) $ 2,728 $ (915) $ 341 $ 9,704
Approved dividends . . . . . . — — (513) — — — — (513)Retirement of treasury shares . (14) — — — (1,992) 2,006 — —Acquisition of treasury shares . — — — — — (2,603) — (2,603)Transfer of reserves for
treasury shares and other . . — — — 64 166 — (230) —Net income . . . . . . . . . . . — — — — 1,462 — — 1,462
September 30, 2016 . . . . . . . . 168 38 6,992 (111) 2,364 (1,512) 111 8,050Approved dividends . . . . . . — — (572) — — — — (572)Retirement of treasury shares . (11) — — — (1,501) 1,512 — —Transfer of reserves for
treasury shares and other . . — — — (310) — — 310 —Net loss . . . . . . . . . . . . . — — — — (58) — — (58)
September 29, 2017 . . . . . . . . $157 $38 $6,420 $(421) $ 805 $ — $ 421 $ 7,420
Authorized Share Capital
In March 2016, our shareholders approved and extended through March 2, 2018 our board ofdirectors’ authorization to issue additional new shares, subject to certain conditions specified in thearticles, in aggregate not exceeding 50% of the amount of our authorized shares. This authorization canbe renewed for additional two-year periods upon shareholder approval. As of September 29, 2017, noadditional shares had been issued under this authorization.
Conditional Share Capital
Subject to certain conditions specified in our articles of association, we are authorized to increaseour conditional share capital by issuing new shares in aggregate not exceeding 50% of our authorizedshares. As of September 29, 2017, no conditional shares had been issued.
111
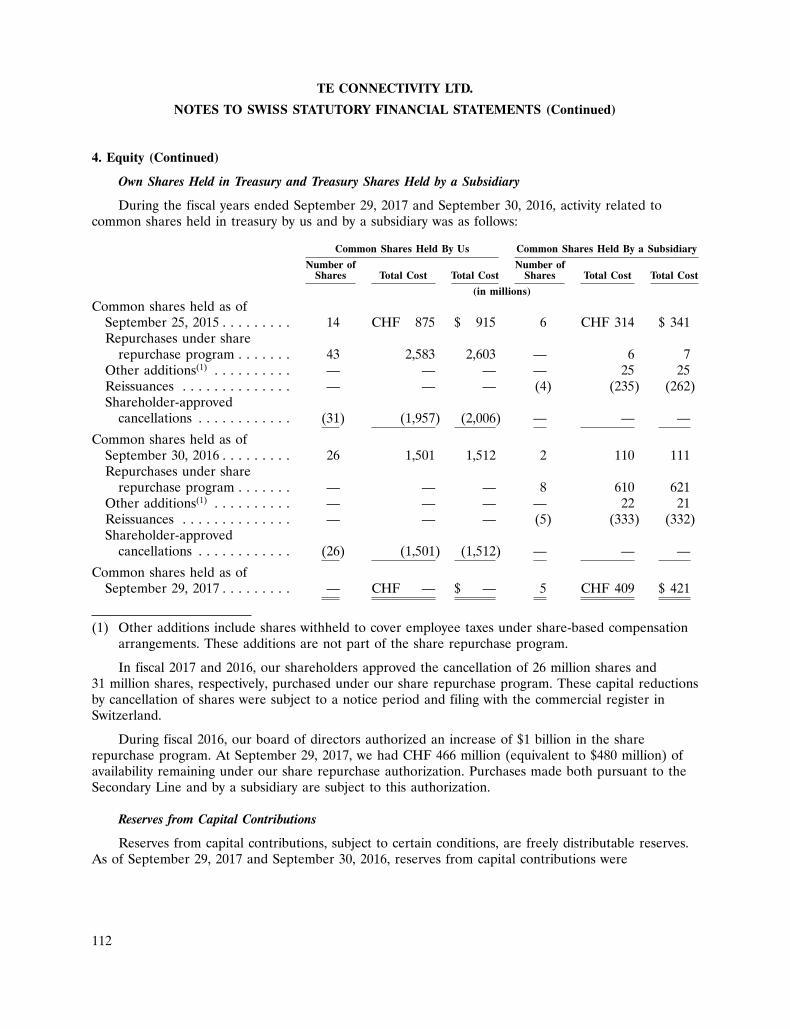
112
TE CONNECTIVITY LTD.
NOTES TO SWISS STATUTORY FINANCIAL STATEMENTS (Continued)
4. Equity (Continued)
Own Shares Held in Treasury and Treasury Shares Held by a Subsidiary
During the fiscal years ended September 29, 2017 and September 30, 2016, activity related tocommon shares held in treasury by us and by a subsidiary was as follows:
Common Shares Held By Us Common Shares Held By a Subsidiary
Number of Number ofShares Total Cost Total Cost Shares Total Cost Total Cost
(in millions)
Common shares held as ofSeptember 25, 2015 . . . . . . . . . 14 CHF 875 $ 915 6 CHF 314 $ 341Repurchases under share
repurchase program . . . . . . . 43 2,583 2,603 — 6 7Other additions(1) . . . . . . . . . . — — — — 25 25Reissuances . . . . . . . . . . . . . . — — — (4) (235) (262)Shareholder-approved
cancellations . . . . . . . . . . . . (31) (1,957) (2,006) — — —
Common shares held as ofSeptember 30, 2016 . . . . . . . . . 26 1,501 1,512 2 110 111Repurchases under share
repurchase program . . . . . . . — — — 8 610 621Other additions(1) . . . . . . . . . . — — — — 22 21Reissuances . . . . . . . . . . . . . . — — — (5) (333) (332)Shareholder-approved
cancellations . . . . . . . . . . . . (26) (1,501) (1,512) — — —
Common shares held as ofSeptember 29, 2017 . . . . . . . . . — CHF — $ — 5 CHF 409 $ 421
(1) Other additions include shares withheld to cover employee taxes under share-based compensationarrangements. These additions are not part of the share repurchase program.
In fiscal 2017 and 2016, our shareholders approved the cancellation of 26 million shares and31 million shares, respectively, purchased under our share repurchase program. These capital reductionsby cancellation of shares were subject to a notice period and filing with the commercial register inSwitzerland.
During fiscal 2016, our board of directors authorized an increase of $1 billion in the sharerepurchase program. At September 29, 2017, we had CHF 466 million (equivalent to $480 million) ofavailability remaining under our share repurchase authorization. Purchases made both pursuant to theSecondary Line and by a subsidiary are subject to this authorization.
Reserves from Capital Contributions
Reserves from capital contributions, subject to certain conditions, are freely distributable reserves.As of September 29, 2017 and September 30, 2016, reserves from capital contributions were
112
113
TE CONNECTIVITY LTD.
NOTES TO SWISS STATUTORY FINANCIAL STATEMENTS (Continued)
4. Equity (Continued)
CHF 7,300 million (equivalent to $6,420 million) and CHF 7,878 million (equivalent to $6,992 million),respectively.
General Reserve from Earnings
To comply with the Swiss Code of Obligations, 5% of annual net income must be appropriated toour general reserve until the general reserve, a non-distributable reserve, equals 20% of share capital.Our current appropriation of CHF 49 million (equivalent to $38 million) satisfies the requirements ofthe Swiss Code of Obligations with respect to the general reserve.
Dividends
Under current Swiss tax law, subject to certain conditions, dividends paid from reserves fromcapital contributions are exempt from Swiss withholding tax.
During the quarters ended December 25, 2015 and March 25, 2016, we paid the third and fourthinstallments of the dividend approved in March 2015 at a rate of $0.33 per installment.
In March 2016, our shareholders approved a dividend payment to shareholders of $1.48(equivalent to CHF 1.48, based on the exchange rate on the date of approval) per share out of reservesfrom capital contributions, payable in four quarterly installments beginning in the third quarter of fiscal2016 and ending in the second quarter of fiscal 2017. We paid the installments of the dividend at a rateof $0.37 per share during each of the quarters ended June 24, 2016, September 30, 2016, December 30,2016 and March 31, 2017.
In March 2017, our shareholders approved a dividend payment to shareholders of $1.60(equivalent to CHF 1.62, based on the exchange rate on the date of approval) per share out of reservesfrom capital contributions, payable in four quarterly installments beginning in the third quarter of fiscal2017 and ending in the second quarter of fiscal 2018. We paid the first and second installments of thedividend at a rate of $0.40 per share during each of the quarters ended June 30, 2017 andSeptember 29, 2017. We have reflected a liability related to the unpaid distributions in approved butunpaid distributions to shareholders on our balance sheets.
5. Non-Employee Director and Executive Compensation
For information regarding non-employee director and executive compensation, see our SwissStatutory Compensation Report.
6. Security Ownership of Board of Directors and Executive Officers
Board of Directors
The following table sets forth the shares, options and share units held as of September 29, 2017and September 30, 2016 by each member of our board of directors serving on our board atSeptember 29, 2017. The share ownership of Mr. Curtin, our Chief Executive Officer and a member of
113
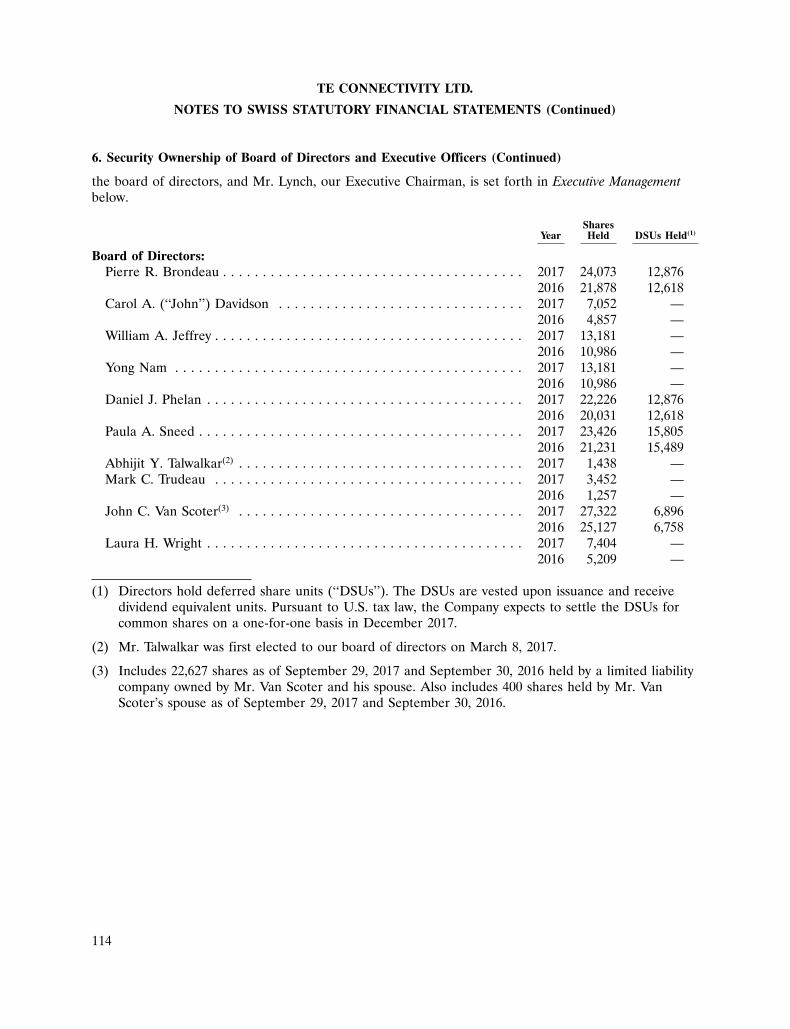
114
TE CONNECTIVITY LTD.
NOTES TO SWISS STATUTORY FINANCIAL STATEMENTS (Continued)
6. Security Ownership of Board of Directors and Executive Officers (Continued)
the board of directors, and Mr. Lynch, our Executive Chairman, is set forth in Executive Managementbelow.
SharesYear Held DSUs Held(1)
Board of Directors:Pierre R. Brondeau . . . . . . . . . . . . . . . . . . . . . . . . . . . . . . . . . . . . . . 2017 24,073 12,876
2016 21,878 12,618Carol A. (‘‘John’’) Davidson . . . . . . . . . . . . . . . . . . . . . . . . . . . . . . . 2017 7,052 —
2016 4,857 —William A. Jeffrey . . . . . . . . . . . . . . . . . . . . . . . . . . . . . . . . . . . . . . . 2017 13,181 —
2016 10,986 —Yong Nam . . . . . . . . . . . . . . . . . . . . . . . . . . . . . . . . . . . . . . . . . . . . 2017 13,181 —
2016 10,986 —Daniel J. Phelan . . . . . . . . . . . . . . . . . . . . . . . . . . . . . . . . . . . . . . . . 2017 22,226 12,876
2016 20,031 12,618Paula A. Sneed . . . . . . . . . . . . . . . . . . . . . . . . . . . . . . . . . . . . . . . . . 2017 23,426 15,805
2016 21,231 15,489Abhijit Y. Talwalkar(2) . . . . . . . . . . . . . . . . . . . . . . . . . . . . . . . . . . . . 2017 1,438 —Mark C. Trudeau . . . . . . . . . . . . . . . . . . . . . . . . . . . . . . . . . . . . . . . 2017 3,452 —
2016 1,257 —John C. Van Scoter(3) . . . . . . . . . . . . . . . . . . . . . . . . . . . . . . . . . . . . 2017 27,322 6,896
2016 25,127 6,758Laura H. Wright . . . . . . . . . . . . . . . . . . . . . . . . . . . . . . . . . . . . . . . . 2017 7,404 —
2016 5,209 —
(1) Directors hold deferred share units (‘‘DSUs’’). The DSUs are vested upon issuance and receivedividend equivalent units. Pursuant to U.S. tax law, the Company expects to settle the DSUs forcommon shares on a one-for-one basis in December 2017.
(2) Mr. Talwalkar was first elected to our board of directors on March 8, 2017.
(3) Includes 22,627 shares as of September 29, 2017 and September 30, 2016 held by a limited liabilitycompany owned by Mr. Van Scoter and his spouse. Also includes 400 shares held by Mr. VanScoter’s spouse as of September 29, 2017 and September 30, 2016.
114
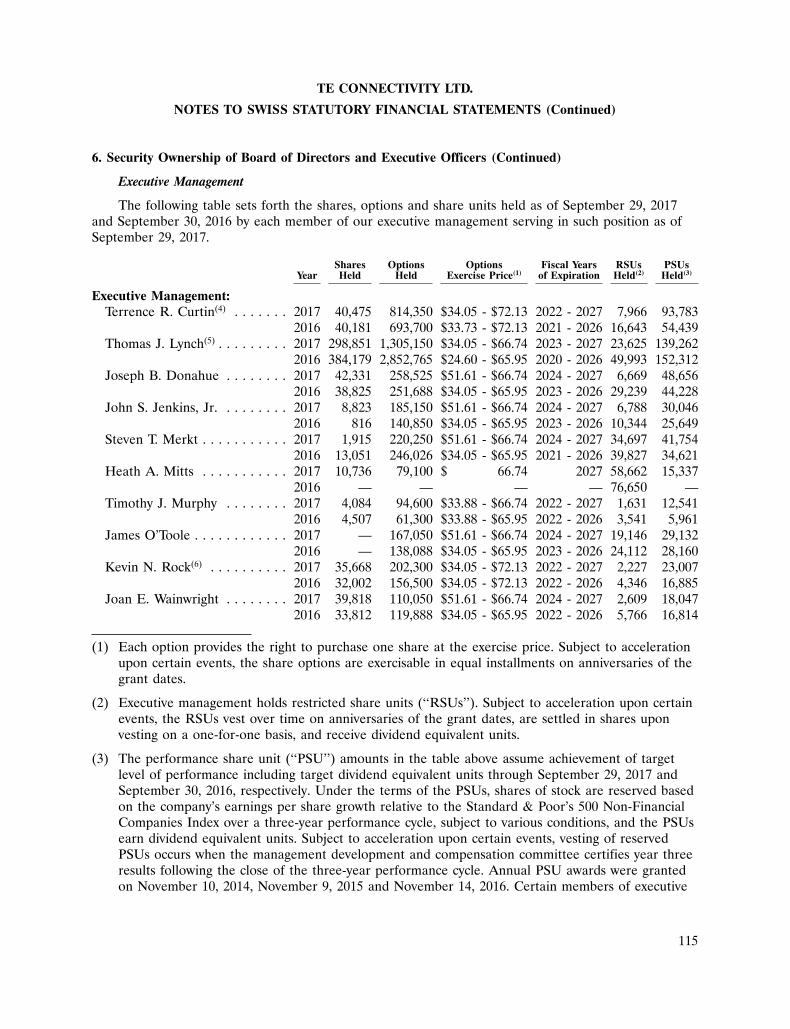
115
TE CONNECTIVITY LTD.
NOTES TO SWISS STATUTORY FINANCIAL STATEMENTS (Continued)
6. Security Ownership of Board of Directors and Executive Officers (Continued)
Executive Management
The following table sets forth the shares, options and share units held as of September 29, 2017and September 30, 2016 by each member of our executive management serving in such position as ofSeptember 29, 2017.
Shares Options Options Fiscal Years RSUs PSUsYear Held Held Exercise Price(1) of Expiration Held(2) Held(3)
Executive Management:Terrence R. Curtin(4) . . . . . . . 2017 40,475 814,350 $34.05 - $72.13 2022 - 2027 7,966 93,783
2016 40,181 693,700 $33.73 - $72.13 2021 - 2026 16,643 54,439Thomas J. Lynch(5) . . . . . . . . . 2017 298,851 1,305,150 $34.05 - $66.74 2023 - 2027 23,625 139,262
2016 384,179 2,852,765 $24.60 - $65.95 2020 - 2026 49,993 152,312Joseph B. Donahue . . . . . . . . 2017 42,331 258,525 $51.61 - $66.74 2024 - 2027 6,669 48,656
2016 38,825 251,688 $34.05 - $65.95 2023 - 2026 29,239 44,228John S. Jenkins, Jr. . . . . . . . . 2017 8,823 185,150 $51.61 - $66.74 2024 - 2027 6,788 30,046
2016 816 140,850 $34.05 - $65.95 2023 - 2026 10,344 25,649Steven T. Merkt . . . . . . . . . . . 2017 1,915 220,250 $51.61 - $66.74 2024 - 2027 34,697 41,754
2016 13,051 246,026 $34.05 - $65.95 2021 - 2026 39,827 34,621Heath A. Mitts . . . . . . . . . . . 2017 10,736 79,100 $ 66.74 2027 58,662 15,337
2016 — — — — 76,650 —Timothy J. Murphy . . . . . . . . 2017 4,084 94,600 $33.88 - $66.74 2022 - 2027 1,631 12,541
2016 4,507 61,300 $33.88 - $65.95 2022 - 2026 3,541 5,961James O’Toole . . . . . . . . . . . . 2017 — 167,050 $51.61 - $66.74 2024 - 2027 19,146 29,132
2016 — 138,088 $34.05 - $65.95 2023 - 2026 24,112 28,160Kevin N. Rock(6) . . . . . . . . . . 2017 35,668 202,300 $34.05 - $72.13 2022 - 2027 2,227 23,007
2016 32,002 156,500 $34.05 - $72.13 2022 - 2026 4,346 16,885Joan E. Wainwright . . . . . . . . 2017 39,818 110,050 $51.61 - $66.74 2024 - 2027 2,609 18,047
2016 33,812 119,888 $34.05 - $65.95 2022 - 2026 5,766 16,814
(1) Each option provides the right to purchase one share at the exercise price. Subject to accelerationupon certain events, the share options are exercisable in equal installments on anniversaries of thegrant dates.
(2) Executive management holds restricted share units (‘‘RSUs’’). Subject to acceleration upon certainevents, the RSUs vest over time on anniversaries of the grant dates, are settled in shares uponvesting on a one-for-one basis, and receive dividend equivalent units.
(3) The performance share unit (‘‘PSU’’) amounts in the table above assume achievement of targetlevel of performance including target dividend equivalent units through September 29, 2017 andSeptember 30, 2016, respectively. Under the terms of the PSUs, shares of stock are reserved basedon the company’s earnings per share growth relative to the Standard & Poor’s 500 Non-FinancialCompanies Index over a three-year performance cycle, subject to various conditions, and the PSUsearn dividend equivalent units. Subject to acceleration upon certain events, vesting of reservedPSUs occurs when the management development and compensation committee certifies year threeresults following the close of the three-year performance cycle. Annual PSU awards were grantedon November 10, 2014, November 9, 2015 and November 14, 2016. Certain members of executive
115
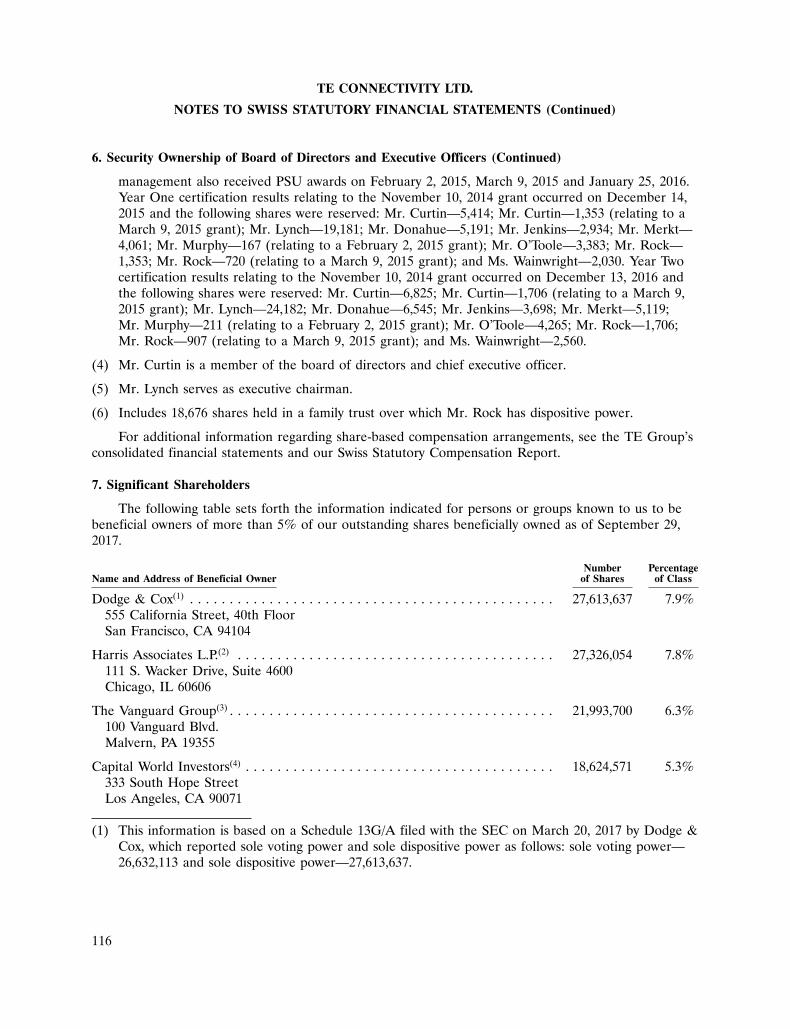
116
TE CONNECTIVITY LTD.
NOTES TO SWISS STATUTORY FINANCIAL STATEMENTS (Continued)
6. Security Ownership of Board of Directors and Executive Officers (Continued)
management also received PSU awards on February 2, 2015, March 9, 2015 and January 25, 2016.Year One certification results relating to the November 10, 2014 grant occurred on December 14,2015 and the following shares were reserved: Mr. Curtin—5,414; Mr. Curtin—1,353 (relating to aMarch 9, 2015 grant); Mr. Lynch—19,181; Mr. Donahue—5,191; Mr. Jenkins—2,934; Mr. Merkt—4,061; Mr. Murphy—167 (relating to a February 2, 2015 grant); Mr. O’Toole—3,383; Mr. Rock—1,353; Mr. Rock—720 (relating to a March 9, 2015 grant); and Ms. Wainwright—2,030. Year Twocertification results relating to the November 10, 2014 grant occurred on December 13, 2016 andthe following shares were reserved: Mr. Curtin—6,825; Mr. Curtin—1,706 (relating to a March 9,2015 grant); Mr. Lynch—24,182; Mr. Donahue—6,545; Mr. Jenkins—3,698; Mr. Merkt—5,119;Mr. Murphy—211 (relating to a February 2, 2015 grant); Mr. O’Toole—4,265; Mr. Rock—1,706;Mr. Rock—907 (relating to a March 9, 2015 grant); and Ms. Wainwright—2,560.
(4) Mr. Curtin is a member of the board of directors and chief executive officer.
(5) Mr. Lynch serves as executive chairman.
(6) Includes 18,676 shares held in a family trust over which Mr. Rock has dispositive power.
For additional information regarding share-based compensation arrangements, see the TE Group’sconsolidated financial statements and our Swiss Statutory Compensation Report.
7. Significant Shareholders
The following table sets forth the information indicated for persons or groups known to us to bebeneficial owners of more than 5% of our outstanding shares beneficially owned as of September 29,2017.
Number PercentageName and Address of Beneficial Owner of Shares of Class
Dodge & Cox(1) . . . . . . . . . . . . . . . . . . . . . . . . . . . . . . . . . . . . . . . . . . . . . . 27,613,637 7.9%555 California Street, 40th FloorSan Francisco, CA 94104
Harris Associates L.P.(2) . . . . . . . . . . . . . . . . . . . . . . . . . . . . . . . . . . . . . . . . 27,326,054 7.8%111 S. Wacker Drive, Suite 4600Chicago, IL 60606
The Vanguard Group(3) . . . . . . . . . . . . . . . . . . . . . . . . . . . . . . . . . . . . . . . . . 21,993,700 6.3%100 Vanguard Blvd.Malvern, PA 19355
Capital World Investors(4) . . . . . . . . . . . . . . . . . . . . . . . . . . . . . . . . . . . . . . . 18,624,571 5.3%333 South Hope StreetLos Angeles, CA 90071
(1) This information is based on a Schedule 13G/A filed with the SEC on March 20, 2017 by Dodge &Cox, which reported sole voting power and sole dispositive power as follows: sole voting power—26,632,113 and sole dispositive power—27,613,637.
116
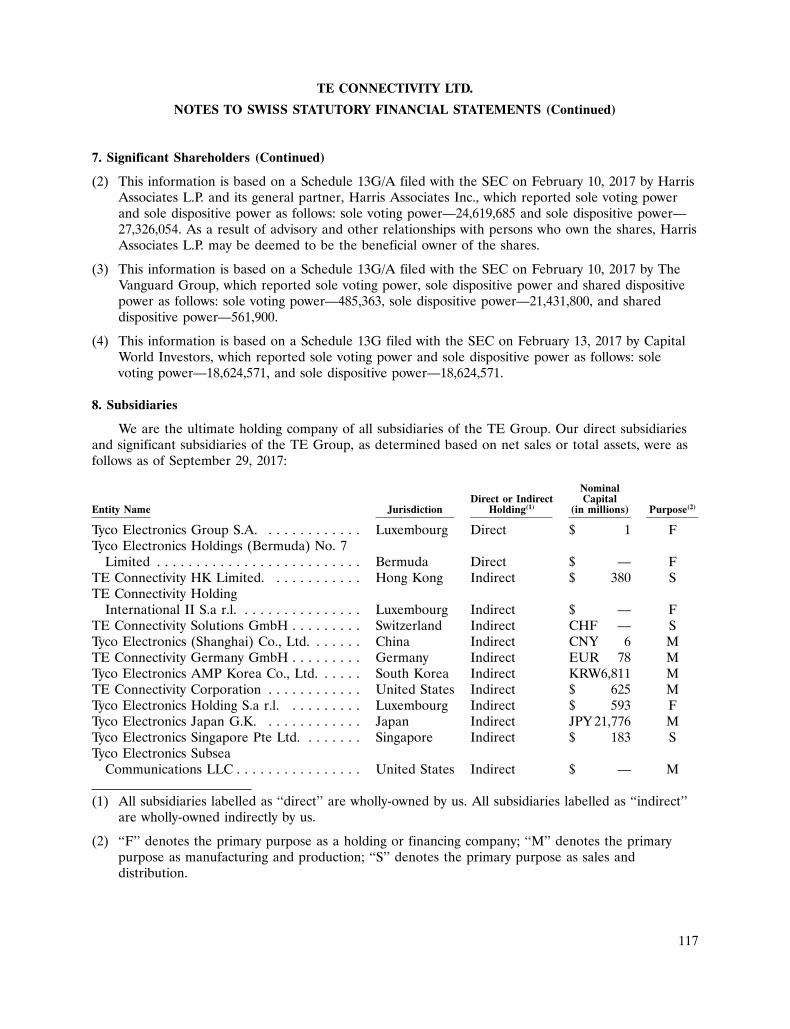
117
TE CONNECTIVITY LTD.
NOTES TO SWISS STATUTORY FINANCIAL STATEMENTS (Continued)
7. Significant Shareholders (Continued)
(2) This information is based on a Schedule 13G/A filed with the SEC on February 10, 2017 by HarrisAssociates L.P. and its general partner, Harris Associates Inc., which reported sole voting powerand sole dispositive power as follows: sole voting power—24,619,685 and sole dispositive power—27,326,054. As a result of advisory and other relationships with persons who own the shares, HarrisAssociates L.P. may be deemed to be the beneficial owner of the shares.
(3) This information is based on a Schedule 13G/A filed with the SEC on February 10, 2017 by TheVanguard Group, which reported sole voting power, sole dispositive power and shared dispositivepower as follows: sole voting power—485,363, sole dispositive power—21,431,800, and shareddispositive power—561,900.
(4) This information is based on a Schedule 13G filed with the SEC on February 13, 2017 by CapitalWorld Investors, which reported sole voting power and sole dispositive power as follows: solevoting power—18,624,571, and sole dispositive power—18,624,571.
8. Subsidiaries
We are the ultimate holding company of all subsidiaries of the TE Group. Our direct subsidiariesand significant subsidiaries of the TE Group, as determined based on net sales or total assets, were asfollows as of September 29, 2017:
NominalDirect or Indirect Capital
Entity Name Jurisdiction Holding(1) (in millions) Purpose(2)
Tyco Electronics Group S.A. . . . . . . . . . . . . Luxembourg Direct $ 1 FTyco Electronics Holdings (Bermuda) No. 7
Limited . . . . . . . . . . . . . . . . . . . . . . . . . . Bermuda Direct $ — FTE Connectivity HK Limited. . . . . . . . . . . . Hong Kong Indirect $ 380 STE Connectivity Holding
International II S.a r.l. . . . . . . . . . . . . . . . Luxembourg Indirect $ — FTE Connectivity Solutions GmbH . . . . . . . . . Switzerland Indirect CHF — STyco Electronics (Shanghai) Co., Ltd. . . . . . . China Indirect CNY 6 MTE Connectivity Germany GmbH . . . . . . . . . Germany Indirect EUR 78 MTyco Electronics AMP Korea Co., Ltd. . . . . . South Korea Indirect KRW6,811 MTE Connectivity Corporation . . . . . . . . . . . . United States Indirect $ 625 MTyco Electronics Holding S.a r.l. . . . . . . . . . Luxembourg Indirect $ 593 FTyco Electronics Japan G.K. . . . . . . . . . . . . Japan Indirect JPY 21,776 MTyco Electronics Singapore Pte Ltd. . . . . . . . Singapore Indirect $ 183 STyco Electronics Subsea
Communications LLC . . . . . . . . . . . . . . . . United States Indirect $ — M
(1) All subsidiaries labelled as ‘‘direct’’ are wholly-owned by us. All subsidiaries labelled as ‘‘indirect’’are wholly-owned indirectly by us.
(2) ‘‘F’’ denotes the primary purpose as a holding or financing company; ‘‘M’’ denotes the primarypurpose as manufacturing and production; ‘‘S’’ denotes the primary purpose as sales anddistribution.
117
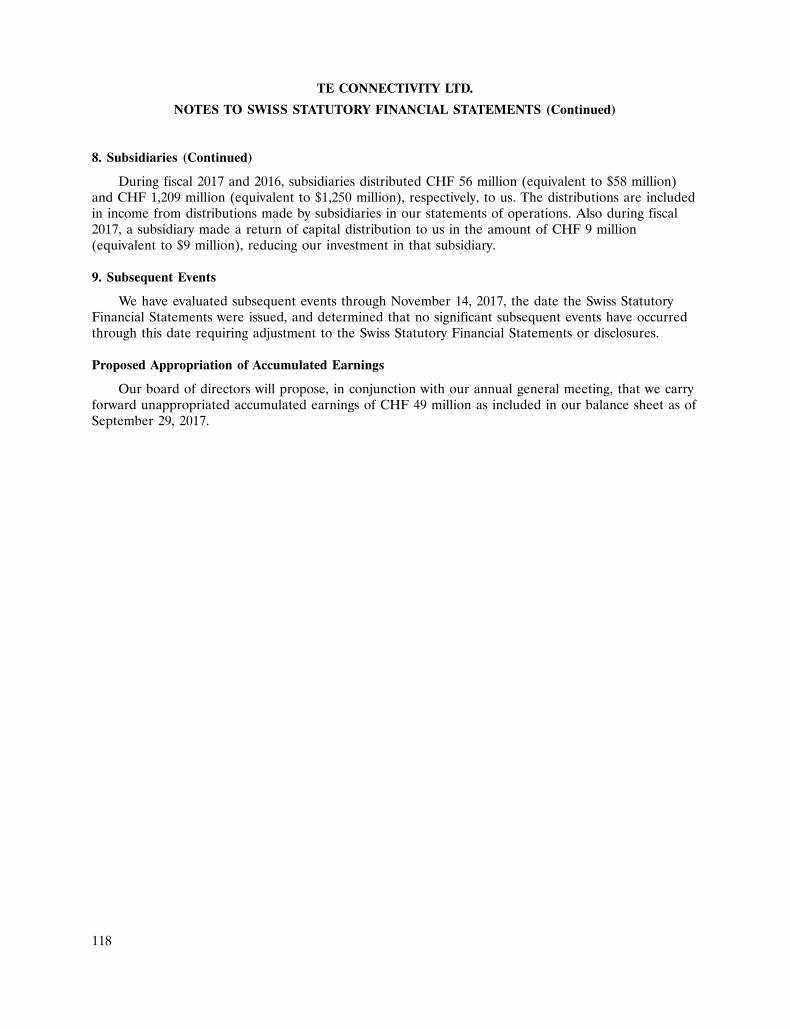
118
TE CONNECTIVITY LTD.
NOTES TO SWISS STATUTORY FINANCIAL STATEMENTS (Continued)
8. Subsidiaries (Continued)
During fiscal 2017 and 2016, subsidiaries distributed CHF 56 million (equivalent to $58 million)and CHF 1,209 million (equivalent to $1,250 million), respectively, to us. The distributions are includedin income from distributions made by subsidiaries in our statements of operations. Also during fiscal2017, a subsidiary made a return of capital distribution to us in the amount of CHF 9 million(equivalent to $9 million), reducing our investment in that subsidiary.
9. Subsequent Events
We have evaluated subsequent events through November 14, 2017, the date the Swiss StatutoryFinancial Statements were issued, and determined that no significant subsequent events have occurredthrough this date requiring adjustment to the Swiss Statutory Financial Statements or disclosures.
Proposed Appropriation of Accumulated Earnings
Our board of directors will propose, in conjunction with our annual general meeting, that we carryforward unappropriated accumulated earnings of CHF 49 million as included in our balance sheet as ofSeptember 29, 2017.
118
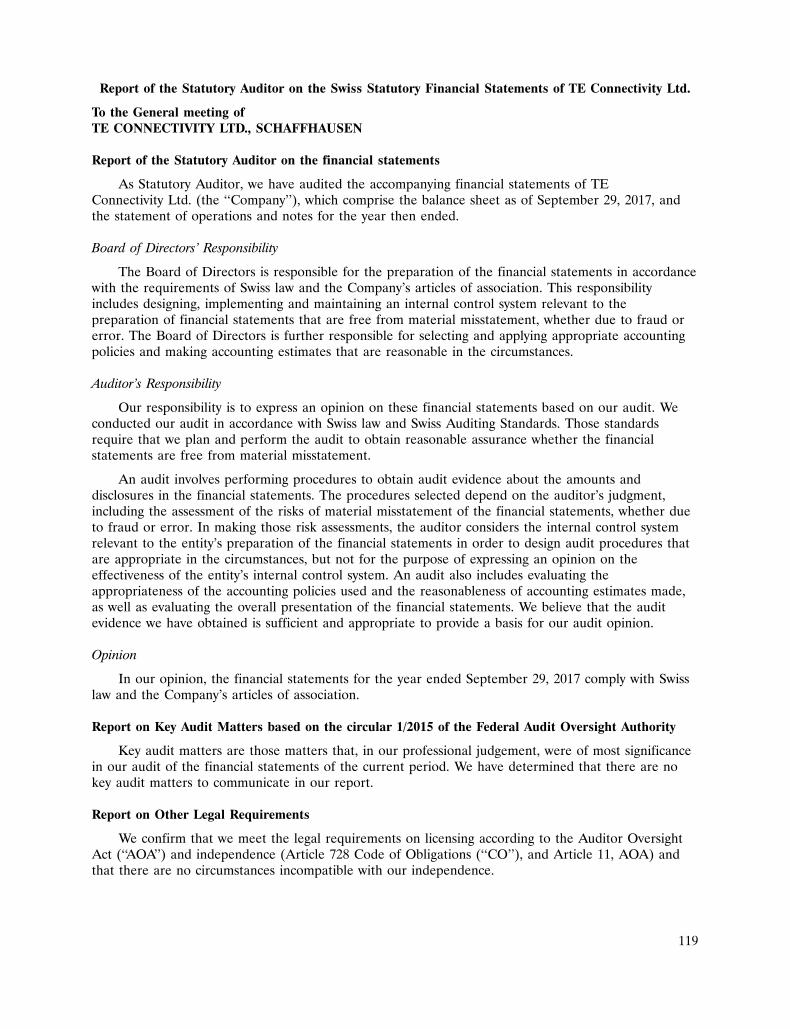
119
Report of the Statutory Auditor on the Swiss Statutory Financial Statements of TE Connectivity Ltd.
To the General meeting ofTE CONNECTIVITY LTD., SCHAFFHAUSEN
Report of the Statutory Auditor on the financial statements
As Statutory Auditor, we have audited the accompanying financial statements of TEConnectivity Ltd. (the ‘‘Company’’), which comprise the balance sheet as of September 29, 2017, andthe statement of operations and notes for the year then ended.
Board of Directors’ Responsibility
The Board of Directors is responsible for the preparation of the financial statements in accordancewith the requirements of Swiss law and the Company’s articles of association. This responsibilityincludes designing, implementing and maintaining an internal control system relevant to thepreparation of financial statements that are free from material misstatement, whether due to fraud orerror. The Board of Directors is further responsible for selecting and applying appropriate accountingpolicies and making accounting estimates that are reasonable in the circumstances.
Auditor’s Responsibility
Our responsibility is to express an opinion on these financial statements based on our audit. Weconducted our audit in accordance with Swiss law and Swiss Auditing Standards. Those standardsrequire that we plan and perform the audit to obtain reasonable assurance whether the financialstatements are free from material misstatement.
An audit involves performing procedures to obtain audit evidence about the amounts anddisclosures in the financial statements. The procedures selected depend on the auditor’s judgment,including the assessment of the risks of material misstatement of the financial statements, whether dueto fraud or error. In making those risk assessments, the auditor considers the internal control systemrelevant to the entity’s preparation of the financial statements in order to design audit procedures thatare appropriate in the circumstances, but not for the purpose of expressing an opinion on theeffectiveness of the entity’s internal control system. An audit also includes evaluating theappropriateness of the accounting policies used and the reasonableness of accounting estimates made,as well as evaluating the overall presentation of the financial statements. We believe that the auditevidence we have obtained is sufficient and appropriate to provide a basis for our audit opinion.
Opinion
In our opinion, the financial statements for the year ended September 29, 2017 comply with Swisslaw and the Company’s articles of association.
Report on Key Audit Matters based on the circular 1/2015 of the Federal Audit Oversight Authority
Key audit matters are those matters that, in our professional judgement, were of most significancein our audit of the financial statements of the current period. We have determined that there are nokey audit matters to communicate in our report.
Report on Other Legal Requirements
We confirm that we meet the legal requirements on licensing according to the Auditor OversightAct (‘‘AOA’’) and independence (Article 728 Code of Obligations (‘‘CO’’), and Article 11, AOA) andthat there are no circumstances incompatible with our independence.
119
120
In accordance with Article 728a, paragraph 1, item 3, CO, and Swiss Auditing Standard 890, weconfirm that an internal control system exists, which has been designed for the preparation of financialstatements according to the instructions of the Board of Directors.
We further confirm that the proposed appropriation of accumulated earnings complies with Swisslaw and the Company’s articles of association. We recommend that the financial statements submittedto you be approved.
Deloitte AG
/s/ Matthias Gschwend /s/ Dominik VoegtliLicensed Audit Expert Licensed Audit ExpertAuditor in charge
Zurich, November 14, 2017
120

121
TE Connectivity Ltd.
Swiss Statutory Compensation Report
September 29, 2017
121

122
TE Connectivity Ltd.
Index to Swiss Statutory Compensation Report
Page
General . . . . . . . . . . . . . . . . . . . . . . . . . . . . . . . . . . . . . . . . . . . . . . . . . . . . . . . . . . . . . . . . . 123Compensation of the Board of Directors . . . . . . . . . . . . . . . . . . . . . . . . . . . . . . . . . . . . . . . . . 123Compensation of Executive Management . . . . . . . . . . . . . . . . . . . . . . . . . . . . . . . . . . . . . . . . . 127Report of the Statutory Auditor on the Swiss Statutory Compensation Report of
TE Connectivity Ltd. . . . . . . . . . . . . . . . . . . . . . . . . . . . . . . . . . . . . . . . . . . . . . . . . . . . . . . 130
122
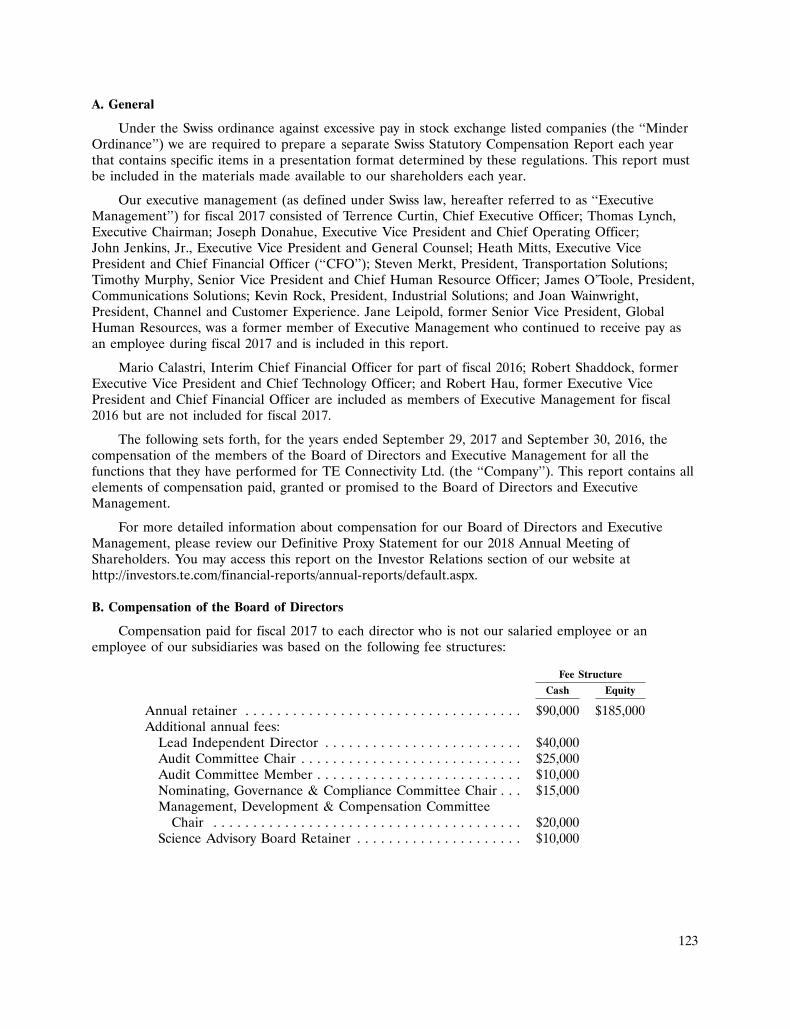
123
A. General
Under the Swiss ordinance against excessive pay in stock exchange listed companies (the ‘‘MinderOrdinance’’) we are required to prepare a separate Swiss Statutory Compensation Report each yearthat contains specific items in a presentation format determined by these regulations. This report mustbe included in the materials made available to our shareholders each year.
Our executive management (as defined under Swiss law, hereafter referred to as ‘‘ExecutiveManagement’’) for fiscal 2017 consisted of Terrence Curtin, Chief Executive Officer; Thomas Lynch,Executive Chairman; Joseph Donahue, Executive Vice President and Chief Operating Officer;John Jenkins, Jr., Executive Vice President and General Counsel; Heath Mitts, Executive VicePresident and Chief Financial Officer (‘‘CFO’’); Steven Merkt, President, Transportation Solutions;Timothy Murphy, Senior Vice President and Chief Human Resource Officer; James O’Toole, President,Communications Solutions; Kevin Rock, President, Industrial Solutions; and Joan Wainwright,President, Channel and Customer Experience. Jane Leipold, former Senior Vice President, GlobalHuman Resources, was a former member of Executive Management who continued to receive pay asan employee during fiscal 2017 and is included in this report.
Mario Calastri, Interim Chief Financial Officer for part of fiscal 2016; Robert Shaddock, formerExecutive Vice President and Chief Technology Officer; and Robert Hau, former Executive VicePresident and Chief Financial Officer are included as members of Executive Management for fiscal2016 but are not included for fiscal 2017.
The following sets forth, for the years ended September 29, 2017 and September 30, 2016, thecompensation of the members of the Board of Directors and Executive Management for all thefunctions that they have performed for TE Connectivity Ltd. (the ‘‘Company’’). This report contains allelements of compensation paid, granted or promised to the Board of Directors and ExecutiveManagement.
For more detailed information about compensation for our Board of Directors and ExecutiveManagement, please review our Definitive Proxy Statement for our 2018 Annual Meeting ofShareholders. You may access this report on the Investor Relations section of our website athttp://investors.te.com/financial-reports/annual-reports/default.aspx.
B. Compensation of the Board of Directors
Compensation paid for fiscal 2017 to each director who is not our salaried employee or anemployee of our subsidiaries was based on the following fee structures:
Fee Structure
Cash Equity
Annual retainer . . . . . . . . . . . . . . . . . . . . . . . . . . . . . . . . . . . $90,000 $185,000Additional annual fees:
Lead Independent Director . . . . . . . . . . . . . . . . . . . . . . . . . $40,000Audit Committee Chair . . . . . . . . . . . . . . . . . . . . . . . . . . . . $25,000Audit Committee Member . . . . . . . . . . . . . . . . . . . . . . . . . . $10,000Nominating, Governance & Compliance Committee Chair . . . $15,000Management, Development & Compensation Committee
Chair . . . . . . . . . . . . . . . . . . . . . . . . . . . . . . . . . . . . . . . $20,000Science Advisory Board Retainer . . . . . . . . . . . . . . . . . . . . . $10,000
123
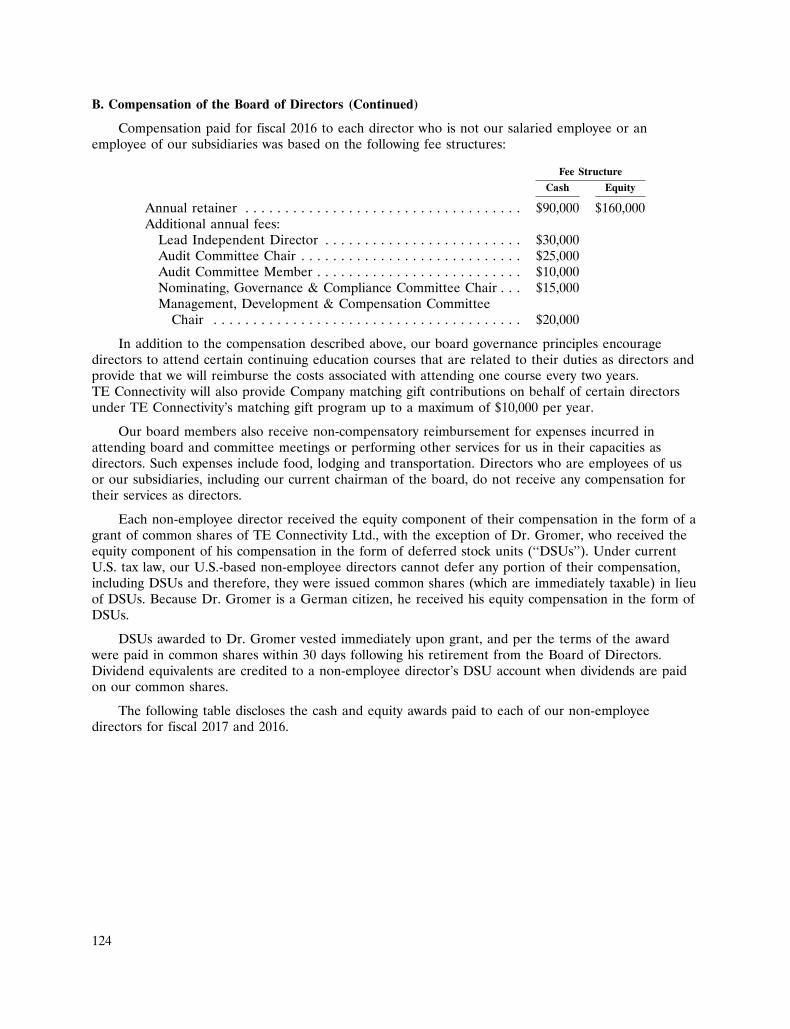
124
B. Compensation of the Board of Directors (Continued)
Compensation paid for fiscal 2016 to each director who is not our salaried employee or anemployee of our subsidiaries was based on the following fee structures:
Fee Structure
Cash Equity
Annual retainer . . . . . . . . . . . . . . . . . . . . . . . . . . . . . . . . . . . $90,000 $160,000Additional annual fees:
Lead Independent Director . . . . . . . . . . . . . . . . . . . . . . . . . $30,000Audit Committee Chair . . . . . . . . . . . . . . . . . . . . . . . . . . . . $25,000Audit Committee Member . . . . . . . . . . . . . . . . . . . . . . . . . . $10,000Nominating, Governance & Compliance Committee Chair . . . $15,000Management, Development & Compensation Committee
Chair . . . . . . . . . . . . . . . . . . . . . . . . . . . . . . . . . . . . . . . $20,000
In addition to the compensation described above, our board governance principles encouragedirectors to attend certain continuing education courses that are related to their duties as directors andprovide that we will reimburse the costs associated with attending one course every two years.TE Connectivity will also provide Company matching gift contributions on behalf of certain directorsunder TE Connectivity’s matching gift program up to a maximum of $10,000 per year.
Our board members also receive non-compensatory reimbursement for expenses incurred inattending board and committee meetings or performing other services for us in their capacities asdirectors. Such expenses include food, lodging and transportation. Directors who are employees of usor our subsidiaries, including our current chairman of the board, do not receive any compensation fortheir services as directors.
Each non-employee director received the equity component of their compensation in the form of agrant of common shares of TE Connectivity Ltd., with the exception of Dr. Gromer, who received theequity component of his compensation in the form of deferred stock units (‘‘DSUs’’). Under currentU.S. tax law, our U.S.-based non-employee directors cannot defer any portion of their compensation,including DSUs and therefore, they were issued common shares (which are immediately taxable) in lieuof DSUs. Because Dr. Gromer is a German citizen, he received his equity compensation in the form ofDSUs.
DSUs awarded to Dr. Gromer vested immediately upon grant, and per the terms of the awardwere paid in common shares within 30 days following his retirement from the Board of Directors.Dividend equivalents are credited to a non-employee director’s DSU account when dividends are paidon our common shares.
The following table discloses the cash and equity awards paid to each of our non-employeedirectors for fiscal 2017 and 2016.
124
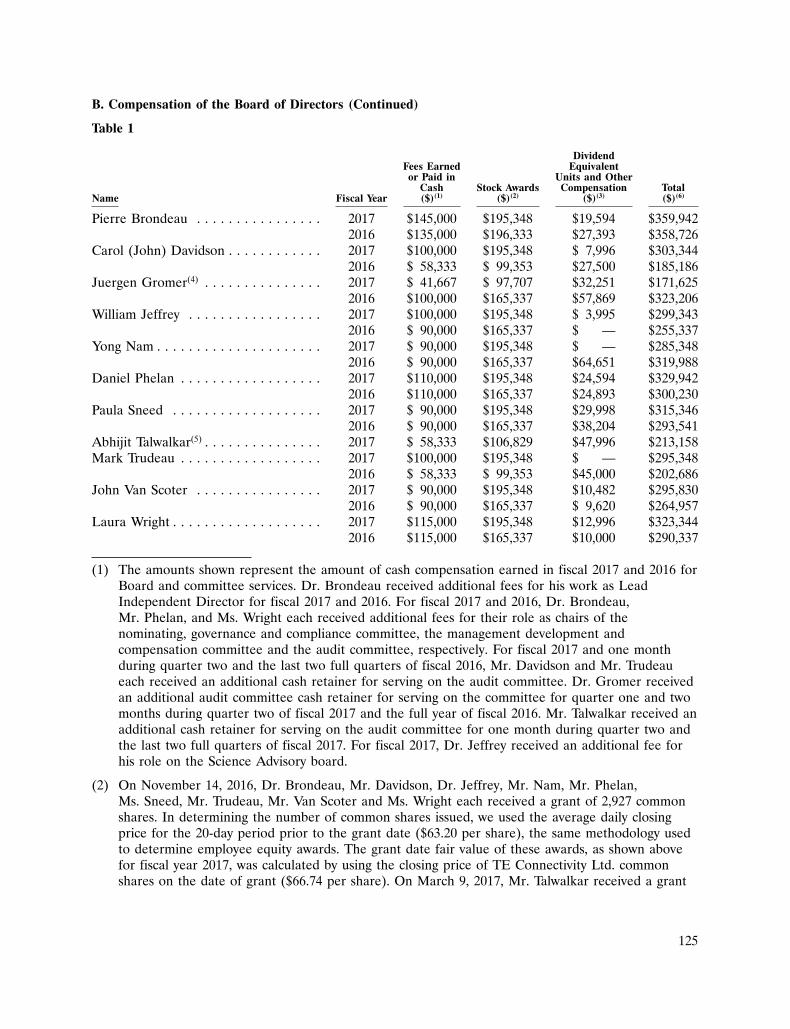
125
B. Compensation of the Board of Directors (Continued)
Table 1
DividendFees Earned Equivalentor Paid in Units and Other
Cash Stock Awards Compensation TotalName Fiscal Year ($)(1) ($)(2) ($)(3) ($)(6)
Pierre Brondeau . . . . . . . . . . . . . . . . 2017 $145,000 $195,348 $19,594 $359,9422016 $135,000 $196,333 $27,393 $358,726
Carol (John) Davidson . . . . . . . . . . . . 2017 $100,000 $195,348 $ 7,996 $303,3442016 $ 58,333 $ 99,353 $27,500 $185,186
Juergen Gromer(4) . . . . . . . . . . . . . . . 2017 $ 41,667 $ 97,707 $32,251 $171,6252016 $100,000 $165,337 $57,869 $323,206
William Jeffrey . . . . . . . . . . . . . . . . . 2017 $100,000 $195,348 $ 3,995 $299,3432016 $ 90,000 $165,337 $ — $255,337
Yong Nam . . . . . . . . . . . . . . . . . . . . . 2017 $ 90,000 $195,348 $ — $285,3482016 $ 90,000 $165,337 $64,651 $319,988
Daniel Phelan . . . . . . . . . . . . . . . . . . 2017 $110,000 $195,348 $24,594 $329,9422016 $110,000 $165,337 $24,893 $300,230
Paula Sneed . . . . . . . . . . . . . . . . . . . 2017 $ 90,000 $195,348 $29,998 $315,3462016 $ 90,000 $165,337 $38,204 $293,541
Abhijit Talwalkar(5) . . . . . . . . . . . . . . . 2017 $ 58,333 $106,829 $47,996 $213,158Mark Trudeau . . . . . . . . . . . . . . . . . . 2017 $100,000 $195,348 $ — $295,348
2016 $ 58,333 $ 99,353 $45,000 $202,686John Van Scoter . . . . . . . . . . . . . . . . 2017 $ 90,000 $195,348 $10,482 $295,830
2016 $ 90,000 $165,337 $ 9,620 $264,957Laura Wright . . . . . . . . . . . . . . . . . . . 2017 $115,000 $195,348 $12,996 $323,344
2016 $115,000 $165,337 $10,000 $290,337
(1) The amounts shown represent the amount of cash compensation earned in fiscal 2017 and 2016 forBoard and committee services. Dr. Brondeau received additional fees for his work as LeadIndependent Director for fiscal 2017 and 2016. For fiscal 2017 and 2016, Dr. Brondeau,Mr. Phelan, and Ms. Wright each received additional fees for their role as chairs of thenominating, governance and compliance committee, the management development andcompensation committee and the audit committee, respectively. For fiscal 2017 and one monthduring quarter two and the last two full quarters of fiscal 2016, Mr. Davidson and Mr. Trudeaueach received an additional cash retainer for serving on the audit committee. Dr. Gromer receivedan additional audit committee cash retainer for serving on the committee for quarter one and twomonths during quarter two of fiscal 2017 and the full year of fiscal 2016. Mr. Talwalkar received anadditional cash retainer for serving on the audit committee for one month during quarter two andthe last two full quarters of fiscal 2017. For fiscal 2017, Dr. Jeffrey received an additional fee forhis role on the Science Advisory board.
(2) On November 14, 2016, Dr. Brondeau, Mr. Davidson, Dr. Jeffrey, Mr. Nam, Mr. Phelan,Ms. Sneed, Mr. Trudeau, Mr. Van Scoter and Ms. Wright each received a grant of 2,927 commonshares. In determining the number of common shares issued, we used the average daily closingprice for the 20-day period prior to the grant date ($63.20 per share), the same methodology usedto determine employee equity awards. The grant date fair value of these awards, as shown abovefor fiscal year 2017, was calculated by using the closing price of TE Connectivity Ltd. commonshares on the date of grant ($66.74 per share). On March 9, 2017, Mr. Talwalkar received a grant
125
126
B. Compensation of the Board of Directors (Continued)
of 1,438 common shares. In determining the number of common shares to be issued, we used theaverage daily closing price for the 20-day period prior to the grant date ($75.06 per share), thesame methodology used to determine employee equity awards. The grant date fair value of thisaward as shown above for fiscal 2017, was calculated by using the closing price ofTE Connectivity Ltd. common shares on the date of grant ($74.29 per share). On December 13,2017, pursuant to U.S. tax law, we settled outstanding DSUs for common shares on a one-for-onebasis in the following amounts: Dr. Brondeau—12,930; Mr. Phelan—12,930; Ms. Sneed—15,871;Mr. Van Scoter—6,925. This DSU settlement is with respect to shares that had been deferredunder a previous DSU program. On November 9, 2015, Dr. Brondeau, Dr. Jeffrey, Mr. Nam,Mr. Phelan, Ms. Sneed, Mr. Van Scoter and Ms. Wright each received a grant of 2,507 commonshares. Dr. Brondeau received an additional 470 common shares in equity compensation as aspecial one-time grant as a result of the Board’s assessment of the roles and responsibilities of theLead Director in fiscal 2016. Dr. Gromer received an award of 2,507 DSUs. In determining thenumber of common shares and DSUs to be issued, we used the average daily closing price for the20-day period prior to the grant date ($63.82 per share), the same methodology used to determineemployee equity awards. The grant date fair value of these awards, as shown above for fiscal year2016, was calculated by using the closing price of TE Connectivity Ltd. common shares on the dateof grant ($65.95 per share). On March 2, 2016, Mr. Davidson and Mr. Trudeau received a grant of1,676 common shares. In determining the number of common shares to be issued, we used theaverage daily closing price for the 20-day period prior to the grant date ($55.69 per share), thesame methodology used to determine employee equity awards. The grant date fair value of theseawards, as shown above for fiscal 2016, was calculated by using the closing price ofTE Connectivity Ltd. common shares on the date of grant ($59.28 per share). The common sharesand DSUs vested immediately and non-employee directors receive dividend equivalents inconnection with any DSU award granted to them.
(3) Amounts shown represent the value of dividend equivalent units earned on current and prior DSUawards calculated using the market value on the date of the dividend, Company matching giftcontributions made on behalf of certain directors under TE Connectivity’s matching gift program,and amounts reimbursed to Ms. Sneed, Dr. Jeffrey, Ms. Wright, Mr. Davidson and Mr. Talwalkarin fiscal 2017 and Ms. Sneed in fiscal 2016 for expenses incurred when attending continuingeducation courses. Amounts reported in fiscal 2017 and 2016, for Dr. Gromer of $32,251 and$57,869, respectively, are the dividend equivalent unit amount earned on his DSU awards. In fiscal2017, Mr. Talwalkar received fees in the amount of $45,000 for consulting services performed priorto being elected to the board. In fiscal 2016, Mr. Nam received payment by the Company ofMr. Nam’s Swiss social tax obligations for the period 2012-2015 (and additional amounts paid tocover income tax obligations on the Company’s social tax payment) as a result of the Company’sfailure to notify Mr. Nam of his Swiss social tax obligations and to withhold the Swiss social taxamounts as required. Mr. Nam was responsible for his ongoing Swiss social tax obligations effectiveJanuary 1, 2016. In fiscal 2016, Mr. Davidson and Mr. Trudeau received fees, in the amount of$22,500 and $45,000, respectively, for consulting services performed prior to being elected to theboard.
(4) On November 14, 2016, Dr. Gromer received 1,464 DSUs. Dr. Gromer left the board effectiveMarch 8, 2017. The number of DSUs issued to Dr. Gromer was determined in the same mannerapplied to all grants on November 14, 2016 and reflects a pro-ration of his service during fiscal2017. Cash compensation for Dr. Gromer was also pro-rated for his service during fiscal 2017.
(5) On March 8, 2017, Mr. Talwalkar was elected to our Board of Directors. Cash compensation forMr. Talwalkar was pro-rated for service during fiscal year 2017.
126
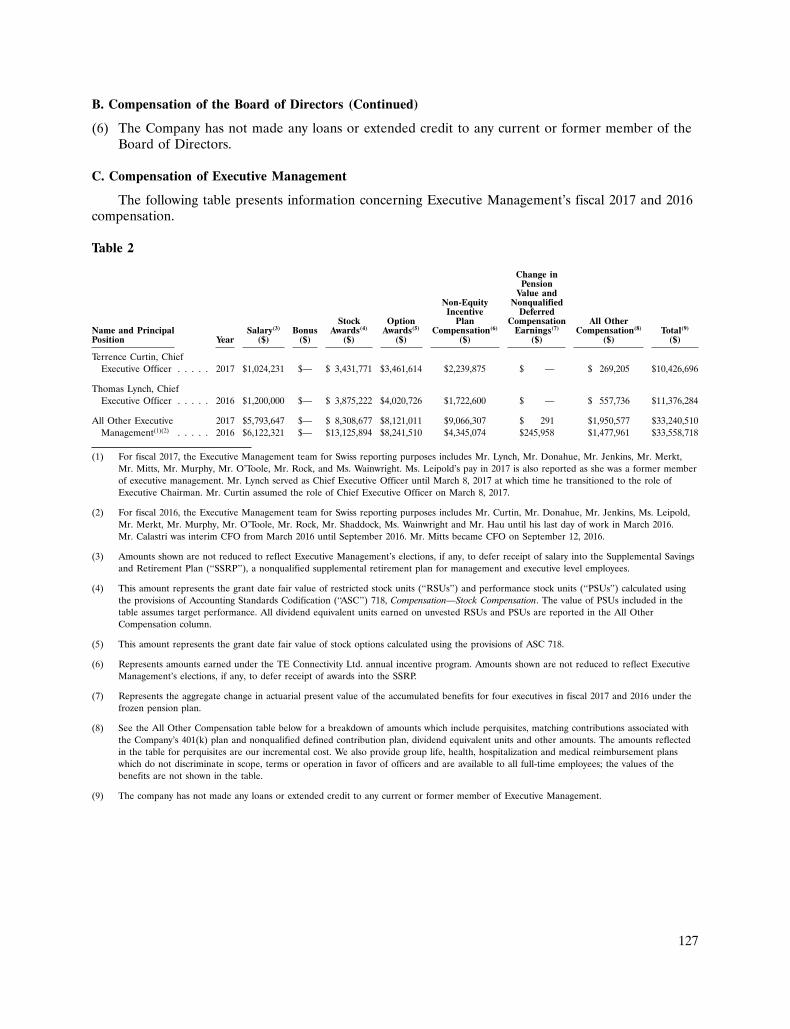
127
B. Compensation of the Board of Directors (Continued)
(6) The Company has not made any loans or extended credit to any current or former member of theBoard of Directors.
C. Compensation of Executive Management
The following table presents information concerning Executive Management’s fiscal 2017 and 2016compensation.
Table 2
Change inPension
Value andNon-Equity Nonqualified
Incentive DeferredStock Option Plan Compensation All Other
Name and Principal Salary(3) Bonus Awards(4) Awards(5) Compensation(6) Earnings(7) Compensation(8) Total(9)
Position Year ($) ($) ($) ($) ($) ($) ($) ($)
Terrence Curtin, ChiefExecutive Officer . . . . . 2017 $1,024,231 $— $ 3,431,771 $3,461,614 $2,239,875 $ — $ 269,205 $10,426,696
Thomas Lynch, ChiefExecutive Officer . . . . . 2016 $1,200,000 $— $ 3,875,222 $4,020,726 $1,722,600 $ — $ 557,736 $11,376,284
All Other Executive 2017 $5,793,647 $— $ 8,308,677 $8,121,011 $9,066,307 $ 291 $1,950,577 $33,240,510Management(1)(2) . . . . . 2016 $6,122,321 $— $13,125,894 $8,241,510 $4,345,074 $245,958 $1,477,961 $33,558,718
(1) For fiscal 2017, the Executive Management team for Swiss reporting purposes includes Mr. Lynch, Mr. Donahue, Mr. Jenkins, Mr. Merkt,Mr. Mitts, Mr. Murphy, Mr. O’Toole, Mr. Rock, and Ms. Wainwright. Ms. Leipold’s pay in 2017 is also reported as she was a former memberof executive management. Mr. Lynch served as Chief Executive Officer until March 8, 2017 at which time he transitioned to the role ofExecutive Chairman. Mr. Curtin assumed the role of Chief Executive Officer on March 8, 2017.
(2) For fiscal 2016, the Executive Management team for Swiss reporting purposes includes Mr. Curtin, Mr. Donahue, Mr. Jenkins, Ms. Leipold,Mr. Merkt, Mr. Murphy, Mr. O’Toole, Mr. Rock, Mr. Shaddock, Ms. Wainwright and Mr. Hau until his last day of work in March 2016.Mr. Calastri was interim CFO from March 2016 until September 2016. Mr. Mitts became CFO on September 12, 2016.
(3) Amounts shown are not reduced to reflect Executive Management’s elections, if any, to defer receipt of salary into the Supplemental Savingsand Retirement Plan (‘‘SSRP’’), a nonqualified supplemental retirement plan for management and executive level employees.
(4) This amount represents the grant date fair value of restricted stock units (‘‘RSUs’’) and performance stock units (‘‘PSUs’’) calculated usingthe provisions of Accounting Standards Codification (‘‘ASC’’) 718, Compensation—Stock Compensation. The value of PSUs included in thetable assumes target performance. All dividend equivalent units earned on unvested RSUs and PSUs are reported in the All OtherCompensation column.
(5) This amount represents the grant date fair value of stock options calculated using the provisions of ASC 718.
(6) Represents amounts earned under the TE Connectivity Ltd. annual incentive program. Amounts shown are not reduced to reflect ExecutiveManagement’s elections, if any, to defer receipt of awards into the SSRP.
(7) Represents the aggregate change in actuarial present value of the accumulated benefits for four executives in fiscal 2017 and 2016 under thefrozen pension plan.
(8) See the All Other Compensation table below for a breakdown of amounts which include perquisites, matching contributions associated withthe Company’s 401(k) plan and nonqualified defined contribution plan, dividend equivalent units and other amounts. The amounts reflectedin the table for perquisites are our incremental cost. We also provide group life, health, hospitalization and medical reimbursement planswhich do not discriminate in scope, terms or operation in favor of officers and are available to all full-time employees; the values of thebenefits are not shown in the table.
(9) The company has not made any loans or extended credit to any current or former member of Executive Management.
127
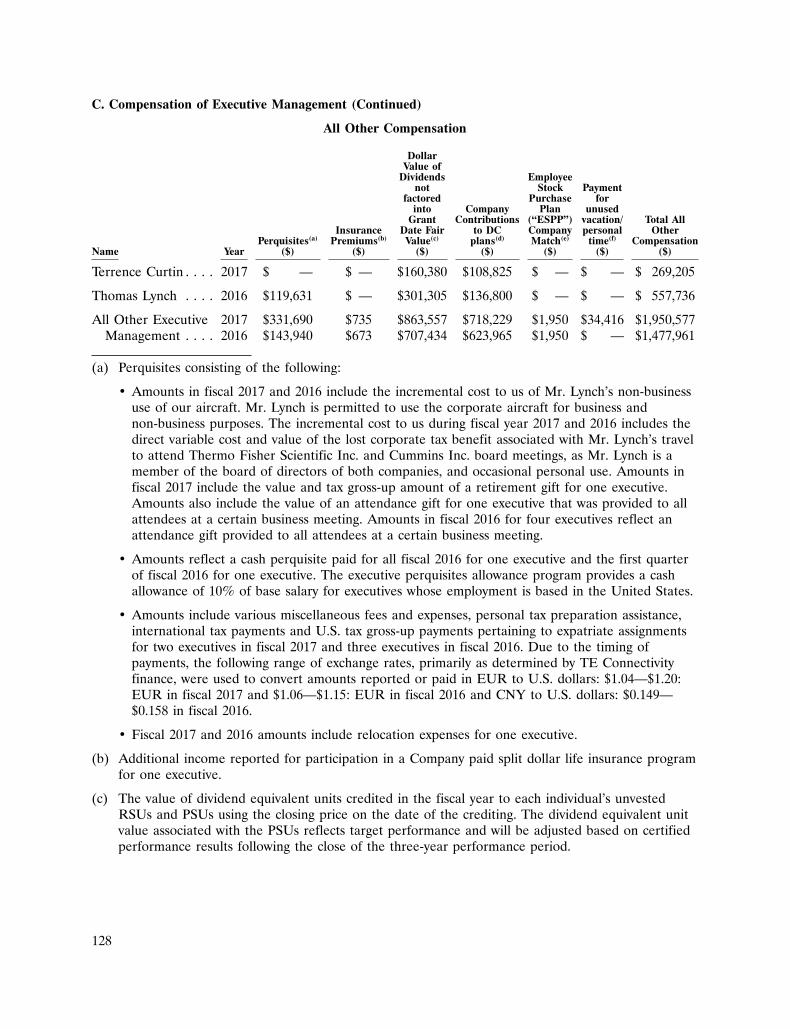
128
C. Compensation of Executive Management (Continued)
All Other Compensation
DollarValue of
Dividends Employeenot Stock Payment
factored Purchase forinto Company Plan unused
Grant Contributions (‘‘ESPP’’) vacation/ Total AllInsurance Date Fair to DC Company personal Other
Perquisites(a) Premiums(b) Value(c) plans(d) Match(e) time(f) CompensationName Year ($) ($) ($) ($) ($) ($) ($)
Terrence Curtin . . . . 2017 $ — $ — $160,380 $108,825 $ — $ — $ 269,205
Thomas Lynch . . . . 2016 $119,631 $ — $301,305 $136,800 $ — $ — $ 557,736
All Other Executive 2017 $331,690 $735 $863,557 $718,229 $1,950 $34,416 $1,950,577Management . . . . 2016 $143,940 $673 $707,434 $623,965 $1,950 $ — $1,477,961
(a) Perquisites consisting of the following:
• Amounts in fiscal 2017 and 2016 include the incremental cost to us of Mr. Lynch’s non-businessuse of our aircraft. Mr. Lynch is permitted to use the corporate aircraft for business andnon-business purposes. The incremental cost to us during fiscal year 2017 and 2016 includes thedirect variable cost and value of the lost corporate tax benefit associated with Mr. Lynch’s travelto attend Thermo Fisher Scientific Inc. and Cummins Inc. board meetings, as Mr. Lynch is amember of the board of directors of both companies, and occasional personal use. Amounts infiscal 2017 include the value and tax gross-up amount of a retirement gift for one executive.Amounts also include the value of an attendance gift for one executive that was provided to allattendees at a certain business meeting. Amounts in fiscal 2016 for four executives reflect anattendance gift provided to all attendees at a certain business meeting.
• Amounts reflect a cash perquisite paid for all fiscal 2016 for one executive and the first quarterof fiscal 2016 for one executive. The executive perquisites allowance program provides a cashallowance of 10% of base salary for executives whose employment is based in the United States.
• Amounts include various miscellaneous fees and expenses, personal tax preparation assistance,international tax payments and U.S. tax gross-up payments pertaining to expatriate assignmentsfor two executives in fiscal 2017 and three executives in fiscal 2016. Due to the timing ofpayments, the following range of exchange rates, primarily as determined by TE Connectivityfinance, were used to convert amounts reported or paid in EUR to U.S. dollars: $1.04—$1.20:EUR in fiscal 2017 and $1.06—$1.15: EUR in fiscal 2016 and CNY to U.S. dollars: $0.149—$0.158 in fiscal 2016.
• Fiscal 2017 and 2016 amounts include relocation expenses for one executive.
(b) Additional income reported for participation in a Company paid split dollar life insurance programfor one executive.
(c) The value of dividend equivalent units credited in the fiscal year to each individual’s unvestedRSUs and PSUs using the closing price on the date of the crediting. The dividend equivalent unitvalue associated with the PSUs reflects target performance and will be adjusted based on certifiedperformance results following the close of the three-year performance period.
128
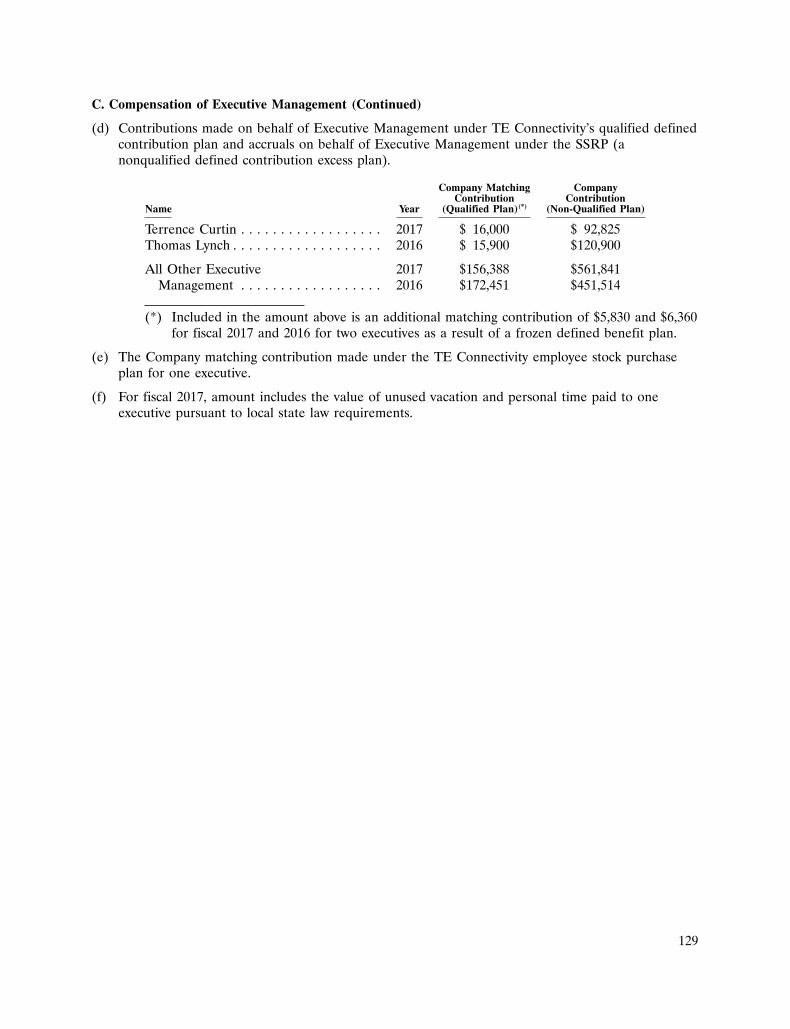
129
C. Compensation of Executive Management (Continued)
(d) Contributions made on behalf of Executive Management under TE Connectivity’s qualified definedcontribution plan and accruals on behalf of Executive Management under the SSRP (anonqualified defined contribution excess plan).
Company Matching CompanyContribution Contribution
Name Year (Qualified Plan)(*) (Non-Qualified Plan)
Terrence Curtin . . . . . . . . . . . . . . . . . . 2017 $ 16,000 $ 92,825Thomas Lynch . . . . . . . . . . . . . . . . . . . 2016 $ 15,900 $120,900
All Other Executive 2017 $156,388 $561,841Management . . . . . . . . . . . . . . . . . . 2016 $172,451 $451,514
(*) Included in the amount above is an additional matching contribution of $5,830 and $6,360for fiscal 2017 and 2016 for two executives as a result of a frozen defined benefit plan.
(e) The Company matching contribution made under the TE Connectivity employee stock purchaseplan for one executive.
(f) For fiscal 2017, amount includes the value of unused vacation and personal time paid to oneexecutive pursuant to local state law requirements.
129
130
Report of the Statutory Auditor on the Swiss Statutory Compensation Report ofTE Connectivity Ltd.
To the General meeting ofTE CONNECTIVITY LTD., SCHAFFHAUSEN
We have audited Tables 1 and 2 within the accompanying compensation report of TEConnectivity Ltd. for the year ended September 29, 2017.
Board of Directors’ Responsibility
The Board of Directors is responsible for the preparation and overall fair presentation of thecompensation report in accordance with Swiss law and the Ordinance against Excessive Compensationin Stock Exchange Listed Companies (the ‘‘Ordinance’’). The Board of Directors is also responsible fordesigning the compensation system and defining individual compensation packages.
Auditor’s Responsibility
Our responsibility is to express an opinion on the accompanying compensation report. Weconducted our audit in accordance with Swiss Auditing Standards. Those standards require that wecomply with ethical requirements and plan and perform the audit to obtain reasonable assurance aboutwhether the compensation report complies with Swiss law and articles 14–16 of the Ordinance.
An audit involves performing procedures to obtain audit evidence on the disclosures made in thecompensation report with regard to compensation, loans and credits in accordance with articles 14–16of the Ordinance. The procedures selected depend on the auditor’s judgment, including the assessmentof the risks of material misstatements in the compensation report, whether due to fraud or error. Thisaudit also includes evaluating the reasonableness of the methods applied to value components ofremuneration, as well as assessing the overall presentation of the compensation report.
We believe that the audit evidence we have obtained is sufficient and appropriate to provide abasis for our opinion.
Opinion
In our opinion, the compensation report of TE Connectivity Ltd. for the year ended September 29,2017 complies with Swiss law and articles 14–16 of the Ordinance.
Deloitte AG
/s/ Matthias Gschwend /s/ Dominik VoegtliLicensed audit expert Licensed audit expertAuditor in charge
Zurich, December 13, 2017
130

BOARD OF DIRECTORS
LEADERSHIP TEAM AND OFFICERS
Thomas J. Lynch ‡Executive Chairman TE Connectivity Ltd.
Dr. Pierre R. Brondeau* President, Chairman, and Chief Executive Officer, FMC Corporation
Terrence R. Curtin Director and Chief Executive Officer, TE Connectivity Ltd.
Carol A. “John” Davidson Retired Senior Vice President, Controller and Chief Accounting Officer, Tyco International Ltd.
Dr. William A. Jeffrey Chief Executive Officer,SRI International
Yong Nam Advisor to the CEO, Daelim Industrial Co. Ltd. Former Chief Executive Officer, LG Electronics Inc.
Daniel J. Phelan Retired Chief of Staff, GlaxoSmithKline plc
Mark C. Trudeau President and Chief Executive Officer, Mallinckrodt plc
Paula A. Sneed Chair and Chief Executive Officer, Phelps Prescott Group, LLC Retired Executive Vice President, Kraft Foods Inc.
Abhijit Y. Talwalkar Former President and Chief Executive Officer, LSI Corporation
John C. Van Scoter Former President and Chief Executive Officer, eSolar, Inc.
Laura H. Wright Founder, GSB Advisors Retired Chief Financial Officer, Southwest Airlines Co.
Terrence R. Curtin Chief Executive Officer and Director
Mario Calastri Senior Vice President, Treasurer
Joel Dubs Senior Vice President, Operations
Joseph F. Eckroth, Jr. Senior Vice President, Chief Information Officer
John S. Jenkins, Jr. Executive Vice President, General Counsel
Shad W. Kroeger President, Communications Solutions
Thomas J. Lynch‡Executive Chairman
Steven T. Merkt President, Transportation Solutions
Heath A. Mitts Executive Vice President, Chief Financial Officer
Timothy J. Murphy Senior Vice President, Chief Human Resources Officer
Robert J. OttSenior Vice President,Corporate Controller
Sameer PagnisSenior Vice President, Corporate Strategy
Jeanne QuirkSenior Vice President,Mergers and Acquisitions
Eric J. Resch Senior Vice President, Chief Tax Officer
Kevin N. RockPresident,Industrial Solutions
Amy Summy Senior Vice President,Chief Marketing Officer
Joan E. WainwrightPresident,Channel and Customer Experience
*Lead Independent Director of the TE Connectivity Ltd. Board of Directors
© 2018 TE Connectivity Ltd. All Rights Reserved.001-AR-FY2017
TE Connectivity, TE, TE connectivity (logo) are trademarks of the TE Connectivity family of companies. Other logos, product, and/or company names may be trademarks of their respective owners.
CORPORATE DATAREGISTERED & PRINCIPALEXECUTIVE OFFICETE Connectivity Ltd. Rheinstrasse 20 CH-8200 Schaffhausen Switzerland +41.0.52.633.66.61
INDEPENDENT AUDITORSDeloitte & Touche LLP 1700 Market Street Philadelphia, PA 19103 Deloitte AG General Guisan-Quai 38 CH-8022 Zurich Switzerland
STOCK EXCHANGE The company’s common shares are traded on the New York Stock Exchange (NYSE) under the ticker symbol TEL.
FORM 10-K Copies of the company’s Annual Report on Form 10-K for the fiscal year that ended September 29, 2017 may be obtained by shareholders without charge upon written request to TE Connectivity Ltd. Rheinstrasse 20 CH-8200 Schaffhausen SwitzerlandThe Annual Report on Form 10-K is also available on the company’s website at www.te.com.
SHAREHOLDER SERVICES Registered shareholders (shares held in your own name with our transfer agent) with requests such as change of address or dividend checks should contact TE Connectivity’s transfer agent at: Wells Fargo Shareowner Services 1110 Centre Pointe Curve, Suite 101 Mendota Heights, MN 55120-4100 866.258.4745 www.shareowneronline.com
Beneficial shareholders (shares held with a bank or broker) should contact the bank or brokerage holding their shares with their requests. Other shareholder inquiries may be directed to TE Connectivity Shareholder Services at the company’s registered and principal executive office above.
www.te.com
‡ On December 14, 2017, Mr. Lynch announced his retirement as Executive Chairman of TE Connectivity effective March 14, 2018. Mr. Lynch has been nominated for, and will continue to serve on, the Board of Directors of TE Connectivity and as the Non-Executive Chairman of the Board of Directors, if elected at the Annual General Meeting of Shareholders on March 14, 2018.

2017 ANNUAL REPORT
20
17 A
NN
UA
L R
EP
OR
T


![[Annual Report] FY2010 Annual Report(FULL)](https://img.pdfslide.us/doc/110x75/58a19c0c1a28abf0428b88ed/annual-report-fy2010-annual-reportfull.jpg)