Embed Size (px)
Citation preview

2017 ANNUAL REPORT

1
THE UK’S LARGESTAUTOMOTIVE ONLINERETAILER
1 AT A GLANCE
2 LOCATIONS
4 OUR OPERATIONAL & FINANCIAL HIGHLIGHTS
6 CHAIRMAN’S HIGHLIGHTS
8 INDUSTRY & BUSINESS
8 Industry Insight 12 Our Business
16 OUR BUSINESS MODEL & STRATEGY
16 Business Model 17 Viability Statement 18 Key Performance Indicators 20 Risk Overview & Management
26 OPERATIONAL & FINANCIAL REVIEW
26 Business Review & Strategy 32 Financial Review
STRATEGIC REVIEW
CONTENTS
27.3mANNUAL WEBSITE HITS
279,000NEW & USED UNIT SALES
>1MILLIONAFTERSALES TRANSACTIONS
221RETAIL POINTS
TURNOVER£4.7bn
PROFIT BEFORE TAX£65.3m
9,989 EMPLOYEES
AT A GLANCE36 DIRECTORS’ REPORTS
36 Board of Directors 37 Corporate Governance Report 42 Corporate Social Responsibility Report 44 Committee Reports 50 Directors’ Remuneration Report 63 Directors’ Report 66 Directors’ Responsibility Statement
GOVERNANCE
67 INDEPENDENT AUDITOR’S REPORT
73 FINANCIAL STATEMENTS 73 Consolidated Income Statement 74 Consolidated Statement of Comprehensive Income 75 Consolidated Statement of Changes in Equity 76 Consolidated Balance Sheet 77 Consolidated Cash Flow Statement 78 Reconciliation of Net Cash Flow to Movement in Net Debt 79 Notes to the Financial Statements 144 Company Balance Sheet 145 Company Statement of Comprehensive Income 146 Company Statement of Changes in Equity 147 Notes to the Financial Statements of the Company 155 Advisors, Banks and Shareholder Information 156 5 Year Group Review
FINANCIALS
22
NOTE: Throughout this document, Alternative Performance Measures have been used which are non-GAAP measures that are presented to provide readers with additional financial information that is regularly reported and discussed by management to review performance and should not be viewed in isolation or as an alternative to the equivalent GAAP measure, see note 1 of the Financial Statements for details.
WORLDWIDE
BRANDS

2LOCATIONS
Jaguar
11
Mercedes-Benz
8
Harley-Davidson
2
BMW
7
MINI
7
Aston Martin
3
Porsche
5
Smart
6
Ferrari
1
Jaguar
4
Land Rover
4
Aston Martin
1
Used Non-Franchise
27Ford
39
Renault
6
Kia
3
Hyundai
4
Vauxhall
32
Peugeot
6
Citroën
16
Nissan
4
SEAT
1
Land Rover
13
DAF
4
Dacia
6
Chevrolet
1

3
Stratstone 63
USA/Others 20
Map does not show
support business locations
nor those in USA
Evans Halshaw 121
Used Non-franchise 27

4OUR OPERATIONAL AND FINANCIAL HIGHLIGHTS
REVENUE
£4,739.1m
2015
4,453.9
2016
4,537.0
2017
4,739.1
GROSS PROFIT
£552.9m
2015 2016 2017
552.9548.9 559.6
GROSS MARGIN
11.7%
2015 2016 2017
12.3 12.311.7
2015
100.5
2016
101.2
2017
UNDERLYING
OPERATING PROFIT
£83.8m
83.8
2015 2016 2017
UNDERLYING
EPS
3.3p
3.7 3.9
3.3
£60.4m
2015 2016 2017
70.175.4
UNDERLYING PROFIT
BEFORE TAX
60.4
2015
79.6
2016
91.7
2017
NET DEBT
£124.1m
124.1
2015
121.7
2016
100.4
2017
OPERATING PROFIT
£91.4m
91.4
2015
79.0
2016
73.0
2017
PROFIT BEFORE TAX
£65.3m
65.3
NOTE: Throughout this document, Alternative Performance Measures have been used which are non-GAAP measures that are presented to provide readers with additional financial information that is regularly reviewed by management and should not be viewed in isolation or as an alternative to the equivalent GAAP measure, see note 1 of the Financial Statements for details.

5
Aftersales £387.6m
Used £2,211.2m
New £2,059.6m
Software & Leasing £80.7m
REVENUE
BY SECTOR
Aftersales £210.8m
Used £161.1m
New £153.3m
Software & Leasing £27.7m
GROSS PROFIT
BY SECTOR
REVENUE
BY SEGMENT
UK Motor £4,243.6m
US Motor £414.8m
Software £15.8m
Leasing £64.9m
GROSS PROFIT MARGIN
BY SECTOR
Aftersales
Used
New
Software & Leasing
54.4%
7.3%
7.4%
34.3%
UNDERLYING OPERATING MARGIN
BY SEGMENT
1.2%
2.6%
69.0%
15.1%
UK Motor
US Motor
Software
Leasing
UNDERLYING OPERATING PROFIT
BY SEGMENT
UK Motor £52.3m
US Motor £10.8m
Software £10.9m
Leasing £9.8m

6
The UK’s largest automotive online retailer continues tomake significant progress
Strategic Highlights
The strategy of the business has four main components:
• Software and Online Technologies - Online and technology at the heart of our business transformation, providing the online platform for our customers and our Motor business. Global opportunity for software system with deployment in Europe, Africa and Asia Pacific.
• Reshaping of the Business – Acceleration of the transformation of the business, to deliver a market leading share in used vehicle and aftersales markets.
• Double Used Vehicle Revenue - Double our used vehicle revenue over the five years to 2021 with investment in capacity in the UK.
• Capital Allocation Focus - Disposal process underway to achieve a reduction in our UK Premium franchise locations and disposal of the US business.
The Board committed to this strategy to achieve more
reliable and sustainable returns and a higher value business.
Operational and Financial Highlights
• Used Revenue Up 15.3% (L4L) – Further strong growth against a backdrop of a challenging economic environment and lower consumer confidence.
• Aftersales Revenue Up 6.9% (L4L) – Continuing growth due to own initiatives and favourable market conditions.
• New Revenue Down 4.9% (L4L) – Reduction in new vehicle revenue, particularly in the third quarter. UK retail national registrations in our brands fell by 8.0% in the year.
• Gross Margin Movement in Third Quarter – Gross margin fell by 80 basis points over the prior year quarter, due to a reduction in new and nearly new vehicle margin primarily in the premium sector in the third quarter, which also impacted used vehicle margin in the same period.
• Gross Margin Recovered in the Fourth Quarter – Gross margin in new and used vehicle margins recovered to more normal seasonal levels in the fourth quarter.
• Software Revenue Up 9.7% - Double digit growth in gross profit and operating profit up £0.9m.
• Leasing Revenue Up 39.0% - Double digit growth in gross profit and operating profit up £4.8m.
• Underlying Profit Before Tax £60.4m – Underlying profit before tax down £15.0m due to reduction in new revenue in the year and the margin impacts in the third quarter.
• Robust Balance Sheet – Strong balance sheet and still trading below the Net Debt: EBITDA target of 1 to 1.5.
REVENUE
£4,665.9(+5.1%)
* like for like results include only current trading businesses which have a 12 month comparative history** underlying results that exclude items that are not incurred in the normal course of business and are sufficiently significant and/or irregular to impact the underlying trends in the businessNOTE: Throughout this document, Alternative Performance Measures have been used which are non-GAAP measures that are presented to provide readers with additional financial information that is regularly reviewed by management and should not be viewed in isolation or as an alternative to the equivalent GAAP measure, see note 1 of the Financial Statements for details.
£4,739.1(+4.5%)
£4,739.1(+4.5%)
£546.3(-1.0%)
£552.9(-1.2%)
£552.9(-1.2%)
GROSS PROFIT
£85.8(-16.1%)
£83.8(-17.2%)
£91.4M(-9.0%)
OPERATING PROFIT
£62.4(-18.4%)
£60.4(-19.9%)
£65.3(-10.5%)
PBT
N/A
3.3p(-15.4%)
3.7p(-2.6%)
EPS
LIKE FOR LIKE*
UNDERLYING**
TOTAL
£M
CHAIRMAN’S HIGHLIGHTS

7
Outlook
During 2017 the Board undertook a strategic review and
committed to focussing on reshaping the business to
provide more reliable and sustainable returns. In December
we announced that we would also be taking specific actions
on our strategic objectives.
In the automotive software and online market we believe
there is a global opportunity for growth. Our Software
business is a unique asset, well placed to capture the global
opportunity, which is at the heart of our business. We are
setting our objective to achieve at least double digit growth
in revenue in the Software business.
We believe that the UK market for used vehicle sales and
the aftersales opportunity will continue to grow. We remain
committed to our goal to double used vehicle revenue
over the five years to 2021 and we will continue to invest in
capacity to grow our used vehicle and aftersales business.
We broadly concur with the SMMT forecast for UK new car
registrations being 6% lower in 2018 and 2% lower in 2019.
We will be reducing the number of our Premium brand
franchise locations over the next three years. As a result this
will release £100m of capital through a mixture of disposal
proceeds and investment not deployed. Given the strong
performance of our US Motor Group, we have concluded
that it is economically right to sell the business at this time
to realise value.
Following a challenging trading period in quarter three of
2017 in particular, we experienced a recovery in quarter
four and expect to make progress in 2018 on our strategic
objectives. We anticipate our performance in 2018 to be in
line with expectations.
Chris Chambers
Chairman

8
1.12m
1.42m
INDUSTRY INSIGHT
PRIVATE FLEET/BUSINESS PENDRAGON FORECAST
UK NEW CAR MARKET
Source: SMMT (2013 to 2017) and Pendragon (2018 to 2019)
3.0m
2.8m
2.6m
2.4m
2.2m
2.0m
1.8m
1.6m
1.4m
1.2m
1.0m
0.8m
0.6m
0.4m
0.2m
0
2.27m
2013 2014 2015 2016
1.08m
UK CAR PARC BY AGE OF VEHICLE
Source: Callcredit (2014 to 2017) and Pendragon (2018 to 2019)
10.0m
9.0m
8.0m
7.0m
6.0m
5.0m
4.0m
3.0m
2.0m
1.0m
0
0-3 YEARS 4-6 YEARS 7-10 YEARS 11-15 YEARS
2017
20
14
20
15
20
16
20
17
2019
>15 YEARS
20
18
20
14
20
15
20
16
20
17
20
18
20
14
20
15
20
16
20
17
20
18
20
14
20
15
20
16
20
17
20
18
20
14
20
15
20
16
20
17
20
18
1.19m
2.48m
1.18m
1.30m
2.63m
1.21m
1.42m
2.69m
1.21m
1.48m
2.54m2.38m
20
19
20
19
20
19
20
19
20
19
2.33m
2018
Units
Units

9
UK USED CAR MARKET
Source: Callcredit (2015 to 2017) and Pendragon (2018 to 2021)
10.0m
8.0m
6.0m
4.0m
2.0m
02015 2016 2017 2018
USED CAR MARKETThe used car market in 2017 was 7.78 million units, which
was a minor fall of 1.2% over 2016 and represents a market
opportunity that is 3.1 times the size of the new car market.
Despite challenging economic conditions, the used market is
more stable and provides a more reliable supply chain than
the new vehicle sector. We believe the market will grow by
around 1.0% in 2018.
AFTERSALES CAR MARKETThe main determinant of the aftersales market is the number
of vehicles on the road, known as the ‘car parc’. The car
parc in the UK has risen to over 34 million vehicles in 2017,
a rise of 1.6% on the prior year. The car parc can also be
segmented into markets representing different age groups.
Typically, around 22% of the car parc is represented by less
than three year old cars, around 18% is represented by four
to six year old cars and 60% is greater than seven year old
cars. The demand for servicing and repair activity is less im-
pacted than other sectors by adverse economic conditions,
as motor vehicles require regular maintenance and repair for
safety, economy and performance reasons.
Overall, we expect at least for the next three years to see
good continuing growth in the car parc, with higher growth
expected in vehicles over four years of age.
2019 2020
7.4m7.9m 7.8m 7.9m 7.9m 8.0m
2021
8.1m
Units

10
NEW CAR MARKETThe UK new car market was 2.540 million in the period which
is a reduction of 5.6% over the prior year. The UK new car
market is divided into two markets, retail and fleet. The
retail market is the direct selling of vehicle units to individual
customers and operates at a higher margin than the fleet
market. The retail market is the key market opportunity for
the Group within the new car market and represents 44%
of the total market in 2017. The fleet market represents the
sale of multiple vehicles to businesses, and is predominately
transacted at a lower margin and consumes higher levels
of working capital than retail, and represented 56% of the
market in 2017.
The new retail market has followed a somewhat unusual
trend during the year. In quarter one, the retail market
was up 3.6%, partly due to the impact of Vehicle Excise
Duty taxes which increased on 1 April 2017 which pulled
some registration activity into the first quarter of the year.
Consequently the quarter two retail market was 16.5% behind
the prior year. In quarter three the retail market was 8.5%
behind the prior year and in quarter four the retail market
was 10.1% behind the prior year.
INDUSTRY INSIGHT
NEW CAR VEHICLE REGISTRATIONS FOR YEAR ENDED 31 DECEMBER ('000)
2017 2016 Change %
UK Retail Market 1,123.9 1,206.3 -6.8%
UK Fleet Market 1,416.8 1,486.5 -4.7%
UK New Market 2,540.7 2,692.8 -5.6%
Group Represented* UK Retail Market 746.4 811.1 -8.0%
Group Represented* UK Fleet Market 992.0 1,052.3 -5.7%
Group Represented* UK New Market 1,738.4 1,863.4 -6.7%
Source: new car vehicle registrations data from the ‘Society of Motor Manufacturers and Traders’.*Group Represented is defined as national registrations for the franchised brands that the Group represents as a franchised dealer.
Our expectations are that the full year 2018 market will be
around 6.6% below 2017, with the retail market 8.8% lower.
We believe that the first half of 2018 will have a higher
degree of decline than the second half of the year due to
the stronger comparatives and the new market returning
towards more normal levels of activity in the second half.
The Society of Motor Manufacturers and Traders (‘SMMT’) is
currently forecasting that the 2018 market will be 5.6% lower.

11

12
The UK’s leading vehicle online retailer with 184 franchise points and 27 used retail points. We represent a range of volume
and premium products that we sell and service which include: Aston Martin, BMW, Citroën, Dacia, DAF, Ferrari, Ford, Harley-
Davidson, Hyundai, Jaguar, Land Rover, Kia, Mercedes-Benz, MINI, Nissan, Peugeot, Porsche, Renault, SEAT, Smart and Vauxhall.
OUR BUSINESS
UK MOTOR
Our Software business (‘Pinewood’) is at the heart of our strategic plan to revolutionise the business to be fully online and
provide the technology platform to transform the way we do business for our team members and customers.
SOFTWARE
REVENUE
£4,117.9m
2016 2017
Aftersales Used New
£4,243.6m
333.2
1,939.4
1,845.3
GROSS PROFIT
£490.7m
2016 2017
Aftersales Used New
£471.0m
190.8
142.3
157.6
OPERATING PROFIT
£74.0m £52.3m
OPERATING MARGIN
1.8% 1.2%
GROSS MARGIN
11.9% 11.1%
2016 2017
2016 2017
2016 2017
REVENUE
£14.4m
2016 2017
£15.8m
GROSS PROFIT
£12.3m
2016 2017
£13.8m £10.0m £10.9m
69.4% 69.0%
85.4% 87.3%
2016 2017
2016 2017
2016 2017
OPERATING PROFIT
OPERATING MARGIN
GROSS MARGIN
350.6
1,767.5
2,125.5191.2
123.5
156.3

13
Leasing comprises our fleet and contract hire vehicle activity. Our leasing business trades under the ‘Pendragon Vehicle
Management’ brand and offers a complete range of fleet leasing and management facilities from the initial consultation of
fleet policies to vehicle disposal. Our customers are varied in both fleet size and business sector. Our services are delivered by
maximising the facilities of our wider Group, as well as working very closely with market leading partners.
LEASING
REVENUE
£46.7m
2016 2017
£64.9m
GROSS PROFIT
£9.0m
2016 2017
£13.9m £5.0m £9.8m
10.7% 15.1%
19.3% 21.4%
2016 2017
2016 2017
2016 2017
OPERATING PROFIT
OPERATING MARGIN
GROSS MARGIN
US Motor is our US retail vehicle business which is based in California. The business operates from ten franchise points
representing the following products that we sell and service: Aston Martin, Chevrolet, Jaguar and Land Rover.
US MOTOR
REVENUE
£358.0m
2016 2017
£414.8m
32.6
247.1
78.3
GROSS PROFIT
£47.6m
2016 2017
£54.2m
17.1
26.1
4.4
£12.2m £10.8m
3.4% 2.6%
13.3% 13.1%
2016 2017
2016 2017
2016 2017
37.0
292.1
85.719.6
29.8
4.8
Aftersales Used New Aftersales Used New
OPERATING PROFIT
OPERATING MARGIN
GROSS MARGIN

14OUR BUSINESS

15
Trevor Finn
Chief Executive Officer
“The Group has a clear focus and direction to transform
the business and double used revenue by 2021.
This will be enabled by our market leading software
business to provide the online and technology platform
and by investment in increasing the used retail and
aftersales representation points in the UK.
We made further progress towards our goal of doubling
used vehicle revenue with growth in the period of 15%.
We anticipate our performance in 2018 to be in line with
expectations.”

16
SOFTWARE - ONLINE TRANSFORMATION
BUSINESS MODEL
NEWSelling of a new car or commercial vehicle (1st registration)
USEDSelling of all vehicles except new vehicles �(as�defined�above)
AFTERSALESEncompasses the service, maintenance and repair of vehicles (including vehicle part sales��and�body�shop�repairs)
MOTOR DIVISIONSCUSTOMER RESEARCH
FEEDBACK Our People &Customer Service PLCPendragon
Aftersales�activity�creates�opportunity�for used vehicle sale tomorrow
Used�activity�creates a new vehicle��opportunity�tomorrow
PURCHASE
PURCHASE
PURCHASE
New vehicle sale creates part-exchange opportunity�in��used�today
Used vehicle sale creates aftersales revenue�today�and�opportunity�tomorrow
New vehicle sale creates aftersales
revenue�today�and�opportunity�
tomorrow
Aftersales activity�creates
opportunity�for new
vehicle sale tomorrow
Evans Halshaw • Quicks • Stratstone
Evanshalshaw.com Stratstone.com USA
LEASING
Contract Hire Leasing

17VIABILITY STATEMENT
VIABILITY STATEMENT In accordance with provision C.2.2 of the UK Corporate
Governance Code, published by the Financial Reporting
Council in September 2014 (the ‘Code’), the directors have
assessed the viability of the company over the three year
period to 31 December 2020.
The directors believe this period to be appropriate as:
i) The Group’s detailed plan encompasses this period.
ii) We typically, at inception, look to attain a revolving credit
facility for at least four years.
The three-year strategic review considers the Group’s profit
and loss, cash flows, debt and other key financial ratios
over the period. These metrics are subject to sensitivity
analysis which involves flexing one of the main assumptions
underlying the forecast. Where appropriate, this analysis is
carried out to evaluate the potential impact of the Group’s
principal risks actually occurring. The three-year review also
makes certain assumptions about the normal level of capital
recycling likely to occur and considers whether additional
financing facilities will be required.
Based on the results of this analysis, the directors have a
reasonable expectation that the company will be able to
continue in operation, comply with facility covenants and
meet its liabilities as they fall due over the three year period
of their assessment.
In addition, further discussion of the principal risks and
material uncertainties affecting Pendragon PLC can be
found within the Annual Report and Accounts on pages
20 to 24. The risk disclosures section of the consolidated
financial statements set out the principal risks the Group
is exposed to, including insurance, market, liquidity, credit,
operational and strategic, together with the Group’s policies
for monitoring, managing and mitigating its exposures to
these risks. The Board considers risks during the year on
triannual basis through the Risk Control Group and annually
at a Board meeting with ad hoc reporting as required.
The principal risks and the mitigation steps that the Board
considered as part of this viability statement were as follows:
• The ability to adopt and implement an appropriate
strategy, including our goal to double used vehicle
revenue over five years to 2021 with investment in
capacity in the UK and the implementation of the
disposals we announced in 2017. This is mitigated by our
management information and market data, appropriate
investment, monitoring of our performance and focus on
financial discipline.
• The availability of debt funding which is mitigated by
maintaining adequate committed, diversified funding
sources.
• The ability to adapt to changing environments outside
our direct control such as macro-economic, political and
environmental factors, regulation changes, manufacturer
and competitor behaviour. In particular the Board
reviewed the causes and consequences of the reduction
in profitability in the third quarter in assessing the risks.
We mitigate these risks through the diverse revenue
generation from all parts of the vehicle cycle and wide
range of franchise representation together with regular
monitoring to identify changes quickly.
During 2017, the Board carried out a robust assessment of
the principal risks facing the Group, including those that
would threaten its business model, future performance,
solvency or liquidity. The directors believe that the Group
is well placed to manage its business risks successfully,
having taken into account the current economic outlook.
Accordingly, the Board believes that, taking into account the
Group’s current position, and subject to the principal risks
faced by the business, the Group will be able to continue in
operation and to meet its liabilities as they fall due for the
period up to 31 December 2020.

18KEY PERFORMANCE INDICATORS
KPI
UnderlyingEPS
Aftersales Retail Labour
Sales
UnderlyingPBT
UsedRevenue
Operating Margin
Net Debt
Online Growth
Definition Performance
Str
ate
gic
/O
pera
tio
nal K
PIs
*F
inan
cia
l K
PIs
*
Underlying�profit�after�tax�divided�by�weighted�average�number�of�shares
Underlying�profit�before�tax�excludes items that are not incurred in�the�normal�course�of�business�and�are�sufficiently�significant�and/or�irregular�to�impact�the�underlying�trends�in�the�business
Underlying�operating�profit�divided�by�underlying�revenue
Net�Debt�:�underlying�EBITDA�is�the�ratio�of�our�net�debt�to�underlying�EBITDA
Retail�labour�sales�is�activity�direct�to consumers for the servicing and repair of motor vehicles (like for like)
All used revenues (like for like)
Website�visits�to�Evanshalshaw.com and Stratstone.com (excluding Apps)
FY17�–�Underlying�EPS�of�3.3pFY16�–�Underlying�EPS�of�3.9pDecrease�of�15.4%�year�on�year���
FY17�–�Underlying�PBT�£60.4mFY16�–�Underlying�PBT�£75.4mDecrease�of�19.9%�year�on�year���
FY17 – Operating margin 1.8%FY16 – Operating margin 2.2%Decrease�of�18.1%�year�on�year
FY17�–�Ratio�0.9FY16�–�Ratio�0.6The�Group�has�increased�net�debt�by�£32.4m�and�decreased�underlying�EBITDA�by�£13.3m
FY17�–�Retail�growth�3.4%FY16 – Retail growth 4.5%Retail�labour�sales�growth�
FY17�–�Used�revenue�£2,159.7mFY16�–�Used�revenue�£1,872.5mImprovement�of�15.3%�year�on�year
FY17�–�27.3m�visitorsFY16 – 22.7m visitorsImprovement�of�20.3%�year�on�year
NOTE: Throughout this document, Alternative Performance Measures have been used which are non-GAAP measures that are presented to provide readers with additional financial information that is regularly reviewed by management and should not be viewed in isolation or as an alternative to the equivalent GAAP measure, see note 1 of the Financial Statements for details.

19
ALL
Risk Factor Link Business Model ImpactAftersales
ALL
3 4 7 8
1 6
1 2 3 5 10
1 8
1 2 3 4 5 10
Used New Support
✓
✓
✓ ✓ ✓ ✓
✓ ✓ ✓ ✓
✓ ✓ ✓ ✓
✓ ✓ ✓ ✓
✓ ✓ ✓ ✓

20
PRINCIPAL RISKS Recognising that all businesses entail elements of risk, the
Board maintains a policy of continuous identification and
review of risks which may cause our actual future Group
results to differ materially from expected results. The table
on pages 21 to 24 is an overview of the principal risks faced
by the Group, with corresponding controls and mitigating
factors. The specified risks are not intended to represent an
exhaustive list of all potential risks and uncertainties. The risk
factors outlined below should be considered in conjunction
with the Group’s system for managing risk, described below
and in the Corporate Governance Report on page 37.
RISK MANAGEMENT AND INTERNAL CONTROLSAccountability
The Board is responsible for risk management and internal
control within the context of achieving the Group’s objectives.
The system of control the Board has established covers both
the Group’s financial reporting, including the consolidation
process, and the mitigation of business and operational risks.
The system is designed to manage, rather than eliminate, the
risk of failure to achieve business objectives, and can provide
only reasonable and not absolute assurance against material
misstatement or loss.
Financial Reporting
The executive directors oversee the preparation of the Group’s
annual corporate plan; the Board reviews and approves it and
monitors actual performance against it on a monthly basis.
Where appropriate, during the year, revised forecasts are
prepared and presented for Board review and approval. To
ensure that information to be consolidated into the Group’s
financial statements is in compliance with relevant accounting
policies, internal reporting data is comprehensively reviewed.
Reviews of the appropriateness of group accounting policies
take place at least twice a year, under the scrutiny of the
Audit Committee, which considers reports on this from the
Group’s auditor, the application of IFRS and the reliability of
the Group’s system of control of financial information. No
material changes have occurred in 2017 which have or are likely
to have a material effect on the Group’s internal controls over
financial reporting. Controls are designed to ensure that the
Group’s financial reporting presents a true and fair reflection of
the Group’s financial position. The Board has concluded that,
as at 31 December 2017, the Group’s systems of control over
financial reporting were effective.
Operational and Other Risks
Operational management is charged by the Board with
responsibility for identifying and evaluating risks facing the
Group’s businesses on a day-to-day basis and is supported
by the Risk Control Group (RCG), a committee formed of two
executive directors, the company secretary and Group heads
of information technology and internal audit. The approach to
risk control and the work of the RCG are described on page 38.
RISK OVERVIEW AND MANAGEMENT

21
MITIGATIONIMPACT BEFORE MITIGATION
STRATEGY AND BUSINESS RELATIONSHIPS
PRINCIPAL RISKS
We miss our profit growth and/or debt
management target, alienate key stakeholders
and are unable to invest adequately in our
business
We receive complaints or poor customer
satisfaction scores which damage our
reputation and ‘customer service’ strategic
pillar
Our Strategy:
Failure to adopt the right
strategy
or,
Failure of our adopted
strategy to deliver the desired
outcomes
or,
Failure to implement our
strategy effectively
• Our strategy is informed by significant
research and market data
• We communicate effectively our adopted
strategy to our stakeholders
• We invest appropriately in the
technological, physical and human
resources to deliver our strategy, closely
monitor performance against our
objectives, and adjust our actions to meet
our strategic goals
• Our sophisticated management
information identifies threats to the
success of our strategy both during the
planning and implementation phases,
and informs mitigating actions, both
directionally and operationally
• We ensure that we monitor our
manufacturer and third party customer
service measures and take action in the
event of low scores
• We focus strongly on efficient use of
working capital through embedded
disciplines, especially in relation to vehicle
inventory
• We review capital expenditure plans to
ensure our ROI objectives are achievable
Failure of, or weaknesses in, our vehicle
manufacturers’ financial condition, reputation,
marketing, production and distribution
capabilities, and lack of alignment with
manufacturers’ remuneration systems for
dealers impairs our investments and prevents
us achieving our profit goals
Failure to maintain good relations with
our franchisors either through day-to-day
activities or our strategic decisions impairs
our ability to generate good quality earnings
The Manufacturers change the business
model towards direct sales to customers
Our Manufacturer
Relationships:
Dependence on vehicle
manufacturers for the success
of our business
• Our diverse franchise representation
avoids over reliance on any single
manufacturer
• Our close contact with our vehicle
manufacturers seeks to ensure our
respective goals and strategic decisions
are communicated, understood and
aligned, to deliver mutually acceptable
performance
• Our appropriately targeted investment
in franchise assets and our performance
maintains our reputation as a quality
representative for our brand manufacturers
• Our investment in marketing initiatives
and our online presence supplement and
enhance our market presence and offering
over and above manufacturers' marketing
efforts
• Our strategy to develop and maintain
revenues from used vehicles aftersales,
and our software and leasing segments
reduces our overall reliance on new vehicle
franchises
NO.
1
2

22RISK OVERVIEW AND MANAGEMENT
MITIGATIONIMPACT BEFORE MITIGATION
MACRO-ECONOMIC, POLITICAL AND ENVIRONMENTAL
ENVIRONMENTAL
PRINCIPAL RISKS
Vehicle manufacturers oversupply into
UK market or alterations to supply terms,
damages margins and vehicle values
Availability and cost base of appropriate
team member resource to run our business
effectively
Fewer purchasers of vehicles
Lower demand for vehicle servicing
Changes in regulation as a result of the UK
decision to leave the EU or the change in
President in the USA
European economic instability
and/or the UK decision to
leave the EU impacting the
UK, in particular impacting
used vehicle prices
UK or USA economic
and business conditions
deteriorate
UK Governmental spending
constraints
• We carefully control new vehicle inventory
to mitigate effects of overstocking
• We constantly monitor and evaluate
alternative recruitment, training and
apprenticeship methods to fulfil our
employment needs
• Our business model derives revenues from
every stage of the vehicle’s life-cycle and
has expanded into the older vehicle parc
for both vehicle sales and aftersales
• We invest in and vigorously pursue
customer retention initiatives to secure
longer term loyalty
• We monitor diesel sales to maintain an
appropriate inventory profile
Customers choose greener vehicles we
cannot supply
Overall vehicle parc reduces
Vehicle purchase and use declines, adversely
affecting revenue opportunities
Lower demand for diesel vehicles and
potential impact on diesel vehicle residual
values
Government policy and consumer sentiment
in respect of diesel vehicles impacts the sale
of diesel vehicles
Progression towards greener
technologies, autonomous
driving, and/or pay-per-use,
rather than owning a vehicle
UK taxes change to penalise
road use, fuel type, vehicle use
and to increase VAT
• We represent vehicle brands which are
responding effectively to the greener
technology agenda
• We identify trends in demand through our
sophisticated management information
and analysis tools and tailor our model
accordingly
• Our breadth of relationships with asset
finance companies and geographic
footprint help us to provide innovative
mobility solutions for private and business
vehicle users, whatever their needs
• We maintain the right level of tax expertise
to interpret and assess proposed changes,
respond with well-informed advice and
effectively assist our strategic planning
and the design and implementation of
appropriate mitigating actions
NO.
4
5
Customers migrate to alternative
providers
Intermediary companies establish a barrier
between us and our customers
Revenues and profits fall owing to competitor
action
• Our detailed market and sector monitoring
systems assist effective response to
identify early and assist effective response
to any competitive or intermediary threats
• Our scale, expertise and technological
capabilities enable rapid and flexible
response to market opportunities
• Our well-developed customer relationship
management capabilities and online
customer satisfaction tools aim to drive
industry-leading service and attract
customer loyalty
Our Competitors:
Failure to meet competitive
challenges to our business
model or sector
3

23
FINANCE AND TREASURY
Unable to meet debt obligations
Unsustainable demand of funding
occupational pensions schemes
Availability of debt funding
Pension liabilities
• Our business model produces strong free
cash flow generation
• We maintain adequate committed
facilities to meet forecast debt funding
requirements
• Diversification of funding sources, monitor
daily our funding requirements
• Regular review by our pension trustees of
investment strategy and liability reduction
and risk mitigation, taking professional
advice
MITIGATIONIMPACT BEFORE MITIGATION
TECHNOLOGY, INFORMATION SYSTEMS AND ESTIMATES
PRINCIPAL RISKS
Data loss interrupts business, incurs cost
of recreating records, causes loss of or
impairment to financial and operational
control and loss of business opportunities
Website interruptions and other potential
consequences of system failure or cyber
attack
Customer confidence is impaired
Failure of systems
Cyber security
• We adopt and regularly update robust
business continuity measures, including
within our dealer management systems
• Our geographic diversity allows prompt
deployment of key functions to alternative
locations
• Our Pinewood business monitors cyber
security threats and has systems and
processes in place to deal with incidents
LEGAL AND REGULATORY
Resources are diverted to taking proceedings
or defending legal or regulatory action, at the
expense of business efficiency and profit
Reputation is damaged by regulatory censure
or punitive action
Fines and penalties reduce profits
Significant litigation
Regulator action against
or otherwise impacting the
Group
• We maintain the right level of legal
expertise to interpret, assess and respond
to proposed changes in regulation,
enabling us to adapt our model and
processes to comply with changes in a
seamless manner
• Our culture focuses strongly on good
compliance delivering good performance
• Our team of compliance specialists
design, and we communicate effectively,
processes that support our businesses to
minimise the risk of non-compliance
Revenue, profits and reputation all suffer
damage
Group’s financial statements will be wrong,
affecting property valuations, future
warranty costs, vehicle values where we have
committed to purchase at a pre-set price,
and the discounted cashflows used to test
impairment of goodwill
Reputational damage and inability to raise
funding for the Group’s business
Reliance on the use of
significant estimates which
prove to be incorrect
• We assess actual outturns of previous
estimates to test the robustness of
adopted assumptions, and adjust the
estimating approach accordingly
• We support estimates with reliable
external research where available
NO.
8
9
6
7

24
TEAM MEMBERS AND THE ENVIRONMENT WE WORK IN
Poor decision making and inability to deliver
our strategy and meet our business objectives
Lack of innovation in our business
Loss of custom owing to poor quality
customer experience delivered by
demotivated or untrained team members
Illness and injury, lost working time and civil
claims
Reputational damage and clean-up costs,
leading to loss of custom and revenues
Regulatory censure, suspension of business,
convictions and fines; reputational damage,
leading to loss of custom and revenues
Failure to attract, develop,
motivate and retain good
quality team members and
leaders
Failure to provide safe working
and retail environments
Failure to control
environmental hazards
• We invest in online means of attraction and recruitment, targeting the right quality candidates
• We set clear competencies and career goals to prevent mishires
• We continually review and adapt for the market conditions our employment terms, salaries and performance related pay elements at all levels
• We adopt and renew responsive succession plans for all key roles
• We leverage our scale to afford training opportunities and progression within the Group
• We work to the Health & Safety Executive’s ‘Plan, Do, Check, Act’ framework for managing risk in the workplace and our retail spaces
• We allocate clear responsibilities for delivery of safe places to work and shop
• We adopt process-driven initiatives to mitigate specific risk areas
• We measure and review our performance against appropriate benchmarks
• We allocate local accountability for sites’ compliance and provide specialist support to responsible leaders
• We monitor site conditions and drive corrective action through audit follow-up
10
MITIGATIONIMPACT BEFORE MITIGATIONPRINCIPAL RISKSNO.
RISK OVERVIEW AND MANAGEMENT

25

26BUSINESS REVIEW & STRATEGY
(£m)
Underlying 2017 2016 Change (%)
L4L Change (%)
REVENUE
UK Motor 4,243.6 4,117.9 +3.1% +4.0%
Software 15.8 14.4 +9.7% +9.7%
Leasing 64.9 46.7 +39.0% +39.0%
US Motor 414.8 358.0 +15.9% +12.4%
Revenue 4,739.1 4,537.0 +4.5% +5.1%
GROSS PROFIT
UK Motor 471.0 490.7 -4.0% -3.4%
Software 13.8 12.3 +12.2% +12.2%
Leasing 13.9 9.0 +54.4% +54.4%
US Motor 54.2 47.6 +13.9% +9.9%
Gross Profit 552.9 559.6 -1.2% -1.0%
OPERATING PROFIT
UK Motor 52.3 74.0 -29.3% -27.3%
Software 10.9 10.0 +9.0% +9.0%
Leasing 9.8 5.0 +96.0% +96.0%
US Motor 10.8 12.2 -11.5% -13.9%
Operating Profit 83.8 101.2 -17.2% -16.1%
Gross Margin (%) 11.7% 12.3% -0.6% -0.6%
Operating Margin (%) 1.8% 2.2% -0.4% -0.5%
The following business review and strategy has been
approved by the Board.
The business has 4 areas as follows:
• UK Motor – sale and servicing of vehicles in the U.K.
• Software – provides IT solutions for automotive online
retailing
• Leasing – vehicle fleet which provides a stable profitability
stream and used vehicle supply
• US Motor – sale and servicing of vehicles in the U.S.

27
UK MOTOR STRATEGYClear strategy in place to transform the business to deliver
a market leading share in the used vehicle and aftersales
market in the UK following October 2017 strategic review.
Recruitment process underway for a senior executive to lead
our used vehicle operations.
Review Premium brand capital allocation to optimise returns
complete, we will reduce our Premium franchise locations
over a three year period. As a result of this, we will realise
£100 million of capital through a mixture of disposal proceeds
and capital expenditure not made.
BUSINESS REVIEWWe are the UK’s leading vehicle online retailer with 184
franchise points and 27 used retail points. We represent
a range of volume and premium products that we sell and
service which include: Aston Martin, BMW, Citroën, Dacia,
DAF, Ferrari, Ford, Harley-Davidson, Hyundai, Jaguar, Land
Rover, Kia, Mercedes-Benz, MINI, Nissan, Peugeot, Porsche,
Renault, SEAT, Smart and Vauxhall.
The business increased like for like revenue by 4.0% in the
period, largely as a result of used revenue growth of 15.8%,
whilst new vehicle revenue fell by 7.5%. We are delighted to
report that we achieved growth of 15.8% in used in the period
while the used vehicle market fell by 1.6% – further increasing
our market share in the UK. Our used revenue growth
comprised 12.0% from like for like and 3.8% was achieved
from investments in used retail points. We opened the
following seven used retail points in the period: Amersham,
Coventry, Dartford, Glasgow, Gloucester, Reading and
Sunbury. We now have 27 used retail points in total. We are
expecting to open four additional used retail points in the
first half of 2018, with a further four additional sites in the
second half of 2018.
Our aftersales business revenue has grown by 6.5% on a
like for like basis, and whilst there has been some reduction
in gross margin, this is a result of investment in technician
resource which will enhance our aftersales capacity and
activity in the coming year.
As announced on 23 October 2017, we experienced a
downturn in new vehicle activity, this was particularly
evident in the third quarter of the year, leading to lower than
expected volumes and margins from new vehicles. This had
a knock-on impact on the value of premium used vehicles,
which impacted our used margin in quarter three of the
year. We are pleased to report that new and used margin
recovered to more normalised seasonal levels in quarter
four and confirms the margin impact was only temporary.
We have assessed the new vehicle market and believe that
the market is moderating to a more normalised level. To
support this, industry data indicates that the rate of new
vehicles being sold on finance and the proportion of those
finance sales on a PCP product became flat in 2016.
UK MOTOR (£m)
Underlying 2017 2016 Change (%)
L4L Change (%)
REVENUE
Used 2,125.5 1,845.3 +15.2% +15.8%
Aftersales 350.6 333.2 +5.2% +6.5%
New 1,767.5 1,939.4 -8.9% -7.5%
Revenue 4,243.6 4,117.9 +3.1% +4.0%
GROSS PROFIT
Used 156.3 157.6 -0.8% -1.0%
Aftersales 191.2 190.8 +0.2% +1.1%
New 123.5 142.3 -13.2% -12.3%
Gross Profit 471.0 490.7 -4.0% -3.4%
Operating Costs (418.7) (416.7) +0.5% +1.0%
Operating Profit 52.3 74.0 -29.3% -27.2%
GROSS PROFIT MARGIN %
Used 7.4% 8.5% -1.1% -1.4%
Aftersales 54.5% 57.3% -2.8% -2.9%
New 7.0% 7.3% -0.3% -0.3%
Gross Margin (%) 11.1% 11.9% -0.8% -0.9%
Operating Margin (%) 1.2% 1.8% -0.6% -0.6%

28
BUSINESS REVIEWDuring the period we achieved double digit growth in
revenue and gross profit which is a result of the ongoing
growth in the UK, South Africa and initial deployment in
new territories. The income stream from this business
continues to accelerate and the business model provides
a gross margin in excess of 85.0% with strong recurring
revenue. Pinewood continues to expand globally and is
accelerating its representation and implementations in a
number of countries worldwide. Pinewood has installations
in Europe in the UK, Switzerland and the Netherlands. In
Africa, Pinewood has installations in South Africa, Namibia
and Zimbabwe. Pinewood has recently expanded into Asia
Pacific and has an Asia Pacific representative in Hong Kong,
along with two installations in Hong Kong.
We continue to see significant growth in our online business,
with visits to Evanshalshaw.com and Stratstone.com up
20.3% to 27.3 million visitors from 22.1 million visitors in the
prior year. We are investing in further online capability and
platforms to ensure we provide best in class service to our
customers.
SOFTWARE (£m)
Underlying 2017 2016 Change (%)
L4L Change (%)
Revenue 15.8 14.4 +9.7% +9.7%
Gross Profit 13.8 12.3 +12.2% +12.2%
Operating Costs (2.9) (2.3) +26.1% +26.1%
Operating Profit 10.9 10.0 +9.0% +9.0%
Gross Profit % 87.3% 85.4% +1.9% +1.9%
Operating Profit 69.0% 69.4% -0.4% -0.4%
BUSINESS REVIEW & STRATEGY
SOFTWARE STRATEGYOur software business (‘Pinewood’) is at the heart of our
strategic plan to revolutionise the business to have full
online capability and provide the technology platform to
transform the way we do business for our team members
and customers.
We are setting our objective to achieve at least double
digit growth in revenue in the Software business. We have
a strong track record and whilst historically the business
achieved this growth in the UK, more recently the business
has been expanding outside of the UK.
We expect to continue to expand globally and accelerate
our representation and implementations in a number of
countries worldwide. Pinewood has representation in
Europe, Africa and Asia Pacific and is actively expanding the
business in these territories.
Progress is being made on our new website platform for
rollout in quarter one of 2018.

29
LEASING STRATEGYMaintain at least double digit growth in business in revenue
and gross profit.
Provide a used vehicle supply to the Group to assist with
achieving the doubling of used revenue by 2021.
BUSINESS REVIEWLeasing comprises our fleet and contract hire vehicle
activity. Our Leasing business trades under the ‘Pendragon
Vehicle Management’ brand and offers a complete range of
fleet leasing and management solutions. Our customers are
varied in both fleet size and business sector. Our services
are delivered by maximising the facilities of our wider Group,
as well as working very closely with market leading partners.
Significant growth in the Leasing business was achieved in
the period with operating profit up £4.8m (+96.0%). Revenue
increased by 39.0% and gross profit by 54.4% as a result of
the continued growth of the vehicle fleet. During the year
46.2% of vehicles defleeted were sold within the UK Motor
Group. We are pleased with the increasing contribution that
this business is providing to the Group and the strong used
vehicle supply it generates for our UK Motor business.
LEASING (£m)
Underlying 2017 2016 Change (%)
L4L Change (%)
Revenue 64.9 46.7 +39.0% +39.0%
Gross Profit 13.9 9.0 +54.4% +54.4%
Operating Costs (4.1) (4.0) +2.5% +2.5%
Operating Profit 9.8 5.0 +96.0% +96.0%
Gross Profit % 21.4% 19.3% +2.1% +2.1%
Operating Profit 15.1% 10.7% +4.4% +4.4%

30BUSINESS REVIEW & STRATEGY
US MOTOR STRATEGYWe will be selling the US Motor Group, as we have concluded
that is economically right to sell the business at this time to
realise its value. We are expecting proceeds in excess of
£100.0 million before tax.
BUSINESS REVIEWUS Motor is our US retail vehicle business which is based in
California. The business operates from ten franchise points
representing the following products that we sell and service:
Aston Martin, Chevrolet, Jaguar and Land Rover.
US Motor division results are in line with expectations in
2017 following exceptional results in the prior year. There
has been very strong performance in aftersales with revenue
up 11.0% and gross profit up 11.7% on a like for like basis. In
the US, we also have not seen any reduction in new vehicle
activity, with new gross profit up 14.2% in the period and up
10.3% on a like for like basis. In September 2017 we acquired
the Chevrolet franchise in Puente Hills, California which was
earnings enhancing for the remainder of the year. During
the year, we settled an employment related class action at a
cost of £1.3 million.
US MOTOR (£m)
Underlying 2017 2016 Change (%)
L4L Change (%)
REVENUE
Used 85.7 78.3 +9.5% +5.0%
Aftersales 37.0 32.6 +13.5% +11.0%
New 292.1 247.1 +18.2% +15.0%
Revenue 414.8 358.0 +15.9% +12.4%
GROSS PROFIT
Used 4.8 4.4 +9.1% +0.0%
Aftersales 19.6 17.1 +14.6% +11.7%
New 29.8 26.1 +14.2% +10.3%
Gross Profit 54.2 47.6 +13.9% +9.9%
Operating Costs (43.4) (35.4) +22.6% +18.1%
Operating Profit 10.8 12.2 -11.5% -13.9%
GROSS PROFIT MARGIN %
Used 5.6% 5.6% +0.0% -0.2%
Aftersales 53.0% 52.5% +0.5% +0.3%
New 10.2% 10.6% -0.4% -0.5%
Gross Profit 13.1% 13.3% -0.2% -0.3%
Operating Margin (%) 2.6% 3.4% -0.8% -0.8%

31

32FINANCIAL REVIEW
FINANCIAL SUMMARY HIGHLIGHTSThe Group has achieved an underlying profit before tax
of £60.4m in the period despite more difficult trading
conditions in the third quarter of the year. Overall profit
after tax was £53.3m in the period, 4.0% behind the prior
year. The Group’s revenue increased by 4.5% in the period
largely as a result of used vehicle revenue improvements, the
key strategic growth objective for the Group. Encouragingly
in the period, on a like for like basis, the rate of growth of
costs1 was 2.3% versus a revenue increase of 5.1%. The ratio
of underlying operating costs to revenue fell from 10.1% to
9.9% in the period, and we expect to be further improving
this ratio in 2018.
CAPITAL ALLOCATIONWe have reviewed our capital allocation as part of a strategic
review of our business which was conducted at the end of
2017. We will be selling the US Motor Group, as we have
concluded that it is economically right to sell the business at
this time to realise its value. We are expecting proceeds in
excess of £100.0 million before tax.
We have also reviewed our capital allocation within our
Premium brands and concluded that we will reduce our
Premium franchise locations over a three year period. As a
result of this, we will release £100.0 million of capital through
a mixture of disposal proceeds and investment not deployed.
The Group intends to complete the deployment of a national
footprint in the UK for the Evans Halshaw Used Vehicle
business, Evans Halshaw CarStore.
Given the Group is currently trading below our target
range for the net debt to underlying EBITDA ratio, the
Board considered the Group’s capital structure and capital
allocation priorities with a view to a return of surplus cash to
shareholders. The Board believes the Group will continue to
generate strong cash flows and, after assessing the capital
needs of the business and the current leverage position, has
restarted the share buyback programme in December 2017.
The Board has ongoing capital expenditure requirements,
and will continue to pursue organic and acquisitive growth
and investment opportunities, including potential repurchase
of leasehold properties and evaluate them against the returns
generated via the share buyback programme. The buyback
programme is capable of being stopped and restarted.
This flexibility will enable the Group to pursue other, higher
returning, capital allocation opportunities if they arise.
SUMMARY OF FINANCIALS
£m
UNDERLYING* TOTAL
2017 2016 YOY Change % 2017 2016 YOY
Change %
Revenue 4,739.1 4,537.0 +4.5% 4,739.1 4,537.0 + 4.5%
Gross Profit 552.9 559.6 -1.2% 552.9 559.6 -1.2%
Operating Profit 83.8 101.2 -17.2% 91.4 100.4 -9.0%
Interest (23.4) (25.8) -9.3% (26.1) (27.4) -4.7%
Profit Before Taxation 60.4 75.4 -19.9% 65.3 73.0 -10.5%
Tax (12.8) (19.1) -33.0% (12.0) (17.5) -31.4%
Profit After Taxation 47.6 56.3 -15.5% 53.3 55.5 -4.0%
Earnings Per Share (p) 3.3p 3.9p -15.4% 3.7p 3.8p -2.6%
Dividend Per Share (p)** 1.55p 1.45p 6.9% 1.55p 1.45p +6.9%
Gross Margin (%) 11.7% 12.3% 0.6% 11.7% 12.3% 0.6%
Operating Margin (%) 1.8% 2.2% -0.4% 1.9% 2.2% -0.3%
* Underlying results, where stated, exclude items that are not incurred in the normal course of business and are sufficiently significant and/or irregular to impact the underlying trends in the business. ** Dividend paid at interim and proposed for final year dividend.
A summary of the reported results for the year ended 31 December 2017 and 31 December 2016 is set out below:
1 – costs are operating costs on a like for like basis (like for like is defined in the alternative performances measures in note 1 of the financial statements)

33

34FINANCIAL REVIEW
BALANCE SHEET AND CASH FLOWThe Group has a strong balance sheet and low debt level and
is in a strong position to reinvest at the appropriate return on
investment. The following table summarises the cash flows
and net debt of the Group for the twelve month periods
ended 31 December 2017 and 31 December 2016 as follows:
SUMMARY CASHFLOW AND NET DEBT (£m)
2017 2016
Underlying Operating Profit Before Other Income 83.8 101.2
Depreciation and Amortisation 28.5 29.9
Share Based Payments (1.7) 2.2
Working Capital and Contract Hire Vehicle Movements 18.3 (30.7)
Operating Cash Flow 128.9 102.6
Tax Paid (16.1) (17.3)
Underlying Net Interest Paid (20.0) (25.2)
Capital Expenditure – 40 Site Roll-Out (17.5) (7.0)
Capital Expenditure – Franchise (25.5) (16.2)
Capital Expenditure – Underlying Replacement (13.8) (26.2)
Capital Expenditure – Business Acquisitions (17.8) (2.6)
Capital Expenditure – Property (24.6) (8.8)
Business and Property Disposals 2.5 17.0
Net Franchise Capital Expenditure (96.7) (43.8)
Dividends (21.3) (20.3)
Share Buybacks (4.0) (7.5)
Other (3.2) (0.6)
(Increase)/Reduction In Net Debt (32.4) (12.1)
Opening Net Debt (91.7) (79.6)
Closing Net Debt (124.1) (91.7)
PROPERTY AND INVESTMENT, ACQUISITIONS AND DISPOSALSOur property portfolio provides a key strength for our
business. At 31 December 2017, the Group had £261.2 million
of land and property assets (2016 : £199.3 million) and
property assets for sale of £11.0 million (2016 : £6.6 million).
During the last two years we have taken the opportunity
to acquire the freehold on some existing leased premises,
purchasing £15.6 million in the period, versus £4.1 million
in the prior year. We have also acquired £9.0m of other
freehold property for development.
DIVIDENDThe Group is proposing a final dividend of 0.8p per share
in respect of 2017, bringing the full year dividend to 1.55p
per share. We intend to maintain a progressive dividend
approach in the future.
The proposed final dividend will be paid on 23 May 2018 for
those shares recorded on 20 April 2018.
Approved by order of the Board
Trevor Finn
Chief Executive Officer
13 February 2018

35
SHARES REPURCHASED AND BUYBACKDuring the year the Group repurchased £4.0 million of its
own shares, after initiating a £20.0 million share buyback
programme in May 2016. The programme was suspended
from April 2017 and restarted in December 2017. The total
amount repurchased under the programme to date is £11.5m
with 35.5m shares cancelled. This represents 2.5% of the
shares at inception of the buyback programme. The Group
also purchased £2.8 million (2016 : £0.3 million) of shares in
respect of LTIP and options.
PENSIONSThe net liability for defined benefit pension scheme
obligations has decreased from £103.2 million at 31 December
2016 to £62.8 million at 31 December 2017. This decrease in
obligations of £40.4 million is largely due to improvements
in financial or mortality assumptions. Following the full
actuarial valuation of the company’s pension scheme at
31 December 2015 showing a deficit of £35.1 million, the
company and trustees agreed to raise its annual contribution
to the pension scheme to £7.0 million from 1 January 2017
increasing by 2.25% per annum thereafter until July 2022,
from £3.1 million contributions in 2016.

36
Chris Chambers†
Non-executive Chairman (N*) (R)
Chris joined Pendragon on 28 January 2013 and became
chairman on 23 October 2017. He is a banker with particular
expertise in retail and property, and is chairman of Leonteq,
Lonrho and a member of the supervisory board of Berenberg
Bank.
Gillian Kent
Non-executive Director (A) (N) (R)
Gillian joined Pendragon on 23 May 2013. Formerly managing
director of MSN, UK, her expertise is in building markets
and brands for online consumer products and web-based
applications.
Jeremy King
Non-executive Director (A*) (F) (N) (R**)
Jeremy joined Pendragon on 25 November 2014. Formerly a
partner with PwC in its East Midlands and London regions,
he is a chartered accountant.
Trevor Finn†
Chief Executive
Having spent a career in the retail motor industry, starting
as an apprentice mechanic, Trevor became chief executive
of Pendragon in 1989, when the company first listed on the
London Stock Exchange.
Martin Casha
Chief Operating Officer
Having spent his entire career with Pendragon businesses,
from apprentice mechanic to group general manager, Martin
became operations director in September 1995 and chief
operating officer in November 2001.
Tim Holden
Finance Director
Tim is a chartered accountant and joined Pendragon from
KPMG in June 2008, as group financial controller. He became
finance director in December 2009.
BOARD OF DIRECTORS
More detailed professional biographies of the directors are on the company’s website.
Key to memberships, roles and re-election status
* Committee chairman
** Acting chairman of the Remuneration Committee
(A) Audit Committee
(N) Nomination Committee
(R) Remuneration Committee
(F) Audit Committee member with recent and relevant financial experience
(SID) Senior independent director to be appointed
†retiring by rotation at the AGM
Group motor businesses websites
www.evanshalshaw.com
www.stratstone.com
www.hornburg.com
Group support business websites
www.pinewood.co.uk
www.pendragonvehiclemanagement.co.uk
www.quickco.co.uk
Secretary
Richard Maloney
Registered Office
Loxley House,
2 Oakwood Court, Little Oak Drive,
Annesley, Nottingham NG15 0DR
Telephone 01623 725200
Registered in England and Wales
Registered number
2304195
Website
www.pendragonplc.com

37
The April 2016 UK Corporate Governance Code (the ‘Code’)
applies to the company and is available on the FRC website
at https://www.frc.org.uk. Other than where expressly
stated, throughout 2017, the company complied in full
with the applicable provisions of the Code. The corporate
governance statement as required by Disclosure and
Transparency Rule 7.2.1 is set out below.
OUR BOARD The Board sets our company’s strategy and ensures we
have in place the financial and human resources we need
to meet our objectives. We take collective responsibility
for Pendragon’s long term success. The executive directors,
led by the chief executive, are responsible for running the
company and our group to effect that strategy, and work
within prescribed delegated authority, such as capital
expenditure limits. The executives direct and monitor
business performance through regular operational meetings
with their respective leadership teams and set and regularly
review the effectiveness of key operating controls, reporting
to the Board on these and any variances. The Board as a
whole reviews management performance.
Although the Board delegates to the chief executive and
finance director responsibility for briefing key stakeholders,
major shareholders and the investor community, the chairman
holds himself available to engage with shareholders, and the
senior independent director is ready to perform a similar
role, where appropriate. Information from engagement with
shareholders is shared with the entire Board and taken into
account in financial planning and strategy.
The Board has three committees: Audit, Nomination and
Remuneration, each made up entirely of non-executive
directors. The Risk Control Group (RCG) is a committee of
the executive directors, the company secretary and Group
heads of information technology and internal audit. Each
committee operates within delegated authority and terms
of reference, set by the Board, reviewed annually and
available to view on the company’s website. Details of each
committee’s work appear on the next few pages of this
Report. Executive directors can attend Board committees at
times, to assist their business, but only with the committee’s
prior agreement.
CORPORATE GOVERNANCE REPORT
PENDRAGON PLC BOARD
MAIN BOARD COMMITTEES
OPERATIONAL MEETINGS
NOMINATION COMMITTEE
REMUNERATIONCOMMITTEE
AUDIT COMMITTEE EXECUTIVE
COMMITTEE
RISK CONTROL GROUP

38
LEADERSHIP AND BOARD COMPOSITION As at 13 February 2018, the Board is made up of three
executive directors and three non-executive directors, one
of whom is chairman. The respective responsibilities of the
Board, the chairman and the chief executive are clearly
defined by the Board in formal responsibilities documents,
which the Board reviewed and readopted in 2017. The
Board is committed to the progressive refreshing of our
membership, so as to maintain the right balance of skills,
experience, independence and knowledge of the company
to enable us to continue operating effectively. Other than
Mel Egglenton stepping down from the Board on 23 October
2017, no changes to Board membership occurred in 2017.
The Board is actively seeking to recruit an additional non-
executive director. In accordance with the company’s
articles of association, the Board ensures that at least one
third of the directors shall retire from office at the Annual
General Meeting of the company. Details of the directors
offering themselves for re-election in 2018, together with
directors’ brief biographical details appear on page 36, and
gender balance details are on page 40.
HOW THE BOARD MANAGES RISKThe Board and our committees each operate to a set
meeting agenda which ensures that all relevant risks are
identified and addressed by appropriate controls. We
review management information which helps us to prescribe
operating controls and monitor performance against our
strategy and business plans. The non-executive directors
have particular responsibility for monitoring financial and
performance reporting, to ensure that progress is being
made towards our agreed goals. The Board’s responsibilities
also include assessing the effectiveness of internal controls
and the management of risk. Specific areas of risk
assessment and control fall within the remit of committees
of the Board; details of their work in 2017 appear below and
in the Directors’ Remuneration Report on pages 50 to 62.
THE BOARD’S REVIEW OF RISK AND CONTROLS IN 2017
During the year, the Board considered all strategic matters,
received key performance information on operating,
financial and compliance matters and reviewed the results
of corresponding controls and risk management. We
received from the Audit Committee and from the RCG
timely information and reports on all relevant aspects of
risk and corresponding controls. We reviewed all our key
company policies and ensured all matters of internal control
received adequate Board scrutiny and debate. At Board
meetings, and informally via the chairman, all directors
had the opportunity to raise matters of particular concern
to them. There were no unresolved concerns in 2017.
We concluded that all appropriate controls are in place
and functioning effectively. The Board considers that the
Group’s systems provide information which is adequate to
permit the identification of key risks to its business and the
proper assessment and mitigation of those risks. Based on
the Audit Committee’s and the RCG’s work, the Board has
performed a high level risk assessment, to ensure that (i) the
principal risks and uncertainties facing the Group’s business
have been identified and assessed, taking into account any
adaptations made to the Group’s business strategies, and (ii)
that appropriate mitigation is in place.
Our company policies on managing financial risk and
application of hedging are set out in note 4.2 to the financial
statements. The principal risks and uncertainties we have
identified are on pages 20 to 24 and our viability statement
is on page 17.
WORK OF THE RISK CONTROL GROUPThe accountability framework described on page 20 is
designed to ensure comprehensive management of risk
across the Group’s businesses. The Risk Control Group
(RCG), made up of the chief operating officer, finance
director, company secretary, and Group heads of information
technology and internal audit, performs detailed work on
risk assessment and oversees the effective implementation
of new measures designed to mitigate or meet any
specific risks or threats. The chair of the Audit Committee,
a representative of the external auditor and the Group
insurance risk leader attend by invitation. The RCG reports
to the Audit Committee on its work. The Board and any of
its committees is able to refer specific risks to the RCG for
evaluation and for controls to be designed or modified; this
occurs in consultation with operational management. The
executive directors are responsible for communicating and
implementing mitigating controls and operating suitable
systems of check. The RCG met twice in 2017. In addition to
reviewing and refining the Group’s corporate risk register, for
Board review and adoption, the RCG continues to monitor
and review the Group’s anti-bribery controls, including the
development of e-learning, gifts and hospitality training,
Consumer Rights Act 2015 training, Modern Slavery Act
2015 awareness and further initiatives to reduce incidences
of theft and fraud. Following its review of the Group’s
systems of internal control, the RCG has reported to the
Audit Committee that it has not identified any weakness in
controls which would have a material effect on the Group’s
business. The Audit Committee has reviewed and accepted
the processes adopted by the RCG in this respect and
accepted its conclusions.
CORPORATE GOVERNANCE REPORT

39
NON-EXECUTIVE DIRECTORSAND INDEPENDENCE
The non-executive chairman (who, on appointment to
that role, fulfilled the requirement to be independent) has
ensured that the Board performs effectively through a well-
functioning combination of Board and committee meetings
and other appropriate channels for strategic input and
constructive challenge from non-executive directors. The
chairman has held meetings with the non-executive directors
without the executive directors present, where necessary to
assist Board effectiveness, and, following the 2017 year end,
conducted individual meetings with each director to arrive at
his and the Board’s assessment of the directors’ respective
contributions, training needs and independence. The Board
has routinely operated conflict management procedures
and has deemed these procedures effective. Through these,
and the evaluations which are described below, we have
concluded that:-
• the Board’s collective skills, experience, knowledge of the
company and independence allow it and its committees
to discharge their respective duties properly;
• subject to the recruitment of an additional non-executive
director, the Board and each of its committees is of the
right size and balance to function effectively;
• we have satisfactory plans for orderly succession to
Board roles;
• the chairman and respective committee chairmen are
performing their roles effectively;
• all non-executive directors are independent in character
and judgment;
• no director has any relationships or circumstances which
could affect their exercising independent judgement; and
• the chairman and each of the non-executive directors is
devoting the amount of time required to attend to the
company’s affairs and their duties as a Board member.
BOARD EVALUATIONFor ten months of 2017, the Board consisted of seven
directors, consisting of three executive and four non-
executive directors, including the non-executive chairman
and was considered to be of the correct size and balance
to function effectively. Following the decision of Mel
Egglenton to step down from the Board in October 2017,
recruitment of an additional non-executive director is
underway. During 2017, the Board received informal
briefings from company executives to familiarise directors
with strategic developments and key aspects of the Group’s
business. Formal presentations to the Board by senior group
executives focussed on matters of strategic importance. The
Board and its committees conducted formal evaluations
of their effectiveness in 2017, facilitated by the chairman,
addressing questions based closely on the Code, applicable
good governance topics and drawn from best corporate
practice. The results were reviewed by the chairman, the
committee chairmen and the Board as a whole and the
chairman has factored suggested improvements into
our 2018 Board programme. More details on the Board’s
approach to individual and Board evaluation are on the
company’s website.
Director Board Audit Nominationº Remuneration
Chris Chambers * (B) (I) (R) (N)** 9/9 3/3 3/3 2/2
Gillian Kent (I) 9/9 4/4 3/3 2/2
Jeremy King (I) (A) (R)*** 9/9 4/4 3/3 2/2
Trevor Finn 9/9 N/A N/A N/A
Martin Casha 9/9 N/A N/A N/A
Tim Holden 8/9 N/A N/A N/A
Mel Egglenton **** 7/7 N/A 2/2 1/1
(I) Considered by the Board to be independent; the chairman is required to fulfil this criterion at appointment but not thereafter. (B) chairman of the Board. (A) Committee chairman (N) Committee chairman (R) Committee chairman. *Appointed non-executive chairman on 23 October 2017.**Remuneration Committee chairman until appointment as non-executive chairman on 23 October 2017.***Acting Remuneration Committee chairman.****Resigned from the Board as non-executive chairman and director on 23 October 2017.º Where the Nomination Committee is undertaking a specific recruitment, continuing directors only are eligible to attend.Shows the number of meetings attended out of the total a director was eligible to attend.

40
RE-ELECTION OF DIRECTORSIn accordance with the company’s Articles of Association,
all directors seek re-election by rotation at least once every
three years. Accordingly, Mr T G Finn and Mr C M Chambers
offer themselves for re-election at the 2018 AGM.
INFORMATION AND SUPPORT To ensure our decisions are fully informed and debated, the
chairman ensures our Board’s business agenda is set timely
to allow appropriately detailed information to be circulated
to all directors before meetings. The company secretary
facilitates the flow of information within the Board, attends
all Board meetings and is responsible for advising the Board
and its committees, through their respective chairmen, on
corporate governance and matters of procedure. All directors
have access to support from the company secretary on
matters of procedure, law and governance and in relation to
their own induction and professional development as Board
members. All directors are entitled to take independent
advice at the company’s expense, and to have the company
and other Board members provide the information required
to enable them to make informed judgements and discharge
their duties effectively.
COMMUNICATION We aim to meet the challenges presented by our size and
geography through innovation in internal communications.
Internal website messaging, video and face to face
presentations as well as electronic newsletters and social
media content keep team members up-to-date with the
company’s strategy and performance. Team members’
views on our performance and services are actively gathered
via targeted electronic surveys. Regular briefings for all
team members, held at each location, provide a forum
for sharing both company and local information. At all
levels, communications aim particularly to recognise the
achievements of individual team members and celebrate
outstanding personal and business performance, through
peer recognition and widely publicised awards. Each
year we review our incentive and recognition programmes
aligned to the Group’s business objectives.
DIVERSITY AND EQUALITYOF OPPORTUNITYWe are an equal opportunity employer, committed to ensuring
that our workplaces are free from unfair discrimination, within
the framework of the law. We aim to ensure that our team
members achieve their full potential and that, throughout
all our attraction, recruitment, selection, employment and
internal promotion processes, all employment decisions
are taken without reference to irrelevant or discriminatory
criteria. The company’s diversity and equal opportunities
policy is available at www.pendragonplc.com.
GENDER BALANCEWe describe our approach to Board composition diversity in
the Nomination Committee’s report on page 48.
CORPORATE GOVERNANCE REPORT
Number of group employees by category (UK only)
At 31 December 2016 At 31 December 2017
Female Male Total Female Male Total
Director 2 6 8 1 5 6
Senior manager 0 5 5 0 5 5
All employees 2,311 6,923 9,234 2,379 6,973 9,352
GENDER PAY GAP REPORTING The company’s gender pay gap report will be published in
full on our website www.pendragonplc.com in accordance
with the statutory timescale.
HEALTH AND SAFETY We take seriously our responsibility to our team members,
customers and the public. We aim to ensure that all team
members in the course of their roles, and all who work
in or visit our facilities or receive our services, so far as is
reasonably practicable, experience an environment and
practices which are safe and without risk to their health.
Our policy is to identify and assess all potential risks and
hazards presented by our activities and to provide systems
and procedures which allow all team members in their
daily work to take responsible decisions in relation to their
own and others’ health and safety. We publish a clear
hierarchy of responsibility to team members and reinforce
this through regular monitoring by a variety of means. We
promote awareness of potential risks and hazards and the
implementation of corresponding preventative or remedial
actions through our online health and safety systems,
operations manuals and regular communications on topical
issues. Our health and safety management system provides
our UK leadership and team members with detailed access
to information, guidance and control measures.

41
ACCIDENTS AT WORKWe assess our safety record against relevant published
benchmarks and target specific hazards for improved results
through additional monitoring and processes promoting
safe working. The nearest bench mark for our operations is
accidents per employee data published by the Health and
Safety Executive1. For the 12 months to December 2017, these
reveal reported performance of the UK motor retail and
repair industry as 0.017 RIDDOR accidents per employee2;
the Group’s corresponding ratio is 0.0033 per employee3,
representing 31 RIDDOR reported accidents occurring
in 2017 (2016: 23). The company’s reporting system for
accidents, first introduced in 2015 has increased accuracy
of reporting and classification of accidents reported. The
company’s health and safety policy is available at www.
pendragonplc.com.
COMMUNITYWe are predominantly a retail operator, with a tangible
presence in the many communities our businesses serve.
During 2017, our monthly fundraising events supported
a range of national charities, including the British Heart
Foundation, Help for Heroes, Macmillan Cancer Support,
Cancer Research, Comic Relief and Children in Need. Our
Academy and retail businesses also generate community
involvement through local engagement, contributing to their
local areas in a variety of ways. Individuals and businesses
organise charity events to support schools, hospitals and
local children’s and medical charities as well as the Group
wide monthly nominated charity. The company supports
and encourages these activities and we welcome the
opportunities they present for team-building within our
businesses, engagement with the communities they serve
and recognition of charitable causes with whom our team
members and their families have connections.
RESPONSIBLE SOURCINGAll our Group’s sites are situated within the UK or US and
at each of them we operate in strict compliance with all
applicable labour relations laws. We have no presence, either
directly or via sub-contractors, in any areas which present
any risk of the exploitation of men, women or children in the
workplace. We work with vehicle manufacturers and other
suppliers who manage their supply chains in a responsible
way, free from the exploitation of labour.
We have readopted our Anti-Slavery and Human Trafficking
Policy, available to view on our website, together with our
Anti-Slavery and Human Trafficking Statement for the year
ending 2017.
ENVIRONMENT ANDGREEN HOUSE GAS REPORTINGAlthough not generally regarded as a high environmental
impact sector, motor retailing and its associated aftersales
service activities carries with it a range of responsibilities
relating to protection of the environment. Our policy is to
promote and operate processes and procedures which,
so far as is reasonably practicable, avoid or minimise the
contamination of water, air or the ground; and to manage
responsibly the by-products of our activities, such as noise,
waste packaging and substances and vehicle movements.
During the year, we have continued to be registered with and
have complied with our obligations under the Department
for Environment, Food and Rural Affairs’ (DEFRA) carbon
reduction commitment scheme. The company’s statement
of environment policy is available at www.pendragonplc.
com
1. Reported injuries to employees and the self-employed in Great Britain, by detailed industry and severity of injury data published annually by the Health and Safety Executive. The relevant industry segment is ‘Wholesale and retail trade and repair of motor vehicles and motor cycles’.
2. Provisional data; source: Health and Safety Executive http://www.hse.gov.uk/statistics/tables/index.htm#riddor reported under ‘Reported injuries
to employees and the self-employed in Great Britain, by detailed industry and severity of injury’; RIDDOR is the Reporting of Injuries, Diseases and Dangerous Occurrences Regulations 2013.
3. Data reported here excludes the Group’s US business, but reflects all Pendragon UK operations including the Support Businesses, the average number of employees in such businesses for 2017 being 9,352.

42CORPORATE SOCIAL RESPONSIBILITY REPORT
GREENHOUSE GAS EMISSIONSThis section includes our mandatory reporting of greenhouse
gas emissions for the period 1 January 2017 to 31 December
2017, pursuant to the Companies Act 2006 (Strategic Report
and Directors’ Report) Regulations 2013.
Our methodology to calculate our greenhouse gas emissions
is based on the ‘Environmental Reporting Guidelines:
including mandatory greenhouse gas emissions reporting
guidance’ (June 2013) issued by DEFRA using DEFRA’s 2017
conversion factors. In some cases, we have extrapolated
total emissions by utilising available data from part of
the reporting period, and extending it to apply to the full
reporting period.
We report our emissions data using an operational control
approach to define our organisational boundary. We have
reported all material emission sources for which we deem
ourselves to be responsible, including both our UK businesses
and estimated usage for our US businesses. We also include
emissions from driving activity, comprising data verified
internally, including estimates of distances travelled during
test drives, transportation of vehicles and parts between
sites, and business travel (excluding commuting by means
which are not owned/controlled by us).
Global greenhouse gas emissions data
Source: Tonnes of Co2
01.01.17 – 31.12.17 01.01.16 – 31.12.16
CO2 emitted from facilities 14,517 16,338
CO2 emitted from driving activities 9,403 10,221
Intensity ratio (tonnes of CO2 per £m revenue) 5.1 5.9
REDUCING CARBON AND WASTEDuring the year, we have continued to assess and monitor
our energy use and, where practicable, to implement
measures designed to reduce our activities’ environmental
impact, which, over time, we anticipate will help reduce our
carbon footprint. The Group has undertaken mandatory
energy assessments of our sites in accordance with the ESOS
Regulations 2014. We continue to use the results of this
assessment to identify further energy saving opportunities.
To conserve energy, we continue, where practicable, to install
LED lights at our sites, limit the duration of periods when full
lighting is used on our sites out of hours, keep external doors
closed when not in use, and fit insulators to limit the escape
of heat. We continue to seek to limit our paper consumption
and waste, through increasingly paperless communications
and systems.

43

44COMMITTEE REPORTS
AUDIT COMMITTEE
THE COMMITTEE’S WORK IN 2017The Audit Committee met three times in 2017 and this report
describes its work and conclusions.
FINANCIAL STATEMENTS REVIEWThe Committee received the auditor’s memorandum on
the company’s 2016 financial statements and the auditor’s
memorandum on the unaudited 2017 interim results. In each
case, it discussed the auditor’s findings with the auditor,
satisfied itself of the integrity of the financial statements
and recommended the financial statements for approval by
the Board. Key aspects of those discussions and relevant
considerations and conclusions are as follows:-
AUDIT RISK CONSIDERED BY THE COMMITTEEThe table on page 45 sets out the key audit risks and
judgements applied, for the 2017 year results, which the
Committee considered and discussed with the auditor, and
the Committee’s conclusions.
The Audit Committee is a committee of the Board, chaired by Jeremy King, made up entirely of independent non-executive directors.
Their names and qualifications are on page 36 and attendance at meetings in the table on pages 39.
Key Responsibilities of the Audit Committee
• monitors the integrity of the financial statements
and formal announcements
• reviews and approves the Annual Report and
Accounts for adoption by the Board
• recommends to the Board the selection of the
external auditor and its terms of appointment
and monitors its effectiveness and independence
• governs policy for the allocation of non-audit
work to the audit firm
• reviews internal controls and risk management
• monitors the effectiveness of the internal audit
function
• reviews and monitors whistleblowing
arrangements
Its terms of reference detail its key responsibilities
and appear, with relevant background information,
on the company’s website www.pendragonplc.com

45
AUDIT RISK CONSIDERED BY THE COMMITTEE EVIDENCE CONSIDERED AND CONCLUSION REACHED
Goodwill
The judgements in relation to asset impairment of the carrying
value of goodwill largely related to the achievability of the
assumptions underlying the calculation of the value in use of
the business being tested for impairment, set out in note 3.1 to
the financial statements. These primarily consist of the Group’s
forecasts from 2018 to 2022, which underpin the valuation
process.
The Committee considered the risk that goodwill could be
materially overstated in the context of the sensitivity analysis,
also set out in note 3.1. The Committee addressed these matters
through receiving reports from management outlining the
basis for the assumptions used, assessing the range and depth
of information underpinning the assumptions and calculations
and discussing this with the auditors.
The Committee concluded that the judgements applied were
appropriate.
Vehicle inventory valuation
This is the risk that the value of inventory set out in note 3.4
to the financial statements could be materially overstated and
whether or not an appropriate provision had been calculated.
The risk for used vehicles is seen as the most relevant, for
scrutiny. Used vehicle prices can vary depending on a number
of factors, including general economic conditions and the
levels of new vehicle production.
The Committee received a report from management which
set out factors relevant to an assessment of used inventory
valuation, including the level of inventory held across the
business, the ageing of the inventory, the stock turn of the
inventory and an analysis of market factors including the parc
of used vehicles, the used vehicle market sales rate and historic
movements in used vehicle prices.
The Committee discussed the report from management with
the auditors together with all audit findings. The Committee
was satisfied that a comprehensive assessment of inventory
valuation had been undertaken and concluded that the
judgements applied were appropriate. Overall, the level of
used inventory risk remained the same as in the prior year.
Pension scheme liabilities
The amounts reflected in the financial statements in respect of
pension scheme liabilities involve judgements made in relation
actuarial assumptions, long-term interest rates, inflation,
longevity and investment returns. The liabilities are set out in
note 5.1 to the financial statements. There is a risk that the value
of the pension scheme liabilities could be materially under or
over stated in the context of the sensitivity analysis in that note.
The Committee ascertained that judgements made on the
pension scheme were all based on advice from the Group’s
pension adviser. The final calculations in respect of the Group’s
defined benefit pension scheme liability were performed by our
pension scheme actuary. The Committee discussed with the
auditor the assumptions applied, in particular the findings of
the auditor’s own pension specialist. The level of pension risk is
elevated, as a result of the recent Bank of England quantitative
easing programme, causing bond yields to fall and pension
deficits to increase.
The Committee concluded that the judgements applied were
appropriate.
Carrying value of investments
The subsidiary companies’ investment balances are held at
cost less any impairment. It is considered that the Group
subsidiaries investments are one CGU. An impairment exists
when their recoverable amount is less than the costs held in the
accounts. There are a number of factors which could impact
the recoverable amount which creates a risk of this recoverable
amount being lower than the investment balance held.
The Committee looked at the range of factors that could
impact the recoverable amount and looked at the values in
use calculations at different assumption levels. The Committee
concluded that the assessment of the recoverable amount of
the parent company’s investment in subsidiaries is acceptable.

46
EXTERNAL AUDITOR APPOINTMENTAND PERFORMANCE EVALUATION The Committee considered Auditor effectiveness and
independence of the audit, during the year. The Committee
arrived at its recommendation to the Board on the auditor’s
appointment by:
• applying exclusively objective criteria;
• evaluating the ability of the audit firm to demonstrate its
independence;
• assessing the effectiveness of the audit firm in the
performance of its audit duties; and
• assessing the audit firm’s adherence to applicable
professional standards.
The Committee chairman oversaw the company’s evaluation
of the auditor’s performance, using questionnaires covering
all aspects of the company and auditor relationship and
reviewed the results with the Committee members and
the company’s management. The Committee noted that
the current auditor, KPMG had issued to the company all
requisite assurances of its independence. The Committee
reported its conclusions to the Board, namely, that there
are no existing or historical relationships or other matters
which adversely affect the independence of KPMG as the
company’s auditor, and no performance shortcomings or
unresolved issues relating to fee levels.
POLICY ON AUDIT TENDERING KPMG was appointed as auditor in September 1997, since
when, audit services have not been tendered competitively.
The Committee has concluded that a competitive tender of the
audit service is not necessary at this time, but acknowledged
that circumstances could arise where a competitive tender
for audit services is desirable. It recommended the re-
appointment of KPMG as the company’s auditor. The Board
accepted the Committee’s recommendation and concluded
that:-
• there are no matters warranting a competitive tender
exercise in relation to the provision of audit services, but
this position would change if there were to arise at any
time any concerns as to the continuing independence or
performance of the current audit firm (no such concerns
have arisen as at the date of this report);
• none of the directors’ independence in considering this
matter is impaired in any way and none has a potential
or actual conflict of interest in relation to KPMG, whether
in regard to its appointment, fees, the evaluation of its
performance, any decision as to competitive tender for
audit services, or any other matter.
The Committee also took into account that under the current
EU legislation on audit firm rotation the current auditor could
not be re-appointed after 2023.
REVIEW OF NON-AUDIT SERVICESThe Committee reviewed the company’s policy on its use
of its audit firm for non-audit work. Its main principles are
that the auditor is excluded from providing certain non-
audit services the performance of which is considered
incompatible with its audit duties, but is eligible to tender
for other non-audit work on a competitive basis and can
properly be awarded such work if its fees and service
represent value for money. The policy can be viewed on
the company’s website. The Committee considered reports
on the extent and nature of non-audit work available, the
allocation during the year of that work to accountancy and
audit firms, including KPMG LLP, and the associated fees.
Details of audit and non-audit work performed by KPMG
and the related fees appear annually in the notes to the
company’s financial statements. A full statement of the
fees paid to KPMG LLP for work performed during the year
is set out in note 2.5 to the financial statements on page
95. Having satisfied itself on each item for its review, the
Committee reported to the Board that:-
• the company’s existing policy continues to be
appropriate, has been adhered to throughout the year,
and is operating effectively to provide the necessary
safeguards to independence of the external auditor;
• there are no facts or circumstances relating to the
award or performance of non-audit work that affect the
independence of KPMG LLP as auditor or justify putting
out audit work to competitive tender at this time;
• no contract for non-audit services has been awarded to
KPMG LLP in any circumstance of perceived or potential
conflict of interest or non-compliance with the company’s
policy; and
• the fees KPMG LLP have earned from non-audit services
provided during the year are not, either by reason of
their amount or otherwise, such as might impair its
independence as auditor. The ratio of non-audit to audit
fees was 0.14:1 in 2017 (2016: 0.18:1).
The Board accepted these findings.
REVIEW OF INTERNAL AUDITPERFORMANCEThe Committee chairman oversaw the Committee’s
evaluation of the internal auditor’s performance, using
questionnaires covering all aspects of the internal auditor
work and relationship to the audit and received the auditor’s
view on that performance. He reviewed the results with
the Committee members and company management and
reported the Committee’s conclusions to the Board. KPMG
LLP gave formal assurance to the company of its ability as
auditor to place reliance on the work of the internal audit
team, and the Committee concluded that the scope and
quality of the internal audit work done reflects an effective,
well-functioning team.
COMMITTEE REPORTS

47
REVIEW OF RISK MANAGEMENTAND INTERNAL CONTROLSThe Committee reviewed the effectiveness of the company’s
system of internal control and financial risk management. It
received reports from the auditor on each of these areas and
from the RCG, whose work is described on page 38 on the
company’s risk register, emerging risks and corresponding
internal controls. It scrutinised the key risks register, as
revised by the RCG, and approved it for adoption by the
Board. Its work informed and supported the Board’s
assessments detailed under ‘How the Board manages risk’
on page 38.
REVIEW OF ANTI-BRIBERY CONTROLSAND WHISTLEBLOWINGThe Committee reviewed the company’s anti-bribery
processes and controls and evaluated and approved
these and the company’s bribery risk assessment. On its
recommendation, the Board readopted the company’s
anti-bribery policy statements and associated controls.
The Committee considered reports on known instances
of alleged wrongdoing and matters reported on the
company’s confidential reporting line and their investigation,
reviewed the adequacy of whistleblowing procedures and
commissioned follow-up action and improvements in risk-
related controls.
Our current anti-bribery value statements and our policies
on the control of fraud, theft and bribery risks appear on
the company’s website and are drawn to the attention
of all parties seeking to transact with the Group. Our
whistleblowing procedures are published internally on our
intranet and their existence is regularly reinforced in our
team member communications.

48
THE COMMITTEE’S WORK IN 2017The Nomination Committee met three times in 2017. This
report describes its work and conclusions.
REVIEW OF BOARD COMPOSITION AND BALANCEIn January 2017, the Committee reviewed the structure of
the Board, in relation to its size, composition and potential
vacancies. At this stage, as part of the annual review of
the workings of the Board and its annual valuation, the
Committee concluded that a cohort of four non-executive
directors, made up of the chairman and three independent
non-executive directors is sufficient for the Board and its
committees to function effectively.
In June 2017, the Committee’s work focussed on succession
planning, concluding that the successful introduction of the
value creation plan long term remuneration incentive had
enabled focus on a cohort of below Board executives with
potential to succeed the executive directors, as part of the
growth and development of an internal pool of talent.
In October 2017, following the resignation of Mel Egglenton
as chairman, the Committee met for the purposes of
recruitment and selection of the chairman. Owing to the
interest expressed by eligible non-executive director Chris
Chambers, the Nomination Committee recommended that
the Board as a whole (excluding the outgoing chairman
and the interested non-executive director), undertook
the process for the appointment of the chairman of the
company. Having drawn up a role description and the
required capabilities for the appointment, the Board
concluded that the company’s interests were best served by
appointing as chairman someone already familiar with the
development of the company’s strategy. Chris Chambers
was an internal candidate meeting the role criteria, and
accordingly, he was appointed as chairman in October 2017
in preference to seeking an external appointment. Following
the appointment of Chris Chambers as chairman, the Board
concluded to recruit and appoint an additional non-executive
director to ensure that the composition and balance of the
Board remained appropriate. As at 13 February 2018, the
process to recruit an additional non-executive director is
ongoing. Details of the annual evaluation of the Board are
set out below.
EVALUATIONThe annual evaluations of the Board and its members were
conducted by the Board and are described on page 39. As
part of that process, the Committee conducted an evaluation
of its own performance.
DIVERSITY
All appointments made, including those of Board members,
adhere to the company’s diversity and equal opportunities
policy, which can be viewed on the company’s website.
For non-executive director appointments, where executive
search consultants are instructed, they are done so in a
manner consistent with this policy. As identified above,
the company is currently in the process of recruiting an
additional non-executive director, and will engage an
executive search for this purpose if considered appropriate
to do so. The company has not adopted a gender balance
target for its Board.
COMMITTEE REPORTS
NOMINATION COMMITTEE
Key Responsibilities of the Nomination Committee
• reviews the Board’s size, structure and
composition and leads recruitment to Board
positions
• undertakes annual Board performance evaluation
• satisfies itself on the company’s refreshing of
Board membership and succession planning
Its terms of reference detail its key responsibilities
and appear, with relevant background information,
on the company’s website www.pendragonplc.com
The Nomination Committee is chaired by Chris Chambers, and made up entirely of independent non-executive directors.
Their names and qualifications are on page 36 and attendance at meetings in the table on page 39.

49
REMUNERATION COMMITTEEThe Remuneration Committee is a committee of the Board, and was chaired by Chris Chambers until his appointment as non-executive Chairman in October 2017. Jeremy King is currently the acting Chairman of the Committee. It is made up entirely of independent non-executive directors. Their names and qualifications are on page 36 and attendance at meetings in the table on page 39.
THE COMMITTEE’S WORK IN 2017The Remuneration Committee met twice in 2017. The
Directors’ Remuneration Report, beginning at page 50,
describes its work and conclusions.
Key Responsibilities of the Remuneration Committee
• determines and agrees with the Board the
framework for remuneration of executive
directors
• ensures that executive directors are provided
with appropriate incentives which align their
interests with those of shareholders, and
encourage enhanced performance in the short
and medium term, as well as achievement of the
company’s longer term strategic goals
• determines targets for any performance related
pay schemes
• seeks shareholder approval for any long term
incentive arrangements
• determines the remuneration of the chairman
The terms of reference of the Remuneration
Committee are available at www.pendragonplc.com

50DIRECTORS’ REMUNERATION REPORT
Dear Shareholder
Following Chris Chambers’ appointment as non-executive chairman, on behalf of the Board, I am pleased to present the
Directors’ Remuneration Report as acting chairman of the Remuneration Committee for the year ended 31 December
2017. This report has been prepared by the Remuneration Committee and approved by the Board.
This remuneration report is split into two sections:
• the new Directors’ Remuneration Policy; which provides an ‘at a glance’ summary of the Remuneration Policy for
which shareholder approval was obtained at the 2017 AGM and which will continue to apply without amendment for
the forthcoming year; and
• the Annual Report on Remuneration.
Aligning the Remuneration Policy with strategy and performance
The Remuneration Committee conducted a thorough review of our remuneration policy in autumn 2016 and early 2017.
In December 2017, the company released an update outlining next steps on its strategic objectives, and actions taken
on delivering those strategic objectives. The Remuneration Committee maintains that the remuneration policy we
have in place today, approved by shareholders at our 2017 AGM, will support the reshaping of our business and assist
in the acceleration of our transformation as we move towards achieving our strategic objectives. Our remuneration
policy continues to provide a strong and clear link between business strategy and incentive arrangements, with both
the Value Creation Plan (VCP) and our remuneration policy as a whole being fundamental in supporting the delivery of
our strategy, rewarding both the executives and senior management group driving its successful delivery.
As no changes are proposed to our remuneration policy for the year ahead, the company’s remuneration policy is not
subject to shareholder approval. The full policy is available on the company’s website at www.pendragonplc.com,
and in last year’s remuneration report, and is summarised in the policy table on page 51. During the course of the
coming year, the Committee will continue to closely follow developments in remuneration policy and prevailing market
practice, including the implementation of proposed changes to the UK Corporate Governance Code, the introduction
of secondary legislation and voluntary industry action following the Government’s response to the 2016 Green Paper
on Corporate Governance Reform where it applies to executive pay.
We continue to maintain the bias in our remuneration policy towards long term incentives, supported through interlinked
share ownership and part-deferral requirements within the annual bonus plan.
2017 Outturn
As highlighted earlier, in 2017, the company delivered underlying profit of £60.4m, a decline of 19.9% year on year. Year
end net debt has increased by 35.3%, as a result of further investments in line with our clear strategy to provide more
reliable and sustainable returns. As a result, for the year under review, bonuses were paid to the executive directors
at 29.8% of salary.
In addition, upon conclusion of the three-year performance period, the Remuneration Committee determined that
long term incentives awarded in 2015 will not vest, as the relevant performance conditions to achieve vesting were not
satisfied. The 2015 LTIP therefore lapsed in its entirety. Full details of remuneration decisions for 2017 are set out in the
directors’ annual remuneration report on pages 57 to 62.
At last year’s AGM, 98.80% of shareholders voted in favour of the Directors’ Remuneration Report. 55% of shareholders
voted in favour of our remuneration policy and details of the votes cast are set out on page 62. I hope that you find the
information in this report helpful and I look forward to your continued support at the company’s AGM.
Yours sincerely
Jeremy King
Acting Chairman of the Remuneration Committee
Remuneration Committee Chairman’sLetter to Shareholders

51
REMUNERATION DISCLOSURE This report complies with the requirements of The Large
and Medium-sized Companies and Groups (Accounts and
Reports) Regulations 2008 and the Large and Medium-
sized Companies and Groups (Accounts and Reports)
(Amendment) Regulations 2013 (the Regulations) and
has been prepared in accordance with the UK Corporate
Governance Code and the UKLA Listing Rules. The parts of
the report which have been audited in accordance with the
Regulations have been identified.
REMUNERATION POLICYThis year, there are no changes to the remuneration policy
that was approved by our shareholders at the 2017 AGM.
The full, shareholder approved, policy is available on the
company’s website and sets out our policy on directors’
remuneration, recruitment, loss of office, termination of
employment and change of control. Consistent with market
practice, the Remuneration Committee retains full discretion
over all elements of variable remuneration, both in terms of
annual bonus awards made and long term incentive awards
granted and vesting. The extent of this discretion is more
particularly described in the table on page 54.
The table below summarises the individual elements of
remuneration provided to the executive directors. It is
a summary only and does not replace or override the full,
shareholder policy, which is displayed on the company’s
website (www.pendragonplc.com).
FUTURE REMUNERATION POLICY FOR EXECUTIVE DIRECTORS
BASE SALARY
ELEMENT AND PURPOSE Provide competitive remuneration that will attract and retain executives of the calibre required to take forward the company’s strategy.
OPERATION Base salaries are reviewed annually, effective from 1 January. The Committee sets base salaries taking into account: • the performance and experience of the individual
concerned;• any change in responsibilities;• appropriate executive remuneration benchmarking,
which may include the following comparator groups (i) FTSE 250 companies (excluding investment trusts); (ii) companies of a similar size to the Group, currently being those in the bottom quartile of the FTSE 250 and the top quartile of the FTSE Small Cap; (iii) FTSE retailers, broadly the FTSE All Share General Retailers index excluding companies with a market cap greater than £3.5bn; and (iv) selected automotive retailers which are deemed to be the closest comparators to the company. Alternative peer groups may need to be referenced depending on the business circumstances.
Base salaries are paid monthly in arrears.
MAXIMUM OPPORTUNITY Salary levels are eligible for increases during the three-year period that the remuneration policy operates (policy effective from 27 April 2017).
During this time, salaries may be increased each year. Salary increases are determined after taking due account of market conditions and any increases awarded to the wider workforce.
Significant changes in role scope may require further adjustments to bring salary into line with new responsibilities.
For recent joiners or promotions, whose pay was initially set below market rate, higher than usual increases may be awarded to bring them into line with the market over a phased period as they develop in their role.
PERFORMANCE METRICS Individual performance is an important factor considered by
the Committee when reviewing base salary each year.

52
FUTURE REMUNERATION POLICY FOR EXECUTIVE DIRECTORS
BENEFITS
ELEMENT AND PURPOSE Cost-effective, market competitive benefits are provided to assist executive directors in the performance of their roles.
OPERATION Life assurance, private health cover, professional subscriptions, home telephone costs and (at executive’s option) company cars.
MAXIMUM OPPORTUNITY Benefit levels are set to be competitive relative to companies of a comparable size. The cost of some of these benefits is not pre-determined and may vary from year to year based on the overall cost to the company of securing these benefits for a population of employees (particularly health insurance and death in service cover).
PERFORMANCE METRICS None.
PENSION
ELEMENT AND PURPOSE Provide cost-effective long term retirement benefits that will form part of a remuneration package that will attract and retain executives who are able to take forward the company’s strategy.
OPERATION Post-2009 executives: participation in a defined contribution pension scheme.
Pre-2009 executives: deferred membership of defined benefit pension scheme.
MAXIMUM OPPORTUNITY Post-2009 executives: contribution of 10% of base salary, or payment of a 10% cash alternative at the option of the executive.
Pre-2009 executives: 26% of salary cash supplement in lieu of pension contribution.
PERFORMANCE METRICS None.
ANNUAL BONUS
ELEMENT AND PURPOSE Incentivises achievement of annual objectives which support the short term goals of the company, as reflected in the annual business plan.
OPERATION Annual bonuses are earned over the year and are paid annually in arrears after the end of the financial year to which they relate, based on performance against targets over the year. 25% of after tax bonus earned is subject to compulsory deferral into the company’s shares until such time as the company’s share ownership guidelines are met. In such situations where bonus is deferred into shares, an executive director may be entitled to receive dividend payments on such shares.
MAXIMUM OPPORTUNITY Maximum available bonus is equivalent to 100% of base salary. Maximum bonus is available only for material outperformance of the company’s annual business plan.
PERFORMANCE METRICS Annual bonus is earned based on performance against stretching company financial performance measures as set and assessed by the Committee. At present, financial measures used are underlying (adjusted) profit and year-end net debt. A sliding scale of targets is set for each measure, with 12.5% of salary for each element being payable for achieving the relevant threshold hurdles.
CHANGESThe specific measures, targets and weightings may vary from year to year in order to align with the company’s strategy over each year. The measures will be dependent on the company’s goals over the year under review.
DIRECTORS’ REMUNERATION REPORT

53
FUTURE REMUNERATION POLICY FOR EXECUTIVE DIRECTORS
VALUE CREATION PLAN (VCP)
ELEMENT AND PURPOSE The VCP rewards and retains executive directors over the longer term, whilst also aligning the incentives of those participating with the long term performance of the business and returns for our shareholders. The VCP is the company’s principal long term incentive plan for rewarding and incentivising executive directors.
OPERATION The VCP operates over a four year performance period which commenced on 1 January 2017. Executive directors, and other eligible team members are granted an entitlement to a percentage share in a pool of returns delivered to shareholders, above a hurdle rate of return. The participant’s percentage entitlement is awarded under nil-cost options over shares, with a value calculated to be a proportion of the total shareholder return created for shareholders. This is measured over the four year VCP performance period, with a further one year holding period being applicable to any awards vesting.
The overall effect of the VCP is that the executive directors and other eligible team members will be able to earn shares equivalent to 10% of any total shareholder return created above a 10% per annum compound annual growth rate based on the measurement of absolute total shareholder return generated over the four year VCP performance period. In other words, until shareholders receive a 10% p.a. return, the VCP will not pay out. Beyond that, broadly participants may receive 10% of any further value created subject to cap of 5% of issued share capital. The company used an initial or base share price of the Q4 2016 average share price, which was £0.3016.
MAXIMUM OPPORTUNITY Under the VCP, the maximum aggregate number of ordinary shares in the company that can be issued to satisfy awards under the VCP to all participants is limited to 5% of the company’s issued share capital at the end of the four year performance period.
At the outset, entitlements of participants in the pool of returns were split as follows:-
chief executive officer – up to a maximum of 30%chief operating officer – up to a maximum of 20%finance director – up to a maximum of 10%other below board participants – share of remaining balance of 40%
PERFORMANCE METRICS The performance condition is based on the absolute total shareholder return performance of the company over a four-year period. Participants in the VCP are able to earn shares equivalent to 10% of any total shareholder return created above a 10% p.a. threshold.
CHANGESThe VCP replaces the LTIP as the company’s selected long term incentive plan from 1 January 2017.
LONG TERM INCENTIVE PLAN (LTIP)
ELEMENT AND PURPOSE Incentivises executives to achieve EPS growth over a three year period. EPS growth is the measure most appropriate to the company’s strategy.
OPERATION Awards are subject to performance conditions measured over three years and a service requirement.
The Committee retains a discretion to refine the choice of performance metrics in each year in light of developments in the company’s strategy. In the event of a significant or material change, the Committee would engage in dialogue with shareholders and, if necessary, seek a renewed shareholder approval by ordinary resolution.
MAXIMUM OPPORTUNITY No further awards will be made to executive directors under the LTIP.
PERFORMANCE METRICS Awards vest at the end of a three year performance period, based on achievement of stretching underlying EPS targets. The underlying EPS targets operate subject to a positive total shareholder return (TSR) underpin. Threshold performance attracts vesting of 25% of the award with 100% of awards being achieved for maximum performance. There is a straight line vesting between performance points.
CHANGESFollowing approval of the VCP at the 2017 AGM, the company does not intend to use the long term incentive plan to reward the executive directors over the period of the remuneration policy and in the future, and the LTIP remains solely for legacy awards made in 2015 and 2016.

54
FUTURE REMUNERATION POLICY FOR EXECUTIVE DIRECTORS
POLICY ON EXECUTIVE DIRECTOR SHARE OWNERSHIP
The company continues to recognise the importance of executive directors building significant holdings of the company’s shares. To encourage share ownership among executive directors joining the company, these require executive directors to aim, within five years of joining the Board, to have built a stake in value equal to 100% of their annual salary (200% in the case of the chief executive). Until such time as the policy is met, executive directors will be required to defer 25% of annual bonus into the company’s shares and retain half the after tax number of vested shares received under the VCP.
POLICY ON NON-EXECUTIVE DIRECTORS’ REMUNERATION
The company’s policy on non-executive directors’ remuneration is reviewed annually by the Board. Remuneration for non-executive directors is confined to fees alone, without a performance related element. Non-executive directors may elect to receive all or part of their fees in the form of benefits in kind, typically the provision of a motor vehicle for their use. The company considers that the remuneration of the non-executive directors remains consistent with the time commitments associated with individual positions and wider market practice among companies of a comparable size.
Fee Type: Fee Level Change in 2017
Chairman fee £150,000 None
Basic fee £40,000 None
Supplementary fees:
Senior independent director £4,000 None
Audit Committee chairman £10,000 None
Remuneration Committee chairman £5,000 None
Nomination Committee chairman Nil None
Notes accompanying the future Remuneration Policy table:
1. Malus and clawback – malus and clawback may operate in respect of the annual bonus, VCP, and long term incentive plan. These provisions will permit the company to reclaim annual bonus payments or reverse VCP or LTIP awards or claim proportionate payments in exceptional circumstances of misstatement or misconduct. These are kept under review, in the light of prevailing Financial Reporting Council guidance.2. Salary – base salaries are set by reference to the criteria specified in the table above. If a salary is initially set below the market rate, a phased realignment may be made over time.3. Annual bonus – targets of underlying (adjusted) profit (50%) and year-end net debt (50%) were selected as these measures correlate to measures used in the company’s overall business plan. The split between net debt and profit, and the performance measures attributable to them is determined by the Remuneration Committee who seek external guidance on the appropriateness of any performance targets set relative to the market. 4. Long term incentive plans – (i) LTIP: under the company’s current long term incentive plan, performance shares are awarded up to a maximum of 150% of salary if significantly challenging performance targets are attained. The Remuneration Committee selected EPS as this remains the key internal measure of long term financial performance, as well as being well understood by the executives and our investors as providing a clear incentive to deliver the company’s long term growth prospects. An underpin of creating absolute shareholder return has been adopted as this further aligns the interests of executives with those of shareholders. The vesting schedule outlines the vesting percentages in relation to EPS performance targets, which were set after taking into account internal scenario analysis, current market expectations and the current trading environment. (ii) VCP: the introduction of the VCP ensures alignment of rewards with the performance and delivery of our business strategy. The initial or base share price under the VCP was set at £0.3016, being the three month average share price prior to 01 January 2017. The hurdle price was set at £0.442, being the initial or base share price plus 10% compounded annual growth over the four plan years. The total participation pool for the VCP is 10% of the total value created above the hurdle. 5. Pensions – Trevor Finn and Martin Casha ceased to be active members of the Pension Plan in 2006. Tim Holden participated in the defined contribution section of the Pendragon Group Pension Scheme, to which the company made a contribution of 10% of his basic salary. In April 2016, Tim Holden elected to receive a payment of 10% of salary, rather than continue to receive pension contributions.6. Benefits – benefit levels are set to be competitive relative to companies of a comparable size.7. Annual Bonus, VCP and LTIP Policy – Remuneration Committee Discretions: The Committee will operate the annual bonus plan, VCP and LTIP in accordance with their respective rules and in accordance with the Listing Rules, where relevant. Consistent with market practice, the Committee retains discretion in a number of respects with regard to the operation and administration of these plans. These include the following (albeit with quantum and performance targets restricted to the descriptions detailed in the future policy table above):- • who participates in the plans; • the timing of grant of award and/or payment; • the size of an award and/or payment; • the determination of vesting and/or meeting targets; • discretion required when dealing with a change of control (e.g. the timing of testing performance targets) or restructuring of the Group; • determination of good/bad leaver cases for incentive plan purposes based on the rules of each plan and the appropriate treatment chosen; • adjustments required in certain circumstances (e.g. rights issues, corporate restructuring events, share buybacks and special dividends); and • the annual review of performance measures and weighting, and targets for the annual bonus plan, VCP and LTIP from year to year or on award.
The Committee also retains the ability to adjust the targets and/or set different measures and alter weightings for the annual bonus plan and to adjust targets for the VCP or LTIP if events occur (such as a material divestment of Group business) which cause it to determine that the conditions are no longer appropriate and the amendment is required so that the conditions achieve their original purpose and are not materially less difficult to satisfy.
The company retains the authority to honour any commitments entered into with current or former directors that have been disclosed to shareholders in previous remuneration reports (e.g. all historic awards that were granted under any LTIPs that remain outstanding, as detailed in the company’s latest Annual Report), and which remain eligible to vest based on their original award terms. With regard to any promotions to executive director positions, the company will retain the ability to honour payments agreed prior to executives joining the Board, albeit any payments agreed in consideration of being promoted to the Board will be consistent with the policy on new appointments as an executive director detailed in the remuneration policy at www.pendragonplc.com
DIRECTORS’ REMUNERATION REPORT

55
ILLUSTRATION OF OUR REMUNERATION POLICY FOR 2018The tables and charts below illustrate the operation of the
remuneration policy and provide estimates of the potential
future remuneration that executive directors would receive,
in the scenarios shown, in accordance with the directors’
remuneration policy for 2018. Potential outcomes based
on different performance scenarios are provided for each
executive director. A significant percentage of remuneration
is linked to performance, particularly at maximum levels.
The chart below illustrates the remuneration that could be
paid to each of the executive directors, based on salaries
at the start of the financial year 2018, under three different
performance scenarios: (i) minimum; (ii) on target; and
(iii) maximum. The elements of remuneration have been
categorised into three components: (i) fixed; (ii) annual
bonus; (iii) Value Creation Plan.
Element Description Minimum On Target Maximum
FixedFixed (comprises
base salary, benefits,pension)
Included Included Included
Annual Bonus Annual bonus 0%25% of the
maximum bonus1
100% of the maximum bonus1
Value Creation PlanLong term
incentive plan0%
50% of the average annual IFRS 2 value
of the award2
100% of the average IFRS 2 value of the
award2
1. The maximum bonus available for executive directors is equivalent to 100% of base salary. 2. Awards made under the VCP will be on a one-off basis with a four year measurement period. For illustrative purposes only, the maximum value displayed here represents 100% of the IFRS 2 value of the award, which is intended to give an estimate of the value of the award on grant.
In accordance with the regulations, share price growth has not been included.
TREVOR FINNValue of package (£m)
MARTIN CASHAValue of package (£m)
TIM HOLDENValue of package (£m)
=FIXEDANNUAL BONUS VCP TOTAL+ +
Minimum On Target Maximum
Fixed Elements Annual Bonus VCP
£1.5M
£1.2M
£0.9M
£0.6M
£0.3M
£000
Minimum On Target Maximum Minimum On Target Maximum
£0.589m
£0.896m
£1.434m
£0.376m
£0.576m
£0.922m
£0.249m
£0.368m
£0.597m
100%
100%
100%
69% 44%
68% 44%
66% 41%
14%
17% 35%
21%
14%
18% 35%
21%
15%
19%36%
23%

56
We list below the areas of policy the company has adopted
in the shareholder approved remuneration policy (available
to view on the company’s website).
New appointments as executive directorIncluding each component of remuneration
All these policy areas remain unchanged from the policy approved by shareholders at the 2017 AGM.
New appointments as non-executive director
Non-executive remuneration
How employees’ pay is taken account in executive remuneration
Directors’ service contracts and exit payments
Treatment of fees earned from external directorships
NON-EXECUTIVE DIRECTORS’ APPOINTMENTS
Name Commencement Expiry/cessationUnexpired at date of
report (months)
Chris Chambers 23.10.17 31.12.20 34
Gillian Kent 22.05.16 31.12.18 11
Jeremy King 25.11.17 31.12.20 34
DIRECTORS’ REMUNERATION REPORT

57
ADVISORS During 2017, the chief executive, Trevor Finn provided
advice to the Committee but not in respect of his own pay.
In addition, external advice was provided by PwC. Pinsent
Masons LLP continue to be retained as the company’s share
incentive scheme legal advisors, although did not earn fees
in 2017. In 2017, fees of £52,860 were paid to PwC. Pinsent
Masons and PwC are considered to be independent. Pinsent
Masons and PwC do not provide any other services to the
Group. The company secretary also acts as secretary to the
Committee and provides additional advice.
ANNUAL REPORT ON REMUNERATION
Salary or fees1
£000
Taxablebenefits3
£000Pension4
£000Bonus5
£000
Long termincentive plan6,7
£000
Single total figure£000
2017 2016 2017 2016 2017 2016 2017 2016 2017 2016 2017 2016
Executive directors
Trevor Finn 464 464 4 4 121 121 138 402 0 666 727 1,657
Martin Casha 292 292 8 7 76 76 87 254 0 400 463 1,029
Tim Holden 221 221 6 6 22 22 66 192 0 317 315 758
Hilary Sykes2 - 129 - 8 - 33 - 112 - 188 - 470
Non-executive directors
Chris Chambers 69 47 - - - - - - - - 69 47
Gillian Kent 40 40 - - - - - - - - 40 40
Jeremy King 50 48 - - - - - - - - 50 48
Mel Egglenton8 121 150 - - - - - - - - 121 150
Paul Hampden Smith9 - 20 - - - - - - - - - 20
1. In the case of non-executive directors, fees include committee chair fees in addition to the basic non-executive director fee of £40,000, as detailed in the Policy on Non-Executive Directors’ Remuneration in the policy table above at page 54. 2. Hilary Sykes retired from the company and the board with effect from 01.01.17. Settlement entitled her to the 2014 LTIP.3. Benefits in kind include life assurance, private health cover, professional subscriptions, contribution to home telephone costs and provision of up to two cars (at the director’s election), one of which is fully expensed.4. Salary supplement in lieu of employer pension contribution, or in the case of Tim Holden, company contribution to defined contribution pension scheme of 10% of basic salary (£22,083 in 2017, £22,083 in 2016). Trevor Finn and Martin Casha ceased to be active members of the Pendragon defined benefit Pension Plan in 2006. Trevor Finn elected to take early retirement benefits from 08.02.08 and is therefore a pensioner member. Martin Casha also elected to take early retirement benefits from 01.07.16 and is therefore also a pensioner member. In April 2016, Tim Holden elected to a receive a payment of 10% of salary rather than continue to receive pension contributions.5. Bonus Award for 2017 total equivalent to 29.8% of base salary, 2016 total equivalent to 86.76% of base salary – see page 58 for more detail.6. The performance conditions for the LTIP awarded in 2015 have not been achieved, and consequently these awards will lapse in their entirety.7. The sterling value of the 2014 LTIP awards which vested in 2016 (maturity date 20.03.17) is based on the actual price these shares were sold at (where shares were retained by directors, the sold at price was used), which was £0.3421 on 20.03.17.8. Mel Egglenton resigned from the Board on 23.10.17. Accordingly, his fees are for the period 01.01.17 to 23.10.179. Paul Hampden Smith retired from the board at the expiry of his appointment on 22.05.16. Consequently, his fee for 2016 is calculated for the period 01.06.16 to 22.05.16.
The Committee’s work for 2017
• determined annual bonus awards in respect of
2016 performance
• set the annual bonus plan terms for 2017
• introduced and granted awards under the Value
Creation Plan
• tested the performance targets for the company’s
2015 Long Term Incentive Award vesting
• set 2018 executive director salary levels
• noted remuneration trends across the Group
• reviewed and effected renewal of remuneration
policy and made awards under the Value Creation
Plan
SINGLE TOTAL FIGURE (AUDITED INFORMATION)

58
PENSIONSThe Pendragon Pension Plan (Pension Plan) is established for
the benefit of the Group’s eligible employees. The Pension
Plan operates through a trustee company which holds and
administers its assets entirely separately from the Group’s
assets. There is no direct investment in Pendragon PLC.
Trevor Finn and Martin Casha ceased to be active members
of the Pension Plan in 2006. Tim Holden participated in the
Pendragon Group Pension Scheme, a defined contribution
pension scheme, until April 2016. From April 2016, Tim
Holden elected to receive a payment of 10% of basic salary,
rather than continue to receive pension contributions
(£22,083 in 2017). The non-executive directors are not
eligible to participate in the Pension Plan.
PERFORMANCE RELATED PAY FOR 2017: ANNUAL BONUSGiven their commercial sensitivity, we do not publish the
details of targets in advance. However, the Committee
considers the targets to be measurable and appropriately
stretching. For 2017, the maximum available annual bonus
opportunity was 100% of base salary, only achievable
for performance in excess of the company’s strategic
plan. Payouts are achievable for demanding performance,
measured against underlying (adjusted) profit (50%)
and year-end net debt (50%). This structure for bonus
opportunity for 2017 reflects both the investor feedback
received and the competitive market in which the company
currently operates. Details of the percentages of salary
payable at threshold, target and maximum are set out in the
table below.
Available Actual outturn 2017
Performance measureUnderlying
profitYear end net debt
Underlying profit Year end net debt
Target aligned to business plan% of basic salary
payableLevel
% of basic salarypayable
Level% of basic salary
payable
Threshold performance(10% below Target) must exceed
prior year’s result12.5 12.5 - - - -
In line with Target 31.25 31.25 - - - 29.8%
Maximum ≥10% above Target 50 50 - - - -
Straight line vesting between performance points
For the year ended 31 December 2017, the Committee
determined that as underlying profit performance was
below the Threshold, no performance related pay would be
payable in this respect. The year end net debt performance
was marginally below the target, and therefore total annual
performance related pay on a pro-rata basis would be 29.8%
of salary, based on the salary earned by each executive
director during the year under review.
Measure
Performance metrics2017 outturn
Performance Payout
Threshold Target Maximum Actual% of basic salary
payable
Underlying profit >£75.4m ≥£76.2m ≥£83.8m £60.4m 0
Net debt <£135.5m £123.2m £110.9m £124.1m 29.8
Total bonus achieved 29.8
≥≥
DIRECTORS’ REMUNERATION REPORT

59
LONG TERM INCENTIVES VESTING IN 2017The Remuneration Committee assesses the extent to which
the performance conditions that apply to the performance
related elements of the remuneration framework have been
met, following sign off of the company’s audited Annual
Report and Accounts. This ensures that incentive payments
are made following independently audited results being
known.
Following an assessment of the performance conditions
applicable to the 2015 award, the Remuneration Committee
determined that the relevant performance conditions to
achieve vesting were not satisfied (namely that actual
underlying EPS achieved in the financial year ending 31
December 2017 be 3.8p or above for 25% vesting: actual
EPS achieved was 3.3p. The 2015 LTIP therefore lapsed in
its entirety.
BASE SALARY FOR 2018Base salaries for the executive directors will remain
unchanged from the 2017 salary levels.
PERFORMANCE RELATED PAY FOR 2018The annual bonus for the 2018 financial year will operate
on the same basis as for the 2017 financial year and will be
consistent with the policy detailed in the remuneration policy
section of this report having maximum bonus opportunity,
deferral and clawback provisions identical to those in place
for 2017. The performance metrics selected are underlying
profit and year-end net debt, with an equal weighting given
to each. Underlying profit and year-end net debt targets
have been set to be challenging relative to the 2018 business
plan. The targets themselves, as they relate to the 2018
financial year, are considered to be commercially sensitive,
and we do not publish details of these in advance.
VALUE CREATION PLAN(VCP) AWARDS MADE IN 2017The VCP was approved by shareholders on 27 April 2017.
Under the VCP, executive directors were granted a nil cost
option over ordinary shares of the company on 26 May 2017.
Vesting is based on the growth of absolute total shareholder
return generated over the VCP performance period. The
performance period for the award comprises the four years
(‘Performance Period’) commencing on 1 January 2017. The
VCP award gives the executive directors the opportunity
to share in a proportion of the total value created for
shareholders above a hurdle (‘Threshold Total Shareholder
Return’) measured at the end of the Performance Period on
31 December 2020 (‘Measurement Date’).
The price used for this measurement (‘Measurement Total
Shareholder Return’) will be the sum of the average share
price for the three months ending on the Measurement
Date plus the cumulative dividends paid per share over the
Performance Period. The starting share price was set at
£0.3016 (‘Initial Price’), being the three month average share
price prior to 1 January 2017. The hurdle price was set at
£0.442, being the Initial Price plus 10% compounded annual
growth over the Performance Period (‘Hurdle’). The total
participation pool for the VCP will be 10% of the total value
created above the Hurdle (‘Pool’). The number of shares
under the nil cost option will be determined at the end of
the Performance Period on the Measurement Date and
will be calculated by reference to the executive director’s
percentage entitlement to growth in value in the table below.
Any awards which vest after the four year Performance
Period will be subject to a further one year holding period.
Director PositionPercentage entitlement of 10% Pool
Percentage entitlement of growth in value
Trevor Finn Chief Executive 30% 3%
Martin Casha Chief Operating Officer 20% 2%
Tim Holden Finance Director 10% 2%
RECOVERY ANDWITHHOLDING PROVISIONSAs detailed in the summary of remuneration policy on pages
51 to 54, the clawback provisions that operate in the annual
bonus, the LTIP and the VCP enable the Remuneration
Committee to recover value overpaid in the event of either
a material misstatement of the company’s financial results
for any period or misconduct. Should it be considered
appropriate to enforce these provisions, value can be
recovered through the withholding of future incentive
payouts (including at the point of vesting of an LTIP or VCP
award) or through requiring the overpayment be refunded to
the company on a net of tax basis. The clawback provisions
are included in the relevant plan documentation so that there
is a clear basis on which the Remuneration Committee could
seek to enforce the provisions should it consider it necessary
to do so.

60
DIRECTORS’ SHAREHOLDINGS(AUDITED INFORMATION)
Each executive director fulfils the requirements of the
company share ownership policy applicable to them (i.e.
building a 200% of salary share ownership in the case of the
chief executive and 100% in the case of the other executive
directors). There is no company policy on non-executive
director share ownership.
TOTAL SHAREHOLDER RETURN1
The graph below shows the total shareholder return (‘TSR’)2
on the company’s shares in comparison to the FTSE Small
Cap Index (excluding investment companies)3. TSR has been
calculated as the percentage change, during the relevant
period, in the market price of the shares, assuming that any
dividends paid are reinvested on the ex-dividend date. The
relevant period is the seven years ending 31 December 2017.
The notes at the foot of the graph provide more detail of the
TSR calculation.
300
250
200
150
100
50
02011 2012 2013 2014 2015 2016 2017
PENDRAGON PLC - TOTAL RETURN INDEX FTSE SMALL CAP EX INV. TRUSTS - TOTAL RETURN INDEX
PENDRAGON PLC TSR 2011 - 2017
1. This report is required, pursuant to the Large and Medium sized Companies and Groups (Accounts and Reports) (Amendment) Regulations 2013, regulation 18, Performance Graph. 2. Total Shareholder Return (‘TSR’) is calculated over the seven years ended on 31 December 2017 and reflects the theoretical growth in the value of a shareholding over that period, assuming dividends (if any) are reinvested in shares in the company. The price at which dividends are reinvested is assumed to be the amount equal to the closing price of the shares on the ex-dividend date plus the gross amount of annual dividend. The calculation ignores tax and reinvestment charges. For each company in the index, the TSR statistics are normalised to a common start point, which gives the equivalent to investing the same amount of money in each company at that time. The percentage growth in TSR is measured over the chosen period. To obtain TSR growth of the relevant index over the chosen period, the weighted average of TSR for all the companies in the index is calculated. In this case, it is the FTSE Small Cap Index (excluding investment companies) as explained in Note 3. The weighting is by reference to the market capitalisation of each company in the index in proportion to the total market capitalisation of all the companies in the index at the end of the chosen measurement period.3. The FTSE Small CAP index has been selected as it represents the equity market in which the Company was a constituent member for the majority of the relevant seven year period ending 31 December 2017 detailed above.
DIRECTORS’ REMUNERATION REPORT
Legally owned as at 31.12.2017
Legally owned as at 31.12.2016
Subject to deferral under the annual bonus plan
Subject to performance conditions under the relevant long term
incentive planVested but unexercised
share options2016 LTIP
award2015 LTIP
award 2015 LTIP1 award 2016 LTIP2 award
Trevor Finn 19,127,976 18,216,623 No No 1,764,593 1,931,250 0
Martin Casha 9,559,780 8,794,301 No No 1,113,236 1,218,375 0
Tim Holden 2,131,331 1,524,347 No No 840,704 920,104 0
1. Performance conditions: vesting is subject to the satisfaction of performance conditions based on achieving defined earnings per share targets measured from the 2014 earnings per share result over a three year performance period – 3.8p (25% vesting) rising to 4.5p (100% vesting). Actual EPS achieved for the financial year 2017: 3.3p. 2. Performance conditions: vesting is subject to the satisfaction of performance conditions based on achieving defined earnings per share targets measured from the 2015 earnings per share result over a three-year performance period – 4.5p (25% vesting) rising to 5.3p (100% vesting).
DIRECTORS’ SHAREHOLDINGS (AUDITED INFORMATION)

61
Chief Executive 2017 2016 2015 2014 2013 2012 2011
Total Remuneration £m (single figure) 727 1,657 1,667 3,472 2,961 857 946
Annual bonus award (% of maximumthat could have been paid)
30% 87% 100% 100% 100% 54% 75%
Percentage of LTIP1 vesting 0% 100% 56% 100% 100% 0% 0%
1. Percentage of shares vesting under the Pendragon Long Term Incentive Plan (for 2012, the Pendragon ExSOP) against the maximum number of shares that could have been received.
HISTORY OF CHIEF EXECUTIVE REMUNERATION (AUDITED INFORMATION)
Chief Executive
Employees of Company as a whole
% change in salary 2017 compared to 2016 0% 3.34%
% change in benefit 2017 compared to 2016 0% -1.18%
% change in bonus 2017 compared to 2016 -65.65% -34.67%
PERCENTAGE CHANGE IN CHIEF EXECUTIVE REMUNERATION
The table below illustrates the percentage change in the
remuneration awarded to the chief executive between
the preceding year and the reported year and that of the
Group’s employees across its entire UK business.
£30M
£20M
£10M
£0M
£3OOM
£200M
£100M
£0M
DIVIDEND TOTAL EMPLOYEE PAY
£287.1M
RELATIVE IMPORTANCE OF SPEND ON PAY
The graph below illustrates the difference between spend
on remuneration paid to all employees of the company, and
dividend (interim and final proposed dividend) compared to
the prior year.
2016 2017 2016 2017
£294.2M
£20.8M £21.3M

62
2016 Directors’ Remuneration Report Number Proportion of votes cast
Votes cast in favour 966,066,769 98.60
Votes cast against 13,757,503 1.40
Total votes cast in favour or against 979,824,272 100%
Votes withheld 10,179,935
SHAREHOLDERS’ VOTE ON REMUNERATION AT THE 2017 AGM
SHARE PRICE INFORMATIONAND PERFORMANCEOther than those detailed above, there are no share option
or long term incentive schemes in which the directors are
eligible to participate. The middle market price of Pendragon
ordinary shares at 29 December 2017 was 28.125 pence and
the range during the year was 22.25 pence to 39.00 pence.
APPROVALThis report was approved by the Committee and signed on its behalf by
Jeremy King
Acting Chairman of the Remuneration Committee
13 February 2018
DIRECTORS’ REMUNERATION REPORT
Directors’ Remuneration Policy (2017-2020) Number Proportion of votes cast
Votes cast in favour 546,252,498 55.34
Votes cast against 440,789,662 44.66
Total votes cast in favour or against 987,042,160 100%
Votes withheld 2,691,847

63DIRECTORS’ REPORT
STRATEGIC REVIEW ANDPRESCRIBED REPORTINGOur Strategic Review at pages 1 to 35 contains the
information, prescribed by the Companies Act 2006,
required to present a fair review of the company’s business,
a description of the principal risks and uncertainties it
faces, and certain of the information on which reports and
statements are required by the UK Corporate Governance
Code. The Board approved the Strategic Review set out on
pages 1 to 35 and the Viability Statement set out on page 17.
Additional information on which the directors are required
by law to report is set out below and in the following:-
• Corporate Governance Report
• Board of Directors
• Corporate Social Responsibility Report
• Audit Committee Report
• Nomination Committee Report
• Directors’ Remuneration Report
• Directors’ Report
• Directors’ Responsibility Statement
In the interests of increasing the relevance of the Report and
reducing the environmental impacts of over-lengthy printed
reports, we have placed on our website certain background
information on the company the disclosure of which, in this
Report, is not mandatory. We first adopted this approach in
2015, and have not received any adverse feedback. We shall
continue to monitor reaction to publication of shareholder
information on our website, to help shape our shareholder
communication and future improvements.
RESULTS AND DIVIDENDSThe results of the Group for the year are set out in the
financial statements on pages 73 to 143. An interim dividend
of 0.75 pence per ordinary share was paid to shareholders
on 24 October 2017 (2016: 0.7 pence). The directors are
recommending a final dividend of 0.80 pence per ordinary
share (2016: 0.75 pence) which would, if approved by
shareholders at the 2018 AGM, bring total dividends for 2017
to 1.55 pence (2016 total: 1.45 pence).
APPOINTMENT AND POWERSOF THE COMPANY’S DIRECTORSAppointment and removal of directors is governed by the
company’s articles of association (the Articles), the UK
Corporate Governance Code (the Code), the Companies
Acts and related legislation. Subject to the Articles (which
shareholders may amend by special resolution), relevant
legislation and any directions given by special resolution, the
company and its group is managed by its board of directors.
By resolutions passed at company general meetings, the
shareholders have authorised the directors: (i) to allot and
issue ordinary shares; (ii) to offer and allot ordinary shares in
lieu of some or all of the dividends; and (iii) to make market
purchases of the company’s ordinary shares (in practice,
exercised only if the directors expect it to result in an
increase in earnings per share). Details of movements in the
company’s share capital are given in note 4.4 to the financial
statements.
In May 2016, the company announced the commencement of
a programme to buyback an initial £20 million of its ordinary
shares. Between 20 May 2016 and 31 December 2017, the
company purchased and cancelled a total of 35,506,652
ordinary shares in the company. In addition, from time to time,
Pendragon provides financial assistance to its independent
employee benefits trust to facilitate the market purchase of
ordinary shares in the company for use in connection with
various of the company’s employee incentive schemes. In
2017, 8,277,625 shares were purchased in this way.
BUSINESS ATTHE ANNUAL GENERAL MEETINGAt the AGM, a separate shareholders’ resolution is proposed
for each substantive matter. We will issue with shareholders
the company’s annual report and financial statements
together with the notice of AGM, giving not less than the
requisite period of notice. The notice sets out the resolutions
the directors are proposing and has explanatory notes for
each. At the AGM, directors’ terms of appointment are
available for inspection and, as well as dealing with formal
AGM business, the Board takes the opportunity to give an
update to shareholders on the company’s trading position.
The chairman and each committee chairman are available to
answer questions put by shareholders present.

64
DIRECTORS AND THEIRINTERESTS IN SHARES Current directors are listed on page 36. Details of the terms
of appointment and notice period of each of the current
directors, together with executives directors’ respective
interests in shares under the company’s long term incentive
plan (non-executive directors have none), appear in the
Directors’ Remuneration Report on pages 50 to 62 . Directors
who served during 2017 and their respective interests in
the company’s issued ordinary share capital are shown in
the table below. All holdings shown are beneficial. None
of the directors holds options over company shares. Each
executive director fulfils the requirements of the company’s
share ownership policy applicable to them. There is no
company policy requiring non-executive directors to hold a
minimum number of company shares.
DIRECTORS’ ROTATIONThe Articles require directors to retire by rotation. The Code
superimposes an obligation that all directors retire annually,
if the company is within the FTSE 350. The company is
currently outside of the FTSE 350. Irrespective of any Code
requirements, the company has made annual retirement
and offering for re-election compulsory in the case of non-
executive directors whose service exceeds six years, even
should the company cease to lie within the FTSE 350.
INDEMNITIES TO DIRECTORSIn line with market practice and the company’s Articles,
each director has the benefit of a deed of indemnity from
the company, which includes provisions in relation to duties
as a director of the company or an associated company,
qualifying third party indemnity provisions and protection
against derivative actions. Copies of these are available for
shareholders’ inspection at the AGM.
SIGNIFICANT DIRECT OR INDIRECT SHAREHOLDINGSAt 1 February 2018 the directors had been advised of the
following interests in the shares of the company:-
Directors’ shareholdingsNumber at
31.12.17Number at
31.12.16
Martin Casha 9,559,780 8,794,301
Chris Chambers 2,000,000 240,000
Trevor Finn 19,127,976 18,216,623
Tim Holden 2,131,331 1,524,347
Jeremy King 145,030 145,030
Gillian Kent Nil Nil
Shareholder Number of sharesPercentage of voting rights of the issued share capital
Odey Asset Management 208,103,250 14.61
GMT Capital Corp 135,320,712 9.50
Teleios Capital Partners GmBH 111,457,345 7.83
Schroder Investment Management 76,410,302 5.37
Aberforth Partners LLP 73,796,823 5.18
AXA Investment Managers UK 46,699,000 3.28
Alken Asset Management Limited 45,536,298 3.20
Hosking & Co. Ltd 43,555,569 3.06
SHARE CAPITALAs at 31 December 2017, Pendragon’s issued share capital
comprised a single class: ordinary shares of 5 pence each.
The Articles permit the creation of more than one class of
share, but there is currently none other than ordinary shares.
Details of the company’s share capital are set out in note
4.4 to the accounts. All issued shares are fully paid. The
company did not issue any new shares during the period
under review. The rights and obligations attaching to the
company’s ordinary shares are set out in the Articles. The
company is currently authorised to issue up to two-thirds
of its current issued share capital pursuant to a resolution
passed at its 2017 AGM.
DIRECTORS’ REPORT

65
VOTING RIGHTS, RESTRICTIONSON VOTING RIGHTS AND DEADLINESFOR VOTING RIGHTSShareholders (other than any who, under the Articles or the
terms of the shares they hold, are not entitled to receive
such notices) have the right to receive notice of, and to
attend and to vote at, all general and (if any) applicable class
meetings of the company. A resolution put to the vote at
any general or class meeting is decided on a show of hands
unless (before or on the declaration of the result of the show
of hands or on the withdrawal of any other demand for a poll)
a poll is properly demanded. At a general meeting, every
member present in person has, upon a show of hands, one
vote, and on a poll, every member has one vote for every 5
pence nominal amount of share capital of which they are the
holder. In the case of joint holders of a share, the vote of the
member whose name stands first in the register of members
is accepted to the exclusion of any vote tendered by any
other joint holder. Unless the Board decides otherwise, a
shareholder may not vote at any general or class meeting or
exercise any rights in relation to meetings whilst any amount
of money relating to his shares remains outstanding.
A member is entitled to appoint a proxy to exercise all or any
of their rights to attend and speak and vote on their behalf
at a general meeting. Further details regarding voting can
be found in the notes to the notice of the AGM. Details of
the exercise of voting rights attached to the ordinary shares
held by the company’s Employee Benefit Trust are set out
below. None of the ordinary shares, including those held by
the Employee Benefit Trust, carries any special voting rights
with regard to control of the company.
To be effective, electronic and paper proxy appointments
and voting instructions must be received by the company’s
registrars not later than 48 hours before a general meeting.
The Articles may be obtained from Companies House in the
UK or upon application to the company secretary. Other
than those prescribed by applicable law and the company’s
procedures for ensuring compliance with it, there are no
specific restrictions on the size of a holding nor on the
transfer of shares, which are governed by the Articles and
prevailing legislation. The directors are not aware of any
agreement between holders of the company’s shares that
may result in restrictions on the transfer of securities or the
exercise of voting rights. No person has any special rights of
control over the company’s share capital.
SHARES HELD BY THE PENDRAGON EMPLOYEE BENEFIT TRUSTAs at 31 December 2017, the company’s Employee Benefit
Trust with Accuro Trustees (Jersey) Limited (the Trustee)
held 7,676,226 shares, representing 0.54% of the total issued
share capital at that date (2016: 5,913,892; 0.42%). The
Trustee has waived its voting rights attached to these shares.
It holds these shares to enable it to satisfy entitlements under
the company’s share schemes. During the year, the Trustee
transferred 6,515,291 shares to satisfy such entitlements
(2016: 4,571,340).
CONTRACTS
None of the directors had an interest in any contract
with the Group (other than their service agreement or
appointment terms and routine purchases of vehicles for
their own use) at any time during 2017. The company and
members of its group are party to agreements relating to
banking, properties, employee share plans and motor vehicle
franchises which alter or terminate if the company or group
company concerned undergoes a change of control. None
is considered significant in terms of its likely impact on the
business of the Group as a whole.
POLITICAL DONATIONS
The company and its group made no political donations
(2016: £ nil).
AUDITORThe directors who held office at the date of approval of
this directors’ report confirm that: so far as they are each
aware, there is no relevant audit information of which the
Group’s auditors are unaware; and each director has taken
all the steps that they ought to have taken as a director
to make themself aware of any relevant audit information
and to establish that the Group’s auditors are aware of that
information.
By order of the Board
Richard Maloney
Company Secretary
13 February 2018

66STATEMENT OF DIRECTORS’ RESPONSIBILITIES IN RESPECT OF THE ANNUAL REPORT AND THE FINANCIAL STATEMENTS
The directors are responsible for preparing the Annual Report
and the Group and parent company financial statements in
accordance with applicable law and regulations.
Company law requires the directors to prepare group and
parent company financial statements for each financial
year. Under that law they are required to prepare the group
financial statements in accordance with IFRSs as adopted by
the EU and applicable law and have elected to prepare the
parent company financial statements in accordance with UK
Accounting Standards, including FRS 101 Reduced Disclosure
Framework.
Under company law the directors must not approve the
financial statements unless they are satisfied that they give a
true and fair view of the state of affairs of the Group and parent
company and of their profit or loss for that period. In preparing
each of the Group and parent company financial statements,
the directors are required to:
• select suitable accounting policies and then apply them
consistently;
• make judgements and estimates that are reasonable and
prudent;
• for the Group financial statements, state whether they have
been prepared in accordance with IFRSs as adopted by the
EU;
• for the parent company financial statements, state whether
applicable UK Accounting Standards have been followed,
subject to any material departures disclosed and explained
in the parent company financial statements; and
• assess the Group and parent company’s ability to continue
as a going concern, disclosing, as applicable, matters related
to going concern; and
• use the going concern basis of accounting unless they either
intend to liquidate the Group or the parent company or to
cease operations, or have no realistic alternative but to do
so.
The directors are responsible for keeping adequate accounting
records that are sufficient to show and explain the parent
company’s transactions and disclose with reasonable accuracy
at any time the financial position of the parent company and
enable them to ensure that its financial statements comply
with the Companies Act 2006. They are responsible for such
internal control as they determine is necessary to enable the
preparation of financial statements that are free from material
misstatement, whether due to fraud or error, and have general
responsibility for taking such steps as are reasonably open to
them to safeguard the assets of the Group and to prevent and
detect fraud and other irregularities.
Under applicable law and regulations, the directors are also
responsible for preparing a Strategic Report, Directors’ Report,
Directors’ Remuneration Report and Corporate Governance
Statement that complies with that law and those regulations.
The directors are responsible for the maintenance and integrity
of the corporate and financial information included on the
company’s website. Legislation in the UK governing the
preparation and dissemination of financial statements may
differ from legislation in other jurisdictions.
Responsibility statement of the directors in respect of the
annual financial report
We confirm that to the best of our knowledge:
• the financial statements, prepared in accordance with the
applicable set of accounting standards, give a true and fair
view of the assets, liabilities, financial position and profit or
loss of the company and the undertakings included in the
consolidation taken as a whole; and
• the Annual Report and Accounts includes a fair review of
the development and performance of the business and the
position of the issuer and the undertakings included in the
consolidation taken as a whole, together with a description
of the principal risks and uncertainties that they face.
We consider the Annual Report and Accounts, taken as a
whole, is fair, balanced and understandable and provides the
information necessary for shareholders to assess the Group’s
position and performance, business model and strategy.
Approved by order of the Board
Tim Holden
Finance Director
13 February 2018

67INDEPENDENT AUDITOR’S REPORT TOTHE MEMBERS OF PENDRAGON PLC
1. Our opinion on the financial statements is unmodified
We have audited the financial statements of Pendragon PLC (‘the Company’) for the year ended 31 December 2017 set out on
pages 73 to 154, which comprise of Consolidated Income Statement, Consolidated and Company Statement of Comprehensive
Income, Consolidated and Company Statement of Changes in Equity, Consolidated and Company Balance Sheet, Consolidated
Cash Flow Statement and the related notes, including the accounting policies.
In our opinion:
• the financial statements give a true and fair view of the state of the Group’s and of the parent company’s affairs as at 31
December 2017 and of the Group’s profit for the year then ended;
• the Group financial statements have been properly prepared in accordance with International Financial Reporting
Standards as adopted by the European Union;
• the parent company’s financial statements have been properly prepared in accordance with UK Accounting Standards,
including FRS 101 Reduced Disclosure Framework; and
• the financial statements have been prepared in accordance with the requirements of the Companies Act 2006 and, as
regards the Group financial statements, Article 4 of the IAS Regulation.
Basis for opinion
We conducted our audit in accordance with International Standards on Auditing (UK) (‘ISAs (UK)’) and applicable law. Our
responsibilities are described below. We believe that the audit evidence we have obtained is a sufficient and appropriate basis
for our opinion. Our audit opinion is consistent with our report to the Audit Committee.
We were appointed as auditor by the shareholders on 28 April 1997. The period of total uninterrupted engagement is for the
21 financial years ended 31 December 2017. We have fulfilled our ethical responsibilities under, and we remain independent of
the Group in accordance with UK ethical requirements including the FRC Ethical Standard as applied to listed public interest
entities. No non-audit services prohibited by that standard were provided.
2. Our assessment of risks of material misstatement
Key audit matters are those matters that, in our professional judgement, were of most significance in the audit of the financial
statements and include the most significant assessed risks of material misstatement (whether or not due to fraud) identified
by us, including those which had the greatest effect on: the overall audit strategy; the allocation of resources in the audit;
and directing the efforts of the engagement team. We summarise below the key audit matters (unchanged from 2016), in
decreasing order of audit significance, in arriving at our audit opinion above, together with our key audit procedures to address
those matters and, as required for public interest entities, our results from those procedures. These matters were addressed,
and our results are based on procedures undertaken, in the context of, and solely for the purpose of, our audit of the financial
statements as a whole, and in forming our opinion thereon, and consequently are incidental to that opinion, and we do not
provide a separate opinion on these matters.
Those relevant to the Group are:

68
The risk – Forecast-based valuation
The Group’s significant goodwill balance is allocated across
its CGUs which are generally the franchises. For some CGUs
with a significant goodwill balance and poor historical
performance there is a risk that book value exceeds
recoverable amount. The recoverable amount of the CGU will
be affected by a number of factors including both general
market trends and franchise specific factors, for example,
the success of new model launches, which could result in
a franchise not achieving its forecasted results. There is
inherent uncertainty in forecasting future cash flows and
following the decline in the share price and profits warning
issued by the Group in October 2017 this is a particularly
judgemental area of the audit.
Our response – Our procedures included:
• Historical comparisons: We assessed the Group’s
budgeting procedures by comparing the Group’s
historical budgets to actual performance;
• Benchmarking assumptions: We performed our own
assessments in relation to key inputs such as projected
economic growth and competition and their expected
impact on forecasted results, cost inflation and discount
rates used within management forecasts;
• Our valuation experience: We used our own valuation
specialist to assist us in evaluating the assumptions and
methodology used by the Group to derive a discount
rate;
• Sensitivity analysis: We performed break-even analysis
on the assumptions noted above;
• Comparing valuations: We compared the sum of
the discounted cash flows to the Group’s market
capitalisation to assess the reasonableness of those
cashflows and challenged the Group’s explanation in
reconciling the two; and
• Assessing transparency: We assessed whether the
Group’s disclosures about the sensitivity of the outcome
of the impairment assessment to changes in key
assumptions reflected the risks inherent in the valuation
of goodwill.
Our results: We found the Group’s assessment of the
recoverable amount of goodwill in the Group to be
acceptable (2016 result: acceptable).
INDEPENDENT AUDITOR’S REPORT TOTHE MEMBERS OF PENDRAGON PLC
2. Our assessment of risks of material misstatement continued
Carrying value of Goodwill (£361.2m (2016: £356.5m)) Risk vs 2016:
Refer to page 45 Audit Committee report, page 102 (accounting policy) and pages 103 to 105 (financial disclosures).
The risk – subjective valuation
The Group holds significant levels of used vehicle inventory
in the UK. Used vehicle selling prices vary depending upon a
number of factors including general economic conditions and
the levels of new vehicle production. Accounting standards
require inventory to be held at the lower of cost and net
realisable value. For inventory held for a longer period, there
is heightened risk that the value may decline below the initial
purchase price. History has shown that the average price of
a used vehicle may decline significantly over a short period
of time, and therefore this is a significant judgement area.
Valuation of used vehicle inventory in the UK (£349.8m (2016: £380.4m)) Risk vs 2016:
Refer to page 45 Audit Committee report, page 109 (accounting policy) and page 109 (financial disclosures).
Our response- Our procedures include:
• Reperformance: We have reperformed the calculation
of the provision provided by management;
• Historical comparisons: We considered the Group’s
historical trading patterns and made alternative
calculations to assess whether the provision was in a
range of acceptable outcomes;
• Benchmarking assumptions: We have compared
the Group’s expectations for used car prices to the
expectations of other market commentators;
• Tests of details: We assessed the appropriateness of
the provision by comparing the losses incurred on used
car sales subsequent to the year end to the level of the
year end provision;
• Historical comparisons: We assessed the Group’s
methodology for calculating the provision by performing
a retrospective review of sales prices achieved during
the year compared to the prior year provision; and

69
2. Our assessment of risks of material misstatement continued
• Assessing transparency: We also considered the
adequacy of the Group’s disclosures about the degree
of estimation involved in arriving at the vehicle inventory
provision.
Our results: We found the Group’s assessment of the
valuation of UK used inventory to be acceptable (2016
result: acceptable).
The risk – subjective valuation
Significant estimates are made in valuing the Group’s post-
retirement benefit liabilities within the pension schemes.
Small changes in assumptions and estimates used to value
the Group’s net pension deficit would have a significant
effect on the results and financial position of the Group.
Liabilities within the post-retirement benefits obligation (£521.8m (2016: £544.6m)) Risk vs 2016:
Refer to page 45 Audit Committee report, page 133 (accounting policy) and pages 133 to 140 (financial disclosures).
Our response- Our procedures include:
• Our sector experience: With the support of our own
actuarial specialists, we challenged the key assumptions
applied to determine the Group’s post-retirement
benefit liabilities. The key assumptions tested include
discount rate, inflation rate, mortality/life expectancy
and rate of pension payments;
• Benchmarking assumptions: We compared the discount
rate, inflation rate, mortality/life expectancy and rate of
pension payments to externally derived data; and
• Assessing transparency: We also considered the
adequacy of the Group’s disclosures in respect of the
sensitivity of the deficits to these assumptions.
Our results: We found basis for valuing the liabilities within
the post-retirement benefits obligations to be acceptable
(2016 result: acceptable).
Those relevant to Company only are:
Carrying value of Investments (£922.6m (2016: £922.6m)) Risk vs 2016:
Refer to page 45 Audit Committee report, page 148 (accounting policy) and page 150 (financial disclosures).
The risk – Forecast-based valuation
The subsidiary companies’ investment balances are held
at cost less any impairment. The estimated recoverable
amount of these balances is subjective due to the inherent
uncertainty involved in forecasting and discounting future
cash flows. The risks have increased this year due to a
reduction in share price and the profit warning issued in
October 2017.
Our response- Our procedures include:
• Comparing valuations: We compared the carrying
value of investments to discounted cashflows;
• Our work relied on the procedures we undertook
to consider the reasonableness of the discounted
cashflows used to assess the valuation of goodwill
discussed.
Our results: We found the Group’s assessment of the
recoverable amount of the parent company’s investment in
subsidiaries to be acceptable (2016 result: acceptable).

70
3. Our application of materiality and an overview of the scope of our audit
Materiality for the Group financial statements as a whole was set at £3.0m determined with reference to a benchmark of Group
profit before tax of £65.3m of which it represents 4.6%. In 2016, materiality for the Group financial statements as a whole was
£3.6m determined with reference to underlying Group profit before taxation (adjusted for pensions expenses included in
non-underlying) of £73.8m which represents 4.8%. We have changed the benchmark this year as we believe that Group profit
before tax is more appropriate due to the nature of the items included in non-underlying and is comparable to other audits in
the sector.
Materiality for the parent company financial statements as a whole was set at £2.1m (2016: £2.7m), determined with reference
to component materiality. This is lower than the materiality we would otherwise have determined by reference to a benchmark
of company net assets, of which it represents 0.6% (2016: 0.8%).
We reported to the Audit Committee any corrected or uncorrected identified misstatements exceeding £0.2m (2016: £0.2m),
in addition to other identified misstatements that warranted reporting on qualitative grounds.
The Group audit team approved the component materiality of £2.1m (2016: £2.7m), having regard to the mix of size and
risk profile of the Group across the components. The Group audit team performed all of the audit work in relation to the six
components (2016: six).
Of the Group’s reporting components, we subjected all six (2016: six) to full scope audits for Group purposes. 100% of the
Group’s revenue, profit before tax and total assets have been covered within the scope of our group reporting work (2016:
100%).
GroupProfit before tax
£65.3mGroup materiality
£3.0m
£3.0mWhole financial statements materiality
£2.1m Component materiality
£0.2m Mis-statements reported to the Audit Committee
4. We have nothing to report on going concern
We are required to report to you if:
• we have anything material to add or draw attention to in relation to the directors’ statement in note 1 to the financial
statements on the use of the going concern basis of accounting with no material uncertainties that may cast significant
doubt over the Group and company’s use of that basis for a period of at least twelve months from the date of approval of
the financial statements; or
• the related statement under the Listing Rules set out on page 17 is materially inconsistent with our audit knowledge.
We have nothing to report in these respects.
5. We have nothing to report on the other information in the Annual Report
The directors are responsible for the other information presented in the Annual Report together with the financial statements.
Our opinion on the financial statements does not cover the other information and, accordingly, we do not express an audit
opinion or, except as explicitly stated below, any form of assurance conclusion thereon.
INDEPENDENT AUDITOR’S REPORT TOTHE MEMBERS OF PENDRAGON PLC

71
5. We have nothing to report on the other information in the Annual Report continued
Our responsibility is to read the other information and, in doing so, consider whether, based on our financial statements audit
work, the information therein is materially misstated or inconsistent with the financial statements or our audit knowledge.
Based solely on that work we have not identified material misstatements in the other information.
Strategic report and directors’ report
Based solely on our work on the other information:
• we have not identified material misstatements in the strategic report and the directors’ report;
• in our opinion the information given in those reports for the financial year is consistent with the financial statements; and
• in our opinion those reports have been prepared in accordance with the Companies Act 2006.
Directors’ remuneration report
In our opinion the part of the Directors’ Remuneration Report to be audited has been properly prepared in accordance with
the Companies Act 2006.
Disclosures of principal risks and longer-term viability
Based on the knowledge we acquired during our financial statements audit, we have nothing material to add or draw attention
to in relation to:
• the directors’ confirmation within the viability statement on page 17 that they have carried out a robust assessment of the
principal risks facing the Group, including those that would threaten its business model, future performance, solvency and
liquidity;
• the Principal Risks disclosures on pages 20 to 24 describing these risks and explaining how they are being managed and
mitigated; and
• the directors’ explanation in the viability statement of how they have assessed the prospects of the Group, over what
period they have done so and why they considered that period to be appropriate, and their statement as to whether they
have a reasonable expectation that the Group will be able to continue in operation and meet its liabilities as they fall due
over the period of their assessment, including any related disclosures drawing attention to any necessary qualifications or
assumptions.
Under the Listing Rules we are required to review the Viability Statement. We have nothing to report in this respect.
Corporate governance disclosures
We are required to report to you if:
• we have identified material inconsistencies between the knowledge we acquired during our financial statements audit and the
directors’ statement that they consider that the Annual Report and financial statements taken as a whole is fair, balanced and
understandable and provides the information necessary for shareholders to assess the Group’s position and performance,
business model and strategy; or
• the section of the Annual Report describing the work of the Audit Committee does not appropriately address matters
communicated by us to the Audit Committee.
We are required to report to you if the Corporate Governance Report does not properly disclose a departure from the eleven
provisions of the UK Corporate Governance Code specified by the Listing Rules for our review.
We have nothing to report in these respects.
6. We have nothing to report on the other matters on which we are required to report by exception
Under the Companies Act 2006, we are required to report to you if, in our opinion:
• adequate accounting records have not been kept by the parent company, or returns adequate for our audit have not been
received from branches not visited by us; or
• the parent company financial statements and the part of the Directors’ Remuneration Report to be audited are not in
agreement with the accounting records and returns; or
• certain disclosures of directors’ remuneration specified by law are not made; or
• we have not received all the information and explanations we require for our audit.
We have nothing to report in these respects.

72
7. Respective responsibilities
Directors’ responsibilities
As explained more fully in their statement set out on page 66, the directors are responsible for: the preparation of the
financial statements including being satisfied that they give a true and fair view; such internal control as they determine is
necessary to enable the preparation of financial statements that are free from material misstatement, whether due to fraud
or error; assessing the Group and parent company’s ability to continue as a going concern, disclosing, as applicable, matters
related to going concern; and using the going concern basis of accounting unless they either intend to liquidate the Group
or the parent company or to cease operations, or have no realistic alternative but to do so.
Auditor’s responsibilities
Our objectives are to obtain reasonable assurance about whether the financial statements as a whole are free from material
misstatement, whether due to fraud or other irregularities (see below), or error, and to issue our opinion in an auditor’s report.
Reasonable assurance is a high level of assurance, but does not guarantee that an audit conducted in accordance with ISAs
(UK) will always detect a material misstatement when it exists. Misstatements can arise from fraud, other irregularities
or error and are considered material if, individually or in aggregate, they could reasonably be expected to influence the
economic decisions of users taken on the basis of the financial statements.
A fuller description of our responsibilities is provided on the FRC’s website at www.frc.org.uk/auditorsresponsibilities
Irregularities – ability to detect
Our audit aimed to detect non-compliance with relevant laws and regulations (irregularities) that could have a material
effect on the financial statements. In planning and performing our audit, we considered the impact of laws and regulations
in the specific areas of Anti-bribery and Corruption Act 2011. We identified these areas through discussion with the directors
and other management (as required by auditing standards), from our sector experience, and from inspection of the Group’s
regulatory and legal correspondence. In addition we had regard to laws and regulations in other areas including financial
reporting, and company and taxation legislation.
We considered the extent of compliance with those laws and regulations that directly affect the financial statements, being
Anti-bribery and Corruption Act 2011, as part of our procedures on the related financial statement items. For the remaining
laws and regulations, we made enquiries of directors and other management (as required by auditing standards).
We communicated identified laws and regulations throughout our team and remained alert to any indications of non-
compliance throughout the audit.
As with any audit, there remained a higher risk of non-detection of irregularities, as these may involve collusion, forgery,
intentional omissions, misrepresentations, or the override of internal controls.
8. The purpose of our audit work and to whom we owe our responsibilities
This report is made solely to the company’s members, as a body, in accordance with Chapter 3 of Part 16 of the Companies
Act 2006. Our audit work has been undertaken so that we might state to the company’s members those matters we are
required to state to them in an auditor’s report and for no other purpose. To the fullest extent permitted by law, we do not
accept or assume responsibility to anyone other than the company and the company’s members, as a body, for our audit
work, for this report, or for the opinions we have formed.
John Leech (Senior Statutory Auditor)
for and on behalf of KPMG LLP, Statutory Auditor
Chartered Accountants
One Snowhill, Snowhill Queensway, Birmingham B4 6GH
13 February 2018
INDEPENDENT AUDITOR’S REPORT TOTHE MEMBERS OF PENDRAGON PLC

73
Notes
Underlying £m
Non- Underlying £m
2017 £m
Underlying £m
Non- Underlying £m
2016 £m
Revenue 2.1 4,739.1 - 4,739.1 4,537.0 - 4,537.0
Cost of sales (4,186.2) - (4,186.2) (3,977.4) - (3,977.4)
Gross profit 552.9 - 552.9 559.6 - 559.6
Operating expenses 2.2 (469.1) 7.7 (461.4) (458.4) (1.1) (459.5)
Operating profit before other income 83.8 7.7 91.5 101.2 (1.1) 100.1
Other income - (losses)/gains on the sale of businesses and property 2.6 - (0.1) (0.1) - 0.3 0.3
Operating profit 83.8 7.6 91.4 101.2 (0.8) 100.4
Net finance costs 4.3 (23.4) (2.7) (26.1) (25.8) (1.6) (27.4)
Profit before taxation 60.4 4.9 65.3 75.4 (2.4) 73.0
Income tax (expense)/credit 2.7 (12.8) 0.8 (12.0) (19.1) 1.6 (17.5)
Profit for the year 47.6 5.7 53.3 56.3 (0.8) 55.5
Earnings per share
Basic earnings per share 2.8 3.7p 3.8p
Diluted earnings per share 2.8 3.7p 3.8p
Non GAAP measure:
Underlying basic earnings per share 2.8 3.3p 3.9p
Underlying diluted earnings per share 2.8 3.3p 3.9p
CONSOLIDATED INCOME STATEMENTYear ended 31 December 2017
The notes on pages 79 to 143 form part of these financial statements

74CONSOLIDATED STATEMENT OF COMPREHENSIVE INCOMEYear ended 31 December 2017
Notes
2017 £m
2016 £m
Profit for the year 53.3 55.5
Other comprehensive income
Items that will never be reclassified to profit and loss:
Defined benefit plan remeasurement gains and (losses) 5.1 35.8 (61.3)
Income tax relating to defined benefit plan remeasurement (gains) and losses 2.7 (6.3) 9.8
29.5 (51.5)
Items that are or may be reclassified to profit and loss:
Foreign currency translation differences of foreign operations (0.6) -
Other comprehensive income for the year, net of tax 28.9 (51.5)
Total comprehensive income for the year 82.2 4.0
The notes on pages 79 to 143 form part of these financial statements

75CONSOLIDATED STATEMENT OF CHANGES IN EQUITY Year ended 31 December 2017
Share capital £m
Share premium £m
Capital redemption reserve £m
Other reserves £m
Translation differences £m
Retained earnings £m
Total £m
Balance at 1 January 2017 71.8 56.8 3.7 12.6 (0.2) 228.1 372.8
Total comprehensive income for 2017
Profit for the year - - - - - 53.3 53.3
Other comprehensive income for the year, net of tax
- - - - (0.6) 29.5 28.9
Total comprehensive income for the year - - - - (0.6) 82.8 82.2
Dividends paid (note 4.5) - - - - - (21.3) (21.3)
Own shares purchased for cancellation (0.6) - 0.6 - - (4.0) (4.0)
Own shares purchased by EBT - - - - - (2.8) (2.8)
Own shares issued by EBT - - - - - 0.1 0.1
Share based payments - - - - - (1.7) (1.7)
Income tax relating to share based payments - - - - - 0.1 0.1
Balance at 31 December 2017 71.2 56.8 4.3 12.6 (0.8) 281.3 425.4
Balance at 1 January 2016 73.0 56.8 2.5 12.6 (0.2) 250.4 395.1
Total comprehensive income for 2016
Profit for the year - - - - - 55.5 55.5
Other comprehensive income for the year, net of tax
- - - - - (51.5) (51.5)
Total comprehensive income for the year - - - - - 4.0 4.0
Dividends paid (note 4.5) - - - - - (20.3) (20.3)
Own shares purchased for cancellation (1.2) - 1.2 - - (7.5) (7.5)
Own shares purchased by EBT - - - - - (0.3) (0.3)
Own shares issued by EBT - - - - - 0.1 0.1
Share based payments - - - - - 2.2 2.2
Income tax relating to share based payments - - - - - (0.5) (0.5)
Balance at 31 December 2016 71.8 56.8 3.7 12.6 (0.2) 228.1 372.8
The notes on pages 79 to 143 form part of these financial statements

76CONSOLIDATED BALANCE SHEETAt 31 December 2017
Notes
2017 £m
2016 £m
Non-current assets
Property, plant and equipment 3.2 479.9 405.3
Goodwill 3.1 361.2 356.5
Other intangible assets 3.1 7.5 5.7
Deferred tax assets 2.7 11.4 19.0
Total non-current assets 860.0 786.5
Current assets
Inventories 3.4 1,003.5 846.2
Trade and other receivables 3.6 132.8 153.1
Cash and cash equivalents 4.2 53.3 84.0
Assets classified as held for sale 3.3 11.0 6.6
Total current assets 1,200.6 1,089.9
Total assets 2,060.6 1,876.4
Current liabilities
Trade and other payables 3.7 (1,224.2) (1,068.7)
Deferred income 3.9 (50.3) (36.6)
Current tax payable (2.1) (7.8)
Provisions 3.8 (0.7) (6.2)
Total current liabilities (1,277.3) (1,119.3)
Non-current liabilities
Interest bearing loans and borrowings 4.2 (177.4) (175.7)
Trade and other payables 3.7 (59.0) (48.8)
Deferred income 3.9 (49.9) (50.4)
Retirement benefit obligations 5.1 (62.8) (103.2)
Provisions 3.8 (8.8) (6.2)
Total non-current liabilities (357.9) (384.3)
Total liabilities (1,635.2) (1,503.6)
Net assets 425.4 372.8
Capital and reserves
Called up share capital 4.4 71.2 71.8
Share premium account 4.4 56.8 56.8
Capital redemption reserve 4.4 4.3 3.7
Other reserves 4.4 12.6 12.6
Translation reserve 4.4 (0.8) (0.2)
Retained earnings 281.3 228.1
Total equity attributable to equity shareholders of the company 425.4 372.8
Approved by the Board of directors on 13 February 2018 and signed on its behalf by:
T G Finn T P HoldenChief Executive Finance Director
Registered Company Number: 2304195
The notes on pages 79 to 143 form part of these financial statements

77CONSOLIDATED CASH FLOW STATEMENTYear ended 31 December 2017
Notes
2017 £m
2016 £m
Cash flows from operating activities
Profit for the year 53.3 55.5
Adjustment for taxation 12.0 17.5
Adjustment for net financing expense 26.1 27.4
91.4 100.4
Depreciation and amortisation 28.5 29.9
Share based payments (1.7) 2.2
Loss/(profit) on sale of businesses and property 0.1 (0.3)
Impairment of assets held for sale - 1.1
Contributions into defined benefit pension scheme (7.3) (3.1)
Changes in inventories 3.4 (102.3) (3.6)
Changes in trade and other receivables 20.8 (19.7)
Changes in trade and other payables 134.0 14.2
Changes in provisions (2.9) 3.1
Movement in contract hire vehicle balances 3.5 (31.7) (21.6)
Cash generated from operations 128.9 102.6
Taxation paid (16.1) (17.3)
Interest paid (20.0) (25.2)
Net cash from operating activities 92.8 60.1
Cash flows from investing activities
Business acquisitions 6.1 (17.8) (2.6)
Proceeds from sale of businesses 6.2 - 8.9
Purchase of property, plant, equipment and intangible assets 3.1, 3.2 (193.0) (147.0)
Proceeds from sale of property, plant, equipment and intangible assets 3.1, 3.2 114.1 96.9
Net cash used in investing activities (96.7) (43.8)
Cash flows from financing activities
Dividends paid to shareholders (21.3) (20.3)
Repurchase of own shares (4.0) (7.5)
Own shares acquired by EBT (2.8) (0.3)
Disposal of shares by EBT 0.1 0.1
Repayment of bond and loans (15.0) (216.7)
Proceeds from issue of loans 20.4 173.6
Net cash outflow from financing activities (22.6) (71.1)
Net decrease in cash and cash equivalents (26.5) (54.8)
Cash and cash equivalents at 1 January 84.0 138.8
Effects of exchange rate changes on cash held (4.2) -
Cash and cash equivalents at 31 December 4.2 53.3 84.0
The notes on pages 79 to 143 form part of these financial statements

78RECONCILIATION OF NET CASH FLOW TO MOVEMENT IN NET DEBT
Note: The reconciliation of net cash flow to movement in net debt is not a primary statement and does not form part of the consolidated cash flow statement but
forms part of the notes to the financial statements.
2017 £m
2016 £m
Net decrease in cash and cash equivalents (26.5) (54.8)
Repayment of bond and loans 15.0 216.7
Proceeds from issue of loans (net of directly attributable transaction costs) (20.4) (173.6)
Non-cash movements (0.5) (0.4)
Increase in net debt in the year (32.4) (12.1)
Opening net debt (91.7) (79.6)
Closing net debt (124.1) (91.7)
The notes on pages 79 to 143 form part of these financial statements

79NOTES TO THE FINANCIAL STATEMENTS
SECTION 1 - BASIS OF PREPARATION
Presented below are those accounting policies that relate to the financial statements as a whole and includes details of new
accounting standards that are or will be effective for 2017 or later years. To facilitate the understanding of each note to the
financial statements those accounting policies that are relevant to a particular category are presented within the relevant
notes.
Pendragon PLC is a company domiciled in the United Kingdom. The consolidated financial statements of the Group for
the year ended 31 December 2017 comprise the company and its subsidiaries and the Group’s interest in jointly controlled
entities, together referred to as the ‘Group’.
The Group financial statements have been prepared and approved by the directors in accordance with international
accounting standards, being the International Financial Reporting Standards as adopted by the EU (‘adopted IFRSs’).
The company has elected to prepare its parent company financial statements in accordance with FRS 101. These are
presented on pages 114 to 154.
The financial statements are presented in millions of UK pounds, rounded to the nearest £0.1m. They have been prepared
under the historical cost convention and where other bases are applied these are identified in the relevant accounting policy
in the notes below.
Going concern
The Group’s business activities, together with the factors likely to affect its future development, performance and position
are set out in the Operational Review sections on pages 12 to 13 and pages 26 to 30. The financial position of the Group,
its cash flows, liquidity position and borrowing facilities are described in the Financial Review section on pages 32 to 35.
In addition, note 4.2 to the financial statements includes the Group’s objectives, policies and processes for managing its
capital; its financial risk management objectives; details of its financial instruments and hedging activities; and its exposures
to credit risk and liquidity risk.
At 31 December 2017, there are undrawn available facilities and, as highlighted in note 4.2 to the financial statements, the
Group meets its day-to-day working capital requirements through bank, manufacturer and third party vehicle financing
facilities. The Group’s forecasts and projections, taking account of reasonably possible changes in trading performance,
show that the Group should be able to operate within the level of its current facility.
The directors have a reasonable expectation that the Group has adequate resources to continue in operational existence for
the foreseeable future. Thus they continue to adopt the going concern basis of accounting in preparing the annual financial
statements.

80
Key judgements Effect on Financial Statements
Alternative accounting judgement that could have been applied
Effect of that alternative accounting judgement
Contract hire vehicles:
The Group leases vehicles to third party customers under undisclosed agency agreements. In legal terms, the Group has disposed of vehicles to third party banks, leases those vehicles as undisclosed agent of the bank to third party customers and agrees to repurchase those vehicles from the bank at the end of the lease term. The Group has determined that it has retained substantially all of the significant risks and rewards of ownership so recognises in full the related assets and liabilities.
Sale of vehicle to third party bank derecognised; recognition of contract hire vehicles within fixed assets – carrying value £153.7m; recognition of contract hire buyback commitments within trade and other payables of £79.5m and £74.9m within deferred income. Profit on disposal to third party bank deferred over term of lease.
If the Group had determined that substantially all of the significant risks and rewards of ownership had been transferred then there would have been full recognition of the sale of the asset.
No recognition of asset or related liabilities and no deferral of income.
Deferred tax assets:
No recognition of certain deferred tax assets as the Group believes their recovery to be too uncertain.
No recognition of potential assets of £8.3m relating to unutilised tax losses of £13.8m and unrecognised net capital losses of £35.0m.
If the Group had determined that the utilisation of the losses was more certain then full or partial recognition of deferred tax assets would have taken place.
Recognition of assets within the range £0-£8.3m..
Assets held for sale:
The Group has announced its intention to dispose of its US business and reduce its premium franchise locations. Only two locations for the affected businesses are shown in assets held for sale at the year end.
Assets held for sale was increased by £5.6m for a business which we were actively selling at 31 December 2017. The disclosure of the assets and liabilities relating to the other businesses which we expect to sell remain unchanged.
If the Group had determined that some or all of the planned disposals were sufficiently advanced to meet the criteria to be classified as assets held for sale then other businesses could have been classified as assets held for sale.
Reclassification of further businesses as assets held for sale.
Intangibles:
Internally generated intangible assets relate to activities that involve the development of dealer management systems by the Software operating segment.
Capitalisation of development expenditure is completed only if development costs meet certain criteria. Full detail of the criteria is in note 3.1.
Not capitalising development costs.
.
Reduction of £6.1m of asset carrying value.
.
NOTES TO THE FINANCIAL STATEMENTS
SECTION 1 - BASIS OF PREPARATION
Judgements
The Group applies judgement in how it applies its accounting policies, which do not involve estimation, but could materially
affect the numbers disclosed in these financial statements. The key accounting judgements, without estimation, that have
been applied in these financial statements are as follows:

81
Key estimate area Key assumption
Potential impact within the next financial year
Potential impact in the longer term
Note reference
Goodwill impairment
Within the Goodwill calculation we undertake an exercise to estimate future cashflows from each Cash Generating Unit (CGU). We have key assumptions on the growth rates of revenue and gross margin in each of new, used and aftersales which impacts the profit assumed and hence cashflow generation in each CGU. These assumptions are key to calculation of the net present value of cashflows. The further key assumptions are the perpetuity growth rate and discount rate.
✓ ✓ 3.1
Inventory fair value (UK used inventory of £397.4m)
The Group assessment of fair values of used inventory involves an element of estimation. The key assumption is estimating the likely sale period and the expected profit or loss on sale for each of our inventory items that are held at the year end point. We conduct this analysis by looking at stock by age category and comparing historical trends and our forward expectations on these assumptions.
✓ 3.4
VAT assessment A provision of £6.8m is held in relation to a potential VAT liability. This represents the current estimate at 31 December 2017 of the maximum amount the Group would have to pay if it is unsuccessful in its action against HMRC. Although the matter is not expected to be concluded in the following year, as it shall probably involve litigation, it is possible that the estimate of the provision as at 31 December 2017 could change significantly in the following year if HMRC concede that there is merit to some of our argument, such that the amounts currently provided ultimately prove not to be payable.
✓ ✓ 3.8
Retirement benefit obligations
The main assumptions in determining the Group’s Retirement Benefit Obligations are: discount rate, mortality and rate of inflation. Full detail is included in the pension note, 5.1.
✓ ✓ 5.1
SECTION 1 - BASIS OF PREPARATION
Accounting Estimates
The preparation of financial statements in conformity with adopted IFRSs requires the use of estimates and assumptions
that affect the reported amounts of assets and liabilities at the date of the financial statements and the reported amounts of
revenues and expenses during the reporting year. Although these estimates are based on management’s best knowledge
of the amount, events or actions, actual results ultimately may differ from those estimates.
The estimates and underlying assumptions are reviewed on an ongoing basis. The estimates and associated assumptions
are based on historical experience and various other factors that are believed to be reasonable under the circumstances.
Revisions to accounting estimates are recognised in the period in which the estimate is revised if the revision affects only
that period, or in the period of the revision and future periods if the revision affects both current and future periods. The
directors consider the following to be the key estimates applicable to the financial statements, which have a significant risk
of resulting in a material adjustment to the carrying amounts of assets and liabilities within the next financial year or in the
long term:

82
SECTION 1 - BASIS OF PREPARATION
Basis of consolidation
The consolidated financial statements include the financial statements of Pendragon PLC, all its subsidiary undertakings and
investments. Consistent accounting policies have been applied in the preparation of all such financial statements.
Subsidiaries
Subsidiaries are entities controlled by the Group. The Group controls an entity when it is exposed to, or has rights to,
variable returns from its involvement with the entity and has the ability to affect those returns through its power over the
entity. The financial statements of subsidiaries are included in the consolidated financial statements from the date that
control commences until the date that control ceases.
Investments
Investments in entities in which the Group has no control are stated at their fair value.
When the Group’s share of losses exceeds its interest in an equity-accounted investee, the carrying amount of that interest,
including any long term investments, is reduced to zero, and the recognition of further losses is discontinued except to the
extent that the Group has an obligation or has made payments on behalf of the investee.
Transactions eliminated on consolidation
Intragroup balances and any unrealised gains or losses or income and expenses arising from intragroup transactions, are
eliminated in preparing the consolidated financial statements. Unrealised gains and losses arising from transactions with
joint ventures are eliminated against the investment to the extent of the Group’s interest in the entity.
Foreign currencies
Transactions in foreign currencies are translated to the respective functional currency of Group entities at the foreign
exchange rate ruling at the date of the transaction. Monetary assets and liabilities denominated in foreign currencies at the
balance sheet date are translated to the functional currency at the foreign exchange rate ruling at that date. Non-monetary
assets and liabilities that are measured in terms of historical cost in a foreign currency are translated using the exchange
rate at the date of the transaction. Non-monetary assets and liabilities denominated in foreign currencies that are stated
at fair value are translated to sterling at foreign exchange rates ruling at the dates the fair value was determined. Foreign
currency differences arising on retranslation are recognised in profit or loss.
The assets and liabilities of foreign operations, including goodwill and fair value adjustments arising on consolidation, are
translated to sterling at foreign exchange rates ruling at the balance sheet date. The revenues and expenses of foreign
operations are translated to sterling at rates approximating to the foreign exchange rates ruling at the dates of the
transactions.
Foreign currency differences arising on the retranslation of a financial liability designated as a hedge of a net investment
in a foreign operation are recognised directly in equity, in the foreign currency translation reserve, to the extent the hedge
is effective. To the extent the hedge is ineffective, such differences are recognised in profit or loss. When the hedged
net investment is disposed of, the cumulative amount in equity is transferred to profit and loss on disposal.
In respect of all foreign operations, any differences that have arisen after 1 January 2004, the date of transition to IFRS, are
presented as a separate component of equity.
NOTES TO THE FINANCIAL STATEMENTS

83
SECTION 1 - BASIS OF PREPARATION
Cash and cash equivalents
For the purposes of the cash flow statement, cash and cash equivalents comprise deposits with banks and financial
institutions, bank and cash balances, and liquid investments, net of bank overdrafts. Bank overdrafts that are repayable
on demand and form an integral part of the Group’s cash management are included as a component of cash and cash
equivalents for the purpose of the statement of cash flows. In the balance sheet, bank overdrafts are included in current
borrowings.
Impairment
The carrying amounts of the Group’s assets, other than inventories (see note 3.4) and deferred tax assets (see note 2.7),
are reviewed at each balance sheet date to determine whether there is any indication of impairment. If any such indication
exists, the asset’s recoverable amount is estimated.
For goodwill the recoverable amount is estimated at each balance sheet date. The recoverable amount is the higher of fair
value less costs to sell and value in use. In assessing value in use, the estimated future cash flows are discounted to their
present value using a pre-tax discount rate that reflects current market assessments of the time value of money and the
risks specific to the asset for which the estimates of future cash flows have not been adjusted.
For the purpose of impairment testing, assets are grouped together into the smallest group of assets that generates
cash inflows from continuing use that are largely independent of the cash inflows from other groups of assets (‘the cash
generating unit’). The goodwill acquired in a business combination, for the purpose of impairment testing is allocated to cash
generating units. Management have determined that the cash generating units of the Group are the motor franchise groups
and other business segments.
An impairment loss is recognised whenever the carrying amount of an asset or its cash generating unit exceeds its
recoverable amount. Impairment losses are recognised in the income statement.
Impairment losses recognised in respect of cash generating units are allocated first to reduce the carrying amount of any
goodwill allocated to cash generating units and then, to reduce the carrying amount of the other assets in the unit on a pro
rata basis.
The recoverable amount of assets is the greater of their fair value less costs to sell and value in use. In assessing value
in use, the estimated future cash flows are discounted to their present value using a pre-tax discount rate that reflects
current market assessments of the time value of money and the risks specific to the asset. For an asset that does not
generate largely independent inflows, the recoverable amount is determined for the cash generating unit to which the asset
belongs.
An impairment loss in respect of goodwill is not reversed. In respect of other assets, an impairment loss is reversed if there
has been a change in the estimates used to determine the recoverable amount. An impairment loss is reversed only to the
extent that the asset’s carrying amount does not exceed the carrying amount that would have been determined, net of
depreciation or amortisation, if no impairment loss had been recognised. The impact of the current year impairment review
can be seen in note 3.1.
Adoption of new and revised standards and new standards and interpretations not yet adopted
In the current year, the Group has adopted the following new standards and interpretations:
Recognition of Deferred Tax Assets for Unrealised Losses – Amendments to IAS 12
Disclosure Initiative – Amendments to IAS 7
The adoption of the new standards and amendments above have had no significant impact.

84
SECTION 1 - BASIS OF PREPARATION
A number of new standards are effective for annual periods beginning after 1 January 2017 and earlier application is
permitted; however, the Group has not early adopted the new or amended standards in preparing these consolidated
financial statements.
The following standards are expected to have a material impact on the Group’s financial statements in the period of initial
application.
IFRS 15 Revenue from Contracts with Customers
The Group is required to adopt IFRS 15 Revenue from Contracts with Customers from 1 January 2018. IFRS 15 establishes a
comprehensive framework for determining whether, how much and when revenue is recognised. It replaces existing revenue
recognition guidance, including IAS 18 Revenue, IAS 11 Construction Contracts and IFRIC 13 Customer Loyalty Programmes.
The Group has assessed the estimated impact that the initial application of IFRS 15 will have on its consolidated financial
statements. The estimated impact of the adoption of this standard on the Group’s equity as at 1 January 2018 is based on
assessments undertaken to date and is summarised below. The actual impacts of adopting the standard at 1 January 2018
may change because the Group has not finalised the testing and assessment of all income streams and controls over its new
IT and reporting systems.
Sale of motor vehicles, parts and aftersales services
For the sale of motor vehicles, parts and aftersales services revenue is currently recognised when vehicles or parts have
been supplied or when service has been completed. Revenue from services rendered is recognised in the income statement
in proportion to the stage of completion of the transaction at the reporting date. The stage of completion is assessed
by reference to time expended on services that are charged on a labour rate basis. Revenue is recognised at this point
provided that the revenue and costs can be measured reliably, the recovery of the consideration is probable and there
is no continuing management involvement with the goods. Under IFRS 15, revenue will be recognised when a customer
obtains control of the goods and the Group’s assessment indicates that this will not result in any change to current practice
and therefore no adjustment will be required. The Group has a number of manufacturer partners who will provide goods/
services to customers e.g. free servicing when purchasing a new vehicle. Such items do not have a contractual obligation
on the Group as the obligation lies with the manufacturer.
Sale of warranty products
The income received in respect of warranty policies sold and administered by the Group is recognised over the period of
the policy on a straight line basis. Under IFRS 15, the performance obligation of the Group will be the period over which
the customer can exercise their rights under the warranty and therefore revenue should be recognised over the period of
that warranty. The Group’s assessment indicates that this will not result in any change to current practice and therefore no
adjustment will be required.
Commissions received
The Group receives commissions when it arranges finance and insurance packages for its customers to purchase its products
and services, acting as agent on behalf of various finance and insurance companies. Any commission earned is recognised
when the customer draws down the finance or commences the isurance policy from the supplier which coincides with the
delivery of the product or service. Under IFRS 15, the assessment will be based on whether the Group controls the specific
goods and services before transferring them to the end customer, rather than whether it has exposure to significant risks
and rewards associated with the sale of goods. Under IFRS 15, revenue will be recognised when a customer obtains the
benefits of the financing and the Group’s assessment indicates that this will not result in any change to current practice and
therefore no adjustment will be required.
Provision of computer systems
The Group, through its Pinewood business, supplies dealer management systems to motor vehicle dealers. These systems
include the delivery of computer hardware, training and installation services and the right to use the Group’s software over
a contractual period. Pinewood supply its software on a hosting basis and licence specific numbers of users to access this
service. As such Pinewood supply ‘Software as a Service’ (SaaS). The software licences are provided only in conjunction
with a hosting service, the customer cannot take control of the licence or use the software without the hosting service
and as such the customer cannot benefit from the licence on its own and the licence is not separable from the hosting
services. Therefore, the licence is not distinct and would be combined with the hosting service. The Group’s assessment
NOTES TO THE FINANCIAL STATEMENTS

85
SECTION 1 - BASIS OF PREPARATION
of its performance obligation under IFRS 15 of providing SaaS is that revenue is recognised over the period of the contract.
This is in line with current accounting practice and therefore no adjustment is required. The sale of hardware and the
provision of training and installation services is similar in substance to the sale of motor vehicles, parts and aftersales services
where under IFRS 15, revenue will be recognised when a customer obtains control of the goods and the Group’s assessment
indicates that this will not result in any change to current practice and therefore no adjustment will be required.
Transition
The Group plans to adopt IFRS 15 using the cumulative effect method, with the effect of initially applying this standard
recognised at the date of initial application (i.e. 1 January 2018). As a result, the Group will not apply the requirements of
IFRS 15 to the comparative period presented.
IFRS 16 Leasing
IFRS 16 Leasing is effective for annual periods beginning on or after 1 January 2019. Early adoption is permitted for entities
that apply IFRS 15 at or before the date of initial application of IFRS 16. The new standard replaces existing leases guidance,
principally IAS 17 Leases.
IFRS 16 introduces a single, on-balance sheet lease accounting model for lessees. A lessee recognises a right-of-use asset
representing its right to use the underlying asset and a lease liability representing its obligation to make lease payments.
There are recognition exemptions for short term leases and leases of low-value items. Lessor accounting remains similar to
the current standard – i.e. lessors continue to classify leases as finance or operating leases.
The Group is conducting an initial assessment of the potential impact on its consolidated financial statements. So far,
the most significant impact identified is that the Group will recognise new assets and liabilities for its operating leases of
properties and the expenses related to those leases will now change as IFRS 16 replaces the straight-line operating lease
expense with a depreciation charge for right-of-use assets and interest expense on lease liabilities. As at 31 December
2017, the Group’s future minimum lease payments under non-cancellable operating leases amounted to £540.7m, on an
undiscounted basis.
Transition
As a lessee, the Group can apply the standard using either a retrospective approach or a modified retrospective approach
with optional practical expedients. The lessee applies the election consistently to all of its leases. The Group plans to apply
IFRS 16 initially on 1 January 2019, with a preference of using the retrospective approach. In this case, the cumulative effect
of adopting IFRS 16 will be recognised as an adjustment to the opening balance of retained earnings at 1 January 2018, with
a restatement of comparative information. Whilst the Group is confident of being able to apply a retrospective approach,
due to the number and age of our leases we may have insufficient historical data to meet the requirements of the standard
which would preclude the retrospective approach being taken. Should this be the case then a modified retrospective
approach will be adopted where the cumulative effect of adopting IFRS 16 will be recognised as an adjustment to the
opening balance of retained earnings at 1 January 2019, with no restatement of comparative information.

86
SECTION 1 - BASIS OF PREPARATION
IFRS 9 Financial Instruments
The Group is required to adopt IFRS 9 Financial Instruments from 1 January 2018. An assessment as to the likely impact of
IFRS 9 is provided in note 4.2 on page 124.
Other standards
The following amended standards and interpretations are not expected to have a significant impact on the Group’s
consolidated financial statements.
- Annual Improvements to IFRSs 2014-2016 Cycle - Amendments to IFRS 1 and IAS 28.
- Classification and Measurement of Share-based Payment Transactions (Amendments to IFRS 2).
- Transfers of Investment Property (Amendments to IAS 40).
- Sale or Contribution of Assets between an Investor and its Associate or Joint Venture (Amendments to IFRS 10 and IAS
28).
- IFRIC 22 Foreign Currency Transactions and Advance Consideration.
- IFRIC 23 Uncertainty over Income Tax Treatments.
Alternative performance measures
The Group uses a number of key performance measures (‘KPI’s’) which are non-IFRS measures to monitor the performance
of its operations. The Group believes these KPIs provide useful historical financial information to help investors and other
stakeholders evaluate the performance of the business and are measures commonly used by certain investors for evaluating
the performance of the Group. In particular, the Group uses KPIs which reflect the underlying performance on the basis that
this provides a more relevant focus on the core business performance of the Group. The Group has been using the following
KPIs on a consistent basis and they are defined and reconciled as follows:
Dividend per share – dividend per share is defined as the interim dividend per share plus the proposed final year dividend
per share for a given period.
Gross margin % – gross margin is defined as gross profit as a percentage of revenue.
Like for like - results on a like for like basis include only businesses which have been trading for 12 consecutive months.
We use like for like results to aid in the understanding of the like for like movement in revenue, gross profit and operating
profit in the business. The difference to underlying results are simply those businesses which are not like for like which have
recently commenced operation and therefore do not have a 12 month history plus any retail points closed during the current
or previous period.
Operating margin % - operating margin is defined as operating profit as a percentage of revenue.
Underlying operating profit/profit before tax - results on an underlying basis exclude items that have non-trading attributes
due to their size, nature or incidence. The detail of the non-underlying results is shown in note 2.6 and this is also shown on
the face of the consolidated income statement to reconcile from the underlying to total results.
Net franchise capital expenditure - total franchise specific (new manufacturer vehicle partners) capital expenditure incurred
in the period less franchise specific disposal proceeds.
NOTES TO THE FINANCIAL STATEMENTS

87
2017 £m
2016 £m
Underlying operating profit 83.8 101.2
Settlement of historic VAT issues 7.7 -
(Losses)/gains on the sale of businesses and property (see note 2.6) (0.1) 0.3
Impairment of assets held for sale (see note 2.6) - (1.1)
Non-underlying operating profit items 7.6 (0.8)
Operating profit 91.4 100.4
SECTION 1 - BASIS OF PREPARATION
Operating profit reconciliation
2017 £m
2016 £m
Underlying profit before tax 60.4 75.4
Non-underlying operating profit items (see reconciliation above) 7.6 (0.8)
Non-underlying finance costs (see note 2.6) (2.7) (1.6)
Non-underlying operating profit and finance cost items 4.9 (2.4)
Profit before tax 65.3 73.0
Profit before tax reconciliation
2017 £m
2016 £m
Underlying profit after tax 47.6 56.3
Non-underlying operating profit and finance cost items (see reconciliation above) 4.9 (2.4)
Non-underlying tax (see note 2.6) 0.8 1.6
Non-underlying operating profit, finance cost and tax items 5.7 (0.8)
Profit after tax 53.3 55.5
Profit after tax reconciliation
Underlying basic earnings per share (‘underlying earnings per share’) – the Group presents underlying basic earnings per
share as the directors consider that this is a better measure of comparative performance. Underlying basic earnings per
share is calculated by dividing the underlying profit or loss attributable to ordinary shareholders by the weighted average
number of ordinary shares in issue during the period. A full reconciliation of how this is derived is found in note 2.8.
Underlying diluted earnings per share – the Group presents underlying diluted earnings per share as the directors consider
that this is a better measure of comparative performance. Underlying diluted earnings per share is calculated by dividing
the underlying profit and loss attributable to ordinary shareholders by the weighted average number of ordinary shares
in issue taking account of the effects of all dilutive potential ordinary shares, which comprise of share options granted to
employees, LTIPs and share warrants. A full reconciliation of how this is derived is found in note 2.8.
Net Debt : Underlying EBITDA – the Group uses the ratio of net debt to underlying EBITDA to assess the use of the Group’s
financial resources. The reconciliation of this and the composition of net debt and underlying EBITDA is shown in note 4.2.

88NOTES TO THE FINANCIAL STATEMENTS
SECTION 2 - RESULTS AND TRADING
This section contains the notes and information to support the results presented in the income statement:
2.1 Revenue 2.5 Audit fees
2.2 Net operating expenses 2.6 Non-underlying items
2.3 Operating segments 2.7 Taxation
2.4 Staff costs 2.8 Earnings per share
2.1 Revenue
Accounting policy
Revenue from the sale of goods is recognised in the income statement, net of discounts, when the significant risks and
rewards of ownership have been transferred to the buyer. In general this occurs when vehicles or parts have been supplied
or when service has been completed. Revenue from services rendered is recognised in the income statement in proportion
to the stage of completion of the transaction at the reporting date. The stage of completion is assessed by reference to
time expended on services that are charged on a labour rate basis.
Where vehicles are supplied to a leasing company for contract hire purposes and the Group undertakes to repurchase
the vehicle at a predetermined date and value the significant risks and rewards of ownership are deemed not to have
transferred outside the Group and consequently no sale is recognised. As a result the accounting for the arrangement
reflects the Group’s retention of the asset to generate future rentals and, in accordance with IAS 17 Leases, the Group is
considered to be an operating lessor for all arrangements in place. The initial amounts received in consideration from the
leasing company are held as deferred income allocated between the present value of the repurchase commitment, held
within trade and other payables and a residual amount of deferred revenue held within deferred income. A finance charge
is accrued against the present value of the repurchase commitment and recorded as a finance expense in the income
statement. The remaining deferred revenue, which effectively represents rentals received in advance, is taken to the income
statement on a straight line basis over the related lease term. No additional disclosures are made under IAS 17 as there are
no future rentals receivable. These vehicles are held within ‘property, plant and equipment’ at their cost to the Group and
are depreciated to their residual values over the terms of the leases. These assets are transferred into inventory at their
carrying amount when they cease to be rented and they become available for sale as part of the Group’s ordinary course
of business. Revenue also comprises commissions receivable for arranging vehicle finance.
The income received in respect of warranty policies sold and administered by the Group is recognised over the period of
the policy on a straight line basis. The unrecognised income is held within deferred income (see note 3.9).
Rental income from property is recognised in profit or loss on a straight-line basis over the term of the lease. Lease
incentives granted are recognised as an integral part of the total rental income, over the term of the lease. Rental income
from property is recognised as rents received in net operating expenses. The Group has a significant property portfolio and
from time to time they may become vacant and are sublet to mitigate operating losses, until the Group decides upon the
appropriate use of the property. These properties are not considered investment properties.
The Group is required to adopt IFRS 15 Revenue from Contracts with Cutomers from 1 January 2018, the impact of this
standard on the Group is detailed in note 1.
2.2 Net operating expenses 2017 £m
2016 £m
Net operating expenses:
Distribution costs (264.0) (253.9)
Administrative expenses (202.5) (210.9)
Rents received 5.1 5.3
(461.4) (459.5)

89
SECTION 2 - RESULTS AND TRADING
2.3 Operating segments
The Group has revised its operating segments. In January 2017 the Group reorganised its management and reporting
structure. The significant changes were that the Evans Halshaw, Stratstone and Quickco operations were brought under
the management of the UK Motor operation. In addition, the Central segment operating costs, which comprised of head
office related expenditure, were allocated to the resultant four operating segments. This revised segmental structure
is reflected in the internal reporting structure as presented to the Chief Operating Decision Maker. In the 2017 financial
statements therefore the Evans Halshaw, Stratstone, Quickco and Central segments are no longer reported separately.
The central segment costs incurred in 2016 are applied to the new UK Motor Segment and the existing segments of US
Motor (previously known as California), Leasing and Software (previously known as Pinewood) as shown in the table
below. The finance costs previously reported in the central segment cannot be reasonably allocated against the operating
segments and therefore are shown against the total result.
The results presented in the Operational Review are stated after the allocation of the costs incurred in the Central segment.
These costs are allocated by Operating Segment based on the nature of the cost and its relevance to each segment.
Central segment cost allocation
allocated to: UK Motor £m
Software £m
Leasing £m
US Motor £m
Group interest £m
As reported 31 December 2016 £m
Operating profit before non-underlying
items (16.8) (0.3) (0.3) - - (17.4)
Other income and non-underlying items (0.8) - - - - (0.8)
Operating profit (17.6) (0.3) (0.3) - - (18.2)
Finance expense - - - - (20.5) (20.5)
Profit before tax (17.6) (0.3) (0.3) - (20.5) (38.7)

90
SECTION 2 - RESULTS AND TRADING
2.3 Operating segments continued
UK Motor segment restatement
The results of the Evans Halshaw, Stratstone and Quickco segments for the comparative period have been aggregated into
the new UK Motor Group segment and is re-presented as follows for the period ended 31 December 2016:
Stratstone £m
Evans Halshaw £m
Quickco £m
Central allocation £m
UK Motor segment as restated 31 Dec 2016 £m
Aftersales revenue 128.2 155.7 72.3 - 356.2
Used vehicle revenue 690.9 1,154.4 - - 1,845.3
New vehicle revenue 841.4 1,098.0 - - 1,939.4
Total gross segment turnover 1,660.5 2,408.1 72.3 - 4,140.9
Inter-segment turnover - - (23.0) - (23.0)
Revenue from external customers 1,660.5 2,408.1 49.3 - 4,117.9
NOTES TO THE FINANCIAL STATEMENTS
As reported 31 December 2016
Operating profit before non-underlying items 35.4 53.8 1.6 (16.8) 74.0
Other income and non-underlying items - - - (0.8) (0.8)
Operating profit 35.4 53.8 1.6 (17.6) 73.2
Finance expense (2.9) (3.5) - - (6.4)
Finance income - - 0.1 - 0.1
Profit before tax 32.5 50.3 1.7 (17.6) 66.9
Other items included in the income statement are as follows:
Depreciation and impairment (6.7) (12.4) (0.1) - (19.2)
Amortisation (0.2) (0.3) - - (0.5)
Share based payments (0.9) (1.3) - - (2.2)
Impairment of assets held for sale - - - (1.1) (1.1)
Other income - gains on the sale of businesses and property - - - 0.3 0.3
The revenue from the Quickco segment was previously reported as Support business revenue. On restatement of the
segments the revenue of Quickco, which derives from the sale of motor vehicle parts, has been reclassified as Aftersales
revenue.

91
Stratstone £m
Evans Halshaw £m
Quickco £m
Central allocation £m
UK Motor segment as restated 31 Dec 2016 £m
Aftersales revenue 128.2 155.7 72.3 - 356.2
Used vehicle revenue 690.9 1,154.4 - - 1,845.3
New vehicle revenue 841.4 1,098.0 - - 1,939.4
Total gross segment turnover 1,660.5 2,408.1 72.3 - 4,140.9
Inter-segment turnover - - (23.0) - (23.0)
Revenue from external customers 1,660.5 2,408.1 49.3 - 4,117.9
Operating profit before non-underlying items 35.4 53.8 1.6 (16.8) 74.0
Other income and non-underlying items - - - (0.8) (0.8)
Operating profit 35.4 53.8 1.6 (17.6) 73.2
Finance expense (2.9) (3.5) - - (6.4)
Finance income - - 0.1 - 0.1
Profit before tax 32.5 50.3 1.7 (17.6) 66.9
Other items included in the income statement are as follows:
Depreciation and impairment (6.7) (12.4) (0.1) - (19.2)
Amortisation (0.2) (0.3) - - (0.5)
Share based payments (0.9) (1.3) - - (2.2)
Impairment of assets held for sale - - - (1.1) (1.1)
Other income - gains on the sale of businesses and property - - - 0.3 0.3
SECTION 2 - RESULTS AND TRADING
2.3 Operating segments continued
Leasing segment restatement As reported 31 Dec 2016 £m
Central allocation £m
Leasing segment as restated 31 Dec 2016 £m
Support businesses revenue 67.0 - 67.0
Total gross segment turnover 67.0 - 67.0
Inter-segment turnover (20.3) - (20.3)
Revenue from external customers 46.7 - 46.7
Operating profit before non-underlying items 5.3 (0.3) 5.0
Other income and non-underlying items - - -
Operating profit 5.3 (0.3) 5.0
Finance income 0.1 - 0.1
Profit before tax 5.4 (0.3) 5.1
Other items included in the income statement are as follows:
Depreciation and impairment (34.4) - (34.4)
Operating profit before non-underlying items 10.3 (0.3) 10.0
Other income and non-underlying items - - -
Operating profit 10.3 (0.3) 10.0
Finance income 0.3 - 0.3
Profit before tax 10.6 (0.3) 10.3
Other items included in the income statement are as follows:
Depreciation and impairment (0.4) - (0.4)
Amortisation (1.9) - (1.9)
As reported 31 Dec 2016 £m
Central allocation £m
Software segment as restated
31 Dec 2016 £m
Support businesses revenue 24.5 - 24.5
Total gross segment turnover 24.5 - 24.5
Inter-segment turnover (10.1) - (10.1)
Revenue from external customers 14.4 - 14.4
Software segment restatement

92
SECTION 2 - RESULTS AND TRADING
2.3 Operating segments continued
Following the revisions to the Group’s operating segments as outlined above there are now four reportable segments,
as described below, which are the Group’s strategic business units. The segments offer different ranges of products and
services and are managed separately because they require their own specialisms in terms of market and product. For each
of these segments, the Executive Committee which is deemed to be the Chief Operating Decision Maker (CODM), reviews
internal management reports on at least a monthly basis. The review of these management reports enables the CODM to
allocate resources to each segment and form the basis of strategic and operational decisions, such as acquisition strategy,
closure programme or working capital allocation. The following summary describes the operations in each of the Group’s
reportable segments:
UK Motor. This segment comprises the Group’s motor vehicle retail, parts wholesale and fleet operations, encompassing
the sale of new and used motor cars, motorbikes, trucks and vans, together with associated aftersales activities of service,
body repair and parts sales.
Software. This segment comprises the Group’s activities as a dealer management systems provider. This segment was
previously referred to as Pinewood.
Leasing. This segment comprises the Group’s contract hire and leasing activities.
US Motor. This segment comprises the Group’s retail operation in California in the United States encompassing the sale
of new and used motor cars, together with associated aftersales activities of service and parts sales. This segment was
previously referred to as California.
The tables of financial performance presented in the Operational and Financial Review on pages 26 to 35 are based upon
these segmental reports.
Inter-segment transfers and transactions are entered into under normal commercial terms and conditions that would also
be available to unrelated third parties.
NOTES TO THE FINANCIAL STATEMENTS

93
SECTION 2 - RESULTS AND TRADING
2.3 Operating segments continued
Year ended 31 December 2017
UK Motor £m
Software £m
Leasing £m
US Motor £m
Group interest £m
Total £m
Aftersales revenue 350.6 - - 37.0 - 387.6
Used vehicle revenue 2,125.5 - - 85.7 - 2,211.2
New vehicle revenue 1,767.5 - - 292.1 - 2,059.6
Support businesses revenue - 27.1 71.2 - - 98.3
Total gross segment revenue 4,243.6 27.1 71.2 414.8 - 4,756.7
Inter-segment revenue - (11.3) (6.3) - - (17.6)
Revenue from external customers 4,243.6 15.8 64.9 414.8 - 4,739.1
Operating profit before non-underlying items 52.3 10.9 9.8 10.8 - 83.8
Non-underlying items 7.6 - - - - 7.6
Operating profit 59.9 10.9 9.8 10.8 - 91.4
Finance expense (11.1) - (2.0) (1.6) (11.4) (26.1)
Finance income - 0.8 - - (0.8) -
Segmental profit before tax 48.8 11.7 7.8 9.2 (12.2) 65.3
Depreciation and impairment (21.9) (0.3) (36.0) (1.3) - (59.5)
Amortisation (0.4) (2.2) (0.1) - - (2.7)
Share based payments 1.7 - - - - 1.7
Other income - losses on the sale of
businesses and property (0.1) - - - - (0.1)
Other items included in the income statement are as follows:

94
Geographical information.
All segments, with the exception of the US Motor Group in the United States originate in the United Kingdom.
SECTION 2 - RESULTS AND TRADING
2.3 Operating segments continued
Year ended 31 December 2016 - as restated
UK Motor £m
Software £m
Leasing £m
US Motor £m
Group interest £m
Total £m
Aftersales revenue 356.2 - - 32.6 - 388.8
Used vehicle revenue 1,845.3 - - 78.3 - 1,923.6
New vehicle revenue 1,939.4 - - 247.1 - 2,186.5
Support businesses revenue - 24.5 67.0 - - 91.5
Total gross segment revenue 4,140.9 24.5 67.0 358.0 - 4,590.4
Inter-segment revenue (23.0) (10.1) (20.3) - - (53.4)
Revenue from external customers 4,117.9 14.4 46.7 358.0 - 4,537.0
Operating profit before non-underlying items 74.0 10.0 5.0 12.2 - 101.2
Non-underlying items (0.8) - - - - (0.8)
Operating profit 73.2 10.0 5.0 12.2 - 100.4
Finance expense (6.4) - - (1.0) (20.0) (27.4)
Finance income 0.1 0.3 0.1 - (0.5) -
Segmental profit before tax 66.9 10.3 5.1 11.2 (20.5) 73.0
Depreciation and impairment (19.2) (0.4) (34.4) (1.7) - (55.7)
Amortisation (0.5) (1.9) - - - (2.4)
Share based payments (2.2) - - - - (2.2)
Impairment of assets held for sale (1.1) - - - - (1.1)
Other income - gains on the sale of businesses
and property 0.3 - - - - 0.3
NOTES TO THE FINANCIAL STATEMENTS
Other items included in the income statement are as follows:

95
SECTION 2 - RESULTS AND TRADING
2.3 Operating segments continued
UK Motor £m
Software £m
Leasing £m
US Motor £m
Group interest £m
Total £m
Aftersales revenue 356.2 - - 32.6 - 388.8
Used vehicle revenue 1,845.3 - - 78.3 - 1,923.6
New vehicle revenue 1,939.4 - - 247.1 - 2,186.5
Support businesses revenue - 24.5 67.0 - - 91.5
Total gross segment revenue 4,140.9 24.5 67.0 358.0 - 4,590.4
Inter-segment revenue (23.0) (10.1) (20.3) - - (53.4)
Revenue from external customers 4,117.9 14.4 46.7 358.0 - 4,537.0
Operating profit before non-underlying items 74.0 10.0 5.0 12.2 - 101.2
Non-underlying items (0.8) - - - - (0.8)
Operating profit 73.2 10.0 5.0 12.2 - 100.4
Finance expense (6.4) - - (1.0) (20.0) (27.4)
Finance income 0.1 0.3 0.1 - (0.5) -
Segmental profit before tax 66.9 10.3 5.1 11.2 (20.5) 73.0
Depreciation and impairment (19.2) (0.4) (34.4) (1.7) - (55.7)
Amortisation (0.5) (1.9) - - - (2.4)
Share based payments (2.2) - - - - (2.2)
Impairment of assets held for sale (1.1) - - - - (1.1)
Other income - gains on the sale of businesses
and property 0.3 - - - - 0.3
SECTION 2 - RESULTS AND TRADING
2.4 Staff costs
The average number of people employed by the Group in the following areas was:
2017 Number
2016 Number
Sales 3,296 3,187
Aftersales 4,495 4,345
Administration 2,198 2,124
9,989 9,656
2017 £m
2016 £m
Wages and salaries 272.1 254.6
Social security costs 24.8 23.5
Contributions to defined contribution plans (see note 5.1) 5.2 5.2
Cost recognised for defined benefit plans (see note 5.1) 2.7 1.6
Share based payments (see note 4.6) (1.7) 2.2
303.1 287.1
Costs incurred in respect of these employees were:
Information relating to directors’ emoluments, share options and pension entitlements is set out in the Directors’
Remuneration Report on pages 50 to 62.
2.5 Audit fees
Auditors’ remuneration:
2017 £000
2016 £000
Fees payable to the company's auditor for the audit of the company's annual accounts: 253.0 221.8
Fees payable to the company's auditor and its associates for other services:
Audit of the company's subsidiaries pursuant to legislation 162.9 156.1
Audit-related assurance services 45.0 45.0
Tax compliance services 65.0 65.0
Other assurance services 10.0 10.0
535.9 497.9

96
SECTION 2 - RESULTS AND TRADING
2.6 Non-underlying items
Non-underlying income and expenses are items that are not incurred in the normal course of business and are sufficiently
significant and/or irregular to impact the underlying trends in the business. 2017 £m
2016 £m
Within operating expenses:
Settlement of historic VAT issues 7.7 -
Impairment of assets held for sale - (1.1)
7.7 (1.1)
Within other income - gains on the sale of businesses, property and investments:
(Losses) on the sale of businesses - (1.0)
(Losses)/gains on the sale of property (0.1) 1.3
(0.1) 0.3
Within finance expense:
Net interest on pension scheme obligations (2.7) (1.6)
(2.7) (1.6)
Total non-underlying items before tax 4.9 (2.4)
Non-underlying items in tax 0.8 1.6
Total non-underlying items after tax 5.7 (0.8)
The following amounts have been presented as non-underlying items in these financial statements:
During 2015, the Supreme Court had determined the Group’s long running litigation in respect of financing in favour of
HMRC. It was only during 2017 that the final accounting for the numerous offsets was finally determined, resulting in a
credit of £7.7m made up of VAT reclaims of £2.2m, interest on VAT reclaims of £3.3m and other items resulting from
settlement of historic issues and litigation of £2.2m.
Group tangible fixed assets and assets held for sale have been reviewed for possible impairments. There was no impairment
charge against assets held for sale as a result of this review (2016: £1.1m). There were no reversals of previous impairment
charges in respect of assets held for sale where anticipated proceeds less costs to sell have increased over their impaired
carrying values (2016: £nil).
The net financing return on pension obligations in respect of the defined benefit schemes closed to future accrual is shown
as a non-underlying item due to the irregularity of this amount historically and it is not incurred in the normal course of
business. A net expense of £2.7m has been recognised during the year (2016: £1.6m).
Other income consists of the profit or loss on disposal of businesses and property. There were no disposals of motor vehicle
dealerships during the year (2016: £1.0m loss was incurred) and a £0.1m loss was incurred on sale of properties (2016: profit
£1.3m). This does not include routine transactions in relation to the disposal of individual assets, and only relates to the
disposal of motor vehicle dealerships and associated properties.
NOTES TO THE FINANCIAL STATEMENTS

97
SECTION 2 - RESULTS AND TRADING
2.7 Taxation
Accounting policy
Income tax comprises current and deferred tax. Income tax is recognised in the income statement except to the extent that
it relates to items recognised directly in equity, in which case it is recognised in equity.
Current tax is the expected tax payable on the taxable income for the year, using tax rates enacted or substantively enacted
at the balance sheet date, and any adjustment to tax payable in respect of previous years.
Deferred tax is recognised using the balance sheet liability method, recognising temporary differences between the carrying
amounts of assets and liabilities for financial reporting purposes and the amounts used for taxation purposes. The following
temporary differences are not recognised: initial recognition of goodwill, the initial recognition of assets or liabilities in a
transaction that is not a business combination that affect neither accounting nor taxable profit, and differences relating
to investments in subsidiaries to the extent that they will probably not reverse in the foreseeable future. The amount of
deferred tax recognised is based on the expected manner of realisation or settlement of the carrying amount of assets and
liabilities, using tax rates enacted or substantively enacted at the balance sheet date.
A deferred tax asset is recognised only to the extent that it is probable that future taxable profits will be available against
which the asset can be utilised. Deferred tax assets are reduced to the extent that it is no longer probable that the related
tax benefit will be realised.
Additional income taxes that arise from the distribution of dividends are recognised at the same time as the liability to pay
the related dividend.
Estimates and judgements
The actual tax on the Group’s profits is determined according to complex laws and regulations. Where the effect of these
laws and regulations is unclear, estimates are used in determining the liability for the tax to be paid on profits which are
recognised in the financial statements. The Group considers the estimates, assumptions and judgements to be reasonable
but this can involve complex issues which may take a number of years to resolve. The final determination of tax liabilities
could be different from the estimates reflected in the financial statements but the Group believes that none have a significant
risk of causing a material adjustment to the carrrying amount of the liability within the next financial year.
Deferred tax assets and liabilities require management judgement in determining the amounts to be recognised. In particular,
judgement is used when assessing the extent to which deferred tax assets should be recognised with consideration given to
the timing and level of future taxable income. The unrecognised deferred tax assets are disclosed below.

98NOTES TO THE FINANCIAL STATEMENTS
SECTION 2 - RESULTS AND TRADING
2.7 Taxation continued
Taxation - Income statement
2017 £m
2016 £m
UK corporation tax:
Current tax on profit for the year 10.0 11.3
Adjustments in respect of prior periods (2.7) 0.4
7.3 11.7
Overseas taxation:
Current tax on profit for the year 3.5 4.5
Adjustments in respect of prior periods (0.3) -
3.2 4.5
Total current tax 10.5 16.2
Deferred tax expense:
Origination and reversal of temporary differences 1.5 1.3
Total deferred tax 1.5 1.3
Total income tax expense in the income statement 12.0 17.5
Factors affecting the tax charge for the period:
The tax assessed is different from the standard rate of corporation tax in the UK of 19.25% (2016: 20.00%)
The differences are explained below: 2017 £m
2016 £m
Profit before taxation 65.3 73.0
Tax on profit at UK rate of 19.25% (2016: 20.00%) 12.6 14.6
Differences:
Tax effect of expenses that are not deductible in determining taxable profit 0.2 0.2
Permanent differences arising in respect of fixed assets 0.7 0.6
Tax rate differential on overseas income 2.0 2.4
Non-underlying items (see below) (1.9) (1.2)
Impact of UK corporation tax rate change (0.2) -
Impact of US corporate tax rate change (0.8) -
Adjustments to tax charge in respect of previous periods (0.6) 0.9
Total income tax expense in the income statement 12.0 17.5

99
SECTION 2 - RESULTS AND TRADING
2.7 Taxation continued
Taxation - Other comprehensive income
2017 £m
2016 £m
Relating to defined benefit plan remeasurement (gains) and losses (6.3) 9.8
(6.3) 9.8
Tax rate
The reduction in the UK corporation tax rate to 20% (effective from 1 April 2015) was substantively enacted on 2 July 2013.
Further reductions to 19% (effective from 1 April 2017) and to 17% (effective from 1 April 2020) were substantively enacted
on 26 October 2015 and 6 September 2016 respectively. This will reduce the Group’s future UK tax charge accordingly.
The UK deferred tax asset as at 31 December 2017 has been calculated based on the expected long term rate of 17%
substantively enacted at the balance sheet date.
The reduction in the US federal corporate tax rate to 21% (effective from 1 January 2018) was substantively enacted on
20 December 2017. This will reduce the Group’s future US tax charge accordingly. The USA deferred tax liability as at 31
December 2017 has been calculated based on the expected long term rate of 21% substantively enacted at the balance
sheet date. The impact of this rate change was to increase the deferred tax asset by £0.8m.
Factors affecting the tax charge
The tax charge/credit is decreased/increased by the release of prior year provisions relating to UK corporation tax returns
and also non-deductible expenses including the impairment of goodwill and non-qualifying depreciation.
Non-underlying tax credit
The tax credit in relation to non-underlying items referred to in note 2.6 is £0.8m (2016: £1.6m). This includes a tax credit of
£1.9m (2016: £1.2m) relating to the settlement of certain historic corporation tax issues, £nil (2016: £0.1m) in respect of tax
relief on business disposals, a £1.5m (2016: £nil) charge in respect of the settlement of historic VAT issues and a tax credit
of £0.4m (2016: £0.3m) in respect of pension scheme interest.
Unrecognised deferred tax assets
There are unutilised tax losses within the Group of £13.8m (2016: £13.8m) relating to former overseas businesses for which no
deferred tax asset has been recognised pending the clarity of the availability of intra-EU losses. There are also unrecognised
capital losses net of rolled over gains of £35.0m (2016: £35.0m).
Deferred tax assets/(liabilities)
Deferred income tax assets and liabilities are offset when there is a legally enforceable right to offset current tax assets
against current tax liabilities and when the deferred income taxes relate to the same fiscal authority. The offset amounts
are as follows:
2017 £m
2016 £m
Deferred tax assets 13.1 21.5
Deferred tax liabilities (1.7) (2.5)
11.4 19.0

100NOTES TO THE FINANCIAL STATEMENTS
SECTION 2 - RESULTS AND TRADING
2.7 Taxation continued
The table below outlines the deferred tax assets/(liabilities) that are recognised on the balance sheet, together with their
movements in the year;
At 1 January 2016 £m
(Charged) to consolidated income statement £m
(Charged) /credited to equity £m
On acquisition £m
Exchange differences £m
At 31 December 2016 £m
Property, plant and equipment (1.2) (1.1) - (0.1) (0.4) (2.8)
Retirement benefit obligations 7.9 (0.1) 9.8 - - 17.6
Other short termtemporary differences 3.4 - (0.5) - - 2.9
Losses 1.4 (0.1) - - - 1.3
Tax assets/(liabilities) 11.5 (1.3) 9.3 (0.1) (0.4) 19.0
At 1 January 2017 £m
(Charged) to consolidated income statement £m
(Charged) to equity £m
On acquisition £m
Exchange differences £m
At 31 December 2017 £m
Property, plant and equipment (2.8) (0.5) - - 0.2 (3.1)
Retirement benefit obligations 17.6 (0.6) (6.3) - - 10.7
Other short termtemporary differences 2.9 (0.4) - - - 2.5
Losses 1.3 - - - - 1.3
Tax assets/(liabilities) 19.0 (1.5) (6.3) - 0.2 11.4

101
SECTION 2 - RESULTS AND TRADING
2.8 Earnings per share
Accounting policy
The Group presents basic and diluted earnings per share (‘eps’) data for its ordinary shares. Basic eps is calculated by
dividing the profit or loss attributable to ordinary shareholders of the company by the weighted average number of
ordinary shares in issue during the period. The shares held by the EBT have been excluded from the calculation until such
time as they vest unconditionally with the employees. Diluted eps is calculated by dividing the profit and loss attributable
to ordinary shareholders by the weighted average number of ordinary shares in issue taking account of the effects of all
dilutive potential ordinary shares, which comprise of share options granted to employees and LTIPs.
2017 Earnings per share pence
2017 Earnings total £m
2016 Earnings per share pence
2016 Earnings total £m
Basic earnings per share 3.7 53.3 3.8 55.5
Adjusting items:
Non-underlying items attributable to the parent (see note 2.6) (0.3) (4.9) 0.2 2.4
Tax effect of non-underlying items (0.1) (0.8) (0.1) (1.6)
Underlying earnings per share (Non GAAP measure) 3.3 47.6 3.9 56.3
Diluted earnings per share 3.7 53.3 3.8 55.5
Diluted earnings per share - underlying (Non GAAP measure) 3.3 47.6 3.9 56.3
2017 Number
2016 Number
Weighted average number of ordinary shares in issue 1,422.5 1,444.1
Weighted average number of dilutive shares under option 2.3 14.3
Weighted average number of shares in issue taking account of applicable outstanding share options
1,424.8 1,458.4
Non-dilutive shares under option 20.2 21.0
The calculation of basic, adjusted and diluted earnings per share is based on the following number of shares in issue
(millions):
The directors consider that the underlying earnings per share figure provides a better measure of comparative performance.
Earnings per share calculation

102NOTES TO THE FINANCIAL STATEMENTS
SECTION 3 - OPERATING ASSETS AND LIABILITIES
This section contains the notes and information to support those assets and liabilities presented in the Consolidated
Balance Sheet that relate to the Group’s operating activities.
3.1 Intangible assets and goodwill 3.6 Trade and other receivables
3.2 Property, plant and equipment 3.7 Trade and other payables
3.3 Assets classified as held for sale 3.8 Provisions
3.4 Inventories 3.9 Deferred income
3.5 Movement in contract hire vehicle balances
3.1 Intangible assets and goodwill
Accounting policies
All business combinations are accounted for by applying the purchase method. Goodwill represents the excess of the
cost of acquisition over the net fair value of the identifiable assets, liabilities and contingent liabilities of the acquired
subsidiary undertakings at the effective date of acquisition and is included in the balance sheet under the heading of
intangible assets. The goodwill is allocated to cash generating units (CGUs), which are franchise groups and other
business units. An impairment test is performed annually as detailed below. Goodwill is then held in the balance sheet
at cost less any accumulated impairment losses.
Adjustments are applied to bring the accounting policies of the acquired businesses into alignment with those of the
Group. The costs associated with reorganising or restructuring are charged to the post acquisition income statement. For
those acquisitions made prior to 1 January 2004, goodwill is recorded on the basis of its deemed cost which represented
its carrying value as at 1 January 2004 under UK GAAP. Fair value adjustments are made in respect of acquisitions. If
at the balance sheet date the fair value of the acquiree’s identifiable assets, liabilities and contingent liabilities can only
be established provisionally then these values are used. Any adjustments to these values made within 12 months of the
acquisition date are taken as adjustments to goodwill.
Internally generated intangible assets relate to activities that involve the development of dealer management systems
by the Group’s Pinewood division. Development expenditure is capitalised only if development costs can be measured
reliably, the product is technically and commercially feasible, future economic benefits are probable and the Group
intends to and has sufficient resources to complete development and to use or sell the asset. The expenditure capitalised
includes the costs of labour and overhead costs that are directly attributable to preparing the asset for its intended use.
If the development expenditure does not meet the above criteria it is expensed to the income statement.
Capitalised development expenditure is measured at cost less accumulated amortisation and accumulated impairment
losses and is amortised over a period of five years.
Intangible assets other than goodwill are stated at cost less accumulated amortisation and any impairment losses. This
category of asset includes purchased computer software and internally generated intangible assets which are amortised
by equal instalments over four years and the fair value of the benefit of forward sales orders assumed on acquisition,
which is amortised by reference to when those orders are delivered.
Subsequent expenditure on capitalised intangible assets is capitalised only when it increases the future economic
benefits embodied in the specific asset to which it relates. All other expenditure is expensed as incurred.
Intangible assets arising on an acquisition are recognised separately from goodwill if the fair value of the asset can be
identified separately and measured reliably. Amortisation is calculated on a straight line basis over the estimated useful
life of the intangible asset. Amortisation methods and useful lives are reviewed annually and adjusted if appropriate.

103
SECTION 3 - OPERATING ASSETS AND LIABILITIES
3.1 Intangible assets and goodwill continued
Activity Goodwill £m
Development costs £m
Other intangibles £m
Total £m
Cost
At 1 January 2016 431.2 13.1 11.7 456.0
Business acquisitions 0.6 - - 0.6
Other additions - 2.4 0.2 2.6
Disposals of businesses (4.9) - - (4.9)
Other disposals - - (0.5) (0.5)
At 31 December 2016 426.9 15.5 11.4 453.8
At 1 January 2017 426.9 15.5 11.4 453.8
Business acquisitions 6.1 - - 6.1
Other additions - 2.9 1.7 4.6
Disposals (0.1) - (0.2) (0.3)
Classified as non-current assets held for sale (1.4) - - (1.4)
At 31 December 2017 431.5 18.4 12.9 462.8
Amortisation
At 1 January 2016 70.4 8.2 10.8 89.4
Amortised during the year - 1.9 0.5 2.4
Other disposals - - (0.2) (0.2)
At 31 December 2016 70.4 10.1 11.1 91.6
At 1 January 2017 70.4 10.1 11.1 91.6
Amortised during the year - 2.2 0.5 2.7
Disposals (0.1) - (0.1) (0.2)
At 31 December 2017 70.3 12.3 11.5 94.1
Carrying amounts
At 1 January 2016 360.8 4.9 0.9 366.6
At 31 December 2016 356.5 5.4 0.3 362.2
At 1 January 2017 356.5 5.4 0.3 362.2
At 31 December 2017 361.2 6.1 1.4 368.7
2017 £m
2016 £m
Amortisation of internally generated intangible assets 2.2 1.9
Amortisation of other intangible assets 0.5 0.5
Research and development costs 0.8 0.7
The following have been recognised in the income statement within net operating expenses:

104NOTES TO THE FINANCIAL STATEMENTS
SECTION 3 - OPERATING ASSETS AND LIABILITIES
3.1 Intangible assets and goodwill continued
Goodwill is allocated across multiple cash-generating units which are franchise groups and other business units
and consequently a consistent approach to performing an annual impairment test to assess the carrying value of this
amount is taken. This value was determined by discounting the future cash flows generated from the continuing use of
the unit and was based on the following key assumptions:
Future cash flows were projected into perpetuity with reference to the Group’s forecasts from 2018 to 2021. The 2018
forecast was derived from the corporate plan, approved by the Board and compiled on a bottom up basis with reference
to BCA, SMMT and the University of Buckingham. The 2019-2022 forecasts represent a projection from the 2018 bottom up
forecast. These forecasts have been approved by the directors and form the basis of the growth assumptions for future
cash flows from 2018 to 2021. The growth rates are considered to be at or below long term market trends for the Group’s
business.
It is anticipated that the units will grow revenues in the future. For the purpose of the impairment testing, a growth rate of
2.4% (2016: 2.4%) has been assumed beyond the business plan.
The discount rates are estimated to reflect current market estimates of the time value of money and is calculated after
consideration of market information and risk adjusted for individual circumstances. With all units carrying a goodwill value
operating in the UK and in the motor retail or related sector a single pre-tax discount rate of 10.2% has been applied (2016:
10.2%). The discount rate used in Pinewood was 11.2% (2016: 11.2%).
The break even point sensitivity of the key assumptions which would cause the first CGU to become impaired are as follows:
The profitability forecast in our base plan assumptions would need to fall by 15.4%; the perpetuity rate needs to fall by 1.83%
to 0.57% from the 2.40% assumption today or the discount rate increases by 1.35% to 11.55% from the 10.20% assumed
today, before we would reach an impairment point on any CGU. From the break-even point, if we were to reduce the
perpetuity rate to 0% from 0.57% this would lead to an impairment of goodwill of £3.2m. From the break-even point, if we
were to increase the discount rate from 11.55% by 1.00% to 12.55%, this would lead to an impairment of £8.1m of goodwill.
Movements of the principal CGUs are summarised in the table below:
BMW £m
Ford £m
Mercedes £m
Vauxhall £m
Others £m
Total £m
At 1 January 2016 32.1 71.6 47.8 77.8 131.5 360.8
Additions - - - - 0.6 0.6
Disposals - (1.9) - - (3.0) (4.9)
At 31 December 2016 32.1 69.7 47.8 77.8 129.1 356.5
At 1 January 2017 32.1 69.7 47.8 77.8 129.1 356.5
Additions - - - - 6.1 6.1
Classified as non-current assets held for sale - - - - (1.4) (1.4)
At 31 December 2017 32.1 69.7 47.8 77.8 133.8 361.2

105
2017 £m
2016 £m
UK Motor 332.8 334.2
US Motor 6.1 -
Pinewood 0.3 0.3
Leasing 22.0 22.0
361.2 356.5
SECTION 3 - OPERATING ASSETS AND LIABILITIES
3.1 Intangible assets and goodwill continued
Goodwill by segment
3.2 Property, plant and equipment
Accounting policy
Freehold land is not depreciated. Depreciation is provided to write off the cost less the estimated residual value of other
assets by equal instalments over their estimated useful economic lives. On transition to IFRS as at 1 January 2004, all land
and buildings were restated to fair value as permitted by IFRS 1, which is then treated as the deemed cost. All other assets
are initially measured and recorded at cost.
Depreciation rates are as follows: Freehold buildings – 2% per annum
Leasehold property improvements – 2% per annum or over the period of the lease if less than 50 years
Fixtures, fittings and office equipment – 10 – 20% per annum
Plant and machinery – 10 – 33% per annum
Motor vehicles – 20 – 25% per annum
Contract hire vehicles are depreciated to their residual value over the period of their lease
The residual value of all assets, depreciation methods and useful economic lives, if significant, are reassessed annually.
The Group recognises in the carrying amount of an item of property, plant and equipment the cost of replacing part of such
an item when that cost is incurred if it is possible that the future economic benefits embodied with the item will flow to
the Group and the cost of the item can be measured reliably. All other costs are recognised in the income statement as an
expense as incurred.
Gains and losses on disposal of an item of property, plant and equipment are determined by comparing the proceeds from
disposal with the carrying amount of property, plant and equipment and are recognised net within other income in the
income statement.
The depreciation charge in respect of property, plant and equipment is recognised within administrative expenses within
the income statement.

106NOTES TO THE FINANCIAL STATEMENTS
SECTION 3 - OPERATING ASSETS AND LIABILITIES
3.2 Property, plant and equipment continued
Land & buildings £m
Plant & equipment £m
Motor vehicles £m
Contract hire vehicles £m
Total £m
Cost
At 1 January 2016 220.7 70.0 56.9 154.2 501.8
Business acquisitions 1.3 0.1 0.1 - 1.5
Other additions 29.0 11.2 104.2 69.7 214.1
Exchange adjustments 4.6 1.2 0.1 - 5.9
Disposals of businesses (0.2) (1.4) (0.4) - (2.0)
Other disposals (0.6) (4.9) (97.9) - (103.4)
Contract hire vehicles transferred to inventory - - - (38.6) (38.6)
Classified as non-current assets held for sale (2.8) - - - (2.8)
Reinstated from non-current assets held for sale 2.4 - - - 2.4
At 31 December 2016 254.4 76.2 63.0 185.3 578.9
At 1 January 2017 254.4 76.2 63.0 185.3 578.9
Business acquisitions 11.4 0.2 - - 11.6
Other additions 63.5 14.0 110.9 82.1 270.5
Exchange adjustments (2.4) (0.7) (0.1) - (3.2)
Disposals (0.7) (2.7) (121.8) - (125.2)
Contract hire vehicles transferred to inventory - - - (54.2) (54.2)
Classified as non-current assets held for sale (6.8) (1.0) - - (7.8)
At 31 December 2017 319.4 86.0 52.0 213.2 670.6
Depreciation
At 1 January 2016 48.0 46.8 13.1 41.2 149.1
Exchange adjustments 1.5 1.3 - - 2.8
Charge for the year 5.7 7.5 14.3 28.2 55.7
Disposals of businesses - (0.9) (0.1) - (1.0)
Other disposals (0.4) (4.6) (9.7) - (14.7)
Contract hire vehicles transferred to inventory - - - (18.6) (18.6)
Classified as non-current assets held for sale (0.6) - - - (0.6)
Reinstated from non-current assets held for sale 0.9 - - - 0.9
At 31 December 2016 55.1 50.1 17.6 50.8 173.6
At 1 January 2017 55.1 50.1 17.6 50.8 173.6
Exchange adjustments (0.9) (0.6) - - (1.5)
Charge for the year 6.2 8.1 11.5 33.7 59.5
Disposals (0.4) (1.0) (12.0) - (13.4)
Contract hire vehicles transferred to inventory - - - (25.0) (25.0)
Classified as non-current assets held for sale (1.8) (0.7) - - (2.5)
At 31 December 2017 58.2 55.9 17.1 59.5 190.7

107
SECTION 3 - OPERATING ASSETS AND LIABILITIES
3.2 Property, plant and equipment continued
Carrying amounts
Land & buildings £m
Plant & equipment £m
Motor vehicles £m
Contract hire vehicles £m
Total £m
At 1 January 2016 172.7 23.2 43.8 113.0 352.7
At 31 December 2016 199.3 26.1 45.4 134.5 405.3
At 1 January 2017 199.3 26.1 45.4 134.5 405.3
At 31 December 2017 261.2 30.1 34.9 153.7 479.9
Included in the amounts for property, plant and equipment above are the following amounts relating to leased assets and
assets acquired under hire purchase contracts:
Land & buildings £m
Depreciation
Charge for the year -
Carrying amounts
At 31 December 2016 0.1
At 31 December 2017 0.1
2017 £m
2016 £m
Building projects currently under construction for which no depreciation has been charged during the year 26.8 9.2
Future capital expenditure which has been contracted for but not yet provided in the financial statements - property development and refurbishment 7.3 5.5
Cumulative interest charges capitalised as construction costs and included in land and buildings 2.6 1.8
The following items have been charged to the income statement as operating expenses during the year:
Depreciation of property, plant and equipment - owned 59.5 55.7

108
SECTION 3 - OPERATING ASSETS AND LIABILITIES
3.3 Assets classified as held for sale
Accounting policy
Non-current assets that are expected to be recovered primarily through sale rather than through continuing use are
classified as held for sale. Immediately before classification as held for sale, the assets are measured in accordance with
the Group’s accounting policies. Thereafter the assets are measured at the lower of their carrying amount and fair value
less costs to sell. Impairment losses on remeasurement are recognised in the income statement. Gains are not recognised
in excess of any cumulative impairment loss. Non-current assets classified as held for sale are available for immediate sale
and a resultant disposal is highly probable within one year.
A non-current asset that stops being classified as held for sale is remeasured at the lower of its carrying amount prior to the
asset or disposal group being classified as held for sale, adjusted for any depreciation or amortisation that would have been
recognised if the asset had not been classified as held for sale, or, its recoverable amount at the date of the decision not to
sell.
Balance sheet
The Group holds a number of freehold properties that are currently being marketed for sale which are expected to be
disposed of during 2018. In addition the Group, as at 31 December 2017, is expected to dispose of two of its motor vehicle
dealerships in the first half of 2018 and therefore includes the relevant goodwill, property and other non-current assets of
these businesses as assets classified as held for sale.
Properties are valued using a combination of external qualified valuers and in-house experts. Due to the nature of the
market, especially in light of current economic conditions, a property may ultimately realise proceeds that vary from those
valuations applied.
Income statement
The following items have been credited/(charged) to the income statement during the year:
If the fair value less costs to sell assigned to each property were to be reduced by 10% a further impairment loss of £0.4m
would have been recognised (2016: £0.4m).
The Group, in its December 2017 strategy update, announced the intention to offer for sale its businesses in the US and
certain premium franchise locations. Given the proximity of the announcement to the year end, only two of the premium
franchise points met the criteria to be classified as an asset held for sale as at 31 December 2017. As described earlier in
these financial statements, the sale processes are being progressed during 2018.
Income statement category
2017 £m
2016 £m
Profit/(loss) on sale of assets classified as held for sale
Other income - (losses)/gains on the sale of businesses and property 0.2 1.3
Impairment of assets held for sale Net operating expenses - (1.1)
Assets classified for sale comprise: 2017 £m
2016 £m
Goodwill 1.4 -
Property, plant and equipment 9.6 6.6
11.0 6.6
NOTES TO THE FINANCIAL STATEMENTS

109
SECTION 3 - OPERATING ASSETS AND LIABILITIES
3.4 Inventories
Accounting policies
Motor vehicle inventories are stated at the lower of cost and net realisable value. Cost is net of incentives received from
manufacturers in respect of target achievements. Fair values of stock are conducted regularly utilising our market
intelligence and analysis of the market which we conduct by segment and by model, these fair values are updated in the
light of any changing trends by model line. The assessment of fair values involves an element estimation, the Group takes
the age profile of our inventories at the year end, estimates the likely sale period and the expected profit or loss on sale to
determine the fair value at the balance sheet date. Whilst this data is deemed representative of current values it is possible
that ultimate sales values can vary from those applied. Parts inventories are based on an average purchase cost principle
and are written down to net realisable value by providing for obsolescence on a time in stock based formula approach.
Consignment vehicles are regarded as being effectively under the control of the Group and are included within inventories
on the balance sheet as the Group has the significant risks and rewards of ownership even though legal title has not yet
passed. The corresponding liability is included in trade and other payables. Movements in consignment vehicle inventory
and its corresponding liability within trade and other payables are not included within movements of inventories and
payables as stated in the consolidated cash flow statement as no cash flows arise in respect of these transactions until the
vehicle is either sold or purchased at which point it is reclassified within new and used vehicle inventory.
Motor vehicles are transferred from contract hire activities at the end of their lease term to inventory at their depreciated
cost. No physical cash flow arises from these transfers.
Balance sheet 2017 £m
2016 £m
New and used vehicles 870.8 741.5
Consignment vehicles 95.5 70.3
Vehicle parts and other inventories 37.2 34.4
1,003.5 846.2
2017 £m
2016 £m
Carrying value of inventories subject to retention of title clauses 897.3 759.9
Cash flow statement information 2017 £m
2016 £m
Movement in inventory (157.3) (15.6)
Inventory changes in business combinations and disposals 0.3 (1.0)
Impact of exchange differences 0.3 (1.0)
Non cash movement in consignment vehicles 25.2 (6.0)
Transfer value of contract hire vehicles from fixed assets to inventory 29.2 20.0
Cash flow decrease due to movements in inventory (102.3) (3.6)
The sensitivity of the key assumptions on our sales prices could have the following impact on the fair value of inventory.
If our assumptions were £100 per unit worse for those vehicles that are expected to make a loss per unit, the fair value of
inventory would reduce by £1.4m in the year.

110
SECTION 3 - OPERATING ASSETS AND LIABILITIES
3.5 Movement in contract hire vehicle balances
2017 £m
2016 £m
Depreciation 33.7 28.2
Changes in trade and other payables and deferred income 19.3 21.5
Purchases of contract hire vehicles (82.1) (69.7)
Unwinding of discounts in contract hire residual values (2.6) (1.6)
(31.7) (21.6)
3.6 Trade and other receivables
Accounting policies
Trade and other receivables are recognised initially at fair value and are subsequently stated at amortised cost using the
effective interest method, less any impairment losses.
Credit risk management
The Group is exposed to credit risk primarily in respect of its trade receivables and financial assets. Trade receivables are
stated net of provision for estimated impairment losses. Exposure to credit risk in respect of trade receivables is mitigated
by the Group’s policy of only granting credit to certain customers after an appropriate evaluation of credit risk. Credit risk
arises in respect of amounts due from vehicle manufacturers in relation to bonuses and warranty receivables. This risk is
mitigated by the range of manufacturers dealt with, the Group’s procedures in effecting timely collection of amounts due
and management’s belief that it does not expect any manufacturer to fail to meet its obligations. Financial assets comprise
trade and other receivables (as above) and cash balances. The counterparties are banks and management does not expect
any counterparty to fail to meet its obligations. The maximum exposure to credit risk is represented by the carrying amount
of each financial asset, including derivative financial instruments, in the balance sheet.
Before granting any new customer credit terms the Group uses external credit scoring systems to assess the potential new
customer’s credit quality and defines credit limits by customer. These limits and credit worthiness are regularly reviewed
and use is made of monitoring alerts provided by the providers of the credit scoring systems. The Group has no customer
that represents more than 5% of the total balance of trade receivables.
Balance sheet 2017 £m
2016 £m
Trade receivables 60.6 61.8
Allowance for doubtful debts (0.3) (0.6)
60.3 61.2
Other receivables 56.6 76.5
Prepayments 15.9 15.4
132.8 153.1
All amounts are due within one year.
NOTES TO THE FINANCIAL STATEMENTS

111
SECTION 3 - OPERATING ASSETS AND LIABILITIES
3.6 Trade and other receivables continued
All trade receivables are classified as loans and receivables and held at amortised cost in the current year and prior year.
Total trade receivables held by the Group at 31 December 2017 was £60.3m (2016: £61.2m). No trade receivables have been
classified as held for sale (2016: £nil).
The average credit period taken on sales of goods is 29 days (2016: 29 days). No interest is charged on trade receivables.
The Group makes an impairment provision for all debts that are considered unlikely to be collected plus a proportion of all
debts over 120 days past their due date. An expense has been recognised in respect of impairment losses during the year
of £0.5m (2016: £0.8m). Any impairment is in respect of items that are aged greater than 120 days.
Tradereceivables 2017 £m
Otherreceivables 2017 £m
Tradereceivables 2016 £m
Other receivables 2016 £m
Not past due 45.3 46.1 44.6 63.7
Past due 0-30 days 11.5 5.1 12.9 6.1
Past due 31-120 days 3.2 5.4 3.4 6.7
Past due 120+ days subject to impairment 0.6 - 0.9 -
60.6 56.6 61.8 76.5
Provision for impairment (0.3) - (0.6) -
60.3 56.6 61.2 76.5
2017 £m
2016 £m
Balance at 1 January 0.6 0.3
Utilisation (0.8) (0.5)
Impairment loss recognised 0.5 0.8
Balance at 31 December 0.3 0.6
The movement in the allowance for impairment in respect of trade receivables during the year was as follows:
The directors consider that the carrying amount of trade and other receivables approximates their fair value.
The ageing of trade and other receivables at the
reporting date was:

112
SECTION 3 - OPERATING ASSETS AND LIABILITIES
3.7 Trade and other payables
Accounting policy
Trade and other payables are recognised initially at fair value and are subsequently stated at amortised cost using the
effective interest method, less any write-offs.
Balance sheet 2017 £m
2016 £m
Trade payables 968.6 810.4
Contract hire buyback commitments 79.5 68.4
Consignment vehicle liabilities 95.5 70.3
Payments received on account 16.7 19.0
Other taxation and social security 12.1 32.6
Accruals 110.8 116.8
1,283.2 1,117.5
Non-current 59.0 48.8
Current 1,224.2 1,068.7
1,283.2 1,117.5
Trade payables are classified as other financial liabilities and principally relate to vehicle funding. Fair value is deemed to be
the same as carrying value.
The non-current element of trade and other payables relates to contract hire buyback commitments where the Group has
contracted to repurchase vehicles, at predetermined values and dates, that have been let under operating leases or similar
arrangements.
The Group enters into leasing arrangements whereby it agrees to repurchase vehicles from providers of lease finance at the
end of the lease agreement, typically two to four years in the future. The repurchase price is determined at the time the
agreement is entered into based on the then estimate of a vehicle’s future residual value. The actual value of the vehicles at
the end of the lease contract, and therefore the proceeds that can be realised from eventual sale, can vary materially from
these estimates. Annual reviews are undertaken to reappraise residual values and to recognise impairment write downs
where necessary.
NOTES TO THE FINANCIAL STATEMENTS

113
SECTION 3 - OPERATING ASSETS AND LIABILITIES
3.8 Provisions
Accounting policy
A provision is recognised if as a result of a past event the Group has a present legal or constructive obligation that can be
estimated reliably, and it is probable that the Group will be required to settle the obligation. Provisions are determined by
discounting the expected future cash flows at a pre-tax rate that reflects current market assessments of the time value of
money and the risks specific to the liability.
Vacant property provision
A provision for vacant properties is recognised when the expected benefits to be derived by the Group from a lease
contract are lower than the unavoidable cost of meeting its obligation under the contract. The provision is measured at the
present value of the lower of the expected cost of terminating the contract and the expected net cost of continuing with
the contract.
The vacant property provision is comprised of the future costs of vacated properties, being predominantly future lease
commitments less any contributions from income derived from the subletting of these properties. The present value of
future net lease commitments is calculated using a 1.2% discount rate. It is expected that the majority of this expenditure
will be incurred over the next four years. The present value of the income from the subleases is £4.1m over the period of
the leases and assumes that any sublet properties will remain so until the end of the sublease.
VAT assessment
The Group has a provision of £6.8m in respect of potential VAT issues arising from purchases of vehicles from Motability,
the settlement of which is now not expected to be concluded in the forthcoming year.
The movements in provisions for the year are as follows: Vacant property provision £m
VATassessment £m
Total £m
At 31 December 2016 7.4 5.0 12.4
Provisions made during the year 0.6 1.8 2.4
Provisions used during the year (0.7) - (0.7)
Provisions released during the year (4.6) - (4.6)
At 31 December 2017 2.7 6.8 9.5
Non-current 2.0 6.8 8.8
Current 0.7 - 0.7
2.7 6.8 9.5

114
SECTION 3 - OPERATING ASSETS AND LIABILITIES
3.9 Deferred income
Property leases
Deferred income arose in 2006 from a sale and leaseback arrangement relating to certain dealership properties leased by
the Group over a 25 year period.
Warranty policies sold
The income received in respect of warranty policies sold and administered by the Group is recognised over the period of
the policy on a straight line basis. Within the £9.0m warranty income created in the year, £4.0m relates to the prior year.
The unrecognised income is held within deferred income.
Contract hire
Vehicles supplied to a leasing company for contract hire purposes where the Group undertakes to repurchase the vehicle at
a predetermined date are accounted for in accordance with IAS 17 Leases, where the Group is considered to be an operating
lessor for all arrangements in place. The initial amounts received in consideration from the leasing company are allocated
between the present value of the repurchase commitment, held within trade and other payables and a residual amount
of deferred revenue held within deferred income. The deferred revenue, which effectively represents rentals received in
advance, is taken to the income statement on a straight line basis over the related lease term.
Property leases £m
Warranty policies £m
Contract hire £m
Total £m
At 31 December 2016 13.9 6.4 66.7 87.0
Created in the year - 9.0 44.4 53.4
Recognised as income during the year (1.6) (2.4) (36.2) (40.2)
At 31 December 2017 12.3 13.0 74.9 100.2
Non-current 11.4 2.9 35.6 49.9
Current 0.9 10.1 39.3 50.3
12.3 13.0 74.9 100.2
NOTES TO THE FINANCIAL STATEMENTS

115
SECTION 4 - FINANCING ACTIVITIES AND CAPITAL STRUCTURE
This section contains the notes and information to support the elements of both net debt and equity financing as
presented in the Consolidated Balance Sheet.
4.1 Accounting policies 4.5 Dividends
4.2 Financial instruments and derivatives 4.6 Share based compensation
4.3 Net financing costs 4.7 Obligations under finance leases
4.4 Capital and reserves 4.8 Operating lease arrangements
4.1 Accounting policies
A financial instrument is recognised if the Group becomes a party to the contractual provisions of the instrument. Financial
assets are derecognised if the Group’s contractual rights to the cash flows from the financial asset expires. Financial
liabilities are derecognised if the Group’s obligations specified in the contract expire or are discharged and cancelled.
Financial instruments comprise both derivative and non-derivative financial instruments.
Non-derivative financial instruments
Non-derivative financial instruments comprise investments in equity and debt securities, trade and other receivables, cash
and cash equivalents, loans and borrowings, and trade and other payables.
Non-derivative financial instruments are recognised initially at fair value. Subsequent to initial recognition non-derivative
financial instruments are measured as described below.
Trade and other receivables - see note 3.6
Cash and cash equivalents
Cash and cash equivalents comprise cash in hand and demand deposits, and other short term highly liquid investments that
are readily convertible to a known amount of cash and are subject to an insignificant risk of changes in value.
Loans and borrowings
Interest-bearing loans and borrowings are recognised initially at fair value less attributable transaction costs. Subsequent
to initial recognition, interest-bearing borrowings are stated at amortised cost with any difference between cost and
redemption value being recognised in the income statement over the period of the borrowings on an effective interest
basis. The effective interest basis is a method of calculating the amortised cost of a financial liability and of allocating
interest payments over the relevant period. The effective interest rate is the rate that exactly discounts estimated future
cash payments through the expected life of the financial liability, or where appropriate, a shorter period.

116
SECTION 4 - FINANCING ACTIVITIES AND CAPITAL STRUCTURE
4.1 Accounting policies continued
Trade and other payables - see note 3.7
Hedging instruments
The Group holds hedging instruments to hedge currency risks arising from its activities. Hedging instruments are recognised
at fair value. Any gain or loss on remeasurement is recognised in the income statement. However, the treatment of gains
or losses arising from hedging instruments which qualify for hedge accounting depends on the type of hedge arrangement.
The fair value of hedging instruments is the estimated amount receivable or payable to terminate the contract determined
by reference to the market prices prevailing at the balance sheet date. The only hedging instrument held by the Group at
the balance sheet date was its borrowing in USD to hedge its investment in overseas operations. A gain or loss in respect
of an effective hedge of a net investment in an overseas operation is recognised directly in equity. Any ineffective portion
of the hedge is recognised in the income statement.
4.2 Financial instruments and derivatives
Net Debt 2017 £m
2016 £m
Cash and cash equivalents 53.3 84.0
Non-current interest bearing loans and borrowings (177.4) (175.7)
(124.1) (91.7)
Cash and cash equivalents
Bank balances and bank overdrafts set out below are stated net of legal rights of set-off resulting from pooling arrangements
operated by individual banks. Carrying value & fair value 2017 £m
Carrying value & fair value 2016 £m
Bank balances and cash equivalents 53.3 84.0
NOTES TO THE FINANCIAL STATEMENTS
During 2016 the Company signed a £240m 5 year committed bank facility and a £60m 5.75% 7 year debt private placement.
The fees and expenses associated with this debt of £2.1m are amortised over the expected life of the facility commencing
in 2016. At 31 December 2017, £0.9m had been amortised and £1.2m remains to be amortised in future periods.
Borrowings
As at 31 December 2017, the Group had a £240m credit facility and a £60m senior note, expiring as set out below: Expiry date
£m
Revolving credit facility March 2021 240.0
Senior note March 2023 60.0
300.0

117
SECTION 4 - FINANCING ACTIVITIES AND CAPITAL STRUCTURE
4.2 Financial instruments and derivatives continued
Current margin
Commitment (non-utilisation) fee
Revolving credit facility 1.40% 0.49%
Senior note 5.75% n/a
The margin on the revolving credit facility varies according to a ratchet mechanism linked to the ratio of net debt to
underlying EBITDA (after stocking interest). At 31 December 2017, the margin was 1.40%, consequent on the Group having
achieved a ratio of less than 1.0. The commitment fee is calculated at 35% of the margin. The interest rate in respect of
the senior note is a fixed rate of 5.75% until maturity.
The revolving credit facility and the senior note are both subject to the same performance covenants with respect to net
debt : underlying EBITDA (after stocking interest) and fixed charge cover.
Security
Both the revolving credit facility and the senior note are unsecured and rank pari-passu.
Summary of borrowings Carrying value 2017 £m
Fair value 2017 £m
Carrying value 2016 £m
Fair value 2016 £m
Non-current:
Bank borrowings 115.7 115.7 114.0 114.0
5.75% Senior note 2023 60.0 60.0 60.0 60.0
Other loan notes 0.2 0.2 0.2 0.2
Finance leases 1.5 1.5 1.5 1.5
Total non-current 177.4 177.4 175.7 175.7
Total Borrowings 177.4 177.4 175.7 175.7

118
SECTION 4 - FINANCING ACTIVITIES AND CAPITAL STRUCTURE
4.2 Financial instruments and derivatives continued
Reconciliation of movements of liabilities to cash flows arising from financing activities
Interest payments in respect of the above borrowings are reported in operating cash flows in the Consolidated Cash Flow
Statement.
Fair value hierarchy
Financial instruments carried at fair value are required to be measured by reference to the following levels:
Level 1: quoted prices in active markets for identical assets or liabilities
Level 2: inputs other than quoted prices included within Level 1 that are observable for the asset or liability, either directly
(i.e. as prices) or indirectly (i.e. derived from prices)
Level 3: inputs for the asset or liability that are not based on observable market data (unobservable inputs)
The revolving credit facility and senior note have been measured by a Level 2 valuation method.
Long term borrowings £m
Finance lease £m
Share capital £m
Other reserves £m
Retained earnings £m
Total £m
At 1 January 2017 174.2 1.5 71.8 72.9 228.1 548.5
Cash flows from financing activities
Dividends paid to shareholders - - - - (21.3) (21.3)
Repurchase of own shares - - (0.6) 0.6 (4.0) (4.0)
Own shares acquired by EBT - - - - (2.8) (2.8)
Disposal of shares by EBT - - - - 0.1 0.1
Repayment of loans (15.0) - - - - (15.0)
Proceeds from issue of loans 20.4 - - - 20.4
5.4 - (0.6) 0.6 (28.0) (22.6)
Other changes
The effect of changes in foreign exchange rates
(4.2) - - - - (4.2)
Liability-related : Amortisation of fees and expenses
0.5 - - - - 0.5
Equity-related : Total other changes - - - (0.6) 81.2 80.6
At 31 December 2017 175.9 1.5 71.2 72.9 281.3 602.8
NOTES TO THE FINANCIAL STATEMENTS
_____Borrowings______ ___________Equity__________

119
SECTION 4 - FINANCING ACTIVITIES AND CAPITAL STRUCTURE
4.2 Financial instruments and derivatives continued
The effective interest rates for all borrowings are all based on LIBOR for the relevant currency, except for the 5.75% senior
note 2023, which is at a fixed rate. Finance leases are effectively held at fixed rates of interest within the range set out
below. Information regarding classification of balances and interest, the range of interest rates applied in the year to 31
December 2017 and repricing periods, is set out in the table below.
2017 £m
2016 £m
Pound sterling 115.5 130.0
US dollar 61.9 45.7
177.4 175.7
Classification
Carrying value £m
Classification
Interest classification
Interest rate range Repricing periods
Bank balances and cash equivalents Loans and receivables 53.3 Amortised cost Floating GBP 0.20% - 1.87% 6 months or less
Borrowings
Non - current:
Bank borrowings Other financial liabilities 53.8 Amortised cost Floating GBP 1.48% - 1.89% 6 months or less
Bank borrowings Other financial liabilities 61.9 Amortised cost Floating USD 1.95% - 2.88% 6 months or less
5.75% Senior notes 2023 Other financial liabilities 60.0 Amortised cost Fixed GBP 5.75% n/a
Other loan notes Other financial liabilities 0.2 Amortised cost Fixed GBP 12.50% n/a
Finance leases Other financial liabilities 1.5 Amortised cost Fixed GBP 6.00% - 7.93% n/a
Total non-current 177.4
Total current -
Total borrowings 177.4
The carrying amounts of the Group’s borrowings are denominated in the following currencies:
Treasury policy, financial risk, funding and liquidity management
Financial risk management
The Group is exposed to the following risks from its use of financial instruments:
Funding and liquidity risk - the risk that the Group will not be able to meet its financial obligations as they fall due
Credit risk - the risk of financial loss to the Group on the failure of a customer or counterparty to meet its obligations to the
Group as they fall due
Market risk - the risk that changes in market prices, such as interest rates and foreign exchange rates, have on the Group’s
financial performance
The Group’s quantitative exposure to these risks is explained throughout these financial statements whilst the Group’s
objectives and management of these risks is set out below.

120
2017 £m
2016 £m
Between 1 and 2 years - -
Between 2 and 5 years 115.7 114.0
Over 5 years 61.7 61.7
177.4 175.7
Maturities include amounts drawn under revolving credit facilities which are contractually repayable generally within a
month of the year end but which may be redrawn at the Group’s option. The maturities above therefore represent the final
repayment dates for these facilities. If the amounts drawn at the year end were redrawn at the Group’s usual practice of
monthly drawings, the total cash outflows associated with all borrowings, assuming interest rates remain at the same rates
as at the year end, are estimated on an undiscounted basis as follows:
Carrying amount
Contractual cashflows
Within 6 months
6-12 months
1-2 years
2-5 years
Over 5 years
Bank borrowings 115.7 124.8 1.4 1.4 2.8 119.2 -
Senior note 60.0 78.1 1.7 1.7 3.5 10.3 60.9
Loan notes 0.2 0.4 - - - 0.1 0.3
Finance leases 1.5 5.9 - 0.1 0.1 0.3 5.4
177.4 209.2 3.1 3.2 6.4 129.9 66.6
2017 £m
2016 £m
Expiring in more than two years 124.3 126.0
The Group has the following undrawn borrowing facilities:
SECTION 4 - FINANCING ACTIVITIES AND CAPITAL STRUCTURE
4.2 Financial instruments and derivatives continued
Treasury policy and procedures
Group treasury matters are managed within policy guidelines set by the Board with prime areas of focus being liquidity,
interest rate and foreign exchange exposure. Management of these areas is the responsibility of the Group’s central treasury
function. Hedging financial instruments are utilised to reduce exposure to movements in foreign exchange rates. The Board
does not permit the speculative use of derivatives.
Funding and liquidity management
The Group is financed primarily by its issued Senior note, revolving credit facility, vehicle stocking credit lines and operating
cash flow. Committed facilities mature within appropriate timescales, are maintained at levels in excess of planned
requirements and are in addition to short term uncommitted facilities that are also available to the Group.
Each business within the Group is responsible for its own day-to-day cash management and the overall cash position is
monitored on a daily basis by the Group treasury department.
The maturity of non-current borrowings is as follows:
NOTES TO THE FINANCIAL STATEMENTS

121
SECTION 4 - FINANCING ACTIVITIES AND CAPITAL STRUCTURE
4.2 Financial instruments and derivatives continued
Interest rate risk management
The objective of the Group’s interest rate policy is to minimise interest costs whilst protecting the Group from adverse
movements in interest rates. Borrowings issued at variable rates expose the Group to cash flow interest rate risk whereas
borrowings issued at fixed rates expose the Group to fair value interest rate risk. The Group does not actively manage cash
flow interest rate risk as the Board believes that the retail sector in which the Group operates provides a natural hedge
against interest rate movements. Consequently, it is normal Group policy to borrow on a floating rate basis and all fair value
interest rate risk arising from fixed rate borrowings entered into by the Group are usually managed by swaps into floating
rate. However, the Group decided on a deviation from this policy in respect of its former 6.875% bond 2020. This bond was
issued at a fixed rate of interest and, due to the historically low rates in current floating interest rates, there was relatively
low downside risk in maintaining the bond at fixed rate. This policy has been continued in respect of the Group’s £60m
Senior note 2023.
Interest rate risk sensitivity analysis
As some of the Group’s borrowings and vehicle stocking credit lines are floating rate instruments they therefore have a
sensitivity to changes in market rates of interest. The table below shows the effect of a 100 basis points change in interest
rates for floating rate instruments outstanding at the period end, showing how profit or loss would have varied in the period
on the assumption that the instruments at the period end were outstanding for the entire period.
Profit/(loss) 2017 £m
Profit/(loss) 2016 £m
100 basis points increase (7.6) (6.8)
Tax effect 1.5 1.4
Effect on net assets (6.1) (5.4)
100 basis points decrease 7.6 6.8
Tax effect (1.5) (1.4)
Effect on net assets 6.1 5.4
Foreign exchange risk management
The Group faces currency risk in respect of its net assets denominated in currencies other than sterling. On translation into
sterling, movements in currency will affect the value of these assets. The Group’s policy is therefore to match, where possible,
net assets in overseas subsidiaries which are denominated in a foreign currency with borrowings in the same currency. The
Group has therefore borrowed USD 83.5m (2016: USD 57.0m) against its net assets held in overseas subsidiaries.
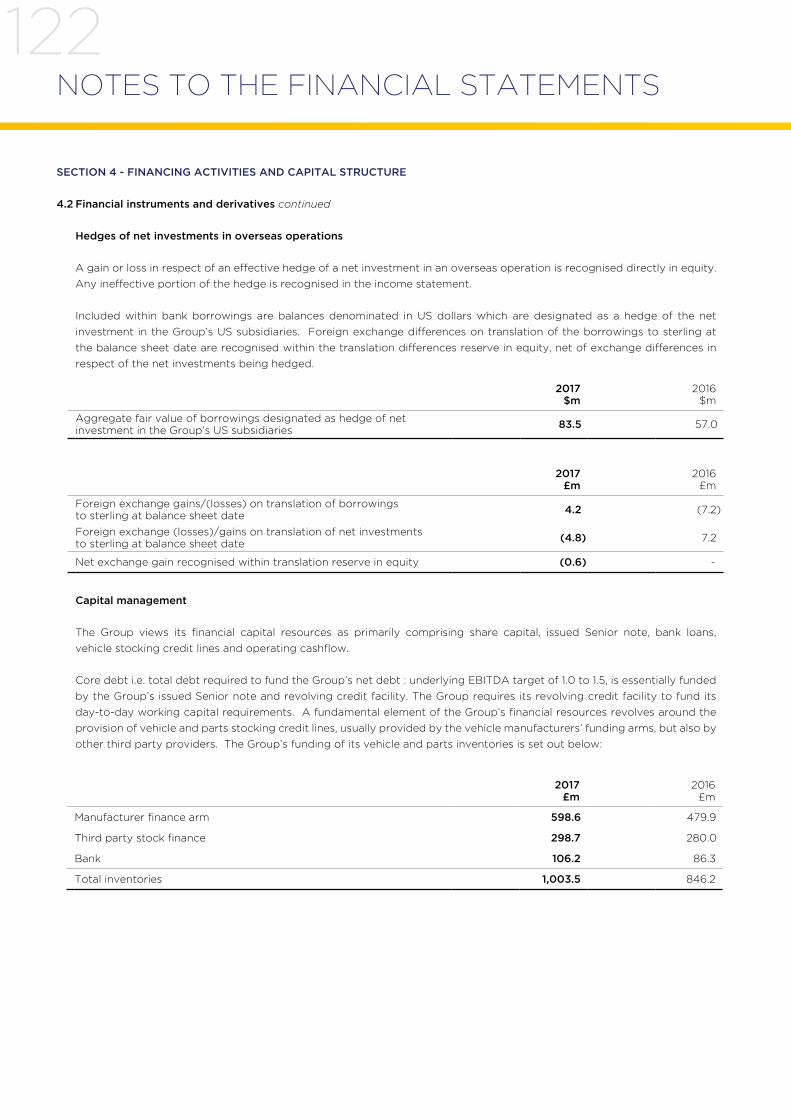
122
SECTION 4 - FINANCING ACTIVITIES AND CAPITAL STRUCTURE
4.2 Financial instruments and derivatives continued
Hedges of net investments in overseas operations
A gain or loss in respect of an effective hedge of a net investment in an overseas operation is recognised directly in equity.
Any ineffective portion of the hedge is recognised in the income statement.
Included within bank borrowings are balances denominated in US dollars which are designated as a hedge of the net
investment in the Group’s US subsidiaries. Foreign exchange differences on translation of the borrowings to sterling at
the balance sheet date are recognised within the translation differences reserve in equity, net of exchange differences in
respect of the net investments being hedged.
2017 $m
2016 $m
Aggregate fair value of borrowings designated as hedge of net investment in the Group’s US subsidiaries
83.5 57.0
2017 £m
2016 £m
Foreign exchange gains/(losses) on translation of borrowings to sterling at balance sheet date
4.2 (7.2)
Foreign exchange (losses)/gains on translation of net investments to sterling at balance sheet date
(4.8) 7.2
Net exchange gain recognised within translation reserve in equity (0.6) -
Capital management
The Group views its financial capital resources as primarily comprising share capital, issued Senior note, bank loans,
vehicle stocking credit lines and operating cashflow.
Core debt i.e. total debt required to fund the Group’s net debt : underlying EBITDA target of 1.0 to 1.5, is essentially funded
by the Group’s issued Senior note and revolving credit facility. The Group requires its revolving credit facility to fund its
day-to-day working capital requirements. A fundamental element of the Group’s financial resources revolves around the
provision of vehicle and parts stocking credit lines, usually provided by the vehicle manufacturers’ funding arms, but also by
other third party providers. The Group’s funding of its vehicle and parts inventories is set out below:
2017 £m
2016 £m
Manufacturer finance arm 598.6 479.9
Third party stock finance 298.7 280.0
Bank 106.2 86.3
Total inventories 1,003.5 846.2
NOTES TO THE FINANCIAL STATEMENTS

123
SECTION 4 - FINANCING ACTIVITIES AND CAPITAL STRUCTURE
4.2 Financial instruments and derivatives continued
When considering vehicle stocks from a funding risk view point we split the funding into that which is funded by the vehicle
manufacturers through their related finance arms and that funded through third party stock finance facilities and bank
borrowings. Financing for stock other than through bank borrowings is shown in trade creditors in the balance sheet.
Manufacturers’ finance arms tend to vary the level of finance facilities offered dependent on the amount of stocks their
manufacturer wishes to put into the network and this varies depending on the time of year and the level of production.
Undrawn third party stock finance facilities at 31 December 2017 amounted to £85m.
The Group is also responsible for funding the pension deficit. The total financial resources required by the Group to fund
itself at 31 December 2017 comprises:
The Board’s policy is to maintain a strong capital base to maintain market confidence and to sustain the development of
the business, whilst maximising the return on capital to the Group’s shareholders. The Group’s strategy will be to maintain
facilities appropriate to the working requirements of the Group, to grow organically and service its debt requirements
through generating cash flow. The Group had set a net debt : underlying EBITDA target range of 1.0 to 1.5 : 1. At 31
December 2017 the net debt : underlying EBITDA ratio achieved was 0.9 : 1, calculated as follows:
2017 £m
2016 £m
Net debt 124.1 91.7
Stock finance 897.3 759.9
Pension deficit 62.8 103.2
1,084.2 954.8
2017 £m
2016 £m
Underlying operating profit 83.8 101.2
Depreciation 59.5 55.7
Amortisation 2.7 2.4
Underlying EBITDA 146.0 159.3
Net debt (being net debt as set out above) 124.1 91.7
Net debt : underlying EBITDA ratio 0.9 0.6
The key measures which management uses to evaluate the Group’s use of its financial resources, and performance achieved
against these in 2017 and 2016 are set out below:
2017
2016
Underlying profit before tax (£m) 60.4 75.4
Underlying earnings per share (p) 3.3 3.9
Net debt : underlying EBITDA 0.9 0.6

124
SECTION 4 - FINANCING ACTIVITIES AND CAPITAL STRUCTURE
4.2 Financial instruments and derivatives continued
The Group’s capital structure and capital allocation priorities were reassessed during 2017 and the conclusion of that review
in December 2017 decided the following priorities: UK New car business - a review of capital allocation of Premium Brands
was completed and certain franchise locations will be reduced over a three year period. It is estimated that £100m capital
will be released through a mixture of disposal proceeds and investment not deployed over the next three years. US Motor
Group - given the strong performance of this division, it is economically right to sell the business at this time to realise
its value of approximately £100m before tax. UK Used car business - this remains our focus for growth with continued
investment to complete our national network achieving our objective to double used car revenue by 2021.
The Group has a target range of 1.0 to 1.5 times net debt to underlying EBITDA and is currently trading with financial leverage
below this level. The Group believes that it will continue to generate strong cash flows and, after assessing the capital needs
of the business and the current leverage position, concluded that there was scope to return surplus cash to shareholders. The
Group therefore recommenced its £20m share buyback programme, which will increase capital efficiency whilst ensuring
the balance sheet remains strong, enabling the Group to pursue its investment strategy and progressive dividend policy.
The Group will continue to pursue organic and acquisitive growth and investment opportunities and evaluate them against
the returns generated via the share buyback programme. The buyback programme is capable of being stopped and
restarted and this flexibility will enable the Group to pursue other, higher returning, capital allocation opportunities if
they arise. At the end of this share buyback programme, the Group will evaluate whether a further programme would
be appropriate. The Group may also issue shares or purchase them in the market to satisfy share incentives issued to
employees of the Group. The Group encourages employees to be shareholders of the Group, providing selective share
option and LTIP schemes from time to time.
Certain of the company’s subsidiaries are required to maintain issued share capital at levels to support capital adequacy
under Financial Conduct Authority (FCA) requirements. The Group ensures these requirements are met by injections of
equity to the subsidiaries in question, when required.
Other than specifically set out above, there were no changes to capital management in the year.
IFRS 9
IFRS 9 Financial Instruments is mandatory for reporting periods commencing on or after 1 January 2018 but can be adopted
early. These financial statements have not adopted IFRS 9 early but we provide here an explanation of the likely effect of
its adoption on the financial statements. In summary, whilst there will be changes in disclosure, there are not expected to
be any material changes in the quantification or measurement of financial assets or financial liabilities.
Financial assets
These financial statements have been prepared using IAS 39 financial instruments. IAS 39 classifies financial assets into
classes according to their nature i.e. loans and receivables, held to maturity or available for sale. IFRS 9, by contrast,
classifies assets according to the business model for their realisation, as determined by the expected contractual cashflows.
This classification determines the accounting treatment, and the new classification under IFRS 9 is by reference to the
accounting treatment i.e. amortised cost, fair value through other comprehensive income or fair value through profit and
loss.
Impairment of financial assets
IAS 39 adopts an incurred loss approach for measuring impairment while IFRS 9 adopts an expected credit loss approach
(ECL). The IAS 39 incurred loss approach relied on a credit event occurring (an actual loss or a debt past a number of
days due) before an inpairment could be recognised. The IFRS 9 approach does not require a credit event to occur but
is based on changes in expectations of credit losses. IFRS 9 also requires that impairment of financial assets be shown as
a separate line item in either the statement of comprehensive income or the income statement. Under IAS 39 the Group
recorded the impairment of its financial assets (trade and other receivables) within operating expenses.
NOTES TO THE FINANCIAL STATEMENTS

125
SECTION 4 - FINANCING ACTIVITIES AND CAPITAL STRUCTURE
4.2 Financial instruments and derivatives continued
Financial liabilities
IFRS 9 largely retains the classification requirements of IAS 39 so there are not expected to be any material differences.
The following table summarises the expected changes from IAS 39 to IFRS 9.
4.3 Net financing costs
Accounting policy
Finance income comprises interest income on funds invested, return on net pension scheme assets and gains on hedging
instruments that are recognised in profit and loss. Interest income is recognised as it accrues in profit and loss, using the
effective rate method.
Finance expense comprises interest expense on borrowings, unwinding of the discount on provisions, interest on net
pension scheme obligations and losses on hedging instruments recognised in profit and loss. All borrowing costs are
recognised in profit and loss using the effective interest method.
Gross finance costs directly attributable to the construction of property, plant and equipment are capitalised as part of the
cost of those assets until such a time as the assets are substantially ready for their intended use or sale.
IAS 39 classification IFRS 9 classification
IAS 39 Carrying value £m
Remeas- urement £m
IFRS 9 Carrying value £m
Financial assets
Trade and other receivables Loans and receivables Amortised costs 132.8 - 132.8
Cash and cash equivalents Loans and receivables Amortised costs 53.3 - 53.3
Financial liabilities
Loans and borrowings Amortised cost Amortised cost (177.4) - (177.4)
Trade and other payables Amortised cost Amortised cost (1,283.2) - (1,283.2)
Foreign currency loans used to hedge overseas investments Fair value hedging instrument Fair value hedging instrument (61.9) - (61.9)

126
SECTION 4 - FINANCING ACTIVITIES AND CAPITAL STRUCTURE
4.3 Net financing costs continued
Finance expense
Number
£m
Allotted, called up and fully paid shares of 5p each at 31 December 2016 1,436,896,960 71.8
Shares cancelled during the year (12,082,956) (0.6)
Allotted, called up and fully paid shares of 5p each at 31 December 2017 1,424,814,004 71.2
4.4 Capital and reserves
Ordinary share capital
Ordinary shares are classified as equity. Incremental costs directly attributable to the issue of ordinary shares are recognised
as a deduction from equity, net of any tax effects.
There were no issues of ordinary shares during the year.
12,082,956 ordinary shares having a nominal value of £0.6m were bought back and subsequently cancelled during the year
in accordance with the authority granted by shareholders in the Annual General Meeting on 27 April 2017. The aggregate
consideration paid, including directly attributable costs, was £4.0m.
The holders of ordinary shares are entitled to receive dividends as declared from time to time and are entitled to one vote
per share at meetings of the company. All shares rank equally with regard to the company’s residual assets.
Recognised in profit and loss
2017 £m
2016 £m
Interest payable on bank borrowings, Senior note, bond and loan notes 7.0 7.7
Vehicle stocking plan interest 14.5 16.8
Interest payable on finance leases 0.1 0.1
Net interest on pension scheme obligations (non-underlying - see note 2.6) 2.7 1.6
Less: interest capitalised (0.8) (0.4)
Total interest expense being interest expense in respect of financial liabilities held at amortised cost 23.5 25.8
Unwinding of discounts in contract hire residual values 2.6 1.6
Total finance expense 26.1 27.4
Interest of £0.8m has been capitalised during the year on assets under construction at an average rate of 5.75% (2016:
£0.4m).
NOTES TO THE FINANCIAL STATEMENTS

127
SECTION 4 - FINANCING ACTIVITIES AND CAPITAL STRUCTURE
4.4 Capital and reserves continued
Capital redemption reserve
The capital redemption reserve has arisen following the purchase by the company of its own shares and comprises the
amount by which distributable profits were reduced on these transactions in accordance with s733 of the Companies
Act 2006. £0.6m (2016: £1.2m) was transferred into the capital redemption reserve during the year in respect of shares
purchased by the Company and subsequently cancelled.
Other reserves
Other reserves comprise the amount of demerger reserve arising on the demerger of the company from Williams Holdings
PLC in 1989.
Own shares held by Employee Benefit Trust (EBT)
Transactions of the Group-sponsored EBT are included in the Group financial statements. In particular, the trust’s purchases
of shares in the company, which are classified as own shares, are debited directly to equity through retained earnings.
When own shares are sold or reissued the resulting surplus or deficit on the transaction is also recognised within retained
earnings.
The market value of the investment in the company’s own shares at 31 December 2017 was £2.2m (2016: £2.3m), being
7.7m (2016: 7.5m) shares with a nominal value of 5p each, acquired at an average cost of £0.33 each (2016: £0.32). During
the year the trust acquired 8.3m (2016: 0.8m) shares for a consideration of £2.8m (2016: £0.3m) and disposed of 8.1m
(2016: 4.5m) shares in respect of LTIP and executive share option awards for a consideration of £0.1m (2016: £0.1m). The
amounts deducted from retained earnings for shares held by the EBT at 31 December 2017 was £18.2m (2016: £15.5m).
The trustee of the EBT is Salamanca Group Trust (Jersey) Limited. The shares in trust may subsequently be awarded to
Executive Directors and employees under the Pendragon 1999 Approved Executive Share Option Scheme, Pendragon 1999
Unapproved Executive Share Option Scheme and to satisfy amounts under LTIPs and the VCP. Details of the plans are
given in the Directors’ Remuneration Report on pages 50 to 62.
Dividends on the shares owned by the trust, the purchase of which were funded by interest free loans to the trust from
Pendragon PLC, are waived. All expenses incurred by the trust are settled directly by Pendragon PLC and charged in the
accounts as incurred.
The trust is regarded as a quasi subsidiary and its assets and results are consolidated into the financial statements of the
Group.
Translation reserve
The translation reserve comprises all foreign exchange differences arising from the translation of the net investment in
foreign operations as well as from the translation of liabilities held to hedge the respective net investment in foreign
operations.

128
SECTION 4 - FINANCING ACTIVITIES AND CAPITAL STRUCTURE
4.5 Dividends
Final dividends proposed by the Board and unpaid at the end of the year are not recognised in the financial statements until
they have been approved by the shareholders at the AGM. Interim dividends are recognised when they are paid.
Weighted average exercise price 2017
Number of options millions 2017
Weighted average exercise price 2016
Number of options millions 2016
Outstanding at beginning of period 29.76p 14.7 29.59p 16.4
Exercised during the period 12.55p (0.8) 14.98p (0.6)
Lapsed during the period 38.76p (1.0) 34.58p (1.1)
Granted during the period 39.92p - 39.92p -
Outstanding at the end of the period 29.89p 12.9 29.76p 14.7
Exercisable at the end of the period 21.83p 7.1 11.80p 4.2
The options outstanding at 31 December 2017 have an exercise price in the range of 8.82 pence to 39.92 pence and a
weighted contractual life of 6.2 years. All share options are settled in equity.
2017 £m
2016 £m
Ordinary shares
Final dividend in respect of 2016 of 0.75p per share (2015: 0.7p per share) 10.7 10.2
Interim dividend in respect of 2017 of 0.75p per share (2016: 0.7p per share) 10.6 10.1
21.3 20.3
The Board is recommending a final dividend for 2017 of 0.8p (2016: 0.75p) per ordinary share equating to £11.3m in total in
respect of shares in issue at the date of this report (2016: £10.7m).
4.6 Share based compensation
Accounting policy
The Group operates a number of employee share option schemes and an executive share ownership plan ‘exsop’ awarded
in 2010. The fair value at the date at which the share options are granted is recognised in the income statement on a straight
line basis over the vesting period, taking into account the number of options that are expected to vest. The fair value of the
options granted is measured using an option pricing model, taking into account the terms and conditions upon which the
options were granted. The number of options that are expected to become exercisable is reviewed at each balance sheet
date and if necessary estimates are revised.
Executive share options
The number and weighted average exercise prices of share options is as follows:
NOTES TO THE FINANCIAL STATEMENTS

129
SECTION 4 - FINANCING ACTIVITIES AND CAPITAL STRUCTURE
4.6 Share based compensation continued
Movements in the number of options to acquire ordinary shares under the Group’s various share option schemes, together
with exercise prices and the outstanding position at 31 December 2017 were as follows:
Exercise period Date of grant
Exercise price per share
At 31 December 2016 Number
Exercised Number
Lapsed Number
At 31 December 2017 Number
20 September 2013 to 19 September 2020 20 September 2010 14.22p 667,126 (231,149) - 435,977
7 October 2014 to 6 October 2021 6 October 2011 8.82p 1,589,764 (205,313) - 1,384,451
31 March 2015 to 30 March 2022 30 March 2012 13.50p 2,130,000 (400,000) - 1,730,000
19 September 2017 to 19 September 2024 18 September 2014 31.82p 3,729,500 - (150,000) 3,579,500
1 April 2018 to 31 April 2025 31 March 2015 39.92p 6,625,000 - (895,981) 5,729,019
14,741,390 (836,462) (1,045,981) 12,858,947
All grants of share options were issued pursuant to the 2009 Executive Share Option Scheme, which prescribed an earnings
per share performance criterion. It is a precondition to the exercise of grants made under the 2009 Scheme that the growth
in the company’s earnings per share over the prescribed three year period must exceed by at least 3 percent per annum
compound the annual rate of inflation as shown by the RPI Index.
The weighted average share price at the date of exercise for share options exercised in the year was 32.4p (2016: 36.0p).
All options are settled by physical delivery of shares.
The fair value of the services received in return for share options is measured by reference to the fair value of the options
granted. The estimate of the fair value of the services received in respect of share option schemes is measured using the
Black-Scholes option pricing model. The weighted average fair value of the options at the date of grant for those that are
outstanding at 31 December 2017 is 7.0p (2016: 7.0p).

130
SECTION 4 - FINANCING ACTIVITIES AND CAPITAL STRUCTURE
4.6 Share based compensation continued
Executive Long Term Incentive Plan (‘LTIPs’)
The number and weighted average exercise prices of executive LTIPs is as follows:
Exercise period Date of grant
At 31 December 2016 Number
Lapsed Number
At 31 December 2017 Number
31 March 2018 31 March 2015 4,650,000 (712,367) 3,937,633
14 September 2019 14 September 2016 3,000,000 (600,000) 2,400,000
7,650,000 (1,312,367) 6,337,633
All grants of LTIPs were issued pursuant to the Long Term Incentive Plan, which prescribed an earnings per share performance
criterion. It is a precondition that vesting will not occur if earnings per share growth in the three year performance period
does not exceed RPI by at least 4 percent. Vesting will occur between performance points on a straight line basis. All is
subject to an underpin of creating absolute total shareholder value. In the case of the Company, this means that growth
in the value of a shareholding in the Company must exceed the growth in the value of shares in the comparator index the
Company is in, currently the FTSE Small Cap.
The fair value of the services received in return for the LTIPs is measured by reference to the fair value of the LTIPs granted.
The estimate of the fair value of the services received in respect of the LTIPs is measured using the Black-Scholes option
pricing model. The weighted average fair value of the options at the date of grant for those that are outstanding at 31
December 2017 is 34.2p (2016: 34.1p).
Executive LTIP Scheme 2017
2016
Number of share options granted in year - 3,000,000
Weighted average share price (pence) - 0.00
Weighted average exercise price (pence) - 0.00
Weighted average fair value (pence) - 30.46
Expected volatility (%) - 37.3%
Expected life (years) - 3.0
Risk free rate (%) - 0.06%
Expected dividend yield (%) - 3.0%
Weighted average exercise price 2017
Number of options millions 2017
Weighted average exercise price 2016
Number of options millions 2016
Outstanding at the start of the period 0.00p 7.7 0.00p 4.7
Granted during the period 0.00p - 0.00p 3.0
Lapsed during the period 0.00p (1.4) 0.00p -
Outstanding at the end of the period 0.00p 6.3 0.00p 7.7
Movements in the number of options to acquire ordinary shares under the Group’s LTIP, together with the outstanding
position at 31 December 2017 were as follows:
NOTES TO THE FINANCIAL STATEMENTS

131
2017 £m
2016 £m
2017 £m
2016 £m
Amounts payable under finance leases:
Within one year 0.1 0.1 0.1 0.1
In the second to fifth years inclusive 0.4 0.4 0.3 0.3
After five years 5.4 5.5 1.1 1.1
5.9 6.0 1.5 1.5
Less: future finance charges (4.4) (4.5) - -
Present value of lease obligations 1.5 1.5 1.5 1.5
Amount due for settlement within one year - -
Amount due for settlement in over one year 1.5 1.5
1.5 1.5
Minimumlease payments
Present value ofminimum
lease payments
The Group’s obligations under finance leases comprise properties on long term leases with a lease term of between 51 and
76 years. The effective interest rates are shown in note 4.2 above. The Group’s obligations under finance leases are secured
by the lessors’ charges over the leased assets.
All leases are on a fixed repayment basis and no arrangements have been entered into for contingent rental payments.
SECTION 4 - FINANCING ACTIVITIES AND CAPITAL STRUCTURE
4.6 Share based compensation continued
Expected volatility was determined by calculating the historical volatility of the Group’s share price over the corresponding
historical period. The expected life used in the model has been adjusted, based on management’s best estimate, for the
effects of exercise restrictions and team member turnover.
The Group recognised a total net credit of £1.7m (2016: £2.2m charge) as an employee benefit cost in respect of all equity-
settled share based payment transactions included within administration costs.
4.7 Obligations under finance leases
Accounting policies
Leases are classified as finance leases wherever the lease transfers substantially all the risks and rewards of ownership to
the Group. All other leases are treated as operating leases.
Assets held under finance leases are recorded at inception at the lower of the fair value of the asset and the present value
of the minimum payments required to be made under the lease. Subsequent to initial recognition, the asset is accounted
for in accordance with the accounting policy applicable to that asset. The corresponding liability is recorded as a finance
lease obligation. The finance charge element of rentals paid under these leases is expensed so as to give a constant rate
of finance charge on the remainder of the obligation. Finance charges are expensed in the income statement and the
capitalised leased asset is depreciated over the shorter of the lease term and the asset’s useful economic life.
Finance leases

132
SECTION 4 - FINANCING ACTIVITIES AND CAPITAL STRUCTURE
4.8 Operating lease arrangements
Leases are classified as operating leases wherever the lease does not transfer substantially all the risks and rewards of ownership to the Group.
Rentals paid under operating leases are charged directly to the income statement on a straight line basis over the period of the lease. Leases subject to predetermined fixed rental uplifts have their rentals accounted for on a straight line basis recognised over the life of the lease. Lease incentives received and paid are recognised in the income statement as an integral part of the total lease expense over the term of the lease.
The Group as lessee
At the balance sheet date, the Group had outstanding commitments for future minimum lease payments under non-cancellable operating leases, which fall due as follows:
2017 £m
2016 £m
Within one year 43.4 43.4
In the second to fifth years inclusive 159.3 163.1
After five years 338.0 386.9
540.7 593.4
The Group leases a number of properties, the majority of which are motor vehicle showrooms with workshop and parts
retail facilities, with varying lease periods. None of the leases includes contingent rentals. In addition there are other leases
in respect of items of plant and equipment which includes the rental of motor vehicles hired for short term usage, typically
as courtesy cars.
The following amounts have been charged to the income statement as operating expenses during the year:
2017 £m
2016 £m
Operating lease rentals payable - hire of plant and machinery 2.1 2.4
- property rentals 43.8 42.9
2017 £m
2016 £m
Within one year 4.3 4.8
In the second to fifth years inclusive 13.7 15.8
After five years 24.0 32.5
42.0 53.1
The Group as lessor
Property rental income earned during the year was £5.1m (2016: £5.3m). No contingent rents were recognised in income
(2016: £nil). The Group currently receives rental income on 32 (2016: 39) properties on short term leases. These properties
are not treated as investment properties.
At the balance sheet date, the Group had contracted with tenants for the following future minimum lease payments:
In addition, the Group is a lessor in respect of vehicle sales with committed repurchase terms (see notes 3.7 and 3.9). There
are no future minimum lease payments outstanding.
NOTES TO THE FINANCIAL STATEMENTS

133
SECTION 5 - PENSION SCHEMES
This section explains the pension scheme obligations of the Group.
5.1 Pension obligations
Accounting policy
The Group operated a number of defined benefit and defined contribution plans during the year. The assets of the defined
benefit plan and one defined contribution plan are held in independent trustee administered funds. The Group also operates
a Group Personal Pension Plan which is a defined contribution plan where the assets are held by the insurance company
under a contract with each individual.
Defined contribution plans - A defined contribution plan is one under which the Group pays fixed contributions and has
no legal or constructive obligation to pay further amounts. Therefore, no assets or liabilities of these plans are recorded
in these financial statements. Obligations for contributions to defined contribution pension plans are recognised as an
employee benefit expense in the income statement when they are due.
Defined benefit plans - Pension accounting costs for defined benefit plans are assessed by determining the pension
obligation using the projected unit credit method after including a net return on the plan assets. Under this method, in
accordance with the advice of qualified actuaries, the amounts charged in respect of employee benefits reflect the cost of
benefits accruing in the year and the cost of financing historical accrued benefits. The Group recognises all actuarial gains
and losses arising from defined benefit plans in the statement of other comprehensive income immediately.
The present value of pension obligations is measured by reference to market yields on high quality corporate bonds which
have terms to maturity approximating to the terms of the related pension liability. Plan assets are measured at fair value.
When the calculation results in a benefit to the Group, the recognised asset is limited to the total of the present value of
economic benefits available in the form of any future refunds from the plan or reductions in future contributions to the
plan. An economic benefit is available to the Group if it is realisable during the life of the plan, or on settlement of the plan
liabilities.
Under IAS 19 Employee Benefits, the Group recognises an interest expense or income which is calculated on the net defined
benefit liability or asset respectively by applying the discount rate to the net defined benefit liability or asset.
Remeasurements arising from defined benefit plans comprise actuarial gains and losses and the return on plan assets
(excluding interest) are immediately recognised directly in the statement of other comprehensive income. Actuarial gains
and losses are the differences between actual and interest income during the year, experience losses on scheme liabilities
and the impact of any changes in assumptions. Details of the last independent statutory actuarial valuation and assumptions
are set out below.
Pension Arrangements
The Group operated six defined benefit pension schemes (one of which had a defined contribution section) which closed
to new members and accrual of future benefits on 30 September 2006 and a defined contribution scheme which was
closed to new contributions from April 2006. All affected employees were offered membership of a defined contribution
pension arrangement with Friends Provident. A Group Personal Pension arrangement with Legal & General replaced the
Friends Provident arrangement from 1 January 2010. Total contributions paid by the Group in 2017 to the Legal & General
arrangement were £2.5m (2016: £2.7m). To comply with the Government’s automatic enrolment legislation, the Group
chose to participate in the People’s Pension Scheme in April 2013. This is a defined contribution occupational pension
scheme provided by B&CE. Total contributions paid by the Group to the People’s Pension in 2017 were £2.6m (2016:
£2.5m). The combined contributions to the Group’s Personal Pension arrangement (including the US Motor business) and
the Peoples Pension scheme totalled £5.2m in the period.

134
SECTION 5 - PENSION SCHEMES
5.1 Pension obligations continued
During 2012 the Trustees merged the six defined benefit schemes into one new defined benefit scheme, ‘the Pendragon
Group Pension Scheme’, which remains closed to new members and accrual of future benefits. The assets of the six
schemes have all been transferred into the new scheme and the benefits previously accrued in the six schemes were
transferred without amendment of the benefit entitlement of members to the new scheme.
The scheme is subject to the funding legislation outlined in the Pensions Act 2004 which came into force on 30 December
2005. This, together with documents issued by the Pensions Regulator, and Guidance Notes adopted by the Financial
Reporting Council, set out the framework for funding defined benefit occupational pension schemes in the UK.
The Board of the Trustees of the pension scheme is currently composed of two member nominated trustees (i.e. members
of the pension scheme nominated by other members to be trustees), two employer representatives and a professional
independent trustee. The independent chair of trustees retired at 31 December 2017 and so, in the interim, one of the
member nominated trustees shall act as chairman until a permanent chairman is appointed. It is anticipated that the
independent trustee will become chair during 2018. The Trustee of the scheme is required to act in the best interest of the
scheme’s beneficiaries. The appointment of the Trustee is determined by the scheme’s trust documentation.
Under IAS 24, the pension schemes are related parties of the Group. At 31 December 2017 there was an outstanding balance
of £0.8m (2016: £0.8m) payable to the pension schemes.
Funding
The Pendragon Group Pension Scheme is fully funded by the Group’s subsidiaries. The funding requirements are based on
the Scheme’s actuarial measurement framework set out in the funding policies of the Scheme. Employees are not required
to contribute to the plans.
Explanation of the Pension Deficit
The liabilty to pay future pensions is a liability to settle a stream of future cashflows. These future cashflows have the
following profile:
NOTES TO THE FINANCIAL STATEMENTS
30
25
20
15
10
5
02020 2030 2040 2050 2060 2070 2080 2090 2100 2110
Deferreds Pensioners
‘Deferreds’ are those pension scheme members not yet drawing a pension as at 31 December 2017; ‘Pensioners’ are those in
receipt of pension at 31 December 2017.
The actual total cash liabilities shown above are estimated at £870m. The value of these liabilites discounted to present
value at 31 December 2017 are £521.8m.
An
nu
al P
aym
en
t £
m

135
2020 2030 2040 2050 2060 2070 2080 2090 2100 2110
SECTION 5 - PENSION SCHEMES
5.1 Pension obligations continued
In order to meet those future cashflows, the Pension Scheme has to grow its assets sufficent to settle those liabilities. The
risk of the future value of those assets is dependent on the financial return; the liabilities will change dependent on the rate
of inflation (as most pensions are inflation adjusted) and longevity (how long the pensioner lives for and therefore in receipt
of pension). The pension deficit is the gap between those assets and liabilites and can be calculated in one of two ways,
both of which are arithmetically identical: either forecast future assets at the asset growth rate to offset against actual
liabilities or discount future liabilites by the asset growth rate and compare with the present value of the assets. The latter
method is the one commonly adopted and accounting standards require that the asset growth rate (the discount rate)
should be estimated on a similar basis for every company, to enhance comparability and to assume a relatively low level of
risk. The more realistic picture is provided by the actuarial valuation which considers what the best estimate of the asset
growth rate should be and hence what the gap is that the Group will be required to fund through cash contributions. These
actuarial valuations are conducted every three years (the triennial valuation). The last triennial valuation was conducted as
at 31 December 2015 giving the following comparison:
As at 31 December 2015 IAS 19 (Accounts) £m
Actuarial valuation £m
Assets 396.9 397.0
Liabilites (440.3) (432.1)
Pension deficit (43.4) (35.1)
Discount rate used 3.90% 4.20%
Inflation 2.1%-3.9% 1.8%-3.7%
The triennial valuation of the pension scheme reflecting the position as at 31 December 2015 was agreed by the Trustees on
13 March 2017. The Company has agreed with the trustees that it will aim to eliminate the deficit over a period of 5 years and
7 months from 1 January 2017 by the payment of deficit recovery contributions of £7.0m each year, increasing at 2.25% p.a.
These contributions include the expected quarterly distributions from the Central Asset Reserve over the recovery period.
The next triennial valuation of the pension scheme will reflect the position as at 31 December 2018.
Central Asset Reserve
Pendragon PLC is a general partner and the Pendragon Group Pension Scheme is a limited partner of the Pendragon
Scottish Limited Partnership (the Partnership). The Partnership holds £34.5m of properties which have been leased back to
the Group at market rates. The Group retains control over these properties, including the flexibility to substitute alternative
properties. As such, the Partnership is consolidated into the results of the Group. During the year the Group has paid
£2.8m to the Pendragon Group Pension Scheme through the Partnership (2016: £2.8m) and will increase by 2.25% on
1 August each year until the leases expire on 31 July 2032. These payments could cease in advance of that date if the
Pension Scheme’s actuarial valuation reaches a point where there is a surplus of 5% over the liability value (on the actuarial
triennial valuation basis). The Pension Scheme therefore has a right to receive a future stream of rental receipts. No asset
is recognised in these financial statements as a group has to consent to any proposed disposal of this asset by the Pension
Scheme. However, if the Group became insolvent the properties themselves would be retained by the Pension Scheme.

136
2017
2016
2015
Inflation - RPI 3.25% 3.35% 3.10%
Inflation - CPI 2.25% 2.35% 2.10%
Rate of increase in salaries n/a n/a n/a
Rate of increase to pensions in payment 2.82%* 2.91% 2.75%
Discount rate 2.55% 2.70% 3.90%
Mortality table assumption ** S2PMA CMI 2016 M (1%)/ S2PFA CMI 2016 F (1%)
S2PMA CMI 2015 M (1%)/ S2PFA CMI 2015 F (1%)
S1PMA CMI 2014 M (1%)/ S1PFA CMI 2014 F (1%)
* A full breakdown of the assumptions for the rates of increase to pensions in payment for the 31 December 2017 valuation
is as follows:
RPI to max 5% 3.25%
RPI to max 3% 2.40%
RPI to min 3% to max 5% 3.70%
CPI to max 5% 2.25%
CPI to max 3% 1.95%
CPI to min 3% to max 5% 3.35%
During 2010 the Government announced a change to the index to be used for pension increases from RPI to CPI. The
change applied to certain elements of pension increases depending on the nature of the pension entitlement, the period in
which it was earned and the rules of each scheme. The application of either RPI or CPI to calculate the pension liability has
been assessed for each scheme and the relevant elements of pension increases within each scheme.
The sensitivities regarding the principal assumptions used to measure scheme liabilities are set out below:
Assumption Change in assumption Impact on scheme liabilities
Discount rate Increase/decrease by 0.1% Decrease/increase of £9.2m
Rate of inflation Increase/decrease by 0.1% Increase/decrease of £7.5m
Rate of increase to pensions in payment Increase/decrease by 0.1% Increase/decrease of £5.4m
Mortality Increase in life expectancy of 1 year Increase by £16.2m
SECTION 5 - PENSION SCHEMES
5.1 Pension obligations continued
IAS 19 assumptions
The principal assumptions used by the independent qualified actuaries for the purposes of IAS 19 for all schemes were:
NOTES TO THE FINANCIAL STATEMENTS
The sensitivities shown above are approximate. Each sensitivity considers one change in isolation. The inflation sensitivity
includes the impact of changes to the assumptions for revaluation and pension increases. The average duration of the
defined benefit obligation at the period ending 31 December 2017 is 18 years (2016: 18 years).
The scheme typically exposes the Group to actuarial risks such as investment risk in assets (the return and gain or loss
on assets invested in), inflation risk (as pensions typically rise in line with inflation) and mortality risk (the length of time a
pensioner lives for) in respect of liabilities. As the accounting deficit is calculated by reference to a discount rate linked to
corporate bonds then the Group is also exposed to interest rate risk i.e. the discounted value of liabilities will rise or fall in
line with changes in the interest rate used to calculate (discount) the future pension liabilities to present value. A decrease in
corporate bond yields, a rise in inflation or an increase in life expectancy would result in an increase to scheme liabilities. This
would detrimentally impact the balance sheet position and may give rise to increased charges in future income statements.
This effect could be partially offset by an increase in the value of the scheme’s assets. In order to further mitigate risk, the
scheme’s investment strategy was changed during the year and now operates within a liability driven framework known
as Liability Driven Investments (‘LDI’) i.e. the scheme invests in a mix of assets that are broadly expected to match the

137
SECTION 5 - PENSION SCHEMES
5.1 Pension obligations continued
expected movement in the net present value of liabilities. This is achieved by investing in assets that are broadly expected
to hedge the underlying inflation and interest rate risks of 80% of the liabilities. The nature of the products available for
liability driven investing mean that a greater proportion of the scheme’s assets can be used to invest in assets that are
expected to have a higher growth rate than low risk assets. Traditionally, a pension scheme would typically invest in low risk
assets such as gilts or cash to broadly match the liabilities of pensions already in payment and invest in higher risk assets
such as equities in an attempt to seek growth to fund future pensions for deferred members. Today, the products available
for liability driven investing means that each £100 of gilts formerly held can now be replaced with c. £25 of collateral LDI
assets and £75 of higher growth assets in order to generate a higher expected return with a similar expected level of risk
of volatility. When the LDI investment strategy was put in place in the year, the investments were rebalanced to hold the
required level of LDI collateral assets and the balance invested in a range of diversified growth funds which typically target
a return of 3-5% per annum. Additionally, caps on inflationary increases are in place to protect the scheme against extreme
inflation.
The assumptions used by the actuary in performing the triennial valuation at 31 December 2015 are the best estimates
chosen from a range of possible actuarial assumptions which, due to the timescale covered, may not necessarily be borne
out in practice. The IAS assumptions have been updated at 31 December 2017 and differ from those used for the earlier
independent statutory actuarial valuations explained above.
** The mortality table assumption implies the following expected future lifetime from age 65:
2017 years
2016 years
2015 years
Males aged 45 23.0 23.2 23.0
Females aged 45 25.0 25.4 25.5
Males aged 65 21.9 21.9 21.7
Females aged 65 23.7 23.9 24.0
2017 £m
2016 £m
2015 £m
UK equities 193.0 234.5 218.4
Overseas equities 0.2 7.8 14.8
Unit trust 17.8 21.9 22.4
Corporate bonds - 10.9 9.9
Government bonds - 161.2 127.3
Liability driven investments 65.6 - -
Diversified growth fund 163.1 - -
Cash 19.3 5.1 4.1
Fair value of scheme assets 459.0 441.4 396.9
Present value of funded defined benefit obligations (521.8) (544.6) (440.3)
Net liability on the balance sheet (62.8) (103.2) (43.4)
The fair value of the scheme’s assets which are not intended to be realised in the short term and may be subject to significant
change before they are realised, and the value of the schemes liabilities, which is derived from cash flow projections over
long periods and thus inherently uncertain, are:
Scheme assets and liabilities

138
2017 £m
2016 £m
Net liability for defined benefit obligations at 1 January (103.2) (43.4)
Contributions received 7.3 3.1
Expense recognised in the income statement (2.7) (1.6)
Actuarial gains and losses recognised in the statement of other comprehensive income 35.8 (61.3)
Net liability for defined benefit obligations at 31 December (62.8) (103.2)
SECTION 5 - PENSION SCHEMES
5.1 Pension obligations continued
None of the fair values of the assets shown above include any of the company’s own financial instruments or any property
occupied by, or other assets used by, the company. All of the scheme assets have a quoted market price in an active market
with the exception of the Trustee’s bank account balance.
UK equities are held as a mixture of pooled funds (where cash is invested in a quoted fund designed by the fund manager)
or via a segregated mandate where cash is advanced to a fund manager for direct investment in equities at the discretion
of the fund manager.
Liability driven investments (LDI) comprises of investments in funds invested mostly in assets akin to gilts. The diversified
growth fund comprises of investments with a number of different fund managers in their individual funds, which funds
invest in a mixture of UK and global equities, government and non-government bonds, cash and derivatives.
An LDI solution does not remove all risks within a pension scheme. Those that remain include:
• Demographic risks. For example mortality experience may differ from that assumed when projecting the liability cashflows.
• Basis risk. The valuation of the liabilities by the Scheme Actuary may be based on a specific discount rate, or perhaps a
market reference yield. The LDI portfolio will be subject to either underlying gilt or swap market rates. To the extent that
these differ, it may result in a residual variation between the two valuation approaches.
• LIBOR target risk. With derivative positions in place, the assets need to achieve a LIBOR (cash return) based target in order
to keep pace with the liabilities. To the extent that this return is not achieved (through poor cash funds, or underperformance
of growth assets), this will detract from the funding position.
• Counterparty risk. The instruments used in an LDI solution rely on investment bank counterparties to provide the required
exposures. If a counterparty defaults, this can lead to a loss of that particular exposure and potentially a loss of any accrued
profit on the position. This latter is mitigated by the counterparty, placing assets as security or ‘collateral’ to cover accrued
profits
It is the policy of the Trustee and the company to review the investment strategy at the time of each funding valuation
and keep this under review. The Trustee investment objectives and the processes undertaken to measure and manage the
risks inherent in the scheme investment strategy are documented in the scheme’s Statement of Investment Principles.
The Group has reviewed implications of the guidance provided by IFRIC 14 and have concluded that it is not necessary
to make any adjustments to the IAS 19 figures in respect of an asset ceiling or Minimum Funding Requirement as at 31
December 2017 and at 31 December 2016.
Movements in the net liability for defined benefit obligations recognised in the balance sheet
NOTES TO THE FINANCIAL STATEMENTS

139
The defined benefit obligation can be allocated to the plan’s participants as follows:
2017 %
2016 %
Deferred plan participants 58 60
Retirees 42 40
2017 £m
2016 £m
Actual return on assets 40.1 65.0
Expected contributions in following year 7.2 7.0
The expected interest income as at 31 December 2017 was 2.55%. This compares to the discount rate of 2.70% used in the
calculation of the interest income for the period ending 31 December 2016.
SECTION 5 - PENSION SCHEMES
5.1 Pension obligations continued
Total in the income statement
The expense is recognised in the following line items in the income statement:
2017 £m
2016 £m
Net interest on obligation 2.7 1.6
2017 £m
2016 £m
Finance costs 2.7 1.6
Based on the reported deficit of £62.8m at 31 December 2017 and the discount rate assumption of 3.25% the charge in 2018
is expected to be £2.0m.
Actuarial gains and losses recognised directly in the statement of other comprehensive income 2017 £m
2016 £m
Cumulative amount at 1 January (86.5) (25.2)
Recognised during the period 35.8 (61.3)
Cumulative amount at 31 December (50.7) (86.5)
Defined benefit income/(costs) recognised in statement of other comprehensive income
2017 £m
2016 £m
Difference between actual and expected interest income on scheme assets 28.4 49.9
Experience gain on scheme liabilities 4.9 5.2
Changes in assumptions underlying the present value of scheme obligations 2.5 (116.4)
35.8 (61.3)

140
SECTION 5 - PENSION SCHEMES
5.1 Pension obligations continued
2017 £m
2016 £m
Opening fair value of assets 441.4 396.9
Interest income 11.6 15.1
Return on plan assets, excluding interest income 28.4 49.9
Contributions by employer 7.3 3.1
Benefits paid (29.7) (23.6)
End of period 459.0 441.4
History of experience adjustments
2017 £m
2016 £m
2015 £m
2014 £m
2013 £m
Present value of defined benefit obligation 521.8 544.6 440.3 495.1 450.8
Fair value of scheme assets 459.0 441.4 396.9 428.7 407.4
Deficit in schemes 62.8 103.2 43.4 66.4 43.4
Experience adjustments on scheme liabilities:
Amount (7.4) 111.2 (22.9) 40.5 11.1
Percentage of scheme liabilities (%) (1.4%) 20.4% (5.2%) 8.2% 2.5%
Experience adjustments on scheme assets:
Amount 28.4 49.9 (0.5) 16.5 34.6
Percentage of scheme liabilities (%) 5.4% 9.2% (0.1%) 3.3% 7.7%
NOTES TO THE FINANCIAL STATEMENTS
Changes in the present value of the defined benefit obligation
2017 £m
2016 £m
Opening present value of defined benefit obligation 544.6 440.3
Interest cost 14.3 16.7
Remeasurements:
Experience adjustments (4.9) (5.2)
Actuarial (losses)/gains due to changes in demographic assumptions (4.7) 6.4
Actuarial gains due to changes in financial assumptions 2.2 110.0
Benefits paid (29.7) (23.6)
Closing present value of defined benefit obligation 521.8 544.6
Movement in fair value of scheme assets during the period

141
SECTION 6 - OTHER NOTES
This section contains the notes and information relating to acquisitions and disposals and related party transactions:
6.1 Business combinations 6.3 Related party transactions
6.2 Business disposals 6.4 Contingent liabilities and contingent assets
6.1 Business combinations
Accounting policy
The Group accounts for business combinations using the acquisition method when control is transferred to the Group (see
Basis of preparation in Section 1 above). The results of companies and businesses acquired during the year are included
from the effective date of acquisition.
Acquisitions on or after 1 January 2010
For acquisitions on or after 1 January 2010, the Group measures goodwill at the acquisition date as:
• the fair value of the consideration transferred; plus
• the recognised amount of any non-controlling interests in the acquiree; plus if the business combination is achieved in
stages, the fair value of the existing equity interest in the acquiree; less
• the net recognised amount (generally fair value) of the identifiable assets acquired and liabilities assumed.
When the excess is negative, a bargain purchase gain is recognised immediately in profit or loss.
The consideration transferred does not include amounts related to the settlement of pre-existing relationships. Such
amounts are generally recognised in profit or loss.
Costs related to the acquisition, other than those associated with the issue of debt or equity securities, that the Group incurs
in connection with a business combination are expensed as incurred.
Any contingent consideration payable is recognised at fair value at the acquisition date. If the contingent consideration is
classified as equity, it is not remeasured and settlement is accounted for within equity. Otherwise, subsequent changes to
the fair value of the contingent consideration are recognised in profit or loss.
When share based payment awards (replacement awards) are required to be exchanged for awards held by the acquiree’s
employees (acquiree’s awards) and relate to past services, then all or a portion of the amount of the acquirer’s replacement
awards is included in measuring the consideration transferred in the business combination. This determination is based on
the market based value of the replacement awards compared with the market based value of the acquiree’s awards and the
extent to which the replacement awards relate to past and/or future service.
Acquisitions between 1 January 2004 and 1 January 2010
For acquisitions between 1 January 2004 and 1 January 2010, goodwill represents the excess of the cost of the acquisition
over the Group’s interest in the recognised amount (generally fair value) of the identifiable assets, liabilities and contingent
liabilities of the acquiree. When the excess was negative, a bargain purchase gain was recognised immediately in profit or
loss.
Transaction costs, other than those associated with the issue of debt or equity securities, that the Group incurred in
connection with business combinations were capitalised as part of the cost of the acquisition.
Acquisitions prior to 1 January 2004 (date of transition to IFRSs)
As part of its transition to IFRSs, the Group elected to restate only those business combinations that occurred on or after
1 January 2003. In respect of acquisitions prior to 1 January 2003, goodwill represents the amount recognised under the
Group’s previous accounting framework, UK GAAP.

142
SECTION 6 - OTHER NOTES
6.1 Business combinations continued
Activity
On 26 September 2017 the Group acquired the trade and assets of a Chevrolet franchised dealership in California for a total
cash consideration paid on completion of £17.6m. The acquisition strengthens the Group’s franchise portfolio in the Los
Angeles area of California. In addition the Group acquired the entire ordinary share capital of Suresell Limited on 31 January
2017 for a total cash consideration paid on completion of £0.2m, for the purpose of securing a property lease.
The amounts recognised in the 2017 financial statements in respect of identifiable assets acquired and liabilities assumed
are:
Acquisition related costs are less than £0.1m and are included in administration expenses.
The goodwill acquired represents the excess of consideration paid over the fair value of identifiable assets and liabilities
and represents the expected benefits from aquiring a new franchise in the US. The purchased goodwill is expected to be
deductible for tax purposes over the life of the asset. A fair value adjustment of £1.3m was made to reflect the market value
of the property acquired in the Puente Hills acquisition. Management have conducted a review as to the value of other
intangible assets within the acquired businesses and have concluded that there are no significant items to recognise.
The acquired business in California contributed revenue of £12.3m and a profit before taxation of £0.3m in the period since
acquisition. Had the business been acquired at the start of the annual reporting period it would have contributed revenue
of £54.5m and a profit before taxation of £0.9m. The Suresell business contributed no revenue and a loss before taxation
of £0.6m which was also the result had the business been acquired at the start of the year.
During the prior year, on 6 July 2016, the Group acquired the trade and assets of the Jaguar franchised dealerships in
Cheltenham, Doncaster and Nottingham from Inchcape plc for a total cash consideration paid on completion of £0.5m. In
addition, on 31 October 2016 the Group acquired the trade and assets of the Newcastle Hyundai dealership from Lookers
plc for a total cash consideration paid on completion of £2.1m.
Book value £m
Fair value adjustments £m
Fair value £m
Financial assets:
Property, plant and equipment 12.9 (1.3) 11.6
Inventory 0.3 - 0.3
Receivables 0.2 - 0.2
Payables (0.4) - (0.4)
Total identifiable assets 13.0 (1.3) 11.7
Goodwill 4.8 1.3 6.1
Total consideration - satisfied in cash 17.8 - 17.8
NOTES TO THE FINANCIAL STATEMENTS

143
SECTION 6 - OTHER NOTES
6.2 Business disposals
Accounting policy
The results of businesses disposed of during the year are included up to the effective date of disposal using the acquisition
method of accounting.
Activity
During the year there were no business disposals.
Proceeds on sale satisfied by cash and cash equivalents for the previous period was £8.9m.
6.3 Related party transactions
Subsidiaries
The Group’s ultimate parent company is Pendragon PLC. A listing of subsidiaries is shown within the financial statements
of the company on page 151.
Transactions with key management personnel
The key management personnel of the Group comprise the executive and non-executive directors. The details of the
remuneration, long term incentive plans, shareholdings, share option and pension entitlements of individual directors are
included in the Directors’ Remuneration Report on pages 50 to 62.
Directors of the company and their immediate relatives control 2.31% of the ordinary shares of the company.
During the year key management personnel compensation was as follows:
6.4 Contingent liabilities and contingent assets
Separate to the amounts already provided for VAT, the Group is in discussion with HM Revenue and Customs over issues
which may result in additional amounts of VAT receivable to be recognised in future periods. These relate to historical
claims in respect of VAT overpaid in prior periods (‘Fleming claims’). Although these amounts, if any, could potentially be
significant, it is not possible at present to quantify them. Accordingly no amounts have been included in the 2017 financial
statements in respect of these issues.
2017 £m
2016 £m
Short term employee benefits 1.6 2.4
Post-employment benefits 0.2 0.3
Share based payments (0.6) 1.3
1.2 4.0

144COMPANY BALANCE SHEETAt 31 December 2017
note
2017 £m
2016 £m
Fixed assets
Investments 5 922.6 922.6
Loans to subsidiary undertakings 90.0 90.0
1,012.6 1,012.6
Current assets
Debtors 6 41.2 48.9
41.2 48.9
Creditors: amounts falling due within one year 7 (437.9) (441.8)
Net current liabilities (396.7) (392.9)
Total assets less current liabilities 615.9 619.7
Creditors: amounts falling due after more than one year 8 (175.7) (174.0)
Retirement benefit obligations (62.8) (103.2)
Net assets 377.4 342.5
Capital and reserves
Called up share capital 11 71.2 71.8
Share premium account 56.8 56.8
Capital redemption reserve 4.3 3.7
Other reserves 13.9 13.9
Profit and loss account 231.2 196.3
Equity shareholders' funds 377.4 342.5
Approved by the Board of Directors on 13 February 2018 and signed on its behalf by:
T G Finn
Chief Executive
T P Holden
Finance Director
Registered Company Number : 2304195
The notes on pages 147 to 154 form part of these financial statements.

145
2017 £m
2016 £m
Profit for the year 31.9 20.3
Other comprehensive income
Items that will never be reclassified to profit and loss:
Defined benefit plan remeasurement (gains) and losses 37.7 (59.4)
Income tax relating to defined benefit plan remeasurement gains and (losses) (6.1) 10.0
Other comprehensive income for the year, net of tax 31.6 (49.4)
Total comprehensive income for the year 63.5 (29.1)
COMPANY STATEMENT OF COMPREHENSIVE INCOMEYear ended 31 December 2017
The notes on pages 147 to 154 form part of these financial statements.

146
Share capital £m
Share premium £m
Capital redemption reserve £m
Other reserves £m
Retained earnings £m
Total £m
Balance at 1 January 2017 71.8 56.8 3.7 13.9 196.3 342.5
Total comprehensive income for 2017
Profit for the year - - - - 31.9 31.9
Other comprehensive income for the year, net of tax - - - - 31.6 31.6
Total comprehensive income for the year - - - - 63.5 63.5
Transactions with owners, recorded directly in equity
Own shares purchased for cancellation (0.6) - 0.6 - (4.0) (4.0)
Own shares purchased by EBT - - - - (2.8) (2.8)
Own shares issued by EBT - - - - 0.1 0.1
Share based payments - - - - (0.6) (0.6)
Dividends paid (see note 4) - - - - (21.3) (21.3)
Total contributions by and distributions to owners (0.6) - 0.6 - (28.6) (28.6)
Balance at 31 December 2017 71.2 56.8 4.3 13.9 231.2 377.4
Balance at 1 January 2016 73.0 56.8 2.5 13.9 252.4 398.6
Total comprehensive income for 2016
Profit for the year - - - - 20.3 20.3
Other comprehensive income for the year, net of tax - - - - (49.4) (49.4)
Total comprehensive income for the year - - - - (29.1) (29.1)
Transactions with owners, recorded directly in equity
Own shares purchased for cancellation (1.2) - 1.2 - (7.5) (7.5)
Own shares purchased by EBT - - - - (0.3) (0.3)
Own shares issued by EBT - - - - 0.1 0.1
Share based payments - - - - 1.3 1.3
Income tax relating to share based payments - - - - (0.3) (0.3)
Dividends paid (see note 4) - - - - (20.3) (20.3)
Total contributions by and distributions to owners (1.2) - 1.2 - (27.0) (27.0)
Balance at 31 December 2016 71.8 56.8 3.7 13.9 196.3 342.5
COMPANY STATEMENT OF CHANGES IN EQUITY Year ended 31 December 2017
The notes on pages 147 to 154 form part of these financial statements.

147NOTES TO THE FINANCIAL STATEMENTS OF THE COMPANY
1 Accounting policies
(a) Basis of preparation Pendragon PLC is a company incorporated and domiciled in the UK.
These financial statements were prepared in accordance with Financial Reporting Standard 101 Reduced Disclosure
Framework (‘FRS 101’). The amendments to FRS 101 (2015/16 Cycle) issued in July 2016 have been applied.
In preparing these financial statements, the Company applies the recognition, measurement and disclosure requirements
of International Financial Reporting Standards as adopted by the EU (‘Adopted IFRSs’), but makes amendments where
necessary in order to comply with Companies Act 2006 and has set out below where advantage of the FRS 101 disclosure
exemptions has been taken.
In these financial statements, the Company has applied the exemptions available under FRS 101 in respect of the following
disclosures:
• a Cash Flow Statement and related notes;
• Comparative period reconciliations for share capital, tangible fixed assets and intangible assets;
• Disclosures in respect of transactions with wholly owned subsidiaries;
• Disclosures in respect of capital management;
• The effects of new but not yet effective IFRSs;
• Disclosures in respect of the compensation of Key Management Personnel.
• Disclosures of transactions with a management entity that provides key management and personnel services to the
company.
As the consolidated financial statements of the Company include the equivalent disclosures, the Company has also taken
the exemptions under FRS 101 available in respect of the following disclosures:
• IFRS 2 Share Based Payments in respect of group settled share based payments;
• Certain disclosures required by IFRS 13 Fair Value Measurement and the disclosures required by IFRS 7 Financial Instrument
Disclosures.
The accounting policies set out below have, unless otherwise stated, been applied consistently to all periods presented in
these financial statements.
Estimates and Judgements
The preparation of financial statements in conformity with FRS 101 requires the use of certain critical accounting estimates.
It also requires management to exercise its judgement in the process of applying the Company’s accounting policies. The
areas involving a higher degree of judgement or complexity, or areas where assumptions and estimates are significant to
the financial statements are:
- note 5 - The subsidiary companies’ investment balances are held at cost less any impairment. It is considered that the
Group subsidiaries investments are one CGU. An impairment exists when their recoverable amount is less than the costs
held in the accounts. There are a number of factors which could impact the recoverable amount which creates a risk of this
recoverable amount being lower than the investment balance held.
- notes 6 & 9 - tax liability and recognition of deferred tax assets. The actual tax on the Company’s profits is determined
according to complex laws and regulations. Where the effect of these laws and regulations is unclear, estimates are used
in determining the liability for the tax to be paid on profits which are recognised in the financial statements. The Company
considers the estimates, assumptions and judgements to be reasonable but this can involve complex issues which may take
a number of years to resolve. The final determination of tax liabilities could be different from the estimates reflected in the
financial statements. Deferred tax assets and liabilities require management judgement in determining the amounts to be
recognised. In particular, judgement is used when assessing the extent to which deferred tax assets should be recognised
with consideration given to the timing and level of future taxable income.
- note 12 - retirement benefit obligations. The Pendragon Group Pension Scheme typically exposes the Company to actuarial
risks such as investment risk, interest rate risk, mortality risk and longevity risk. A decrease in corporate bond yields, a
rise in inflation or an increase in life expectancy would result in an increase to scheme liabilities. This would detrimentally
impact the balance sheet position and may give rise to increased charges in future income statements. This effect would
be partially offset by an increase in the value of the scheme’s bond holdings. Additionally, caps on inflationary increases
are in place to protect the scheme against extreme inflation. The assumptions used by the actuary are the best estimates
chosen from a range of possible actuarial assumptions which, due to the timescale covered, may not necessarily be borne
out in practice.

148
1 Accounting policies continued
(b) Deferred taxation Full provision is made for deferred taxation on all timing differences which have arisen but have not
reversed at the balance sheet date, except as follows:
(i) tax payable on the future remittance of the past earnings of subsidiaries is provided only to the extent that dividends
have been accrued as receivable or a binding agreement to distribute all past earnings exists;
(ii) deferred tax assets are recognised only to the extent that it is more likely than not that they will be recovered.
Deferred tax is measured on a non-discounted basis at the tax rates that are expected to apply in the periods in which the
timing differences reverse, based on tax rates and laws substantively enacted at the balance sheet date.
(c) Financial instruments The Company holds derivative financial instruments to hedge currency and interest risks arising
from its activities. Derivative financial instruments are recognised at fair value. Any gain or loss on remeasurement is
recognised in the profit and loss account. However, the treatment of gains or losses arising from derivatives which qualify
for hedge accounting depends on the nature of the hedged item itself. The fair value of derivatives is the estimated amount
receivable or payable to terminate the contract determined by reference to the market prices prevailing at the balance
sheet date.
Fair value hedges
Where a derivative financial instrument hedges the changes in fair value of recognised assets or liabilities, any gain or loss
is recognised in profit and loss. The hedged item is also stated, separately from the derivative, at fair value in respect of the
risk being hedged with any gain or loss also recognised in profit and loss. This will result in variations in the balance sheet
values of the gross debt and the offsetting derivatives as the market value fluctuates.
(d) Investments Investments held as fixed assets are stated at cost less any impairment losses. For Investments the
recoverable amount is estimated at each balance sheet date. The recoverable amount is the higher of fair value less costs to
sell and value in use. In assessing value in use, the estimated future cash flows are discounted to their present value using a
pre-tax discount rate that reflects current market assessments of the time value of money and the risks specific to the asset
for which the estimates of future cash flows have not been adjusted.
(e) Employee benefits – Share based payments The Company operates a number of employee share option schemes.
The fair value at the date at which the share options are granted is recognised in profit and loss on a straight line basis over
the vesting period, taking into account the number of options that are expected to vest. The number of options that are
expected to become exercisable is reviewed at each balance sheet date and if necessary estimates are revised.
(f) Pension obligations The Company operated a defined benefit and defined contribution plan during the year, the
assets of which are held in independent trustee administered funds. Pension accounting costs for defined benefit plans
are assessed by determining the pension obligation using the projected unit credit method after including a net return
on the plan assets. Under this method, in accordance with the advice of qualified actuaries, the amounts charged in
respect of employee benefits reflect the cost of benefits accruing in the year and the cost of financing historical accrued
benefits. The company recognises all actuarial gains and losses arising from defined benefit plans in the statement of other
comprehensive income immediately.
The present value of pension obligations is measured by reference to market yields on high quality corporate bonds which
have terms to maturity approximating to the terms of the related pension liability. Plan assets are measured at fair value.
When the calculation results in a benefit to the Company, the recognised asset is limited to the total of the present value
of economic benefits available in the form of any future refunds from the plan or reductions in future contributions to the
plan. An economic benefit is available to the Company if it is realisable during the life of the plan, or on settlement of the
plan liabilities.
Under IAS 19 Employee Benefits, the Group recognises an interest expense or income which is calculated on the net defined
benefit liability or asset respectively by applying the discount rate to the net defined benefit liability or asset.
A defined contribution plan is one under which the Company pays fixed contributions and has no legal or constructive
obligation to pay further amounts. Obligations for contributions to defined contribution pension plans are recognised as an
employee benefit expense in the income statement when they are due.
NOTES TO THE FINANCIAL STATEMENTS OF THE COMPANY

149
1 Accounting policies continued
(f) Pension obligations continued In accordance with IFRIC 14 surpluses in schemes are recognised as assets only if
they represent unconditional economic benefits available to the Company in the future. Provision is made for future
unrecognisable surpluses that will arise as a result of regulatory funding requirements. Movements in unrecognised
surpluses are included in the statement of recognised income and expense. If the fair value of the assets exceeds the
present value of the defined benefit obligation then the surplus will only be recognised if the nature of the arrangements
under the trust deed, and funding arrangements between the Trustee and the Company support the availability of refunds
or recoverability through agreed reductions in future contributions. In addition, if there is an obligation for the Company to
pay deficit funding, this is also recognised.
Under the provisions of FRS 101 Pendragon PLC is designated as the principal employer of the Pendragon Group Pension
Scheme and as such applies the full provisions of IAS 19 Employee benefits (2011). In line with IAS 19 Employee benefits
(2011), the Company has recognised a pension prepayment with respect to an extraordinary contribution made during
31 December 2011 as this does not meet the definition of a planned asset and therefore the amount is held in pension
prepayment and will be unwound over the period in which Scottish Limited Partnership Limited makes contributions to the
pension scheme.
Information relating to pension obligations can be found in the Consolidated Financial Statements in note 5.1.
(g) Dividends Dividends proposed by the Board and unpaid at the end of the year are not recognised in the financial
statements until they have been approved by the shareholders at the Annual General Meeting. Interim dividends are
recognised when they are paid.
(h) Own shares held by ESOP trust Transactions of the group-sponsored ESOP trust are included in the Company financial
statements. In particular, the trust’s purchases and sales of shares in the Company are debited and credited directly to
equity.
(i) Contingent liabilities Where the Company enters into financial guarantee contracts to guarantee the indebtedness of
other companies within its group, the Company considers these to be insurance arrangements, and accounts for them as
such. In this respect, the Company treats the guarantee contract as a contingent liability until such time as it becomes
probable that the Company will be required to make a payment under the guarantee.
2 Profit and loss account of the Company and distributable reserves
In accordance with the exemption allowed by Section 408 of the Companies Act 2006, the profit and loss account of the
Company is not presented. The profit after taxation attributable to the Company dealt with in its own accounts for the year
ended 31 December 2017 is £31.9m (2016: £20.3m).
The profit and loss account of the Parent Company does not include any unrealised profits. The amount available for
distribution under the Companies Act 2006 by reference to these accounts is £231.2m (2016: £196.3m) which is stated after
deducting the ESOT reserve of £18.2m (2016: £15.5m). The Group’s subsidiary companies which earn distributable profits
themselves are expected to make distributions each year up to the Parent Company in due course to ensure a regular flow
of income to the Company such that surplus cash generated can continue to be returned to our external shareholders.
3 Directors
Total emoluments of directors (including pension contributions) amounted to £1.8m (2016: £2.7m). Information relating to
directors’ emoluments, share options and pension entitlements is set out in the Directors’ Remuneration Report on pages
50 to 62.
The directors are the only employees of the Company.

150
2017 £m
2016 £m
Ordinary shares
Final dividend in respect of 2016 of 0.75p per share (2015: 0.7p per share) 10.7 10.2
Interim dividend in respect of 2017 of 0.75p per share (2016: 0.7p per share) 10.6 10.1
21.3 20.3
The Board is recommending a final dividend for 2017 of 0.8p (2016: 0.75p) per ordinary share equating to £11.3m in total in
respect of shares in issue at the date of this report (2016: £10.7m).
5 Investments
Shares in subsidiary undertakings £m
At 31 December 2016 and at 31 December 2017 922.6
4 Dividends
Shares in subsidiary undertakings are stated at cost. Pendragon PLC owns directly or indirectly 100 percent of the issued
ordinary share capital of the following subsidiaries.
The investment has been tested against the expected cashflows of the business to establish the value in use of this
investment. The assumptions in the forecasts are based on projecting into perpetuity the forecasts of the key drivers of the
business. These drivers are based on the key assumptions for the aftersales, used and new sectors. These forecasts have
been approved by the directors and form the basis of the growth assumptions for future cash flows from 2018 to 2021. The
growth rates are considered to be at or below long term market trends for the Group’s business. The investment of the
Company has been reviewed against our value-in-use calculation and this does not highlight any impairment in 2017.
NOTES TO THE FINANCIAL STATEMENTS OF THE COMPANY

151
Alloy Racing Equipment LimitedBramall Quicks Dealerships LimitedCD Bramall Dealerships LimitedChatfields LimitedDerwent Vehicles LimitedEvans Halshaw LimitedNational Fleet Solutions LimitedPendragon Vehicle Management LimitedPendragon Finance & Insurance Services LimitedPendragon Management Services LimitedPendragon Motor Group Limited Pendragon Premier LimitedPendragon Property Holdings LimitedPendragon Sabre LimitedPinewood Technologies PLC *Pendragon Used Cars LimitedReg Vardy (MML) LimitedReg Vardy (VMC) Limited **Reg Vardy Limited *Stratstone Limited Stripestar LimitedVictoria (Bavaria) LimitedChatfields - Martin Walter LimitedPendragon Group Services LimitedPendragon Overseas LimitedPendragon Stock LimitedPendragon Stock Finance LimitedVardy Contract Motoring LimitedVardy Marketing LimitedPendragon Limited Partner LimitedBramall Quicks LimitedCD Bramall LimitedThe Car Store LimitedExecutive Motor Group LimitedStratstone Motor Holdings LimitedPetrogate LimitedReg Vardy (Property Management) LimitedReg Vardy (TMC) LimitedReg Vardy (TMH) LimitedEvans Halshaw.com LimitedPendragon Automotive Services LimitedStratstone.com LimitedVardy (Continental) LimitedPendragon Group Pension Trustees LimitedAllens (Plymouth) LimitedAMG LimitedAndre Baldet LimitedArena Auto LimitedAutomend LimitedBerkhamsted Motor Company LimitedBletchley Motor Company LimitedBletchley Motor Contracts LimitedBletchley Motor Group LimitedBletchley Motor Rentals LimitedBletchley Motors Car Sales LimitedBletchley Properties LimitedBoxmoor Motors LimitedBramall Contracts LimitedBridgegate LimitedBrightdart LimitedBuist Manor LimitedC P Evinson LimitedC.G.S.B Holdings LimitedCalmoon Limited
Canitanel Consulting LimitedCD Bramall Motor Group LimitedCD Bramall Pensions LimitedCD Bramall Pension Trustee LimitedCD Bramall York LimitedCentral Motor Company (Leicester) LimitedCharles Douglas Dealerships LimitedCharles Sidney Holdings LimitedCharles Sidney LimitedChelmhill Motors LimitedClarks Garage (Narborough) LimitedComet Vehicle Contracts LimitedContim Harrow LimitedCumbria Vehicles LimitedDavenport Vernon Beaconsfield LimitedDavenport Vernon Berkshire LimitedDavenport Vernon Finance LimitedDavenport Vernon Milton Keynes LimitedDavenport Vernon Nissan LimitedDavenport Vernon Northfield LimitedDavenport Vernon Oxford LimitedDavenport Vernon Reading LimitedDavenport Vernon Watford LimitedDavenport Vernon Welwyn Garden City LimitedDavid Ruskin LimitedDavies Holdings LimitedDunham & Haines LimitedEvans Halshaw (Cardiff) LimitedEvans Halshaw (Chesham) LimitedEvans Halshaw (Dormants) LimitedEvans Halshaw (Halifax) LimitedEvans Halshaw (Macclesfield) LimitedEvans Halshaw (Midlands) LimitedEvans Halshaw (Sussex) LimitedEvans Halshaw (The Wirral) LimitedEvans Halshaw Group Pension Trustees LimitedEvans Halshaw Motor Holdings LimitedEvans Halshaw Vehicle Management Services LimitedEvinson Tractors LimitedExcalibur Motor Finance LimitedExecutive Motor Group LimitedExecutive Motors (Stevenage) LimitedExtra Rentals LimitedFolletts LimitedFord Parts LimitedG.E. Harper LimitedGelderd Road Eight LimitedGiltbase LimitedGodfrey Davis (London) LimitedGodfrey Davis (Trust) LimitedGodfrey Davis Motor Group LimitedHemel Hempstead Motors LimitedKingston Reconditioning Services LimitedLeveling LimitedLewcan LimitedLongton Garages LimitedManchester Garages (Cars) LimitedManchester Garages Holdings LimitedManchester Garages LimitedMerlin (Chatsworth) LimitedMiles (Chesham) LimitedMotors Direct LimitedMotown Limited
Munn & Chapman LimitedMunn Holdings LimitedNeville (EMV) LimitedNewport (Gwent) Motor Company LimitedNorthside Truck Centre LimitedOggelsby’s LimitedP J Evans (Holdings) LimitedParamount Cars LimitedParkhouse Garage (Newcastle) LimitedPendragon Company Car Finance LimitedPendragon Demonstrator Finance LimitedPendragon Demonstrator Finance November LimitedPendragon Demonstrator Sales LimitedPendragon Extra LimitedPetrogate Properties LimitedPinewood Computers LimitedPlumtree Motor Company LimitedPortmann LimitedPremier Carriage LimitedPremier Parts LimitedQuicks (1997) Motor Holdings LimitedQuicks (1997) Properties LimitedQuicks Finance LimitedReades of Telford LimitedRegency Automotive LimitedReg Vardy (AMC) LimitedReg Vardy (DWSB) LimitedReg Vardy (EBT) LimitedReg Vardy (MMC) LimitedReg Vardy (Property Management) LimitedReg Vardy (Rentals) LimitedReg Vardy (RTL) LimitedRossleigh LimitedRudds LimitedSanderson Murray & Elder LimitedSkipper of Aintree LimitedSkipper of Burnley LimitedSkipper of Cheltenham LimitedSkipper of Darlington LimitedSkipper of Northallerton LimitedSkipper of Plymouth LimitedSkipper of Sheffield LimitedSkipper of Torbay LimitedSkipper of Wakefield LimitedSM & E Properties LimitedStorm of Leicester LimitedStrattons (Service) LimitedStrattons (Wilmslow) LimitedSuresell LimitedTamplins LimitedThe Mcgill Group LimitedThe Skipper Group LimitedTins LimitedTrust Advertising LimitedTrust Developments LimitedTrust Holidays LimitedTrust Motors LimitedTrust Properties LimitedTyne Tees Properties LimitedUnited Motor Group LimitedVenture (RVL) LimitedVertcell LimitedWayahead Fuel Services Limited
Pendragon North America Automobiles, Inc.Penegon West, Inc.Penegon Mission Viejo, Inc.Penegon Newport Beach, Inc.
Penegon Glendale, Inc.Lincoln Irvine, IncPenegon South Bay, IncPenegon Santa Monica, Inc
South County, IncBauer Motors, IncPenegon Properties, IncPenegon East,Inc.
* Direct subsidiary of Pendragon PLC** Pendragon PLC owns 95% of the issued ordinary share capital
Incorporated in Great Britain having a registered office at Loxley House, 2 Little Oak Drive, Annesley, Nottingham, NG15 0DR:
Incorporated in Great Britain having a registered office at Citypoint, 65 Haymarket Terrace, Edinburgh, EH12 5HD:
Pendragon General Partner Limited
Incorporated in Great Britain having a registered office at 221 Windmillhill Street, Motherwell, Lanarkshire, ML1 2UB:
Reg Vardy (Aberdeen) LimitedReg Vardy (MME) Limited
Trust Motors (Glasgow) LimitedTrust Motors (Motherwell) Limited
Incorporated in Great Britain having a registered office at 1 Forth Avenue, Kirkcaldy, Fife, KY2 5PS:
Bramall Laidlaw Limited
Incorporated in the United States of America having a registered office at 2171 Campus Drive Suite 260, Irvine, California, 92612:
Incorporated in Germany having a registered office at 40210 Düsseldorf, Nordrhein-Westfalen, Germany:
Pendragon Overseas Holdings, GmbH.
5 Investments continued

152
6 Debtors
2017 £m
2016 £m
Amounts due within one year:
Prepayments 29.9 30.8
29.9 30.8
Amounts due after more than one year
Deferred tax (see note 9) 11.3 18.1
11.3 18.1
41.2 48.9
7 Creditors: amounts falling due within one year
2017 £m
2016 £m
Amounts due to subsidiary undertakings 407.5 436.6
Bank loans and overdrafts 30.4 5.2
437.9 441.8
8 Creditors: amounts falling due after more than one year
2017 £m
2016 £m
Bank loans (repayable between two and five years) 115.7 114.0
5.75% Senior notes 2023 60.0 60.0
175.7 174.0
Full details of the Company’s borrowings including security and maturity are given in note 4.2 to the consolidated financial
statements.
NOTES TO THE FINANCIAL STATEMENTS OF THE COMPANY

153
Number
£m
Allotted, called up and fully paid shares of 5p each at 31 December 2016 1,436,896,960 71.8
Shares cancelled during the year (12,082,956) (0.6)
Allotted, called up and fully paid shares of 5p each at 31 December 2017 1,424,814,004 71.2
9 Deferred tax
Deferred income tax assets and liabilities are offset when there is a legally enforceable right to offset current tax assets
against current tax liabilities and when the deferred income taxes relate to the same fiscal authority. There are no offset
amounts as follows:
2017 £m
2016 £m
Deferred tax assets 11.3 18.1
Retirement benefit obligations £m
Other provisions £m
Total £m
At 1 January 2016 7.8 0.7 8.5
(Charged) to income statement (0.1) - (0.1)
Credited/(charged) to equity 10.0 (0.3) 9.7
At 31 December 2016 17.7 0.4 18.1
At 1 January 2017 17.7 0.4 18.1
(Charged)/credited to income statement (0.8) 0.1 (0.7)
(Charged) to equity (6.1) - (6.1)
At 31 December 2017 10.8 0.5 11.3
The movements in the deferred tax asset for the year are as follows:
Deferred tax asset is shown within debtors (see note 6).
10 Share based payments
Details of share schemes in place for the Group of which the Company participates as at 31 December 2017 are fully
disclosed above in note 4.6 of this report.
11 Called up share capital

154
11 Called up share capital continued
There were no issues of ordinary shares during the year.
12,082,956 ordinary shares having a nominal value of £0.6m were bought back and subsequently cancelled during the year
in accordance with the authority granted by shareholders in the Annual General Meeting on 27 April 2017. The aggregate
consideration paid, including directly attributable costs, was £4.0m.
Movements in the number of options to acquire ordinary shares under the Group’s various share option schemes, together
with exercise prices and the outstanding position at 31 December 2017 are fully disclosed above in note 4.6 of this report.
The market value of the investment in the Company’s own shares at 31 December 2017 was £2.2m (2016: £2.3m), being
7.7m (2016: 7.5m) shares with a nominal value of 5p each, acquired at an average cost of £0.33 each (2016: £0.32). During
the year the trust acquired 8.3m (2016: 0.8m) shares for a consideration of £2.8m (2016: £0.3m) and disposed of 8.1m
(2016: 4.5m) shares in respect of LTIP and executive share option awards for a consideration of £0.1m (2016: £0.1m). The
amounts deducted from retained earnings for shares held by the EBT at 31 December 2017 was £18.2m (2016: £15.5m).
The trustee of the EBT is Salamanca Group Trust (Jersey) Limited. The shares in trust may subsequently be awarded to
Executive Directors and employees under the Pendragon 1999 Approved Executive Share Option Scheme, Pendragon 1999
Unapproved Executive Share Option Scheme and to satisfy amounts under LTIPs and the VCP. Details of the plans are
given in the Directors’ Remuneration Report on pages 50 to 62.
Dividends on the shares owned by the trust, the purchase of which were funded by interest free loans to the trust from
Pendragon PLC, are waived. All expenses incurred by the trust are settled directly by Pendragon PLC and charged in the
accounts as incurred.
12 Retirement benefit obligations
Details of Pendragon Group Pension Scheme are fully disclosed above in note 5.1 of this report.
13 Related party transactions
Identity of related parties
The Company has related party relationships with its subsidiaries, its joint venture and with its key management
personnel.
Transactions with related parties
The transaction with directors of the Company are set out in note 6.3 to the consolidated financial statements.
14 Contingent liabilities
(a) The Company has entered into cross-guarantees with its bankers whereby it guarantees payment of bank borrowings
in respect of UK subsidiary undertakings.
(b) The Company has given performance guarantees in the normal course of business in respect of subsidiary undertaking
obligations.
NOTES TO THE FINANCIAL STATEMENTS OF THE COMPANY

155
Share dealing service
Pendragon’s company registrar offers a share dealing
service, provided by Link Asset Services (a trading name of
Link Market Services). Details appear at www.linksharedeal.
com
Shareholder and investor information
Making some of our corporate materials and policies
available on our website reduces the length of this report.
This year we have placed certain background information
on policy and governance on our website. We also display
historic financial reports and have a section on company
news, which we regularly update on www.pendragonplc.
com
Online services
Shareholders can choose to receive communications and
access a variety of share-related services online via the
share portal offered by Pendragon’s company registrar.
This allows shareholders to manage their shareholding
electronically and is free of charge. For details, visit www.
mypendragonshares.com
Getting company reports online
Reduces the environmental impacts of report distribution.
To choose online only reporting, visit the share portal
and register for electronic form reporting, or contact our
registrar, whose details are:
Registrar and shareholder enquiries
Link Asset Services
The Registry
34 Beckenham Road
Beckenham
Kent
BR3 4TU
Tel: 0871 664 0300
ADVISORS, BANKS AND SHAREHOLDER INFORMATION
Financial Calendar 2018
13 February date of this Report
13 February preliminary announcement of 2017 results
19 April ex-dividend date 2017 proposed final dividend
20 April record date 2017 proposed final dividend
23 May payment of proposed 2017 final dividend
20 September ex-dividend date interim dividend 2018
21 September record date 2018 interim dividend
23 October payment of 2018 interim dividend
Auditor
KPMG LLP
Banks
Barclays Bank PLC
Lloyds TSB Bank plc
Royal Bank of Scotland plc
Allied Irish Banks plc
HSBC Bank plc
Stockbrokers
Joh. Berenberg, Gossler & Co. KG
Jefferies International Limited
Solicitors
CMS Cameron McKenna LLP
Geldards LLP
Eversheds LLP
How to find Pendragon PLC’s offices
Visit Contacts on the company’s website
www.pendragonplc.com
Stock Classification
The company’s ordinary shares are traded on the London
Stock Exchange. Investment codes for Pendragon’s shares
are:
London Stock Exchange: PDG
Bloomberg: PDG.LN
GlobalTOPIC and Reuters: PDG.L

156
note 1 Net borrowings comprise interest bearing loans and borrowings, cash and cash equivalents and derivative financial instruments.
note 2 Total operating margin is calculated after adding back non-underlying items, and excluding other income.
note 3 Return on equity is profit after tax for the year as a percentage of average shareholders’ funds.
note 4 Basic earnings per share adjusted to eliminate the effects of non-underlying operating, non-underlying finance and tax items, see note 2.8 of the financial
statements.
note 5 Dividends per share are based on the interim dividend paid and final dividend proposed for the year.
note 6 Full details of the calculation of the net debt : underlying EBITDA ratio are given in note 4.2 to the financial statements.
note 7 Gearing is calculated as net borrowings as a percentage of net assets.
5 YEAR GROUP REVIEW
2017 £m
2016 £m
2015 £m
2014 £m
2013 £m
Revenue 4,739.1 4,537.0 4,453.9 4,000.4 3,848.9
Gross profit 552.9 559.6 548.9 522.6 499.9
Operating profit before other income 91.5 100.1 96.4 89.8 77.5
Profit before taxation 65.3 73.0 79.0 64.6 38.9
Basic earnings per share 3.7p 3.8p 5.0p 3.5p 2.8p
Net assets 425.4 372.8 395.1 339.9 305.2
Net borrowings (note 1) 124.1 91.7 79.6 108.8 139.6
Other financial information
Underlying profit before tax 60.4 75.4 70.1 60.2 44.2
Underlying earnings per share (note 4) 3.3p 3.9p 3.7p 3.1p 2.3p
Net debt : underlying EBITDA (note 6) 0.9 0.6 0.5 0.8 1.2
Gross margin 11.7% 12.3% 12.3% 13.1% 13.0%
Total operating margin (note 2) 1.8% 2.2% 2.3% 2.2% 2.0%
After tax return on equity (note 3) 13.4% 14.5% 19.8% 15.4% 14.2%
Dividends per share (note 5) 1.55p 1.45p 1.3p 0.9p 0.4p
Dividend cover (times) 2.4 2.7 3.9 3.8 6.9
Interest cover (times) 3.5 3.7 2.9 3.0 2.0
Gearing (note 7) 29.2% 24.6% 20.1% 32.0% 45.7%
Business summary
Number of franchise points 194 196 200 213 225

ADDRESS: Pendragon PLC, Loxley House, Little Oak Drive, Annesley, Nottingham, NG15 0DR
TELEPHONE: 01623 725200 E-MAIL: [email protected]
WEBSITE: www.pendragonplc.com
DESIGN: Creative Services, Loxley House, Little Oak Drive, Annesley, Nottingham, NG15 0DR