Embed Size (px)
Citation preview

2017ANNUALREPORT
General Electric Company41 Farnsworth StreetBoston, MA 02210www.ge.com 3.EPC055148101A.108
GE 2017 A
nnual Report

ETHISPHERE
World’s Most Ethical Companies
FAST COMPANY
Most Innovative Companies
FORTUNE
World’s Most Admired Companies
HUMAN RIGHTS CAMPAIGN
Best Places to Work
INTERBRAND
Best Global Brands
WORKING MOTHER
Best Companies for Working Mothers
Visit our online annual report at www.ge.com/ar2017
Thanks to the customers, partners and GE employees who appear in this annual report for contributing their time and support.
The majority of the power utilized to manufacture this paper was renewable energy, produced with GE’s wind and biogas technologies, and powered by GE steam engines and turbine engines. The manufacturing facility that produced this report is an EPA GreenPower Partner and is solar powered.
COVER, BACK COVER: The front and back covers of this report feature GE employees, some of whom were recognized in 2017 for their breakthrough innovations, technical excellence, customer impact, and inspiring leadership. These employees include:
Ruben Fairman GE AdditiveDaniel Osgood GE AviationMichael Weimer GE AviationJacey Welsh GE Aviation
Massimo Giannozzi Baker Hughes, a GE companyMichelle Wu GE CapitalWilliam Beers Current, powered by GEMohamedraed Hergli GE Global Growth Organization
Gwenola Muller de Morogues GE Global Operations & GE PowerKristen Brosnan GE Global ResearchMiriam Balstad GE HealthcareAndreas Meijer GE Healthcare
Sarah Bonnett GE HealthcareBob Senzig GE HealthcareNicholas Miller GE PowerWilliam Miller GE Power
John-T Olesen GE Renewable EnergyJingjun (JJ) Zhang GE TransportationAshfaq Nainar GE TransportationJennine Sullivan GE Ventures
GE is consistently ranked as one of the world’s leading corporations:
Des
ign
by A
ddis
on w
ww
.add
ison
.com
Pr
intin
g by
Alli
ed P
rintin
g Se
rvic
es
GELISTEDNYSE
I will do the same with investors. When I look back at 2017, there’s no doubt: GE had a very tough year.
Revenues were down 1% at $122.1 billion, and we delivered $(0.68) in earnings per share (EPS) on a GAAP basis. Excluding charges for insurance-related items, U.S. tax reform, and industrial portfolio actions, EPS was at the low end of our reduced guidance for the year, at $1.05.1 In 2017, GE returned $12.1 billion to investors through dividends and buyback.
While most of our businesses delivered solid—and, in the cases of Aviation and Healthcare, world-class—performances, our cash flow was challenging. We took significant charges at Capital and Power Conversion and made painful cuts to GE’s dividend and employment. We lost some of the intense focus on operations and rigorous execution that have been GE’s hallmarks for generations.
Many people have lost faith in us. I have not. As difficult as 2017 was for everyone connected with GE, it was also a chance to reflect on what this Company means and why it exists.
DEAR INVESTORS, CUSTOMERS, PARTNERS, AND EMPLOYEES:On August 1, 2017, my first day as CEO, our more than 300,000 employees had an email from me waiting in their inboxes. In it, I promised that I would “always own up to what is going well and what is not.”
1. Industrial Operating + Verticals EPS adjusted to exclude significant charges taken in the fourth quarter including GE Capital insurance-related charges of $0.91 per share, tax reform-related charges of $0.40 per share, and Industrial portfolio-related charges of $0.18 per share.
GE 2017 ANNUAL REPORT 1
I want to be very clear on one thing: While I am not proud of our performance, I am incredibly proud of this Company. Our technology solves the world’s toughest problems. We fight for and support our customers in more than 180 countries. We innovate and drive new industrial paradigms like additive manufacturing and software and analytics. We launch products that lead in their industries. We operate with the highest integrity and commitment to compliance. We invest in our leaders and in developing global, diverse talent. And our employees dedicate themselves day in and day out to fulfilling GE’s mission.
If anything gives me faith in our future, it is the passion and resolve of our teams. On one level, many of them are disappointed and frustrated. I get that. On another level, I see a competitive drive aflame in them. The passion to be the best we can be for our customers. To win in the marketplace. To fight for our reputation. People who bet against that do so at their own peril.
We have a lot to work on, but we have a lot to work with.
I have talked very publicly about what I think the challenges have been at GE. The power and oil and gas markets were tough. Our metrics were too focused on EPS and operating profit and not enough on cash. We lost too much of our focus on operating rigor and discipline. And even though our teams had sustained track records of success in challenging times, hindsight suggests that we might have benefited from more debate about challenges in our tougher markets and a more skeptical assessment of the risks they posed.
Some of the people who follow the Company closely, like media and analysts, examine the past and demand accountability. I understand this. Our leadership team, Board, and employees have devoted meaningful time to identifying lessons we ought to learn and how we ought to be applying them. History teaches that you cannot move forward effectively and with purpose until you truly understand what happened in the past.
Our eyes are wide open. We already have made significant changes across our leadership teams at Corporate and Power and will continue to hold every member of every team at GE accountable for the type of performance to which our shareholders are entitled. That said, how the Company is being portrayed in certain quarters is overwrought and, in most cases, does not reflect the reality of GE that our customers and employees are seeing around the world.
For our investors and many others, this is a “show me” moment. We need to explain to you what moving forward looks like and what we’ll do differently to build a stronger GE. In a lot of ways, this feels familiar to what I saw when I
How we are building a stronger GE
DELIVER OUTCOMES FOR CUSTOMERS
STRENGTHEN OUR BUSINESSES TO THRIVE IN THE DECADES AHEAD
RUN THE COMPANY FOR CASH
DRIVE A CULTURE OF CANDOR AND ACCOUNTABILITY IN OUR TEAMS
1
2
3
4
2 GE 2017 ANNUAL REPORT
became the CEO of Healthcare and the business had been struggling. There are things we need to fix. But we can. We know how to. And we will.
Our primary focus must be on delivering outcomes. We don’t define that solely by the number of gas turbines, wind turbines, jet engines, or CT scanners we manufacture. The ultimate purpose of our work is the children in distant villages who get access to electricity for the first time, the travelers who get home safely, and the patients who receive better diagnoses and treatments in the moments that matter most. When our teams understand customer needs and deliver outcomes for them, we always end up in a good place for our employees and our owners.
The center of gravity in the Company needs to be the business units. We will support them from the center only where we clearly and demonstrably add value—like shared research and technology, shared services, global footprint, brand, and leadership development. We completed a zero-based budget review of our Corporate operations, and in 2017 we reduced Corporate costs by $0.5 billion. We will cut more in 2018. I am determined to explore every avenue and option to make sure our businesses have the resources and flexibility to maximize their potential in the years to come.
This includes revisiting the Company’s structure. We know that we can improve by running our businesses better within our current structure. The more fundamental question we must examine is whether there are other ways that would allow us to achieve even better results. Would different structures open new and better options for our businesses? Could those be managed, given other constraints we have in the Company?
These considerations have been widely reported as a plan to “break up” GE. They are no more and no less than a desire and an obligation to explore every option to ensure the best results for our customers, employees, and owners. We will continue to review this in 2018, and we will take steps only when we see a clear path to better long-term outcomes for GE. There will be a GE in the future, but it will look different from how it does today.
RUNNING OUR BUSINESSES BETTERWhen we talk about running our businesses better, we really mean four things— customer outcomes, our business units as the center of gravity, running the businesses for cash, and driving a new culture for the future. Let me walk through some of the specifics in more detail.
1 DELIVER OUTCOMES FOR CUSTOMERSOur customers are our “North Star,” and their outcomes guide everything we do. Moving forward, we will more rigorously align our capital allocation strategy with customer needs and market realities. Above all, we are and will always be a company that values our customers, our relationships with them, and our commitments to them.
Our relationship with American Airlines is a good example. In the aftermath of 9/11 and subsequent airline industry bankruptcies and mergers, GE invested in the industry when no one else would, and many strong relationships were born of that loyalty. At our senior leadership meeting in Boston this past January, Robert Isom, the president of American Airlines, credited that trust between his company and ours for American’s success. “American Airlines today wouldn’t be here in the shape and the form it is without GE and the relationships that were built over the years,” he said. “We need GE to be great.”
Whether it’s our largest customers like American Airlines or a local shop, our customers are counting on us to understand their problems and bring to bear all of GE’s capabilities to solve them. One way we are bringing new levels of innovation and productivity to our customers—and
GE 2017 ANNUAL REPORT 3
simultaneously empowering our businesses—is through digital applications. We’re seeing time and time again the outcomes we can deliver for customers when we pair our technology with software and when analytics enable us to do more than equipment alone can do.
We’re not aiming small. Our Aviation and Digital teams, in collaboration with Qantas, built FlightPulse,™ the first mobile application built entirely on the Predix platform for the industrial IoT. FlightPulse is a post-flight analytics app that enables pilots to see their own operational flight
We’re also inventing a new future for GE through additive manufacturing. We are learning how to create more advanced designs while reducing cost through the elimination of traditional manufacturing constraints.
We’re already experiencing the benefits in our Aviation business, which used additive manufacturing to develop a new turboprop engine in just two short years. The engine, which passed its inaugural test at the end of 2017, combines more than 850 separate components into just 12, saving more than 5% in weight. More than one-third of the
passionIf anything gives me faith in our future, it is the
engine is 3D-printed, which will help provide our customers with a 20% improvement in fuel burn and 10% more power than competitor offerings in the same size class.
The potential is disruptive, and the work that our teams already have done in this important area reflects GE at its very best. In 2018, each of our businesses will have a specific additive manufacturing adoption strategy and goals.
Finally, we streamlined our Global Research Centers from nine to just two, and focused more tightly and in a more deliberate manner on using them, along with our Ventures arm, as technology accelerators. They are feeding new research into game-changing technologies like energy storage, cell therapy, digital medical imaging, and other systems. Again, no change in our philosophy of shared technology and innovation—just a sharpening of our investment and approach.
data and monitor their own performance, all through their tablets. Using GE’s Flight Efficiency Analytics Suite, including FlightPulse, Qantas is on track to increase its annual fuel savings to more than 30 million kilograms of fuel, or a 1% savings. The driving force behind this transformation is data: When you have the data, you can put it to work, gain insights, and deliver results.
Digital is critical to our future, but we are tightening the scope of where and how much we’re going to invest. Our sales teams’ win rates are twice as high and cycle times are half as long when they sell Predix offerings into our own installed base. Predix-powered orders were up over 150% in 2017. So we’re focusing on our core installed base market—where we know our businesses can win—and expect Predix product revenues will double in 2018, to approximately $1 billion. We also will leverage our partners to pursue digital opportunities beyond our core industries. There is absolutely no change in our belief in the digital future—only some adjustments in our approach.
and resolve of our teams.

4 GE 2017 ANNUAL REPORT
2STRENGTHEN OUR BUSINESSES TO THRIVE IN THE DECADES AHEAD Next, we need to do whatever it takes to make sure our business segments have the capability, resources, and structures to create these outcomes.
When I first took stock of our portfolio, I saw a series of competitive businesses that were fundamentally strong. But they play in infrastructure industries that have experienced significant disruption —from globalization, digitization, shifting demands, and new players.
I concluded that we were running too many businesses at once to do them all justice. We had to admit we didn’t have the financial and management bandwidth to have so many large, global businesses in the open throttle position that they need to progress.
We are narrowing our long-term focus to three key industries where our impact is greatest: aviation, health, and energy. We run competitive businesses with market-leading positions in each of these sectors, industries that are positioned for major long-term growth. To support them, we are shifting GE’s center of gravity away from headquarters to empower the businesses with more resources. We have identified more than $20 billion of assets for potential exit and currently have more than 20 dispositions in active discussions.
The past year already brought some significant changes to our businesses. In July, we completed the transaction to create Baker Hughes, a GE company (BHGE), in which we hold a 62.5% stake. In the third quarter, we combined our Energy Connections business with our Power business to form one integrated business called GE Power.
Our performance by business was mixed for the year:
Aviation grew margins 100 basis points while delivering 459 LEAP2 engines with improving cost positions. Growth in commercial and military services helped offset margin pressure from the launch and production ramp-up of LEAP.
Healthcare grew revenue by 5% and margins by 70 basis
points, and new product launches like Pristina™ patient-
assisted mammography helped drive continued growth. With leading positions in imaging and life sciences, together with our digital and analytics capabilities, Healthcare is well-placed to transform the future of the industry.
Renewable Energy increased profit by 26%. Its agreements to supply wind farms in Sweden, Australia, Thailand, the U.S., and many other places around the world will generate 8 gigawatts of renewable power.
Markets for our Transportation and Oil & Gas segments remained challenging, leading to lower volume and profit in those segments. But despite a difficult North American freight rail market, the Transportation team landed some exciting customer wins, including a 200-locomotive order with Canadian National Railway—the largest order from a Class 1 railroad to any equipment manufacturer since 2014.
Oil & Gas is making strong progress on integration and synergy targets are on track. The team secured several major commercial wins, including its first fullstream agreement with Twinza to support an offshore project in Papua New Guinea.
Current and Lighting operating profit was $93 million, up from a loss of $56 million last year. Current is helping customers like Walmart, JPMorgan Chase, and GM save millions of dollars in energy costs through sensor-enabled LEDs and software applications. Lighting partnered with retailers to lead the LED shift while innovating in the smart-home market, including launching the world’s first lighting product embedded with Amazon’s Alexa Voice Service.
Capital enabled $14.4 billion of industrial orders in 2017 and ended the year with $157 billion of assets, including $31 billion of liquidity. However, we incurred $0.91 per share of charges related to our run-off insurance operations and related actions we are taking to make Capital smaller and more focused, while continuing to focus on vital industrial partnerships. While we exited most of our insurance operations more than a decade ago, in 2017 we took a charge to add to our insurance reserves for our run-off insurance operations. We are disappointed in the magnitude of this charge, but we think these actions, along with suspending dividends from GE Capital to GE, will be sufficient to restore GE Capital’s capital adequacy to appropriate levels by the end of 2019.
Power is competing in an environment that is far more challenging than we anticipated this time last year, and its earnings were down 45% in 2017. We are preparing for a market that could be as low as 30 gigawatts in 2018, deteriorating further into 2019. And it will take us into 2019 to right-size our business for this. Over the past several months, we have examined every inch of this business and we have a plan to reset, refocus, and renew Power.
2. LEAP is a registered trademark of CFM International, a 50-50 joint venture between Snecma (Safran) and GE.

GE 2017 ANNUAL REPORT 5
GE POWER Reset, Refocus, Renew
3. IMF World Economic Outlook, October 2017.
4. Structural costs exclude the effects of acquisition and disposition activity.
POWERING EVERYONE
In Power, we continuously think of the one billion people without access to electricity. Today, nearly 600 million of those people reside in sub-Saharan Africa, facing unique opportunities and challenges in transforming their energy systems. On a recent trip to the region, I witnessed the dynamics of an evolving energy ecosystem involving almost every fuel type, challenges in transmission and distribution infrastructure, and a critical need for project execution and financing capabilities. We also see how properly managed electrification helps enable growth; in Ghana, for example, GDP growth rates have risen from 3.5% in 2016 to 5.9% in 2017, and are expected to reach 8.9% in 2018.3
The dynamic nature of Power across the globe has become increasingly local and complex. Customers everywhere are seeking energy solutions with the best cost, lowest carbon footprint, and greater reliability and resiliency. In 2017, we also felt the disruptive nature of renewables penetration into the energy mix. While renewables are here to stay, we know that gas and other fuel types will remain important.
To remain competitive, we know we must operate in a leaner, more cost-efficient way. Over the past several months, we launched a three-part strategy to Reset, Refocus, and Renew GE Power.
Reset is about getting “back to basics.” In 2017, we consolidated the legacy Power and Energy Connections businesses, both of which included Alstom entities, into one business unit—giving us an end-to-end view of the energy value chain. We’ve launched a plan to fully realize the benefits of the combined business by:
Reducing structure and manufacturing footprint.
We announced plans to reduce our global headcount by approximately 12,000 positions and cut $1 billion of structural costs4 in 2018. We are planning to reduce manufacturing capacity by 30% or more, and we’ll continually evaluate further reductions depending on market demand.
Improving cash conversion.
We have established clear performance goals and are executing focused plays through dedicated teams. In 2017, we changed our Global Supply Chain leadership, and they are actively working to double our current inventory-turn performance, to eight, by 2020, starting with a $1 billion reduction in inventory in 2018.
Refocus is about defining a clear path forward across our asset lifecycle.
Expanding product and service margins.
In 2017, we received a majority of global Heavy Duty Gas Turbine awards, with the HA leading in its space. But we navigated challenging HA turbine launch margin dynamics, as well as margin compression in our service business. We know we can improve margins in both areas. Consolidating our IT systems is giving us better visibility into operations in real time so we can make smarter decisions to improve them; our new CIO is streamlining our infrastructure to 80% fewer applications.
Maximizing services dollars per installed asset.
We have a 1,600-gigawatt installed base of assets in the world. We lost focus on holistically driving revenues across our entire fleet, especially our transactional portfolio. With new leadership, we are making progress in balancing this focus, and identified $1 billion in new service opportunities at the end of 2017.
Renew is about our commitment to become a leaner, more focused, and more efficient business with better cash and income returns. We will continue to develop high-technology products that will lead our industry. We also are investing in software and growth incubators around storage, distributed grids, and grid automation so we can successfully lead the global shift to decentralized, decarbonized, and digitized electricity infrastructure.
Our transformation will take time, but we know we can run Power in line with our own and shareholder expectations. Our teams are focused, committed, and up to the task.
Russell Stokes President & CEO, GE Power

6 GE 2017 ANNUAL REPORT
3 RUN THE COMPANY FOR CASHCash is top of mind for us and our investors, and our performance through the first three quarters of 2017 fell short. Our higher-than- expected $7.8 billion of Industrial CFOA5 in the fourth quarter reflects our improving discipline and execution. We will continue to increase our visibility and execution on cash.
It’s a similar story on costs. We came into the year with a structural cost-out target of $1 billion. We raised that in the third quarter, to $1.5 billion, and we delivered a little higher than that, at $1.7 billion for the year. We will cut an additional $2 billion in structural costs in 2018. In addition, we are particularly focused on product costs, attacking cost of quality, reducing manufacturing overhead, and accelerating the implementation of additive design and manufacturing.
Cost cuts also lead to reductions in workforce. We recognize that they can profoundly disrupt impacted employees, their families, and their communities. We can never lose sight of what those cuts mean in people’s lives.
Finally, we are ensuring that we have compensation programs, goals, and metrics that drive us to perform on a consistent basis over the long term. We are focusing on simpler reporting metrics like revenue, operating profit, and free cash flow. Compensation for our senior executives now includes a higher mix of equity, and our annual bonus program will be more closely tied to each business’ performance. These changes are designed to motivate our teams and leaders to focus on execution and cash.
The other side of running GE better is building stronger processes around capital allocation and managing enterprise risk. We have established a robust capital allocation framework and process in the past six months.
This will allow us to improve capital allocation on two levels. We have added more quantitative measures to assess alternatives for deploying the Company’s excess cash flow and to make it easier to compare the relative risk and return of dividend policy, share repurchases, acquisitions, divestitures, and joint venture investments. These will include things like intrinsic value analysis in the case of share repurchases, optimized capital structures and dividend policies, and a constant evaluation of our portfolio assets and where we want to expand or contract.
The reality, though, is that most of the Company’s capital is already allocated before getting to these kinds of topics. I view every single decision—whether it is product development, salesforce size, or other everyday factors—as a capital allocation decision. We must weigh these empirically and hold teams accountable for the results.
We formed an investment committee reporting to me that includes all our business unit leaders. They help assess where we invest—making sure we allocate to the highest and best risk-adjusted returns, double down on areas where we have strong prospects, and reduce capital flow into areas that have lesser prospects. There will be—and should be—winners and losers in our capital allocation process.
We will continue to increase our visibility and execution on cash.
5. Excluding deal-related taxes and principal pension plan funding on a BHGE dividend basis.

GE 2017 ANNUAL REPORT 7
4DRIVE A CULTURE OF CANDOR AND ACCOUNTABILITY IN OUR TEAMS For the past three decades, I always have been proud to say that I work at GE. The bedrock of my confidence comes from our people. GE teams built the first jet engine in the U.S., pioneered the LED, and designed the first MRI scanner for the brain. The passion, meritocracy, diversity, and integrity of our people have been—and always will be—the cornerstone of who we are.
Yet there are lots of opportunities to sharpen how we work. I am constantly pushing for more accountability at all levels of GE. I believe the culture we need to foster starts with me, and I have taken tangible steps in that direction.
For example, all employees can ask me questions and give me feedback through an internal website. The community chooses which questions I’ll answer by video every Friday. These videos won’t win any awards for cinematography, but they are valuable for me to reach the team directly and personally.
I receive a lot of feedback and insights through that site, email, and other tools. No opinion or question is off limits for me or the leadership team. For example, I received a lot of constructive feedback about some of the content in an employee broadcast last November. I heard the team’s concerns loud and clear, responded immediately, and we moved forward.
I’ll continue to communicate responsively and candidly with employees, and I’m demanding the same of my leadership team. We talk almost every day, and we meet formally every two weeks to collaborate on strategy, risks, and execution across GE’s business units.
We also are significantly reducing the size of our Board and bringing in new experts with fresh perspectives. This revamped Board will continue to help move GE forward.
The best people, the best culture—this is what makes everything else possible. At the end of the day, we exist to deliver outcomes for our customers, performance for our owners, and an environment for our employees that motivates them, excites them, and rewards them for delivering those outcomes and that performance.
THE PATH FORWARDAll of this makes 2018 a reset year. This is the next step in our evolution.
Of course, we aren’t operating in a vacuum. We see protectionism and nationalism continue to rise in many places amid growing U.S.-China trade tensions, uncertainty about the future of NAFTA and other trade agreements, and new import tariffs around the world. Even business leaders, traditionally the champions of open markets, are turning inward; 55% of executives surveyed around the world in our recently released Global Innovation Barometer think protectionist policies will benefit their businesses.
As a global multinational with operations in more than 180 countries that sells more than 60% of what we make to customers abroad, we disfavor barriers to trade, investment, and the movement of people. At the same time, in an increasingly protectionist world, our global footprint becomes more and more of a singular asset. GE will continue to be a strong voice in support of free trade and robust international competition.
On balance, we are encouraged by stronger global economic growth. Developed markets remain key to GE, but we are redoubling our focus on China, India, and emerging markets like Southeast Asia, the Middle East, and Africa. More than 1.5 billion people around the world still lack access to the basics of modern healthcare, electricity, and contemporary transportation. India and the Middle East will each need to order about 30 gigawatts of electricity every year to meet the needs of their growing populations. China will need to add three million hospital beds by 2020. Southeast Asian countries spend more than $180 billion on infrastructure every year. GE stands uniquely ready to meet these huge needs.

8 GE 2017 ANNUAL REPORT
We see an especially strong focus in the emerging markets on economic diversification, digital transformation, and industrialization and a sense of urgency everywhere to do everything faster. For example, Saudi Arabia’s ambitious Vision 2030 Plan, which will build 9.5 gigawatts of renewable energy by 2023, portends a profound shift from being an oil-based economy to a greener one. We are helping our customers and the world reduce emissions, use less energy, save money, and increase reliability. And we go beyond the technology, connecting capital to customers and building local teams that understand the countries and cultures in which they work and how to win.
We have our work cut out for us. But we will continue to drive the world forward because we tackle its biggest challenges. A few weeks ago, I got to meet Bernadette Gabel, the young daughter and personal hero of a member of our Global Operations team, Chris Gabel. She was born with an exceedingly rare heart defect: two separate conditions that appear together in just one out of every 40 million people, meaning it’s likely to afflict fewer than 200 people on the planet. Bernadette is a strong little girl who endured three open-heart surgeries before her third birthday. Wearing a pretty pink dress and a big, beautiful smile, she stood on the stage with her dad at our leadership gathering in January thanks to the healthcare technologies that GE developed.
Then, with Bernadette in his arms, Chris challenged us to keep working to give children more years with their parents and parents more years with their children. “Let us be that company that isn’t afraid to take risks in developing breakthrough technologies that will change the game for our customers, for GE, and for the world,” Chris said. And we are going to take him up on it.
You can find these kinds of inspirational stories everywhere across GE. Like the team of engineers, designers, and managers outside Paris who designed a better mammography machine, one that takes away a primary obstacle keeping people from lifesaving screenings: fear. The new system,
engineered for women by women, increases comfort for 80% of patients and decreases anxiety for most of them, all without sacrificing image quality or increasing exam time.
Our Renewable Energy and Capital teams are partnering on a project to erect 179 GE wind turbines, each twice the height of the Statue of Liberty, in the Markbygden forest in northern Sweden. When complete in 2019, it will be the largest operating wind farm in Europe, generating 650 megawatts of electricity and increasing Sweden’s installed wind generation by 12%.
And as Hurricane Irma ravaged the Gulf last year, a GE Healthcare team in Miami helped keep open six hospitals even as most other facilities were forced to evacuate.
GE’s people have always built technology to improve human life in profound ways. I will use the privilege of leading this great Company to improve the many ways we make that happen both inside and out. As I said in that first email on my first day in the job: “Doing what we said we would do matters.”
Now it’s time to take what we’ve learned, recommit to the fundamentals, and dedicate 2018 to earning back your trust and delivering for you.
Thank you for your support, investment, and belief in GE.
John L. FlanneryChairman of the Board and Chief Executive OfficerFebruary 23, 2018
EVERY 2 SECONDS an aircraft powered by GE technology takes off
Everyday, GE is helping doctors save 3,000 LIVES
GE powers over 30% OF THE WORLD’S ENERGY

GE 2017 ANNUAL REPORT 9
GE EXECUTIVE TEAM
Vic AbateSenior Vice President and Chief Technology
Officer, GE
Kieran MurphySenior Vice President,
GE; President and Chief Executive Officer,
GE Healthcare
Aris KekedjianVice President,
Business Development, GE
John L. FlanneryChairman of the Board
and Chief Executive Officer
Sue SiegelChief Innovation Officer,
GE; Chief Executive Officer, GE Business Innovations
Alex DimitriefSenior Vice President
and General Counsel, GE; President and
Chief Executive Officer, GE Global Growth
Organization
Russell StokesSenior Vice President,
GE; President and Chief Executive Officer,
GE Power
David JoyceVice Chair, GE; President and
Chief Executive Officer, GE Aviation
Rafael SantanaVice President, GE;
President and Chief Executive Officer,
GE Transportation
Raghu Krishnamoorthy
Senior Vice President and Chief Human Resources
Officer, GE
Jamie S. MillerSenior Vice President
and Chief Financial Officer, GE
Daniel Janki Senior Vice President,
Business Transformation, GE
Jérôme PécresseSenior Vice President,
GE; President and Chief Executive Officer, GE Renewable Energy
Bill RuhSenior Vice President
and Chief Digital Officer, GE; Chief Executive Officer, GE Digital
Lorenzo SimonelliSenior Vice President,
GE; President and Chief Executive Officer,
Baker Hughes, a GE company
Alec BurgerVice President, GE;
President, GE Capital
GE EXECUTIVE TEAM

10 GE 2017 ANNUAL REPORT
GE BOARD
THE GE BOARD The GE Board held 15 meetings during 2017, including four meetings of the independent directors of the Board. Board members focus on the areas that are important to shareowners —strategy, risk management, leadership
development and succession. In 2017, the Board focused on CEO succession, the ongoing GE portfolio review, the combination with Baker Hughes, performance of GE’s Power business, capital allocation, GE Capital,
and other key initiatives including GE Digital and additive manufacturing.
W. Geoffrey BeattieA
Chief Executive Officer, Generation Capital, private investment
company, Toronto, Canada.
Director since 2009.
Sébastien M. BazinF
Chairman and Chief Executive Officer,
AccorHotels, a global hotel company,
Paris, France.Director since
2016.
Edward P. Garden F G M
Chief Investment Officer and Founding Partner,
Trian Fund Management, a multi-billion dollar
asset management firm, New York, New York.
Director since 2017.
Mary L. Schapiro A
Vice Chairman, Advisory Board of
Promontory Financial Group, leading strategy,
risk management and regulatory compliance
consulting firm, and former Chairman,
U.S. Securities and Exchange Commission,
Washington, D.C.Director since
2013.
John J. BrennanG M L
Chairman Emeritus and Senior Advisor,
The Vanguard Group, Inc.,global investment
management company,Malvern, Pennsylvania.
Director since 2012.
Andrea JungG M
President & Chief Executive Officer,
Grameen America, nonprofit microfinance
organization, New York, New York.
Director since 1998.
James S. Tisch F G
President and Chief Executive Officer, Loews Corporation, diversified holding company with subsidiaries involved in energy, insurance,
and hospitality, New York, New York.
Director since 2010.
A AuditF Finance &
Capital AllocationG Governance &
Public AffairsM Management
Development & Compensation
T Technology & Industrial Risk
L Lead Director
Committee memberships as of 12/31/17
John L. FlanneryChairman of the
Board and Chief Executive Officer,
General Electric Company, Boston, Massachusetts.
Director since 2017.
Peter B. HenryA
Dean Emeritus and professor of economics and finance, NYU’s Stern
School of Business, New York, New York.
Director since 2016.
Risa Lavizzo-MoureyG
Former President and Chief Executive Officer, Robert Wood Johnson Foundation, the largest
U.S. philanthropy dedicated to health,
Princeton, New Jersey.Director since
2017.
Marijn E. DekkersM T
Chairman of the Board,Unilever, a multinational
consumer goods company, Rotterdam,
Netherlands, and London, United Kingdom.
Director since 2012.
Rochelle B. LazarusG M
Chairman Emeritusand former Chief
Executive Officer, Ogilvy& Mather Worldwide,
global marketingcommunications company,
New York, New York.Director since
2000.
Steven M. MollenkopfT
Chief Executive Officer and director, Qualcomm,
a multinational semiconductor and
telecommunications equipment company, San Diego, California.
Director since 2016.
Francisco D’SouzaT
Chief Executive Officer,Cognizant TechnologySolutions Corporation,
multinational IT company, Teaneck, New Jersey.
Director since 2013.
James J. MulvaA F
Former Chairman, President and
Chief Executive Officer, ConocoPhillips,
integrated global energy company, Houston, Texas.Director since
2008.
Susan J. HockfieldG T
President Emerita and Professor of
Neuroscience,Massachusetts Institute
of Technology, Cambridge, Massachusetts.Director since
2006.
James E. RohrA F M
Former Chairman and Chief Executive
Officer, The PNC Financial Services Group, large
financial services company, Pittsburgh,
Pennsylvania.Director since
2013.
United States Securities and Exchange CommissionWASHINGTON, D.C. 20549
FORM 10-K(Mark One)
þ Annual Report Pursuant to Section 13 or 15(d) of the Securities Exchange Act of 1934
For the fiscal year ended December 31, 2017or
¨ Transition Report pursuant to Section 13 or 15(d) of the Securities Exchange Act of 1934
For the transition period from ___________to ___________
Commission file number 001-00035
General Electric Company (Exact name of registrant as specified in charter)
New York 14-0689340(State or other jurisdiction of incorporation or organization) (I.R.S. Employer Identification No.)
41 Farnsworth Street, Boston, MA 02210 (617) 443-3000(Address of principal executive offices) (Zip Code) (Telephone No.)
Securities Registered Pursuant to Section 12(b) of the Act:Title of each class Name of each exchange on which registered
Common stock, par value $0.06 per share New York Stock Exchange
Securities Registered Pursuant to Section 12(g) of the Act:
(Title of class)
Indicate by check mark if the registrant is a well-known seasoned issuer, as defined in Rule 405 of the Securities Act. Yes þ No ¨
Indicate by check mark if the registrant is not required to file reports pursuant to Section 13 or Section 15(d) of the Act. Yes ¨ No þIndicate by check mark whether the registrant (1) has filed all reports required to be filed by Section 13 or 15(d) of the Securities Exchange Act of 1934during the preceding 12 months (or for such shorter period that the registrant was required to file such reports), and (2) has been subject to such filingrequirements for the past 90 days. Yes þ No ¨Indicate by check mark whether the registrant has submitted electronically and posted on its corporate Web site, if any, every Interactive Data Filerequired to be submitted and posted pursuant to Rule 405 of Regulation S-T during the preceding 12 months (or for such shorter period that theregistrant was required to submit and post such files). Yes þ No ¨Indicate by check mark if disclosure of delinquent filers pursuant to Item 405 of Regulation S-K is not contained herein, and will not be contained, to thebest of registrant’s knowledge, in definitive proxy or information statements incorporated by reference in Part III of this Form 10-K or any amendment tothis Form 10‑K. ¨Indicate by check mark whether the registrant is a large accelerated filer, an accelerated filer, a non-accelerated filer, a smaller reporting company or anemerging growth company. See definitions of “large accelerated filer,” “accelerated filer,” “smaller reporting company” and "emerging growth company" inRule 12b-2 of the Exchange Act. (Check one):
Large accelerated filer þ Accelerated filer ¨Non-accelerated filer ¨ Smaller reporting company ¨Emerging growth company ¨
If an emerging growth company, indicate by check mark if the registrant has elected not to use the extended transition period for complying with any newor revised financial accounting standards provided pursuant to Section 13(a) of the Exchange Act. ¨
Indicate by check mark whether the registrant is a shell company (as defined in Rule 12b-2 of the Act). Yes ¨ No þThe aggregate market value of the outstanding common equity of the registrant not held by affiliates as of the last business day of the registrant’s mostrecently completed second fiscal quarter was at least $231.5 billion. There were 8,682,576,000 shares of voting common stock with a par value of $0.06outstanding at January 31, 2018.
DOCUMENTS INCORPORATED BY REFERENCEThe definitive proxy statement relating to the registrant’s Annual Meeting of Shareowners, to be held April 25, 2018, is incorporated by reference intoPart III to the extent described therein.
GE 2017 FORM 10-K 1

TABLE OF CONTENTSPage
10-K Introduction & Summary 3
Forward Looking Statements 11
About General Electric 12
Management’s Discussion and Analysis of Financial Condition and Results of Operations (MD&A) 14
Key Performance Indicators 18
Consolidated Results 20
Segment Operations 25
GE Corporate Items and Eliminations 58
Other Consolidated Information 62
Statement of Financial Position 69
Financial Resources and Liquidity 71
Critical Accounting Estimates 82
Other Items 89
Supplemental Information 93
Other Financial Data 104
Risk Factors 106
Legal Proceedings 112
Management and Auditor's Reports 115
Audited Financial Statements and Notes 119
Directors, Executive Officers and Corporate Governance 200
Exhibits and Financial Statement Schedules 201
Form 10-K Cross Reference Index 205
Signatures 206
2 GE 2017 FORM 10-K
This section provides an overview of General Electric. It does not contain all of the information you should consider. Please read the entire Annual Report on Form 10-K carefully before making a voting or investment decision.
Risk Factors
page
106
Forward-Looking Statements
page
11
Management’s Discussion & Analysis
page
14
Legal Proceedings
page
112
Financial Resources & Liquidity
page
71
Financial Statements
page
119
GE-specific terms & icons. Many of the GE-specific terms & acronyms used in this section are explained in Presentation on page 14 and Other Terms Used by GE on page 15.
Throughout our Annual Report, we use the following icons:
Forward-looking information. Some of the information we provide in this section is forward-looking and, therefore, could change over time to reflect changes in the environment in which GE competes.
Non-GAAP information. Certain measures we use throughout this section are non-GAAP financial measures. For more information, see Financial Measures That Supplement U.S. Generally Accepted Accounting Principles Measures (Non-GAAP Financial Measures) on page 93.
10-K INTRODUCTION & SUMMARY
IN PARTICULAR, PLEASE SEE THE FOLLOWING SECTIONS
AVIATION CAPITALHEALTHCARERENEWABLE ENERGY
POWER OIL & GAS TRANSPORTATION LIGHTING
GE 2017 FORM 10-K 3
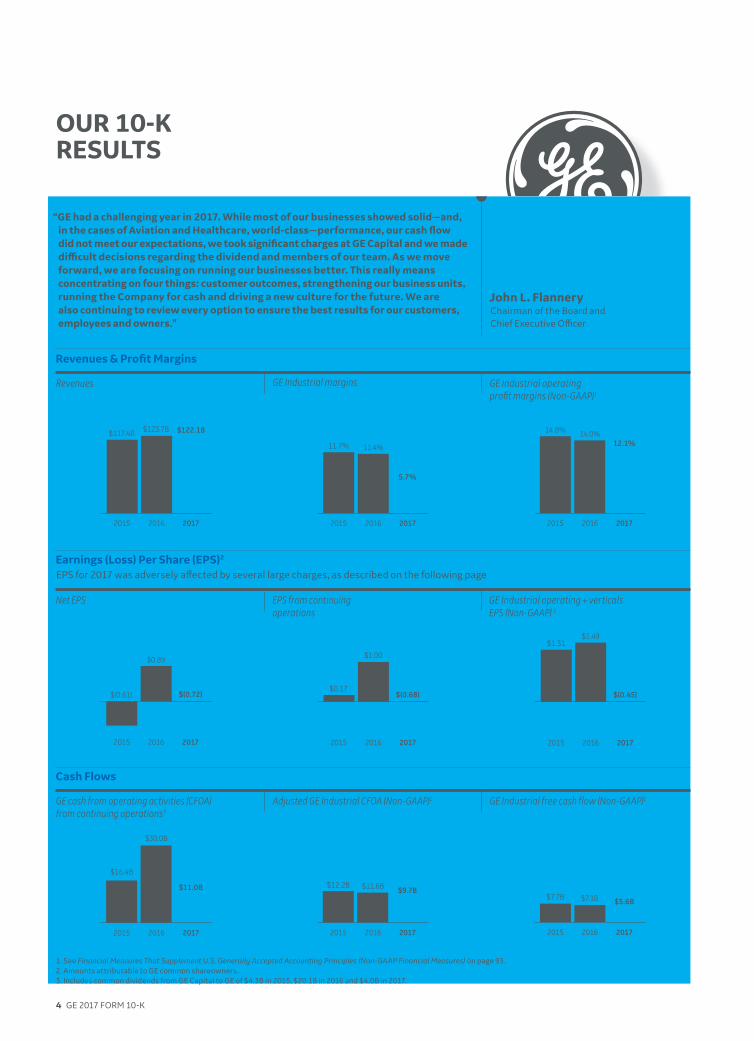
OUR 10-K RESULTS
“GE had a challenging year in 2017. While most of our businesses showed solid—and, in the cases of Aviation and Healthcare, world-class—performance, our cash flow did not meet our expectations, we took significant charges at GE Capital and we made difficult decisions regarding the dividend and members of our team. As we move forward, we are focusing on running our businesses better. This really means concentrating on four things: customer outcomes, strengthening our business units, running the Company for cash and driving a new culture for the future. We are also continuing to review every option to ensure the best results for our customers, employees and owners.”
John L. FlanneryChairman of the Board and Chief Executive Officer
Earnings (Loss) Per Share (EPS)2
EPS for 2017 was adversely affected by several large charges, as described on the following page
Net EPS EPS from continuing operations
GE Industrial operating + verticals EPS (Non-GAAP) 1
Cash Flows
GE cash from operating activities (CFOA) from continuing operations3
GE Industrial free cash flow (Non-GAAP)1Adjusted GE Industrial CFOA (Non-GAAP)1
1. See Financial Measures That Supplement U.S. Generally Accepted Accounting Principles (Non-GAAP Financial Measures) on page 93.2. Amounts attributable to GE common shareowners.3. Includes common dividends from GE Capital to GE of $4.3B in 2015, $20.1B in 2016 and $4.0B in 2017.
2015 2016 2017
$117.4B $123.7B $122.1B
2015 2016 2017
11.7% 11.4%
5.7%
2015 2016 2017
14.8% 14.0%12.1%
2015 2016 2017
$(0.61)
$0.89
$(0.72)
2015 2016 2017
$0.17
$1.00
$(0.68)
$1.31$1.49
$(0.45)
2015 20172016
2015 2016 2017
$16.4B
$30.0B
$11.0B
2015 2016 2017
$12.2B $11.6B $9.7B
2015 2016 2017
$7.7B $7.1B $5.6B
Revenues & Profit Margins
Revenues GE Industrial margins GE Industrial operating profit margins (Non-GAAP)1
4 GE 2017 FORM 10-K

SIGNIFICANT DEVELOPMENTS IN 2017
Leadership and Board changes
John Flannery became CEO and Chairman in August & October, respectively. Mr. Flannery is a 30-year GE veteran whose experience includes leading, most recently, the turnaround of GE Healthcare, as well as business development, GE’s industrial presence in India, and GE Capital’s presence in Asia Pacific. The GE Board selected Mr. Flannery after a multiyear succession process.
Our CFO and other members of the senior leadership team have also changed since mid-2017. Jamie Miller became CFO in November, and several other new business and functional leaders have been appointed (e.g., Russell Stokes for Power, Kieran Murphy for Healthcare, Rafael Santana for Transportation and Alec Burger for GE Capital).
We are planning to significantly reduce the size of our Board at the 2018 shareowners meeting and will nominate new directors with fresh perspectives and relevant expertise.
Financial results significantly below our expectations
Full-year results were significantly below guidance provided in December 2016 for earnings, cash flows and cash returned to investors (dividends and buyback).
Key drivers for earnings (loss) included: • Significant charges from an increase in reserves
related to GE Capital’s run-off insurance operations, U.S. tax reform and portfolio-related actions;
• Market and other challenges in our Power and, to a lesser degree, Oil & Gas businesses; and
• Strong performance in other GE businesses (especially Aviation and Healthcare) and lower Corporate spending, which were not enough to overcome those headwinds.
Key drivers for cash flows included: • Industrial performance, including income
(especially at our Power business), working capital performance and cash flows from contract assets that were below our expectations; and
• Lower common dividends from GE Capital than originally planned.
Capital allocation, cost and portfolio actions
Completed the transaction to create Baker Hughes, a GE company (BHGE) in July, and closed the sale of our Water & Process Technologies business in September. See page 9 for additional details about M&A during the year.
Cut our quarterly dividend from $0.24/share to $0.12/share in November, reflecting a reset of a payout level that exceeded our free cash flow. We are planning for a more balanced capital allocation with a mix of dividend payments and investments in the Company.
Exceeded our target on cost reduction. We had strong execution and discipline on cost, particularly at Power and from steps to make Corporate smaller and more focused.
We have identified $20B+ of industrial assets that we plan to exit over the next two years, and we continue to review strategic portfolio options. We are also planning to substantially reduce the size of GE Capital.
1 2 3
INVESTOR FRAMEWORK FOR 2018In November 2017, we provided initial guidance on our financial outlook for 2018 and simplified the number of metrics in our annual framework to the two primary measures below.
1. See Financial Measures That Supplement U.S. Generally Accepted Accounting Principles Measures (Non-GAAP Financial Measures) on page 93.2. See pages 102–103 for additional details and reconciliations of the measures used in our investor framework for 2018 to these GAAP measures.
We believe this measure provides a better sense of earnings from the ongoing operations of our businesses than the GAAP measure of EPS from continuing operations. When reporting on this basis, we adjust the GAAP measure to remove the effects of the items below:
We cannot provide an equivalent GAAP guidance range without unreasonable effort because of the uncertainty of the timing and events affecting earnings as we execute on restructuring actions and business portfolio changes.
“Free cash flow” is generally used to measure cash available for capital allocation priorities after taking capital expenditures into account. We report GE Industrial free cash flow (Non-GAAP), which represents the CFOA of our industrial businesses after deducting our gross capital expenditures (additions to property, plant & equipment and to internal-use software). The measure also removes the effects of the items below:
WHY WE CHOSE THESE MEASURES
OUTLOOK UNDER NEW MEASURES
Adjusted EPS (Non-GAAP)1 GE Industrial free cash flow (Non-GAAP)1
$1.00–1.07 $6–7B
~$3–4B
ExclusionsDeal taxes
Principal pension plan funding
Certain BHGE-related cash flows
WhyFree cash flow does not include proceeds from dispositions, so we also exclude the related tax payments
In 2018, we plan to fund our principal pension plans for the next three years
We exclude our Oil & Gas segment’s CFOA and gross capital expenditures because, although we consolidate those cash flows, they do not represent movements of cash between GE and BHGE; we include dividend payments from BHGE to GE as cash available for GE to use
COMPARABLEGAAP MEASURES2
EPS from continuing operations GE CFOA from continuing operations
ExclusionsGainsRestructuring and other charges
Non-operating pension cost (Non-GAAP)1
WhyThese items reflect portfolio actions, restructuring and other activity, rather than earnings we anticipate from ongoing operations of our businesses
This item varies based on the timing of funding, interest rates and pension investment returns, rather than GE’s performance
GE 2017 FORM 10-K 5

MISSION: Providing leading physical & digital technology solutions to enhance customer productivity across the oil & gas value chain
Major products: oilfield services, oilfield equipment, turbomachinery & process solutions, digital solutions
MISSION: Powering lives & making electricity more affordable, reliable, accessible & sustainable1
Major products: technologies, solutions & services related to energy production, including gas & steam turbines, engines, generators, high-voltage equipment, power generation services & digital solutions
+ Positive: Momentum on cost reduction efforts; maintaining ~50% share in heavy-duty turbine market; expanding digital products & digital order backlog
– Negative: Declining heavy-duty gas turbine market & over-capacity driving down pricing/margins; challenging dynamics in Aero market, including customer financing availability; lower demand for services upgrades; supply chain over-capacity; tougher competitive dynamics on transactional services
Outlook: Markets will remain challenging, with increasing renewables in energy mix; positioning for lower demand, with opportunity to improve margins with cost reduction & improved operational execution
+ Positive: Solid growth in shorter-cycle businesses (oilfield services & digital solutions); increased rig count & oil prices; strong progress on BHGE integration & synergies
– Negative: Despite some stabilization, large-scale customer investments remain muted
Outlook: Strength in short-cycle businesses driven by North America onshore activity; long-cycle businesses stabilizing as environment improves
MISSION: Making renewable power sources affordable, accessible & reliable for the benefit of people everywhere
Major products: onshore & offshore wind turbines, wind turbine blades, hydropower solutions
+ Positive: Strong revenue & orders growth from repowering projects, new product introductions & digital capability; closed LM Wind Power acquisition; significant focus & execution on technology enhancement & lower product cost
– Negative: Increasing pricing pressure & need for innovation due to continued competitive pressure from other wind turbine producers & energy sources
Outlook: Positioning the onshore & offshore wind businesses to drive value for customers by in-sourcing blade production & developing larger, more efficient turbines; strong focus & execution on lower product cost
How Our Segments Performed
Revenues Profit Revenues Profit Revenues Profit
Other 2017 resultsOther 2017 results Other 2017 results
Profit margin: 1.3% 950bps Orders: $17B 56% Backlog: $21B 1%
Profit margin: 7.7% 610bps Orders: $37B (13)% Backlog: $98B 3%
Profit margin: 7.1% 70bps Orders: $10B 1% Backlog: $15B 15%
2017 Competitive Dynamics
1. Beginning in the third quarter of 2017, the Energy Connections business within the former Energy Connections & Lighting segment was combined with the Power segment and presented as one reporting segment called Power.
The Oil & Gas segment comprises our ownership of ~62.5% of BHGE following the combination of GE Oil & Gas with Baker Hughes in July 2017. Segment profit is net of the minority interest attributable to BHGE’s Class A shareholders.
2015 2016 2017
$16.5B
$12.9B
$17.2B
2015 2016 2017
$2.4B $1.4B $0.2B
2015 2016 2017
$28.9B
$36.8B $36.0B
2015 2016 2017
$4.8B $5.1B$2.8B
2015 2016 2017
$6.3B$9.0B
$10.3B
2015 2016 2017
$0.4B $0.6B $0.7B
POWER RENEWABLEENERGY
OIL & GAS
6 GE 2017 FORM 10-K
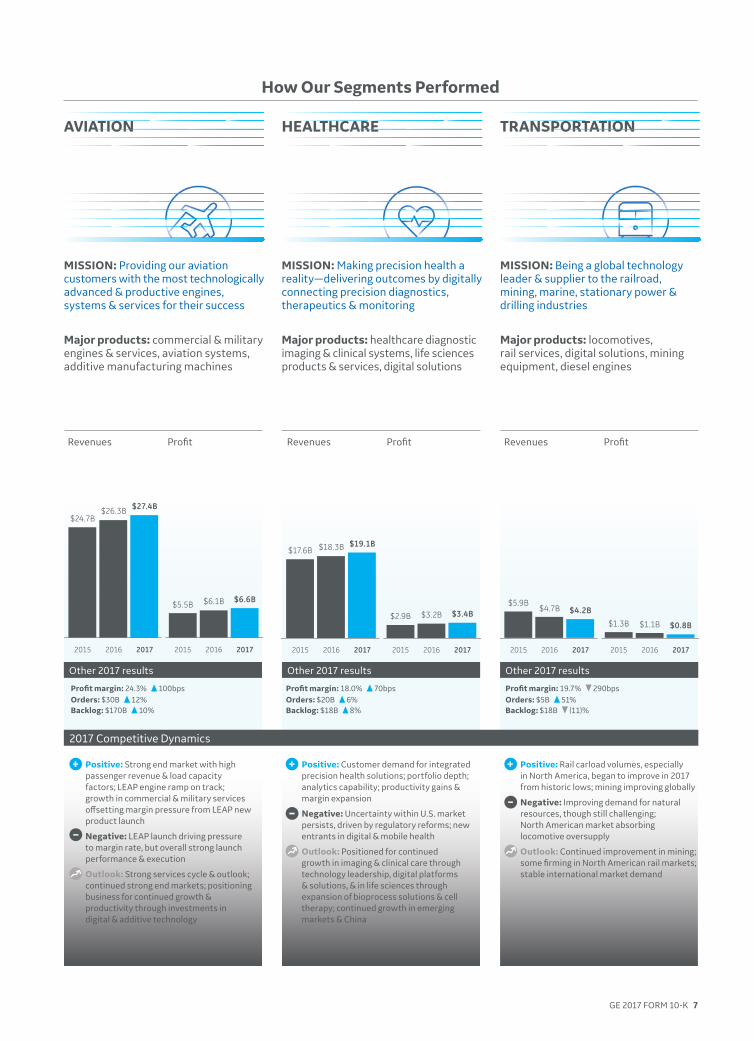
How Our Segments Performed
MISSION: Being a global technology leader & supplier to the railroad, mining, marine, stationary power & drilling industries
Major products: locomotives, rail services, digital solutions, mining equipment, diesel engines
MISSION: Making precision health a reality—delivering outcomes by digitally connecting precision diagnostics, therapeutics & monitoring
Major products: healthcare diagnostic imaging & clinical systems, life sciences products & services, digital solutions
MISSION: Providing our aviation customers with the most technologically advanced & productive engines, systems & services for their success
Major products: commercial & military engines & services, aviation systems, additive manufacturing machines
+ Positive: Strong end market with high passenger revenue & load capacity factors; LEAP engine ramp on track; growth in commercial & military services offsetting margin pressure from LEAP new product launch
– Negative: LEAP launch driving pressure to margin rate, but overall strong launch performance & execution
Outlook: Strong services cycle & outlook; continued strong end markets; positioning business for continued growth & productivity through investments in digital & additive technology
+ Positive: Customer demand for integrated precision health solutions; portfolio depth; analytics capability; productivity gains & margin expansion
– Negative: Uncertainty within U.S. market persists, driven by regulatory reforms; new entrants in digital & mobile health
Outlook: Positioned for continued growth in imaging & clinical care through technology leadership, digital platforms & solutions, & in life sciences through expansion of bioprocess solutions & cell therapy; continued growth in emerging markets & China
+ Positive: Rail carload volumes, especially in North America, began to improve in 2017 from historic lows; mining improving globally
– Negative: Improving demand for natural resources, though still challenging; North American market absorbing locomotive oversupply
Outlook: Continued improvement in mining; some firming in North American rail markets; stable international market demand
Revenues Profit Revenues Profit Revenues Profit
2017 Competitive Dynamics
Other 2017 resultsOther 2017 resultsOther 2017 results
Profit margin: 24.3% 100bpsOrders: $30B 12% Backlog: $170B 10%
Profit margin: 19.7% 290bpsOrders: $5B 51% Backlog: $18B (11)%
Profit margin: 18.0% 70bpsOrders: $20B 6% Backlog: $18B 8%
2015 2016 2017
$17.6B $18.3B $19.1B
2015 2016 2017
$2.9B $3.2B $3.4B
2015 2016 2017
$5.9B$4.7B $4.2B
2015 2016 2017
$1.3B $1.1B $0.8B
2015 2016 2017
$24.7B$26.3B $27.4B
2015 2016 2017
$5.5B $6.1B $6.6B
AVIATION HEALTHCARE TRANSPORTATION
GE 2017 FORM 10-K 7

How Our Segments Performed
MISSION: Helping businesses, cities & homes become more energy efficient & productive with LED & solar technologies, networked sensors & software & connected lighting solutions1 Major products: consumer home lighting, commercial & industrial lighting, solar, digital energy efficiency & productivity solutions
MISSION: Investing financial, human & intellectual capital to help our industrial businesses & their customers grow Major products: Industrial-aligned financial structuring & product support in aviation (GECAS), energy (EFS) & healthcare
Revenues Profit Revenues Profit (loss)
Other 2017 results
Verticals earnings (loss) (Non-GAAP)2: $(6.2)B GE Capital segment assets: $156.7B
Profit margin: 4.7% 60bps
Other 2017 results
+ Positive: Continued LED growth driven by energy savings & better light quality; increasing interest in digital solutions where there is no established market leader
– Negative: Wide variety of global competitors in LED lighting & long replacement cycle once installed; declining sales & margins on traditional lighting products; many point-solution digital companies expanding into energy efficiency
Outlook: LED conversion expected to continue in both consumer & commercial markets; significant growth potential in digital capabilities for intelligent buildings, cities & homes
+ Positive: Strong performance from GECAS and Industrial Finance businesses; operating expenses down as GE Capital has become smaller
– Negative: Charge of $6.2B (after-tax) from increased reserves related to run-off insurance operations, which we estimate will require approximately $15B of capital contributions over the next seven years; also incurred charges from strategic portfolio actions planned for EFS; pending DOJ investigation of WMC under FIRREA
Outlook: Taking actions to make GE Capital smaller & more focused, including substantial reduction of EFS & Industrial Finance
2017 Competitive Dynamics
1. The Lighting segment includes the historical results of the Appliances business prior to its sale in June 2016.2. See Financial Measures That Supplement U.S. Generally Accepted Accounting Principles (Non-GAAP Financial Measures) on page 93.
2015 2016 2017
$10.8B $10.9B$9.1B
2015 2016 2017
$(8.0)B $(1.3)B $(6.8)B
2015 2016 2017
$8.8B
$4.8B$2.0B
2015 2016 2017
$0.7B $0.2B $0.1B
LIGHTING CAPITAL
8 GE 2017 FORM 10-K

FRAMEWORK
— Strengthening cash position and improving cash flow generation
— Organic investments that deliver strong returns
— GE dividend at appropriate level with a path to grow
— Opportunistic use of buybacks when we have excess capital and stock is undervalued
— Disciplined approach to M&A
— Appropriate funding of other obligations, including pension
Capital Allocation
John L. FlanneryChairman of the Board and Chief Executive Officer
“In the last several years, we have not generated the rates of return that we expect. This is an area where GE needs to improve. We are prioritizing improved cash flow generation across all of our businesses and enhancing the discipline in how we allocate capital, with a more market-based approach and enhanced board-level oversight.”
Per share dividends paid on common stock
2015 = $0.92
2016 = $0.92
2017 = $0.96
We reduced our dividend target for 2018 to $0.48 per share
Shares outstanding2
2015 = 9.4B
2016 = 8.7B
2017 = 8.7B
Restructuring & other charges included workforce reductions, facility exit costs & integration of recent acquisitions
CASH RETURNED TO INVESTORS
Acquisitions (net cash payments)
Significant acquisitions closed Significant dispositions closed
Organic investments (gross capital expenditures + R&D)
Restructuring & other charges (cash expenditures)
Buyback(reported on a book basis)
Dispositions (cash proceeds)
Dividends
GE Industrial segment organic revenue growth (Non-GAAP)3
2015 = 3%
2016 = 1%
2017 = 0%
1. We effectuated the Synchrony Financial split-off in November 2015 through a share exchange that retired 671 million shares of GE common stock.2. Basic (not diluted); year-end (not weighted average).3. See Financial Measures That Supplement U.S. Generally Accepted Accounting Principles Measures (Non-GAAP Financial Measures) on page 93. Adjusted to include the results of
Alstom for November and December of both 2015 and 2016.
OTHER GE INDUSTRIAL CAPITAL ALLOCATION HIGHLIGHTS
2015 2016 2017
$10.0B $10.0B $10.3B
2015 2016 2017
$9.3B$8.5B $8.4B
$20.4B1
Sync
hron
ysplit-off
2015 2016 2017
$23.7B$22.0B
$3.8B
2015 2016 2017
$10.4B
$2.3B
$6.1B
2015 2016 2017
$1.7B
$5.4B
$3.1B
2015 2016 2017
$1.0B$1.7B $2.0B
2017 2017
Water & Process Technologies
GE 2017 FORM 10-K 9

Risk Factors
Our businesses routinely encounter and address risks, some of which will cause our future results to be different — sometimes materially different — than we presently anticipate. The summary below provides an overview of important types of strategic, operational, financial and legal and compliance risks that we face, but you should also refer to the full descriptions in Risk Factors beginning on page 106 of our Form 10-K.
Global macro environment Our growth is subject to global economic and political risks.
Business portfolio The success of our business depends on achieving our strategic objectives, including through dispositions, acquisitions and business integrations and joint ventures.
RestructuringWe may not realize expected benefits from our cost reduction and restructuring efforts, and these efforts may have adverse effects on our operations, employee retention and results.
Strategic Risks
Operational Risks
Financial Risks
Legal & Compliance Risks
Operational execution
We may face operational challenges that could have a material adverse effect on our business, reputation, financial position and results of operations. Product safetyOur products and services are highly sophisticated and specialized, and a major product failure or similar event could adversely affect our business, reputation, financial position and results of operations.
Funding & liquidityFailure to maintain our credit ratings, or conditions in the financial and credit markets, could adversely affect our access to capital markets, funding costs and related margins, liquidity, capital allocation plans and competitive position. Economy/counterpartiesA deterioration in conditions in the global economy, the major industries we serve or the financial markets, or in the soundness of financial institutions, governments or customers we deal with, may adversely affect our business and results of operations.
RegulatoryWe are subject to a wide variety of laws, regulations and government policies that may change in significant ways.
Competitive environmentWe are dependent on the maintenance of existing product lines and service relationships, market acceptance of new product and service introductions and innovations for revenue and earnings growth.
Intellectual property (IP)Our IP portfolio may not prevent competitors from independently developing products and services similar to or duplicative to ours, and the value of our IP may be negatively impacted by external dependencies.
CybersecurityIncreased cybersecurity requirements, vulnerabilities, threats and more sophisticated and targeted computer crime could pose a risk to our systems, networks, products, solutions, services and data.
Supply chainSignificant raw material shortages, supplier capacity constraints, supplier production disruptions, supplier quality and sourcing issues or price increases could increase our operating costs and adversely impact the competitive positions of our products.
GE CapitalA smaller GE Capital continues to have exposure to credit and other risks and, in the event of future adverse developments, may not be able to meet its business and financial objectives without taking further actions at GE Capital or capital contributions by GE. Social costsSustained increases in pension and healthcare benefits costs may reduce our profitability.
Legal proceedingsWe are subject to legal proceedings, investigations and legal compliance risks, including trailing liabilities from businesses that we dispose of or that are inactive.
10 GE 2017 FORM 10-K

ETHISPHERE
World’s Most Ethical Companies
FAST COMPANY
Most Innovative Companies
FORTUNE
World’s Most Admired Companies
HUMAN RIGHTS CAMPAIGN
Best Places to Work
INTERBRAND
Best Global Brands
WORKING MOTHER
Best Companies for Working Mothers
Visit our online annual report at www.ge.com/ar2017
Thanks to the customers, partners and GE employees who appear in this annual report for contributing their time and support.
The majority of the power utilized to manufacture this paper was renewable energy, produced with GE’s wind and biogas technologies, and powered by GE steam engines and turbine engines. The manufacturing facility that produced this report is an EPA GreenPower Partner and is solar powered.
COVER, BACK COVER: The front and back covers of this report feature GE employees, some of whom were recognized in 2017 for their breakthrough innovations, technical excellence, customer impact, and inspiring leadership. These employees include:
Ruben Fairman GE AdditiveDaniel Osgood GE AviationMichael Weimer GE AviationJacey Welsh GE Aviation
Massimo Giannozzi Baker Hughes, a GE companyMichelle Wu GE CapitalWilliam Beers Current, powered by GEMohamedraed Hergli GE Global Growth Organization
Gwenola Muller de Morogues GE Global Operations & GE PowerKristen Brosnan GE Global ResearchMiriam Balstad GE HealthcareAndreas Meijer GE Healthcare
Sarah Bonnett GE HealthcareBob Senzig GE HealthcareNicholas Miller GE PowerWilliam Miller GE Power
John-T Olesen GE Renewable EnergyJingjun (JJ) Zhang GE TransportationAshfaq Nainar GE TransportationJennine Sullivan GE Ventures
GE is consistently ranked as one of the world’s leading corporations:
Des
ign
by A
ddis
on w
ww
.add
ison
.com
Pr
intin
g by
Alli
ed P
rintin
g Se
rvic
es
GELISTEDNYSE
I will do the same with investors. When I look back at 2017, there’s no doubt: GE had a very tough year.
Revenues were down 1% at $122.1 billion, and we delivered $(0.68) in earnings per share (EPS) on a GAAP basis. Excluding charges for insurance-related items, U.S. tax reform, and industrial portfolio actions, EPS was at the low end of our reduced guidance for the year, at $1.05.1 In 2017, GE returned $12.1 billion to investors through dividends and buyback.
While most of our businesses delivered solid—and, in the cases of Aviation and Healthcare, world-class—performances, our cash flow was challenging. We took significant charges at Capital and Power Conversion and made painful cuts to GE’s dividend and employment. We lost some of the intense focus on operations and rigorous execution that have been GE’s hallmarks for generations.
Many people have lost faith in us. I have not. As difficult as 2017 was for everyone connected with GE, it was also a chance to reflect on what this Company means and why it exists.
DEAR INVESTORS, CUSTOMERS, PARTNERS, AND EMPLOYEES:On August 1, 2017, my first day as CEO, our more than 300,000 employees had an email from me waiting in their inboxes. In it, I promised that I would “always own up to what is going well and what is not.”
1. Industrial Operating + Verticals EPS adjusted to exclude significant charges taken in the fourth quarter including GE Capital insurance-related charges of $0.91 per share, tax reform-related charges of $0.40 per share, and Industrial portfolio-related charges of $0.18 per share.

2017ANNUALREPORT
General Electric Company41 Farnsworth StreetBoston, MA 02210www.ge.com 3.EPC055148101A.108
GE 2017 A
nnual Report