Embed Size (px)
Citation preview

2017 Annual Report
Moving with SPEED
Learn more about how Walmart is moving with speed
with our enhanced digital annual report at stock.walmart.com
Wal-Mart Stores, Inc. (NYSE: WMT) 702 S.W. 8th Street
Bentonville, Arkansas 72716 USA 479-273-4000 walmart.com
2017 Annual Rep
ort

The minimized environmental footprint of this report is the result of an extensive, collaborative effort of Walmart and our supply chain partners. The environmental and social impact continues to be an important consideration. It is printed on paper from well-managed forests containing recycled PCW fiber that is Elementally Chlorine Free (ECF). It is printed using 100 percent renewable wind power (RECs), along with environmental manufacturing principles that were utilized in the printing process. These practices include environmentally responsible procurement, lean manufacturing, green chemistry principles, the recycling of residual materials and reduced volatile organic compound inks and coatings.
Apple, the Apple logo, iPhone and iPod touch are trademarks of Apple Inc., registered in the U.S. and other countries. App Store is a service mark of Apple Inc. Android, Google Play and the Google Play logo are trademarks of Google Inc.
P
RINTED USIN
G
100%
WIND ENERG
Y
Supplied by Community Energy
Rainforest Alliance CertifiedTM
SmartWood Program Labeling Guidelines
Global ResponsibilityThe work we do to help people live better extends far beyond the walls of our stores. We’re committed to making a difference by working to create economic opportunity, enhance the sustainability of our operations as well as the systems we operate in, and strengthen local communities. From supporting the development of our associates, suppliers and women entrepreneurs to pursuing a more affordable, secure food supply chain, to helping to build resiliency in the face of disasters, Walmart seeks to create value for stakeholders across business and society, because shared value enhances the quality and viability of solutions. To learn more about these initiatives and others, read our GRR by visiting corporate.walmart.com/2017GRR.
Walmart’s investor relations app: anytime, anywhere access to financial and company newsOur IR app offers shareholders an array of investor resources in a user-friendly format. With the app, you can access quarterly results, stock price, financial presentations and company news at any time from your mobile device. It’s available for the iPad, iPhone, Android or Microsoft device. Download the free app from iTunes, Google Play or by scanning this QR code.
Moving with speed to win the future of retail—it’s in our DNA. Innovating to serve customers better is how Walmart became the company it is today. Now, we’re transforming to make every day easier for busy families.
As associates, we all play a role in creating an even better Walmart that saves customers time and money.
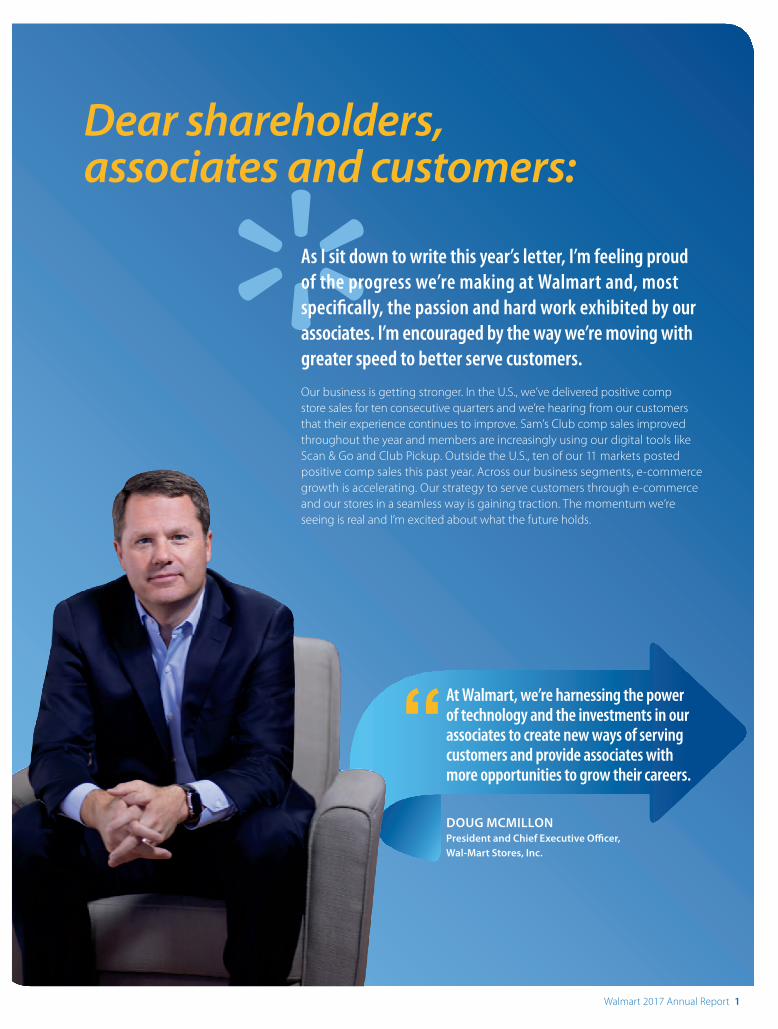
Dear shareholders, associates and customers:
As I sit down to write this year’s letter, I’m feeling proud of the progress we’re making at Walmart and, most specifically, the passion and hard work exhibited by our associates. I’m encouraged by the way we’re moving with greater speed to better serve customers.
Our business is getting stronger. In the U.S., we’ve delivered positive comp store sales for ten consecutive quarters and we’re hearing from our customers that their experience continues to improve. Sam’s Club comp sales improved throughout the year and members are increasingly using our digital tools like Scan & Go and Club Pickup. Outside the U.S., ten of our 11 markets posted positive comp sales this past year. Across our business segments, e-commerce growth is accelerating. Our strategy to serve customers through e-commerce and our stores in a seamless way is gaining traction. The momentum we’re seeing is real and I’m excited about what the future holds.
DOUG MCMILLON President and Chief Executive Officer, Wal-Mart Stores, Inc.
At Walmart, we’re harnessing the power of technology and the investments in our associates to create new ways of serving customers and provide associates with more opportunities to grow their careers.
“
Walmart 2017 Annual Report 1
We’re clearly living in a time of transformative change. The world is moving faster and the magnitude of the changes, and their influence on business, seem larger than I can remember. In retail, the things made possible by technology are fundamentally transforming this industry. These changes are creating compelling ways for customers to save time and gain easy access to products and services they didn’t have before. At Walmart, we’re harnessing the power of technology and the investments in our associates to create new ways of serving customers and provide associates with more opportunities to grow their careers.
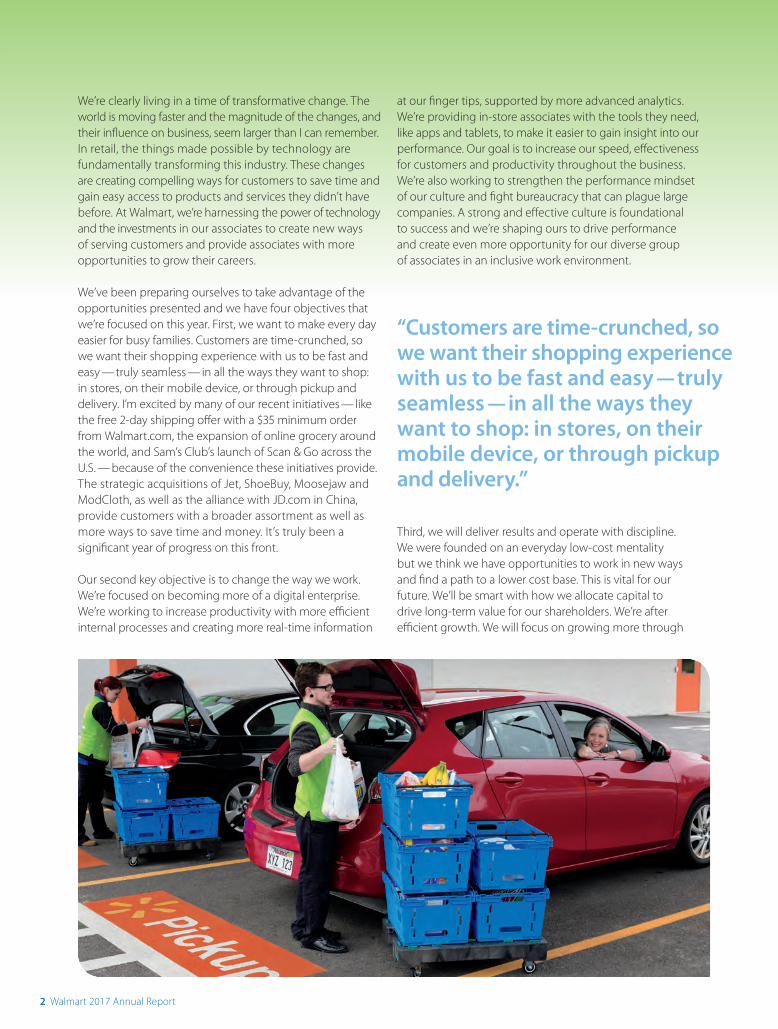
We’ve been preparing ourselves to take advantage of the opportunities presented and we have four objectives that we’re focused on this year. First, we want to make every day easier for busy families. Customers are time-crunched, so we want their shopping experience with us to be fast and easy — truly seamless — in all the ways they want to shop: in stores, on their mobile device, or through pickup and delivery. I’m excited by many of our recent initiatives — like the free 2-day shipping offer with a $35 minimum order from Walmart.com, the expansion of online grocery around the world, and Sam’s Club’s launch of Scan & Go across the U.S. — because of the convenience these initiatives provide. The strategic acquisitions of Jet, ShoeBuy, Moosejaw and ModCloth, as well as the alliance with JD.com in China, provide customers with a broader assortment as well as more ways to save time and money. It’s truly been a significant year of progress on this front.
Our second key objective is to change the way we work. We’re focused on becoming more of a digital enterprise. We’re working to increase productivity with more efficient internal processes and creating more real-time information
at our finger tips, supported by more advanced analytics. We’re providing in-store associates with the tools they need, like apps and tablets, to make it easier to gain insight into our performance. Our goal is to increase our speed, effectiveness for customers and productivity throughout the business. We’re also working to strengthen the performance mindset of our culture and fight bureaucracy that can plague large companies. A strong and effective culture is foundational to success and we’re shaping ours to drive performance and create even more opportunity for our diverse group of associates in an inclusive work environment.
Third, we will deliver results and operate with discipline. We were founded on an everyday low-cost mentality but we think we have opportunities to work in new ways and find a path to a lower cost base. This is vital for our future. We’ll be smart with how we allocate capital to drive long-term value for our shareholders. We’re after efficient growth. We will focus on growing more through
“Customers are time-crunched, so we want their shopping experience with us to be fast and easy — truly seamless — in all the ways they want to shop: in stores, on their mobile device, or through pickup and delivery.”
2 Walmart 2017 Annual Report

e-commerce and comp sales in our current store fleet and rely less on new store growth in the U.S. We’ll also continually look at our portfolio to make sure we’re positioned to win. We’ll invest in our core business with store remodels, technology and customer initiatives like online grocery and pickup, while at the same time being open to divest non-core assets if it’s in our best interest.
The fourth objective is to be the most trusted retailer. During this time of change, customers are watching the companies they spend their time and money with more closely than ever. The way we earn their trust is through our associates doing the right thing every day — being creative, curious, ethical, service oriented and embodying our purpose of making
lives better for others. If everyone could see inside the company I’ve come to love, they would feel even better about the company.
We’re doing things people would expect from Walmart: focusing on lowering prices — not by cutting corners, but by being better at delivering great items more efficiently than our competitors; and constantly innovating to save customers time as well as money. We’re also doing things that might surprise some people. We’ve made significant investments in our associates, providing the career opportunities they deserve and skills necessary to be successful at Walmart or wherever their career takes them. Over the last decade, we’ve become one of the most environmentally sustainable retailers (and companies) in the world and we’re raising the bar even higher. We’re investing in making our supply chain safer and more transparent so customers can be confident that the products they purchase are sourced the right way. And, we have embraced the journey towards the concept of “shared value” as espoused by Dr. Michael Porter of Harvard Business School, which challenges us to create a business model that is not just good for shareholders but better for everyone: customers, associates, suppliers, communities and society in general.
We’ve worked hard over the years to earn the trust of those we serve and do business with around the world. By no means am I saying Walmart is perfect. We’ll make honest mistakes along the way, but we won’t let up until we get it right. Our purpose is simple: we save people money so they can live better. We take both aspects of our purpose seriously.
We want to thank you for believing in us…for investing in our future. We are a company of the future. As I stated earlier, we’re operating from a strong foundation built by those before us and taking action aimed at strengthening our business this year and beyond. We’ll continue to strengthen our stores around the world, we’ll continue to build our e-commerce and digital capabilities, and we’ll put them together in a way that saves customers time and money. And as they choose to shop with us, we’ll be doing things behind the scenes to create shared value for all so they are confident that their trust in us is well-placed.
Honored to serve,
Doug McMillon
Make every day easier for busy families
Be the most trusted retailer
Change how we work
Deliver results and operate with discipline
Our plan to win
Walmart 2017 Annual Report 3
Q: Why is the combination of Walmart and Jet.com such a great strategic fit?
Doug We’re passionate about moving with speed to better serve customers and accelerate our e-commerce growth. That’s why we were so excited to bring Jet into our e-commerce family of brands and to have Marc lead the next chapter of our U.S. e-commerce transformation. Our philosophies on how to best serve customers are well-aligned. The Jet.com team has the expertise, capabilities and assets that will allow us to scale e-commerce faster.
Marc We built Jet.com on three core values: trust, transparency and fairness. All these values empower people — both customers and associates. Those values fit very well with Walmart’s. When you’re transparent with customers and treat them fairly, you build trust. We’re operating Walmart and Jet as distinct brands. Jet indexes strongly with millennial customers and tends to serve a more urban and more affluent customer than Walmart. With our recent acquisitions of ShoeBuy, Moosejaw and ModCloth, we’ve broadened our assortment and expertise in key categories and we’ve brought more premium brands into our ecosystem to continue to drive growth.
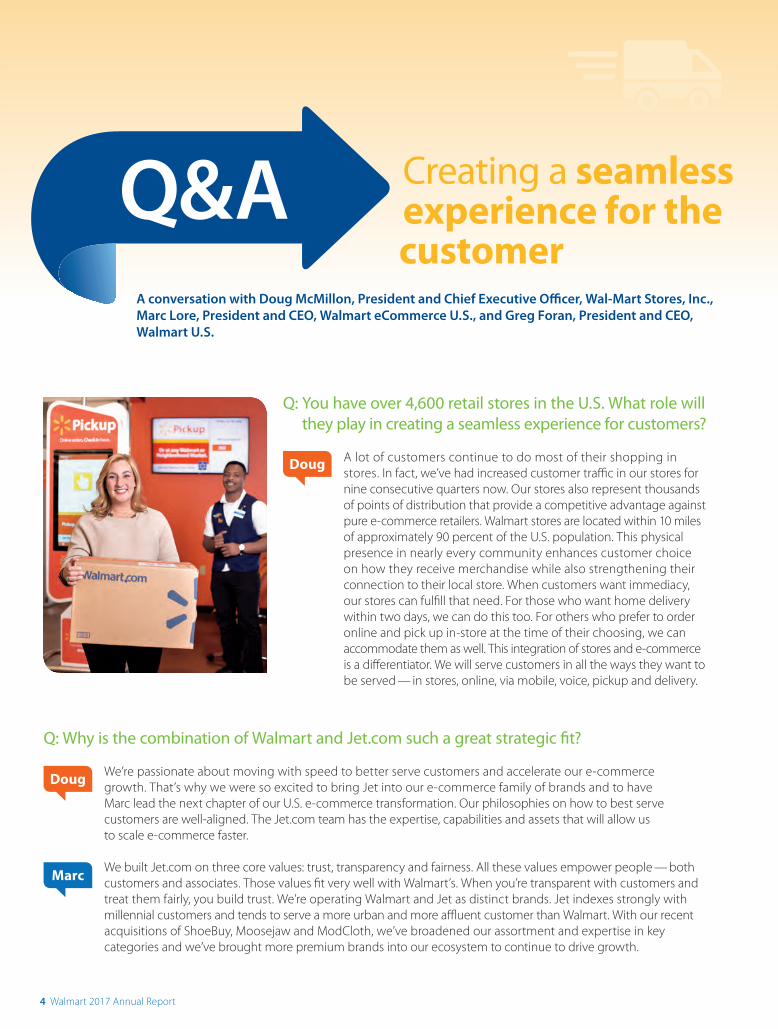
Q: You have over 4,600 retail stores in the U.S. What role will they play in creating a seamless experience for customers?
Doug A lot of customers continue to do most of their shopping in stores. In fact, we’ve had increased customer traffic in our stores for nine consecutive quarters now. Our stores also represent thousands of points of distribution that provide a competitive advantage against pure e-commerce retailers. Walmart stores are located within 10 miles of approximately 90 percent of the U.S. population. This physical presence in nearly every community enhances customer choice on how they receive merchandise while also strengthening their connection to their local store. When customers want immediacy, our stores can fulfill that need. For those who want home delivery within two days, we can do this too. For others who prefer to order online and pick up in-store at the time of their choosing, we can accommodate them as well. This integration of stores and e-commerce is a differentiator. We will serve customers in all the ways they want to be served — in stores, online, via mobile, voice, pickup and delivery.
Creating a seamless experience for the customer
A conversation with Doug McMillon, President and Chief Executive Officer, Wal-Mart Stores, Inc., Marc Lore, President and CEO, Walmart eCommerce U.S., and Greg Foran, President and CEO, Walmart U.S.
Q&A
4 Walmart 2017 Annual Report
Q: What progress has been made on integrating U.S. e-commerce and improving capabilities for customers?
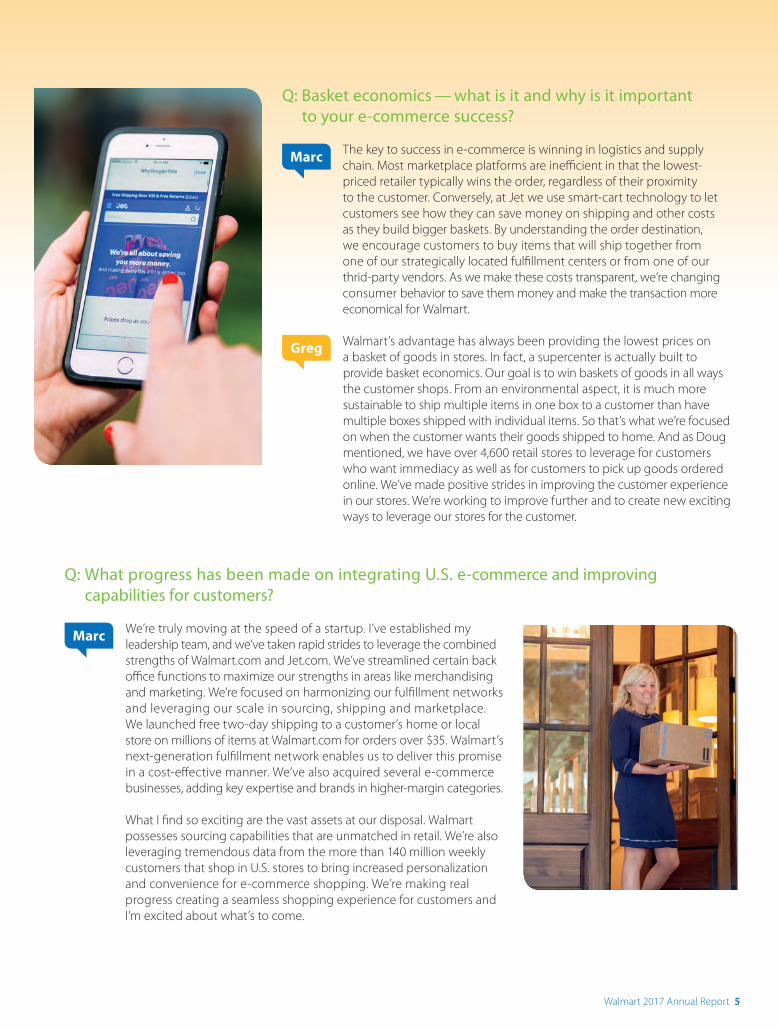
Marc We’re truly moving at the speed of a startup. I’ve established my leadership team, and we’ve taken rapid strides to leverage the combined strengths of Walmart.com and Jet.com. We’ve streamlined certain back office functions to maximize our strengths in areas like merchandising and marketing. We’re focused on harmonizing our fulfillment networks and leveraging our scale in sourcing, shipping and marketplace. We launched free two-day shipping to a customer’s home or local store on millions of items at Walmart.com for orders over $35. Walmart’s next-generation fulfillment network enables us to deliver this promise in a cost-effective manner. We’ve also acquired several e-commerce businesses, adding key expertise and brands in higher-margin categories.
What I find so exciting are the vast assets at our disposal. Walmart possesses sourcing capabilities that are unmatched in retail. We’re also leveraging tremendous data from the more than 140 million weekly customers that shop in U.S. stores to bring increased personalization and convenience for e-commerce shopping. We’re making real progress creating a seamless shopping experience for customers and I’m excited about what’s to come.
Q: Basket economics — what is it and why is it important to your e-commerce success?
Marc The key to success in e-commerce is winning in logistics and supply chain. Most marketplace platforms are inefficient in that the lowest- priced retailer typically wins the order, regardless of their proximity to the customer. Conversely, at Jet we use smart-cart technology to let customers see how they can save money on shipping and other costs as they build bigger baskets. By understanding the order destination, we encourage customers to buy items that will ship together from one of our strategically located fulfillment centers or from one of our thrid-party vendors. As we make these costs transparent, we’re changing consumer behavior to save them money and make the transaction more economical for Walmart.
Greg Walmart’s advantage has always been providing the lowest prices on a basket of goods in stores. In fact, a supercenter is actually built to provide basket economics. Our goal is to win baskets of goods in all ways the customer shops. From an environmental aspect, it is much more sustainable to ship multiple items in one box to a customer than have multiple boxes shipped with individual items. So that’s what we’re focused on when the customer wants their goods shipped to home. And as Doug mentioned, we have over 4,600 retail stores to leverage for customers who want immediacy as well as for customers to pick up goods ordered online. We’ve made positive strides in improving the customer experience in our stores. We’re working to improve further and to create new exciting ways to leverage our stores for the customer.
Walmart 2017 Annual Report 5
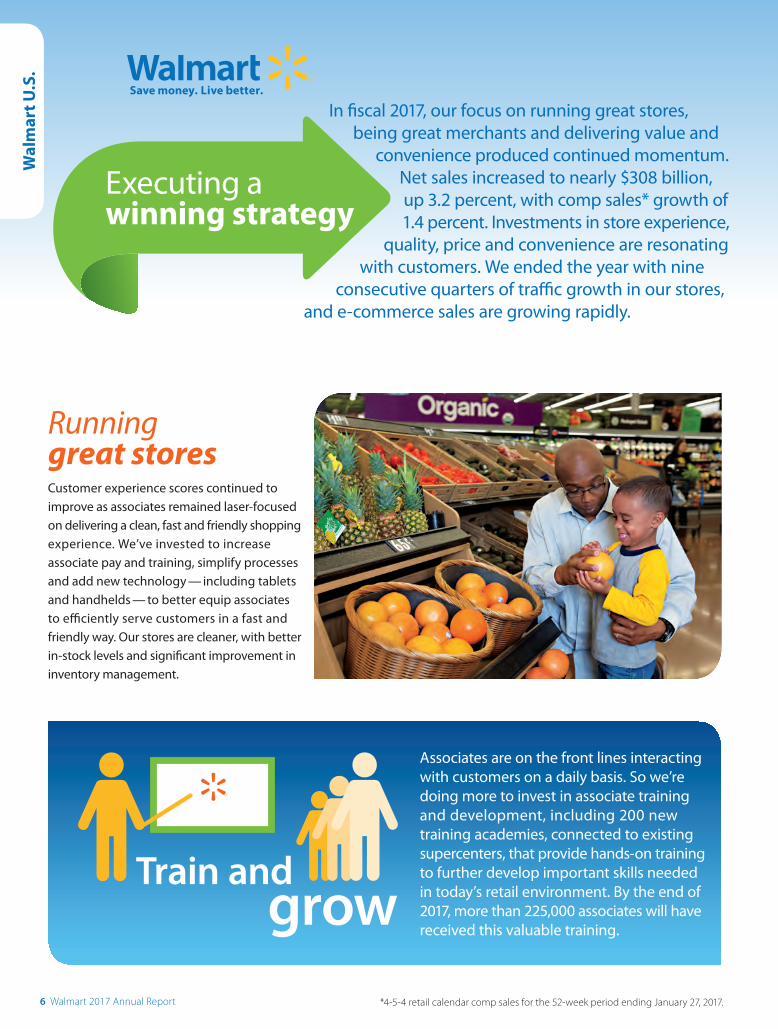
Running great stores Customer experience scores continued to improve as associates remained laser-focused on delivering a clean, fast and friendly shopping experience. We’ve invested to increase associate pay and training, simplify processes and add new technology — including tablets and handhelds — to better equip associates to efficiently serve customers in a fast and friendly way. Our stores are cleaner, with better in-stock levels and significant improvement in inventory management.
Associates are on the front lines interacting with customers on a daily basis. So we’re doing more to invest in associate training and development, including 200 new training academies, connected to existing supercenters, that provide hands-on training to further develop important skills needed in today’s retail environment. By the end of 2017, more than 225,000 associates will have received this valuable training.
Train andgrow
In fiscal 2017, our focus on running great stores, being great merchants and delivering value and
convenience produced continued momentum. Net sales increased to nearly $308 billion, up 3.2 percent, with comp sales* growth of 1.4 percent. Investments in store experience,
quality, price and convenience are resonating with customers. We ended the year with nine
consecutive quarters of traffic growth in our stores, and e-commerce sales are growing rapidly.
Executing a winning strategy
*4-5-4 retail calendar comp sales for the 52-week period ending January 27, 2017.
Wal
mar
t U.S
.
6 Walmart 2017 Annual Report
Providing convenienceWe’re committed to saving customers time. Only Walmart can deliver a seamless shopping experience at scale by combining the power of stores with digital innovation. Customers love the convenience of Online Grocery, now available in over 600 stores, with more than 500 additional locations coming in fiscal 2018. Innovations like Walmart Pay and pharmacy express lanes make checkout fast and easy in our stores. And, with our free 2-day shipping offer, customers can place an order of $35 or more on Walmart.com and have it delivered to their doorstep within two days, without needing a membership.
Delivering value Walmart was built on a foundation of saving customers money — it helps us become the most trusted retailer — and today we remain deeply committed to everyday low prices. To deliver on this promise, we’re focused on driving everyday low cost (EDLC) through cost of goods savings and supply chain efficiencies, and by increasingly leveraging technology to change how we work. These savings help fund a portion of our multiyear strategy of incremental price investment to reinforce our customer value proposition.
Being great merchantsAssortment is the lifeblood of retail — it drives traffic, sales and brand excitement. We’re using data and analytics to tailor our assortment for customers — both what’s on their shopping list and what they didn’t know they needed. We’ve seen strength in key traffic-driving categories like grocery and health & wellness. Customers are responding to the improvements in fresh quality and presentation, as well as private brand quality, innovation and broader assortment.
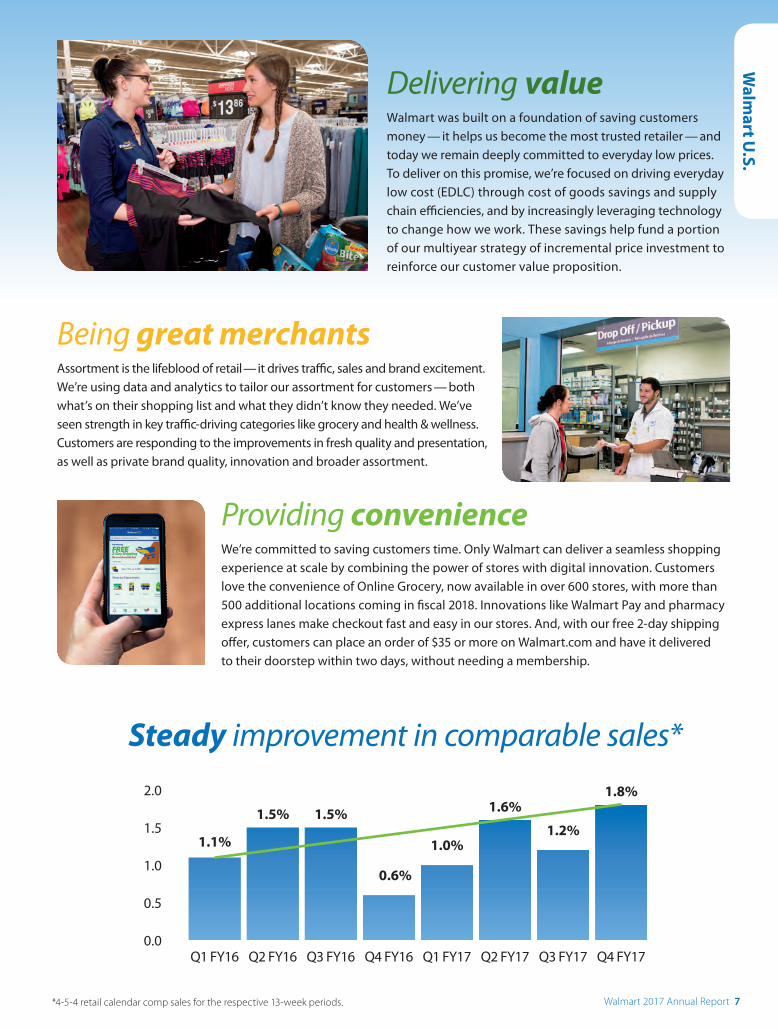
Steady improvement in comparable sales*
0.0
0.5
1.0
1.5
2.0
Q1 FY16 Q4 FY17Q3 FY17Q2 FY17Q1 FY17Q4 FY16Q3 FY16Q2 FY16
1.1%
1.8%
1.2%
1.6%
1.0%
0.6%
1.5%1.5%
*4-5-4 retail calendar comp sales for the respective 13-week periods.
Walm
art U.S.
Walmart 2017 Annual Report 7
Actively manage the portfolioIn order to grow our business profitably, we’re making strategic choices to simplify our portfolio and be more focused. For example, we’ve sold non-core assets like shopping malls in Chile and the Suburbia clothing chain in Mexico. Our emphasis for capital allocation is on our core North American markets (Mexico & Canada) and key growth markets (China & India). We are intentionally focused on investing in markets, channels, and formats that position us to win.
Be the lowest cost operatorWe’re deeply committed to being the lowest cost operator. By driving savings through our cost analytics program in areas such as sourcing, supply chain, and operational efficiencies, we can fund growth and lower prices for customers. We’ve increased our vertical integration, improved logistics and leveraged new data tools to expand our cost advantage.
Build strong foundationsWe are increasingly focused on training and developing world-class talent throughout our markets and empowering them to lead us into the next generation of retail. This year several leaders received new CEO appointments within various countries across our portfolio. In addition, International continues to serve as an exporter of officer-level talent to the U.S. businesses. Whether through automation, analytics, or mobile payment solutions, we will also continue to digitally transform our business. As always, we remain committed to being the most trusted retailer in the world.
Disciplined growth through differentiated customer proposition We are focused on expanding price leadership, driving private brand penetration, and continually improving our fresh offering. In addition, e-commerce will be a key growth engine in the future, and we are rapidly developing our capabilities in this area, including the use of alliances such as the one recently completed with JD.com in China.
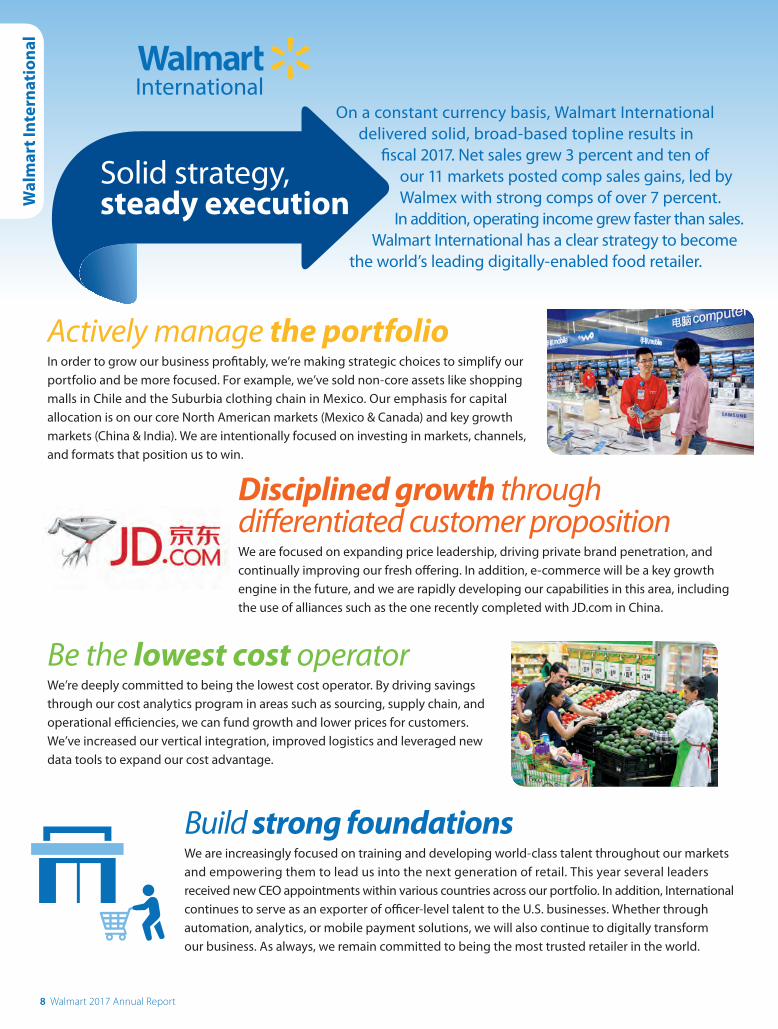
Solid strategy, steady execution
On a constant currency basis, Walmart International delivered solid, broad-based topline results in
fiscal 2017. Net sales grew 3 percent and ten of our 11 markets posted comp sales gains, led by Walmex with strong comps of over 7 percent.
In addition, operating income grew faster than sales. Walmart International has a clear strategy to become
the world’s leading digitally-enabled food retailer.
Wal
mar
t In
tern
atio
nal
International
8 Walmart 2017 Annual Report
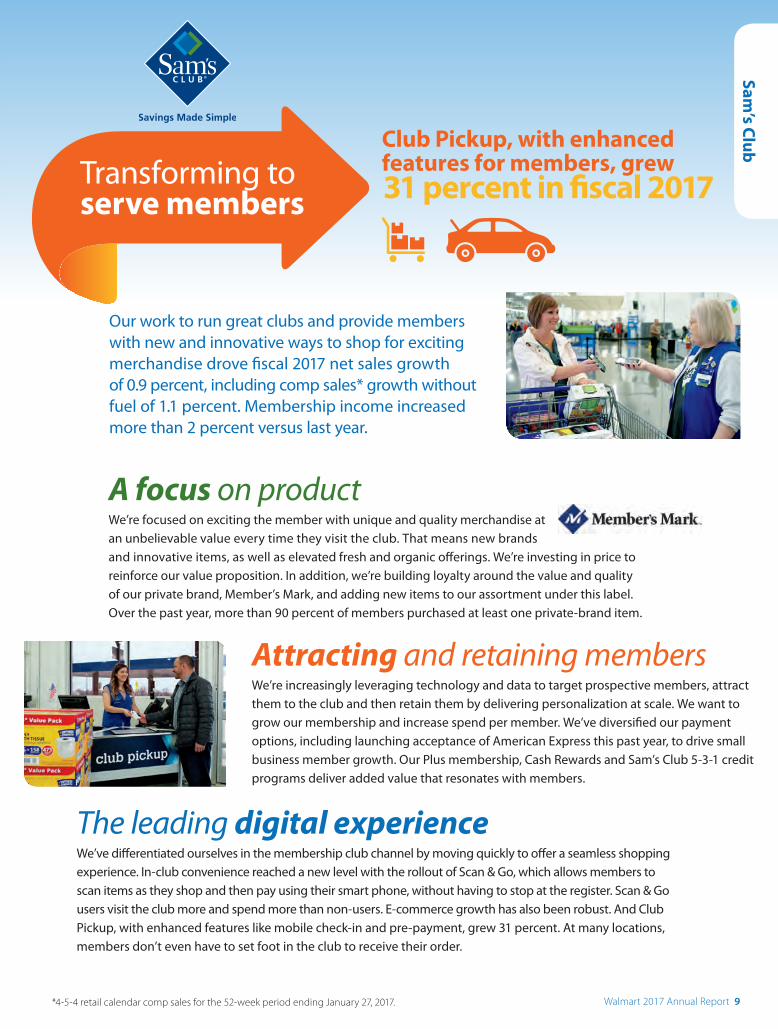
Our work to run great clubs and provide members with new and innovative ways to shop for exciting merchandise drove fiscal 2017 net sales growth of 0.9 percent, including comp sales* growth without fuel of 1.1 percent. Membership income increased more than 2 percent versus last year.
Attracting and retaining membersWe’re increasingly leveraging technology and data to target prospective members, attract them to the club and then retain them by delivering personalization at scale. We want to grow our membership and increase spend per member. We’ve diversified our payment options, including launching acceptance of American Express this past year, to drive small business member growth. Our Plus membership, Cash Rewards and Sam’s Club 5-3-1 credit programs deliver added value that resonates with members.
The leading digital experience We’ve differentiated ourselves in the membership club channel by moving quickly to offer a seamless shopping experience. In-club convenience reached a new level with the rollout of Scan & Go, which allows members to scan items as they shop and then pay using their smart phone, without having to stop at the register. Scan & Go users visit the club more and spend more than non-users. E-commerce growth has also been robust. And Club Pickup, with enhanced features like mobile check-in and pre-payment, grew 31 percent. At many locations, members don’t even have to set foot in the club to receive their order.
A focus on product We’re focused on exciting the member with unique and quality merchandise at an unbelievable value every time they visit the club. That means new brands and innovative items, as well as elevated fresh and organic offerings. We’re investing in price to reinforce our value proposition. In addition, we’re building loyalty around the value and quality of our private brand, Member’s Mark, and adding new items to our assortment under this label. Over the past year, more than 90 percent of members purchased at least one private-brand item.
Transforming to serve members
Club Pickup, with enhanced features for members, grew 31 percent in fiscal 2017
Sam’s C
lub
*4-5-4 retail calendar comp sales for the 52-week period ending January 27, 2017. Walmart 2017 Annual Report 9

2.3 millionDedicated associates globally
Our U.S. Academy training and development program will
graduate 225,000 associates by the end of 2017
75% of our U.S. store management teams started as hourly associates
We invested $2.7 billion in the U.S. over the past two years in education, higher wages and training
We plan to hire 250,000 discharged U.S. veterans by 2020
Our associates: Moving faster to win the future
10 Walmart 2017 Annual Report
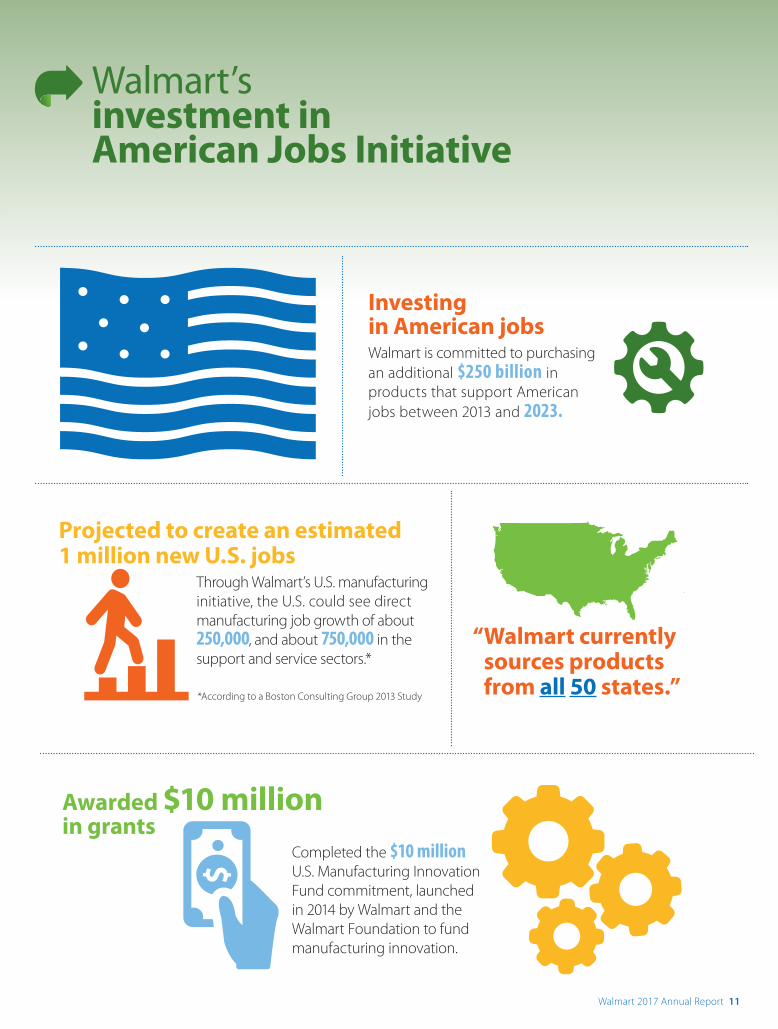
Investing in American jobsWalmart is committed to purchasing an additional $250 billion in products that support American jobs between 2013 and 2023.
Projected to create an estimated 1 million new U.S. jobs
Through Walmart’s U.S. manufacturing initiative, the U.S. could see direct manufacturing job growth of about 250,000, and about 750,000 in the support and service sectors.*
Awarded $10 million in grants
*According to a Boston Consulting Group 2013 Study
Completed the $10 million U.S. Manufacturing Innovation Fund commitment, launched in 2014 by Walmart and the Walmart Foundation to fund manufacturing innovation.
Walmart’s investment in American Jobs Initiative
“ Walmart currently sources products from all 50 states.”
Walmart 2017 Annual Report 11
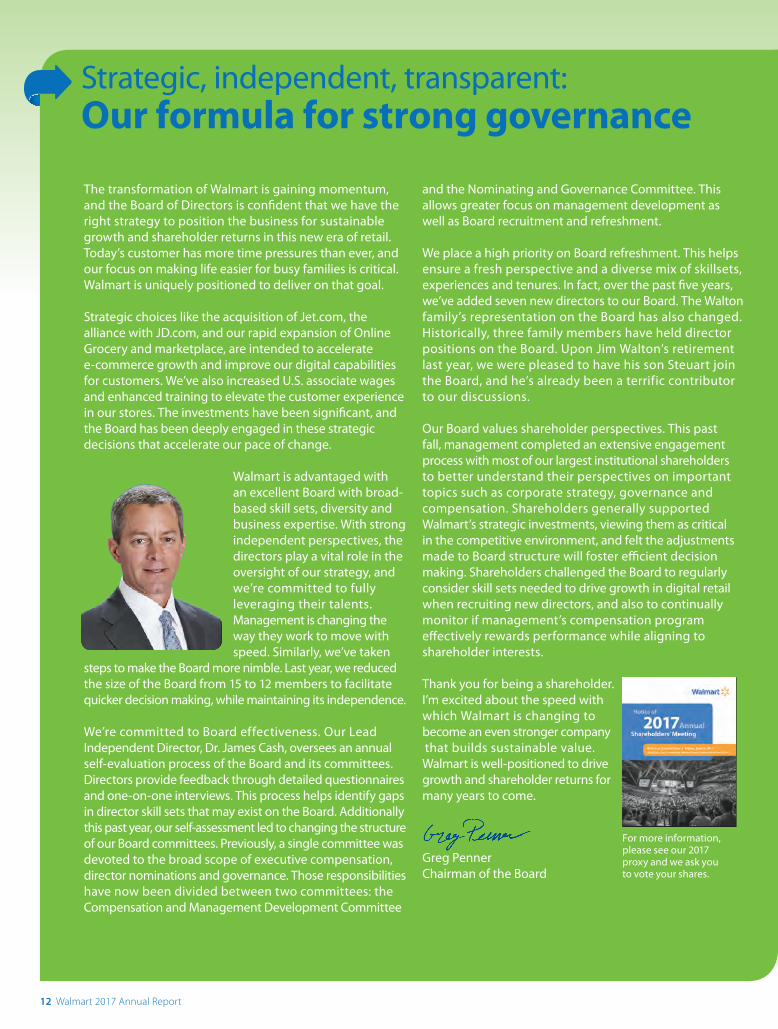
The transformation of Walmart is gaining momentum, and the Board of Directors is confident that we have the right strategy to position the business for sustainable growth and shareholder returns in this new era of retail. Today’s customer has more time pressures than ever, and our focus on making life easier for busy families is critical. Walmart is uniquely positioned to deliver on that goal.
Strategic choices like the acquisition of Jet.com, the alliance with JD.com, and our rapid expansion of Online Grocery and marketplace, are intended to accelerate e-commerce growth and improve our digital capabilities for customers. We’ve also increased U.S. associate wages and enhanced training to elevate the customer experience in our stores. The investments have been significant, and the Board has been deeply engaged in these strategic decisions that accelerate our pace of change.
Walmart is advantaged with an excellent Board with broad- based skill sets, diversity and business expertise. With strong independent perspectives, the directors play a vital role in the oversight of our strategy, and we’re committed to fully leveraging their talents. Management is changing the way they work to move with speed. Similarly, we’ve taken
steps to make the Board more nimble. Last year, we reduced the size of the Board from 15 to 12 members to facilitate quicker decision making, while maintaining its independence.
We’re committed to Board effectiveness. Our Lead Independent Director, Dr. James Cash, oversees an annual self-evaluation process of the Board and its committees. Directors provide feedback through detailed questionnaires and one-on-one interviews. This process helps identify gaps in director skill sets that may exist on the Board. Additionally this past year, our self-assessment led to changing the structure of our Board committees. Previously, a single committee was devoted to the broad scope of executive compensation, director nominations and governance. Those responsibilities have now been divided between two committees: the Compensation and Management Development Committee
and the Nominating and Governance Committee. This allows greater focus on management development as well as Board recruitment and refreshment.
We place a high priority on Board refreshment. This helps ensure a fresh perspective and a diverse mix of skillsets, experiences and tenures. In fact, over the past five years, we’ve added seven new directors to our Board. The Walton family’s representation on the Board has also changed. Historically, three family members have held director positions on the Board. Upon Jim Walton’s retirement last year, we were pleased to have his son Steuart join the Board, and he’s already been a terrific contributor to our discussions.
Our Board values shareholder perspectives. This past fall, management completed an extensive engagement process with most of our largest institutional shareholders to better understand their perspectives on important topics such as corporate strategy, governance and compensation. Shareholders generally supported Walmart’s strategic investments, viewing them as critical in the competitive environment, and felt the adjustments made to Board structure will foster efficient decision making. Shareholders challenged the Board to regularly consider skill sets needed to drive growth in digital retail when recruiting new directors, and also to continually monitor if management’s compensation program effectively rewards performance while aligning to shareholder interests.
Thank you for being a shareholder. I’m excited about the speed with which Walmart is changing to become an even stronger company that builds sustainable value. Walmart is well-positioned to drive growth and shareholder returns for many years to come.
Greg PennerChairman of the Board
Strategic, independent, transparent: Our formula for strong governance
For more information, please see our 2017 proxy and we ask you to vote your shares.
12 Walmart 2017 Annual Report

James I. Cash, Jr., Ph.D. (Lead Independent Director) Dr. Cash is the James E. Robison Professor of Business Administration, Emeritus at Harvard Business School, where he served from July 1976 to October 2003.
Steuart L. Walton
Steuart L. Walton is the chief executive officer of Game Composites, Ltd., a company he founded in 2013 that designs and builds small composite aircraft.
Pamela J. CraigMs. Craig is the retired Chief Financial Officer of Accenture plc, a global management consulting, technology services, and outsourcing company.
Timothy P. FlynnMr. Flynn is the retired Chairman of KPMG International, a professional services firm.
Thomas W. HortonMr. Horton is the former Chairman of American Airlines Group Inc. and the former Chairman of American Airlines, Inc. He also previously served as the Chairman and Chief Executive Officer of AMR Corporation and CEO of American Airlines, Inc.
Marissa A. MayerMs. Mayer is the Chief Executive Officer and President and Director of Yahoo!, Inc., a digital media company.
C. Douglas McMillonMr. McMillon is the President and Chief Executive Officer of Wal-Mart Stores, Inc.
Linda S. WolfMs. Wolf is the retired Chairman of the Board of Directors and Chief Executive Officer of Leo Burnett Worldwide, Inc., an advertising agency and division of Publicis Groupe S.A.
Steven S ReinemundMr. Reinemund is the retired Dean of Business and Professor of Leadership and Strategy at Wake Forest University. He previously served as the Chairman of the Board and Chairman and Chief Executive Officer of PepsiCo, Inc.
S. Robson WaltonMr. Walton is the retired Chairman of the Board of Directors of Wal-Mart Stores, Inc.
Kevin Y. SystromMr. Systrom is the Chief Executive Officer and co-founder of Instagram, a social media application.
Gregory B. Penner (Chairman)
Mr. Penner is the Chairman of the Board of Directors of Wal-Mart Stores, Inc. and a General Partner at Madrone Capital Partners, an investment firm.
Board Committees:
Name Audit
Compensation & Management Development
Nominating & Governance Executive
Global Compensation
Strategic Planning & Finance
Technology & e-commerce
James I. Cash, Jr., Ph.D.(FE) (C)
Pamela J. Craig
Timothy P. Flynn(FE) (C)
Thomas W. Horton(FE)
Marissa A. Mayer
C. Douglas McMillon (C) (C)
Name Audit
Compensation & Management Development
Nominating & Governance Executive
Global Compensation
Strategic Planning & Finance
Technology & e-commerce
Gregory B. Penner(*)
Steven S Reinemund (C)
Kevin Y. Systrom (C)
S. Robson Walton
Steuart L. Walton
Linda S. Wolf (C)
(*) Chairman (C) Committee Chair (FE) Financial Expert
Board of Directors
Walmart 2017 Annual Report 13
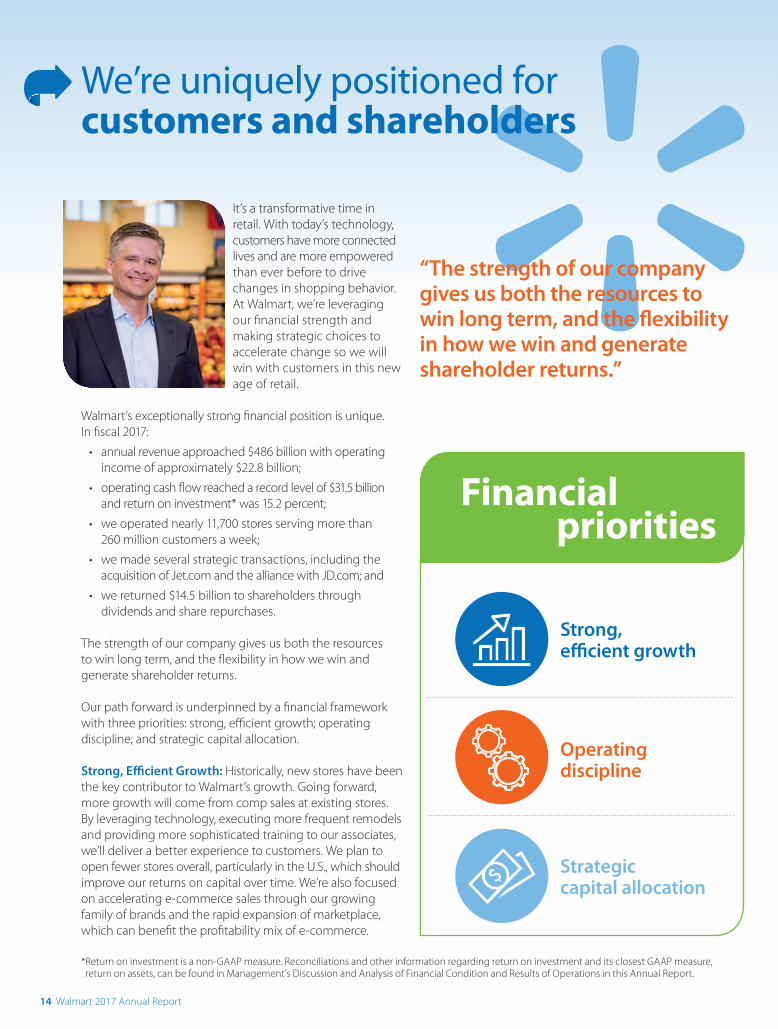
It’s a transformative time in retail. With today’s technology, customers have more connected lives and are more empowered than ever before to drive changes in shopping behavior. At Walmart, we’re leveraging our financial strength and making strategic choices to accelerate change so we will win with customers in this new age of retail.
Walmart’s exceptionally strong financial position is unique. In fiscal 2017:
• annual revenue approached $486 billion with operating income of approximately $22.8 billion;
• operating cash flow reached a record level of $31.5 billion and return on investment* was 15.2 percent;
• we operated nearly 11,700 stores serving more than 260 million customers a week;
• we made several strategic transactions, including the acquisition of Jet.com and the alliance with JD.com; and
• we returned $14.5 billion to shareholders through dividends and share repurchases.
The strength of our company gives us both the resources to win long term, and the flexibility in how we win and generate shareholder returns.
Our path forward is underpinned by a financial framework with three priorities: strong, efficient growth; operating discipline; and strategic capital allocation.
Strong, Efficient Growth: Historically, new stores have been the key contributor to Walmart’s growth. Going forward, more growth will come from comp sales at existing stores. By leveraging technology, executing more frequent remodels and providing more sophisticated training to our associates, we’ll deliver a better experience to customers. We plan to open fewer stores overall, particularly in the U.S., which should improve our returns on capital over time. We’re also focused on accelerating e-commerce sales through our growing family of brands and the rapid expansion of marketplace, which can benefit the profitability mix of e-commerce.
We’re uniquely positioned for customers and shareholders
Strong, efficient growth
Operating discipline
Strategiccapital allocation
Financial priorities
“The strength of our company gives us both the resources to win long term, and the flexibility in how we win and generate shareholder returns.”
* Return on investment is a non-GAAP measure. Reconciliations and other information regarding return on investment and its closest GAAP measure, return on assets, can be found in Management’s Discussion and Analysis of Financial Condition and Results of Operations in this Annual Report.
14 Walmart 2017 Annual Report
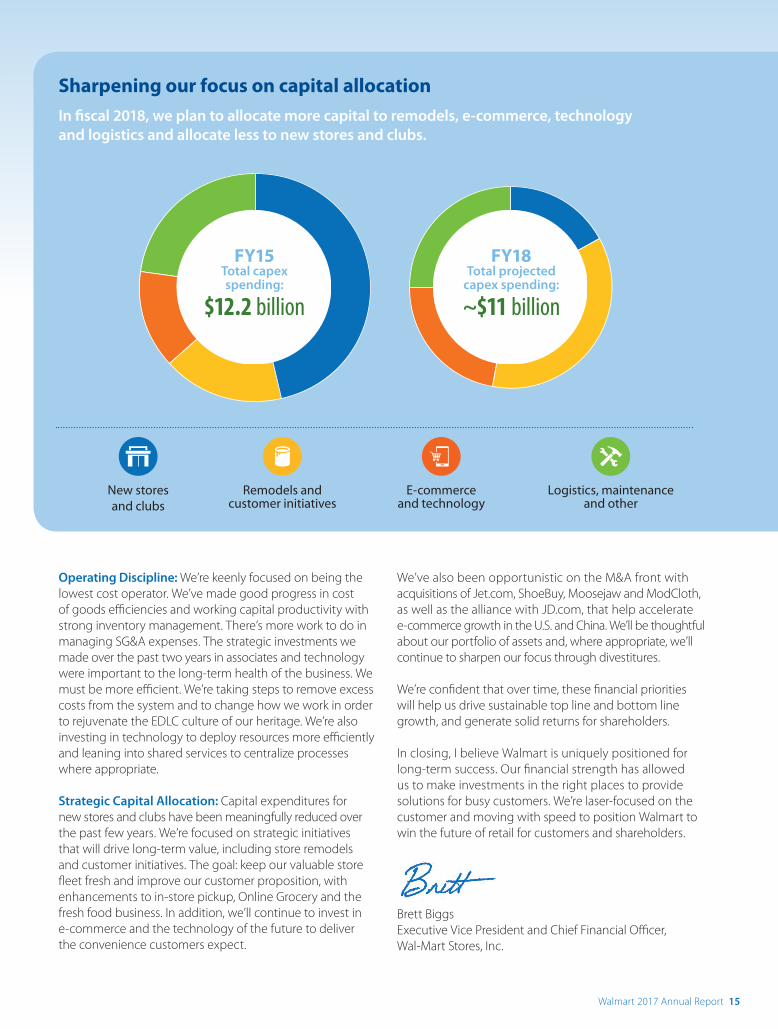
New stores and clubs
Logistics, maintenance and other
Remodels and customer initiatives
E-commerce and technology
FY18 Total projected
capex spending:
~$11 billion
FY15 Total capexspending:
$12.2 billion
Sharpening our focus on capital allocation
In fiscal 2018, we plan to allocate more capital to remodels, e-commerce, technology and logistics and allocate less to new stores and clubs.
Operating Discipline: We’re keenly focused on being the lowest cost operator. We’ve made good progress in cost of goods efficiencies and working capital productivity with strong inventory management. There’s more work to do in managing SG&A expenses. The strategic investments we made over the past two years in associates and technology were important to the long-term health of the business. We must be more efficient. We’re taking steps to remove excess costs from the system and to change how we work in order to rejuvenate the EDLC culture of our heritage. We’re also investing in technology to deploy resources more efficiently and leaning into shared services to centralize processes where appropriate.
Strategic Capital Allocation: Capital expenditures for new stores and clubs have been meaningfully reduced over the past few years. We’re focused on strategic initiatives that will drive long-term value, including store remodels and customer initiatives. The goal: keep our valuable store fleet fresh and improve our customer proposition, with enhancements to in-store pickup, Online Grocery and the fresh food business. In addition, we’ll continue to invest in e-commerce and the technology of the future to deliver the convenience customers expect.
We’ve also been opportunistic on the M&A front with acquisitions of Jet.com, ShoeBuy, Moosejaw and ModCloth, as well as the alliance with JD.com, that help accelerate e-commerce growth in the U.S. and China. We’ll be thoughtful about our portfolio of assets and, where appropriate, we’ll continue to sharpen our focus through divestitures.
We’re confident that over time, these financial priorities will help us drive sustainable top line and bottom line growth, and generate solid returns for shareholders.
In closing, I believe Walmart is uniquely positioned for long-term success. Our financial strength has allowed us to make investments in the right places to provide solutions for busy customers. We’re laser-focused on the customer and moving with speed to position Walmart to win the future of retail for customers and shareholders.
Brett BiggsExecutive Vice President and Chief Financial Officer, Wal-Mart Stores, Inc.
Walmart 2017 Annual Report 15
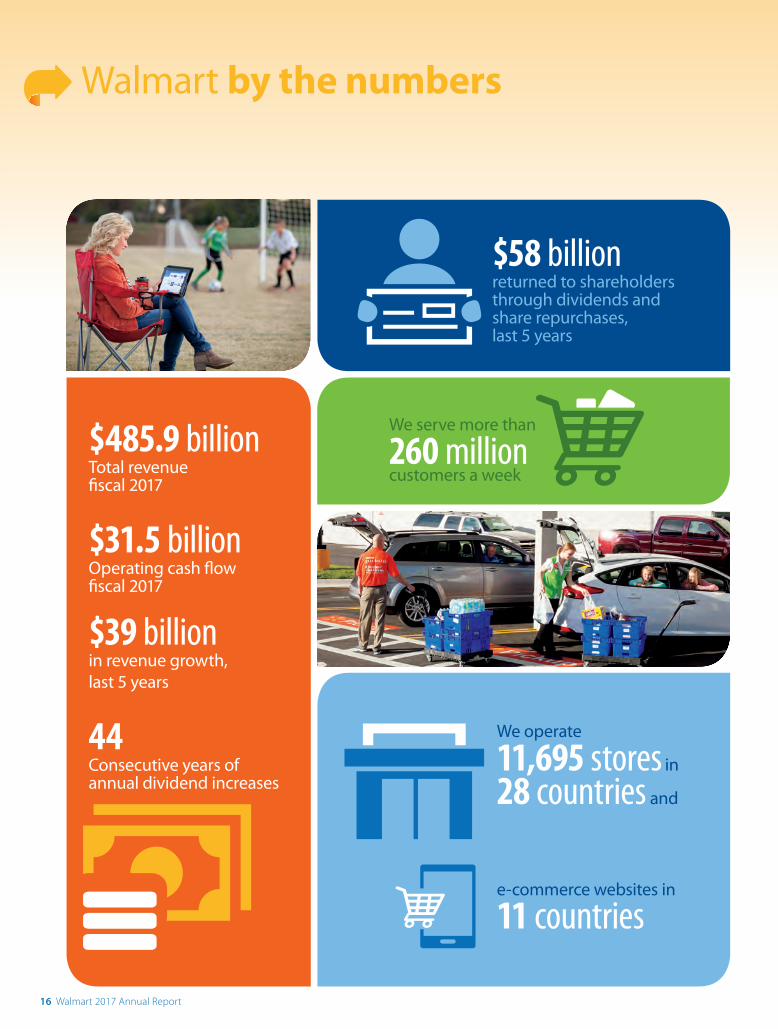
We serve more than
260 million customers a week
$58 billion returned to shareholders through dividends and share repurchases, last 5 years
$485.9 billion Total revenue fiscal 2017
$31.5 billion Operating cash flow fiscal 2017
$39 billion in revenue growth, last 5 years
44Consecutive years of annual dividend increases
We operate
11,695 stores in
28 countries and
e-commerce websites in
11 countries
Walmart by the numbers
16 Walmart 2017 Annual Report
Walmart 2017 Annual Report 17
2017 Financials18 Five-Year Financial Summary
19 Management’s Discussion and Analysis of Financial Condition and Results of Operations
36 Consolidated Statements of Income
37 Consolidated Statements of Comprehensive Income
38 Consolidated Balance Sheets
39 Consolidated Statements of Shareholders’ Equity and Redeemable Noncontrolling Interest
40 Consolidated Statements of Cash Flows
41 Notes to Consolidated Financial Statements
60 Report of Independent Registered Public Accounting Firm
61 Report of Independent Registered Public Accounting Firm on Internal Control Over Financial Reporting
62 Management’s Report to Our Shareholders
63 Unit Counts as of January 31, 2017
64 Corporate and Stock Information
Daniel J. BartlettExecutive Vice President,Corporate Affairs
M. Brett BiggsExecutive Vice President,Chief Financial Officer
Jacqueline P. CanneyExecutive Vice President,Global People
David CheesewrightExecutive Vice President,President and CEO,Walmart International
David M. ChojnowskiSenior Vice Presidentand Controller
Greg S. ForanExecutive Vice President,President and CEO,Walmart U.S.
John FurnerExecutive Vice President,President and CEO,Sam’s Club
Jeffrey J. GearhartExecutive Vice President,Global Governance andCorporate Secretary
Marc LoreExecutive Vice President,President and CEO,Walmart eCommerce U.S.
C. Douglas McMillonPresident and CEO
18 Walmart 2017 Annual Report
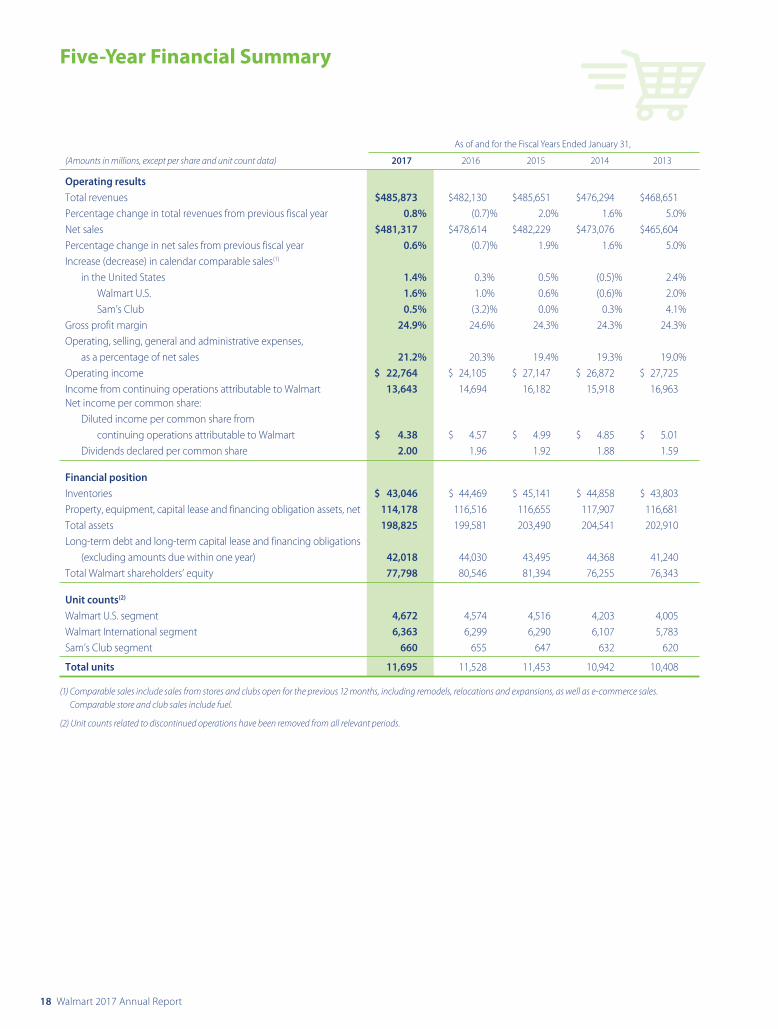
Five-Year Financial Summary
As of and for the Fiscal Years Ended January 31,
(Amounts in millions, except per share and unit count data) 2017 2016 2015 2014 2013
Operating resultsTotal revenues $485,873 $482,130 $485,651 $476,294 $468,651Percentage change in total revenues from previous fiscal year 0.8% (0.7)% 2.0% 1.6% 5.0%Net sales $481,317 $478,614 $482,229 $473,076 $465,604Percentage change in net sales from previous fiscal year 0.6% (0.7)% 1.9% 1.6% 5.0%Increase (decrease) in calendar comparable sales(1) in the United States 1.4% 0.3% 0.5% (0.5)% 2.4% Walmart U.S. 1.6% 1.0% 0.6% (0.6)% 2.0% Sam’s Club 0.5% (3.2)% 0.0% 0.3% 4.1%Gross profit margin 24.9% 24.6% 24.3% 24.3% 24.3%Operating, selling, general and administrative expenses, as a percentage of net sales 21.2% 20.3% 19.4% 19.3% 19.0%Operating income $ 22,764 $ 24,105 $ 27,147 $ 26,872 $ 27,725Income from continuing operations attributable to Walmart 13,643 14,694 16,182 15,918 16,963Net income per common share: Diluted income per common share from continuing operations attributable to Walmart $ 4.38 $ 4.57 $ 4.99 $ 4.85 $ 5.01 Dividends declared per common share 2.00 1.96 1.92 1.88 1.59
Financial positionInventories $ 43,046 $ 44,469 $ 45,141 $ 44,858 $ 43,803Property, equipment, capital lease and financing obligation assets, net 114,178 116,516 116,655 117,907 116,681Total assets 198,825 199,581 203,490 204,541 202,910Long-term debt and long-term capital lease and financing obligations (excluding amounts due within one year) 42,018 44,030 43,495 44,368 41,240Total Walmart shareholders’ equity 77,798 80,546 81,394 76,255 76,343
Unit counts(2)
Walmart U.S. segment 4,672 4,574 4,516 4,203 4,005Walmart International segment 6,363 6,299 6,290 6,107 5,783Sam’s Club segment 660 655 647 632 620
Total units 11,695 11,528 11,453 10,942 10,408
(1) Comparable sales include sales from stores and clubs open for the previous 12 months, including remodels, relocations and expansions, as well as e-commerce sales. Comparable store and club sales include fuel.
(2) Unit counts related to discontinued operations have been removed from all relevant periods.
Walmart 2017 Annual Report 19
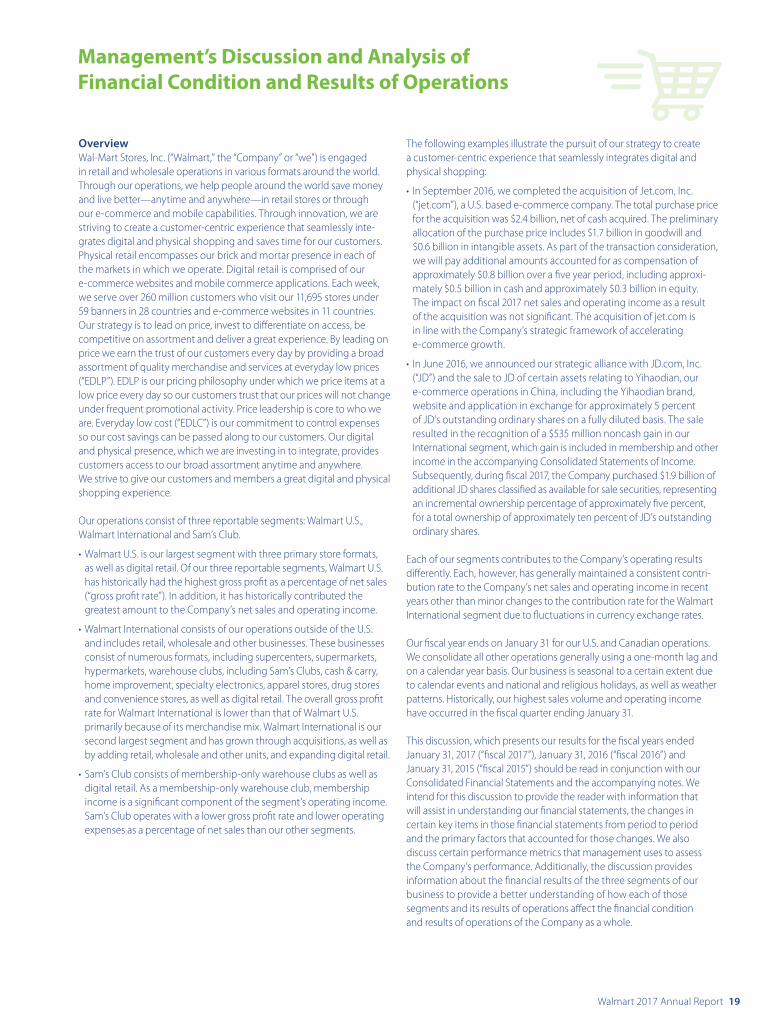
Management’s Discussion and Analysis of Financial Condition and Results of Operations
OverviewWal-Mart Stores, Inc. (“Walmart,” the “Company” or “we”) is engaged in retail and wholesale operations in various formats around the world. Through our operations, we help people around the world save money and live better—anytime and anywhere—in retail stores or through our e-commerce and mobile capabilities. Through innovation, we are striving to create a customer-centric experience that seamlessly inte-grates digital and physical shopping and saves time for our customers. Physical retail encompasses our brick and mortar presence in each of the markets in which we operate. Digital retail is comprised of our e-commerce websites and mobile commerce applications. Each week, we serve over 260 million customers who visit our 11,695 stores under 59 banners in 28 countries and e-commerce websites in 11 countries. Our strategy is to lead on price, invest to differentiate on access, be competitive on assortment and deliver a great experience. By leading on price we earn the trust of our customers every day by providing a broad assortment of quality merchandise and services at everyday low prices (“EDLP”). EDLP is our pricing philosophy under which we price items at a low price every day so our customers trust that our prices will not change under frequent promotional activity. Price leadership is core to who we are. Everyday low cost (“EDLC”) is our commitment to control expenses so our cost savings can be passed along to our customers. Our digital and physical presence, which we are investing in to integrate, provides customers access to our broad assortment anytime and anywhere. We strive to give our customers and members a great digital and physical shopping experience.
Our operations consist of three reportable segments: Walmart U.S., Walmart International and Sam’s Club.
• Walmart U.S. is our largest segment with three primary store formats, as well as digital retail. Of our three reportable segments, Walmart U.S. has historically had the highest gross profit as a percentage of net sales (“gross profit rate”). In addition, it has historically contributed the greatest amount to the Company’s net sales and operating income.
• Walmart International consists of our operations outside of the U.S. and includes retail, wholesale and other businesses. These businesses consist of numerous formats, including supercenters, supermarkets, hypermarkets, warehouse clubs, including Sam’s Clubs, cash & carry, home improvement, specialty electronics, apparel stores, drug stores and convenience stores, as well as digital retail. The overall gross profit rate for Walmart International is lower than that of Walmart U.S. primarily because of its merchandise mix. Walmart International is our second largest segment and has grown through acquisitions, as well as by adding retail, wholesale and other units, and expanding digital retail.
• Sam’s Club consists of membership-only warehouse clubs as well as digital retail. As a membership-only warehouse club, membership income is a significant component of the segment’s operating income. Sam’s Club operates with a lower gross profit rate and lower operating expenses as a percentage of net sales than our other segments.
The following examples illustrate the pursuit of our strategy to create a customer-centric experience that seamlessly integrates digital and physical shopping:
• In September 2016, we completed the acquisition of Jet.com, Inc. (“jet.com”), a U.S. based e-commerce company. The total purchase price for the acquisition was $2.4 billion, net of cash acquired. The preliminary allocation of the purchase price includes $1.7 billion in goodwill and $0.6 billion in intangible assets. As part of the transaction consideration, we will pay additional amounts accounted for as compensation of approximately $0.8 billion over a five year period, including approxi-mately $0.5 billion in cash and approximately $0.3 billion in equity. The impact on fiscal 2017 net sales and operating income as a result of the acquisition was not significant. The acquisition of jet.com is in line with the Company’s strategic framework of accelerating e-commerce growth.
• In June 2016, we announced our strategic alliance with JD.com, Inc. (“JD”) and the sale to JD of certain assets relating to Yihaodian, our e-commerce operations in China, including the Yihaodian brand, website and application in exchange for approximately 5 percent of JD’s outstanding ordinary shares on a fully diluted basis. The sale resulted in the recognition of a $535 million noncash gain in our International segment, which gain is included in membership and other income in the accompanying Consolidated Statements of Income. Subsequently, during fiscal 2017, the Company purchased $1.9 billion of additional JD shares classified as available for sale securities, representing an incremental ownership percentage of approximately five percent, for a total ownership of approximately ten percent of JD’s outstanding ordinary shares.
Each of our segments contributes to the Company’s operating results differently. Each, however, has generally maintained a consistent contri-bution rate to the Company’s net sales and operating income in recent years other than minor changes to the contribution rate for the Walmart International segment due to fluctuations in currency exchange rates.
Our fiscal year ends on January 31 for our U.S. and Canadian operations. We consolidate all other operations generally using a one-month lag and on a calendar year basis. Our business is seasonal to a certain extent due to calendar events and national and religious holidays, as well as weather patterns. Historically, our highest sales volume and operating income have occurred in the fiscal quarter ending January 31.
This discussion, which presents our results for the fiscal years ended January 31, 2017 (“fiscal 2017”), January 31, 2016 (“fiscal 2016”) and January 31, 2015 (“fiscal 2015”) should be read in conjunction with our Consolidated Financial Statements and the accompanying notes. We intend for this discussion to provide the reader with information that will assist in understanding our financial statements, the changes in certain key items in those financial statements from period to period and the primary factors that accounted for those changes. We also discuss certain performance metrics that management uses to assess the Company’s performance. Additionally, the discussion provides information about the financial results of the three segments of our business to provide a better understanding of how each of those segments and its results of operations affect the financial condition and results of operations of the Company as a whole.
20 Walmart 2017 Annual Report
Management’s Discussion and Analysis of Financial Condition and Results of Operations
Throughout this Management’s Discussion and Analysis of Financial Condition and Results of Operations, we discuss segment operating income, comparable store and club sales and other measures. Management measures the results of the Company’s segments using each segment’s operating income, including certain corporate overhead allocations, as well as other measures. From time to time, we revise the measurement of each segment’s operating income, including certain corporate overhead allocations, and other measures as determined by the information regularly reviewed by our chief operating decision maker. When we do so, the previous period amounts and balances are reclassified to conform to the current period’s presentation.
Comparable store and club sales is a metric that indicates the performance of our existing U.S. stores and clubs by measuring the change in sales for such stores and clubs, including e-commerce sales, for a particular period from the corresponding period in the previous year. Walmart’s definition of comparable store and club sales includes sales from stores and clubs open for the previous 12 months, including remodels, relocations, expansions and conversions, as well as e-commerce sales. We measure the e-commerce sales impact by including those sales initi-ated through websites and mobile commerce applications and fulfilled through our e-commerce distribution facilities, as well as an estimate for sales initiated online and on our mobile commerce applications, but fulfilled through our stores and clubs. Sales of a store that has changed in format are excluded from comparable store and club sales when the conversion of that store is accompanied by a relocation or expansion that results in a change in the store’s retail square feet of more than five percent. Additionally, sales related to e-commerce acquisitions are excluded until such acquisitions have been owned for 12 months. Comparable store and club sales are also referred to as “same-store” sales by others within the retail industry. The method of calculating comparable store and club sales varies across the retail industry. As a result, our calculation of comparable store and club sales is not necessarily comparable to similarly titled measures reported by other companies.
In discussing our operating results, we use the term “currency exchange rates” to refer to the currency exchange rates we use to convert the operating results for all countries where the functional currency is not the U.S. dollar into U.S. dollars for financial reporting purposes. We calcu-late the effect of changes in currency exchange rates from the prior period to the current period as the difference between current period activity translated using the current period’s currency exchange rates, and current period activity translated using the comparable prior year period’s currency exchange rates. Throughout our discussion, we refer to the results of this calculation as the impact of currency exchange rate fluctuations. Volatility in currency exchange rates may impact the results, including net sales and operating income, of the Company and the Walmart International segment in the future.
The Retail IndustryWe operate in the highly competitive retail industry in all of the markets we serve. We face strong sales competition from other discount, department, drug, dollar, variety and specialty stores, warehouse clubs and supermarkets, as well as e-commerce and catalog businesses. Many of these competitors are national, regional or international chains or have a national or international online presence. We compete with a number of companies for prime retail site locations, as well as in attracting and retaining quality employees (whom we call “associates”). We, along with other retail companies, are influenced by a number of factors including, but not limited to: catastrophic events, weather, competitive pressures, consumer disposable income, consumer debt levels and buying pat-terns, consumer credit availability, cost of goods, currency exchange rate fluctuations, customer preferences, deflation, inflation, fuel and energy prices, general economic conditions, insurance costs, interest rates, labor costs, tax rates, cybersecurity attacks and unemployment. Further information on the factors that can affect our operating results and on certain risks to our Company and an investment in its securities can be found under “Item 1A. Risk Factors” in our Annual Report on Form 10-K for the fiscal year ended January 31, 2017, and in the discussion under “Cautionary Statement Regarding Forward-Looking Statements and Information” in our Annual Report on Form 10-K for the fiscal year ended January 31, 2017.
Company Performance MetricsWe are committed to helping customers save money and live better through everyday low prices, supported by everyday low costs. At times, we adjust our business strategies to maintain and strengthen our com-petitive positions in the countries in which we operate. For several years, our performance metrics emphasized three financial priorities: growth, expense leverage and returns. We are currently making strategic invest-ments in our associates and in the integration of digital and physical retail. These investments support long-term growth while we maintain our heritage of everyday low prices which are supported by everyday low cost. During this time of increased investments, we are focused pri-marily on growth, balanced by the long-term health of the Company including expense leverage and returns. Although we will continue to grow through new stores and clubs, our growth going forward will rely more on increasing comparable store and club sales and accelerating e-commerce sales growth.
Our objective of balancing growth with returns means that we are focused on efficiently employing assets for return on investment and more effectively managing working capital to deliver strong free cash flow. We plan to provide returns to our shareholders through share repurchases and dividends.
Walmart 2017 Annual Report 21
Management’s Discussion and Analysis of Financial Condition and Results of Operations
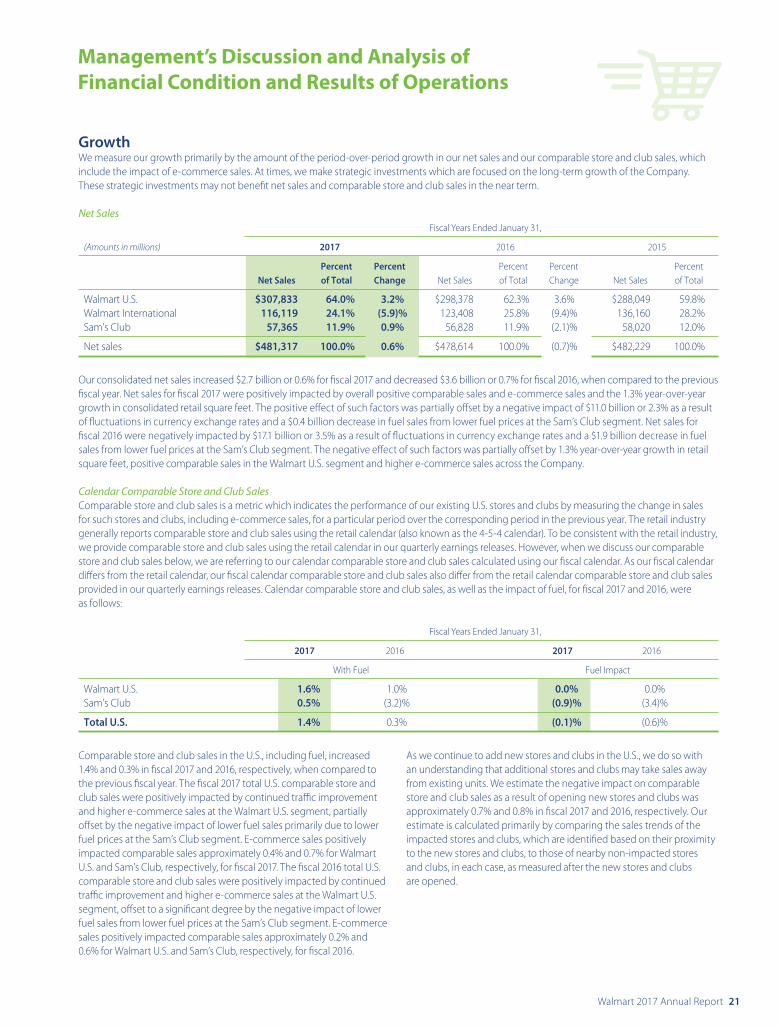
GrowthWe measure our growth primarily by the amount of the period-over-period growth in our net sales and our comparable store and club sales, which include the impact of e-commerce sales. At times, we make strategic investments which are focused on the long-term growth of the Company. These strategic investments may not benefit net sales and comparable store and club sales in the near term.
Net Sales Fiscal Years Ended January 31,
(Amounts in millions) 2017 2016 2015
Percent Percent Percent Percent Percent Net Sales of Total Change Net Sales of Total Change Net Sales of Total
Walmart U.S. $307,833 64.0% 3.2% $298,378 62.3% 3.6% $288,049 59.8%Walmart International 116,119 24.1% (5.9)% 123,408 25.8% (9.4)% 136,160 28.2%Sam’s Club 57,365 11.9% 0.9% 56,828 11.9% (2.1)% 58,020 12.0%
Net sales $481,317 100.0% 0.6% $478,614 100.0% (0.7)% $482,229 100.0%
Our consolidated net sales increased $2.7 billion or 0.6% for fiscal 2017 and decreased $3.6 billion or 0.7% for fiscal 2016, when compared to the previous fiscal year. Net sales for fiscal 2017 were positively impacted by overall positive comparable sales and e-commerce sales and the 1.3% year-over-year growth in consolidated retail square feet. The positive effect of such factors was partially offset by a negative impact of $11.0 billion or 2.3% as a result of fluctuations in currency exchange rates and a $0.4 billion decrease in fuel sales from lower fuel prices at the Sam’s Club segment. Net sales for fiscal 2016 were negatively impacted by $17.1 billion or 3.5% as a result of fluctuations in currency exchange rates and a $1.9 billion decrease in fuel sales from lower fuel prices at the Sam’s Club segment. The negative effect of such factors was partially offset by 1.3% year-over-year growth in retail square feet, positive comparable sales in the Walmart U.S. segment and higher e-commerce sales across the Company.
Calendar Comparable Store and Club SalesComparable store and club sales is a metric which indicates the performance of our existing U.S. stores and clubs by measuring the change in sales for such stores and clubs, including e-commerce sales, for a particular period over the corresponding period in the previous year. The retail industry generally reports comparable store and club sales using the retail calendar (also known as the 4-5-4 calendar). To be consistent with the retail industry, we provide comparable store and club sales using the retail calendar in our quarterly earnings releases. However, when we discuss our comparable store and club sales below, we are referring to our calendar comparable store and club sales calculated using our fiscal calendar. As our fiscal calendar differs from the retail calendar, our fiscal calendar comparable store and club sales also differ from the retail calendar comparable store and club sales provided in our quarterly earnings releases. Calendar comparable store and club sales, as well as the impact of fuel, for fiscal 2017 and 2016, were as follows:
Fiscal Years Ended January 31,
2017 2016 2017 2016
With Fuel Fuel Impact
Walmart U.S. 1.6% 1.0% 0.0% 0.0%Sam’s Club 0.5% (3.2)% (0.9)% (3.4)%
Total U.S. 1.4% 0.3% (0.1)% (0.6)%
Comparable store and club sales in the U.S., including fuel, increased 1.4% and 0.3% in fiscal 2017 and 2016, respectively, when compared to the previous fiscal year. The fiscal 2017 total U.S. comparable store and club sales were positively impacted by continued traffic improvement and higher e-commerce sales at the Walmart U.S. segment, partially offset by the negative impact of lower fuel sales primarily due to lower fuel prices at the Sam’s Club segment. E-commerce sales positively impacted comparable sales approximately 0.4% and 0.7% for Walmart U.S. and Sam’s Club, respectively, for fiscal 2017. The fiscal 2016 total U.S. comparable store and club sales were positively impacted by continued traffic improvement and higher e-commerce sales at the Walmart U.S. segment, offset to a significant degree by the negative impact of lower fuel sales from lower fuel prices at the Sam’s Club segment. E-commerce sales positively impacted comparable sales approximately 0.2% and 0.6% for Walmart U.S. and Sam’s Club, respectively, for fiscal 2016.
As we continue to add new stores and clubs in the U.S., we do so with an understanding that additional stores and clubs may take sales away from existing units. We estimate the negative impact on comparable store and club sales as a result of opening new stores and clubs was approximately 0.7% and 0.8% in fiscal 2017 and 2016, respectively. Our estimate is calculated primarily by comparing the sales trends of the impacted stores and clubs, which are identified based on their proximity to the new stores and clubs, to those of nearby non-impacted stores and clubs, in each case, as measured after the new stores and clubs are opened.
22 Walmart 2017 Annual Report
Management’s Discussion and Analysis of Financial Condition and Results of Operations
ReturnsWhile we are focused primarily on growth, we also place a priority on generating returns to ensure our approach is appropriately balanced. We generate returns by efficiently deploying assets and effectively managing working capital. We monitor these efforts through our return on investment and free cash flow metrics, which we discuss below. In addition, we are focused on providing returns to our shareholders in the form of share repurchases and dividends, which are discussed in the Liquidity and Capital Resources section.
We include Return on Assets (“ROA”), the most directly comparable measure based on our financial statements presented in accordance with generally accepted accounting principles in the U.S. (“GAAP”), and Return on Investment (“ROI”) as metrics to assess returns on assets.
Return on Assets and Return on InvestmentManagement believes ROI is a meaningful metric to share with investors because it helps investors assess how effectively Walmart is deploying its assets. Trends in ROI can fluctuate over time as management balances long-term potential strategic initiatives with possible short-term impacts. We consider ROA to be the financial measure computed in accordance with GAAP that is the most directly comparable financial measure to our calculation of ROI.
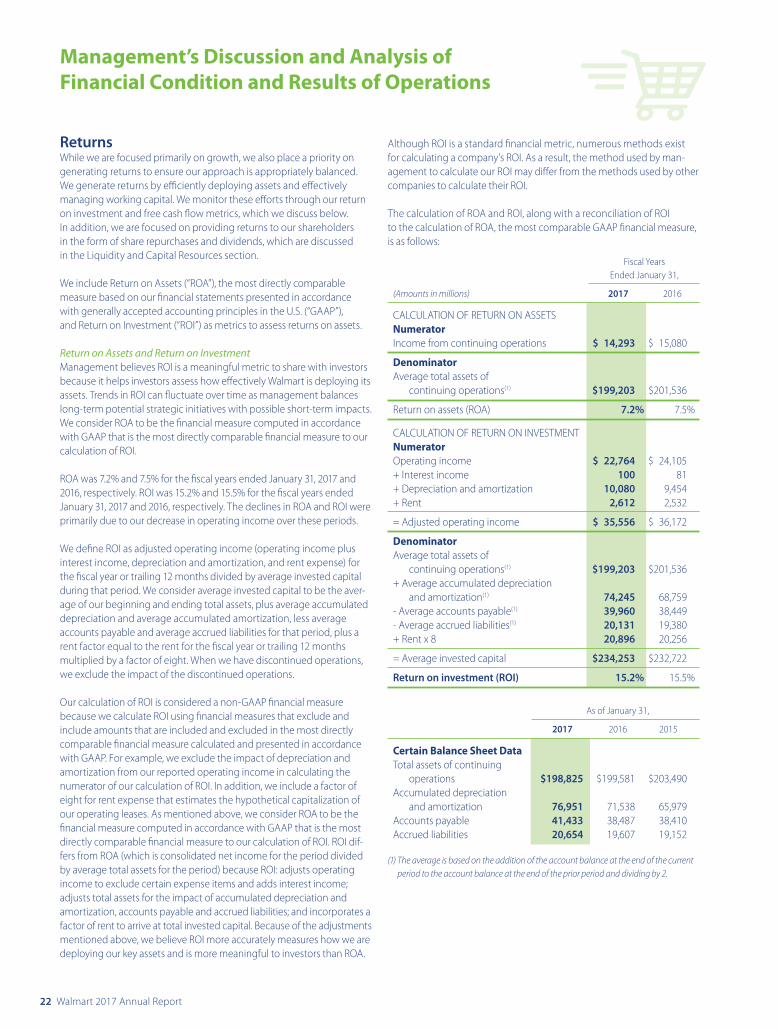
ROA was 7.2% and 7.5% for the fiscal years ended January 31, 2017 and 2016, respectively. ROI was 15.2% and 15.5% for the fiscal years ended January 31, 2017 and 2016, respectively. The declines in ROA and ROI were primarily due to our decrease in operating income over these periods.
We define ROI as adjusted operating income (operating income plus interest income, depreciation and amortization, and rent expense) for the fiscal year or trailing 12 months divided by average invested capital during that period. We consider average invested capital to be the aver-age of our beginning and ending total assets, plus average accumulated depreciation and average accumulated amortization, less average accounts payable and average accrued liabilities for that period, plus a rent factor equal to the rent for the fiscal year or trailing 12 months multiplied by a factor of eight. When we have discontinued operations, we exclude the impact of the discontinued operations.
Our calculation of ROI is considered a non-GAAP financial measure because we calculate ROI using financial measures that exclude and include amounts that are included and excluded in the most directly comparable financial measure calculated and presented in accordance with GAAP. For example, we exclude the impact of depreciation and amortization from our reported operating income in calculating the numerator of our calculation of ROI. In addition, we include a factor of eight for rent expense that estimates the hypothetical capitalization of our operating leases. As mentioned above, we consider ROA to be the financial measure computed in accordance with GAAP that is the most directly comparable financial measure to our calculation of ROI. ROI dif-fers from ROA (which is consolidated net income for the period divided by average total assets for the period) because ROI: adjusts operating income to exclude certain expense items and adds interest income; adjusts total assets for the impact of accumulated depreciation and amortization, accounts payable and accrued liabilities; and incorporates a factor of rent to arrive at total invested capital. Because of the adjustments mentioned above, we believe ROI more accurately measures how we are deploying our key assets and is more meaningful to investors than ROA.
Although ROI is a standard financial metric, numerous methods exist for calculating a company’s ROI. As a result, the method used by man-agement to calculate our ROI may differ from the methods used by other companies to calculate their ROI.
The calculation of ROA and ROI, along with a reconciliation of ROI to the calculation of ROA, the most comparable GAAP financial measure, is as follows:
Fiscal Years Ended January 31,
(Amounts in millions) 2017 2016
CALCULATION OF RETURN ON ASSETSNumeratorIncome from continuing operations $ 14,293 $ 15,080
DenominatorAverage total assets of continuing operations(1) $199,203 $201,536
Return on assets (ROA) 7.2% 7.5%
CALCULATION OF RETURN ON INVESTMENTNumeratorOperating income $ 22,764 $ 24,105+ Interest income 100 81+ Depreciation and amortization 10,080 9,454+ Rent 2,612 2,532
= Adjusted operating income $ 35,556 $ 36,172
DenominatorAverage total assets of continuing operations(1) $199,203 $201,536+ Average accumulated depreciation and amortization(1) 74,245 68,759- Average accounts payable(1) 39,960 38,449- Average accrued liabilities(1) 20,131 19,380+ Rent x 8 20,896 20,256
= Average invested capital $234,253 $232,722
Return on investment (ROI) 15.2% 15.5%
As of January 31,
2017 2016 2015
Certain Balance Sheet DataTotal assets of continuing operations $198,825 $199,581 $203,490Accumulated depreciation and amortization 76,951 71,538 65,979Accounts payable 41,433 38,487 38,410Accrued liabilities 20,654 19,607 19,152
(1) The average is based on the addition of the account balance at the end of the current period to the account balance at the end of the prior period and dividing by 2.
Walmart 2017 Annual Report 23
Management’s Discussion and Analysis of Financial Condition and Results of Operations
Free Cash FlowFree cash flow is considered a non-GAAP financial measure. Management believes, however, that free cash flow, which measures our ability to generate additional cash from our business operations, is an important financial measure for use in evaluating the Company’s financial perfor-mance. Free cash flow should be considered in addition to, rather than as a substitute for, consolidated net income as a measure of our performance and net cash provided by operating activities as a measure of our liquidity. See Liquidity and Capital Resources for discussions of GAAP metrics including net cash provided by operating activities, net cash used in investing activities and net cash used in financing activities.
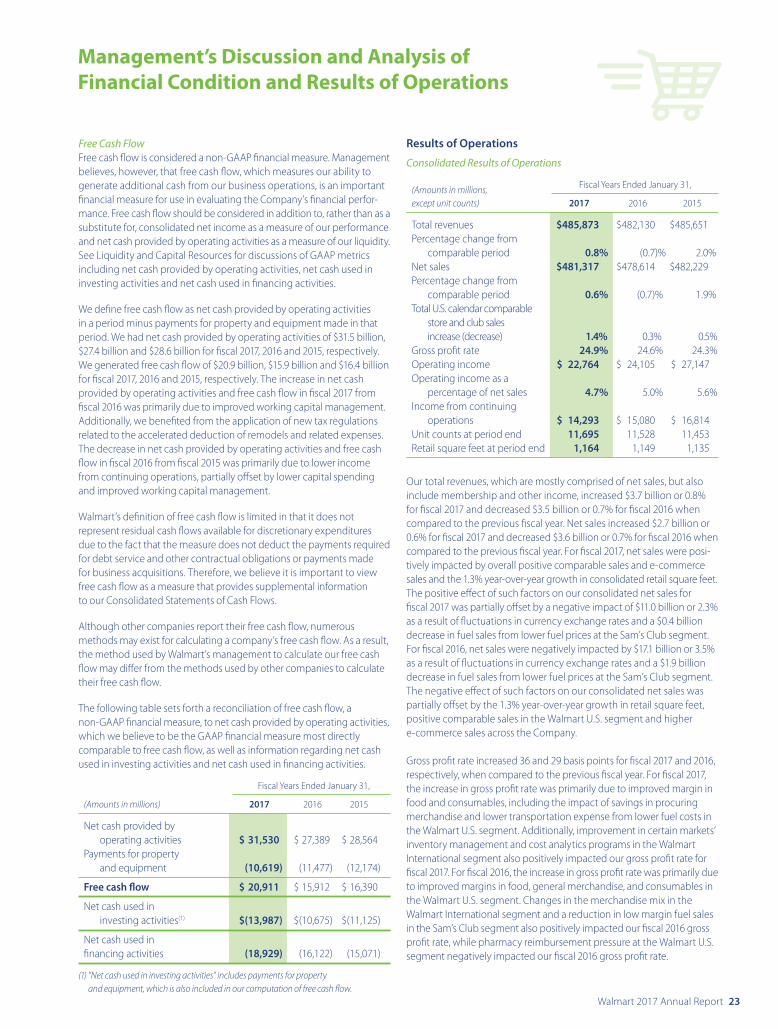
We define free cash flow as net cash provided by operating activities in a period minus payments for property and equipment made in that period. We had net cash provided by operating activities of $31.5 billion, $27.4 billion and $28.6 billion for fiscal 2017, 2016 and 2015, respectively. We generated free cash flow of $20.9 billion, $15.9 billion and $16.4 billion for fiscal 2017, 2016 and 2015, respectively. The increase in net cash provided by operating activities and free cash flow in fiscal 2017 from fiscal 2016 was primarily due to improved working capital management. Additionally, we benefited from the application of new tax regulations related to the accelerated deduction of remodels and related expenses. The decrease in net cash provided by operating activities and free cash flow in fiscal 2016 from fiscal 2015 was primarily due to lower income from continuing operations, partially offset by lower capital spending and improved working capital management.
Walmart’s definition of free cash flow is limited in that it does not represent residual cash flows available for discretionary expenditures due to the fact that the measure does not deduct the payments required for debt service and other contractual obligations or payments made for business acquisitions. Therefore, we believe it is important to view free cash flow as a measure that provides supplemental information to our Consolidated Statements of Cash Flows.
Although other companies report their free cash flow, numerous methods may exist for calculating a company’s free cash flow. As a result, the method used by Walmart’s management to calculate our free cash flow may differ from the methods used by other companies to calculate their free cash flow.
The following table sets forth a reconciliation of free cash flow, a non-GAAP financial measure, to net cash provided by operating activities, which we believe to be the GAAP financial measure most directly comparable to free cash flow, as well as information regarding net cash used in investing activities and net cash used in financing activities.
Fiscal Years Ended January 31,
(Amounts in millions) 2017 2016 2015
Net cash provided by operating activities $ 31,530 $ 27,389 $ 28,564Payments for property and equipment (10,619) (11,477) (12,174)
Free cash flow $ 20,911 $ 15,912 $ 16,390
Net cash used in investing activities(1) $(13,987) $(10,675) $(11,125)
Net cash used in financing activities (18,929) (16,122) (15,071)
(1) “Net cash used in investing activities” includes payments for property and equipment, which is also included in our computation of free cash flow.
Results of Operations
Consolidated Results of Operations
(Amounts in millions, Fiscal Years Ended January 31,
except unit counts) 2017 2016 2015
Total revenues $485,873 $482,130 $485,651Percentage change from comparable period 0.8% (0.7)% 2.0%Net sales $481,317 $478,614 $482,229Percentage change from comparable period 0.6% (0.7)% 1.9%Total U.S. calendar comparable store and club sales
increase (decrease) 1.4% 0.3% 0.5%Gross profit rate 24.9% 24.6% 24.3%Operating income $ 22,764 $ 24,105 $ 27,147Operating income as a percentage of net sales 4.7% 5.0% 5.6%Income from continuing operations $ 14,293 $ 15,080 $ 16,814Unit counts at period end 11,695 11,528 11,453Retail square feet at period end 1,164 1,149 1,135
Our total revenues, which are mostly comprised of net sales, but also include membership and other income, increased $3.7 billion or 0.8% for fiscal 2017 and decreased $3.5 billion or 0.7% for fiscal 2016 when compared to the previous fiscal year. Net sales increased $2.7 billion or 0.6% for fiscal 2017 and decreased $3.6 billion or 0.7% for fiscal 2016 when compared to the previous fiscal year. For fiscal 2017, net sales were posi-tively impacted by overall positive comparable sales and e-commerce sales and the 1.3% year-over-year growth in consolidated retail square feet. The positive effect of such factors on our consolidated net sales for fiscal 2017 was partially offset by a negative impact of $11.0 billion or 2.3% as a result of fluctuations in currency exchange rates and a $0.4 billion decrease in fuel sales from lower fuel prices at the Sam’s Club segment. For fiscal 2016, net sales were negatively impacted by $17.1 billion or 3.5% as a result of fluctuations in currency exchange rates and a $1.9 billion decrease in fuel sales from lower fuel prices at the Sam’s Club segment. The negative effect of such factors on our consolidated net sales was partially offset by the 1.3% year-over-year growth in retail square feet, positive comparable sales in the Walmart U.S. segment and higher e-commerce sales across the Company.
Gross profit rate increased 36 and 29 basis points for fiscal 2017 and 2016, respectively, when compared to the previous fiscal year. For fiscal 2017, the increase in gross profit rate was primarily due to improved margin in food and consumables, including the impact of savings in procuring merchandise and lower transportation expense from lower fuel costs in the Walmart U.S. segment. Additionally, improvement in certain markets’ inventory management and cost analytics programs in the Walmart International segment also positively impacted our gross profit rate for fiscal 2017. For fiscal 2016, the increase in gross profit rate was primarily due to improved margins in food, general merchandise, and consumables in the Walmart U.S. segment. Changes in the merchandise mix in the Walmart International segment and a reduction in low margin fuel sales in the Sam’s Club segment also positively impacted our fiscal 2016 gross profit rate, while pharmacy reimbursement pressure at the Walmart U.S. segment negatively impacted our fiscal 2016 gross profit rate.
24 Walmart 2017 Annual Report
Management’s Discussion and Analysis of Financial Condition and Results of Operations
Operating expenses as a percentage of net sales increased 88 and 91 basis points for fiscal 2017 and 2016, respectively, when compared to the previous fiscal year. For fiscal 2017, the increase in operating expenses as a percentage of net sales was primarily due to an increase in wage expense at the Walmart U.S. and Sam’s Club segments resulting from the continued investment in associate wage structure; a $370 million charge related to discontinued domestic real estate projects and severance; and our continued investments in digital retail and information technology. The increase in operating expenses as a percentage of net sales for fiscal 2017 was partially offset by the impact of store closures in the fourth quarter of fiscal 2016. For fiscal 2016, the increase in operating expenses as a percentage of net sales was due to an increase in wage expense at the Walmart U.S. segment due to the new associate wage structure and increased associate hours to improve the overall customer experience, the approximately $0.9 billion charge for the store closures announced in January 2016 and our investments in digital retail and information technology.
Membership and other income increased $1.0 billion for fiscal 2017 and was relatively flat for fiscal 2016, respectively, when compared to the same periods in the previous fiscal year. For fiscal 2017, the increase in membership and other income was primarily due the recognition of a $535 million gain in the second quarter of fiscal 2017 from the sale of certain assets relating to Yihaodian, our e-commerce operations in China, including the Yihaodian brand, website and application, to JD, and a $194 million gain from the sale of shopping malls in Chile.
Our effective income tax rate was 30.3% for both fiscal 2017 and 2016, and 32.2% for fiscal 2015, respectively. Our effective tax rate fluctuates from period to period and may be impacted by a number of factors, including changes in our assessment of certain tax contingencies, valuation allowances, changes in laws, outcomes of administrative audits, the impacts of discrete items and the mix of earnings among our U.S. and international operations. The reconciliation from the U.S. statutory rate to the effective income tax rates for fiscal 2017, 2016 and 2015 is presented in Note 9 in the “Notes to Consolidated Financial Statements.”
As a result of the factors discussed above, we reported $14.3 billion, $15.1 billion and $16.8 billion of consolidated income from continuing operations for fiscal 2017, 2016 and 2015, respectively; a decrease of $0.8 billion and $1.7 billion for fiscal 2017 and 2016, respectively, when compared to the previous fiscal year. Diluted income per common share from continuing operations attributable to Walmart was $4.38, $4.57 and $4.99 for fiscal 2017, 2016 and 2015, respectively.
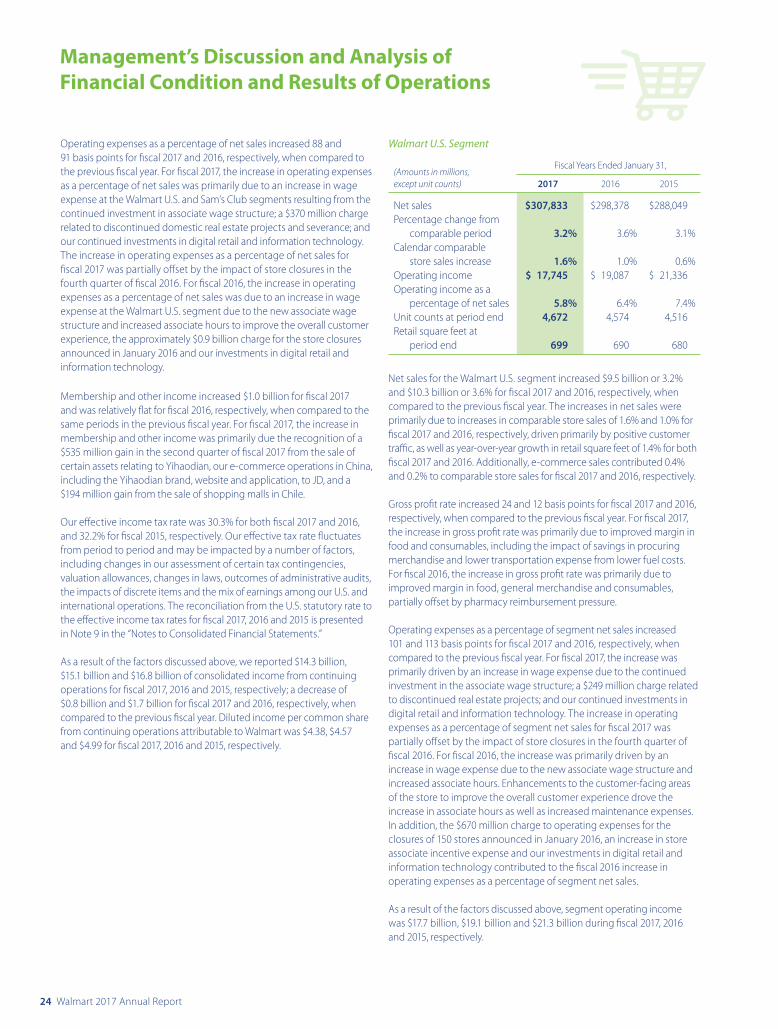
Walmart U.S. Segment
(Amounts in millions, Fiscal Years Ended January 31,
except unit counts) 2017 2016 2015
Net sales $307,833 $298,378 $288,049Percentage change from comparable period 3.2% 3.6% 3.1%Calendar comparable store sales increase 1.6% 1.0% 0.6%Operating income $ 17,745 $ 19,087 $ 21,336Operating income as a percentage of net sales 5.8% 6.4% 7.4%Unit counts at period end 4,672 4,574 4,516Retail square feet at period end 699 690 680
Net sales for the Walmart U.S. segment increased $9.5 billion or 3.2% and $10.3 billion or 3.6% for fiscal 2017 and 2016, respectively, when compared to the previous fiscal year. The increases in net sales were primarily due to increases in comparable store sales of 1.6% and 1.0% for fiscal 2017 and 2016, respectively, driven primarily by positive customer traffic, as well as year-over-year growth in retail square feet of 1.4% for both fiscal 2017 and 2016. Additionally, e-commerce sales contributed 0.4% and 0.2% to comparable store sales for fiscal 2017 and 2016, respectively.
Gross profit rate increased 24 and 12 basis points for fiscal 2017 and 2016, respectively, when compared to the previous fiscal year. For fiscal 2017, the increase in gross profit rate was primarily due to improved margin in food and consumables, including the impact of savings in procuring merchandise and lower transportation expense from lower fuel costs. For fiscal 2016, the increase in gross profit rate was primarily due to improved margin in food, general merchandise and consumables, partially offset by pharmacy reimbursement pressure.
Operating expenses as a percentage of segment net sales increased 101 and 113 basis points for fiscal 2017 and 2016, respectively, when compared to the previous fiscal year. For fiscal 2017, the increase was primarily driven by an increase in wage expense due to the continued investment in the associate wage structure; a $249 million charge related to discontinued real estate projects; and our continued investments in digital retail and information technology. The increase in operating expenses as a percentage of segment net sales for fiscal 2017 was partially offset by the impact of store closures in the fourth quarter of fiscal 2016. For fiscal 2016, the increase was primarily driven by an increase in wage expense due to the new associate wage structure and increased associate hours. Enhancements to the customer-facing areas of the store to improve the overall customer experience drove the increase in associate hours as well as increased maintenance expenses. In addition, the $670 million charge to operating expenses for the closures of 150 stores announced in January 2016, an increase in store associate incentive expense and our investments in digital retail and information technology contributed to the fiscal 2016 increase in operating expenses as a percentage of segment net sales.
As a result of the factors discussed above, segment operating income was $17.7 billion, $19.1 billion and $21.3 billion during fiscal 2017, 2016 and 2015, respectively.
Walmart 2017 Annual Report 25
Management’s Discussion and Analysis of Financial Condition and Results of Operations
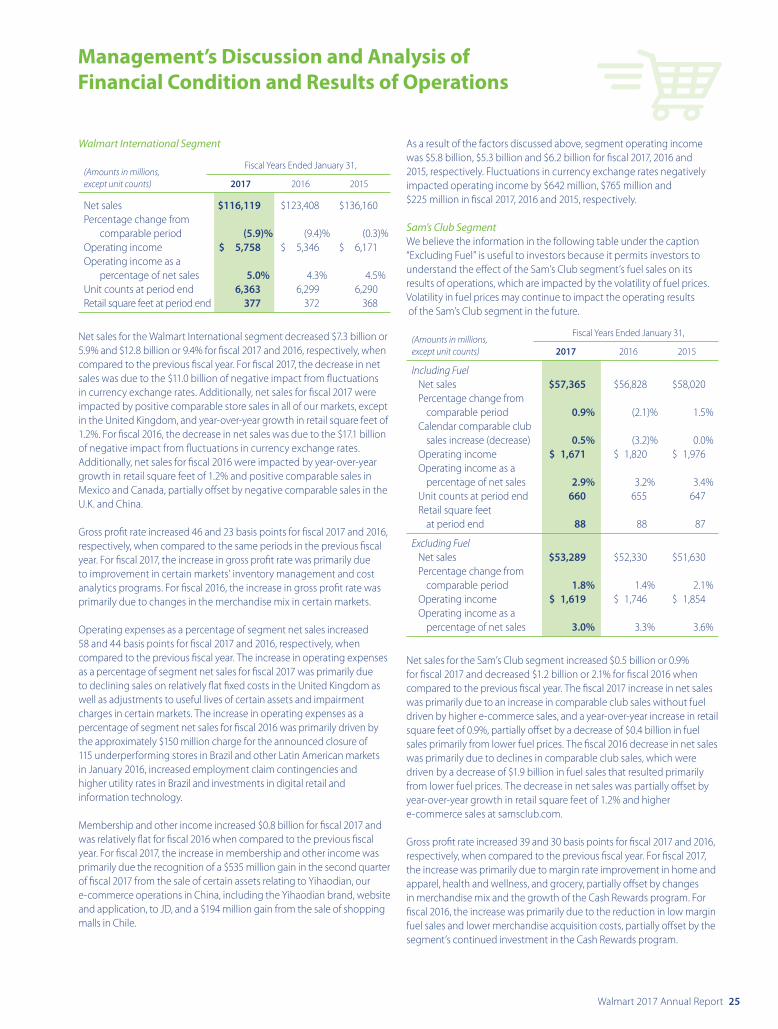
Walmart International Segment
(Amounts in millions, Fiscal Years Ended January 31,
except unit counts) 2017 2016 2015
Net sales $116,119 $123,408 $136,160Percentage change from comparable period (5.9)% (9.4)% (0.3)%Operating income $ 5,758 $ 5,346 $ 6,171Operating income as a percentage of net sales 5.0% 4.3% 4.5%Unit counts at period end 6,363 6,299 6,290Retail square feet at period end 377 372 368
Net sales for the Walmart International segment decreased $7.3 billion or 5.9% and $12.8 billion or 9.4% for fiscal 2017 and 2016, respectively, when compared to the previous fiscal year. For fiscal 2017, the decrease in net sales was due to the $11.0 billion of negative impact from fluctuations in currency exchange rates. Additionally, net sales for fiscal 2017 were impacted by positive comparable store sales in all of our markets, except in the United Kingdom, and year-over-year growth in retail square feet of 1.2%. For fiscal 2016, the decrease in net sales was due to the $17.1 billion of negative impact from fluctuations in currency exchange rates. Additionally, net sales for fiscal 2016 were impacted by year-over-year growth in retail square feet of 1.2% and positive comparable sales in Mexico and Canada, partially offset by negative comparable sales in the U.K. and China.
Gross profit rate increased 46 and 23 basis points for fiscal 2017 and 2016, respectively, when compared to the same periods in the previous fiscal year. For fiscal 2017, the increase in gross profit rate was primarily due to improvement in certain markets’ inventory management and cost analytics programs. For fiscal 2016, the increase in gross profit rate was primarily due to changes in the merchandise mix in certain markets.
Operating expenses as a percentage of segment net sales increased 58 and 44 basis points for fiscal 2017 and 2016, respectively, when compared to the previous fiscal year. The increase in operating expenses as a percentage of segment net sales for fiscal 2017 was primarily due to declining sales on relatively flat fixed costs in the United Kingdom as well as adjustments to useful lives of certain assets and impairment charges in certain markets. The increase in operating expenses as a percentage of segment net sales for fiscal 2016 was primarily driven by the approximately $150 million charge for the announced closure of 115 underperforming stores in Brazil and other Latin American markets in January 2016, increased employment claim contingencies and higher utility rates in Brazil and investments in digital retail and information technology.
Membership and other income increased $0.8 billion for fiscal 2017 and was relatively flat for fiscal 2016 when compared to the previous fiscal year. For fiscal 2017, the increase in membership and other income was primarily due the recognition of a $535 million gain in the second quarter of fiscal 2017 from the sale of certain assets relating to Yihaodian, our e-commerce operations in China, including the Yihaodian brand, website and application, to JD, and a $194 million gain from the sale of shopping malls in Chile.
As a result of the factors discussed above, segment operating income was $5.8 billion, $5.3 billion and $6.2 billion for fiscal 2017, 2016 and 2015, respectively. Fluctuations in currency exchange rates negatively impacted operating income by $642 million, $765 million and $225 million in fiscal 2017, 2016 and 2015, respectively.
Sam’s Club SegmentWe believe the information in the following table under the caption “Excluding Fuel” is useful to investors because it permits investors to understand the effect of the Sam’s Club segment’s fuel sales on its results of operations, which are impacted by the volatility of fuel prices. Volatility in fuel prices may continue to impact the operating results of the Sam’s Club segment in the future.
(Amounts in millions, Fiscal Years Ended January 31,
except unit counts) 2017 2016 2015
Including Fuel Net sales $57,365 $56,828 $58,020 Percentage change from comparable period 0.9% (2.1)% 1.5% Calendar comparable club sales increase (decrease) 0.5% (3.2)% 0.0% Operating income $ 1,671 $ 1,820 $ 1,976 Operating income as a percentage of net sales 2.9% 3.2% 3.4% Unit counts at period end 660 655 647 Retail square feet at period end 88 88 87
Excluding Fuel Net sales $53,289 $52,330 $51,630 Percentage change from comparable period 1.8% 1.4% 2.1% Operating income $ 1,619 $ 1,746 $ 1,854 Operating income as a percentage of net sales 3.0% 3.3% 3.6%
Net sales for the Sam’s Club segment increased $0.5 billion or 0.9% for fiscal 2017 and decreased $1.2 billion or 2.1% for fiscal 2016 when compared to the previous fiscal year. The fiscal 2017 increase in net sales was primarily due to an increase in comparable club sales without fuel driven by higher e-commerce sales, and a year-over-year increase in retail square feet of 0.9%, partially offset by a decrease of $0.4 billion in fuel sales primarily from lower fuel prices. The fiscal 2016 decrease in net sales was primarily due to declines in comparable club sales, which were driven by a decrease of $1.9 billion in fuel sales that resulted primarily from lower fuel prices. The decrease in net sales was partially offset by year-over-year growth in retail square feet of 1.2% and higher e-commerce sales at samsclub.com.
Gross profit rate increased 39 and 30 basis points for fiscal 2017 and 2016, respectively, when compared to the previous fiscal year. For fiscal 2017, the increase was primarily due to margin rate improvement in home and apparel, health and wellness, and grocery, partially offset by changes in merchandise mix and the growth of the Cash Rewards program. For fiscal 2016, the increase was primarily due to the reduction in low margin fuel sales and lower merchandise acquisition costs, partially offset by the segment’s continued investment in the Cash Rewards program.
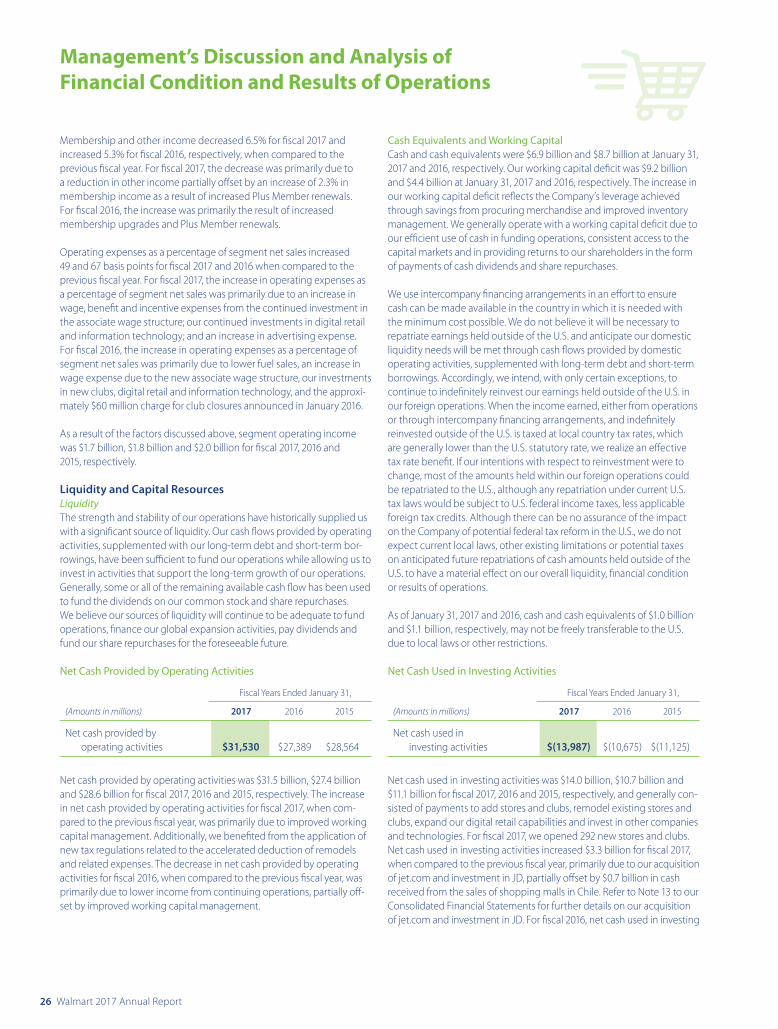
26 Walmart 2017 Annual Report
Management’s Discussion and Analysis of Financial Condition and Results of Operations
Membership and other income decreased 6.5% for fiscal 2017 and increased 5.3% for fiscal 2016, respectively, when compared to the previous fiscal year. For fiscal 2017, the decrease was primarily due to a reduction in other income partially offset by an increase of 2.3% in membership income as a result of increased Plus Member renewals. For fiscal 2016, the increase was primarily the result of increased membership upgrades and Plus Member renewals.
Operating expenses as a percentage of segment net sales increased 49 and 67 basis points for fiscal 2017 and 2016 when compared to the previous fiscal year. For fiscal 2017, the increase in operating expenses as a percentage of segment net sales was primarily due to an increase in wage, benefit and incentive expenses from the continued investment in the associate wage structure; our continued investments in digital retail and information technology; and an increase in advertising expense. For fiscal 2016, the increase in operating expenses as a percentage of segment net sales was primarily due to lower fuel sales, an increase in wage expense due to the new associate wage structure, our investments in new clubs, digital retail and information technology, and the approxi-mately $60 million charge for club closures announced in January 2016.
As a result of the factors discussed above, segment operating income was $1.7 billion, $1.8 billion and $2.0 billion for fiscal 2017, 2016 and 2015, respectively.
Liquidity and Capital ResourcesLiquidityThe strength and stability of our operations have historically supplied us with a significant source of liquidity. Our cash flows provided by operating activities, supplemented with our long-term debt and short-term bor-rowings, have been sufficient to fund our operations while allowing us to invest in activities that support the long-term growth of our operations. Generally, some or all of the remaining available cash flow has been used to fund the dividends on our common stock and share repurchases. We believe our sources of liquidity will continue to be adequate to fund operations, finance our global expansion activities, pay dividends and fund our share repurchases for the foreseeable future.
Net Cash Provided by Operating Activities
Fiscal Years Ended January 31,
(Amounts in millions) 2017 2016 2015
Net cash provided by operating activities $31,530 $27,389 $28,564
Net cash provided by operating activities was $31.5 billion, $27.4 billion and $28.6 billion for fiscal 2017, 2016 and 2015, respectively. The increase in net cash provided by operating activities for fiscal 2017, when com-pared to the previous fiscal year, was primarily due to improved working capital management. Additionally, we benefited from the application of new tax regulations related to the accelerated deduction of remodels and related expenses. The decrease in net cash provided by operating activities for fiscal 2016, when compared to the previous fiscal year, was primarily due to lower income from continuing operations, partially off-set by improved working capital management.
Cash Equivalents and Working CapitalCash and cash equivalents were $6.9 billion and $8.7 billion at January 31, 2017 and 2016, respectively. Our working capital deficit was $9.2 billion and $4.4 billion at January 31, 2017 and 2016, respectively. The increase in our working capital deficit reflects the Company’s leverage achieved through savings from procuring merchandise and improved inventory management. We generally operate with a working capital deficit due to our efficient use of cash in funding operations, consistent access to the capital markets and in providing returns to our shareholders in the form of payments of cash dividends and share repurchases.
We use intercompany financing arrangements in an effort to ensure cash can be made available in the country in which it is needed with the minimum cost possible. We do not believe it will be necessary to repatriate earnings held outside of the U.S. and anticipate our domestic liquidity needs will be met through cash flows provided by domestic operating activities, supplemented with long-term debt and short-term borrowings. Accordingly, we intend, with only certain exceptions, to continue to indefinitely reinvest our earnings held outside of the U.S. in our foreign operations. When the income earned, either from operations or through intercompany financing arrangements, and indefinitely reinvested outside of the U.S. is taxed at local country tax rates, which are generally lower than the U.S. statutory rate, we realize an effective tax rate benefit. If our intentions with respect to reinvestment were to change, most of the amounts held within our foreign operations could be repatriated to the U.S., although any repatriation under current U.S. tax laws would be subject to U.S. federal income taxes, less applicable foreign tax credits. Although there can be no assurance of the impact on the Company of potential federal tax reform in the U.S., we do not expect current local laws, other existing limitations or potential taxes on anticipated future repatriations of cash amounts held outside of the U.S. to have a material effect on our overall liquidity, financial condition or results of operations.
As of January 31, 2017 and 2016, cash and cash equivalents of $1.0 billion and $1.1 billion, respectively, may not be freely transferable to the U.S. due to local laws or other restrictions.
Net Cash Used in Investing Activities
Fiscal Years Ended January 31,
(Amounts in millions) 2017 2016 2015
Net cash used in investing activities $(13,987) $(10,675) $(11,125)
Net cash used in investing activities was $14.0 billion, $10.7 billion and $11.1 billion for fiscal 2017, 2016 and 2015, respectively, and generally con-sisted of payments to add stores and clubs, remodel existing stores and clubs, expand our digital retail capabilities and invest in other companies and technologies. For fiscal 2017, we opened 292 new stores and clubs. Net cash used in investing activities increased $3.3 billion for fiscal 2017, when compared to the previous fiscal year, primarily due to our acquisition of jet.com and investment in JD, partially offset by $0.7 billion in cash received from the sales of shopping malls in Chile. Refer to Note 13 to our Consolidated Financial Statements for further details on our acquisition of jet.com and investment in JD. For fiscal 2016, net cash used in investing
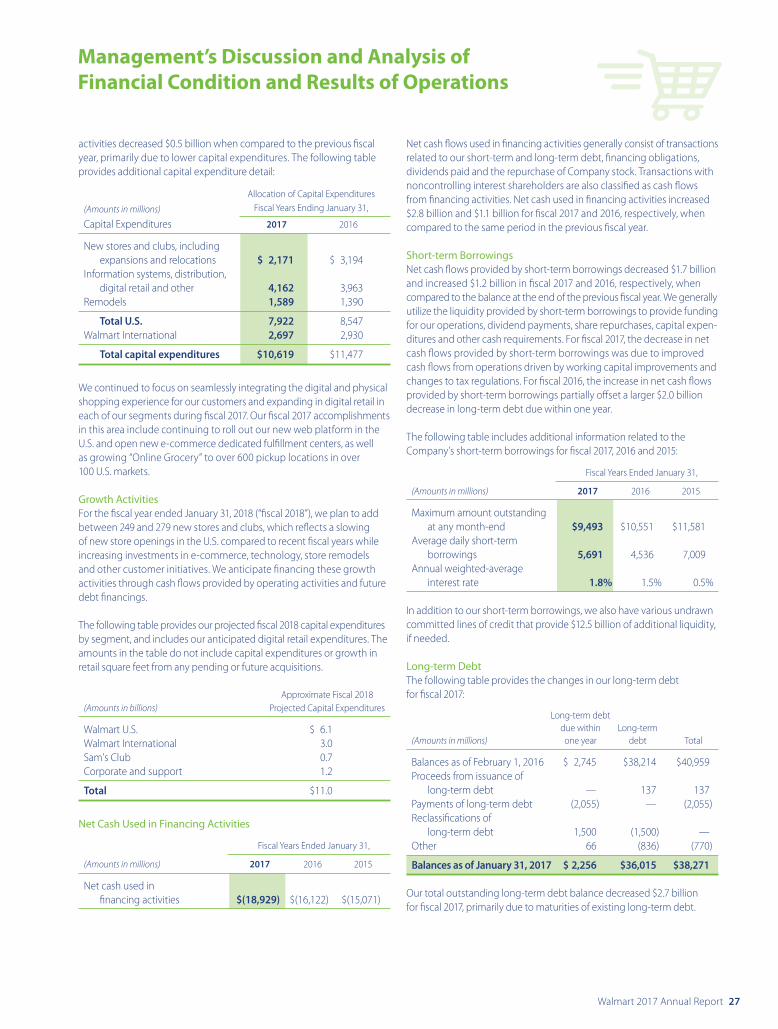
Walmart 2017 Annual Report 27
Management’s Discussion and Analysis of Financial Condition and Results of Operations
activities decreased $0.5 billion when compared to the previous fiscal year, primarily due to lower capital expenditures. The following table provides additional capital expenditure detail:
Allocation of Capital Expenditures
(Amounts in millions) Fiscal Years Ending January 31,
Capital Expenditures 2017 2016
New stores and clubs, including expansions and relocations $ 2,171 $ 3,194Information systems, distribution, digital retail and other 4,162 3,963Remodels 1,589 1,390
Total U.S. 7,922 8,547Walmart International 2,697 2,930
Total capital expenditures $10,619 $11,477
We continued to focus on seamlessly integrating the digital and physical shopping experience for our customers and expanding in digital retail in each of our segments during fiscal 2017. Our fiscal 2017 accomplishments in this area include continuing to roll out our new web platform in the U.S. and open new e-commerce dedicated fulfillment centers, as well as growing “Online Grocery” to over 600 pickup locations in over 100 U.S. markets.
Growth ActivitiesFor the fiscal year ended January 31, 2018 (“fiscal 2018”), we plan to add between 249 and 279 new stores and clubs, which reflects a slowing of new store openings in the U.S. compared to recent fiscal years while increasing investments in e-commerce, technology, store remodels and other customer initiatives. We anticipate financing these growth activities through cash flows provided by operating activities and future debt financings.
The following table provides our projected fiscal 2018 capital expenditures by segment, and includes our anticipated digital retail expenditures. The amounts in the table do not include capital expenditures or growth in retail square feet from any pending or future acquisitions.
Approximate Fiscal 2018 (Amounts in billions) Projected Capital Expenditures
Walmart U.S. $ 6.1Walmart International 3.0Sam’s Club 0.7Corporate and support 1.2
Total $11.0
Net Cash Used in Financing Activities
Fiscal Years Ended January 31,
(Amounts in millions) 2017 2016 2015
Net cash used in financing activities $(18,929) $(16,122) $(15,071)
Net cash flows used in financing activities generally consist of transactions related to our short-term and long-term debt, financing obligations, dividends paid and the repurchase of Company stock. Transactions with noncontrolling interest shareholders are also classified as cash flows from financing activities. Net cash used in financing activities increased $2.8 billion and $1.1 billion for fiscal 2017 and 2016, respectively, when compared to the same period in the previous fiscal year.
Short-term BorrowingsNet cash flows provided by short-term borrowings decreased $1.7 billion and increased $1.2 billion in fiscal 2017 and 2016, respectively, when compared to the balance at the end of the previous fiscal year. We generally utilize the liquidity provided by short-term borrowings to provide funding for our operations, dividend payments, share repurchases, capital expen-ditures and other cash requirements. For fiscal 2017, the decrease in net cash flows provided by short-term borrowings was due to improved cash flows from operations driven by working capital improvements and changes to tax regulations. For fiscal 2016, the increase in net cash flows provided by short-term borrowings partially offset a larger $2.0 billion decrease in long-term debt due within one year.
The following table includes additional information related to the Company’s short-term borrowings for fiscal 2017, 2016 and 2015:
Fiscal Years Ended January 31,
(Amounts in millions) 2017 2016 2015
Maximum amount outstanding at any month-end $9,493 $10,551 $11,581Average daily short-term borrowings 5,691 4,536 7,009Annual weighted-average interest rate 1.8% 1.5% 0.5%
In addition to our short-term borrowings, we also have various undrawn committed lines of credit that provide $12.5 billion of additional liquidity, if needed.
Long-term DebtThe following table provides the changes in our long-term debt for fiscal 2017:
Long-term debt due within Long-term (Amounts in millions) one year debt Total
Balances as of February 1, 2016 $ 2,745 $38,214 $40,959Proceeds from issuance of long-term debt — 137 137Payments of long-term debt (2,055) — (2,055)Reclassifications of long-term debt 1,500 (1,500) —Other 66 (836) (770)
Balances as of January 31, 2017 $ 2,256 $36,015 $38,271
Our total outstanding long-term debt balance decreased $2.7 billion for fiscal 2017, primarily due to maturities of existing long-term debt.
28 Walmart 2017 Annual Report
Management’s Discussion and Analysis of Financial Condition and Results of Operations
DividendsOur total dividend payments were $6.2 billion, $6.3 billion and $6.2 billion for fiscal 2017, 2016 and 2015, respectively. On February 21, 2017, the Board of Directors approved the fiscal 2018 annual dividend of $2.04 per share, an increase over the fiscal 2017 annual dividend of $2.00 per share. For fiscal 2018, the annual dividend will be paid in four quarterly installments of $0.51 per share, according to the following record and payable dates:
Record Date Payable Date
March 10, 2017 April 3, 2017May 12, 2017 June 5, 2017August 11, 2017 September 5, 2017December 8, 2017 January 2, 2018
Company Share Repurchase ProgramFrom time to time, we repurchase shares of our common stock under share repurchase programs authorized by the Company’s Board of Directors. The current $20.0 billion share repurchase program has no expiration date or other restrictions limiting the period over which we can make share repurchases. At January 31, 2017, authorization for $9.2 billion of share repurchases remained under the current share repurchase program. Any repurchased shares are constructively retired and returned to an unissued status. The Company intends to utilize the current share repurchase authorization through the fiscal year ending January 31, 2018.
We regularly review share repurchase activity and consider several factors in determining when to execute share repurchases, including, among other things, current cash needs, capacity for leverage, cost of borrowings, our results of operations and the market price of our com-mon stock. We anticipate that a significant majority of the ongoing share repurchase program will be funded through the Company’s free cash flows. The following table provides, on a settlement date basis, the number of shares repurchased, average price paid per share and total amount paid for share repurchases for fiscal 2017, 2016 and 2015:
(Amounts in millions, Fiscal Years Ended January 31,
except per share data) 2017 2016 2015
Total number of shares repurchased 119.9 62.4 13.4Average price paid per share $69.18 $65.90 $75.82Total amount paid for share repurchases $8,298 $4,112 $1,015
Share repurchases increased $4.2 billion and $3.1 billion for fiscal 2017 and 2016, respectively, when compared to the previous fiscal year.
Significant Transactions with Noncontrolling InterestsIn fiscal 2016, as described in Note 13 to our Consolidated Financial Statements, we completed the purchase of all of the remaining noncontrolling interest in Yihaodian, our e-commerce operations in China, for approximately $760 million, using existing cash to complete this transaction. Additionally, during fiscal 2015, we completed the purchase of substantially all of the remaining noncontrolling interest in Walmart Chile for approximately $1.5 billion, using existing cash to complete this transaction.
Capital ResourcesWe believe cash flows from continuing operations, our current cash position and access to capital markets will continue to be sufficient to meet our anticipated operating cash needs, which include funding s easonal buildups in merchandise inventories and funding our capital expenditures, dividend payments and share repurchases.
We have strong commercial paper and long-term debt ratings that have enabled and should continue to enable us to refinance our debt as it becomes due at favorable rates in capital markets. At January 31, 2017, the ratings assigned to our commercial paper and rated series of our outstanding long-term debt were as follows:
Rating agency Commercial paper Long-term debt
Standard & Poor’s A-1+ AAMoody’s Investors Service P-1 Aa2Fitch Ratings F1+ AA
Credit rating agencies review their ratings periodically and, therefore, the credit ratings assigned to us by each agency may be subject to revision at any time. Accordingly, we are not able to predict whether our current credit ratings will remain consistent over time. Factors that could affect our credit ratings include changes in our operating performance, the general economic environment, conditions in the retail industry, our financial position, including our total debt and capitalization, and changes in our business strategy. Any downgrade of our credit ratings by a credit rating agency could increase our future borrowing costs or impair our ability to access capital and credit markets on terms commercially acceptable to us. In addition, any downgrade of our current short-term credit ratings could impair our ability to access the commercial paper markets with the same flexibility that we have experienced historically, potentially requiring us to rely more heavily on more expensive types of debt financing. The credit rating agency ratings are not recommen-dations to buy, sell or hold our commercial paper or debt securities. Each rating may be subject to revision or withdrawal at any time by the assigning rating organization and should be evaluated independently of any other rating. Moreover, each credit rating is specific to the security to which it applies.
Walmart 2017 Annual Report 29
Management’s Discussion and Analysis of Financial Condition and Results of Operations
Contractual Obligations and Other Commercial CommitmentsThe following table sets forth certain information concerning our obligations and commitments to make contractual future payments, such as debt and lease agreements, and certain contingent commitments as of January 31, 2017:
Payments Due During Fiscal Years Ending January 31,
(Amounts in millions) Total 2018 2019-2020 2021-2022 Thereafter
Recorded contractual obligations: Long-term debt(1) $ 38,271 $ 2,256 $ 4,039 $ 4,394 $27,582 Short-term borrowings 1,099 1,099 — — — Capital lease and financing obligations(2) 8,909 894 1,624 1,395 4,996
Unrecorded contractual obligations: Non-cancelable operating leases(3) 18,139 2,270 3,466 2,866 9,537 Estimated interest on long-term debt 28,373 1,749 3,250 2,987 20,387 Trade and stand-by letters of credit 3,582 3,582 — — — Purchase obligations 19,622 9,048 8,324 1,032 1,218
Total commercial commitments $117,995 $20,898 $20,703 $12,674 $63,720
(1) “Long-term debt” includes the fair value of our derivatives classified as fair value hedges.
(2) “Capital lease and financing obligations” includes executory costs and imputed interest related to capital lease and financing obligations that are not yet recorded. Refer to Note 11 in the “Notes to Consolidated Financial Statements” for more information.
(3) Represents minimum contractual obligation for non-cancelable leases with initial or remaining terms greater than 12 months as of January 31, 2017.
Additionally, the Company has $12.5 billion in undrawn committed lines of credit which, if drawn upon, would be included in the current liabilities section of the Company’s Consolidated Balance Sheets.
Estimated interest payments are based on our principal amounts and expected maturities of all debt outstanding at January 31, 2017, and assumes interest rates remain at current levels for our variable rate debt.
Purchase obligations include legally binding contracts, such as firm commitments for inventory and utility purchases, as well as commitments to make capital expenditures, software acquisition and license commit-ments and legally binding service contracts. Purchase orders for inventory and other services are not included in the table above. Purchase orders represent authorizations to purchase rather than binding agreements. For the purposes of this table, contractual obligations for the purchase of goods or services are defined as agreements that are enforceable and legally binding and that specify all significant terms, including: fixed or minimum quantities to be purchased; fixed, minimum or variable price provisions; and the approximate timing of the transaction. Our purchase orders are based on our current inventory needs and are fulfilled by our suppliers within short time periods. We also enter into contracts for outsourced services; however, the obligations under these contracts are not significant and the contracts generally contain clauses allowing for cancellation without significant penalty.
The expected timing for payment of the obligations discussed above is estimated based on current information. Timing of payments and actual amounts paid with respect to some unrecorded contractual commit-ments may be different depending on the timing of receipt of goods or services or changes to agreed-upon amounts for some obligations.
In addition to the amounts shown in the table above, $1.1 billion of unrecognized tax benefits are considered uncertain tax positions and have been recorded as liabilities. The timing of the payment, if any, associated with these liabilities is uncertain. Refer to Note 9 in the “Notes to Consolidated Financial Statements” for additional discussion of unrecognized tax benefits.
Off Balance Sheet ArrangementsAs of January 31, 2017, we had no off-balance sheet arrangements that have, or are reasonably likely to have, a current or future material effect on our consolidated financial condition, results of operations, liquidity, capital expenditures or capital resources.
Market RiskIn addition to the risks inherent in our operations, we are exposed to certain market risks, including changes in interest rates and fluctuations in currency exchange rates.
The analysis presented below for each of our market risk sensitive instruments is based on a hypothetical scenario used to calibrate poten-tial risk and does not represent our view of future market changes. The effect of a change in a particular assumption is calculated without adjusting any other assumption. In reality, however, a change in one factor could cause a change in another, which may magnify or negate other sensitivities.
30 Walmart 2017 Annual Report
Management’s Discussion and Analysis of Financial Condition and Results of Operations
Interest Rate RiskWe are exposed to changes in interest rates as a result of our short-term borrowings and long-term debt issuances. We hedge a portion of our interest rate risk by managing the mix of fixed and variable rate debt and by entering into interest rate swaps. For fiscal 2017, the net fair value of our interest rate swaps decreased approximately $177 million primarily due to fluctuations in market interest rates.
The table below provides information about our financial instruments that are sensitive to changes in interest rates. For debt obligations, the table represents the principal cash flows and related weighted-average interest rates by expected maturity dates. For interest rate swaps, the table represents the contractual cash flows and weighted-average interest rates by the contractual maturity date, unless otherwise noted. The notional amounts are used to calculate contractual cash flows to be exchanged under the contracts. The weighted-average variable rates are based upon prevailing market rates at January 31, 2017.
Expected Maturity Date
(Amounts in millions) Fiscal 2018 Fiscal 2019 Fiscal 2020 Fiscal 2021 Fiscal 2022 Thereafter Total
Liabilities Short-term borrowings: Variable rate $1,099 $ — $ — $ — $ — $ — $ 1,099 Weighted-average interest rate 6.2% —% —% —% —% —% 6.2%
Long-term debt(1): Fixed rate $1,523 $3,497 $542 $3,311 $1,083 $27,582 $37,538 Weighted-average interest rate 4.1% 3.1% 4.8% 3.4% 4.9% 5.1% 4.7% Variable rate $ 733 $ — $ — $ — $ — $ — $ 733 Weighted-average interest rate 5.0% —% —% —% —% —% 5.0%
Interest rate derivatives Interest rate swaps: Fixed to variable $ — $ — $ — $1,500 $ 250 $ 3,250 $ 5,000 Weighted-average pay rate —% —% —% 2.4% 3.2% 1.8% 2.0% Weighted-average receive rate —% —% —% 3.3% 4.3% 2.9% 3.1%
(1) The long-term debt amounts in the table exclude the Company’s derivatives classified as fair value hedges.
As of January 31, 2017, our variable rate borrowings, including the effect of our commercial paper and interest rate swaps, represented 17% of our total short-term and long-term debt. Based on January 31, 2017 debt levels, a 100 basis point change in prevailing market rates would cause our annual interest costs to change by approximately $63 million.
Walmart 2017 Annual Report 31
Management’s Discussion and Analysis of Financial Condition and Results of Operations
Foreign Currency RiskWe are exposed to fluctuations in foreign currency exchange rates as a result of our net investments and operations in countries other than the U.S. For fiscal 2017, movements in currency exchange rates and the related impact on the translation of the balance sheets of the Company’s subsidiaries in the United Kingdom and Mexico were the primary cause of the $2.7 billion loss in the currency translation and other category of accumulated other comprehensive loss. We hedge a portion of our foreign currency risk by entering into currency swaps and designating certain foreign-currency-denominated long-term debt as net investment hedges.
We hold currency swaps to hedge the currency exchange component of our net investments and also to hedge the currency exchange rate fluctuation exposure associated with the forecasted payments of principal and interest of non-U.S. denominated debt. The aggregate fair value of these swaps was in a liability position of $147 million and $290 million at January 31, 2017 and 2016, respectively. The change in the fair value of these swaps was due to fluctuations in currency exchange rates, primarily the strengthening of the U.S. dollar relative to other currencies in fiscal 2017. A hypothetical 10% increase or decrease in the currency exchange rates underlying these swaps from the market rate at January 31, 2017 would have resulted in a loss or gain in the value of the swaps of $521 million. A hypothetical 10% change in interest rates underlying these swaps from the market rates in effect at January 31, 2017 would have resulted in a loss or gain in value of the swaps of $11 million.
In addition to currency swaps, we have designated foreign-currency-denominated long-term debt as nonderivative hedges of net invest-ments of certain of our foreign operations. At January 31, 2017 and 2016, we had £2.5 billion of outstanding long-term debt designated as a hedge of our net investment in the United Kingdom. At January 31, 2017, a hypothetical 10% increase or decrease in the value of the U.S. dollar rel-ative to the British pound would have resulted in a gain or loss in the value of the debt of $284 million. In addition, we had outstanding long-term debt of ¥10 billion at January 31, 2017 and 2016, that was desig-nated as a hedge of our net investment in Japan. At January 31, 2017, a hypothetical 10% increase or decrease in value of the U.S. dollar relative to the Japanese yen would have resulted in a gain or loss in the value of the debt of $8 million.
In certain countries, we also enter into immaterial foreign currency forward contracts to hedge the purchase and payment of purchase commitments denominated in non-functional currencies.
Other MattersWe discuss our existing FCPA investigation and related matters in the Annual Report on Form 10-K for fiscal 2017, including certain risks arising therefrom, in Part I, Item 1A of the Form 10-K under the caption “Risk Factors” and under the sub-caption “Legal Proceedings” in Note 10 to our Consolidated Financial Statements, which is captioned “Contingencies,” and appears elsewhere herein. We also discuss various legal proceedings related to the FCPA investigation in Item 3 of the Form 10-K under the caption “Part I, Item 3. Legal Proceedings,” under the sub-caption “II. Certain Other Proceedings.” We discuss the “equal value” claims against our United Kingdom subsidiary, ASDA Stores, Ltd., in the Annual Report on Form 10-K for fiscal 2017, including certain risks arising therefrom, in Part I, Item 1A of the Form 10-K under the caption “Risk Factors” and under the sub-caption “Legal Proceedings” in Note 10 to our Consolidated Financial Statements, which is captioned “Contingencies,” and appears elsewhere herein.
Summary of Critical Accounting EstimatesManagement strives to report our financial results in a clear and understandable manner, although in some cases accounting and dis-closure rules are complex and require us to use technical terminology. In preparing the Company’s Consolidated Financial Statements, we follow accounting principles generally accepted in the U.S. These principles require us to make certain estimates and apply judgments that affect our financial position and results of operations as reflected in our financial statements. These judgments and estimates are based on past events and expectations of future outcomes. Actual results may differ from our estimates.
Management continually reviews our accounting policies, how they are applied and how they are reported and disclosed in our financial statements. Following is a summary of our critical accounting estimates and how they are applied in preparation of the financial statements.
InventoriesWe value inventories at the lower of cost or market as determined primarily by the retail method of accounting, using the last-in, first-out (“LIFO”) method for substantially all of the Walmart U.S. segment’s inventories. The inventory at the Walmart International segment is valued primarily by the retail inventory method of accounting, using the first-in, first-out (“FIFO”) method. The retail method of accounting results in inventory being valued at the lower of cost or market since permanent markdowns are immediately recorded as a reduction of the retail value of inventory. The inventory at the Sam’s Club segment is valued using the LIFO method.
32 Walmart 2017 Annual Report
Management’s Discussion and Analysis of Financial Condition and Results of Operations
Under the retail method of accounting, inventory is valued at the lower of cost or market, which is determined by applying a cost-to-retail ratio to each merchandise grouping’s retail value. The FIFO cost-to-retail ratio is generally based on the fiscal year purchase activity. The cost-to-retail ratio for measuring any LIFO provision is based on the initial margin of the fiscal year purchase activity less the impact of any permanent mark-downs. The retail method of accounting requires management to make certain judgments and estimates that may significantly impact the ending inventory valuation at cost, as well as the amount of gross profit recognized. Judgments made include recording markdowns used to sell inventory and shrinkage. When management determines the ability to sell inventory has diminished, markdowns for clearance activity and the related cost impact are recorded. Factors considered in the determina-tion of markdowns include current and anticipated demand, customer preferences and age of merchandise, as well as seasonal and fashion trends. Changes in weather and customer preferences could cause material changes in the amount and timing of markdowns from year to year.
When necessary, we record a LIFO provision for the estimated annual effect of inflation, and these estimates are adjusted to actual results determined at year-end. Our LIFO provision is calculated based on inventory levels, markup rates and internally generated retail price indices. At January 31, 2017 and 2016, our inventories valued at LIFO approximated those inventories as if they were valued at FIFO.
We provide for estimated inventory losses, or shrinkage, between physical inventory counts on the basis of a historical percentage of sales. Following annual inventory counts, the provision is adjusted to reflect updated historical results.
Impairment of AssetsWe evaluate long-lived assets other than goodwill and assets with indefinite lives for indicators of impairment whenever events or changes in circumstances indicate their carrying amounts may not be recoverable. Management’s judgments regarding the existence of impairment indicators are based on market conditions and operational performance, such as operating income and cash flows. The evaluation for long-lived assets is performed at the lowest level of identifiable cash flows, which is generally at the individual store level or, in certain markets, at the market group level. The variability of these factors depends on a number of conditions, including uncertainty about future events and changes in demographics. Thus, our accounting estimates may change from period to period. These factors could cause management to conclude that indicators of impairment exist and require impairment tests be performed, which could result in management determining the value of long-lived assets is impaired, resulting in a write-down of the related long-lived assets.
Goodwill and other indefinite-lived acquired intangible assets are not amortized, but are evaluated for impairment annually or whenever events or changes in circumstances indicate that the value of a certain asset may be impaired. Generally, this evaluation begins with a qualitative assessment to determine whether a quantitative impairment test is necessary. If we determine, after performing an assessment based on the qualitative factors, that the fair value of the reporting unit is more likely than not less than the carrying amount, or that a fair value of the reporting unit substantially in excess of the carrying amount cannot be assured, then a quantitative impairment test would be performed. The quantitative test for impairment requires management to make judgments relating to future cash flows, growth rates and economic and market conditions. These evaluations are based on determining the fair value of a reporting unit or asset using a valuation method such as discounted cash flow or a relative, market-based approach. Historically, our reporting units have generated sufficient returns to recover the cost of goodwill and other indefinite-lived acquired intangible assets. Because of the nature of the factors used in these tests, if different conditions occur in future periods, future operating results could be materially impacted.
Income TaxesIncome taxes have a significant effect on our net earnings. We are subject to income taxes in the U.S. and numerous foreign jurisdictions. Accordingly, the determination of our provision for income taxes requires significant judgment, the use of estimates and the interpretation and application of complex tax laws. Our effective income tax rate is affected by many factors, including changes in our assessment of certain tax contingencies, increases and decreases in valuation allowances, changes in tax law, outcomes of administrative audits, the impact of discrete items and the mix of earnings among our U.S. and international operations where the statutory rates are generally lower than the U.S. statutory rate, and may fluctuate as a result.
Our tax returns are routinely audited and settlements of issues raised in these audits sometimes affect our tax provisions. The benefits of uncertain tax positions are recorded in our financial statements only after determining a more likely than not probability that the uncertain tax positions will withstand challenge, if any, from taxing authorities. When facts and circumstances change, we reassess these probabilities and record any changes in the financial statements as appropriate. We account for uncertain tax positions by determining the minimum recognition threshold that a tax position is required to meet before being recognized in the financial statements. This determination requires the use of significant judgment in evaluating our tax positions and assessing the timing and amounts of deductible and taxable items.
Walmart 2017 Annual Report 33
Management’s Discussion and Analysis of Financial Condition and Results of Operations
Deferred tax assets represent amounts available to reduce income taxes payable on taxable income in future years. Such assets arise because of temporary differences between the financial reporting and tax bases of assets and liabilities, as well as from net operating loss and tax credit carryforwards. Deferred tax assets are evaluated for future realization and reduced by a valuation allowance to the extent that a portion is not more likely than not to be realized. Many factors are considered when assessing whether it is more likely than not that the deferred tax assets will be realized, including recent cumulative earnings, expectations of future taxable income, carryforward periods and other relevant quantitative and qualitative factors. The recoverability of the deferred tax assets is evaluated by assessing the adequacy of future expected taxable income from all sources, including reversal of taxable temporary differences, forecasted operating earnings and available tax planning strategies. This evaluation relies heavily on estimates.
Cautionary Statement Regarding Forward-Looking StatementsThis Annual Report to Shareholders contains statements that we believe are “forward-looking statements” entitled to the protection of the safe harbor for forward-looking statements provided by the Private Securities Litigation Reform Act of 1995, as amended.
The forward-looking statements made in this Annual Report to Shareholders are not statements of historical facts, but instead express our estimates or expectations for our consolidated, or one of our seg-ment’s, economic performance or results of operations for future periods or as of future dates or events or developments that may occur in the future or discuss our plans, objectives or goals. These forward-looking statements relate to:
• the growth of our business or change in our competitive position in the future or in or over particular periods;
• the amount, number, growth or increase, in or over certain periods, of or in certain financial items or measures or operating measures, including net sales, comparable store and club sales, liabilities, expenses of certain categories, returns, capital and operating investments or expenditures of particular types, new store openings, or investments in particular formats;
• investments we will make and how certain of those investments are expected to be financed;
• the number of new stores and clubs we plan to add in the U.S. and in our foreign markets;
• our plans to increase investments in e-commerce, technology, store remodels and other customer initiatives;
• volatility in currency exchange rates and fuel prices affecting our or one of our segments’ results of operations;
• the Company continuing to provide returns to shareholders through share repurchases and dividends, the use of share repurchase authorization over a certain period or the source of funding of a certain portion of our share repurchases;
• our sources of liquidity, including our cash, continuing to be adequate or sufficient to fund and finance our operations, expansion activities, dividends and share repurchases, to meet our cash needs and to fund our domestic operations without repatriating earnings we hold outside of the U.S.;
• our intention to reinvest the earnings we hold outside of the U.S. in our foreign operations and certain laws, other limitations and potential taxes on anticipated future repatriations of such earnings not materially affecting our liquidity, financial condition or results of operations;
• the insignificance of ineffective hedges and reclassification of amounts related to our derivatives;
• the realization of certain net deferred tax assets and the effects of resolutions of tax-related matters;
• the effect of adverse decisions in, or settlement of, litigation to which we are subject and the effect of an FCPA-investigation on our business; or
• the effect on the Company’s results of operations or financial condition of the Company’s adoption of certain new, or amendments to existing, accounting standards.
Statement of our plans, objectives and goals in this Annual Report to Shareholders, including our priority of the growth of the Company being balanced by the long-term health of the Company, including returns, are also forward-looking statements.
The forward-looking statements described above are identified by the use in such statements of words or phrases such as “aim,” “anticipate,” “could be,” “could increase,” “estimated,” “expansion,” “expect,” “expected to be,” “focus,” “goal,” “grow,” “intend,” “invest,” “is expected,” “may con-tinue,” “may fluctuate,” “may grow,” “may impact,” “may result,” “objective,” “plan,” “priority,” “project,” “strategy,” “to be,” “to win,” “we’ll,” “we will,” “ will add,” “will allow,” “will be,” “will benefit,” “will continue,” “will decrease,” “will have,” “will impact,” “will include,” “will increase,” “will open,” “will remain,” “will result,” “will strengthen,” “will win,” “would be,” “would decrease” and “would increase,” variations of such words and phrases and other words or phrases of similar import.
34 Walmart 2017 Annual Report
Management’s Discussion and Analysis of Financial Condition and Results of Operations
Risks, Factors and Uncertainties Affecting Our BusinessOur business operations are subject to numerous risks, factors and uncertainties, domestically and internationally, outside of our control. One, or a combination, of these risks, factors and uncertainties could materially affect any of those matters as to which we have made forward-looking statements in this Annual Report to Shareholders and cause our actual results or an actual event or occurrence to differ materially from those results or an event or occurrence described in any such forward- looking statement. These factors include, but are not limited to:
Economic Factors
• economic, geo-political, capital markets and business conditions, trends and events around the world and in the markets in which Walmart operates;
• currency exchange rate fluctuations;
• changes in market rates of interest;
• changes in market levels of wages;
• changes in the size of various markets, including e-commerce markets;
• unemployment levels;
• inflation or deflation, generally and in certain product categories;
• transportation, energy and utility costs;
• commodity prices, including the prices of oil and natural gas;
• consumer confidence, disposable income, credit availability, spending levels, shopping patterns, debt levels, and demand for certain merchandise;
• trends in consumer shopping habits around the world and in the markets in which Walmart operates;
• new methods for delivery of merchandise purchased to customers;
• consumer enrollment in health and drug insurance programs and such programs’ reimbursement rates and drug formularies; and
• initiatives of competitors, competitors’ entry into and expansion in Walmart’s markets, and competitive pressures;
Operating Factors
• the amount of Walmart’s net sales and operating expenses denominated in U.S. dollar and various foreign currencies;
• the financial performance of Walmart and each of its segments, including the amounts of Walmart’s cash flow during various periods;
• Walmart’s need to repatriate earnings held outside of the U.S.;
• customer traffic and average ticket in Walmart’s stores and clubs and on its e-commerce websites;
• the mix of merchandise Walmart sells;
• the availability of goods from suppliers and the cost of goods acquired from suppliers;
• the effectiveness of the implementation and operation of Walmart’s strategies, plans, programs and initiatives;
• Walmart’s ability to successfully integrate acquired businesses, including Jet.com, Inc.;
• the amount of shrinkage Walmart experiences;
• consumer acceptance of and response to Walmart’s stores and clubs, e-commerce websites, mobile apps, programs and merchandise offer-ings, including the Walmart U.S. segment’s Grocery Pickup program;
• Walmart’s gross profit margins, including pharmacy margins and margins of other product categories;
• the selling prices of gasoline and diesel fuel;
• disruption of seasonal buying patterns in Walmart’s markets;
• Walmart’s expenditures for FCPA and other compliance-related matters;
• disruptions in Walmart’s supply chain;
• cybersecurity events affecting Walmart and related costs and impact of any disruption in business;
• Walmart’s labor costs, including healthcare and other benefit costs;
• Walmart’s casualty and accident-related costs and insurance costs;
• the size of and turnover in Walmart’s workforce and the number of associates at various pay levels within that workforce;
• unexpected changes in Walmart’s objectives and plans;
• the availability of necessary personnel to staff Walmart’s stores, clubs and other facilities;
• the availability of skilled labor in areas in which new units are to be constructed or existing units are to be relocated, expanded or remodeled;
• delays in the opening of new, expanded or relocated units;
• developments in, and the outcome of, legal and regulatory proceedings and investigations to which Walmart is a party or is subject, and the liabilities, obligations and expenses, if any, that Walmart may incur in connection therewith;
• changes in the credit ratings assigned to Walmart’s commercial paper and debt securities by credit rating agencies;
• Walmart’s effective tax rate; and
• unanticipated changes in accounting judgments and estimates;
Management’s Discussion and Analysis of Financial Condition and Results of Operations
Walmart 2017 Annual Report 35
Regulatory and Other Factors
• changes in existing tax, labor and other laws and changes in tax rates, including the enactment of laws and the adoption and interpretation of administrative rules and regulations;
• governmental policies, programs, initiatives and actions in the markets in which Walmart operates and elsewhere;
• the possibility of imposition of new taxes on imports and new tariffs and trade restrictions and changes in existing tariff rates and trade restrictions;
• changes in currency control laws;
• the level of public assistance payments;
• the timing of federal income tax refunds;
• natural disasters, public health emergencies, civil disturbances, and terrorist attacks; and
• changes in generally accepted accounting principles in the United States.
We typically earn a disproportionate part of our annual operating income in the fourth quarter as a result of seasonal buying patterns, which patterns are difficult to forecast with certainty and can be affected by many factors.
Other Risk Factors; No Duty to UpdateWe discuss certain of these factors more fully, as well as certain other risk factors that may affect the results and other matters discussed in the forward-looking statements identified above, in our filings with the Securities and Exchange Commission (the “SEC”), including in our Annual Report on Form 10-K under the heading “Item 1A. Risk Factors.” We filed our Annual Report on Form 10-K for the fiscal year ended January 31, 2017, with the SEC on March 31, 2017. The forward-looking statements described above are made based on knowledge of our business and our operating environment and assumptions we believed to be reasonable when such forward-looking statements were made. As a consequence of the risks, factors and uncertainties we discuss above, and in the Annual Report on Form 10-K and other reports we may file with the SEC, other risks not known to us at this time, changes in facts, assumptions not being realized or other circumstances, our actual results may differ materially from those results discussed in or implied or contemplated by such forward-looking statements.
This cautionary statement qualifies all of the forward-looking statements made in this Annual Report to Shareholders. We cannot assure you that the results, events or developments expected or anticipated by us will be realized or, even if substantially realized, that those results, events or developments will result in the expected consequences for us or affect us, our business or our operations in the way or to the extent we expect. You are urged to consider all of these risks, factors and uncertainties carefully in evaluating the forward-looking statements made in this Annual Report to Shareholders and not to place undue reliance on such forward-looking statements. The forward-looking statements included in this Annual Report speak only as of the date of this Annual Report to Shareholders, and we undertake no obligation to update any of these forward-looking statements to reflect subsequent events or circumstances, except to the extent required by applicable law.
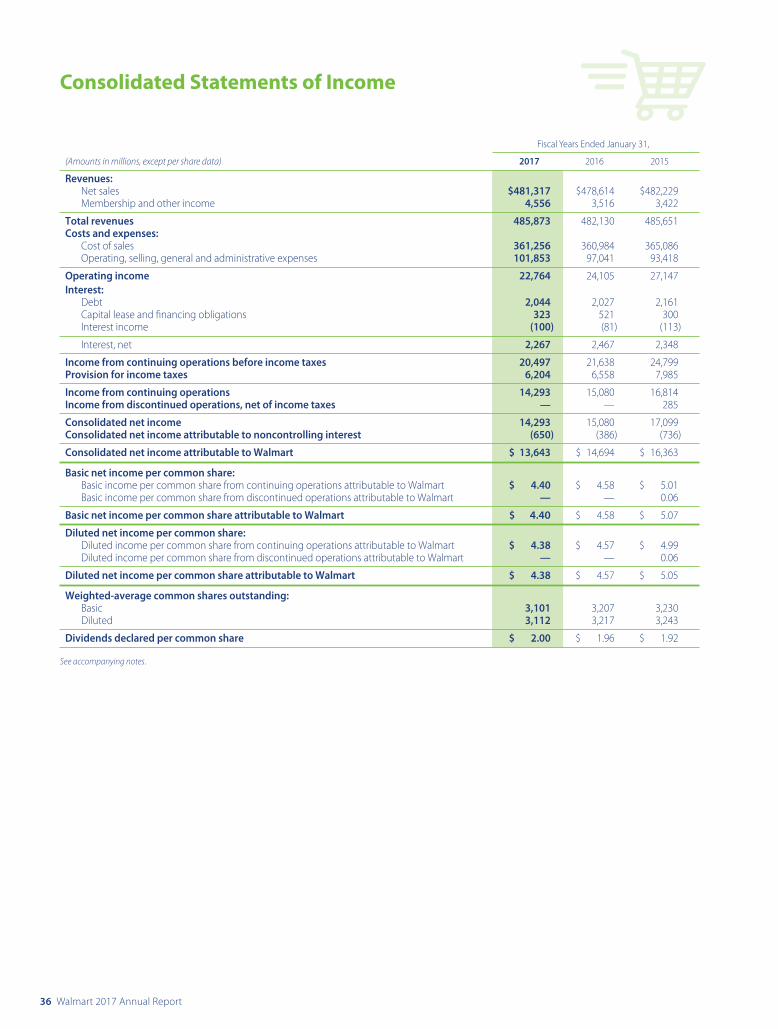
36 Walmart 2017 Annual Report
Consolidated Statements of Income
Fiscal Years Ended January 31,
(Amounts in millions, except per share data) 2017 2016 2015
Revenues: Net sales $481,317 $478,614 $482,229 Membership and other income 4,556 3,516 3,422
Total revenues 485,873 482,130 485,651Costs and expenses: Cost of sales 361,256 360,984 365,086 Operating, selling, general and administrative expenses 101,853 97,041 93,418
Operating income 22,764 24,105 27,147Interest: Debt 2,044 2,027 2,161 Capital lease and financing obligations 323 521 300 Interest income (100) (81) (113)
Interest, net 2,267 2,467 2,348
Income from continuing operations before income taxes 20,497 21,638 24,799Provision for income taxes 6,204 6,558 7,985
Income from continuing operations 14,293 15,080 16,814Income from discontinued operations, net of income taxes — — 285
Consolidated net income 14,293 15,080 17,099Consolidated net income attributable to noncontrolling interest (650) (386) (736)
Consolidated net income attributable to Walmart $ 13,643 $ 14,694 $ 16,363
Basic net income per common share: Basic income per common share from continuing operations attributable to Walmart $ 4.40 $ 4.58 $ 5.01 Basic income per common share from discontinued operations attributable to Walmart — — 0.06
Basic net income per common share attributable to Walmart $ 4.40 $ 4.58 $ 5.07
Diluted net income per common share: Diluted income per common share from continuing operations attributable to Walmart $ 4.38 $ 4.57 $ 4.99 Diluted income per common share from discontinued operations attributable to Walmart — — 0.06
Diluted net income per common share attributable to Walmart $ 4.38 $ 4.57 $ 5.05
Weighted-average common shares outstanding: Basic 3,101 3,207 3,230 Diluted 3,112 3,217 3,243
Dividends declared per common share $ 2.00 $ 1.96 $ 1.92
See accompanying notes.
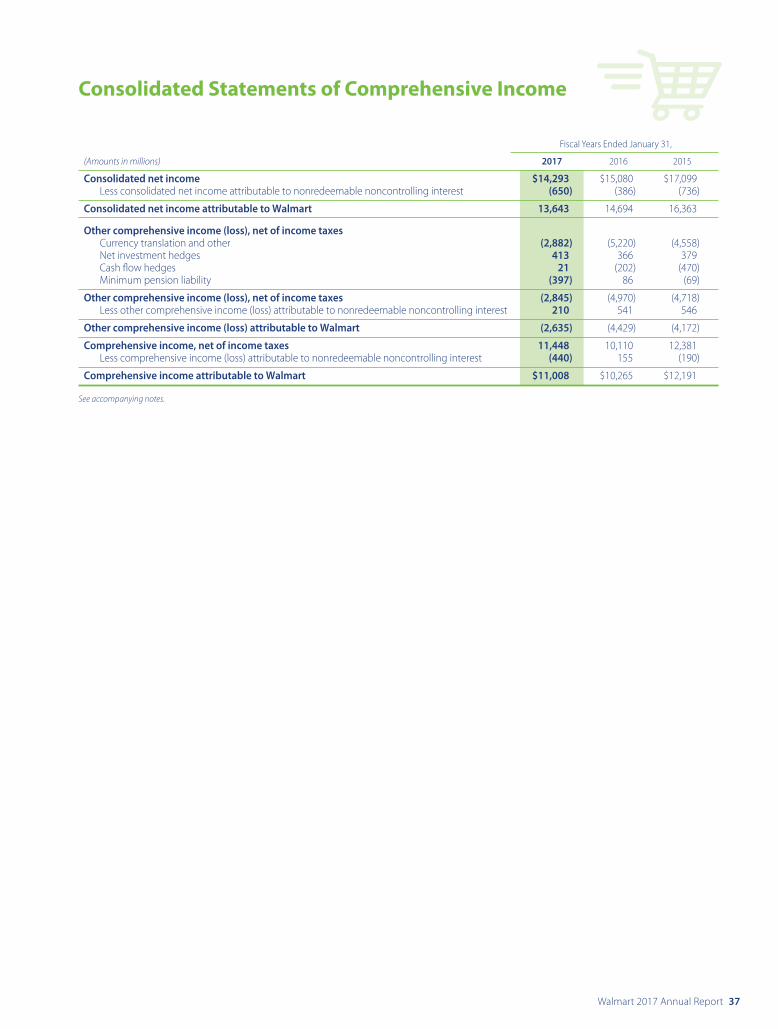
Walmart 2017 Annual Report 37
Fiscal Years Ended January 31,
(Amounts in millions) 2017 2016 2015
Consolidated net income $14,293 $15,080 $17,099 Less consolidated net income attributable to nonredeemable noncontrolling interest (650) (386) (736)
Consolidated net income attributable to Walmart 13,643 14,694 16,363
Other comprehensive income (loss), net of income taxes Currency translation and other (2,882) (5,220) (4,558) Net investment hedges 413 366 379 Cash flow hedges 21 (202) (470) Minimum pension liability (397) 86 (69)
Other comprehensive income (loss), net of income taxes (2,845) (4,970) (4,718) Less other comprehensive income (loss) attributable to nonredeemable noncontrolling interest 210 541 546
Other comprehensive income (loss) attributable to Walmart (2,635) (4,429) (4,172)
Comprehensive income, net of income taxes 11,448 10,110 12,381 Less comprehensive income (loss) attributable to nonredeemable noncontrolling interest (440) 155 (190)
Comprehensive income attributable to Walmart $11,008 $10,265 $12,191
See accompanying notes.
Consolidated Statements of Comprehensive Income
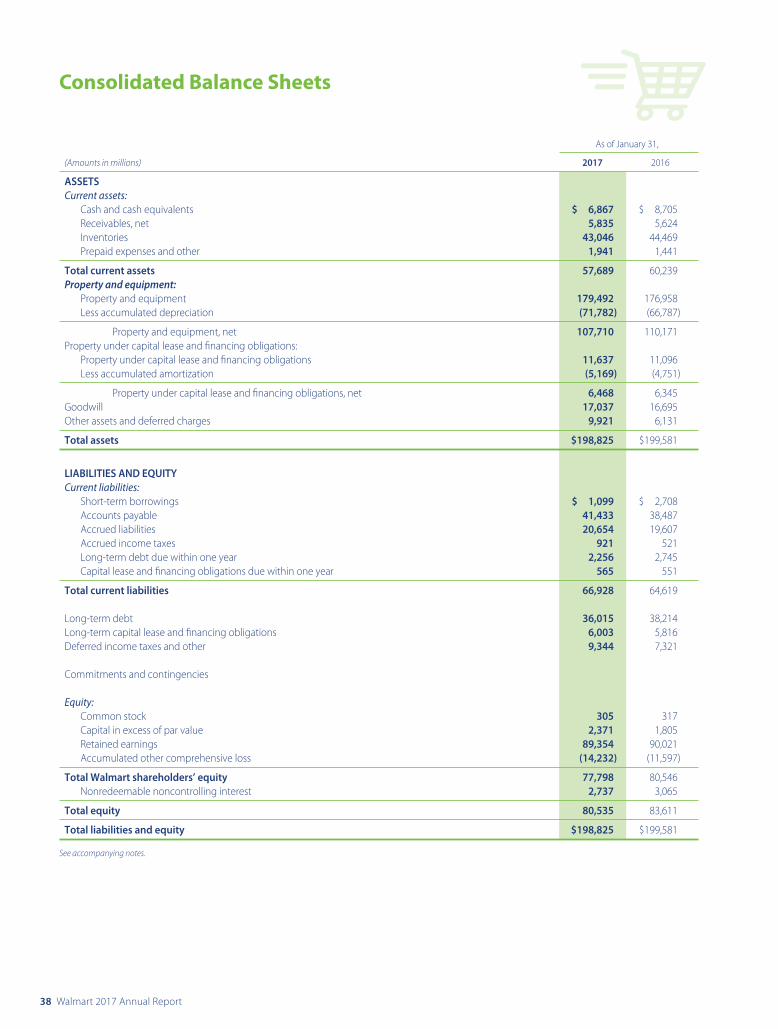
38 Walmart 2017 Annual Report
As of January 31,
(Amounts in millions) 2017 2016
ASSETSCurrent assets: Cash and cash equivalents $ 6,867 $ 8,705 Receivables, net 5,835 5,624 Inventories 43,046 44,469 Prepaid expenses and other 1,941 1,441
Total current assets 57,689 60,239Property and equipment: Property and equipment 179,492 176,958 Less accumulated depreciation (71,782) (66,787)
Property and equipment, net 107,710 110,171Property under capital lease and financing obligations: Property under capital lease and financing obligations 11,637 11,096 Less accumulated amortization (5,169) (4,751)
Property under capital lease and financing obligations, net 6,468 6,345Goodwill 17,037 16,695Other assets and deferred charges 9,921 6,131
Total assets $198,825 $199,581
LIABILITIES AND EQUITYCurrent liabilities: Short-term borrowings $ 1,099 $ 2,708 Accounts payable 41,433 38,487 Accrued liabilities 20,654 19,607 Accrued income taxes 921 521 Long-term debt due within one year 2,256 2,745 Capital lease and financing obligations due within one year 565 551
Total current liabilities 66,928 64,619
Long-term debt 36,015 38,214Long-term capital lease and financing obligations 6,003 5,816Deferred income taxes and other 9,344 7,321
Commitments and contingencies
Equity: Common stock 305 317 Capital in excess of par value 2,371 1,805 Retained earnings 89,354 90,021 Accumulated other comprehensive loss (14,232) (11,597)
Total Walmart shareholders’ equity 77,798 80,546 Nonredeemable noncontrolling interest 2,737 3,065
Total equity 80,535 83,611
Total liabilities and equity $198,825 $199,581
See accompanying notes.
Consolidated Balance Sheets
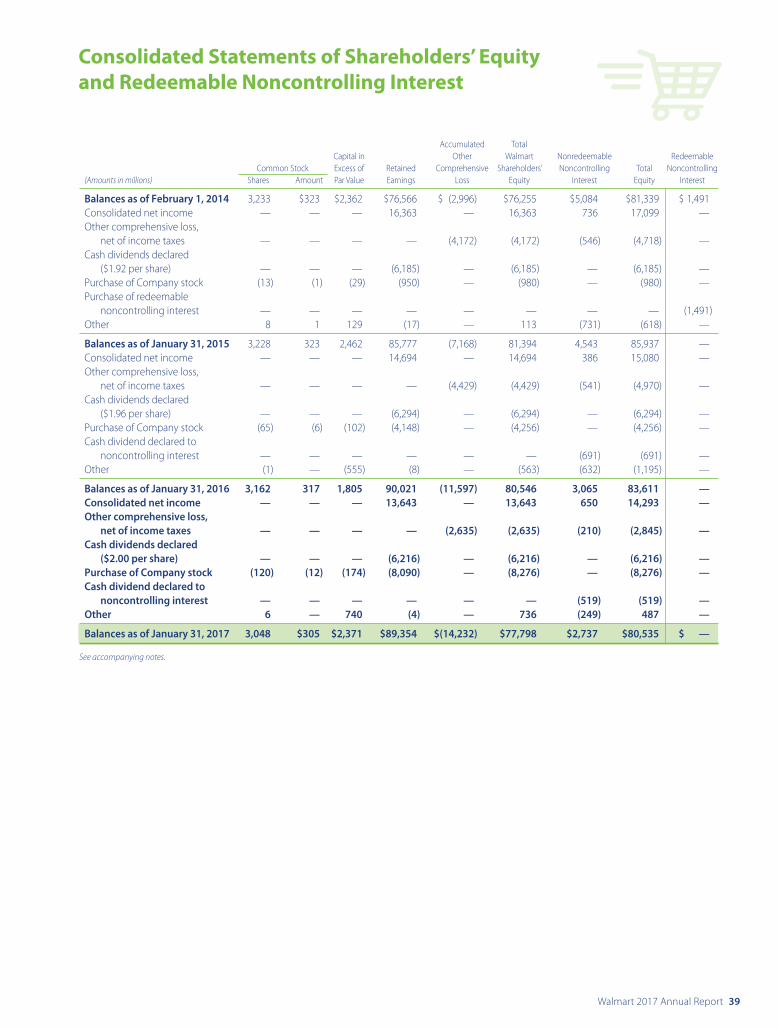
Walmart 2017 Annual Report 39
Accumulated Total Capital in Other Walmart Nonredeemable Redeemable Common Stock Excess of Retained Comprehensive Shareholders’ Noncontrolling Total Noncontrolling(Amounts in millions) Shares Amount Par Value Earnings Loss Equity Interest Equity Interest
Balances as of February 1, 2014 3,233 $323 $2,362 $76,566 $ (2,996) $76,255 $5,084 $81,339 $ 1,491Consolidated net income — — — 16,363 — 16,363 736 17,099 —Other comprehensive loss, net of income taxes — — — — (4,172) (4,172) (546) (4,718) —Cash dividends declared ($1.92 per share) — — — (6,185) — (6,185) — (6,185) —Purchase of Company stock (13) (1) (29) (950) — (980) — (980) —Purchase of redeemable noncontrolling interest — — — — — — — — (1,491)Other 8 1 129 (17) — 113 (731) (618) —
Balances as of January 31, 2015 3,228 323 2,462 85,777 (7,168) 81,394 4,543 85,937 —Consolidated net income — — — 14,694 — 14,694 386 15,080 —Other comprehensive loss, net of income taxes — — — — (4,429) (4,429) (541) (4,970) —Cash dividends declared ($1.96 per share) — — — (6,294) — (6,294) — (6,294) —Purchase of Company stock (65) (6) (102) (4,148) — (4,256) — (4,256) —Cash dividend declared to noncontrolling interest — — — — — — (691) (691) —Other (1) — (555) (8) — (563) (632) (1,195) —
Balances as of January 31, 2016 3,162 317 1,805 90,021 (11,597) 80,546 3,065 83,611 —Consolidated net income — — — 13,643 — 13,643 650 14,293 —Other comprehensive loss, net of income taxes — — — — (2,635) (2,635) (210) (2,845) —Cash dividends declared ($2.00 per share) — — — (6,216) — (6,216) — (6,216) —Purchase of Company stock (120) (12) (174) (8,090) — (8,276) — (8,276) —Cash dividend declared to noncontrolling interest — — — — — — (519) (519) —Other 6 — 740 (4) — 736 (249) 487 —
Balances as of January 31, 2017 3,048 $305 $2,371 $89,354 $(14,232) $77,798 $2,737 $80,535 $ —
See accompanying notes.
Consolidated Statements of Shareholders’ Equity and Redeemable Noncontrolling Interest
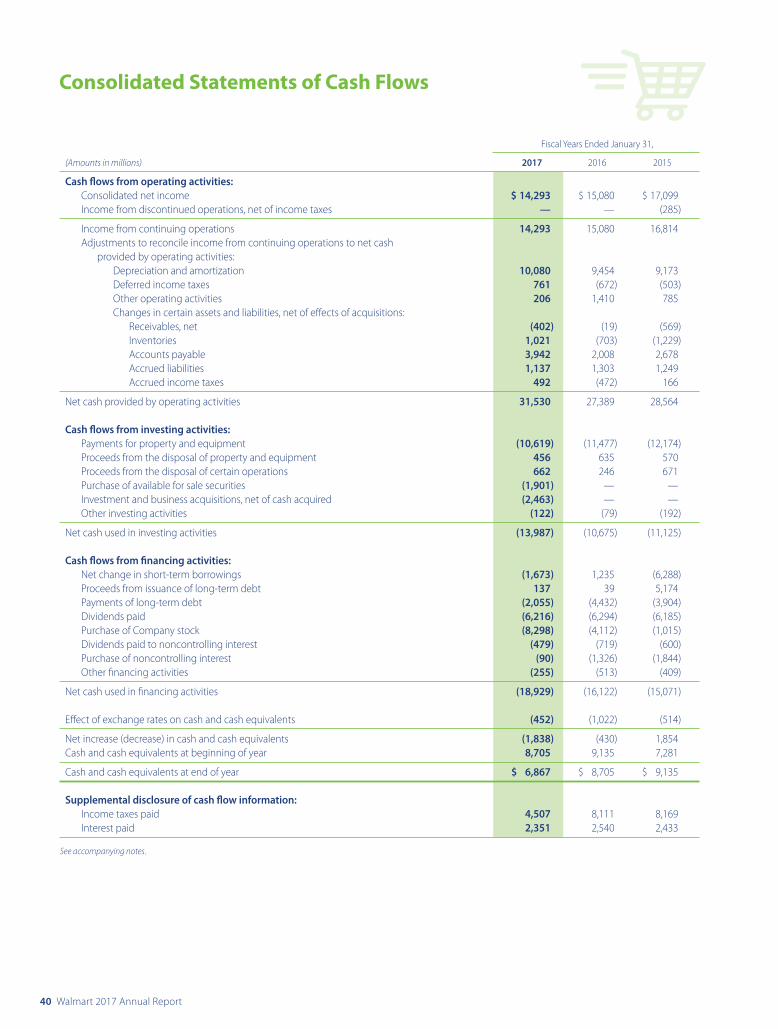
40 Walmart 2017 Annual Report
Fiscal Years Ended January 31,
(Amounts in millions) 2017 2016 2015
Cash flows from operating activities: Consolidated net income $ 14,293 $ 15,080 $ 17,099 Income from discontinued operations, net of income taxes — — (285)
Income from continuing operations 14,293 15,080 16,814 Adjustments to reconcile income from continuing operations to net cash provided by operating activities: Depreciation and amortization 10,080 9,454 9,173 Deferred income taxes 761 (672) (503) Other operating activities 206 1,410 785 Changes in certain assets and liabilities, net of effects of acquisitions: Receivables, net (402) (19) (569) Inventories 1,021 (703) (1,229) Accounts payable 3,942 2,008 2,678 Accrued liabilities 1,137 1,303 1,249 Accrued income taxes 492 (472) 166
Net cash provided by operating activities 31,530 27,389 28,564
Cash flows from investing activities: Payments for property and equipment (10,619) (11,477) (12,174) Proceeds from the disposal of property and equipment 456 635 570 Proceeds from the disposal of certain operations 662 246 671 Purchase of available for sale securities (1,901) — — Investment and business acquisitions, net of cash acquired (2,463) — — Other investing activities (122) (79) (192)
Net cash used in investing activities (13,987) (10,675) (11,125)
Cash flows from financing activities: Net change in short-term borrowings (1,673) 1,235 (6,288) Proceeds from issuance of long-term debt 137 39 5,174 Payments of long-term debt (2,055) (4,432) (3,904) Dividends paid (6,216) (6,294) (6,185) Purchase of Company stock (8,298) (4,112) (1,015) Dividends paid to noncontrolling interest (479) (719) (600) Purchase of noncontrolling interest (90) (1,326) (1,844) Other financing activities (255) (513) (409)
Net cash used in financing activities (18,929) (16,122) (15,071)
Effect of exchange rates on cash and cash equivalents (452) (1,022) (514)
Net increase (decrease) in cash and cash equivalents (1,838) (430) 1,854Cash and cash equivalents at beginning of year 8,705 9,135 7,281
Cash and cash equivalents at end of year $ 6,867 $ 8,705 $ 9,135
Supplemental disclosure of cash flow information: Income taxes paid 4,507 8,111 8,169 Interest paid 2,351 2,540 2,433
See accompanying notes.
Consolidated Statements of Cash Flows
Walmart 2017 Annual Report 41
1. Summary of Significant Accounting Policies
GeneralWal-Mart Stores, Inc. (“Walmart” or the “Company”) helps people around the world save money and live better—anytime and anywhere—in retail stores or through the Company’s e-commerce and mobile capabilities. Through innovation, the Company is striving to create a customer-centric experience that seamlessly integrates digital and physical shopping and saves time for our customers. Each week, the Company serves over 260 million customers who visit its 11,695 stores under 59 banners in 28 countries and e-commerce websites in 11 countries. The Company’s strategy is to lead on price, invest to differentiate on access, be competitive on assortment and deliver a great experience.
The Company’s operations comprise three reportable segments: Walmart U.S., Walmart International and Sam’s Club.
Principles of ConsolidationThe Consolidated Financial Statements include the accounts of Walmart and its subsidiaries as of and for the fiscal years ended January 31, 2017 (“fiscal 2017”), January 31, 2016 (“fiscal 2016”) and January 31, 2015 (“fiscal 2015”). All material intercompany accounts and transactions have been eliminated in consolidation. We consolidate variable interest entities where it has been determined that the Company is the primary beneficiary of those entities’ operations. Investments in unconsolidated affiliates, which are 50% or less owned and do not otherwise meet consolidation requirements, are accounted for primarily using the equity method. These investments are immaterial to the Company’s Consolidated Financial Statements.
The Company’s Consolidated Financial Statements are based on a fiscal year ending on January 31 for the United States (“U.S.”) and Canadian operations. The Company consolidates all other operations generally using a one-month lag and based on a calendar year. There were no significant intervening events during January 2017 that materially affected the Consolidated Financial Statements.
Use of EstimatesThe Consolidated Financial Statements have been prepared in conformity with U.S. generally accepted accounting principles. Those principles require management to make estimates and assumptions that affect the reported amounts of assets and liabilities. Management’s estimates and assumptions also affect the disclosure of contingent assets and liabilities at the date of the financial statements and the reported amounts of revenues and expenses during the reporting period. Actual results may differ from those estimates.
Cash and Cash EquivalentsThe Company considers investments with a maturity when purchased of three months or less to be cash equivalents. All credit card, debit card and electronic benefits transfer transactions that process in less than seven days are classified as cash and cash equivalents. The amounts due from banks for these transactions classified as cash and cash equivalents totaled $1.5 billion and $3.4 billion at January 31, 2017 and 2016, respec-tively. In addition, cash and cash equivalents included restricted cash of $265 million and $362 million at January 31, 2017 and 2016, respectively, which was primarily related to cash collateral holdings from various counterparties, as required by certain derivative and trust agreements.
The Company’s cash balances are held in various locations around the world. Of the Company’s $6.9 billion and $8.7 billion of cash and cash equivalents at January 31, 2017 and 2016, respectively, $5.9 billion and $4.5 billion, respectively, were held outside of the U.S. and were generally utilized to support liquidity needs in the Company’s non-U.S. operations.
The Company uses intercompany financing arrangements in an effort to ensure cash can be made available in the country in which it is needed with the minimum cost possible. Management does not believe it will be necessary to repatriate earnings held outside of the U.S. and anticipates the Company’s domestic liquidity needs will be met through cash flows provided by domestic operating activities, supplemented with long-term debt and short-term borrowings. Accordingly, the Company intends, with only certain exceptions, to continue to indefinitely reinvest the Company’s earnings held outside of the U.S. in our foreign operations. When the income earned, either from operations or through intercom-pany financing arrangements, and indefinitely reinvested outside of the U.S. is taxed at local country tax rates, which are generally lower than the U.S. statutory rate, the Company realizes an effective tax rate benefit. If the Company’s intentions with respect to reinvestment were to change, most of the amounts held within the Company’s foreign operations could be repatriated to the U.S., although any repatriation under current U.S. tax laws would be subject to U.S. federal income taxes, less applicable foreign tax credits. Although there can be no assurance of the impact on the Company of potential federal tax reform in the U.S., the Company does not expect current local laws, other existing limitations or potential taxes on anticipated future repatriations of earnings held outside of the U.S. to have a material effect on the Company’s overall liquidity, financial condition or results of operations.
As of January 31, 2017 and 2016, cash and cash equivalents of approximately $1.0 billion and $1.1 billion, respectively, may not be freely transferable to the U.S. due to local laws or other restrictions.
ReceivablesReceivables are stated at their carrying values, net of a reserve for doubtful accounts. Receivables consist primarily of amounts due from:
• insurance companies resulting from pharmacy sales;
• banks for customer credit and debit cards and electronic bank transfers that take in excess of seven days to process;
• consumer financing programs in certain international operations;
• suppliers for marketing or incentive programs; and
• real estate transactions.
The Walmart International segment offers a limited number of consumer credit products, primarily through its financial institutions in select countries. The receivable balance from consumer credit products was $1.2 billion, net of a reserve for doubtful accounts of $79 million at January 31, 2017, compared to a receivable balance of $1.0 billion, net of a reserve for doubtful accounts of $70 million at January 31, 2016. These balances are included in receivables, net, in the Company’s Consolidated Balance Sheets.
InventoriesThe Company values inventories at the lower of cost or market as determined primarily by the retail inventory method of accounting, using the last-in, first-out (“LIFO”) method for substantially all of the
Notes to Consolidated Financial Statements
42 Walmart 2017 Annual Report
Walmart U.S. segment’s inventories. The inventory at the Walmart International segment is valued primarily by the retail inventory method of accounting, using the first-in, first-out (“FIFO”) method. The retail inventory method of accounting results in inventory being valued at the lower of cost or market since permanent markdowns are immediately recorded as a reduction of the retail value of inventory. The inventory at the Sam’s Club segment is valued using the LIFO method. At January 31, 2017 and January 31, 2016, the Company’s inventories valued at LIFO approximated those inventories as if they were valued at FIFO.
Property and EquipmentProperty and equipment are stated at cost. Gains or losses on disposition are recognized as earned or incurred. Costs of major improvements are capitalized, while costs of normal repairs and maintenance are charged to expense as incurred. The following table summarizes the Company’s property and equipment balances and includes the estimated useful lives that are generally used to depreciate the assets on a straight-line basis:
Fiscal Years Ended Estimated January 31,
(Amounts in millions) Useful Lives 2017 2016
Land N/A $ 24,801 $ 25,624Buildings and improvements 3-40 years 98,547 96,845Fixtures and equipment 1-30 years 48,998 47,033Transportation equipment 3-15 years 2,845 2,917Construction in progress N/A 4,301 4,539
Property and equipment $179,492 $176,958Accumulated depreciation (71,782) (66,787)
Property and equipment, net $107,710 $110,171
Leasehold improvements are depreciated or amortized over the shorter of the estimated useful life of the asset or the remaining expected lease term. Total depreciation and amortization expense for property and equipment, property under financing obligations and property under capital leases for fiscal 2017, 2016 and 2015 was $10.0 billion, $9.4 billion and $9.1 billion, respectively. Interest costs capitalized on construction projects were $36 million, $39 million and $59 million in fiscal 2017, 2016 and 2015, respectively.
LeasesThe Company estimates the expected term of a lease by assuming the exercise of renewal options where an economic penalty exists that would preclude the abandonment of the lease at the end of the initial non-cancelable term and the exercise of such renewal is at the sole dis-cretion of the Company. The expected term is used in the determination of whether a store or club lease is a capital or operating lease and in the calculation of straight-line rent expense. Additionally, the useful life of leasehold improvements is limited by the expected lease term or the economic life of the asset, whichever is shorter. If significant expenditures are made for leasehold improvements late in the expected term of a lease and renewal is reasonably assured, the useful life of the leasehold improvement is limited to the end of the renewal period or economic life of the asset, whichever is shorter. Rent abatements and escalations are considered in the calculation of minimum lease payments in the Company’s capital lease tests and in determining straight-line rent expense for operating leases.
The Company is often involved in the construction of its leased stores. In certain cases, payments made for certain structural components included in the lessor’s construction of the leased assets result in the Company being deemed the owner of the leased assets for accounting purposes. As a result, the payments, regardless of the significance, are automatic indicators of ownership and require the Company to capitalize the lessor’s total project cost with a corresponding financing obligation. Upon completion of the lessor’s project, the Company performs a sale-leaseback analysis to determine if these assets and the related financing obligation can be derecognized from the Company’s Consolidated Balance Sheets. If the Company is deemed to have “continuing involvement,” the leased assets and the related financing obligation remain on the Company’s Consolidated Balance Sheets and are generally amortized over the lease term. At the end of the lease term, including exercise of any renewal options, the net remaining financing obligation over the net carrying value of the fixed asset will be recognized as a non-cash gain on sale of the property.
Long-Lived AssetsLong-lived assets are stated at cost. Management reviews long-lived assets for indicators of impairment whenever events or changes in cir-cumstances indicate that the carrying amount may not be recoverable. The evaluation is performed at the lowest level of identifiable cash flows, which is at the individual store or club level or, in certain circumstances, a market group of stores. Undiscounted cash flows expected to be generated by the related assets are estimated over the assets’ useful lives based on updated projections. If the evaluation indicates that the carrying amount of the assets may not be recoverable, any potential impairment is measured based upon the fair value of the related asset or asset group as determined by an appropriate market appraisal or other valuation technique. Impairment charges of long-lived assets for fiscal 2017, 2016 and 2015 were not material.
Goodwill and Other Acquired Intangible AssetsGoodwill represents the excess of the purchase price over the fair value of net assets acquired in business combinations and is allocated to the appropriate reporting unit when acquired. Other acquired intangible assets are stated at the fair value acquired as determined by a valuation technique commensurate with the intended use of the related asset. Goodwill and indefinite-lived intangible assets are not amortized; rather, they are evaluated for impairment annually and whenever events or changes in circumstances indicate that the value of the asset may be impaired. Definite-lived intangible assets are considered long-lived assets and are amortized on a straight-line basis over the periods that expected economic benefits will be provided.
Goodwill is evaluated for impairment using either a qualitative or quantitative approach for each of the Company’s reporting units. Generally, a qualitative assessment is first performed to determine whether a quantitative goodwill impairment test is necessary. If man-agement determines, after performing an assessment based on the qualitative factors, that the fair value of the reporting unit is more likely than not less than the carrying amount, or that a fair value of the reporting unit substantially in excess of the carrying amount cannot be assured, then a quantitative goodwill impairment test would be required. The quantitative test for goodwill impairment is performed by determining the fair value of the related reporting units. Fair value is measured based on the discounted cash flow method and relative market-based approaches.
Notes to Consolidated Financial Statements
Walmart 2017 Annual Report 43
The Company’s reporting units were evaluated using a quantitative impairment test. Management determined the fair value of each reporting unit is greater than the carrying amount and, accordingly, the Company has not recorded any impairment charges related to goodwill.
The following table reflects goodwill activity, by reportable segment, for fiscal 2017 and 2016:
Walmart (Amounts in millions) Walmart U.S. International Sam’s Club Total
Balances as of February 1, 2015 $ 461 $17,328 $313 $18,102Changes in currency translation and other — (1,412) — (1,412)Acquisitions(1) — 5 — 5
Balances as of January 31, 2016 461 15,921 313 16,695Changes in currency translation and other — (1,433) — (1,433)Acquisitions(2) 1,775 — — 1,775
Balances as of January 31, 2017 $2,236 $14,488 $313 $17,037
(1) Goodwill recorded for fiscal 2016 acquisitions relates to acquisitions that are not significant, individually or in the aggregate, to the Company’s Consolidated Financial Statements.
(2) Goodwill recorded for fiscal 2017 Walmart U.S. acquisitions primarily relates to Jet.com, Inc. (“jet.com”).
Indefinite-lived intangible assets are included in other assets and deferred charges in the Company’s Consolidated Balance Sheets. These assets are evaluated for impairment based on their fair values using valuation techniques which are updated annually based on the most recent variables and assumptions. There were no significant impairment charges related to indefinite-lived intangible assets recorded for fiscal 2017, 2016 and 2015.
Self Insurance ReservesThe Company self-insures a number of risks, including, but not limited to, workers’ compensation, general liability, auto liability, product liability and certain employee-related healthcare benefits. Standard actuarial procedures and data analysis are used to estimate the liabilities associated with these risks as of the balance sheet date on an undiscounted basis. The recorded liabilities reflect the ultimate cost for claims incurred but not paid and any estimable administrative run-out expenses related to the processing of these outstanding claim payments. On a regular basis, claims reserve valuations are provided by independent third-party actuaries to ensure liability estimates are appropriate. To limit exposure to some risks, the Company maintains insurance coverage with varying limits and retentions, including stop-loss insurance coverage for workers’ compensation, general liability and auto liability.
Income TaxesIncome taxes are accounted for under the balance sheet method. Deferred tax assets and liabilities are recognized for the estimated future tax consequences attributable to differences between the financial statement carrying amounts of existing assets and liabilities and their respective tax bases (“temporary differences”). Deferred tax assets and
liabilities are measured using enacted tax rates in effect for the year in which those temporary differences are expected to be recovered or settled. The effect on deferred tax assets and liabilities of a change in tax rate is recognized in income in the period that includes the enactment date.
Deferred tax assets are evaluated for future realization and reduced by a valuation allowance to the extent that a portion is not more likely than not to be realized. Many factors are considered when assessing whether it is more likely than not that the deferred tax assets will be realized, including recent cumulative earnings, expectations of future taxable income, carryforward periods, and other relevant quantitative and quali-tative factors. The recoverability of the deferred tax assets is evaluated by assessing the adequacy of future expected taxable income from all sources, including reversal of taxable temporary differences, forecasted operating earnings and available tax planning strategies. These sources of income rely heavily on estimates.
In determining the provision for income taxes, an annual effective income tax rate is used based on annual income, permanent differences between book and tax income, and statutory income tax rates. Discrete events such as audit settlements or changes in tax laws are recognized in the period in which they occur.
The Company records a liability for unrecognized tax benefits resulting from uncertain tax positions taken or expected to be taken in a tax return. The Company records interest and penalties related to unrecognized tax benefits in interest expense and operating, selling, general and adminis-trative expenses, respectively, in the Company’s Consolidated Statements of Income. Refer to Note 9 for additional income tax disclosures.
Revenue RecognitionSalesThe Company recognizes sales revenue, net of sales taxes and estimated sales returns, at the time it sells merchandise to the customer. Digital retail sales include shipping revenue and are recorded upon delivery to the customer.
Membership Fee RevenueThe Company recognizes membership fee revenue both in the U.S. and internationally over the term of the membership, which is typically 12 months. The following table summarizes membership fee activity for fiscal 2017, 2016 and 2015:
Fiscal Years Ended January 31,
(Amounts in millions) 2017 2016 2015
Deferred membership fee revenue, beginning of year $ 744 $ 759 $ 641Cash received from members 1,371 1,333 1,410Membership fee revenue recognized (1,372) (1,348) (1,292)
Deferred membership fee revenue, end of year $ 743 $ 744 $ 759
Membership fee revenue is included in membership and other income in the Company’s Consolidated Statements of Income. The deferred membership fee is included in accrued liabilities in the Company’s Consolidated Balance Sheets.
Notes to Consolidated Financial Statements
44 Walmart 2017 Annual Report
Shopping CardsCustomer purchases of shopping cards, to be utilized in our stores or on our e-commerce websites, are not recognized as revenue until the card is redeemed and the customer purchases merchandise using the shop-ping card. Shopping cards in the U.S. do not carry an expiration date; therefore, customers and members can redeem their shopping cards for merchandise indefinitely. Shopping cards in certain foreign countries where the Company does business may have expiration dates. A certain number of shopping cards, both with and without expiration dates, will not be fully redeemed. Management estimates unredeemed shopping cards and recognizes revenue for these amounts when it is determined the likelihood of redemption is remote. Management periodically reviews and updates its estimates.
Financial and Other ServicesThe Company recognizes revenue from service transactions at the time the service is performed. Generally, revenue from services is classified as a component of net sales in the Company’s Consolidated Statements of Income.
Cost of SalesCost of sales includes actual product cost, the cost of transportation to the Company’s distribution facilities, stores and clubs from suppliers, the cost of transportation from the Company’s distribution facilities to the stores, clubs and customers and the cost of warehousing for the Sam’s Club segment and import distribution centers. Cost of sales is reduced by supplier payments that are not a reimbursement of specific, incremental and identifiable costs.
Payments from SuppliersThe Company receives consideration from suppliers for various programs, primarily volume incentives, warehouse allowances and reimbursements for specific programs such as markdowns, margin protection, advertising and supplier-specific fixtures. Payments from suppliers are accounted for as a reduction of cost of sales and are recognized in the Company’s Consolidated Statements of Income when the related inventory is sold, except in certain limited situations when the payment is a reimbursement of specific, incremental and identifiable costs.
Operating, Selling, General and Administrative ExpensesOperating, selling, general and administrative expenses include all operating costs of the Company, except cost of sales, as described above. As a result, the majority of the cost of warehousing and occupancy for the Walmart U.S. and Walmart International segments’ distribution facilities is included in operating, selling, general and administrative expenses. Because the Company does not include most of the cost of its Walmart U.S. and Walmart International segments’ distribution facilities in cost of sales, its gross profit and gross profit as a percentage of net sales may not be comparable to those of other retailers that may include all costs related to their distribution facilities in cost of sales and in the calculation of gross profit.
Advertising CostsAdvertising costs are expensed as incurred, consist primarily of print, television and digital advertisements and are recorded in operating, selling, general and administrative expenses in the Company’s Consolidated Statements of Income. In certain limited situations, reimbursements from suppliers that are for specific, incremental and identifiable advertising costs are recognized as a reduction of advertising costs in operating, selling, general and administrative expenses. Advertising costs were $2.9 billion, $2.5 billion and $2.4 billion for fiscal 2017, 2016 and 2015, respectively.
Pre-Opening CostsThe cost of start-up activities, including organization costs, related to new store openings, store remodels, relocations, expansions and conversions are expensed as incurred and included in operating, selling, general and administrative expenses in the Company’s Consolidated Statements of Income. Pre-opening costs totaled $131 million, $271 million and $317 million for fiscal 2017, 2016 and 2015, respectively.
Currency TranslationThe assets and liabilities of all international subsidiaries are translated from the respective local currency to the U.S. dollar using exchange rates at the balance sheet date. Related translation adjustments are recorded as a component of accumulated other comprehensive income (loss). The income statements of all international subsidiaries are translated from the respective local currencies to the U.S. dollar using average exchange rates for the period covered by the income statements.
Recent Accounting PronouncementsRevenue RecognitionIn May 2014, the Financial Accounting Standards Board (“FASB”) issued Accounting Standards Update (“ASU”) 2014-09, Revenue from Contracts with Customers (Topic 606). This ASU is a comprehensive new revenue recognition model that requires a company to recognize revenue to depict the transfer of goods or services to a customer at an amount that reflects the consideration it expects to receive in exchange for those goods or services. Management continues to evaluate the impact this ASU, the related amendments and the interpretive guidance will have on the Company’s consolidated financial statements. While management does not expect this ASU to materially impact the Company’s consoli-dated net income, balance sheet or cash flows, the ASU will impact the timing of recognition of some revenue and may impact the gross amount of revenue presented for certain contracts. Management expects the most significant timing change to result from the revenue associated with the unredeemed portion of Company issued gift cards, which will be recognized over the expected redemption period of the gift card under the new standard rather than waiting until the likelihood of redemption becomes remote or waiting for the gift card to expire. Additionally, management continues to assess the guidance and the related interpretation to determine if that guidance will impact the gross amount of revenue presented for certain contracts. The Company is planning to adopt this ASU on February 1, 2018 under the modified retrospective approach, which will result in a cumulative adjustment to retained earnings.
Notes to Consolidated Financial Statements
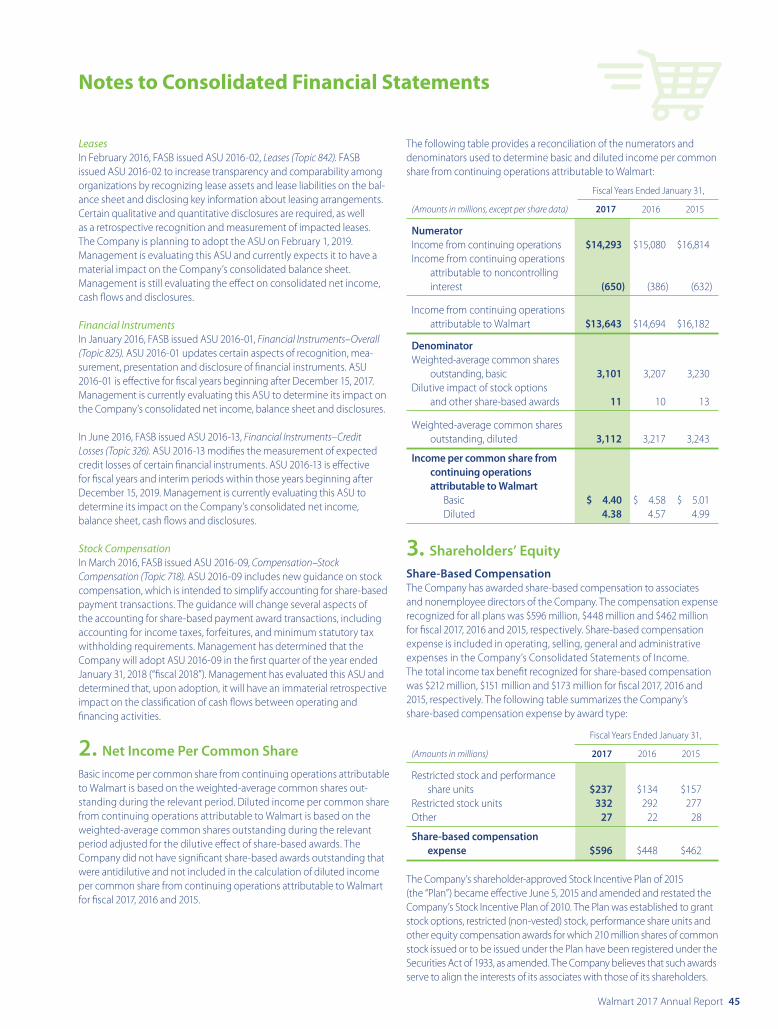
Walmart 2017 Annual Report 45
LeasesIn February 2016, FASB issued ASU 2016-02, Leases (Topic 842). FASB issued ASU 2016-02 to increase transparency and comparability among organizations by recognizing lease assets and lease liabilities on the bal-ance sheet and disclosing key information about leasing arrangements. Certain qualitative and quantitative disclosures are required, as well as a retrospective recognition and measurement of impacted leases. The Company is planning to adopt the ASU on February 1, 2019. Management is evaluating this ASU and currently expects it to have a material impact on the Company’s consolidated balance sheet. Management is still evaluating the effect on consolidated net income, cash flows and disclosures.
Financial InstrumentsIn January 2016, FASB issued ASU 2016-01, Financial Instruments–Overall (Topic 825). ASU 2016-01 updates certain aspects of recognition, mea-surement, presentation and disclosure of financial instruments. ASU 2016-01 is effective for fiscal years beginning after December 15, 2017. Management is currently evaluating this ASU to determine its impact on the Company’s consolidated net income, balance sheet and disclosures.
In June 2016, FASB issued ASU 2016-13, Financial Instruments–Credit Losses (Topic 326). ASU 2016-13 modifies the measurement of expected credit losses of certain financial instruments. ASU 2016-13 is effective for fiscal years and interim periods within those years beginning after December 15, 2019. Management is currently evaluating this ASU to determine its impact on the Company’s consolidated net income, balance sheet, cash flows and disclosures.
Stock CompensationIn March 2016, FASB issued ASU 2016-09, Compensation–Stock Compensation (Topic 718). ASU 2016-09 includes new guidance on stock compensation, which is intended to simplify accounting for share-based payment transactions. The guidance will change several aspects of the accounting for share-based payment award transactions, including accounting for income taxes, forfeitures, and minimum statutory tax withholding requirements. Management has determined that the Company will adopt ASU 2016-09 in the first quarter of the year ended January 31, 2018 (“fiscal 2018”). Management has evaluated this ASU and determined that, upon adoption, it will have an immaterial retrospective impact on the classification of cash flows between operating and financing activities.
2. Net Income Per Common Share
Basic income per common share from continuing operations attributable to Walmart is based on the weighted-average common shares out-standing during the relevant period. Diluted income per common share from continuing operations attributable to Walmart is based on the weighted-average common shares outstanding during the relevant period adjusted for the dilutive effect of share-based awards. The Company did not have significant share-based awards outstanding that were antidilutive and not included in the calculation of diluted income per common share from continuing operations attributable to Walmart for fiscal 2017, 2016 and 2015.
The following table provides a reconciliation of the numerators and denominators used to determine basic and diluted income per common share from continuing operations attributable to Walmart:
Fiscal Years Ended January 31,
(Amounts in millions, except per share data) 2017 2016 2015
NumeratorIncome from continuing operations $14,293 $15,080 $16,814Income from continuing operations attributable to noncontrolling interest (650) (386) (632)
Income from continuing operations attributable to Walmart $13,643 $14,694 $16,182
DenominatorWeighted-average common shares outstanding, basic 3,101 3,207 3,230Dilutive impact of stock options and other share-based awards 11 10 13
Weighted-average common shares outstanding, diluted 3,112 3,217 3,243
Income per common share from continuing operations attributable to Walmart Basic $ 4.40 $ 4.58 $ 5.01 Diluted 4.38 4.57 4.99
3. Shareholders’ Equity
Share-Based CompensationThe Company has awarded share-based compensation to associates and nonemployee directors of the Company. The compensation expense recognized for all plans was $596 million, $448 million and $462 million for fiscal 2017, 2016 and 2015, respectively. Share-based compensation expense is included in operating, selling, general and administrative expenses in the Company’s Consolidated Statements of Income. The total income tax benefit recognized for share-based compensation was $212 million, $151 million and $173 million for fiscal 2017, 2016 and 2015, respectively. The following table summarizes the Company’s share-based compensation expense by award type:
Fiscal Years Ended January 31,
(Amounts in millions) 2017 2016 2015
Restricted stock and performance share units $237 $134 $157Restricted stock units 332 292 277Other 27 22 28
Share-based compensation expense $596 $448 $462
The Company’s shareholder-approved Stock Incentive Plan of 2015 (the “Plan”) became effective June 5, 2015 and amended and restated the Company’s Stock Incentive Plan of 2010. The Plan was established to grant stock options, restricted (non-vested) stock, performance share units and other equity compensation awards for which 210 million shares of common stock issued or to be issued under the Plan have been registered under the Securities Act of 1933, as amended. The Company believes that such awards serve to align the interests of its associates with those of its shareholders.
Notes to Consolidated Financial Statements
46 Walmart 2017 Annual Report
The Plan’s award types are summarized as follows:
• Restricted Stock and Performance Share Units. Restricted stock awards are for shares that vest based on the passage of time and include restrictions related to employment. Performance share units vest based on the passage of time and achievement of performance criteria and may range from 0% to 150% of the original award amount. Vesting periods for these awards are generally between one and three years. Restricted stock and performance share units may be settled or deferred in stock and are accounted for as equity in the Company’s Consolidated Balance Sheets. The fair value of restricted stock awards is determined on the date of grant and is expensed ratably over the vesting period. The fair value of performance share units is determined on the date of grant using the Company’s stock price discounted for the expected dividend yield through the vesting period and is recognized over the vesting period. The weighted-average discount for the dividend yield used to determine the fair value of performance share units in fiscal 2017, 2016 and 2015 was 8.3%, 7.4% and 7.1%, respectively.
• Restricted Stock Units. Restricted stock units provide rights to Company stock after a specified service period; generally 50% vest three years from the grant date and the remaining 50% vest five years from the grant date. The fair value of each restricted stock unit is determined on the date of grant using the stock price discounted for the expected dividend yield through the vesting period and is recognized ratably over the vesting period. The expected dividend yield is based on the anticipated dividends over the vesting period. The weighted-average discount for the dividend yield used to determine the fair value of restricted stock units granted in fiscal 2017, 2016 and 2015 was 9.0%, 8.7% and 9.5%, respectively.
In addition to the Plan, the Company’s subsidiary in the United Kingdom has stock option plans for certain colleagues which generally vest over three years. The stock option share-based compensation expense is included in the Other line in the table above.
The following table shows the activity for restricted stock and performance share units and restricted stock units during fiscal 2017:
Restricted Stock and Performance Share Units (1) Restricted Stock Units
Weighted-Average Weighted-Average Grant-Date Grant-Date Fair Value Fair Value (Shares in thousands) Shares Per Share Shares Per Share
Outstanding at February 1, 2016 8,259 $72.23 17,591 $65.67 Granted 4,102 64.09 12,696 63.71 Vested/exercised (2,073) 71.99 (4,332) 60.54 Forfeited or expired (1,211) 71.58 (1,679) 65.95
Outstanding at January 31, 2017 9,077 $68.61 24,276(2) $65.52
(1) Assumes payout rate at 100% for Performance Share Units.
(2) Includes 3.6 million restricted stock units granted in fiscal 2017 outside of the Plan in conjunction with the acquisition of jet.com.
The following table includes additional information related to restricted stock and performance share units and restricted stock units:
Fiscal Years Ended January 31,
(Amounts in millions) 2017 2016 2015
Fair value of restricted stock and performance share units vested $149 $142 $156Fair value of restricted stock units vested 261 237 218Unrecognized compensation cost for restricted stock and performance share units 211 133 154Unrecognized compensation cost for restricted stock units 986 628 570Weighted average remaining period to expense for restricted stock and performance share units (years) 1.3 1.3 1.3Weighted average remaining period to expense for restricted stock units (years) 1.9 1.7 1.7
Share Repurchase ProgramFrom time to time, the Company repurchases shares of its common stock under share repurchase programs authorized by the Board of Directors. The current $20.0 billion share repurchase program, as authorized by the Board of Directors on October 13, 2015, has no expiration date or other restrictions limiting the period over which the Company can make share repurchases. At January 31, 2017, authorization for $9.2 billion of share repurchases remained under the current share repurchase program. Any repurchased shares are constructively retired and returned to an unissued status.
The Company considers several factors in determining when to execute share repurchases, including, among other things, current cash needs, capacity for leverage, cost of borrowings, its results of operations and the market price of its common stock. The following table provides, on a settlement date basis, the number of shares repurchased, average price paid per share and total cash paid for share repurchases for fiscal 2017, 2016 and 2015:
Fiscal Years Ended January 31,
(Amounts in millions, except per share data) 2017 2016 2015
Total number of shares repurchased 119.9 62.4 13.4Average price paid per share $69.18 $65.90 $75.82Total cash paid for share repurchases $8,298 $4,112 $1,015
Notes to Consolidated Financial Statements
Walmart 2017 Annual Report 47
4. Accumulated Other Comprehensive Loss
The following table provides changes in the composition of total accumulated other comprehensive loss for fiscal 2017, 2016 and 2015:
Currency Translation Net Investment Cash Flow Minimum (Amounts in millions and net of income taxes) and Other Hedges Hedges Pension Liability Total
Balances as of January 31, 2014 $ (2,999) $ 277 $ 336 $ (610) $ (2,996)Other comprehensive income (loss) before reclassifications (4,012) 379 (496) (58) (4,187)Amounts reclassified from accumulated other comprehensive loss — — 26 (11) 15
Balances as of January 31, 2015 (7,011) 656 (134) (679) (7,168)Other comprehensive income (loss) before reclassifications (4,679) 366 (217) 96 (4,434)Amounts reclassified from accumulated other comprehensive loss — — 15 (10) 5
Balances as of January 31, 2016 (11,690) 1,022 (336) (593) (11,597)Other comprehensive income (loss) before reclassifications (2,672) 413 (22) (389) (2,670)Amounts reclassified from accumulated other comprehensive loss — — 43 (8) 35
Balances as of January 31, 2017 $(14,362) $1,435 $(315) $(990) $(14,232)
Amounts reclassified from accumulated other comprehensive loss for derivative instruments are recorded in interest, net, in the Company’s Consolidated Statements of Income, and the amounts for the minimum pension liability are recorded in operating, selling, general and administrative expenses in the Company’s Consolidated Statements of Income.
5. Accrued Liabilities
The Company’s accrued liabilities consist of the following: As of January 31,
(Amounts in millions) 2017 2016
Accrued wages and benefits(1) $ 6,105 $ 5,814Self-insurance(2) 3,922 3,414Accrued non-income taxes(3) 2,816 2,544Other(4) 7,811 7,835
Total accrued liabilities $20,654 $19,607
(1) Accrued wages and benefits include accrued wages, salaries, vacation, bonuses and other incentive plans.
(2) Self-insurance consists of all insurance-related liabilities, such as workers’ compensation, general liability, auto liability, product liability and certain employee-related healthcare benefits.
(3) Accrued non-income taxes include accrued payroll, value added, sales and miscellaneous other taxes.
(4) Other accrued liabilities consist of various items such as maintenance, utilities, advertising and interest.
Notes to Consolidated Financial Statements
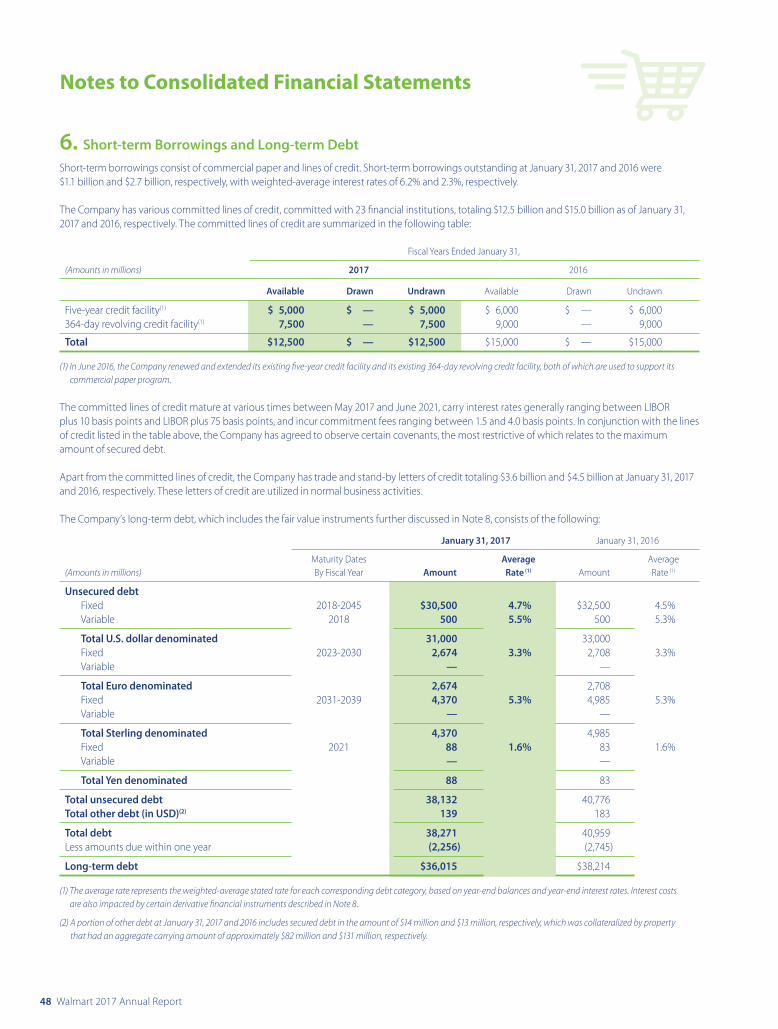
48 Walmart 2017 Annual Report
6. Short-term Borrowings and Long-term Debt
Short-term borrowings consist of commercial paper and lines of credit. Short-term borrowings outstanding at January 31, 2017 and 2016 were $1.1 billion and $2.7 billion, respectively, with weighted-average interest rates of 6.2% and 2.3%, respectively.
The Company has various committed lines of credit, committed with 23 financial institutions, totaling $12.5 billion and $15.0 billion as of January 31, 2017 and 2016, respectively. The committed lines of credit are summarized in the following table:
Fiscal Years Ended January 31,
(Amounts in millions) 2017 2016
Available Drawn Undrawn Available Drawn Undrawn
Five-year credit facility(1) $ 5,000 $ — $ 5,000 $ 6,000 $ — $ 6,000364-day revolving credit facility(1) 7,500 — 7,500 9,000 — 9,000
Total $12,500 $ — $12,500 $15,000 $ — $15,000
(1) In June 2016, the Company renewed and extended its existing five-year credit facility and its existing 364-day revolving credit facility, both of which are used to support its commercial paper program.
The committed lines of credit mature at various times between May 2017 and June 2021, carry interest rates generally ranging between LIBOR plus 10 basis points and LIBOR plus 75 basis points, and incur commitment fees ranging between 1.5 and 4.0 basis points. In conjunction with the lines of credit listed in the table above, the Company has agreed to observe certain covenants, the most restrictive of which relates to the maximum amount of secured debt.
Apart from the committed lines of credit, the Company has trade and stand-by letters of credit totaling $3.6 billion and $4.5 billion at January 31, 2017 and 2016, respectively. These letters of credit are utilized in normal business activities.
The Company’s long-term debt, which includes the fair value instruments further discussed in Note 8, consists of the following:
January 31, 2017 January 31, 2016
Maturity Dates Average Average (Amounts in millions) By Fiscal Year Amount Rate (1) Amount Rate (1)
Unsecured debt Fixed 2018-2045 $30,500 4.7% $32,500 4.5% Variable 2018 500 5.5% 500 5.3%
Total U.S. dollar denominated 31,000 33,000 Fixed 2023-2030 2,674 3.3% 2,708 3.3% Variable — —
Total Euro denominated 2,674 2,708 Fixed 2031-2039 4,370 5.3% 4,985 5.3% Variable — —
Total Sterling denominated 4,370 4,985 Fixed 2021 88 1.6% 83 1.6% Variable — —
Total Yen denominated 88 83
Total unsecured debt 38,132 40,776Total other debt (in USD)(2) 139 183
Total debt 38,271 40,959Less amounts due within one year (2,256) (2,745)
Long-term debt $36,015 $38,214
(1) The average rate represents the weighted-average stated rate for each corresponding debt category, based on year-end balances and year-end interest rates. Interest costs are also impacted by certain derivative financial instruments described in Note 8.
(2) A portion of other debt at January 31, 2017 and 2016 includes secured debt in the amount of $14 million and $13 million, respectively, which was collateralized by property that had an aggregate carrying amount of approximately $82 million and $131 million, respectively.
Notes to Consolidated Financial Statements
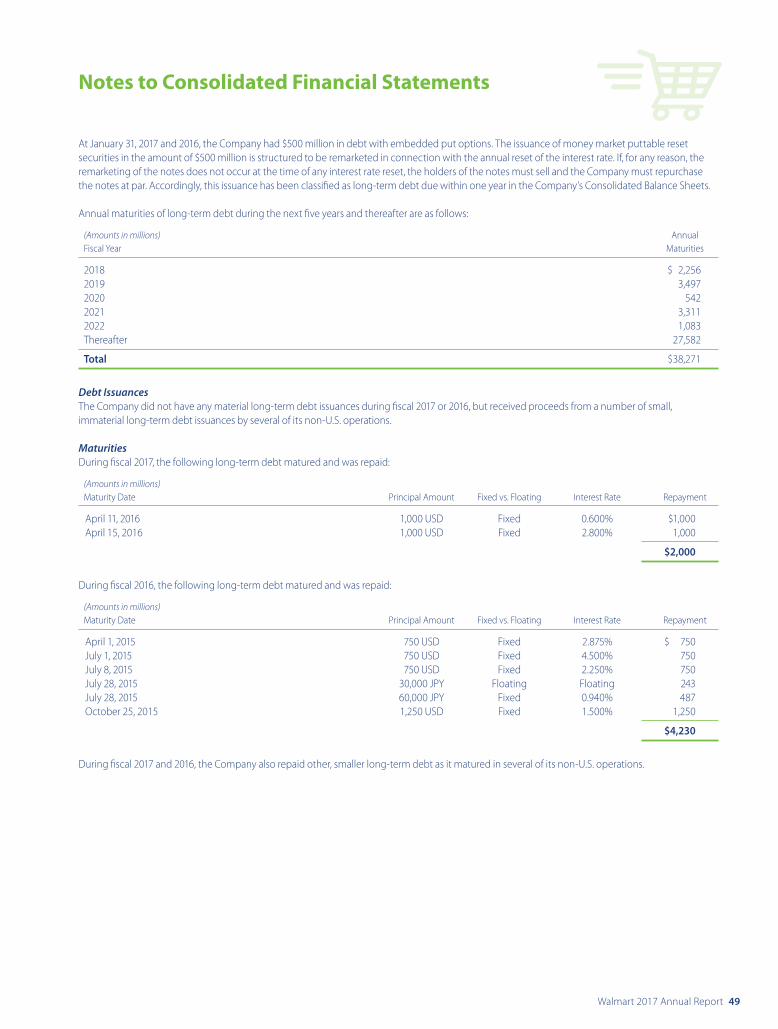
Walmart 2017 Annual Report 49
At January 31, 2017 and 2016, the Company had $500 million in debt with embedded put options. The issuance of money market puttable reset securities in the amount of $500 million is structured to be remarketed in connection with the annual reset of the interest rate. If, for any reason, the remarketing of the notes does not occur at the time of any interest rate reset, the holders of the notes must sell and the Company must repurchase the notes at par. Accordingly, this issuance has been classified as long-term debt due within one year in the Company’s Consolidated Balance Sheets.
Annual maturities of long-term debt during the next five years and thereafter are as follows:
(Amounts in millions) Annual Fiscal Year Maturities
2018 $ 2,2562019 3,4972020 5422021 3,3112022 1,083Thereafter 27,582
Total $38,271
Debt IssuancesThe Company did not have any material long-term debt issuances during fiscal 2017 or 2016, but received proceeds from a number of small, immaterial long-term debt issuances by several of its non-U.S. operations.
MaturitiesDuring fiscal 2017, the following long-term debt matured and was repaid:
(Amounts in millions) Maturity Date Principal Amount Fixed vs. Floating Interest Rate Repayment
April 11, 2016 1,000 USD Fixed 0.600% $1,000April 15, 2016 1,000 USD Fixed 2.800% 1,000
$2,000
During fiscal 2016, the following long-term debt matured and was repaid:
(Amounts in millions) Maturity Date Principal Amount Fixed vs. Floating Interest Rate Repayment
April 1, 2015 750 USD Fixed 2.875% $ 750July 1, 2015 750 USD Fixed 4.500% 750July 8, 2015 750 USD Fixed 2.250% 750July 28, 2015 30,000 JPY Floating Floating 243July 28, 2015 60,000 JPY Fixed 0.940% 487October 25, 2015 1,250 USD Fixed 1.500% 1,250
$4,230
During fiscal 2017 and 2016, the Company also repaid other, smaller long-term debt as it matured in several of its non-U.S. operations.
Notes to Consolidated Financial Statements
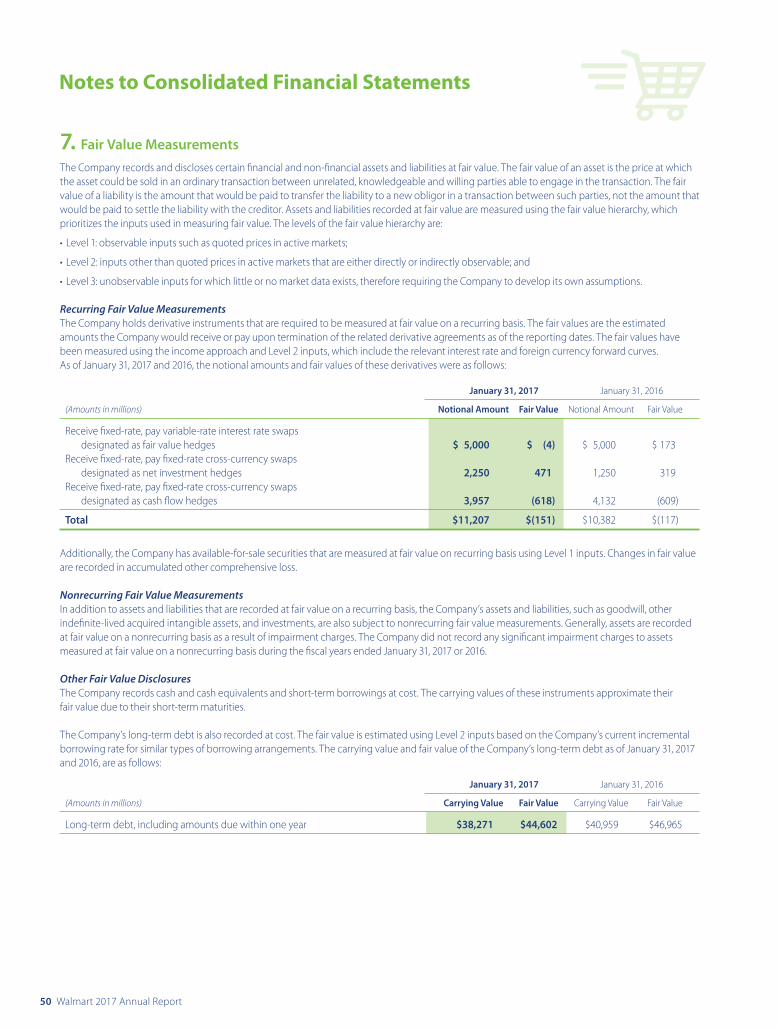
50 Walmart 2017 Annual Report
7. Fair Value Measurements
The Company records and discloses certain financial and non-financial assets and liabilities at fair value. The fair value of an asset is the price at which the asset could be sold in an ordinary transaction between unrelated, knowledgeable and willing parties able to engage in the transaction. The fair value of a liability is the amount that would be paid to transfer the liability to a new obligor in a transaction between such parties, not the amount that would be paid to settle the liability with the creditor. Assets and liabilities recorded at fair value are measured using the fair value hierarchy, which prioritizes the inputs used in measuring fair value. The levels of the fair value hierarchy are:
• Level 1: observable inputs such as quoted prices in active markets;
• Level 2: inputs other than quoted prices in active markets that are either directly or indirectly observable; and
• Level 3: unobservable inputs for which little or no market data exists, therefore requiring the Company to develop its own assumptions.
Recurring Fair Value MeasurementsThe Company holds derivative instruments that are required to be measured at fair value on a recurring basis. The fair values are the estimated amounts the Company would receive or pay upon termination of the related derivative agreements as of the reporting dates. The fair values have been measured using the income approach and Level 2 inputs, which include the relevant interest rate and foreign currency forward curves. As of January 31, 2017 and 2016, the notional amounts and fair values of these derivatives were as follows:
January 31, 2017 January 31, 2016
(Amounts in millions) Notional Amount Fair Value Notional Amount Fair Value
Receive fixed-rate, pay variable-rate interest rate swaps designated as fair value hedges $ 5,000 $ (4) $ 5,000 $ 173Receive fixed-rate, pay fixed-rate cross-currency swaps designated as net investment hedges 2,250 471 1,250 319Receive fixed-rate, pay fixed-rate cross-currency swaps designated as cash flow hedges 3,957 (618) 4,132 (609)
Total $11,207 $(151) $10,382 $(117)
Additionally, the Company has available-for-sale securities that are measured at fair value on recurring basis using Level 1 inputs. Changes in fair value are recorded in accumulated other comprehensive loss.
Nonrecurring Fair Value MeasurementsIn addition to assets and liabilities that are recorded at fair value on a recurring basis, the Company’s assets and liabilities, such as goodwill, other indefinite-lived acquired intangible assets, and investments, are also subject to nonrecurring fair value measurements. Generally, assets are recorded at fair value on a nonrecurring basis as a result of impairment charges. The Company did not record any significant impairment charges to assets measured at fair value on a nonrecurring basis during the fiscal years ended January 31, 2017 or 2016.
Other Fair Value DisclosuresThe Company records cash and cash equivalents and short-term borrowings at cost. The carrying values of these instruments approximate their fair value due to their short-term maturities.
The Company’s long-term debt is also recorded at cost. The fair value is estimated using Level 2 inputs based on the Company’s current incremental borrowing rate for similar types of borrowing arrangements. The carrying value and fair value of the Company’s long-term debt as of January 31, 2017 and 2016, are as follows:
January 31, 2017 January 31, 2016
(Amounts in millions) Carrying Value Fair Value Carrying Value Fair Value
Long-term debt, including amounts due within one year $38,271 $44,602 $40,959 $46,965
Notes to Consolidated Financial Statements
Walmart 2017 Annual Report 51
8. Derivative Financial Instruments
The Company uses derivative financial instruments for hedging and non-trading purposes to manage its exposure to changes in interest and currency exchange rates, as well as to maintain an appropriate mix of fixed- and variable-rate debt. Use of derivative financial instruments in hedging programs subjects the Company to certain risks, such as market and credit risks. Market risk represents the possibility that the value of the derivative financial instrument will change. In a hedging relationship, the change in the value of the derivative financial instrument is offset to a great extent by the change in the value of the underlying hedged item. Credit risk related to a derivative financial instrument represents the possibility that the counterparty will not fulfill the terms of the contract. The notional, or contractual, amount of the Company’s derivative financial instruments is used to measure interest to be paid or received and does not represent the Company’s exposure due to credit risk. Credit risk is monitored through established approval procedures, including setting concentration limits by counterparty, reviewing credit ratings and requir-ing collateral (generally cash) from the counterparty when appropriate.
The Company only enters into derivative transactions with counterparties rated “A-” or better by nationally recognized credit rating agencies. Subsequent to entering into derivative transactions, the Company regu-larly monitors the credit ratings of its counterparties. In connection with various derivative agreements, including master netting arrangements, the Company held cash collateral from counterparties of $242 million and $345 million at January 31, 2017 and January 31, 2016, respectively. The Company records cash collateral received as amounts due to the counterparties exclusive of any derivative asset. Furthermore, as part of the master netting arrangements with each of these counterparties, the Company is also required to post collateral with a counterparty if the Company’s net derivative liability position exceeds $150 million with such counterparties. The Company did not have any cash collateral posted with counterparties at January 31, 2017, and had an insignificant amount of cash collateral posted with counterparties at January 31, 2016. The Company records cash collateral it posts with counterparties as amounts receivable from those counterparties exclusive of any derivative liability.
The Company uses derivative financial instruments for the purpose of hedging its exposure to interest and currency exchange rate risks and, accordingly, the contractual terms of a hedged instrument closely mirror those of the hedged item, providing a high degree of risk reduction and correlation. Contracts that are effective at meeting the risk reduction and correlation criteria are recorded using hedge accounting. If a derivative financial instrument is recorded using hedge accounting, depending on the nature of the hedge, changes in the fair value of the instrument will either be offset against the change in fair value of the hedged assets, liabilities or firm commitments through earnings or be recognized in accumulated other comprehensive loss until the hedged item is recog-nized in earnings. Any hedge ineffectiveness is immediately recognized in earnings. The Company’s net investment and cash flow instruments are highly effective hedges and the ineffective portion has not been, and is not expected to be, significant. Instruments that do not meet the criteria for hedge accounting, or contracts for which the Company has not elected hedge accounting, are recorded at fair value with unrealized gains or losses reported in earnings during the period of the change.
Fair Value InstrumentsThe Company is a party to receive fixed-rate, pay variable-rate interest rate swaps that the Company uses to hedge the fair value of fixed-rate
debt. The notional amounts are used to measure interest to be paid or received and do not represent the Company’s exposure due to credit loss. The Company’s interest rate swaps that receive fixed-interest rate payments and pay variable-interest rate payments are designated as fair value hedges. As the specific terms and notional amounts of the deriva-tive instruments match those of the fixed-rate debt being hedged, the derivative instruments are assumed to be perfectly effective hedges. Changes in the fair values of these derivative instruments are recorded in earnings, but are offset by corresponding changes in the fair values of the hedged items, also recorded in earnings, and, accordingly, do not impact the Company’s Consolidated Statements of Income. These fair value instruments will mature on dates ranging from October 2020 to April 2024.
Net Investment InstrumentsThe Company is a party to cross-currency interest rate swaps that the Company uses to hedge its net investments. The agreements are con-tracts to exchange fixed-rate payments in one currency for fixed-rate payments in another currency. All changes in the fair value of these instruments are recorded in accumulated other comprehensive loss, offsetting the currency translation adjustment of the related investment that is also recorded in accumulated other comprehensive loss. These instruments will mature on dates ranging from July 2020 to February 2030.
The Company has issued foreign-currency-denominated long-term debt as hedges of net investments of certain of its foreign operations. These foreign-currency-denominated long-term debt issuances are des-ignated and qualify as nonderivative hedging instruments. Accordingly, the foreign currency translation of these debt instruments is recorded in accumulated other comprehensive loss, offsetting the foreign currency translation adjustment of the related net investments that is also recorded in accumulated other comprehensive loss. At January 31, 2017 and January 31, 2016, the Company had ¥10.0 billion of outstanding long-term debt designated as a hedge of its net investment in Japan, as well as outstanding long-term debt of £2.5 billion at January 31, 2017 and January 31, 2016 that was designated as a hedge of its net investment in the United Kingdom. These nonderivative net investment hedges will mature on dates ranging from July 2020 to January 2039.
Cash Flow InstrumentsThe Company is a party to receive fixed-rate, pay fixed-rate cross-currency interest rate swaps to hedge the currency exposure associated with the forecasted payments of principal and interest of certain non-U.S. denominated debt. The swaps are designated as cash flow hedges of the currency risk related to payments on the non-U.S. denominated debt. The effective portion of changes in the fair value of derivatives designated as cash flow hedges of foreign exchange risk is recorded in accumulated other comprehensive loss and is subsequently reclassified into earnings in the period that the hedged forecasted transaction affects earnings. The hedged items are recognized foreign currency-denominated liabilities that are re-measured at spot exchange rates each period, and the assessment of effectiveness (and measurement of any ineffectiveness) is based on total changes in the related derivative’s cash flows. As a result, the amount reclassified into earnings each period includes an amount that offsets the related transaction gain or loss arising from that re-measurement and the adjustment to earnings for the period’s allocable portion of the initial spot-forward difference associated with the hedging instrument. These cash flow instruments will mature on dates ranging from April 2022 to March 2034.
Notes to Consolidated Financial Statements
52 Walmart 2017 Annual Report
Financial Statement PresentationAlthough subject to master netting arrangements, the Company does not offset derivative assets and derivative liabilities in its Consolidated Balance Sheets. Derivative instruments with an unrealized gain are recorded in the Company’s Consolidated Balance Sheets as either current or non-current assets, based on maturity date, and those hedging instruments with an unrealized loss are recorded as either current or non-current liabilities, based on maturity date. Refer to Note 7 for the net presentation of the Company’s derivative instruments.
The Company’s derivative instruments, as well as its nonderivative debt instruments designated and qualifying as net investment hedges, were classified as follows in the Company’s Consolidated Balance Sheets:
January 31, 2017 January 31, 2016
Fair Value Net Investment Cash Flow Fair Value Net Investment Cash Flow (Amounts in millions) Instruments Instruments Instruments Instruments Instruments Instruments
Derivative instrumentsDerivative assets:Other assets and deferred charges $ 8 $ 471 $ — $173 $ 319 $129
Derivative liabilities:Deferred income taxes and other 12 — 618 — — 738
Nonderivative hedging instrumentsLong-term debt — 3,209 — — 3,644 —
Gains and losses related to the Company’s derivatives primarily relate to interest rate hedges, which are recorded in interest, net, in the Company’s Consolidated Statements of Income. Amounts related to the Company’s derivatives expected to be reclassified from accumulated other comprehensive loss to net income during the next 12 months are not significant.
9. Taxes
Income from Continuing OperationsThe components of income from continuing operations before income taxes are as follows:
Fiscal Years Ended January 31,
(Amounts in millions) 2017 2016 2015
U.S. $15,680 $16,685 $18,610Non-U.S. 4,817 4,953 6,189
Total income from continuing operations before income taxes $20,497 $21,638 $24,799
A summary of the provision for income taxes is as follows:
Fiscal Years Ended January 31,
(Amounts in millions) 2017 2016 2015
Current: U.S. federal $3,454 $ 5,562 $6,165 U.S. state and local 495 622 810 International 1,510 1,400 1,529
Total current tax provision 5,459 7,584 8,504
Deferred: U.S. federal 1,054 (704) (387) U.S. state and local 51 (106) (55) International (360) (216) (77)
Total deferred tax expense (benefit) 745 (1,026) (519)
Total provision for income taxes $6,204 $ 6,558 $7,985
Effective Income Tax Rate ReconciliationThe Company’s effective income tax rate is typically lower than the U.S. statutory tax rate primarily because of benefits from lower-taxed global operations, including the use of global funding structures and certain U.S. tax credits as further discussed in the “Cash and Cash Equivalents” section of the Company’s significant accounting policies in Note 1. The Company’s non-U.S. income is generally subject to local country tax rates that are below the 35% U.S. statutory tax rate. Certain non-U.S. earnings have been indefinitely reinvested outside the U.S. and are not subject to current U.S. income tax. A reconciliation of the significant differences between the U.S. statutory tax rate and the effective income tax rate on pretax income from continuing operations is as follows:
Fiscal Years Ended January 31,
2017 2016 2015
U.S. statutory tax rate 35.0% 35.0% 35.0%U.S. state income taxes, net of federal income tax benefit 1.7% 1.8% 1.8%Income taxed outside the U.S. (4.5)% (4.0)% (2.7)%Net impact of repatriated international earnings (1.0)% 0.1% (1.5)%Other, net (0.9)% (2.6)% (0.4)%
Effective income tax rate 30.3% 30.3% 32.2%
Notes to Consolidated Financial Statements
Walmart 2017 Annual Report 53
Deferred TaxesThe significant components of the Company’s deferred tax account balances are as follows:
January 31,
(Amounts in millions) 2017 2016
Deferred tax assets: Loss and tax credit carryforwards $ 3,633 $ 3,313 Accrued liabilities 3,437 3,763 Share-based compensation 309 192 Other 1,474 1,390
Total deferred tax assets 8,853 8,658Valuation allowances (1,494) (1,456)
Deferred tax assets, net of valuation allowance 7,359 7,202
Deferred tax liabilities: Property and equipment 6,435 5,813 Inventories 1,808 1,790 Other 1,884 1,452
Total deferred tax liabilities 10,127 9,055
Net deferred tax liabilities $ 2,768 $ 1,853
The deferred taxes noted above are classified as follows in the Company’s Consolidated Balance Sheets:
January 31,
(Amounts in millions) 2017 2016
Balance Sheet classificationAssets:Other assets and deferred charges $1,565 $1,504
Liabilities:Deferred income taxes and other 4,333 3,357
Net deferred tax liabilities $2,768 $1,853
Unremitted EarningsU.S. income taxes have not been provided on accumulated but undistributed earnings of the Company’s international subsidiaries of approximately $26.6 billion and $26.1 billion as of January 31, 2017 and 2016, respectively, as the Company intends to permanently reinvest these amounts outside of the U.S. However, if any portion were to be distributed, the related U.S. tax liability may be reduced by foreign income taxes paid on those earnings. Determination of the unrecog-nized deferred tax liability related to these undistributed earnings is not practicable because of the complexities with its hypothetical calculation. The Company provides deferred or current income taxes on earnings of international subsidiaries in the period that the Company determines it will remit those earnings.
Net Operating Losses, Tax Credit Carryforwards and Valuation AllowancesAt January 31, 2017, the Company had net operating loss and capital loss carryforwards totaling approximately $6.1 billion. Of these carryforwards, approximately $3.6 billion will expire, if not utilized, in various years through 2037. The remaining carryforwards have no expiration. At January 31, 2017, the Company had foreign tax credit carryforwards of approximately $1.9 billion, which will expire in various years through 2027 if not utilized.
The recoverability of these future tax deductions and credits is evaluated by assessing the adequacy of future expected taxable income from all sources, including taxable income in prior carryback years, reversal of taxable temporary differences, forecasted operating earnings and available tax planning strategies. To the extent the Company does not consider it more likely than not that a deferred tax asset will be recovered, a valuation allowance is established. To the extent that a valuation allowance has been established and it is subsequently determined that it is more likely than not that the deferred tax assets will be recovered, the valuation allowance will be released.
The Company had valuation allowances of approximately $1.5 billion as of January 31, 2017 and 2016, respectively, on deferred tax assets associated primarily with net operating loss carryforwards for which management has determined it is more likely than not that the deferred tax asset will not be realized. Net activity in the valuation allowance during fiscal 2017 related to releases arising from the use of deferred tax assets, changes in judgment regarding the future realization of deferred tax assets, increases from certain net operating losses and deductible temporary differences arising in fiscal 2017, decreases due to operating loss expirations and fluctuations in currency exchange rates. Management believes that it is more likely than not that the remaining deferred tax assets will be fully realized.
Uncertain Tax PositionsThe benefits of uncertain tax positions are recorded in the Company’s Consolidated Financial Statements only after determining a more-likely-than-not probability that the uncertain tax positions will withstand challenge, if any, from taxing authorities.
As of January 31, 2017 and 2016, the amount of unrecognized tax benefits related to continuing operations was $1.1 billion and $607 million, respectively. The amount of unrecognized tax benefits that would affect the Company’s effective income tax rate was $703 million and $522 million for January 31, 2017 and 2016, respectively.
Notes to Consolidated Financial Statements
54 Walmart 2017 Annual Report
A reconciliation of unrecognized tax benefits from continuing operations is as follows:
Fiscal Years Ended January 31,
(Amounts in millions) 2017 2016 2015
Unrecognized tax benefits, beginning of year $ 607 $ 838 $763Increases related to prior year tax positions 388 164 7Decreases related to prior year tax positions (32) (446) (17)Increases related to current year tax positions 145 119 174Settlements during the period (46) (25) (89)Lapse in statutes of limitations (12) (43) —
Unrecognized tax benefits, end of year $1,050 $ 607 $838
The Company classifies interest and penalties related to uncertain tax benefits as interest expense and as operating, selling, general and administrative expenses, respectively. During fiscal 2017, 2016 and 2015, the Company recognized interest expense related to uncertain tax positions of $35 million, $5 million and $18 million, respectively. As of January 31, 2017 and 2016, accrued interest related to uncertain tax positions of $72 million and $60 million, respectively, was recorded in the Company’s Consolidated Balance Sheets. The Company did not have any accrued penalties recorded for income taxes as of January 31, 2017 or 2016.
During the next twelve months, it is reasonably possible that tax audit resolutions could reduce unrecognized tax benefits by between $50 million and $300 million, either because the tax positions are sus-tained on audit or because the Company agrees to their disallowance. The Company is focused on resolving tax audits as expeditiously as possible. As a result of these efforts, unrecognized tax benefits could potentially be reduced beyond the provided range during the next twelve months. The Company does not expect any change to have a significant impact to its Consolidated Financial Statements.
The Company remains subject to income tax examinations for its U.S. federal income taxes generally for fiscal 2013 through 2017. The Company also remains subject to income tax examinations for international income taxes for fiscal 2000 through 2017, and for U.S. state and local income taxes generally for the fiscal years ended 2011 through 2017.
Other TaxesThe Company is subject to tax examinations for value added, sales-based, payroll and other non-income taxes. A number of these examinations are ongoing in various jurisdictions. In certain cases, the Company has received assessments from the respective taxing authorities in connection with these examinations. Unless otherwise indicated, the possible losses or range of possible losses associated with these matters are individually immaterial, but a group of related matters, if decided adversely to the Company, could result in a liability material to the Company’s Consolidated Financial Statements. In particular, Brazil federal, state and local laws are complex and subject to varying interpretations, and the Company’s subsidiaries in Brazil are party to a large number of non-income tax assessments. One of these interpretations common to the retail industry in Brazil relates to whether credits received from suppliers should be treated as a reduction of cost for purposes of calculating certain indirect taxes. The Company believes credits received from suppliers are reductions in cost and that it hassubstantial legal defenses in this matter and intends to defend this matter vigorously. As such, the Company has not accrued for this matter, although the Company may be required to deposit funds in escrow or secure financial guarantees to continue the judicial process in defending this matter in Brazil.
10. Contingencies
Legal ProceedingsThe Company is involved in a number of legal proceedings. The Company has made accruals with respect to these matters, where appropriate, which are reflected in the Company’s Consolidated Financial Statements. For some matters, a liability is not probable or the amount cannot be reasonably estimated and therefore an accrual has not been made. However, where a liability is reasonably possible and may be material, such matters have been disclosed. The Company may enter into discussions regarding settlement of these matters, and may enter into settlement agreements, if it believes settlement is in the best interest of the Company and its shareholders.
Unless stated otherwise, the matters, or groups of related matters, discussed below, if decided adversely to or settled by the Company, individually or in the aggregate, may result in a liability material to the Company’s financial condition or results of operations.
Notes to Consolidated Financial Statements
Walmart 2017 Annual Report 55
ASDA Equal Value ClaimsASDA Stores, Ltd. (“ASDA”), a wholly-owned subsidiary of the Company, is a defendant in over 10,000 “equal value” claims that are proceeding before an Employment Tribunal in Manchester (the “Employment Tribunal”) in the United Kingdom (“UK”) on behalf of current and former ASDA store employees, who allege that the work performed by female employees in ASDA’s retail stores is of equal value in terms of, among other things, the demands of their jobs to that of male employees working in ASDA’s warehouse and distribution facilities, and that the disparity in pay between these different job positions is not objectively justified. Claimants are requesting differential back pay based on higher wage rates in the warehouse and distribution facilities and those higher wage rates on a prospective basis as part of these equal value proceedings. ASDA believes that further claims may be asserted in the future. On March 23, 2015, ASDA asked the Employment Tribunal to stay all proceedings and to “strike out” substantially all of the claims. On July 23, 2015, the Employment Tribunal denied ASDA’s requests. Following additional proceedings, the Employment Appeal Tribunal agreed to review the “strike out” issue and the Court of Appeals agreed to review the stay issue. On May 26, 2016, the Court of Appeals denied ASDA’s appeal of the stay issue. On October 14, 2016, following a preliminary hearing, the Employment Tribunal ruled that claimants could compare their positions in ASDA’s retail stores with those of employees in ASDA’s warehouse and distribution facilities. Claimants will now proceed to the next phase of their claims. That phase will determine whether the work performed by the claimants is of equal value to the work performed by employees in ASDA’s warehouse and distribution facilities. On November 23, 2016, ASDA filed a request with the Employment Appeal Tribunal to hear an appeal of the October 14, 2016 ruling, which was granted on January 11, 2017. At present, the Company cannot predict the number of such claims that may be filed, and cannot reasonably estimate any loss or range of loss that may arise from these proceedings. The Company believes it has substantial factual and legal defenses to these claims, and intends to defend the claims vigorously.
FCPA Investigation and Related MattersThe Audit Committee (the “Audit Committee”) of the Board of Directors of the Company has been conducting an internal investigation into, among other things, alleged violations of the U.S. Foreign Corrupt Practices Act (“FCPA”) and other alleged crimes or misconduct in connection with foreign subsidiaries, including Wal-Mart de México, S.A.B. de C.V. (“Walmex”), and whether prior allegations of such violations and/or misconduct were appropriately handled by the Company. The Audit Committee and the Company have engaged outside counsel from a number of law firms and other advisors who are assisting in the on-going investigation of these matters.
The Company has also been conducting a voluntary global review of its policies, practices and internal controls for anti-corruption compliance. The Company is engaged in strengthening its global anti-corruption compliance program through appropriate remedial anti-corruption measures. In November 2011, the Company voluntarily disclosed that investigative activity to the U.S. Department of Justice (the “DOJ”) and the Securities and Exchange Commission (the “SEC”). Since the imple-mentation of the global review and the enhanced anti-corruption compliance program, the Audit Committee and the Company have identified or been made aware of additional allegations regarding potential violations of the FCPA. When such allegations have been reported or identified, the Audit Committee and the Company, together with their third party advisors, have conducted inquiries and when warranted based on those inquiries, opened investigations. Inquiries or investigations regarding allegations of potential FCPA violations were commenced in a number of foreign markets where the Company operates, including, but not limited to, Brazil, China and India.
As previously disclosed, the Company is under investigation by the DOJ and the SEC regarding possible violations of the FCPA. The Company has been cooperating with the agencies and discussions have begun with them regarding the resolution of these matters. As these discussions are preliminary, the Company cannot currently predict the timing, the outcome or the impact of a possible resolution of these matters.
A number of federal and local government agencies in Mexico have also initiated investigations of these matters. Walmex is cooperating with the Mexican governmental agencies conducting these investigations. Furthermore, lawsuits relating to the matters under investigation have been filed by several of the Company’s shareholders against it, certain of its current directors, certain of its former directors, certain of its current and former officers and certain of Walmex’s current and former officers.
Notes to Consolidated Financial Statements
56 Walmart 2017 Annual Report
The Company could be exposed to a variety of negative consequences as a result of the matters noted above. There could be one or more enforcement actions in respect of the matters that are the subject of some or all of the on-going government investigations, and such actions, if brought, may result in judgments, settlements, fines, penalties, injunctions, cease and desist orders, debarment or other relief, criminal convictions and/or penalties and the shareholder lawsuits referenced above may result in judgments against the Company and its current and former directors and officers named in those proceedings. The Company expects that there will be on-going media and governmental interest, including additional news articles from media publications on these matters, which could impact the perception among certain audiences of the Company’s role as a corporate citizen.
In addition, the Company has incurred and expects to continue to incur costs in responding to requests for information or subpoenas seeking documents, testimony and other information in connection with the government investigations, in defending the shareholder lawsuits, and in conducting the review and investigations. These costs will be expensed as incurred. For the fiscal years ended January 31, 2017, 2016 and 2015, the Company incurred the following third-party expenses in connection with the FCPA investigation and related matters:
Fiscal Years Ended January 31,
(Amounts in millions) 2017 2016 2015
Ongoing inquiries and investigations $80 $ 95 $121Global compliance program and organizational enhancements 19 31 52
Total $99 $126 $173
While the Company believes that it is probable that it will incur a loss from these matters, given the on-going nature and complexity of the review, inquiries and investigations, the Company cannot yet reasonably estimate a loss or range of loss that may arise from the conclusion of these matters. Although the Company does not presently believe that these matters will have a material adverse effect on its business, given the inherent uncertainties in such situations, the Company can provide no assurance that these matters will not be material to its business in the future.
11. Commitments
The Company has long-term leases for stores and equipment. Rentals (including amounts applicable to taxes, insurance, maintenance, other operating expenses and contingent rentals) under operating leases and other short-term rental arrangements were $2.6 billion, $2.5 billion and $2.8 billion in fiscal 2017, 2016 and 2015, respectively.
Aggregate minimum annual rentals at January 31, 2017, under non-cancelable leases are as follows:
(Amounts in millions) Operating Capital Lease and Fiscal Year Leases(1) Financial Obligations
2018 $ 2,270 $ 8942019 1,787 8382020 1,679 7862021 1,524 7432022 1,342 652Thereafter 9,537 4,996
Total minimum rentals $18,139 $8,909Less estimated executory costs 30
Net minimum lease payments 8,879Noncash gain on future termination of financing obligation 1,061Less imputed interest (3,372)
Present value of minimum lease payments $6,568
(1) Represents minimum contractual obligation for non-cancelable leases with initial or remaining terms greater than 12 months as of January 31, 2017.
Certain of the Company’s leases provide for the payment of contingent rentals based on a percentage of sales. Such contingent rentals were not material for fiscal 2017, 2016 and 2015. Substantially all of the Company’s store leases have renewal options, some of which may trigger an escalation in rentals.
Notes to Consolidated Financial Statements
Walmart 2017 Annual Report 57
12. Retirement-Related Benefits
The Company offers a 401(k) plan for associates in the U.S. under which eligible associates can begin contributing to the plan immediately upon hire. The Company also offers a 401(k) type plan for associates in Puerto Rico under which associates can begin to contribute generally after one year of employment. Under these plans, after one year of employment, the Company matches 100% of participant contributions up to 6% of annual eligible earnings. The matching contributions immediately vest at 100% for each associate. Participants can contribute up to 50% of their pretax earnings, but not more than the statutory limits. Participants age 50 or older may defer additional earnings in catch-up contributions up to the maximum statutory limits.
Associates in international countries who are not U.S. citizens are covered by various defined contribution post-employment benefit arrangements. These plans are administered based upon the legislative and tax requirements in the countries in which they are established.
Additionally, the Company’s subsidiaries in the United Kingdom and Japan have sponsored defined benefit pension plans. The plan in the United Kingdom was underfunded by $129 million at January 31, 2017 and overfunded by $106 million at January 31, 2016. The plan in Japan was underfunded by $203 million and $205 million at January 31, 2017 and 2016, respectively. Overfunded amounts are recorded as assets in the Company’s Consolidated Balance Sheets in other assets and deferred charges. Underfunded amounts are recorded as liabilities in the Company’s Consolidated Balance Sheets in deferred income taxes and other. Certain other international operations also have defined benefit arrangements that are not significant.
The following table summarizes the contribution expense related to the Company’s retirement-related benefits for fiscal 2017, 2016 and 2015:
Fiscal Years Ended January 31,
(Amounts in millions) 2017 2016 2015
Defined contribution plans: U.S. $1,064 $ 967 $ 898 International 173 179 167
Defined benefit plans: International 7 6 5
Total contribution expense for retirement-related benefits $1,244 $1,152 $1,070
13. Acquisitions, Disposals and Related Items
The Company completed the following transaction that impacts the operations of the Company’s Walmart U.S. segment:
Jet.com, Inc.In September 2016, the Company completed the acquisition of jet.com, a U.S.-based e-commerce company. The integration of jet.com into the Walmart U.S. e-commerce business will build upon the current e-commerce foundation, allowing for synergies from talent, logistical operations and access to a broader customer base. The total purchase price for the acquisition was $2.4 billion, net of cash acquired. The preliminary allocation of the purchase price includes $1.7 billion in goodwill and $0.6 billion in intangible assets. As part of the transaction, the Company will pay additional compensation of approximately $0.8 billion over a five year period.
The Company completed the following transactions that impact the operations of the Company’s Walmart International segment:
SuburbiaIn August 2016, one of the Company’s subsidiaries entered into a definitive agreement to sell Suburbia, the apparel retail division in Mexico, for approximately $1.0 billion in total consideration, resulting in $634 million in current assets held for sale and $180 million in current liabilities held for sale as of January 31, 2017. The transaction has received regulatory approval and is expected to close in the first half of fiscal 2018.
Yihaodian and JD.com, Inc. (“JD”)In June 2016, the Company sold certain assets relating to Yihaodian, our e-commerce operations in China, including the Yihaodian brand, website and application, to JD in exchange for Class A ordinary shares of JD representing approximately five percent of JD’s outstanding ordinary shares on a fully diluted basis. The $1.5 billion investment in JD is carried at cost and is included in other assets and deferred charges in the accompanying Consolidated Balance Sheets. The sale resulted in the recognition of a $535 million noncash gain, which gain is included in membership and other income in the accompanying Consolidated Statements of Income. Subsequently, during fiscal 2017, the Company purchased $1.9 billion of additional JD shares classified as available for sale securities, representing an incremental ownership percentage of approximately five percent, for a total ownership of approximately ten percent of JD’s outstanding ordinary shares.
In fiscal 2016, the Company completed the purchase of all of the remaining noncontrolling interest in Yihaodian for approximately $760 million, using existing cash to complete this transaction.
Notes to Consolidated Financial Statements
58 Walmart 2017 Annual Report
Walmart ChileIn fiscal 2014, the redeemable noncontrolling interest shareholders exercised put options that required the Company to purchase their shares in Walmart Chile. In February 2014, the Company completed this transaction for approximately $1.5 billion using existing cash of the Company, increasing its ownership interest in Walmart Chile to 99.7 percent. In March 2014, the Company completed a tender offer for most of the remaining noncontrolling interest shares at the same value per share as was paid to the redeemable noncontrolling interest shareholders. As a result of completing these transactions, the Company owns substantially all of Walmart Chile.
Vips Restaurant Business in MexicoIn fiscal 2014, Walmex, a majority-owned subsidiary of the Company, entered into a definitive agreement with Alsea S.A.B. de C.V. to sell the Vips restaurant business (“Vips”) in Mexico. The sale of Vips was completed on May 12, 2014. The Company received $671 million of cash and recognized a net gain of $262 million in discontinued operations at the time of the sale.
14. Segments
The Company is engaged in the operation of retail, wholesale and other units located in the U.S., Africa, Argentina, Brazil, Canada, Central America, Chile, China, India, Japan, Mexico and the United Kingdom. The Company’s operations are conducted in three business segments: Walmart U.S., Walmart International and Sam’s Club. The Company
defines its segments as those operations whose results its chief operating decision maker (“CODM”) regularly reviews to analyze performance and allocate resources. The Company sells similar individual products and services in each of its segments. It is impractical to segregate and identify revenues for each of these individual products and services.
The Walmart U.S. segment includes the Company’s mass merchant concept in the U.S. operating under the “Walmart” or “Wal-Mart” brands, as well as retail websites such as walmart.com and jet.com. The Walmart International segment consists of the Company’s operations outside of the U.S., including various retail websites. The Sam’s Club segment includes the warehouse membership clubs in the U.S., as well as samsclub.com. Corporate and support consists of corporate overhead and other items not allocated to any of the Company’s segments.
The Company measures the results of its segments using, among other measures, each segment’s net sales and operating income, which includes certain corporate overhead allocations. From time to time, the Company revises the measurement of each segment’s operating income, including any corporate overhead allocations, as determined by the information regularly reviewed by its CODM. When the measure-ment of a segment changes, previous period amounts and balances are reclassified to be comparable to the current period’s presentation.
Information for the Company’s segments, as well as for Corporate and support, including the reconciliation to income from continuing operations before income taxes, is provided in the following table:
Walmart Corporate (Amounts in millions) Walmart U.S. International Sam’s Club and support Consolidated
Fiscal Year Ended January 31, 2017Net sales $307,833 $116,119 $57,365 $ — $481,317Operating income (loss) 17,745 5,758 1,671 (2,410) 22,764Interest expense, net (2,267)
Income from continuing operations before income taxes $ 20,497
Total assets $104,262 $ 74,508 $14,125 $ 5,930 $198,825Depreciation and amortization 3,298 2,629 487 3,666 10,080Capital expenditures 6,090 2,697 639 1,193 10,619
Fiscal Year Ended January 31, 2016Net sales $ 298,378 $ 123,408 $ 56,828 $ — $ 478,614Operating income (loss) 19,087 5,346 1,820 (2,148) 24,105Interest expense, net (2,467)
Income from continuing operations before income taxes $ 21,638
Total assets $ 103,109 $ 73,720 $ 13,998 $ 8,754 $ 199,581Depreciation and amortization 2,800 2,549 472 3,633 9,454Capital expenditures 6,728 2,930 695 1,124 11,477
Fiscal Year Ended January 31, 2015Net sales $ 288,049 $ 136,160 $ 58,020 $ — $ 482,229Operating income (loss) 21,336 6,171 1,976 (2,336) 27,147Interest expense, net (2,348)
Income from continuing operations before income taxes $ 24,799
Total assets $ 101,381 $ 80,505 $ 13,995 $ 7,609 $ 203,490Depreciation and amortization 2,665 2,665 473 3,370 9,173Capital expenditures 6,286 3,936 753 1,199 12,174
Notes to Consolidated Financial Statements
Walmart 2017 Annual Report 59
Notes to Consolidated Financial Statements
Total revenues, consisting of net sales and membership and other income, and long-lived assets, consisting primarily of property and equipment, net, aggregated by the Company’s U.S. and non-U.S. operations for fiscal 2017, 2016 and 2015, are as follows:
Fiscal Years Ended January 31,
(Amounts in millions) 2017 2016 2015
Total revenuesU.S. operations $367,784 $357,559 $348,227Non-U.S. operations 118,089 124,571 137,424
Total revenues $485,873 $482,130 $485,651
Long-lived assetsU.S. operations $ 82,746 $ 82,475 $ 80,879Non-U.S. operations 31,432 34,041 35,776
Total long-lived assets $114,178 $116,516 $116,655
No individual country outside of the U.S. had total revenues or long-lived assets that were material to the consolidated totals. Additionally, the Company did not generate material total revenues from any single customer.
15. Subsequent Event
Dividends DeclaredOn February 21, 2017, the Board of Directors approved the fiscal 2018 annual dividend at $2.04 per share, an increase over the fiscal 2017 dividend of $2.00 per share. For fiscal 2018, the annual dividend will be paid in four quarterly installments of $0.51 per share, according to the following record and payable dates:
Record Date Payable Date
March 10, 2017 April 3, 2017May 12, 2017 June 5, 2017August 11, 2017 September 5, 2017December 8, 2017 January 2, 2018
16. Quarterly Financial Data (Unaudited)
Fiscal Year Ended January 31, 2017
(Amounts in millions, except per share data) Q1 Q2 Q3 Q4 Total
Total revenues $115,904 $120,854 $118,179 $130,936 $485,873Net sales 114,986 119,405 117,176 129,750 481,317Cost of sales 86,544 89,485 87,484 97,743 361,256Consolidated net income 3,216 3,889 3,202 3,986 14,293Consolidated net income attributable to Walmart 3,079 3,773 3,034 3,757 13,643Basic net income per common share attributable to Walmart 0.98 1.21 0.98 1.23 4.40Diluted net income per common share attributable to Walmart(1) 0.98 1.21 0.98 1.22 4.38
Fiscal Year Ended January 31, 2016
Q1 Q2 Q3 Q4 Total
Total revenues $114,826 $120,229 $117,408 $129,667 $482,130Net sales 114,002 119,330 116,598 128,684 478,614Cost of sales 86,483 90,056 87,446 96,999 360,984Consolidated net income 3,283 3,635 3,414 4,748 15,080Consolidated net income attributable to Walmart 3,341 3,475 3,304 4,574 14,694Basic net income per common share attributable to Walmart 1.03 1.08 1.03 1.44 4.58Diluted net income per common share attributable to Walmart 1.03 1.08 1.03 1.43 4.57
(1) The sum of quarterly amounts may not agree to annual amount due to rounding.
60 Walmart 2017 Annual Report
The Board of Directors and Shareholders of Wal-Mart Stores, Inc.
We have audited the accompanying consolidated balance sheets of Wal-Mart Stores, Inc. as of January 31, 2017 and 2016, and the related consolidated statements of income, comprehensive income, shareholders’ equity and redeemable noncontrolling interest, and cash flows for each of the three years in the period ended January 31, 2017. These financial statements are the responsibility of the Company’s management. Our responsibility is to express an opinion on these financial statements based on our audits.
We conducted our audits in accordance with the standards of the Public Company Accounting Oversight Board (United States). Those standards require that we plan and perform the audit to obtain reasonable assurance about whether the financial statements are free of material misstatement. An audit includes examining, on a test basis, evidence supporting the amounts and disclosures in the financial statements. An audit also includes assessing the accounting principles used and significant estimates made by management, as well as evaluating the overall financial statement presentation. We believe that our audits provide a reasonable basis for our opinion.
In our opinion, the financial statements referred to above present fairly, in all material respects, the consolidated financial position of Wal-Mart Stores, Inc. at January 31, 2017 and 2016, and the consolidated results of its operations and its cash flows for each of the three years in the period ended January 31, 2017, in conformity with U.S. generally accepted accounting principles.
We also have audited, in accordance with the standards of the Public Company Accounting Oversight Board (United States), Wal-Mart Stores, Inc.’s internal control over financial reporting as of January 31, 2017, based on criteria established in Internal Control-Integrated Framework issued by the Committee of Sponsoring Organizations of the Treadway Commission (2013 framework) and our report dated March 31, 2017 expressed an unqualified opinion thereon.
Rogers, ArkansasMarch 31, 2017
Report of Independent Registered Public Accounting Firm
Walmart 2017 Annual Report 61
The Board of Directors and Shareholders of Wal-Mart Stores, Inc.
We have audited Wal-Mart Stores, Inc.’s internal control over financial reporting as of January 31, 2017, based on criteria established in Internal Control-Integrated Framework issued by the Committee of Sponsoring Organizations of the Treadway Commission (2013 framework) (the COSO criteria). Wal-Mart Stores, Inc.’s management is responsible for maintaining effective internal control over financial reporting, and for its assessment of the effectiveness of internal control over financial reporting included in the accompanying Report on Internal Control over Financial Reporting. Our responsibility is to express an opinion on the Company’s internal control over financial reporting based on our audit.
We conducted our audit in accordance with the standards of the Public Company Accounting Oversight Board (United States). Those standards require that we plan and perform the audit to obtain reasonable assurance about whether effective internal control over financial reporting was maintained in all material respects. Our audit included obtaining an understanding of internal control over financial reporting, assessing the risk that a material weakness exists, testing and evaluating the design and operating effectiveness of internal control based on the assessed risk, and performing such other procedures as we considered necessary in the circumstances. We believe that our audit provides a reasonable basis for our opinion.
A company’s internal control over financial reporting is a process designed to provide reasonable assurance regarding the reliability of financial reporting and the preparation of financial statements for external purposes in accordance with generally accepted accounting principles. A company’s internal control over financial reporting includes those policies and procedures that (1) pertain to the maintenance of records that, in reasonable detail, accurately and fairly reflect the transactions and dispositions of the assets of the company; (2) provide reasonable assurance that transactions are recorded as necessary to permit preparation of financial statements in accordance with generally accepted accounting principles, and that receipts and expenditures of the company are being made only in accordance with authorizations of management and directors of the company; and (3) provide reasonable assurance regarding prevention or timely detection of unauthorized acquisition, use or disposition of the company’s assets that could have a material effect on the financial statements.
Because of its inherent limitations, internal control over financial reporting may not prevent or detect misstatements. Also, projections of any evaluation of effectiveness to future periods are subject to the risk that controls may become inadequate because of changes in conditions, or that the degree of compliance with the policies or procedures may deteriorate.
In our opinion, Wal-Mart Stores, Inc. maintained, in all material respects, effective internal control over financial reporting as of January 31, 2017, based on the COSO criteria.
As indicated in the accompanying Report on Internal Control over Financial Reporting, management’s assessment of and conclusion on the effectiveness of internal control over financial reporting did not include the internal controls of Jet.com, which is included in the fiscal year 2017 consolidated financial statements of Wal-Mart Stores, Inc. and represented 1.3% and 0.1% of the Company’s consolidated total assets and consolidated net sales, respectively, as of and for the year ended January 31, 2017. Our audit of internal control over financial reporting of Wal-Mart Stores, Inc. also did not include an evaluation of the internal control over financial reporting of Jet.com.
We also have audited, in accordance with the standards of the Public Company Accounting Oversight Board (United States), the consolidated balance sheets of Wal-Mart Stores, Inc. as of January 31, 2017 and 2016, and related consolidated statements of income, comprehensive income, shareholders’ equity and redeemable noncontrolling interest, and cash flows for each of the three years in the period ended January 31, 2017 and our report dated March 31, 2017 expressed an unqualified opinion thereon.
Rogers, ArkansasMarch 31, 2017
Report of Independent Registered Public Accounting Firm on Internal Control over Financial Reporting
62 Walmart 2017 Annual Report
Wal-Mart Stores, Inc.Management of Wal-Mart Stores, Inc. (“Walmart,” the “company” or “we”) is responsible for the preparation, integrity and objectivity of Walmart’s Consolidated Financial Statements and other financial information con-tained in this Annual Report to Shareholders. Those Consolidated Financial Statements were prepared in conformity with accounting principles generally accepted in the United States. In preparing those Consolidated Financial Statements, management is required to make certain estimates and judgments, which are based upon currently available information and management’s view of current conditions and circumstances.
The Audit Committee of the Board of Directors oversees our process of reporting financial information and the audit of our Consolidated Financial Statements. The Audit Committee stays informed of the financial condition of Walmart and regularly reviews management’s financial policies and procedures, the independence of our independent auditors, our internal control over financial reporting and the objectivity of our financial reporting. Both the independent auditors and the internal auditors have free access to the Audit Committee and meet with the Audit Committee regularly, both with and without management present.
Acting through our Audit Committee, we have retained Ernst & Young LLP, an independent registered public accounting firm, to audit our Consolidated Financial Statements found in this Annual Report to Shareholders. We have made available to Ernst & Young LLP all of our financial records and related data in connection with their audit of our Consolidated Financial Statements. We have filed with the Securities and Exchange Commission (“SEC”) the required certifications related to our Consolidated Financial Statements as of and for the year ended January 31, 2017. These certifications are attached as exhibits to our Annual Report on Form 10-K for the year ended January 31, 2017. Additionally, we have also provided to the New York Stock Exchange the required annual certification of our Chief Executive Officer regarding our compliance with the New York Stock Exchange’s corporate governance listing standards.
Report on Internal Control Over Financial ReportingManagement has responsibility for establishing and maintaining adequate internal control over financial reporting. Internal control over financial reporting is a process designed to provide reasonable assurance regarding the reliability of financial reporting and the preparation of financial state-ments for external reporting purposes in accordance with accounting principles generally accepted in the United States. Because of its inherent limitations, internal control over financial reporting may not prevent or detect misstatements. Management has assessed the effectiveness of the Company’s internal control over financial reporting as of January 31, 2017. In making its assessment, management has utilized the criteria set forth by the Committee of Sponsoring Organizations (“COSO”) of the Treadway Commission in Internal Control-Integrated Framework (2013). Management concluded that based on its assessment, Walmart’s internal control over financial reporting was effective as of January 31, 2017. The Company’s internal control over financial reporting as of January 31, 2017, has been audited by Ernst & Young LLP as stated in their report which appears in this Annual Report to Shareholders.
Under guidelines established by the SEC, companies are allowed to exclude acquisitions from their first assessment of internal control over financial reporting following the date of acquisition. Based on those guidelines, management’s assessment of the effectiveness of the Company’s internal control over financial reporting excluded
Jet.com, Inc. (“jet.com”), a U.S.-based e-commerce company, which the Company acquired in fiscal 2017. Jet.com represented 1.3% and 0.1% of the Company’s consolidated total assets and consolidated net sales, respectively, as of and for the year ended January 31, 2017. The Company’s acquisition of jet.com is discussed in Note 13 to its Consolidated Financial Statements for fiscal 2017.
Evaluation of Disclosure Controls and ProceduresWe maintain disclosure controls and procedures that are designed to provide reasonable assurance that information, which is required to be timely disclosed, is accumulated and communicated to management in a timely fashion. Management has assessed the effectiveness of these disclosure controls and procedures as of January 31, 2017, and determined they were effective as of that date to provide reasonable assurance that information required to be disclosed by us in the reports we file or submit under the Securities Exchange Act of 1934, as amended, was accumulated and communicated to management, as appropriate, to allow timely decisions regarding required disclosure and were effective to provide reasonable assurance that such information is recorded, processed, summarized and reported within the time periods specified by the SEC’s rules and forms.
Report on Ethical StandardsOur Company was founded on the belief that open communication and the highest ethical standards are necessary to be successful. Our long-standing “Open Door” communication policy helps management be aware of and address issues in a timely and effective manner. Through the open door policy all associates are encouraged to inform management at the appropriate level when they are concerned about any matter pertaining to Walmart.
Walmart has adopted a Statement of Ethics to guide our associates in the continued observance of high ethical standards such as honesty, integrity and compliance with the law in the conduct of Walmart’s business. Familiarity and compliance with the Statement of Ethics is required of all associates. The Company also maintains a separate Code of Ethics for our senior financial officers. Walmart also has in place a Related-Party Transaction Policy. This policy applies to Walmart’s senior officers and directors and requires material related-party transactions to be reviewed by the Audit Committee. The senior officers and directors are required to report material related-party transactions to Walmart. We maintain a global ethics and compliance office which oversees and administers several reporting mechanisms, including an ethics helpline. The ethics helpline provides a channel for associates to ask questions and make confidential complaints regarding potential violations of our statements of ethics, including violations related to financial or accounting matters. These contacts may be made anonymously.
/s/ C. Douglas McMillon
C. Douglas McMillonPresident and Chief Executive Officer
/s/ M. Brett Biggs
M. Brett BiggsExecutive Vice President and Chief Financial Officer
Management’s Report to Our Shareholders
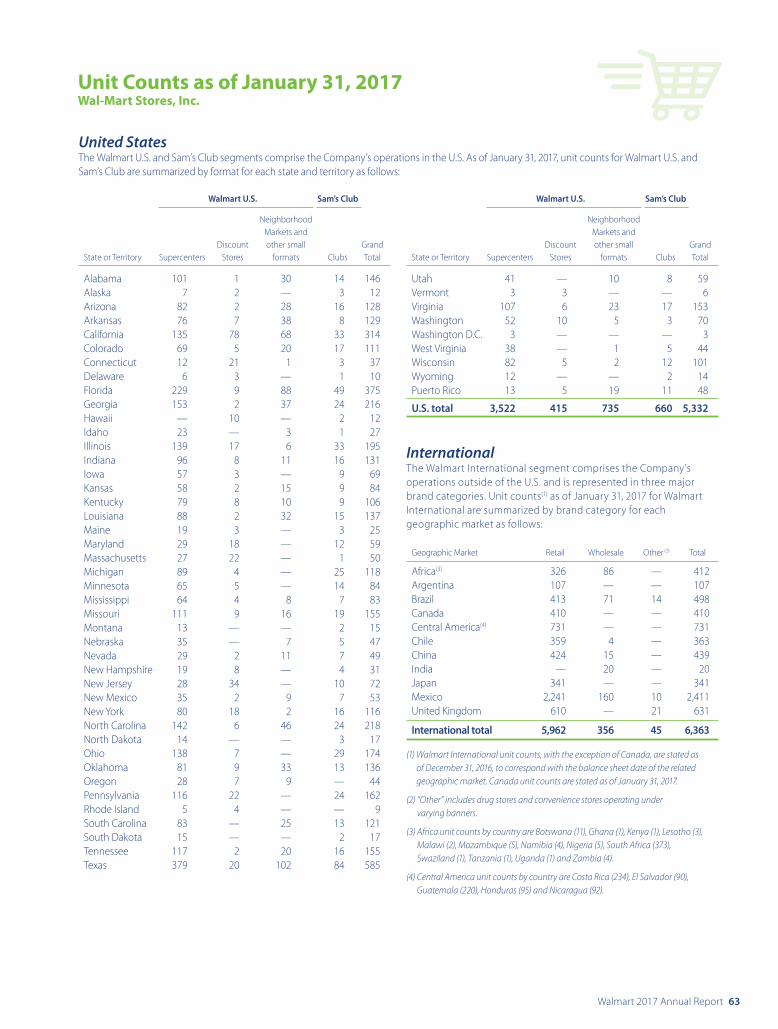
Walmart 2017 Annual Report 63
United StatesThe Walmart U.S. and Sam’s Club segments comprise the Company’s operations in the U.S. As of January 31, 2017, unit counts for Walmart U.S. and Sam’s Club are summarized by format for each state and territory as follows:
Walmart U.S. Sam’s Club
Neighborhood Markets and Discount other small Grand State or Territory Supercenters Stores formats Clubs Total
Alabama 101 1 30 14 146Alaska 7 2 — 3 12Arizona 82 2 28 16 128Arkansas 76 7 38 8 129California 135 78 68 33 314Colorado 69 5 20 17 111Connecticut 12 21 1 3 37Delaware 6 3 — 1 10Florida 229 9 88 49 375Georgia 153 2 37 24 216Hawaii — 10 — 2 12Idaho 23 — 3 1 27Illinois 139 17 6 33 195Indiana 96 8 11 16 131Iowa 57 3 — 9 69Kansas 58 2 15 9 84Kentucky 79 8 10 9 106Louisiana 88 2 32 15 137Maine 19 3 — 3 25Maryland 29 18 — 12 59Massachusetts 27 22 — 1 50Michigan 89 4 — 25 118Minnesota 65 5 — 14 84Mississippi 64 4 8 7 83Missouri 111 9 16 19 155Montana 13 — — 2 15Nebraska 35 — 7 5 47Nevada 29 2 11 7 49New Hampshire 19 8 — 4 31New Jersey 28 34 — 10 72New Mexico 35 2 9 7 53New York 80 18 2 16 116North Carolina 142 6 46 24 218North Dakota 14 — — 3 17Ohio 138 7 — 29 174Oklahoma 81 9 33 13 136Oregon 28 7 9 — 44Pennsylvania 116 22 — 24 162Rhode Island 5 4 — — 9South Carolina 83 — 25 13 121South Dakota 15 — — 2 17Tennessee 117 2 20 16 155Texas 379 20 102 84 585
Walmart U.S. Sam’s Club
Neighborhood Markets and Discount other small Grand State or Territory Supercenters Stores formats Clubs Total
Utah 41 — 10 8 59Vermont 3 3 — — 6Virginia 107 6 23 17 153Washington 52 10 5 3 70Washington D.C. 3 — — — 3West Virginia 38 — 1 5 44Wisconsin 82 5 2 12 101Wyoming 12 — — 2 14Puerto Rico 13 5 19 11 48
U.S. total 3,522 415 735 660 5,332
InternationalThe Walmart International segment comprises the Company’s operations outside of the U.S. and is represented in three major brand categories. Unit counts(1) as of January 31, 2017 for Walmart International are summarized by brand category for each geographic market as follows:
Geographic Market Retail Wholesale Other (2) Total
Africa(3) 326 86 — 412Argentina 107 — — 107Brazil 413 71 14 498Canada 410 — — 410Central America(4) 731 — — 731Chile 359 4 — 363China 424 15 — 439India — 20 — 20Japan 341 — — 341Mexico 2,241 160 10 2,411United Kingdom 610 — 21 631
International total 5,962 356 45 6,363
(1) Walmart International unit counts, with the exception of Canada, are stated as of December 31, 2016, to correspond with the balance sheet date of the related geographic market. Canada unit counts are stated as of January 31, 2017.
(2) “Other” includes drug stores and convenience stores operating under varying banners.
(3) Africa unit counts by country are Botswana (11), Ghana (1), Kenya (1), Lesotho (3), Malawi (2), Mozambique (5), Namibia (4), Nigeria (5), South Africa (373), Swaziland (1), Tanzania (1), Uganda (1) and Zambia (4).
(4) Central America unit counts by country are Costa Rica (234), El Salvador (90), Guatemala (220), Honduras (95) and Nicaragua (92).
Unit Counts as of January 31, 2017Wal-Mart Stores, Inc.
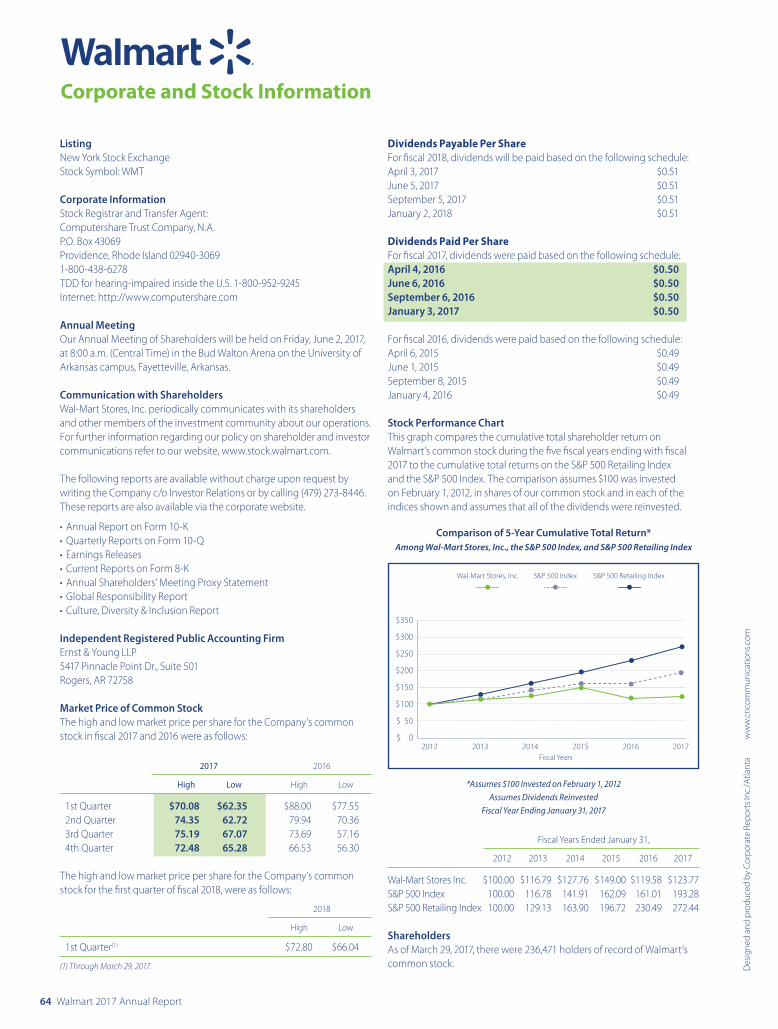
64 Walmart 2017 Annual Report
Corporate and Stock Information
ListingNew York Stock ExchangeStock Symbol: WMT
Corporate InformationStock Registrar and Transfer Agent:Computershare Trust Company, N.A.P.O. Box 43069Providence, Rhode Island 02940-30691-800-438-6278TDD for hearing-impaired inside the U.S. 1-800-952-9245Internet: http://www.computershare.com
Annual MeetingOur Annual Meeting of Shareholders will be held on Friday, June 2, 2017, at 8:00 a.m. (Central Time) in the Bud Walton Arena on the University of Arkansas campus, Fayetteville, Arkansas.
Communication with ShareholdersWal-Mart Stores, Inc. periodically communicates with its shareholders and other members of the investment community about our operations. For further information regarding our policy on shareholder and investor communications refer to our website, www.stock.walmart.com.
The following reports are available without charge upon request by writing the Company c/o Investor Relations or by calling (479) 273-8446. These reports are also available via the corporate website.
• Annual Report on Form 10-K• Quarterly Reports on Form 10-Q• Earnings Releases• Current Reports on Form 8-K• Annual Shareholders’ Meeting Proxy Statement• Global Responsibility Report• Culture, Diversity & Inclusion Report
Independent Registered Public Accounting FirmErnst & Young LLP5417 Pinnacle Point Dr., Suite 501Rogers, AR 72758
Market Price of Common StockThe high and low market price per share for the Company’s common stock in fiscal 2017 and 2016 were as follows:
2017 2016
High Low High Low
1st Quarter $70.08 $62.35 $88.00 $77.552nd Quarter 74.35 62.72 79.94 70.363rd Quarter 75.19 67.07 73.69 57.164th Quarter 72.48 65.28 66.53 56.30
The high and low market price per share for the Company’s common stock for the first quarter of fiscal 2018, were as follows:
2018
High Low
1st Quarter(1) $72.80 $66.04
(1) Through March 29, 2017.
Dividends Payable Per ShareFor fiscal 2018, dividends will be paid based on the following schedule:April 3, 2017 $0.51June 5, 2017 $0.51September 5, 2017 $0.51January 2, 2018 $0.51
Dividends Paid Per ShareFor fiscal 2017, dividends were paid based on the following schedule:April 4, 2016 $0.50June 6, 2016 $0.50September 6, 2016 $0.50January 3, 2017 $0.50
For fiscal 2016, dividends were paid based on the following schedule:April 6, 2015 $0.49June 1, 2015 $0.49September 8, 2015 $0.49January 4, 2016 $0.49
Stock Performance ChartThis graph compares the cumulative total shareholder return on Walmart’s common stock during the five fiscal years ending with fiscal 2017 to the cumulative total returns on the S&P 500 Retailing Index and the S&P 500 Index. The comparison assumes $100 was invested on February 1, 2012, in shares of our common stock and in each of the indices shown and assumes that all of the dividends were reinvested.
Comparison of 5-Year Cumulative Total Return* Among Wal-Mart Stores, Inc., the S&P 500 Index, and S&P 500 Retailing Index
*Assumes $100 Invested on February 1, 2012
Assumes Dividends Reinvested
Fiscal Year Ending January 31, 2017
Fiscal Years Ended January 31,
2012 2013 2014 2015 2016 2017
Wal-Mart Stores Inc. $100.00 $116.79 $127.76 $149.00 $119.58 $123.77S&P 500 Index 100.00 116.78 141.91 162.09 161.01 193.28S&P 500 Retailing Index 100.00 129.13 163.90 196.72 230.49 272.44
ShareholdersAs of March 29, 2017, there were 236,471 holders of record of Walmart’s common stock. D
esig
ned
and
prod
uced
by
Corp
orat
e Re
port
s Inc
./Atla
nta
w
ww
.cric
omm
unic
atio
ns.c
om
$350
$300
$250
$200
$150
$100
$ 50
$ 020172012 2013 2014 20162015
Fiscal Years
S&P 500 Retailing IndexS&P 500 IndexWal-Mart Stores, Inc.
The minimized environmental footprint of this report is the result of an extensive, collaborative effort of Walmart and our supply chain partners. The environmental and social impact continues to be an important consideration. It is printed on paper from well-managed forests containing recycled PCW fiber that is Elementally Chlorine Free (ECF). It is printed using 100 percent renewable wind power (RECs), along with environmental manufacturing principles that were utilized in the printing process. These practices include environmentally responsible procurement, lean manufacturing, green chemistry principles, the recycling of residual materials and reduced volatile organic compound inks and coatings.
Apple, the Apple logo, iPhone and iPod touch are trademarks of Apple Inc., registered in the U.S. and other countries. App Store is a service mark of Apple Inc. Android, Google Play and the Google Play logo are trademarks of Google Inc.
P
RINTED USIN
G
100%
WIND ENERG
Y
Supplied by Community Energy
Rainforest Alliance CertifiedTM
SmartWood Program Labeling Guidelines
Global ResponsibilityThe work we do to help people live better extends far beyond the walls of our stores. We’re committed to making a difference by working to create economic opportunity, enhance the sustainability of our operations as well as the systems we operate in, and strengthen local communities. From supporting the development of our associates, suppliers and women entrepreneurs to pursuing a more affordable, secure food supply chain, to helping to build resiliency in the face of disasters, Walmart seeks to create value for stakeholders across business and society, because shared value enhances the quality and viability of solutions. To learn more about these initiatives and others, read our GRR by visiting corporate.walmart.com/2017GRR.
Walmart’s investor relations app: anytime, anywhere access to financial and company newsOur IR app offers shareholders an array of investor resources in a user-friendly format. With the app, you can access quarterly results, stock price, financial presentations and company news at any time from your mobile device. It’s available for the iPad, iPhone, Android or Microsoft device. Download the free app from iTunes, Google Play or by scanning this QR code.
Moving with speed to win the future of retail—it’s in our DNA. Innovating to serve customers better is how Walmart became the company it is today. Now, we’re transforming to make every day easier for busy families.
As associates, we all play a role in creating an even better Walmart that saves customers time and money.

2017 Annual Report
Moving with SPEED
Learn more about how Walmart is moving with speed
with our enhanced digital annual report at stock.walmart.com
Wal-Mart Stores, Inc. (NYSE: WMT) 702 S.W. 8th Street
Bentonville, Arkansas 72716 USA 479-273-4000 walmart.com
2017 Annual Rep
ort