Embed Size (px)
Citation preview
2017 – 2018 BUDGET
CITY OF LODI CALIFORNIA

(This page intentionally left blank)
City of Lodi Mission Statement
“The City of Lodi’s purpose is to enhance the quality of life for Lodi residents reflecting our high community standards.”
(This page intentionally left blank)
2017‐2018
Budget
Doug Kuehne, Mayor Alan Nakanishi, Mayor Pro‐Tempore Mark Chandler, Council Member Bob Johnson, Council Member
JoAnne Mounce, Council Member
Steve Schwabauer, City Manager
Prepared by the Staff of the
City of Lodi
CITY OF LODI, CALIFORNIA

(This page intentionally left blank)
2017-2018 CITY OF LODI
FINANCIAL PLAN AND BUDGET
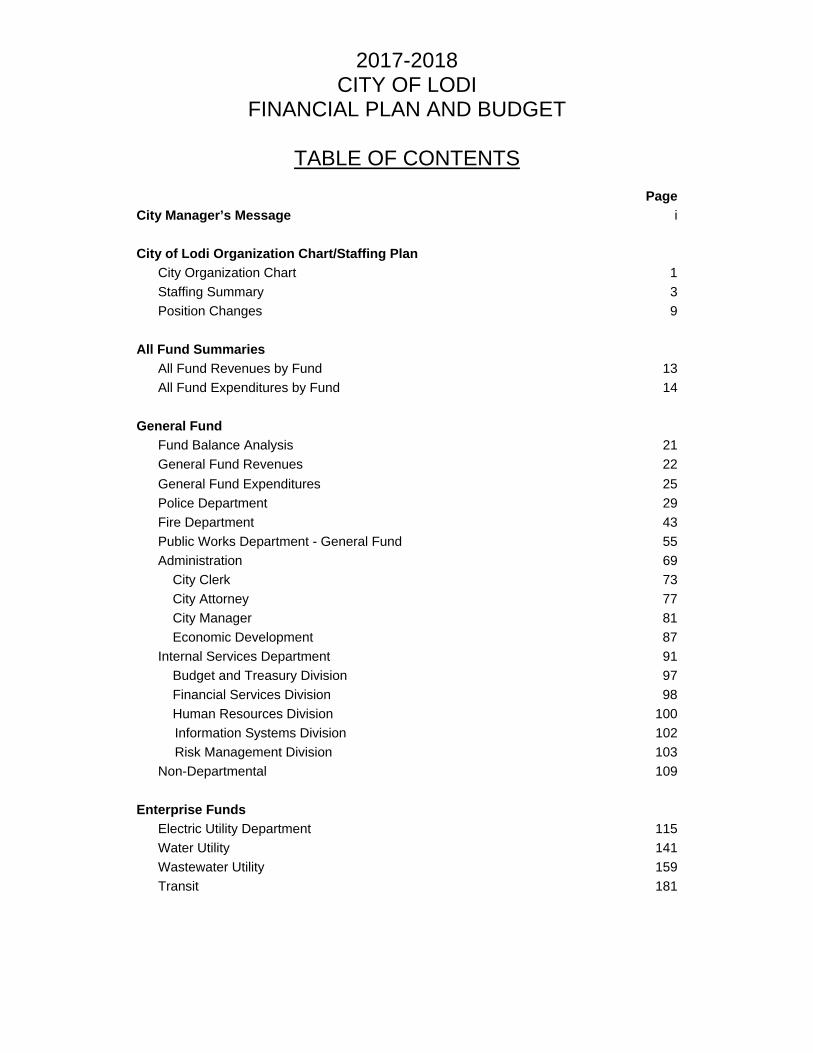
TABLE OF CONTENTS
PageCity Manager’s Message i City of Lodi Organization Chart/Staffing Plan
City Organization Chart 1Staffing Summary 3Position Changes 9
All Fund Summaries
All Fund Revenues by Fund 13All Fund Expenditures by Fund 14
General Fund
Fund Balance Analysis 21General Fund Revenues 22General Fund Expenditures 25Police Department 29Fire Department 43Public Works Department - General Fund 55Administration 69 City Clerk 73 City Attorney 77 City Manager 81 Economic Development 87Internal Services Department 91 Budget and Treasury Division 97 Financial Services Division 98 Human Resources Division 100
Information Systems Division 102Risk Management Division 103
Non-Departmental 109
Enterprise Funds Electric Utility Department 115Water Utility 141Wastewater Utility 159Transit 181
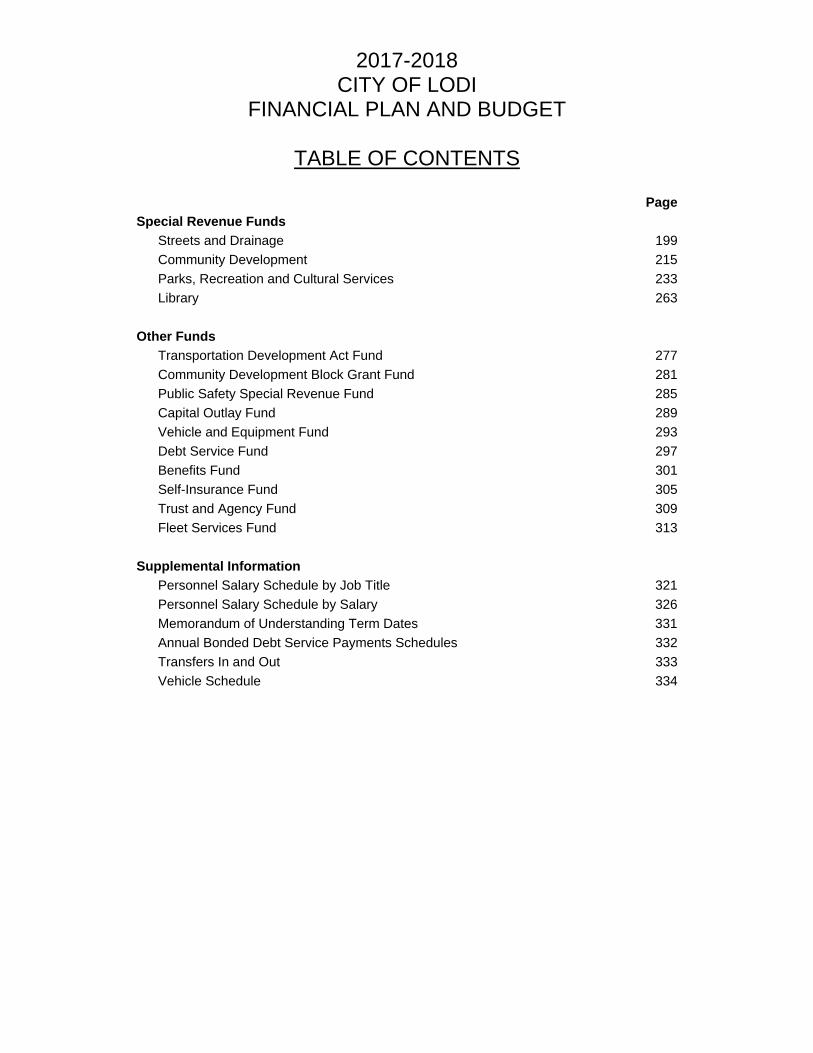
2017-2018 CITY OF LODI
FINANCIAL PLAN AND BUDGET
TABLE OF CONTENTS
PageSpecial Revenue Funds
Streets and Drainage 199Community Development 215Parks, Recreation and Cultural Services 233Library 263
Other Funds
Transportation Development Act Fund 277Community Development Block Grant Fund 281Public Safety Special Revenue Fund 285Capital Outlay Fund 289Vehicle and Equipment Fund 293Debt Service Fund 297Benefits Fund 301Self-Insurance Fund 305Trust and Agency Fund 309Fleet Services Fund 313
Supplemental Information Personnel Salary Schedule by Job Title 321Personnel Salary Schedule by Salary 326Memorandum of Understanding Term Dates 331Annual Bonded Debt Service Payments Schedules 332Transfers In and Out 333Vehicle Schedule 334
CITY COUNCIL
DOUG KUEHNE,Mayor,
ALAN NAKANISHIMayor Pro Tempore
MARK CHANDLER
BOB JOHNSON
JOANNE MOUNCE
CITY OF LODICITY HALL, 221 WEST PINE STREET
P.O. BOX 3006LODt, CALTFORNTA 95241-1910
(209) 333-6700 / FAX (209) 333-6807
June 1,2017
Dear Honorable Mayor and Council Members:
I am pleased to be able to submit a proposed balanced budget for Fiscal Year (FY) 2017118.
Unfortunately, I am forced to note that it could not come without sacrifice to staffing levels,service levels and vehicle reserve funds. And given unrestrained increases in PERS costs furtherand more expansive sacrifices will be necessary in successive years. The major sacrifices thisyear come in the form of reduced funding for Fire Engine I (operational 60% of the time last yearand30Yo of the time in2017ll8); two half year unfunded police officer positions, elimination of asecretary in the Library and underfunding of Police and Fire Vehicle Replacement funds.
On a positive note projected General Fund revenue growth is significant over 2016117 totaling$50,388,788. A significant share of this growth is due to new Cost of Service Charges inCommunity Development and Transit and a large portion of that represents a claw back of pastyears unrecovered charges. As such, repeatable growth only totals 51,243,560 representing2.6%opercent growth in revenues year over year. However, the growth is more than absorbed by theexhaustion of the reserve funds that were set aside to fund the $3.9 million cumulative 7%o anntalwage increase required by the 2014-17 labor agreements. V/hile we had excess reserves to fundthe contracts through today, revenue growth has not been sufficient to fully fund those agreementsnow that the reserves have been depleted. Combined with a PERS projected stair-steppedincrease of nearly $7 million between now and 2022123, it is apparent that this next year will be
spent planning for reduced service levels.
There are, of course, reasons for optimism as well. This past year showed continued growth forCostco, Home Depot and the Lodi Shopping Center. The former Wal-Mart site has been fullyleased with construction starts for Petco, The Party Store and Hobby Lobby. Additional junior-major retailers Ross (relocation), Sprouts, and Home Goods, are moving forward with plans tocomplete other sections of Reynolds Ranch.
Residential development continues to be a bright spot for the local economy. We now have eighthousing projects in various stages from grading to completed sales including Rosegate I and II,Orchard Lane in Reynolds Ranch, Grupe's Vine and Harvest Crossing, Elliot's Van RuitenRanch, and the small I and 9 unit Teinda Drive projects. All told we built about 165 units in2016, and expect to build 196 in20l7 and209 in2018.
Multi-Unit projects are aî added bright spot with Eden Housing's 80 affordable units coming online this year, and Reynolds Ranch's 156 unit apartments and 142 unit senior apartments comingon line in 2018 and2019.
Unfortunately residential growth in and of itself is not projected to keep pace with rapidlyinflating PERS costs. Assuming Lodi builds all 565 single family units and all478 multi-familyunits projected between 2017 and 2019, they will only raise roughly $900,000 in property tax andCommunity Facilities District Fees. PERS increases are projected to be more than double thatgrowth in the same time frame.
STEPHEN SCHWABAUERCity Manager
JENNIFER M. FERRAIOLOCity Clerk
JANICE D. MAGDICHCity Attorney
i
The City has reduced its work force by about 16 percent over the past 12 years, from 470 full-timebudgeted employees in2004105 to 393 full-time budgeted employees in2017ll8. Approximately248 positions (63 percent) are funded by the General Fund, either directly or through transfers
from the General Fund. Notwithstanding our positive economic indicators, staff will remain
cautious recommending new full-time General Fund positions, in light of the City's sharply
increasing PERS obligations.
The City will have a net reduction of 4 positions this year. A table showing these changes appears
later in this letter.
Cities, like businesses and households, need some type of financial cushion against the potentialshock of unanticipated circumstances and poor economies. Recognizing this, the City Counciladopted a General Fund Reserve Policy with the FY 2010/11 budget. The policy sets a target of 8percent of General Fund revenue as a "catastrophic" reserve to meet natural and other physicaldisasters and an additional 8 percent of General Fund revenue to meet unanticipated economic
crises. I am pleased to report that the City has fully funded both elements of these reserves for the
fifth year in a row inthe2017/18 budget, even as the reserve target rises with the General Fund
revenue tide.
I am also pleased to note that Council established and funded a PERS Stabilization Fund withreserves in excess of targeted amounts atthe close of the 2015116 BudgetYear. This actionwascritical to the City given the unprecedented increase in PERS costs discussed below. With the
implementation of the Cost of Service charges to Community Development, Streets and Transitwe will also be able to recapture past and cunent charges of $2 million to dedicate to the PERS
Stabilization Fund bringing total General Fund side funding to $4.8 million.
The City will continue its capital efforts in the coming year. Significant projects expected to be
undertaken during the year include the long awaited City Website Update, Several roof and storm
water handling projects, street improvements, phase seven of the water meter project and theLibrary's Teen Scene project.
The City continued its phased financial systems implementation and activated the utility billingmodules. The utility billing module did not come without its challenges. We anticipate lostrevenues inthe2016117 budget year associated with the inability to collect late fees. However weare also working on an improved online payment platform that may actually decrease costs and
improve function.
Fiscal Year 2017118 Budget Issues
Balancing the 2017ll8 budget involves balancing several challenging factors. Three particularpoints are worthy of highlighting: (1) employee costs and contributions; (2) capital programs; and
(3) a combination of cost increases that were either a) imposed on the City by external forces, orb) negotiated by the City with its bargaining groups.
Employee costs and contributions - The Great Recession brought a gteat number of changes toLodi's employee pay and benefit structures. As the City moved to control costs, employees made
significant concessions to retain services. Although concessions took many different formsincluding furloughs, health insurance caps and elimination of certain benefits, they ultimatelymatured to a universal health insurance cap and full employee paid employee PERS share. Theeffect of these agreements was to reduce employment costs 7 to 9 percent below 2007/08levels.
ii
The City negotiated its first multi-year agreement since 2009 in 2074. Labor agreements with allbargaining units provide fiscal certainty through December 31,2017 . These agreements generallycall for a 3 percent raise in 2015 and2 percent raisds in 2016 and 2017 (except for IBEW). Theseamounts help offset the value of the retirement contributions that employees picked up during therecessionary years. City medical contributions were held at the 2014 levels. Funding for theGeneral Fund component of these agreements was provided by reserves in excess of the reserve
target established by Council.
Unfortunately those excess reserves have now been fully expended. Although this budget doesshow significant growth, the sustainable portion of it is not adequate to cover the full amount ofthe increased labor costs. As such this budget was only balanced at the expense of several servicelevel reductions referenced at the beginning ofthis letter.
I greatly appreciate the sacrifices and services of our employees. Lodi's employees realizethatour primary responsibility is to provide a high level of service to our communit¡r, and thesesacrifices have allowed the City to maintain that quality service to our citizens during a
particularly challenging time. The City of Lodi is proud to meet its commitment to those weserve.
Long Range X'inancial Plan
The City recognizes the need to look beyond Fiscal Year 2017118 to develop a long rangefinancial plan. The longer a forecast, the less reliable it is. For instance, if actual revenues inFiscal Year 2017118 come in af 99%o of the anticipated level, the City would realize $487,000 lessrevenue than projected. If all other assumptions hold true, the six year combined impact to theGeneral Fund is a reduction of $3.1 million in revenue, further exacerbating the City's financialoutlook. In this scenario, all General Fund economic reserves would be exhausted by Fiscal Year2020/21, all General Fund catastrophic reserves would be exhausted by FY 2021122 and nearly allpension stabilization reserves would be exhausted during the forecast term.
Despite this fact, a forecast based on known factors, reasonable estimates and assumptions,combined with contextual analysis of risks and opportunities, is a valuable decision making tool.The following forecast is intended to help guide decision making and resource prioritization in thelong-range. In addition, scenarios have been discussed that would require a reevaluation of theforecast should they come to fruition during the term.
The forecast represents the baseline scenario for all long range financial plans. In this scenario,FY 2016117 employment agreements and service level provision are assumed to continue as iswith only minor adjustments as shown.
The model is attached as exhibit A to this letter. The first two tables highlight revenue andexpense assumptions used to develop the model followed by the projected revenue results basedon those assumptions. The third and final page of the forecast shows the expense results, thebottom line annual surplus/(deficits) and resulting fund balances.
In summary, forecast for the General Fund indicates that fund balance reserves will be entirelyexhausted by Fiscal Year 2023124, despite consistent revenue growth and stable expenses. TheCity Council's decision inFY 2016/17 to use excess reserves to create a PERS Stabilization Fundand the staff budget recommendation to place an additional $2 million into a pension stabilizationfund in this budget year will provide resources to float operations through FY 2022123. After that,the City is entirely at the mercy of the increasing unfunded accrued liability (UAL) paymentsmandated by the California Public Employees' Retirement System (CaIPERS).
iii
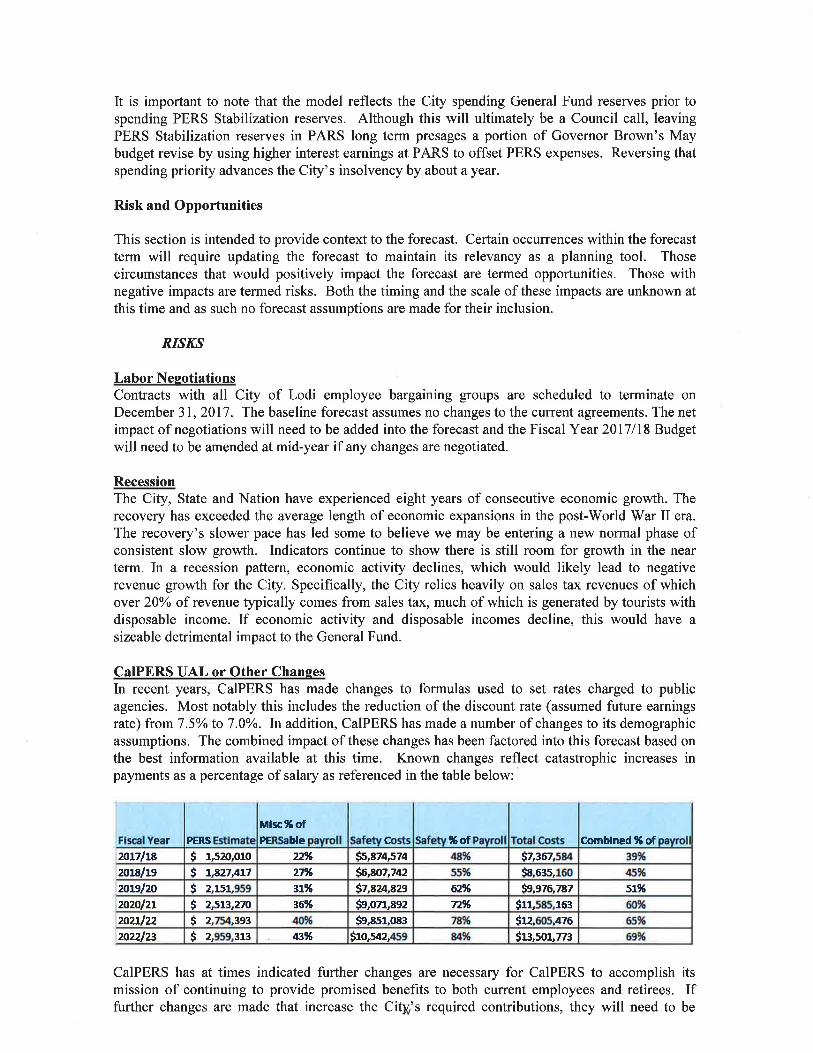
It is important to note that the model reflects the City spending General Fund reserves prior tospending PERS Stabilization reserves. Although this will ultimately be a Council call, leavingPERS Stabilization reserves in PARS long term presages a portion of Governor Brown's Maybudget revise by using higher interest earnings at PARS to offset PERS expenses. Reversing thatspending priority advances the City's insolvency by about ayear.
Risk and Opportunities
This section is intended to provide context to the forecast. Certain occuffences within the forecastterm will require updating the forecast to maintain its relevancy as a planning tool. Thosecircumstances that would positively impact the forecast are termed opportunities. Those withnegative impacts are termed risks. Both the timing and the scale of these impacts are unknown atthis time and as such no forecast assumptions are made for their inclusion.
,RI,Sr,S
Labor NesotiationsContracts with all City of Lodi employee bargaining groups are scheduled to terminate onDecember 31,2017 . The baseline forecast assumes no changes to the current agreements. The netimpact of negotiations will need to be added into the forecast and the Fiscal Year 2017/18 Budgetwill need to be amended at mid-year if any changes are negotiated.
RecessionThe City, State and Nation have experienced eight years of consecutive economic growth. Therecovery has exceeded the average length of economic expansions in the post-World War II era.
The recovery's slower pace has led some to believe we may be entering a new normal phase ofconsistent slow growth. Indicators continue to show there is still room for growth in the nearterm. In a recession pattern, economic activity declines, which would likely lead to negativerevenue growth for the City. Specifically, the City relies heavily on sales tax revenues of whichover 20o/o of revenue typically comes from sales tax, much of which is generated by tourists withdisposable income. If economic activity and disposable incomes decline, this would have asizeable detrimental impact to the General Fund.
CaIPERS UAL or Other ChansesIn recent years, CaIPERS has made changes to formulas used to set rates charged to publicagencies. Most notably this includes the reduction of the discount rate (assumed future earningsrate) from 7 .5o/o to 7 .0%. ln addition, CaIPERS has made a number of changes to its demographicassumptions. The combined impact of these changes has been factored into this forecast based onthe best information available at this time. Known changes reflect catastrophic increases inpayments as a percentage of salary as referenced in the table below:
Yeâr PEßS
Ml¡c96ofPERS¡ble Costs 96of Costs Comblned ?6 of
CaIPERS has at times indicated further changes are necessary for CaIPERS to accomplish itsmission of continuing to provide promised benefits to both curent employees and retirees. Iffurther changes are made that increase the City's required contributions, they will need to be
zor:lta $ r,szo,oro 229É $s,ez+sz¿ 4896 s¿36¿s84 3996,
S L.sz7.ifi 2716 s6.807.742 s596 Ss.63s.t6ozoLslLe ¡l¡t96
zoLglzo S z,rsr,gsg 3196. S¿sz4szg 62% $s,gzo,7Bz s196.
z0z0lZL s ¿s13,270 36x $9,07r"892 7Z% srl,s8s,163 6096
zoztlzz $ 2,754,393 ¡f096 s9,851,083 78x s12,605,476 6s96
zo22lz3 S ¿e5e,313 439G, Sro,s4¿4s9 s% $rc,sol,I's 6996
iv
factored into this forecast.
OPPORTUNITIES
This list is not exhaustive. Staff will continue to explore opportunities for partnerships with thecommunity and private sector to best deliver services in an efficient manner.
Economic l)evelopmentOther economic development opportunities may be realized during the term of the forecast. Mostprominent are the Candlewood Suites and the La Quinta Hotel projects. rWhen completed, bothwould add to the transient occupancy, sales tax and property tax revenues. Currently, physical sitedevelopment has not begun. With a construction timeline ranging up to 18 months to ayear,revenue is not forecasted in FY 2017118. Additionally, significant private investment predicatedon proper economic and market conditions are required before construction begins. These
investment decisions and market conditions are not under the City's influence; hence it isirresponsible to model the additional revenue in the forecast. When more information on the starttime is available, the additional revenue can be programmed into the forecast. Once the project is
started, there is no guarantee the project will be delivered to completion within that timeframe, butthere is a certainty level that allows for accurate projections.
The City will reevaluate its forecast as these and other significant economic developmentopportunities are realized.
Revenue EnhancementIn November 2016, the City Council elected to place two special revenue sales tax measures on
the local ballot. Measure R was a0.125 percent (1/8 cent) tax for 15 years to fund park repairsand updates and riverbank erosion repairs. It failed to reach the necessary 213 voter approvalthreshold, but did receive an impressive 62.65Yo of the vote in support of the measure. Measure S
was a 0.25 percent sales tax for 15 years to fund the restoration of Fire Engine I (currentlyproposed to be browned out 70% in the FY 20l7ll8 budget) and to expand gang preventionprograms. This measure also failed, but by the nanow margin of 13 votes, receiving 66.61% ofthe vote in support of the measure.
The results of the 2016 election suggest that the majority of the public is in support of newrevenue for a broad range of services. A General Purpose sales tax measure would need only 50%plus 1 support. Given the wealth of support for both 2016 measures, with proper public outreachto scope the general measure and controls (such as Citizen's Oversight and separate annual audits)built in, the City could possibly garner the needed support. To place a General measure on theballot, City Council would have to vote 4-7, and voters would need to pass the measure with a
simple majority.
A general revenue measure would add significant resources to the General Fund and wouldrequire an overhaul of this forecast. The same would be true of a special measure.
Other revenue enhancing options are available, including an increase in the Transient Occupancytax (up to $200,000 in additional revenue) and the Business License Fee (up to $2.4 million inadditional annual revenue) but all require a vote of the Council and the public and can beconsidered at Council direction. Given the significant need for new revenue based on known costdrivers, primarily CaIPERS UAL increases; a general sales tax is the most reliable method thatcould generate sufficient revenue to make current operations sustainable.
Cost of ServicesBuilt into the forecast is the assumption that the cost of services measures adopted for the first
v
time in FY 20l7lI8 will continue throughout the forecast term and beyond. In FY 2017118,Community Development, Public Works Administration, Streets and Transit cost of servicescharges are recommended for the first time. Community Development has historically levied thischarge to fee payers. However the internal transfer of funds from Community Development to theGeneral Fund has not occurred. As such, an additional allocation for the prior l0 years has beenincluded in the FY 2017 ll8 budget recommendation. Staff is reviewing the possibility of a similarhistorical allocation charge for Public Works Admin, Streets and Transit, but has not included anyestimates in this forecast. It is important to note that in the forecast, the ongoing cost of servicesis included. Any additional revenue from the historical allocation charge will be one time andcannot be relied upon to fund continuing operations. Finally a full review of the allocation factorsand the allocation formulas will be conducted during FY 20l7ll8 to ensure the City is fullycapturing eligible cost for internal services, administrative and government functions fromrestricted revenue sources.
Full Cost Recovery EffortsFinance staff will begin an ongoing review of all rates, fees, and charges (internal and external) toprovide a clear picture of any subsidies the General Fund curently offers. The goal of this effortis to present full cost recovery options to Council in considering fees using the Fully BurdenedHourly Rate (FBHR) concept for staff time in a full time and materials model for each serviceprovided.
Known Impacts Beyond the Forecast TermCaIPERS Discount Rate Phase InThe full effect of the discount rate reduction approved by CaIPERS is not seen in this forecast.Each of three discount rate reductions is phased in over a five year period as shown in thefo table
Specifically, the final two years of the drop from 7 .25% to 7 .00Yo do not occur until FY 2023124and FY 2024125, the first two years beyond this forecast term. These are the final two years of thephase in for the largest of the three discount rate reductions. The City's UAL is scheduled forcontinued increases during these years. The next table shows the expected increase ranges, as
provided by CaIPERS. The increases to "Normal Cost" are on a Yo of payroll basis. Theincreases to "UAL Payments" are on a %o of the UAL estimate calculated in the current actuarialstudy. Both are increases relative to estimates provided by the City's PERS actuary report with avaluation date of June 30,2075.
All Funds
The All-Funds budget expenditures for FY 20l7ll8 are $204,699,940. This is an increase ofnearly $1 million from the previous year's budget.
The single-largest City fund is the Electric Fund at573,996,630. The second-largest fund is theGeneral Fund at $50,388,780. As mentioned above much of the growth in the General Fund isdriven by one-time accounting adjustments related to Cost of Service recoveries in theCommunity Development Fund. Other funds of note: Wastewater Fund, $18,950,180; WaterFund, $14,722,520; Street Fund, $9,139,110 which sees a small influx of cash this year from newtransportation taxes (HUTA) increasing to $1.2 million in new revenue in following years; Parks,Recreation and Cultural Services Fund $6,149,250 andLibrary Fund, $1,327,990.
Valuation DateFiscal Year
for Reouired Contr¡bution Discount Rate
June 30, 2016 2018-19 7.37s%June 30, 2017 2019-20 7.25o,6
June 30, 2018 2020-2t 7.OO%
The overall staffing levels for All-Funds are 393 full-time funded positions. This is a netvi
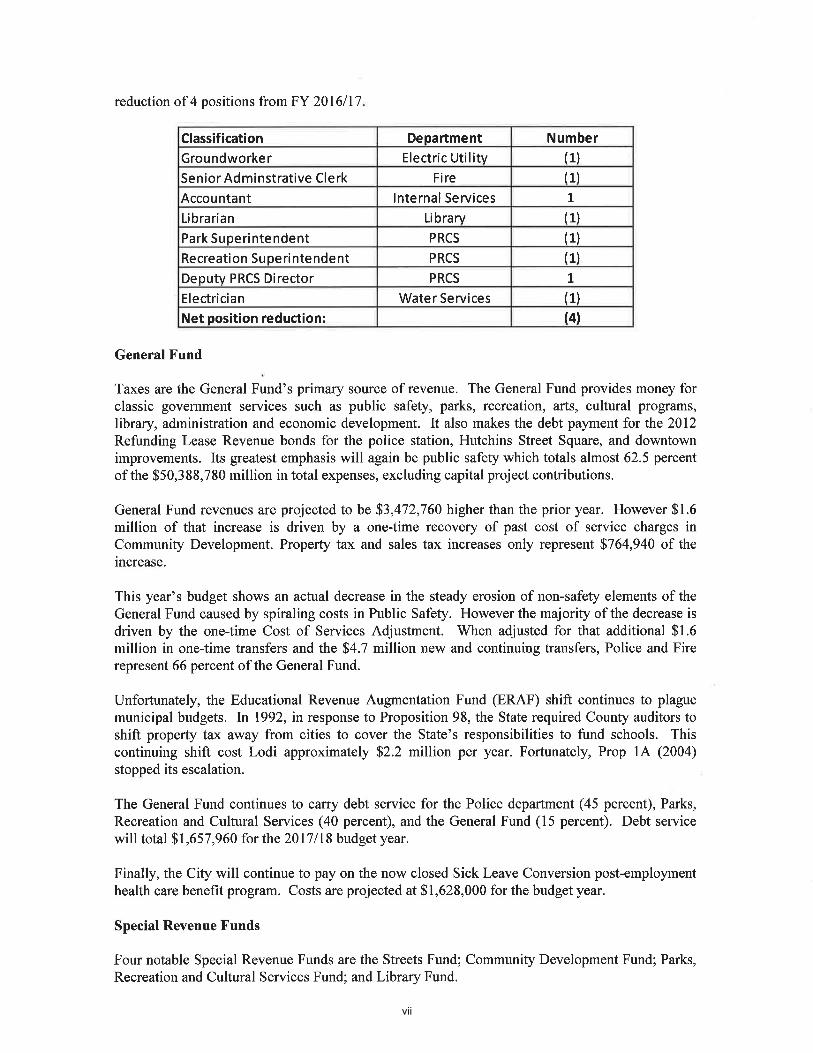
reduction of 4 positions from FY 2016117
Classification Department Number
Groundworker Electric Utility (1)
Senior Adminstrative Clerk Fire (1)
Accountant lnternal Services L
Libra rian Library (1)
Park Superintendent PRCS (1)
Recreation Superi ntendent PRCS (1)
Deputv PRCS Director PRCS L
Electrician Water Services (1)
Net position reduction: (41
General Fund
Taxes are the General Fund's primary source of revenue. The General Fund provides money forclassic government services such as public safety, parks, recreation, arts, cultural programs,library, administration and economic development. It also makes the debt payment for the 2012Refunding Lease Revenue bonds for the police station, Hutchins Street Square, and downtownimprovements. Its greatest emphasis will again be public safety which totals almost 62.5 percentof the $50,388,780 million in total expenses, excluding capital project contributions.
General Fund revenues are projected to be $3,472,760 higher than the prior year. However $1.6million of that increase is driven by a one-time recovery of past cost of service charges inCommunity Development. Property tax and sales tax increases only represent 5764,940 of the
increase.
This year's budget shows an actual decrease in the steady erosion of non-safety elements of theGeneral Fund caused by spiraling costs in Public Safety. However the majority of the decrease is
driven by the one-time Cost of Services Adjustment. When adjusted for that additional $1.6million in one-time transfers and the $4.7 million new and continuing transfers, Police and Firerepresent 66 percent ofthe General Fund.
Unfortunately, the Educational Revenue Augmentation Fund (ERAF) shift continues to plaguemunicipal budgets. ln 1992, in response to Proposition 98, the State required County auditors toshift property tax away from cities to cover the State's responsibilities to fund schools. Thiscontinuing shift cost Lodi approximately $2.2 million per year. Fortunately, Prop 1A (2004)stopped its escalation.
The General Fund continues to carry debt service for the Police department (45 percent), Parks,
Recreation and Cultural Services (40 percent), and the General Fund (15 percent). Debt servicewill total $1,657,960 for the 2017/18 budget year.
Finally, the City will continue to pay on the now closed Sick Leave Conversion post-employmenthealth care benefit program. Costs are projected at $1,628,000 for the budget year.
Special Revenue Funds
Four notable Special Revenue Funds are the Streets Fund; Community Development Fund; Parks,
Recreation and Cultural Services Fund; and Library Fund.
vii
The Streets Fund handles all street and pavement activities including street cleaning and
sweeping, traffic control devices, street trees, sidewalk and landscape maintenance and
management of the storm water collection system.
The Community Development Fund covers the cost of the Community Development Department
and its three divisions: Planning, Building, and Neighborhood Services. The Fund turned the
corner in FY 2010111 and erased its prior deficit. Budget year revenues are projected to exceed
costs. However, Fund balance will actually decrease to $1.7 million as a result of accounting
corrections to transfer past years uncollected Cost of Service charges to the Department.
The Parks, Recreation and Cultural Services (PRCS) Fund is projected to start FY 2017ll8 with a
cumulative surplus of about $212,000.
The Library Fund is projecting a budget is expected to end the year with no fund balance as a
result of two major capital projects for its roof and the Teen Scene project.
Utilities and Enterprise Funds
The Electric Fund is the City's largest fund and is seeing increasing stress as capital maintenance
needs increase in frequency and urgency. As Council will note, budgets for the last number ofyears have shown a drawdown of reserves to feed capital maintenance needs. The staffing
Shortages that prevented the implementation of most of these projects have been filled with the
first major progress accomplished in the 2016/17 budget year.
During FY 2014115, the City engaged a consultant to develop a rate model to assist the utility inlong-range planning. As a result, staff brought forward a rate increase and added positions funded
by the rate action to accommodate projected maintenance projects and new development.
Bulk power purchases will likely always be the largest expense for the Electric Utility. The LodiEnergy Center, operated by the Northern California Power Agency, began operations and
delivering power to the City in FY 2012113. This power supply has allowed the City to reduce its
reliance on other contracted power sources. Over time, power from the Lodi Energy Center is
expected to moderate, or reduce utility costs. Unfortunately current market conditions have leftLEC out of the market all but aboutT1o/o of the time. The Electric Utility is projecting a decrease
to reseryes of $800,000 as a result of the continued capital program.
The Surface Water Treatment Plant began operations in FY 2012113. The plant operation allows
the City to end its past practices of drawing ground water in excess of the amount that is naturally
replenished. The installation of water meters and the transition from a flat-rate water bill to ausage-based water bill are a significant change for the Water Fund and will continue for a number
of years. Council expanded this resource by entering into an agreement in 2014 that allows forthe purchase of up to an additional 1,000 acre feet of water per year from North San Joaquin
Water Conservation District. Staff will also be focusing heavily on implementing the new State
Groundwater Management Act in the coming year. The Water Fund is projecting an increase to
reserves of about $3 million.
The impact of prudent management along with rate increases has brought the wastewater utility toa point where it is expected to have cash reserves of $10.2 million at the end of FY 2017118, a
level well in excess of its target reserve level of $2.8 million. Although not noticed, the utilitymanaged to operate without the need for a consumer price index type increase in the 2016117
budget year and anticipates the same for 2017/18.
Acknowledgments viii
I extend my deepest appreciation to the staff team involved in preparing the 2017/18 budget:Deputy City Manager/Internal Services Director Andrew Keys, Supervising Budget Analyst Susan
Bjork, and Management Analyst Sandra Brage. Additionally, I must thank the department headsand their staff teams for their work and sacrifice in making this balanced budget possible.
Sincerely,
Stephen SchwabauerCity Manager
ix
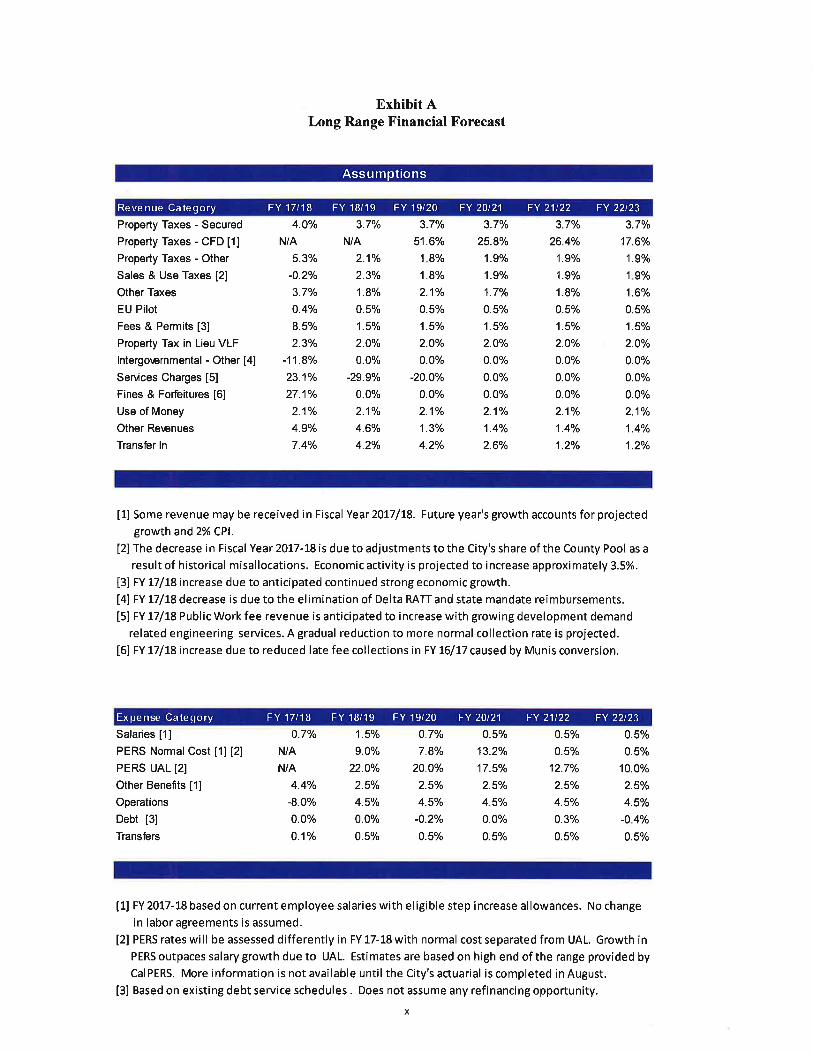
Exhibit ALong Range Financial Forecast
Assumptions
Revenue Category FY 17t18 FY 18/19 FY 19t2A FY 20t21 FY 21t22 FY 22123
Property Taxes - Secured
Property Taxes - CFD [1]
Property Taxes - Other
Sales & Use Taxes [2]
Other Taxes
EU Pilot
Fees & Permits [3]
Property Tax in Lieu VLF
lntergorernmental - Other [4]
Senices Charges [5]
Fines & ForÞitures [6]
Use of Money
Other Rercnues
TransÊr ln
Salaries fllPERS NormalCost fll [2]
PERS UAL [2]
Other Benefits [1]
Operations
Debt [3]
Transbrs
[1] Some revenue may be received in Fiscal Year2017/18. Future year's growth accounts for projectedgrowth and2% CPl.
[2] The decrease in Fiscal Year 20I7-I8is due to adjustments to the City's share of the County Pool as a
result of historical misallocations. Economic activity is projected to increase approximatelV 3S%.
[3lFY L7/tg increase due to antícipated continued strong economic growth.
Í4ltY L7/ISdecrease is due to the elimination of Delta RATT and state mandate reimbursements.
Í5lFY 77/18 Public Work fee revenue is anticipated to increase with growing development demand
related engineering services. A gradual reduction to more normal collection rate is projected.
16ltY t7/tB increase due to reduced late fee collections inFY t6/17 caused by Munis conversion.
4.0o/o
N/A
5.3o/o
-0.2o/o
3.7o/o
0A%
8.5%
2.3Yo
-11.8o/o
23.1o/o
27.1o/o
2.1o/o
4.9o/o
7.4o/o
3.7%
N/A
2.1Vo
2.3o/o
1.8o/o
Q.5To
1.5o/o
2.0o/o
0.0o/o
-29.9%
0.0%
2.1o/o
4.60/o
4.2o/o
3.7%
51.60/o
1.8%
1.8o/o
2.1o/o
0.íYo
1.5o/o
2.0%
O.0o/o
-20.0o/o
0.0%
2.1o/o
1.3o/o
4.2o/o
0.7o/o
7.8o/o
20.0o/o
2.5o/o
4.5%
-0.2%
0.5%
3.7o/o
25.8o/o
1.9o/o
1.9o/o
1.7o/o
Q.5o/o
1.5o/o
2.0o/o
0.0%
0.0%
O.0o/o
2.1o/o
1A%
2.6Yo
0.5o/o
13.2o/o
17.5%
2.5o/o
4.50/o
0.0o/o
0.5o/o
3.7o/o
26.4o/o
1.9o/o
1.9To
1.8%
0.5o/o
1.5o/o
2.0o/o
0.QYo
0.0o/o
0.0o/o
2.1o/o
1.4o/o
1.2%
0.5o/o
0.5%
12.7o/o
2.5o/o
4.5o/o
Q.3Yo
0.5%
3.7o/o
17.60/o
1.9%
1.9Yo
1.60/o
0.5o/o
1.5%
2.0%
0.0%
0.0%
0.0%
2.1o/o
1.4o/o
1.2o/o
0.íYo
0.5o/o
10.0o/o
2.5o/o
4.5%
-0.4o/o
0.5%
0.7o/o
N/A
N/A
4.4o/o
-8.Qo/o
0.0o/o
0.1Vo
1.5o/o
9.0%
22.0o/o
2.5o/o
4.5%
0.0%
0.5o/o
[lltY 2017-t8 based on current employee salaries with eligible step increase allowances. No change
in labor agreements is assumed.
[2] PERSrateswill beassesseddifferentlyinFYlT-l8withnormal costseparatedfromUAL GrowthinPERSoutpacessalarygrowthdueto UAL. EstimatesarebasedonhighendoftherangeprovidedbyCalPERS. More information is not available until the City's actuarial is completed in August.
[3] Based on existing debt service schedules . Does not assume any refinanc¡ng opportunity.
Expense Category FY 17t18 FY 18/19 FY 19/20 FY 20t21 FY 2',t22 Fy 22t23
x
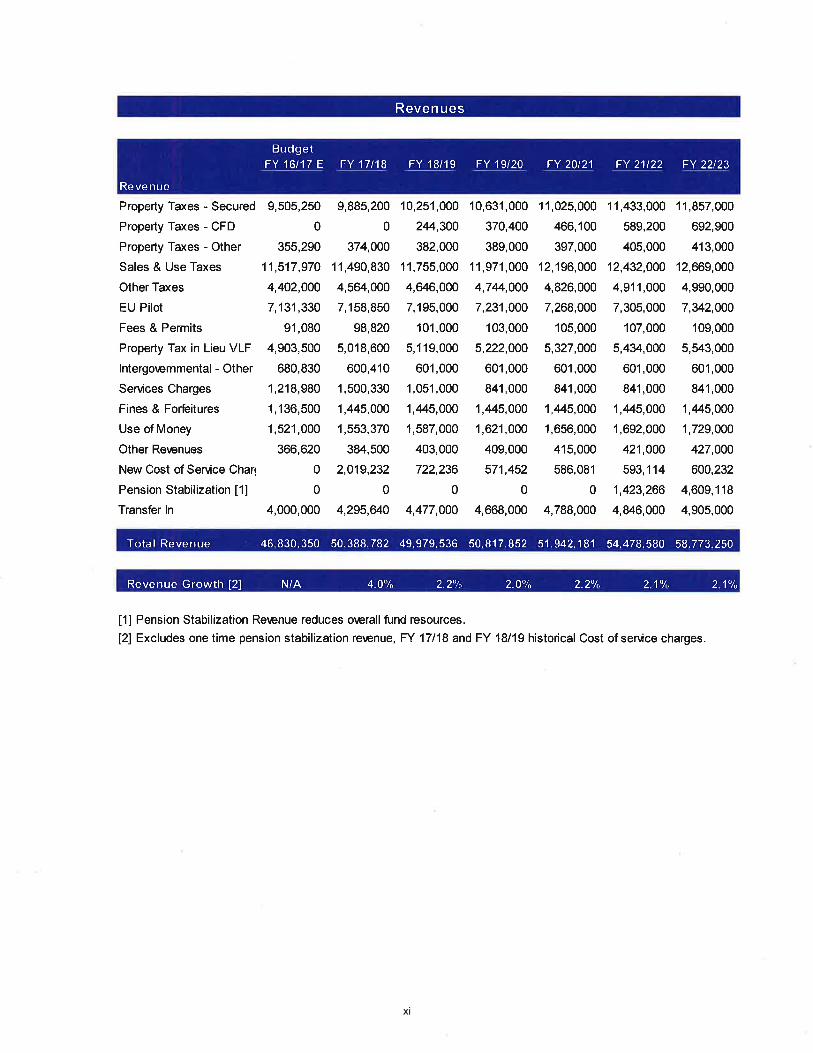
Revenues
BudgetFY 16117 E FY 17118
Revenue
FY 18/19 FY 19t20 FY 20t21 ÍJ]1t?2 F_Y 2?.2jJ
Property Taxes - Secured 9,505,250
Property Taxes - CFD 0
Property Taxes - Other 355,290
Sales & Use Taxes 11,517,970
Other Taxes 4,402,000
EU Pilot 7,131,330
Fees & Permits 91,080
Property Tax in Lieu VLF 4,903,500
lntergorcmmental-Other 680,830
Services Charges 1,218,980
Fines & Forfeitures 1,136,500
Use of Money 1,521,000
Other Rercnues 366,620
New Cost of Service Charl 0
Pension Stabilization [1] 0
Transfer ln 4,000,000
9,885,200
0
374,000
11,490,830
4,5ô4,000
7,'158,850
98,820
5,018,600
600,410
1,500,330
1,445,000
1,553,370
384,500
2,019,232
0
4,295,640
10,251,000
244,300
382,000
11,755,000
4,646,000
7,195,000
101,000
5,119,000
601,000
1,051 ,000
1,445,000
1,587,000
403,000
722,236
0
4,477,000
10,631,000
370,400
389,000
11,971,000
4,74,000
7,231,000
103,000
5,222,000
601,000
841,000
1,445,000
1,621,000
409,000
571,452
0
4,668,000
11,025,000
466,1 00
397,000
12,196,000
4,826,000
7,268,000
105,000
5,327,000
601,000
841,000
1,¿145,000
1,656,000
415,000
586,081
0
4,788,000
11,433,000
589,200
405,000
12,432,000
4,911,000
7,305,000
107,000
5,434,000
601,000
841,000
1,¿145,000
1,692,000
421,000
593,114
1,423,266
4,846,000
11,857,000
692,900
413,000
12,669,000
4,990,000
7,U2,O00
109,000
5,543,000
601,000
841,000
1,445,000
1,729,000
427,000
600,232
4,609, 1 18
4,905,000
46,830,350 50,388.782 49.979.536 50.817.852 51.942.181 54.478.580 58.773.250Total Revenue
4.OYo 2.2Tn 2.0% 2.2o/. 2.',\o/,, 2.1o/oRevenue Growth [2] N/A
[1] Pension Stabilization Rerenue reduces or,erall fund resources.
[2] Excludes one time pension stabilization revenue, FY 17118 and FY 18/19 historical Cost of sen¡ice charges.
xi
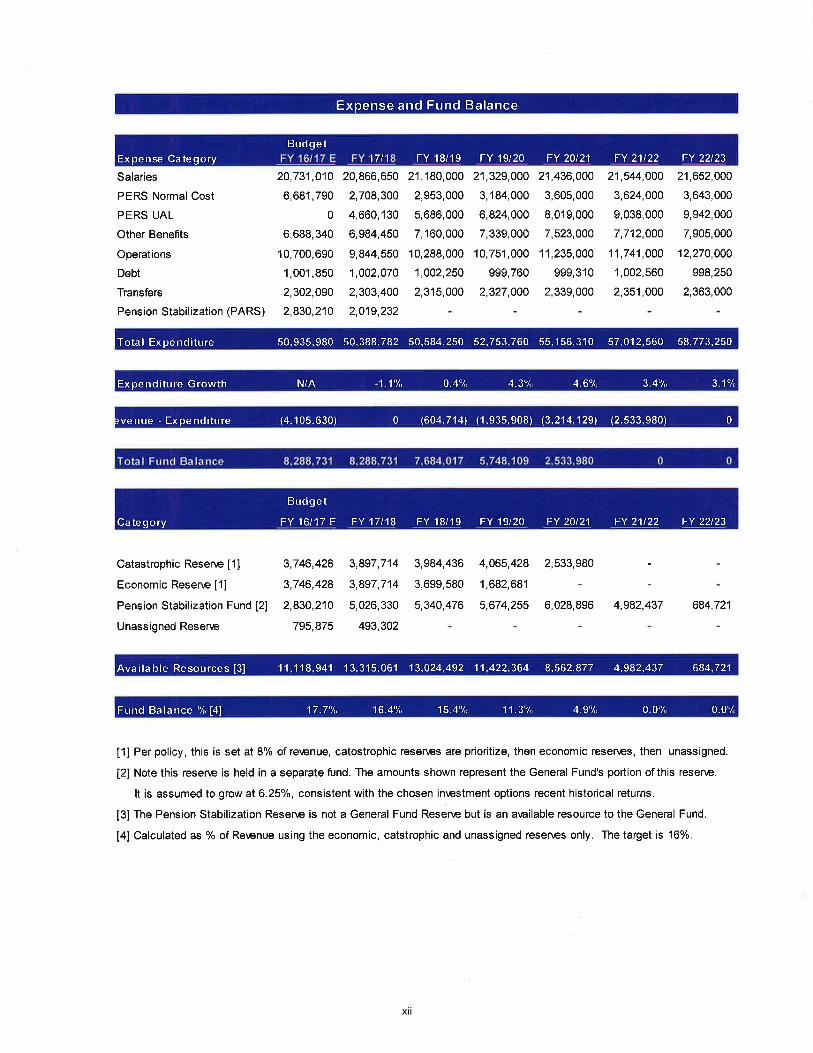
Expense and Fund Balance
FY 18/19 FY 19t20 FY 20t21 FY 21t22 FY 22t23Buclget
17 t1Expense Category
Salaries
PERS Normal Cost
PERS UAL
Other Benefits
Operations
Debt
Transfers
Pension Stabilization (PARS)
20,731,010
6,681,790
0
6,688,340
10,700,690
1,001,850
2,302,090
2,830,210
20,866,650
2,708,300
4,660,130
6,984,450
9,844,550
1,002,070
2,303,400
2,019,232
21,180,000
2,953,000
5,686,000
7,160,000
10,288,000
1,002,250
2,31 5,000
21,329,000
3,184,000
6,824,000
7,339,000
10,751,000
999,760
2,327,000
21,436,000
3,605,000
8,019,000
7,523,000
1't,235,000
999,310
2,339,000
21,544,000
3,624,000
9,038,000
7,712þ00
11,741,000
1,002,560
2,351,000
21,652,000
3,643,000
9,942,000
7,905,000
12,270,000
998,250
2,363,000
Total Expenditure 50.935.980 50.388.782 50.584,250 52.753.760 55.156.310 57.012.560 58.773.250
Experrditure Growth N/A 1.1u/n 4-3'/,, 3.4'/,, 3.1'/oO.4u/n 4.60/,,
)venue - Expenditure (4.105.630) 00 (604,714) (1.935.908) (3.214.1291 (2,533.980)
Fy 16t17 E Fy 17t18 FY 18/19 FY 19t20 FY 20t21 FY 2'1t22 FY 22t23
Buclget
Ca te go ry
Catastrophic Resene [1]
Economic Resene fllPens¡on Stabilization Fund [2]
Unassigned Resene
3,746,428
3,746,428
2,830,210
795,875
3,897,714
3,897,714
5,026,330
493,302
3,984,436
3,699,580
5,340,476
4,065,428 2,533,980
1,682,681
5,674,255 6,028,896 4,982,437 684,721
Available Resources [3] 11.1'18,941 13,315.061 13.024.492 11.422.364 8.562.877 4.982.437 684.721
'17.70/,, 16.4'/,, 15.4"1, 11.3'/" 4.9'/. 0.0% 0.0%Fund Balance "k[4]
[1] Per policy, this is set at 8% of rerenue, catostrophic resenes are prior¡t¡ze, then economic resenes, then unassigned.
[2] Note this resene is held in a separate fund. The amounts shown represent the General Fund's portion of this resenê.
It is assumed to grow at6.250/o, cons¡stent with the chosen in\estment options recent historical returns.
t3l The Pension Stabilization Resenæ is not a General Fund Reserr,e but is an arailable resource to the General Fund.
[4] Calculated as % of Rerenue using the economic, catstrophic and unassigned resenes only. The target is 16%.
xii
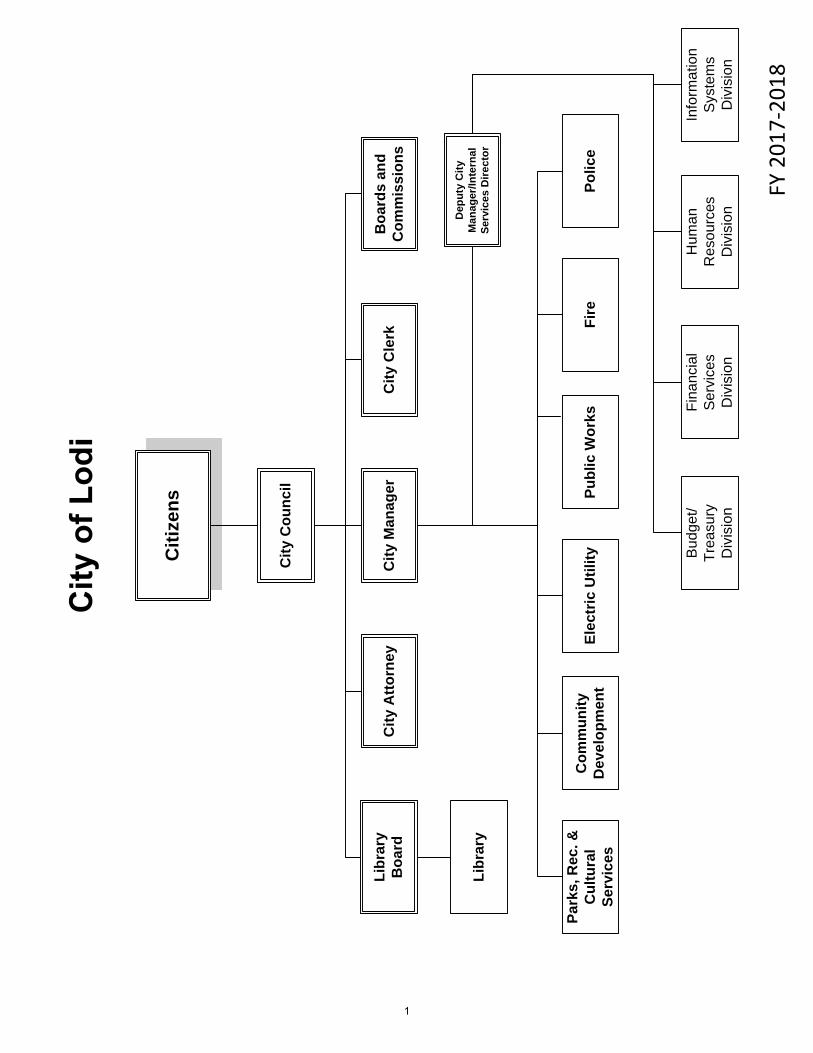
FY 2
017-
2018
Citi
zens
City
Cou
ncil
City
Man
ager
City
Cle
rkC
ity A
ttorn
eyB
oard
s an
dC
omm
issi
ons
Libr
ary
Boa
rd
Libr
ary
Dep
uty
City
M
anag
er/In
tern
al
Serv
ices
Dire
ctor
Fire
Park
s, R
ec. &
C
ultu
ral
Serv
ices
Elec
tric
Util
ityPu
blic
Wor
ksC
omm
unity
D
evel
opm
ent
Polic
e
Fina
ncia
l S
ervi
ces
Div
isio
n
Hum
an
Res
ourc
esD
ivis
ion
Bud
get/
Trea
sury
D
ivis
ion
Info
rmat
ion
Sys
tem
s D
ivis
ion
1

(This page intentionally left blank)
2
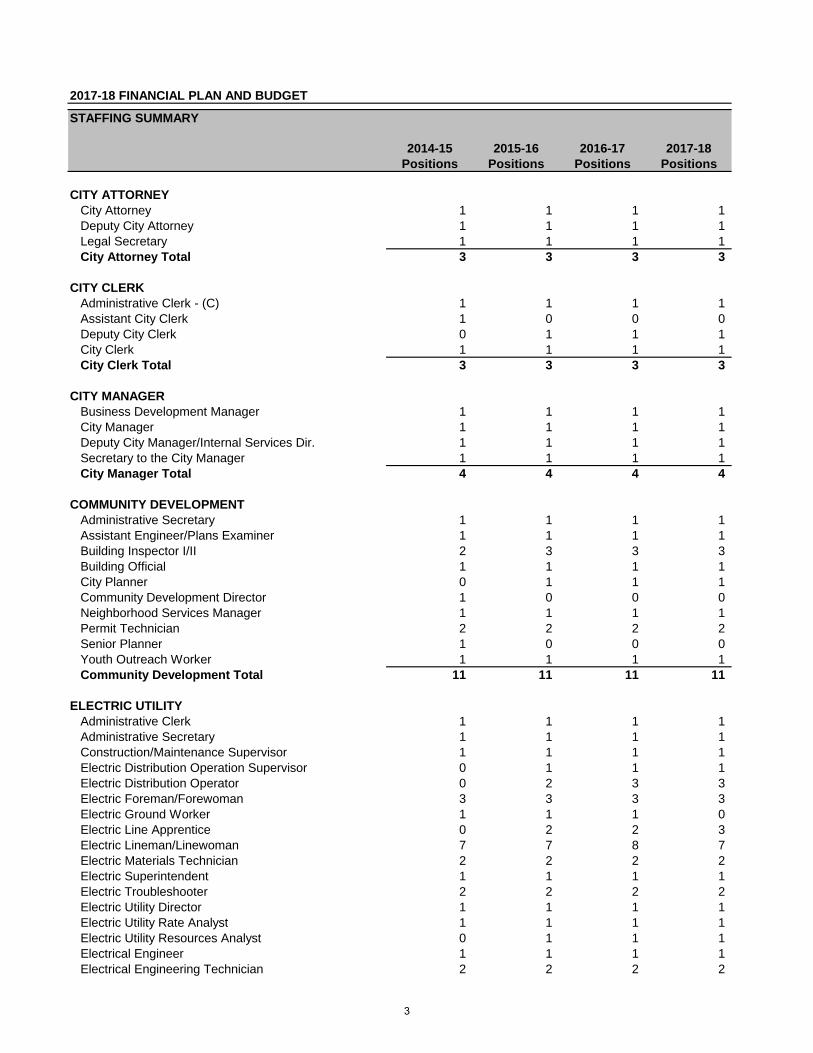
2017-18 FINANCIAL PLAN AND BUDGET
STAFFING SUMMARY
2014-15 2015-16 2016-17 2017-18Positions Positions Positions Positions
CITY ATTORNEYCity Attorney 1 1 1 1Deputy City Attorney 1 1 1 1Legal Secretary 1 1 1 1City Attorney Total 3 3 3 3
CITY CLERKAdministrative Clerk - (C) 1 1 1 1Assistant City Clerk 1 0 0 0Deputy City Clerk 0 1 1 1City Clerk 1 1 1 1City Clerk Total 3 3 3 3
CITY MANAGERBusiness Development Manager 1 1 1 1City Manager 1 1 1 1Deputy City Manager/Internal Services Dir. 1 1 1 1Secretary to the City Manager 1 1 1 1City Manager Total 4 4 4 4
COMMUNITY DEVELOPMENTAdministrative Secretary 1 1 1 1Assistant Engineer/Plans Examiner 1 1 1 1Building Inspector I/II 2 3 3 3Building Official 1 1 1 1City Planner 0 1 1 1Community Development Director 1 0 0 0Neighborhood Services Manager 1 1 1 1Permit Technician 2 2 2 2Senior Planner 1 0 0 0Youth Outreach Worker 1 1 1 1Community Development Total 11 11 11 11
ELECTRIC UTILITYAdministrative Clerk 1 1 1 1Administrative Secretary 1 1 1 1Construction/Maintenance Supervisor 1 1 1 1Electric Distribution Operation Supervisor 0 1 1 1Electric Distribution Operator 0 2 3 3Electric Foreman/Forewoman 3 3 3 3Electric Ground Worker 1 1 1 0Electric Line Apprentice 0 2 2 3Electric Lineman/Linewoman 7 7 8 7Electric Materials Technician 2 2 2 2Electric Superintendent 1 1 1 1Electric Troubleshooter 2 2 2 2Electric Utility Director 1 1 1 1Electric Utility Rate Analyst 1 1 1 1Electric Utility Resources Analyst 0 1 1 1Electrical Engineer 1 1 1 1Electrical Engineering Technician 2 2 2 2
3
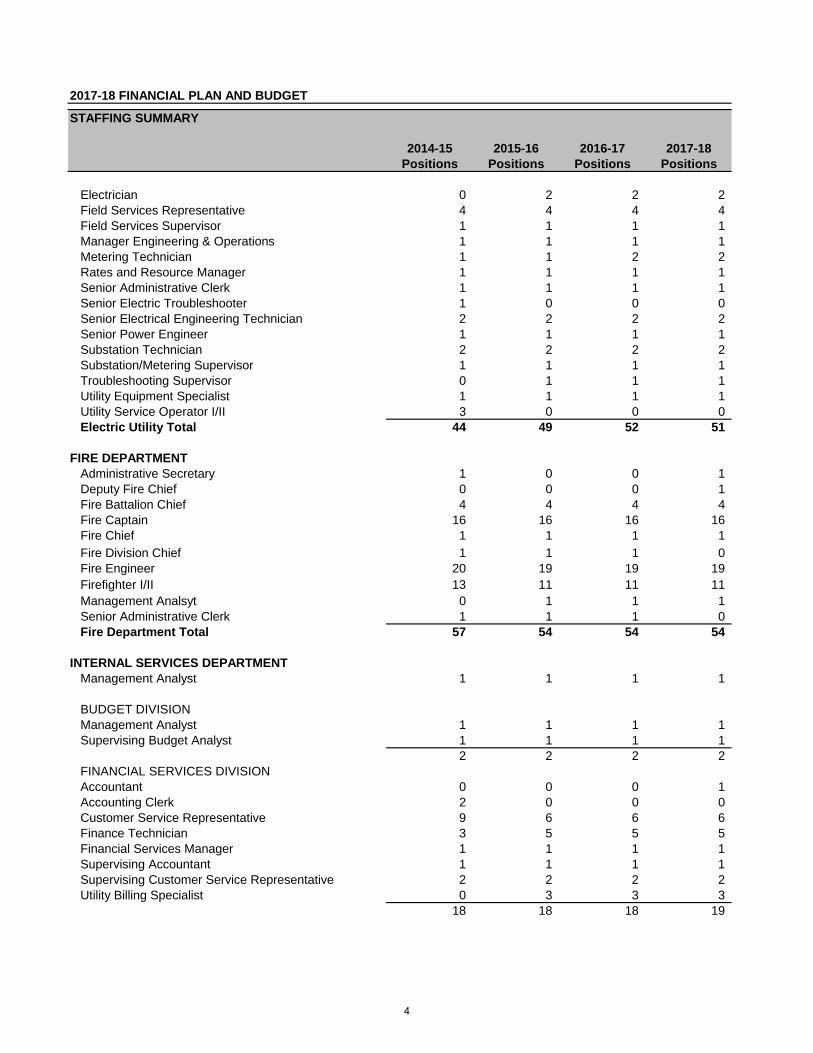
2017-18 FINANCIAL PLAN AND BUDGET
STAFFING SUMMARY
2014-15 2015-16 2016-17 2017-18Positions Positions Positions Positions
Electrician 0 2 2 2Field Services Representative 4 4 4 4Field Services Supervisor 1 1 1 1Manager Engineering & Operations 1 1 1 1Metering Technician 1 1 2 2Rates and Resource Manager 1 1 1 1Senior Administrative Clerk 1 1 1 1Senior Electric Troubleshooter 1 0 0 0Senior Electrical Engineering Technician 2 2 2 2Senior Power Engineer 1 1 1 1Substation Technician 2 2 2 2Substation/Metering Supervisor 1 1 1 1Troubleshooting Supervisor 0 1 1 1Utility Equipment Specialist 1 1 1 1Utility Service Operator I/II 3 0 0 0Electric Utility Total 44 49 52 51
FIRE DEPARTMENTAdministrative Secretary 1 0 0 1Deputy Fire Chief 0 0 0 1Fire Battalion Chief 4 4 4 4Fire Captain 16 16 16 16Fire Chief 1 1 1 1Fire Division Chief 1 1 1 0Fire Engineer 20 19 19 19Firefighter I/II 13 11 11 11Management Analsyt 0 1 1 1Senior Administrative Clerk 1 1 1 0Fire Department Total 57 54 54 54
INTERNAL SERVICES DEPARTMENTManagement Analyst 1 1 1 1
BUDGET DIVISIONManagement Analyst 1 1 1 1Supervising Budget Analyst 1 1 1 1
2 2 2 2FINANCIAL SERVICES DIVISIONAccountant 0 0 0 1Accounting Clerk 2 0 0 0Customer Service Representative 9 6 6 6Finance Technician 3 5 5 5Financial Services Manager 1 1 1 1Supervising Accountant 1 1 1 1Supervising Customer Service Representative 2 2 2 2Utility Billing Specialist 0 3 3 3
18 18 18 19
4
2017-18 FINANCIAL PLAN AND BUDGET
STAFFING SUMMARY
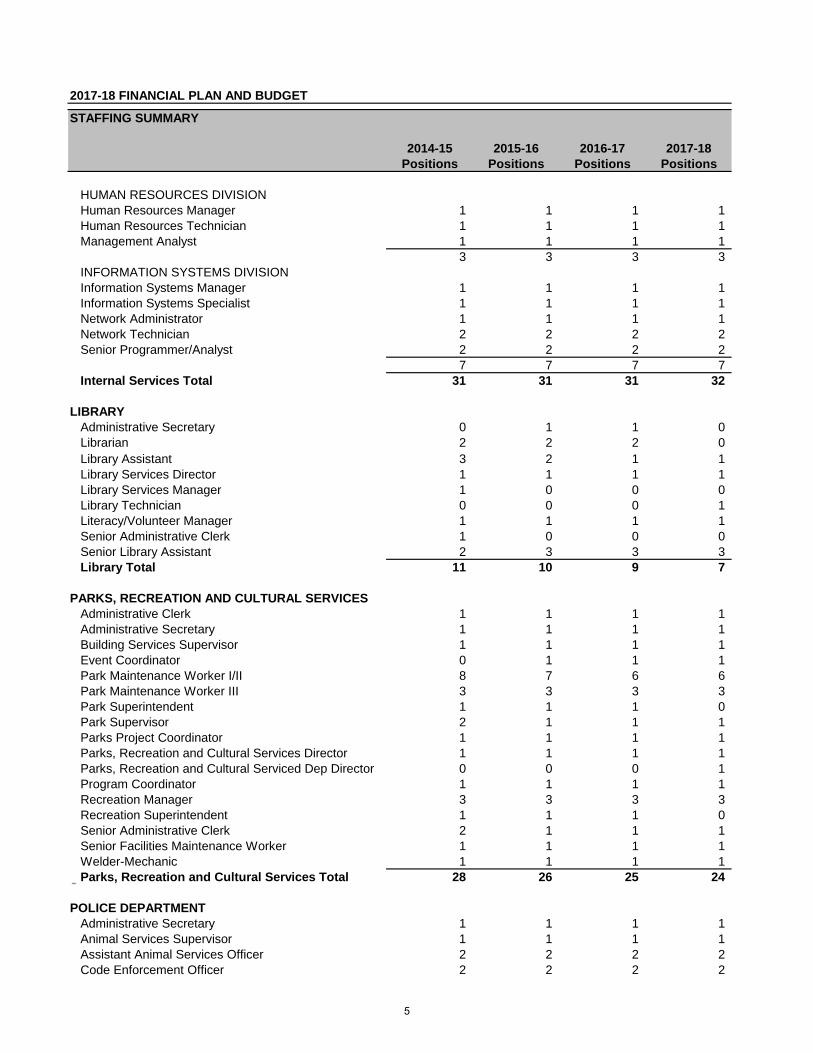
2014-15 2015-16 2016-17 2017-18Positions Positions Positions Positions
HUMAN RESOURCES DIVISIONHuman Resources Manager 1 1 1 1Human Resources Technician 1 1 1 1Management Analyst 1 1 1 1
3 3 3 3INFORMATION SYSTEMS DIVISIONInformation Systems Manager 1 1 1 1Information Systems Specialist 1 1 1 1Network Administrator 1 1 1 1Network Technician 2 2 2 2Senior Programmer/Analyst 2 2 2 2
7 7 7 7Internal Services Total 31 31 31 32
LIBRARYAdministrative Secretary 0 1 1 0Librarian 2 2 2 0Library Assistant 3 2 1 1Library Services Director 1 1 1 1Library Services Manager 1 0 0 0Library Technician 0 0 0 1Literacy/Volunteer Manager 1 1 1 1Senior Administrative Clerk 1 0 0 0Senior Library Assistant 2 3 3 3Library Total 11 10 9 7
PARKS, RECREATION AND CULTURAL SERVICESAdministrative Clerk 1 1 1 1Administrative Secretary 1 1 1 1Building Services Supervisor 1 1 1 1Event Coordinator 0 1 1 1Park Maintenance Worker I/II 8 7 6 6Park Maintenance Worker III 3 3 3 3Park Superintendent 1 1 1 0Park Supervisor 2 1 1 1Parks Project Coordinator 1 1 1 1Parks, Recreation and Cultural Services Director 1 1 1 1Parks, Recreation and Cultural Serviced Dep Director 0 0 0 1Program Coordinator 1 1 1 1Recreation Manager 3 3 3 3Recreation Superintendent 1 1 1 0Senior Administrative Clerk 2 1 1 1Senior Facilities Maintenance Worker 1 1 1 1Welder-Mechanic 1 1 1 1Parks, Recreation and Cultural Services Total 28 26 25 24
POLICE DEPARTMENTAdministrative Secretary 1 1 1 1Animal Services Supervisor 1 1 1 1Assistant Animal Services Officer 2 2 2 2Code Enforcement Officer 2 2 2 2
5
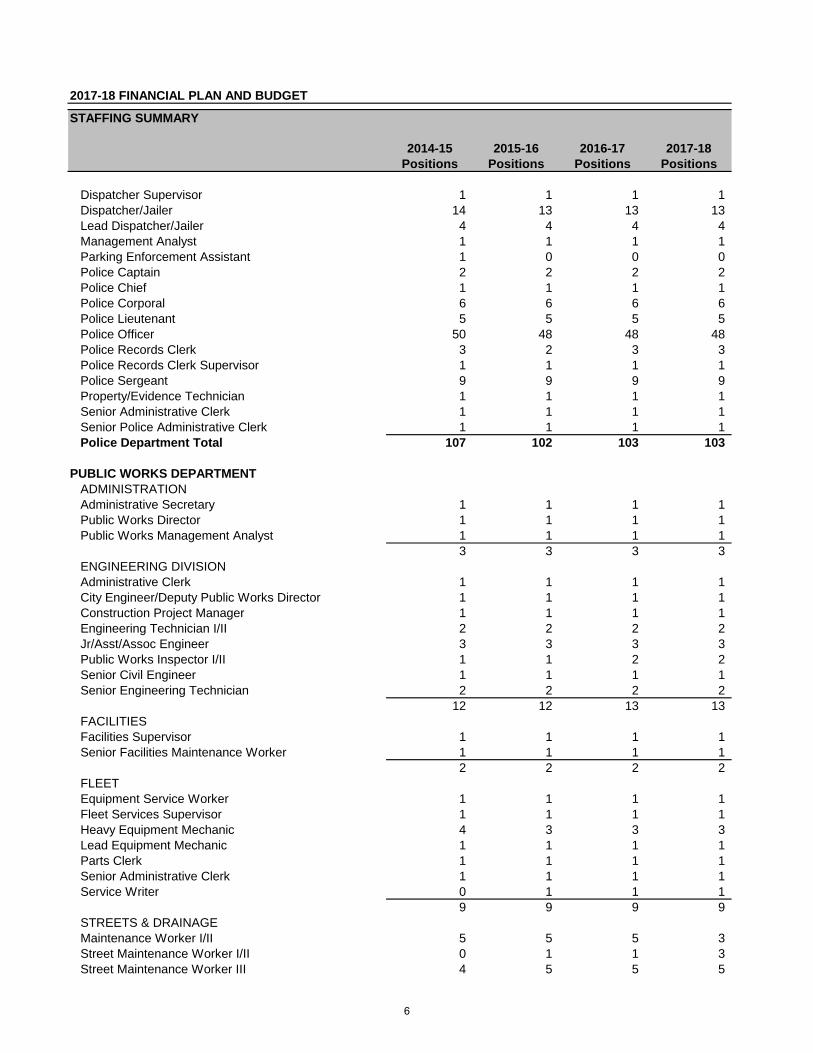
2017-18 FINANCIAL PLAN AND BUDGET
STAFFING SUMMARY
2014-15 2015-16 2016-17 2017-18Positions Positions Positions Positions
Dispatcher Supervisor 1 1 1 1Dispatcher/Jailer 14 13 13 13Lead Dispatcher/Jailer 4 4 4 4Management Analyst 1 1 1 1Parking Enforcement Assistant 1 0 0 0Police Captain 2 2 2 2Police Chief 1 1 1 1Police Corporal 6 6 6 6Police Lieutenant 5 5 5 5Police Officer 50 48 48 48Police Records Clerk 3 2 3 3Police Records Clerk Supervisor 1 1 1 1Police Sergeant 9 9 9 9Property/Evidence Technician 1 1 1 1Senior Administrative Clerk 1 1 1 1Senior Police Administrative Clerk 1 1 1 1Police Department Total 107 102 103 103
PUBLIC WORKS DEPARTMENTADMINISTRATIONAdministrative Secretary 1 1 1 1Public Works Director 1 1 1 1Public Works Management Analyst 1 1 1 1
3 3 3 3ENGINEERING DIVISIONAdministrative Clerk 1 1 1 1City Engineer/Deputy Public Works Director 1 1 1 1Construction Project Manager 1 1 1 1Engineering Technician I/II 2 2 2 2Jr/Asst/Assoc Engineer 3 3 3 3Public Works Inspector I/II 1 1 2 2Senior Civil Engineer 1 1 1 1Senior Engineering Technician 2 2 2 2
12 12 13 13FACILITIESFacilities Supervisor 1 1 1 1Senior Facilities Maintenance Worker 1 1 1 1
2 2 2 2FLEETEquipment Service Worker 1 1 1 1Fleet Services Supervisor 1 1 1 1Heavy Equipment Mechanic 4 3 3 3Lead Equipment Mechanic 1 1 1 1Parts Clerk 1 1 1 1Senior Administrative Clerk 1 1 1 1Service Writer 0 1 1 1
9 9 9 9STREETS & DRAINAGEMaintenance Worker I/II 5 5 5 3Street Maintenance Worker I/II 0 1 1 3Street Maintenance Worker III 4 5 5 5
6
2017-18 FINANCIAL PLAN AND BUDGET
STAFFING SUMMARY
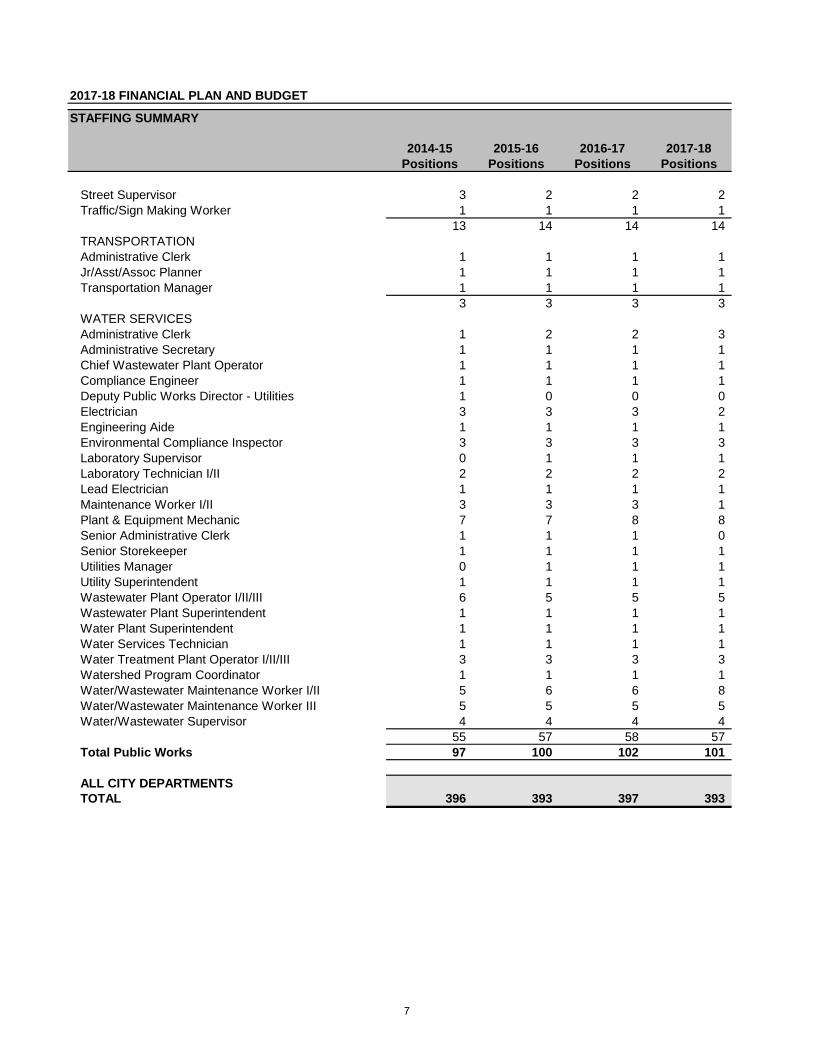
2014-15 2015-16 2016-17 2017-18Positions Positions Positions Positions
Street Supervisor 3 2 2 2Traffic/Sign Making Worker 1 1 1 1
13 14 14 14TRANSPORTATIONAdministrative Clerk 1 1 1 1Jr/Asst/Assoc Planner 1 1 1 1Transportation Manager 1 1 1 1
3 3 3 3WATER SERVICES Administrative Clerk 1 2 2 3Administrative Secretary 1 1 1 1Chief Wastewater Plant Operator 1 1 1 1Compliance Engineer 1 1 1 1Deputy Public Works Director - Utilities 1 0 0 0Electrician 3 3 3 2Engineering Aide 1 1 1 1Environmental Compliance Inspector 3 3 3 3Laboratory Supervisor 0 1 1 1Laboratory Technician I/II 2 2 2 2Lead Electrician 1 1 1 1Maintenance Worker I/II 3 3 3 1Plant & Equipment Mechanic 7 7 8 8Senior Administrative Clerk 1 1 1 0Senior Storekeeper 1 1 1 1Utilities Manager 0 1 1 1Utility Superintendent 1 1 1 1Wastewater Plant Operator I/II/III 6 5 5 5Wastewater Plant Superintendent 1 1 1 1Water Plant Superintendent 1 1 1 1Water Services Technician 1 1 1 1Water Treatment Plant Operator I/II/III 3 3 3 3Watershed Program Coordinator 1 1 1 1Water/Wastewater Maintenance Worker I/II 5 6 6 8Water/Wastewater Maintenance Worker III 5 5 5 5Water/Wastewater Supervisor 4 4 4 4
55 57 58 57Total Public Works 97 100 102 101
ALL CITY DEPARTMENTSTOTAL 396 393 397 393
7

(This page intentionally left blank)
8
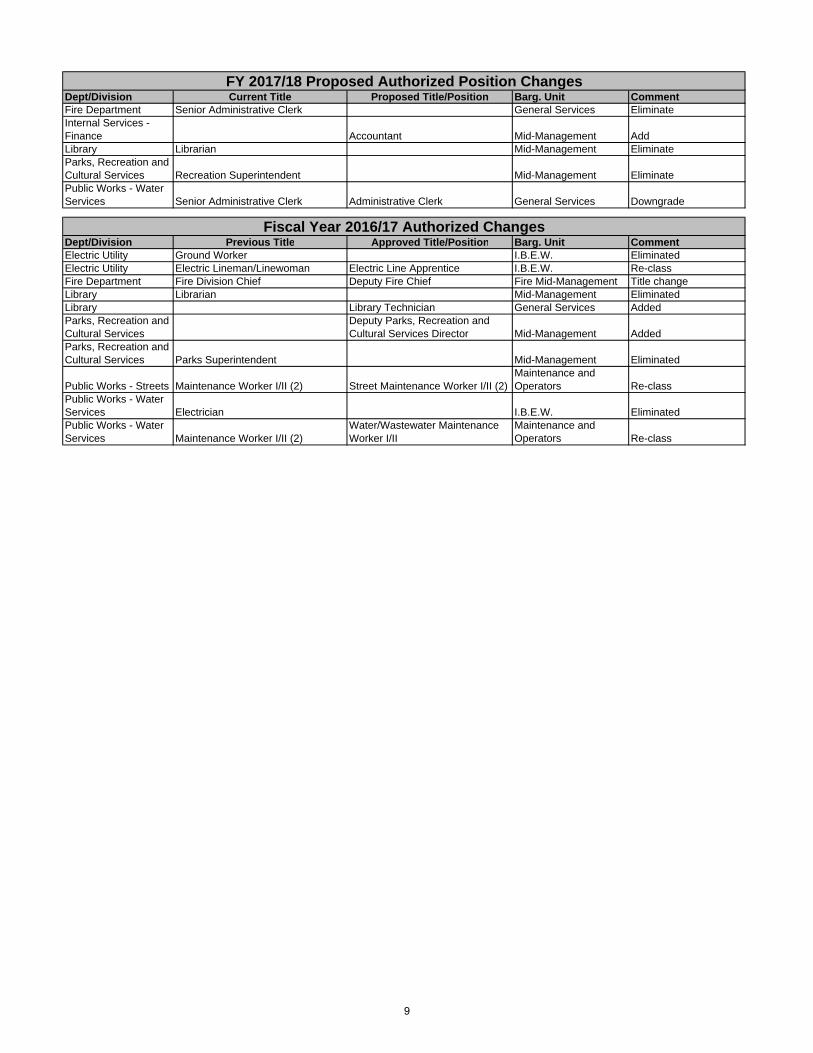
Dept/Division Current Title Proposed Title/Position Barg. Unit CommentFire Department Senior Administrative Clerk General Services EliminateInternal Services - Finance Accountant Mid-Management AddLibrary Librarian Mid-Management EliminateParks, Recreation and Cultural Services Recreation Superintendent Mid-Management EliminatePublic Works - Water Services Senior Administrative Clerk Administrative Clerk General Services Downgrade
Dept/Division Previous Title Approved Title/Position Barg. Unit CommentElectric Utility Ground Worker I.B.E.W. EliminatedElectric Utility Electric Lineman/Linewoman Electric Line Apprentice I.B.E.W. Re-classFire Department Fire Division Chief Deputy Fire Chief Fire Mid-Management Title changeLibrary Librarian Mid-Management EliminatedLibrary Library Technician General Services AddedParks, Recreation and Cultural Services
Deputy Parks, Recreation and Cultural Services Director Mid-Management Added
Parks, Recreation and Cultural Services Parks Superintendent Mid-Management Eliminated
Public Works - Streets Maintenance Worker I/II (2) Street Maintenance Worker I/II (2)Maintenance and Operators Re-class
Public Works - Water Services Electrician I.B.E.W. EliminatedPublic Works - Water Services Maintenance Worker I/II (2)
Water/Wastewater Maintenance Worker I/II
Maintenance and Operators Re-class
FY 2017/18 Proposed Authorized Position Changes
Fiscal Year 2016/17 Authorized Changes
9

(This page intentionally left blank)
10
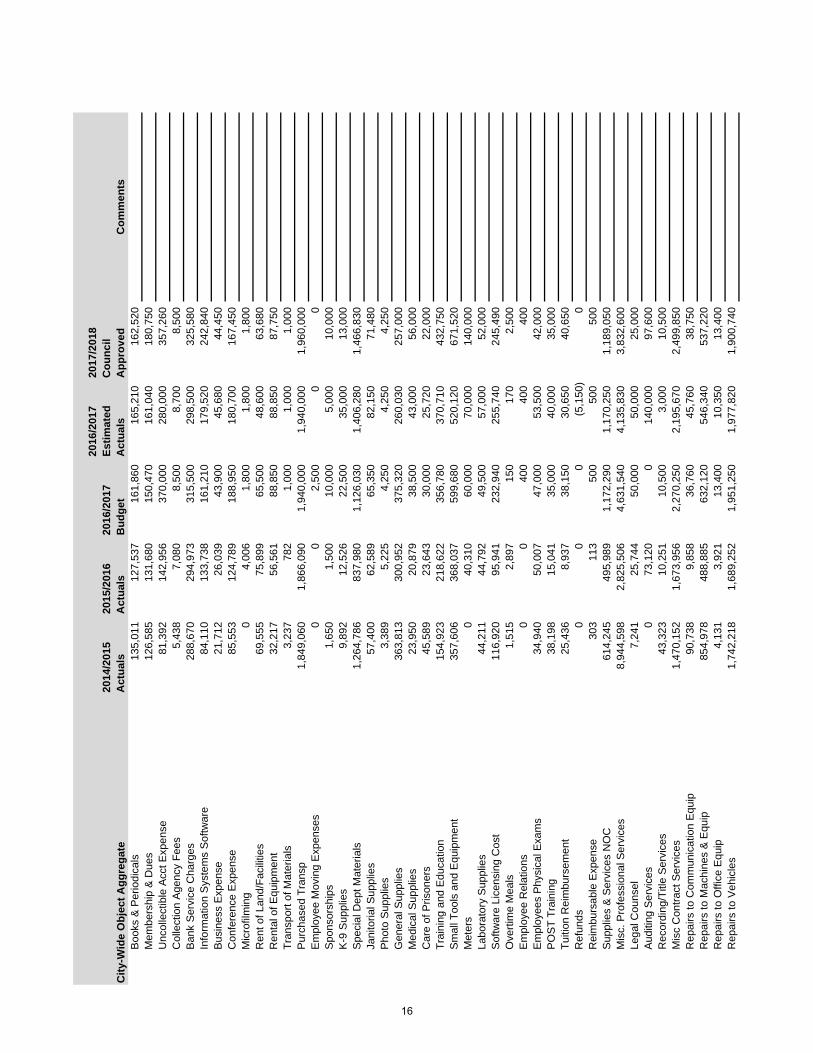
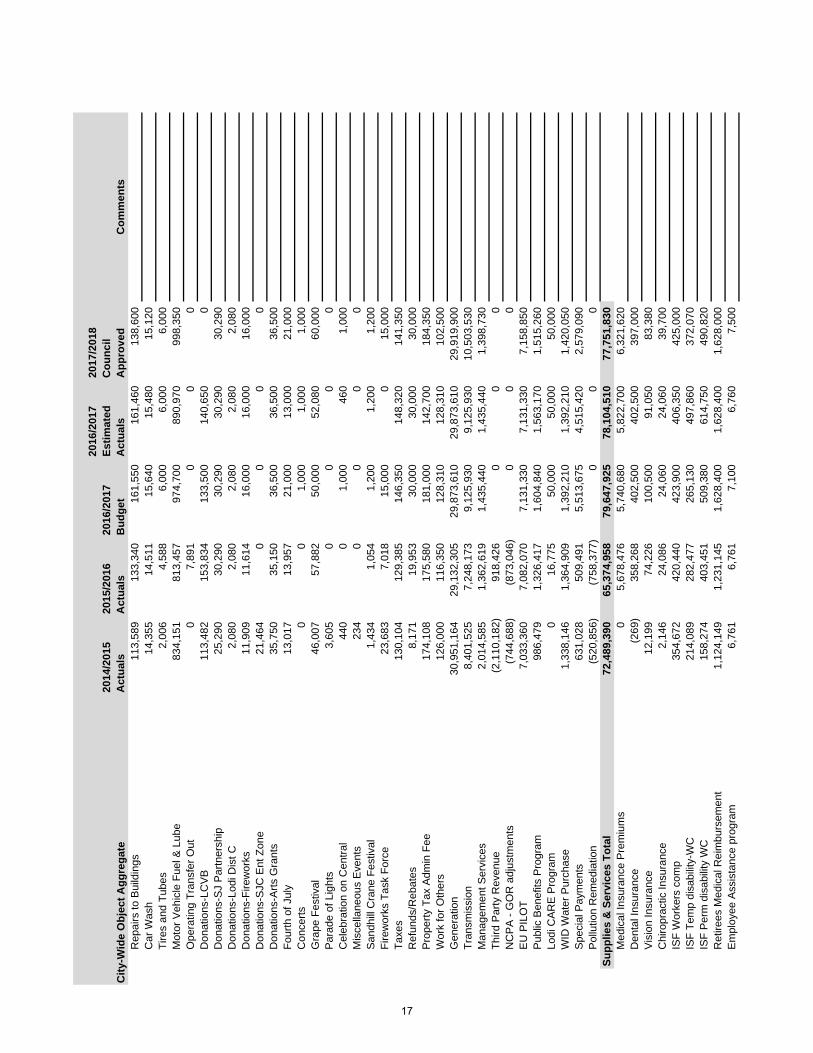
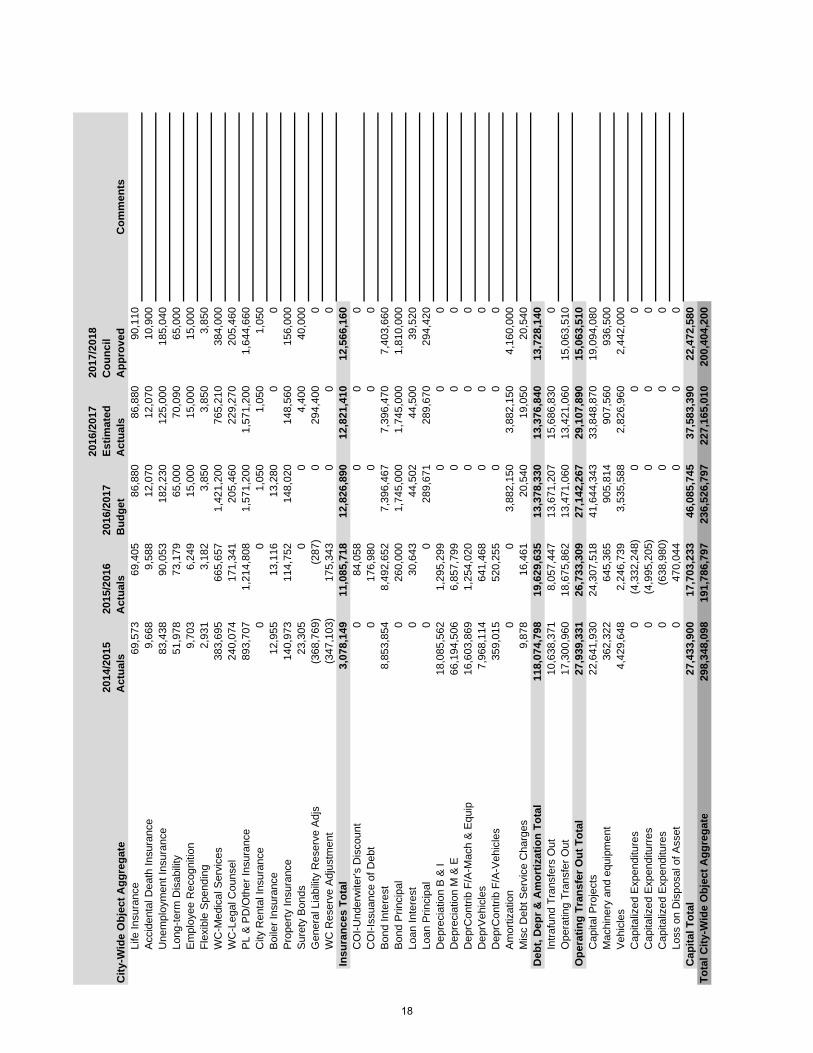
ALL FUNDS All City of Lodi funds project total revenues of $204,699,940 in the fiscal year beginning July 1, 2017, and expenditures of $200,404,200. The Electric Fund is the City’s largest, with $73,996,630 in projected revenue and $74,784,690 in expenses. The Electric Fund covers the activities of the Lodi Electric Utility, which provides electricity within the Lodi city limits. The General Fund projects revenues and expenditures of $50,388,780 in the fiscal year. The General Fund supports most of the City’s discretionary programs, such as Police, Fire and administrative functions. The All Funds figures overstate the City’s actual revenue and spending. For example, $1 received by the Electric Utility and transferred to the General Fund to support general City services is counted by both funds as $1 received and $1 expended. The following pages provide a detailed description of the City of Lodi’s funds, including organizational charts, narrative summaries of the various activities and financial tables.
11
(This page intentionally left blank)
12
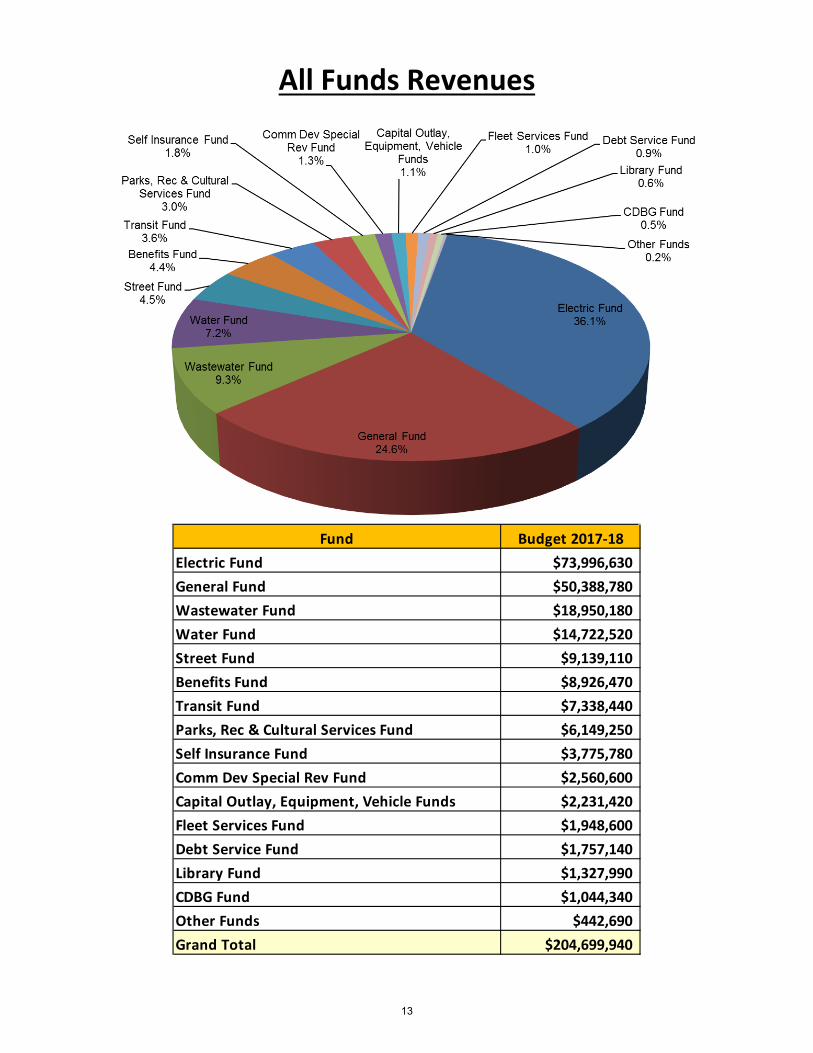
All Funds Revenues
Fund Budget 2017-18Electric Fund $73,996,630General Fund $50,388,780Wastewater Fund $18,950,180Water Fund $14,722,520Street Fund $9,139,110Benefits Fund $8,926,470Transit Fund $7,338,440Parks, Rec & Cultural Services Fund $6,149,250Self Insurance Fund $3,775,780Comm Dev Special Rev Fund $2,560,600Capital Outlay, Equipment, Vehicle Funds $2,231,420Fleet Services Fund $1,948,600Debt Service Fund $1,757,140Library Fund $1,327,990CDBG Fund $1,044,340Other Funds $442,690Grand Total $204,699,940
13
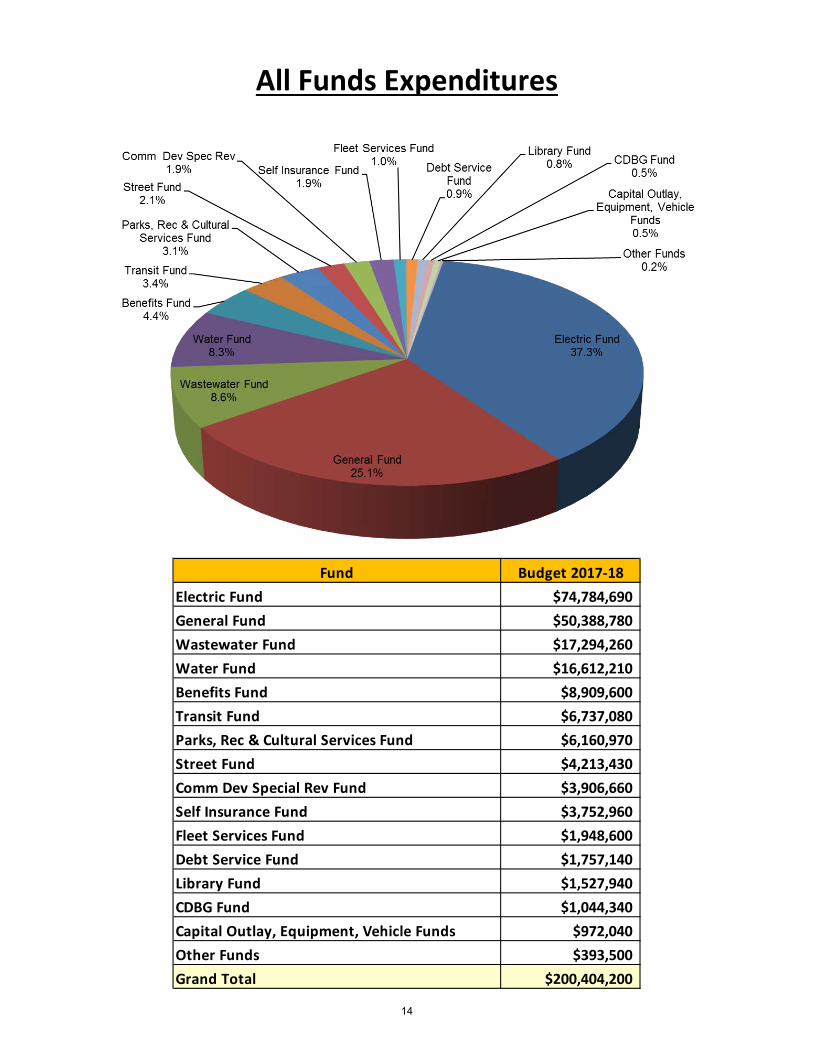
All Funds Expenditures
Fund Budget 2017-18Electric Fund $74,784,690General Fund $50,388,780Wastewater Fund $17,294,260Water Fund $16,612,210Benefits Fund $8,909,600Transit Fund $6,737,080Parks, Rec & Cultural Services Fund $6,160,970Street Fund $4,213,430Comm Dev Special Rev Fund $3,906,660Self Insurance Fund $3,752,960Fleet Services Fund $1,948,600Debt Service Fund $1,757,140Library Fund $1,527,940CDBG Fund $1,044,340Capital Outlay, Equipment, Vehicle Funds $972,040Other Funds $393,500Grand Total $200,404,200
14
2014
/201
5 A
ctua
ls20
15/2
016
Act
uals
2016
/201
7 B
udge
t
2016
/201
7 Es
timat
ed
Act
uals
2017
/201
8 C
ounc
il A
ppro
ved
Com
men
tsR
egul
ar E
mpl
oyee
Sal
ary
26,8
24,4
6428
,519
,840
30,9
00,6
2029
,475
,130
30,7
03,2
50O
verti
me
2,04
2,82
62,
509,
628
2,40
0,62
03,
266,
710
2,65
8,33
0P
art-t
ime
Sal
ary
2,19
1,95
72,
161,
872
2,41
5,30
02,
404,
130
2,58
0,10
0C
ontra
ct E
mpl
oyee
sal
ary
7,53
80
00
0Lo
ngev
ity P
ay
013
8,00
013
0,50
012
9,00
016
2,00
0U
nifo
rm A
llow
ance
15
8,60
316
5,92
817
7,40
017
5,05
017
7,75
0M
eal A
llow
ance
69
65,
693
8,00
011
,890
5,75
0In
cent
ive
Pay
82
1,34
474
8,62
275
5,41
075
5,89
081
1,45
0A
dmin
Lea
ve P
ay
80,0
3821
6,51
431
6,50
031
5,60
032
0,41
0W
orke
rs C
ompe
nsat
ion
1,58
5,10
01,
592,
780
2,14
2,52
02,
142,
520
2,16
4,17
0M
edic
al In
sura
nce
5,59
3,07
25,
525,
912
6,14
0,23
05,
822,
070
5,98
9,53
0D
enta
l Ins
uran
ce
350,
700
332,
144
402,
500
367,
310
397,
000
Vis
ion
Insu
ranc
e 91
,704
78,0
3310
0,50
088
,290
83,3
80M
edic
are
Insu
ranc
e 45
1,31
148
9,06
353
2,28
053
7,23
053
6,04
0S
ervi
ce C
ontri
butio
n-P
ER
S
7,24
7,88
96,
055,
845
9,78
6,04
09,
390,
530
3,69
7,37
0U
nfun
ded
Acc
Lia
bilit
y - P
ER
S
00
00
6,56
8,66
0D
efer
red
Com
p 59
6,45
963
6,54
863
8,85
066
3,68
073
2,38
0LI
& A
D &
D
109,
483
87,0
6598
,950
98,4
1010
1,48
0U
nem
ploy
men
t Ins
uran
ce
152,
341
161,
480
182,
230
177,
370
184,
530
LTD
40
,885
59,9
9613
8,83
013
8,39
098
,790
Chi
ropr
actic
21
,994
26,8
8524
,060
34,9
9039
,700
Med
ical
In-li
eu
58,1
930
00
0O
ther
Ben
efits
1,
543,
050
1,58
2,18
91,
714,
850
1,71
4,85
02,
014,
770
Cel
l Stip
end
33,7
3743
,336
58,1
0049
,300
41,6
00P
erso
nnel
Tra
nsfe
r Rec
over
y (5
,385
,365
)(5
,862
,745
)(6
,788
,400
)(6
,775
,490
)(6
,863
,170
)P
erso
nnel
Tra
nsfe
r Cha
rges
4,
714,
512
5,30
5,20
75,
169,
750
5,18
8,12
05,
616,
710
Com
pens
ated
Abs
ence
Exp
ense
0
680,
111
00
0Sa
larie
s &
Ben
efits
Tot
al49
,332
,531
51,2
59,9
4557
,445
,640
56,1
70,9
7058
,821
,980
Pos
tage
22
7,76
822
8,81
727
9,48
021
9,14
024
8,87
0Te
leph
one
237,
039
200,
780
190,
300
244,
450
208,
520
Cel
lula
r pho
ne c
harg
es
60,1
4162
,507
61,4
3070
,610
113,
320
Pag
ers
175
163
150
100
0E
lect
ricity
1,
870,
220
1,80
1,88
51,
971,
100
1,96
6,31
01,
855,
590
Gas
16
0,17
314
3,54
615
3,42
014
3,42
016
5,25
0W
ater
34
1,81
341
5,83
634
9,84
043
5,10
043
2,17
0S
ewer
66
,987
68,8
8469
,250
70,8
4070
,540
Ref
use
38,4
2758
,209
40,0
0055
,000
50,0
00P
rintin
g/B
indi
ng/D
uplic
atio
n 78
,070
78,0
4911
1,30
010
2,56
098
,500
Pho
toco
pyin
g 30
,984
44,6
2251
,330
52,7
9050
,220
Adv
ertis
ing
49,5
9257
,837
115,
500
112,
200
108,
150
Laun
dry
& D
ry C
lean
ing
15,8
9527
,372
29,6
0031
,140
29,8
60U
nifo
rms
93,0
8690
,907
126,
710
117,
850
131,
560
Saf
ety
Equ
ipm
ent
288,
762
503,
007
493,
060
486,
310
373,
220
Offi
ce S
uppl
ies
150,
135
136,
238
167,
100
163,
390
158,
650
City
-Wid
e O
bjec
t Agg
rega
te
15
2014
/201
5 A
ctua
ls20
15/2
016
Act
uals
2016
/201
7 B
udge
t
2016
/201
7 Es
timat
ed
Act
uals
2017
/201
8 C
ounc
il A
ppro
ved
Com
men
tsC
ity-W
ide
Obj
ect A
ggre
gate
Boo
ks &
Per
iodi
cals
13
5,01
112
7,53
716
1,86
016
5,21
016
2,52
0M
embe
rshi
p &
Due
s 12
6,58
513
1,68
015
0,47
016
1,04
018
0,75
0U
ncol
lect
ible
Acc
t Exp
ense
81
,392
142,
956
370,
000
280,
000
357,
260
Col
lect
ion
Age
ncy
Fees
5,
438
7,08
08,
500
8,70
08,
500
Ban
k S
ervi
ce C
harg
es
288,
670
294,
973
315,
500
298,
500
325,
580
Info
rmat
ion
Sys
tem
s S
oftw
are
84,1
1013
3,73
816
1,21
017
9,52
024
2,84
0B
usin
ess
Exp
ense
21
,712
26,0
3943
,900
45,6
8044
,450
Con
fere
nce
Exp
ense
85
,553
124,
789
188,
950
180,
700
167,
450
Mic
rofil
min
g 0
4,00
61,
800
1,80
01,
800
Ren
t of L
and/
Faci
litie
s 69
,555
75,8
9965
,500
48,6
0063
,680
Ren
tal o
f Equ
ipm
ent
32,2
1756
,561
88,8
5088
,850
87,7
50Tr
ansp
ort o
f Mat
eria
ls
3,23
778
21,
000
1,00
01,
000
Pur
chas
ed T
rans
p 1,
849,
060
1,86
6,09
01,
940,
000
1,94
0,00
01,
960,
000
Em
ploy
ee M
ovin
g E
xpen
ses
00
2,50
00
0S
pons
orsh
ips
1,65
01,
500
10,0
005,
000
10,0
00K
-9 S
uppl
ies
9,89
212
,526
22,5
0035
,000
13,0
00S
peci
al D
ept M
ater
ials
1,
264,
786
837,
980
1,12
6,03
01,
406,
280
1,46
6,83
0Ja
nito
rial S
uppl
ies
57,4
0062
,589
65,3
5082
,150
71,4
80P
hoto
Sup
plie
s 3,
389
5,22
54,
250
4,25
04,
250
Gen
eral
Sup
plie
s 36
3,81
330
0,95
237
5,32
026
0,03
025
7,00
0M
edic
al S
uppl
ies
23,9
5020
,879
38,5
0043
,000
56,0
00C
are
of P
rison
ers
45,5
8923
,643
30,0
0025
,720
22,0
00Tr
aini
ng a
nd E
duca
tion
154,
923
218,
622
356,
780
370,
710
432,
750
Sm
all T
ools
and
Equ
ipm
ent
357,
606
368,
037
599,
680
520,
120
671,
520
Met
ers
040
,310
60,0
0070
,000
140,
000
Labo
rato
ry S
uppl
ies
44,2
1144
,792
49,5
0057
,000
52,0
00S
oftw
are
Lice
nsin
g C
ost
116,
920
95,9
4123
2,94
025
5,74
024
5,49
0O
verti
me
Mea
ls
1,51
52,
897
150
170
2,50
0E
mpl
oyee
Rel
atio
ns
00
400
400
400
Em
ploy
ees
Phy
sica
l Exa
ms
34,9
4050
,007
47,0
0053
,500
42,0
00P
OS
T Tr
aini
ng
38,1
9815
,041
35,0
0040
,000
35,0
00Tu
ition
Rei
mbu
rsem
ent
25,4
368,
937
38,1
5030
,650
40,6
50R
efun
ds
00
0(5
,150
)0
Rei
mbu
rsab
le E
xpen
se
303
113
500
500
500
Sup
plie
s &
Ser
vice
s N
OC
61
4,24
549
5,98
91,
172,
290
1,17
0,25
01,
189,
050
Mis
c. P
rofe
ssio
nal S
ervi
ces
8,94
4,59
82,
825,
506
4,63
1,54
04,
135,
830
3,83
2,60
0Le
gal C
ouns
el
7,24
125
,744
50,0
0050
,000
25,0
00A
uditi
ng S
ervi
ces
073
,120
014
0,00
097
,600
Rec
ordi
ng/T
itle
Ser
vice
s 43
,323
10,2
5110
,500
3,00
010
,500
Mis
c C
ontra
ct S
ervi
ces
1,47
0,15
21,
673,
956
2,27
0,25
02,
195,
670
2,49
9,85
0R
epai
rs to
Com
mun
icat
ion
Equ
ip
90,7
389,
858
36,7
6045
,760
38,7
50R
epai
rs to
Mac
hine
s &
Equ
ip
854,
978
488,
885
632,
120
546,
340
537,
220
Rep
airs
to O
ffice
Equ
ip
4,13
13,
921
13,4
0010
,350
13,4
00R
epai
rs to
Veh
icle
s 1,
742,
218
1,68
9,25
21,
951,
250
1,97
7,82
01,
900,
740
16
2014
/201
5 A
ctua
ls20
15/2
016
Act
uals
2016
/201
7 B
udge
t
2016
/201
7 Es
timat
ed
Act
uals
2017
/201
8 C
ounc
il A
ppro
ved
Com
men
tsC
ity-W
ide
Obj
ect A
ggre
gate
Rep
airs
to B
uild
ings
11
3,58
913
3,34
016
1,55
016
1,46
013
8,60
0C
ar W
ash
14,3
5514
,511
15,6
4015
,480
15,1
20Ti
res
and
Tube
s 2,
006
4,58
86,
000
6,00
06,
000
Mot
or V
ehic
le F
uel &
Lub
e 83
4,15
181
3,45
797
4,70
089
0,97
099
8,35
0O
pera
ting
Tran
sfer
Out
0
7,89
10
00
Don
atio
ns-L
CV
B
113,
482
153,
834
133,
500
140,
650
0D
onat
ions
-SJ
Par
tner
ship
25
,290
30,2
9030
,290
30,2
9030
,290
Don
atio
ns-L
odi D
ist C
2,
080
2,08
02,
080
2,08
02,
080
Don
atio
ns-F
irew
orks
11
,909
11,6
1416
,000
16,0
0016
,000
Don
atio
ns-S
JC E
nt Z
one
21,4
640
00
0D
onat
ions
-Arts
Gra
nts
35,7
5035
,150
36,5
0036
,500
36,5
00Fo
urth
of J
uly
13,0
1713
,957
21,0
0013
,000
21,0
00C
once
rts
00
1,00
01,
000
1,00
0G
rape
Fes
tival
46
,007
57,8
8250
,000
52,0
8060
,000
Par
ade
of L
ight
s 3,
605
00
00
Cel
ebra
tion
on C
entra
l 44
00
1,00
046
01,
000
Mis
cella
neou
s E
vent
s 23
40
00
0S
andh
ill C
rane
Fes
tival
1,
434
1,05
41,
200
1,20
01,
200
Fire
wor
ks T
ask
Forc
e 23
,683
7,01
815
,000
015
,000
Taxe
s 13
0,10
412
9,38
514
6,35
014
8,32
014
1,35
0R
efun
ds/R
ebat
es
8,17
119
,953
30,0
0030
,000
30,0
00P
rope
rty T
ax A
dmin
Fee
17
4,10
817
5,58
018
1,00
014
2,70
018
4,35
0W
ork
for O
ther
s 12
6,00
011
6,35
012
8,31
012
8,31
010
2,50
0G
ener
atio
n 30
,951
,164
29,1
32,3
0529
,873
,610
29,8
73,6
1029
,919
,900
Tran
smis
sion
8,
401,
525
7,24
8,17
39,
125,
930
9,12
5,93
010
,503
,530
Man
agem
ent S
ervi
ces
2,01
4,58
51,
362,
619
1,43
5,44
01,
435,
440
1,39
8,73
0Th
ird P
arty
Rev
enue
(2
,110
,182
)91
8,42
60
00
NC
PA
- G
OR
adj
ustm
ents
(7
44,6
88)
(873
,046
)0
00
EU
PIL
OT
7,03
3,36
07,
082,
070
7,13
1,33
07,
131,
330
7,15
8,85
0P
ublic
Ben
efits
Pro
gram
98
6,47
91,
326,
417
1,60
4,84
01,
563,
170
1,51
5,26
0Lo
di C
AR
E P
rogr
am
016
,775
50,0
0050
,000
50,0
00W
ID W
ater
Pur
chas
e 1,
338,
146
1,36
4,90
91,
392,
210
1,39
2,21
01,
420,
050
Spe
cial
Pay
men
ts
631,
028
509,
491
5,51
3,67
54,
515,
420
2,57
9,09
0P
ollu
tion
Rem
edia
tion
(520
,856
)(7
58,3
77)
00
0Su
pplie
s &
Ser
vice
s To
tal
72,4
89,3
9065
,374
,958
79,6
47,9
2578
,104
,510
77,7
51,8
30M
edic
al In
sura
nce
Pre
miu
ms
05,
678,
476
5,74
0,68
05,
822,
700
6,32
1,62
0D
enta
l Ins
uran
ce
(269
)35
8,26
840
2,50
040
2,50
039
7,00
0V
isio
n In
sura
nce
12,1
9974
,226
100,
500
91,0
5083
,380
Chi
ropr
actic
Insu
ranc
e 2,
146
24,0
8624
,060
24,0
6039
,700
ISF
Wor
kers
com
p 35
4,67
242
0,44
042
3,90
040
6,35
042
5,00
0IS
F Te
mp
disa
bilit
y-W
C
214,
089
282,
477
265,
130
497,
860
372,
070
ISF
Per
m d
isab
ility
WC
15
8,27
440
3,45
150
9,38
061
4,75
049
0,82
0R
etire
es M
edic
al R
eim
burs
emen
t 1,
124,
149
1,23
1,14
51,
628,
400
1,62
8,40
01,
628,
000
Em
ploy
ee A
ssis
tanc
e pr
ogra
m
6,76
16,
761
7,10
06,
760
7,50
0
17
2014
/201
5 A
ctua
ls20
15/2
016
Act
uals
2016
/201
7 B
udge
t
2016
/201
7 Es
timat
ed
Act
uals
2017
/201
8 C
ounc
il A
ppro
ved
Com
men
tsC
ity-W
ide
Obj
ect A
ggre
gate
Life
Insu
ranc
e 69
,573
69,4
0586
,880
86,8
8090
,110
Acc
iden
tal D
eath
Insu
ranc
e 9,
668
9,58
812
,070
12,0
7010
,900
Une
mpl
oym
ent I
nsur
ance
83
,438
90,0
5318
2,23
012
5,00
018
5,04
0Lo
ng-te
rm D
isab
ility
51
,978
73,1
7965
,000
70,0
9065
,000
Em
ploy
ee R
ecog
nitio
n 9,
703
6,24
915
,000
15,0
0015
,000
Flex
ible
Spe
ndin
g 2,
931
3,18
23,
850
3,85
03,
850
WC
-Med
ical
Ser
vice
s 38
3,69
566
5,65
71,
421,
200
765,
210
384,
000
WC
-Leg
al C
ouns
el
240,
074
171,
341
205,
460
229,
270
205,
460
PL
& P
D/O
ther
Insu
ranc
e 89
3,70
71,
214,
808
1,57
1,20
01,
571,
200
1,64
4,66
0C
ity R
enta
l Ins
uran
ce
00
1,05
01,
050
1,05
0B
oile
r Ins
uran
ce
12,9
5513
,116
13,2
800
0P
rope
rty In
sura
nce
140,
973
114,
752
148,
020
148,
560
156,
000
Sur
ety
Bon
ds
23,3
050
04,
400
40,0
00G
ener
al L
iabi
lity
Res
erve
Adj
s (3
68,7
69)
(287
)0
294,
400
0W
C R
eser
ve A
djus
tmen
t (3
47,1
03)
175,
343
00
0In
sura
nces
Tot
al3,
078,
149
11,0
85,7
1812
,826
,890
12,8
21,4
1012
,566
,160
CO
I-Und
erw
iter's
Dis
coun
t 0
84,0
580
00
CO
I-Iss
uanc
e of
Deb
t 0
176,
980
00
0B
ond
Inte
rest
8,
853,
854
8,49
2,65
27,
396,
467
7,39
6,47
07,
403,
660
Bon
d P
rinci
pal
026
0,00
01,
745,
000
1,74
5,00
01,
810,
000
Loan
Inte
rest
0
30,6
4344
,502
44,5
0039
,520
Loan
Prin
cipa
l 0
028
9,67
128
9,67
029
4,42
0D
epre
ciat
ion
B &
I 18
,085
,562
1,29
5,29
90
00
Dep
reci
atio
n M
& E
66
,194
,506
6,85
7,79
90
00
Dep
rCon
trib
F/A
-Mac
h &
Equ
ip
16,6
03,8
691,
254,
020
00
0D
eprV
ehic
les
7,96
8,11
464
1,46
80
00
Dep
rCon
trib
F/A
-Veh
icle
s 35
9,01
552
0,25
50
00
Am
ortiz
atio
n 0
03,
882,
150
3,88
2,15
04,
160,
000
Mis
c D
ebt S
ervi
ce C
harg
es
9,87
816
,461
20,5
4019
,050
20,5
40D
ebt,
Dep
r & A
mor
tizat
ion
Tota
l11
8,07
4,79
819
,629
,635
13,3
78,3
3013
,376
,840
13,7
28,1
40In
trafu
nd T
rans
fers
Out
10
,638
,371
8,05
7,44
713
,671
,207
15,6
86,8
300
Ope
ratin
g Tr
ansf
er O
ut
17,3
00,9
6018
,675
,862
13,4
71,0
6013
,421
,060
15,0
63,5
10O
pera
ting
Tran
sfer
Out
Tot
al27
,939
,331
26,7
33,3
0927
,142
,267
29,1
07,8
9015
,063
,510
Cap
ital P
roje
cts
22,6
41,9
3024
,307
,518
41,6
44,3
4333
,848
,870
19,0
94,0
80M
achi
nery
and
equ
ipm
ent
362,
322
645,
365
905,
814
907,
560
936,
500
Veh
icle
s 4,
429,
648
2,24
6,73
93,
535,
588
2,82
6,96
02,
442,
000
Cap
italiz
ed E
xpen
ditu
res
0(4
,332
,248
)0
00
Cap
italiz
ed E
xpen
ditu
rres
0
(4,9
95,2
05)
00
0C
apita
lized
Exp
endi
ture
s 0
(638
,980
)0
00
Loss
on
Dis
posa
l of A
sset
0
470,
044
00
0C
apita
l Tot
al27
,433
,900
17,7
03,2
3346
,085
,745
37,5
83,3
9022
,472
,580
Tota
l City
-Wid
e O
bjec
t Agg
rega
t e29
8,34
8,09
819
1,78
6,79
723
6,52
6,79
722
7,16
5,01
020
0,40
4,20
0
18
GENERAL FUND The City of Lodi General Fund projects revenues and expenditures of $50,388,780 in Fiscal Year 2017/18. Sales tax, property tax and Electric Utility in-lieu payments account for 57 percent of General Fund revenue, and the Police and Fire departments consume 63 percent of all General Fund revenue. The General Fund is the City’s discretionary fund. It also supports City administration and overhead, a portion of the Public Works Department, Internal Services and costs that are not associated with a particular department, such as citywide utilities. In addition, the General Fund contributes to the Street Division, Community Development Department and Parks, Recreation and Cultural Services to support their operations. Funding for the Library is also transferred from the General Fund. The following pages provide a detailed description of each General Fund activity and financial tables. The 2016/17 budget shown reflects adjustments made throughout the year.
19

(This page intentionally left blank)
20
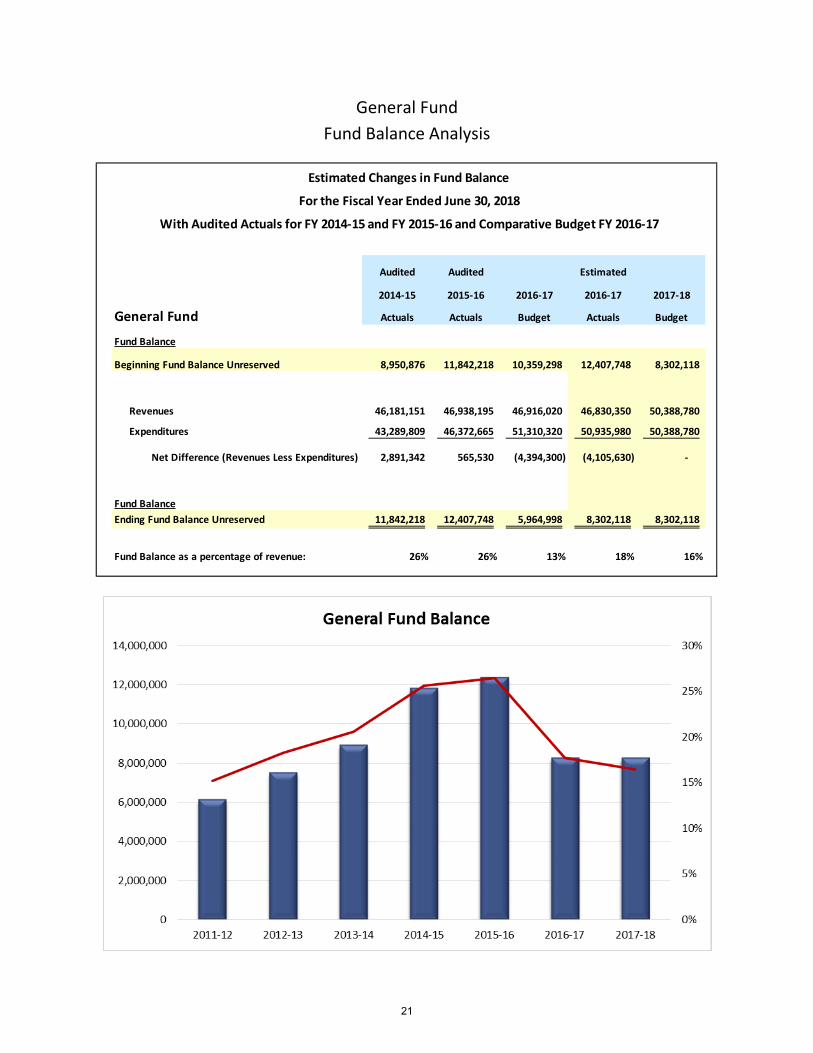
General Fund Fund Balance Analysis
Audited Audited Estimated
2014-15 2015-16 2016-17 2016-17 2017-18
General Fund Actuals Actuals Budget Actuals Budget
Fund Balance
Beginning Fund Balance Unreserved 8,950,876 11,842,218 10,359,298 12,407,748 8,302,118
Revenues 46,181,151 46,938,195 46,916,020 46,830,350 50,388,780
Expenditures 43,289,809 46,372,665 51,310,320 50,935,980 50,388,780
Net Difference (Revenues Less Expenditures) 2,891,342 565,530 (4,394,300) (4,105,630) -
Fund BalanceEnding Fund Balance Unreserved 11,842,218 12,407,748 5,964,998 8,302,118 8,302,118
Fund Balance as a percentage of revenue: 26% 26% 13% 18% 16%
Estimated Changes in Fund Balance
For the Fiscal Year Ended June 30, 2018
With Audited Actuals for FY 2014-15 and FY 2015-16 and Comparative Budget FY 2016-17
21
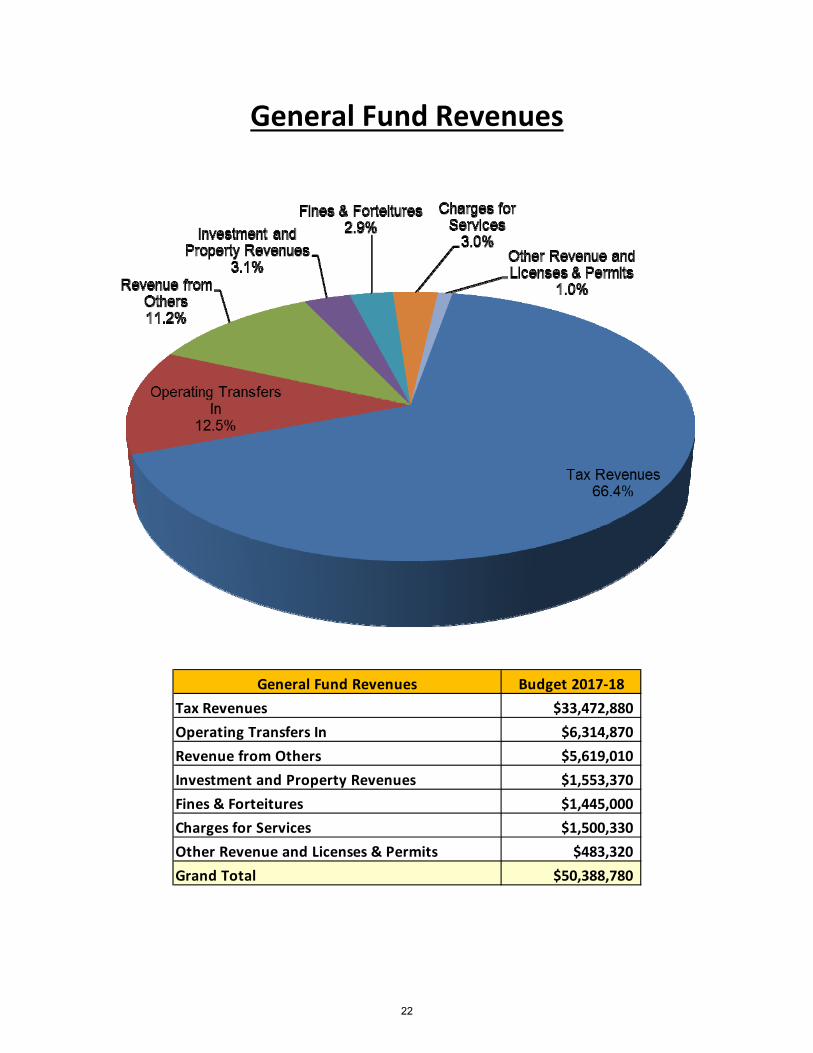
General Fund Revenues
General Fund Revenues Budget 2017‐18
Tax Revenues $33,472,880
Operating Transfers In $6,314,870
Revenue from Others $5,619,010
Investment and Property Revenues $1,553,370
Fines & Forteitures $1,445,000
Charges for Services $1,500,330
Other Revenue and Licenses & Permits $483,320
Grand Total $50,388,780
22
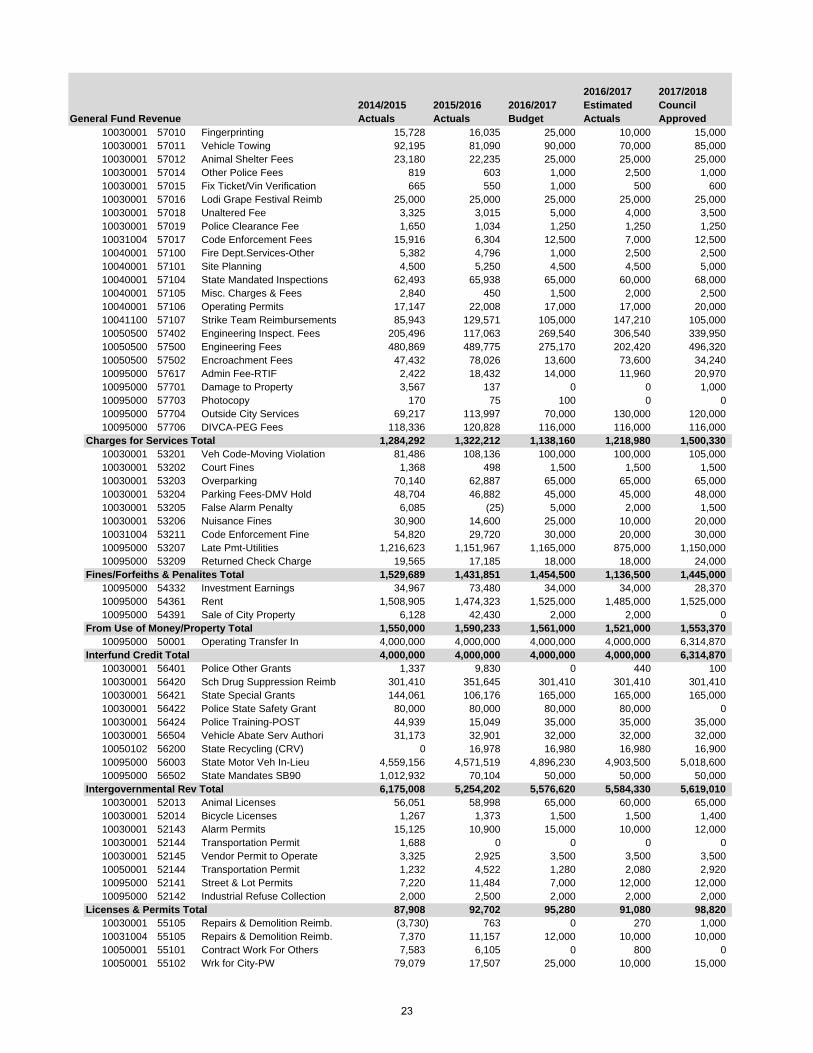
2014/2015 Actuals
2015/2016 Actuals
2016/2017 Budget
2016/2017 Estimated Actuals
2017/2018 Council Approved
10030001 57010 Fingerprinting 15,728 16,035 25,000 10,000 15,00010030001 57011 Vehicle Towing 92,195 81,090 90,000 70,000 85,00010030001 57012 Animal Shelter Fees 23,180 22,235 25,000 25,000 25,00010030001 57014 Other Police Fees 819 603 1,000 2,500 1,00010030001 57015 Fix Ticket/Vin Verification 665 550 1,000 500 60010030001 57016 Lodi Grape Festival Reimb 25,000 25,000 25,000 25,000 25,00010030001 57018 Unaltered Fee 3,325 3,015 5,000 4,000 3,50010030001 57019 Police Clearance Fee 1,650 1,034 1,250 1,250 1,25010031004 57017 Code Enforcement Fees 15,916 6,304 12,500 7,000 12,50010040001 57100 Fire Dept.Services-Other 5,382 4,796 1,000 2,500 2,50010040001 57101 Site Planning 4,500 5,250 4,500 4,500 5,00010040001 57104 State Mandated Inspections 62,493 65,938 65,000 60,000 68,00010040001 57105 Misc. Charges & Fees 2,840 450 1,500 2,000 2,50010040001 57106 Operating Permits 17,147 22,008 17,000 17,000 20,00010041100 57107 Strike Team Reimbursements 85,943 129,571 105,000 147,210 105,00010050500 57402 Engineering Inspect. Fees 205,496 117,063 269,540 306,540 339,95010050500 57500 Engineering Fees 480,869 489,775 275,170 202,420 496,32010050500 57502 Encroachment Fees 47,432 78,026 13,600 73,600 34,24010095000 57617 Admin Fee-RTIF 2,422 18,432 14,000 11,960 20,97010095000 57701 Damage to Property 3,567 137 0 0 1,00010095000 57703 Photocopy 170 75 100 0 010095000 57704 Outside City Services 69,217 113,997 70,000 130,000 120,00010095000 57706 DIVCA-PEG Fees 118,336 120,828 116,000 116,000 116,000
Charges for Services Total 1,284,292 1,322,212 1,138,160 1,218,980 1,500,33010030001 53201 Veh Code-Moving Violation 81,486 108,136 100,000 100,000 105,00010030001 53202 Court Fines 1,368 498 1,500 1,500 1,50010030001 53203 Overparking 70,140 62,887 65,000 65,000 65,00010030001 53204 Parking Fees-DMV Hold 48,704 46,882 45,000 45,000 48,00010030001 53205 False Alarm Penalty 6,085 (25) 5,000 2,000 1,50010030001 53206 Nuisance Fines 30,900 14,600 25,000 10,000 20,00010031004 53211 Code Enforcement Fine 54,820 29,720 30,000 20,000 30,00010095000 53207 Late Pmt-Utilities 1,216,623 1,151,967 1,165,000 875,000 1,150,00010095000 53209 Returned Check Charge 19,565 17,185 18,000 18,000 24,000
Fines/Forfeiths & Penalites Total 1,529,689 1,431,851 1,454,500 1,136,500 1,445,00010095000 54332 Investment Earnings 34,967 73,480 34,000 34,000 28,37010095000 54361 Rent 1,508,905 1,474,323 1,525,000 1,485,000 1,525,00010095000 54391 Sale of City Property 6,128 42,430 2,000 2,000 0
From Use of Money/Property Total 1,550,000 1,590,233 1,561,000 1,521,000 1,553,37010095000 50001 Operating Transfer In 4,000,000 4,000,000 4,000,000 4,000,000 6,314,870
Interfund Credit Total 4,000,000 4,000,000 4,000,000 4,000,000 6,314,87010030001 56401 Police Other Grants 1,337 9,830 0 440 10010030001 56420 Sch Drug Suppression Reimb 301,410 351,645 301,410 301,410 301,41010030001 56421 State Special Grants 144,061 106,176 165,000 165,000 165,00010030001 56422 Police State Safety Grant 80,000 80,000 80,000 80,000 010030001 56424 Police Training-POST 44,939 15,049 35,000 35,000 35,00010030001 56504 Vehicle Abate Serv Authori 31,173 32,901 32,000 32,000 32,00010050102 56200 State Recycling (CRV) 0 16,978 16,980 16,980 16,90010095000 56003 State Motor Veh In-Lieu 4,559,156 4,571,519 4,896,230 4,903,500 5,018,60010095000 56502 State Mandates SB90 1,012,932 70,104 50,000 50,000 50,000
Intergovernmental Rev Total 6,175,008 5,254,202 5,576,620 5,584,330 5,619,01010030001 52013 Animal Licenses 56,051 58,998 65,000 60,000 65,00010030001 52014 Bicycle Licenses 1,267 1,373 1,500 1,500 1,40010030001 52143 Alarm Permits 15,125 10,900 15,000 10,000 12,00010030001 52144 Transportation Permit 1,688 0 0 0 010030001 52145 Vendor Permit to Operate 3,325 2,925 3,500 3,500 3,50010050001 52144 Transportation Permit 1,232 4,522 1,280 2,080 2,92010095000 52141 Street & Lot Permits 7,220 11,484 7,000 12,000 12,00010095000 52142 Industrial Refuse Collection 2,000 2,500 2,000 2,000 2,000
Licenses & Permits Total 87,908 92,702 95,280 91,080 98,82010030001 55105 Repairs & Demolition Reimb. (3,730) 763 0 270 1,00010031004 55105 Repairs & Demolition Reimb. 7,370 11,157 12,000 10,000 10,00010050001 55101 Contract Work For Others 7,583 6,105 0 800 010050001 55102 Wrk for City-PW 79,079 17,507 25,000 10,000 15,000
General Fund Revenue
23
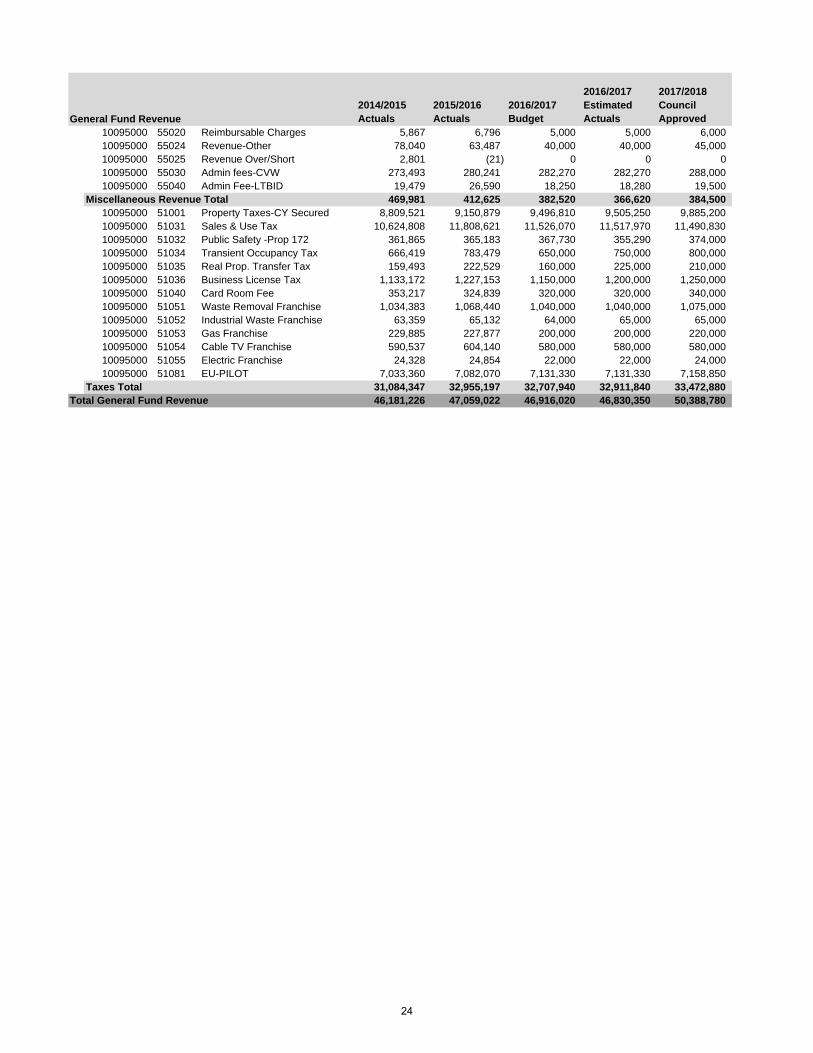
2014/2015 Actuals
2015/2016 Actuals
2016/2017 Budget
2016/2017 Estimated Actuals
2017/2018 Council ApprovedGeneral Fund Revenue
10095000 55020 Reimbursable Charges 5,867 6,796 5,000 5,000 6,00010095000 55024 Revenue-Other 78,040 63,487 40,000 40,000 45,00010095000 55025 Revenue Over/Short 2,801 (21) 0 0 010095000 55030 Admin fees-CVW 273,493 280,241 282,270 282,270 288,00010095000 55040 Admin Fee-LTBID 19,479 26,590 18,250 18,280 19,500
Miscellaneous Revenue Total 469,981 412,625 382,520 366,620 384,50010095000 51001 Property Taxes-CY Secured 8,809,521 9,150,879 9,496,810 9,505,250 9,885,20010095000 51031 Sales & Use Tax 10,624,808 11,808,621 11,526,070 11,517,970 11,490,83010095000 51032 Public Safety -Prop 172 361,865 365,183 367,730 355,290 374,00010095000 51034 Transient Occupancy Tax 666,419 783,479 650,000 750,000 800,00010095000 51035 Real Prop. Transfer Tax 159,493 222,529 160,000 225,000 210,00010095000 51036 Business License Tax 1,133,172 1,227,153 1,150,000 1,200,000 1,250,00010095000 51040 Card Room Fee 353,217 324,839 320,000 320,000 340,00010095000 51051 Waste Removal Franchise 1,034,383 1,068,440 1,040,000 1,040,000 1,075,00010095000 51052 Industrial Waste Franchise 63,359 65,132 64,000 65,000 65,00010095000 51053 Gas Franchise 229,885 227,877 200,000 200,000 220,00010095000 51054 Cable TV Franchise 590,537 604,140 580,000 580,000 580,00010095000 51055 Electric Franchise 24,328 24,854 22,000 22,000 24,00010095000 51081 EU-PILOT 7,033,360 7,082,070 7,131,330 7,131,330 7,158,850
Taxes Total 31,084,347 32,955,197 32,707,940 32,911,840 33,472,880Total General Fund Revenue 46,181,226 47,059,022 46,916,020 46,830,350 50,388,780
24
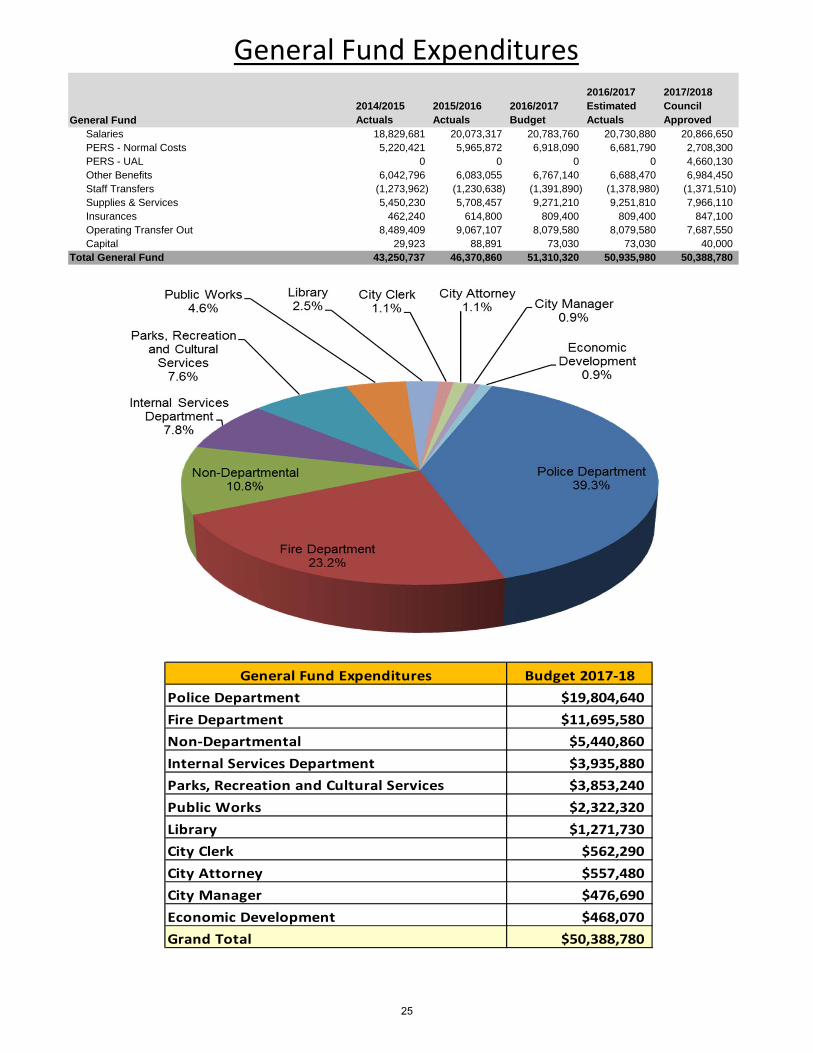
General Fund Expenditures
2014/2015 Actuals
2015/2016 Actuals
2016/2017 Budget
2016/2017 Estimated Actuals
2017/2018 Council Approved
Salaries 18,829,681 20,073,317 20,783,760 20,730,880 20,866,650PERS - Normal Costs 5,220,421 5,965,872 6,918,090 6,681,790 2,708,300PERS - UAL 0 0 0 0 4,660,130Other Benefits 6,042,796 6,083,055 6,767,140 6,688,470 6,984,450Staff Transfers (1,273,962) (1,230,638) (1,391,890) (1,378,980) (1,371,510)Supplies & Services 5,450,230 5,708,457 9,271,210 9,251,810 7,966,110Insurances 462,240 614,800 809,400 809,400 847,100Operating Transfer Out 8,489,409 9,067,107 8,079,580 8,079,580 7,687,550Capital 29,923 88,891 73,030 73,030 40,000
Total General Fund 43,250,737 46,370,860 51,310,320 50,935,980 50,388,780
General Fund
General Fund Expenditures Budget 2017‐18
Police Department $19,804,640
Fire Department $11,695,580
Non‐Departmental $5,440,860
Internal Services Department $3,935,880
Parks, Recreation and Cultural Services $3,853,240
Public Works $2,322,320
Library $1,271,730
City Clerk $562,290
City Attorney $557,480
City Manager $476,690
Economic Development $468,070
Grand Total $50,388,780
25
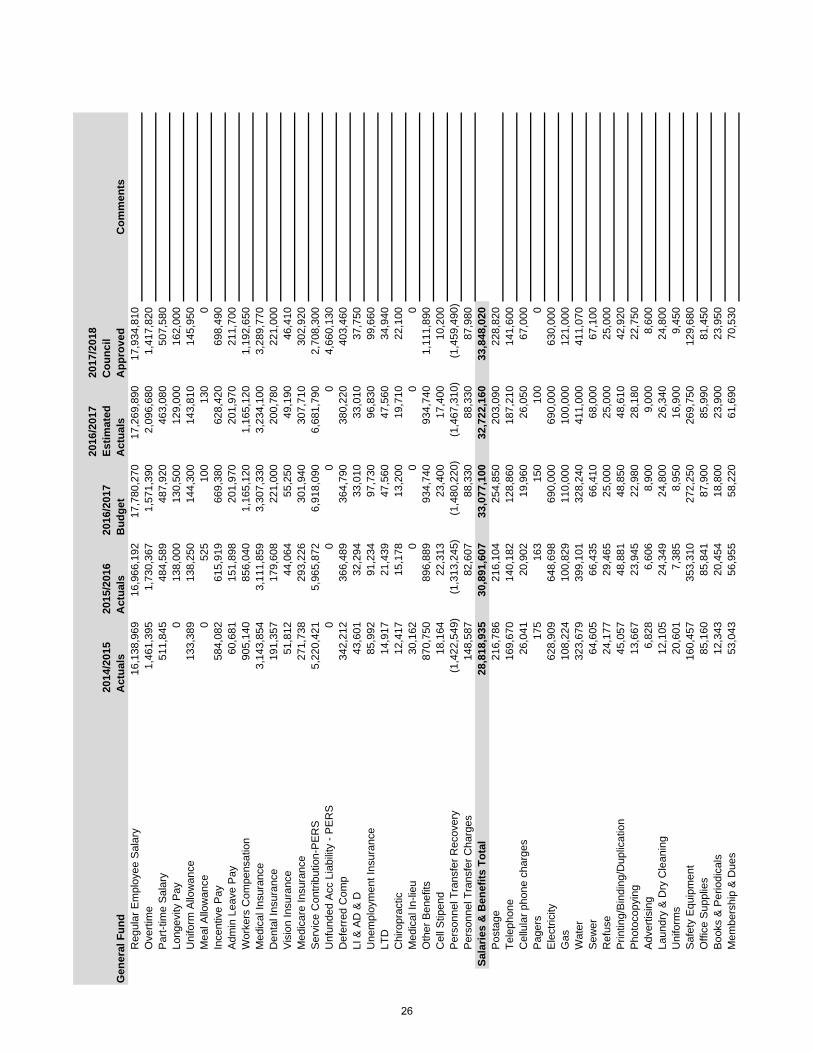
2014
/201
5 A
ctua
ls20
15/2
016
Act
uals
2016
/201
7 B
udge
t
2016
/201
7 Es
timat
ed
Act
uals
2017
/201
8 C
ounc
il A
ppro
ved
Com
men
tsR
egul
ar E
mpl
oyee
Sal
ary
16,1
38,9
6916
,966
,192
17,7
80,2
7017
,269
,890
17,9
34,8
10O
verti
me
1,46
1,39
51,
730,
367
1,57
1,39
02,
096,
680
1,41
7,82
0P
art-t
ime
Sal
ary
511,
845
484,
589
487,
920
463,
080
507,
580
Long
evity
Pay
0
138,
000
130,
500
129,
000
162,
000
Uni
form
Allo
wan
ce
133,
389
138,
250
144,
300
143,
810
145,
950
Mea
l Allo
wan
ce
052
510
013
00
Ince
ntiv
e P
ay
584,
082
615,
919
669,
380
628,
420
698,
490
Adm
in L
eave
Pay
60
,681
151,
898
201,
970
201,
970
211,
700
Wor
kers
Com
pens
atio
n 90
5,14
085
6,04
01,
165,
120
1,16
5,12
01,
192,
650
Med
ical
Insu
ranc
e 3,
143,
854
3,11
1,85
93,
307,
330
3,23
4,10
03,
289,
770
Den
tal I
nsur
ance
19
1,35
717
9,60
822
1,00
020
0,78
022
1,00
0V
isio
n In
sura
nce
51,8
1244
,064
55,2
5049
,190
46,4
10M
edic
are
Insu
ranc
e 27
1,73
829
3,22
630
1,94
030
7,71
030
2,92
0S
ervi
ce C
ontri
butio
n-P
ER
S
5,22
0,42
15,
965,
872
6,91
8,09
06,
681,
790
2,70
8,30
0U
nfun
ded
Acc
Lia
bilit
y - P
ER
S
00
00
4,66
0,13
0D
efer
red
Com
p 34
2,21
236
6,48
936
4,79
038
0,22
040
3,46
0LI
& A
D &
D
43,6
0132
,294
33,0
1033
,010
37,7
50U
nem
ploy
men
t Ins
uran
ce
85,9
9291
,234
97,7
3096
,830
99,6
60LT
D
14,9
1721
,439
47,5
6047
,560
34,9
40C
hiro
prac
tic
12,4
1715
,178
13,2
0019
,710
22,1
00M
edic
al In
-lieu
30
,162
00
00
Oth
er B
enef
its
870,
750
896,
889
934,
740
934,
740
1,11
1,89
0C
ell S
tipen
d 18
,164
22,3
1323
,400
17,4
0010
,200
Per
sonn
el T
rans
fer R
ecov
ery
(1,4
22,5
49)
(1,3
13,2
45)
(1,4
80,2
20)
(1,4
67,3
10)
(1,4
59,4
90)
Per
sonn
el T
rans
fer C
harg
es
148,
587
82,6
0788
,330
88,3
3087
,980
Sala
ries
& B
enef
its T
otal
28,8
18,9
3530
,891
,607
33,0
77,1
0032
,722
,160
33,8
48,0
20P
osta
ge
216,
786
216,
104
254,
850
203,
090
228,
820
Tele
phon
e 16
9,67
014
0,18
212
8,86
018
7,21
014
1,60
0C
ellu
lar p
hone
cha
rges
26
,041
20,9
0219
,960
26,0
5067
,000
Pag
ers
175
163
150
100
0E
lect
ricity
62
8,90
964
8,69
869
0,00
069
0,00
063
0,00
0G
as
108,
224
100,
829
110,
000
100,
000
121,
000
Wat
er
323,
679
399,
101
328,
240
411,
000
411,
070
Sew
er
64,6
0566
,435
66,4
1068
,000
67,1
00R
efus
e 24
,177
29,4
6525
,000
25,0
0025
,000
Prin
ting/
Bin
ding
/Dup
licat
ion
45,0
5748
,881
48,8
5048
,610
42,9
20P
hoto
copy
ing
13,6
6723
,945
22,9
8028
,180
22,7
50A
dver
tisin
g 6,
828
6,60
68,
900
9,00
08,
600
Laun
dry
& D
ry C
lean
ing
12,1
0524
,349
24,8
0026
,340
24,8
00U
nifo
rms
20,6
017,
385
8,95
016
,900
9,45
0S
afet
y E
quip
men
t 16
0,45
735
3,31
027
2,25
026
9,75
012
9,68
0O
ffice
Sup
plie
s 85
,160
85,8
4187
,900
85,9
9081
,450
Boo
ks &
Per
iodi
cals
12
,343
20,4
5418
,800
23,9
0023
,950
Mem
bers
hip
& D
ues
53,0
4356
,955
58,2
2061
,690
70,5
30
Gen
eral
Fun
d
26
2014
/201
5 A
ctua
ls20
15/2
016
Act
uals
2016
/201
7 B
udge
t
2016
/201
7 Es
timat
ed
Act
uals
2017
/201
8 C
ounc
il A
ppro
ved
Com
men
tsG
ener
al F
und
Unc
olle
ctib
le A
cct E
xpen
se
10,4
5714
,858
40,0
0020
,000
27,2
60C
olle
ctio
n A
genc
y Fe
es
00
020
00
Ban
k S
ervi
ce C
harg
es
13,1
7516
,586
19,2
0017
,200
18,8
80In
form
atio
n S
yste
ms
Sof
twar
e 25
,479
34,8
6567
,260
67,1
7099
,360
Bus
ines
s E
xpen
se
11,6
9312
,788
16,1
0015
,950
12,9
50C
onfe
renc
e E
xpen
se
23,6
3758
,078
61,4
0058
,820
98,7
00R
ent o
f Lan
d/Fa
cilit
ies
8,82
611
,530
7,00
010
,100
7,68
0R
enta
l of E
quip
men
t 1,
637
1,22
41,
300
1,30
01,
200
K-9
Sup
plie
s 9,
892
12,5
2622
,500
35,0
0013
,000
Spe
cial
Dep
t Mat
eria
ls
51,9
6359
,292
66,2
3082
,600
82,2
00Ja
nito
rial S
uppl
ies
28,1
8030
,783
32,8
0049
,400
33,8
70G
ener
al S
uppl
ies
12,7
2614
,151
26,4
0017
,080
33,7
00M
edic
al S
uppl
ies
23,5
7319
,960
35,5
0040
,500
41,5
00C
are
of P
rison
ers
45,5
8923
,643
30,0
0025
,720
22,0
00Tr
aini
ng a
nd E
duca
tion
77,8
4614
1,80
416
8,30
018
2,98
012
8,20
0S
mal
l Too
ls a
nd E
quip
men
t 64
,917
66,4
0621
4,75
011
8,09
018
8,88
0La
bora
tory
Sup
plie
s 6,
339
3,47
14,
500
2,00
02,
000
Sof
twar
e Li
cens
ing
Cos
t 25
,430
28,9
6675
,440
72,2
4076
,590
Ove
rtim
e M
eals
68
00
00
Em
ploy
ees
Phy
sica
l Exa
ms
34,9
4049
,895
46,5
0053
,000
42,0
00P
OS
T Tr
aini
ng
38,1
9815
,041
35,0
0040
,000
35,0
00Tu
ition
Rei
mbu
rsem
ent
21,6
417,
792
25,5
0017
,500
20,5
00R
efun
ds
00
0(3
,190
)0
Rei
mbu
rsab
le E
xpen
se
303
113
500
500
500
Sup
plie
s &
Ser
vice
s N
OC
1,
248
44,3
9850
,000
51,6
6050
,000
Mis
c. P
rofe
ssio
nal S
ervi
ces
1,20
3,96
477
6,71
91,
143,
050
1,08
9,98
072
7,60
0A
uditi
ng S
ervi
ces
073
,120
014
0,00
097
,600
Rec
ordi
ng/T
itle
Ser
vice
s 0
109
500
500
500
Mis
c C
ontra
ct S
ervi
ces
259,
859
552,
848
636,
250
586,
970
588,
750
Rep
airs
to C
omm
unic
atio
n E
quip
85
,922
7,50
227
,600
37,6
0030
,100
Rep
airs
to M
achi
nes
& E
quip
16
5,49
212
3,60
914
5,00
013
6,54
014
5,00
0R
epai
rs to
Offi
ce E
quip
2,
293
490
3,50
03,
500
3,50
0R
epai
rs to
Veh
icle
s 41
0,34
749
4,01
942
1,65
044
9,62
053
1,10
0R
epai
rs to
Bui
ldin
gs
45,0
6673
,041
85,0
0084
,610
79,5
00C
ar W
ash
5,97
65,
906
5,95
05,
790
6,25
0M
otor
Veh
icle
Fue
l & L
ube
248,
106
190,
858
261,
250
192,
520
226,
670
Don
atio
ns-L
CV
B
113,
482
153,
834
133,
500
140,
650
0D
onat
ions
-SJ
Par
tner
ship
25
,290
30,2
9030
,290
30,2
9030
,290
Don
atio
ns-L
odi D
ist C
2,
080
2,08
02,
080
2,08
02,
080
Don
atio
ns-F
irew
orks
11
,909
11,6
1416
,000
16,0
0016
,000
Don
atio
ns-S
JC E
nt Z
one
21,4
640
00
0D
onat
ions
-Arts
Gra
nts
35,7
5035
,150
36,5
0036
,500
36,5
00Fo
urth
of J
uly
13,0
1713
,957
21,0
0013
,000
21,0
00C
once
rts
00
1,00
01,
000
1,00
0
27
2014
/201
5 A
ctua
ls20
15/2
016
Act
uals
2016
/201
7 B
udge
t
2016
/201
7 Es
timat
ed
Act
uals
2017
/201
8 C
ounc
il A
ppro
ved
Com
men
tsG
ener
al F
und
Gra
pe F
estiv
al
46,0
0757
,882
50,0
0052
,080
60,0
00P
arad
e of
Lig
hts
3,60
50
00
0C
eleb
ratio
n on
Cen
tral
440
01,
000
460
1,00
0M
isce
llane
ous
Eve
nts
234
00
00
San
dhill
Cra
ne F
estiv
al
1,43
41,
054
1,20
01,
200
1,20
0Fi
rew
orks
Tas
k Fo
rce
23,6
837,
018
15,0
000
15,0
00P
rope
rty T
ax A
dmin
Fee
17
4,10
817
5,58
018
1,00
014
2,70
018
4,35
0S
peci
al P
aym
ents
41
,416
4,00
42,
831,
590
2,83
1,59
02,
019,
430
Supp
lies
& S
ervi
ces
Tota
l5,
450,
230
5,70
8,45
79,
271,
210
9,25
1,81
07,
966,
110
PL
& P
D/O
ther
Insu
ranc
e 46
2,24
061
4,80
080
9,40
080
9,40
084
7,10
0In
sura
nces
Tot
al46
2,24
061
4,80
080
9,40
080
9,40
084
7,10
0O
pera
ting
Tran
sfer
Out
8,
489,
409
9,06
7,10
78,
079,
580
8,07
9,58
07,
687,
550
Ope
ratin
g Tr
ansf
er O
ut T
otal
8,48
9,40
99,
067,
107
8,07
9,58
08,
079,
580
7,68
7,55
0C
apita
l Pro
ject
s 0
5,91
50
00
Mac
hine
ry a
nd e
quip
men
t 29
,923
82,9
7673
,030
73,0
3040
,000
Cap
ital
29,9
2388
,891
73,0
3073
,030
40,0
00To
tal G
ener
al F
und
43,2
50,7
3746
,370
,860
51,3
10,3
2050
,935
,980
50,3
88,7
80
28
POLICE DEPARTMENT The Police Department is the City’s largest General Fund expense with a FY 2017/18 budget of $19,804,640 compared to $19,872,500 as originally adopted for the FY 2016/17 budget. The 2016/17 budget shown in the following pages reflects adjustments made throughout the year. The Police Department budget comprises Administration, Operations, Support Services and the Animal Shelter. FY 2017/18 budgeted staffing is being maintained at 103 positions. Two police officer positions are unfunded for the first six months in an effort to help balance the budget. An organizational chart, staffing summary, detailed activity descriptions and financial tables are included in the following pages.
29

(This page intentionally left blank)
30
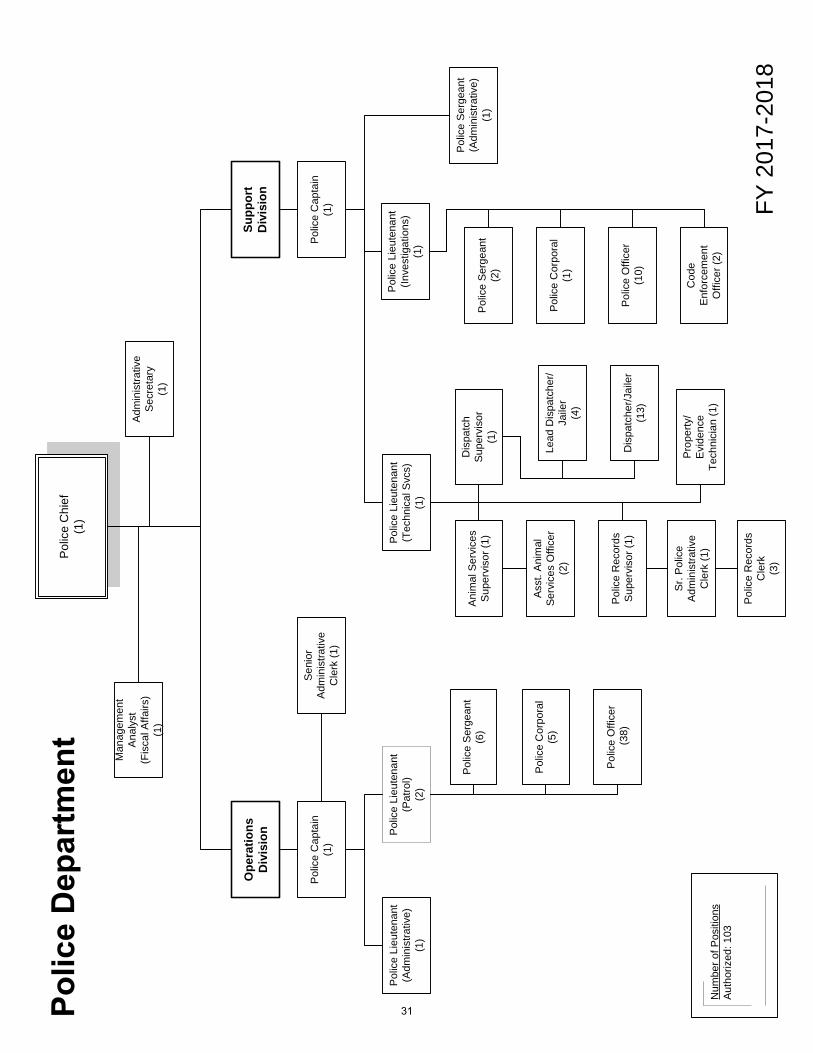
FY 2
017-
2018
Num
ber o
f Pos
ition
sAu
thor
ized
: 103
Polic
e C
hief
(1)
Ope
ratio
ns
Div
isio
nSu
ppor
tD
ivis
ion
Pol
ice
Cap
tain
(1)
Adm
inis
trativ
e S
ecre
tary
(1)
Pol
ice
Lieu
tena
nt(P
atro
l) (2
)
Man
agem
ent
Ana
lyst
(Fis
cal A
ffairs
)(1
)
Pol
ice
Offi
cer
(38)
Polic
e S
erge
ant
(6)
Polic
e C
apta
in(1
)
Sen
ior
Adm
inis
trativ
e C
lerk
(1)
Pol
ice
Cor
pora
l(5
)
Pol
ice
Lieu
tena
nt(In
vest
igat
ions
)(1
)
Pol
ice
Lieu
tena
nt(A
dmin
istra
tive)
(1
)
Polic
e Li
eute
nant
(Tec
hnic
al S
vcs)
(1)
Dis
patc
h Su
perv
isor
(1)
Pol
ice
Rec
ords
S
uper
viso
r (1)
Ani
mal
Ser
vice
s S
uper
viso
r(1)
Pro
perty
/E
vide
nce
Tech
nici
an (1
)
Asst
. Ani
mal
Se
rvic
es O
ffice
r (2
)
Sr. P
olic
e A
dmin
istra
tive
Cle
rk (1
)
Dis
patc
her/J
aile
r(1
3)
Lead
Dis
patc
her/
Jaile
r (4
)
Polic
e C
orpo
ral
(1)
Pol
ice
Offi
cer
(10)
Polic
e S
erge
ant
(2)
Cod
e E
nfor
cem
ent
Offi
cer(
2)
Pol
ice
Rec
ords
C
lerk
(3)
Polic
e S
erge
ant
(Adm
inis
trativ
e)(1
)
31
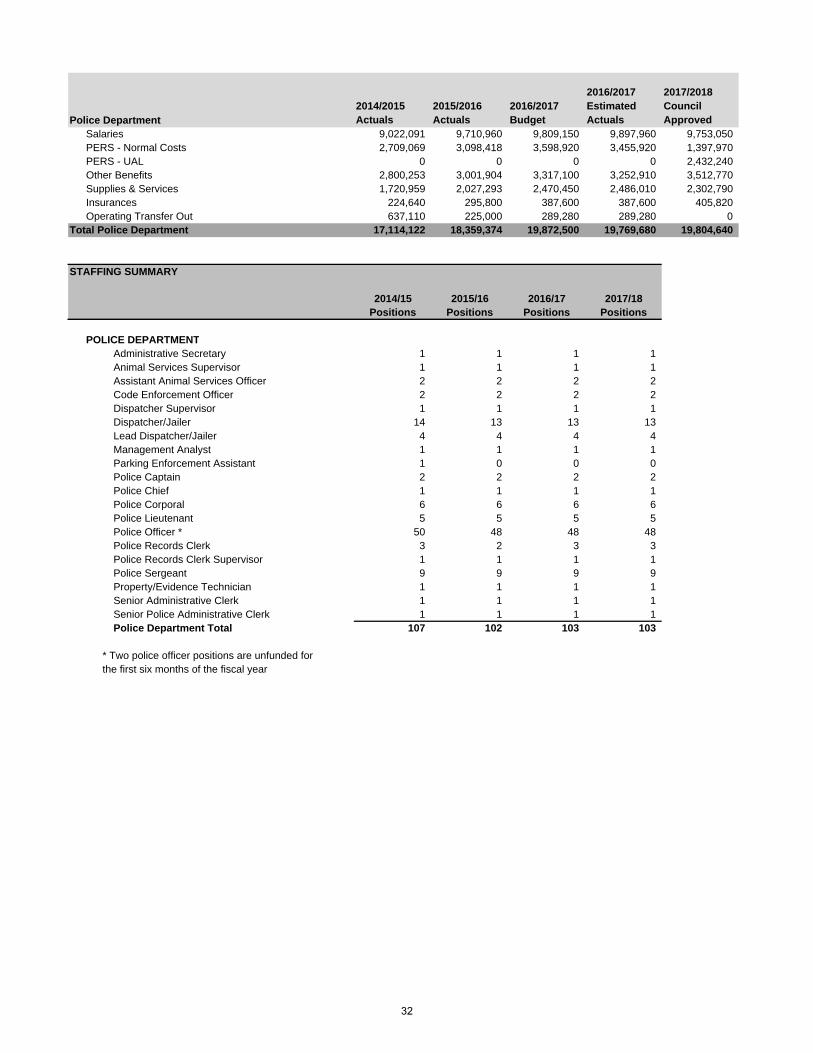
2014/2015 Actuals
2015/2016 Actuals
2016/2017 Budget
2016/2017 Estimated Actuals
2017/2018 Council Approved
Salaries 9,022,091 9,710,960 9,809,150 9,897,960 9,753,050PERS - Normal Costs 2,709,069 3,098,418 3,598,920 3,455,920 1,397,970PERS - UAL 0 0 0 0 2,432,240Other Benefits 2,800,253 3,001,904 3,317,100 3,252,910 3,512,770Supplies & Services 1,720,959 2,027,293 2,470,450 2,486,010 2,302,790Insurances 224,640 295,800 387,600 387,600 405,820Operating Transfer Out 637,110 225,000 289,280 289,280 0
Total Police Department 17,114,122 18,359,374 19,872,500 19,769,680 19,804,640
STAFFING SUMMARY
2014/15 2015/16 2016/17 2017/18Positions Positions Positions Positions
POLICE DEPARTMENTAdministrative Secretary 1 1 1 1Animal Services Supervisor 1 1 1 1Assistant Animal Services Officer 2 2 2 2Code Enforcement Officer 2 2 2 2Dispatcher Supervisor 1 1 1 1Dispatcher/Jailer 14 13 13 13Lead Dispatcher/Jailer 4 4 4 4Management Analyst 1 1 1 1Parking Enforcement Assistant 1 0 0 0Police Captain 2 2 2 2Police Chief 1 1 1 1Police Corporal 6 6 6 6Police Lieutenant 5 5 5 5Police Officer * 50 48 48 48Police Records Clerk 3 2 3 3Police Records Clerk Supervisor 1 1 1 1Police Sergeant 9 9 9 9Property/Evidence Technician 1 1 1 1Senior Administrative Clerk 1 1 1 1Senior Police Administrative Clerk 1 1 1 1Police Department Total 107 102 103 103
* Two police officer positions are unfunded forthe first six months of the fiscal year
Police Department
32
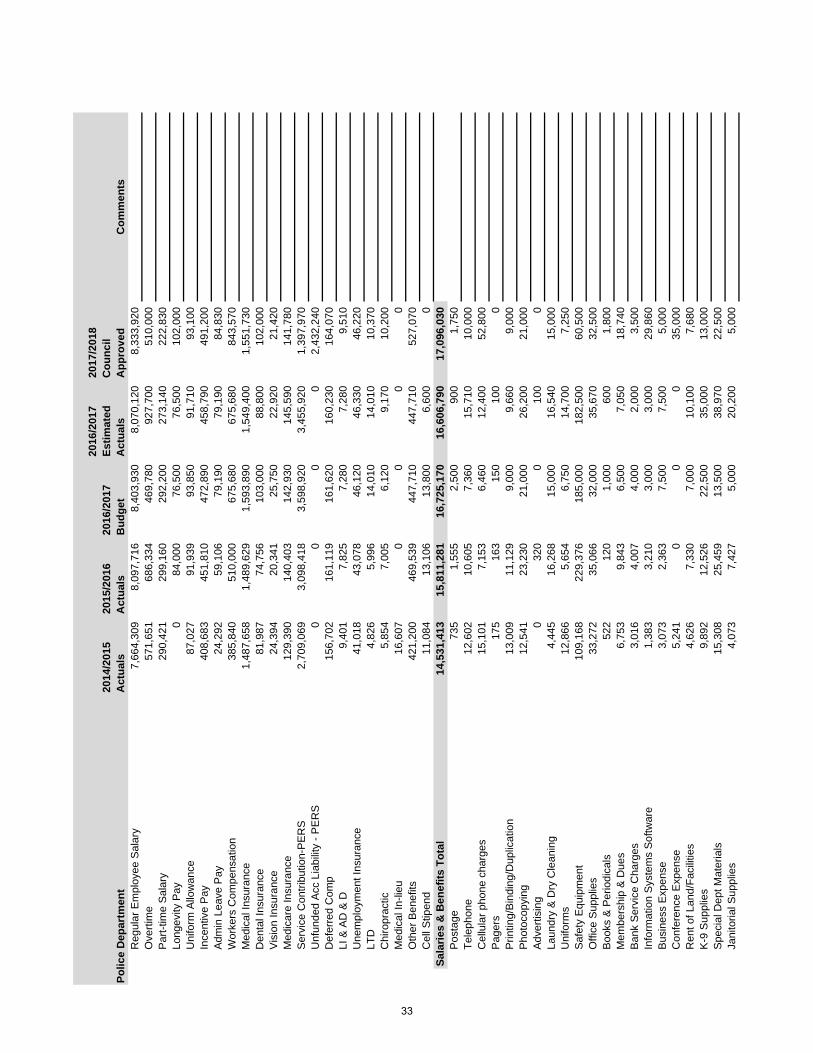
2014
/201
5 A
ctua
ls20
15/2
016
Act
uals
2016
/201
7 B
udge
t
2016
/201
7 Es
timat
ed
Act
uals
2017
/201
8 C
ounc
il A
ppro
ved
Com
men
tsR
egul
ar E
mpl
oyee
Sal
ary
7,66
4,30
98,
097,
716
8,40
3,93
08,
070,
120
8,33
3,92
0O
verti
me
571,
651
686,
334
469,
780
927,
700
510,
000
Par
t-tim
e S
alar
y 29
0,42
129
9,16
029
2,20
027
3,14
022
2,83
0Lo
ngev
ity P
ay
084
,000
76,5
0076
,500
102,
000
Uni
form
Allo
wan
ce
87,0
2791
,939
93,8
5091
,710
93,1
00In
cent
ive
Pay
40
8,68
345
1,81
047
2,89
045
8,79
049
1,20
0A
dmin
Lea
ve P
ay
24,2
9259
,106
79,1
9079
,190
84,8
30W
orke
rs C
ompe
nsat
ion
385,
840
510,
000
675,
680
675,
680
843,
570
Med
ical
Insu
ranc
e 1,
487,
658
1,48
9,62
91,
593,
890
1,54
9,40
01,
551,
730
Den
tal I
nsur
ance
81
,987
74,7
5610
3,00
088
,800
102,
000
Vis
ion
Insu
ranc
e 24
,394
20,3
4125
,750
22,9
2021
,420
Med
icar
e In
sura
nce
129,
390
140,
403
142,
930
145,
590
141,
780
Ser
vice
Con
tribu
tion-
PE
RS
2,
709,
069
3,09
8,41
83,
598,
920
3,45
5,92
01,
397,
970
Unf
unde
d A
cc L
iabi
lity
- PE
RS
0
00
02,
432,
240
Def
erre
d C
omp
156,
702
161,
119
161,
620
160,
230
164,
070
LI &
AD
& D
9,
401
7,82
57,
280
7,28
09,
510
Une
mpl
oym
ent I
nsur
ance
41
,018
43,0
7846
,120
46,3
3046
,220
LTD
4,
826
5,99
614
,010
14,0
1010
,370
Chi
ropr
actic
5,
854
7,00
56,
120
9,17
010
,200
Med
ical
In-li
eu
16,6
070
00
0O
ther
Ben
efits
42
1,20
046
9,53
944
7,71
044
7,71
052
7,07
0C
ell S
tipen
d 11
,084
13,1
0613
,800
6,60
00
Sala
ries
& B
enef
its T
otal
14,5
31,4
1315
,811
,281
16,7
25,1
7016
,606
,790
17,0
96,0
30P
osta
ge
735
1,55
52,
500
900
1,75
0Te
leph
one
12,6
0210
,605
7,36
015
,710
10,0
00C
ellu
lar p
hone
cha
rges
15
,101
7,15
36,
460
12,4
0052
,800
Pag
ers
175
163
150
100
0P
rintin
g/B
indi
ng/D
uplic
atio
n 13
,009
11,1
299,
000
9,66
09,
000
Pho
toco
pyin
g 12
,541
23,2
3021
,000
26,2
0021
,000
Adv
ertis
ing
032
00
100
0La
undr
y &
Dry
Cle
anin
g 4,
445
16,2
6815
,000
16,5
4015
,000
Uni
form
s 12
,866
5,65
46,
750
14,7
007,
250
Saf
ety
Equ
ipm
ent
109,
168
229,
376
185,
000
182,
500
60,5
00O
ffice
Sup
plie
s 33
,272
35,0
6632
,000
35,6
7032
,500
Boo
ks &
Per
iodi
cals
52
212
01,
000
600
1,80
0M
embe
rshi
p &
Due
s 6,
753
9,84
36,
500
7,05
018
,740
Ban
k S
ervi
ce C
harg
es
3,01
64,
007
4,00
02,
000
3,50
0In
form
atio
n S
yste
ms
Sof
twar
e 1,
383
3,21
03,
000
3,00
029
,860
Bus
ines
s E
xpen
se
3,07
32,
363
7,50
07,
500
5,00
0C
onfe
renc
e E
xpen
se
5,24
10
00
35,0
00R
ent o
f Lan
d/Fa
cilit
ies
4,62
67,
330
7,00
010
,100
7,68
0K
-9 S
uppl
ies
9,89
212
,526
22,5
0035
,000
13,0
00S
peci
al D
ept M
ater
ials
15
,308
25,4
5913
,500
38,9
7022
,500
Jani
toria
l Sup
plie
s 4,
073
7,42
75,
000
20,2
005,
000
Polic
e D
epar
tmen
t
33
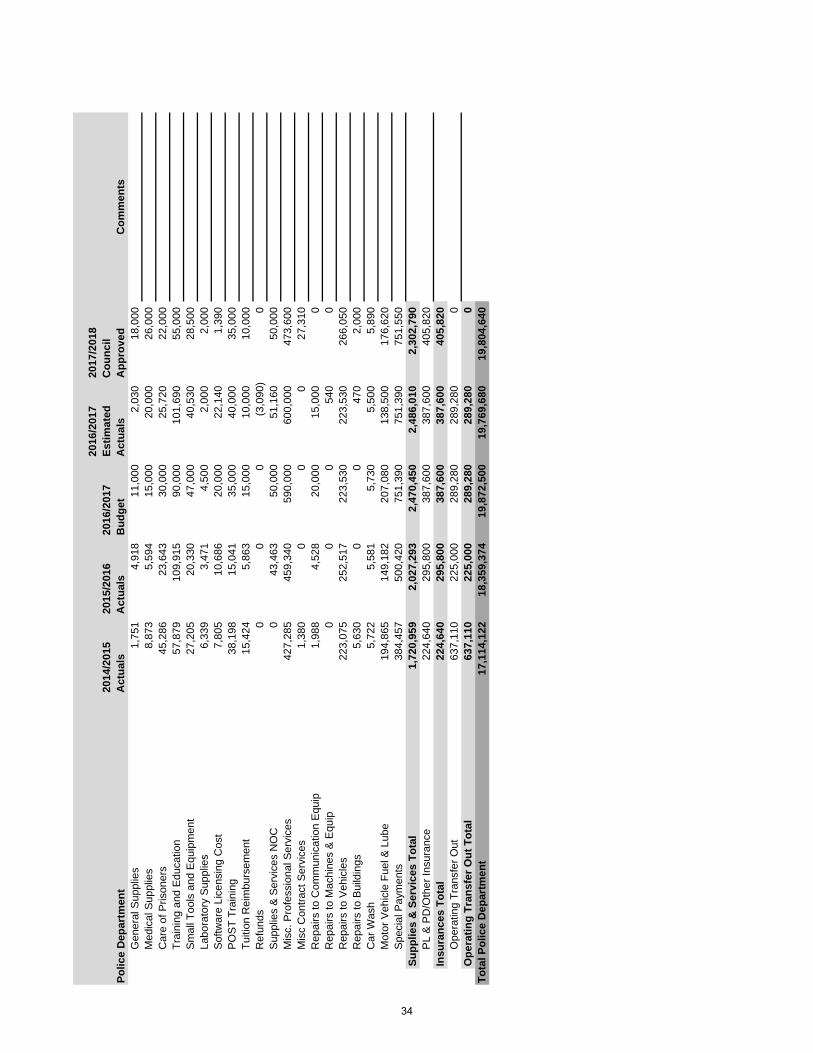
2014
/201
5 A
ctua
ls20
15/2
016
Act
uals
2016
/201
7 B
udge
t
2016
/201
7 Es
timat
ed
Act
uals
2017
/201
8 C
ounc
il A
ppro
ved
Com
men
tsPo
lice
Dep
artm
ent
Gen
eral
Sup
plie
s 1,
751
4,91
811
,000
2,03
018
,000
Med
ical
Sup
plie
s 8,
873
5,59
415
,000
20,0
0026
,000
Car
e of
Pris
oner
s 45
,286
23,6
4330
,000
25,7
2022
,000
Trai
ning
and
Edu
catio
n 57
,879
109,
915
90,0
0010
1,69
055
,000
Sm
all T
ools
and
Equ
ipm
ent
27,2
0520
,330
47,0
0040
,530
28,5
00La
bora
tory
Sup
plie
s 6,
339
3,47
14,
500
2,00
02,
000
Sof
twar
e Li
cens
ing
Cos
t 7,
805
10,6
8620
,000
22,1
401,
390
PO
ST
Trai
ning
38
,198
15,0
4135
,000
40,0
0035
,000
Tuiti
on R
eim
burs
emen
t 15
,424
5,86
315
,000
10,0
0010
,000
Ref
unds
0
00
(3,0
90)
0S
uppl
ies
& S
ervi
ces
NO
C
043
,463
50,0
0051
,160
50,0
00M
isc.
Pro
fess
iona
l Ser
vice
s 42
7,28
545
9,34
059
0,00
060
0,00
047
3,60
0M
isc
Con
tract
Ser
vice
s 1,
380
00
027
,310
Rep
airs
to C
omm
unic
atio
n E
quip
1,
988
4,52
820
,000
15,0
000
Rep
airs
to M
achi
nes
& E
quip
0
00
540
0R
epai
rs to
Veh
icle
s 22
3,07
525
2,51
722
3,53
022
3,53
026
6,05
0R
epai
rs to
Bui
ldin
gs
5,63
00
047
02,
000
Car
Was
h 5,
722
5,58
15,
730
5,50
05,
890
Mot
or V
ehic
le F
uel &
Lub
e 19
4,86
514
9,18
220
7,08
013
8,50
017
6,62
0S
peci
al P
aym
ents
38
4,45
750
0,42
075
1,39
075
1,39
075
1,55
0Su
pplie
s &
Ser
vice
s To
tal
1,72
0,95
92,
027,
293
2,47
0,45
02,
486,
010
2,30
2,79
0P
L &
PD
/Oth
er In
sura
nce
224,
640
295,
800
387,
600
387,
600
405,
820
Insu
ranc
es T
otal
224,
640
295,
800
387,
600
387,
600
405,
820
Ope
ratin
g Tr
ansf
er O
ut
637,
110
225,
000
289,
280
289,
280
0O
pera
ting
Tran
sfer
Out
Tot
al63
7,11
022
5,00
028
9,28
028
9,28
00
Tota
l Pol
ice
Dep
artm
ent
17,1
14,1
2218
,359
,374
19,8
72,5
0019
,769
,680
19,8
04,6
40
34
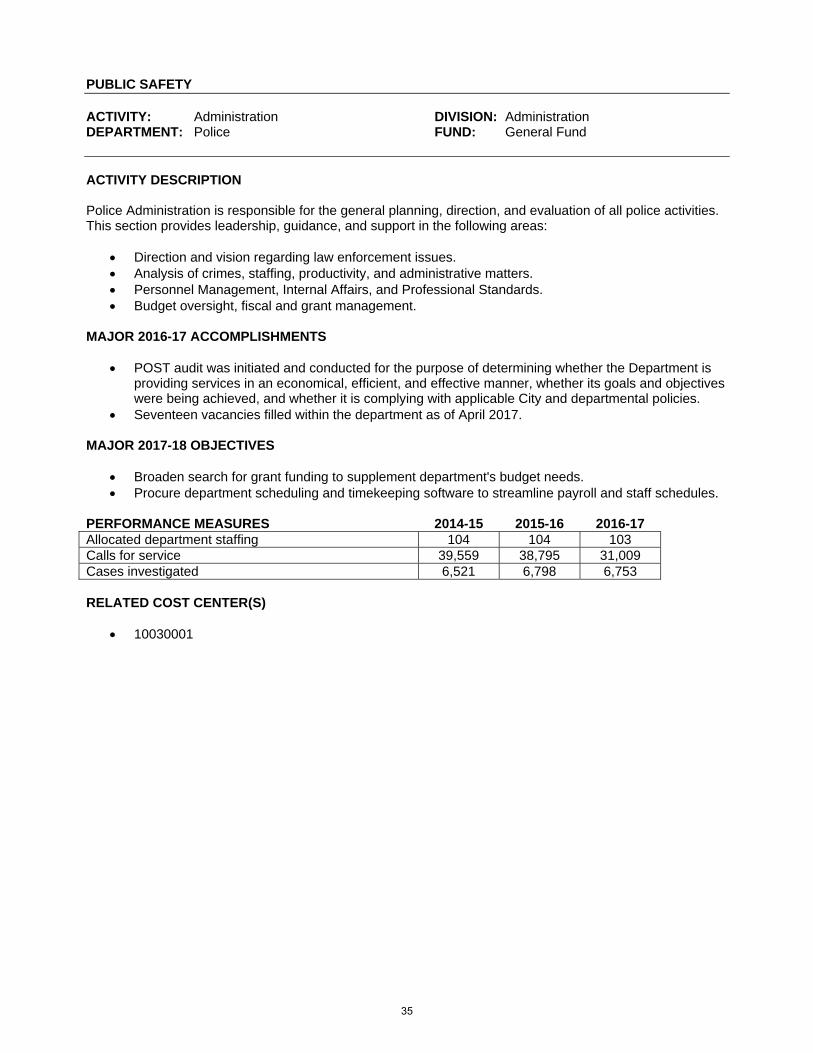
PUBLIC SAFETY ACTIVITY: Administration DIVISION: Administration DEPARTMENT: Police FUND: General Fund ACTIVITY DESCRIPTION Police Administration is responsible for the general planning, direction, and evaluation of all police activities. This section provides leadership, guidance, and support in the following areas:
Direction and vision regarding law enforcement issues. Analysis of crimes, staffing, productivity, and administrative matters. Personnel Management, Internal Affairs, and Professional Standards. Budget oversight, fiscal and grant management.
MAJOR 2016-17 ACCOMPLISHMENTS
POST audit was initiated and conducted for the purpose of determining whether the Department is providing services in an economical, efficient, and effective manner, whether its goals and objectives were being achieved, and whether it is complying with applicable City and departmental policies.
Seventeen vacancies filled within the department as of April 2017. MAJOR 2017-18 OBJECTIVES
Broaden search for grant funding to supplement department's budget needs. Procure department scheduling and timekeeping software to streamline payroll and staff schedules.
PERFORMANCE MEASURES 2014-15 2015-16 2016-17 Allocated department staffing 104 104 103 Calls for service 39,559 38,795 31,009 Cases investigated 6,521 6,798 6,753 RELATED COST CENTER(S)
10030001
35
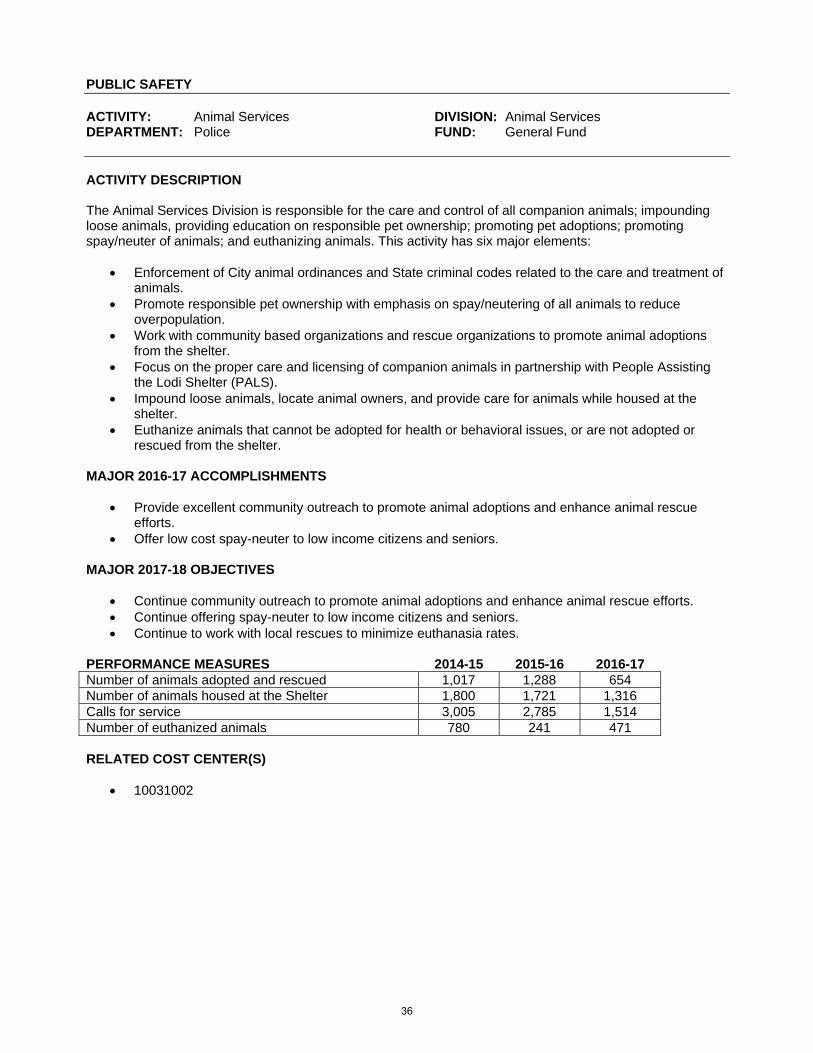
PUBLIC SAFETY ACTIVITY: Animal Services DIVISION: Animal Services DEPARTMENT: Police FUND: General Fund ACTIVITY DESCRIPTION The Animal Services Division is responsible for the care and control of all companion animals; impounding loose animals, providing education on responsible pet ownership; promoting pet adoptions; promoting spay/neuter of animals; and euthanizing animals. This activity has six major elements:
Enforcement of City animal ordinances and State criminal codes related to the care and treatment of animals.
Promote responsible pet ownership with emphasis on spay/neutering of all animals to reduce overpopulation.
Work with community based organizations and rescue organizations to promote animal adoptions from the shelter.
Focus on the proper care and licensing of companion animals in partnership with People Assisting the Lodi Shelter (PALS).
Impound loose animals, locate animal owners, and provide care for animals while housed at the shelter.
Euthanize animals that cannot be adopted for health or behavioral issues, or are not adopted or rescued from the shelter.
MAJOR 2016-17 ACCOMPLISHMENTS
Provide excellent community outreach to promote animal adoptions and enhance animal rescue efforts.
Offer low cost spay-neuter to low income citizens and seniors. MAJOR 2017-18 OBJECTIVES
Continue community outreach to promote animal adoptions and enhance animal rescue efforts. Continue offering spay-neuter to low income citizens and seniors. Continue to work with local rescues to minimize euthanasia rates.
PERFORMANCE MEASURES 2014-15 2015-16 2016-17 Number of animals adopted and rescued 1,017 1,288 654 Number of animals housed at the Shelter 1,800 1,721 1,316 Calls for service 3,005 2,785 1,514 Number of euthanized animals 780 241 471 RELATED COST CENTER(S)
10031002
36
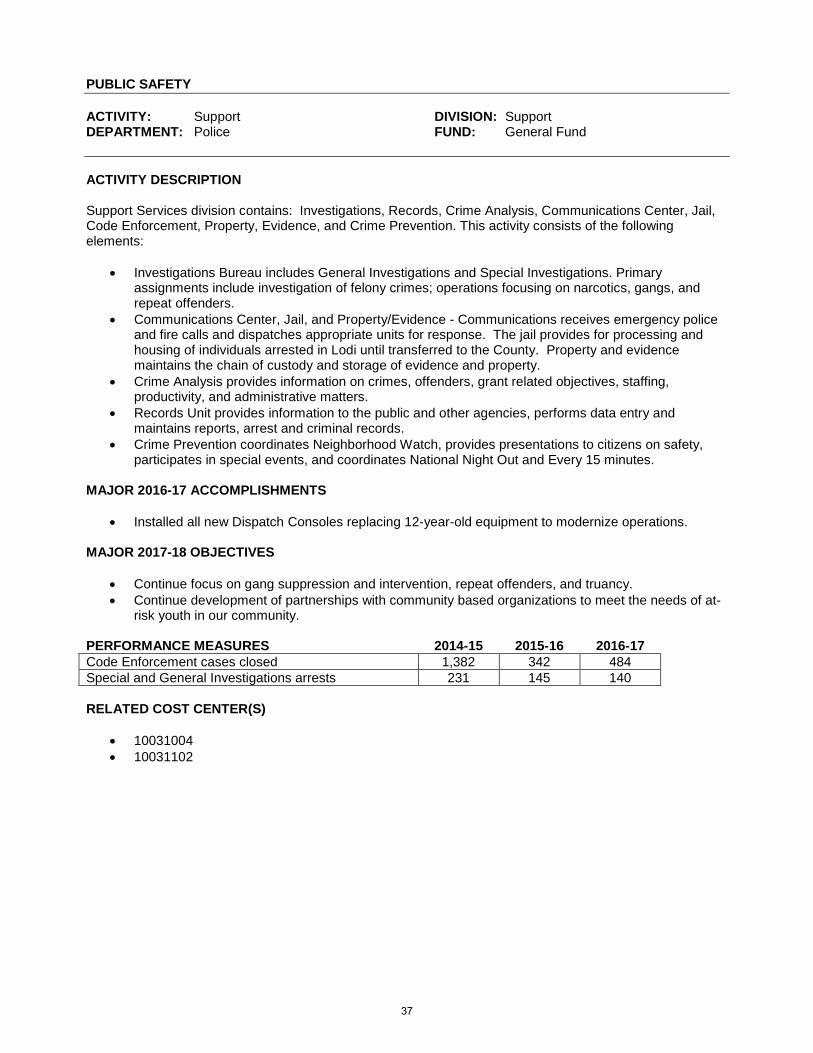
PUBLIC SAFETY ACTIVITY: Support DIVISION: Support DEPARTMENT: Police FUND: General Fund ACTIVITY DESCRIPTION Support Services division contains: Investigations, Records, Crime Analysis, Communications Center, Jail, Code Enforcement, Property, Evidence, and Crime Prevention. This activity consists of the following elements:
• Investigations Bureau includes General Investigations and Special Investigations. Primary assignments include investigation of felony crimes; operations focusing on narcotics, gangs, and repeat offenders.
• Communications Center, Jail, and Property/Evidence - Communications receives emergency police and fire calls and dispatches appropriate units for response. The jail provides for processing and housing of individuals arrested in Lodi until transferred to the County. Property and evidence maintains the chain of custody and storage of evidence and property.
• Crime Analysis provides information on crimes, offenders, grant related objectives, staffing, productivity, and administrative matters.
• Records Unit provides information to the public and other agencies, performs data entry and maintains reports, arrest and criminal records.
• Crime Prevention coordinates Neighborhood Watch, provides presentations to citizens on safety, participates in special events, and coordinates National Night Out and Every 15 minutes.
MAJOR 2016-17 ACCOMPLISHMENTS
• Installed all new Dispatch Consoles replacing 12-year-old equipment to modernize operations. MAJOR 2017-18 OBJECTIVES
• Continue focus on gang suppression and intervention, repeat offenders, and truancy. • Continue development of partnerships with community based organizations to meet the needs of at-
risk youth in our community. PERFORMANCE MEASURES 2014-15 2015-16 2016-17 Code Enforcement cases closed 1,382 342 484 Special and General Investigations arrests 231 145 140 RELATED COST CENTER(S)
• 10031004 • 10031102
37
PUBLIC SAFETY ACTIVITY: Operations DIVISION: Operations DEPARTMENT: Police FUND: General Fund ACTIVITY DESCRIPTION Police Operations maintains public order, apprehends violators of the law, incarcerates criminals, and enforces traffic regulations. Operations staff maintain open communication, focus on problem areas, and initiate strategies for resolution. Officers strive to create a safe and secure community, build and maintain public trust, and provide excellent customer service to citizens. This activity consists of the following elements:
General Patrol - provide patrols for suppression and detection of criminal activity, assist citizens, respond to calls for service, investigate crimes, apprehend violators, and implement community-oriented policing strategies to resolve problems.
Provide education and direction to empower citizens to assist in resolving their problems and issues. Enforce local and State vehicle regulations, issue citations, respond to traffic accidents, and enforce
local parking regulations. School Resource Officers - in partnership with the Lodi Unified School District, provide four officers
to assist in the safety and security of schools. Officers also provide gang resistance and education training to students.
Special events - provide security, traffic control, and staffing at community events. Extraordinary police response - Special Weapons and Tactics (SWAT), Bomb Squad, Major Accident
Investigations Team, and the Critical Incident Negotiations Team response to major disturbances and high risk situations.
MAJOR 2016-17 ACCOMPLISHMENTS
Awarded $130,000 of grant funding for special DUI enforcement and special distracted driving enforcement.
Awarded $42,186 in grant funding for special ABC enforcement. Conducted special enforcement days addressing cellular phone use, warrant service, traffic
violations, and pedestrian safety. Special operations were also conducted to address problematic locations and repeat offenders.
Designated a Community Resource Police Officer to preemptively respond to the needs of the homeless community.
MAJOR 2017-18 OBJECTIVES
Work within the community to develop and foster continued positive relationships. Continue with special operations utilizing patrol officers to target crime trends, gang activity,
problematic areas, and repeat offenders. PERFORMANCE MEASURES 2014-15 2015-16 2016-17 Arrests 3,658 3,188 3,119 Traffic Citations 5,390 2,365 2,391 Drunk Driving Arrests 281 270 222 RELATED COST CENTER(S)
10032000
38
2014/2015 Actuals
2015/2016 Actuals
2016/2017 Budget
2016/2017 Estimated Actuals
2017/2018 Council Approved
Police Administration10030001 71001 Regular Employee Salary 378,049 230,710 340,620 326,800 350,18010030001 71002 Overtime 1,672 1,334 3,810 1,000 3,81010030001 71003 Part-time Salary 0 15,384 69,830 170 010030001 71007 Uniform Allowance 804 0 0 0 010030001 71009 Incentive Pay 0 361 480 970 1,21010030001 71010 Admin Leave Pay 2,721 1,104 9,580 9,580 9,88010030001 71011 Workers Compensation 11,130 10,000 26,240 26,240 32,76010030001 71012 Medical Insurance 27,789 53,263 77,300 77,000 69,84010030001 71013 Dental Insurance 2,278 1,947 4,000 3,360 4,00010030001 71014 Vision Insurance 570 471 1,000 870 84010030001 71015 Medicare Insurance 5,499 3,592 6,160 6,160 5,29010030001 71021 Service Contribution-PERS 78,161 69,001 114,320 113,080 45,37010030001 71022 Unfunded Acc Liability - PERS 0 0 0 0 81,87010030001 71023 Deferred Comp 5,162 2,266 4,660 4,660 8,27010030001 71024 LI & AD & D 2,639 1,192 1,850 1,850 1,92010030001 71025 Unemployment Insurance 1,340 1,285 2,250 1,810 1,93010030001 71028 LTD 609 417 2,380 2,380 1,75010030001 71029 Chiropractic 137 188 240 340 40010030001 71031 Other Benefits 12,150 7,700 17,240 17,240 20,52010030001 71032 Cell Stipend 1,165 944 1,200 500 0
Salaries & Benefits Total 531,876 401,159 683,160 594,010 639,84010030001 72201 Postage 580 584 1,500 600 75010030001 72202 Telephone 7,806 10,605 7,000 14,000 10,00010030001 72203 Cellular phone charges 16 724 0 0 010030001 72204 Pagers 16 0 0 0 010030001 72301 Printing/Binding/Duplication 6,272 6,578 5,000 6,000 5,00010030001 72302 Photocopying 11,119 22,722 21,000 26,000 21,00010030001 72304 Laundry & Dry Cleaning 16 0 0 1,540 010030001 72305 Uniforms 313 0 0 0 010030001 72306 Safety Equipment 10 0 0 0 010030001 72307 Office Supplies 2,774 2,782 0 1,670 1,50010030001 72308 Books & Periodicals 196 120 1,000 600 1,00010030001 72309 Membership & Dues 5,783 9,843 6,500 6,500 6,50010030001 72312 Bank Service Charges 1,331 2,071 2,000 1,000 1,50010030001 72314 Business Expense 3,073 2,363 7,500 7,500 5,00010030001 72315 Conference Expense 4,868 0 0 0 35,00010030001 72352 Special Dept Materials 408 3,765 3,000 10,000 2,50010030001 72355 General Supplies 344 1,947 1,000 1,000 4,00010030001 72358 Training and Education 55,642 109,595 90,000 100,000 55,00010030001 72359 Small Tools and Equipment 4,418 3,806 2,500 3,530 2,50010030001 72369 Software Licensing Cost 2,449 0 20,000 20,000 010030001 72375 POST Training 37,648 15,041 35,000 40,000 35,00010030001 72376 Tuition Reimbursement 14,399 5,863 15,000 10,000 10,00010030001 72380 Refunds 0 0 0 (3,090) 010030001 72399 Supplies & Services NOC 0 43,463 50,000 50,000 50,00010030001 72450 Misc. Professional Services 6,883 11,148 10,000 20,000 10,00010030001 72499 Misc Contract Services 1,380 0 0 0 010030001 72533 Repairs to Vehicles 0 20 0 0 010030001 72534 Repairs to Buildings 5,630 0 0 470 010030001 72536 Car Wash 0 151 0 0 010030001 72990 Special Payments 384,457 500,420 751,390 751,390 751,550
Supplies & Services Total 557,832 753,611 1,029,390 1,068,710 1,007,80010030001 74070 PL & PD/Other Insurance 6,480 5,800 15,200 15,200 15,760
Insurances Total 6,480 5,800 15,200 15,200 15,76010030001 76220 Operating Transfer Out 637,110 225,000 289,280 289,280 0
Operating Transfer Out Total 637,110 225,000 289,280 289,280 0Police Administration Total 1,733,298 1,385,570 2,017,030 1,967,200 1,663,400
Animal Services10031002 71001 Regular Employee Salary 91,720 128,592 138,910 112,120 150,86010031002 71002 Overtime 10,129 10,922 13,390 10,000 13,400
Police Department
39
2014/2015 Actuals
2015/2016 Actuals
2016/2017 Budget
2016/2017 Estimated Actuals
2017/2018 Council ApprovedPolice Department
10031002 71003 Part-time Salary 56,877 43,905 47,950 75,000 48,41010031002 71007 Uniform Allowance 1,700 2,275 2,550 2,000 2,55010031002 71011 Workers Compensation 7,420 15,000 19,680 19,680 24,57010031002 71012 Medical Insurance 42,216 44,990 47,410 41,050 56,80010031002 71013 Dental Insurance 2,059 1,921 3,000 2,020 3,00010031002 71014 Vision Insurance 515 487 750 580 63010031002 71015 Medicare Insurance 2,324 2,771 2,920 2,920 3,13010031002 71021 Service Contribution-PERS 16,770 25,785 30,140 24,840 11,76010031002 71022 Unfunded Acc Liability - PERS 0 0 0 0 22,60010031002 71023 Deferred Comp 2,346 2,302 2,890 1,500 1,87010031002 71024 LI & AD & D 184 267 200 200 29010031002 71025 Unemployment Insurance 817 1,202 1,110 1,110 1,19010031002 71028 LTD 229 442 960 960 75010031002 71029 Chiropractic 124 172 180 180 30010031002 71031 Other Benefits 8,100 11,550 12,930 12,930 15,390
Salaries & Benefits Total 243,530 292,583 324,970 307,090 357,50010031002 72201 Postage 155 0 1,000 300 1,00010031002 72202 Telephone 3,480 0 0 0 010031002 72203 Cellular phone charges 2,228 1,603 1,200 2,200 1,80010031002 72301 Printing/Binding/Duplication 2,668 1,279 1,500 1,300 1,50010031002 72305 Uniforms 124 32 250 700 75010031002 72306 Safety Equipment 138 0 2,500 0 010031002 72307 Office Supplies 910 0 1,000 0 1,00010031002 72308 Books & Periodicals 54 0 0 0 20010031002 72309 Membership & Dues 0 0 0 400 10010031002 72312 Bank Service Charges 1,685 1,936 2,000 1,000 2,00010031002 72313 Information Systems Software 0 0 0 0 3,00010031002 72321 Rent of Land/Facilities 4,626 7,330 7,000 10,100 7,68010031002 72352 Special Dept Materials 6,903 6,247 4,500 15,000 19,00010031002 72353 Janitorial Supplies 3,880 1,705 2,500 2,200 2,50010031002 72355 General Supplies 0 0 0 130 12,00010031002 72356 Medical Supplies 5,773 10,425 10,000 15,000 10,00010031002 72358 Training and Education 875 0 0 0 010031002 72359 Small Tools and Equipment 3,046 1,984 5,000 5,000 4,00010031002 72450 Misc. Professional Services 101,474 107,390 150,000 150,000 107,00010031002 72533 Repairs to Vehicles 1,778 3,574 5,500 5,500 4,34010031002 72534 Repairs to Buildings 0 0 0 0 2,00010031002 72536 Car Wash 0 21 630 200 3010031002 72551 Motor Vehicle Fuel & Lube 2,292 2,252 3,050 1,500 2,870
Supplies & Services Total 142,090 145,777 197,630 210,530 182,77010031002 74070 PL & PD/Other Insurance 4,320 8,700 11,400 11,400 11,820
Insurances Total 4,320 8,700 11,400 11,400 11,820Animal Services Total 389,940 447,060 534,000 529,020 552,090
Support Services10031004 71001 Regular Employee Salary 2,876,241 3,087,921 1,584,560 1,607,330 1,755,77010031004 71002 Overtime 233,138 301,349 39,980 106,000 39,99010031004 71003 Part-time Salary 229,359 218,669 174,420 174,420 174,42010031004 71006 Longevity Pay 0 36,000 19,500 28,500 33,00010031004 71007 Uniform Allowance 36,834 37,183 24,000 24,340 25,30010031004 71009 Incentive Pay 178,397 193,231 45,960 51,770 57,52010031004 71010 Admin Leave Pay 7,079 23,746 2,930 2,930 2,96010031004 71011 Workers Compensation 159,530 220,000 170,560 170,560 229,32010031004 71012 Medical Insurance 612,853 593,033 385,150 396,230 410,12010031004 71013 Dental Insurance 34,816 32,334 26,000 24,230 28,00010031004 71014 Vision Insurance 10,294 8,717 6,500 6,000 5,88010031004 71015 Medicare Insurance 51,921 57,169 27,400 27,710 30,24010031004 71021 Service Contribution-PERS 871,414 998,771 383,610 406,050 161,34010031004 71022 Unfunded Acc Liability - PERS 0 0 0 0 302,50010031004 71023 Deferred Comp 67,959 73,285 34,980 34,980 39,62010031004 71024 LI & AD & D 3,598 3,467 1,740 1,740 2,63010031004 71025 Unemployment Insurance 16,451 16,995 9,160 9,310 10,870
40
2014/2015 Actuals
2015/2016 Actuals
2016/2017 Budget
2016/2017 Estimated Actuals
2017/2018 Council ApprovedPolice Department
10031004 71028 LTD 3,663 5,088 10,670 10,670 7,87010031004 71029 Chiropractic 2,470 2,975 1,500 3,150 2,80010031004 71030 Medical In-lieu 6,991 0 0 0 010031004 71031 Other Benefits 174,150 246,239 115,840 115,840 147,45010031004 71032 Cell Stipend 5,487 6,602 300 100 0
Salaries & Benefits Total 5,582,645 6,162,776 3,064,760 3,201,860 3,467,60010031004 72201 Postage 0 971 0 0 010031004 72202 Telephone 1,316 0 0 1,710 010031004 72203 Cellular phone charges 1,106 3,693 460 5,100 010031004 72301 Printing/Binding/Duplication 1,739 3,029 1,000 0 1,00010031004 72302 Photocopying 1,422 508 0 200 010031004 72303 Advertising 0 320 0 100 010031004 72304 Laundry & Dry Cleaning 4,429 16,268 15,000 15,000 15,00010031004 72305 Uniforms 3,456 1,598 1,500 4,000 1,50010031004 72306 Safety Equipment 19,379 130,718 7,500 7,500 7,50010031004 72307 Office Supplies 27,671 32,219 30,000 34,000 30,00010031004 72308 Books & Periodicals 15 0 0 0 60010031004 72309 Membership & Dues 95 0 0 0 17010031004 72313 Information Systems Software 1,383 3,210 3,000 3,000 26,86010031004 72352 Special Dept Materials 5,018 5,858 1,000 3,970 1,00010031004 72353 Janitorial Supplies 192 5,722 2,500 18,000 2,50010031004 72355 General Supplies 1,247 2,103 5,000 500 1,00010031004 72356 Medical Supplies 2,822 (4,831) 5,000 5,000 16,00010031004 72357 Care of Prisoners 35,950 23,643 30,000 25,000 22,00010031004 72358 Training and Education 585 0 0 30 010031004 72359 Small Tools and Equipment 14,400 10,732 25,000 2,000 10,00010031004 72362 Laboratory Supplies 5,297 3,123 4,500 2,000 2,00010031004 72369 Software Licensing Cost 670 10,686 0 2,140 1,39010031004 72399 Supplies & Services NOC 0 0 0 1,160 010031004 72450 Misc. Professional Services 309,774 335,575 430,000 430,000 350,00010031004 72499 Misc Contract Services 0 0 0 0 27,31010031004 72530 Repairs to Communication Equi 686 941 5,000 0 010031004 72533 Repairs to Vehicles 29 0 0 0 0
Supplies & Services Total 438,679 586,084 566,460 560,410 515,83010031004 74070 PL & PD/Other Insurance 92,880 127,600 95,000 95,000 110,320
Insurances Total 92,880 127,600 95,000 95,000 110,320Support Services Total 6,114,204 6,876,460 3,726,220 3,857,270 4,093,750
AB109 Comm.Corrections Prtnshp10031102 71001 Regular Employee Salary 48,177 128,796 81,960 82,610 82,77010031102 71002 Overtime 15,519 4,761 5,900 4,000 5,97010031102 71006 Longevity Pay 0 0 0 0 3,00010031102 71007 Uniform Allowance 950 959 950 960 95010031102 71009 Incentive Pay 12,961 10,197 10,050 12,220 12,00010031102 71011 Workers Compensation 3,710 5,000 6,560 6,560 8,19010031102 71012 Medical Insurance 16,044 18,933 20,510 20,690 20,51010031102 71013 Dental Insurance 1,004 833 1,000 870 1,00010031102 71014 Vision Insurance 254 226 250 230 21010031102 71015 Medicare Insurance 1,521 1,694 1,430 1,430 1,51010031102 71021 Service Contribution-PERS 34,056 43,802 41,430 42,870 17,50010031102 71022 Unfunded Acc Liability - PERS 0 0 0 0 30,76010031102 71023 Deferred Comp 2,603 1,995 1,280 1,280 2,48010031102 71024 LI & AD & D 33 34 40 40 3010031102 71025 Unemployment Insurance 409 454 0 500 46010031102 71029 Chiropractic 61 77 60 100 10010031102 71031 Other Benefits 4,050 3,850 4,310 4,310 5,130
Salaries & Benefits Total 141,351 221,610 175,730 178,670 192,57010031102 72375 POST Training 550 0 0 0 0
Supplies & Services Total 550 0 0 0 010031102 74070 PL & PD/Other Insurance 2,160 2,900 3,800 3,800 3,940
Insurances Total 2,160 2,900 3,800 3,800 3,940AB109 Comm.Corrections Prtnshp Total 144,061 224,510 179,530 182,470 196,510
41
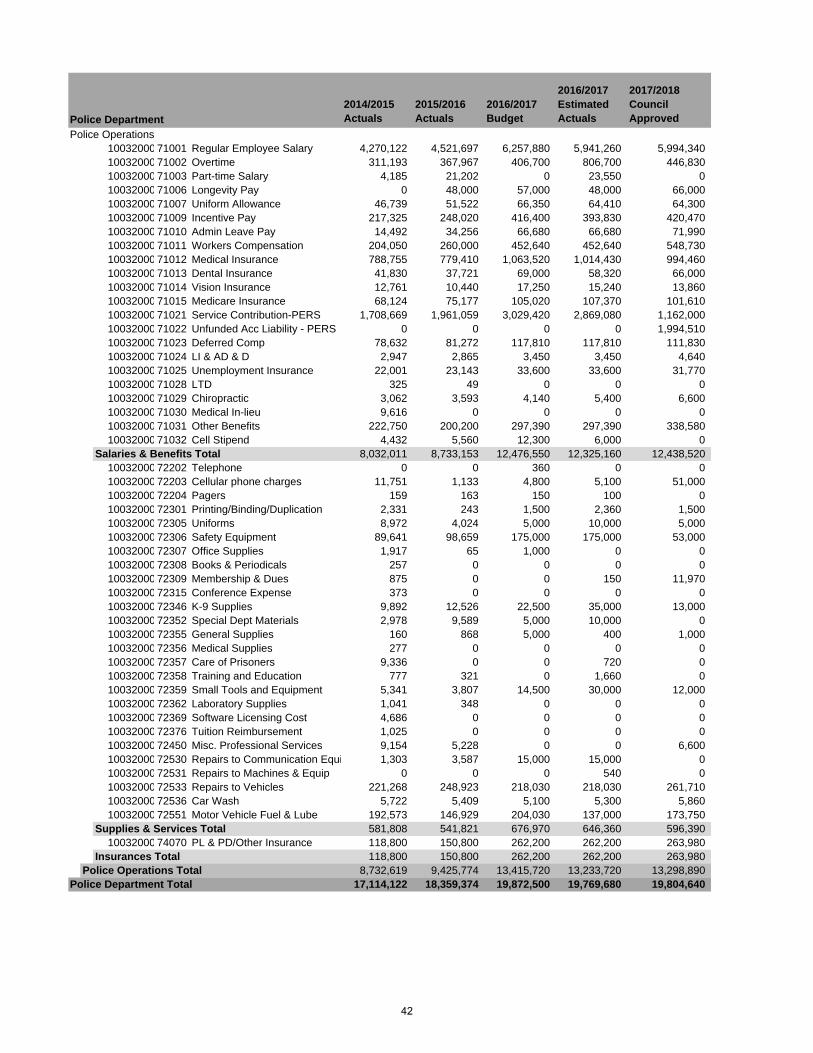
2014/2015 Actuals
2015/2016 Actuals
2016/2017 Budget
2016/2017 Estimated Actuals
2017/2018 Council ApprovedPolice Department
Police Operations10032000 71001 Regular Employee Salary 4,270,122 4,521,697 6,257,880 5,941,260 5,994,34010032000 71002 Overtime 311,193 367,967 406,700 806,700 446,83010032000 71003 Part-time Salary 4,185 21,202 0 23,550 010032000 71006 Longevity Pay 0 48,000 57,000 48,000 66,00010032000 71007 Uniform Allowance 46,739 51,522 66,350 64,410 64,30010032000 71009 Incentive Pay 217,325 248,020 416,400 393,830 420,47010032000 71010 Admin Leave Pay 14,492 34,256 66,680 66,680 71,99010032000 71011 Workers Compensation 204,050 260,000 452,640 452,640 548,73010032000 71012 Medical Insurance 788,755 779,410 1,063,520 1,014,430 994,46010032000 71013 Dental Insurance 41,830 37,721 69,000 58,320 66,00010032000 71014 Vision Insurance 12,761 10,440 17,250 15,240 13,86010032000 71015 Medicare Insurance 68,124 75,177 105,020 107,370 101,61010032000 71021 Service Contribution-PERS 1,708,669 1,961,059 3,029,420 2,869,080 1,162,00010032000 71022 Unfunded Acc Liability - PERS 0 0 0 0 1,994,51010032000 71023 Deferred Comp 78,632 81,272 117,810 117,810 111,83010032000 71024 LI & AD & D 2,947 2,865 3,450 3,450 4,64010032000 71025 Unemployment Insurance 22,001 23,143 33,600 33,600 31,77010032000 71028 LTD 325 49 0 0 010032000 71029 Chiropractic 3,062 3,593 4,140 5,400 6,60010032000 71030 Medical In-lieu 9,616 0 0 0 010032000 71031 Other Benefits 222,750 200,200 297,390 297,390 338,58010032000 71032 Cell Stipend 4,432 5,560 12,300 6,000 0
Salaries & Benefits Total 8,032,011 8,733,153 12,476,550 12,325,160 12,438,52010032000 72202 Telephone 0 0 360 0 010032000 72203 Cellular phone charges 11,751 1,133 4,800 5,100 51,00010032000 72204 Pagers 159 163 150 100 010032000 72301 Printing/Binding/Duplication 2,331 243 1,500 2,360 1,50010032000 72305 Uniforms 8,972 4,024 5,000 10,000 5,00010032000 72306 Safety Equipment 89,641 98,659 175,000 175,000 53,00010032000 72307 Office Supplies 1,917 65 1,000 0 010032000 72308 Books & Periodicals 257 0 0 0 010032000 72309 Membership & Dues 875 0 0 150 11,97010032000 72315 Conference Expense 373 0 0 0 010032000 72346 K-9 Supplies 9,892 12,526 22,500 35,000 13,00010032000 72352 Special Dept Materials 2,978 9,589 5,000 10,000 010032000 72355 General Supplies 160 868 5,000 400 1,00010032000 72356 Medical Supplies 277 0 0 0 010032000 72357 Care of Prisoners 9,336 0 0 720 010032000 72358 Training and Education 777 321 0 1,660 010032000 72359 Small Tools and Equipment 5,341 3,807 14,500 30,000 12,00010032000 72362 Laboratory Supplies 1,041 348 0 0 010032000 72369 Software Licensing Cost 4,686 0 0 0 010032000 72376 Tuition Reimbursement 1,025 0 0 0 010032000 72450 Misc. Professional Services 9,154 5,228 0 0 6,60010032000 72530 Repairs to Communication Equi 1,303 3,587 15,000 15,000 010032000 72531 Repairs to Machines & Equip 0 0 0 540 010032000 72533 Repairs to Vehicles 221,268 248,923 218,030 218,030 261,71010032000 72536 Car Wash 5,722 5,409 5,100 5,300 5,86010032000 72551 Motor Vehicle Fuel & Lube 192,573 146,929 204,030 137,000 173,750
Supplies & Services Total 581,808 541,821 676,970 646,360 596,39010032000 74070 PL & PD/Other Insurance 118,800 150,800 262,200 262,200 263,980
Insurances Total 118,800 150,800 262,200 262,200 263,980Police Operations Total 8,732,619 9,425,774 13,415,720 13,233,720 13,298,890
Police Department Total 17,114,122 18,359,374 19,872,500 19,769,680 19,804,640
42
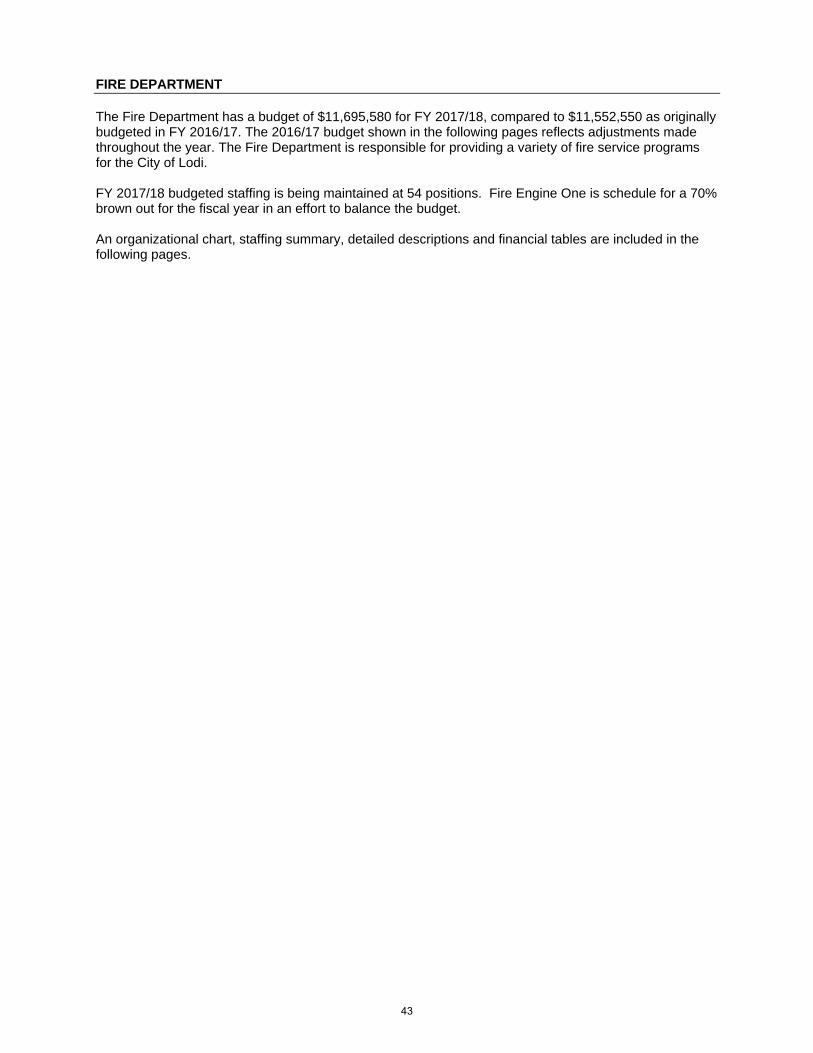
FIRE DEPARTMENT The Fire Department has a budget of $11,695,580 for FY 2017/18, compared to $11,552,550 as originally budgeted in FY 2016/17. The 2016/17 budget shown in the following pages reflects adjustments made throughout the year. The Fire Department is responsible for providing a variety of fire service programs for the City of Lodi. FY 2017/18 budgeted staffing is being maintained at 54 positions. Fire Engine One is schedule for a 70% brown out for the fiscal year in an effort to balance the budget. An organizational chart, staffing summary, detailed descriptions and financial tables are included in the following pages.
43

(This page intentionally left blank)
44
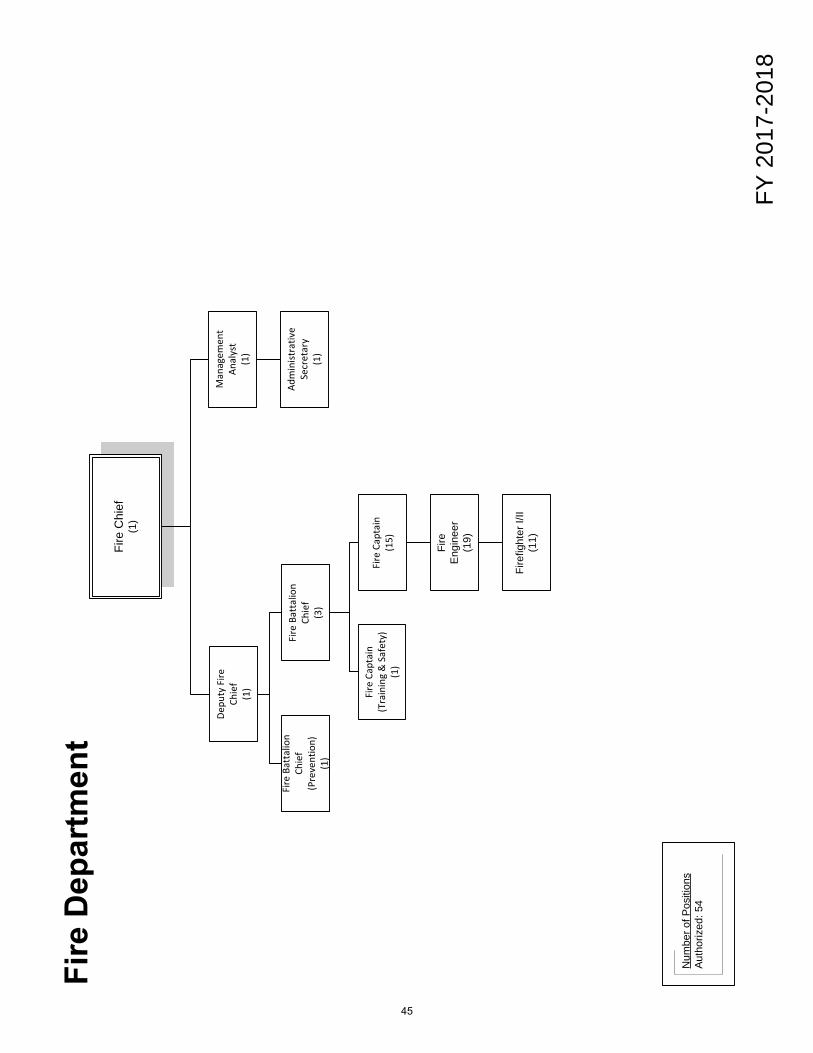
FY 2
017-
2018
Num
ber o
f Pos
ition
sAu
thor
ized
: 54
Fire
Chi
ef(1
)
Man
agem
ent
Anal
yst
(1)
Depu
ty F
ire
Chie
f(1
)
Adm
inist
rativ
e Se
cret
ary
(1)
Fire
Bat
talio
nCh
ief
(Pre
vent
ion)
(1)
Fire
Bat
talio
nCh
ief
(3)
Fire
Cap
tain
(15)
Fire
Cap
tain
(Tra
inin
g &
Saf
ety)
(1)
Fire
Eng
inee
r(1
9)
Fire
fight
er I/
II(1
1)
45
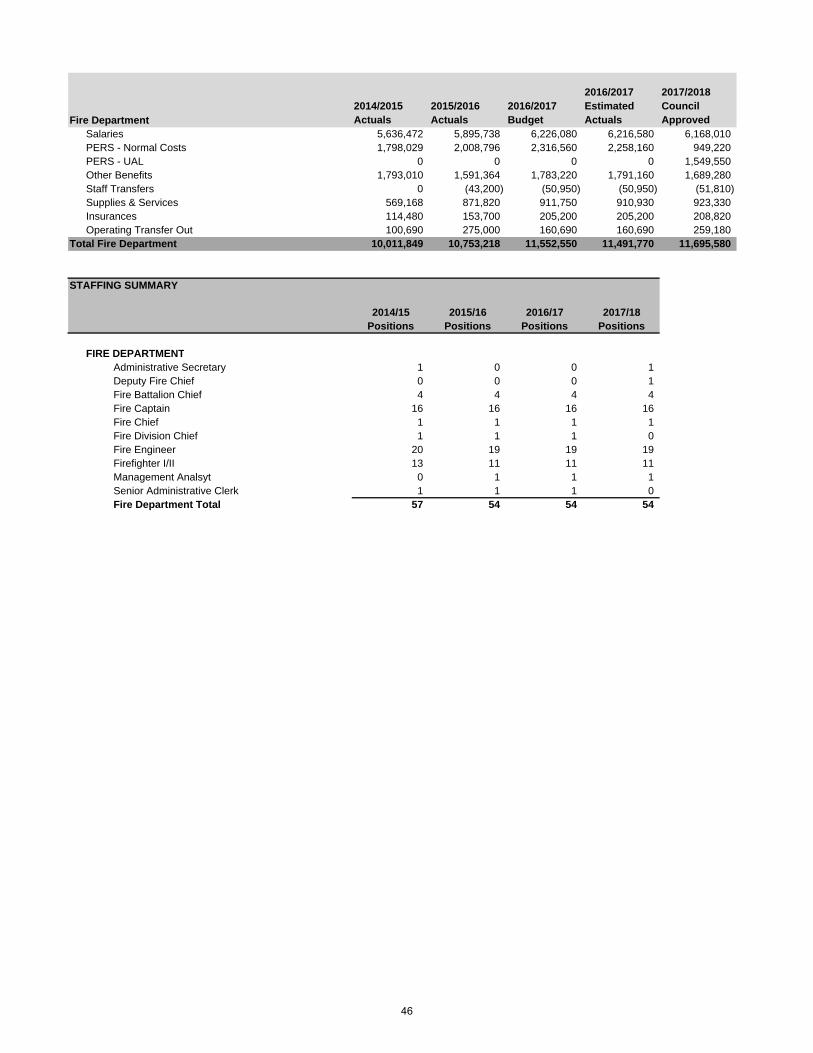
2014/2015 Actuals
2015/2016 Actuals
2016/2017 Budget
2016/2017 Estimated Actuals
2017/2018 Council Approved
Salaries 5,636,472 5,895,738 6,226,080 6,216,580 6,168,010PERS - Normal Costs 1,798,029 2,008,796 2,316,560 2,258,160 949,220PERS - UAL 0 0 0 0 1,549,550Other Benefits 1,793,010 1,591,364 1,783,220 1,791,160 1,689,280Staff Transfers 0 (43,200) (50,950) (50,950) (51,810)Supplies & Services 569,168 871,820 911,750 910,930 923,330Insurances 114,480 153,700 205,200 205,200 208,820Operating Transfer Out 100,690 275,000 160,690 160,690 259,180
Total Fire Department 10,011,849 10,753,218 11,552,550 11,491,770 11,695,580
STAFFING SUMMARY
2014/15 2015/16 2016/17 2017/18Positions Positions Positions Positions
FIRE DEPARTMENTAdministrative Secretary 1 0 0 1Deputy Fire Chief 0 0 0 1Fire Battalion Chief 4 4 4 4Fire Captain 16 16 16 16Fire Chief 1 1 1 1Fire Division Chief 1 1 1 0Fire Engineer 20 19 19 19Firefighter I/II 13 11 11 11Management Analsyt 0 1 1 1Senior Administrative Clerk 1 1 1 0Fire Department Total 57 54 54 54
Fire Department
46
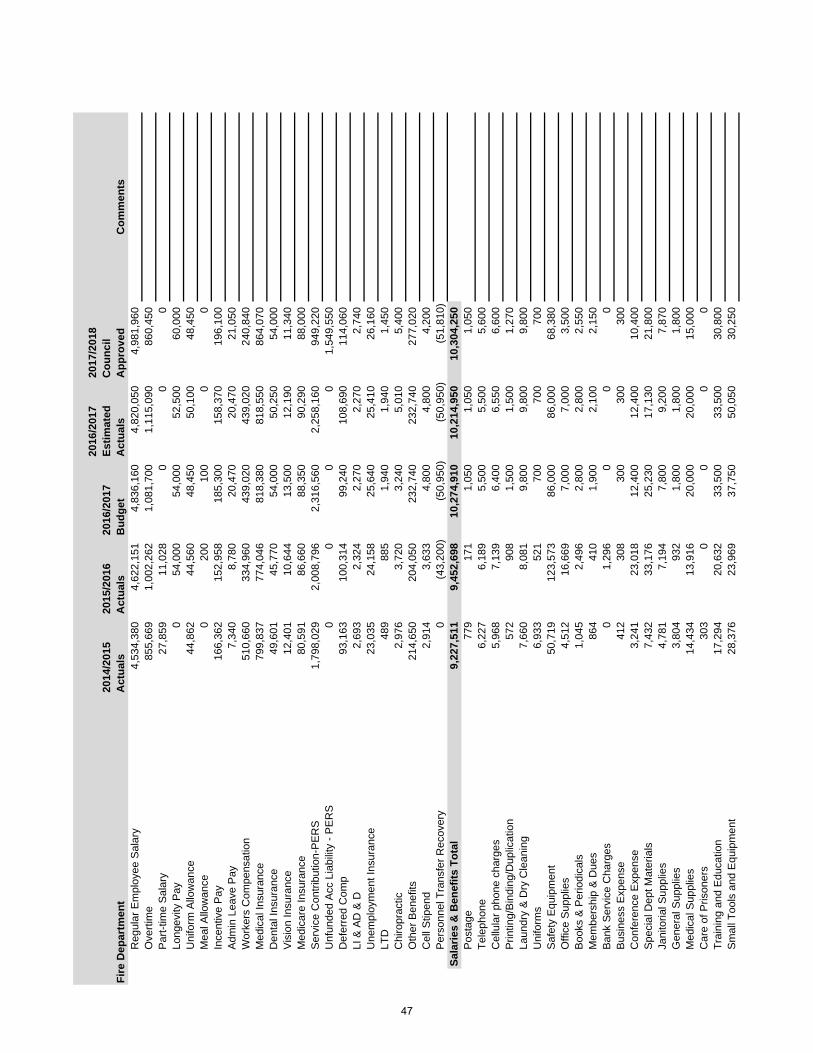
2014
/201
5 A
ctua
ls20
15/2
016
Act
uals
2016
/201
7 B
udge
t
2016
/201
7 Es
timat
ed
Act
uals
2017
/201
8 C
ounc
il A
ppro
ved
Com
men
tsR
egul
ar E
mpl
oyee
Sal
ary
4,53
4,38
04,
622,
151
4,83
6,16
04,
820,
050
4,98
1,96
0O
verti
me
855,
669
1,00
2,26
21,
081,
700
1,11
5,09
086
0,45
0P
art-t
ime
Sal
ary
27,8
5911
,028
00
0Lo
ngev
ity P
ay
054
,000
54,0
0052
,500
60,0
00U
nifo
rm A
llow
ance
44
,862
44,5
6048
,450
50,1
0048
,450
Mea
l Allo
wan
ce
020
010
00
0In
cent
ive
Pay
16
6,36
215
2,95
818
5,30
015
8,37
019
6,10
0A
dmin
Lea
ve P
ay
7,34
08,
780
20,4
7020
,470
21,0
50W
orke
rs C
ompe
nsat
ion
510,
660
334,
960
439,
020
439,
020
240,
840
Med
ical
Insu
ranc
e 79
9,83
777
4,04
681
8,38
081
8,55
086
4,07
0D
enta
l Ins
uran
ce
49,6
0145
,770
54,0
0050
,250
54,0
00V
isio
n In
sura
nce
12,4
0110
,644
13,5
0012
,190
11,3
40M
edic
are
Insu
ranc
e 80
,591
86,6
6088
,350
90,2
9088
,000
Ser
vice
Con
tribu
tion-
PE
RS
1,
798,
029
2,00
8,79
62,
316,
560
2,25
8,16
094
9,22
0U
nfun
ded
Acc
Lia
bilit
y - P
ER
S
00
00
1,54
9,55
0D
efer
red
Com
p 93
,163
100,
314
99,2
4010
8,69
011
4,06
0LI
& A
D &
D
2,69
32,
324
2,27
02,
270
2,74
0U
nem
ploy
men
t Ins
uran
ce
23,0
3524
,158
25,6
4025
,410
26,1
60LT
D
489
885
1,94
01,
940
1,45
0C
hiro
prac
tic
2,97
63,
720
3,24
05,
010
5,40
0O
ther
Ben
efits
21
4,65
020
4,05
023
2,74
023
2,74
027
7,02
0C
ell S
tipen
d 2,
914
3,63
34,
800
4,80
04,
200
Per
sonn
el T
rans
fer R
ecov
ery
0(4
3,20
0)(5
0,95
0)(5
0,95
0)(5
1,81
0)Sa
larie
s &
Ben
efits
Tot
al9,
227,
511
9,45
2,69
810
,274
,910
10,2
14,9
5010
,304
,250
Pos
tage
77
917
11,
050
1,05
01,
050
Tele
phon
e 6,
227
6,18
95,
500
5,50
05,
600
Cel
lula
r pho
ne c
harg
es
5,96
87,
139
6,40
06,
550
6,60
0P
rintin
g/B
indi
ng/D
uplic
atio
n 57
290
81,
500
1,50
01,
270
Laun
dry
& D
ry C
lean
ing
7,66
08,
081
9,80
09,
800
9,80
0U
nifo
rms
6,93
352
170
070
070
0S
afet
y E
quip
men
t 50
,719
123,
573
86,0
0086
,000
68,3
80O
ffice
Sup
plie
s 4,
512
16,6
697,
000
7,00
03,
500
Boo
ks &
Per
iodi
cals
1,
045
2,49
62,
800
2,80
02,
550
Mem
bers
hip
& D
ues
864
410
1,90
02,
100
2,15
0B
ank
Ser
vice
Cha
rges
0
1,29
60
00
Bus
ines
s E
xpen
se
412
308
300
300
300
Con
fere
nce
Exp
ense
3,
241
23,0
1812
,400
12,4
0010
,400
Spe
cial
Dep
t Mat
eria
ls
7,43
233
,176
25,2
3017
,130
21,8
00Ja
nito
rial S
uppl
ies
4,78
17,
194
7,80
09,
200
7,87
0G
ener
al S
uppl
ies
3,80
493
21,
800
1,80
01,
800
Med
ical
Sup
plie
s 14
,434
13,9
1620
,000
20,0
0015
,000
Car
e of
Pris
oner
s 30
30
00
0Tr
aini
ng a
nd E
duca
tion
17,2
9420
,632
33,5
0033
,500
30,8
00S
mal
l Too
ls a
nd E
quip
men
t 28
,376
23,9
6937
,750
50,0
5030
,250
Fire
Dep
artm
ent
47
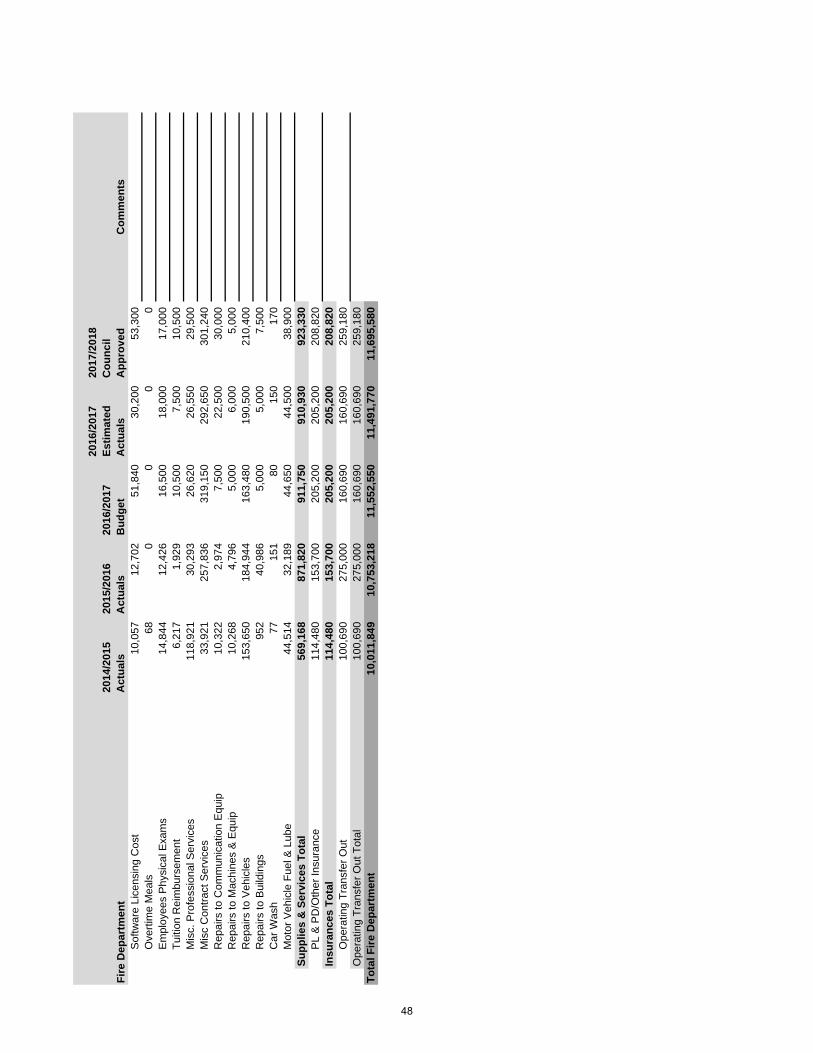
2014
/201
5 A
ctua
ls20
15/2
016
Act
uals
2016
/201
7 B
udge
t
2016
/201
7 Es
timat
ed
Act
uals
2017
/201
8 C
ounc
il A
ppro
ved
Com
men
tsFi
re D
epar
tmen
tS
oftw
are
Lice
nsin
g C
ost
10,0
5712
,702
51,8
4030
,200
53,3
00O
verti
me
Mea
ls
680
00
0E
mpl
oyee
s P
hysi
cal E
xam
s 14
,844
12,4
2616
,500
18,0
0017
,000
Tuiti
on R
eim
burs
emen
t 6,
217
1,92
910
,500
7,50
010
,500
Mis
c. P
rofe
ssio
nal S
ervi
ces
118,
921
30,2
9326
,620
26,5
5029
,500
Mis
c C
ontra
ct S
ervi
ces
33,9
2125
7,83
631
9,15
029
2,65
030
1,24
0R
epai
rs to
Com
mun
icat
ion
Equ
ip
10,3
222,
974
7,50
022
,500
30,0
00R
epai
rs to
Mac
hine
s &
Equ
ip
10,2
684,
796
5,00
06,
000
5,00
0R
epai
rs to
Veh
icle
s 15
3,65
018
4,94
416
3,48
019
0,50
021
0,40
0R
epai
rs to
Bui
ldin
gs
952
40,9
865,
000
5,00
07,
500
Car
Was
h 77
151
8015
017
0M
otor
Veh
icle
Fue
l & L
ube
44,5
1432
,189
44,6
5044
,500
38,9
00Su
pplie
s &
Ser
vice
s To
tal
569,
168
871,
820
911,
750
910,
930
923,
330
PL
& P
D/O
ther
Insu
ranc
e 11
4,48
015
3,70
020
5,20
020
5,20
020
8,82
0In
sura
nces
Tot
al11
4,48
015
3,70
020
5,20
020
5,20
020
8,82
0O
pera
ting
Tran
sfer
Out
10
0,69
027
5,00
016
0,69
016
0,69
025
9,18
0O
pera
ting
Tran
sfer
Out
Tot
al10
0,69
027
5,00
016
0,69
016
0,69
025
9,18
0To
tal F
ire D
epar
tmen
t10
,011
,849
10,7
53,2
1811
,552
,550
11,4
91,7
7011
,695
,580
48
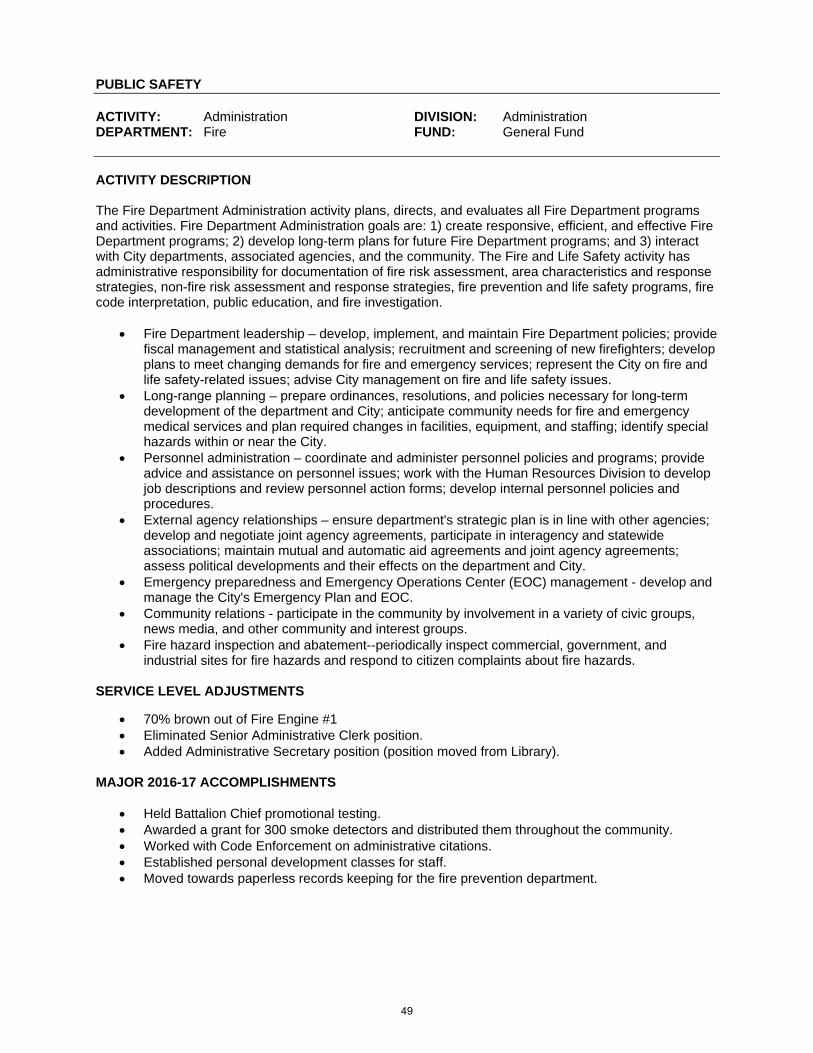
PUBLIC SAFETY ACTIVITY: Administration DIVISION: Administration DEPARTMENT: Fire FUND: General Fund ACTIVITY DESCRIPTION The Fire Department Administration activity plans, directs, and evaluates all Fire Department programs and activities. Fire Department Administration goals are: 1) create responsive, efficient, and effective Fire Department programs; 2) develop long-term plans for future Fire Department programs; and 3) interact with City departments, associated agencies, and the community. The Fire and Life Safety activity has administrative responsibility for documentation of fire risk assessment, area characteristics and response strategies, non-fire risk assessment and response strategies, fire prevention and life safety programs, fire code interpretation, public education, and fire investigation.
Fire Department leadership – develop, implement, and maintain Fire Department policies; provide fiscal management and statistical analysis; recruitment and screening of new firefighters; develop plans to meet changing demands for fire and emergency services; represent the City on fire and life safety-related issues; advise City management on fire and life safety issues.
Long-range planning – prepare ordinances, resolutions, and policies necessary for long-term development of the department and City; anticipate community needs for fire and emergency medical services and plan required changes in facilities, equipment, and staffing; identify special hazards within or near the City.
Personnel administration – coordinate and administer personnel policies and programs; provide advice and assistance on personnel issues; work with the Human Resources Division to develop job descriptions and review personnel action forms; develop internal personnel policies and procedures.
External agency relationships – ensure department's strategic plan is in line with other agencies; develop and negotiate joint agency agreements, participate in interagency and statewide associations; maintain mutual and automatic aid agreements and joint agency agreements; assess political developments and their effects on the department and City.
Emergency preparedness and Emergency Operations Center (EOC) management - develop and manage the City's Emergency Plan and EOC.
Community relations - participate in the community by involvement in a variety of civic groups, news media, and other community and interest groups.
Fire hazard inspection and abatement--periodically inspect commercial, government, and industrial sites for fire hazards and respond to citizen complaints about fire hazards.
SERVICE LEVEL ADJUSTMENTS
70% brown out of Fire Engine #1 Eliminated Senior Administrative Clerk position. Added Administrative Secretary position (position moved from Library).
MAJOR 2016-17 ACCOMPLISHMENTS
Held Battalion Chief promotional testing. Awarded a grant for 300 smoke detectors and distributed them throughout the community. Worked with Code Enforcement on administrative citations. Established personal development classes for staff. Moved towards paperless records keeping for the fire prevention department.
49
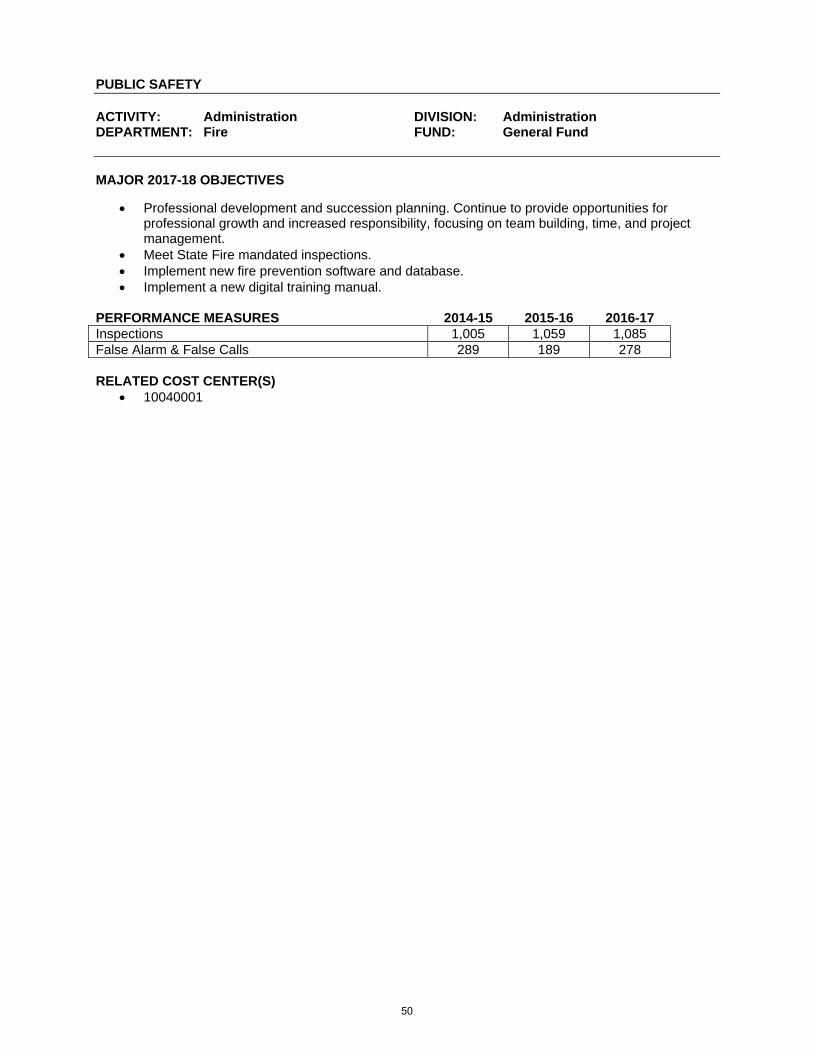
PUBLIC SAFETY ACTIVITY: Administration DIVISION: Administration DEPARTMENT: Fire FUND: General Fund MAJOR 2017-18 OBJECTIVES
Professional development and succession planning. Continue to provide opportunities for professional growth and increased responsibility, focusing on team building, time, and project management.
Meet State Fire mandated inspections. Implement new fire prevention software and database. Implement a new digital training manual.
PERFORMANCE MEASURES 2014-15 2015-16 2016-17 Inspections 1,005 1,059 1,085 False Alarm & False Calls 289 189 278 RELATED COST CENTER(S)
10040001
50
PUBLIC SAFETY ACTIVITY: Emergency Operations DIVISION: Emergency Operations DEPARTMENT: Fire FUND: General Fund ACTIVITY DESCRIPTION Emergency Operations plans, directs, and evaluates all Fire Department programs for emergency response and their related activities. These include: protecting life and property by responding to medical emergencies, rescues, fires, hazardous material incidents, and other emergencies. Activity goals are: 1) safe, effective, and efficient emergency response programs; 2) timely response to calls for services; 3) no loss of life from reported emergencies; and 4) minimize property damage from reported emergencies. This activity has the following elements:
Emergency Medical Response – provide victims of acute trauma and illness with basic life support from certified personnel.
Fire Emergency Response – respond to fire emergency calls within six minutes on at least 90 percent of calls.
Hazardous Material Response – contain and mitigate hazardous material incidents. Rescue – free trapped or incapacitated victims of vehicle accidents, water-related incidents, cave-
in trenches, collapsed buildings, and confined spaces. Non-Emergency Activity – conduct fire inspections, input information for required reports, and
maintenance of fire apparatus and facilities. Training – conduct training for preparation and readiness for various emergency conditions. Public Education – conduct station tours and safety presentations to the community.
MAJOR 2016-17 ACCOMPLISHMENTS
Secured delivery, outfitted, and deployed new engines 2032 and 2033. Successfully completed the fifth year of Division C Training. Completed mutual aid agreement between Lodi Fire and Consumnes Fire District. Hosted California State fire officer and chief officer classes. Transferred training grounds at Fire Station 2.
MAJOR 2017-18 OBJECTIVES
The Lodi Fire Department is committed to providing the highest levels of service and keep Engine #1 within allotted fiscal resources.
Administer Engineer, Captain, and Battalion promotional testing. Empowering staff to expand leadership opportunities preparing them for next steps in succession
planning. Upgrade TeleStaff software. Develop a comprehensive asset management and savings plan to break up the bulk of
maintenance and replacement cost allowing the City to prepare for future expenses by planning out those expenditures on a yearly basis.
PERFORMANCE MEASURES 2014-15 2015-16 2016-17 Percentage of Responses Under Six Minutes 95% 85% 87% Emergency Medical Response 571 551 552 Fire Emergency Response 4145 3826 3528 Hazardous Material Response 71 72 82 Other Responses 926 140 1078 RELATED COST CENTER(S)
10041000 10041100
51
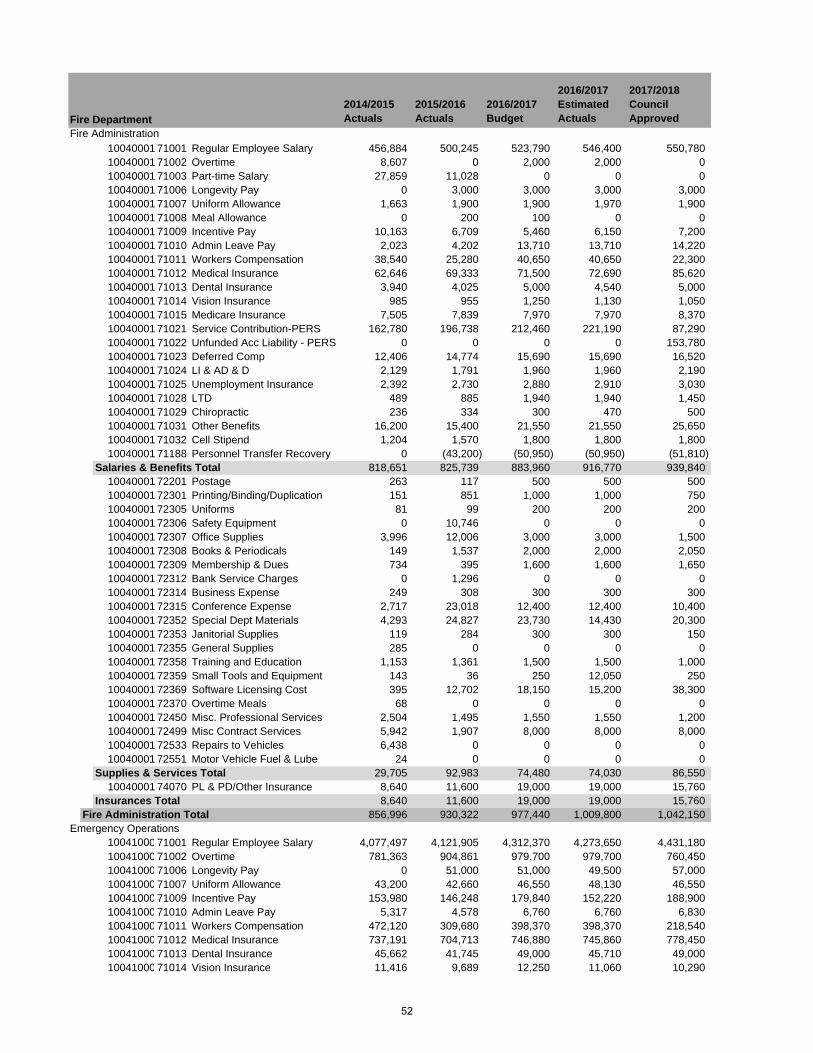
2014/2015 Actuals
2015/2016 Actuals
2016/2017 Budget
2016/2017 Estimated Actuals
2017/2018 Council Approved
Fire Administration10040001 71001 Regular Employee Salary 456,884 500,245 523,790 546,400 550,78010040001 71002 Overtime 8,607 0 2,000 2,000 010040001 71003 Part-time Salary 27,859 11,028 0 0 010040001 71006 Longevity Pay 0 3,000 3,000 3,000 3,00010040001 71007 Uniform Allowance 1,663 1,900 1,900 1,970 1,90010040001 71008 Meal Allowance 0 200 100 0 010040001 71009 Incentive Pay 10,163 6,709 5,460 6,150 7,20010040001 71010 Admin Leave Pay 2,023 4,202 13,710 13,710 14,22010040001 71011 Workers Compensation 38,540 25,280 40,650 40,650 22,30010040001 71012 Medical Insurance 62,646 69,333 71,500 72,690 85,62010040001 71013 Dental Insurance 3,940 4,025 5,000 4,540 5,00010040001 71014 Vision Insurance 985 955 1,250 1,130 1,05010040001 71015 Medicare Insurance 7,505 7,839 7,970 7,970 8,37010040001 71021 Service Contribution-PERS 162,780 196,738 212,460 221,190 87,29010040001 71022 Unfunded Acc Liability - PERS 0 0 0 0 153,78010040001 71023 Deferred Comp 12,406 14,774 15,690 15,690 16,52010040001 71024 LI & AD & D 2,129 1,791 1,960 1,960 2,19010040001 71025 Unemployment Insurance 2,392 2,730 2,880 2,910 3,03010040001 71028 LTD 489 885 1,940 1,940 1,45010040001 71029 Chiropractic 236 334 300 470 50010040001 71031 Other Benefits 16,200 15,400 21,550 21,550 25,65010040001 71032 Cell Stipend 1,204 1,570 1,800 1,800 1,80010040001 71188 Personnel Transfer Recovery 0 (43,200) (50,950) (50,950) (51,810)
Salaries & Benefits Total 818,651 825,739 883,960 916,770 939,84010040001 72201 Postage 263 117 500 500 50010040001 72301 Printing/Binding/Duplication 151 851 1,000 1,000 75010040001 72305 Uniforms 81 99 200 200 20010040001 72306 Safety Equipment 0 10,746 0 0 010040001 72307 Office Supplies 3,996 12,006 3,000 3,000 1,50010040001 72308 Books & Periodicals 149 1,537 2,000 2,000 2,05010040001 72309 Membership & Dues 734 395 1,600 1,600 1,65010040001 72312 Bank Service Charges 0 1,296 0 0 010040001 72314 Business Expense 249 308 300 300 30010040001 72315 Conference Expense 2,717 23,018 12,400 12,400 10,40010040001 72352 Special Dept Materials 4,293 24,827 23,730 14,430 20,30010040001 72353 Janitorial Supplies 119 284 300 300 15010040001 72355 General Supplies 285 0 0 0 010040001 72358 Training and Education 1,153 1,361 1,500 1,500 1,00010040001 72359 Small Tools and Equipment 143 36 250 12,050 25010040001 72369 Software Licensing Cost 395 12,702 18,150 15,200 38,30010040001 72370 Overtime Meals 68 0 0 0 010040001 72450 Misc. Professional Services 2,504 1,495 1,550 1,550 1,20010040001 72499 Misc Contract Services 5,942 1,907 8,000 8,000 8,00010040001 72533 Repairs to Vehicles 6,438 0 0 0 010040001 72551 Motor Vehicle Fuel & Lube 24 0 0 0 0
Supplies & Services Total 29,705 92,983 74,480 74,030 86,55010040001 74070 PL & PD/Other Insurance 8,640 11,600 19,000 19,000 15,760
Insurances Total 8,640 11,600 19,000 19,000 15,760Fire Administration Total 856,996 930,322 977,440 1,009,800 1,042,150
Emergency Operations10041000 71001 Regular Employee Salary 4,077,497 4,121,905 4,312,370 4,273,650 4,431,18010041000 71002 Overtime 781,363 904,861 979,700 979,700 760,45010041000 71006 Longevity Pay 0 51,000 51,000 49,500 57,00010041000 71007 Uniform Allowance 43,200 42,660 46,550 48,130 46,55010041000 71009 Incentive Pay 153,980 146,248 179,840 152,220 188,90010041000 71010 Admin Leave Pay 5,317 4,578 6,760 6,760 6,83010041000 71011 Workers Compensation 472,120 309,680 398,370 398,370 218,54010041000 71012 Medical Insurance 737,191 704,713 746,880 745,860 778,45010041000 71013 Dental Insurance 45,662 41,745 49,000 45,710 49,00010041000 71014 Vision Insurance 11,416 9,689 12,250 11,060 10,290
Fire Department
52
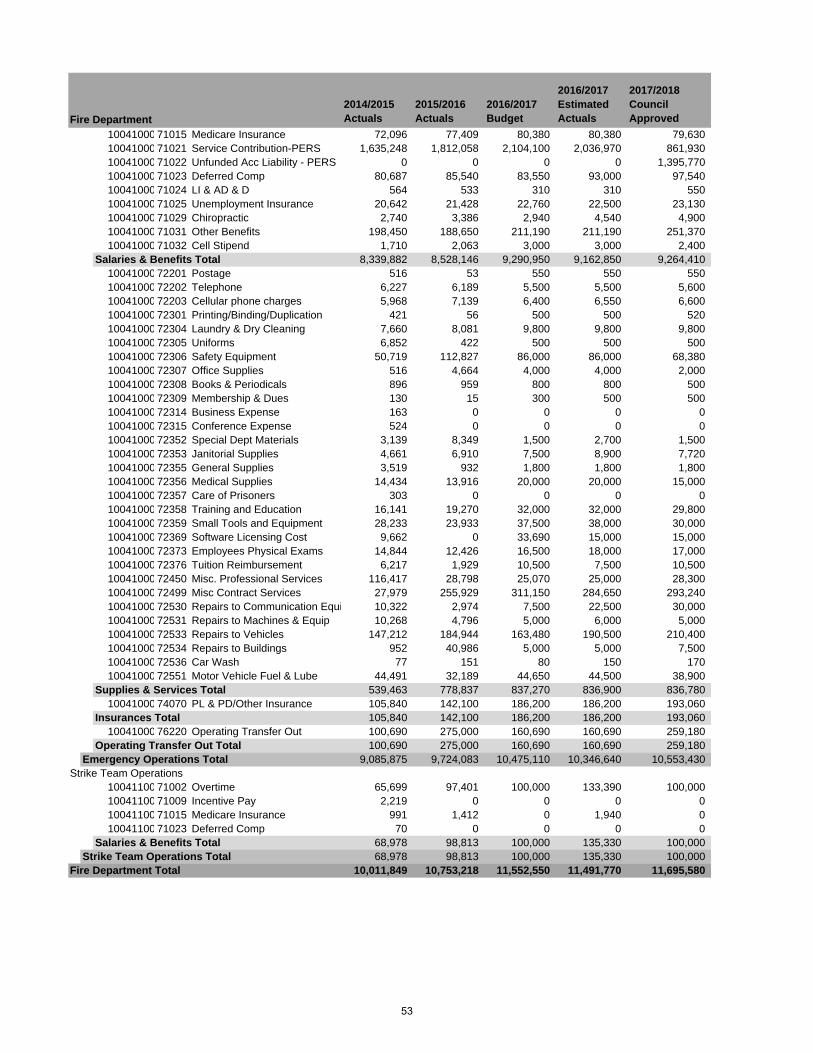
2014/2015 Actuals
2015/2016 Actuals
2016/2017 Budget
2016/2017 Estimated Actuals
2017/2018 Council ApprovedFire Department
10041000 71015 Medicare Insurance 72,096 77,409 80,380 80,380 79,63010041000 71021 Service Contribution-PERS 1,635,248 1,812,058 2,104,100 2,036,970 861,93010041000 71022 Unfunded Acc Liability - PERS 0 0 0 0 1,395,77010041000 71023 Deferred Comp 80,687 85,540 83,550 93,000 97,54010041000 71024 LI & AD & D 564 533 310 310 55010041000 71025 Unemployment Insurance 20,642 21,428 22,760 22,500 23,13010041000 71029 Chiropractic 2,740 3,386 2,940 4,540 4,90010041000 71031 Other Benefits 198,450 188,650 211,190 211,190 251,37010041000 71032 Cell Stipend 1,710 2,063 3,000 3,000 2,400
Salaries & Benefits Total 8,339,882 8,528,146 9,290,950 9,162,850 9,264,41010041000 72201 Postage 516 53 550 550 55010041000 72202 Telephone 6,227 6,189 5,500 5,500 5,60010041000 72203 Cellular phone charges 5,968 7,139 6,400 6,550 6,60010041000 72301 Printing/Binding/Duplication 421 56 500 500 52010041000 72304 Laundry & Dry Cleaning 7,660 8,081 9,800 9,800 9,80010041000 72305 Uniforms 6,852 422 500 500 50010041000 72306 Safety Equipment 50,719 112,827 86,000 86,000 68,38010041000 72307 Office Supplies 516 4,664 4,000 4,000 2,00010041000 72308 Books & Periodicals 896 959 800 800 50010041000 72309 Membership & Dues 130 15 300 500 50010041000 72314 Business Expense 163 0 0 0 010041000 72315 Conference Expense 524 0 0 0 010041000 72352 Special Dept Materials 3,139 8,349 1,500 2,700 1,50010041000 72353 Janitorial Supplies 4,661 6,910 7,500 8,900 7,72010041000 72355 General Supplies 3,519 932 1,800 1,800 1,80010041000 72356 Medical Supplies 14,434 13,916 20,000 20,000 15,00010041000 72357 Care of Prisoners 303 0 0 0 010041000 72358 Training and Education 16,141 19,270 32,000 32,000 29,80010041000 72359 Small Tools and Equipment 28,233 23,933 37,500 38,000 30,00010041000 72369 Software Licensing Cost 9,662 0 33,690 15,000 15,00010041000 72373 Employees Physical Exams 14,844 12,426 16,500 18,000 17,00010041000 72376 Tuition Reimbursement 6,217 1,929 10,500 7,500 10,50010041000 72450 Misc. Professional Services 116,417 28,798 25,070 25,000 28,30010041000 72499 Misc Contract Services 27,979 255,929 311,150 284,650 293,24010041000 72530 Repairs to Communication Equi 10,322 2,974 7,500 22,500 30,00010041000 72531 Repairs to Machines & Equip 10,268 4,796 5,000 6,000 5,00010041000 72533 Repairs to Vehicles 147,212 184,944 163,480 190,500 210,40010041000 72534 Repairs to Buildings 952 40,986 5,000 5,000 7,50010041000 72536 Car Wash 77 151 80 150 17010041000 72551 Motor Vehicle Fuel & Lube 44,491 32,189 44,650 44,500 38,900
Supplies & Services Total 539,463 778,837 837,270 836,900 836,78010041000 74070 PL & PD/Other Insurance 105,840 142,100 186,200 186,200 193,060
Insurances Total 105,840 142,100 186,200 186,200 193,06010041000 76220 Operating Transfer Out 100,690 275,000 160,690 160,690 259,180
Operating Transfer Out Total 100,690 275,000 160,690 160,690 259,180Emergency Operations Total 9,085,875 9,724,083 10,475,110 10,346,640 10,553,430
Strike Team Operations10041100 71002 Overtime 65,699 97,401 100,000 133,390 100,00010041100 71009 Incentive Pay 2,219 0 0 0 010041100 71015 Medicare Insurance 991 1,412 0 1,940 010041100 71023 Deferred Comp 70 0 0 0 0
Salaries & Benefits Total 68,978 98,813 100,000 135,330 100,000Strike Team Operations Total 68,978 98,813 100,000 135,330 100,000
Fire Department Total 10,011,849 10,753,218 11,552,550 11,491,770 11,695,580
53
(This page intentionally left blank)
54
PUBLIC WORKS – General Fund The Public Works Department comprises several functions supported by many funding sources. The General Fund allocation to Public Works supports engineering, public facilities maintenance and some administrative functions. Public Works - General Fund has a budget of $2,322,320 in FY 2017/18, compared to $2,177,750 as originally budgeted in FY 2016/17. The 2016/17 budget shown in the following pages reflects adjustments made throughout the year. Public Works receives revenue from several sources, primarily through engineering fees and inspections. Additional revenue comes from permits and encroachment fees. Public Works has a projected cost recovery of 39% for FY 2017/18 compared with a cost recovery of 30% in FY 2016/17. Public Works Administration is being assessed an internal indirect cost of services charge for the first time in FY 2017/18. This charge has no net impact on the General Fund as it is reallocated to restricted funds the department utilizes to execute its mission. FY 2017/18 budgeted staffing is being maintained at 18 positions. An organizational chart, staffing summary, detailed descriptions and financial tables are included in the following pages.
55

(This page intentionally left blank)
56
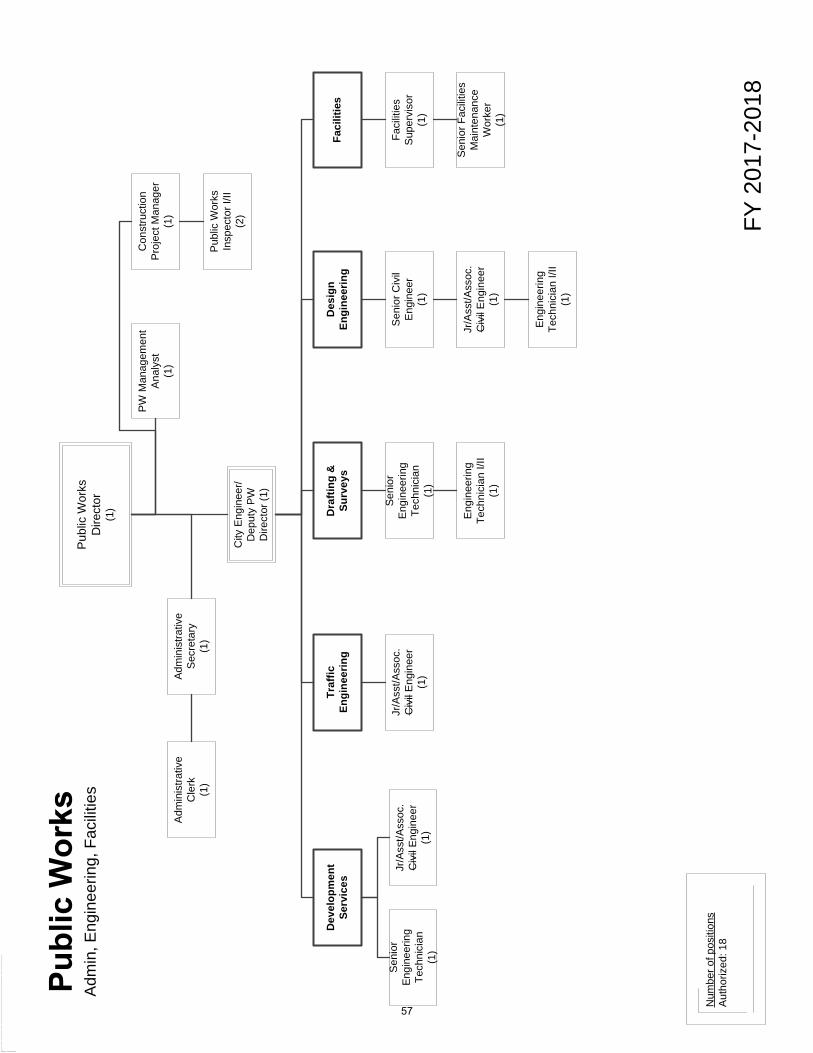
Pub
lic W
orks
Dire
ctor
(1)
City
Eng
inee
r/D
eput
y PW
D
irect
or (1
)
PW
Man
agem
ent
Ana
lyst
(1)
Con
stru
ctio
n Pr
ojec
t Man
ager
(1)
Adm
inis
trativ
eS
ecre
tary
(1)
Adm
inis
trativ
e C
lerk
(1)
Pub
lic W
orks
In
spec
tor I
/II(2
)
Dra
fting
&
Surv
eys
Des
ign
Engi
neer
ing
Traf
fic
Engi
neer
ing
Faci
litie
s D
evel
opm
ent
Serv
ices
Sen
ior
Engi
neer
ing
Tech
nici
an(1
)
Jr/A
sst/A
ssoc
.C
ivil
Engi
neer
(1)
Jr/A
sst/A
ssoc
.C
ivil
Eng
inee
r(1
)
Sen
ior
Eng
inee
ring
Tech
nici
an(1
)
Eng
inee
ring
Tech
nici
an I/
II(1
)
Sen
ior C
ivil
Eng
inee
r(1
)
Jr/A
sst/A
ssoc
.C
ivil
Eng
inee
r(1
)
Faci
litie
s S
uper
viso
r(1
)
Sen
ior F
acilit
ies
Mai
nten
ance
W
orke
r(1
)
Adm
in, E
ngin
eerin
g, F
acilit
ies
Num
ber o
f pos
ition
sA
utho
rized
: 18
FY 2
017-
2018
Engi
neer
ing
Tech
nici
an I/
II(1
)
57
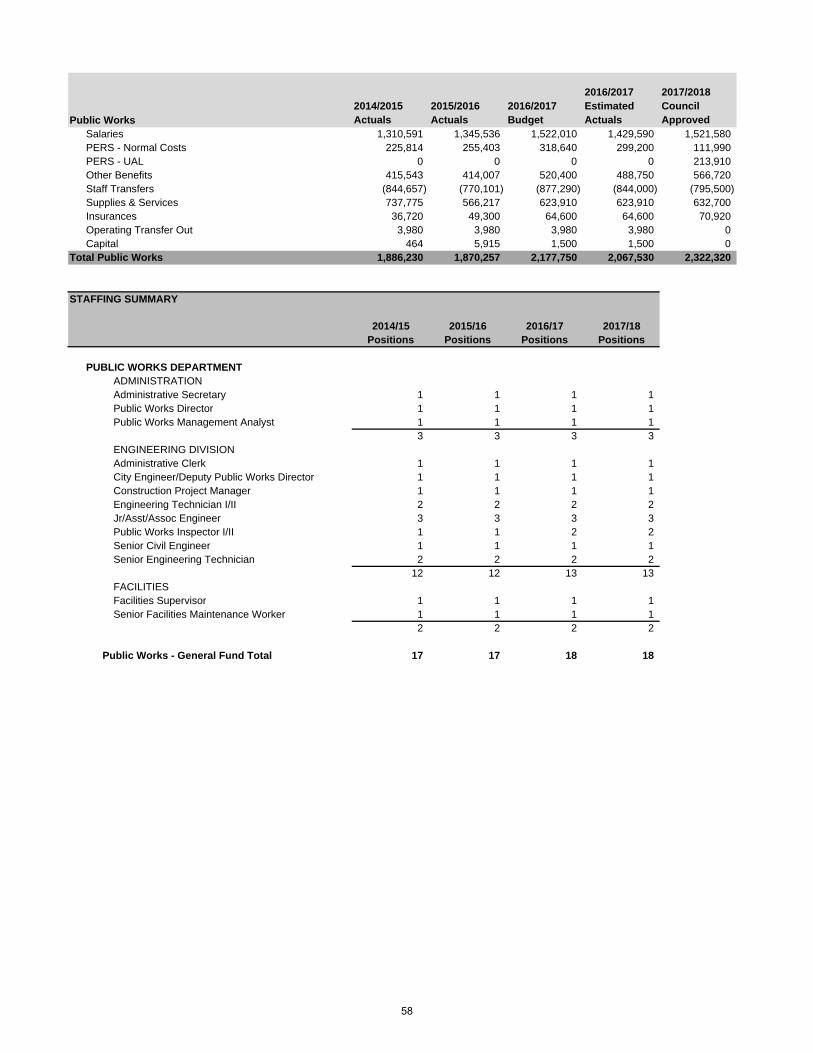
2014/2015 Actuals
2015/2016 Actuals
2016/2017 Budget
2016/2017 Estimated Actuals
2017/2018 Council Approved
Salaries 1,310,591 1,345,536 1,522,010 1,429,590 1,521,580PERS - Normal Costs 225,814 255,403 318,640 299,200 111,990PERS - UAL 0 0 0 0 213,910Other Benefits 415,543 414,007 520,400 488,750 566,720Staff Transfers (844,657) (770,101) (877,290) (844,000) (795,500)Supplies & Services 737,775 566,217 623,910 623,910 632,700Insurances 36,720 49,300 64,600 64,600 70,920Operating Transfer Out 3,980 3,980 3,980 3,980 0Capital 464 5,915 1,500 1,500 0
Total Public Works 1,886,230 1,870,257 2,177,750 2,067,530 2,322,320
STAFFING SUMMARY
2014/15 2015/16 2016/17 2017/18Positions Positions Positions Positions
PUBLIC WORKS DEPARTMENTADMINISTRATIONAdministrative Secretary 1 1 1 1Public Works Director 1 1 1 1Public Works Management Analyst 1 1 1 1
3 3 3 3ENGINEERING DIVISIONAdministrative Clerk 1 1 1 1City Engineer/Deputy Public Works Director 1 1 1 1Construction Project Manager 1 1 1 1Engineering Technician I/II 2 2 2 2Jr/Asst/Assoc Engineer 3 3 3 3Public Works Inspector I/II 1 1 2 2Senior Civil Engineer 1 1 1 1Senior Engineering Technician 2 2 2 2
12 12 13 13FACILITIESFacilities Supervisor 1 1 1 1Senior Facilities Maintenance Worker 1 1 1 1
2 2 2 2
Public Works - General Fund Total 17 17 18 18
Public Works
58

2014
/201
5 A
ctua
ls20
15/2
016
Act
uals
2016
/201
7 B
udge
t
2016
/201
7 Es
timat
ed
Act
uals
2017
/201
8 C
ounc
il A
ppro
ved
Com
men
tsR
egul
ar E
mpl
oyee
Sal
ary
1,25
2,21
71,
279,
802
1,46
3,49
01,
372,
050
1,45
3,73
0O
verti
me
11,7
437,
736
6,83
011
,280
10,7
80P
art-t
ime
Sal
ary
41,7
8852
,338
46,6
8041
,230
49,6
40U
nifo
rm A
llow
ance
1,
500
1,75
02,
000
2,00
04,
400
Mea
l Allo
wan
ce
022
50
130
0In
cent
ive
Pay
3,
342
3,90
93,
010
3,03
03,
030
Adm
in L
eave
Pay
3,
982
17,5
7332
,440
32,4
4032
,570
Wor
kers
Com
pens
atio
n 1,
330
1,26
037
,480
37,4
8091
,210
Med
ical
Insu
ranc
e 24
3,20
923
7,35
626
9,12
023
2,24
023
7,35
0D
enta
l Ins
uran
ce
16,0
4514
,934
18,0
0016
,850
18,0
00V
isio
n In
sura
nce
4,08
63,
351
4,50
03,
930
3,78
0M
edic
are
Insu
ranc
e 19
,438
19,7
6122
,550
22,5
5022
,530
Ser
vice
Con
tribu
tion-
PE
RS
22
5,81
425
5,40
331
8,64
029
9,20
011
1,99
0U
nfun
ded
Acc
Lia
bilit
y - P
ER
S
00
00
213,
910
Def
erre
d C
omp
32,4
3033
,384
31,1
1036
,960
41,9
30LI
& A
D &
D
9,94
96,
465
7,47
07,
470
7,78
0U
nem
ploy
men
t Ins
uran
ce
6,98
87,
239
8,27
07,
630
8,36
0LT
D
3,07
24,
405
10,2
0010
,200
7,27
0C
hiro
prac
tic
981
1,15
01,
080
1,49
01,
800
Med
ical
In-li
eu
3,97
70
00
0O
ther
Ben
efits
68
,850
65,4
5077
,580
77,5
8092
,340
Cel
l Stip
end
1,20
51,
454
600
1,80
01,
800
Per
sonn
el T
rans
fer R
ecov
ery
(893
,344
)(8
21,5
70)
(933
,290
)(9
00,0
00)
(850
,000
)P
erso
nnel
Tra
nsfe
r Cha
rges
48
,687
51,4
7056
,000
56,0
0054
,500
Sala
ries
& B
enef
its T
otal
1,10
7,29
11,
244,
845
1,48
3,76
01,
373,
540
1,61
8,70
0P
osta
ge
295
227
850
750
600
Tele
phon
e 7,
000
5,62
86,
000
6,00
06,
000
Cel
lula
r pho
ne c
harg
es
4,97
36,
611
7,10
07,
100
7,60
0P
rintin
g/B
indi
ng/D
uplic
atio
n 35
564
085
085
085
0A
dver
tisin
g 2,
403
1,80
52,
700
2,70
02,
200
Uni
form
s 80
21,
211
1,50
01,
500
1,50
0S
afet
y E
quip
men
t 57
115
91,
250
1,25
080
0O
ffice
Sup
plie
s 8,
601
4,12
46,
200
6,20
06,
200
Boo
ks &
Per
iodi
cals
48
457
950
040
050
0M
embe
rshi
p &
Due
s 1,
380
1,16
21,
660
1,66
01,
660
Info
rmat
ion
Sys
tem
s S
oftw
are
2,12
931
92,
500
2,50
02,
500
Bus
ines
s E
xpen
se
414
341
300
380
400
Con
fere
nce
Exp
ense
50
269
1,00
01,
000
800
Ren
t of L
and/
Faci
litie
s 4,
200
4,20
00
00
Spe
cial
Dep
t Mat
eria
ls
29,2
2365
827
,500
26,5
0037
,900
Jani
toria
l Sup
plie
s 19
,317
16,1
6120
,000
20,0
0021
,000
Gen
eral
Sup
plie
s 60
12,
188
3,50
03,
500
3,50
0Tr
aini
ng a
nd E
duca
tion
1,89
869
67,
000
7,00
07,
500
Sm
all T
ools
and
Equ
ipm
ent
1,87
72,
310
8,00
08,
000
8,20
0
Publ
ic W
orks
59
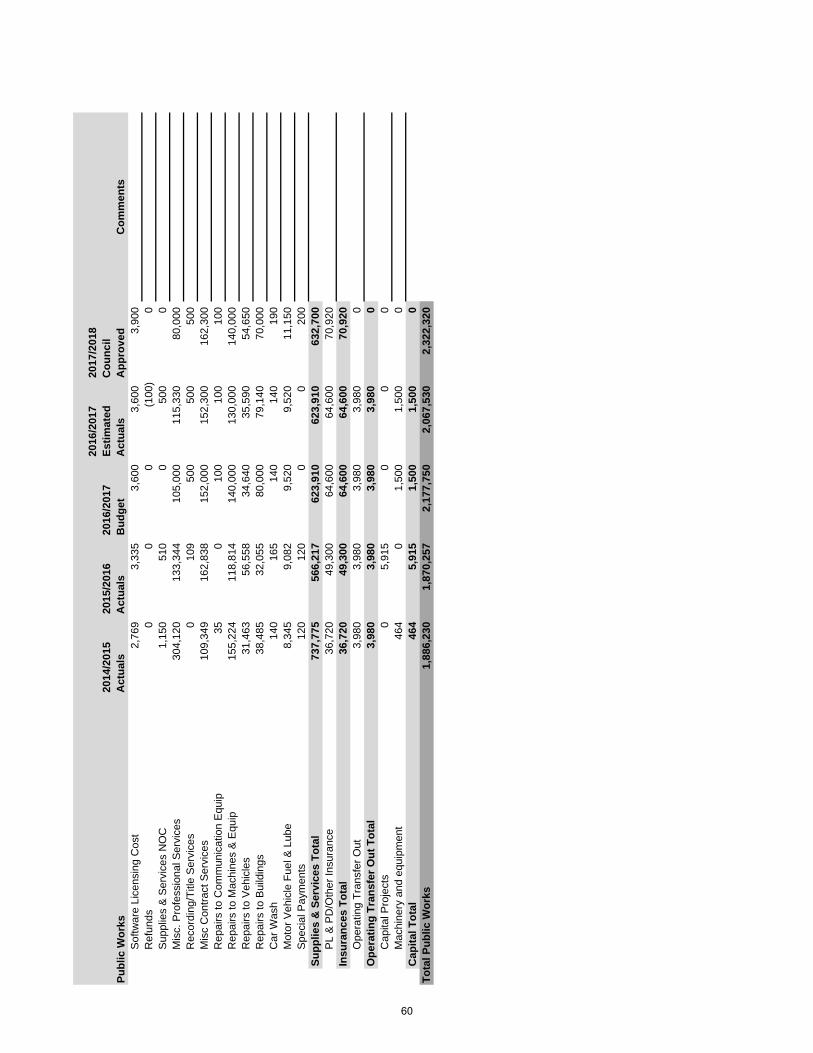
2014
/201
5 A
ctua
ls20
15/2
016
Act
uals
2016
/201
7 B
udge
t
2016
/201
7 Es
timat
ed
Act
uals
2017
/201
8 C
ounc
il A
ppro
ved
Com
men
tsPu
blic
Wor
ksS
oftw
are
Lice
nsin
g C
ost
2,76
93,
335
3,60
03,
600
3,90
0R
efun
ds
00
0(1
00)
0S
uppl
ies
& S
ervi
ces
NO
C
1,15
051
00
500
0M
isc.
Pro
fess
iona
l Ser
vice
s 30
4,12
013
3,34
410
5,00
011
5,33
080
,000
Rec
ordi
ng/T
itle
Ser
vice
s 0
109
500
500
500
Mis
c C
ontra
ct S
ervi
ces
109,
349
162,
838
152,
000
152,
300
162,
300
Rep
airs
to C
omm
unic
atio
n E
quip
35
010
010
010
0R
epai
rs to
Mac
hine
s &
Equ
ip
155,
224
118,
814
140,
000
130,
000
140,
000
Rep
airs
to V
ehic
les
31,4
6356
,558
34,6
4035
,590
54,6
50R
epai
rs to
Bui
ldin
gs
38,4
8532
,055
80,0
0079
,140
70,0
00C
ar W
ash
140
165
140
140
190
Mot
or V
ehic
le F
uel &
Lub
e 8,
345
9,08
29,
520
9,52
011
,150
Spe
cial
Pay
men
ts
120
120
00
200
Supp
lies
& S
ervi
ces
Tota
l73
7,77
556
6,21
762
3,91
062
3,91
063
2,70
0P
L &
PD
/Oth
er In
sura
nce
36,7
2049
,300
64,6
0064
,600
70,9
20In
sura
nces
Tot
al36
,720
49,3
0064
,600
64,6
0070
,920
Ope
ratin
g Tr
ansf
er O
ut
3,98
03,
980
3,98
03,
980
0O
pera
ting
Tran
sfer
Out
Tot
al3,
980
3,98
03,
980
3,98
00
Cap
ital P
roje
cts
05,
915
00
0M
achi
nery
and
equ
ipm
ent
464
01,
500
1,50
00
Cap
ital T
otal
464
5,91
51,
500
1,50
00
Tota
l Pub
lic W
orks
1,88
6,23
01,
870,
257
2,17
7,75
02,
067,
530
2,32
2,32
0
60
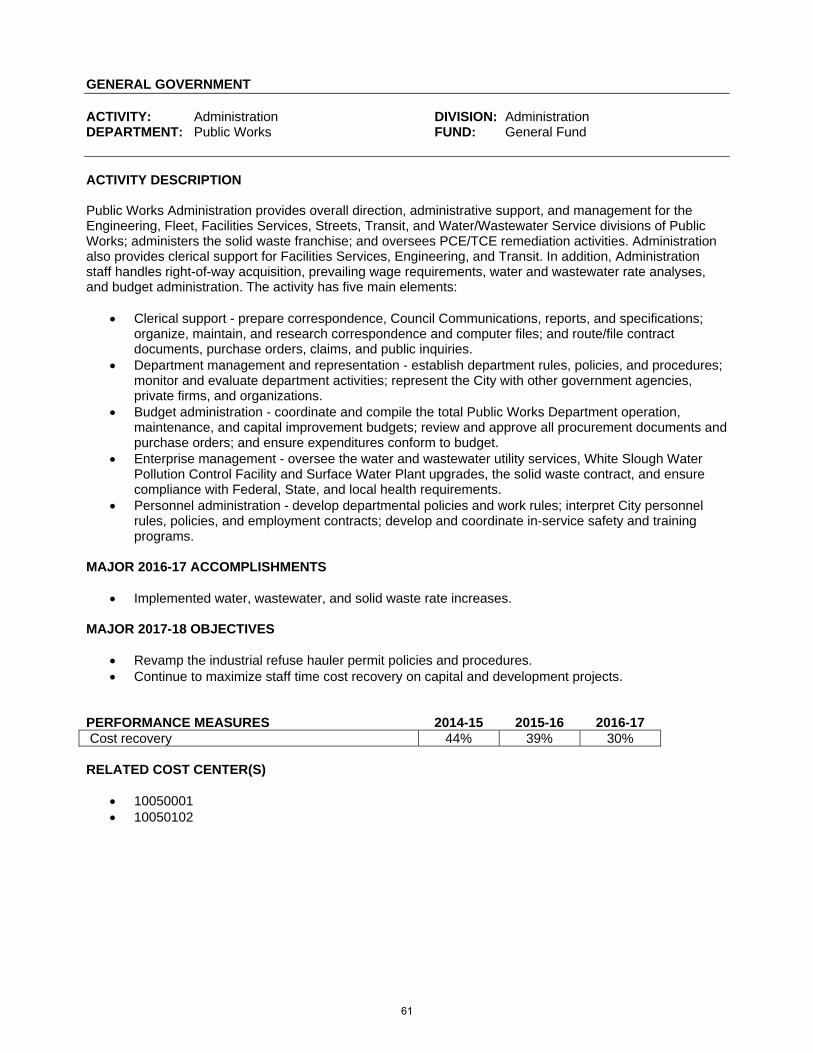
GENERAL GOVERNMENT ACTIVITY: Administration DIVISION: Administration DEPARTMENT: Public Works FUND: General Fund ACTIVITY DESCRIPTION Public Works Administration provides overall direction, administrative support, and management for the Engineering, Fleet, Facilities Services, Streets, Transit, and Water/Wastewater Service divisions of Public Works; administers the solid waste franchise; and oversees PCE/TCE remediation activities. Administration also provides clerical support for Facilities Services, Engineering, and Transit. In addition, Administration staff handles right-of-way acquisition, prevailing wage requirements, water and wastewater rate analyses, and budget administration. The activity has five main elements:
Clerical support - prepare correspondence, Council Communications, reports, and specifications; organize, maintain, and research correspondence and computer files; and route/file contract documents, purchase orders, claims, and public inquiries.
Department management and representation - establish department rules, policies, and procedures; monitor and evaluate department activities; represent the City with other government agencies, private firms, and organizations.
Budget administration - coordinate and compile the total Public Works Department operation, maintenance, and capital improvement budgets; review and approve all procurement documents and purchase orders; and ensure expenditures conform to budget.
Enterprise management - oversee the water and wastewater utility services, White Slough Water Pollution Control Facility and Surface Water Plant upgrades, the solid waste contract, and ensure compliance with Federal, State, and local health requirements.
Personnel administration - develop departmental policies and work rules; interpret City personnel rules, policies, and employment contracts; develop and coordinate in-service safety and training programs.
MAJOR 2016-17 ACCOMPLISHMENTS
Implemented water, wastewater, and solid waste rate increases. MAJOR 2017-18 OBJECTIVES
Revamp the industrial refuse hauler permit policies and procedures. Continue to maximize staff time cost recovery on capital and development projects.
PERFORMANCE MEASURES 2014-15 2015-16 2016-17 Cost recovery 44% 39% 30% RELATED COST CENTER(S)
10050001 10050102
61
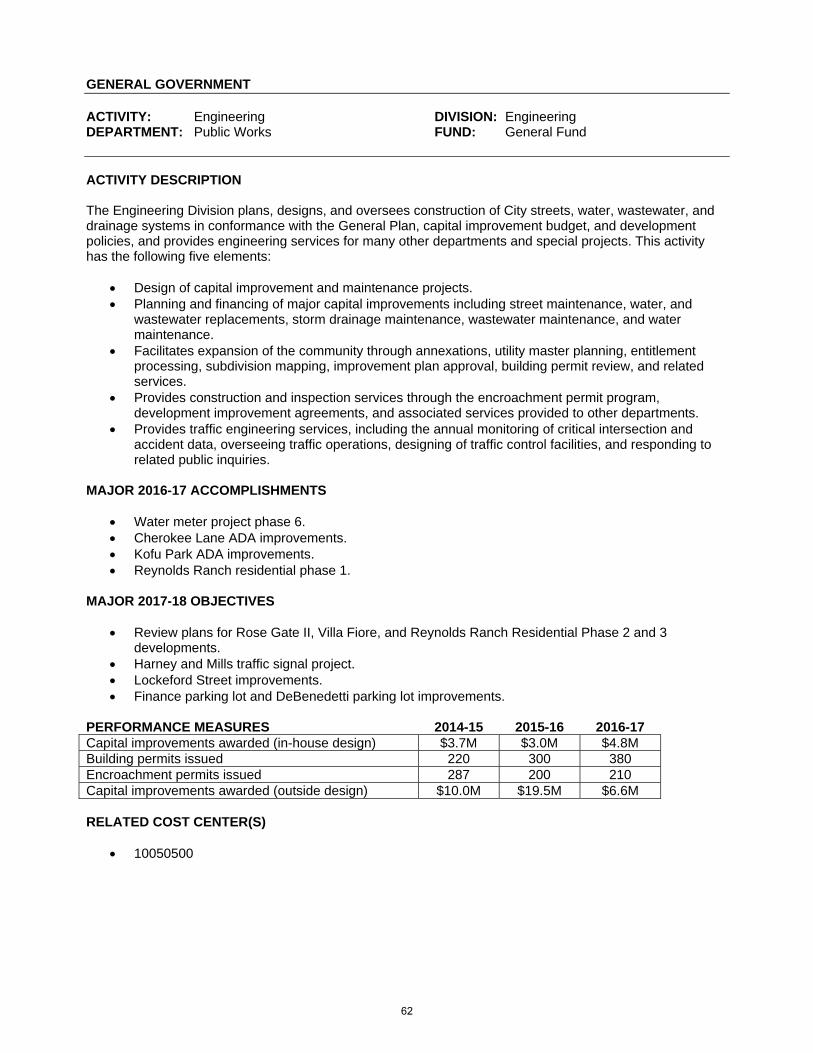
GENERAL GOVERNMENT ACTIVITY: Engineering DIVISION: Engineering DEPARTMENT: Public Works FUND: General Fund ACTIVITY DESCRIPTION The Engineering Division plans, designs, and oversees construction of City streets, water, wastewater, and drainage systems in conformance with the General Plan, capital improvement budget, and development policies, and provides engineering services for many other departments and special projects. This activity has the following five elements:
Design of capital improvement and maintenance projects. Planning and financing of major capital improvements including street maintenance, water, and
wastewater replacements, storm drainage maintenance, wastewater maintenance, and water maintenance.
Facilitates expansion of the community through annexations, utility master planning, entitlement processing, subdivision mapping, improvement plan approval, building permit review, and related services.
Provides construction and inspection services through the encroachment permit program, development improvement agreements, and associated services provided to other departments.
Provides traffic engineering services, including the annual monitoring of critical intersection and accident data, overseeing traffic operations, designing of traffic control facilities, and responding to related public inquiries.
MAJOR 2016-17 ACCOMPLISHMENTS
Water meter project phase 6. Cherokee Lane ADA improvements. Kofu Park ADA improvements. Reynolds Ranch residential phase 1.
MAJOR 2017-18 OBJECTIVES
Review plans for Rose Gate II, Villa Fiore, and Reynolds Ranch Residential Phase 2 and 3 developments.
Harney and Mills traffic signal project. Lockeford Street improvements. Finance parking lot and DeBenedetti parking lot improvements.
PERFORMANCE MEASURES 2014-15 2015-16 2016-17 Capital improvements awarded (in-house design) $3.7M $3.0M $4.8M Building permits issued 220 300 380 Encroachment permits issued 287 200 210 Capital improvements awarded (outside design) $10.0M $19.5M $6.6M RELATED COST CENTER(S)
10050500
62
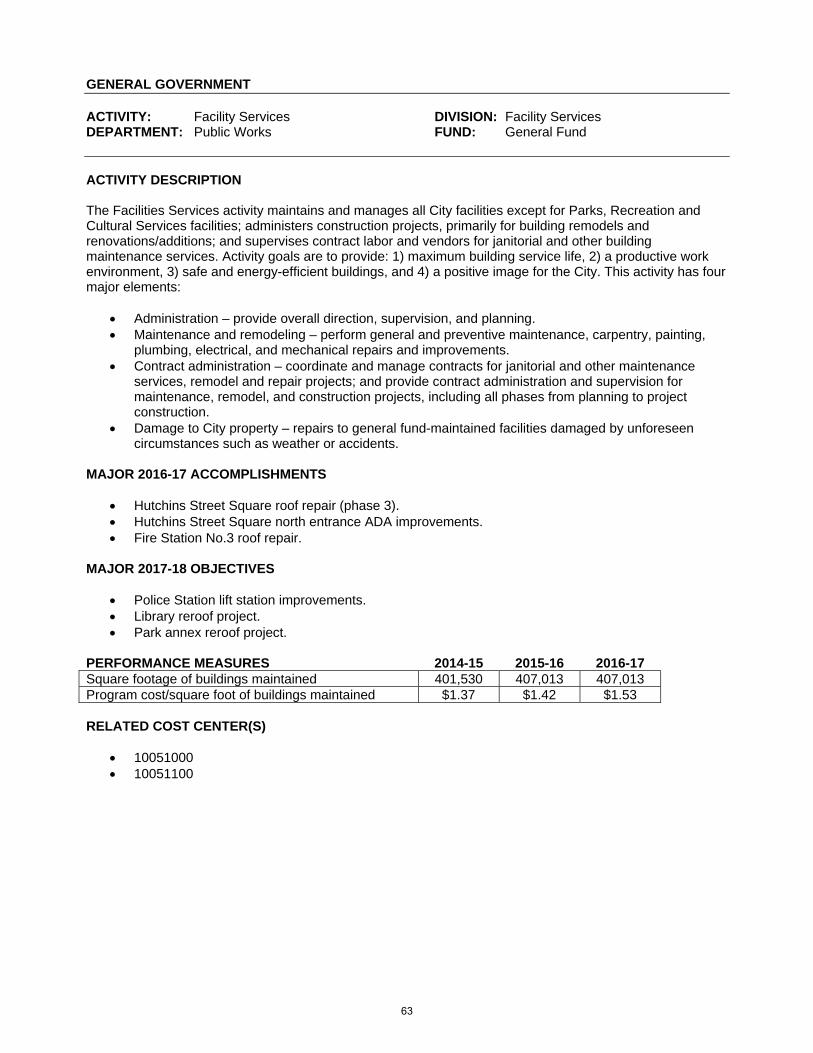
GENERAL GOVERNMENT ACTIVITY: Facility Services DIVISION: Facility Services DEPARTMENT: Public Works FUND: General Fund ACTIVITY DESCRIPTION The Facilities Services activity maintains and manages all City facilities except for Parks, Recreation and Cultural Services facilities; administers construction projects, primarily for building remodels and renovations/additions; and supervises contract labor and vendors for janitorial and other building maintenance services. Activity goals are to provide: 1) maximum building service life, 2) a productive work environment, 3) safe and energy-efficient buildings, and 4) a positive image for the City. This activity has four major elements:
Administration – provide overall direction, supervision, and planning. Maintenance and remodeling – perform general and preventive maintenance, carpentry, painting,
plumbing, electrical, and mechanical repairs and improvements. Contract administration – coordinate and manage contracts for janitorial and other maintenance
services, remodel and repair projects; and provide contract administration and supervision for maintenance, remodel, and construction projects, including all phases from planning to project construction.
Damage to City property – repairs to general fund-maintained facilities damaged by unforeseen circumstances such as weather or accidents.
MAJOR 2016-17 ACCOMPLISHMENTS
Hutchins Street Square roof repair (phase 3). Hutchins Street Square north entrance ADA improvements. Fire Station No.3 roof repair.
MAJOR 2017-18 OBJECTIVES
Police Station lift station improvements. Library reroof project. Park annex reroof project.
PERFORMANCE MEASURES 2014-15 2015-16 2016-17 Square footage of buildings maintained 401,530 407,013 407,013 Program cost/square foot of buildings maintained $1.37 $1.42 $1.53 RELATED COST CENTER(S)
10051000 10051100
63
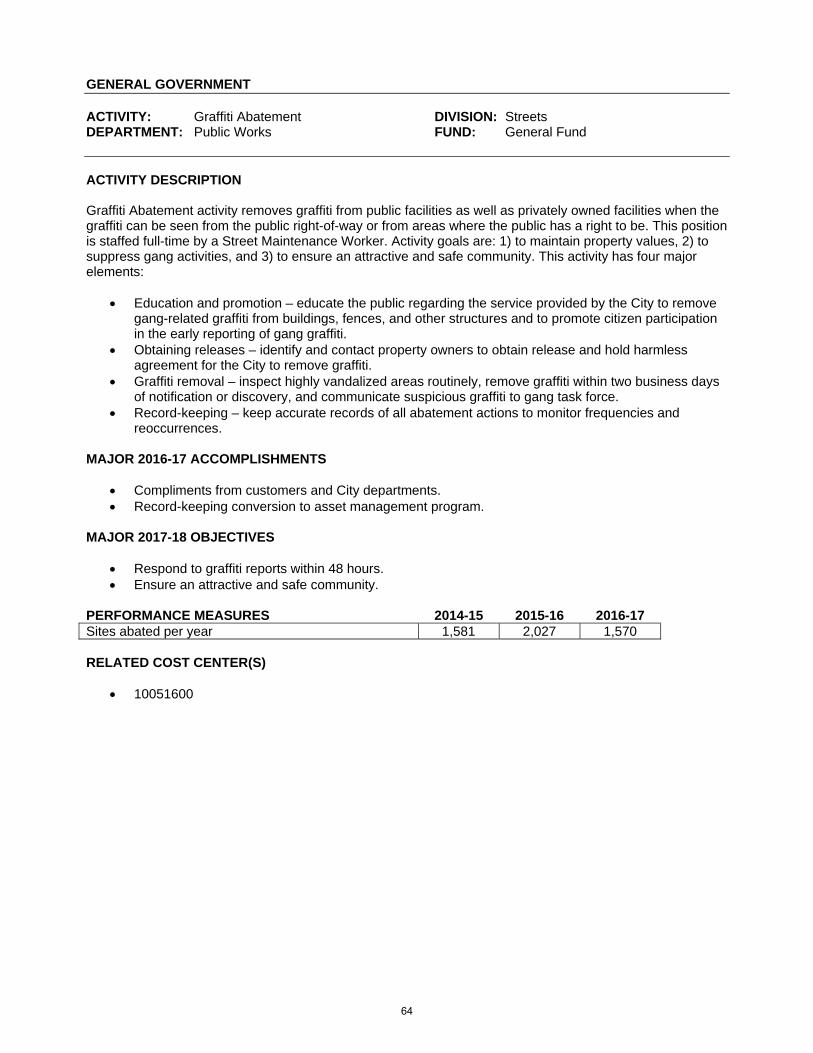
GENERAL GOVERNMENT ACTIVITY: Graffiti Abatement DIVISION: Streets DEPARTMENT: Public Works FUND: General Fund ACTIVITY DESCRIPTION Graffiti Abatement activity removes graffiti from public facilities as well as privately owned facilities when the graffiti can be seen from the public right-of-way or from areas where the public has a right to be. This position is staffed full-time by a Street Maintenance Worker. Activity goals are: 1) to maintain property values, 2) to suppress gang activities, and 3) to ensure an attractive and safe community. This activity has four major elements:
Education and promotion – educate the public regarding the service provided by the City to remove gang-related graffiti from buildings, fences, and other structures and to promote citizen participation in the early reporting of gang graffiti.
Obtaining releases – identify and contact property owners to obtain release and hold harmless agreement for the City to remove graffiti.
Graffiti removal – inspect highly vandalized areas routinely, remove graffiti within two business days of notification or discovery, and communicate suspicious graffiti to gang task force.
Record-keeping – keep accurate records of all abatement actions to monitor frequencies and reoccurrences.
MAJOR 2016-17 ACCOMPLISHMENTS
Compliments from customers and City departments. Record-keeping conversion to asset management program.
MAJOR 2017-18 OBJECTIVES
Respond to graffiti reports within 48 hours. Ensure an attractive and safe community.
PERFORMANCE MEASURES 2014-15 2015-16 2016-17 Sites abated per year 1,581 2,027 1,570 RELATED COST CENTER(S)
10051600
64
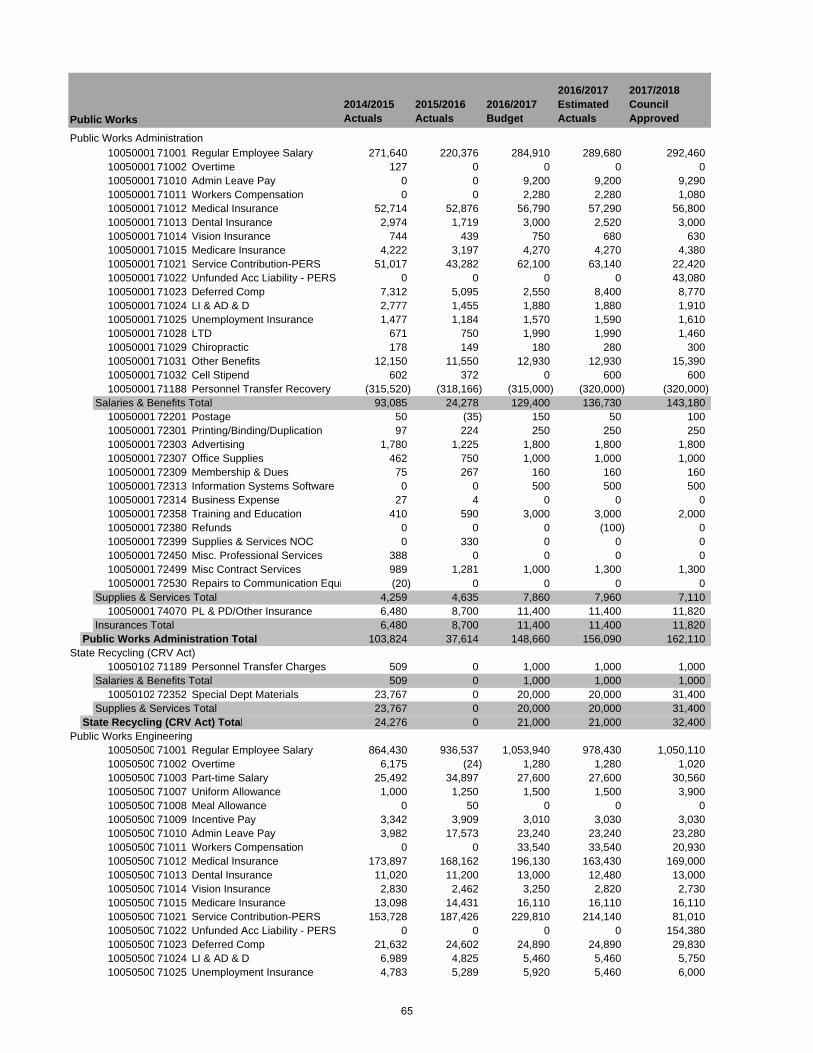
2014/2015 Actuals
2015/2016 Actuals
2016/2017 Budget
2016/2017 Estimated Actuals
2017/2018 Council Approved
Public Works Administration10050001 71001 Regular Employee Salary 271,640 220,376 284,910 289,680 292,46010050001 71002 Overtime 127 0 0 0 010050001 71010 Admin Leave Pay 0 0 9,200 9,200 9,29010050001 71011 Workers Compensation 0 0 2,280 2,280 1,08010050001 71012 Medical Insurance 52,714 52,876 56,790 57,290 56,80010050001 71013 Dental Insurance 2,974 1,719 3,000 2,520 3,00010050001 71014 Vision Insurance 744 439 750 680 63010050001 71015 Medicare Insurance 4,222 3,197 4,270 4,270 4,38010050001 71021 Service Contribution-PERS 51,017 43,282 62,100 63,140 22,42010050001 71022 Unfunded Acc Liability - PERS 0 0 0 0 43,08010050001 71023 Deferred Comp 7,312 5,095 2,550 8,400 8,77010050001 71024 LI & AD & D 2,777 1,455 1,880 1,880 1,91010050001 71025 Unemployment Insurance 1,477 1,184 1,570 1,590 1,61010050001 71028 LTD 671 750 1,990 1,990 1,46010050001 71029 Chiropractic 178 149 180 280 30010050001 71031 Other Benefits 12,150 11,550 12,930 12,930 15,39010050001 71032 Cell Stipend 602 372 0 600 60010050001 71188 Personnel Transfer Recovery (315,520) (318,166) (315,000) (320,000) (320,000)
Salaries & Benefits Total 93,085 24,278 129,400 136,730 143,18010050001 72201 Postage 50 (35) 150 50 10010050001 72301 Printing/Binding/Duplication 97 224 250 250 25010050001 72303 Advertising 1,780 1,225 1,800 1,800 1,80010050001 72307 Office Supplies 462 750 1,000 1,000 1,00010050001 72309 Membership & Dues 75 267 160 160 16010050001 72313 Information Systems Software 0 0 500 500 50010050001 72314 Business Expense 27 4 0 0 010050001 72358 Training and Education 410 590 3,000 3,000 2,00010050001 72380 Refunds 0 0 0 (100) 010050001 72399 Supplies & Services NOC 0 330 0 0 010050001 72450 Misc. Professional Services 388 0 0 0 010050001 72499 Misc Contract Services 989 1,281 1,000 1,300 1,30010050001 72530 Repairs to Communication Equi (20) 0 0 0 0
Supplies & Services Total 4,259 4,635 7,860 7,960 7,11010050001 74070 PL & PD/Other Insurance 6,480 8,700 11,400 11,400 11,820
Insurances Total 6,480 8,700 11,400 11,400 11,820Public Works Administration Total 103,824 37,614 148,660 156,090 162,110
State Recycling (CRV Act)10050102 71189 Personnel Transfer Charges 509 0 1,000 1,000 1,000
Salaries & Benefits Total 509 0 1,000 1,000 1,00010050102 72352 Special Dept Materials 23,767 0 20,000 20,000 31,400
Supplies & Services Total 23,767 0 20,000 20,000 31,400State Recycling (CRV Act) Total 24,276 0 21,000 21,000 32,400
Public Works Engineering10050500 71001 Regular Employee Salary 864,430 936,537 1,053,940 978,430 1,050,11010050500 71002 Overtime 6,175 (24) 1,280 1,280 1,02010050500 71003 Part-time Salary 25,492 34,897 27,600 27,600 30,56010050500 71007 Uniform Allowance 1,000 1,250 1,500 1,500 3,90010050500 71008 Meal Allowance 0 50 0 0 010050500 71009 Incentive Pay 3,342 3,909 3,010 3,030 3,03010050500 71010 Admin Leave Pay 3,982 17,573 23,240 23,240 23,28010050500 71011 Workers Compensation 0 0 33,540 33,540 20,93010050500 71012 Medical Insurance 173,897 168,162 196,130 163,430 169,00010050500 71013 Dental Insurance 11,020 11,200 13,000 12,480 13,00010050500 71014 Vision Insurance 2,830 2,462 3,250 2,820 2,73010050500 71015 Medicare Insurance 13,098 14,431 16,110 16,110 16,11010050500 71021 Service Contribution-PERS 153,728 187,426 229,810 214,140 81,01010050500 71022 Unfunded Acc Liability - PERS 0 0 0 0 154,38010050500 71023 Deferred Comp 21,632 24,602 24,890 24,890 29,83010050500 71024 LI & AD & D 6,989 4,825 5,460 5,460 5,75010050500 71025 Unemployment Insurance 4,783 5,289 5,920 5,460 6,000
Public Works
65
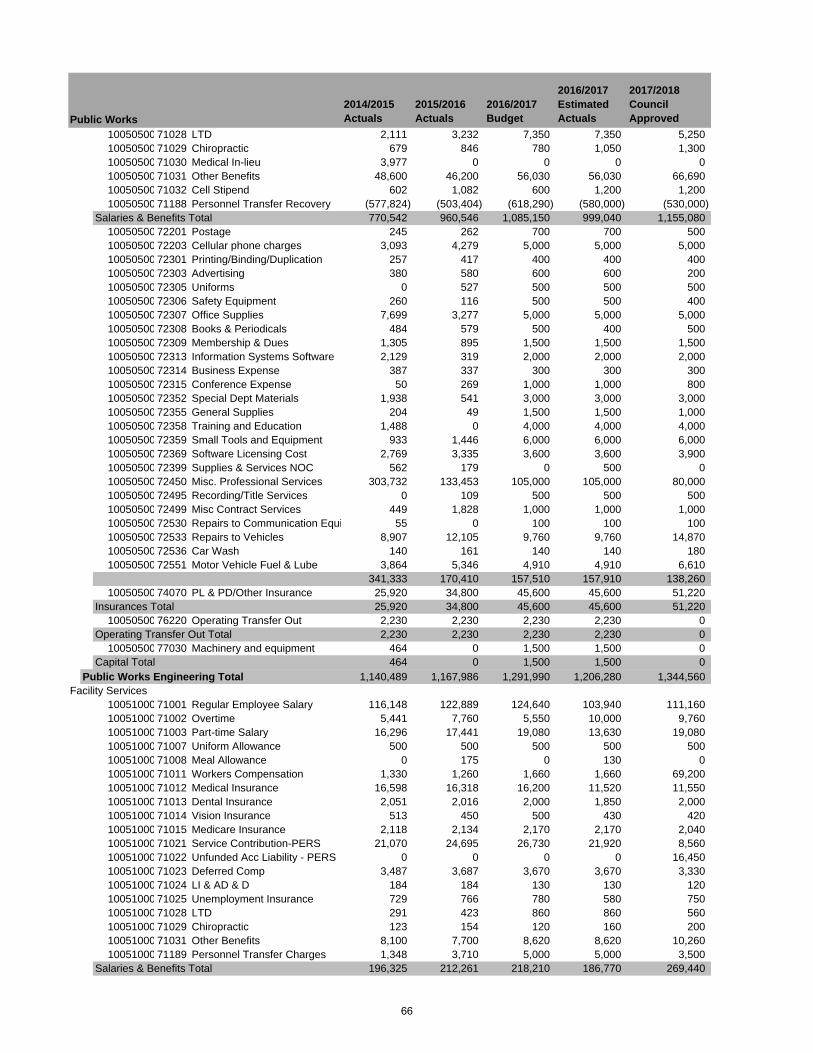
2014/2015 Actuals
2015/2016 Actuals
2016/2017 Budget
2016/2017 Estimated Actuals
2017/2018 Council ApprovedPublic Works
10050500 71028 LTD 2,111 3,232 7,350 7,350 5,25010050500 71029 Chiropractic 679 846 780 1,050 1,30010050500 71030 Medical In-lieu 3,977 0 0 0 010050500 71031 Other Benefits 48,600 46,200 56,030 56,030 66,69010050500 71032 Cell Stipend 602 1,082 600 1,200 1,20010050500 71188 Personnel Transfer Recovery (577,824) (503,404) (618,290) (580,000) (530,000)
Salaries & Benefits Total 770,542 960,546 1,085,150 999,040 1,155,08010050500 72201 Postage 245 262 700 700 50010050500 72203 Cellular phone charges 3,093 4,279 5,000 5,000 5,00010050500 72301 Printing/Binding/Duplication 257 417 400 400 40010050500 72303 Advertising 380 580 600 600 20010050500 72305 Uniforms 0 527 500 500 50010050500 72306 Safety Equipment 260 116 500 500 40010050500 72307 Office Supplies 7,699 3,277 5,000 5,000 5,00010050500 72308 Books & Periodicals 484 579 500 400 50010050500 72309 Membership & Dues 1,305 895 1,500 1,500 1,50010050500 72313 Information Systems Software 2,129 319 2,000 2,000 2,00010050500 72314 Business Expense 387 337 300 300 30010050500 72315 Conference Expense 50 269 1,000 1,000 80010050500 72352 Special Dept Materials 1,938 541 3,000 3,000 3,00010050500 72355 General Supplies 204 49 1,500 1,500 1,00010050500 72358 Training and Education 1,488 0 4,000 4,000 4,00010050500 72359 Small Tools and Equipment 933 1,446 6,000 6,000 6,00010050500 72369 Software Licensing Cost 2,769 3,335 3,600 3,600 3,90010050500 72399 Supplies & Services NOC 562 179 0 500 010050500 72450 Misc. Professional Services 303,732 133,453 105,000 105,000 80,00010050500 72495 Recording/Title Services 0 109 500 500 50010050500 72499 Misc Contract Services 449 1,828 1,000 1,000 1,00010050500 72530 Repairs to Communication Equi 55 0 100 100 10010050500 72533 Repairs to Vehicles 8,907 12,105 9,760 9,760 14,87010050500 72536 Car Wash 140 161 140 140 18010050500 72551 Motor Vehicle Fuel & Lube 3,864 5,346 4,910 4,910 6,610
341,333 170,410 157,510 157,910 138,26010050500 74070 PL & PD/Other Insurance 25,920 34,800 45,600 45,600 51,220
Insurances Total 25,920 34,800 45,600 45,600 51,22010050500 76220 Operating Transfer Out 2,230 2,230 2,230 2,230 0
Operating Transfer Out Total 2,230 2,230 2,230 2,230 010050500 77030 Machinery and equipment 464 0 1,500 1,500 0
Capital Total 464 0 1,500 1,500 0Public Works Engineering Total 1,140,489 1,167,986 1,291,990 1,206,280 1,344,560
Facility Services10051000 71001 Regular Employee Salary 116,148 122,889 124,640 103,940 111,16010051000 71002 Overtime 5,441 7,760 5,550 10,000 9,76010051000 71003 Part-time Salary 16,296 17,441 19,080 13,630 19,08010051000 71007 Uniform Allowance 500 500 500 500 50010051000 71008 Meal Allowance 0 175 0 130 010051000 71011 Workers Compensation 1,330 1,260 1,660 1,660 69,20010051000 71012 Medical Insurance 16,598 16,318 16,200 11,520 11,55010051000 71013 Dental Insurance 2,051 2,016 2,000 1,850 2,00010051000 71014 Vision Insurance 513 450 500 430 42010051000 71015 Medicare Insurance 2,118 2,134 2,170 2,170 2,04010051000 71021 Service Contribution-PERS 21,070 24,695 26,730 21,920 8,56010051000 71022 Unfunded Acc Liability - PERS 0 0 0 0 16,45010051000 71023 Deferred Comp 3,487 3,687 3,670 3,670 3,33010051000 71024 LI & AD & D 184 184 130 130 12010051000 71025 Unemployment Insurance 729 766 780 580 75010051000 71028 LTD 291 423 860 860 56010051000 71029 Chiropractic 123 154 120 160 20010051000 71031 Other Benefits 8,100 7,700 8,620 8,620 10,26010051000 71189 Personnel Transfer Charges 1,348 3,710 5,000 5,000 3,500
Salaries & Benefits Total 196,325 212,261 218,210 186,770 269,440
66
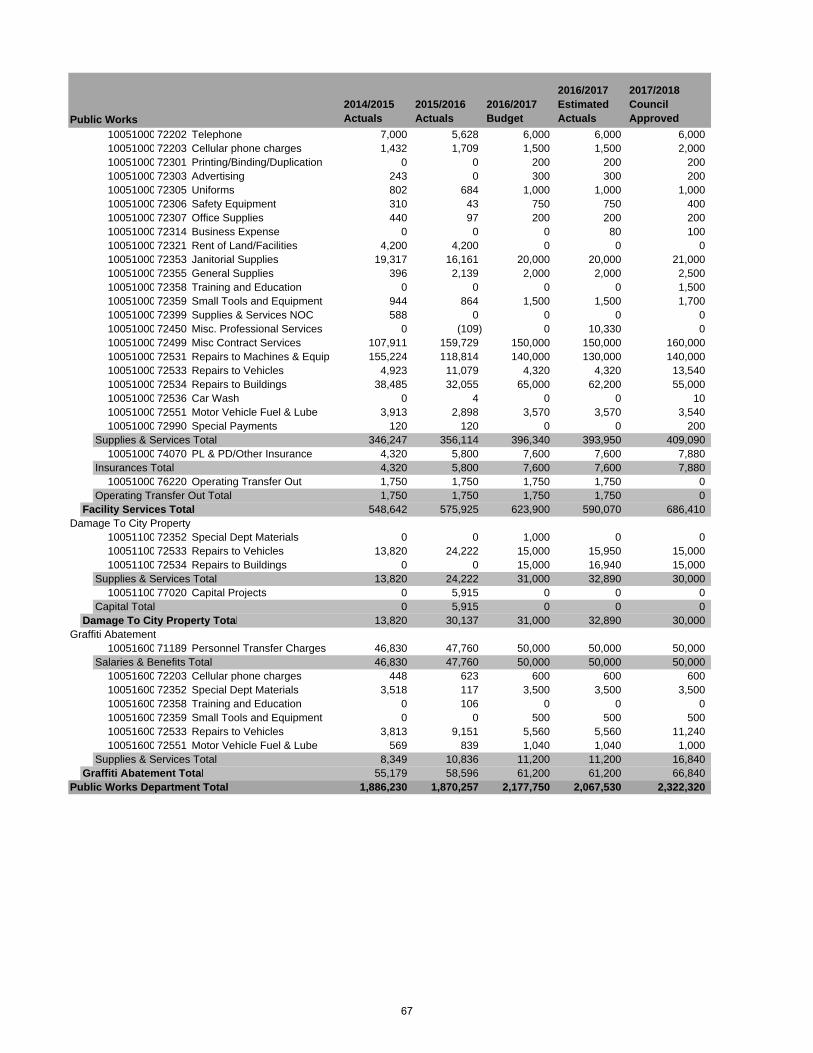
2014/2015 Actuals
2015/2016 Actuals
2016/2017 Budget
2016/2017 Estimated Actuals
2017/2018 Council ApprovedPublic Works
10051000 72202 Telephone 7,000 5,628 6,000 6,000 6,00010051000 72203 Cellular phone charges 1,432 1,709 1,500 1,500 2,00010051000 72301 Printing/Binding/Duplication 0 0 200 200 20010051000 72303 Advertising 243 0 300 300 20010051000 72305 Uniforms 802 684 1,000 1,000 1,00010051000 72306 Safety Equipment 310 43 750 750 40010051000 72307 Office Supplies 440 97 200 200 20010051000 72314 Business Expense 0 0 0 80 10010051000 72321 Rent of Land/Facilities 4,200 4,200 0 0 010051000 72353 Janitorial Supplies 19,317 16,161 20,000 20,000 21,00010051000 72355 General Supplies 396 2,139 2,000 2,000 2,50010051000 72358 Training and Education 0 0 0 0 1,50010051000 72359 Small Tools and Equipment 944 864 1,500 1,500 1,70010051000 72399 Supplies & Services NOC 588 0 0 0 010051000 72450 Misc. Professional Services 0 (109) 0 10,330 010051000 72499 Misc Contract Services 107,911 159,729 150,000 150,000 160,00010051000 72531 Repairs to Machines & Equip 155,224 118,814 140,000 130,000 140,00010051000 72533 Repairs to Vehicles 4,923 11,079 4,320 4,320 13,54010051000 72534 Repairs to Buildings 38,485 32,055 65,000 62,200 55,00010051000 72536 Car Wash 0 4 0 0 1010051000 72551 Motor Vehicle Fuel & Lube 3,913 2,898 3,570 3,570 3,54010051000 72990 Special Payments 120 120 0 0 200
Supplies & Services Total 346,247 356,114 396,340 393,950 409,09010051000 74070 PL & PD/Other Insurance 4,320 5,800 7,600 7,600 7,880
Insurances Total 4,320 5,800 7,600 7,600 7,88010051000 76220 Operating Transfer Out 1,750 1,750 1,750 1,750 0
Operating Transfer Out Total 1,750 1,750 1,750 1,750 0Facility Services Total 548,642 575,925 623,900 590,070 686,410
Damage To City Property10051100 72352 Special Dept Materials 0 0 1,000 0 010051100 72533 Repairs to Vehicles 13,820 24,222 15,000 15,950 15,00010051100 72534 Repairs to Buildings 0 0 15,000 16,940 15,000
Supplies & Services Total 13,820 24,222 31,000 32,890 30,00010051100 77020 Capital Projects 0 5,915 0 0 0
Capital Total 0 5,915 0 0 0Damage To City Property Total 13,820 30,137 31,000 32,890 30,000
Graffiti Abatement10051600 71189 Personnel Transfer Charges 46,830 47,760 50,000 50,000 50,000
Salaries & Benefits Total 46,830 47,760 50,000 50,000 50,00010051600 72203 Cellular phone charges 448 623 600 600 60010051600 72352 Special Dept Materials 3,518 117 3,500 3,500 3,50010051600 72358 Training and Education 0 106 0 0 010051600 72359 Small Tools and Equipment 0 0 500 500 50010051600 72533 Repairs to Vehicles 3,813 9,151 5,560 5,560 11,24010051600 72551 Motor Vehicle Fuel & Lube 569 839 1,040 1,040 1,000
Supplies & Services Total 8,349 10,836 11,200 11,200 16,840Graffiti Abatement Total 55,179 58,596 61,200 61,200 66,840
Public Works Department Total 1,886,230 1,870,257 2,177,750 2,067,530 2,322,320
67

(This page intentionally left blank)
68
ADMINISTRATION The City of Lodi’s Administration consists of departments managed by the three City Council appointees: City Manager, City Clerk and City Attorney. The City Manager is the administrative head of the City of Lodi who implements the City Council’s policy direction. The City Clerk is responsible for official City records, City elections and provides support to the City Council. The City Attorney provides legal services for the municipal organization. The three departments have a combined budget of $1,596,460 in FY 2017/18, compared to $1,694,810 as originally budgeted in FY 2016/17. The 2016/17 budget shown in the following pages reflects adjustments made throughout the year. FY 2017/18 budgeted staffing is being maintained at 10 positions. The City Manager is also responsible for administering the Economic Development and Community Promotions activity, which has a budget of $468,070 in FY 2017/18, compared to $589,910 in FY 2016/17. Organizational charts, staffing summaries, detailed activity descriptions and financial tables are included in the following pages.
69

(This page intentionally left blank)
70
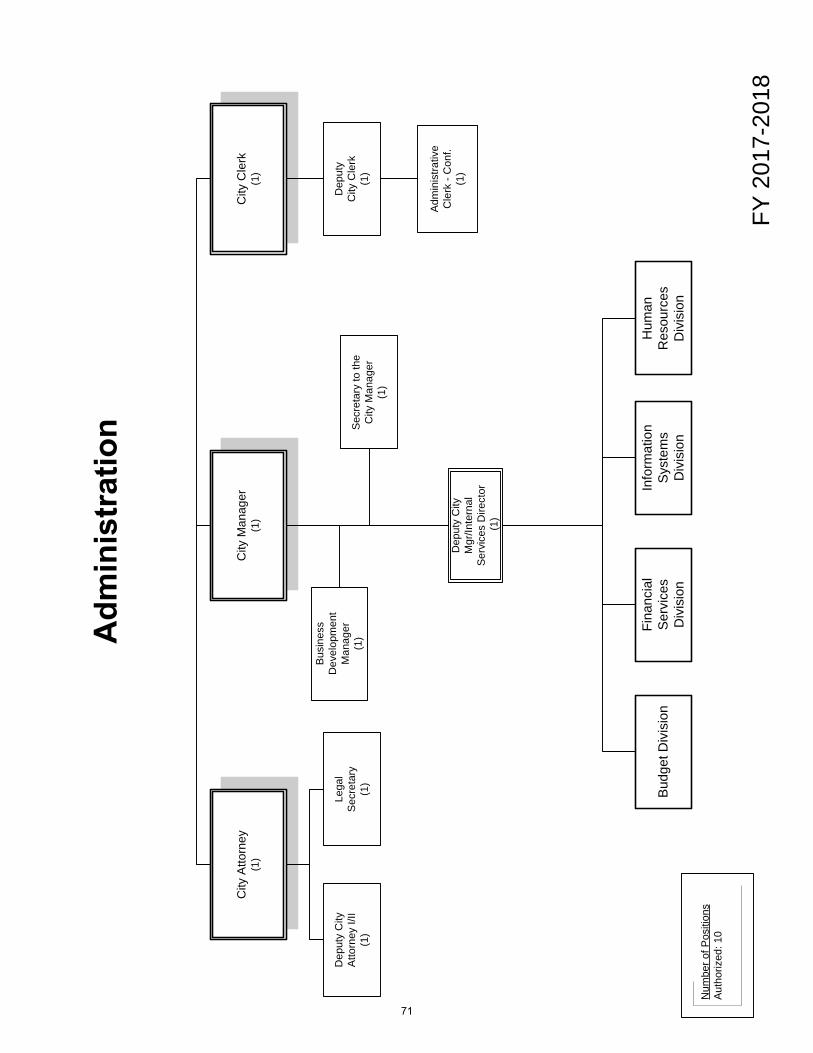
FY 2
017-
2018
Num
ber o
f Pos
ition
sAu
thor
ized
: 10
City
Atto
rney
(1)
City
Man
ager
(1)
City
Cle
rk(1
)
Lega
l S
ecre
tary
(1)
Dep
uty
City
A
ttorn
ey I/
II(1
)
Dep
uty
City
M
gr/In
tern
alSe
rvic
es D
irect
or(1
)
Busi
ness
D
evel
opm
ent
Man
ager
(1)
Sec
reta
ry to
the
City
Man
ager
(1)
Info
rmat
ion
Syst
ems
Div
isio
n
Dep
uty
City
Cle
rk(1
)
Hum
an
Res
ourc
es
Div
isio
nB
udge
t Div
isio
nFi
nanc
ial
Serv
ices
D
ivis
ion
Adm
inis
trativ
e C
lerk
-C
onf.
(1)
71

(This page intentionally left blank)
72
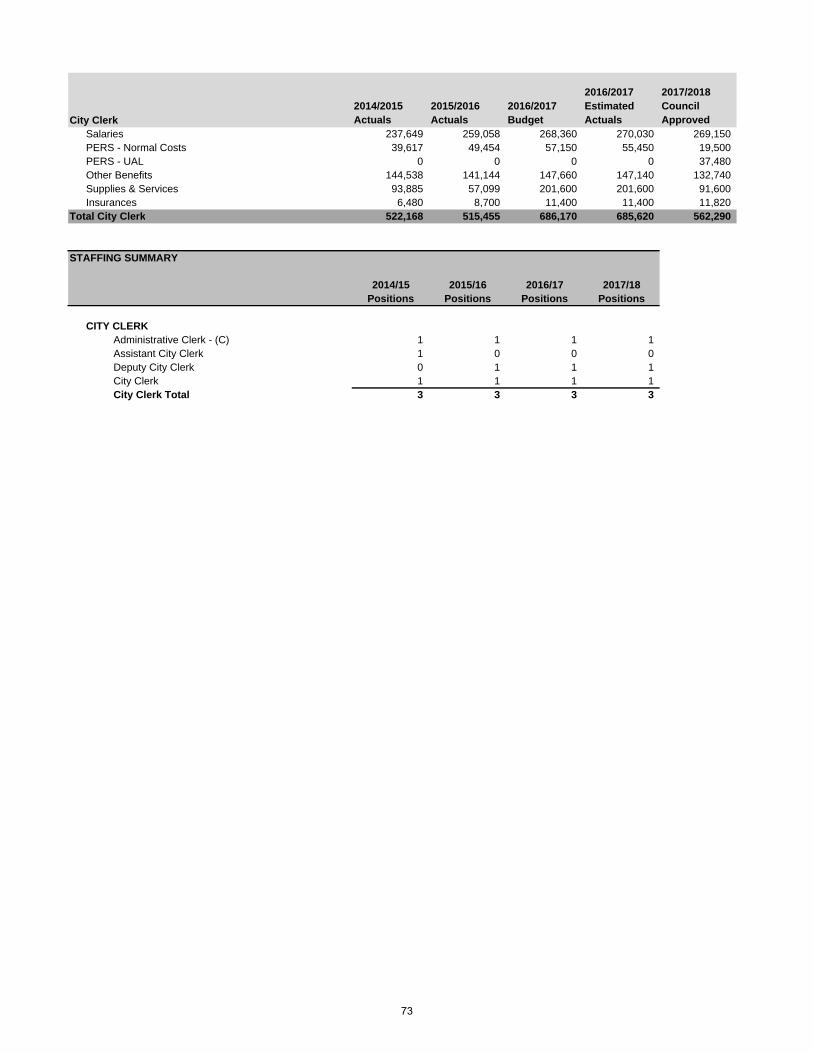
2014/2015 Actuals
2015/2016 Actuals
2016/2017 Budget
2016/2017 Estimated Actuals
2017/2018 Council Approved
Salaries 237,649 259,058 268,360 270,030 269,150PERS - Normal Costs 39,617 49,454 57,150 55,450 19,500PERS - UAL 0 0 0 0 37,480Other Benefits 144,538 141,144 147,660 147,140 132,740Supplies & Services 93,885 57,099 201,600 201,600 91,600Insurances 6,480 8,700 11,400 11,400 11,820
Total City Clerk 522,168 515,455 686,170 685,620 562,290
STAFFING SUMMARY
2014/15 2015/16 2016/17 2017/18Positions Positions Positions Positions
CITY CLERKAdministrative Clerk - (C) 1 1 1 1Assistant City Clerk 1 0 0 0Deputy City Clerk 0 1 1 1City Clerk 1 1 1 1City Clerk Total 3 3 3 3
City Clerk
73
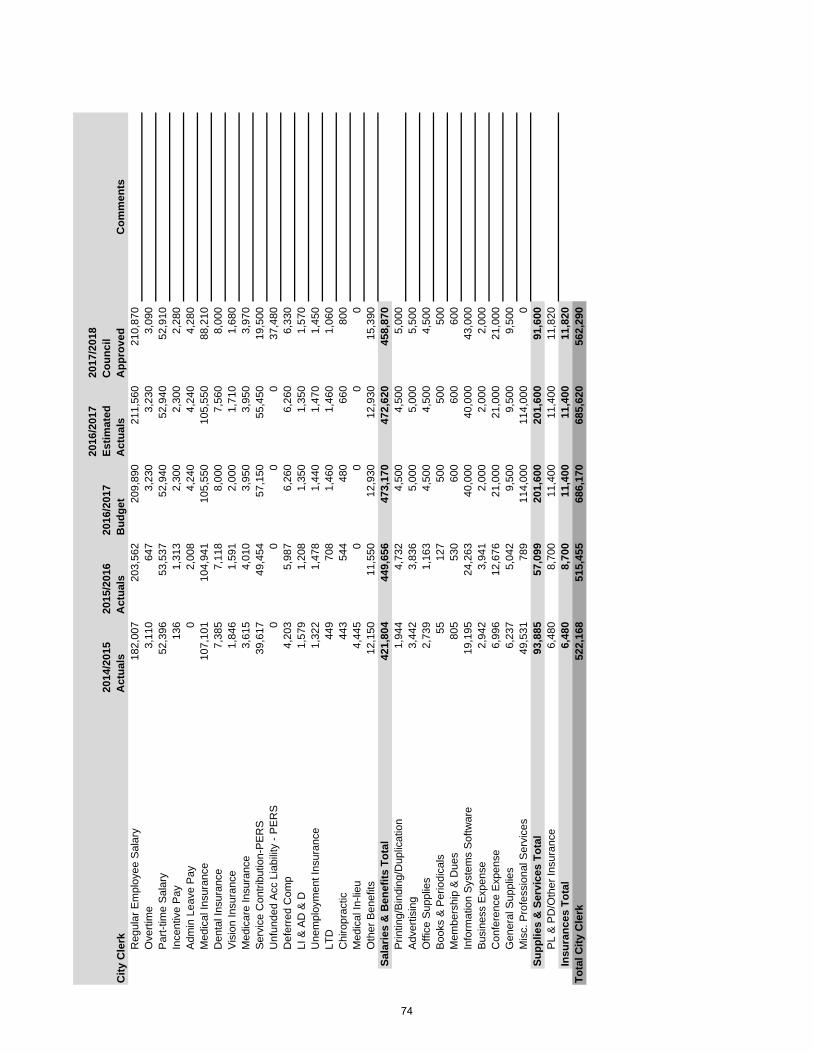
2014
/201
5 A
ctua
ls20
15/2
016
Act
uals
2016
/201
7 B
udge
t
2016
/201
7 Es
timat
ed
Act
uals
2017
/201
8 C
ounc
il A
ppro
ved
Com
men
tsR
egul
ar E
mpl
oyee
Sal
ary
182,
007
203,
562
209,
890
211,
560
210,
870
Ove
rtim
e 3,
110
647
3,23
03,
230
3,09
0P
art-t
ime
Sal
ary
52,3
9653
,537
52,9
4052
,940
52,9
10In
cent
ive
Pay
13
61,
313
2,30
02,
300
2,28
0A
dmin
Lea
ve P
ay
02,
008
4,24
04,
240
4,28
0M
edic
al In
sura
nce
107,
101
104,
941
105,
550
105,
550
88,2
10D
enta
l Ins
uran
ce
7,38
57,
118
8,00
07,
560
8,00
0V
isio
n In
sura
nce
1,84
61,
591
2,00
01,
710
1,68
0M
edic
are
Insu
ranc
e 3,
615
4,01
03,
950
3,95
03,
970
Ser
vice
Con
tribu
tion-
PE
RS
39
,617
49,4
5457
,150
55,4
5019
,500
Unf
unde
d A
cc L
iabi
lity
- PE
RS
0
00
037
,480
Def
erre
d C
omp
4,20
35,
987
6,26
06,
260
6,33
0LI
& A
D &
D
1,57
91,
208
1,35
01,
350
1,57
0U
nem
ploy
men
t Ins
uran
ce
1,32
21,
478
1,44
01,
470
1,45
0LT
D
449
708
1,46
01,
460
1,06
0C
hiro
prac
tic
443
544
480
660
800
Med
ical
In-li
eu
4,44
50
00
0O
ther
Ben
efits
12
,150
11,5
5012
,930
12,9
3015
,390
Sala
ries
& B
enef
its T
otal
421,
804
449,
656
473,
170
472,
620
458,
870
Prin
ting/
Bin
ding
/Dup
licat
ion
1,94
44,
732
4,50
04,
500
5,00
0A
dver
tisin
g 3,
442
3,83
65,
000
5,00
05,
500
Offi
ce S
uppl
ies
2,73
91,
163
4,50
04,
500
4,50
0B
ooks
& P
erio
dica
ls
5512
750
050
050
0M
embe
rshi
p &
Due
s 80
553
060
060
060
0In
form
atio
n S
yste
ms
Sof
twar
e 19
,195
24,2
6340
,000
40,0
0043
,000
Bus
ines
s E
xpen
se
2,94
23,
941
2,00
02,
000
2,00
0C
onfe
renc
e E
xpen
se
6,99
612
,676
21,0
0021
,000
21,0
00G
ener
al S
uppl
ies
6,23
75,
042
9,50
09,
500
9,50
0M
isc.
Pro
fess
iona
l Ser
vice
s 49
,531
789
114,
000
114,
000
0Su
pplie
s &
Ser
vice
s To
tal
93,8
8557
,099
201,
600
201,
600
91,6
00P
L &
PD
/Oth
er In
sura
nce
6,48
08,
700
11,4
0011
,400
11,8
20In
sura
nces
Tot
al6,
480
8,70
011
,400
11,4
0011
,820
Tota
l City
Cle
r k52
2,16
851
5,45
568
6,17
068
5,62
056
2,29
0
City
Cle
rk
74
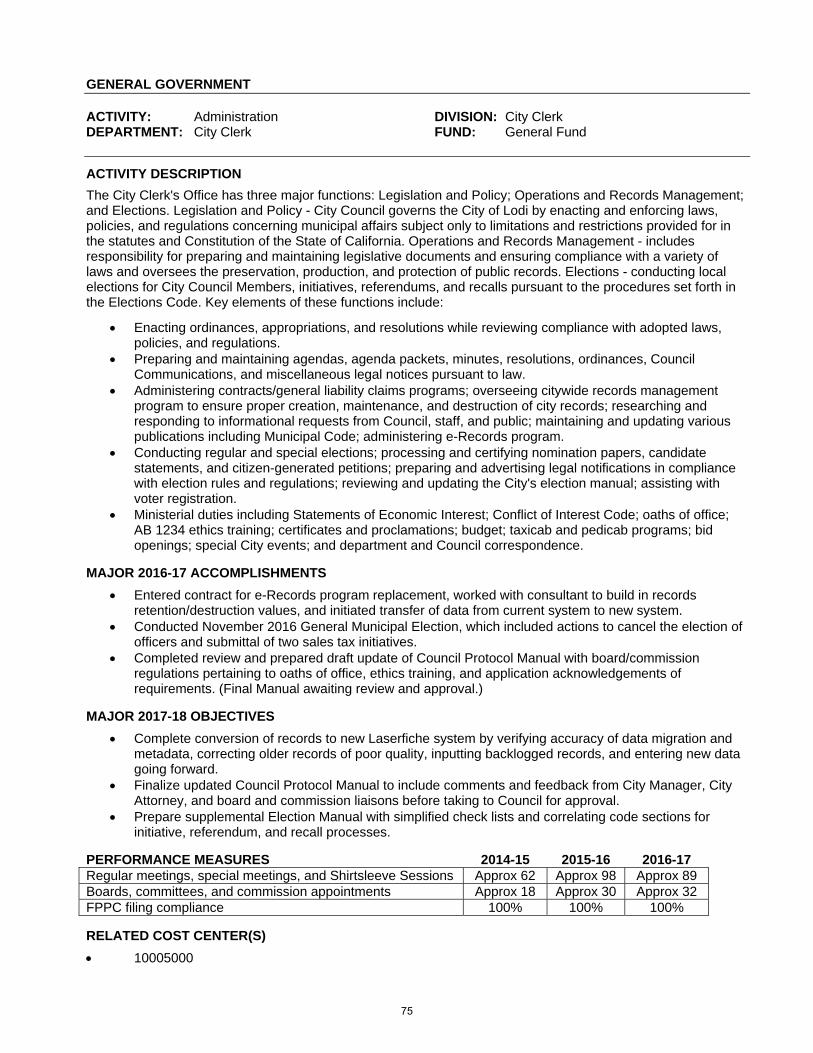
GENERAL GOVERNMENT ACTIVITY: Administration DIVISION: City Clerk DEPARTMENT: City Clerk FUND: General Fund
ACTIVITY DESCRIPTION
The City Clerk's Office has three major functions: Legislation and Policy; Operations and Records Management; and Elections. Legislation and Policy - City Council governs the City of Lodi by enacting and enforcing laws, policies, and regulations concerning municipal affairs subject only to limitations and restrictions provided for in the statutes and Constitution of the State of California. Operations and Records Management - includes responsibility for preparing and maintaining legislative documents and ensuring compliance with a variety of laws and oversees the preservation, production, and protection of public records. Elections - conducting local elections for City Council Members, initiatives, referendums, and recalls pursuant to the procedures set forth in the Elections Code. Key elements of these functions include:
Enacting ordinances, appropriations, and resolutions while reviewing compliance with adopted laws, policies, and regulations.
Preparing and maintaining agendas, agenda packets, minutes, resolutions, ordinances, Council Communications, and miscellaneous legal notices pursuant to law.
Administering contracts/general liability claims programs; overseeing citywide records management program to ensure proper creation, maintenance, and destruction of city records; researching and responding to informational requests from Council, staff, and public; maintaining and updating various publications including Municipal Code; administering e-Records program.
Conducting regular and special elections; processing and certifying nomination papers, candidate statements, and citizen-generated petitions; preparing and advertising legal notifications in compliance with election rules and regulations; reviewing and updating the City's election manual; assisting with voter registration.
Ministerial duties including Statements of Economic Interest; Conflict of Interest Code; oaths of office; AB 1234 ethics training; certificates and proclamations; budget; taxicab and pedicab programs; bid openings; special City events; and department and Council correspondence.
MAJOR 2016-17 ACCOMPLISHMENTS
Entered contract for e-Records program replacement, worked with consultant to build in records retention/destruction values, and initiated transfer of data from current system to new system.
Conducted November 2016 General Municipal Election, which included actions to cancel the election of officers and submittal of two sales tax initiatives.
Completed review and prepared draft update of Council Protocol Manual with board/commission regulations pertaining to oaths of office, ethics training, and application acknowledgements of requirements. (Final Manual awaiting review and approval.)
MAJOR 2017-18 OBJECTIVES
Complete conversion of records to new Laserfiche system by verifying accuracy of data migration and metadata, correcting older records of poor quality, inputting backlogged records, and entering new data going forward.
Finalize updated Council Protocol Manual to include comments and feedback from City Manager, City Attorney, and board and commission liaisons before taking to Council for approval.
Prepare supplemental Election Manual with simplified check lists and correlating code sections for initiative, referendum, and recall processes.
PERFORMANCE MEASURES 2014-15 2015-16 2016-17 Regular meetings, special meetings, and Shirtsleeve Sessions Approx 62 Approx 98 Approx 89 Boards, committees, and commission appointments Approx 18 Approx 30 Approx 32 FPPC filing compliance 100% 100% 100% RELATED COST CENTER(S)
10005000
75
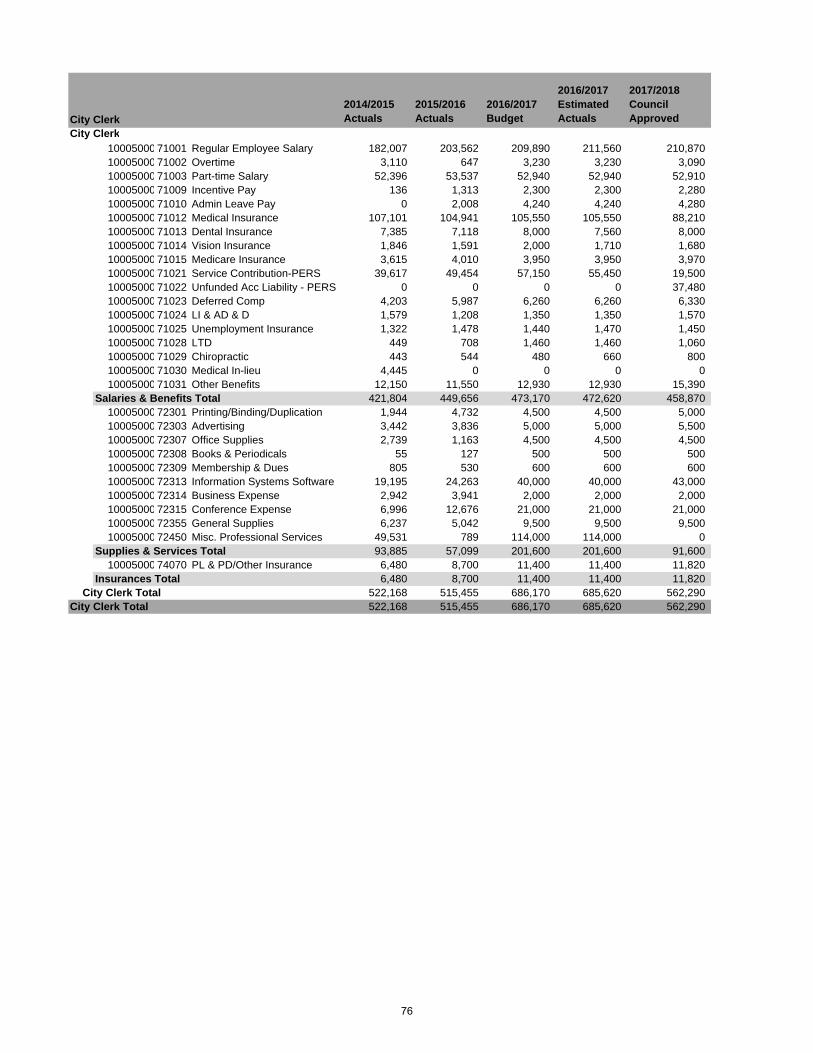
2014/2015 Actuals
2015/2016 Actuals
2016/2017 Budget
2016/2017 Estimated Actuals
2017/2018 Council Approved
City Clerk10005000 71001 Regular Employee Salary 182,007 203,562 209,890 211,560 210,87010005000 71002 Overtime 3,110 647 3,230 3,230 3,09010005000 71003 Part-time Salary 52,396 53,537 52,940 52,940 52,91010005000 71009 Incentive Pay 136 1,313 2,300 2,300 2,28010005000 71010 Admin Leave Pay 0 2,008 4,240 4,240 4,28010005000 71012 Medical Insurance 107,101 104,941 105,550 105,550 88,21010005000 71013 Dental Insurance 7,385 7,118 8,000 7,560 8,00010005000 71014 Vision Insurance 1,846 1,591 2,000 1,710 1,68010005000 71015 Medicare Insurance 3,615 4,010 3,950 3,950 3,97010005000 71021 Service Contribution-PERS 39,617 49,454 57,150 55,450 19,50010005000 71022 Unfunded Acc Liability - PERS 0 0 0 0 37,48010005000 71023 Deferred Comp 4,203 5,987 6,260 6,260 6,33010005000 71024 LI & AD & D 1,579 1,208 1,350 1,350 1,57010005000 71025 Unemployment Insurance 1,322 1,478 1,440 1,470 1,45010005000 71028 LTD 449 708 1,460 1,460 1,06010005000 71029 Chiropractic 443 544 480 660 80010005000 71030 Medical In-lieu 4,445 0 0 0 010005000 71031 Other Benefits 12,150 11,550 12,930 12,930 15,390
Salaries & Benefits Total 421,804 449,656 473,170 472,620 458,87010005000 72301 Printing/Binding/Duplication 1,944 4,732 4,500 4,500 5,00010005000 72303 Advertising 3,442 3,836 5,000 5,000 5,50010005000 72307 Office Supplies 2,739 1,163 4,500 4,500 4,50010005000 72308 Books & Periodicals 55 127 500 500 50010005000 72309 Membership & Dues 805 530 600 600 60010005000 72313 Information Systems Software 19,195 24,263 40,000 40,000 43,00010005000 72314 Business Expense 2,942 3,941 2,000 2,000 2,00010005000 72315 Conference Expense 6,996 12,676 21,000 21,000 21,00010005000 72355 General Supplies 6,237 5,042 9,500 9,500 9,50010005000 72450 Misc. Professional Services 49,531 789 114,000 114,000 0
Supplies & Services Total 93,885 57,099 201,600 201,600 91,60010005000 74070 PL & PD/Other Insurance 6,480 8,700 11,400 11,400 11,820
Insurances Total 6,480 8,700 11,400 11,400 11,820City Clerk Total 522,168 515,455 686,170 685,620 562,290
City Clerk Total 522,168 515,455 686,170 685,620 562,290
City Clerk
76

2014/2015 Actuals
2015/2016 Actuals
2016/2017 Budget
2016/2017 Estimated Actuals
2017/2018 Council Approved
Salaries 237,899 317,894 334,600 338,950 344,150PERS - Normal Costs 43,914 63,571 72,670 73,610 26,220PERS - UAL 0 0 0 0 50,400Other Benefits 77,131 94,449 93,660 94,350 96,570Supplies & Services 31,090 22,258 18,500 25,420 28,320Insurances 6,480 8,700 11,400 11,400 11,820
Total City Attorney 396,514 506,871 530,830 543,730 557,480
STAFFING SUMMARY
2014/15 2015/16 2016/17 2017/18Positions Positions Positions Positions
CITY ATTORNEYCity Attorney 1 1 1 1Deputy City Attorney 1 1 1 1Legal Secretary 1 1 1 1City Attorney Total 3 3 3 3
City Attorney
77
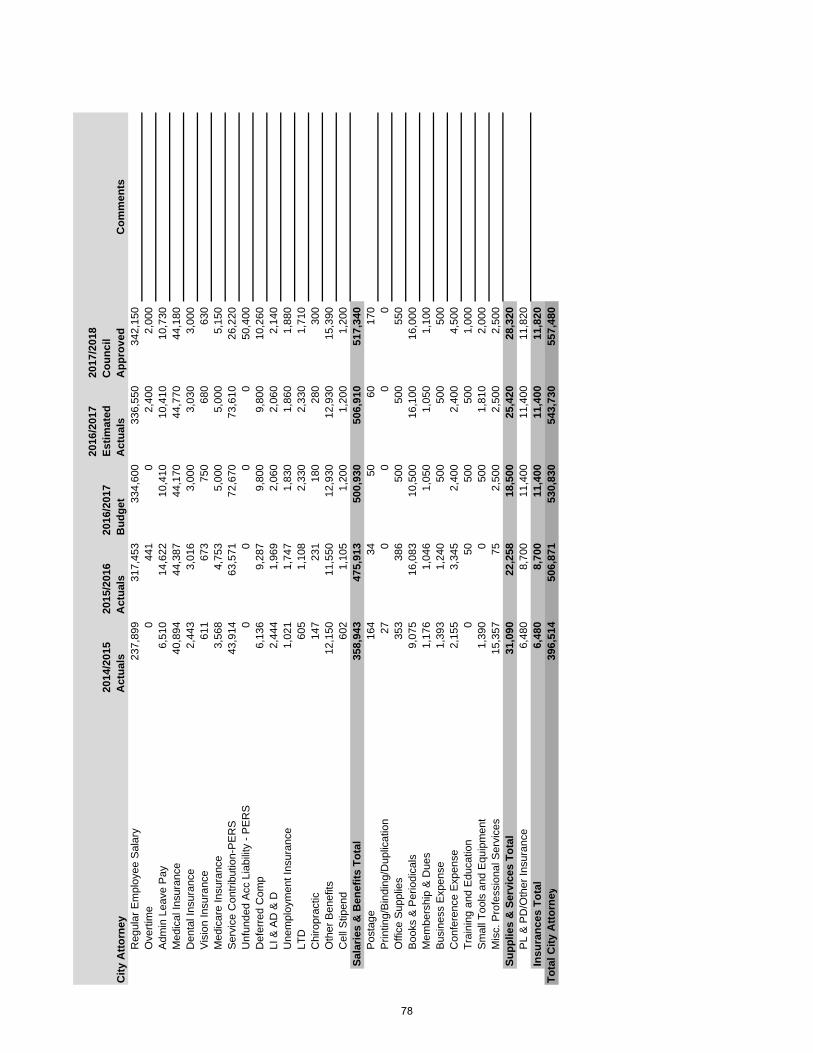
2014
/201
5 A
ctua
ls20
15/2
016
Act
uals
2016
/201
7 B
udge
t
2016
/201
7 Es
timat
ed
Act
uals
2017
/201
8 C
ounc
il A
ppro
ved
Com
men
tsR
egul
ar E
mpl
oyee
Sal
ary
237,
899
317,
453
334,
600
336,
550
342,
150
Ove
rtim
e0
441
02,
400
2,00
0A
dmin
Lea
ve P
ay6,
510
14,6
2210
,410
10,4
1010
,730
Med
ical
Insu
ranc
e40
,894
44,3
8744
,170
44,7
7044
,180
Den
tal I
nsur
ance
2,44
33,
016
3,00
03,
030
3,00
0V
isio
n In
sura
nce
611
673
750
680
630
Med
icar
e In
sura
nce
3,56
84,
753
5,00
05,
000
5,15
0S
ervi
ce C
ontri
butio
n-P
ER
S43
,914
63,5
7172
,670
73,6
1026
,220
Unf
unde
d A
cc L
iabi
lity
- PE
RS
00
00
50,4
00D
efer
red
Com
p6,
136
9,28
79,
800
9,80
010
,260
LI &
AD
& D
2,44
41,
969
2,06
02,
060
2,14
0U
nem
ploy
men
t Ins
uran
ce1,
021
1,74
71,
830
1,86
01,
880
LTD
605
1,10
82,
330
2,33
01,
710
Chi
ropr
actic
147
231
180
280
300
Oth
er B
enef
its12
,150
11,5
5012
,930
12,9
3015
,390
Cel
l Stip
end
602
1,10
51,
200
1,20
01,
200
Sala
ries
& B
enef
its T
otal
358,
943
475,
913
500,
930
506,
910
517,
340
Pos
tage
164
3450
6017
0P
rintin
g/B
indi
ng/D
uplic
atio
n27
00
00
Offi
ce S
uppl
ies
353
386
500
500
550
Boo
ks &
Per
iodi
cals
9,07
516
,083
10,5
0016
,100
16,0
00M
embe
rshi
p &
Due
s1,
176
1,04
61,
050
1,05
01,
100
Bus
ines
s E
xpen
se1,
393
1,24
050
050
050
0C
onfe
renc
e E
xpen
se2,
155
3,34
52,
400
2,40
04,
500
Trai
ning
and
Edu
catio
n0
5050
050
01,
000
Sm
all T
ools
and
Equ
ipm
ent
1,39
00
500
1,81
02,
000
Mis
c. P
rofe
ssio
nal S
ervi
ces
15,3
5775
2,50
02,
500
2,50
0Su
pplie
s &
Ser
vice
s To
tal
31,0
9022
,258
18,5
0025
,420
28,3
20P
L &
PD
/Oth
er In
sura
nce
6,48
08,
700
11,4
0011
,400
11,8
20In
sura
nces
Tot
al6,
480
8,70
011
,400
11,4
0011
,820
Tota
l City
Atto
rne y
396,
514
506,
871
530,
830
543,
730
557,
480
City
Atto
rney
78
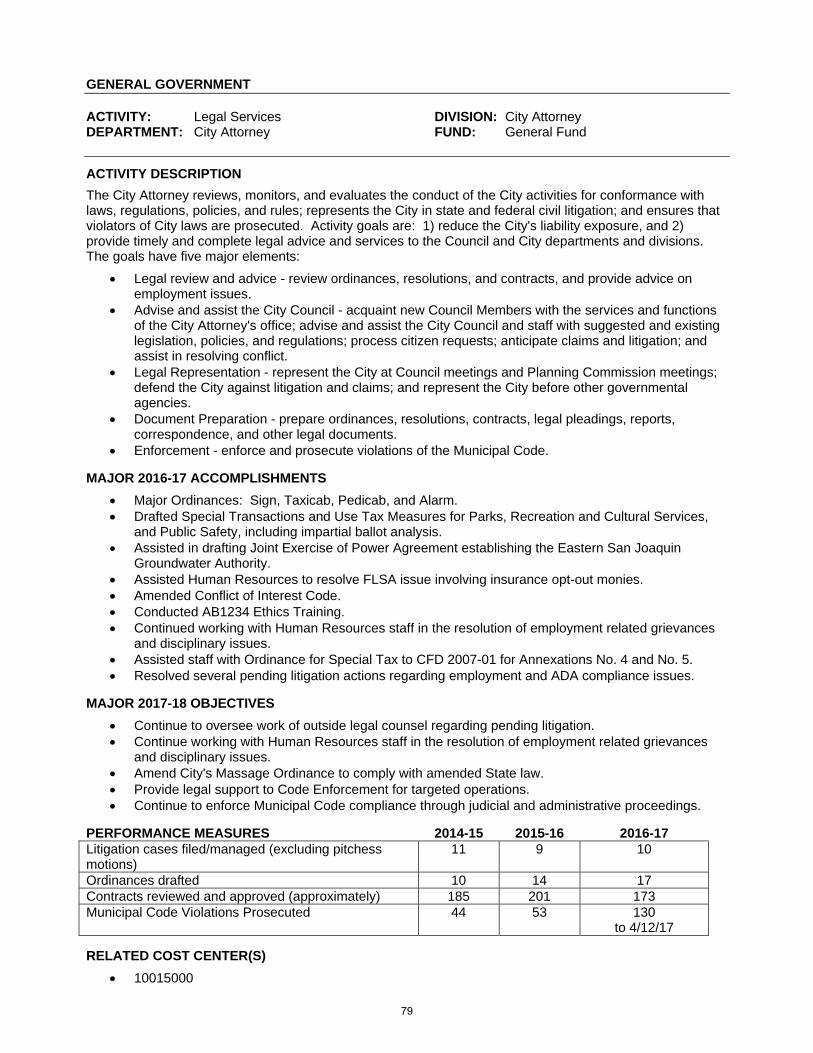
GENERAL GOVERNMENT ACTIVITY: Legal Services DIVISION: City Attorney DEPARTMENT: City Attorney FUND: General Fund
ACTIVITY DESCRIPTION
The City Attorney reviews, monitors, and evaluates the conduct of the City activities for conformance with laws, regulations, policies, and rules; represents the City in state and federal civil litigation; and ensures that violators of City laws are prosecuted. Activity goals are: 1) reduce the City's liability exposure, and 2) provide timely and complete legal advice and services to the Council and City departments and divisions. The goals have five major elements:
Legal review and advice - review ordinances, resolutions, and contracts, and provide advice on employment issues.
Advise and assist the City Council - acquaint new Council Members with the services and functions of the City Attorney's office; advise and assist the City Council and staff with suggested and existing legislation, policies, and regulations; process citizen requests; anticipate claims and litigation; and assist in resolving conflict.
Legal Representation - represent the City at Council meetings and Planning Commission meetings; defend the City against litigation and claims; and represent the City before other governmental agencies.
Document Preparation - prepare ordinances, resolutions, contracts, legal pleadings, reports, correspondence, and other legal documents.
Enforcement - enforce and prosecute violations of the Municipal Code. MAJOR 2016-17 ACCOMPLISHMENTS
Major Ordinances: Sign, Taxicab, Pedicab, and Alarm. Drafted Special Transactions and Use Tax Measures for Parks, Recreation and Cultural Services,
and Public Safety, including impartial ballot analysis. Assisted in drafting Joint Exercise of Power Agreement establishing the Eastern San Joaquin
Groundwater Authority. Assisted Human Resources to resolve FLSA issue involving insurance opt-out monies. Amended Conflict of Interest Code. Conducted AB1234 Ethics Training. Continued working with Human Resources staff in the resolution of employment related grievances
and disciplinary issues. Assisted staff with Ordinance for Special Tax to CFD 2007-01 for Annexations No. 4 and No. 5. Resolved several pending litigation actions regarding employment and ADA compliance issues.
MAJOR 2017-18 OBJECTIVES
Continue to oversee work of outside legal counsel regarding pending litigation. Continue working with Human Resources staff in the resolution of employment related grievances
and disciplinary issues. Amend City's Massage Ordinance to comply with amended State law. Provide legal support to Code Enforcement for targeted operations. Continue to enforce Municipal Code compliance through judicial and administrative proceedings.
PERFORMANCE MEASURES 2014-15 2015-16 2016-17 Litigation cases filed/managed (excluding pitchess motions)
11 9 10
Ordinances drafted 10 14 17 Contracts reviewed and approved (approximately) 185 201 173 Municipal Code Violations Prosecuted 44 53 130
to 4/12/17 RELATED COST CENTER(S)
10015000
79
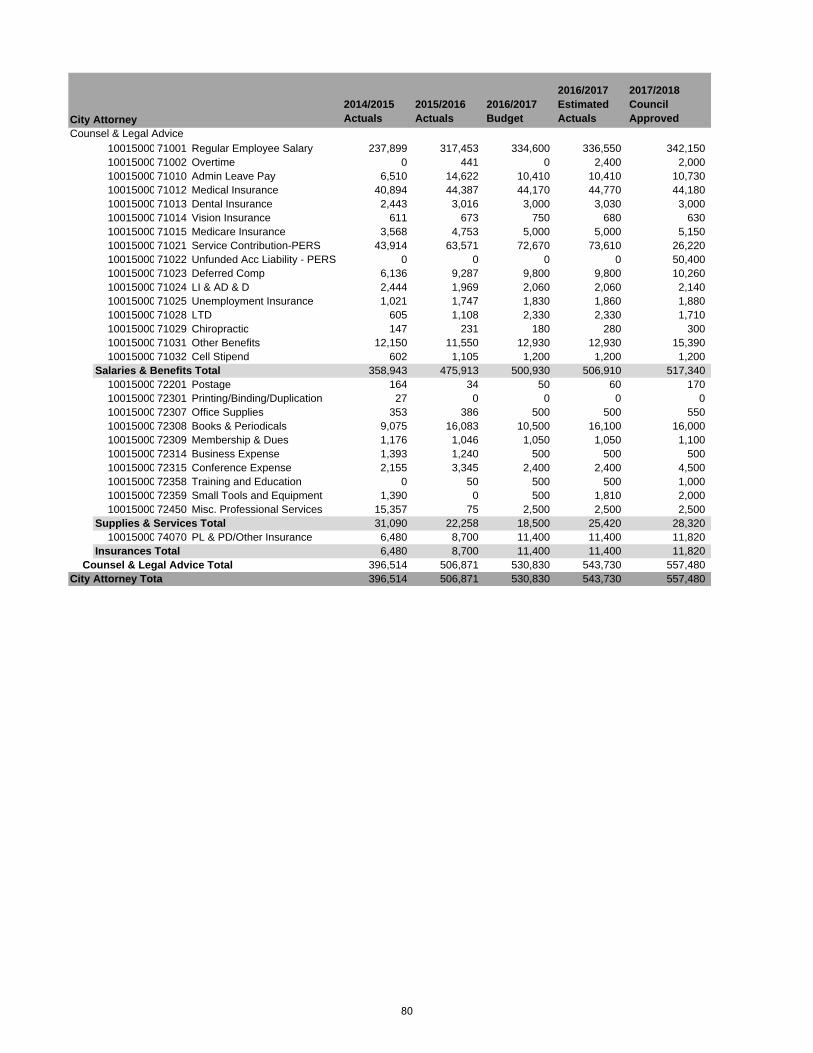
2014/2015 Actuals
2015/2016 Actuals
2016/2017 Budget
2016/2017 Estimated Actuals
2017/2018 Council Approved
Counsel & Legal Advice10015000 71001 Regular Employee Salary 237,899 317,453 334,600 336,550 342,15010015000 71002 Overtime 0 441 0 2,400 2,00010015000 71010 Admin Leave Pay 6,510 14,622 10,410 10,410 10,73010015000 71012 Medical Insurance 40,894 44,387 44,170 44,770 44,18010015000 71013 Dental Insurance 2,443 3,016 3,000 3,030 3,00010015000 71014 Vision Insurance 611 673 750 680 63010015000 71015 Medicare Insurance 3,568 4,753 5,000 5,000 5,15010015000 71021 Service Contribution-PERS 43,914 63,571 72,670 73,610 26,22010015000 71022 Unfunded Acc Liability - PERS 0 0 0 0 50,40010015000 71023 Deferred Comp 6,136 9,287 9,800 9,800 10,26010015000 71024 LI & AD & D 2,444 1,969 2,060 2,060 2,14010015000 71025 Unemployment Insurance 1,021 1,747 1,830 1,860 1,88010015000 71028 LTD 605 1,108 2,330 2,330 1,71010015000 71029 Chiropractic 147 231 180 280 30010015000 71031 Other Benefits 12,150 11,550 12,930 12,930 15,39010015000 71032 Cell Stipend 602 1,105 1,200 1,200 1,200
Salaries & Benefits Total 358,943 475,913 500,930 506,910 517,34010015000 72201 Postage 164 34 50 60 17010015000 72301 Printing/Binding/Duplication 27 0 0 0 010015000 72307 Office Supplies 353 386 500 500 55010015000 72308 Books & Periodicals 9,075 16,083 10,500 16,100 16,00010015000 72309 Membership & Dues 1,176 1,046 1,050 1,050 1,10010015000 72314 Business Expense 1,393 1,240 500 500 50010015000 72315 Conference Expense 2,155 3,345 2,400 2,400 4,50010015000 72358 Training and Education 0 50 500 500 1,00010015000 72359 Small Tools and Equipment 1,390 0 500 1,810 2,00010015000 72450 Misc. Professional Services 15,357 75 2,500 2,500 2,500
Supplies & Services Total 31,090 22,258 18,500 25,420 28,32010015000 74070 PL & PD/Other Insurance 6,480 8,700 11,400 11,400 11,820
Insurances Total 6,480 8,700 11,400 11,400 11,820Counsel & Legal Advice Total 396,514 506,871 530,830 543,730 557,480
City Attorney Total 396,514 506,871 530,830 543,730 557,480
City Attorney
80
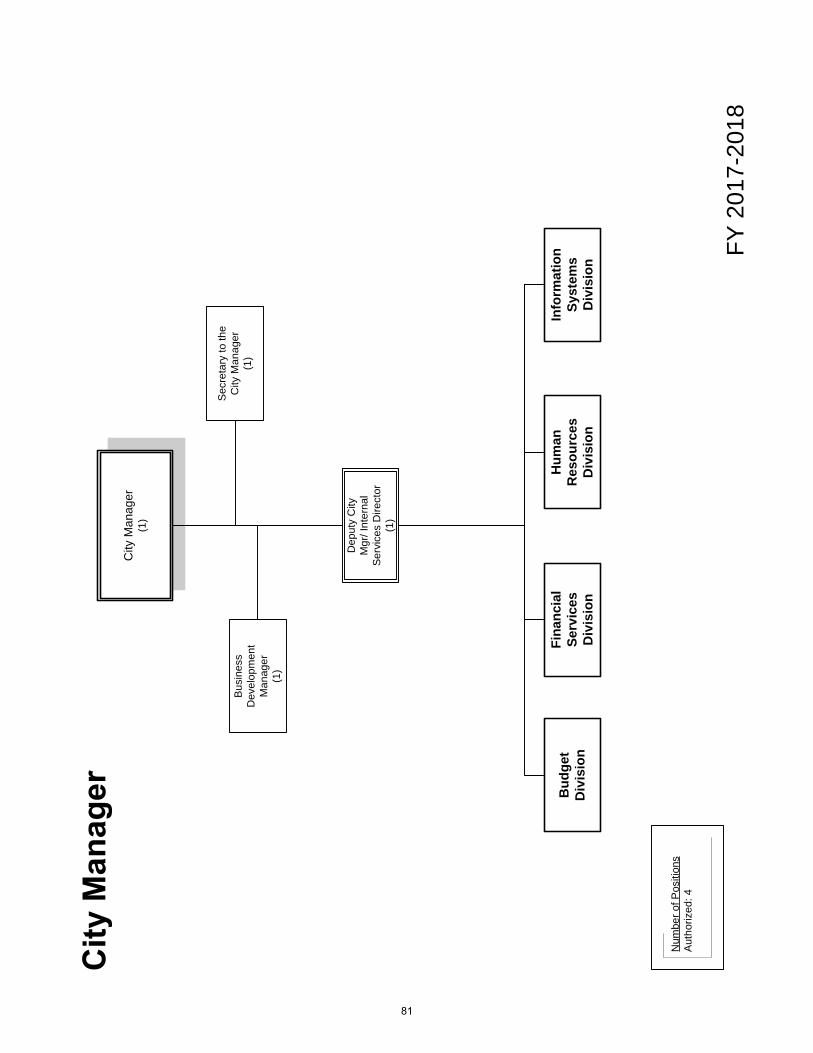
FY 2
017-
2018
Num
ber o
f Pos
ition
sA
utho
rized
: 4
City
Man
ager
(1)
Dep
uty
City
M
gr/ I
nter
nal
Serv
ices
Dire
ctor
(1)
Busi
ness
D
evel
opm
ent
Man
ager
(1
)
Sec
reta
ry to
the
City
Man
ager
(1)
Hum
an
Res
ourc
esD
ivis
ion
Info
rmat
ion
Syst
ems
Div
isio
n
Bud
get
Div
isio
n
Fina
ncia
l Se
rvic
es
Div
isio
n
81
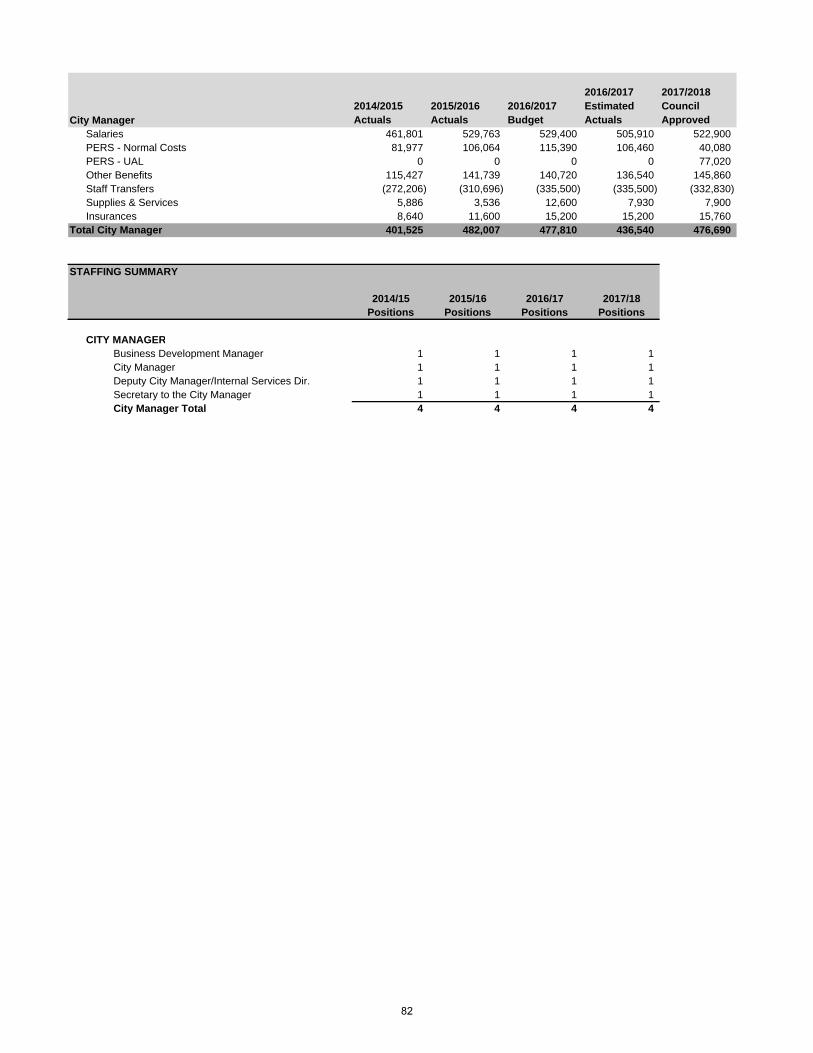
2014/2015 Actuals
2015/2016 Actuals
2016/2017 Budget
2016/2017 Estimated Actuals
2017/2018 Council Approved
Salaries 461,801 529,763 529,400 505,910 522,900PERS - Normal Costs 81,977 106,064 115,390 106,460 40,080PERS - UAL 0 0 0 0 77,020Other Benefits 115,427 141,739 140,720 136,540 145,860Staff Transfers (272,206) (310,696) (335,500) (335,500) (332,830)Supplies & Services 5,886 3,536 12,600 7,930 7,900Insurances 8,640 11,600 15,200 15,200 15,760
Total City Manager 401,525 482,007 477,810 436,540 476,690
STAFFING SUMMARY
2014/15 2015/16 2016/17 2017/18Positions Positions Positions Positions
CITY MANAGERBusiness Development Manager 1 1 1 1City Manager 1 1 1 1Deputy City Manager/Internal Services Dir. 1 1 1 1Secretary to the City Manager 1 1 1 1City Manager Total 4 4 4 4
City Manager
82
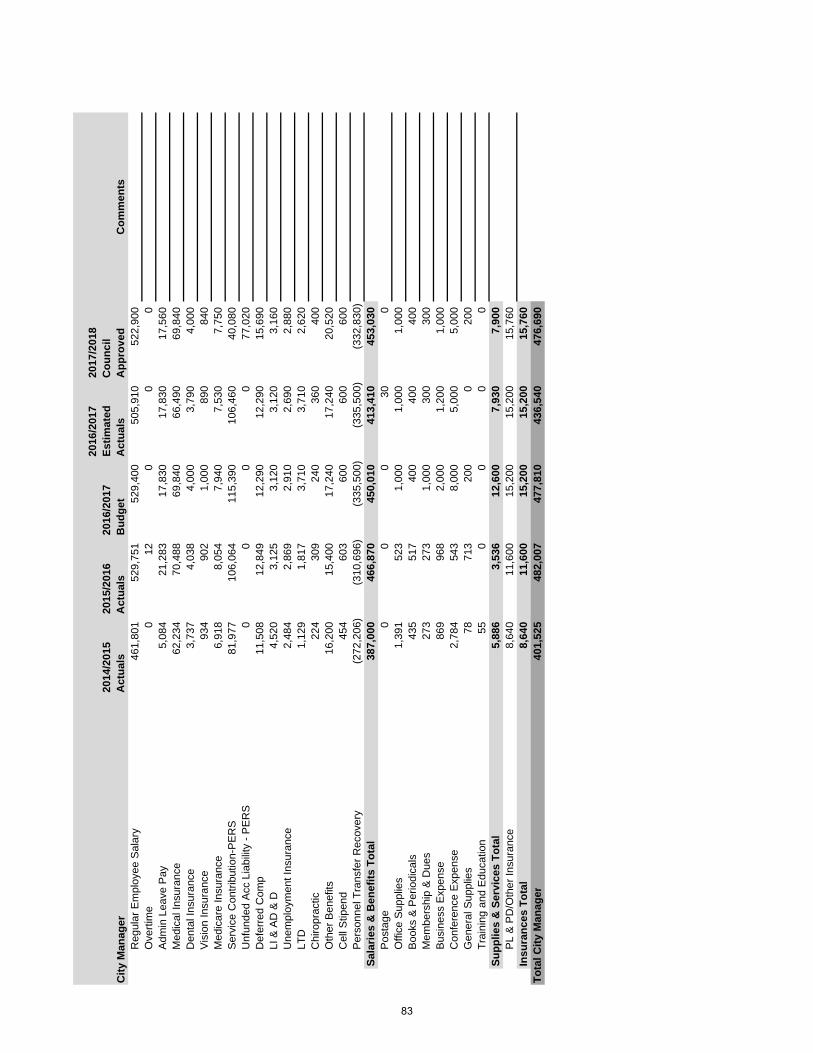
2014
/201
5 A
ctua
ls20
15/2
016
Act
uals
2016
/201
7 B
udge
t
2016
/201
7 Es
timat
ed
Act
uals
2017
/201
8 C
ounc
il A
ppro
ved
Com
men
tsR
egul
ar E
mpl
oyee
Sal
ary
461,
801
529,
751
529,
400
505,
910
522,
900
Ove
rtim
e0
120
00
Adm
in L
eave
Pay
5,08
421
,283
17,8
3017
,830
17,5
60M
edic
al In
sura
nce
62,2
3470
,488
69,8
4066
,490
69,8
40D
enta
l Ins
uran
ce3,
737
4,03
84,
000
3,79
04,
000
Vis
ion
Insu
ranc
e93
490
21,
000
890
840
Med
icar
e In
sura
nce
6,91
88,
054
7,94
07,
530
7,75
0S
ervi
ce C
ontri
butio
n-P
ER
S81
,977
106,
064
115,
390
106,
460
40,0
80U
nfun
ded
Acc
Lia
bilit
y - P
ER
S0
00
077
,020
Def
erre
d C
omp
11,5
0812
,849
12,2
9012
,290
15,6
90LI
& A
D &
D4,
520
3,12
53,
120
3,12
03,
160
Une
mpl
oym
ent I
nsur
ance
2,48
42,
869
2,91
02,
690
2,88
0LT
D1,
129
1,81
73,
710
3,71
02,
620
Chi
ropr
actic
224
309
240
360
400
Oth
er B
enef
its16
,200
15,4
0017
,240
17,2
4020
,520
Cel
l Stip
end
454
603
600
600
600
Per
sonn
el T
rans
fer R
ecov
ery
(272
,206
)(3
10,6
96)
(335
,500
)(3
35,5
00)
(332
,830
)Sa
larie
s &
Ben
efits
Tot
al38
7,00
046
6,87
045
0,01
041
3,41
045
3,03
0P
osta
ge0
00
300
Offi
ce S
uppl
ies
1,39
152
31,
000
1,00
01,
000
Boo
ks &
Per
iodi
cals
435
517
400
400
400
Mem
bers
hip
& D
ues
273
273
1,00
030
030
0B
usin
ess
Exp
ense
869
968
2,00
01,
200
1,00
0C
onfe
renc
e E
xpen
se2,
784
543
8,00
05,
000
5,00
0G
ener
al S
uppl
ies
7871
320
00
200
Trai
ning
and
Edu
catio
n55
00
00
Supp
lies
& S
ervi
ces
Tota
l5,
886
3,53
612
,600
7,93
07,
900
PL
& P
D/O
ther
Insu
ranc
e8,
640
11,6
0015
,200
15,2
0015
,760
Insu
ranc
es T
otal
8,64
011
,600
15,2
0015
,200
15,7
60To
tal C
ity M
anag
e r40
1,52
548
2,00
747
7,81
043
6,54
047
6,69
0
City
Man
ager
83

(This page intentionally left blank)
84
GENERAL GOVERNMENT ACTIVITY: Administration DIVISION: City Manager DEPARTMENT: City Manager FUND: General Fund ACTIVITY DESCRIPTION The City Manager’s Office provides overall management and coordination of the City of Lodi municipal corporation, implements City Council policy directives, and directly oversees the internal administrative functions of the City including Financial Services, Budget and Treasury, Human Resources, Risk Management, Information Services, and Economic Development. The City Manager's office emphasizes the following four areas:
Efficiency – seeks out entrepreneurial activities and cost-savings opportunities. Economic Development – business attraction and retention, job creation. Land Use – General Plan update. Internal Services - manages the City's Internal Services functions of Budgeting, Financial Services,
Human Resources, Risk Management, and Information Systems. MAJOR 2016-17 ACCOMPLISHMENTS
Created and funded PERS stabilization fund. Built consensus at the League of California Cities to re-engage on PERS reform. Implemented Munis utility billing. Adopted comprehensive financial policies. Recruited new Deputy City Manager.
MAJOR 2017-18 OBJECTIVES
Explore options to deliver municipal services in more cost competitive fashion. Negotiate new Memorandums of Understanding with all bargaining groups. Explore new revenue opportunities. Improve Munis utility billing customer interface.
RELATED COST CENTER(S)
10010000
85
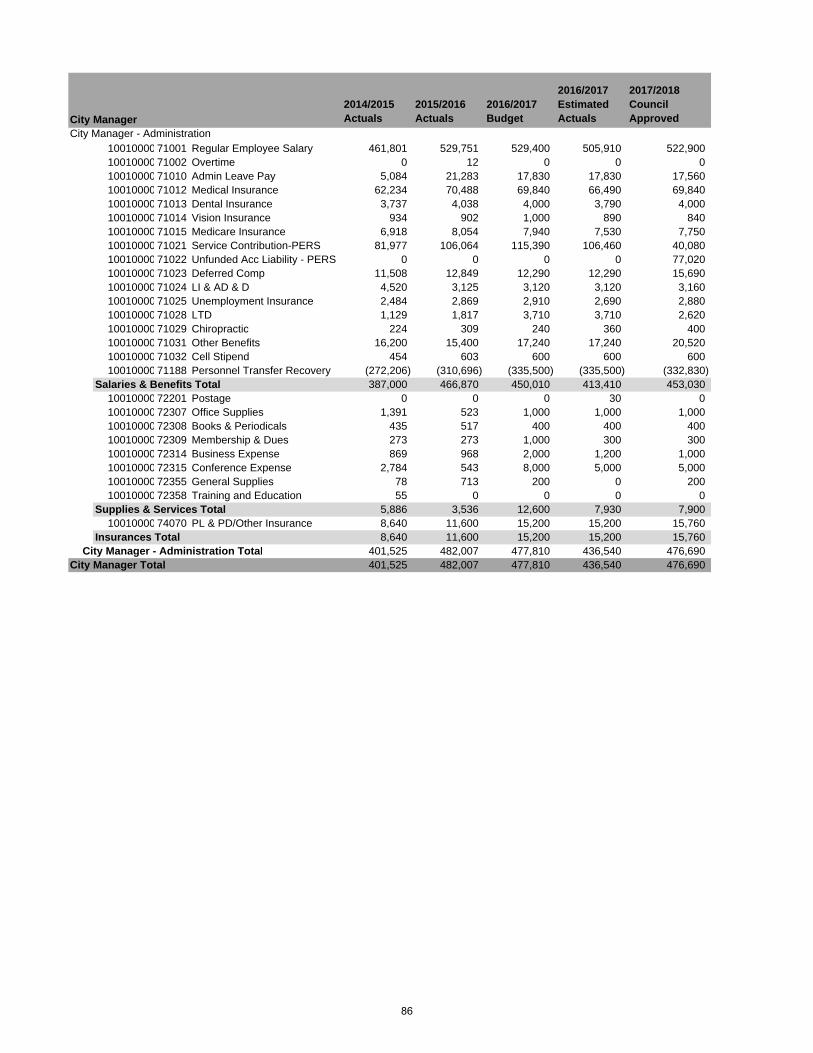
2014/2015 Actuals
2015/2016 Actuals
2016/2017 Budget
2016/2017 Estimated Actuals
2017/2018 Council Approved
City Manager - Administration10010000 71001 Regular Employee Salary 461,801 529,751 529,400 505,910 522,90010010000 71002 Overtime 0 12 0 0 010010000 71010 Admin Leave Pay 5,084 21,283 17,830 17,830 17,56010010000 71012 Medical Insurance 62,234 70,488 69,840 66,490 69,84010010000 71013 Dental Insurance 3,737 4,038 4,000 3,790 4,00010010000 71014 Vision Insurance 934 902 1,000 890 84010010000 71015 Medicare Insurance 6,918 8,054 7,940 7,530 7,75010010000 71021 Service Contribution-PERS 81,977 106,064 115,390 106,460 40,08010010000 71022 Unfunded Acc Liability - PERS 0 0 0 0 77,02010010000 71023 Deferred Comp 11,508 12,849 12,290 12,290 15,69010010000 71024 LI & AD & D 4,520 3,125 3,120 3,120 3,16010010000 71025 Unemployment Insurance 2,484 2,869 2,910 2,690 2,88010010000 71028 LTD 1,129 1,817 3,710 3,710 2,62010010000 71029 Chiropractic 224 309 240 360 40010010000 71031 Other Benefits 16,200 15,400 17,240 17,240 20,52010010000 71032 Cell Stipend 454 603 600 600 60010010000 71188 Personnel Transfer Recovery (272,206) (310,696) (335,500) (335,500) (332,830)
Salaries & Benefits Total 387,000 466,870 450,010 413,410 453,03010010000 72201 Postage 0 0 0 30 010010000 72307 Office Supplies 1,391 523 1,000 1,000 1,00010010000 72308 Books & Periodicals 435 517 400 400 40010010000 72309 Membership & Dues 273 273 1,000 300 30010010000 72314 Business Expense 869 968 2,000 1,200 1,00010010000 72315 Conference Expense 2,784 543 8,000 5,000 5,00010010000 72355 General Supplies 78 713 200 0 20010010000 72358 Training and Education 55 0 0 0 0
Supplies & Services Total 5,886 3,536 12,600 7,930 7,90010010000 74070 PL & PD/Other Insurance 8,640 11,600 15,200 15,200 15,760
Insurances Total 8,640 11,600 15,200 15,200 15,760City Manager - Administration Total 401,525 482,007 477,810 436,540 476,690
City Manager Total 401,525 482,007 477,810 436,540 476,690
City Manager
86
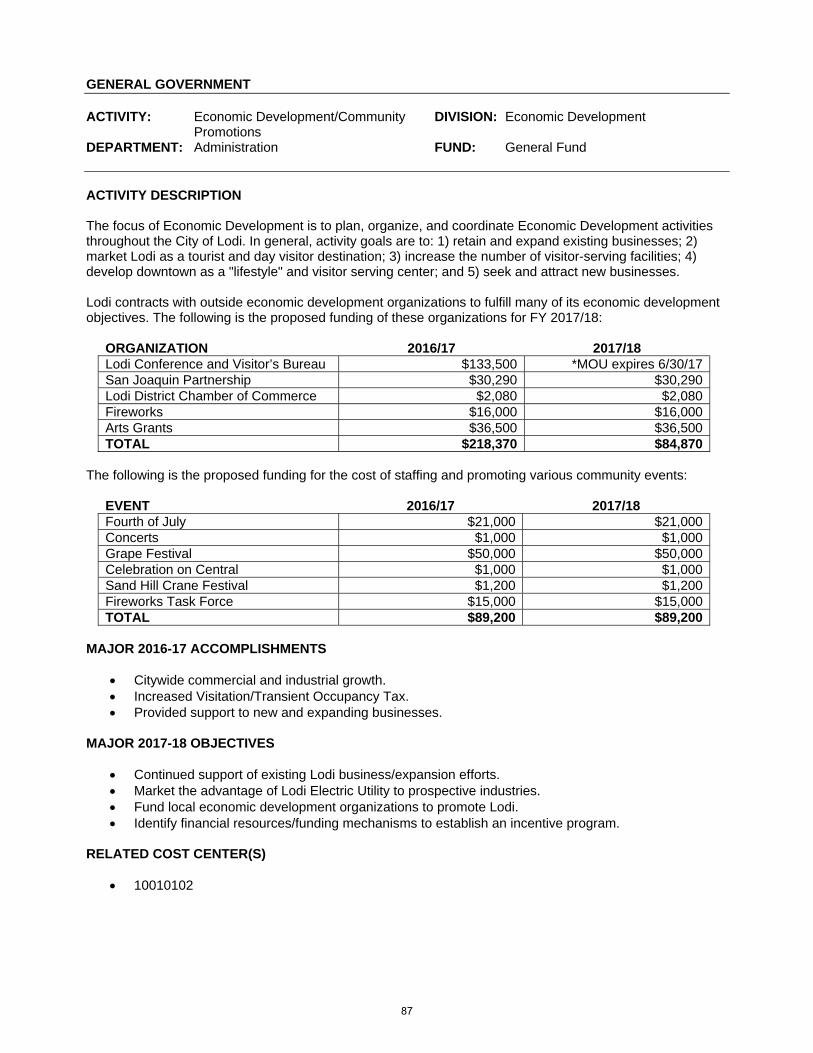
GENERAL GOVERNMENT ACTIVITY: Economic Development/Community
Promotions DIVISION: Economic Development
DEPARTMENT: Administration FUND: General Fund ACTIVITY DESCRIPTION The focus of Economic Development is to plan, organize, and coordinate Economic Development activities throughout the City of Lodi. In general, activity goals are to: 1) retain and expand existing businesses; 2) market Lodi as a tourist and day visitor destination; 3) increase the number of visitor-serving facilities; 4) develop downtown as a "lifestyle" and visitor serving center; and 5) seek and attract new businesses. Lodi contracts with outside economic development organizations to fulfill many of its economic development objectives. The following is the proposed funding of these organizations for FY 2017/18:
ORGANIZATION 2016/17 2017/18 Lodi Conference and Visitor’s Bureau $133,500 *MOU expires 6/30/17San Joaquin Partnership $30,290 $30,290Lodi District Chamber of Commerce $2,080 $2,080Fireworks $16,000 $16,000Arts Grants $36,500 $36,500TOTAL $218,370 $84,870
The following is the proposed funding for the cost of staffing and promoting various community events:
EVENT 2016/17 2017/18 Fourth of July $21,000 $21,000Concerts $1,000 $1,000Grape Festival $50,000 $50,000Celebration on Central $1,000 $1,000Sand Hill Crane Festival $1,200 $1,200Fireworks Task Force $15,000 $15,000TOTAL $89,200 $89,200
MAJOR 2016-17 ACCOMPLISHMENTS
Citywide commercial and industrial growth. Increased Visitation/Transient Occupancy Tax. Provided support to new and expanding businesses.
MAJOR 2017-18 OBJECTIVES
Continued support of existing Lodi business/expansion efforts. Market the advantage of Lodi Electric Utility to prospective industries. Fund local economic development organizations to promote Lodi. Identify financial resources/funding mechanisms to establish an incentive program.
RELATED COST CENTER(S)
10010102
87
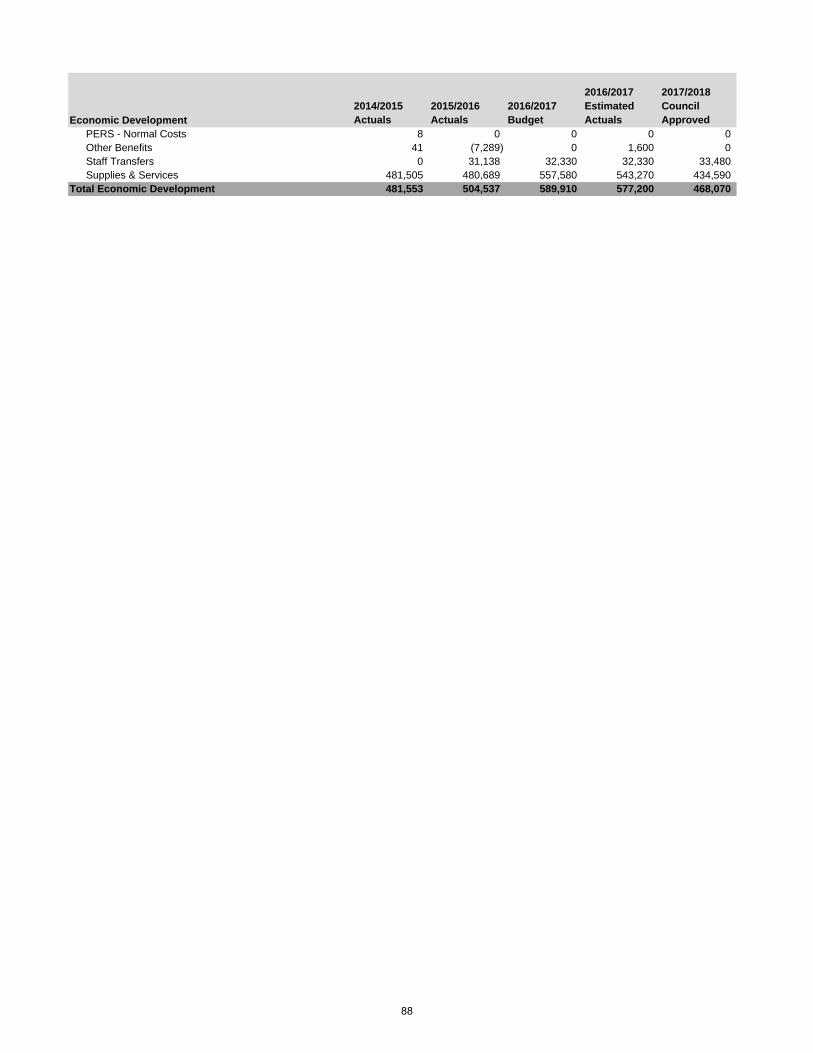
2014/2015 Actuals
2015/2016 Actuals
2016/2017 Budget
2016/2017 Estimated Actuals
2017/2018 Council Approved
PERS - Normal Costs 8 0 0 0 0Other Benefits 41 (7,289) 0 1,600 0Staff Transfers 0 31,138 32,330 32,330 33,480Supplies & Services 481,505 480,689 557,580 543,270 434,590
Total Economic Development 481,553 504,537 589,910 577,200 468,070
Economic Development
88
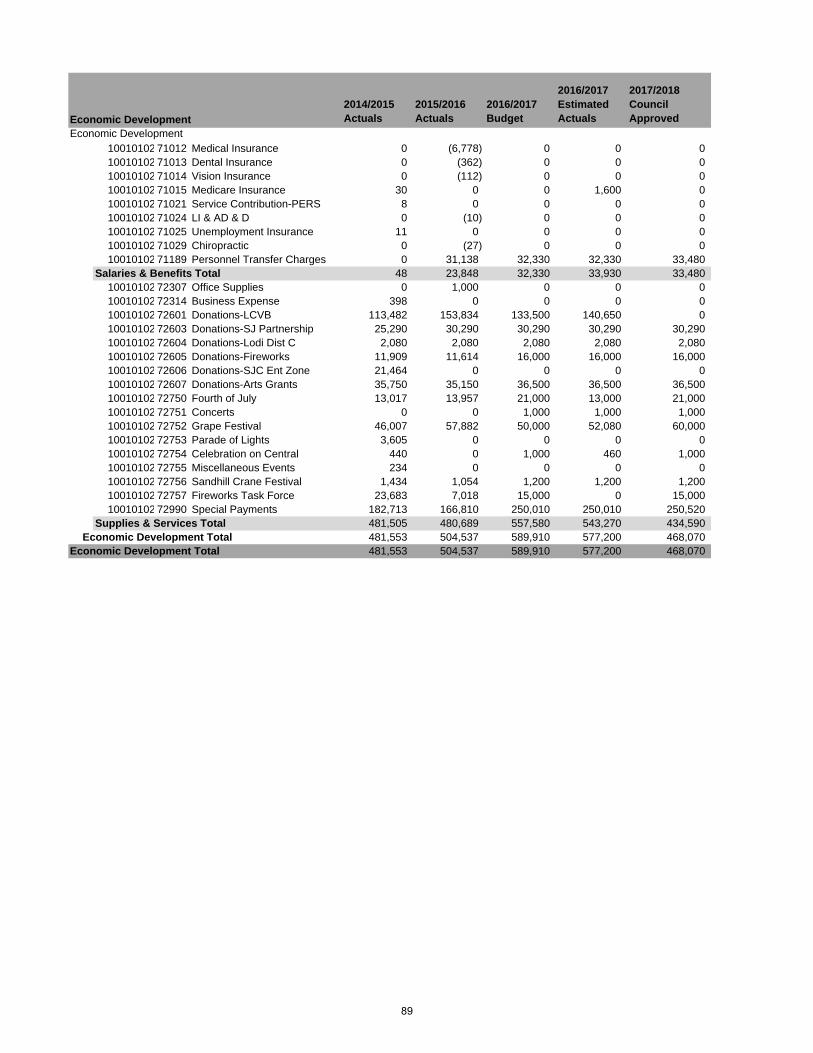
2014/2015 Actuals
2015/2016 Actuals
2016/2017 Budget
2016/2017 Estimated Actuals
2017/2018 Council Approved
Economic Development10010102 71012 Medical Insurance 0 (6,778) 0 0 010010102 71013 Dental Insurance 0 (362) 0 0 010010102 71014 Vision Insurance 0 (112) 0 0 010010102 71015 Medicare Insurance 30 0 0 1,600 010010102 71021 Service Contribution-PERS 8 0 0 0 010010102 71024 LI & AD & D 0 (10) 0 0 010010102 71025 Unemployment Insurance 11 0 0 0 010010102 71029 Chiropractic 0 (27) 0 0 010010102 71189 Personnel Transfer Charges 0 31,138 32,330 32,330 33,480
Salaries & Benefits Total 48 23,848 32,330 33,930 33,48010010102 72307 Office Supplies 0 1,000 0 0 010010102 72314 Business Expense 398 0 0 0 010010102 72601 Donations-LCVB 113,482 153,834 133,500 140,650 010010102 72603 Donations-SJ Partnership 25,290 30,290 30,290 30,290 30,29010010102 72604 Donations-Lodi Dist C 2,080 2,080 2,080 2,080 2,08010010102 72605 Donations-Fireworks 11,909 11,614 16,000 16,000 16,00010010102 72606 Donations-SJC Ent Zone 21,464 0 0 0 010010102 72607 Donations-Arts Grants 35,750 35,150 36,500 36,500 36,50010010102 72750 Fourth of July 13,017 13,957 21,000 13,000 21,00010010102 72751 Concerts 0 0 1,000 1,000 1,00010010102 72752 Grape Festival 46,007 57,882 50,000 52,080 60,00010010102 72753 Parade of Lights 3,605 0 0 0 010010102 72754 Celebration on Central 440 0 1,000 460 1,00010010102 72755 Miscellaneous Events 234 0 0 0 010010102 72756 Sandhill Crane Festival 1,434 1,054 1,200 1,200 1,20010010102 72757 Fireworks Task Force 23,683 7,018 15,000 0 15,00010010102 72990 Special Payments 182,713 166,810 250,010 250,010 250,520
Supplies & Services Total 481,505 480,689 557,580 543,270 434,590Economic Development Total 481,553 504,537 589,910 577,200 468,070
Economic Development Total 481,553 504,537 589,910 577,200 468,070
Economic Development
89

(This page intentionally left blank)
90
INTERNAL SERVICES The Internal Services Department comprises of Budget, Financial Services, Human Resources, Risk Management and Information Systems divisions under the direct supervision of the Deputy City Manager/Internal Services Director. The Internal Services Department makes financial projections and is responsible for the City’s financial services. It also is responsible for all personnel matters and maintaining the City’s computer systems. Internal Services has a budget of $3,935,880 in FY 2017/18, compared to $3,826,830 as originally budgeted in FY 2016/17. The 2016/17 budget shown in the following pages reflects adjustments made throughout the year. FY 2017/18 budgeted staffing is being increased by 1 to 32 positions. This position will provide additional accounting resources to enhance internal controls and ensure timely processing of various reconciliations and monthly closeout activity. Organizational charts, staffing summaries, detailed activity descriptions and financial tables are included in the following pages.
91

(This page intentionally left blank)
92
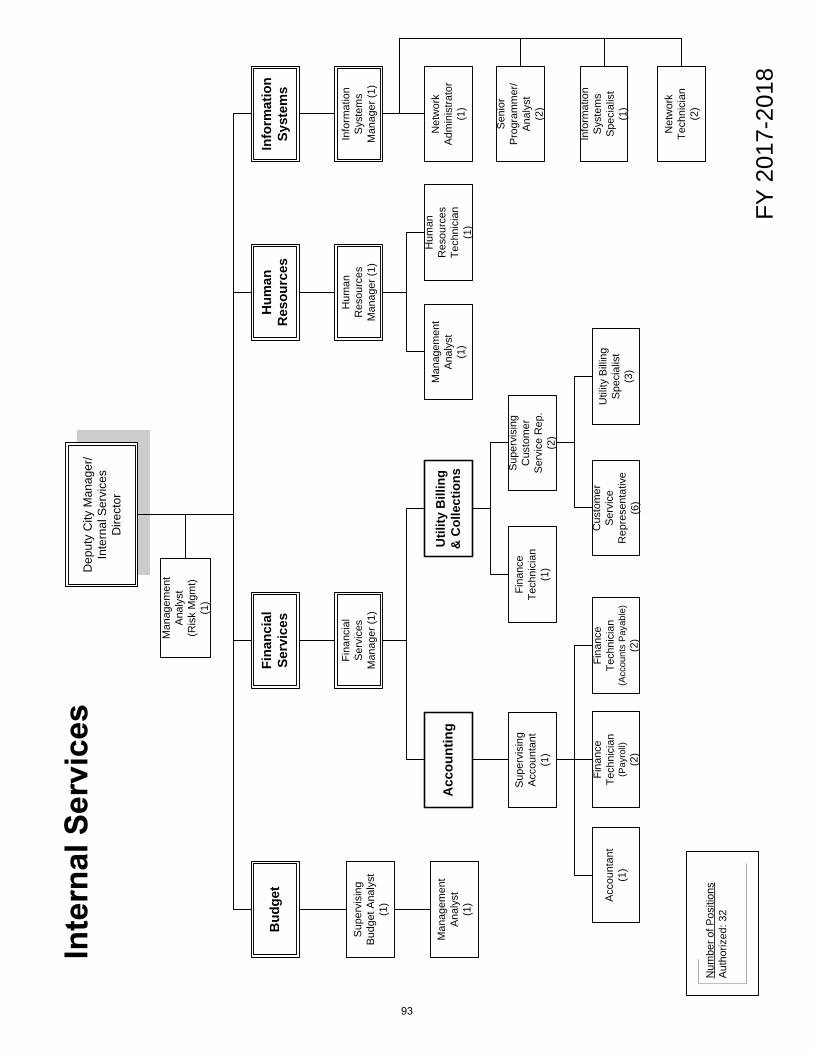
FY 2
017-
2018
Num
ber o
f Pos
ition
sAu
thor
ized
: 32
Dep
uty
City
Man
ager
/In
tern
al S
ervi
ces
Dire
ctor
Fina
ncia
l Se
rvic
esH
uman
R
esou
rces
Bud
get
Info
rmat
ion
Syst
ems
Sup
ervi
sing
Bu
dget
Ana
lyst
(1
)
Fina
ncia
l S
ervi
ces
Man
ager
(1)
Acc
ount
ing
Util
ity B
illin
g &
Col
lect
ions
Fina
nce
Tech
nici
an(1
)
Sup
ervi
sing
C
usto
mer
S
ervi
ce R
ep.
(2
)
Cus
tom
er
Ser
vice
R
epre
sent
ativ
e(6
)
Supe
rvis
ing
Acco
unta
nt(1
)
Fina
nce
Tech
nici
an
(Acc
ount
s P
ayab
le)
(2)
Fina
nce
Tech
nici
an(P
ayro
ll)(2
)
Hum
an
Res
ourc
es
Tech
nici
an
(1)
Man
agem
ent
Ana
lyst
(1
)
Hum
an
Res
ourc
es
Man
ager
(1)
Info
rmat
ion
Sys
tem
s M
anag
er (1
)
Net
wor
k A
dmin
istra
tor
(1)
Sen
ior
Prog
ram
mer
/An
alys
t (2
)
Info
rmat
ion
Sys
tem
s S
peci
alis
t (1
)
Net
wor
k Te
chni
cian
(2)
Man
agem
ent
Anal
yst
(1)
Man
agem
ent
Ana
lyst
(Ris
k M
gmt)
(1)
Util
ity B
illin
g S
peci
alis
t(3
)
Acc
ount
ant
(1)
93
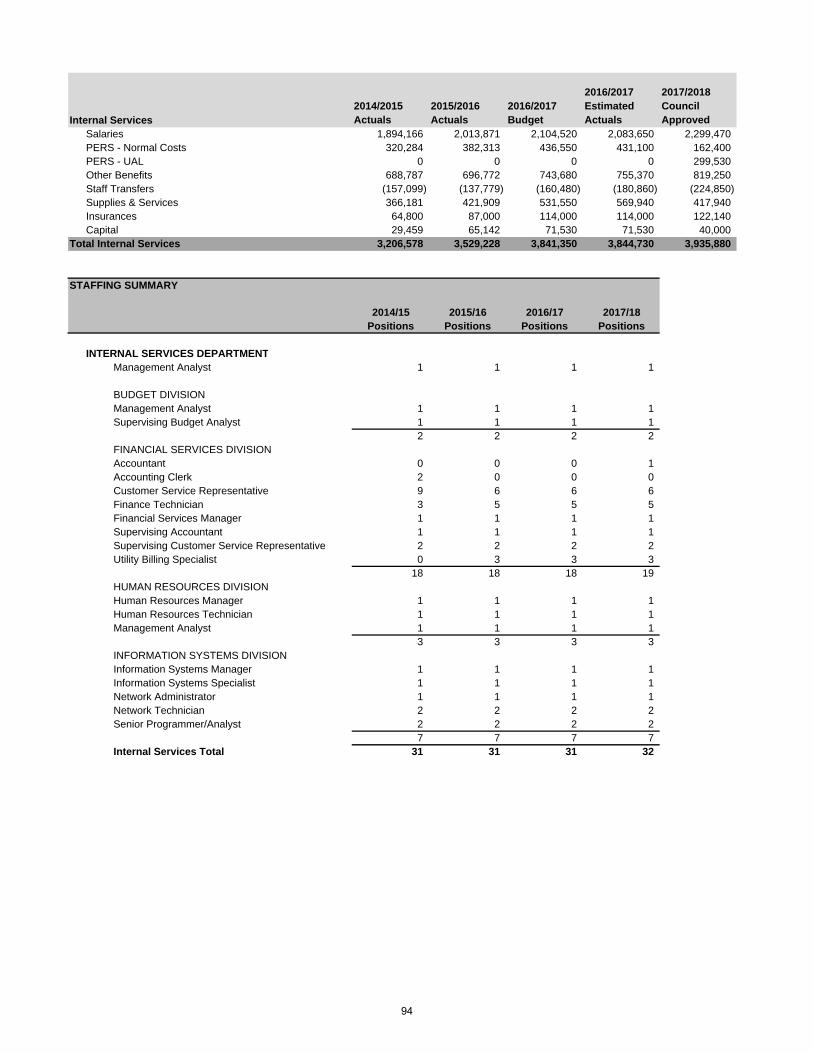
2014/2015 Actuals
2015/2016 Actuals
2016/2017 Budget
2016/2017 Estimated Actuals
2017/2018 Council Approved
Salaries 1,894,166 2,013,871 2,104,520 2,083,650 2,299,470PERS - Normal Costs 320,284 382,313 436,550 431,100 162,400PERS - UAL 0 0 0 0 299,530Other Benefits 688,787 696,772 743,680 755,370 819,250Staff Transfers (157,099) (137,779) (160,480) (180,860) (224,850)Supplies & Services 366,181 421,909 531,550 569,940 417,940Insurances 64,800 87,000 114,000 114,000 122,140Capital 29,459 65,142 71,530 71,530 40,000
Total Internal Services 3,206,578 3,529,228 3,841,350 3,844,730 3,935,880
STAFFING SUMMARY
2014/15 2015/16 2016/17 2017/18Positions Positions Positions Positions
INTERNAL SERVICES DEPARTMENTManagement Analyst 1 1 1 1
BUDGET DIVISIONManagement Analyst 1 1 1 1Supervising Budget Analyst 1 1 1 1
2 2 2 2FINANCIAL SERVICES DIVISIONAccountant 0 0 0 1Accounting Clerk 2 0 0 0Customer Service Representative 9 6 6 6Finance Technician 3 5 5 5Financial Services Manager 1 1 1 1Supervising Accountant 1 1 1 1Supervising Customer Service Representative 2 2 2 2Utility Billing Specialist 0 3 3 3
18 18 18 19HUMAN RESOURCES DIVISIONHuman Resources Manager 1 1 1 1Human Resources Technician 1 1 1 1Management Analyst 1 1 1 1
3 3 3 3INFORMATION SYSTEMS DIVISIONInformation Systems Manager 1 1 1 1Information Systems Specialist 1 1 1 1Network Administrator 1 1 1 1Network Technician 2 2 2 2Senior Programmer/Analyst 2 2 2 2
7 7 7 7Internal Services Total 31 31 31 32
Internal Services
94
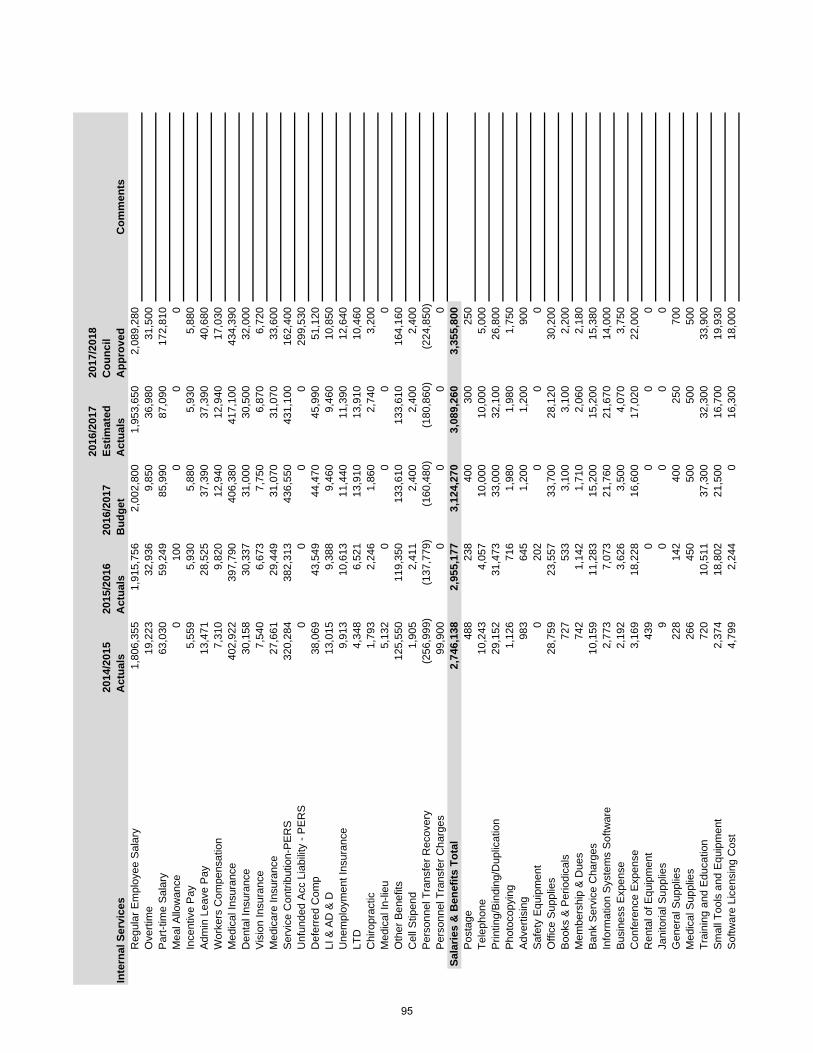
2014
/201
5 A
ctua
ls20
15/2
016
Act
uals
2016
/201
7 B
udge
t
2016
/201
7 Es
timat
ed
Act
uals
2017
/201
8 C
ounc
il A
ppro
ved
Com
men
tsR
egul
ar E
mpl
oyee
Sal
ary
1,80
6,35
51,
915,
756
2,00
2,80
01,
953,
650
2,08
9,28
0O
verti
me
19,2
2332
,936
9,85
036
,980
31,5
00P
art-t
ime
Sal
ary
63,0
3059
,249
85,9
9087
,090
172,
810
Mea
l Allo
wan
ce
010
00
00
Ince
ntiv
e P
ay
5,55
95,
930
5,88
05,
930
5,88
0A
dmin
Lea
ve P
ay
13,4
7128
,525
37,3
9037
,390
40,6
80W
orke
rs C
ompe
nsat
ion
7,31
09,
820
12,9
4012
,940
17,0
30M
edic
al In
sura
nce
402,
922
397,
790
406,
380
417,
100
434,
390
Den
tal I
nsur
ance
30
,158
30,3
3731
,000
30,5
0032
,000
Vis
ion
Insu
ranc
e 7,
540
6,67
37,
750
6,87
06,
720
Med
icar
e In
sura
nce
27,6
6129
,449
31,0
7031
,070
33,6
00S
ervi
ce C
ontri
butio
n-P
ER
S
320,
284
382,
313
436,
550
431,
100
162,
400
Unf
unde
d A
cc L
iabi
lity
- PE
RS
0
00
029
9,53
0D
efer
red
Com
p 38
,069
43,5
4944
,470
45,9
9051
,120
LI &
AD
& D
13
,015
9,38
89,
460
9,46
010
,850
Une
mpl
oym
ent I
nsur
ance
9,
913
10,6
1311
,440
11,3
9012
,640
LTD
4,
348
6,52
113
,910
13,9
1010
,460
Chi
ropr
actic
1,
793
2,24
61,
860
2,74
03,
200
Med
ical
In-li
eu
5,13
20
00
0O
ther
Ben
efits
12
5,55
011
9,35
013
3,61
013
3,61
016
4,16
0C
ell S
tipen
d 1,
905
2,41
12,
400
2,40
02,
400
Per
sonn
el T
rans
fer R
ecov
ery
(256
,999
)(1
37,7
79)
(160
,480
)(1
80,8
60)
(224
,850
)P
erso
nnel
Tra
nsfe
r Cha
rges
99
,900
00
00
Sala
ries
& B
enef
its T
otal
2,74
6,13
82,
955,
177
3,12
4,27
03,
089,
260
3,35
5,80
0P
osta
ge
488
238
400
300
250
Tele
phon
e 10
,243
4,05
710
,000
10,0
005,
000
Prin
ting/
Bin
ding
/Dup
licat
ion
29,1
5231
,473
33,0
0032
,100
26,8
00P
hoto
copy
ing
1,12
671
61,
980
1,98
01,
750
Adv
ertis
ing
983
645
1,20
01,
200
900
Saf
ety
Equ
ipm
ent
020
20
00
Offi
ce S
uppl
ies
28,7
5923
,557
33,7
0028
,120
30,2
00B
ooks
& P
erio
dica
ls
727
533
3,10
03,
100
2,20
0M
embe
rshi
p &
Due
s 74
21,
142
1,71
02,
060
2,18
0B
ank
Ser
vice
Cha
rges
10
,159
11,2
8315
,200
15,2
0015
,380
Info
rmat
ion
Sys
tem
s S
oftw
are
2,77
37,
073
21,7
6021
,670
14,0
00B
usin
ess
Exp
ense
2,
192
3,62
63,
500
4,07
03,
750
Con
fere
nce
Exp
ense
3,
169
18,2
2816
,600
17,0
2022
,000
Ren
tal o
f Equ
ipm
ent
439
00
00
Jani
toria
l Sup
plie
s 9
00
00
Gen
eral
Sup
plie
s 22
814
240
025
070
0M
edic
al S
uppl
ies
266
450
500
500
500
Trai
ning
and
Edu
catio
n 72
010
,511
37,3
0032
,300
33,9
00S
mal
l Too
ls a
nd E
quip
men
t 2,
374
18,8
0221
,500
16,7
0019
,930
Sof
twar
e Li
cens
ing
Cos
t 4,
799
2,24
40
16,3
0018
,000
Inte
rnal
Ser
vice
s
95
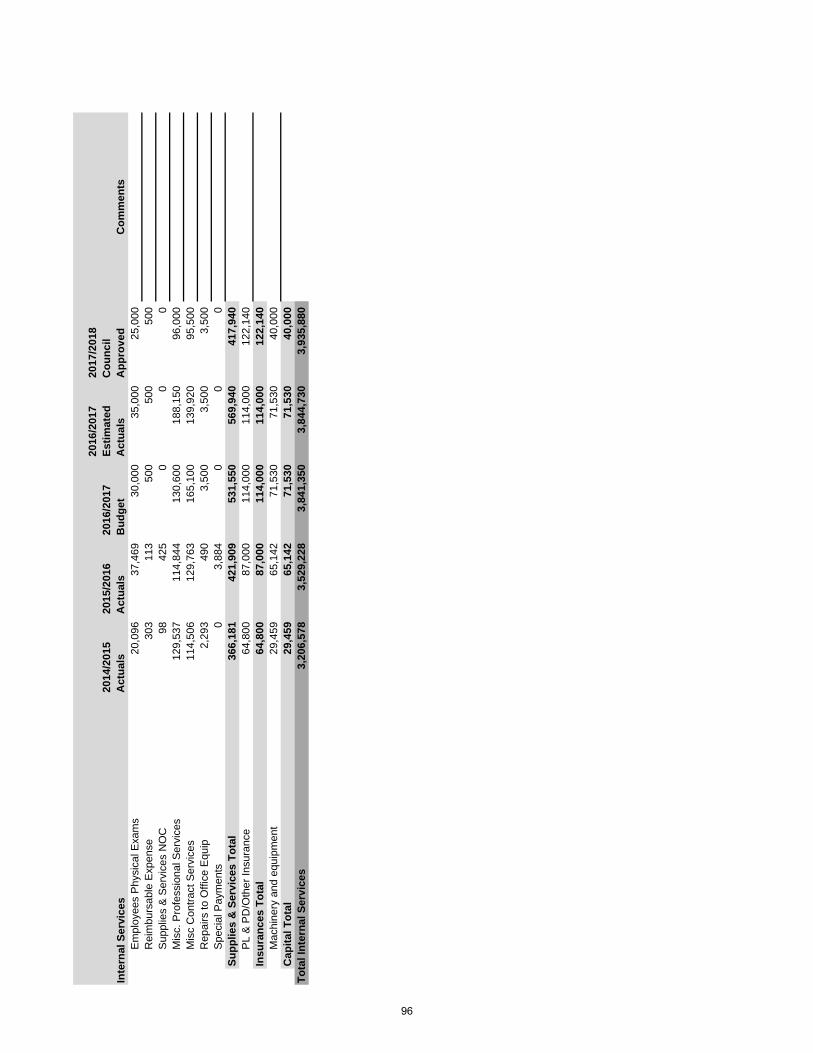
2014
/201
5 A
ctua
ls20
15/2
016
Act
uals
2016
/201
7 B
udge
t
2016
/201
7 Es
timat
ed
Act
uals
2017
/201
8 C
ounc
il A
ppro
ved
Com
men
tsIn
tern
al S
ervi
ces
Em
ploy
ees
Phy
sica
l Exa
ms
20,0
9637
,469
30,0
0035
,000
25,0
00R
eim
burs
able
Exp
ense
30
311
350
050
050
0S
uppl
ies
& S
ervi
ces
NO
C
9842
50
00
Mis
c. P
rofe
ssio
nal S
ervi
ces
129,
537
114,
844
130,
600
188,
150
96,0
00M
isc
Con
tract
Ser
vice
s 11
4,50
612
9,76
316
5,10
013
9,92
095
,500
Rep
airs
to O
ffice
Equ
ip
2,29
349
03,
500
3,50
03,
500
Spe
cial
Pay
men
ts
03,
884
00
0Su
pplie
s &
Ser
vice
s To
tal
366,
181
421,
909
531,
550
569,
940
417,
940
PL
& P
D/O
ther
Insu
ranc
e 64
,800
87,0
0011
4,00
011
4,00
012
2,14
0In
sura
nces
Tot
al64
,800
87,0
0011
4,00
011
4,00
012
2,14
0M
achi
nery
and
equ
ipm
ent
29,4
5965
,142
71,5
3071
,530
40,0
00C
apita
l Tot
al29
,459
65,1
4271
,530
71,5
3040
,000
Tota
l Int
erna
l Ser
vice
s3,
206,
578
3,52
9,22
83,
841,
350
3,84
4,73
03,
935,
880
96
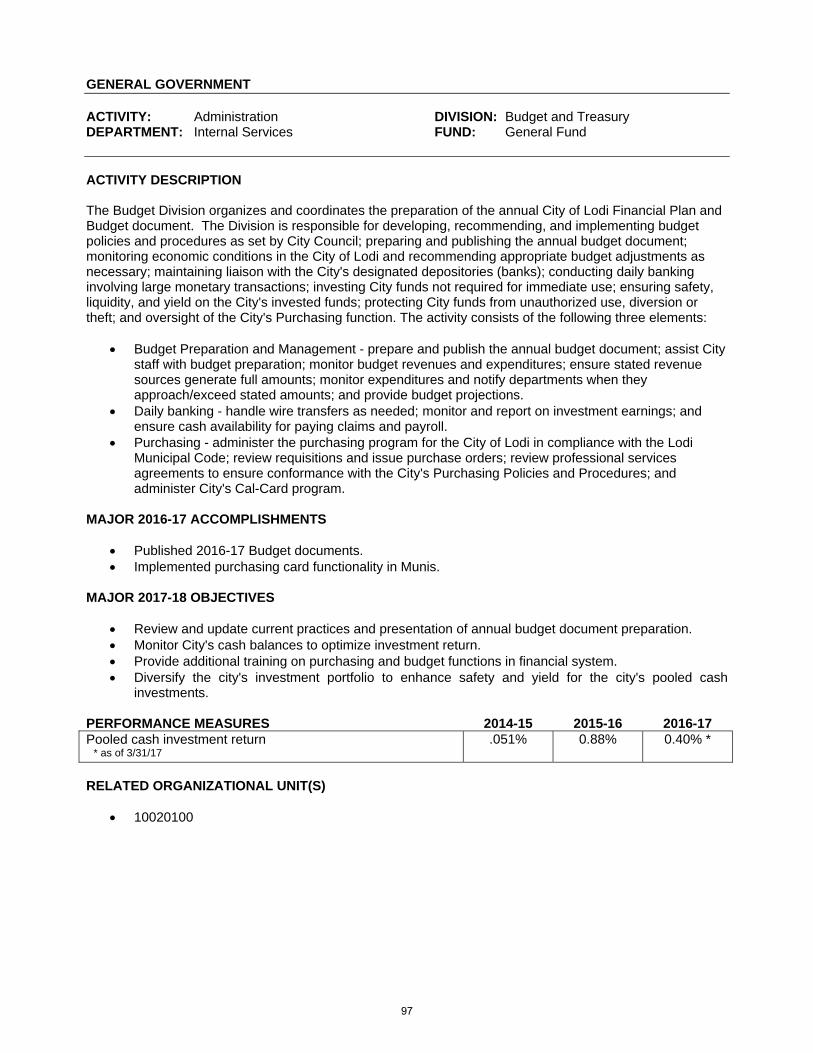
GENERAL GOVERNMENT ACTIVITY: Administration DIVISION: Budget and Treasury DEPARTMENT: Internal Services FUND: General Fund ACTIVITY DESCRIPTION The Budget Division organizes and coordinates the preparation of the annual City of Lodi Financial Plan and Budget document. The Division is responsible for developing, recommending, and implementing budget policies and procedures as set by City Council; preparing and publishing the annual budget document; monitoring economic conditions in the City of Lodi and recommending appropriate budget adjustments as necessary; maintaining liaison with the City's designated depositories (banks); conducting daily banking involving large monetary transactions; investing City funds not required for immediate use; ensuring safety, liquidity, and yield on the City's invested funds; protecting City funds from unauthorized use, diversion or theft; and oversight of the City's Purchasing function. The activity consists of the following three elements:
Budget Preparation and Management - prepare and publish the annual budget document; assist City staff with budget preparation; monitor budget revenues and expenditures; ensure stated revenue sources generate full amounts; monitor expenditures and notify departments when they approach/exceed stated amounts; and provide budget projections.
Daily banking - handle wire transfers as needed; monitor and report on investment earnings; and ensure cash availability for paying claims and payroll.
Purchasing - administer the purchasing program for the City of Lodi in compliance with the Lodi Municipal Code; review requisitions and issue purchase orders; review professional services agreements to ensure conformance with the City's Purchasing Policies and Procedures; and administer City's Cal-Card program.
MAJOR 2016-17 ACCOMPLISHMENTS
Published 2016-17 Budget documents. Implemented purchasing card functionality in Munis.
MAJOR 2017-18 OBJECTIVES
Review and update current practices and presentation of annual budget document preparation. Monitor City's cash balances to optimize investment return. Provide additional training on purchasing and budget functions in financial system. Diversify the city's investment portfolio to enhance safety and yield for the city's pooled cash
investments. PERFORMANCE MEASURES 2014-15 2015-16 2016-17 Pooled cash investment return * as of 3/31/17
.051% 0.88% 0.40% *
RELATED ORGANIZATIONAL UNIT(S)
10020100
97
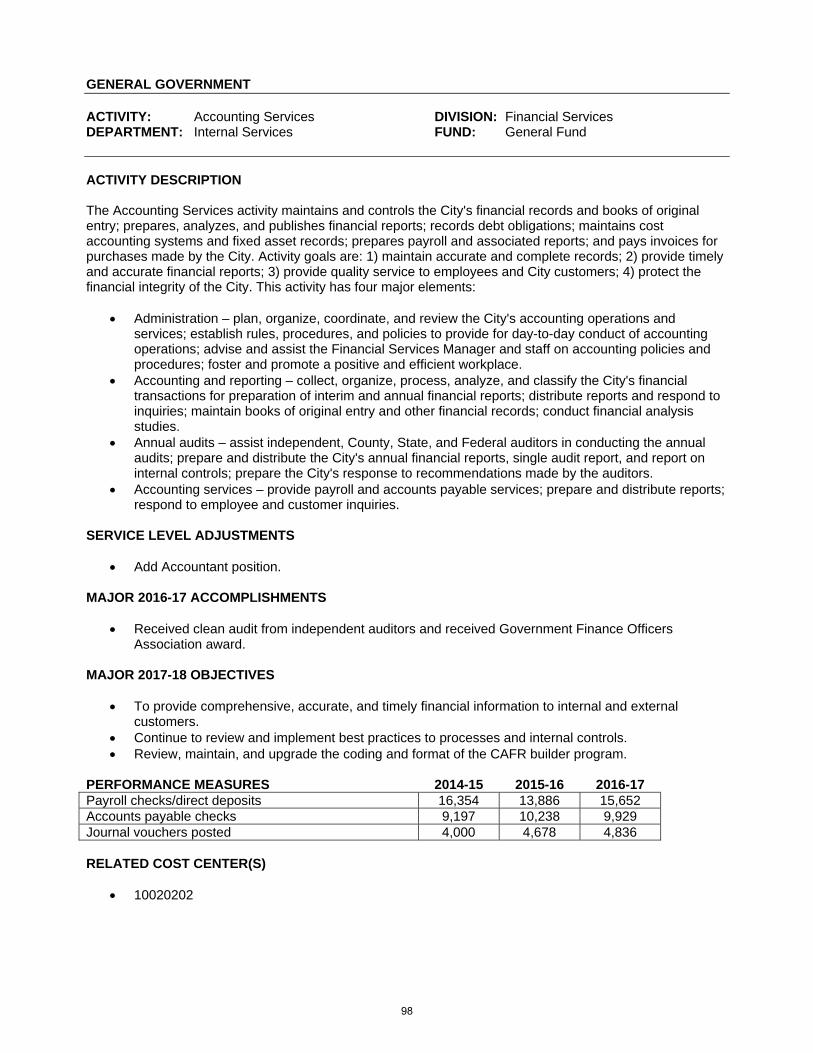
GENERAL GOVERNMENT ACTIVITY: Accounting Services DIVISION: Financial Services DEPARTMENT: Internal Services FUND: General Fund ACTIVITY DESCRIPTION The Accounting Services activity maintains and controls the City's financial records and books of original entry; prepares, analyzes, and publishes financial reports; records debt obligations; maintains cost accounting systems and fixed asset records; prepares payroll and associated reports; and pays invoices for purchases made by the City. Activity goals are: 1) maintain accurate and complete records; 2) provide timely and accurate financial reports; 3) provide quality service to employees and City customers; 4) protect the financial integrity of the City. This activity has four major elements:
Administration – plan, organize, coordinate, and review the City's accounting operations and services; establish rules, procedures, and policies to provide for day-to-day conduct of accounting operations; advise and assist the Financial Services Manager and staff on accounting policies and procedures; foster and promote a positive and efficient workplace.
Accounting and reporting – collect, organize, process, analyze, and classify the City's financial transactions for preparation of interim and annual financial reports; distribute reports and respond to inquiries; maintain books of original entry and other financial records; conduct financial analysis studies.
Annual audits – assist independent, County, State, and Federal auditors in conducting the annual audits; prepare and distribute the City's annual financial reports, single audit report, and report on internal controls; prepare the City's response to recommendations made by the auditors.
Accounting services – provide payroll and accounts payable services; prepare and distribute reports; respond to employee and customer inquiries.
SERVICE LEVEL ADJUSTMENTS
Add Accountant position. MAJOR 2016-17 ACCOMPLISHMENTS
Received clean audit from independent auditors and received Government Finance Officers Association award.
MAJOR 2017-18 OBJECTIVES
To provide comprehensive, accurate, and timely financial information to internal and external customers.
Continue to review and implement best practices to processes and internal controls. Review, maintain, and upgrade the coding and format of the CAFR builder program.
PERFORMANCE MEASURES 2014-15 2015-16 2016-17 Payroll checks/direct deposits 16,354 13,886 15,652 Accounts payable checks 9,197 10,238 9,929 Journal vouchers posted 4,000 4,678 4,836 RELATED COST CENTER(S)
10020202
98
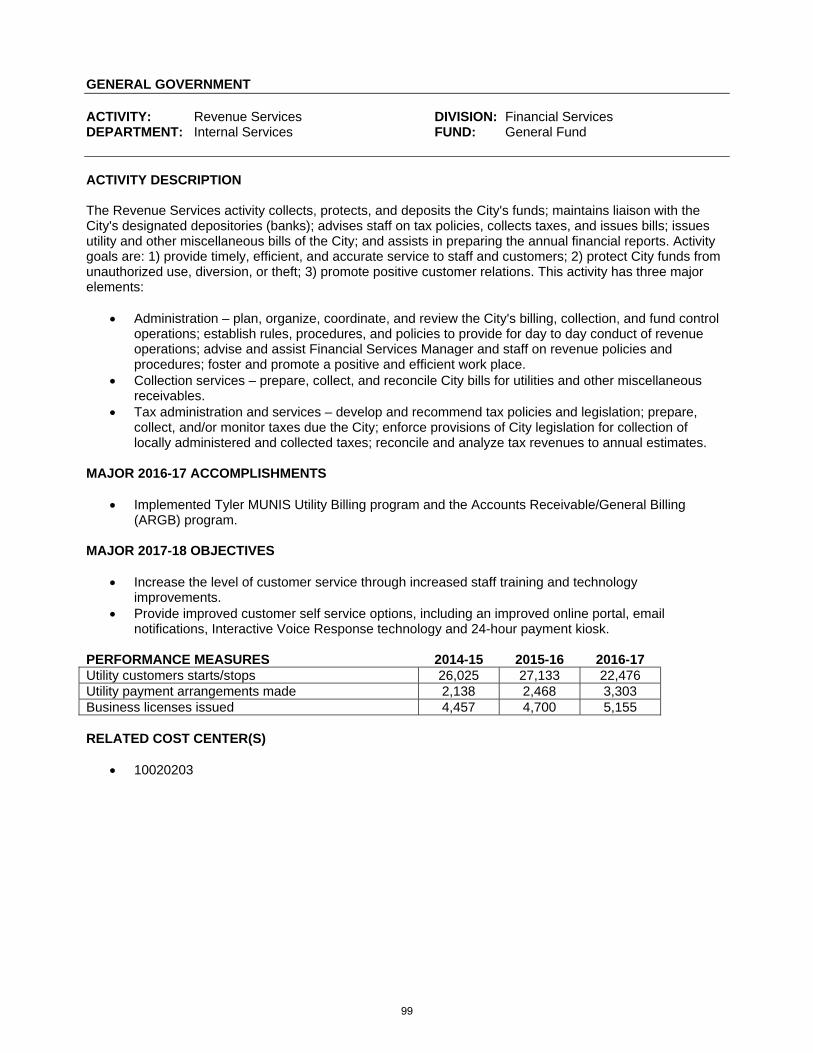
GENERAL GOVERNMENT ACTIVITY: Revenue Services DIVISION: Financial Services DEPARTMENT: Internal Services FUND: General Fund ACTIVITY DESCRIPTION The Revenue Services activity collects, protects, and deposits the City's funds; maintains liaison with the City's designated depositories (banks); advises staff on tax policies, collects taxes, and issues bills; issues utility and other miscellaneous bills of the City; and assists in preparing the annual financial reports. Activity goals are: 1) provide timely, efficient, and accurate service to staff and customers; 2) protect City funds from unauthorized use, diversion, or theft; 3) promote positive customer relations. This activity has three major elements:
Administration – plan, organize, coordinate, and review the City's billing, collection, and fund control operations; establish rules, procedures, and policies to provide for day to day conduct of revenue operations; advise and assist Financial Services Manager and staff on revenue policies and procedures; foster and promote a positive and efficient work place.
Collection services – prepare, collect, and reconcile City bills for utilities and other miscellaneous receivables.
Tax administration and services – develop and recommend tax policies and legislation; prepare, collect, and/or monitor taxes due the City; enforce provisions of City legislation for collection of locally administered and collected taxes; reconcile and analyze tax revenues to annual estimates.
MAJOR 2016-17 ACCOMPLISHMENTS
Implemented Tyler MUNIS Utility Billing program and the Accounts Receivable/General Billing (ARGB) program.
MAJOR 2017-18 OBJECTIVES
Increase the level of customer service through increased staff training and technology improvements.
Provide improved customer self service options, including an improved online portal, email notifications, Interactive Voice Response technology and 24-hour payment kiosk.
PERFORMANCE MEASURES 2014-15 2015-16 2016-17 Utility customers starts/stops 26,025 27,133 22,476 Utility payment arrangements made 2,138 2,468 3,303 Business licenses issued 4,457 4,700 5,155 RELATED COST CENTER(S)
10020203
99
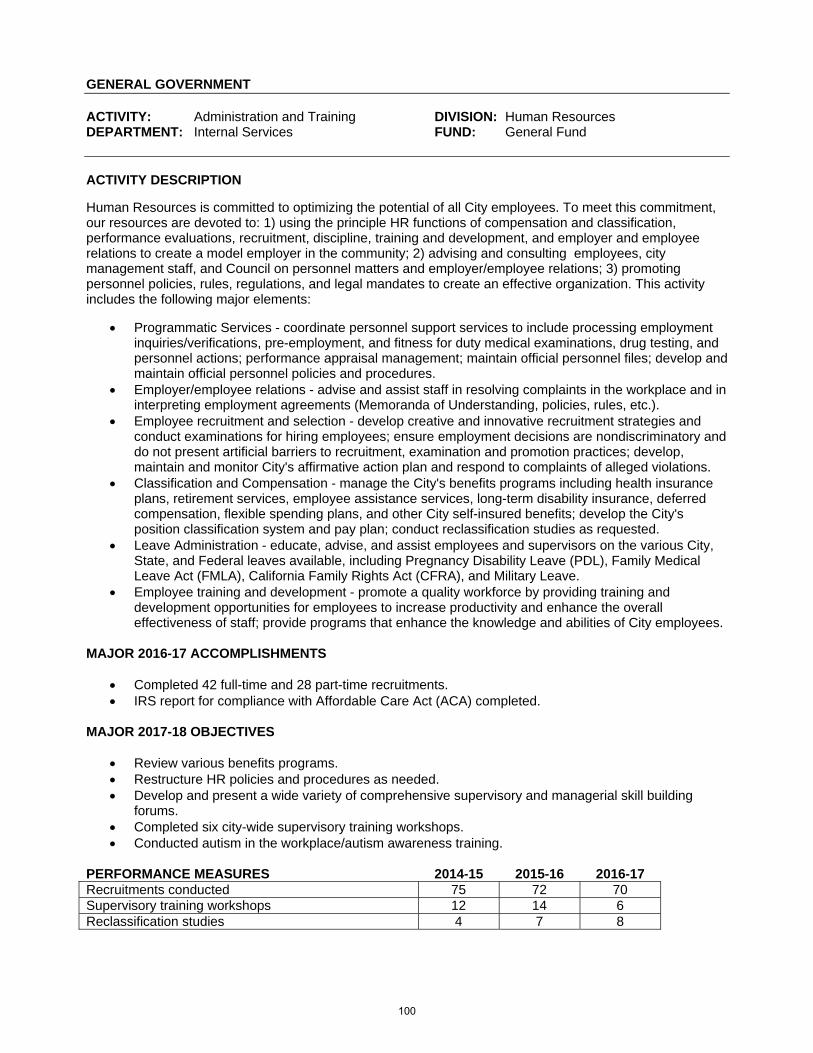
GENERAL GOVERNMENT ACTIVITY: Administration and Training DIVISION: Human Resources DEPARTMENT: Internal Services FUND: General Fund ACTIVITY DESCRIPTION Human Resources is committed to optimizing the potential of all City employees. To meet this commitment, our resources are devoted to: 1) using the principle HR functions of compensation and classification, performance evaluations, recruitment, discipline, training and development, and employer and employee relations to create a model employer in the community; 2) advising and consulting employees, city management staff, and Council on personnel matters and employer/employee relations; 3) promoting personnel policies, rules, regulations, and legal mandates to create an effective organization. This activity includes the following major elements:
Programmatic Services - coordinate personnel support services to include processing employment inquiries/verifications, pre-employment, and fitness for duty medical examinations, drug testing, and personnel actions; performance appraisal management; maintain official personnel files; develop and maintain official personnel policies and procedures.
Employer/employee relations - advise and assist staff in resolving complaints in the workplace and in interpreting employment agreements (Memoranda of Understanding, policies, rules, etc.).
Employee recruitment and selection - develop creative and innovative recruitment strategies and conduct examinations for hiring employees; ensure employment decisions are nondiscriminatory and do not present artificial barriers to recruitment, examination and promotion practices; develop, maintain and monitor City's affirmative action plan and respond to complaints of alleged violations.
Classification and Compensation - manage the City's benefits programs including health insurance plans, retirement services, employee assistance services, long-term disability insurance, deferred compensation, flexible spending plans, and other City self-insured benefits; develop the City's position classification system and pay plan; conduct reclassification studies as requested.
Leave Administration - educate, advise, and assist employees and supervisors on the various City, State, and Federal leaves available, including Pregnancy Disability Leave (PDL), Family Medical Leave Act (FMLA), California Family Rights Act (CFRA), and Military Leave.
Employee training and development - promote a quality workforce by providing training and development opportunities for employees to increase productivity and enhance the overall effectiveness of staff; provide programs that enhance the knowledge and abilities of City employees.
MAJOR 2016-17 ACCOMPLISHMENTS
Completed 42 full-time and 28 part-time recruitments. IRS report for compliance with Affordable Care Act (ACA) completed.
MAJOR 2017-18 OBJECTIVES
Review various benefits programs. Restructure HR policies and procedures as needed. Develop and present a wide variety of comprehensive supervisory and managerial skill building
forums. Completed six city-wide supervisory training workshops. Conducted autism in the workplace/autism awareness training.
PERFORMANCE MEASURES 2014-15 2015-16 2016-17 Recruitments conducted 75 72 70 Supervisory training workshops 12 14 6 Reclassification studies 4 7 8
100
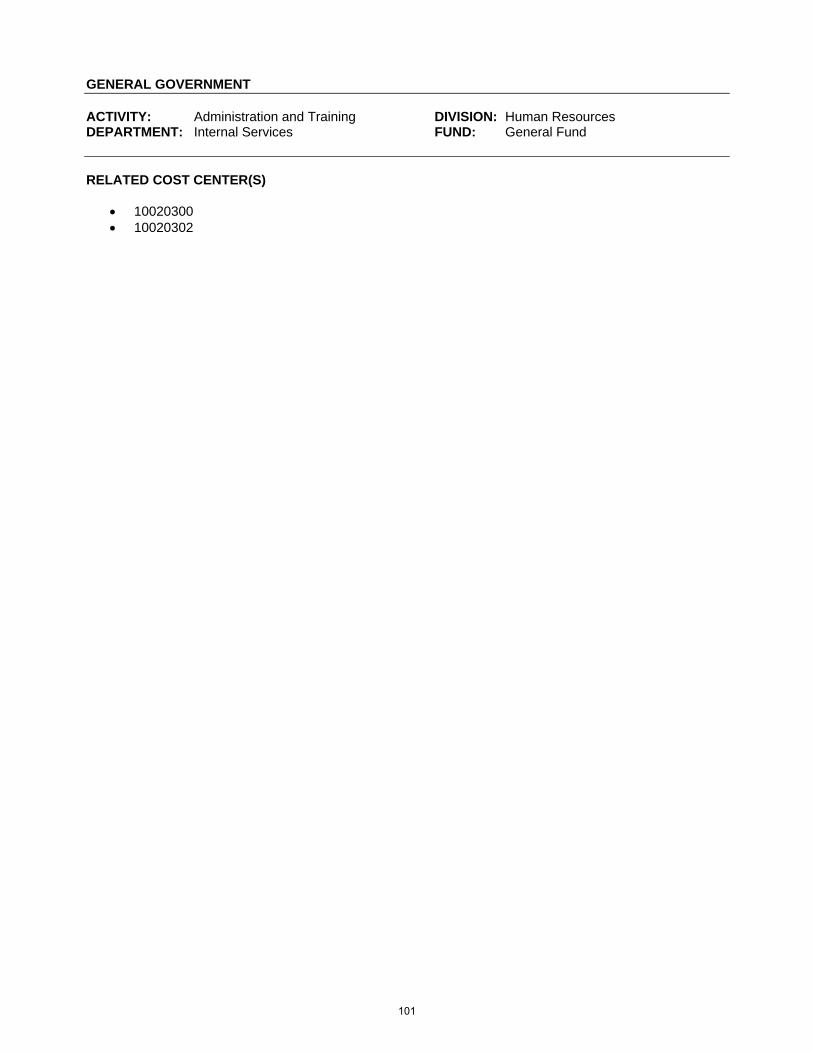
GENERAL GOVERNMENT ACTIVITY: Administration and Training DIVISION: Human Resources DEPARTMENT: Internal Services FUND: General Fund RELATED COST CENTER(S)
10020300 10020302
101
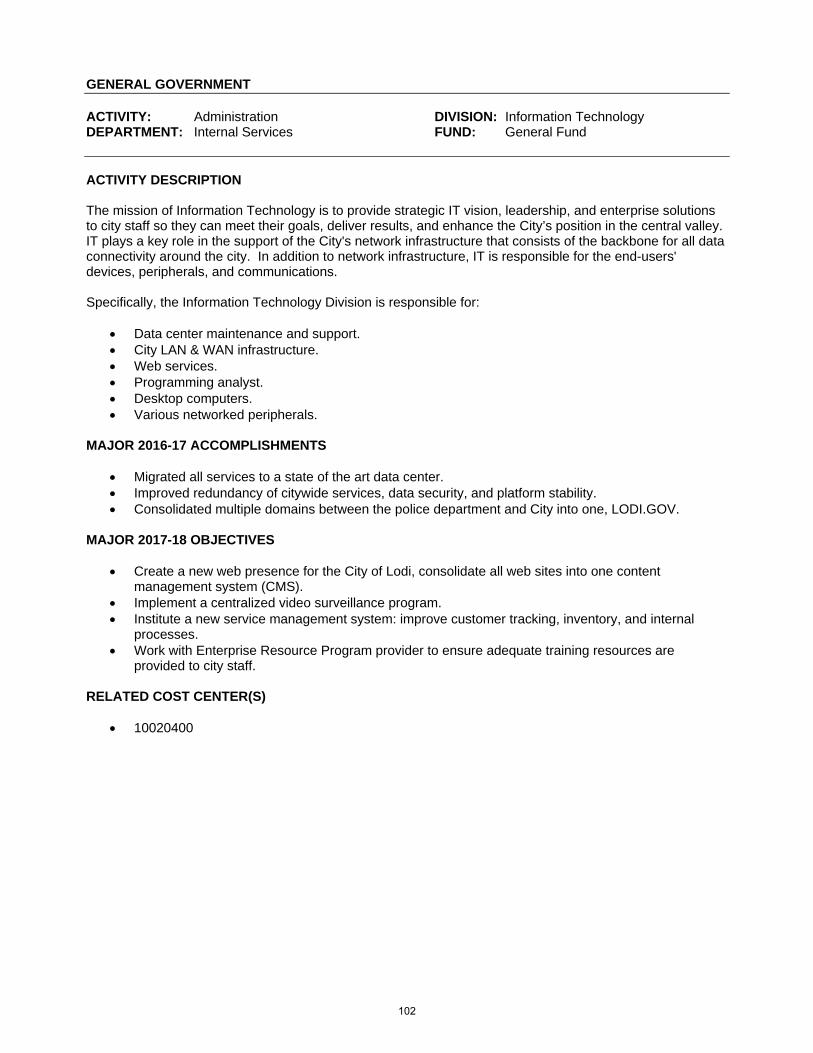
GENERAL GOVERNMENT ACTIVITY: Administration DIVISION: Information Technology DEPARTMENT: Internal Services FUND: General Fund ACTIVITY DESCRIPTION The mission of Information Technology is to provide strategic IT vision, leadership, and enterprise solutions to city staff so they can meet their goals, deliver results, and enhance the City’s position in the central valley. IT plays a key role in the support of the City's network infrastructure that consists of the backbone for all data connectivity around the city. In addition to network infrastructure, IT is responsible for the end-users' devices, peripherals, and communications. Specifically, the Information Technology Division is responsible for:
Data center maintenance and support. City LAN & WAN infrastructure. Web services. Programming analyst. Desktop computers. Various networked peripherals.
MAJOR 2016-17 ACCOMPLISHMENTS
Migrated all services to a state of the art data center. Improved redundancy of citywide services, data security, and platform stability. Consolidated multiple domains between the police department and City into one, LODI.GOV.
MAJOR 2017-18 OBJECTIVES
Create a new web presence for the City of Lodi, consolidate all web sites into one content management system (CMS).
Implement a centralized video surveillance program. Institute a new service management system: improve customer tracking, inventory, and internal
processes. Work with Enterprise Resource Program provider to ensure adequate training resources are
provided to city staff. RELATED COST CENTER(S)
10020400
102
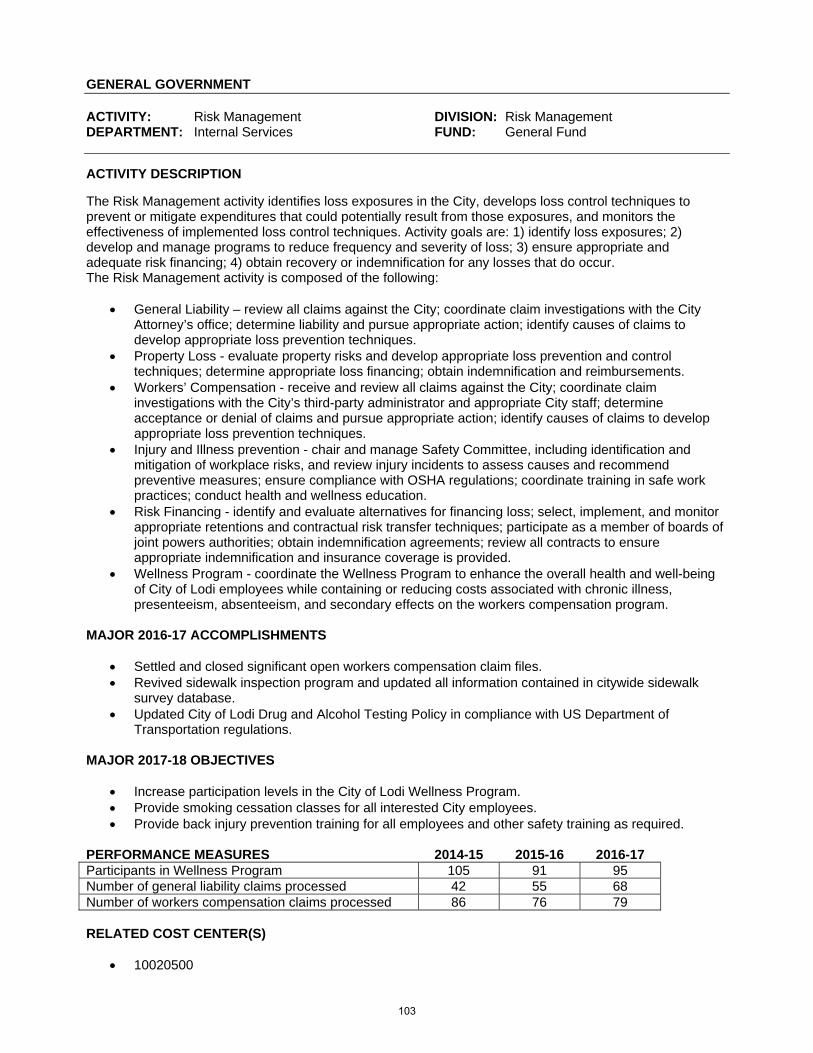
GENERAL GOVERNMENT ACTIVITY: Risk Management DIVISION: Risk Management DEPARTMENT: Internal Services FUND: General Fund ACTIVITY DESCRIPTION The Risk Management activity identifies loss exposures in the City, develops loss control techniques to prevent or mitigate expenditures that could potentially result from those exposures, and monitors the effectiveness of implemented loss control techniques. Activity goals are: 1) identify loss exposures; 2) develop and manage programs to reduce frequency and severity of loss; 3) ensure appropriate and adequate risk financing; 4) obtain recovery or indemnification for any losses that do occur. The Risk Management activity is composed of the following:
General Liability – review all claims against the City; coordinate claim investigations with the City Attorney’s office; determine liability and pursue appropriate action; identify causes of claims to develop appropriate loss prevention techniques.
Property Loss - evaluate property risks and develop appropriate loss prevention and control techniques; determine appropriate loss financing; obtain indemnification and reimbursements.
Workers’ Compensation - receive and review all claims against the City; coordinate claim investigations with the City’s third-party administrator and appropriate City staff; determine acceptance or denial of claims and pursue appropriate action; identify causes of claims to develop appropriate loss prevention techniques.
Injury and Illness prevention - chair and manage Safety Committee, including identification and mitigation of workplace risks, and review injury incidents to assess causes and recommend preventive measures; ensure compliance with OSHA regulations; coordinate training in safe work practices; conduct health and wellness education.
Risk Financing - identify and evaluate alternatives for financing loss; select, implement, and monitor appropriate retentions and contractual risk transfer techniques; participate as a member of boards of joint powers authorities; obtain indemnification agreements; review all contracts to ensure appropriate indemnification and insurance coverage is provided.
Wellness Program - coordinate the Wellness Program to enhance the overall health and well-being of City of Lodi employees while containing or reducing costs associated with chronic illness, presenteeism, absenteeism, and secondary effects on the workers compensation program.
MAJOR 2016-17 ACCOMPLISHMENTS
Settled and closed significant open workers compensation claim files. Revived sidewalk inspection program and updated all information contained in citywide sidewalk
survey database. Updated City of Lodi Drug and Alcohol Testing Policy in compliance with US Department of
Transportation regulations. MAJOR 2017-18 OBJECTIVES
Increase participation levels in the City of Lodi Wellness Program. Provide smoking cessation classes for all interested City employees. Provide back injury prevention training for all employees and other safety training as required.
PERFORMANCE MEASURES 2014-15 2015-16 2016-17 Participants in Wellness Program 105 91 95 Number of general liability claims processed 42 55 68 Number of workers compensation claims processed 86 76 79 RELATED COST CENTER(S)
10020500
103

(This page intentionally left blank)
104
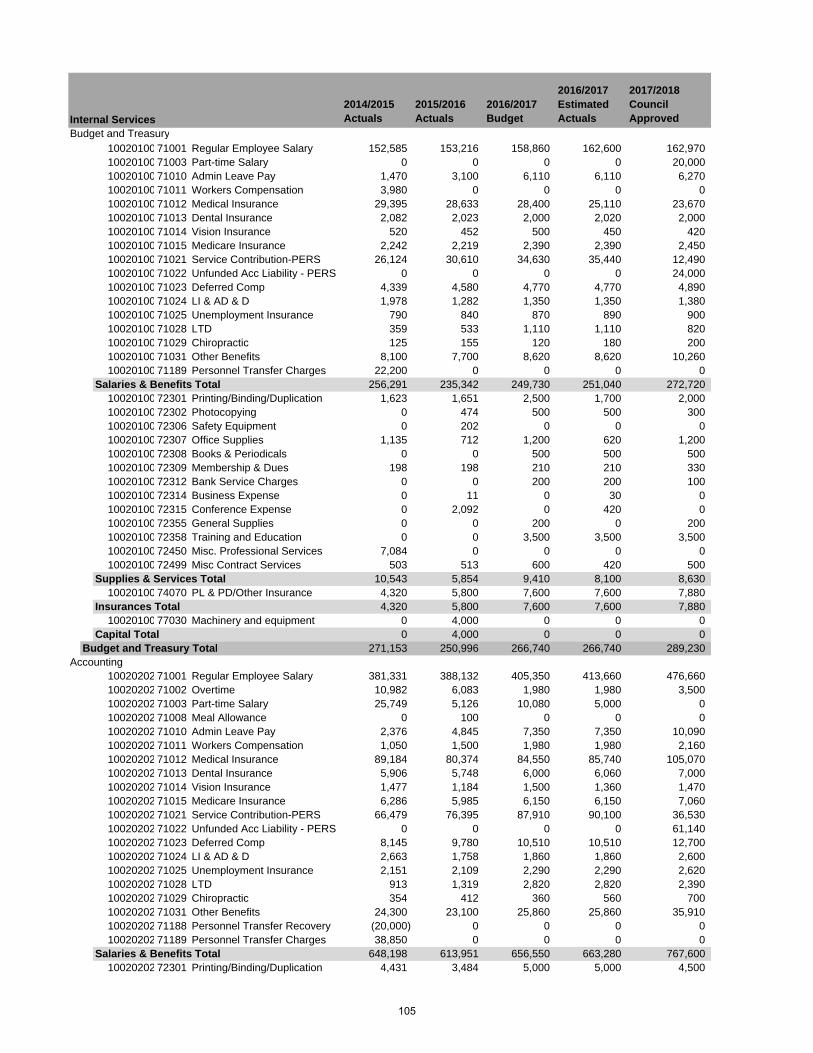
2014/2015 Actuals
2015/2016 Actuals
2016/2017 Budget
2016/2017 Estimated Actuals
2017/2018 Council Approved
Budget and Treasury10020100 71001 Regular Employee Salary 152,585 153,216 158,860 162,600 162,97010020100 71003 Part-time Salary 0 0 0 0 20,00010020100 71010 Admin Leave Pay 1,470 3,100 6,110 6,110 6,27010020100 71011 Workers Compensation 3,980 0 0 0 010020100 71012 Medical Insurance 29,395 28,633 28,400 25,110 23,67010020100 71013 Dental Insurance 2,082 2,023 2,000 2,020 2,00010020100 71014 Vision Insurance 520 452 500 450 42010020100 71015 Medicare Insurance 2,242 2,219 2,390 2,390 2,45010020100 71021 Service Contribution-PERS 26,124 30,610 34,630 35,440 12,49010020100 71022 Unfunded Acc Liability - PERS 0 0 0 0 24,00010020100 71023 Deferred Comp 4,339 4,580 4,770 4,770 4,89010020100 71024 LI & AD & D 1,978 1,282 1,350 1,350 1,38010020100 71025 Unemployment Insurance 790 840 870 890 90010020100 71028 LTD 359 533 1,110 1,110 82010020100 71029 Chiropractic 125 155 120 180 20010020100 71031 Other Benefits 8,100 7,700 8,620 8,620 10,26010020100 71189 Personnel Transfer Charges 22,200 0 0 0 0
Salaries & Benefits Total 256,291 235,342 249,730 251,040 272,72010020100 72301 Printing/Binding/Duplication 1,623 1,651 2,500 1,700 2,00010020100 72302 Photocopying 0 474 500 500 30010020100 72306 Safety Equipment 0 202 0 0 010020100 72307 Office Supplies 1,135 712 1,200 620 1,20010020100 72308 Books & Periodicals 0 0 500 500 50010020100 72309 Membership & Dues 198 198 210 210 33010020100 72312 Bank Service Charges 0 0 200 200 10010020100 72314 Business Expense 0 11 0 30 010020100 72315 Conference Expense 0 2,092 0 420 010020100 72355 General Supplies 0 0 200 0 20010020100 72358 Training and Education 0 0 3,500 3,500 3,50010020100 72450 Misc. Professional Services 7,084 0 0 0 010020100 72499 Misc Contract Services 503 513 600 420 500
Supplies & Services Total 10,543 5,854 9,410 8,100 8,63010020100 74070 PL & PD/Other Insurance 4,320 5,800 7,600 7,600 7,880
Insurances Total 4,320 5,800 7,600 7,600 7,88010020100 77030 Machinery and equipment 0 4,000 0 0 0
Capital Total 0 4,000 0 0 0Budget and Treasury Total 271,153 250,996 266,740 266,740 289,230
Accounting10020202 71001 Regular Employee Salary 381,331 388,132 405,350 413,660 476,66010020202 71002 Overtime 10,982 6,083 1,980 1,980 3,50010020202 71003 Part-time Salary 25,749 5,126 10,080 5,000 010020202 71008 Meal Allowance 0 100 0 0 010020202 71010 Admin Leave Pay 2,376 4,845 7,350 7,350 10,09010020202 71011 Workers Compensation 1,050 1,500 1,980 1,980 2,16010020202 71012 Medical Insurance 89,184 80,374 84,550 85,740 105,07010020202 71013 Dental Insurance 5,906 5,748 6,000 6,060 7,00010020202 71014 Vision Insurance 1,477 1,184 1,500 1,360 1,47010020202 71015 Medicare Insurance 6,286 5,985 6,150 6,150 7,06010020202 71021 Service Contribution-PERS 66,479 76,395 87,910 90,100 36,53010020202 71022 Unfunded Acc Liability - PERS 0 0 0 0 61,14010020202 71023 Deferred Comp 8,145 9,780 10,510 10,510 12,70010020202 71024 LI & AD & D 2,663 1,758 1,860 1,860 2,60010020202 71025 Unemployment Insurance 2,151 2,109 2,290 2,290 2,62010020202 71028 LTD 913 1,319 2,820 2,820 2,39010020202 71029 Chiropractic 354 412 360 560 70010020202 71031 Other Benefits 24,300 23,100 25,860 25,860 35,91010020202 71188 Personnel Transfer Recovery (20,000) 0 0 0 010020202 71189 Personnel Transfer Charges 38,850 0 0 0 0
Salaries & Benefits Total 648,198 613,951 656,550 663,280 767,60010020202 72301 Printing/Binding/Duplication 4,431 3,484 5,000 5,000 4,500
Internal Services
105
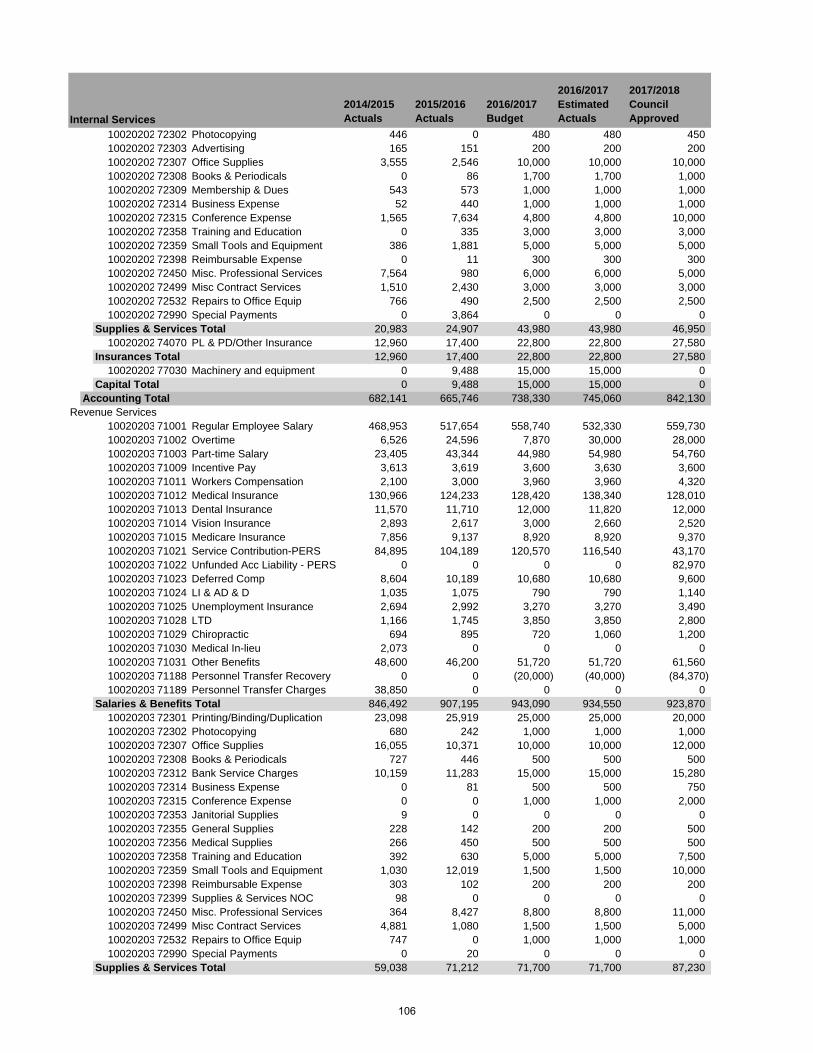
2014/2015 Actuals
2015/2016 Actuals
2016/2017 Budget
2016/2017 Estimated Actuals
2017/2018 Council ApprovedInternal Services
10020202 72302 Photocopying 446 0 480 480 45010020202 72303 Advertising 165 151 200 200 20010020202 72307 Office Supplies 3,555 2,546 10,000 10,000 10,00010020202 72308 Books & Periodicals 0 86 1,700 1,700 1,00010020202 72309 Membership & Dues 543 573 1,000 1,000 1,00010020202 72314 Business Expense 52 440 1,000 1,000 1,00010020202 72315 Conference Expense 1,565 7,634 4,800 4,800 10,00010020202 72358 Training and Education 0 335 3,000 3,000 3,00010020202 72359 Small Tools and Equipment 386 1,881 5,000 5,000 5,00010020202 72398 Reimbursable Expense 0 11 300 300 30010020202 72450 Misc. Professional Services 7,564 980 6,000 6,000 5,00010020202 72499 Misc Contract Services 1,510 2,430 3,000 3,000 3,00010020202 72532 Repairs to Office Equip 766 490 2,500 2,500 2,50010020202 72990 Special Payments 0 3,864 0 0 0
Supplies & Services Total 20,983 24,907 43,980 43,980 46,95010020202 74070 PL & PD/Other Insurance 12,960 17,400 22,800 22,800 27,580
Insurances Total 12,960 17,400 22,800 22,800 27,58010020202 77030 Machinery and equipment 0 9,488 15,000 15,000 0
Capital Total 0 9,488 15,000 15,000 0Accounting Total 682,141 665,746 738,330 745,060 842,130
Revenue Services10020203 71001 Regular Employee Salary 468,953 517,654 558,740 532,330 559,73010020203 71002 Overtime 6,526 24,596 7,870 30,000 28,00010020203 71003 Part-time Salary 23,405 43,344 44,980 54,980 54,76010020203 71009 Incentive Pay 3,613 3,619 3,600 3,630 3,60010020203 71011 Workers Compensation 2,100 3,000 3,960 3,960 4,32010020203 71012 Medical Insurance 130,966 124,233 128,420 138,340 128,01010020203 71013 Dental Insurance 11,570 11,710 12,000 11,820 12,00010020203 71014 Vision Insurance 2,893 2,617 3,000 2,660 2,52010020203 71015 Medicare Insurance 7,856 9,137 8,920 8,920 9,37010020203 71021 Service Contribution-PERS 84,895 104,189 120,570 116,540 43,17010020203 71022 Unfunded Acc Liability - PERS 0 0 0 0 82,97010020203 71023 Deferred Comp 8,604 10,189 10,680 10,680 9,60010020203 71024 LI & AD & D 1,035 1,075 790 790 1,14010020203 71025 Unemployment Insurance 2,694 2,992 3,270 3,270 3,49010020203 71028 LTD 1,166 1,745 3,850 3,850 2,80010020203 71029 Chiropractic 694 895 720 1,060 1,20010020203 71030 Medical In-lieu 2,073 0 0 0 010020203 71031 Other Benefits 48,600 46,200 51,720 51,720 61,56010020203 71188 Personnel Transfer Recovery 0 0 (20,000) (40,000) (84,370)10020203 71189 Personnel Transfer Charges 38,850 0 0 0 0
Salaries & Benefits Total 846,492 907,195 943,090 934,550 923,87010020203 72301 Printing/Binding/Duplication 23,098 25,919 25,000 25,000 20,00010020203 72302 Photocopying 680 242 1,000 1,000 1,00010020203 72307 Office Supplies 16,055 10,371 10,000 10,000 12,00010020203 72308 Books & Periodicals 727 446 500 500 50010020203 72312 Bank Service Charges 10,159 11,283 15,000 15,000 15,28010020203 72314 Business Expense 0 81 500 500 75010020203 72315 Conference Expense 0 0 1,000 1,000 2,00010020203 72353 Janitorial Supplies 9 0 0 0 010020203 72355 General Supplies 228 142 200 200 50010020203 72356 Medical Supplies 266 450 500 500 50010020203 72358 Training and Education 392 630 5,000 5,000 7,50010020203 72359 Small Tools and Equipment 1,030 12,019 1,500 1,500 10,00010020203 72398 Reimbursable Expense 303 102 200 200 20010020203 72399 Supplies & Services NOC 98 0 0 0 010020203 72450 Misc. Professional Services 364 8,427 8,800 8,800 11,00010020203 72499 Misc Contract Services 4,881 1,080 1,500 1,500 5,00010020203 72532 Repairs to Office Equip 747 0 1,000 1,000 1,00010020203 72990 Special Payments 0 20 0 0 0
Supplies & Services Total 59,038 71,212 71,700 71,700 87,230
106
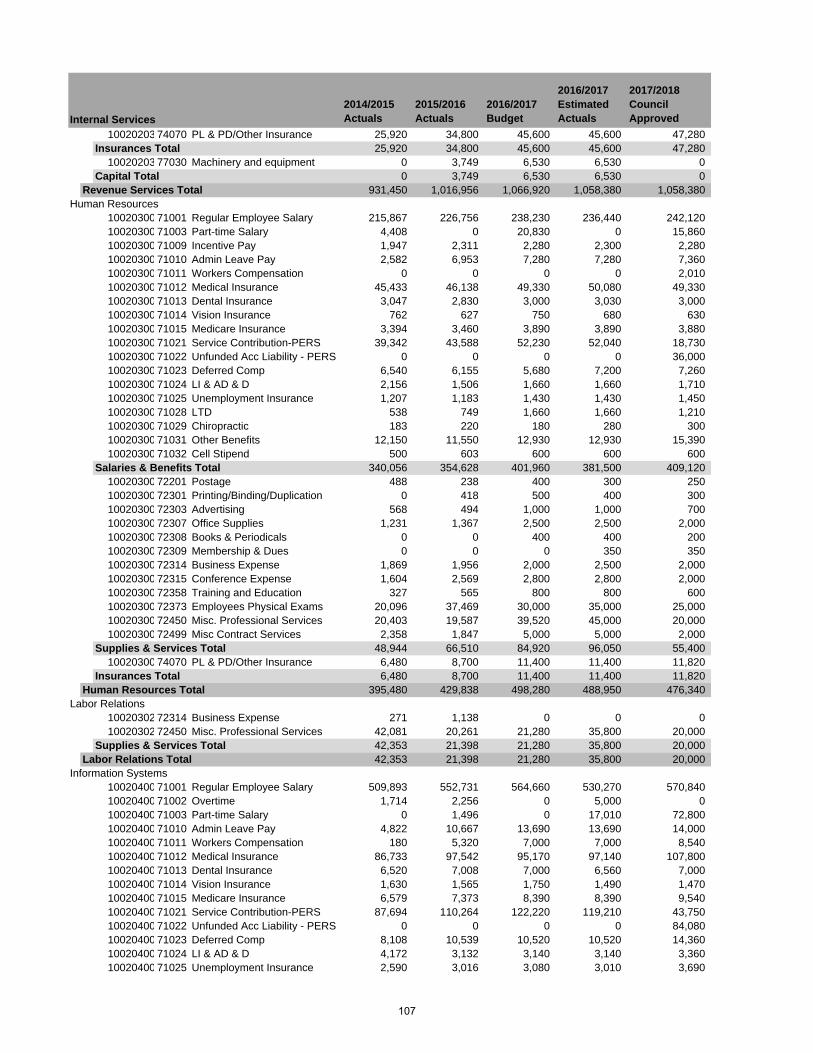
2014/2015 Actuals
2015/2016 Actuals
2016/2017 Budget
2016/2017 Estimated Actuals
2017/2018 Council ApprovedInternal Services
10020203 74070 PL & PD/Other Insurance 25,920 34,800 45,600 45,600 47,280Insurances Total 25,920 34,800 45,600 45,600 47,280
10020203 77030 Machinery and equipment 0 3,749 6,530 6,530 0Capital Total 0 3,749 6,530 6,530 0
Revenue Services Total 931,450 1,016,956 1,066,920 1,058,380 1,058,380Human Resources
10020300 71001 Regular Employee Salary 215,867 226,756 238,230 236,440 242,12010020300 71003 Part-time Salary 4,408 0 20,830 0 15,86010020300 71009 Incentive Pay 1,947 2,311 2,280 2,300 2,28010020300 71010 Admin Leave Pay 2,582 6,953 7,280 7,280 7,36010020300 71011 Workers Compensation 0 0 0 0 2,01010020300 71012 Medical Insurance 45,433 46,138 49,330 50,080 49,33010020300 71013 Dental Insurance 3,047 2,830 3,000 3,030 3,00010020300 71014 Vision Insurance 762 627 750 680 63010020300 71015 Medicare Insurance 3,394 3,460 3,890 3,890 3,88010020300 71021 Service Contribution-PERS 39,342 43,588 52,230 52,040 18,73010020300 71022 Unfunded Acc Liability - PERS 0 0 0 0 36,00010020300 71023 Deferred Comp 6,540 6,155 5,680 7,200 7,26010020300 71024 LI & AD & D 2,156 1,506 1,660 1,660 1,71010020300 71025 Unemployment Insurance 1,207 1,183 1,430 1,430 1,45010020300 71028 LTD 538 749 1,660 1,660 1,21010020300 71029 Chiropractic 183 220 180 280 30010020300 71031 Other Benefits 12,150 11,550 12,930 12,930 15,39010020300 71032 Cell Stipend 500 603 600 600 600
Salaries & Benefits Total 340,056 354,628 401,960 381,500 409,12010020300 72201 Postage 488 238 400 300 25010020300 72301 Printing/Binding/Duplication 0 418 500 400 30010020300 72303 Advertising 568 494 1,000 1,000 70010020300 72307 Office Supplies 1,231 1,367 2,500 2,500 2,00010020300 72308 Books & Periodicals 0 0 400 400 20010020300 72309 Membership & Dues 0 0 0 350 35010020300 72314 Business Expense 1,869 1,956 2,000 2,500 2,00010020300 72315 Conference Expense 1,604 2,569 2,800 2,800 2,00010020300 72358 Training and Education 327 565 800 800 60010020300 72373 Employees Physical Exams 20,096 37,469 30,000 35,000 25,00010020300 72450 Misc. Professional Services 20,403 19,587 39,520 45,000 20,00010020300 72499 Misc Contract Services 2,358 1,847 5,000 5,000 2,000
Supplies & Services Total 48,944 66,510 84,920 96,050 55,40010020300 74070 PL & PD/Other Insurance 6,480 8,700 11,400 11,400 11,820
Insurances Total 6,480 8,700 11,400 11,400 11,820Human Resources Total 395,480 429,838 498,280 488,950 476,340
Labor Relations10020302 72314 Business Expense 271 1,138 0 0 010020302 72450 Misc. Professional Services 42,081 20,261 21,280 35,800 20,000
Supplies & Services Total 42,353 21,398 21,280 35,800 20,000Labor Relations Total 42,353 21,398 21,280 35,800 20,000
Information Systems10020400 71001 Regular Employee Salary 509,893 552,731 564,660 530,270 570,84010020400 71002 Overtime 1,714 2,256 0 5,000 010020400 71003 Part-time Salary 0 1,496 0 17,010 72,80010020400 71010 Admin Leave Pay 4,822 10,667 13,690 13,690 14,00010020400 71011 Workers Compensation 180 5,320 7,000 7,000 8,54010020400 71012 Medical Insurance 86,733 97,542 95,170 97,140 107,80010020400 71013 Dental Insurance 6,520 7,008 7,000 6,560 7,00010020400 71014 Vision Insurance 1,630 1,565 1,750 1,490 1,47010020400 71015 Medicare Insurance 6,579 7,373 8,390 8,390 9,54010020400 71021 Service Contribution-PERS 87,694 110,264 122,220 119,210 43,75010020400 71022 Unfunded Acc Liability - PERS 0 0 0 0 84,08010020400 71023 Deferred Comp 8,108 10,539 10,520 10,520 14,36010020400 71024 LI & AD & D 4,172 3,132 3,140 3,140 3,36010020400 71025 Unemployment Insurance 2,590 3,016 3,080 3,010 3,690
107
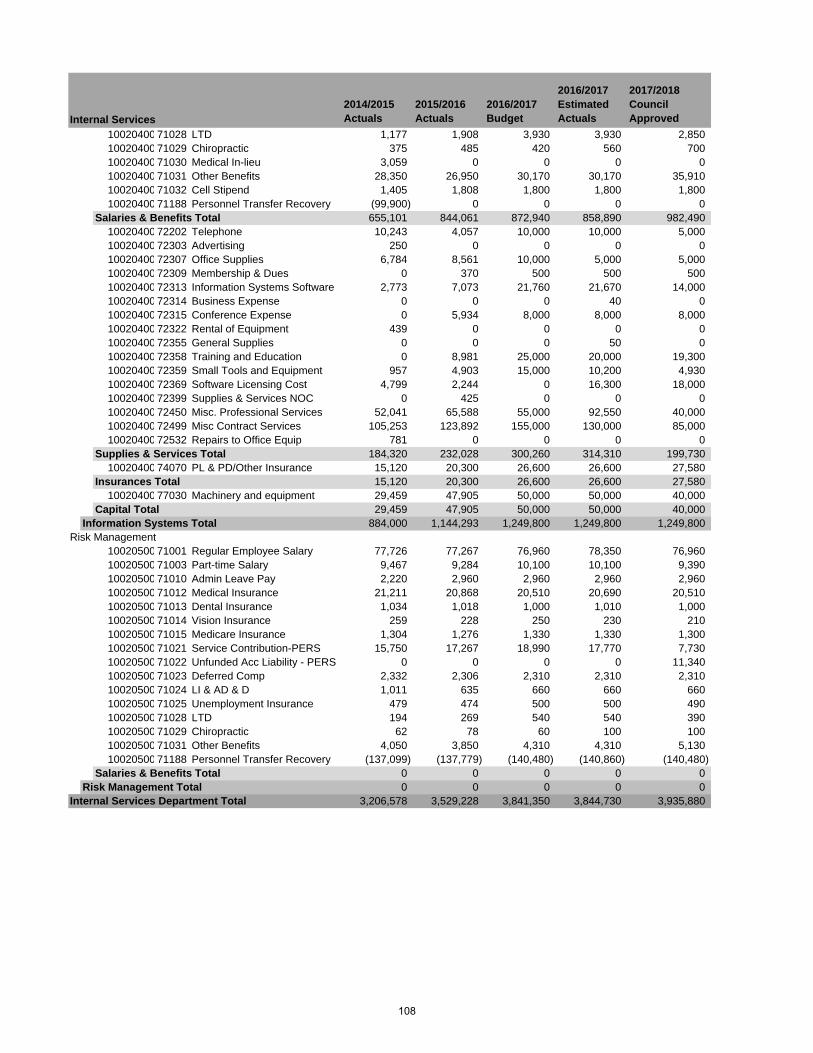
2014/2015 Actuals
2015/2016 Actuals
2016/2017 Budget
2016/2017 Estimated Actuals
2017/2018 Council ApprovedInternal Services
10020400 71028 LTD 1,177 1,908 3,930 3,930 2,85010020400 71029 Chiropractic 375 485 420 560 70010020400 71030 Medical In-lieu 3,059 0 0 0 010020400 71031 Other Benefits 28,350 26,950 30,170 30,170 35,91010020400 71032 Cell Stipend 1,405 1,808 1,800 1,800 1,80010020400 71188 Personnel Transfer Recovery (99,900) 0 0 0 0
Salaries & Benefits Total 655,101 844,061 872,940 858,890 982,49010020400 72202 Telephone 10,243 4,057 10,000 10,000 5,00010020400 72303 Advertising 250 0 0 0 010020400 72307 Office Supplies 6,784 8,561 10,000 5,000 5,00010020400 72309 Membership & Dues 0 370 500 500 50010020400 72313 Information Systems Software 2,773 7,073 21,760 21,670 14,00010020400 72314 Business Expense 0 0 0 40 010020400 72315 Conference Expense 0 5,934 8,000 8,000 8,00010020400 72322 Rental of Equipment 439 0 0 0 010020400 72355 General Supplies 0 0 0 50 010020400 72358 Training and Education 0 8,981 25,000 20,000 19,30010020400 72359 Small Tools and Equipment 957 4,903 15,000 10,200 4,93010020400 72369 Software Licensing Cost 4,799 2,244 0 16,300 18,00010020400 72399 Supplies & Services NOC 0 425 0 0 010020400 72450 Misc. Professional Services 52,041 65,588 55,000 92,550 40,00010020400 72499 Misc Contract Services 105,253 123,892 155,000 130,000 85,00010020400 72532 Repairs to Office Equip 781 0 0 0 0
Supplies & Services Total 184,320 232,028 300,260 314,310 199,73010020400 74070 PL & PD/Other Insurance 15,120 20,300 26,600 26,600 27,580
Insurances Total 15,120 20,300 26,600 26,600 27,58010020400 77030 Machinery and equipment 29,459 47,905 50,000 50,000 40,000
Capital Total 29,459 47,905 50,000 50,000 40,000Information Systems Total 884,000 1,144,293 1,249,800 1,249,800 1,249,800
Risk Management10020500 71001 Regular Employee Salary 77,726 77,267 76,960 78,350 76,96010020500 71003 Part-time Salary 9,467 9,284 10,100 10,100 9,39010020500 71010 Admin Leave Pay 2,220 2,960 2,960 2,960 2,96010020500 71012 Medical Insurance 21,211 20,868 20,510 20,690 20,51010020500 71013 Dental Insurance 1,034 1,018 1,000 1,010 1,00010020500 71014 Vision Insurance 259 228 250 230 21010020500 71015 Medicare Insurance 1,304 1,276 1,330 1,330 1,30010020500 71021 Service Contribution-PERS 15,750 17,267 18,990 17,770 7,73010020500 71022 Unfunded Acc Liability - PERS 0 0 0 0 11,34010020500 71023 Deferred Comp 2,332 2,306 2,310 2,310 2,31010020500 71024 LI & AD & D 1,011 635 660 660 66010020500 71025 Unemployment Insurance 479 474 500 500 49010020500 71028 LTD 194 269 540 540 39010020500 71029 Chiropractic 62 78 60 100 10010020500 71031 Other Benefits 4,050 3,850 4,310 4,310 5,13010020500 71188 Personnel Transfer Recovery (137,099) (137,779) (140,480) (140,860) (140,480)
Salaries & Benefits Total 0 0 0 0 0Risk Management Total 0 0 0 0 0
Internal Services Department Total 3,206,578 3,529,228 3,841,350 3,844,730 3,935,880
108
NON-DEPARTMENTAL This activity encompasses General Fund transfers to other funds and expenditures that are not attributed to a particular City service, such as utilities, postage and other government agency fees. The exceptions are the transfers to Parks, Recreation and Cultural Services and the City’s Library operations. The Non-Departmental budget is $10,565,830 in FY 2017/18, compared to $8,765,760 as originally budgeted in FY 2016/17. The 2016/17 budget shown in the following pages reflects adjustments made throughout the year. Of the FY 2017/18 total, the Parks, Recreation and Cultural Services transfer is $3,853,240 and the Library transfer is $1,271,730. Also included in the total is a $2,019,230 investment to the City’s pension stabilization fund through PARS. Financial tables are included in the following pages.
109
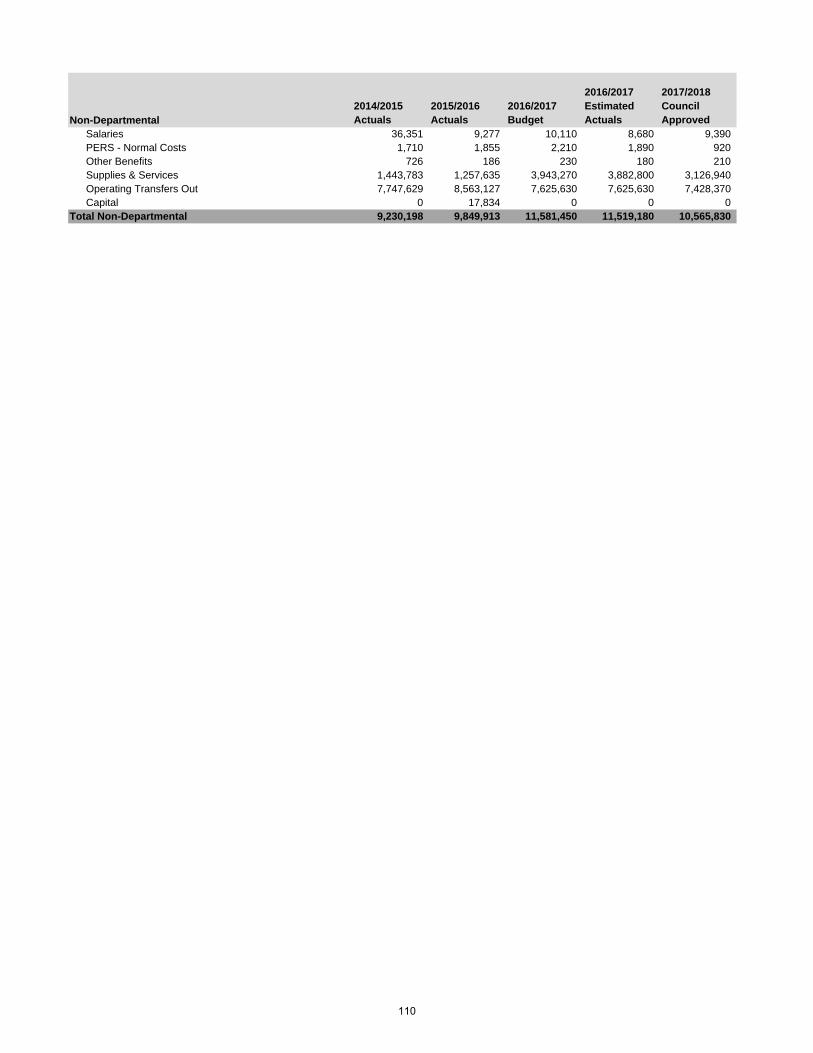
2014/2015 Actuals
2015/2016 Actuals
2016/2017 Budget
2016/2017 Estimated Actuals
2017/2018 Council Approved
Salaries 36,351 9,277 10,110 8,680 9,390PERS - Normal Costs 1,710 1,855 2,210 1,890 920Other Benefits 726 186 230 180 210Supplies & Services 1,443,783 1,257,635 3,943,270 3,882,800 3,126,940Operating Transfers Out 7,747,629 8,563,127 7,625,630 7,625,630 7,428,370Capital 0 17,834 0 0 0
Total Non-Departmental 9,230,198 9,849,913 11,581,450 11,519,180 10,565,830
Non-Departmental
110
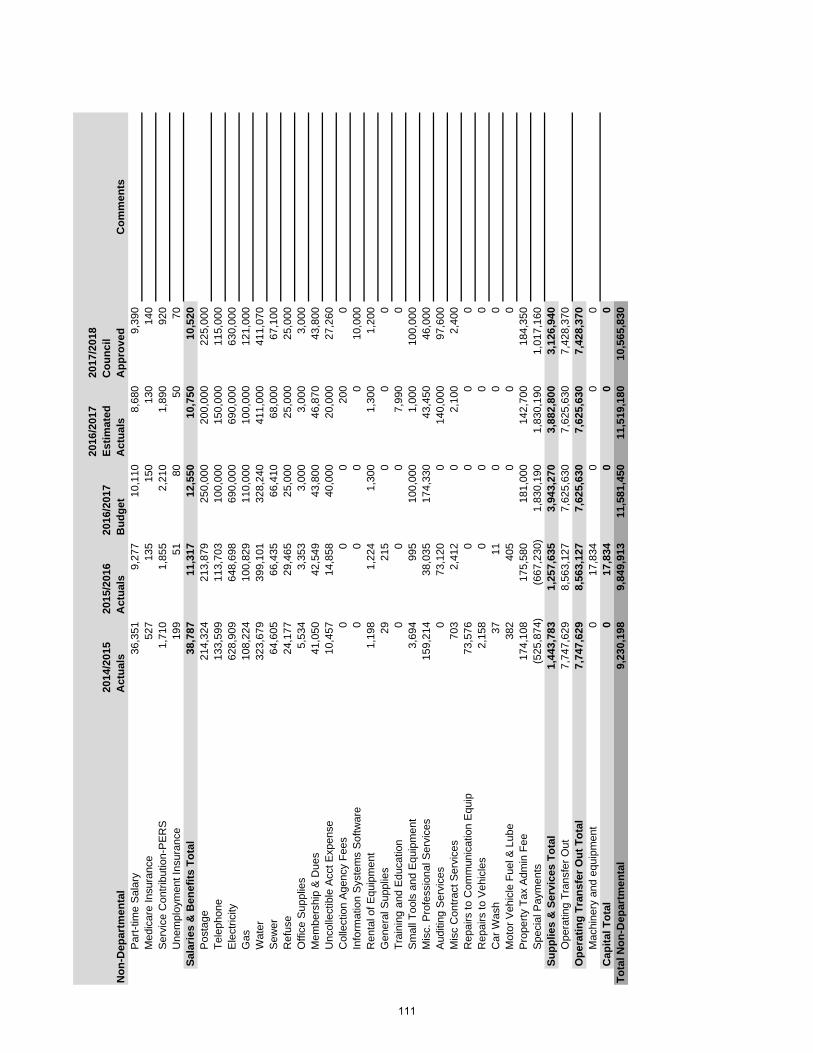
2014
/201
5 A
ctua
ls20
15/2
016
Act
uals
2016
/201
7 B
udge
t
2016
/201
7 Es
timat
ed
Act
uals
2017
/201
8 C
ounc
il A
ppro
ved
Com
men
tsP
art-t
ime
Sal
ary
36,3
519,
277
10,1
108,
680
9,39
0M
edic
are
Insu
ranc
e52
713
515
013
014
0S
ervi
ce C
ontri
butio
n-P
ER
S1,
710
1,85
52,
210
1,89
092
0U
nem
ploy
men
t Ins
uran
ce19
951
8050
70Sa
larie
s &
Ben
efits
Tot
al38
,787
11,3
1712
,550
10,7
5010
,520
Pos
tage
214,
324
213,
879
250,
000
200,
000
225,
000
Tele
phon
e13
3,59
911
3,70
310
0,00
015
0,00
011
5,00
0E
lect
ricity
628,
909
648,
698
690,
000
690,
000
630,
000
Gas
108,
224
100,
829
110,
000
100,
000
121,
000
Wat
er32
3,67
939
9,10
132
8,24
041
1,00
041
1,07
0S
ewer
64,6
0566
,435
66,4
1068
,000
67,1
00R
efus
e24
,177
29,4
6525
,000
25,0
0025
,000
Offi
ce S
uppl
ies
5,53
43,
353
3,00
03,
000
3,00
0M
embe
rshi
p &
Due
s41
,050
42,5
4943
,800
46,8
7043
,800
Unc
olle
ctib
le A
cct E
xpen
se10
,457
14,8
5840
,000
20,0
0027
,260
Col
lect
ion
Age
ncy
Fees
00
020
00
Info
rmat
ion
Sys
tem
s S
oftw
are
00
00
10,0
00R
enta
l of E
quip
men
t1,
198
1,22
41,
300
1,30
01,
200
Gen
eral
Sup
plie
s29
215
00
0Tr
aini
ng a
nd E
duca
tion
00
07,
990
0S
mal
l Too
ls a
nd E
quip
men
t3,
694
995
100,
000
1,00
010
0,00
0M
isc.
Pro
fess
iona
l Ser
vice
s15
9,21
438
,035
174,
330
43,4
5046
,000
Aud
iting
Ser
vice
s0
73,1
200
140,
000
97,6
00M
isc
Con
tract
Ser
vice
s70
32,
412
02,
100
2,40
0R
epai
rs to
Com
mun
icat
ion
Equ
ip73
,576
00
00
Rep
airs
to V
ehic
les
2,15
80
00
0C
ar W
ash
3711
00
0M
otor
Veh
icle
Fue
l & L
ube
382
405
00
0P
rope
rty T
ax A
dmin
Fee
174,
108
175,
580
181,
000
142,
700
184,
350
Spe
cial
Pay
men
ts(5
25,8
74)
(667
,230
)1,
830,
190
1,83
0,19
01,
017,
160
Supp
lies
& S
ervi
ces
Tota
l1,
443,
783
1,25
7,63
53,
943,
270
3,88
2,80
03,
126,
940
Ope
ratin
g Tr
ansf
er O
ut7,
747,
629
8,56
3,12
77,
625,
630
7,62
5,63
07,
428,
370
Ope
ratin
g Tr
ansf
er O
ut T
otal
7,74
7,62
98,
563,
127
7,62
5,63
07,
625,
630
7,42
8,37
0M
achi
nery
and
equ
ipm
ent
017
,834
00
0C
apita
l Tot
al0
17,8
340
00
Tota
l Non
-Dep
artm
enta
l9,
230,
198
9,84
9,91
311
,581
,450
11,5
19,1
8010
,565
,830
Non
-Dep
artm
enta
l
111
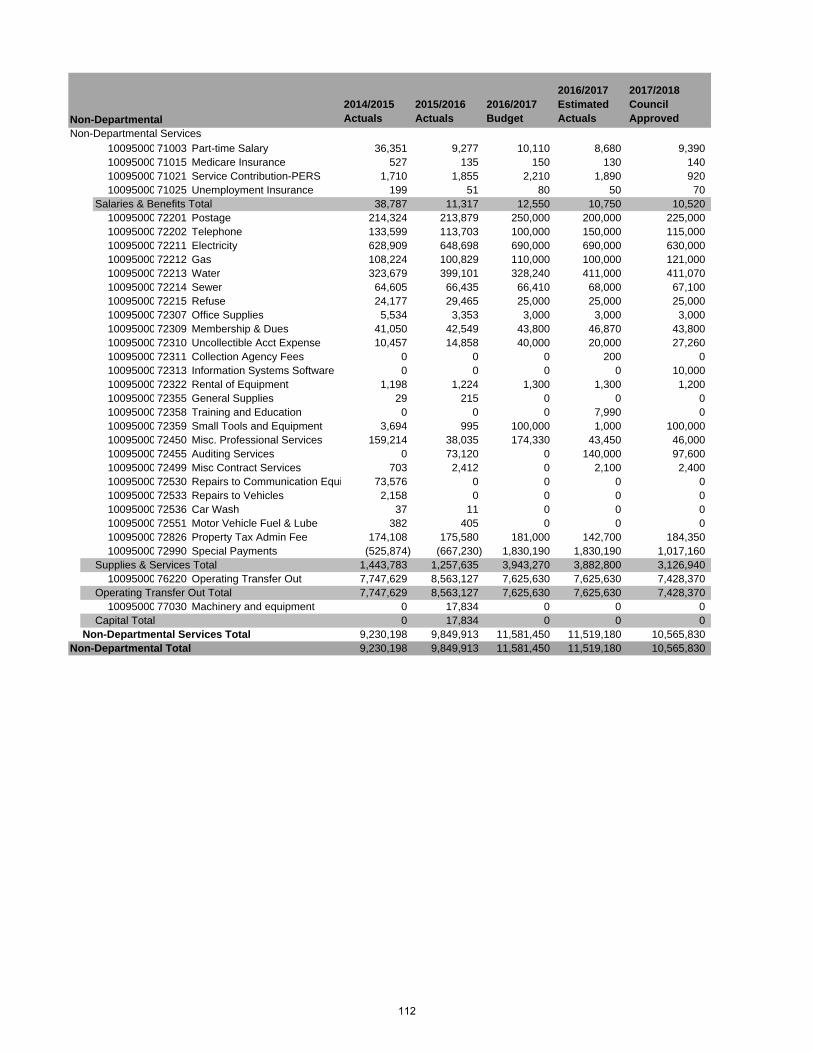
2014/2015 Actuals
2015/2016 Actuals
2016/2017 Budget
2016/2017 Estimated Actuals
2017/2018 Council Approved
Non-Departmental Services10095000 71003 Part-time Salary 36,351 9,277 10,110 8,680 9,39010095000 71015 Medicare Insurance 527 135 150 130 14010095000 71021 Service Contribution-PERS 1,710 1,855 2,210 1,890 92010095000 71025 Unemployment Insurance 199 51 80 50 70
Salaries & Benefits Total 38,787 11,317 12,550 10,750 10,52010095000 72201 Postage 214,324 213,879 250,000 200,000 225,00010095000 72202 Telephone 133,599 113,703 100,000 150,000 115,00010095000 72211 Electricity 628,909 648,698 690,000 690,000 630,00010095000 72212 Gas 108,224 100,829 110,000 100,000 121,00010095000 72213 Water 323,679 399,101 328,240 411,000 411,07010095000 72214 Sewer 64,605 66,435 66,410 68,000 67,10010095000 72215 Refuse 24,177 29,465 25,000 25,000 25,00010095000 72307 Office Supplies 5,534 3,353 3,000 3,000 3,00010095000 72309 Membership & Dues 41,050 42,549 43,800 46,870 43,80010095000 72310 Uncollectible Acct Expense 10,457 14,858 40,000 20,000 27,26010095000 72311 Collection Agency Fees 0 0 0 200 010095000 72313 Information Systems Software 0 0 0 0 10,00010095000 72322 Rental of Equipment 1,198 1,224 1,300 1,300 1,20010095000 72355 General Supplies 29 215 0 0 010095000 72358 Training and Education 0 0 0 7,990 010095000 72359 Small Tools and Equipment 3,694 995 100,000 1,000 100,00010095000 72450 Misc. Professional Services 159,214 38,035 174,330 43,450 46,00010095000 72455 Auditing Services 0 73,120 0 140,000 97,60010095000 72499 Misc Contract Services 703 2,412 0 2,100 2,40010095000 72530 Repairs to Communication Equi 73,576 0 0 0 010095000 72533 Repairs to Vehicles 2,158 0 0 0 010095000 72536 Car Wash 37 11 0 0 010095000 72551 Motor Vehicle Fuel & Lube 382 405 0 0 010095000 72826 Property Tax Admin Fee 174,108 175,580 181,000 142,700 184,35010095000 72990 Special Payments (525,874) (667,230) 1,830,190 1,830,190 1,017,160
Supplies & Services Total 1,443,783 1,257,635 3,943,270 3,882,800 3,126,94010095000 76220 Operating Transfer Out 7,747,629 8,563,127 7,625,630 7,625,630 7,428,370
Operating Transfer Out Total 7,747,629 8,563,127 7,625,630 7,625,630 7,428,37010095000 77030 Machinery and equipment 0 17,834 0 0 0
Capital Total 0 17,834 0 0 0Non-Departmental Services Total 9,230,198 9,849,913 11,581,450 11,519,180 10,565,830
Non-Departmental Total 9,230,198 9,849,913 11,581,450 11,519,180 10,565,830
Non-Departmental
112
ENTERPRISE FUNDS Enterprise Funds are the City’s self-supporting funds: Electric Utility, Water, Wastewater and Transit. The Electric Utility, Water and Wastewater funds are funded through user fees, while Transit is funded through a combination of rider fares, Federal assistance, San Joaquin County’s transportation sales tax (Measure K) and State funds. The following pages provide details on each fund.
113

(This page intentionally left blank)
114

ELECTRIC UTILITY Lodi Electric Utility provides electricity throughout the City. Lodi Electric has a $74,784,690 budget in FY 2017/18, compared to $73,705,900 as originally budgeted in FY 2016/17. The 2016/17 budget shown in the following pages reflects adjustments made throughout the year. The utility is funded primarily through service charges. FY 2017/18 budgeted staffing is being reduced by 1 to 51 positions. An organizational chart, staffing summary, detailed activity descriptions and financial tables are included in the following pages.
115
(This page intentionally left blank)
116
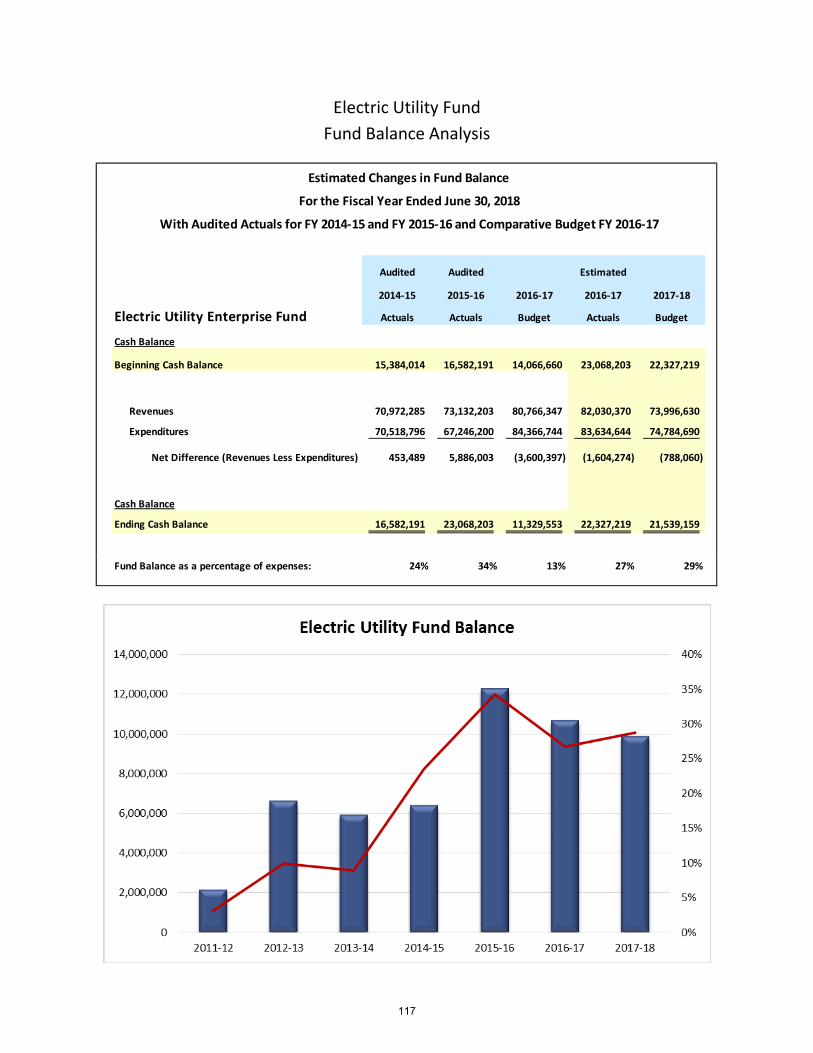
Electric Utility Fund Fund Balance Analysis
Audited Audited Estimated
2014-15 2015-16 2016-17 2016-17 2017-18
Electric Utility Enterprise Fund Actuals Actuals Budget Actuals Budget
Cash Balance
Beginning Cash Balance 15,384,014 16,582,191 14,066,660 23,068,203 22,327,219
Revenues 70,972,285 73,132,203 80,766,347 82,030,370 73,996,630
Expenditures 70,518,796 67,246,200 84,366,744 83,634,644 74,784,690
Net Difference (Revenues Less Expenditures) 453,489 5,886,003 (3,600,397) (1,604,274) (788,060)
Cash Balance
Ending Cash Balance 16,582,191 23,068,203 11,329,553 22,327,219 21,539,159
Fund Balance as a percentage of expenses: 24% 34% 13% 27% 29%
Estimated Changes in Fund Balance
For the Fiscal Year Ended June 30, 2018
With Audited Actuals for FY 2014-15 and FY 2015-16 and Comparative Budget FY 2016-17
117
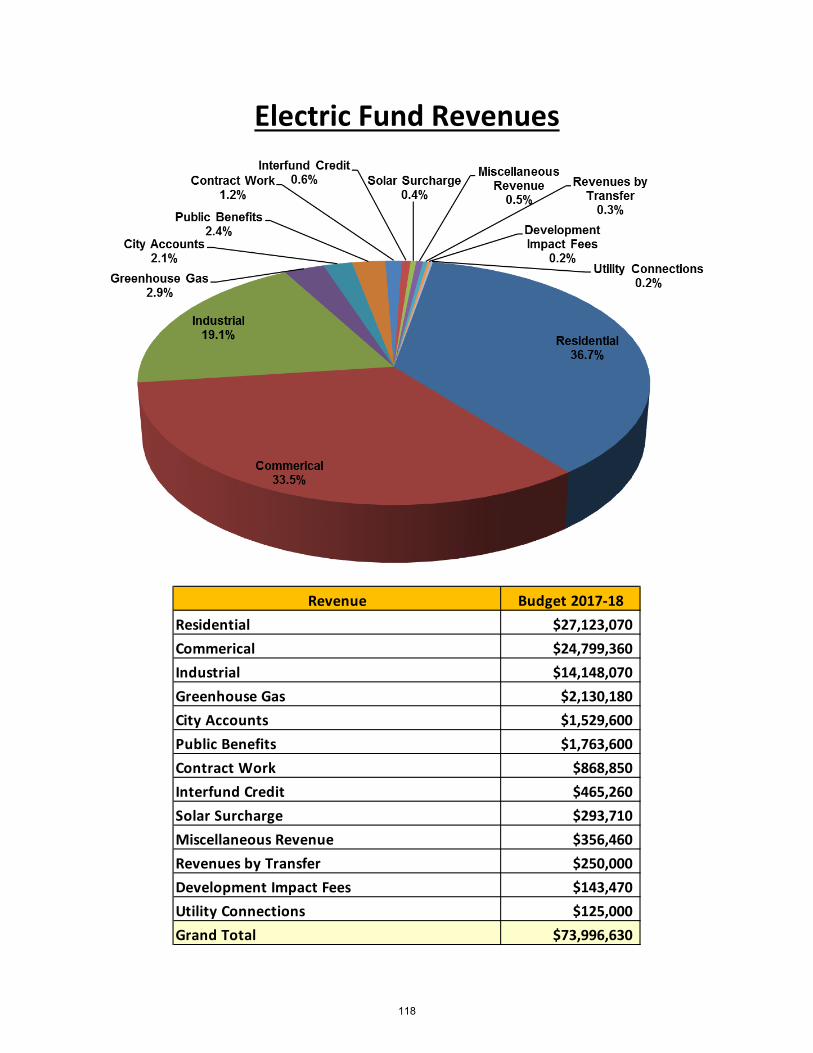
Electric Fund Revenues
Revenue Budget 2017-18Residential $27,123,070Commerical $24,799,360Industrial $14,148,070Greenhouse Gas $2,130,180City Accounts $1,529,600Public Benefits $1,763,600Contract Work $868,850Interfund Credit $465,260Solar Surcharge $293,710Miscellaneous Revenue $356,460Revenues by Transfer $250,000Development Impact Fees $143,470Utility Connections $125,000Grand Total $73,996,630
118
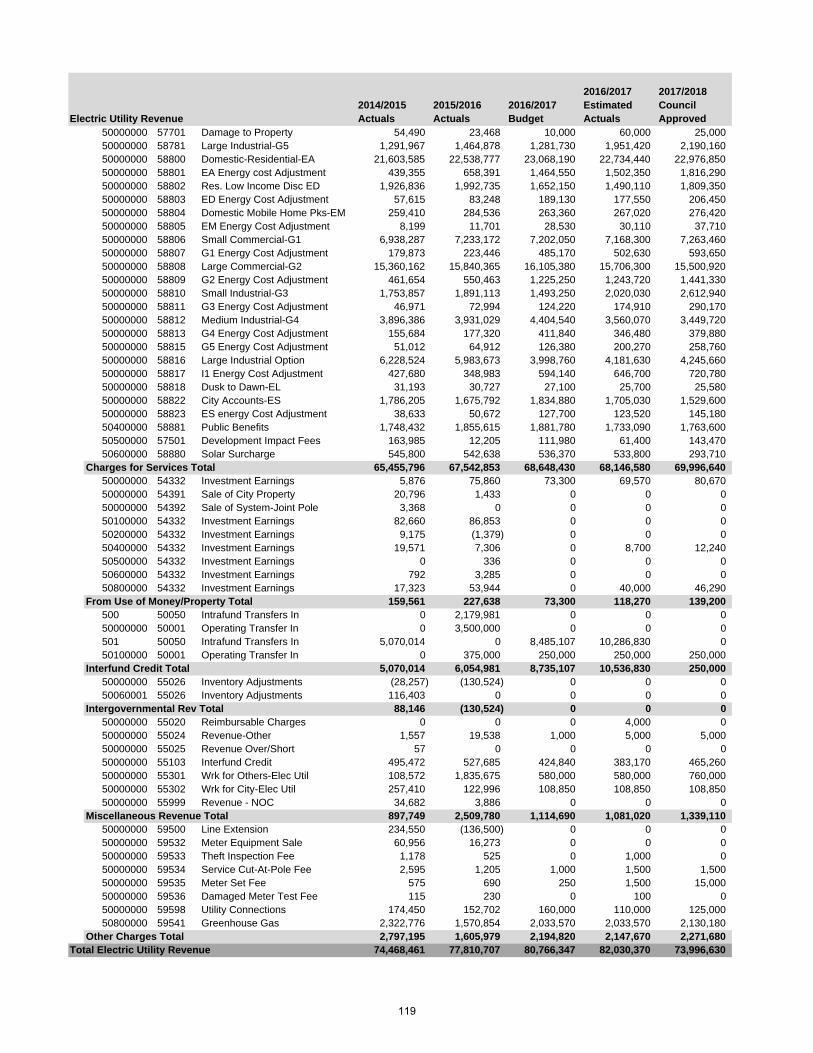
2014/2015 Actuals
2015/2016 Actuals
2016/2017 Budget
2016/2017 Estimated Actuals
2017/2018 Council Approved
50000000 57701 Damage to Property 54,490 23,468 10,000 60,000 25,00050000000 58781 Large Industrial-G5 1,291,967 1,464,878 1,281,730 1,951,420 2,190,16050000000 58800 Domestic-Residential-EA 21,603,585 22,538,777 23,068,190 22,734,440 22,976,85050000000 58801 EA Energy cost Adjustment 439,355 658,391 1,464,550 1,502,350 1,816,29050000000 58802 Res. Low Income Disc ED 1,926,836 1,992,735 1,652,150 1,490,110 1,809,35050000000 58803 ED Energy Cost Adjustment 57,615 83,248 189,130 177,550 206,45050000000 58804 Domestic Mobile Home Pks-EM 259,410 284,536 263,360 267,020 276,42050000000 58805 EM Energy Cost Adjustment 8,199 11,701 28,530 30,110 37,71050000000 58806 Small Commercial-G1 6,938,287 7,233,172 7,202,050 7,168,300 7,263,46050000000 58807 G1 Energy Cost Adjustment 179,873 223,446 485,170 502,630 593,65050000000 58808 Large Commercial-G2 15,360,162 15,840,365 16,105,380 15,706,300 15,500,92050000000 58809 G2 Energy Cost Adjustment 461,654 550,463 1,225,250 1,243,720 1,441,33050000000 58810 Small Industrial-G3 1,753,857 1,891,113 1,493,250 2,020,030 2,612,94050000000 58811 G3 Energy Cost Adjustment 46,971 72,994 124,220 174,910 290,17050000000 58812 Medium Industrial-G4 3,896,386 3,931,029 4,404,540 3,560,070 3,449,72050000000 58813 G4 Energy Cost Adjustment 155,684 177,320 411,840 346,480 379,88050000000 58815 G5 Energy Cost Adjustment 51,012 64,912 126,380 200,270 258,76050000000 58816 Large Industrial Option 6,228,524 5,983,673 3,998,760 4,181,630 4,245,66050000000 58817 I1 Energy Cost Adjustment 427,680 348,983 594,140 646,700 720,78050000000 58818 Dusk to Dawn-EL 31,193 30,727 27,100 25,700 25,58050000000 58822 City Accounts-ES 1,786,205 1,675,792 1,834,880 1,705,030 1,529,60050000000 58823 ES energy Cost Adjustment 38,633 50,672 127,700 123,520 145,18050400000 58881 Public Benefits 1,748,432 1,855,615 1,881,780 1,733,090 1,763,60050500000 57501 Development Impact Fees 163,985 12,205 111,980 61,400 143,47050600000 58880 Solar Surcharge 545,800 542,638 536,370 533,800 293,710
Charges for Services Total 65,455,796 67,542,853 68,648,430 68,146,580 69,996,64050000000 54332 Investment Earnings 5,876 75,860 73,300 69,570 80,67050000000 54391 Sale of City Property 20,796 1,433 0 0 050000000 54392 Sale of System-Joint Pole 3,368 0 0 0 050100000 54332 Investment Earnings 82,660 86,853 0 0 050200000 54332 Investment Earnings 9,175 (1,379) 0 0 050400000 54332 Investment Earnings 19,571 7,306 0 8,700 12,24050500000 54332 Investment Earnings 0 336 0 0 050600000 54332 Investment Earnings 792 3,285 0 0 050800000 54332 Investment Earnings 17,323 53,944 0 40,000 46,290
From Use of Money/Property Total 159,561 227,638 73,300 118,270 139,200500 50050 Intrafund Transfers In 0 2,179,981 0 0 050000000 50001 Operating Transfer In 0 3,500,000 0 0 0501 50050 Intrafund Transfers In 5,070,014 0 8,485,107 10,286,830 050100000 50001 Operating Transfer In 0 375,000 250,000 250,000 250,000
Interfund Credit Total 5,070,014 6,054,981 8,735,107 10,536,830 250,00050000000 55026 Inventory Adjustments (28,257) (130,524) 0 0 050060001 55026 Inventory Adjustments 116,403 0 0 0 0
Intergovernmental Rev Total 88,146 (130,524) 0 0 050000000 55020 Reimbursable Charges 0 0 0 4,000 050000000 55024 Revenue-Other 1,557 19,538 1,000 5,000 5,00050000000 55025 Revenue Over/Short 57 0 0 0 050000000 55103 Interfund Credit 495,472 527,685 424,840 383,170 465,26050000000 55301 Wrk for Others-Elec Util 108,572 1,835,675 580,000 580,000 760,00050000000 55302 Wrk for City-Elec Util 257,410 122,996 108,850 108,850 108,85050000000 55999 Revenue - NOC 34,682 3,886 0 0 0
Miscellaneous Revenue Total 897,749 2,509,780 1,114,690 1,081,020 1,339,11050000000 59500 Line Extension 234,550 (136,500) 0 0 050000000 59532 Meter Equipment Sale 60,956 16,273 0 0 050000000 59533 Theft Inspection Fee 1,178 525 0 1,000 050000000 59534 Service Cut-At-Pole Fee 2,595 1,205 1,000 1,500 1,50050000000 59535 Meter Set Fee 575 690 250 1,500 15,00050000000 59536 Damaged Meter Test Fee 115 230 0 100 050000000 59598 Utility Connections 174,450 152,702 160,000 110,000 125,00050800000 59541 Greenhouse Gas 2,322,776 1,570,854 2,033,570 2,033,570 2,130,180
Other Charges Total 2,797,195 1,605,979 2,194,820 2,147,670 2,271,680Total Electric Utility Revenue 74,468,461 77,810,707 80,766,347 82,030,370 73,996,630
Electric Utility Revenue
119

(This page intentionally left blank)
120
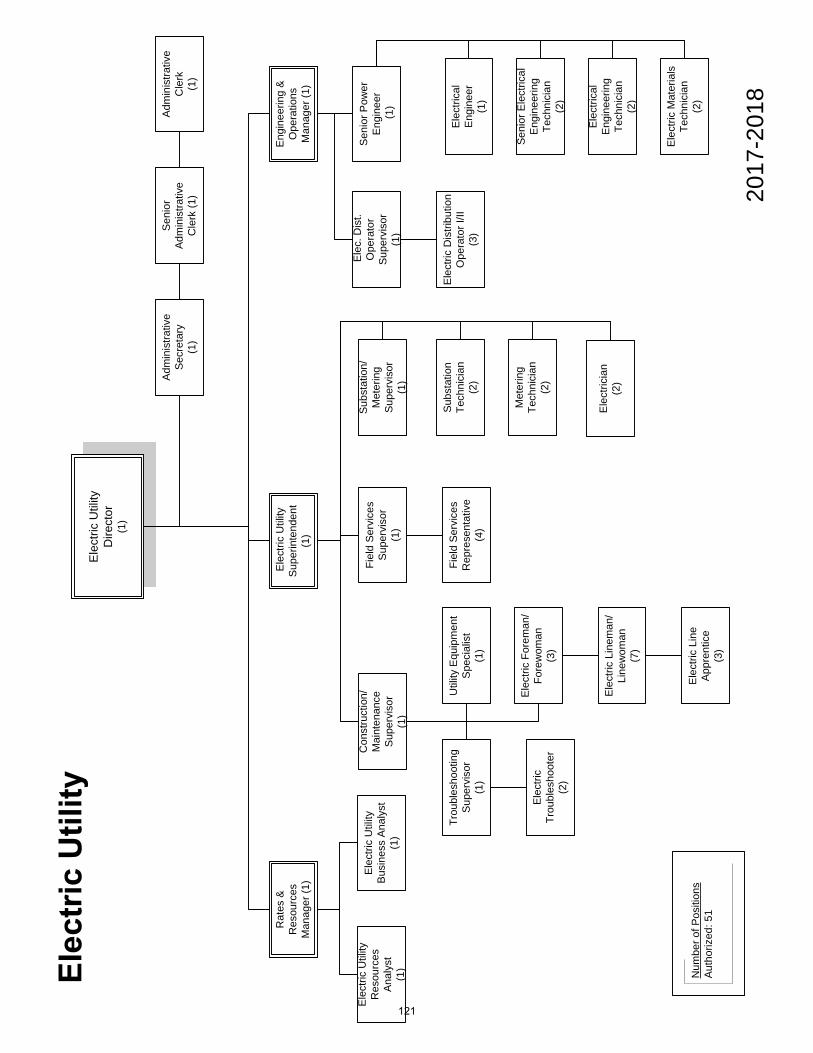
2017
-201
8
Num
ber o
f Pos
ition
sAu
thor
ized
: 51
Ele
ctric
Util
ity
Dire
ctor
(1)
Ele
ctric
Util
ity
Sup
erin
tend
ent
(1)
Rat
es &
R
esou
rces
M
anag
er (1
)
Eng
inee
ring
&
Ope
ratio
ns
Man
ager
(1)
Adm
inis
trativ
e Se
cret
ary
(1)
Sen
ior
Adm
inis
trativ
e C
lerk
(1)
Adm
inis
trativ
e C
lerk
(1
)
Ele
ctric
Util
ity
Res
ourc
es
Anal
yst
(1)
Fiel
d Se
rvic
es
Sup
ervi
sor
(1)
Fiel
d Se
rvic
es
Rep
rese
ntat
ive
(4)
Con
stru
ctio
n/M
aint
enan
ce
Sup
ervi
sor
(1)
Elec
. Dis
t. O
pera
tor
Supe
rvis
or
(1)
Util
ity E
quip
men
t S
peci
alis
t (1
)
Trou
bles
hoot
ing
Sup
ervi
sor
(1)
Ele
ctric
For
eman
/Fo
rew
oman
(3
)E
lect
ric
Trou
bles
hoot
er
(2)
Elec
tric
Line
man
/Li
new
oman
(7
)
Sen
ior P
ower
E
ngin
eer
(1)
Subs
tatio
n/M
eter
ing
Supe
rvis
or
(1)
Sub
stat
ion
Tech
nici
an
(2)
Met
erin
g Te
chni
cian
(2)
Ele
ctric
al
Engi
neer
(1)
Seni
or E
lect
rical
E
ngin
eerin
g Te
chni
cian
(2)
Ele
ctric
al
Eng
inee
ring
Tech
nici
an
(2)
Elec
tric
Mat
eria
ls
Tech
nici
an
(2)
Ele
ctric
Lin
e Ap
pren
tice
(3)
Ele
ctric
ian
(2)
Ele
ctric
Util
ity
Bus
ines
s An
alys
t(1
)
Ele
ctric
Dis
tribu
tion
Ope
rato
r I/II
(3)
121
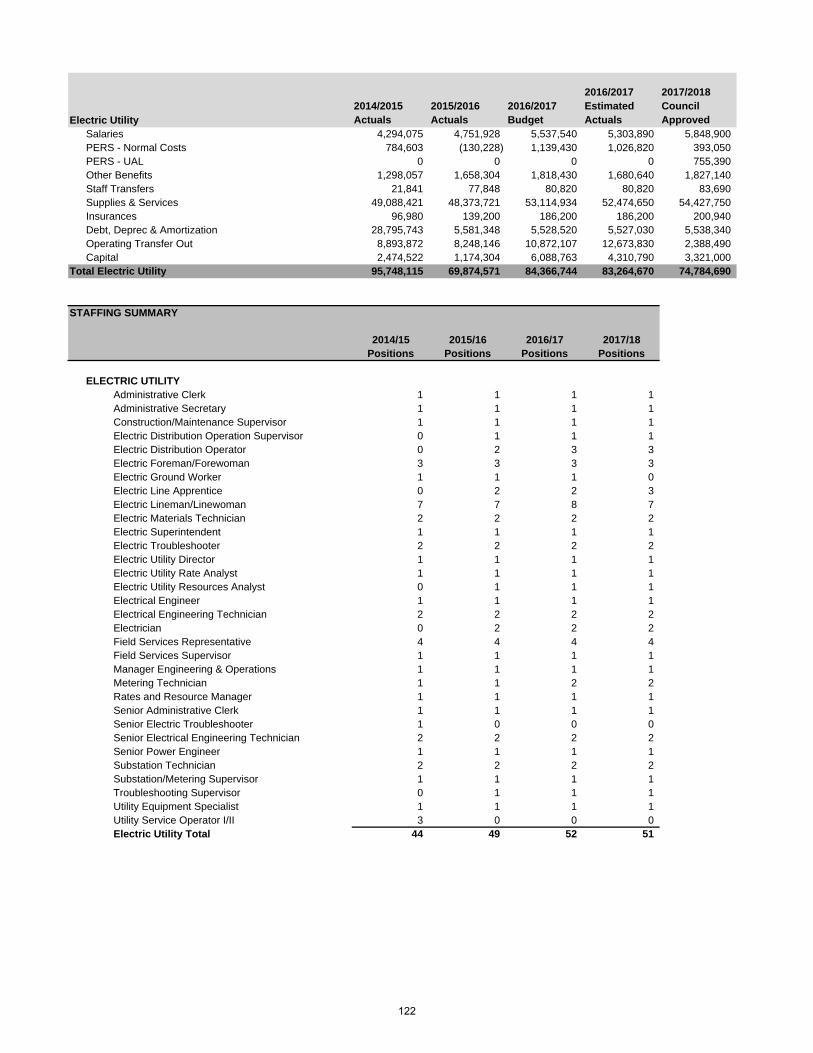
2014/2015 Actuals
2015/2016 Actuals
2016/2017 Budget
2016/2017 Estimated Actuals
2017/2018 Council Approved
Salaries 4,294,075 4,751,928 5,537,540 5,303,890 5,848,900PERS - Normal Costs 784,603 (130,228) 1,139,430 1,026,820 393,050PERS - UAL 0 0 0 0 755,390Other Benefits 1,298,057 1,658,304 1,818,430 1,680,640 1,827,140Staff Transfers 21,841 77,848 80,820 80,820 83,690Supplies & Services 49,088,421 48,373,721 53,114,934 52,474,650 54,427,750Insurances 96,980 139,200 186,200 186,200 200,940Debt, Deprec & Amortization 28,795,743 5,581,348 5,528,520 5,527,030 5,538,340Operating Transfer Out 8,893,872 8,248,146 10,872,107 12,673,830 2,388,490Capital 2,474,522 1,174,304 6,088,763 4,310,790 3,321,000
Total Electric Utility 95,748,115 69,874,571 84,366,744 83,264,670 74,784,690
STAFFING SUMMARY
2014/15 2015/16 2016/17 2017/18Positions Positions Positions Positions
ELECTRIC UTILITYAdministrative Clerk 1 1 1 1Administrative Secretary 1 1 1 1Construction/Maintenance Supervisor 1 1 1 1Electric Distribution Operation Supervisor 0 1 1 1Electric Distribution Operator 0 2 3 3Electric Foreman/Forewoman 3 3 3 3Electric Ground Worker 1 1 1 0Electric Line Apprentice 0 2 2 3Electric Lineman/Linewoman 7 7 8 7Electric Materials Technician 2 2 2 2Electric Superintendent 1 1 1 1Electric Troubleshooter 2 2 2 2Electric Utility Director 1 1 1 1Electric Utility Rate Analyst 1 1 1 1Electric Utility Resources Analyst 0 1 1 1Electrical Engineer 1 1 1 1Electrical Engineering Technician 2 2 2 2Electrician 0 2 2 2Field Services Representative 4 4 4 4Field Services Supervisor 1 1 1 1Manager Engineering & Operations 1 1 1 1Metering Technician 1 1 2 2Rates and Resource Manager 1 1 1 1Senior Administrative Clerk 1 1 1 1Senior Electric Troubleshooter 1 0 0 0Senior Electrical Engineering Technician 2 2 2 2Senior Power Engineer 1 1 1 1Substation Technician 2 2 2 2Substation/Metering Supervisor 1 1 1 1Troubleshooting Supervisor 0 1 1 1Utility Equipment Specialist 1 1 1 1Utility Service Operator I/II 3 0 0 0Electric Utility Total 44 49 52 51
Electric Utility
122
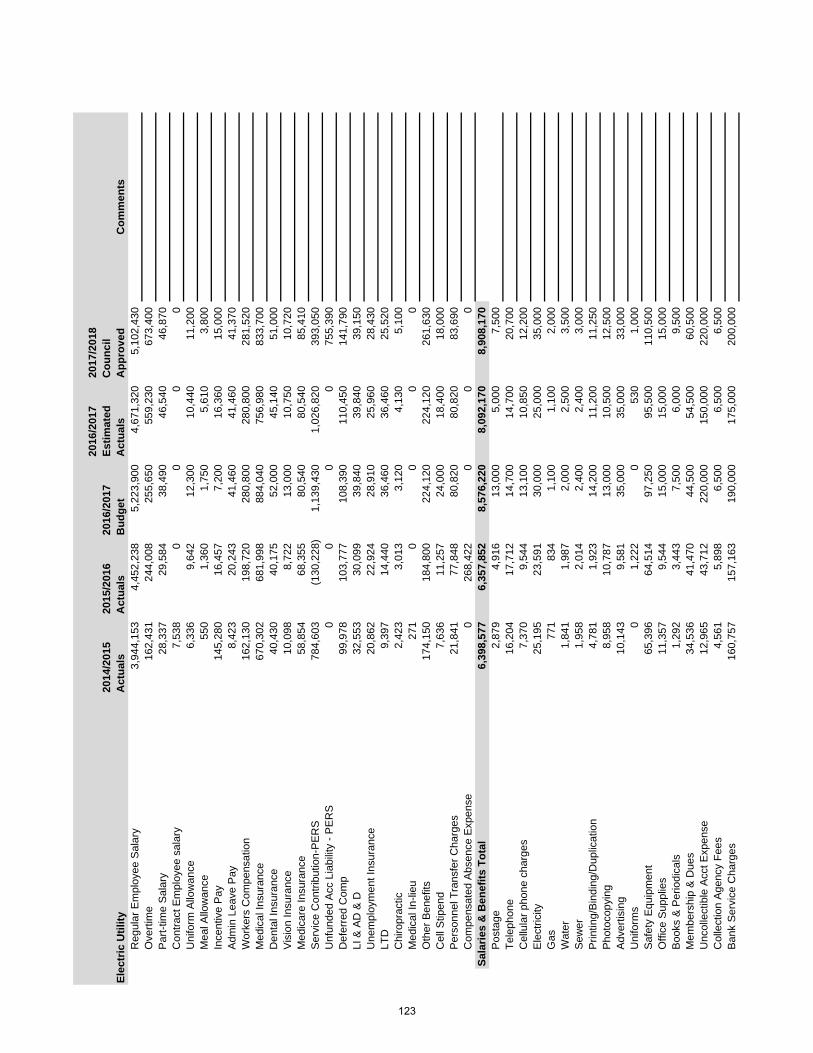
2014
/201
5 A
ctua
ls20
15/2
016
Act
uals
2016
/201
7 B
udge
t
2016
/201
7 Es
timat
ed
Act
uals
2017
/201
8 C
ounc
il A
ppro
ved
Com
men
tsR
egul
ar E
mpl
oyee
Sal
ary
3,94
4,15
34,
452,
238
5,22
3,90
04,
671,
320
5,10
2,43
0O
verti
me
162,
431
244,
008
255,
650
559,
230
673,
400
Par
t-tim
e S
alar
y 28
,337
29,5
8438
,490
46,5
4046
,870
Con
tract
Em
ploy
ee s
alar
y 7,
538
00
00
Uni
form
Allo
wan
ce
6,33
69,
642
12,3
0010
,440
11,2
00M
eal A
llow
ance
55
01,
360
1,75
05,
610
3,80
0In
cent
ive
Pay
14
5,28
016
,457
7,20
016
,360
15,0
00A
dmin
Lea
ve P
ay
8,42
320
,243
41,4
6041
,460
41,3
70W
orke
rs C
ompe
nsat
ion
162,
130
198,
720
280,
800
280,
800
281,
520
Med
ical
Insu
ranc
e 67
0,30
268
1,99
888
4,04
075
6,98
083
3,70
0D
enta
l Ins
uran
ce
40,4
3040
,175
52,0
0045
,140
51,0
00V
isio
n In
sura
nce
10,0
988,
722
13,0
0010
,750
10,7
20M
edic
are
Insu
ranc
e 58
,854
68,3
5580
,540
80,5
4085
,410
Ser
vice
Con
tribu
tion-
PE
RS
78
4,60
3(1
30,2
28)
1,13
9,43
01,
026,
820
393,
050
Unf
unde
d A
cc L
iabi
lity
- PE
RS
0
00
075
5,39
0D
efer
red
Com
p 99
,978
103,
777
108,
390
110,
450
141,
790
LI &
AD
& D
32
,553
30,0
9939
,840
39,8
4039
,150
Une
mpl
oym
ent I
nsur
ance
20
,862
22,9
2428
,910
25,9
6028
,430
LTD
9,
397
14,4
4036
,460
36,4
6025
,520
Chi
ropr
actic
2,
423
3,01
33,
120
4,13
05,
100
Med
ical
In-li
eu
271
00
00
Oth
er B
enef
its
174,
150
184,
800
224,
120
224,
120
261,
630
Cel
l Stip
end
7,63
611
,257
24,0
0018
,400
18,0
00P
erso
nnel
Tra
nsfe
r Cha
rges
21
,841
77,8
4880
,820
80,8
2083
,690
Com
pens
ated
Abs
ence
Exp
ense
0
268,
422
00
0Sa
larie
s &
Ben
efits
Tot
al6,
398,
577
6,35
7,85
28,
576,
220
8,09
2,17
08,
908,
170
Pos
tage
2,
879
4,91
613
,000
5,00
07,
500
Tele
phon
e 16
,204
17,7
1214
,700
14,7
0020
,700
Cel
lula
r pho
ne c
harg
es
7,37
09,
544
13,1
0010
,850
12,2
00E
lect
ricity
25
,195
23,5
9130
,000
25,0
0035
,000
Gas
77
183
41,
100
1,10
02,
000
Wat
er
1,84
11,
987
2,00
02,
500
3,50
0S
ewer
1,
958
2,01
42,
400
2,40
03,
000
Prin
ting/
Bin
ding
/Dup
licat
ion
4,78
11,
923
14,2
0011
,200
11,2
50P
hoto
copy
ing
8,95
810
,787
13,0
0010
,500
12,5
00A
dver
tisin
g 10
,143
9,58
135
,000
35,0
0033
,000
Uni
form
s 0
1,22
20
530
1,00
0S
afet
y E
quip
men
t 65
,396
64,5
1497
,250
95,5
0011
0,50
0O
ffice
Sup
plie
s 11
,357
9,54
415
,000
15,0
0015
,000
Boo
ks &
Per
iodi
cals
1,
292
3,44
37,
500
6,00
09,
500
Mem
bers
hip
& D
ues
34,5
3641
,470
44,5
0054
,500
60,5
00U
ncol
lect
ible
Acc
t Exp
ense
12
,965
43,7
1222
0,00
015
0,00
022
0,00
0C
olle
ctio
n A
genc
y Fe
es
4,56
15,
898
6,50
06,
500
6,50
0B
ank
Ser
vice
Cha
rges
16
0,75
715
7,16
319
0,00
017
5,00
020
0,00
0
Elec
tric
Util
ity
123
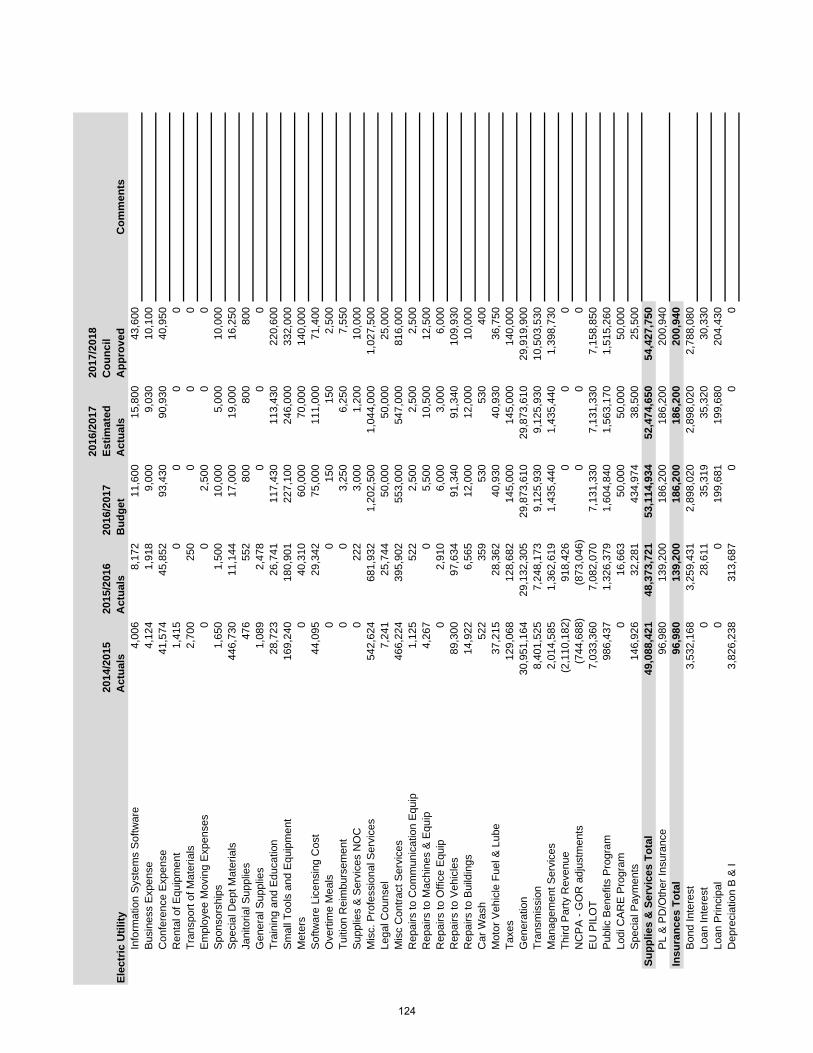
2014
/201
5 A
ctua
ls20
15/2
016
Act
uals
2016
/201
7 B
udge
t
2016
/201
7 Es
timat
ed
Act
uals
2017
/201
8 C
ounc
il A
ppro
ved
Com
men
tsEl
ectr
ic U
tility
Info
rmat
ion
Sys
tem
s S
oftw
are
4,00
68,
172
11,6
0015
,800
43,6
00B
usin
ess
Exp
ense
4,
124
1,91
89,
000
9,03
010
,100
Con
fere
nce
Exp
ense
41
,574
45,8
5293
,430
90,9
3040
,950
Ren
tal o
f Equ
ipm
ent
1,41
50
00
0Tr
ansp
ort o
f Mat
eria
ls
2,70
025
00
00
Em
ploy
ee M
ovin
g E
xpen
ses
00
2,50
00
0S
pons
orsh
ips
1,65
01,
500
10,0
005,
000
10,0
00S
peci
al D
ept M
ater
ials
44
6,73
011
,144
17,0
0019
,000
16,2
50Ja
nito
rial S
uppl
ies
476
552
800
800
800
Gen
eral
Sup
plie
s 1,
089
2,47
80
00
Trai
ning
and
Edu
catio
n 28
,723
26,7
4111
7,43
011
3,43
022
0,60
0S
mal
l Too
ls a
nd E
quip
men
t 16
9,24
018
0,90
122
7,10
024
6,00
033
2,00
0M
eter
s 0
40,3
1060
,000
70,0
0014
0,00
0S
oftw
are
Lice
nsin
g C
ost
44,0
9529
,342
75,0
0011
1,00
071
,400
Ove
rtim
e M
eals
0
015
015
02,
500
Tuiti
on R
eim
burs
emen
t 0
03,
250
6,25
07,
550
Sup
plie
s &
Ser
vice
s N
OC
0
222
3,00
01,
200
10,0
00M
isc.
Pro
fess
iona
l Ser
vice
s 54
2,62
468
1,93
21,
202,
500
1,04
4,00
01,
027,
500
Lega
l Cou
nsel
7,
241
25,7
4450
,000
50,0
0025
,000
Mis
c C
ontra
ct S
ervi
ces
466,
224
395,
902
553,
000
547,
000
816,
000
Rep
airs
to C
omm
unic
atio
n E
quip
1,
125
522
2,50
02,
500
2,50
0R
epai
rs to
Mac
hine
s &
Equ
ip
4,26
70
5,50
010
,500
12,5
00R
epai
rs to
Offi
ce E
quip
0
2,91
06,
000
3,00
06,
000
Rep
airs
to V
ehic
les
89,3
0097
,634
91,3
4091
,340
109,
930
Rep
airs
to B
uild
ings
14
,922
6,56
512
,000
12,0
0010
,000
Car
Was
h 52
235
953
053
040
0M
otor
Veh
icle
Fue
l & L
ube
37,2
1528
,362
40,9
3040
,930
36,7
50Ta
xes
129,
068
128,
682
145,
000
145,
000
140,
000
Gen
erat
ion
30,9
51,1
6429
,132
,305
29,8
73,6
1029
,873
,610
29,9
19,9
00Tr
ansm
issi
on
8,40
1,52
57,
248,
173
9,12
5,93
09,
125,
930
10,5
03,5
30M
anag
emen
t Ser
vice
s 2,
014,
585
1,36
2,61
91,
435,
440
1,43
5,44
01,
398,
730
Third
Par
ty R
even
ue
(2,1
10,1
82)
918,
426
00
0N
CP
A -
GO
R a
djus
tmen
ts
(744
,688
)(8
73,0
46)
00
0E
U P
ILO
T 7,
033,
360
7,08
2,07
07,
131,
330
7,13
1,33
07,
158,
850
Pub
lic B
enef
its P
rogr
am
986,
437
1,32
6,37
91,
604,
840
1,56
3,17
01,
515,
260
Lodi
CA
RE
Pro
gram
0
16,6
6350
,000
50,0
0050
,000
Spe
cial
Pay
men
ts
146,
926
32,2
8143
4,97
438
,500
25,5
00Su
pplie
s &
Ser
vice
s To
tal
49,0
88,4
2148
,373
,721
53,1
14,9
3452
,474
,650
54,4
27,7
50P
L &
PD
/Oth
er In
sura
nce
96,9
8013
9,20
018
6,20
018
6,20
020
0,94
0In
sura
nces
Tot
al96
,980
139,
200
186,
200
186,
200
200,
940
Bon
d In
tere
st
3,53
2,16
83,
259,
431
2,89
8,02
02,
898,
020
2,78
8,08
0Lo
an In
tere
st
028
,611
35,3
1935
,320
30,3
30Lo
an P
rinci
pal
00
199,
681
199,
680
204,
430
Dep
reci
atio
n B
& I
3,82
6,23
831
3,68
70
00
124
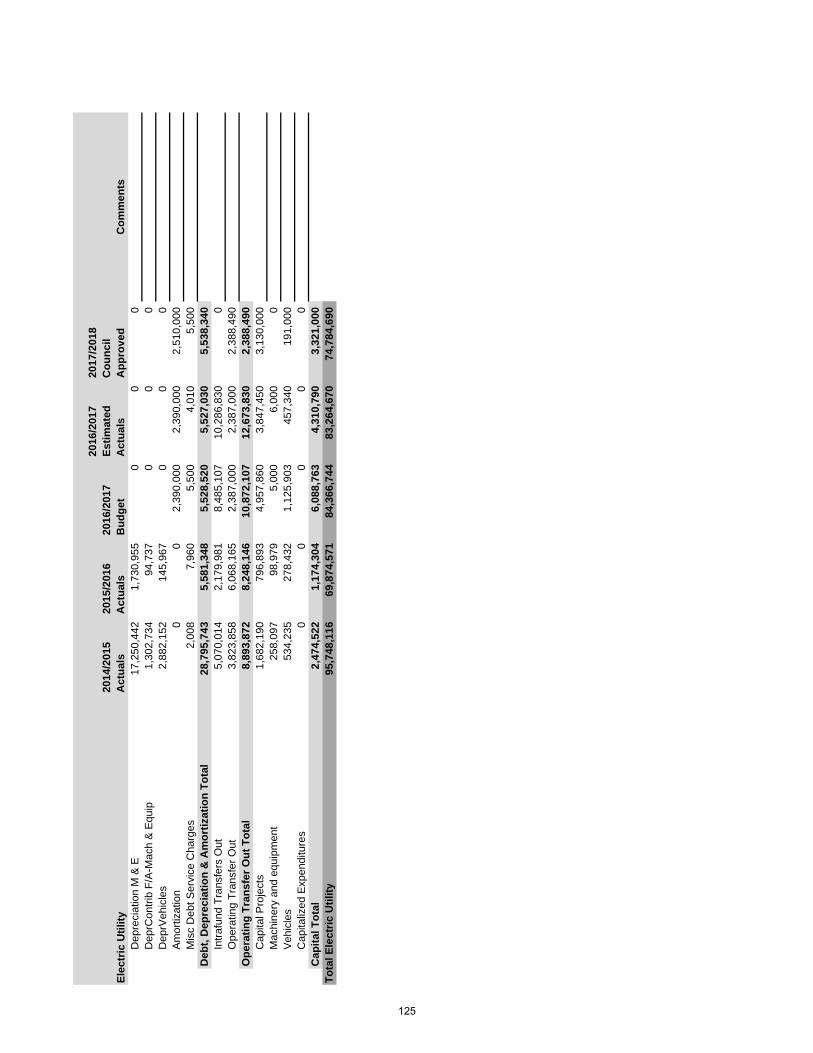
2014
/201
5 A
ctua
ls20
15/2
016
Act
uals
2016
/201
7 B
udge
t
2016
/201
7 Es
timat
ed
Act
uals
2017
/201
8 C
ounc
il A
ppro
ved
Com
men
tsEl
ectr
ic U
tility
Dep
reci
atio
n M
& E
17
,250
,442
1,73
0,95
50
00
Dep
rCon
trib
F/A
-Mac
h &
Equ
ip
1,30
2,73
494
,737
00
0D
eprV
ehic
les
2,88
2,15
214
5,96
70
00
Am
ortiz
atio
n 0
02,
390,
000
2,39
0,00
02,
510,
000
Mis
c D
ebt S
ervi
ce C
harg
es
2,00
87,
960
5,50
04,
010
5,50
0D
ebt,
Dep
reci
atio
n &
Am
ortiz
atio
n To
tal
28,7
95,7
435,
581,
348
5,52
8,52
05,
527,
030
5,53
8,34
0In
trafu
nd T
rans
fers
Out
5,
070,
014
2,17
9,98
18,
485,
107
10,2
86,8
300
Ope
ratin
g Tr
ansf
er O
ut
3,82
3,85
86,
068,
165
2,38
7,00
02,
387,
000
2,38
8,49
0O
pera
ting
Tran
sfer
Out
Tot
al8,
893,
872
8,24
8,14
610
,872
,107
12,6
73,8
302,
388,
490
Cap
ital P
roje
cts
1,68
2,19
079
6,89
34,
957,
860
3,84
7,45
03,
130,
000
Mac
hine
ry a
nd e
quip
men
t 25
8,09
798
,979
5,00
06,
000
0V
ehic
les
534,
235
278,
432
1,12
5,90
345
7,34
019
1,00
0C
apita
lized
Exp
endi
ture
s 0
00
00
Cap
ital T
otal
2,47
4,52
21,
174,
304
6,08
8,76
34,
310,
790
3,32
1,00
0To
tal E
lect
ric U
tilit y
95,7
48,1
1669
,874
,571
84,3
66,7
4483
,264
,670
74,7
84,6
90
125
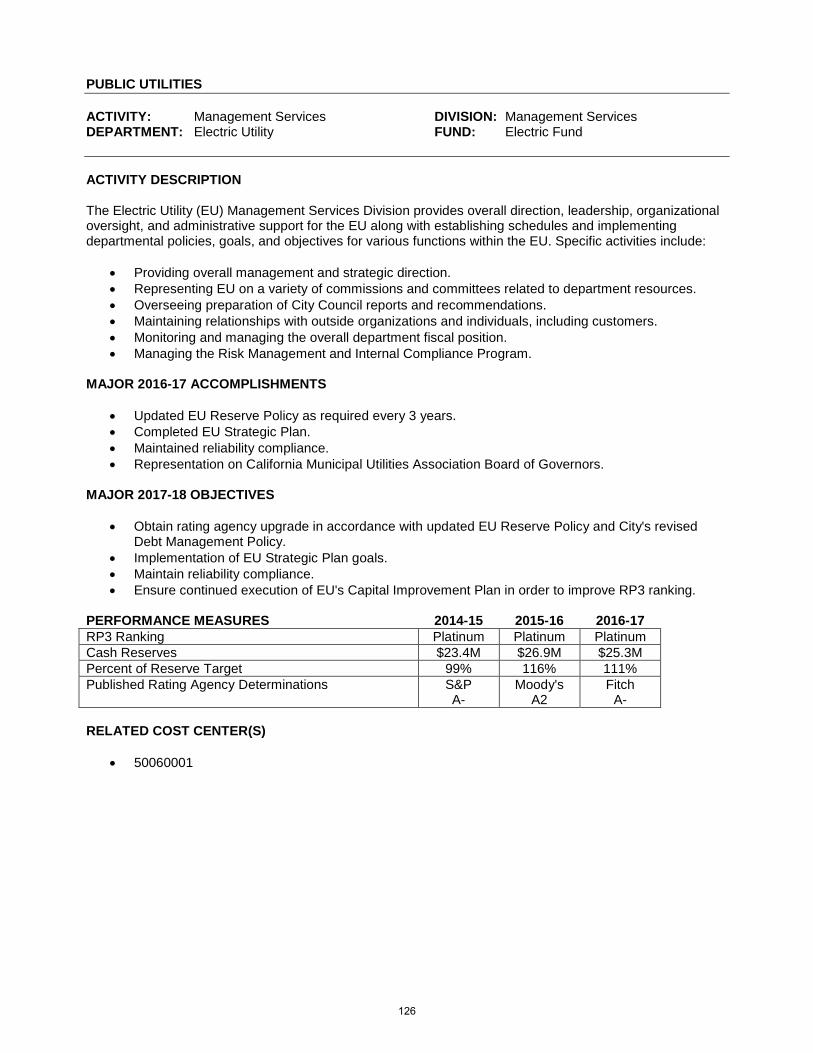
PUBLIC UTILITIES ACTIVITY: Management Services DIVISION: Management Services DEPARTMENT: Electric Utility FUND: Electric Fund ACTIVITY DESCRIPTION The Electric Utility (EU) Management Services Division provides overall direction, leadership, organizational oversight, and administrative support for the EU along with establishing schedules and implementing departmental policies, goals, and objectives for various functions within the EU. Specific activities include:
• Providing overall management and strategic direction. • Representing EU on a variety of commissions and committees related to department resources. • Overseeing preparation of City Council reports and recommendations. • Maintaining relationships with outside organizations and individuals, including customers. • Monitoring and managing the overall department fiscal position. • Managing the Risk Management and Internal Compliance Program.
MAJOR 2016-17 ACCOMPLISHMENTS
• Updated EU Reserve Policy as required every 3 years. • Completed EU Strategic Plan. • Maintained reliability compliance. • Representation on California Municipal Utilities Association Board of Governors.
MAJOR 2017-18 OBJECTIVES
• Obtain rating agency upgrade in accordance with updated EU Reserve Policy and City's revised Debt Management Policy.
• Implementation of EU Strategic Plan goals. • Maintain reliability compliance. • Ensure continued execution of EU's Capital Improvement Plan in order to improve RP3 ranking.
PERFORMANCE MEASURES 2014-15 2015-16 2016-17 RP3 Ranking Platinum Platinum Platinum Cash Reserves $23.4M $26.9M $25.3M Percent of Reserve Target 99% 116% 111% Published Rating Agency Determinations S&P
A- Moody's
A2 Fitch
A- RELATED COST CENTER(S)
• 50060001
126
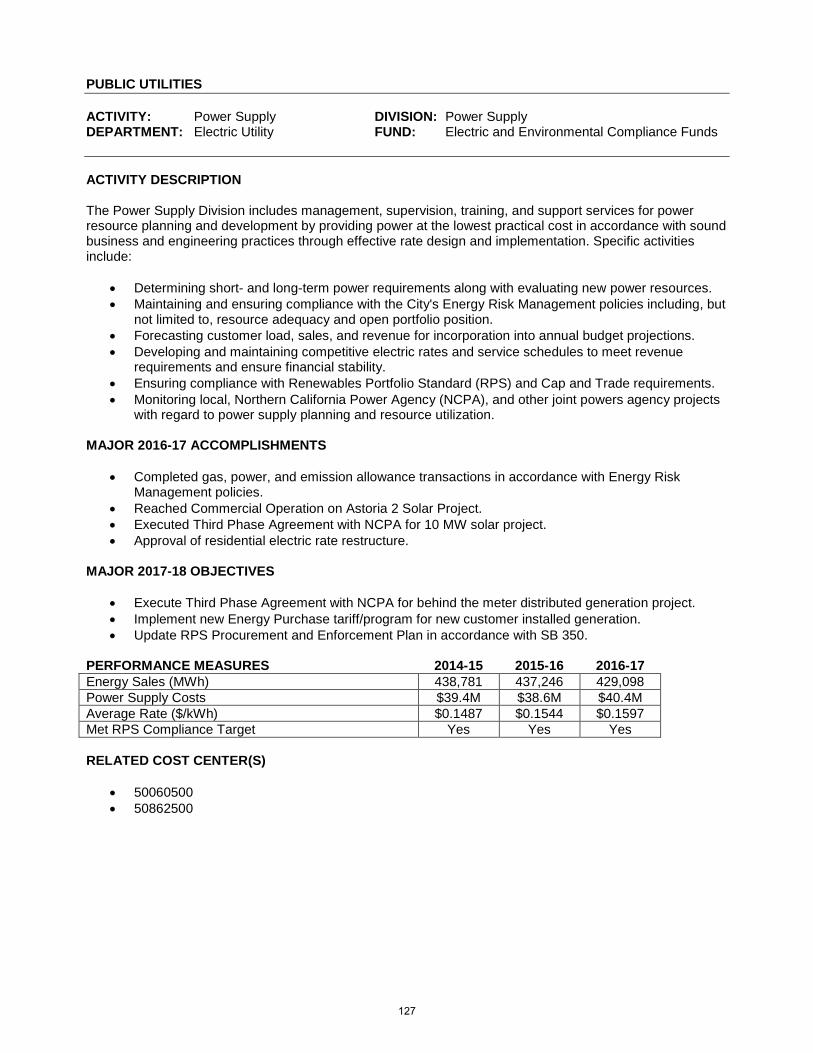
PUBLIC UTILITIES ACTIVITY: Power Supply DIVISION: Power Supply DEPARTMENT: Electric Utility FUND: Electric and Environmental Compliance Funds ACTIVITY DESCRIPTION The Power Supply Division includes management, supervision, training, and support services for power resource planning and development by providing power at the lowest practical cost in accordance with sound business and engineering practices through effective rate design and implementation. Specific activities include:
• Determining short- and long-term power requirements along with evaluating new power resources. • Maintaining and ensuring compliance with the City's Energy Risk Management policies including, but
not limited to, resource adequacy and open portfolio position. • Forecasting customer load, sales, and revenue for incorporation into annual budget projections. • Developing and maintaining competitive electric rates and service schedules to meet revenue
requirements and ensure financial stability. • Ensuring compliance with Renewables Portfolio Standard (RPS) and Cap and Trade requirements. • Monitoring local, Northern California Power Agency (NCPA), and other joint powers agency projects
with regard to power supply planning and resource utilization. MAJOR 2016-17 ACCOMPLISHMENTS
• Completed gas, power, and emission allowance transactions in accordance with Energy Risk Management policies.
• Reached Commercial Operation on Astoria 2 Solar Project. • Executed Third Phase Agreement with NCPA for 10 MW solar project. • Approval of residential electric rate restructure.
MAJOR 2017-18 OBJECTIVES
• Execute Third Phase Agreement with NCPA for behind the meter distributed generation project. • Implement new Energy Purchase tariff/program for new customer installed generation. • Update RPS Procurement and Enforcement Plan in accordance with SB 350.
PERFORMANCE MEASURES 2014-15 2015-16 2016-17 Energy Sales (MWh) 438,781 437,246 429,098 Power Supply Costs $39.4M $38.6M $40.4M Average Rate ($/kWh) $0.1487 $0.1544 $0.1597 Met RPS Compliance Target Yes Yes Yes RELATED COST CENTER(S)
• 50060500 • 50862500
127
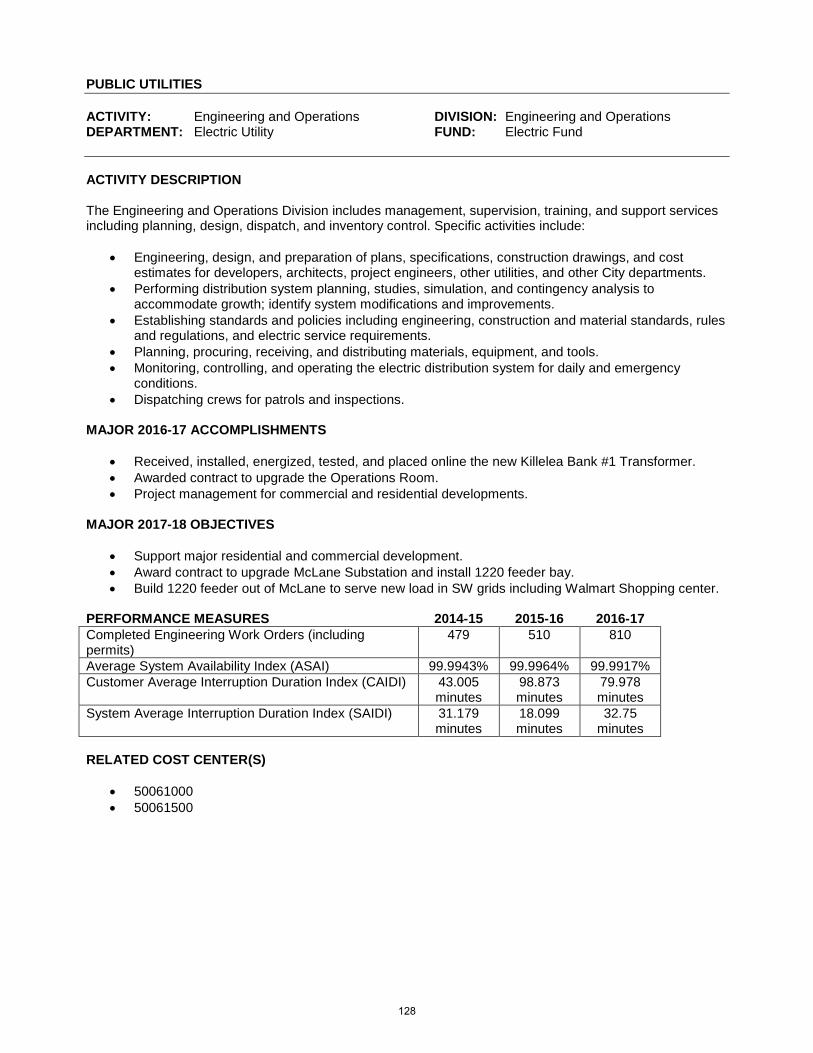
PUBLIC UTILITIES ACTIVITY: Engineering and Operations DIVISION: Engineering and Operations DEPARTMENT: Electric Utility FUND: Electric Fund ACTIVITY DESCRIPTION The Engineering and Operations Division includes management, supervision, training, and support services including planning, design, dispatch, and inventory control. Specific activities include:
• Engineering, design, and preparation of plans, specifications, construction drawings, and cost estimates for developers, architects, project engineers, other utilities, and other City departments.
• Performing distribution system planning, studies, simulation, and contingency analysis to accommodate growth; identify system modifications and improvements.
• Establishing standards and policies including engineering, construction and material standards, rules and regulations, and electric service requirements.
• Planning, procuring, receiving, and distributing materials, equipment, and tools. • Monitoring, controlling, and operating the electric distribution system for daily and emergency
conditions. • Dispatching crews for patrols and inspections.
MAJOR 2016-17 ACCOMPLISHMENTS
• Received, installed, energized, tested, and placed online the new Killelea Bank #1 Transformer. • Awarded contract to upgrade the Operations Room. • Project management for commercial and residential developments.
MAJOR 2017-18 OBJECTIVES
• Support major residential and commercial development. • Award contract to upgrade McLane Substation and install 1220 feeder bay. • Build 1220 feeder out of McLane to serve new load in SW grids including Walmart Shopping center.
PERFORMANCE MEASURES 2014-15 2015-16 2016-17 Completed Engineering Work Orders (including permits)
479 510 810
Average System Availability Index (ASAI) 99.9943% 99.9964% 99.9917% Customer Average Interruption Duration Index (CAIDI) 43.005
minutes 98.873 minutes
79.978 minutes
System Average Interruption Duration Index (SAIDI) 31.179 minutes
18.099 minutes
32.75 minutes
RELATED COST CENTER(S)
• 50061000 • 50061500
128
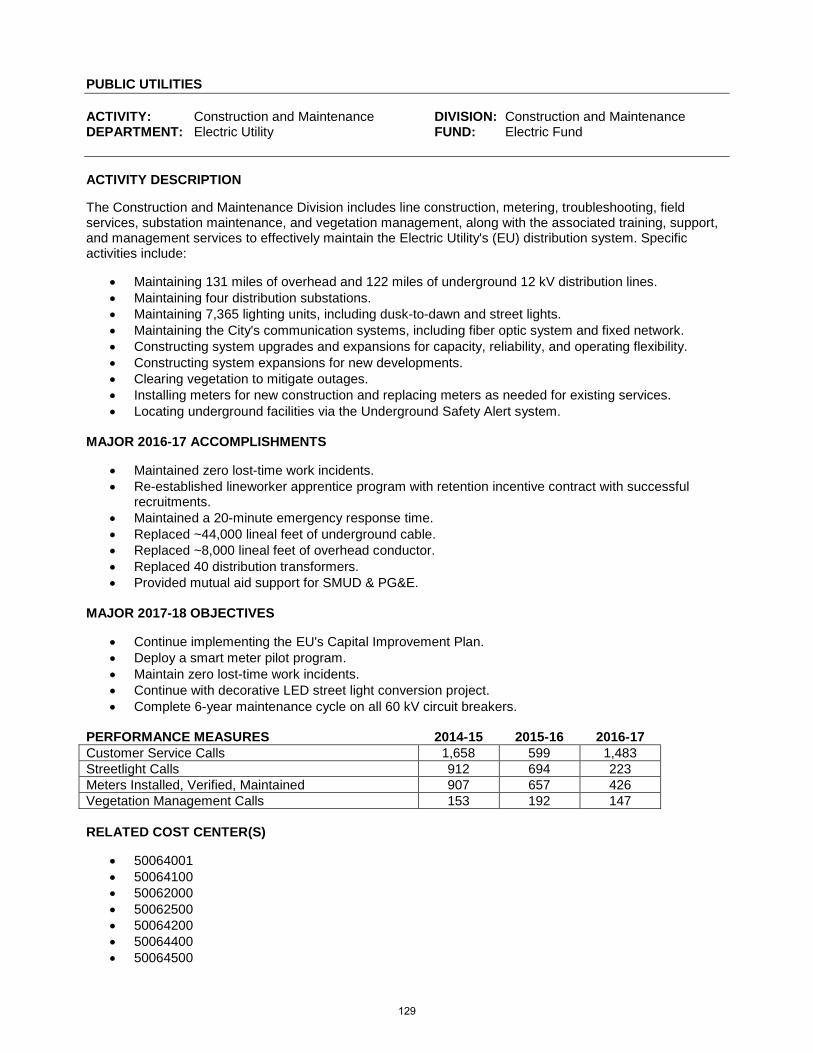
PUBLIC UTILITIES ACTIVITY: Construction and Maintenance DIVISION: Construction and Maintenance DEPARTMENT: Electric Utility FUND: Electric Fund ACTIVITY DESCRIPTION The Construction and Maintenance Division includes line construction, metering, troubleshooting, field services, substation maintenance, and vegetation management, along with the associated training, support, and management services to effectively maintain the Electric Utility's (EU) distribution system. Specific activities include:
• Maintaining 131 miles of overhead and 122 miles of underground 12 kV distribution lines. • Maintaining four distribution substations. • Maintaining 7,365 lighting units, including dusk-to-dawn and street lights. • Maintaining the City's communication systems, including fiber optic system and fixed network. • Constructing system upgrades and expansions for capacity, reliability, and operating flexibility. • Constructing system expansions for new developments. • Clearing vegetation to mitigate outages. • Installing meters for new construction and replacing meters as needed for existing services. • Locating underground facilities via the Underground Safety Alert system.
MAJOR 2016-17 ACCOMPLISHMENTS
• Maintained zero lost-time work incidents. • Re-established lineworker apprentice program with retention incentive contract with successful
recruitments. • Maintained a 20-minute emergency response time. • Replaced ~44,000 lineal feet of underground cable. • Replaced ~8,000 lineal feet of overhead conductor. • Replaced 40 distribution transformers. • Provided mutual aid support for SMUD & PG&E.
MAJOR 2017-18 OBJECTIVES
• Continue implementing the EU's Capital Improvement Plan. • Deploy a smart meter pilot program. • Maintain zero lost-time work incidents. • Continue with decorative LED street light conversion project. • Complete 6-year maintenance cycle on all 60 kV circuit breakers.
PERFORMANCE MEASURES 2014-15 2015-16 2016-17 Customer Service Calls 1,658 599 1,483 Streetlight Calls 912 694 223 Meters Installed, Verified, Maintained 907 657 426 Vegetation Management Calls 153 192 147 RELATED COST CENTER(S)
• 50064001 • 50064100 • 50062000 • 50062500 • 50064200 • 50064400 • 50064500
129
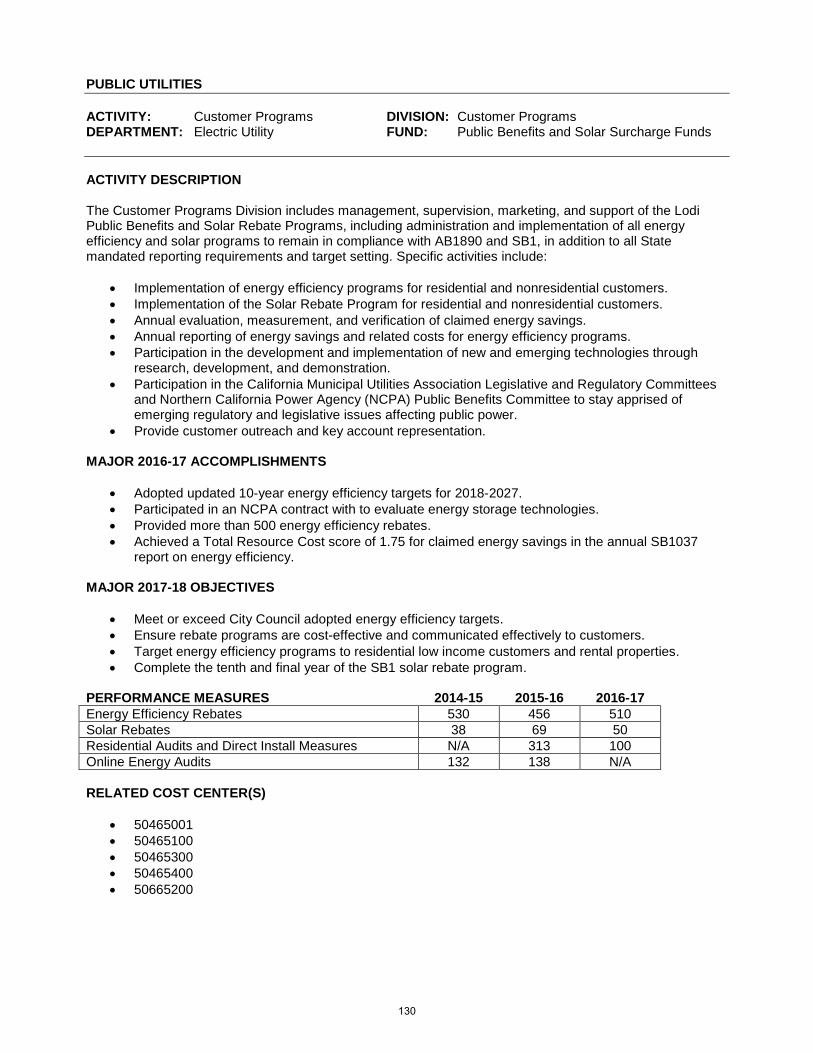
PUBLIC UTILITIES ACTIVITY: Customer Programs DIVISION: Customer Programs DEPARTMENT: Electric Utility FUND: Public Benefits and Solar Surcharge Funds ACTIVITY DESCRIPTION The Customer Programs Division includes management, supervision, marketing, and support of the Lodi Public Benefits and Solar Rebate Programs, including administration and implementation of all energy efficiency and solar programs to remain in compliance with AB1890 and SB1, in addition to all State mandated reporting requirements and target setting. Specific activities include:
• Implementation of energy efficiency programs for residential and nonresidential customers. • Implementation of the Solar Rebate Program for residential and nonresidential customers. • Annual evaluation, measurement, and verification of claimed energy savings. • Annual reporting of energy savings and related costs for energy efficiency programs. • Participation in the development and implementation of new and emerging technologies through
research, development, and demonstration. • Participation in the California Municipal Utilities Association Legislative and Regulatory Committees
and Northern California Power Agency (NCPA) Public Benefits Committee to stay apprised of emerging regulatory and legislative issues affecting public power.
• Provide customer outreach and key account representation. MAJOR 2016-17 ACCOMPLISHMENTS
• Adopted updated 10-year energy efficiency targets for 2018-2027. • Participated in an NCPA contract with to evaluate energy storage technologies. • Provided more than 500 energy efficiency rebates. • Achieved a Total Resource Cost score of 1.75 for claimed energy savings in the annual SB1037
report on energy efficiency. MAJOR 2017-18 OBJECTIVES
• Meet or exceed City Council adopted energy efficiency targets. • Ensure rebate programs are cost-effective and communicated effectively to customers. • Target energy efficiency programs to residential low income customers and rental properties. • Complete the tenth and final year of the SB1 solar rebate program.
PERFORMANCE MEASURES 2014-15 2015-16 2016-17 Energy Efficiency Rebates 530 456 510 Solar Rebates 38 69 50 Residential Audits and Direct Install Measures N/A 313 100 Online Energy Audits 132 138 N/A RELATED COST CENTER(S)
• 50465001 • 50465100 • 50465300 • 50465400 • 50665200
130
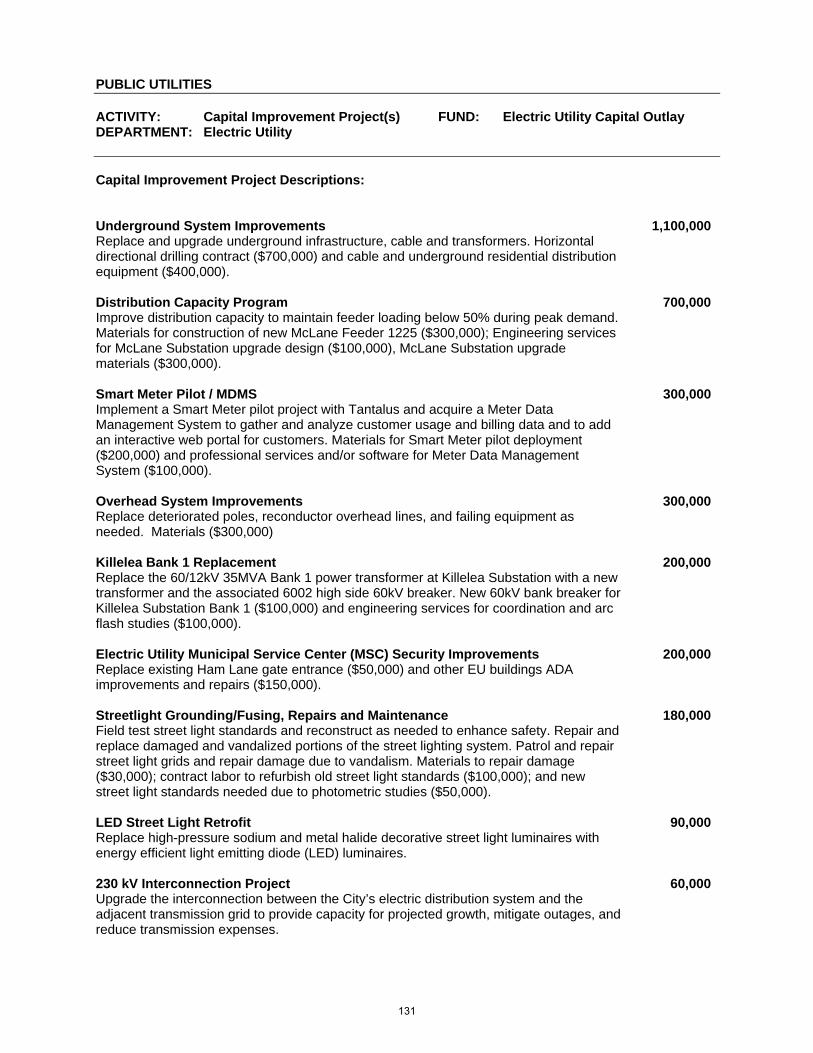
PUBLIC UTILITIES ACTIVITY: Capital Improvement Project(s) FUND: Electric Utility Capital Outlay DEPARTMENT: Electric Utility Capital Improvement Project Descriptions: Underground System Improvements 1,100,000Replace and upgrade underground infrastructure, cable and transformers. Horizontal directional drilling contract ($700,000) and cable and underground residential distribution equipment ($400,000). Distribution Capacity Program 700,000Improve distribution capacity to maintain feeder loading below 50% during peak demand. Materials for construction of new McLane Feeder 1225 ($300,000); Engineering services for McLane Substation upgrade design ($100,000), McLane Substation upgrade materials ($300,000). Smart Meter Pilot / MDMS 300,000Implement a Smart Meter pilot project with Tantalus and acquire a Meter Data Management System to gather and analyze customer usage and billing data and to add an interactive web portal for customers. Materials for Smart Meter pilot deployment ($200,000) and professional services and/or software for Meter Data Management System ($100,000). Overhead System Improvements 300,000Replace deteriorated poles, reconductor overhead lines, and failing equipment as needed. Materials ($300,000) Killelea Bank 1 Replacement 200,000Replace the 60/12kV 35MVA Bank 1 power transformer at Killelea Substation with a new transformer and the associated 6002 high side 60kV breaker. New 60kV bank breaker for Killelea Substation Bank 1 ($100,000) and engineering services for coordination and arc flash studies ($100,000). Electric Utility Municipal Service Center (MSC) Security Improvements 200,000Replace existing Ham Lane gate entrance ($50,000) and other EU buildings ADA improvements and repairs ($150,000). Streetlight Grounding/Fusing, Repairs and Maintenance 180,000Field test street light standards and reconstruct as needed to enhance safety. Repair and replace damaged and vandalized portions of the street lighting system. Patrol and repair street light grids and repair damage due to vandalism. Materials to repair damage ($30,000); contract labor to refurbish old street light standards ($100,000); and new street light standards needed due to photometric studies ($50,000). LED Street Light Retrofit 90,000Replace high-pressure sodium and metal halide decorative street light luminaires with energy efficient light emitting diode (LED) luminaires. 230 kV Interconnection Project 60,000Upgrade the interconnection between the City’s electric distribution system and the adjacent transmission grid to provide capacity for projected growth, mitigate outages, and reduce transmission expenses.
131
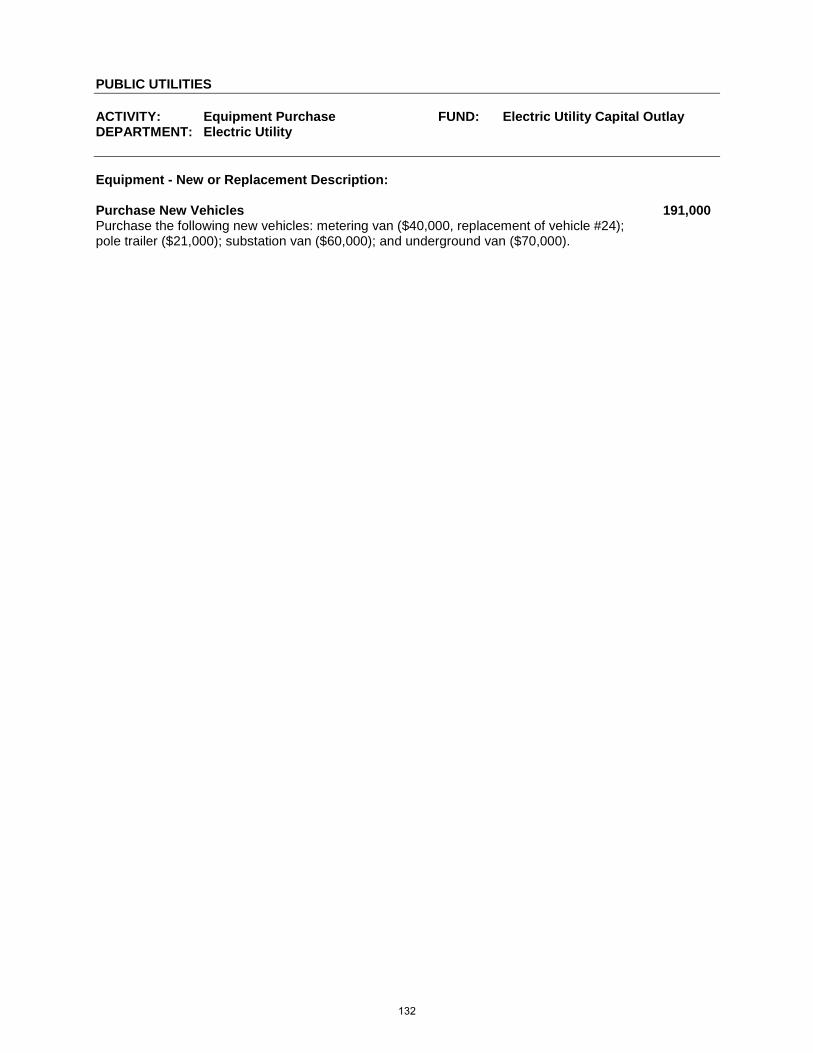
PUBLIC UTILITIES ACTIVITY: Equipment Purchase FUND: Electric Utility Capital Outlay DEPARTMENT: Electric Utility Equipment - New or Replacement Description: Purchase New Vehicles 191,000 Purchase the following new vehicles: metering van ($40,000, replacement of vehicle #24); pole trailer ($21,000); substation van ($60,000); and underground van ($70,000).
132
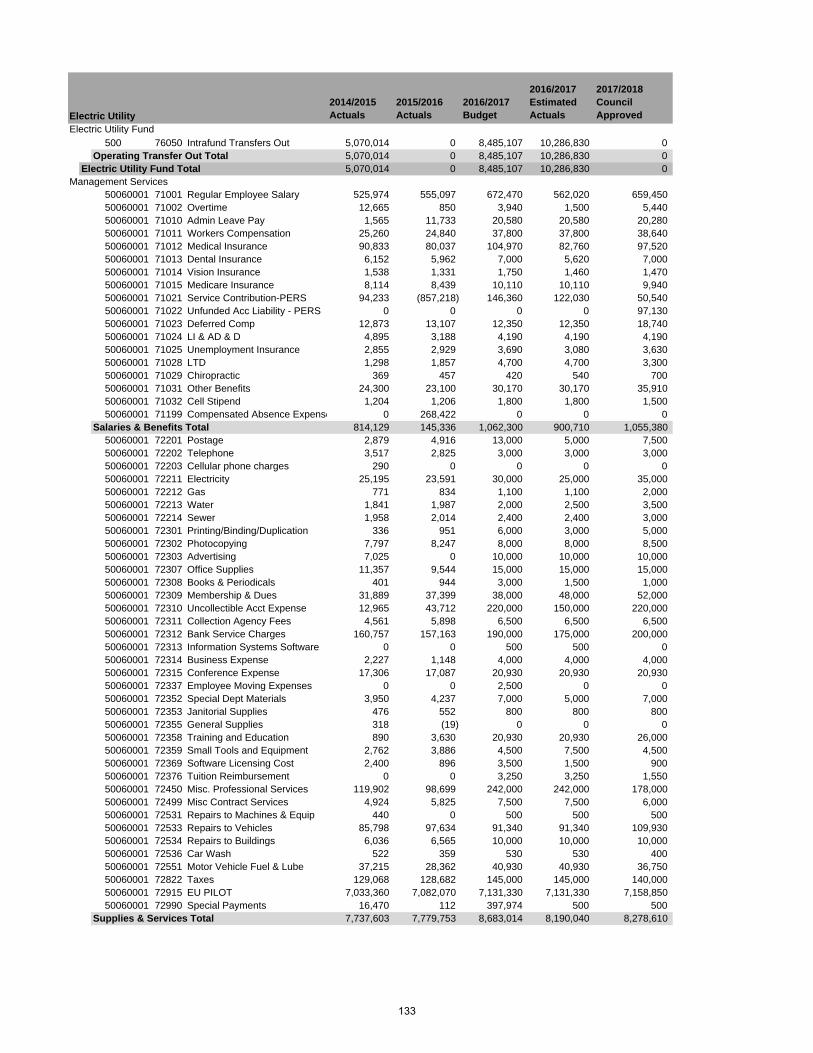
2014/2015 Actuals
2015/2016 Actuals
2016/2017 Budget
2016/2017 Estimated Actuals
2017/2018 Council Approved
Electric Utility Fund500 76050 Intrafund Transfers Out 5,070,014 0 8,485,107 10,286,830 0
Operating Transfer Out Total 5,070,014 0 8,485,107 10,286,830 0Electric Utility Fund Total 5,070,014 0 8,485,107 10,286,830 0
Management Services50060001 71001 Regular Employee Salary 525,974 555,097 672,470 562,020 659,45050060001 71002 Overtime 12,665 850 3,940 1,500 5,44050060001 71010 Admin Leave Pay 1,565 11,733 20,580 20,580 20,28050060001 71011 Workers Compensation 25,260 24,840 37,800 37,800 38,64050060001 71012 Medical Insurance 90,833 80,037 104,970 82,760 97,52050060001 71013 Dental Insurance 6,152 5,962 7,000 5,620 7,00050060001 71014 Vision Insurance 1,538 1,331 1,750 1,460 1,47050060001 71015 Medicare Insurance 8,114 8,439 10,110 10,110 9,94050060001 71021 Service Contribution-PERS 94,233 (857,218) 146,360 122,030 50,54050060001 71022 Unfunded Acc Liability - PERS 0 0 0 0 97,13050060001 71023 Deferred Comp 12,873 13,107 12,350 12,350 18,74050060001 71024 LI & AD & D 4,895 3,188 4,190 4,190 4,19050060001 71025 Unemployment Insurance 2,855 2,929 3,690 3,080 3,63050060001 71028 LTD 1,298 1,857 4,700 4,700 3,30050060001 71029 Chiropractic 369 457 420 540 70050060001 71031 Other Benefits 24,300 23,100 30,170 30,170 35,91050060001 71032 Cell Stipend 1,204 1,206 1,800 1,800 1,50050060001 71199 Compensated Absence Expense 0 268,422 0 0 0
Salaries & Benefits Total 814,129 145,336 1,062,300 900,710 1,055,38050060001 72201 Postage 2,879 4,916 13,000 5,000 7,50050060001 72202 Telephone 3,517 2,825 3,000 3,000 3,00050060001 72203 Cellular phone charges 290 0 0 0 050060001 72211 Electricity 25,195 23,591 30,000 25,000 35,00050060001 72212 Gas 771 834 1,100 1,100 2,00050060001 72213 Water 1,841 1,987 2,000 2,500 3,50050060001 72214 Sewer 1,958 2,014 2,400 2,400 3,00050060001 72301 Printing/Binding/Duplication 336 951 6,000 3,000 5,00050060001 72302 Photocopying 7,797 8,247 8,000 8,000 8,50050060001 72303 Advertising 7,025 0 10,000 10,000 10,00050060001 72307 Office Supplies 11,357 9,544 15,000 15,000 15,00050060001 72308 Books & Periodicals 401 944 3,000 1,500 1,00050060001 72309 Membership & Dues 31,889 37,399 38,000 48,000 52,00050060001 72310 Uncollectible Acct Expense 12,965 43,712 220,000 150,000 220,00050060001 72311 Collection Agency Fees 4,561 5,898 6,500 6,500 6,50050060001 72312 Bank Service Charges 160,757 157,163 190,000 175,000 200,00050060001 72313 Information Systems Software 0 0 500 500 050060001 72314 Business Expense 2,227 1,148 4,000 4,000 4,00050060001 72315 Conference Expense 17,306 17,087 20,930 20,930 20,93050060001 72337 Employee Moving Expenses 0 0 2,500 0 050060001 72352 Special Dept Materials 3,950 4,237 7,000 5,000 7,00050060001 72353 Janitorial Supplies 476 552 800 800 80050060001 72355 General Supplies 318 (19) 0 0 050060001 72358 Training and Education 890 3,630 20,930 20,930 26,00050060001 72359 Small Tools and Equipment 2,762 3,886 4,500 7,500 4,50050060001 72369 Software Licensing Cost 2,400 896 3,500 1,500 90050060001 72376 Tuition Reimbursement 0 0 3,250 3,250 1,55050060001 72450 Misc. Professional Services 119,902 98,699 242,000 242,000 178,00050060001 72499 Misc Contract Services 4,924 5,825 7,500 7,500 6,00050060001 72531 Repairs to Machines & Equip 440 0 500 500 50050060001 72533 Repairs to Vehicles 85,798 97,634 91,340 91,340 109,93050060001 72534 Repairs to Buildings 6,036 6,565 10,000 10,000 10,00050060001 72536 Car Wash 522 359 530 530 40050060001 72551 Motor Vehicle Fuel & Lube 37,215 28,362 40,930 40,930 36,75050060001 72822 Taxes 129,068 128,682 145,000 145,000 140,00050060001 72915 EU PILOT 7,033,360 7,082,070 7,131,330 7,131,330 7,158,85050060001 72990 Special Payments 16,470 112 397,974 500 500
Supplies & Services Total 7,737,603 7,779,753 8,683,014 8,190,040 8,278,610
Electric Utility
133
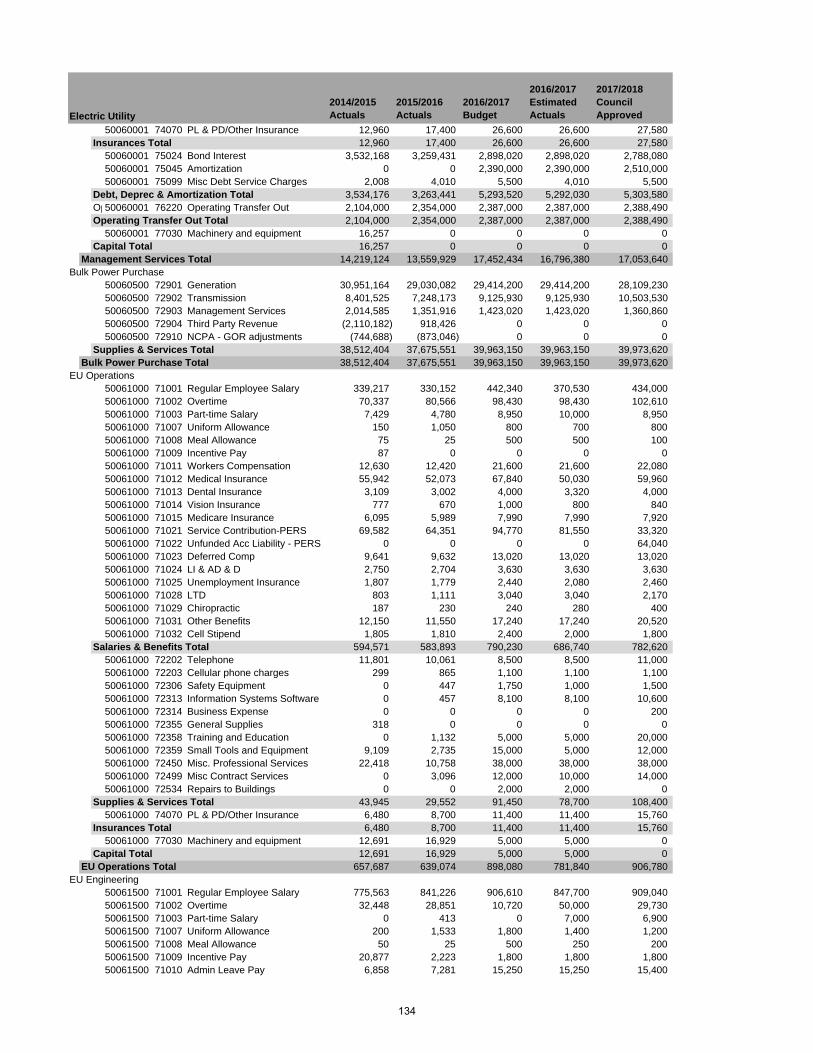
2014/2015 Actuals
2015/2016 Actuals
2016/2017 Budget
2016/2017 Estimated Actuals
2017/2018 Council ApprovedElectric Utility
50060001 74070 PL & PD/Other Insurance 12,960 17,400 26,600 26,600 27,580Insurances Total 12,960 17,400 26,600 26,600 27,580
50060001 75024 Bond Interest 3,532,168 3,259,431 2,898,020 2,898,020 2,788,08050060001 75045 Amortization 0 0 2,390,000 2,390,000 2,510,00050060001 75099 Misc Debt Service Charges 2,008 4,010 5,500 4,010 5,500
Debt, Deprec & Amortization Total 3,534,176 3,263,441 5,293,520 5,292,030 5,303,580Op50060001 76220 Operating Transfer Out 2,104,000 2,354,000 2,387,000 2,387,000 2,388,490Operating Transfer Out Total 2,104,000 2,354,000 2,387,000 2,387,000 2,388,490
50060001 77030 Machinery and equipment 16,257 0 0 0 0Capital Total 16,257 0 0 0 0
Management Services Total 14,219,124 13,559,929 17,452,434 16,796,380 17,053,640Bulk Power Purchase
50060500 72901 Generation 30,951,164 29,030,082 29,414,200 29,414,200 28,109,23050060500 72902 Transmission 8,401,525 7,248,173 9,125,930 9,125,930 10,503,53050060500 72903 Management Services 2,014,585 1,351,916 1,423,020 1,423,020 1,360,86050060500 72904 Third Party Revenue (2,110,182) 918,426 0 0 050060500 72910 NCPA - GOR adjustments (744,688) (873,046) 0 0 0
Supplies & Services Total 38,512,404 37,675,551 39,963,150 39,963,150 39,973,620Bulk Power Purchase Total 38,512,404 37,675,551 39,963,150 39,963,150 39,973,620
EU Operations50061000 71001 Regular Employee Salary 339,217 330,152 442,340 370,530 434,00050061000 71002 Overtime 70,337 80,566 98,430 98,430 102,61050061000 71003 Part-time Salary 7,429 4,780 8,950 10,000 8,95050061000 71007 Uniform Allowance 150 1,050 800 700 80050061000 71008 Meal Allowance 75 25 500 500 10050061000 71009 Incentive Pay 87 0 0 0 050061000 71011 Workers Compensation 12,630 12,420 21,600 21,600 22,08050061000 71012 Medical Insurance 55,942 52,073 67,840 50,030 59,96050061000 71013 Dental Insurance 3,109 3,002 4,000 3,320 4,00050061000 71014 Vision Insurance 777 670 1,000 800 84050061000 71015 Medicare Insurance 6,095 5,989 7,990 7,990 7,92050061000 71021 Service Contribution-PERS 69,582 64,351 94,770 81,550 33,32050061000 71022 Unfunded Acc Liability - PERS 0 0 0 0 64,04050061000 71023 Deferred Comp 9,641 9,632 13,020 13,020 13,02050061000 71024 LI & AD & D 2,750 2,704 3,630 3,630 3,63050061000 71025 Unemployment Insurance 1,807 1,779 2,440 2,080 2,46050061000 71028 LTD 803 1,111 3,040 3,040 2,17050061000 71029 Chiropractic 187 230 240 280 40050061000 71031 Other Benefits 12,150 11,550 17,240 17,240 20,52050061000 71032 Cell Stipend 1,805 1,810 2,400 2,000 1,800
Salaries & Benefits Total 594,571 583,893 790,230 686,740 782,62050061000 72202 Telephone 11,801 10,061 8,500 8,500 11,00050061000 72203 Cellular phone charges 299 865 1,100 1,100 1,10050061000 72306 Safety Equipment 0 447 1,750 1,000 1,50050061000 72313 Information Systems Software 0 457 8,100 8,100 10,60050061000 72314 Business Expense 0 0 0 0 20050061000 72355 General Supplies 318 0 0 0 050061000 72358 Training and Education 0 1,132 5,000 5,000 20,00050061000 72359 Small Tools and Equipment 9,109 2,735 15,000 5,000 12,00050061000 72450 Misc. Professional Services 22,418 10,758 38,000 38,000 38,00050061000 72499 Misc Contract Services 0 3,096 12,000 10,000 14,00050061000 72534 Repairs to Buildings 0 0 2,000 2,000 0
Supplies & Services Total 43,945 29,552 91,450 78,700 108,40050061000 74070 PL & PD/Other Insurance 6,480 8,700 11,400 11,400 15,760
Insurances Total 6,480 8,700 11,400 11,400 15,76050061000 77030 Machinery and equipment 12,691 16,929 5,000 5,000 0
Capital Total 12,691 16,929 5,000 5,000 0EU Operations Total 657,687 639,074 898,080 781,840 906,780
EU Engineering50061500 71001 Regular Employee Salary 775,563 841,226 906,610 847,700 909,04050061500 71002 Overtime 32,448 28,851 10,720 50,000 29,73050061500 71003 Part-time Salary 0 413 0 7,000 6,90050061500 71007 Uniform Allowance 200 1,533 1,800 1,400 1,20050061500 71008 Meal Allowance 50 25 500 250 20050061500 71009 Incentive Pay 20,877 2,223 1,800 1,800 1,80050061500 71010 Admin Leave Pay 6,858 7,281 15,250 15,250 15,400
134
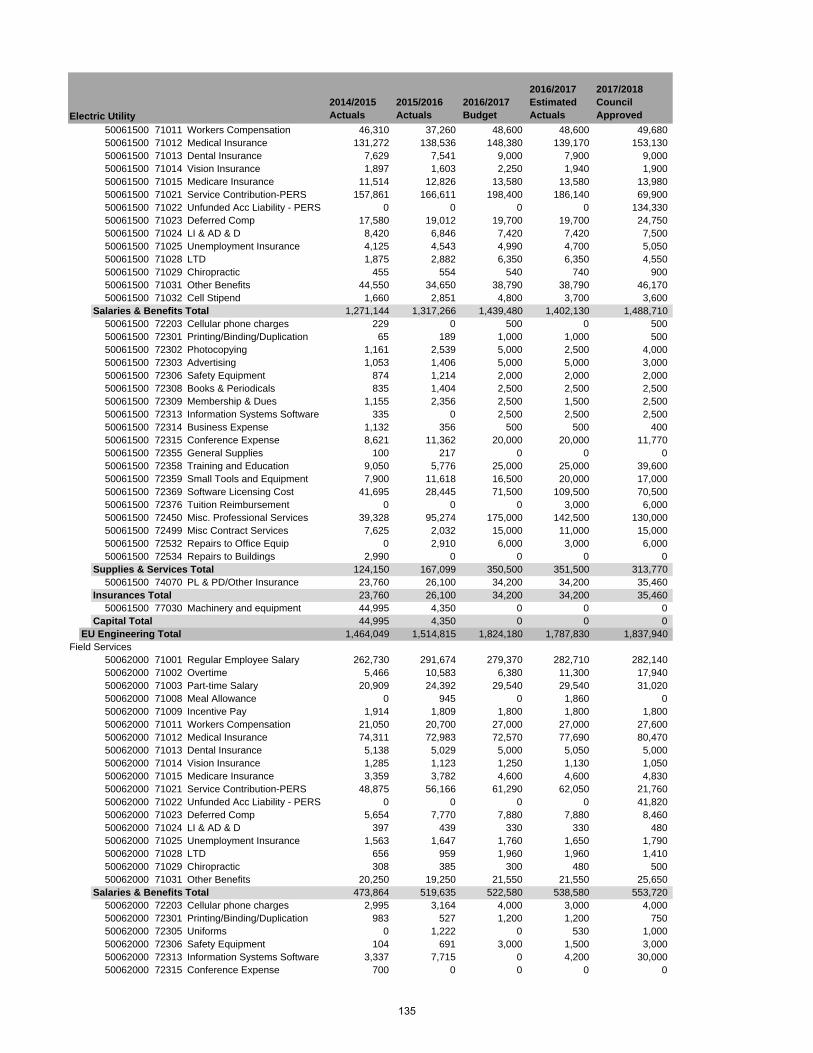
2014/2015 Actuals
2015/2016 Actuals
2016/2017 Budget
2016/2017 Estimated Actuals
2017/2018 Council ApprovedElectric Utility
50061500 71011 Workers Compensation 46,310 37,260 48,600 48,600 49,68050061500 71012 Medical Insurance 131,272 138,536 148,380 139,170 153,13050061500 71013 Dental Insurance 7,629 7,541 9,000 7,900 9,00050061500 71014 Vision Insurance 1,897 1,603 2,250 1,940 1,90050061500 71015 Medicare Insurance 11,514 12,826 13,580 13,580 13,98050061500 71021 Service Contribution-PERS 157,861 166,611 198,400 186,140 69,90050061500 71022 Unfunded Acc Liability - PERS 0 0 0 0 134,33050061500 71023 Deferred Comp 17,580 19,012 19,700 19,700 24,75050061500 71024 LI & AD & D 8,420 6,846 7,420 7,420 7,50050061500 71025 Unemployment Insurance 4,125 4,543 4,990 4,700 5,05050061500 71028 LTD 1,875 2,882 6,350 6,350 4,55050061500 71029 Chiropractic 455 554 540 740 90050061500 71031 Other Benefits 44,550 34,650 38,790 38,790 46,17050061500 71032 Cell Stipend 1,660 2,851 4,800 3,700 3,600
Salaries & Benefits Total 1,271,144 1,317,266 1,439,480 1,402,130 1,488,71050061500 72203 Cellular phone charges 229 0 500 0 50050061500 72301 Printing/Binding/Duplication 65 189 1,000 1,000 50050061500 72302 Photocopying 1,161 2,539 5,000 2,500 4,00050061500 72303 Advertising 1,053 1,406 5,000 5,000 3,00050061500 72306 Safety Equipment 874 1,214 2,000 2,000 2,00050061500 72308 Books & Periodicals 835 1,404 2,500 2,500 2,50050061500 72309 Membership & Dues 1,155 2,356 2,500 1,500 2,50050061500 72313 Information Systems Software 335 0 2,500 2,500 2,50050061500 72314 Business Expense 1,132 356 500 500 40050061500 72315 Conference Expense 8,621 11,362 20,000 20,000 11,77050061500 72355 General Supplies 100 217 0 0 050061500 72358 Training and Education 9,050 5,776 25,000 25,000 39,60050061500 72359 Small Tools and Equipment 7,900 11,618 16,500 20,000 17,00050061500 72369 Software Licensing Cost 41,695 28,445 71,500 109,500 70,50050061500 72376 Tuition Reimbursement 0 0 0 3,000 6,00050061500 72450 Misc. Professional Services 39,328 95,274 175,000 142,500 130,00050061500 72499 Misc Contract Services 7,625 2,032 15,000 11,000 15,00050061500 72532 Repairs to Office Equip 0 2,910 6,000 3,000 6,00050061500 72534 Repairs to Buildings 2,990 0 0 0 0
Supplies & Services Total 124,150 167,099 350,500 351,500 313,77050061500 74070 PL & PD/Other Insurance 23,760 26,100 34,200 34,200 35,460
Insurances Total 23,760 26,100 34,200 34,200 35,46050061500 77030 Machinery and equipment 44,995 4,350 0 0 0
Capital Total 44,995 4,350 0 0 0EU Engineering Total 1,464,049 1,514,815 1,824,180 1,787,830 1,837,940
Field Services50062000 71001 Regular Employee Salary 262,730 291,674 279,370 282,710 282,14050062000 71002 Overtime 5,466 10,583 6,380 11,300 17,94050062000 71003 Part-time Salary 20,909 24,392 29,540 29,540 31,02050062000 71008 Meal Allowance 0 945 0 1,860 050062000 71009 Incentive Pay 1,914 1,809 1,800 1,800 1,80050062000 71011 Workers Compensation 21,050 20,700 27,000 27,000 27,60050062000 71012 Medical Insurance 74,311 72,983 72,570 77,690 80,47050062000 71013 Dental Insurance 5,138 5,029 5,000 5,050 5,00050062000 71014 Vision Insurance 1,285 1,123 1,250 1,130 1,05050062000 71015 Medicare Insurance 3,359 3,782 4,600 4,600 4,83050062000 71021 Service Contribution-PERS 48,875 56,166 61,290 62,050 21,76050062000 71022 Unfunded Acc Liability - PERS 0 0 0 0 41,82050062000 71023 Deferred Comp 5,654 7,770 7,880 7,880 8,46050062000 71024 LI & AD & D 397 439 330 330 48050062000 71025 Unemployment Insurance 1,563 1,647 1,760 1,650 1,79050062000 71028 LTD 656 959 1,960 1,960 1,41050062000 71029 Chiropractic 308 385 300 480 50050062000 71031 Other Benefits 20,250 19,250 21,550 21,550 25,650
Salaries & Benefits Total 473,864 519,635 522,580 538,580 553,72050062000 72203 Cellular phone charges 2,995 3,164 4,000 3,000 4,00050062000 72301 Printing/Binding/Duplication 983 527 1,200 1,200 75050062000 72305 Uniforms 0 1,222 0 530 1,00050062000 72306 Safety Equipment 104 691 3,000 1,500 3,00050062000 72313 Information Systems Software 3,337 7,715 0 4,200 30,00050062000 72315 Conference Expense 700 0 0 0 0
135
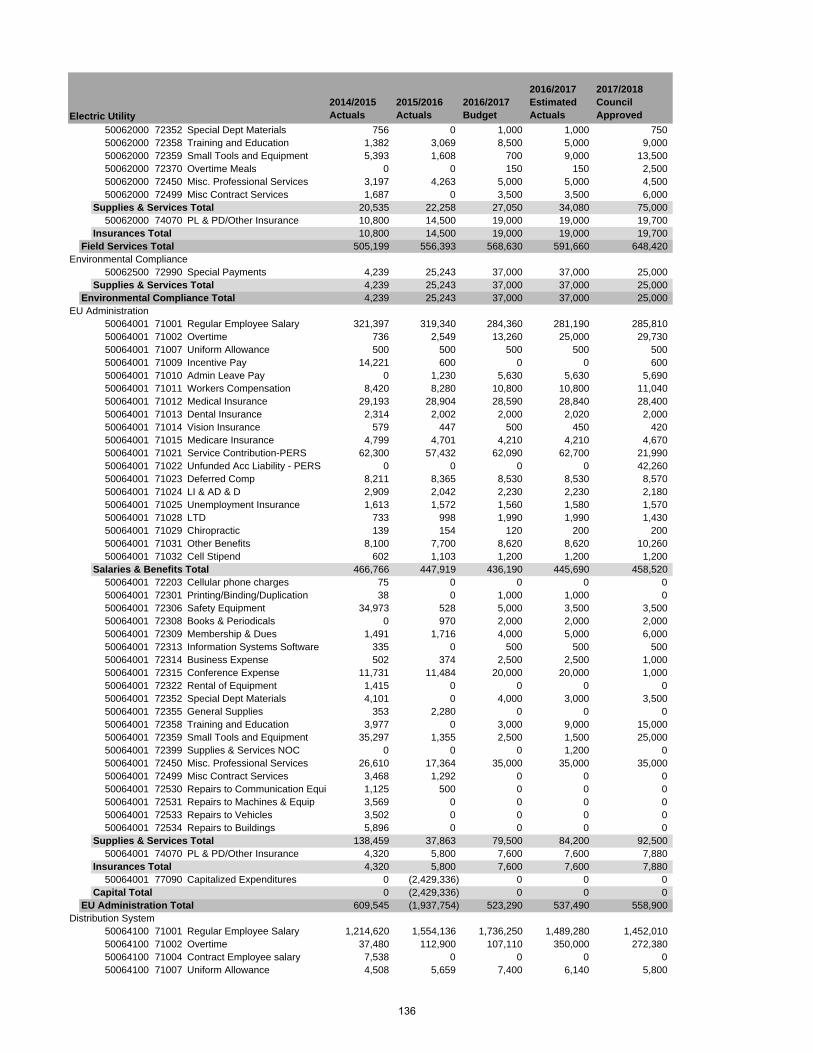
2014/2015 Actuals
2015/2016 Actuals
2016/2017 Budget
2016/2017 Estimated Actuals
2017/2018 Council ApprovedElectric Utility
50062000 72352 Special Dept Materials 756 0 1,000 1,000 75050062000 72358 Training and Education 1,382 3,069 8,500 5,000 9,00050062000 72359 Small Tools and Equipment 5,393 1,608 700 9,000 13,50050062000 72370 Overtime Meals 0 0 150 150 2,50050062000 72450 Misc. Professional Services 3,197 4,263 5,000 5,000 4,50050062000 72499 Misc Contract Services 1,687 0 3,500 3,500 6,000
Supplies & Services Total 20,535 22,258 27,050 34,080 75,00050062000 74070 PL & PD/Other Insurance 10,800 14,500 19,000 19,000 19,700
Insurances Total 10,800 14,500 19,000 19,000 19,700Field Services Total 505,199 556,393 568,630 591,660 648,420
Environmental Compliance50062500 72990 Special Payments 4,239 25,243 37,000 37,000 25,000
Supplies & Services Total 4,239 25,243 37,000 37,000 25,000Environmental Compliance Total 4,239 25,243 37,000 37,000 25,000
EU Administration50064001 71001 Regular Employee Salary 321,397 319,340 284,360 281,190 285,81050064001 71002 Overtime 736 2,549 13,260 25,000 29,73050064001 71007 Uniform Allowance 500 500 500 500 50050064001 71009 Incentive Pay 14,221 600 0 0 60050064001 71010 Admin Leave Pay 0 1,230 5,630 5,630 5,69050064001 71011 Workers Compensation 8,420 8,280 10,800 10,800 11,04050064001 71012 Medical Insurance 29,193 28,904 28,590 28,840 28,40050064001 71013 Dental Insurance 2,314 2,002 2,000 2,020 2,00050064001 71014 Vision Insurance 579 447 500 450 42050064001 71015 Medicare Insurance 4,799 4,701 4,210 4,210 4,67050064001 71021 Service Contribution-PERS 62,300 57,432 62,090 62,700 21,99050064001 71022 Unfunded Acc Liability - PERS 0 0 0 0 42,26050064001 71023 Deferred Comp 8,211 8,365 8,530 8,530 8,57050064001 71024 LI & AD & D 2,909 2,042 2,230 2,230 2,18050064001 71025 Unemployment Insurance 1,613 1,572 1,560 1,580 1,57050064001 71028 LTD 733 998 1,990 1,990 1,43050064001 71029 Chiropractic 139 154 120 200 20050064001 71031 Other Benefits 8,100 7,700 8,620 8,620 10,26050064001 71032 Cell Stipend 602 1,103 1,200 1,200 1,200
Salaries & Benefits Total 466,766 447,919 436,190 445,690 458,52050064001 72203 Cellular phone charges 75 0 0 0 050064001 72301 Printing/Binding/Duplication 38 0 1,000 1,000 050064001 72306 Safety Equipment 34,973 528 5,000 3,500 3,50050064001 72308 Books & Periodicals 0 970 2,000 2,000 2,00050064001 72309 Membership & Dues 1,491 1,716 4,000 5,000 6,00050064001 72313 Information Systems Software 335 0 500 500 50050064001 72314 Business Expense 502 374 2,500 2,500 1,00050064001 72315 Conference Expense 11,731 11,484 20,000 20,000 1,00050064001 72322 Rental of Equipment 1,415 0 0 0 050064001 72352 Special Dept Materials 4,101 0 4,000 3,000 3,50050064001 72355 General Supplies 353 2,280 0 0 050064001 72358 Training and Education 3,977 0 3,000 9,000 15,00050064001 72359 Small Tools and Equipment 35,297 1,355 2,500 1,500 25,00050064001 72399 Supplies & Services NOC 0 0 0 1,200 050064001 72450 Misc. Professional Services 26,610 17,364 35,000 35,000 35,00050064001 72499 Misc Contract Services 3,468 1,292 0 0 050064001 72530 Repairs to Communication Equi 1,125 500 0 0 050064001 72531 Repairs to Machines & Equip 3,569 0 0 0 050064001 72533 Repairs to Vehicles 3,502 0 0 0 050064001 72534 Repairs to Buildings 5,896 0 0 0 0
Supplies & Services Total 138,459 37,863 79,500 84,200 92,50050064001 74070 PL & PD/Other Insurance 4,320 5,800 7,600 7,600 7,880
Insurances Total 4,320 5,800 7,600 7,600 7,88050064001 77090 Capitalized Expenditures 0 (2,429,336) 0 0 0
Capital Total 0 (2,429,336) 0 0 0EU Administration Total 609,545 (1,937,754) 523,290 537,490 558,900
Distribution System50064100 71001 Regular Employee Salary 1,214,620 1,554,136 1,736,250 1,489,280 1,452,01050064100 71002 Overtime 37,480 112,900 107,110 350,000 272,38050064100 71004 Contract Employee salary 7,538 0 0 0 050064100 71007 Uniform Allowance 4,508 5,659 7,400 6,140 5,800
136
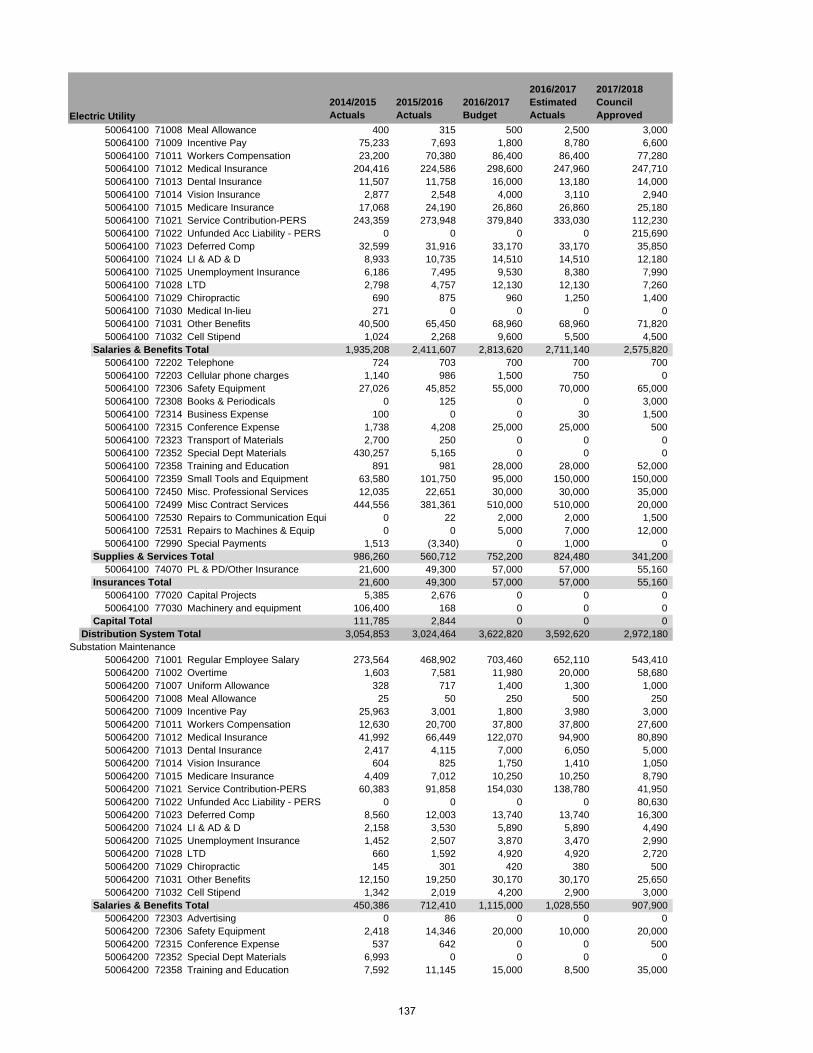
2014/2015 Actuals
2015/2016 Actuals
2016/2017 Budget
2016/2017 Estimated Actuals
2017/2018 Council ApprovedElectric Utility
50064100 71008 Meal Allowance 400 315 500 2,500 3,00050064100 71009 Incentive Pay 75,233 7,693 1,800 8,780 6,60050064100 71011 Workers Compensation 23,200 70,380 86,400 86,400 77,28050064100 71012 Medical Insurance 204,416 224,586 298,600 247,960 247,71050064100 71013 Dental Insurance 11,507 11,758 16,000 13,180 14,00050064100 71014 Vision Insurance 2,877 2,548 4,000 3,110 2,94050064100 71015 Medicare Insurance 17,068 24,190 26,860 26,860 25,18050064100 71021 Service Contribution-PERS 243,359 273,948 379,840 333,030 112,23050064100 71022 Unfunded Acc Liability - PERS 0 0 0 0 215,69050064100 71023 Deferred Comp 32,599 31,916 33,170 33,170 35,85050064100 71024 LI & AD & D 8,933 10,735 14,510 14,510 12,18050064100 71025 Unemployment Insurance 6,186 7,495 9,530 8,380 7,99050064100 71028 LTD 2,798 4,757 12,130 12,130 7,26050064100 71029 Chiropractic 690 875 960 1,250 1,40050064100 71030 Medical In-lieu 271 0 0 0 050064100 71031 Other Benefits 40,500 65,450 68,960 68,960 71,82050064100 71032 Cell Stipend 1,024 2,268 9,600 5,500 4,500
Salaries & Benefits Total 1,935,208 2,411,607 2,813,620 2,711,140 2,575,82050064100 72202 Telephone 724 703 700 700 70050064100 72203 Cellular phone charges 1,140 986 1,500 750 050064100 72306 Safety Equipment 27,026 45,852 55,000 70,000 65,00050064100 72308 Books & Periodicals 0 125 0 0 3,00050064100 72314 Business Expense 100 0 0 30 1,50050064100 72315 Conference Expense 1,738 4,208 25,000 25,000 50050064100 72323 Transport of Materials 2,700 250 0 0 050064100 72352 Special Dept Materials 430,257 5,165 0 0 050064100 72358 Training and Education 891 981 28,000 28,000 52,00050064100 72359 Small Tools and Equipment 63,580 101,750 95,000 150,000 150,00050064100 72450 Misc. Professional Services 12,035 22,651 30,000 30,000 35,00050064100 72499 Misc Contract Services 444,556 381,361 510,000 510,000 20,00050064100 72530 Repairs to Communication Equi 0 22 2,000 2,000 1,50050064100 72531 Repairs to Machines & Equip 0 0 5,000 7,000 12,00050064100 72990 Special Payments 1,513 (3,340) 0 1,000 0
Supplies & Services Total 986,260 560,712 752,200 824,480 341,20050064100 74070 PL & PD/Other Insurance 21,600 49,300 57,000 57,000 55,160
Insurances Total 21,600 49,300 57,000 57,000 55,16050064100 77020 Capital Projects 5,385 2,676 0 0 050064100 77030 Machinery and equipment 106,400 168 0 0 0
Capital Total 111,785 2,844 0 0 0Distribution System Total 3,054,853 3,024,464 3,622,820 3,592,620 2,972,180
Substation Maintenance50064200 71001 Regular Employee Salary 273,564 468,902 703,460 652,110 543,41050064200 71002 Overtime 1,603 7,581 11,980 20,000 58,68050064200 71007 Uniform Allowance 328 717 1,400 1,300 1,00050064200 71008 Meal Allowance 25 50 250 500 25050064200 71009 Incentive Pay 25,963 3,001 1,800 3,980 3,00050064200 71011 Workers Compensation 12,630 20,700 37,800 37,800 27,60050064200 71012 Medical Insurance 41,992 66,449 122,070 94,900 80,89050064200 71013 Dental Insurance 2,417 4,115 7,000 6,050 5,00050064200 71014 Vision Insurance 604 825 1,750 1,410 1,05050064200 71015 Medicare Insurance 4,409 7,012 10,250 10,250 8,79050064200 71021 Service Contribution-PERS 60,383 91,858 154,030 138,780 41,95050064200 71022 Unfunded Acc Liability - PERS 0 0 0 0 80,63050064200 71023 Deferred Comp 8,560 12,003 13,740 13,740 16,30050064200 71024 LI & AD & D 2,158 3,530 5,890 5,890 4,49050064200 71025 Unemployment Insurance 1,452 2,507 3,870 3,470 2,99050064200 71028 LTD 660 1,592 4,920 4,920 2,72050064200 71029 Chiropractic 145 301 420 380 50050064200 71031 Other Benefits 12,150 19,250 30,170 30,170 25,65050064200 71032 Cell Stipend 1,342 2,019 4,200 2,900 3,000
Salaries & Benefits Total 450,386 712,410 1,115,000 1,028,550 907,90050064200 72303 Advertising 0 86 0 0 050064200 72306 Safety Equipment 2,418 14,346 20,000 10,000 20,00050064200 72315 Conference Expense 537 642 0 0 50050064200 72352 Special Dept Materials 6,993 0 0 0 050064200 72358 Training and Education 7,592 11,145 15,000 8,500 35,000
137
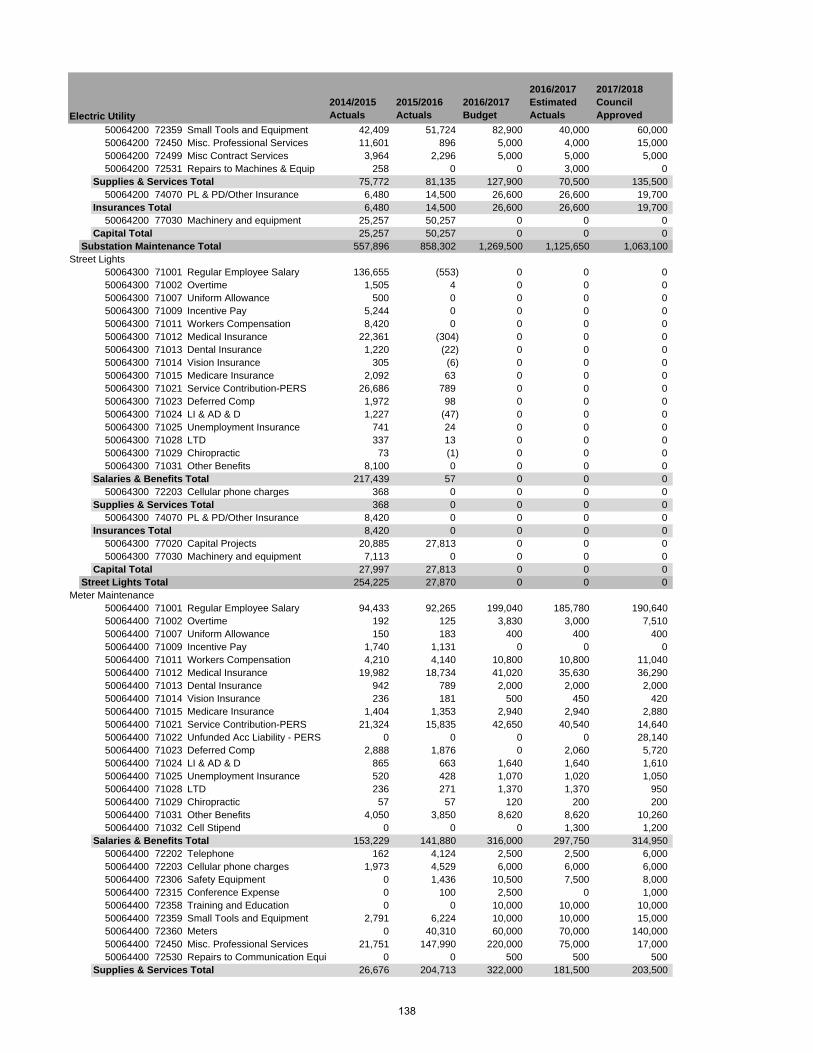
2014/2015 Actuals
2015/2016 Actuals
2016/2017 Budget
2016/2017 Estimated Actuals
2017/2018 Council ApprovedElectric Utility
50064200 72359 Small Tools and Equipment 42,409 51,724 82,900 40,000 60,00050064200 72450 Misc. Professional Services 11,601 896 5,000 4,000 15,00050064200 72499 Misc Contract Services 3,964 2,296 5,000 5,000 5,00050064200 72531 Repairs to Machines & Equip 258 0 0 3,000 0
Supplies & Services Total 75,772 81,135 127,900 70,500 135,50050064200 74070 PL & PD/Other Insurance 6,480 14,500 26,600 26,600 19,700
Insurances Total 6,480 14,500 26,600 26,600 19,70050064200 77030 Machinery and equipment 25,257 50,257 0 0 0
Capital Total 25,257 50,257 0 0 0Substation Maintenance Total 557,896 858,302 1,269,500 1,125,650 1,063,100
Street Lights50064300 71001 Regular Employee Salary 136,655 (553) 0 0 050064300 71002 Overtime 1,505 4 0 0 050064300 71007 Uniform Allowance 500 0 0 0 050064300 71009 Incentive Pay 5,244 0 0 0 050064300 71011 Workers Compensation 8,420 0 0 0 050064300 71012 Medical Insurance 22,361 (304) 0 0 050064300 71013 Dental Insurance 1,220 (22) 0 0 050064300 71014 Vision Insurance 305 (6) 0 0 050064300 71015 Medicare Insurance 2,092 63 0 0 050064300 71021 Service Contribution-PERS 26,686 789 0 0 050064300 71023 Deferred Comp 1,972 98 0 0 050064300 71024 LI & AD & D 1,227 (47) 0 0 050064300 71025 Unemployment Insurance 741 24 0 0 050064300 71028 LTD 337 13 0 0 050064300 71029 Chiropractic 73 (1) 0 0 050064300 71031 Other Benefits 8,100 0 0 0 0
Salaries & Benefits Total 217,439 57 0 0 050064300 72203 Cellular phone charges 368 0 0 0 0
Supplies & Services Total 368 0 0 0 050064300 74070 PL & PD/Other Insurance 8,420 0 0 0 0
Insurances Total 8,420 0 0 0 050064300 77020 Capital Projects 20,885 27,813 0 0 050064300 77030 Machinery and equipment 7,113 0 0 0 0
Capital Total 27,997 27,813 0 0 0Street Lights Total 254,225 27,870 0 0 0
Meter Maintenance50064400 71001 Regular Employee Salary 94,433 92,265 199,040 185,780 190,64050064400 71002 Overtime 192 125 3,830 3,000 7,51050064400 71007 Uniform Allowance 150 183 400 400 40050064400 71009 Incentive Pay 1,740 1,131 0 0 050064400 71011 Workers Compensation 4,210 4,140 10,800 10,800 11,04050064400 71012 Medical Insurance 19,982 18,734 41,020 35,630 36,29050064400 71013 Dental Insurance 942 789 2,000 2,000 2,00050064400 71014 Vision Insurance 236 181 500 450 42050064400 71015 Medicare Insurance 1,404 1,353 2,940 2,940 2,88050064400 71021 Service Contribution-PERS 21,324 15,835 42,650 40,540 14,64050064400 71022 Unfunded Acc Liability - PERS 0 0 0 0 28,14050064400 71023 Deferred Comp 2,888 1,876 0 2,060 5,72050064400 71024 LI & AD & D 865 663 1,640 1,640 1,61050064400 71025 Unemployment Insurance 520 428 1,070 1,020 1,05050064400 71028 LTD 236 271 1,370 1,370 95050064400 71029 Chiropractic 57 57 120 200 20050064400 71031 Other Benefits 4,050 3,850 8,620 8,620 10,26050064400 71032 Cell Stipend 0 0 0 1,300 1,200
Salaries & Benefits Total 153,229 141,880 316,000 297,750 314,95050064400 72202 Telephone 162 4,124 2,500 2,500 6,00050064400 72203 Cellular phone charges 1,973 4,529 6,000 6,000 6,00050064400 72306 Safety Equipment 0 1,436 10,500 7,500 8,00050064400 72315 Conference Expense 0 100 2,500 0 1,00050064400 72358 Training and Education 0 0 10,000 10,000 10,00050064400 72359 Small Tools and Equipment 2,791 6,224 10,000 10,000 15,00050064400 72360 Meters 0 40,310 60,000 70,000 140,00050064400 72450 Misc. Professional Services 21,751 147,990 220,000 75,000 17,00050064400 72530 Repairs to Communication Equi 0 0 500 500 500
Supplies & Services Total 26,676 204,713 322,000 181,500 203,500
138
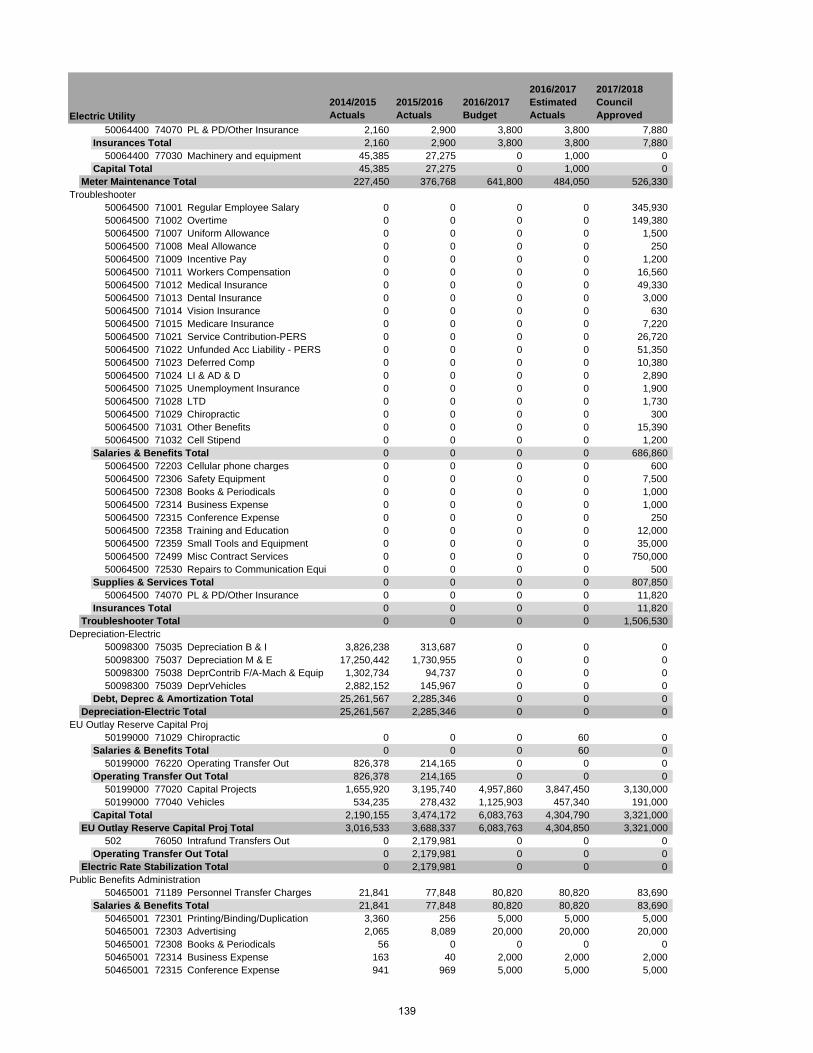
2014/2015 Actuals
2015/2016 Actuals
2016/2017 Budget
2016/2017 Estimated Actuals
2017/2018 Council ApprovedElectric Utility
50064400 74070 PL & PD/Other Insurance 2,160 2,900 3,800 3,800 7,880Insurances Total 2,160 2,900 3,800 3,800 7,880
50064400 77030 Machinery and equipment 45,385 27,275 0 1,000 0Capital Total 45,385 27,275 0 1,000 0
Meter Maintenance Total 227,450 376,768 641,800 484,050 526,330Troubleshooter
50064500 71001 Regular Employee Salary 0 0 0 0 345,93050064500 71002 Overtime 0 0 0 0 149,38050064500 71007 Uniform Allowance 0 0 0 0 1,50050064500 71008 Meal Allowance 0 0 0 0 25050064500 71009 Incentive Pay 0 0 0 0 1,20050064500 71011 Workers Compensation 0 0 0 0 16,56050064500 71012 Medical Insurance 0 0 0 0 49,33050064500 71013 Dental Insurance 0 0 0 0 3,00050064500 71014 Vision Insurance 0 0 0 0 63050064500 71015 Medicare Insurance 0 0 0 0 7,22050064500 71021 Service Contribution-PERS 0 0 0 0 26,72050064500 71022 Unfunded Acc Liability - PERS 0 0 0 0 51,35050064500 71023 Deferred Comp 0 0 0 0 10,38050064500 71024 LI & AD & D 0 0 0 0 2,89050064500 71025 Unemployment Insurance 0 0 0 0 1,90050064500 71028 LTD 0 0 0 0 1,73050064500 71029 Chiropractic 0 0 0 0 30050064500 71031 Other Benefits 0 0 0 0 15,39050064500 71032 Cell Stipend 0 0 0 0 1,200
Salaries & Benefits Total 0 0 0 0 686,86050064500 72203 Cellular phone charges 0 0 0 0 60050064500 72306 Safety Equipment 0 0 0 0 7,50050064500 72308 Books & Periodicals 0 0 0 0 1,00050064500 72314 Business Expense 0 0 0 0 1,00050064500 72315 Conference Expense 0 0 0 0 25050064500 72358 Training and Education 0 0 0 0 12,00050064500 72359 Small Tools and Equipment 0 0 0 0 35,00050064500 72499 Misc Contract Services 0 0 0 0 750,00050064500 72530 Repairs to Communication Equi 0 0 0 0 500
Supplies & Services Total 0 0 0 0 807,85050064500 74070 PL & PD/Other Insurance 0 0 0 0 11,820
Insurances Total 0 0 0 0 11,820Troubleshooter Total 0 0 0 0 1,506,530
Depreciation-Electric50098300 75035 Depreciation B & I 3,826,238 313,687 0 0 050098300 75037 Depreciation M & E 17,250,442 1,730,955 0 0 050098300 75038 DeprContrib F/A-Mach & Equip 1,302,734 94,737 0 0 050098300 75039 DeprVehicles 2,882,152 145,967 0 0 0
Debt, Deprec & Amortization Total 25,261,567 2,285,346 0 0 0Depreciation-Electric Total 25,261,567 2,285,346 0 0 0
EU Outlay Reserve Capital Proj50199000 71029 Chiropractic 0 0 0 60 0
Salaries & Benefits Total 0 0 0 60 050199000 76220 Operating Transfer Out 826,378 214,165 0 0 0
Operating Transfer Out Total 826,378 214,165 0 0 050199000 77020 Capital Projects 1,655,920 3,195,740 4,957,860 3,847,450 3,130,00050199000 77040 Vehicles 534,235 278,432 1,125,903 457,340 191,000
Capital Total 2,190,155 3,474,172 6,083,763 4,304,790 3,321,000EU Outlay Reserve Capital Proj Total 3,016,533 3,688,337 6,083,763 4,304,850 3,321,000
502 76050 Intrafund Transfers Out 0 2,179,981 0 0 0Operating Transfer Out Total 0 2,179,981 0 0 0
Electric Rate Stabilization Total 0 2,179,981 0 0 0Public Benefits Administration
50465001 71189 Personnel Transfer Charges 21,841 77,848 80,820 80,820 83,690Salaries & Benefits Total 21,841 77,848 80,820 80,820 83,690
50465001 72301 Printing/Binding/Duplication 3,360 256 5,000 5,000 5,00050465001 72303 Advertising 2,065 8,089 20,000 20,000 20,00050465001 72308 Books & Periodicals 56 0 0 0 050465001 72314 Business Expense 163 40 2,000 2,000 2,00050465001 72315 Conference Expense 941 969 5,000 5,000 5,000
139
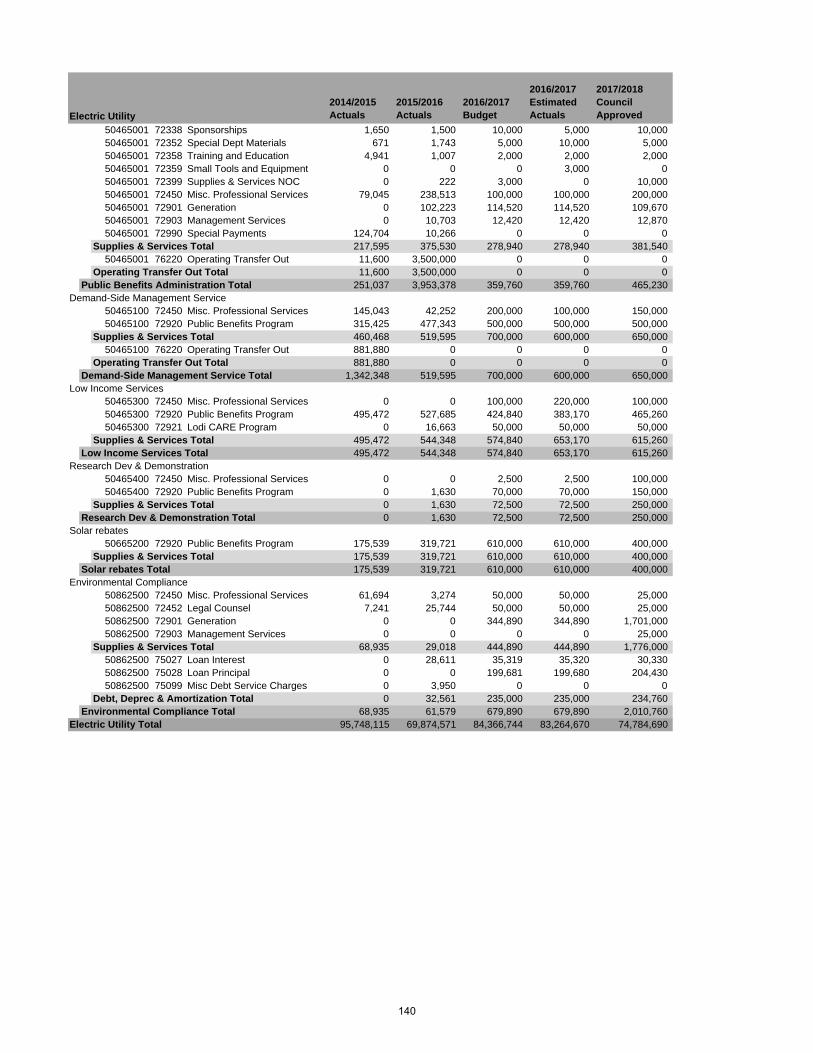
2014/2015 Actuals
2015/2016 Actuals
2016/2017 Budget
2016/2017 Estimated Actuals
2017/2018 Council ApprovedElectric Utility
50465001 72338 Sponsorships 1,650 1,500 10,000 5,000 10,00050465001 72352 Special Dept Materials 671 1,743 5,000 10,000 5,00050465001 72358 Training and Education 4,941 1,007 2,000 2,000 2,00050465001 72359 Small Tools and Equipment 0 0 0 3,000 050465001 72399 Supplies & Services NOC 0 222 3,000 0 10,00050465001 72450 Misc. Professional Services 79,045 238,513 100,000 100,000 200,00050465001 72901 Generation 0 102,223 114,520 114,520 109,67050465001 72903 Management Services 0 10,703 12,420 12,420 12,87050465001 72990 Special Payments 124,704 10,266 0 0 0
Supplies & Services Total 217,595 375,530 278,940 278,940 381,54050465001 76220 Operating Transfer Out 11,600 3,500,000 0 0 0
Operating Transfer Out Total 11,600 3,500,000 0 0 0Public Benefits Administration Total 251,037 3,953,378 359,760 359,760 465,230
Demand-Side Management Service50465100 72450 Misc. Professional Services 145,043 42,252 200,000 100,000 150,00050465100 72920 Public Benefits Program 315,425 477,343 500,000 500,000 500,000
Supplies & Services Total 460,468 519,595 700,000 600,000 650,00050465100 76220 Operating Transfer Out 881,880 0 0 0 0
Operating Transfer Out Total 881,880 0 0 0 0Demand-Side Management Service Total 1,342,348 519,595 700,000 600,000 650,000
Low Income Services50465300 72450 Misc. Professional Services 0 0 100,000 220,000 100,00050465300 72920 Public Benefits Program 495,472 527,685 424,840 383,170 465,26050465300 72921 Lodi CARE Program 0 16,663 50,000 50,000 50,000
Supplies & Services Total 495,472 544,348 574,840 653,170 615,260Low Income Services Total 495,472 544,348 574,840 653,170 615,260
Research Dev & Demonstration50465400 72450 Misc. Professional Services 0 0 2,500 2,500 100,00050465400 72920 Public Benefits Program 0 1,630 70,000 70,000 150,000
Supplies & Services Total 0 1,630 72,500 72,500 250,000Research Dev & Demonstration Total 0 1,630 72,500 72,500 250,000
Solar rebates50665200 72920 Public Benefits Program 175,539 319,721 610,000 610,000 400,000
Supplies & Services Total 175,539 319,721 610,000 610,000 400,000Solar rebates Total 175,539 319,721 610,000 610,000 400,000
Environmental Compliance50862500 72450 Misc. Professional Services 61,694 3,274 50,000 50,000 25,00050862500 72452 Legal Counsel 7,241 25,744 50,000 50,000 25,00050862500 72901 Generation 0 0 344,890 344,890 1,701,00050862500 72903 Management Services 0 0 0 0 25,000
Supplies & Services Total 68,935 29,018 444,890 444,890 1,776,00050862500 75027 Loan Interest 0 28,611 35,319 35,320 30,33050862500 75028 Loan Principal 0 0 199,681 199,680 204,43050862500 75099 Misc Debt Service Charges 0 3,950 0 0 0
Debt, Deprec & Amortization Total 0 32,561 235,000 235,000 234,760Environmental Compliance Total 68,935 61,579 679,890 679,890 2,010,760
Electric Utility Total 95,748,115 69,874,571 84,366,744 83,264,670 74,784,690
140
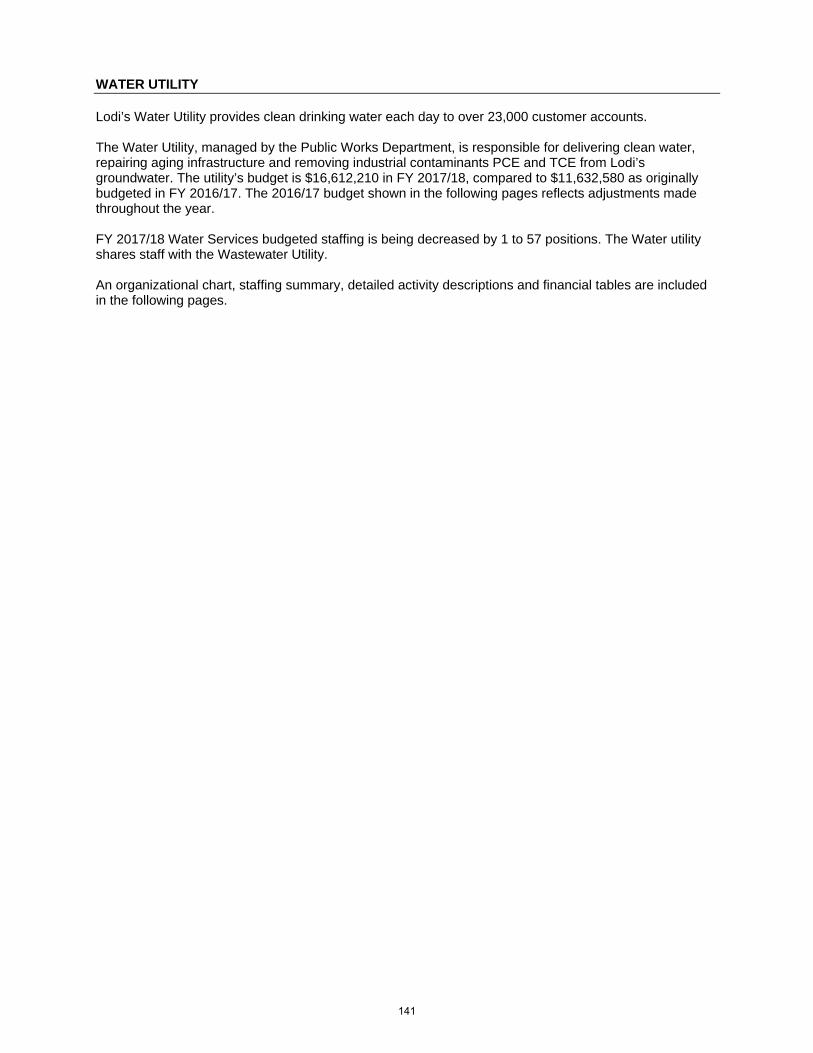
WATER UTILITY Lodi’s Water Utility provides clean drinking water each day to over 23,000 customer accounts. The Water Utility, managed by the Public Works Department, is responsible for delivering clean water, repairing aging infrastructure and removing industrial contaminants PCE and TCE from Lodi’s groundwater. The utility’s budget is $16,612,210 in FY 2017/18, compared to $11,632,580 as originally budgeted in FY 2016/17. The 2016/17 budget shown in the following pages reflects adjustments made throughout the year. FY 2017/18 Water Services budgeted staffing is being decreased by 1 to 57 positions. The Water utility shares staff with the Wastewater Utility. An organizational chart, staffing summary, detailed activity descriptions and financial tables are included in the following pages.
141

(This page intentionally left blank)
142
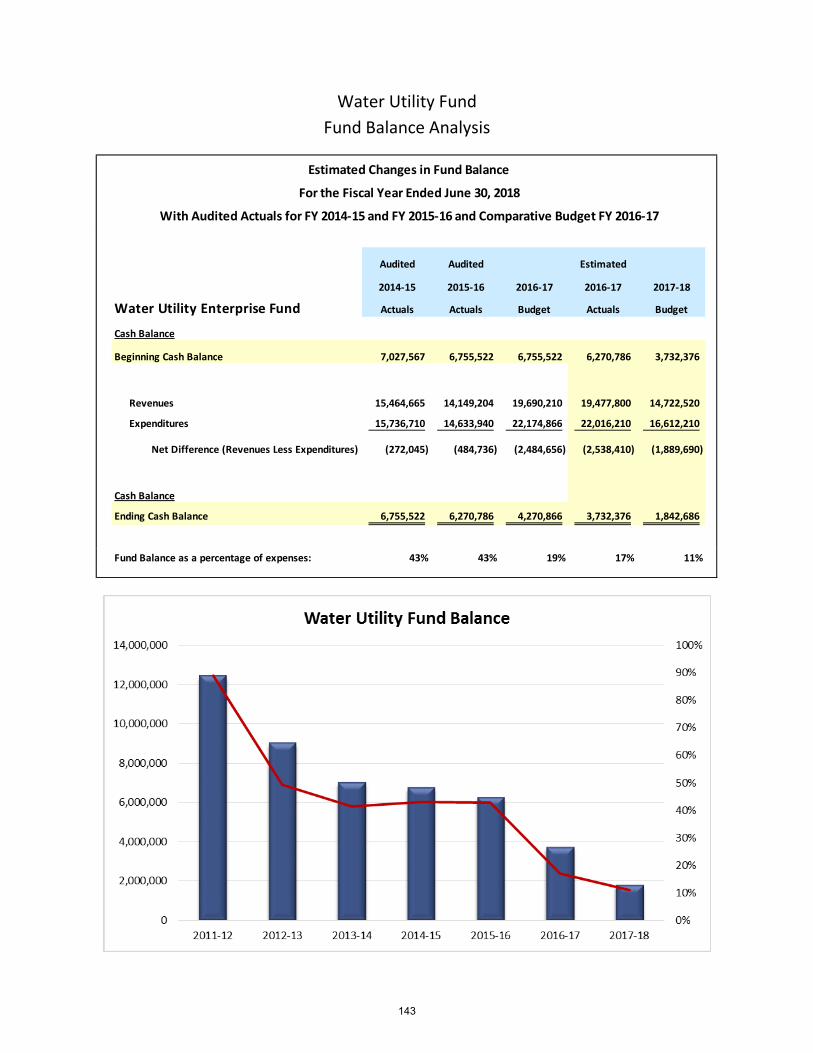
Water Utility Fund Fund Balance Analysis
Audited Audited Estimated
2014-15 2015-16 2016-17 2016-17 2017-18
Water Utility Enterprise Fund Actuals Actuals Budget Actuals Budget
Cash Balance
Beginning Cash Balance 7,027,567 6,755,522 6,755,522 6,270,786 3,732,376
Revenues 15,464,665 14,149,204 19,690,210 19,477,800 14,722,520
Expenditures 15,736,710 14,633,940 22,174,866 22,016,210 16,612,210
Net Difference (Revenues Less Expenditures) (272,045) (484,736) (2,484,656) (2,538,410) (1,889,690)
Cash Balance
Ending Cash Balance 6,755,522 6,270,786 4,270,866 3,732,376 1,842,686
Fund Balance as a percentage of expenses: 43% 43% 19% 17% 11%
Estimated Changes in Fund Balance
For the Fiscal Year Ended June 30, 2018
With Audited Actuals for FY 2014-15 and FY 2015-16 and Comparative Budget FY 2016-17
143
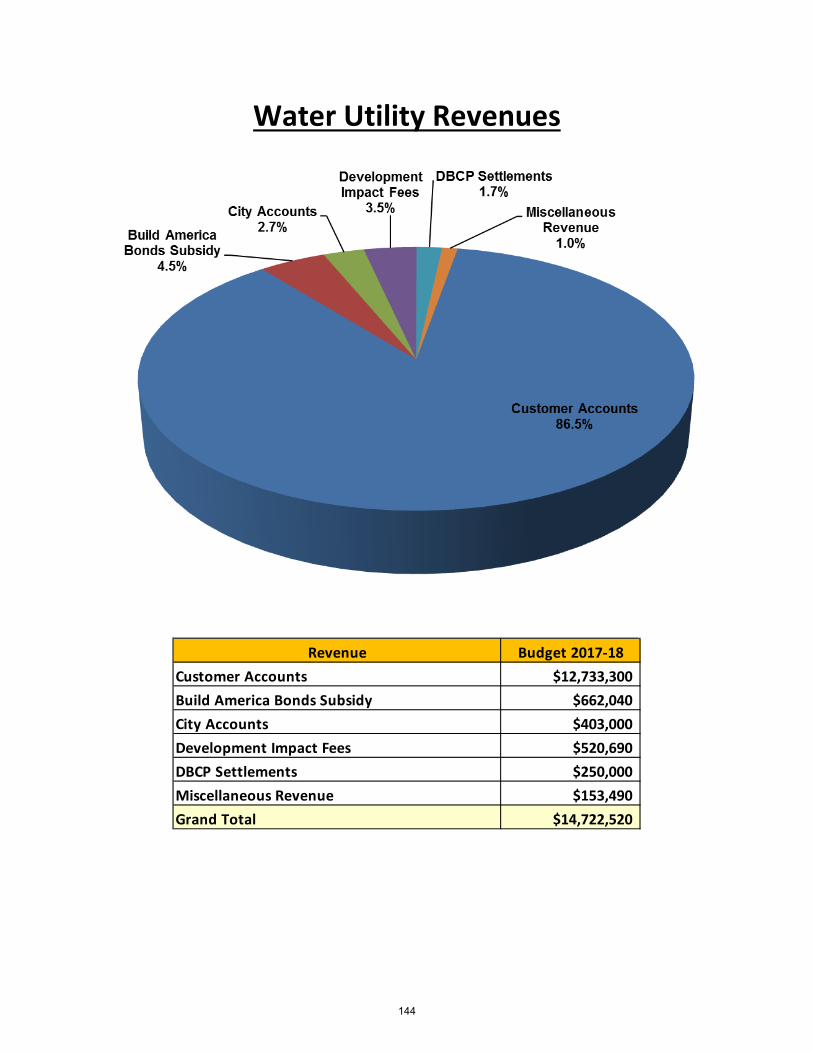
Water Utility Revenues
Revenue Budget 2017-18Customer Accounts $12,733,300Build America Bonds Subsidy $662,040City Accounts $403,000Development Impact Fees $520,690DBCP Settlements $250,000Miscellaneous Revenue $153,490Grand Total $14,722,520
144
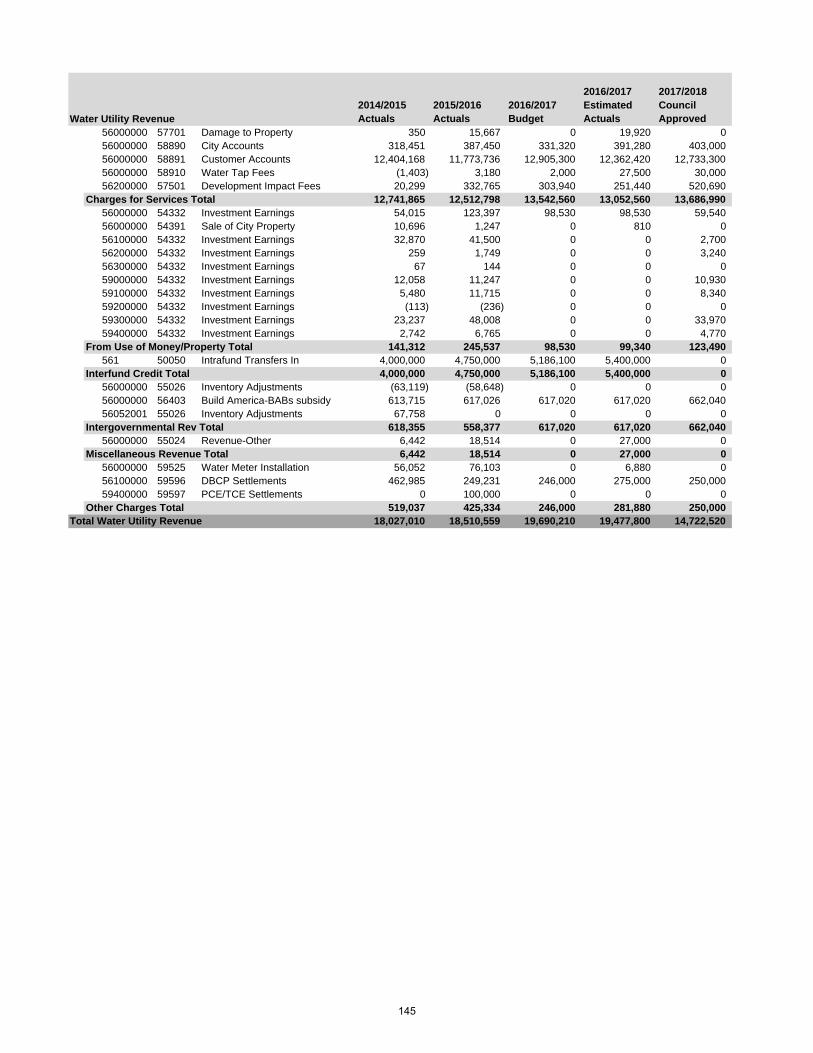
2014/2015 Actuals
2015/2016 Actuals
2016/2017 Budget
2016/2017 Estimated Actuals
2017/2018 Council Approved
56000000 57701 Damage to Property 350 15,667 0 19,920 056000000 58890 City Accounts 318,451 387,450 331,320 391,280 403,00056000000 58891 Customer Accounts 12,404,168 11,773,736 12,905,300 12,362,420 12,733,30056000000 58910 Water Tap Fees (1,403) 3,180 2,000 27,500 30,00056200000 57501 Development Impact Fees 20,299 332,765 303,940 251,440 520,690
Charges for Services Total 12,741,865 12,512,798 13,542,560 13,052,560 13,686,99056000000 54332 Investment Earnings 54,015 123,397 98,530 98,530 59,54056000000 54391 Sale of City Property 10,696 1,247 0 810 056100000 54332 Investment Earnings 32,870 41,500 0 0 2,70056200000 54332 Investment Earnings 259 1,749 0 0 3,24056300000 54332 Investment Earnings 67 144 0 0 059000000 54332 Investment Earnings 12,058 11,247 0 0 10,93059100000 54332 Investment Earnings 5,480 11,715 0 0 8,34059200000 54332 Investment Earnings (113) (236) 0 0 059300000 54332 Investment Earnings 23,237 48,008 0 0 33,97059400000 54332 Investment Earnings 2,742 6,765 0 0 4,770
From Use of Money/Property Total 141,312 245,537 98,530 99,340 123,490561 50050 Intrafund Transfers In 4,000,000 4,750,000 5,186,100 5,400,000 0
Interfund Credit Total 4,000,000 4,750,000 5,186,100 5,400,000 056000000 55026 Inventory Adjustments (63,119) (58,648) 0 0 056000000 56403 Build America-BABs subsidy 613,715 617,026 617,020 617,020 662,04056052001 55026 Inventory Adjustments 67,758 0 0 0 0
Intergovernmental Rev Total 618,355 558,377 617,020 617,020 662,04056000000 55024 Revenue-Other 6,442 18,514 0 27,000 0
Miscellaneous Revenue Total 6,442 18,514 0 27,000 056000000 59525 Water Meter Installation 56,052 76,103 0 6,880 056100000 59596 DBCP Settlements 462,985 249,231 246,000 275,000 250,00059400000 59597 PCE/TCE Settlements 0 100,000 0 0 0
Other Charges Total 519,037 425,334 246,000 281,880 250,000Total Water Utility Revenue 18,027,010 18,510,559 19,690,210 19,477,800 14,722,520
Water Utility Revenue
145

(This page intentionally left blank)
146
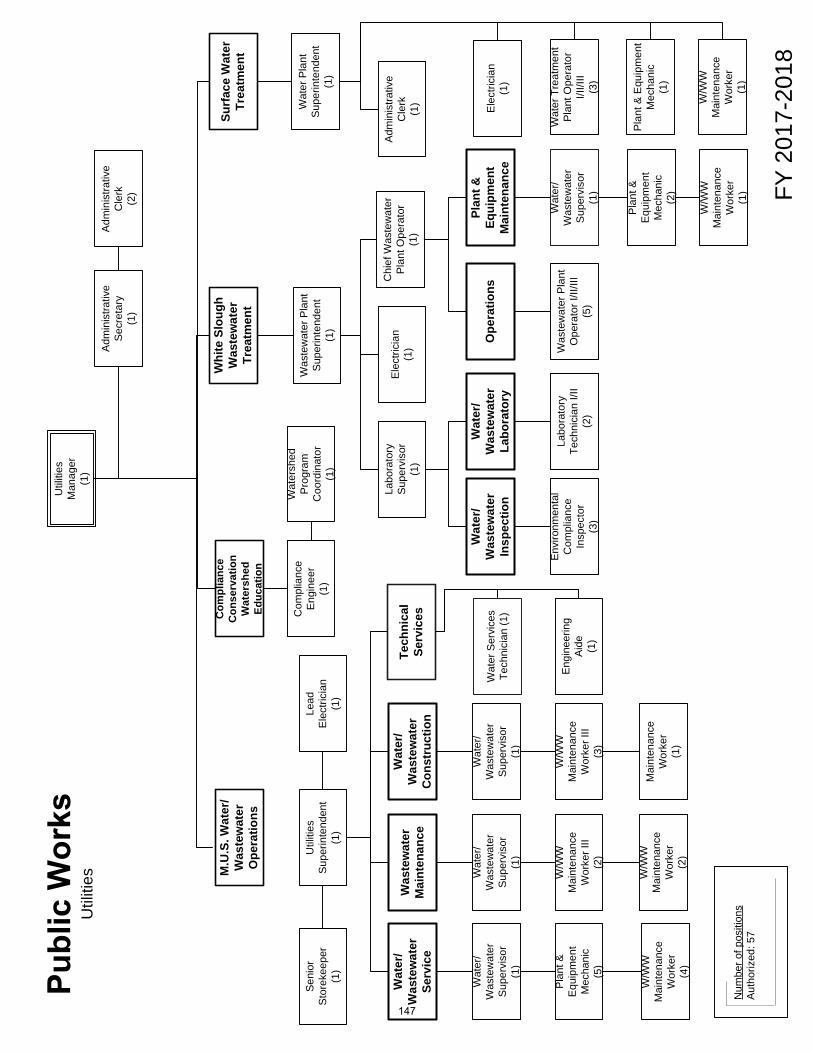
Util
ities
FY 2
017-
2018
Num
ber o
f pos
ition
sAu
thor
ized
: 57
M.U
.S. W
ater
/W
aste
wat
er
Ope
ratio
ns
Whi
te S
loug
h W
aste
wat
er
Trea
tmen
t
Util
ities
S
uper
inte
nden
t (1
)
Was
tew
ater
M
aint
enan
ce
Wat
er/
Was
tew
ater
Se
rvic
e
Wat
er/
Was
tew
ater
C
onst
ruct
ion
Wat
er/
Was
tew
ater
S
uper
viso
r (1
)
Pla
nt &
E
quip
men
t M
echa
nic
(5)
W/W
W
Mai
nten
ance
W
orke
r (4
)
Wat
er/
Was
tew
ater
Su
perv
isor
(1
)
W/W
W
Mai
nten
ance
W
orke
r III
(2)
Wat
er/
Was
tew
ater
S
uper
viso
r (1
)
W/W
W
Mai
nten
ance
W
orke
r III
(3)
Was
tew
ater
Pla
nt
Sup
erin
tend
ent
(1)
Chi
ef W
aste
wat
er
Plan
t Ope
rato
r(1
)
Envi
ronm
enta
l C
ompl
ianc
e In
spec
tor
(3)
Labo
rato
ry
Tech
nici
an I/
II (2
)
Ope
ratio
nsPl
ant &
Eq
uipm
ent
Mai
nten
ance
Was
tew
ater
Pla
nt
Ope
rato
r I/II
/III
(5)
Wat
er/
Was
tew
ater
S
uper
viso
r (1
)
Pla
nt &
E
quip
men
t M
echa
nic
(2)
W/W
WM
aint
enan
ce
Wor
ker
(1)
Tech
nica
l Se
rvic
es
Wat
er S
ervi
ces
Tech
nici
an (1
)
Util
ities
Man
ager
(1
)
Com
plia
nce
Eng
inee
r(1
)S
enio
r S
tore
keep
er(1
)
Surf
ace
Wat
er
Trea
tmen
t
Wat
er/
Was
tew
ater
La
bora
tory
Wat
er/
Was
tew
ater
In
spec
tion
Adm
inis
trativ
e S
ecre
tary
(1)
Adm
inis
trativ
e C
lerk
(2
)
Ele
ctric
ian
(1)
Lead
Ele
ctric
ian
(1)
Wat
ersh
ed
Prog
ram
C
oord
inat
or
(1)
Labo
rato
ry
Sup
ervi
sor
(1)
Wat
er P
lant
Su
perin
tend
ent
(1)
Adm
inis
trativ
e C
lerk
(1)
Engi
neer
ing
Aid
e(1
)
Ele
ctric
ian
(1)
Pla
nt &
Equ
ipm
ent
Mec
hani
c(1
)
Wat
er T
reat
men
t Pl
ant O
pera
tor
I/II/I
II(3
)
W/W
WM
aint
enan
ceW
orke
r(1
)
W/W
W
Mai
nten
ance
W
orke
r(2
)
Mai
nten
ance
W
orke
r(1
)
Com
plia
nce
Con
serv
atio
n W
ater
shed
Ed
ucat
ion
147
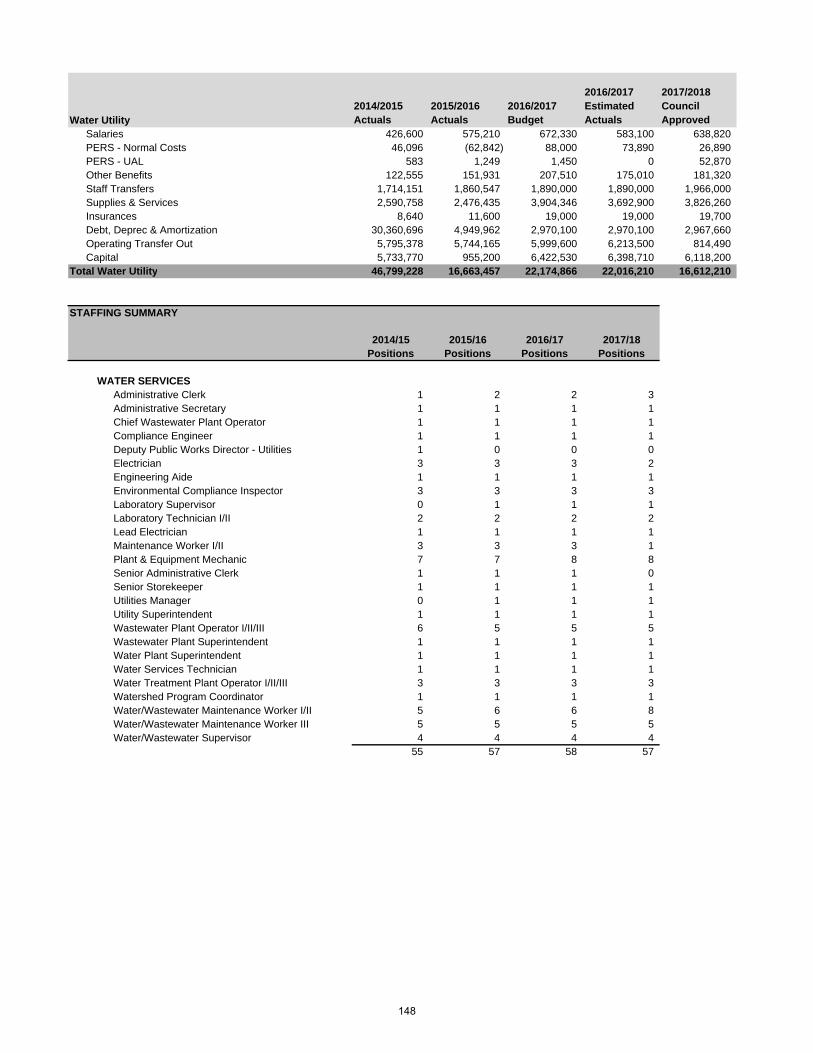
2014/2015 Actuals
2015/2016 Actuals
2016/2017 Budget
2016/2017 Estimated Actuals
2017/2018 Council Approved
Salaries 426,600 575,210 672,330 583,100 638,820PERS - Normal Costs 46,096 (62,842) 88,000 73,890 26,890PERS - UAL 583 1,249 1,450 0 52,870Other Benefits 122,555 151,931 207,510 175,010 181,320Staff Transfers 1,714,151 1,860,547 1,890,000 1,890,000 1,966,000Supplies & Services 2,590,758 2,476,435 3,904,346 3,692,900 3,826,260Insurances 8,640 11,600 19,000 19,000 19,700Debt, Deprec & Amortization 30,360,696 4,949,962 2,970,100 2,970,100 2,967,660Operating Transfer Out 5,795,378 5,744,165 5,999,600 6,213,500 814,490Capital 5,733,770 955,200 6,422,530 6,398,710 6,118,200
Total Water Utility 46,799,228 16,663,457 22,174,866 22,016,210 16,612,210
STAFFING SUMMARY
2014/15 2015/16 2016/17 2017/18Positions Positions Positions Positions
WATER SERVICES Administrative Clerk 1 2 2 3Administrative Secretary 1 1 1 1Chief Wastewater Plant Operator 1 1 1 1Compliance Engineer 1 1 1 1Deputy Public Works Director - Utilities 1 0 0 0Electrician 3 3 3 2Engineering Aide 1 1 1 1Environmental Compliance Inspector 3 3 3 3Laboratory Supervisor 0 1 1 1Laboratory Technician I/II 2 2 2 2Lead Electrician 1 1 1 1Maintenance Worker I/II 3 3 3 1Plant & Equipment Mechanic 7 7 8 8Senior Administrative Clerk 1 1 1 0Senior Storekeeper 1 1 1 1Utilities Manager 0 1 1 1Utility Superintendent 1 1 1 1Wastewater Plant Operator I/II/III 6 5 5 5Wastewater Plant Superintendent 1 1 1 1Water Plant Superintendent 1 1 1 1Water Services Technician 1 1 1 1Water Treatment Plant Operator I/II/III 3 3 3 3Watershed Program Coordinator 1 1 1 1Water/Wastewater Maintenance Worker I/II 5 6 6 8Water/Wastewater Maintenance Worker III 5 5 5 5Water/Wastewater Supervisor 4 4 4 4
55 57 58 57
Water Utility
148
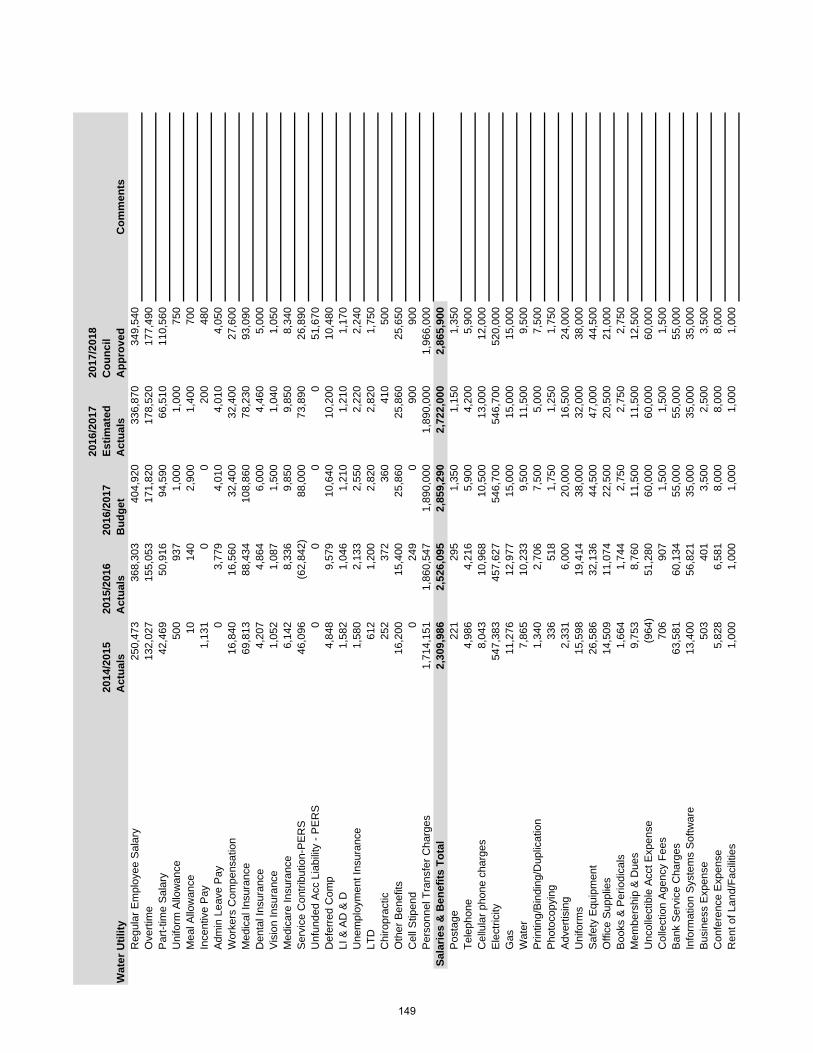
2014
/201
5 A
ctua
ls20
15/2
016
Act
uals
2016
/201
7 B
udge
t
2016
/201
7 Es
timat
ed
Act
uals
2017
/201
8 C
ounc
il A
ppro
ved
Com
men
tsR
egul
ar E
mpl
oyee
Sal
ary
250,
473
368,
303
404,
920
336,
870
349,
540
Ove
rtim
e 13
2,02
715
5,05
317
1,82
017
8,52
017
7,49
0P
art-t
ime
Sal
ary
42,4
6950
,916
94,5
9066
,510
110,
560
Uni
form
Allo
wan
ce
500
937
1,00
01,
000
750
Mea
l Allo
wan
ce
1014
02,
900
1,40
070
0In
cent
ive
Pay
1,
131
00
200
480
Adm
in L
eave
Pay
0
3,77
94,
010
4,01
04,
050
Wor
kers
Com
pens
atio
n 16
,840
16,5
6032
,400
32,4
0027
,600
Med
ical
Insu
ranc
e 69
,813
88,4
3410
8,86
078
,230
93,0
90D
enta
l Ins
uran
ce
4,20
74,
864
6,00
04,
460
5,00
0V
isio
n In
sura
nce
1,05
21,
087
1,50
01,
040
1,05
0M
edic
are
Insu
ranc
e 6,
142
8,33
69,
850
9,85
08,
340
Ser
vice
Con
tribu
tion-
PE
RS
46
,096
(62,
842)
88,0
0073
,890
26,8
90U
nfun
ded
Acc
Lia
bilit
y - P
ER
S
00
00
51,6
70D
efer
red
Com
p 4,
848
9,57
910
,640
10,2
0010
,480
LI &
AD
& D
1,
582
1,04
61,
210
1,21
01,
170
Une
mpl
oym
ent I
nsur
ance
1,
580
2,13
32,
550
2,22
02,
240
LTD
61
21,
200
2,82
02,
820
1,75
0C
hiro
prac
tic
252
372
360
410
500
Oth
er B
enef
its
16,2
0015
,400
25,8
6025
,860
25,6
50C
ell S
tipen
d 0
249
090
090
0P
erso
nnel
Tra
nsfe
r Cha
rges
1,
714,
151
1,86
0,54
71,
890,
000
1,89
0,00
01,
966,
000
Sala
ries
& B
enef
its T
otal
2,30
9,98
62,
526,
095
2,85
9,29
02,
722,
000
2,86
5,90
0P
osta
ge
221
295
1,35
01,
150
1,35
0Te
leph
one
4,98
64,
216
5,90
04,
200
5,90
0C
ellu
lar p
hone
cha
rges
8,
043
10,9
6810
,500
13,0
0012
,000
Ele
ctric
ity
547,
383
457,
627
546,
700
546,
700
520,
000
Gas
11
,276
12,9
7715
,000
15,0
0015
,000
Wat
er
7,86
510
,233
9,50
011
,500
9,50
0P
rintin
g/B
indi
ng/D
uplic
atio
n 1,
340
2,70
67,
500
5,00
07,
500
Pho
toco
pyin
g 33
651
81,
750
1,25
01,
750
Adv
ertis
ing
2,33
16,
000
20,0
0016
,500
24,0
00U
nifo
rms
15,5
9819
,414
38,0
0032
,000
38,0
00S
afet
y E
quip
men
t 26
,586
32,1
3644
,500
47,0
0044
,500
Offi
ce S
uppl
ies
14,5
0911
,074
22,5
0020
,500
21,0
00B
ooks
& P
erio
dica
ls
1,66
41,
744
2,75
02,
750
2,75
0M
embe
rshi
p &
Due
s 9,
753
8,76
011
,500
11,5
0012
,500
Unc
olle
ctib
le A
cct E
xpen
se
(964
)51
,280
60,0
0060
,000
60,0
00C
olle
ctio
n A
genc
y Fe
es
706
907
1,50
01,
500
1,50
0B
ank
Ser
vice
Cha
rges
63
,581
60,1
3455
,000
55,0
0055
,000
Info
rmat
ion
Sys
tem
s S
oftw
are
13,4
0056
,821
35,0
0035
,000
35,0
00B
usin
ess
Exp
ense
50
340
13,
500
2,50
03,
500
Con
fere
nce
Exp
ense
5,
828
6,58
18,
000
8,00
08,
000
Ren
t of L
and/
Faci
litie
s 1,
000
1,00
01,
000
1,00
01,
000
Wat
er U
tility
149
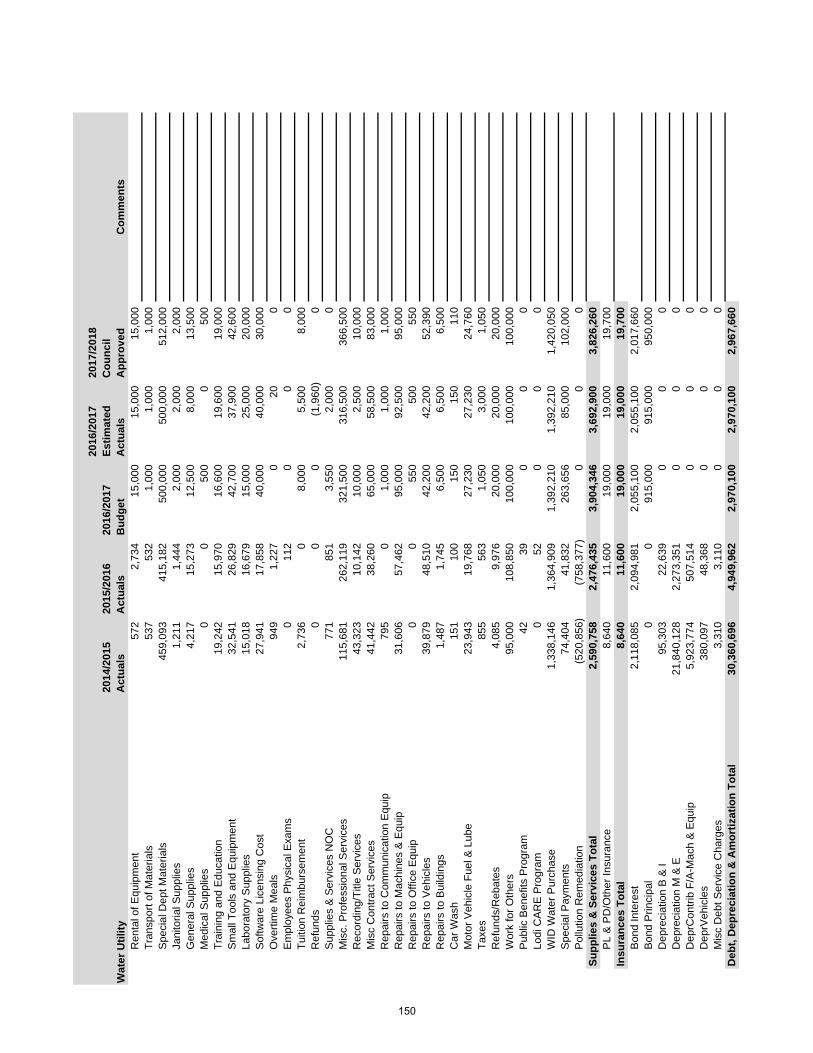
2014
/201
5 A
ctua
ls20
15/2
016
Act
uals
2016
/201
7 B
udge
t
2016
/201
7 Es
timat
ed
Act
uals
2017
/201
8 C
ounc
il A
ppro
ved
Com
men
tsW
ater
Util
ityR
enta
l of E
quip
men
t 57
22,
734
15,0
0015
,000
15,0
00Tr
ansp
ort o
f Mat
eria
ls
537
532
1,00
01,
000
1,00
0S
peci
al D
ept M
ater
ials
45
9,09
341
5,18
250
0,00
050
0,00
051
2,00
0Ja
nito
rial S
uppl
ies
1,21
11,
444
2,00
02,
000
2,00
0G
ener
al S
uppl
ies
4,21
715
,273
12,5
008,
000
13,5
00M
edic
al S
uppl
ies
00
500
050
0Tr
aini
ng a
nd E
duca
tion
19,2
4215
,970
16,6
0019
,600
19,0
00S
mal
l Too
ls a
nd E
quip
men
t 32
,541
26,8
2942
,700
37,9
0042
,600
Labo
rato
ry S
uppl
ies
15,0
1816
,679
15,0
0025
,000
20,0
00S
oftw
are
Lice
nsin
g C
ost
27,9
4117
,858
40,0
0040
,000
30,0
00O
verti
me
Mea
ls
949
1,22
70
200
Em
ploy
ees
Phy
sica
l Exa
ms
011
20
00
Tuiti
on R
eim
burs
emen
t 2,
736
08,
000
5,50
08,
000
Ref
unds
0
00
(1,9
60)
0S
uppl
ies
& S
ervi
ces
NO
C
771
851
3,55
02,
000
0M
isc.
Pro
fess
iona
l Ser
vice
s 11
5,68
126
2,11
932
1,50
031
6,50
036
6,50
0R
ecor
ding
/Titl
e S
ervi
ces
43,3
2310
,142
10,0
002,
500
10,0
00M
isc
Con
tract
Ser
vice
s 41
,442
38,2
6065
,000
58,5
0083
,000
Rep
airs
to C
omm
unic
atio
n E
quip
79
50
1,00
01,
000
1,00
0R
epai
rs to
Mac
hine
s &
Equ
ip
31,6
0657
,462
95,0
0092
,500
95,0
00R
epai
rs to
Offi
ce E
quip
0
055
050
055
0R
epai
rs to
Veh
icle
s 39
,879
48,5
1042
,200
42,2
0052
,390
Rep
airs
to B
uild
ings
1,
487
1,74
56,
500
6,50
06,
500
Car
Was
h 15
110
015
015
011
0M
otor
Veh
icle
Fue
l & L
ube
23,9
4319
,768
27,2
3027
,230
24,7
60Ta
xes
855
563
1,05
03,
000
1,05
0R
efun
ds/R
ebat
es
4,08
59,
976
20,0
0020
,000
20,0
00W
ork
for O
ther
s 95
,000
108,
850
100,
000
100,
000
100,
000
Pub
lic B
enef
its P
rogr
am
4239
00
0Lo
di C
AR
E P
rogr
am
052
00
0W
ID W
ater
Pur
chas
e 1,
338,
146
1,36
4,90
91,
392,
210
1,39
2,21
01,
420,
050
Spe
cial
Pay
men
ts
74,4
0441
,832
263,
656
85,0
0010
2,00
0P
ollu
tion
Rem
edia
tion
(520
,856
)(7
58,3
77)
00
0Su
pplie
s &
Ser
vice
s To
tal
2,59
0,75
82,
476,
435
3,90
4,34
63,
692,
900
3,82
6,26
0P
L &
PD
/Oth
er In
sura
nce
8,64
011
,600
19,0
0019
,000
19,7
00In
sura
nces
Tot
al8,
640
11,6
0019
,000
19,0
0019
,700
Bon
d In
tere
st
2,11
8,08
52,
094,
981
2,05
5,10
02,
055,
100
2,01
7,66
0B
ond
Prin
cipa
l 0
091
5,00
091
5,00
095
0,00
0D
epre
ciat
ion
B &
I 95
,303
22,6
390
00
Dep
reci
atio
n M
& E
21
,840
,128
2,27
3,35
10
00
Dep
rCon
trib
F/A
-Mac
h &
Equ
ip
5,92
3,77
450
7,51
40
00
Dep
rVeh
icle
s 38
0,09
748
,368
00
0M
isc
Deb
t Ser
vice
Cha
rges
3,
310
3,11
00
00
Deb
t, D
epre
ciat
ion
& A
mor
tizat
ion
Tota
l30
,360
,696
4,94
9,96
22,
970,
100
2,97
0,10
02,
967,
660
150
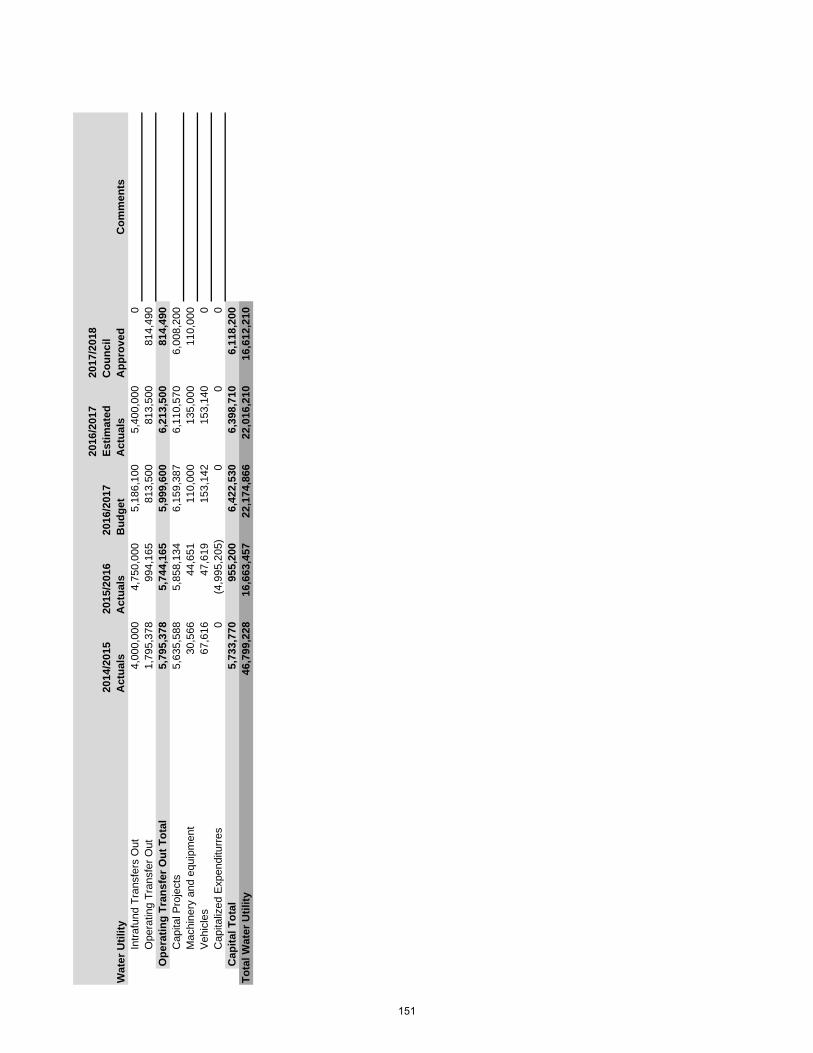
2014
/201
5 A
ctua
ls20
15/2
016
Act
uals
2016
/201
7 B
udge
t
2016
/201
7 Es
timat
ed
Act
uals
2017
/201
8 C
ounc
il A
ppro
ved
Com
men
tsW
ater
Util
ityIn
trafu
nd T
rans
fers
Out
4,
000,
000
4,75
0,00
05,
186,
100
5,40
0,00
00
Ope
ratin
g Tr
ansf
er O
ut
1,79
5,37
899
4,16
581
3,50
081
3,50
081
4,49
0O
pera
ting
Tran
sfer
Out
Tot
al5,
795,
378
5,74
4,16
55,
999,
600
6,21
3,50
081
4,49
0C
apita
l Pro
ject
s 5,
635,
588
5,85
8,13
46,
159,
387
6,11
0,57
06,
008,
200
Mac
hine
ry a
nd e
quip
men
t 30
,566
44,6
5111
0,00
013
5,00
011
0,00
0V
ehic
les
67,6
1647
,619
153,
142
153,
140
0C
apita
lized
Exp
endi
turr
es
0(4
,995
,205
)0
00
Cap
ital T
otal
5,73
3,77
095
5,20
06,
422,
530
6,39
8,71
06,
118,
200
Tota
l Wat
er U
tilit y
46,7
99,2
2816
,663
,457
22,1
74,8
6622
,016
,210
16,6
12,2
10
151
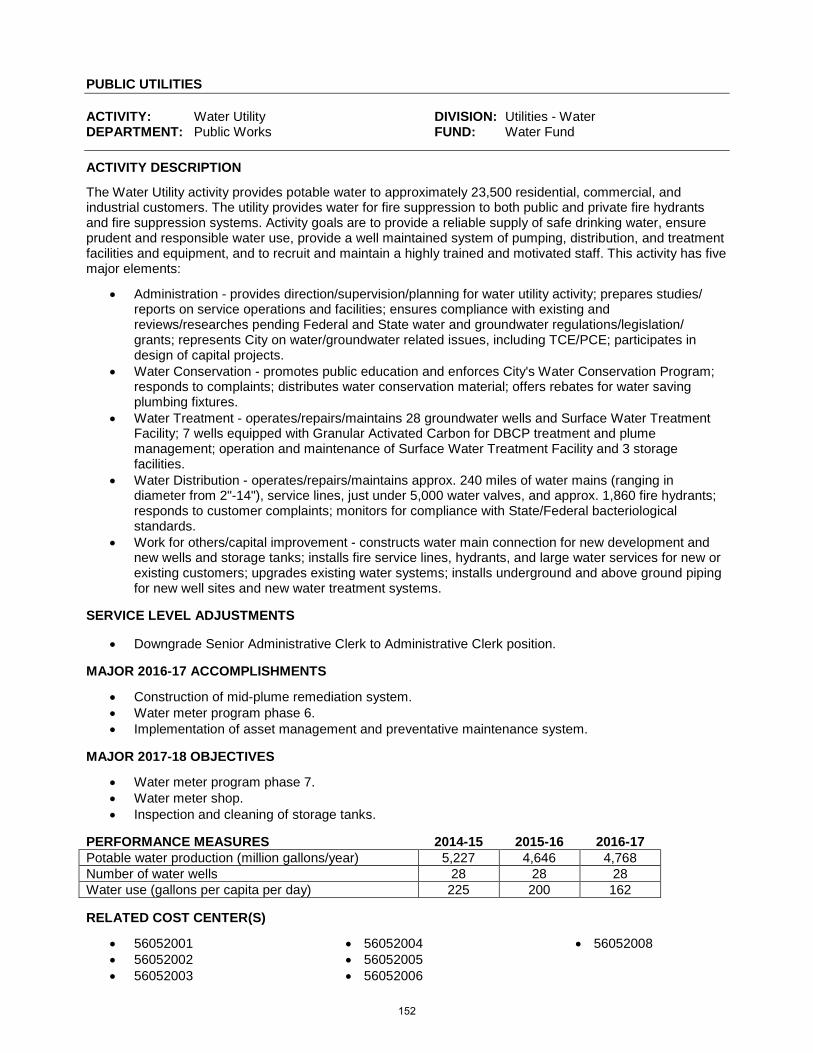
PUBLIC UTILITIES ACTIVITY: Water Utility DIVISION: Utilities - Water DEPARTMENT: Public Works FUND: Water Fund
ACTIVITY DESCRIPTION
The Water Utility activity provides potable water to approximately 23,500 residential, commercial, and industrial customers. The utility provides water for fire suppression to both public and private fire hydrants and fire suppression systems. Activity goals are to provide a reliable supply of safe drinking water, ensure prudent and responsible water use, provide a well maintained system of pumping, distribution, and treatment facilities and equipment, and to recruit and maintain a highly trained and motivated staff. This activity has five major elements:
• Administration - provides direction/supervision/planning for water utility activity; prepares studies/ reports on service operations and facilities; ensures compliance with existing and reviews/researches pending Federal and State water and groundwater regulations/legislation/ grants; represents City on water/groundwater related issues, including TCE/PCE; participates in design of capital projects.
• Water Conservation - promotes public education and enforces City's Water Conservation Program; responds to complaints; distributes water conservation material; offers rebates for water saving plumbing fixtures.
• Water Treatment - operates/repairs/maintains 28 groundwater wells and Surface Water Treatment Facility; 7 wells equipped with Granular Activated Carbon for DBCP treatment and plume management; operation and maintenance of Surface Water Treatment Facility and 3 storage facilities.
• Water Distribution - operates/repairs/maintains approx. 240 miles of water mains (ranging in diameter from 2"-14"), service lines, just under 5,000 water valves, and approx. 1,860 fire hydrants; responds to customer complaints; monitors for compliance with State/Federal bacteriological standards.
• Work for others/capital improvement - constructs water main connection for new development and new wells and storage tanks; installs fire service lines, hydrants, and large water services for new or existing customers; upgrades existing water systems; installs underground and above ground piping for new well sites and new water treatment systems.
SERVICE LEVEL ADJUSTMENTS
• Downgrade Senior Administrative Clerk to Administrative Clerk position. MAJOR 2016-17 ACCOMPLISHMENTS
• Construction of mid-plume remediation system. • Water meter program phase 6. • Implementation of asset management and preventative maintenance system.
MAJOR 2017-18 OBJECTIVES
• Water meter program phase 7. • Water meter shop. • Inspection and cleaning of storage tanks.
PERFORMANCE MEASURES 2014-15 2015-16 2016-17 Potable water production (million gallons/year) 5,227 4,646 4,768 Number of water wells 28 28 28 Water use (gallons per capita per day) 225 200 162 RELATED COST CENTER(S)
• 56052001 • 56052002 • 56052003
• 56052004 • 56052005 • 56052006
• 56052008
152
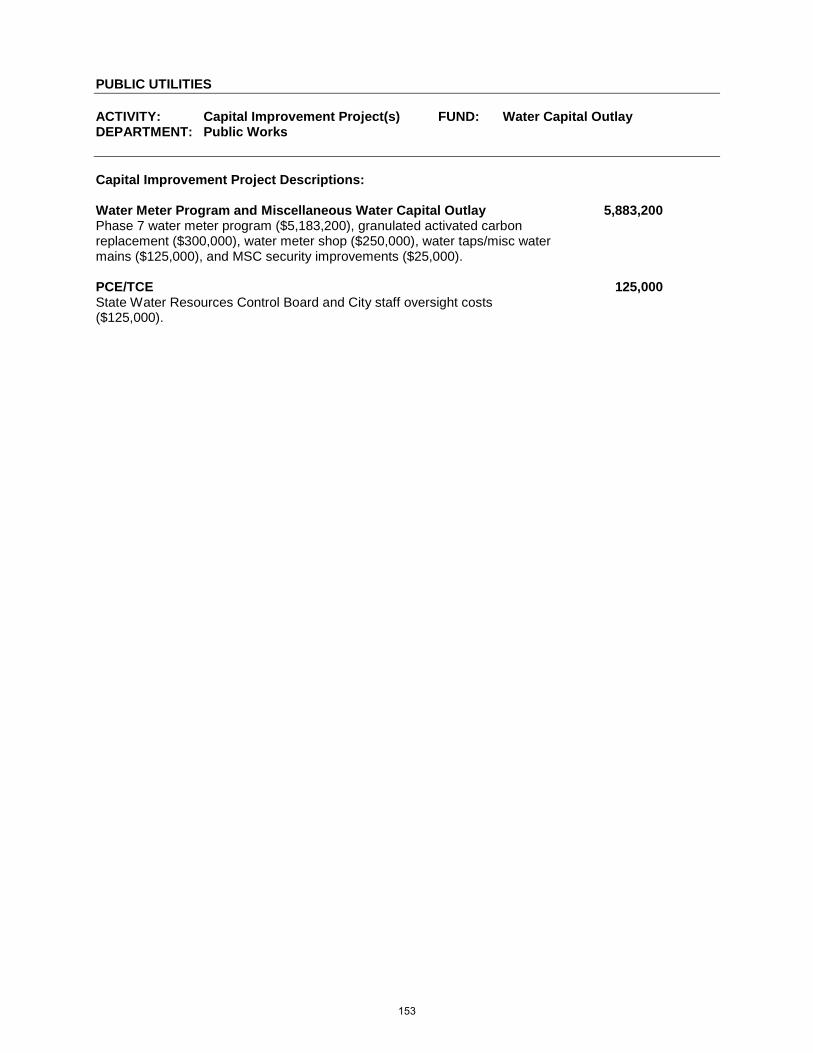
PUBLIC UTILITIES ACTIVITY: Capital Improvement Project(s) FUND: Water Capital Outlay DEPARTMENT: Public Works Capital Improvement Project Descriptions: Water Meter Program and Miscellaneous Water Capital Outlay 5,883,200 Phase 7 water meter program ($5,183,200), granulated activated carbon replacement ($300,000), water meter shop ($250,000), water taps/misc water mains ($125,000), and MSC security improvements ($25,000).
PCE/TCE 125,000 State Water Resources Control Board and City staff oversight costs ($125,000).
153
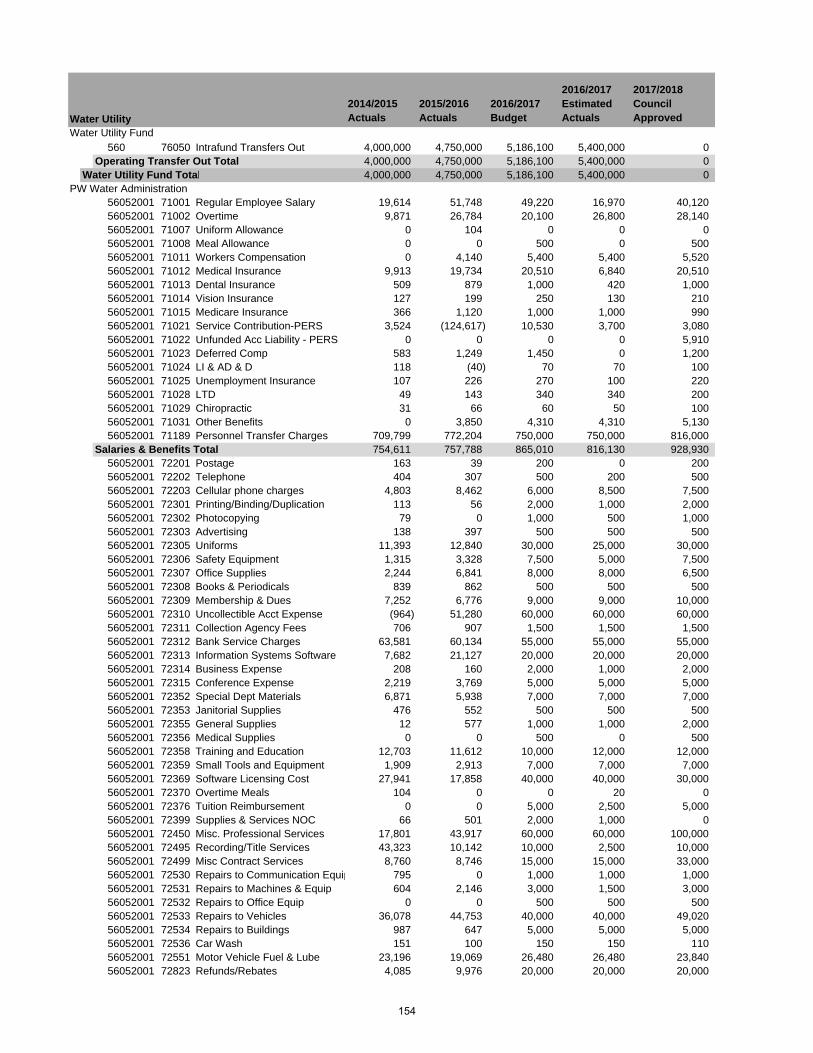
2014/2015 Actuals
2015/2016 Actuals
2016/2017 Budget
2016/2017 Estimated Actuals
2017/2018 Council Approved
Water Utility Fund560 76050 Intrafund Transfers Out 4,000,000 4,750,000 5,186,100 5,400,000 0
Operating Transfer Out Total 4,000,000 4,750,000 5,186,100 5,400,000 0Water Utility Fund Total 4,000,000 4,750,000 5,186,100 5,400,000 0
PW Water Administration56052001 71001 Regular Employee Salary 19,614 51,748 49,220 16,970 40,12056052001 71002 Overtime 9,871 26,784 20,100 26,800 28,14056052001 71007 Uniform Allowance 0 104 0 0 056052001 71008 Meal Allowance 0 0 500 0 50056052001 71011 Workers Compensation 0 4,140 5,400 5,400 5,52056052001 71012 Medical Insurance 9,913 19,734 20,510 6,840 20,51056052001 71013 Dental Insurance 509 879 1,000 420 1,00056052001 71014 Vision Insurance 127 199 250 130 21056052001 71015 Medicare Insurance 366 1,120 1,000 1,000 99056052001 71021 Service Contribution-PERS 3,524 (124,617) 10,530 3,700 3,08056052001 71022 Unfunded Acc Liability - PERS 0 0 0 0 5,91056052001 71023 Deferred Comp 583 1,249 1,450 0 1,20056052001 71024 LI & AD & D 118 (40) 70 70 10056052001 71025 Unemployment Insurance 107 226 270 100 22056052001 71028 LTD 49 143 340 340 20056052001 71029 Chiropractic 31 66 60 50 10056052001 71031 Other Benefits 0 3,850 4,310 4,310 5,13056052001 71189 Personnel Transfer Charges 709,799 772,204 750,000 750,000 816,000
Salaries & Benefits Total 754,611 757,788 865,010 816,130 928,93056052001 72201 Postage 163 39 200 0 20056052001 72202 Telephone 404 307 500 200 50056052001 72203 Cellular phone charges 4,803 8,462 6,000 8,500 7,50056052001 72301 Printing/Binding/Duplication 113 56 2,000 1,000 2,00056052001 72302 Photocopying 79 0 1,000 500 1,00056052001 72303 Advertising 138 397 500 500 50056052001 72305 Uniforms 11,393 12,840 30,000 25,000 30,00056052001 72306 Safety Equipment 1,315 3,328 7,500 5,000 7,50056052001 72307 Office Supplies 2,244 6,841 8,000 8,000 6,50056052001 72308 Books & Periodicals 839 862 500 500 50056052001 72309 Membership & Dues 7,252 6,776 9,000 9,000 10,00056052001 72310 Uncollectible Acct Expense (964) 51,280 60,000 60,000 60,00056052001 72311 Collection Agency Fees 706 907 1,500 1,500 1,50056052001 72312 Bank Service Charges 63,581 60,134 55,000 55,000 55,00056052001 72313 Information Systems Software 7,682 21,127 20,000 20,000 20,00056052001 72314 Business Expense 208 160 2,000 1,000 2,00056052001 72315 Conference Expense 2,219 3,769 5,000 5,000 5,00056052001 72352 Special Dept Materials 6,871 5,938 7,000 7,000 7,00056052001 72353 Janitorial Supplies 476 552 500 500 50056052001 72355 General Supplies 12 577 1,000 1,000 2,00056052001 72356 Medical Supplies 0 0 500 0 50056052001 72358 Training and Education 12,703 11,612 10,000 12,000 12,00056052001 72359 Small Tools and Equipment 1,909 2,913 7,000 7,000 7,00056052001 72369 Software Licensing Cost 27,941 17,858 40,000 40,000 30,00056052001 72370 Overtime Meals 104 0 0 20 056052001 72376 Tuition Reimbursement 0 0 5,000 2,500 5,00056052001 72399 Supplies & Services NOC 66 501 2,000 1,000 056052001 72450 Misc. Professional Services 17,801 43,917 60,000 60,000 100,00056052001 72495 Recording/Title Services 43,323 10,142 10,000 2,500 10,00056052001 72499 Misc Contract Services 8,760 8,746 15,000 15,000 33,00056052001 72530 Repairs to Communication Equip 795 0 1,000 1,000 1,00056052001 72531 Repairs to Machines & Equip 604 2,146 3,000 1,500 3,00056052001 72532 Repairs to Office Equip 0 0 500 500 50056052001 72533 Repairs to Vehicles 36,078 44,753 40,000 40,000 49,02056052001 72534 Repairs to Buildings 987 647 5,000 5,000 5,00056052001 72536 Car Wash 151 100 150 150 11056052001 72551 Motor Vehicle Fuel & Lube 23,196 19,069 26,480 26,480 23,84056052001 72823 Refunds/Rebates 4,085 9,976 20,000 20,000 20,000
Water Utility
154
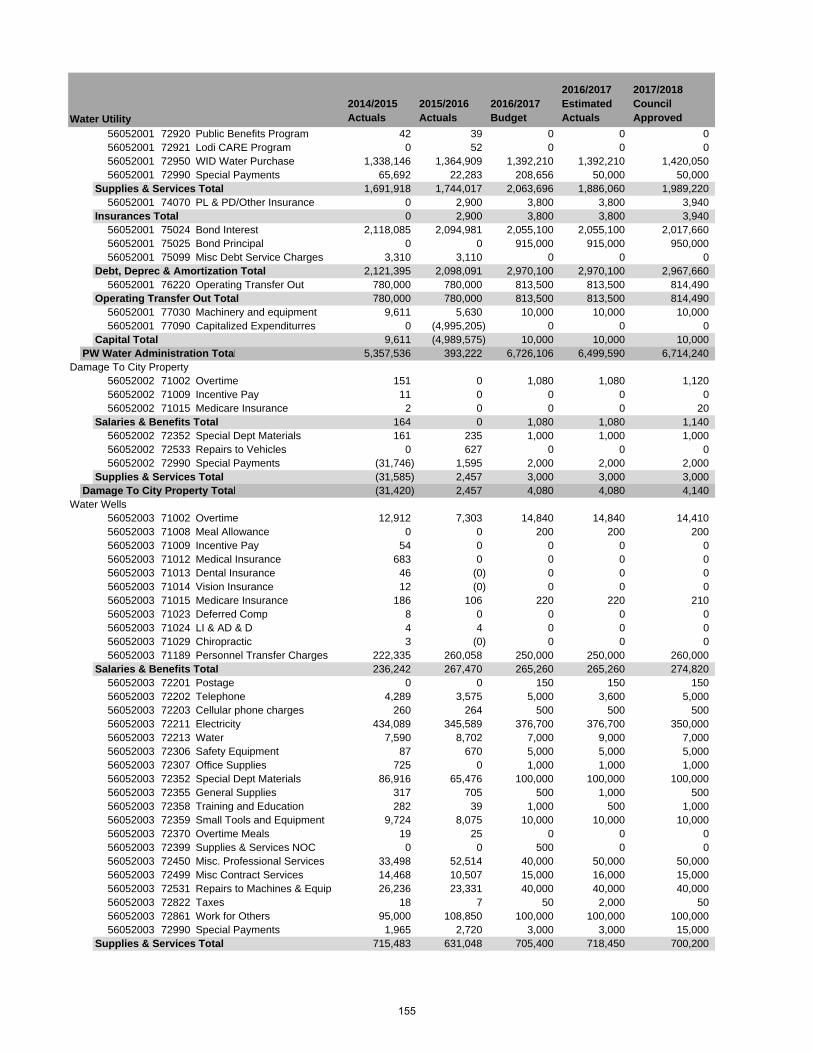
2014/2015 Actuals
2015/2016 Actuals
2016/2017 Budget
2016/2017 Estimated Actuals
2017/2018 Council ApprovedWater Utility
56052001 72920 Public Benefits Program 42 39 0 0 056052001 72921 Lodi CARE Program 0 52 0 0 056052001 72950 WID Water Purchase 1,338,146 1,364,909 1,392,210 1,392,210 1,420,05056052001 72990 Special Payments 65,692 22,283 208,656 50,000 50,000
Supplies & Services Total 1,691,918 1,744,017 2,063,696 1,886,060 1,989,22056052001 74070 PL & PD/Other Insurance 0 2,900 3,800 3,800 3,940
Insurances Total 0 2,900 3,800 3,800 3,94056052001 75024 Bond Interest 2,118,085 2,094,981 2,055,100 2,055,100 2,017,66056052001 75025 Bond Principal 0 0 915,000 915,000 950,00056052001 75099 Misc Debt Service Charges 3,310 3,110 0 0 0
Debt, Deprec & Amortization Total 2,121,395 2,098,091 2,970,100 2,970,100 2,967,66056052001 76220 Operating Transfer Out 780,000 780,000 813,500 813,500 814,490
Operating Transfer Out Total 780,000 780,000 813,500 813,500 814,49056052001 77030 Machinery and equipment 9,611 5,630 10,000 10,000 10,00056052001 77090 Capitalized Expenditurres 0 (4,995,205) 0 0 0
Capital Total 9,611 (4,989,575) 10,000 10,000 10,000PW Water Administration Total 5,357,536 393,222 6,726,106 6,499,590 6,714,240
Damage To City Property56052002 71002 Overtime 151 0 1,080 1,080 1,12056052002 71009 Incentive Pay 11 0 0 0 056052002 71015 Medicare Insurance 2 0 0 0 20
Salaries & Benefits Total 164 0 1,080 1,080 1,14056052002 72352 Special Dept Materials 161 235 1,000 1,000 1,00056052002 72533 Repairs to Vehicles 0 627 0 0 056052002 72990 Special Payments (31,746) 1,595 2,000 2,000 2,000
Supplies & Services Total (31,585) 2,457 3,000 3,000 3,000Damage To City Property Total (31,420) 2,457 4,080 4,080 4,140
Water Wells56052003 71002 Overtime 12,912 7,303 14,840 14,840 14,41056052003 71008 Meal Allowance 0 0 200 200 20056052003 71009 Incentive Pay 54 0 0 0 056052003 71012 Medical Insurance 683 0 0 0 056052003 71013 Dental Insurance 46 (0) 0 0 056052003 71014 Vision Insurance 12 (0) 0 0 056052003 71015 Medicare Insurance 186 106 220 220 21056052003 71023 Deferred Comp 8 0 0 0 056052003 71024 LI & AD & D 4 4 0 0 056052003 71029 Chiropractic 3 (0) 0 0 056052003 71189 Personnel Transfer Charges 222,335 260,058 250,000 250,000 260,000
Salaries & Benefits Total 236,242 267,470 265,260 265,260 274,82056052003 72201 Postage 0 0 150 150 15056052003 72202 Telephone 4,289 3,575 5,000 3,600 5,00056052003 72203 Cellular phone charges 260 264 500 500 50056052003 72211 Electricity 434,089 345,589 376,700 376,700 350,00056052003 72213 Water 7,590 8,702 7,000 9,000 7,00056052003 72306 Safety Equipment 87 670 5,000 5,000 5,00056052003 72307 Office Supplies 725 0 1,000 1,000 1,00056052003 72352 Special Dept Materials 86,916 65,476 100,000 100,000 100,00056052003 72355 General Supplies 317 705 500 1,000 50056052003 72358 Training and Education 282 39 1,000 500 1,00056052003 72359 Small Tools and Equipment 9,724 8,075 10,000 10,000 10,00056052003 72370 Overtime Meals 19 25 0 0 056052003 72399 Supplies & Services NOC 0 0 500 0 056052003 72450 Misc. Professional Services 33,498 52,514 40,000 50,000 50,00056052003 72499 Misc Contract Services 14,468 10,507 15,000 16,000 15,00056052003 72531 Repairs to Machines & Equip 26,236 23,331 40,000 40,000 40,00056052003 72822 Taxes 18 7 50 2,000 5056052003 72861 Work for Others 95,000 108,850 100,000 100,000 100,00056052003 72990 Special Payments 1,965 2,720 3,000 3,000 15,000
Supplies & Services Total 715,483 631,048 705,400 718,450 700,200
155
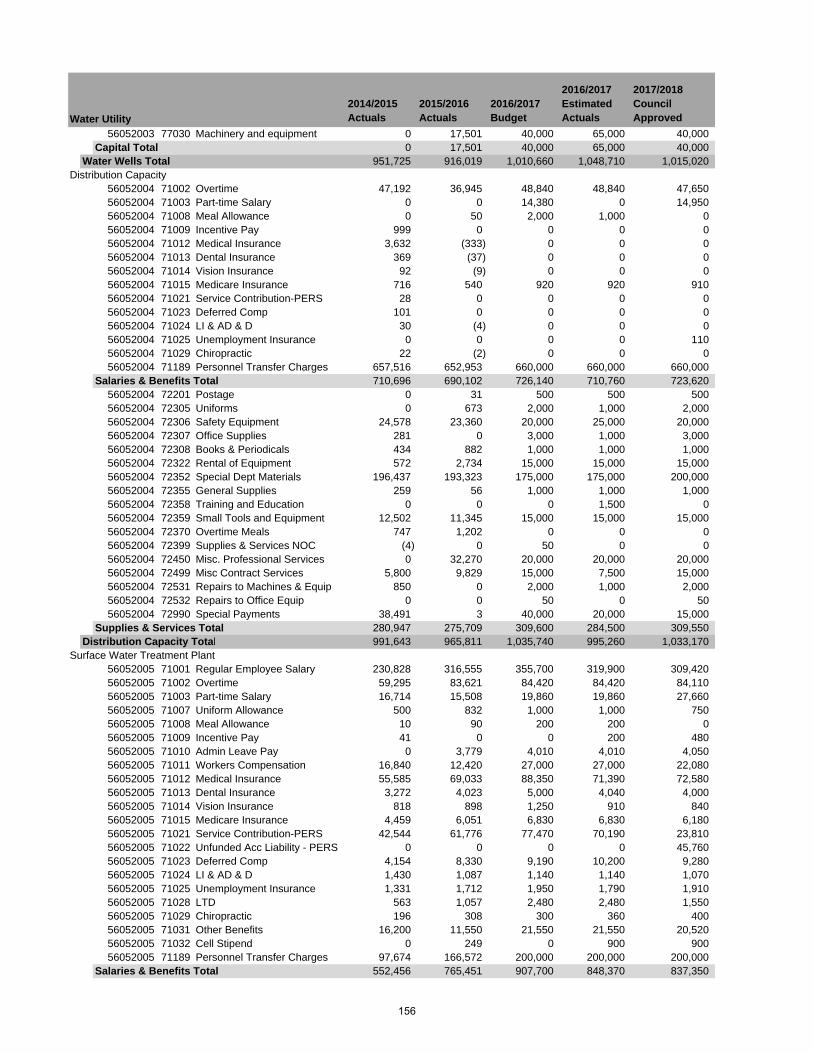
2014/2015 Actuals
2015/2016 Actuals
2016/2017 Budget
2016/2017 Estimated Actuals
2017/2018 Council ApprovedWater Utility
56052003 77030 Machinery and equipment 0 17,501 40,000 65,000 40,000Capital Total 0 17,501 40,000 65,000 40,000
Water Wells Total 951,725 916,019 1,010,660 1,048,710 1,015,020Distribution Capacity
56052004 71002 Overtime 47,192 36,945 48,840 48,840 47,65056052004 71003 Part-time Salary 0 0 14,380 0 14,95056052004 71008 Meal Allowance 0 50 2,000 1,000 056052004 71009 Incentive Pay 999 0 0 0 056052004 71012 Medical Insurance 3,632 (333) 0 0 056052004 71013 Dental Insurance 369 (37) 0 0 056052004 71014 Vision Insurance 92 (9) 0 0 056052004 71015 Medicare Insurance 716 540 920 920 91056052004 71021 Service Contribution-PERS 28 0 0 0 056052004 71023 Deferred Comp 101 0 0 0 056052004 71024 LI & AD & D 30 (4) 0 0 056052004 71025 Unemployment Insurance 0 0 0 0 11056052004 71029 Chiropractic 22 (2) 0 0 056052004 71189 Personnel Transfer Charges 657,516 652,953 660,000 660,000 660,000
Salaries & Benefits Total 710,696 690,102 726,140 710,760 723,62056052004 72201 Postage 0 31 500 500 50056052004 72305 Uniforms 0 673 2,000 1,000 2,00056052004 72306 Safety Equipment 24,578 23,360 20,000 25,000 20,00056052004 72307 Office Supplies 281 0 3,000 1,000 3,00056052004 72308 Books & Periodicals 434 882 1,000 1,000 1,00056052004 72322 Rental of Equipment 572 2,734 15,000 15,000 15,00056052004 72352 Special Dept Materials 196,437 193,323 175,000 175,000 200,00056052004 72355 General Supplies 259 56 1,000 1,000 1,00056052004 72358 Training and Education 0 0 0 1,500 056052004 72359 Small Tools and Equipment 12,502 11,345 15,000 15,000 15,00056052004 72370 Overtime Meals 747 1,202 0 0 056052004 72399 Supplies & Services NOC (4) 0 50 0 056052004 72450 Misc. Professional Services 0 32,270 20,000 20,000 20,00056052004 72499 Misc Contract Services 5,800 9,829 15,000 7,500 15,00056052004 72531 Repairs to Machines & Equip 850 0 2,000 1,000 2,00056052004 72532 Repairs to Office Equip 0 0 50 0 5056052004 72990 Special Payments 38,491 3 40,000 20,000 15,000
Supplies & Services Total 280,947 275,709 309,600 284,500 309,550Distribution Capacity Total 991,643 965,811 1,035,740 995,260 1,033,170
Surface Water Treatment Plant56052005 71001 Regular Employee Salary 230,828 316,555 355,700 319,900 309,42056052005 71002 Overtime 59,295 83,621 84,420 84,420 84,11056052005 71003 Part-time Salary 16,714 15,508 19,860 19,860 27,66056052005 71007 Uniform Allowance 500 832 1,000 1,000 75056052005 71008 Meal Allowance 10 90 200 200 056052005 71009 Incentive Pay 41 0 0 200 48056052005 71010 Admin Leave Pay 0 3,779 4,010 4,010 4,05056052005 71011 Workers Compensation 16,840 12,420 27,000 27,000 22,08056052005 71012 Medical Insurance 55,585 69,033 88,350 71,390 72,58056052005 71013 Dental Insurance 3,272 4,023 5,000 4,040 4,00056052005 71014 Vision Insurance 818 898 1,250 910 84056052005 71015 Medicare Insurance 4,459 6,051 6,830 6,830 6,18056052005 71021 Service Contribution-PERS 42,544 61,776 77,470 70,190 23,81056052005 71022 Unfunded Acc Liability - PERS 0 0 0 0 45,76056052005 71023 Deferred Comp 4,154 8,330 9,190 10,200 9,28056052005 71024 LI & AD & D 1,430 1,087 1,140 1,140 1,07056052005 71025 Unemployment Insurance 1,331 1,712 1,950 1,790 1,91056052005 71028 LTD 563 1,057 2,480 2,480 1,55056052005 71029 Chiropractic 196 308 300 360 40056052005 71031 Other Benefits 16,200 11,550 21,550 21,550 20,52056052005 71032 Cell Stipend 0 249 0 900 90056052005 71189 Personnel Transfer Charges 97,674 166,572 200,000 200,000 200,000
Salaries & Benefits Total 552,456 765,451 907,700 848,370 837,350
156
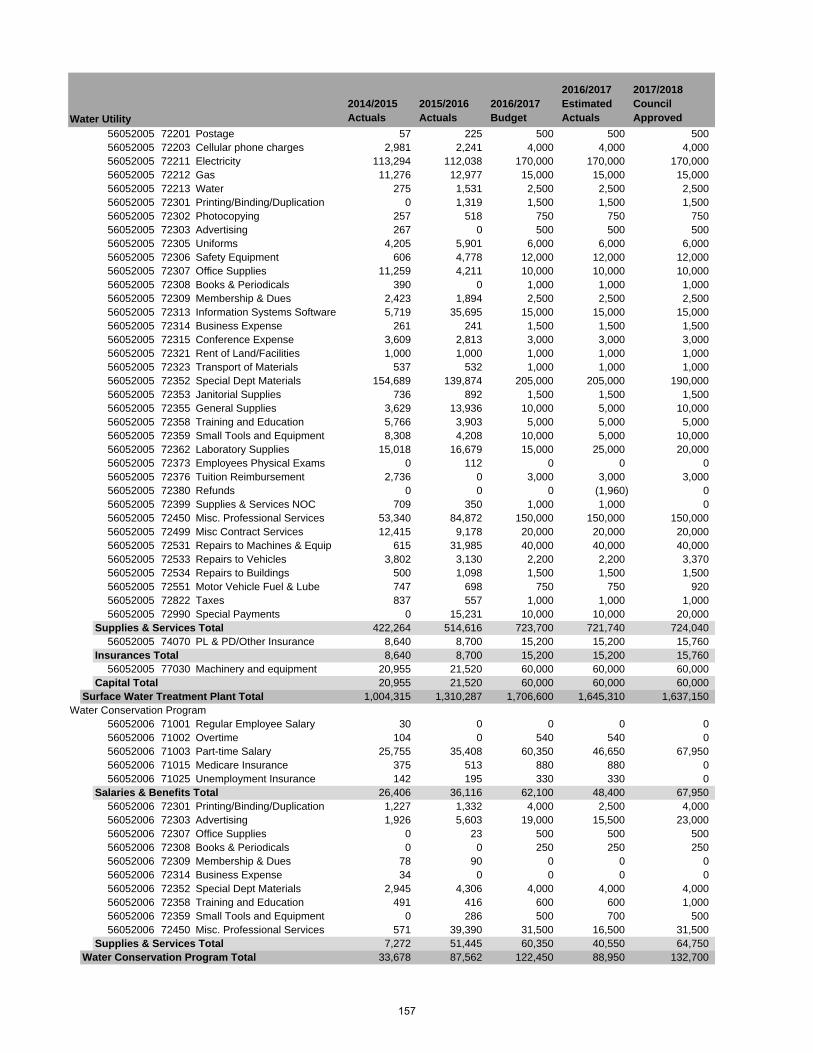
2014/2015 Actuals
2015/2016 Actuals
2016/2017 Budget
2016/2017 Estimated Actuals
2017/2018 Council ApprovedWater Utility
56052005 72201 Postage 57 225 500 500 50056052005 72203 Cellular phone charges 2,981 2,241 4,000 4,000 4,00056052005 72211 Electricity 113,294 112,038 170,000 170,000 170,00056052005 72212 Gas 11,276 12,977 15,000 15,000 15,00056052005 72213 Water 275 1,531 2,500 2,500 2,50056052005 72301 Printing/Binding/Duplication 0 1,319 1,500 1,500 1,50056052005 72302 Photocopying 257 518 750 750 75056052005 72303 Advertising 267 0 500 500 50056052005 72305 Uniforms 4,205 5,901 6,000 6,000 6,00056052005 72306 Safety Equipment 606 4,778 12,000 12,000 12,00056052005 72307 Office Supplies 11,259 4,211 10,000 10,000 10,00056052005 72308 Books & Periodicals 390 0 1,000 1,000 1,00056052005 72309 Membership & Dues 2,423 1,894 2,500 2,500 2,50056052005 72313 Information Systems Software 5,719 35,695 15,000 15,000 15,00056052005 72314 Business Expense 261 241 1,500 1,500 1,50056052005 72315 Conference Expense 3,609 2,813 3,000 3,000 3,00056052005 72321 Rent of Land/Facilities 1,000 1,000 1,000 1,000 1,00056052005 72323 Transport of Materials 537 532 1,000 1,000 1,00056052005 72352 Special Dept Materials 154,689 139,874 205,000 205,000 190,00056052005 72353 Janitorial Supplies 736 892 1,500 1,500 1,50056052005 72355 General Supplies 3,629 13,936 10,000 5,000 10,00056052005 72358 Training and Education 5,766 3,903 5,000 5,000 5,00056052005 72359 Small Tools and Equipment 8,308 4,208 10,000 5,000 10,00056052005 72362 Laboratory Supplies 15,018 16,679 15,000 25,000 20,00056052005 72373 Employees Physical Exams 0 112 0 0 056052005 72376 Tuition Reimbursement 2,736 0 3,000 3,000 3,00056052005 72380 Refunds 0 0 0 (1,960) 056052005 72399 Supplies & Services NOC 709 350 1,000 1,000 056052005 72450 Misc. Professional Services 53,340 84,872 150,000 150,000 150,00056052005 72499 Misc Contract Services 12,415 9,178 20,000 20,000 20,00056052005 72531 Repairs to Machines & Equip 615 31,985 40,000 40,000 40,00056052005 72533 Repairs to Vehicles 3,802 3,130 2,200 2,200 3,37056052005 72534 Repairs to Buildings 500 1,098 1,500 1,500 1,50056052005 72551 Motor Vehicle Fuel & Lube 747 698 750 750 92056052005 72822 Taxes 837 557 1,000 1,000 1,00056052005 72990 Special Payments 0 15,231 10,000 10,000 20,000
Supplies & Services Total 422,264 514,616 723,700 721,740 724,04056052005 74070 PL & PD/Other Insurance 8,640 8,700 15,200 15,200 15,760
Insurances Total 8,640 8,700 15,200 15,200 15,76056052005 77030 Machinery and equipment 20,955 21,520 60,000 60,000 60,000
Capital Total 20,955 21,520 60,000 60,000 60,000Surface Water Treatment Plant Total 1,004,315 1,310,287 1,706,600 1,645,310 1,637,150
Water Conservation Program56052006 71001 Regular Employee Salary 30 0 0 0 056052006 71002 Overtime 104 0 540 540 056052006 71003 Part-time Salary 25,755 35,408 60,350 46,650 67,95056052006 71015 Medicare Insurance 375 513 880 880 056052006 71025 Unemployment Insurance 142 195 330 330 0
Salaries & Benefits Total 26,406 36,116 62,100 48,400 67,95056052006 72301 Printing/Binding/Duplication 1,227 1,332 4,000 2,500 4,00056052006 72303 Advertising 1,926 5,603 19,000 15,500 23,00056052006 72307 Office Supplies 0 23 500 500 50056052006 72308 Books & Periodicals 0 0 250 250 25056052006 72309 Membership & Dues 78 90 0 0 056052006 72314 Business Expense 34 0 0 0 056052006 72352 Special Dept Materials 2,945 4,306 4,000 4,000 4,00056052006 72358 Training and Education 491 416 600 600 1,00056052006 72359 Small Tools and Equipment 0 286 500 700 50056052006 72450 Misc. Professional Services 571 39,390 31,500 16,500 31,500
Supplies & Services Total 7,272 51,445 60,350 40,550 64,750Water Conservation Program Total 33,678 87,562 122,450 88,950 132,700
157
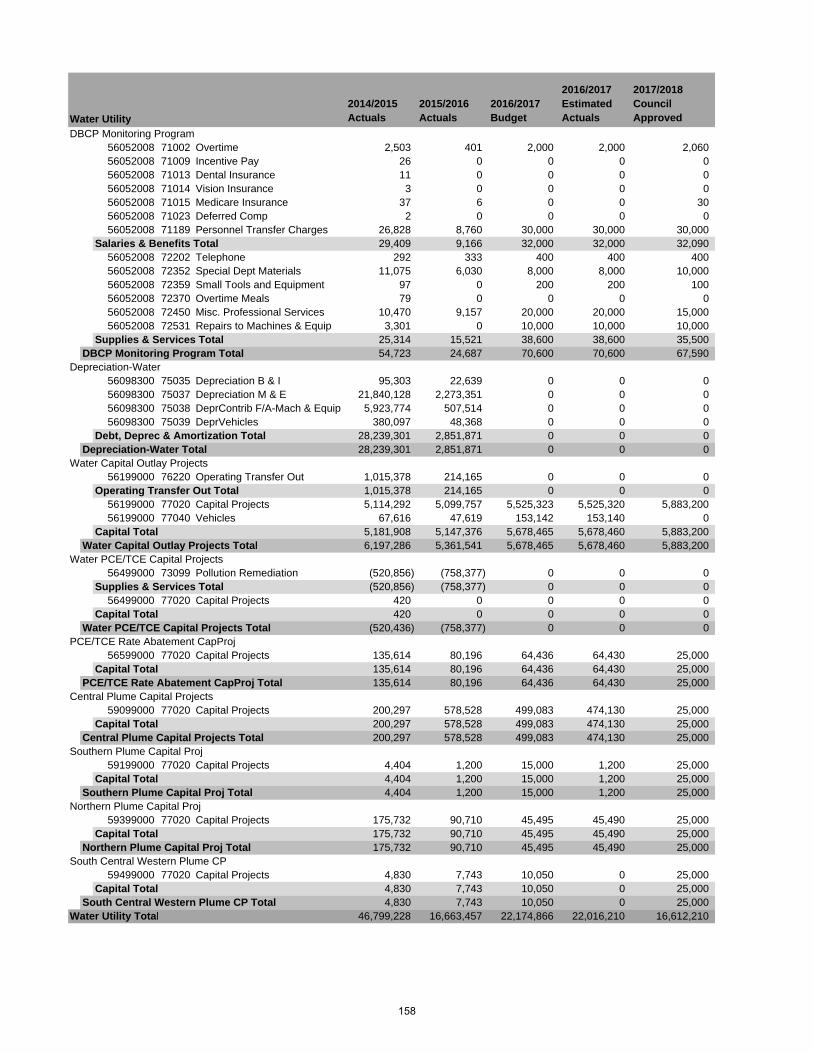
2014/2015 Actuals
2015/2016 Actuals
2016/2017 Budget
2016/2017 Estimated Actuals
2017/2018 Council ApprovedWater Utility
DBCP Monitoring Program56052008 71002 Overtime 2,503 401 2,000 2,000 2,06056052008 71009 Incentive Pay 26 0 0 0 056052008 71013 Dental Insurance 11 0 0 0 056052008 71014 Vision Insurance 3 0 0 0 056052008 71015 Medicare Insurance 37 6 0 0 3056052008 71023 Deferred Comp 2 0 0 0 056052008 71189 Personnel Transfer Charges 26,828 8,760 30,000 30,000 30,000
Salaries & Benefits Total 29,409 9,166 32,000 32,000 32,09056052008 72202 Telephone 292 333 400 400 40056052008 72352 Special Dept Materials 11,075 6,030 8,000 8,000 10,00056052008 72359 Small Tools and Equipment 97 0 200 200 10056052008 72370 Overtime Meals 79 0 0 0 056052008 72450 Misc. Professional Services 10,470 9,157 20,000 20,000 15,00056052008 72531 Repairs to Machines & Equip 3,301 0 10,000 10,000 10,000
Supplies & Services Total 25,314 15,521 38,600 38,600 35,500DBCP Monitoring Program Total 54,723 24,687 70,600 70,600 67,590
Depreciation-Water56098300 75035 Depreciation B & I 95,303 22,639 0 0 056098300 75037 Depreciation M & E 21,840,128 2,273,351 0 0 056098300 75038 DeprContrib F/A-Mach & Equip 5,923,774 507,514 0 0 056098300 75039 DeprVehicles 380,097 48,368 0 0 0
Debt, Deprec & Amortization Total 28,239,301 2,851,871 0 0 0Depreciation-Water Total 28,239,301 2,851,871 0 0 0
Water Capital Outlay Projects56199000 76220 Operating Transfer Out 1,015,378 214,165 0 0 0
Operating Transfer Out Total 1,015,378 214,165 0 0 056199000 77020 Capital Projects 5,114,292 5,099,757 5,525,323 5,525,320 5,883,20056199000 77040 Vehicles 67,616 47,619 153,142 153,140 0
Capital Total 5,181,908 5,147,376 5,678,465 5,678,460 5,883,200Water Capital Outlay Projects Total 6,197,286 5,361,541 5,678,465 5,678,460 5,883,200
Water PCE/TCE Capital Projects56499000 73099 Pollution Remediation (520,856) (758,377) 0 0 0
Supplies & Services Total (520,856) (758,377) 0 0 056499000 77020 Capital Projects 420 0 0 0 0
Capital Total 420 0 0 0 0Water PCE/TCE Capital Projects Total (520,436) (758,377) 0 0 0
PCE/TCE Rate Abatement CapProj56599000 77020 Capital Projects 135,614 80,196 64,436 64,430 25,000
Capital Total 135,614 80,196 64,436 64,430 25,000PCE/TCE Rate Abatement CapProj Total 135,614 80,196 64,436 64,430 25,000
Central Plume Capital Projects59099000 77020 Capital Projects 200,297 578,528 499,083 474,130 25,000
Capital Total 200,297 578,528 499,083 474,130 25,000Central Plume Capital Projects Total 200,297 578,528 499,083 474,130 25,000
Southern Plume Capital Proj59199000 77020 Capital Projects 4,404 1,200 15,000 1,200 25,000
Capital Total 4,404 1,200 15,000 1,200 25,000Southern Plume Capital Proj Total 4,404 1,200 15,000 1,200 25,000
Northern Plume Capital Proj59399000 77020 Capital Projects 175,732 90,710 45,495 45,490 25,000
Capital Total 175,732 90,710 45,495 45,490 25,000Northern Plume Capital Proj Total 175,732 90,710 45,495 45,490 25,000
South Central Western Plume CP59499000 77020 Capital Projects 4,830 7,743 10,050 0 25,000
Capital Total 4,830 7,743 10,050 0 25,000South Central Western Plume CP Total 4,830 7,743 10,050 0 25,000
Water Utility Total 46,799,228 16,663,457 22,174,866 22,016,210 16,612,210
158
WASTEWATER UTILITY The Wastewater Utility, managed by the Public Works Department, is responsible for collecting, conveying and treating 2.4 billion gallons of wastewater a year at the White Slough Water Pollution Control Facility. It also manages the City’s storm drain system. The utility has a budget of $17,294,260 in FY 2017/18, compared to $20,965,390 as originally budgeted in FY 2016/17. The 2016/17 budget shown in the following pages reflects adjustments made throughout the year. FY 2017/18 Water Services budgeted staffing is being decreased by 1 to 57 positions. The Wastewater utility shares staff with the Water Utility. An organizational chart, staffing summary, detailed activity descriptions and financial tables are included in the following pages.
159

(This page intentionally left blank)
160
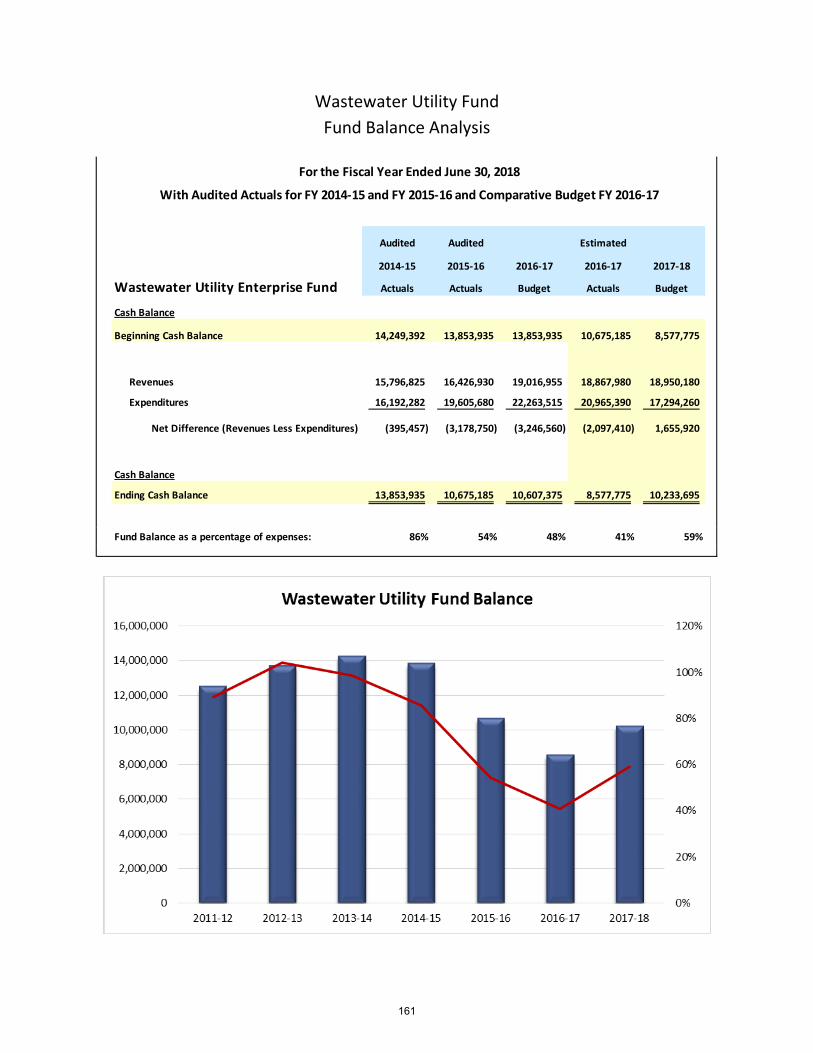
Wastewater Utility Fund Fund Balance Analysis
Audited Audited Estimated
2014-15 2015-16 2016-17 2016-17 2017-18
Wastewater Utility Enterprise Fund Actuals Actuals Budget Actuals Budget
Cash Balance
Beginning Cash Balance 14,249,392 13,853,935 13,853,935 10,675,185 8,577,775
Revenues 15,796,825 16,426,930 19,016,955 18,867,980 18,950,180
Expenditures 16,192,282 19,605,680 22,263,515 20,965,390 17,294,260
Net Difference (Revenues Less Expenditures) (395,457) (3,178,750) (3,246,560) (2,097,410) 1,655,920
Cash Balance
Ending Cash Balance 13,853,935 10,675,185 10,607,375 8,577,775 10,233,695
Fund Balance as a percentage of expenses: 86% 54% 48% 41% 59%
For the Fiscal Year Ended June 30, 2018
With Audited Actuals for FY 2014-15 and FY 2015-16 and Comparative Budget FY 2016-17
161
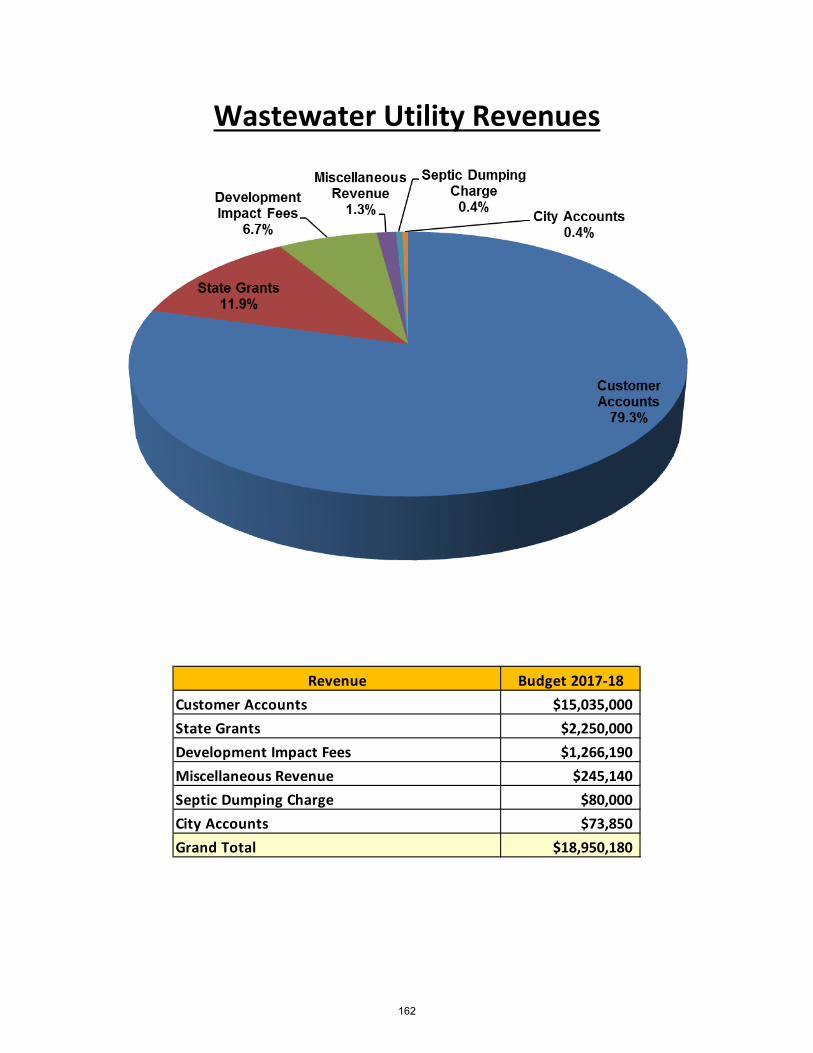
Wastewater Utility Revenues
Revenue Budget 2017-18Customer Accounts $15,035,000State Grants $2,250,000Development Impact Fees $1,266,190Miscellaneous Revenue $245,140Septic Dumping Charge $80,000City Accounts $73,850Grand Total $18,950,180
162
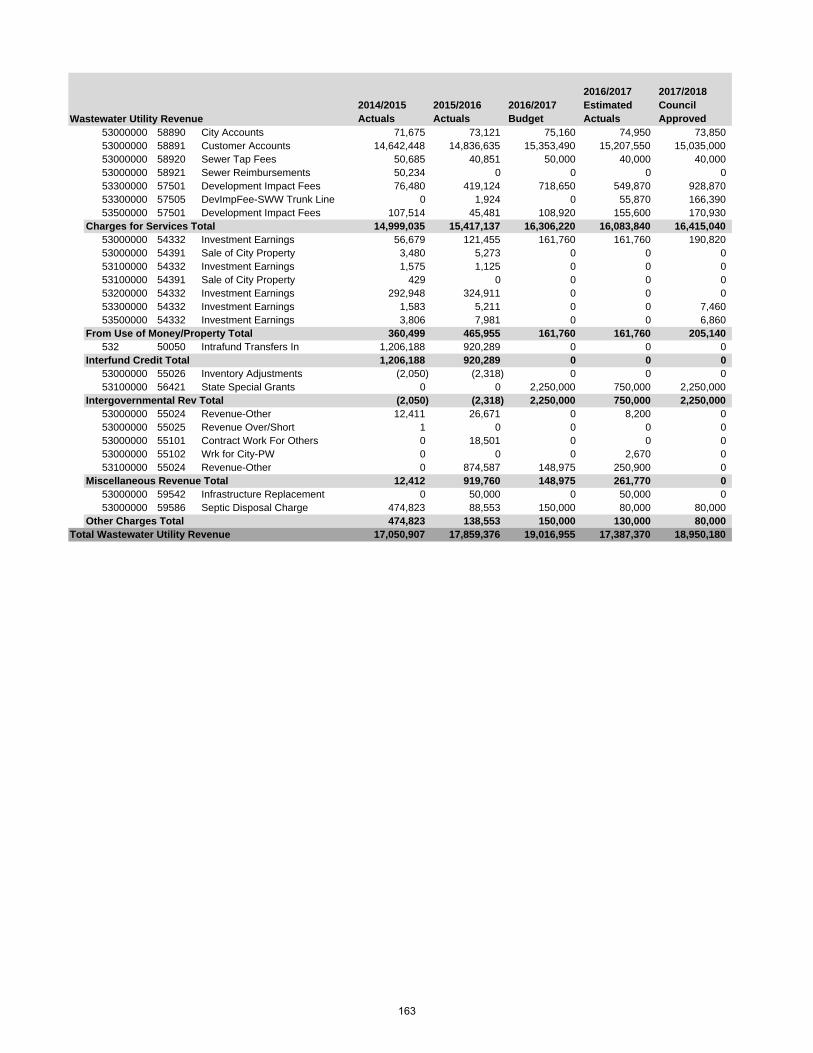
2014/2015 Actuals
2015/2016 Actuals
2016/2017 Budget
2016/2017 Estimated Actuals
2017/2018 Council Approved
53000000 58890 City Accounts 71,675 73,121 75,160 74,950 73,85053000000 58891 Customer Accounts 14,642,448 14,836,635 15,353,490 15,207,550 15,035,00053000000 58920 Sewer Tap Fees 50,685 40,851 50,000 40,000 40,00053000000 58921 Sewer Reimbursements 50,234 0 0 0 053300000 57501 Development Impact Fees 76,480 419,124 718,650 549,870 928,87053300000 57505 DevImpFee-SWW Trunk Line 0 1,924 0 55,870 166,39053500000 57501 Development Impact Fees 107,514 45,481 108,920 155,600 170,930
Charges for Services Total 14,999,035 15,417,137 16,306,220 16,083,840 16,415,04053000000 54332 Investment Earnings 56,679 121,455 161,760 161,760 190,82053000000 54391 Sale of City Property 3,480 5,273 0 0 053100000 54332 Investment Earnings 1,575 1,125 0 0 053100000 54391 Sale of City Property 429 0 0 0 053200000 54332 Investment Earnings 292,948 324,911 0 0 053300000 54332 Investment Earnings 1,583 5,211 0 0 7,46053500000 54332 Investment Earnings 3,806 7,981 0 0 6,860
From Use of Money/Property Total 360,499 465,955 161,760 161,760 205,140532 50050 Intrafund Transfers In 1,206,188 920,289 0 0 0
Interfund Credit Total 1,206,188 920,289 0 0 053000000 55026 Inventory Adjustments (2,050) (2,318) 0 0 053100000 56421 State Special Grants 0 0 2,250,000 750,000 2,250,000
Intergovernmental Rev Total (2,050) (2,318) 2,250,000 750,000 2,250,00053000000 55024 Revenue-Other 12,411 26,671 0 8,200 053000000 55025 Revenue Over/Short 1 0 0 0 053000000 55101 Contract Work For Others 0 18,501 0 0 053000000 55102 Wrk for City-PW 0 0 0 2,670 053100000 55024 Revenue-Other 0 874,587 148,975 250,900 0
Miscellaneous Revenue Total 12,412 919,760 148,975 261,770 053000000 59542 Infrastructure Replacement 0 50,000 0 50,000 053000000 59586 Septic Disposal Charge 474,823 88,553 150,000 80,000 80,000
Other Charges Total 474,823 138,553 150,000 130,000 80,000Total Wastewater Utility Revenue 17,050,907 17,859,376 19,016,955 17,387,370 18,950,180
Wastewater Utility Revenue
163

(This page intentionally left blank)
164

Util
ities
FY 2
017-
2018
Num
ber o
f pos
ition
sAu
thor
ized
: 57
M.U
.S. W
ater
/W
aste
wat
er
Ope
ratio
ns
Whi
te S
loug
h W
aste
wat
er
Trea
tmen
t
Util
ities
S
uper
inte
nden
t (1
)
Was
tew
ater
M
aint
enan
ce
Wat
er/
Was
tew
ater
Se
rvic
e
Wat
er/
Was
tew
ater
C
onst
ruct
ion
Wat
er/
Was
tew
ater
S
uper
viso
r (1
)
Pla
nt &
E
quip
men
t M
echa
nic
(5)
W/W
W
Mai
nten
ance
W
orke
r (4
)
Wat
er/
Was
tew
ater
Su
perv
isor
(1
)
W/W
W
Mai
nten
ance
W
orke
r III
(2)
Wat
er/
Was
tew
ater
S
uper
viso
r (1
)
W/W
W
Mai
nten
ance
W
orke
r III
(3)
Was
tew
ater
Pla
nt
Sup
erin
tend
ent
(1)
Chi
ef W
aste
wat
er
Plan
t Ope
rato
r(1
)
Envi
ronm
enta
l C
ompl
ianc
e In
spec
tor
(3)
Labo
rato
ry
Tech
nici
an I/
II (2
)
Ope
ratio
nsPl
ant &
Eq
uipm
ent
Mai
nten
ance
Was
tew
ater
Pla
nt
Ope
rato
r I/II
/III
(5)
Wat
er/
Was
tew
ater
S
uper
viso
r (1
)
Pla
nt &
E
quip
men
t M
echa
nic
(2)
W/W
WM
aint
enan
ce
Wor
ker
(1)
Tech
nica
l Se
rvic
es
Wat
er S
ervi
ces
Tech
nici
an (1
)
Util
ities
Man
ager
(1
)
Com
plia
nce
Eng
inee
r(1
)S
enio
r S
tore
keep
er(1
)
Surf
ace
Wat
er
Trea
tmen
t
Wat
er/
Was
tew
ater
La
bora
tory
Wat
er/
Was
tew
ater
In
spec
tion
Adm
inis
trativ
e S
ecre
tary
(1)
Adm
inis
trativ
e C
lerk
(2
)
Ele
ctric
ian
(1)
Lead
Ele
ctric
ian
(1)
Wat
ersh
ed
Prog
ram
C
oord
inat
or
(1)
Labo
rato
ry
Sup
ervi
sor
(1)
Wat
er P
lant
Su
perin
tend
ent
(1)
Adm
inis
trativ
e C
lerk
(1)
Engi
neer
ing
Aid
e(1
)
Ele
ctric
ian
(1)
Pla
nt &
Equ
ipm
ent
Mec
hani
c(1
)
Wat
er T
reat
men
t Pl
ant O
pera
tor
I/II/I
II(3
)
W/W
WM
aint
enan
ceW
orke
r(1
)
W/W
W
Mai
nten
ance
W
orke
r(2
)
Mai
nten
ance
W
orke
r(1
)
Com
plia
nce
Con
serv
atio
n W
ater
shed
Ed
ucat
ion
165

2014/2015 Actuals
2015/2016 Actuals
2016/2017 Budget
2016/2017 Estimated Actuals
2017/2018 Council Approved
Salaries 2,939,526 3,217,579 3,535,730 3,429,840 3,572,360PERS - Normal Costs 498,007 (364,419) 723,350 709,050 253,890PERS - UAL 0 0 0 0 487,920Other Benefits 1,283,060 1,678,968 1,547,700 1,543,180 1,616,490Staff Transfers (1,446,899) (1,608,557) (2,632,880) (2,632,880) (2,352,380)Supplies & Services 3,075,410 2,487,106 3,678,116 3,507,490 3,238,610Insurances 105,840 153,700 197,600 202,690 204,880Debt, Deprec & Amortization 48,631,835 6,580,497 3,122,930 3,122,930 3,465,000Operating Transfer Out 3,100,566 2,202,454 1,101,500 1,101,500 1,102,490Capital 4,978,032 1,876,781 10,989,469 7,314,470 5,705,000
Total Wastewater Utility 63,165,375 16,224,111 22,263,515 18,298,270 17,294,260
STAFFING SUMMARY
2014/15 2015/16 2016/17 2017/18Positions Positions Positions Positions
WATER SERVICES Administrative Clerk 1 2 2 3Administrative Secretary 1 1 1 1Chief Wastewater Plant Operator 1 1 1 1Compliance Engineer 1 1 1 1Deputy Public Works Director - Utilities 1 0 0 0Electrician 3 3 3 2Engineering Aide 1 1 1 1Environmental Compliance Inspector 3 3 3 3Laboratory Supervisor 0 1 1 1Laboratory Technician I/II 2 2 2 2Lead Electrician 1 1 1 1Maintenance Worker I/II 3 3 3 1Plant & Equipment Mechanic 7 7 8 8Senior Administrative Clerk 1 1 1 0Senior Storekeeper 1 1 1 1Utilities Manager 0 1 1 1Utility Superintendent 1 1 1 1Wastewater Plant Operator I/II/III 6 5 5 5Wastewater Plant Superintendent 1 1 1 1Water Plant Superintendent 1 1 1 1Water Services Technician 1 1 1 1Water Treatment Plant Operator I/II/III 3 3 3 3Watershed Program Coordinator 1 1 1 1Water/Wastewater Maintenance Worker I/II 5 6 6 8Water/Wastewater Maintenance Worker III 5 5 5 5Water/Wastewater Supervisor 4 4 4 4
55 57 58 57
Wastewater Utility
166
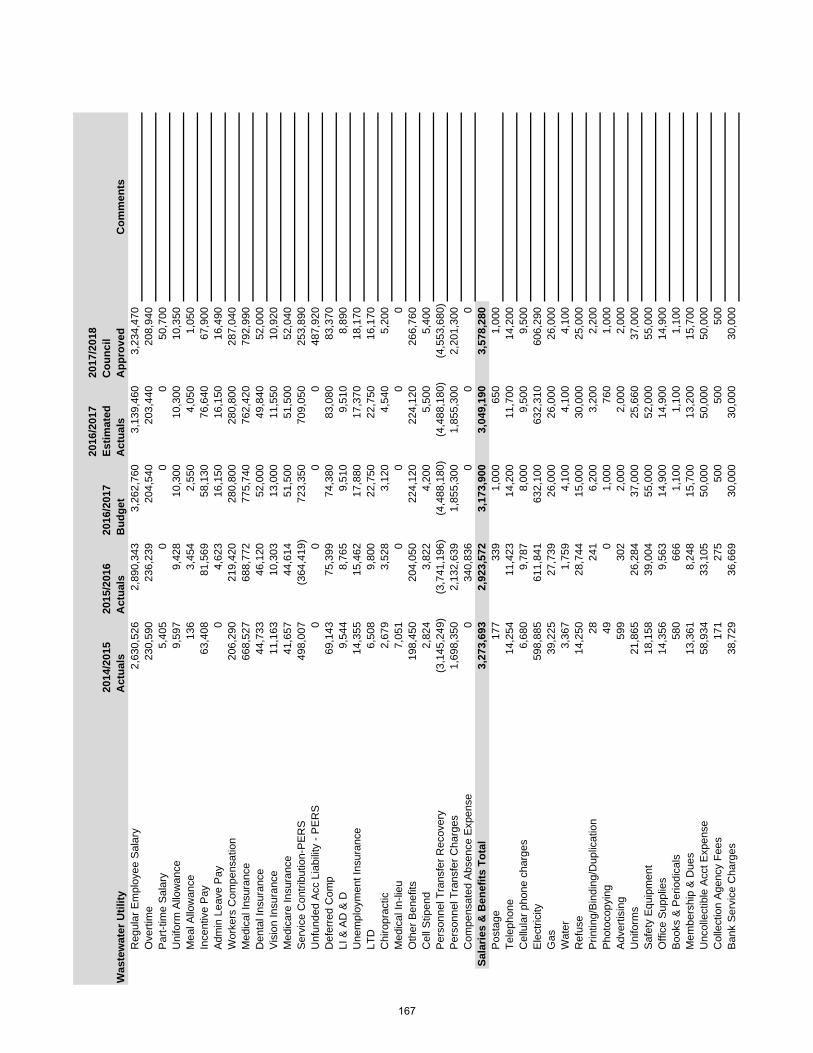
2014
/201
5 A
ctua
ls20
15/2
016
Act
uals
2016
/201
7 B
udge
t
2016
/201
7 Es
timat
ed
Act
uals
2017
/201
8 C
ounc
il A
ppro
ved
Com
men
tsR
egul
ar E
mpl
oyee
Sal
ary
2,63
0,52
62,
890,
343
3,26
2,76
03,
139,
460
3,23
4,47
0O
verti
me
230,
590
236,
239
204,
540
203,
440
208,
940
Par
t-tim
e S
alar
y 5,
405
00
050
,700
Uni
form
Allo
wan
ce
9,59
79,
428
10,3
0010
,300
10,3
50M
eal A
llow
ance
13
63,
454
2,55
04,
050
1,05
0In
cent
ive
Pay
63
,408
81,5
6958
,130
76,6
4067
,900
Adm
in L
eave
Pay
0
4,62
316
,150
16,1
5016
,490
Wor
kers
Com
pens
atio
n 20
6,29
021
9,42
028
0,80
028
0,80
028
7,04
0M
edic
al In
sura
nce
668,
527
688,
772
775,
740
762,
420
792,
990
Den
tal I
nsur
ance
44
,733
46,1
2052
,000
49,8
4052
,000
Vis
ion
Insu
ranc
e 11
,163
10,3
0313
,000
11,5
5010
,920
Med
icar
e In
sura
nce
41,6
5744
,614
51,5
0051
,500
52,0
40S
ervi
ce C
ontri
butio
n-P
ER
S
498,
007
(364
,419
)72
3,35
070
9,05
025
3,89
0U
nfun
ded
Acc
Lia
bilit
y - P
ER
S
00
00
487,
920
Def
erre
d C
omp
69,1
4375
,399
74,3
8083
,080
83,3
70LI
& A
D &
D
9,54
48,
765
9,51
09,
510
8,89
0U
nem
ploy
men
t Ins
uran
ce
14,3
5515
,462
17,8
8017
,370
18,1
70LT
D
6,50
89,
800
22,7
5022
,750
16,1
70C
hiro
prac
tic
2,67
93,
528
3,12
04,
540
5,20
0M
edic
al In
-lieu
7,
051
00
00
Oth
er B
enef
its
198,
450
204,
050
224,
120
224,
120
266,
760
Cel
l Stip
end
2,82
43,
822
4,20
05,
500
5,40
0P
erso
nnel
Tra
nsfe
r Rec
over
y (3
,145
,249
)(3
,741
,196
)(4
,488
,180
)(4
,488
,180
)(4
,553
,680
)P
erso
nnel
Tra
nsfe
r Cha
rges
1,
698,
350
2,13
2,63
91,
855,
300
1,85
5,30
02,
201,
300
Com
pens
ated
Abs
ence
Exp
ense
0
340,
836
00
0Sa
larie
s &
Ben
efits
Tot
al3,
273,
693
2,92
3,57
23,
173,
900
3,04
9,19
03,
578,
280
Pos
tage
17
733
91,
000
650
1,00
0Te
leph
one
14,2
5411
,423
14,2
0011
,700
14,2
00C
ellu
lar p
hone
cha
rges
6,
680
9,78
78,
000
9,50
09,
500
Ele
ctric
ity
598,
885
611,
841
632,
100
632,
310
606,
290
Gas
39
,225
27,7
3926
,000
26,0
0026
,000
Wat
er
3,36
71,
759
4,10
04,
100
4,10
0R
efus
e 14
,250
28,7
4415
,000
30,0
0025
,000
Prin
ting/
Bin
ding
/Dup
licat
ion
2824
16,
200
3,20
02,
200
Pho
toco
pyin
g 49
01,
000
760
1,00
0A
dver
tisin
g 59
930
22,
000
2,00
02,
000
Uni
form
s 21
,865
26,2
8437
,000
25,6
6037
,000
Saf
ety
Equ
ipm
ent
18,1
5839
,004
55,0
0052
,000
55,0
00O
ffice
Sup
plie
s 14
,356
9,56
314
,900
14,9
0014
,900
Boo
ks &
Per
iodi
cals
58
066
61,
100
1,10
01,
100
Mem
bers
hip
& D
ues
13,3
618,
248
15,7
0013
,200
15,7
00U
ncol
lect
ible
Acc
t Exp
ense
58
,934
33,1
0550
,000
50,0
0050
,000
Col
lect
ion
Age
ncy
Fees
17
127
550
050
050
0B
ank
Ser
vice
Cha
rges
38
,729
36,6
6930
,000
30,0
0030
,000
Was
tew
ater
Util
ity
167
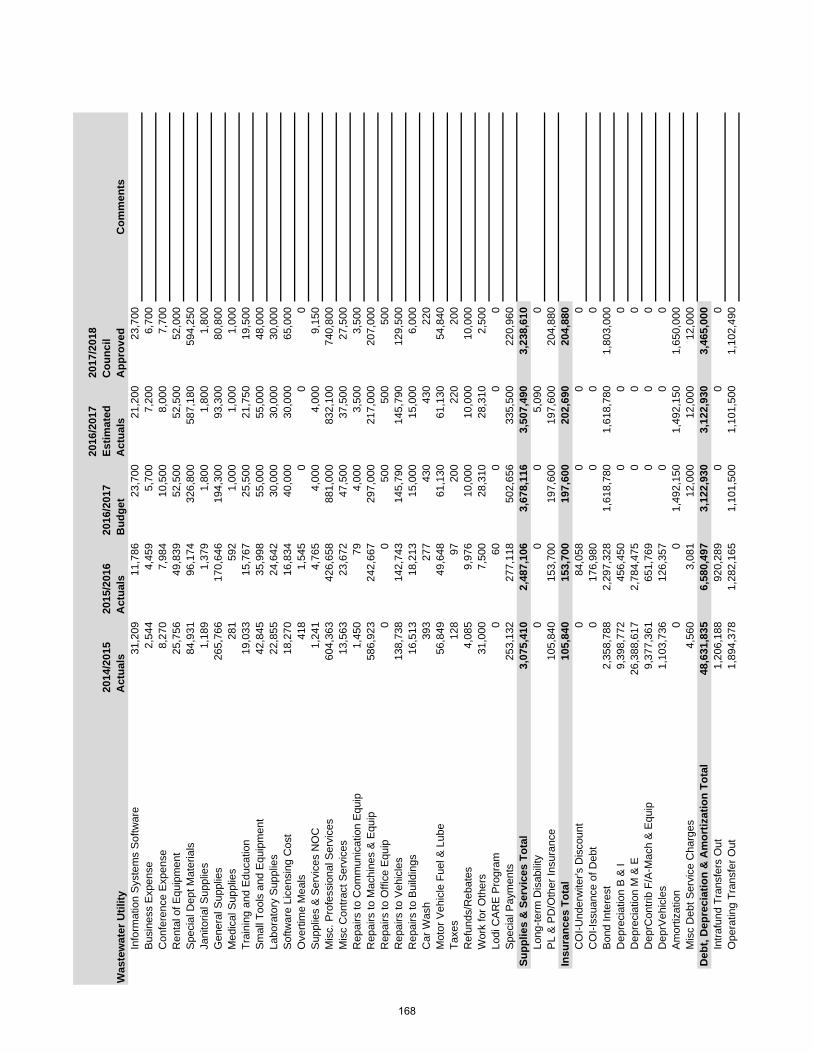
2014
/201
5 A
ctua
ls20
15/2
016
Act
uals
2016
/201
7 B
udge
t
2016
/201
7 Es
timat
ed
Act
uals
2017
/201
8 C
ounc
il A
ppro
ved
Com
men
tsW
aste
wat
er U
tility
Info
rmat
ion
Sys
tem
s S
oftw
are
31,2
0911
,786
23,7
0021
,200
23,7
00B
usin
ess
Exp
ense
2,
544
4,45
95,
700
7,20
06,
700
Con
fere
nce
Exp
ense
8,
270
7,98
410
,500
8,00
07,
700
Ren
tal o
f Equ
ipm
ent
25,7
5649
,839
52,5
0052
,500
52,0
00S
peci
al D
ept M
ater
ials
84
,931
96,1
7432
6,80
058
7,18
059
4,25
0Ja
nito
rial S
uppl
ies
1,18
91,
379
1,80
01,
800
1,80
0G
ener
al S
uppl
ies
265,
766
170,
646
194,
300
93,3
0080
,800
Med
ical
Sup
plie
s 28
159
21,
000
1,00
01,
000
Trai
ning
and
Edu
catio
n 19
,033
15,7
6725
,500
21,7
5019
,500
Sm
all T
ools
and
Equ
ipm
ent
42,8
4535
,998
55,0
0055
,000
48,0
00La
bora
tory
Sup
plie
s 22
,855
24,6
4230
,000
30,0
0030
,000
Sof
twar
e Li
cens
ing
Cos
t 18
,270
16,8
3440
,000
30,0
0065
,000
Ove
rtim
e M
eals
418
1,54
50
00
Sup
plie
s &
Ser
vice
s N
OC
1,
241
4,76
54,
000
4,00
09,
150
Mis
c. P
rofe
ssio
nal S
ervi
ces
604,
363
426,
658
881,
000
832,
100
740,
800
Mis
c C
ontra
ct S
ervi
ces
13,5
6323
,672
47,5
0037
,500
27,5
00R
epai
rs to
Com
mun
icat
ion
Equ
ip
1,45
079
4,00
03,
500
3,50
0R
epai
rs to
Mac
hine
s &
Equ
ip
586,
923
242,
667
297,
000
217,
000
207,
000
Rep
airs
to O
ffice
Equ
ip
00
500
500
500
Rep
airs
to V
ehic
les
138,
738
142,
743
145,
790
145,
790
129,
500
Rep
airs
to B
uild
ings
16
,513
18,2
1315
,000
15,0
006,
000
Car
Was
h 39
327
743
043
022
0M
otor
Veh
icle
Fue
l & L
ube
56,8
4949
,648
61,1
3061
,130
54,8
40Ta
xes
128
9720
022
020
0R
efun
ds/R
ebat
es
4,08
59,
976
10,0
0010
,000
10,0
00W
ork
for O
ther
s 31
,000
7,50
028
,310
28,3
102,
500
Lodi
CA
RE
Pro
gram
0
600
00
Spe
cial
Pay
men
ts
253,
132
277,
118
502,
656
335,
500
220,
960
Supp
lies
& S
ervi
ces
Tota
l3,
075,
410
2,48
7,10
63,
678,
116
3,50
7,49
03,
238,
610
Long
-term
Dis
abili
ty
00
05,
090
0P
L &
PD
/Oth
er In
sura
nce
105,
840
153,
700
197,
600
197,
600
204,
880
Insu
ranc
es T
otal
105,
840
153,
700
197,
600
202,
690
204,
880
CO
I-Und
erw
iter's
Dis
coun
t 0
84,0
580
00
CO
I-Iss
uanc
e of
Deb
t 0
176,
980
00
0B
ond
Inte
rest
2,
358,
788
2,29
7,32
81,
618,
780
1,61
8,78
01,
803,
000
Dep
reci
atio
n B
& I
9,39
8,77
245
6,45
00
00
Dep
reci
atio
n M
& E
26
,388
,617
2,78
4,47
50
00
Dep
rCon
trib
F/A
-Mac
h &
Equ
ip
9,37
7,36
165
1,76
90
00
Dep
rVeh
icle
s 1,
103,
736
126,
357
00
0A
mor
tizat
ion
00
1,49
2,15
01,
492,
150
1,65
0,00
0M
isc
Deb
t Ser
vice
Cha
rges
4,
560
3,08
112
,000
12,0
0012
,000
Deb
t, D
epre
ciat
ion
& A
mor
tizat
ion
Tota
l48
,631
,835
6,58
0,49
73,
122,
930
3,12
2,93
03,
465,
000
Intra
fund
Tra
nsfe
rs O
ut
1,20
6,18
892
0,28
90
00
Ope
ratin
g Tr
ansf
er O
ut
1,89
4,37
81,
282,
165
1,10
1,50
01,
101,
500
1,10
2,49
0
168
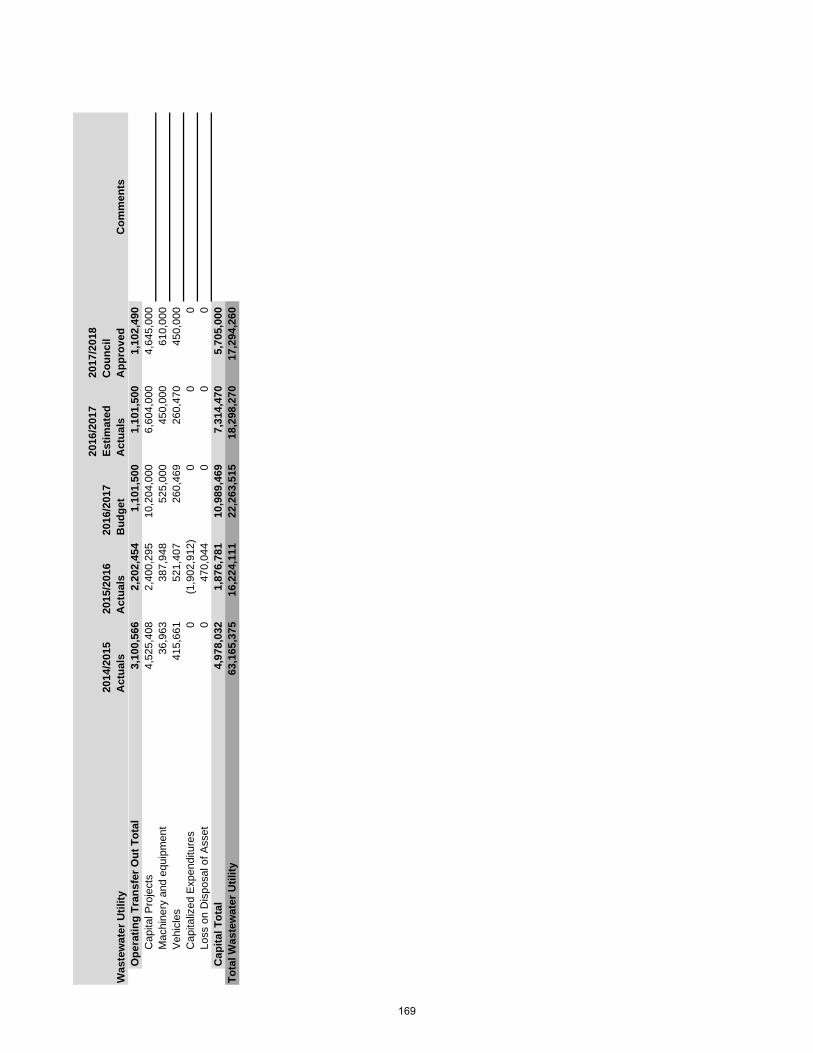
2014
/201
5 A
ctua
ls20
15/2
016
Act
uals
2016
/201
7 B
udge
t
2016
/201
7 Es
timat
ed
Act
uals
2017
/201
8 C
ounc
il A
ppro
ved
Com
men
tsW
aste
wat
er U
tility
Ope
ratin
g Tr
ansf
er O
ut T
otal
3,10
0,56
62,
202,
454
1,10
1,50
01,
101,
500
1,10
2,49
0C
apita
l Pro
ject
s 4,
525,
408
2,40
0,29
510
,204
,000
6,60
4,00
04,
645,
000
Mac
hine
ry a
nd e
quip
men
t 36
,963
387,
948
525,
000
450,
000
610,
000
Veh
icle
s 41
5,66
152
1,40
726
0,46
926
0,47
045
0,00
0C
apita
lized
Exp
endi
ture
s 0
(1,9
02,9
12)
00
0Lo
ss o
n D
ispo
sal o
f Ass
et
047
0,04
40
00
Cap
ital T
otal
4,97
8,03
21,
876,
781
10,9
89,4
697,
314,
470
5,70
5,00
0To
tal W
aste
wat
er U
tilit y
63,1
65,3
7516
,224
,111
22,2
63,5
1518
,298
,270
17,2
94,2
60
169
PUBLIC UTILITIES ACTIVITY: Wastewater Utility DIVISION: Utilities - Wastewater DEPARTMENT: Public Works FUND: Wastewater Fund ACTIVITY DESCRIPTION The Wastewater Utility activity includes the operation of the White Slough Water Pollution Control facility (Treatment Plant) which treats the City's wastewater to tertiary levels (located approximately six miles west of town); the maintenance of wastewater pipelines and lift stations that convey wastewater to the Treatment Plant; and the maintenance of storm drain pipelines and lift stations that convey storm water to various points of discharge. Activity goals are to provide uninterrupted service from source to treatment facilities and/or points of discharge without blockages or overflows; minimize the City's impact on the environment by consistently treating wastewater that meets all Federal and State standards; and continue recycling and land disposal of treatment effluent and industrial wastewater (cannery). This activity has six major elements:
• Wastewater Administration - directs, supervises, and plans operation of wastewater utility, prepares studies/reports, responsible for compliance with State and Federal regulations/legislation on operations and discharge requirements, budget preparation/control, and represents City with other agencies and committees on matters regarding wastewater operations and treatment.
• Domestic Collection System - operates, maintains, and repairs domestic wastewater collection system, including 190 miles of domestic wastewater collection mains, service laterals for over 23,000 customers, approximately 3,200 manholes and 8 domestic pumping stations. Maintains compliance with Sewer System Management Plan by performing hydro cleaning and closed circuit TV operations.
• Industrial Collection System - operates, maintains, and repairs industrial wastewater collection system, including 10 miles of industrial wastewater collection mains, 83 manholes, 4.5 miles of 30-inch diameter "IW outfall" line, one pumping station, and seven service laterals.
• Treatment Facility - operates and maintains a tertiary treatment facility which operates 7 days per week, 24 hours per day, and manned 16 hours per day. Treats an annual average domestic flow of 2.4 billion gallons and an annual average industrial flow of 100 million gallons per year. Utilizes recycled biosolids in accordance with discharge permit requirements.
• Laboratory Services - State-certified lab analyzes untreated and treated wastewater to determine chemical/physical/bacteriological characteristics to evaluate treatment plant effectiveness; samples and analyzes City drinking water to monitor water quality and compliance with State regulations; and administers enforcement of City's pretreatment and cross connection programs.
• Storm Drain Collection System - operates, maintains, and repairs storm drain collection system, including approximately 162 miles of storm drain pipeline, 13 pump stations, and over 3,300 catch basins. Includes compliance with City's discharge permit requirements, including public education, illicit discharge detection and elimination, construction site storm water management, and pollution prevention.
MAJOR 2016-17 ACCOMPLISHMENTS
• White Slough WPCF corrosion repairs. • Implementation of asset management and preventative maintenance system. • White Slough WPCF digester #3 cleaning.
MAJOR 2017-18 OBJECTIVES
• Rehabilitate Ham and Century sewer trunk lines. • Fat, oil, and grease program. • White Slough WPCF improvements.
170
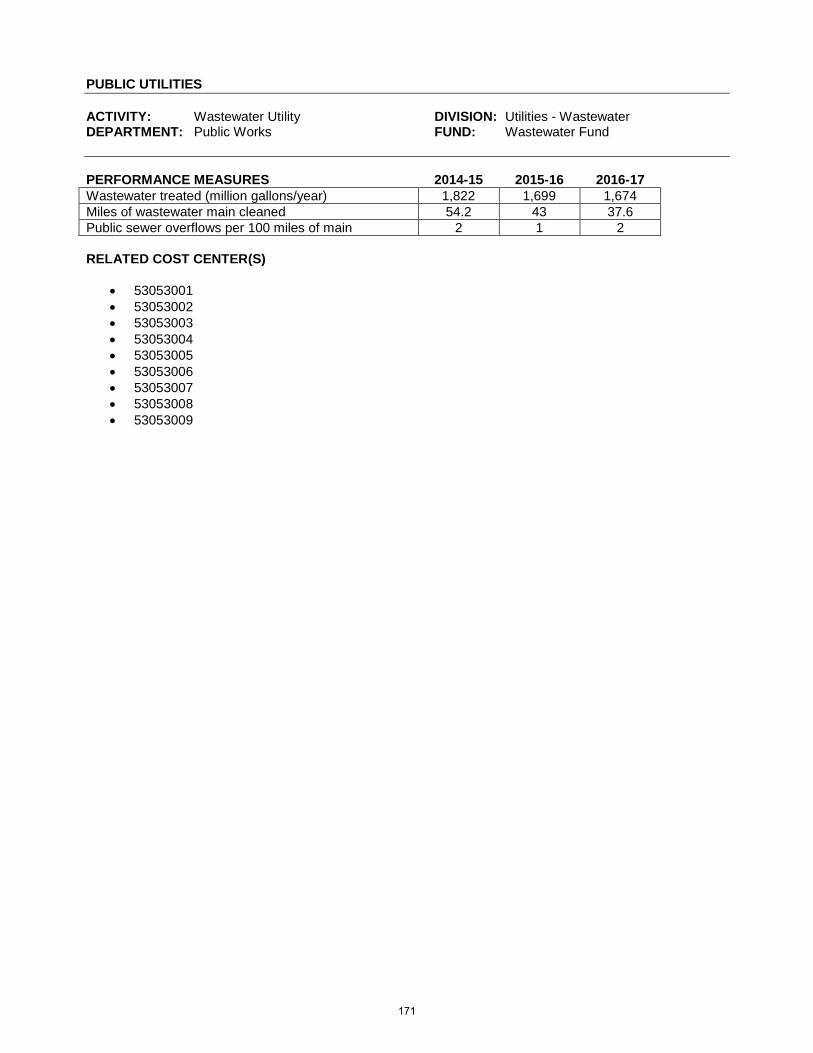
PUBLIC UTILITIES ACTIVITY: Wastewater Utility DIVISION: Utilities - Wastewater DEPARTMENT: Public Works FUND: Wastewater Fund PERFORMANCE MEASURES 2014-15 2015-16 2016-17 Wastewater treated (million gallons/year) 1,822 1,699 1,674 Miles of wastewater main cleaned 54.2 43 37.6 Public sewer overflows per 100 miles of main 2 1 2 RELATED COST CENTER(S)
• 53053001 • 53053002 • 53053003 • 53053004 • 53053005 • 53053006 • 53053007 • 53053008 • 53053009
171
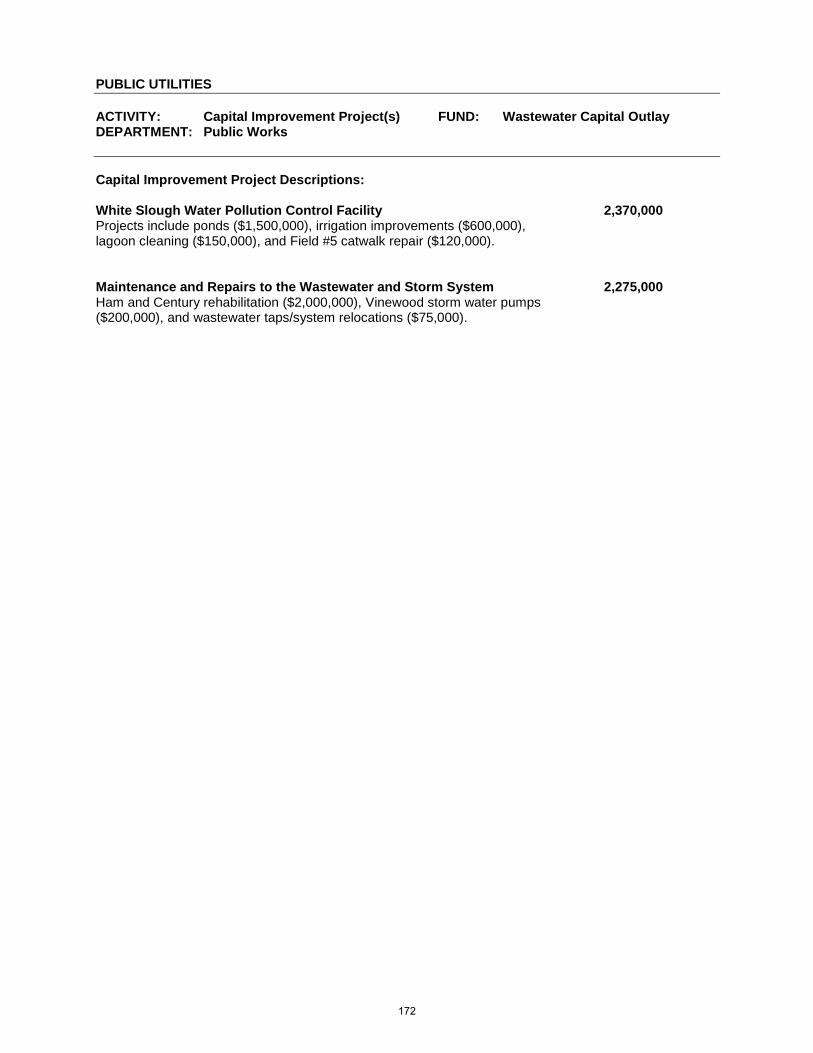
PUBLIC UTILITIES ACTIVITY: Capital Improvement Project(s) FUND: Wastewater Capital Outlay DEPARTMENT: Public Works Capital Improvement Project Descriptions: White Slough Water Pollution Control Facility 2,370,000 Projects include ponds ($1,500,000), irrigation improvements ($600,000), lagoon cleaning ($150,000), and Field #5 catwalk repair ($120,000).
Maintenance and Repairs to the Wastewater and Storm System 2,275,000 Ham and Century rehabilitation ($2,000,000), Vinewood storm water pumps ($200,000), and wastewater taps/system relocations ($75,000).
172

PUBLIC UTILITIES ACTIVITY: Equipment Purchase FUND: Wastewater Capital Outlay DEPARTMENT: Public Works Equipment - New or Replacement Description: New Vehicles 450,000 New Vac-Con sewer/storm drain cleaner ($450,000). Pump and Equipment Upgrades 355,000 Replace/upgrade pump and equipment for the White Slough Wastewater Treatment plant.
173
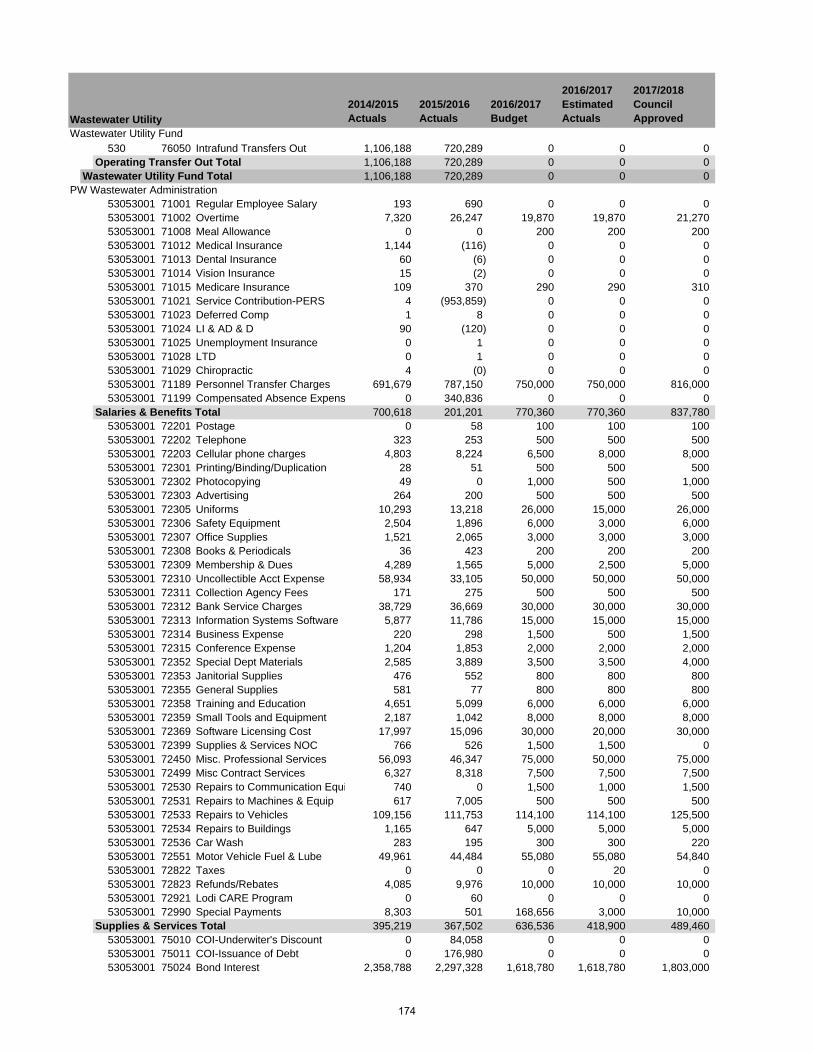
2014/2015 Actuals
2015/2016 Actuals
2016/2017 Budget
2016/2017 Estimated Actuals
2017/2018 Council Approved
Wastewater Utility Fund530 76050 Intrafund Transfers Out 1,106,188 720,289 0 0 0
Operating Transfer Out Total 1,106,188 720,289 0 0 0Wastewater Utility Fund Total 1,106,188 720,289 0 0 0
PW Wastewater Administration53053001 71001 Regular Employee Salary 193 690 0 0 053053001 71002 Overtime 7,320 26,247 19,870 19,870 21,27053053001 71008 Meal Allowance 0 0 200 200 20053053001 71012 Medical Insurance 1,144 (116) 0 0 053053001 71013 Dental Insurance 60 (6) 0 0 053053001 71014 Vision Insurance 15 (2) 0 0 053053001 71015 Medicare Insurance 109 370 290 290 31053053001 71021 Service Contribution-PERS 4 (953,859) 0 0 053053001 71023 Deferred Comp 1 8 0 0 053053001 71024 LI & AD & D 90 (120) 0 0 053053001 71025 Unemployment Insurance 0 1 0 0 053053001 71028 LTD 0 1 0 0 053053001 71029 Chiropractic 4 (0) 0 0 053053001 71189 Personnel Transfer Charges 691,679 787,150 750,000 750,000 816,00053053001 71199 Compensated Absence Expens 0 340,836 0 0 0
Salaries & Benefits Total 700,618 201,201 770,360 770,360 837,78053053001 72201 Postage 0 58 100 100 10053053001 72202 Telephone 323 253 500 500 50053053001 72203 Cellular phone charges 4,803 8,224 6,500 8,000 8,00053053001 72301 Printing/Binding/Duplication 28 51 500 500 50053053001 72302 Photocopying 49 0 1,000 500 1,00053053001 72303 Advertising 264 200 500 500 50053053001 72305 Uniforms 10,293 13,218 26,000 15,000 26,00053053001 72306 Safety Equipment 2,504 1,896 6,000 3,000 6,00053053001 72307 Office Supplies 1,521 2,065 3,000 3,000 3,00053053001 72308 Books & Periodicals 36 423 200 200 20053053001 72309 Membership & Dues 4,289 1,565 5,000 2,500 5,00053053001 72310 Uncollectible Acct Expense 58,934 33,105 50,000 50,000 50,00053053001 72311 Collection Agency Fees 171 275 500 500 50053053001 72312 Bank Service Charges 38,729 36,669 30,000 30,000 30,00053053001 72313 Information Systems Software 5,877 11,786 15,000 15,000 15,00053053001 72314 Business Expense 220 298 1,500 500 1,50053053001 72315 Conference Expense 1,204 1,853 2,000 2,000 2,00053053001 72352 Special Dept Materials 2,585 3,889 3,500 3,500 4,00053053001 72353 Janitorial Supplies 476 552 800 800 80053053001 72355 General Supplies 581 77 800 800 80053053001 72358 Training and Education 4,651 5,099 6,000 6,000 6,00053053001 72359 Small Tools and Equipment 2,187 1,042 8,000 8,000 8,00053053001 72369 Software Licensing Cost 17,997 15,096 30,000 20,000 30,00053053001 72399 Supplies & Services NOC 766 526 1,500 1,500 053053001 72450 Misc. Professional Services 56,093 46,347 75,000 50,000 75,00053053001 72499 Misc Contract Services 6,327 8,318 7,500 7,500 7,50053053001 72530 Repairs to Communication Equi 740 0 1,500 1,000 1,50053053001 72531 Repairs to Machines & Equip 617 7,005 500 500 50053053001 72533 Repairs to Vehicles 109,156 111,753 114,100 114,100 125,50053053001 72534 Repairs to Buildings 1,165 647 5,000 5,000 5,00053053001 72536 Car Wash 283 195 300 300 22053053001 72551 Motor Vehicle Fuel & Lube 49,961 44,484 55,080 55,080 54,84053053001 72822 Taxes 0 0 0 20 053053001 72823 Refunds/Rebates 4,085 9,976 10,000 10,000 10,00053053001 72921 Lodi CARE Program 0 60 0 0 053053001 72990 Special Payments 8,303 501 168,656 3,000 10,000
Supplies & Services Total 395,219 367,502 636,536 418,900 489,46053053001 75010 COI-Underwiter's Discount 0 84,058 0 0 053053001 75011 COI-Issuance of Debt 0 176,980 0 0 053053001 75024 Bond Interest 2,358,788 2,297,328 1,618,780 1,618,780 1,803,000
Wastewater Utility
174
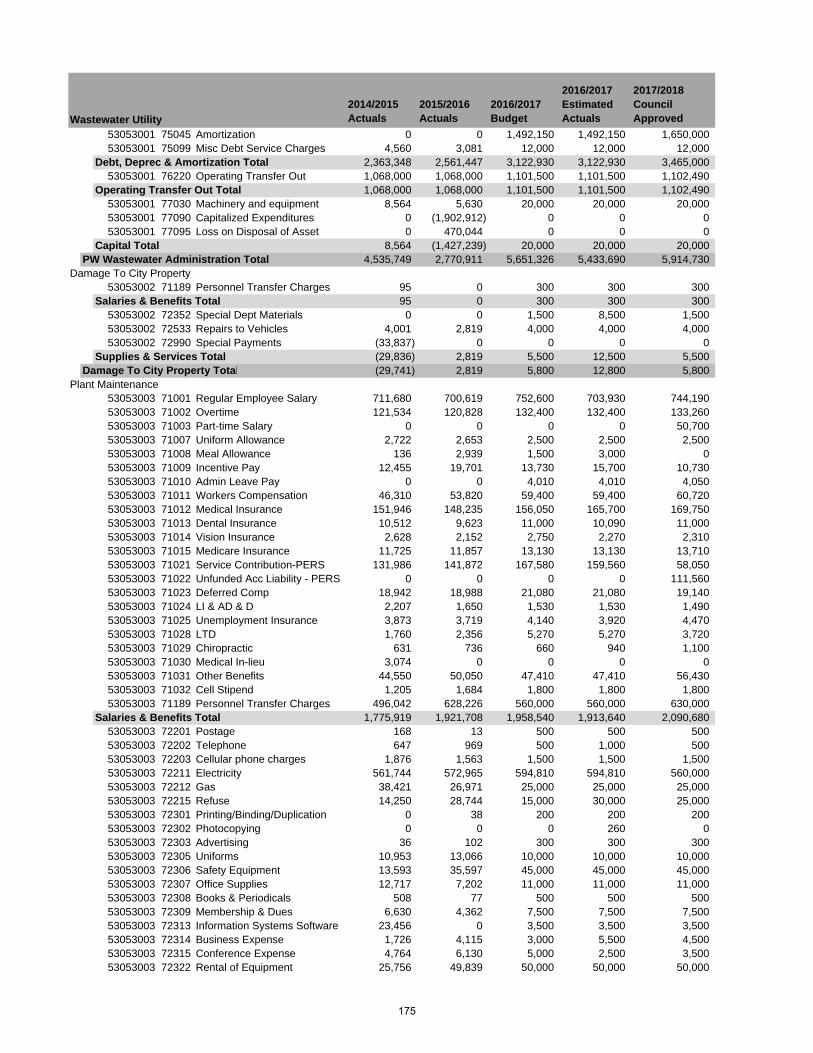
2014/2015 Actuals
2015/2016 Actuals
2016/2017 Budget
2016/2017 Estimated Actuals
2017/2018 Council ApprovedWastewater Utility
53053001 75045 Amortization 0 0 1,492,150 1,492,150 1,650,00053053001 75099 Misc Debt Service Charges 4,560 3,081 12,000 12,000 12,000
Debt, Deprec & Amortization Total 2,363,348 2,561,447 3,122,930 3,122,930 3,465,00053053001 76220 Operating Transfer Out 1,068,000 1,068,000 1,101,500 1,101,500 1,102,490
Operating Transfer Out Total 1,068,000 1,068,000 1,101,500 1,101,500 1,102,49053053001 77030 Machinery and equipment 8,564 5,630 20,000 20,000 20,00053053001 77090 Capitalized Expenditures 0 (1,902,912) 0 0 053053001 77095 Loss on Disposal of Asset 0 470,044 0 0 0
Capital Total 8,564 (1,427,239) 20,000 20,000 20,000PW Wastewater Administration Total 4,535,749 2,770,911 5,651,326 5,433,690 5,914,730
Damage To City Property53053002 71189 Personnel Transfer Charges 95 0 300 300 300
Salaries & Benefits Total 95 0 300 300 30053053002 72352 Special Dept Materials 0 0 1,500 8,500 1,50053053002 72533 Repairs to Vehicles 4,001 2,819 4,000 4,000 4,00053053002 72990 Special Payments (33,837) 0 0 0 0
Supplies & Services Total (29,836) 2,819 5,500 12,500 5,500Damage To City Property Total (29,741) 2,819 5,800 12,800 5,800
Plant Maintenance53053003 71001 Regular Employee Salary 711,680 700,619 752,600 703,930 744,19053053003 71002 Overtime 121,534 120,828 132,400 132,400 133,26053053003 71003 Part-time Salary 0 0 0 0 50,70053053003 71007 Uniform Allowance 2,722 2,653 2,500 2,500 2,50053053003 71008 Meal Allowance 136 2,939 1,500 3,000 053053003 71009 Incentive Pay 12,455 19,701 13,730 15,700 10,73053053003 71010 Admin Leave Pay 0 0 4,010 4,010 4,05053053003 71011 Workers Compensation 46,310 53,820 59,400 59,400 60,72053053003 71012 Medical Insurance 151,946 148,235 156,050 165,700 169,75053053003 71013 Dental Insurance 10,512 9,623 11,000 10,090 11,00053053003 71014 Vision Insurance 2,628 2,152 2,750 2,270 2,31053053003 71015 Medicare Insurance 11,725 11,857 13,130 13,130 13,71053053003 71021 Service Contribution-PERS 131,986 141,872 167,580 159,560 58,05053053003 71022 Unfunded Acc Liability - PERS 0 0 0 0 111,56053053003 71023 Deferred Comp 18,942 18,988 21,080 21,080 19,14053053003 71024 LI & AD & D 2,207 1,650 1,530 1,530 1,49053053003 71025 Unemployment Insurance 3,873 3,719 4,140 3,920 4,47053053003 71028 LTD 1,760 2,356 5,270 5,270 3,72053053003 71029 Chiropractic 631 736 660 940 1,10053053003 71030 Medical In-lieu 3,074 0 0 0 053053003 71031 Other Benefits 44,550 50,050 47,410 47,410 56,43053053003 71032 Cell Stipend 1,205 1,684 1,800 1,800 1,80053053003 71189 Personnel Transfer Charges 496,042 628,226 560,000 560,000 630,000
Salaries & Benefits Total 1,775,919 1,921,708 1,958,540 1,913,640 2,090,68053053003 72201 Postage 168 13 500 500 50053053003 72202 Telephone 647 969 500 1,000 50053053003 72203 Cellular phone charges 1,876 1,563 1,500 1,500 1,50053053003 72211 Electricity 561,744 572,965 594,810 594,810 560,00053053003 72212 Gas 38,421 26,971 25,000 25,000 25,00053053003 72215 Refuse 14,250 28,744 15,000 30,000 25,00053053003 72301 Printing/Binding/Duplication 0 38 200 200 20053053003 72302 Photocopying 0 0 0 260 053053003 72303 Advertising 36 102 300 300 30053053003 72305 Uniforms 10,953 13,066 10,000 10,000 10,00053053003 72306 Safety Equipment 13,593 35,597 45,000 45,000 45,00053053003 72307 Office Supplies 12,717 7,202 11,000 11,000 11,00053053003 72308 Books & Periodicals 508 77 500 500 50053053003 72309 Membership & Dues 6,630 4,362 7,500 7,500 7,50053053003 72313 Information Systems Software 23,456 0 3,500 3,500 3,50053053003 72314 Business Expense 1,726 4,115 3,000 5,500 4,50053053003 72315 Conference Expense 4,764 6,130 5,000 2,500 3,50053053003 72322 Rental of Equipment 25,756 49,839 50,000 50,000 50,000
175
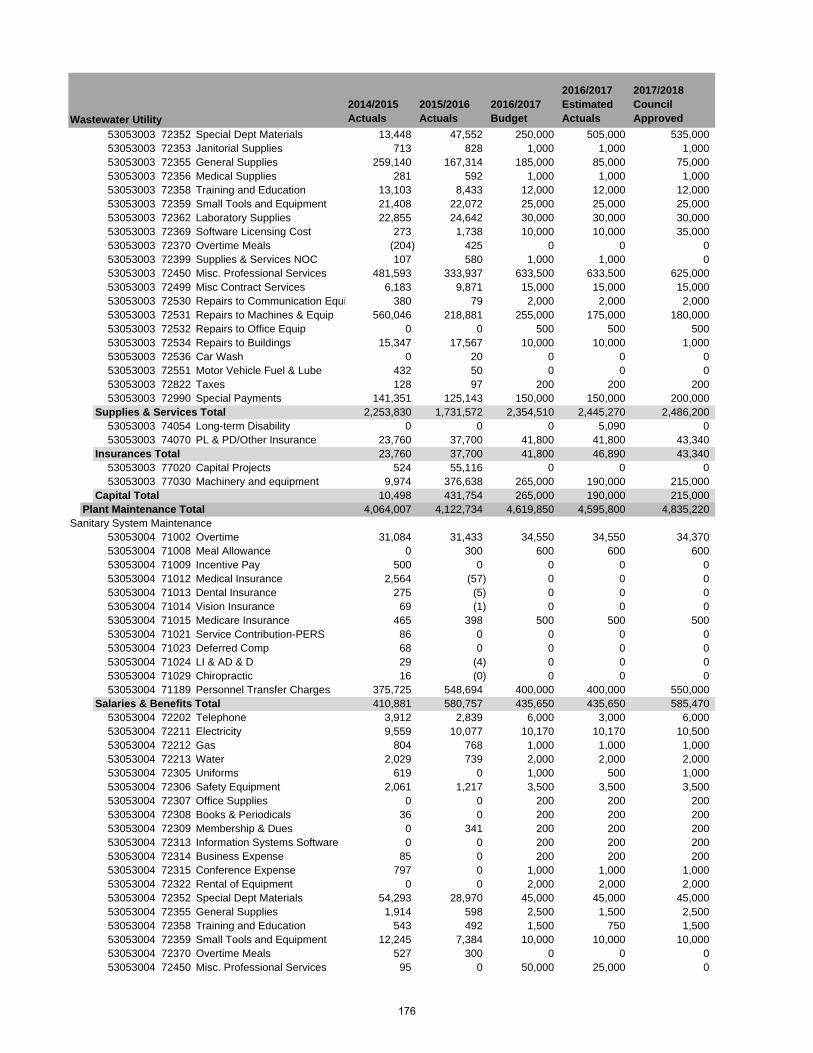
2014/2015 Actuals
2015/2016 Actuals
2016/2017 Budget
2016/2017 Estimated Actuals
2017/2018 Council ApprovedWastewater Utility
53053003 72352 Special Dept Materials 13,448 47,552 250,000 505,000 535,00053053003 72353 Janitorial Supplies 713 828 1,000 1,000 1,00053053003 72355 General Supplies 259,140 167,314 185,000 85,000 75,00053053003 72356 Medical Supplies 281 592 1,000 1,000 1,00053053003 72358 Training and Education 13,103 8,433 12,000 12,000 12,00053053003 72359 Small Tools and Equipment 21,408 22,072 25,000 25,000 25,00053053003 72362 Laboratory Supplies 22,855 24,642 30,000 30,000 30,00053053003 72369 Software Licensing Cost 273 1,738 10,000 10,000 35,00053053003 72370 Overtime Meals (204) 425 0 0 053053003 72399 Supplies & Services NOC 107 580 1,000 1,000 053053003 72450 Misc. Professional Services 481,593 333,937 633,500 633,500 625,00053053003 72499 Misc Contract Services 6,183 9,871 15,000 15,000 15,00053053003 72530 Repairs to Communication Equi 380 79 2,000 2,000 2,00053053003 72531 Repairs to Machines & Equip 560,046 218,881 255,000 175,000 180,00053053003 72532 Repairs to Office Equip 0 0 500 500 50053053003 72534 Repairs to Buildings 15,347 17,567 10,000 10,000 1,00053053003 72536 Car Wash 0 20 0 0 053053003 72551 Motor Vehicle Fuel & Lube 432 50 0 0 053053003 72822 Taxes 128 97 200 200 20053053003 72990 Special Payments 141,351 125,143 150,000 150,000 200,000
Supplies & Services Total 2,253,830 1,731,572 2,354,510 2,445,270 2,486,20053053003 74054 Long-term Disability 0 0 0 5,090 053053003 74070 PL & PD/Other Insurance 23,760 37,700 41,800 41,800 43,340
Insurances Total 23,760 37,700 41,800 46,890 43,34053053003 77020 Capital Projects 524 55,116 0 0 053053003 77030 Machinery and equipment 9,974 376,638 265,000 190,000 215,000
Capital Total 10,498 431,754 265,000 190,000 215,000Plant Maintenance Total 4,064,007 4,122,734 4,619,850 4,595,800 4,835,220
Sanitary System Maintenance53053004 71002 Overtime 31,084 31,433 34,550 34,550 34,37053053004 71008 Meal Allowance 0 300 600 600 60053053004 71009 Incentive Pay 500 0 0 0 053053004 71012 Medical Insurance 2,564 (57) 0 0 053053004 71013 Dental Insurance 275 (5) 0 0 053053004 71014 Vision Insurance 69 (1) 0 0 053053004 71015 Medicare Insurance 465 398 500 500 50053053004 71021 Service Contribution-PERS 86 0 0 0 053053004 71023 Deferred Comp 68 0 0 0 053053004 71024 LI & AD & D 29 (4) 0 0 053053004 71029 Chiropractic 16 (0) 0 0 053053004 71189 Personnel Transfer Charges 375,725 548,694 400,000 400,000 550,000
Salaries & Benefits Total 410,881 580,757 435,650 435,650 585,47053053004 72202 Telephone 3,912 2,839 6,000 3,000 6,00053053004 72211 Electricity 9,559 10,077 10,170 10,170 10,50053053004 72212 Gas 804 768 1,000 1,000 1,00053053004 72213 Water 2,029 739 2,000 2,000 2,00053053004 72305 Uniforms 619 0 1,000 500 1,00053053004 72306 Safety Equipment 2,061 1,217 3,500 3,500 3,50053053004 72307 Office Supplies 0 0 200 200 20053053004 72308 Books & Periodicals 36 0 200 200 20053053004 72309 Membership & Dues 0 341 200 200 20053053004 72313 Information Systems Software 0 0 200 200 20053053004 72314 Business Expense 85 0 200 200 20053053004 72315 Conference Expense 797 0 1,000 1,000 1,00053053004 72322 Rental of Equipment 0 0 2,000 2,000 2,00053053004 72352 Special Dept Materials 54,293 28,970 45,000 45,000 45,00053053004 72355 General Supplies 1,914 598 2,500 1,500 2,50053053004 72358 Training and Education 543 492 1,500 750 1,50053053004 72359 Small Tools and Equipment 12,245 7,384 10,000 10,000 10,00053053004 72370 Overtime Meals 527 300 0 0 053053004 72450 Misc. Professional Services 95 0 50,000 25,000 0
176
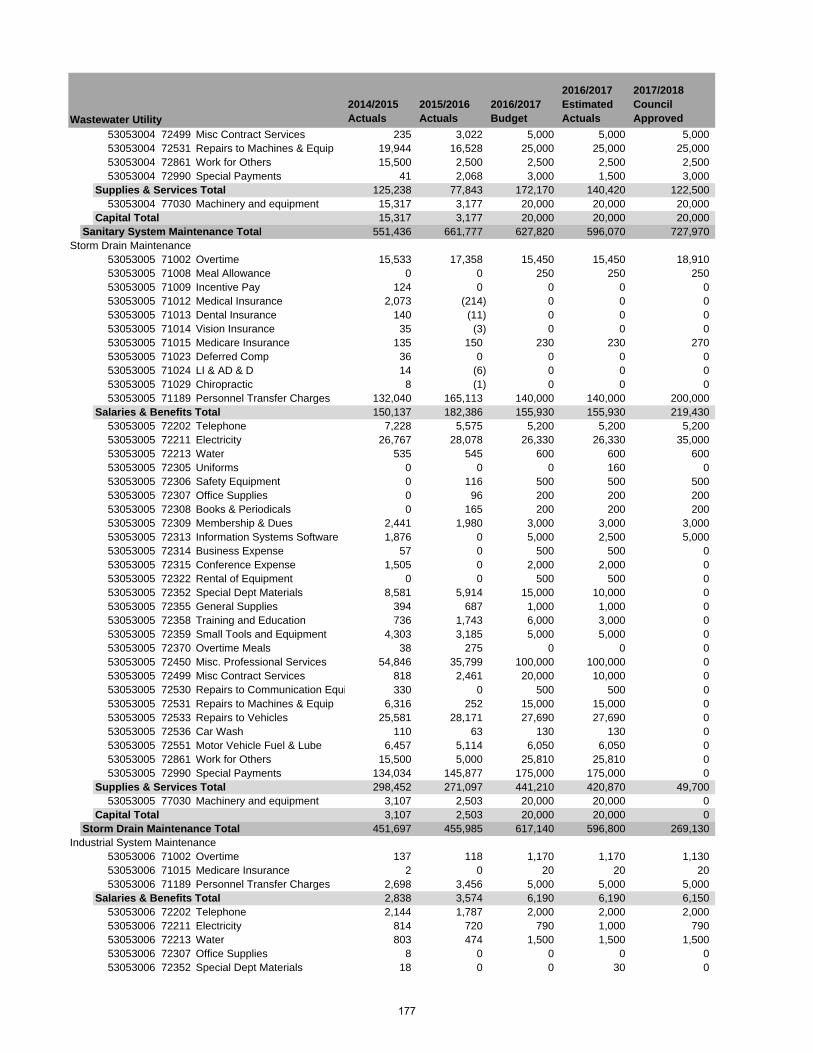
2014/2015 Actuals
2015/2016 Actuals
2016/2017 Budget
2016/2017 Estimated Actuals
2017/2018 Council ApprovedWastewater Utility
53053004 72499 Misc Contract Services 235 3,022 5,000 5,000 5,00053053004 72531 Repairs to Machines & Equip 19,944 16,528 25,000 25,000 25,00053053004 72861 Work for Others 15,500 2,500 2,500 2,500 2,50053053004 72990 Special Payments 41 2,068 3,000 1,500 3,000
Supplies & Services Total 125,238 77,843 172,170 140,420 122,50053053004 77030 Machinery and equipment 15,317 3,177 20,000 20,000 20,000
Capital Total 15,317 3,177 20,000 20,000 20,000Sanitary System Maintenance Total 551,436 661,777 627,820 596,070 727,970
Storm Drain Maintenance53053005 71002 Overtime 15,533 17,358 15,450 15,450 18,91053053005 71008 Meal Allowance 0 0 250 250 25053053005 71009 Incentive Pay 124 0 0 0 053053005 71012 Medical Insurance 2,073 (214) 0 0 053053005 71013 Dental Insurance 140 (11) 0 0 053053005 71014 Vision Insurance 35 (3) 0 0 053053005 71015 Medicare Insurance 135 150 230 230 27053053005 71023 Deferred Comp 36 0 0 0 053053005 71024 LI & AD & D 14 (6) 0 0 053053005 71029 Chiropractic 8 (1) 0 0 053053005 71189 Personnel Transfer Charges 132,040 165,113 140,000 140,000 200,000
Salaries & Benefits Total 150,137 182,386 155,930 155,930 219,43053053005 72202 Telephone 7,228 5,575 5,200 5,200 5,20053053005 72211 Electricity 26,767 28,078 26,330 26,330 35,00053053005 72213 Water 535 545 600 600 60053053005 72305 Uniforms 0 0 0 160 053053005 72306 Safety Equipment 0 116 500 500 50053053005 72307 Office Supplies 0 96 200 200 20053053005 72308 Books & Periodicals 0 165 200 200 20053053005 72309 Membership & Dues 2,441 1,980 3,000 3,000 3,00053053005 72313 Information Systems Software 1,876 0 5,000 2,500 5,00053053005 72314 Business Expense 57 0 500 500 053053005 72315 Conference Expense 1,505 0 2,000 2,000 053053005 72322 Rental of Equipment 0 0 500 500 053053005 72352 Special Dept Materials 8,581 5,914 15,000 10,000 053053005 72355 General Supplies 394 687 1,000 1,000 053053005 72358 Training and Education 736 1,743 6,000 3,000 053053005 72359 Small Tools and Equipment 4,303 3,185 5,000 5,000 053053005 72370 Overtime Meals 38 275 0 0 053053005 72450 Misc. Professional Services 54,846 35,799 100,000 100,000 053053005 72499 Misc Contract Services 818 2,461 20,000 10,000 053053005 72530 Repairs to Communication Equi 330 0 500 500 053053005 72531 Repairs to Machines & Equip 6,316 252 15,000 15,000 053053005 72533 Repairs to Vehicles 25,581 28,171 27,690 27,690 053053005 72536 Car Wash 110 63 130 130 053053005 72551 Motor Vehicle Fuel & Lube 6,457 5,114 6,050 6,050 053053005 72861 Work for Others 15,500 5,000 25,810 25,810 053053005 72990 Special Payments 134,034 145,877 175,000 175,000 0
Supplies & Services Total 298,452 271,097 441,210 420,870 49,70053053005 77030 Machinery and equipment 3,107 2,503 20,000 20,000 0
Capital Total 3,107 2,503 20,000 20,000 0Storm Drain Maintenance Total 451,697 455,985 617,140 596,800 269,130
Industrial System Maintenance53053006 71002 Overtime 137 118 1,170 1,170 1,13053053006 71015 Medicare Insurance 2 0 20 20 2053053006 71189 Personnel Transfer Charges 2,698 3,456 5,000 5,000 5,000
Salaries & Benefits Total 2,838 3,574 6,190 6,190 6,15053053006 72202 Telephone 2,144 1,787 2,000 2,000 2,00053053006 72211 Electricity 814 720 790 1,000 79053053006 72213 Water 803 474 1,500 1,500 1,50053053006 72307 Office Supplies 8 0 0 0 053053006 72352 Special Dept Materials 18 0 0 30 0
177
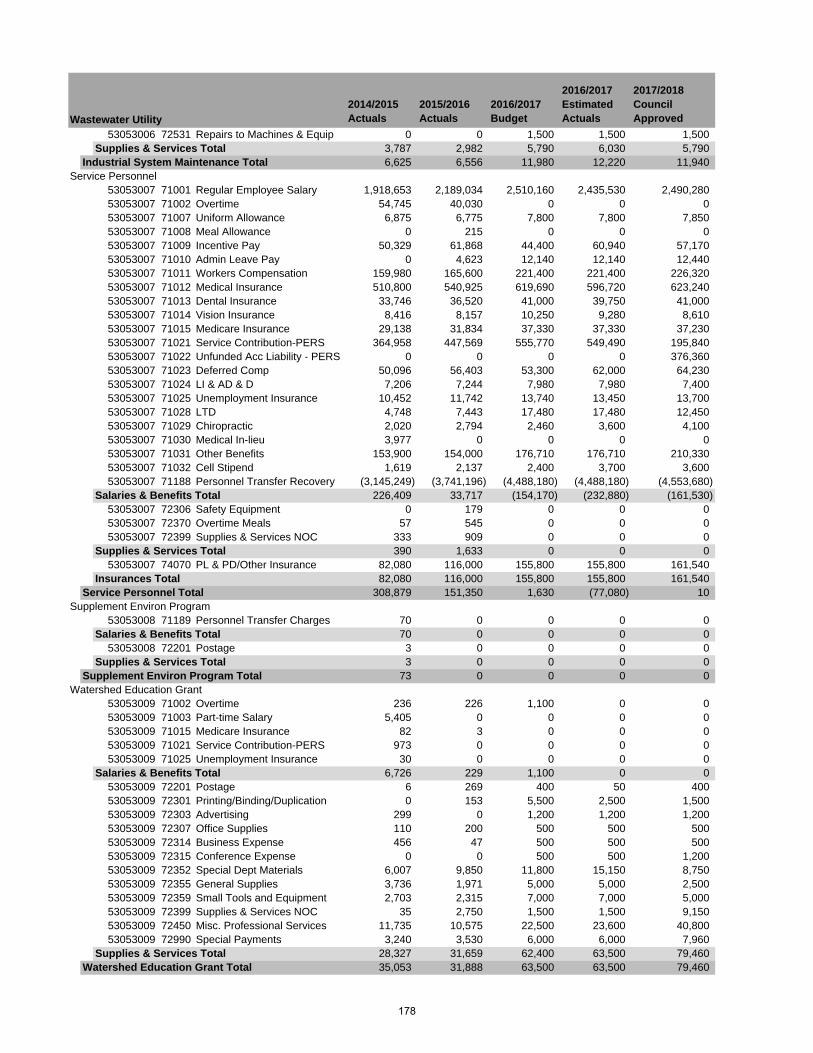
2014/2015 Actuals
2015/2016 Actuals
2016/2017 Budget
2016/2017 Estimated Actuals
2017/2018 Council ApprovedWastewater Utility
53053006 72531 Repairs to Machines & Equip 0 0 1,500 1,500 1,500Supplies & Services Total 3,787 2,982 5,790 6,030 5,790
Industrial System Maintenance Total 6,625 6,556 11,980 12,220 11,940Service Personnel
53053007 71001 Regular Employee Salary 1,918,653 2,189,034 2,510,160 2,435,530 2,490,28053053007 71002 Overtime 54,745 40,030 0 0 053053007 71007 Uniform Allowance 6,875 6,775 7,800 7,800 7,85053053007 71008 Meal Allowance 0 215 0 0 053053007 71009 Incentive Pay 50,329 61,868 44,400 60,940 57,17053053007 71010 Admin Leave Pay 0 4,623 12,140 12,140 12,44053053007 71011 Workers Compensation 159,980 165,600 221,400 221,400 226,32053053007 71012 Medical Insurance 510,800 540,925 619,690 596,720 623,24053053007 71013 Dental Insurance 33,746 36,520 41,000 39,750 41,00053053007 71014 Vision Insurance 8,416 8,157 10,250 9,280 8,61053053007 71015 Medicare Insurance 29,138 31,834 37,330 37,330 37,23053053007 71021 Service Contribution-PERS 364,958 447,569 555,770 549,490 195,84053053007 71022 Unfunded Acc Liability - PERS 0 0 0 0 376,36053053007 71023 Deferred Comp 50,096 56,403 53,300 62,000 64,23053053007 71024 LI & AD & D 7,206 7,244 7,980 7,980 7,40053053007 71025 Unemployment Insurance 10,452 11,742 13,740 13,450 13,70053053007 71028 LTD 4,748 7,443 17,480 17,480 12,45053053007 71029 Chiropractic 2,020 2,794 2,460 3,600 4,10053053007 71030 Medical In-lieu 3,977 0 0 0 053053007 71031 Other Benefits 153,900 154,000 176,710 176,710 210,33053053007 71032 Cell Stipend 1,619 2,137 2,400 3,700 3,60053053007 71188 Personnel Transfer Recovery (3,145,249) (3,741,196) (4,488,180) (4,488,180) (4,553,680)
Salaries & Benefits Total 226,409 33,717 (154,170) (232,880) (161,530)53053007 72306 Safety Equipment 0 179 0 0 053053007 72370 Overtime Meals 57 545 0 0 053053007 72399 Supplies & Services NOC 333 909 0 0 0
Supplies & Services Total 390 1,633 0 0 053053007 74070 PL & PD/Other Insurance 82,080 116,000 155,800 155,800 161,540
Insurances Total 82,080 116,000 155,800 155,800 161,540Service Personnel Total 308,879 151,350 1,630 (77,080) 10
Supplement Environ Program53053008 71189 Personnel Transfer Charges 70 0 0 0 0
Salaries & Benefits Total 70 0 0 0 053053008 72201 Postage 3 0 0 0 0
Supplies & Services Total 3 0 0 0 0Supplement Environ Program Total 73 0 0 0 0
Watershed Education Grant53053009 71002 Overtime 236 226 1,100 0 053053009 71003 Part-time Salary 5,405 0 0 0 053053009 71015 Medicare Insurance 82 3 0 0 053053009 71021 Service Contribution-PERS 973 0 0 0 053053009 71025 Unemployment Insurance 30 0 0 0 0
Salaries & Benefits Total 6,726 229 1,100 0 053053009 72201 Postage 6 269 400 50 40053053009 72301 Printing/Binding/Duplication 0 153 5,500 2,500 1,50053053009 72303 Advertising 299 0 1,200 1,200 1,20053053009 72307 Office Supplies 110 200 500 500 50053053009 72314 Business Expense 456 47 500 500 50053053009 72315 Conference Expense 0 0 500 500 1,20053053009 72352 Special Dept Materials 6,007 9,850 11,800 15,150 8,75053053009 72355 General Supplies 3,736 1,971 5,000 5,000 2,50053053009 72359 Small Tools and Equipment 2,703 2,315 7,000 7,000 5,00053053009 72399 Supplies & Services NOC 35 2,750 1,500 1,500 9,15053053009 72450 Misc. Professional Services 11,735 10,575 22,500 23,600 40,80053053009 72990 Special Payments 3,240 3,530 6,000 6,000 7,960
Supplies & Services Total 28,327 31,659 62,400 63,500 79,460Watershed Education Grant Total 35,053 31,888 63,500 63,500 79,460
178
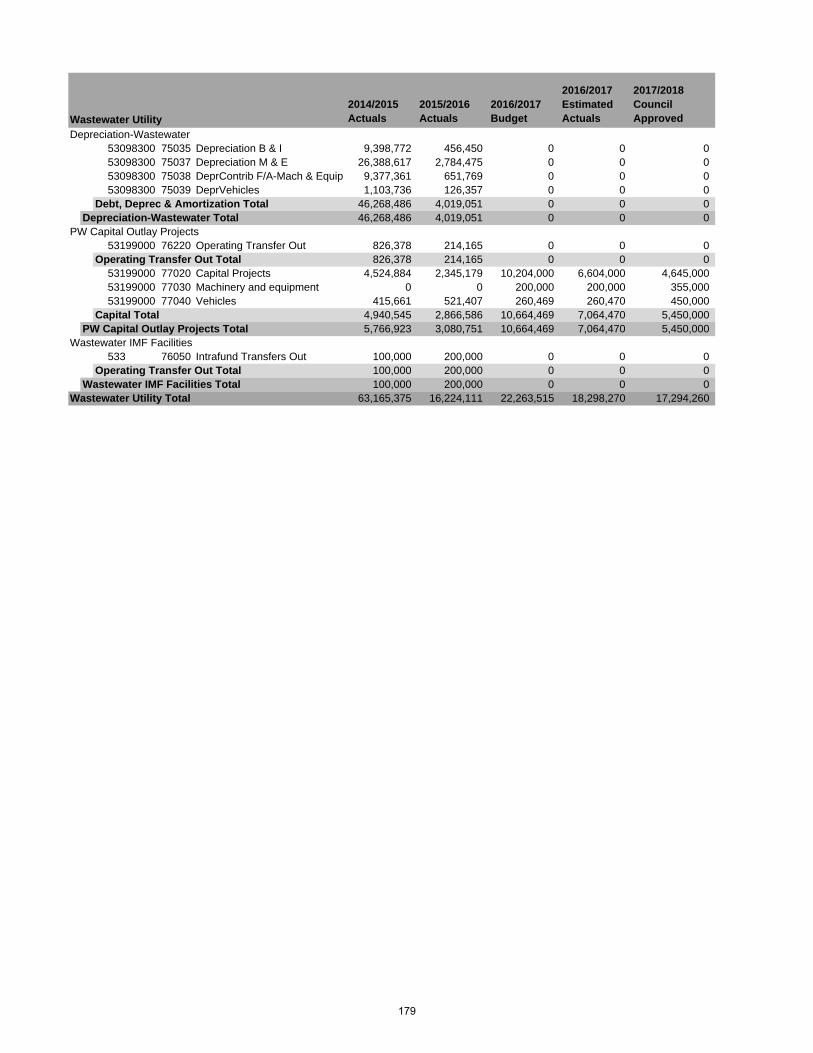
2014/2015 Actuals
2015/2016 Actuals
2016/2017 Budget
2016/2017 Estimated Actuals
2017/2018 Council ApprovedWastewater Utility
Depreciation-Wastewater53098300 75035 Depreciation B & I 9,398,772 456,450 0 0 053098300 75037 Depreciation M & E 26,388,617 2,784,475 0 0 053098300 75038 DeprContrib F/A-Mach & Equip 9,377,361 651,769 0 0 053098300 75039 DeprVehicles 1,103,736 126,357 0 0 0
Debt, Deprec & Amortization Total 46,268,486 4,019,051 0 0 0Depreciation-Wastewater Total 46,268,486 4,019,051 0 0 0
PW Capital Outlay Projects53199000 76220 Operating Transfer Out 826,378 214,165 0 0 0
Operating Transfer Out Total 826,378 214,165 0 0 053199000 77020 Capital Projects 4,524,884 2,345,179 10,204,000 6,604,000 4,645,00053199000 77030 Machinery and equipment 0 0 200,000 200,000 355,00053199000 77040 Vehicles 415,661 521,407 260,469 260,470 450,000
Capital Total 4,940,545 2,866,586 10,664,469 7,064,470 5,450,000PW Capital Outlay Projects Total 5,766,923 3,080,751 10,664,469 7,064,470 5,450,000
Wastewater IMF Facilities533 76050 Intrafund Transfers Out 100,000 200,000 0 0 0
Operating Transfer Out Total 100,000 200,000 0 0 0Wastewater IMF Facilities Total 100,000 200,000 0 0 0
Wastewater Utility Total 63,165,375 16,224,111 22,263,515 18,298,270 17,294,260
179

(This page intentionally left blank)
180

TRANSIT The Transit Division operates the City’s GrapeLine, Dial-A-Ride and VineLine transportation services. The services are available seven days a week. The Transit Division, part of the Public Works Department, has a budget of $6,737,080 in FY 2017/18, compared to $5,894,270 as originally budgeted in FY 2016/17. The City contracts with MV Transit to provide drivers and support staff for transit services. The 2016/17 budget shown in the following pages reflects adjustments made throughout the year. FY 2017/18 budgeted staffing is being maintained at 3 positions. An organizational chart, staffing summary, detailed activity descriptions and financial tables are included in the following pages.
181

(This page intentionally left blank)
182
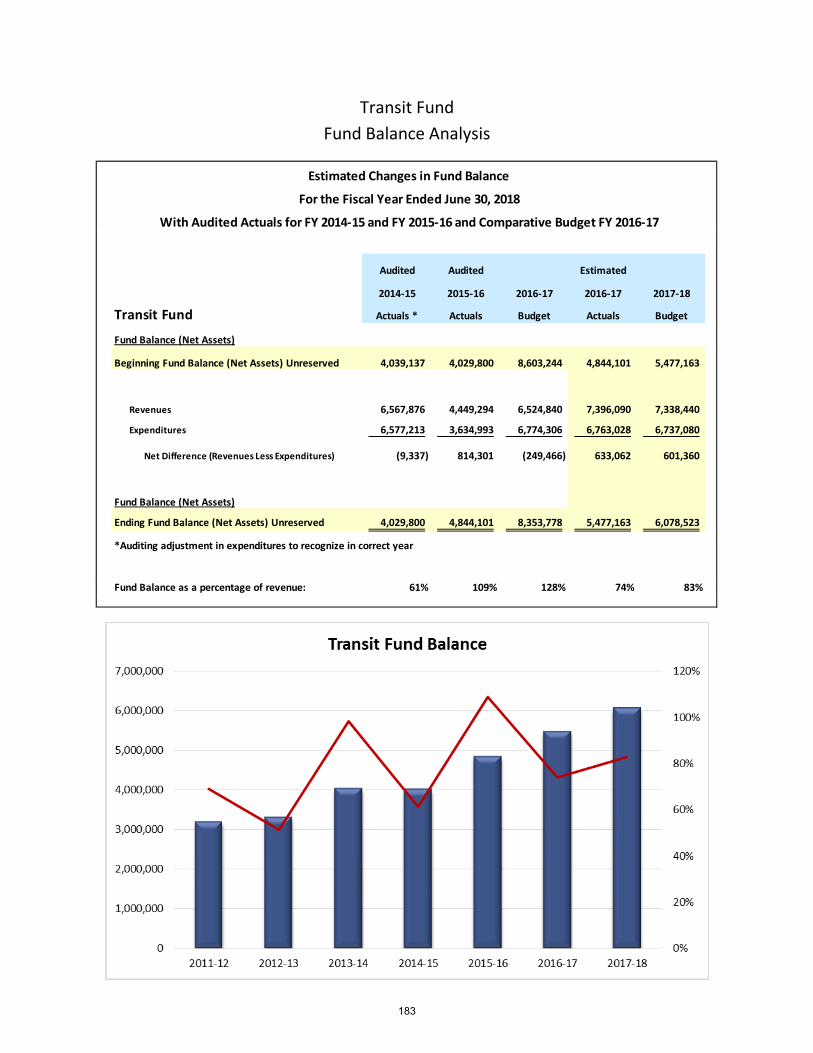
Transit Fund Fund Balance Analysis
Audited Audited Estimated
2014-15 2015-16 2016-17 2016-17 2017-18
Transit Fund Actuals * Actuals Budget Actuals Budget
Fund Balance (Net Assets)
Beginning Fund Balance (Net Assets) Unreserved 4,039,137 4,029,800 8,603,244 4,844,101 5,477,163
Revenues 6,567,876 4,449,294 6,524,840 7,396,090 7,338,440
Expenditures 6,577,213 3,634,993 6,774,306 6,763,028 6,737,080
Net Difference (Revenues Less Expenditures) (9,337) 814,301 (249,466) 633,062 601,360
Fund Balance (Net Assets)
Ending Fund Balance (Net Assets) Unreserved 4,029,800 4,844,101 8,353,778 5,477,163 6,078,523
*Auditing adjustment in expenditures to recognize in correct year
Fund Balance as a percentage of revenue: 61% 109% 128% 74% 83%
Estimated Changes in Fund Balance
For the Fiscal Year Ended June 30, 2018
With Audited Actuals for FY 2014-15 and FY 2015-16 and Comparative Budget FY 2016-17
183
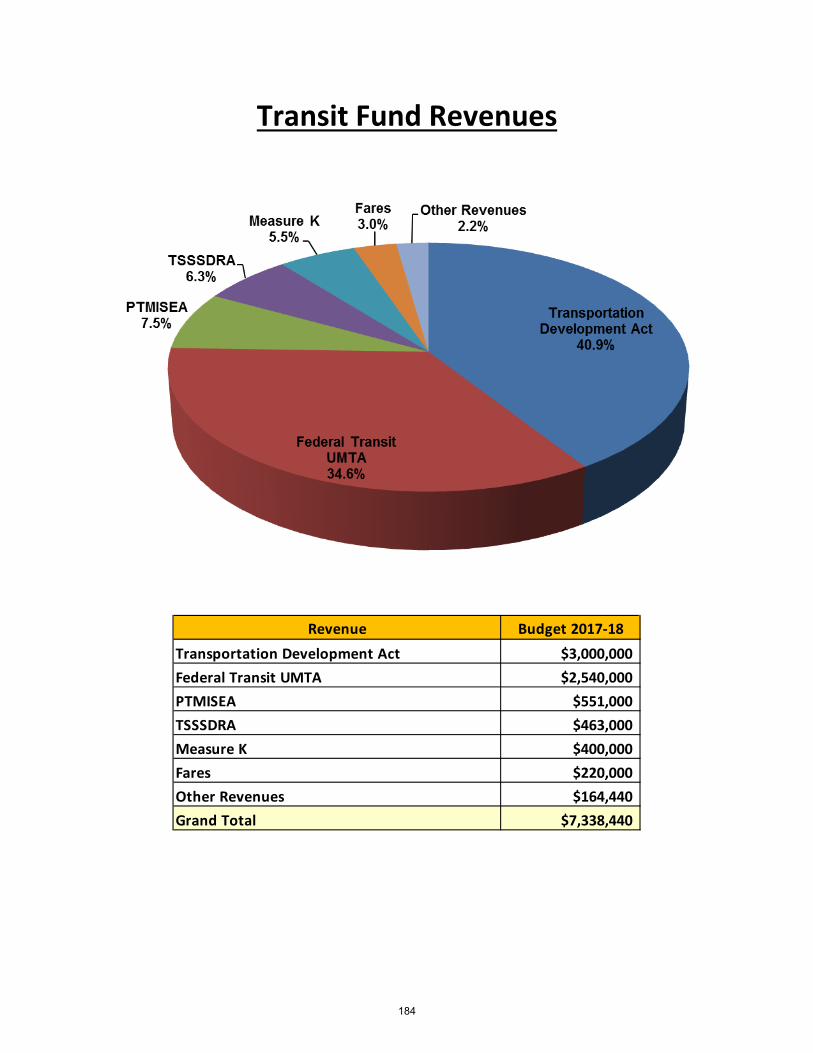
Transit Fund Revenues
Revenue Budget 2017-18Transportation Development Act $3,000,000Federal Transit UMTA $2,540,000PTMISEA $551,000TSSSDRA $463,000Measure K $400,000Fares $220,000Other Revenues $164,440Grand Total $7,338,440
184
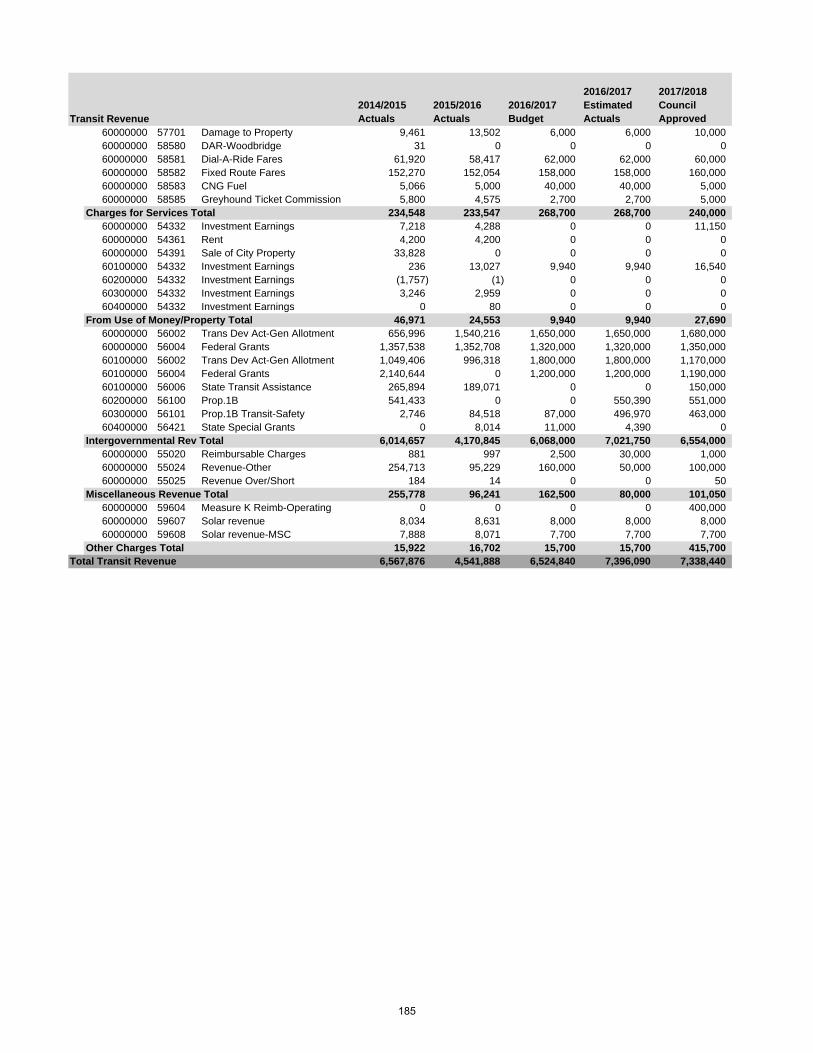
2014/2015 Actuals
2015/2016 Actuals
2016/2017 Budget
2016/2017 Estimated Actuals
2017/2018 Council Approved
60000000 57701 Damage to Property 9,461 13,502 6,000 6,000 10,00060000000 58580 DAR-Woodbridge 31 0 0 0 060000000 58581 Dial-A-Ride Fares 61,920 58,417 62,000 62,000 60,00060000000 58582 Fixed Route Fares 152,270 152,054 158,000 158,000 160,00060000000 58583 CNG Fuel 5,066 5,000 40,000 40,000 5,00060000000 58585 Greyhound Ticket Commission 5,800 4,575 2,700 2,700 5,000
Charges for Services Total 234,548 233,547 268,700 268,700 240,00060000000 54332 Investment Earnings 7,218 4,288 0 0 11,15060000000 54361 Rent 4,200 4,200 0 0 060000000 54391 Sale of City Property 33,828 0 0 0 060100000 54332 Investment Earnings 236 13,027 9,940 9,940 16,54060200000 54332 Investment Earnings (1,757) (1) 0 0 060300000 54332 Investment Earnings 3,246 2,959 0 0 060400000 54332 Investment Earnings 0 80 0 0 0
From Use of Money/Property Total 46,971 24,553 9,940 9,940 27,69060000000 56002 Trans Dev Act-Gen Allotment 656,996 1,540,216 1,650,000 1,650,000 1,680,00060000000 56004 Federal Grants 1,357,538 1,352,708 1,320,000 1,320,000 1,350,00060100000 56002 Trans Dev Act-Gen Allotment 1,049,406 996,318 1,800,000 1,800,000 1,170,00060100000 56004 Federal Grants 2,140,644 0 1,200,000 1,200,000 1,190,00060100000 56006 State Transit Assistance 265,894 189,071 0 0 150,00060200000 56100 Prop.1B 541,433 0 0 550,390 551,00060300000 56101 Prop.1B Transit-Safety 2,746 84,518 87,000 496,970 463,00060400000 56421 State Special Grants 0 8,014 11,000 4,390 0
Intergovernmental Rev Total 6,014,657 4,170,845 6,068,000 7,021,750 6,554,00060000000 55020 Reimbursable Charges 881 997 2,500 30,000 1,00060000000 55024 Revenue-Other 254,713 95,229 160,000 50,000 100,00060000000 55025 Revenue Over/Short 184 14 0 0 50
Miscellaneous Revenue Total 255,778 96,241 162,500 80,000 101,05060000000 59604 Measure K Reimb-Operating 0 0 0 0 400,00060000000 59607 Solar revenue 8,034 8,631 8,000 8,000 8,00060000000 59608 Solar revenue-MSC 7,888 8,071 7,700 7,700 7,700
Other Charges Total 15,922 16,702 15,700 15,700 415,700Total Transit Revenue 6,567,876 4,541,888 6,524,840 7,396,090 7,338,440
Transit Revenue
185

(This page intentionally left blank)
186
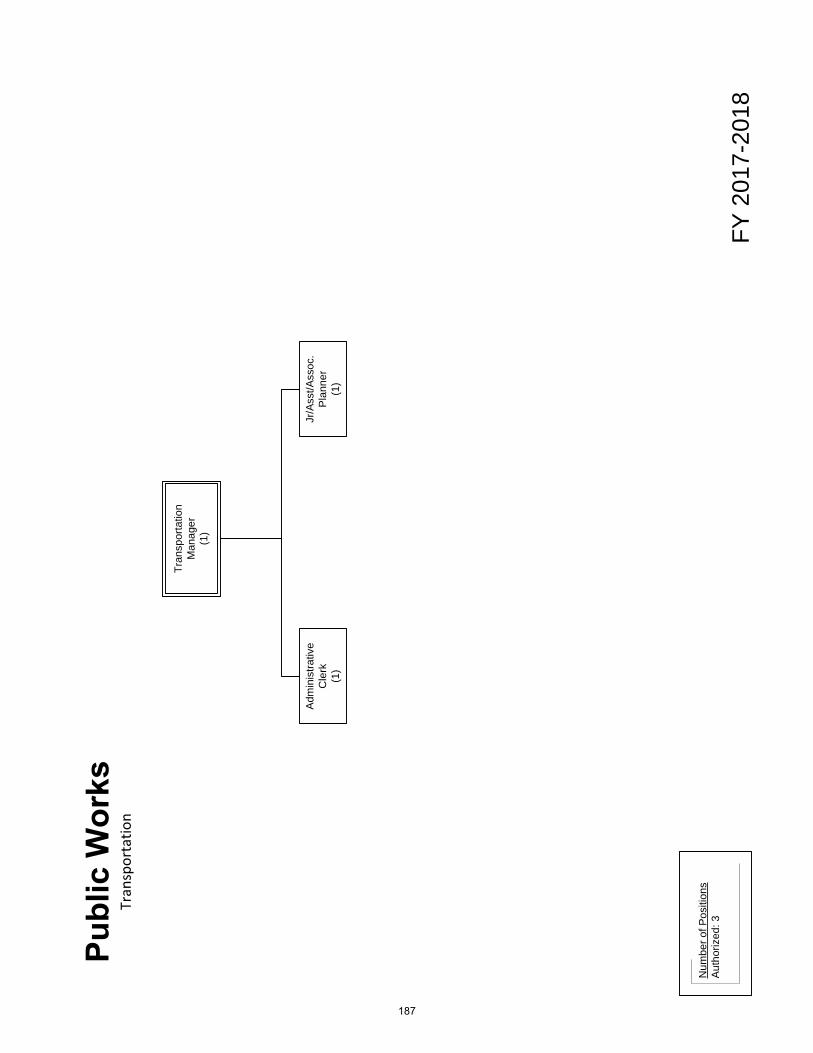
Tran
spor
tatio
n
FY 2
017-
2018
Num
ber o
f Pos
ition
sAu
thor
ized
: 3
Tran
spor
tatio
n M
anag
er(1
)
Adm
inis
trativ
e C
lerk
(1)
Jr/A
sst/A
ssoc
. P
lann
er(1
)
187
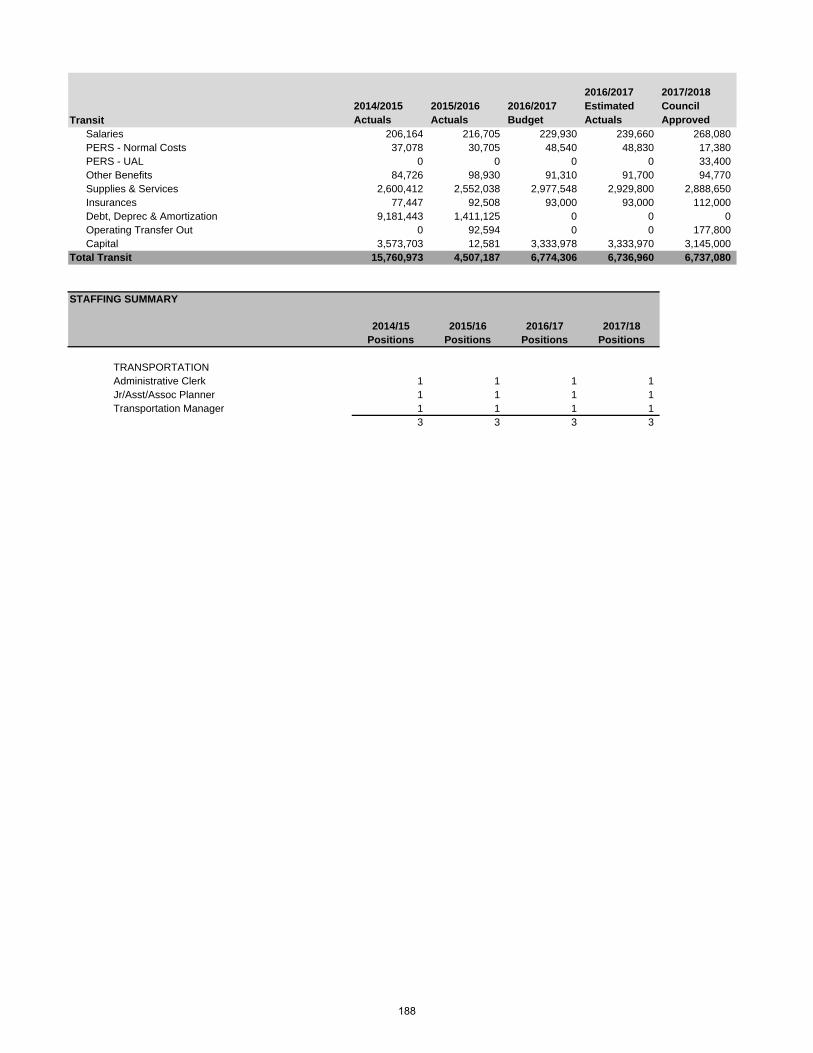
2014/2015 Actuals
2015/2016 Actuals
2016/2017 Budget
2016/2017 Estimated Actuals
2017/2018 Council Approved
Salaries 206,164 216,705 229,930 239,660 268,080PERS - Normal Costs 37,078 30,705 48,540 48,830 17,380PERS - UAL 0 0 0 0 33,400Other Benefits 84,726 98,930 91,310 91,700 94,770Supplies & Services 2,600,412 2,552,038 2,977,548 2,929,800 2,888,650Insurances 77,447 92,508 93,000 93,000 112,000Debt, Deprec & Amortization 9,181,443 1,411,125 0 0 0Operating Transfer Out 0 92,594 0 0 177,800Capital 3,573,703 12,581 3,333,978 3,333,970 3,145,000
Total Transit 15,760,973 4,507,187 6,774,306 6,736,960 6,737,080
STAFFING SUMMARY
2014/15 2015/16 2016/17 2017/18Positions Positions Positions Positions
TRANSPORTATIONAdministrative Clerk 1 1 1 1Jr/Asst/Assoc Planner 1 1 1 1Transportation Manager 1 1 1 1
3 3 3 3
Transit
188
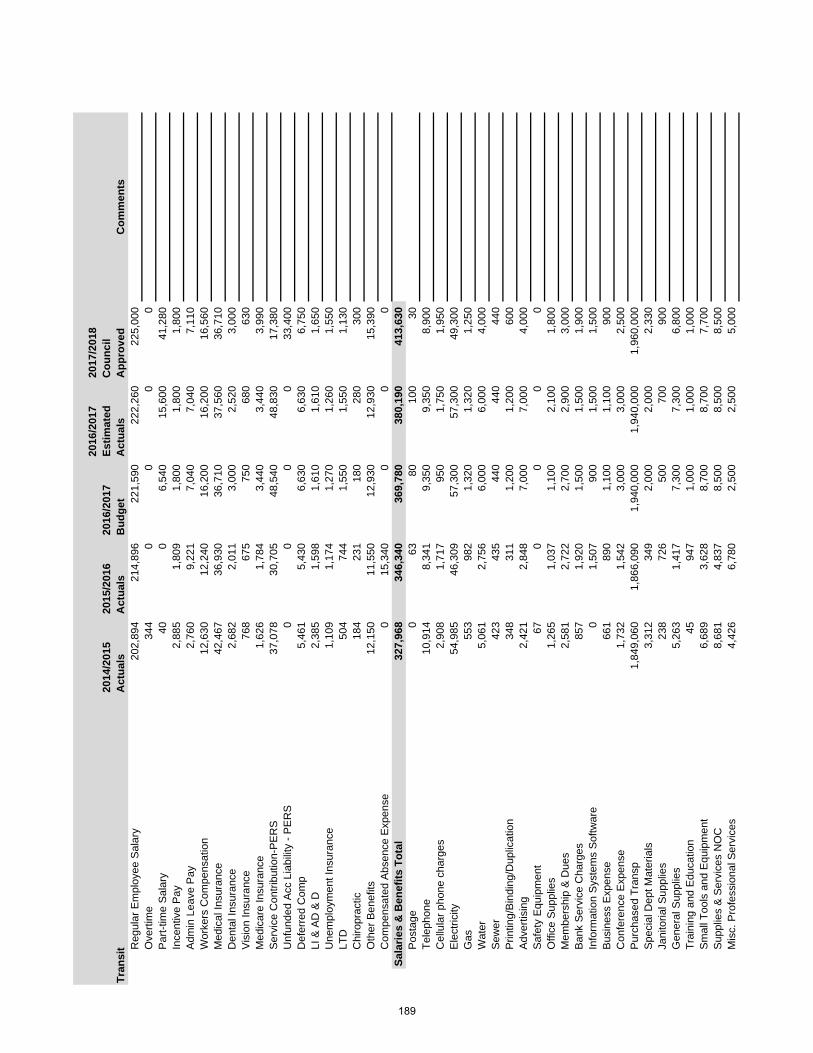
2014
/201
5 A
ctua
ls20
15/2
016
Act
uals
2016
/201
7 B
udge
t
2016
/201
7 Es
timat
ed
Act
uals
2017
/201
8 C
ounc
il A
ppro
ved
Com
men
tsR
egul
ar E
mpl
oyee
Sal
ary
202,
894
214,
896
221,
590
222,
260
225,
000
Ove
rtim
e 34
40
00
0P
art-t
ime
Sal
ary
400
6,54
015
,600
41,2
80In
cent
ive
Pay
2,
885
1,80
91,
800
1,80
01,
800
Adm
in L
eave
Pay
2,
760
9,22
17,
040
7,04
07,
110
Wor
kers
Com
pens
atio
n 12
,630
12,2
4016
,200
16,2
0016
,560
Med
ical
Insu
ranc
e 42
,467
36,9
3036
,710
37,5
6036
,710
Den
tal I
nsur
ance
2,
682
2,01
13,
000
2,52
03,
000
Vis
ion
Insu
ranc
e 76
867
575
068
063
0M
edic
are
Insu
ranc
e 1,
626
1,78
43,
440
3,44
03,
990
Ser
vice
Con
tribu
tion-
PE
RS
37
,078
30,7
0548
,540
48,8
3017
,380
Unf
unde
d A
cc L
iabi
lity
- PE
RS
0
00
033
,400
Def
erre
d C
omp
5,46
15,
430
6,63
06,
630
6,75
0LI
& A
D &
D
2,38
51,
598
1,61
01,
610
1,65
0U
nem
ploy
men
t Ins
uran
ce
1,10
91,
174
1,27
01,
260
1,55
0LT
D
504
744
1,55
01,
550
1,13
0C
hiro
prac
tic
184
231
180
280
300
Oth
er B
enef
its
12,1
5011
,550
12,9
3012
,930
15,3
90C
ompe
nsat
ed A
bsen
ce E
xpen
se
015
,340
00
0Sa
larie
s &
Ben
efits
Tot
al32
7,96
834
6,34
036
9,78
038
0,19
041
3,63
0P
osta
ge
063
8010
030
Tele
phon
e 10
,914
8,34
19,
350
9,35
08,
900
Cel
lula
r pho
ne c
harg
es
2,90
81,
717
950
1,75
01,
950
Ele
ctric
ity
54,9
8546
,309
57,3
0057
,300
49,3
00G
as
553
982
1,32
01,
320
1,25
0W
ater
5,
061
2,75
66,
000
6,00
04,
000
Sew
er
423
435
440
440
440
Prin
ting/
Bin
ding
/Dup
licat
ion
348
311
1,20
01,
200
600
Adv
ertis
ing
2,42
12,
848
7,00
07,
000
4,00
0S
afet
y E
quip
men
t 67
00
00
Offi
ce S
uppl
ies
1,26
51,
037
1,10
02,
100
1,80
0M
embe
rshi
p &
Due
s 2,
581
2,72
22,
700
2,90
03,
000
Ban
k S
ervi
ce C
harg
es
857
1,92
01,
500
1,50
01,
900
Info
rmat
ion
Sys
tem
s S
oftw
are
01,
507
900
1,50
01,
500
Bus
ines
s E
xpen
se
661
890
1,10
01,
100
900
Con
fere
nce
Exp
ense
1,
732
1,54
23,
000
3,00
02,
500
Pur
chas
ed T
rans
p 1,
849,
060
1,86
6,09
01,
940,
000
1,94
0,00
01,
960,
000
Spe
cial
Dep
t Mat
eria
ls
3,31
234
92,
000
2,00
02,
330
Jani
toria
l Sup
plie
s 23
872
650
070
090
0G
ener
al S
uppl
ies
5,26
31,
417
7,30
07,
300
6,80
0Tr
aini
ng a
nd E
duca
tion
4594
71,
000
1,00
01,
000
Sm
all T
ools
and
Equ
ipm
ent
6,68
93,
628
8,70
08,
700
7,70
0S
uppl
ies
& S
ervi
ces
NO
C
8,68
14,
837
8,50
08,
500
8,50
0M
isc.
Pro
fess
iona
l Ser
vice
s 4,
426
6,78
02,
500
2,50
05,
000
Tran
sit
189
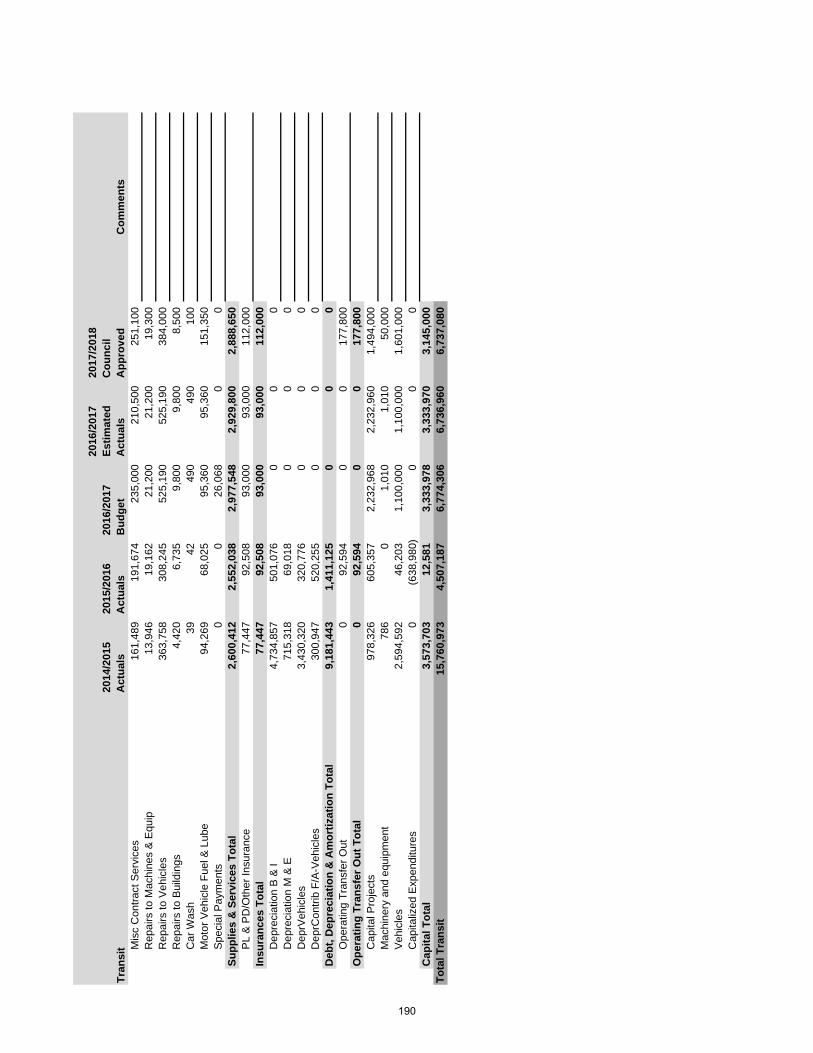
2014
/201
5 A
ctua
ls20
15/2
016
Act
uals
2016
/201
7 B
udge
t
2016
/201
7 Es
timat
ed
Act
uals
2017
/201
8 C
ounc
il A
ppro
ved
Com
men
tsTr
ansi
t Mis
c C
ontra
ct S
ervi
ces
161,
489
191,
674
235,
000
210,
500
251,
100
Rep
airs
to M
achi
nes
& E
quip
13
,946
19,1
6221
,200
21,2
0019
,300
Rep
airs
to V
ehic
les
363,
758
308,
245
525,
190
525,
190
384,
000
Rep
airs
to B
uild
ings
4,
420
6,73
59,
800
9,80
08,
500
Car
Was
h 39
4249
049
010
0M
otor
Veh
icle
Fue
l & L
ube
94,2
6968
,025
95,3
6095
,360
151,
350
Spe
cial
Pay
men
ts
00
26,0
680
0Su
pplie
s &
Ser
vice
s To
tal
2,60
0,41
22,
552,
038
2,97
7,54
82,
929,
800
2,88
8,65
0P
L &
PD
/Oth
er In
sura
nce
77,4
4792
,508
93,0
0093
,000
112,
000
Insu
ranc
es T
otal
77,4
4792
,508
93,0
0093
,000
112,
000
Dep
reci
atio
n B
& I
4,73
4,85
750
1,07
60
00
Dep
reci
atio
n M
& E
71
5,31
869
,018
00
0D
eprV
ehic
les
3,43
0,32
032
0,77
60
00
Dep
rCon
trib
F/A
-Veh
icle
s 30
0,94
752
0,25
50
00
Deb
t, D
epre
ciat
ion
& A
mor
tizat
ion
Tota
l9,
181,
443
1,41
1,12
50
00
Ope
ratin
g Tr
ansf
er O
ut
092
,594
00
177,
800
Ope
ratin
g Tr
ansf
er O
ut T
otal
092
,594
00
177,
800
Cap
ital P
roje
cts
978,
326
605,
357
2,23
2,96
82,
232,
960
1,49
4,00
0M
achi
nery
and
equ
ipm
ent
786
01,
010
1,01
050
,000
Veh
icle
s 2,
594,
592
46,2
031,
100,
000
1,10
0,00
01,
601,
000
Cap
italiz
ed E
xpen
ditu
res
0(6
38,9
80)
00
0C
apita
l Tot
al3,
573,
703
12,5
813,
333,
978
3,33
3,97
03,
145,
000
Tota
l Tra
nsi t
15,7
60,9
734,
507,
187
6,77
4,30
66,
736,
960
6,73
7,08
0
190
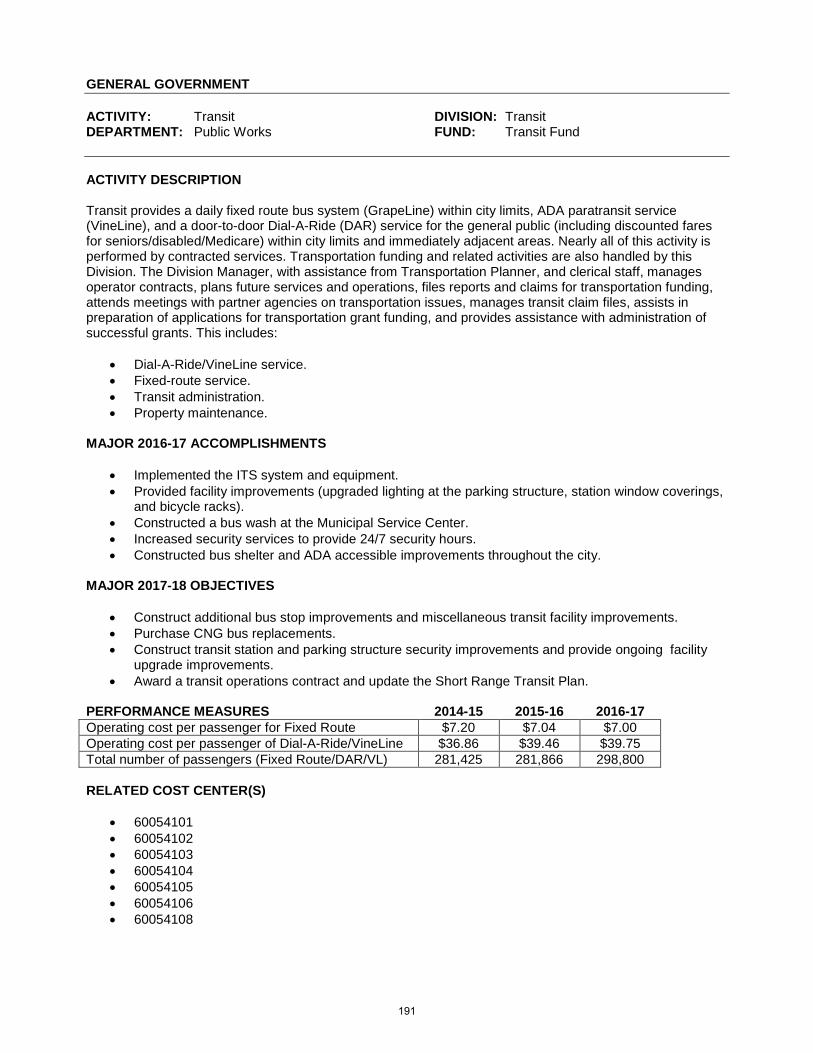
GENERAL GOVERNMENT ACTIVITY: Transit DIVISION: Transit DEPARTMENT: Public Works FUND: Transit Fund ACTIVITY DESCRIPTION Transit provides a daily fixed route bus system (GrapeLine) within city limits, ADA paratransit service (VineLine), and a door-to-door Dial-A-Ride (DAR) service for the general public (including discounted fares for seniors/disabled/Medicare) within city limits and immediately adjacent areas. Nearly all of this activity is performed by contracted services. Transportation funding and related activities are also handled by this Division. The Division Manager, with assistance from Transportation Planner, and clerical staff, manages operator contracts, plans future services and operations, files reports and claims for transportation funding, attends meetings with partner agencies on transportation issues, manages transit claim files, assists in preparation of applications for transportation grant funding, and provides assistance with administration of successful grants. This includes:
• Dial-A-Ride/VineLine service. • Fixed-route service. • Transit administration. • Property maintenance.
MAJOR 2016-17 ACCOMPLISHMENTS
• Implemented the ITS system and equipment. • Provided facility improvements (upgraded lighting at the parking structure, station window coverings,
and bicycle racks). • Constructed a bus wash at the Municipal Service Center. • Increased security services to provide 24/7 security hours. • Constructed bus shelter and ADA accessible improvements throughout the city.
MAJOR 2017-18 OBJECTIVES
• Construct additional bus stop improvements and miscellaneous transit facility improvements. • Purchase CNG bus replacements. • Construct transit station and parking structure security improvements and provide ongoing facility
upgrade improvements. • Award a transit operations contract and update the Short Range Transit Plan.
PERFORMANCE MEASURES 2014-15 2015-16 2016-17 Operating cost per passenger for Fixed Route $7.20 $7.04 $7.00 Operating cost per passenger of Dial-A-Ride/VineLine $36.86 $39.46 $39.75 Total number of passengers (Fixed Route/DAR/VL) 281,425 281,866 298,800 RELATED COST CENTER(S)
• 60054101 • 60054102 • 60054103 • 60054104 • 60054105 • 60054106 • 60054108
191
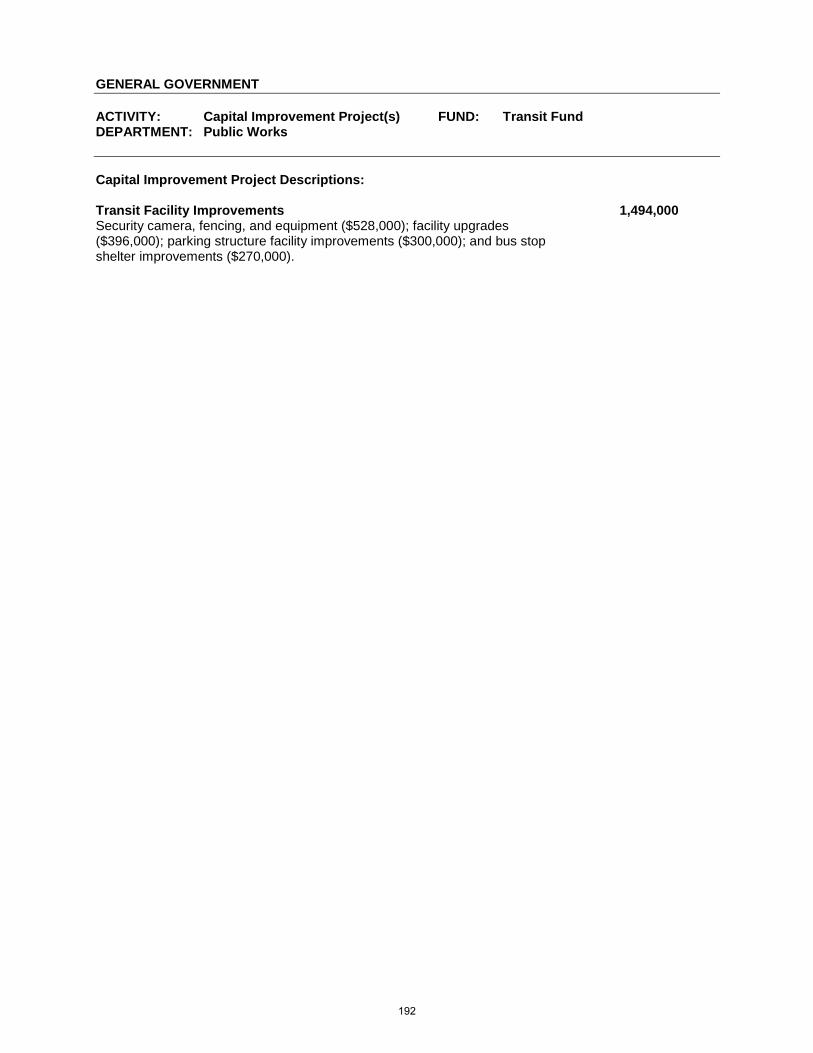
GENERAL GOVERNMENT ACTIVITY: Capital Improvement Project(s) FUND: Transit Fund DEPARTMENT: Public Works Capital Improvement Project Descriptions: Transit Facility Improvements 1,494,000 Security camera, fencing, and equipment ($528,000); facility upgrades ($396,000); parking structure facility improvements ($300,000); and bus stop shelter improvements ($270,000).
192
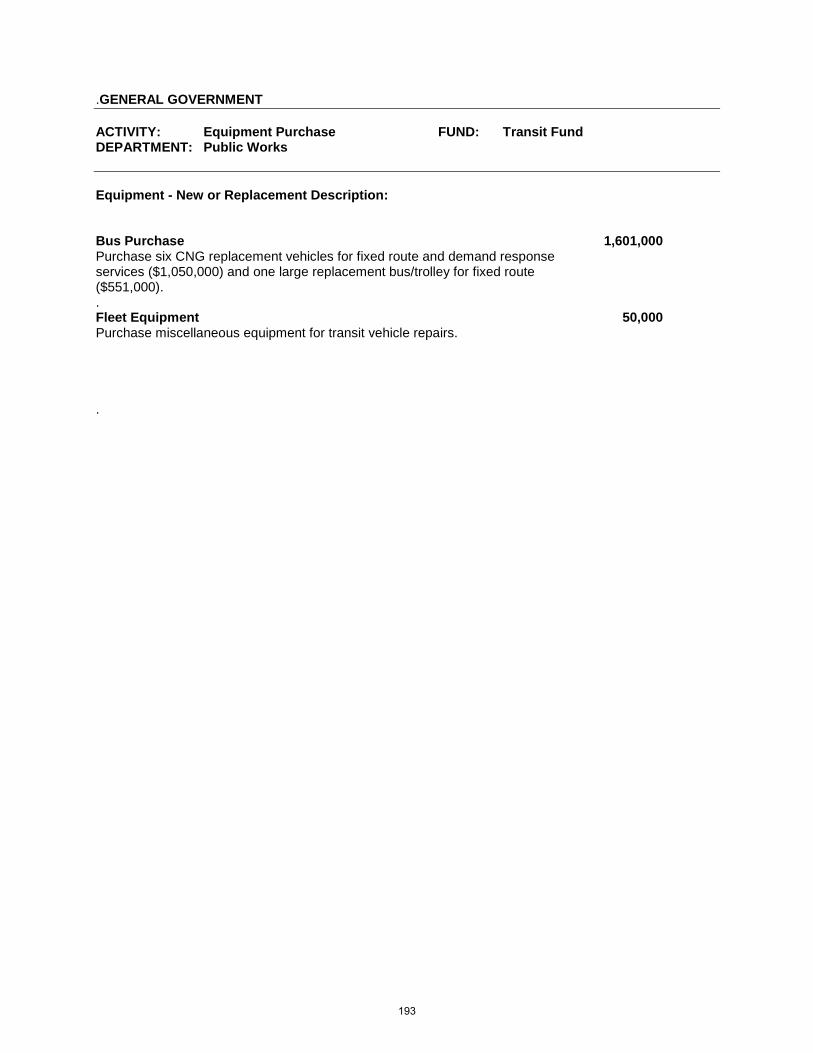
.GENERAL GOVERNMENT ACTIVITY: Equipment Purchase FUND: Transit Fund DEPARTMENT: Public Works Equipment - New or Replacement Description: Bus Purchase 1,601,000 Purchase six CNG replacement vehicles for fixed route and demand response services ($1,050,000) and one large replacement bus/trolley for fixed route ($551,000). .
Fleet Equipment 50,000 Purchase miscellaneous equipment for transit vehicle repairs.
.
193
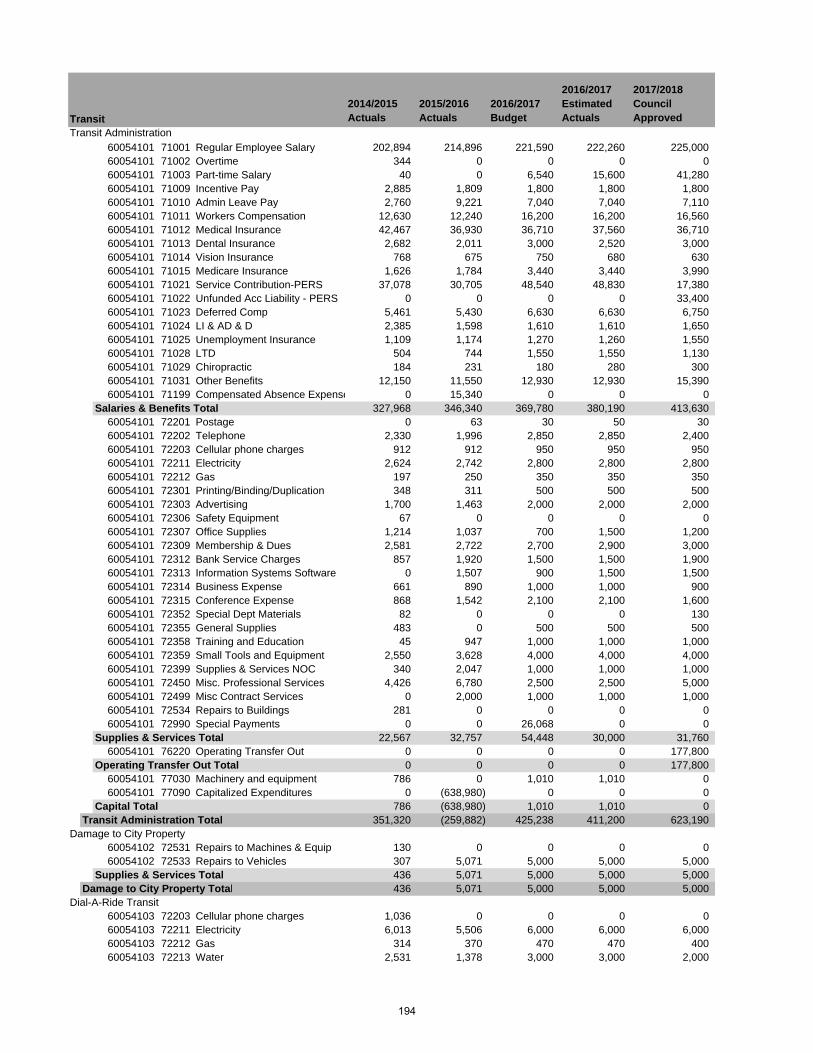
2014/2015 Actuals
2015/2016 Actuals
2016/2017 Budget
2016/2017 Estimated Actuals
2017/2018 Council Approved
Transit Administration60054101 71001 Regular Employee Salary 202,894 214,896 221,590 222,260 225,00060054101 71002 Overtime 344 0 0 0 060054101 71003 Part-time Salary 40 0 6,540 15,600 41,28060054101 71009 Incentive Pay 2,885 1,809 1,800 1,800 1,80060054101 71010 Admin Leave Pay 2,760 9,221 7,040 7,040 7,11060054101 71011 Workers Compensation 12,630 12,240 16,200 16,200 16,56060054101 71012 Medical Insurance 42,467 36,930 36,710 37,560 36,71060054101 71013 Dental Insurance 2,682 2,011 3,000 2,520 3,00060054101 71014 Vision Insurance 768 675 750 680 63060054101 71015 Medicare Insurance 1,626 1,784 3,440 3,440 3,99060054101 71021 Service Contribution-PERS 37,078 30,705 48,540 48,830 17,38060054101 71022 Unfunded Acc Liability - PERS 0 0 0 0 33,40060054101 71023 Deferred Comp 5,461 5,430 6,630 6,630 6,75060054101 71024 LI & AD & D 2,385 1,598 1,610 1,610 1,65060054101 71025 Unemployment Insurance 1,109 1,174 1,270 1,260 1,55060054101 71028 LTD 504 744 1,550 1,550 1,13060054101 71029 Chiropractic 184 231 180 280 30060054101 71031 Other Benefits 12,150 11,550 12,930 12,930 15,39060054101 71199 Compensated Absence Expense 0 15,340 0 0 0
Salaries & Benefits Total 327,968 346,340 369,780 380,190 413,63060054101 72201 Postage 0 63 30 50 3060054101 72202 Telephone 2,330 1,996 2,850 2,850 2,40060054101 72203 Cellular phone charges 912 912 950 950 95060054101 72211 Electricity 2,624 2,742 2,800 2,800 2,80060054101 72212 Gas 197 250 350 350 35060054101 72301 Printing/Binding/Duplication 348 311 500 500 50060054101 72303 Advertising 1,700 1,463 2,000 2,000 2,00060054101 72306 Safety Equipment 67 0 0 0 060054101 72307 Office Supplies 1,214 1,037 700 1,500 1,20060054101 72309 Membership & Dues 2,581 2,722 2,700 2,900 3,00060054101 72312 Bank Service Charges 857 1,920 1,500 1,500 1,90060054101 72313 Information Systems Software 0 1,507 900 1,500 1,50060054101 72314 Business Expense 661 890 1,000 1,000 90060054101 72315 Conference Expense 868 1,542 2,100 2,100 1,60060054101 72352 Special Dept Materials 82 0 0 0 13060054101 72355 General Supplies 483 0 500 500 50060054101 72358 Training and Education 45 947 1,000 1,000 1,00060054101 72359 Small Tools and Equipment 2,550 3,628 4,000 4,000 4,00060054101 72399 Supplies & Services NOC 340 2,047 1,000 1,000 1,00060054101 72450 Misc. Professional Services 4,426 6,780 2,500 2,500 5,00060054101 72499 Misc Contract Services 0 2,000 1,000 1,000 1,00060054101 72534 Repairs to Buildings 281 0 0 0 060054101 72990 Special Payments 0 0 26,068 0 0
Supplies & Services Total 22,567 32,757 54,448 30,000 31,76060054101 76220 Operating Transfer Out 0 0 0 0 177,800
Operating Transfer Out Total 0 0 0 0 177,80060054101 77030 Machinery and equipment 786 0 1,010 1,010 060054101 77090 Capitalized Expenditures 0 (638,980) 0 0 0
Capital Total 786 (638,980) 1,010 1,010 0Transit Administration Total 351,320 (259,882) 425,238 411,200 623,190
Damage to City Property60054102 72531 Repairs to Machines & Equip 130 0 0 0 060054102 72533 Repairs to Vehicles 307 5,071 5,000 5,000 5,000
Supplies & Services Total 436 5,071 5,000 5,000 5,000Damage to City Property Total 436 5,071 5,000 5,000 5,000
Dial-A-Ride Transit60054103 72203 Cellular phone charges 1,036 0 0 0 060054103 72211 Electricity 6,013 5,506 6,000 6,000 6,00060054103 72212 Gas 314 370 470 470 40060054103 72213 Water 2,531 1,378 3,000 3,000 2,000
Transit
194
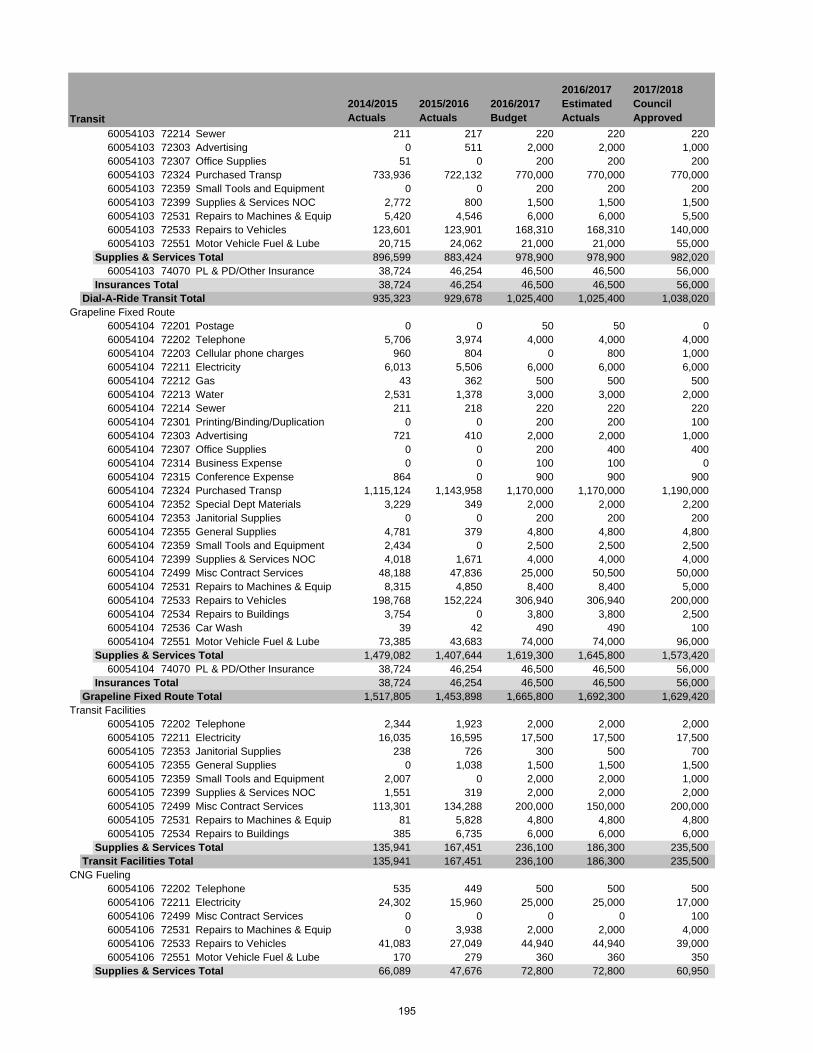
2014/2015 Actuals
2015/2016 Actuals
2016/2017 Budget
2016/2017 Estimated Actuals
2017/2018 Council ApprovedTransit
60054103 72214 Sewer 211 217 220 220 22060054103 72303 Advertising 0 511 2,000 2,000 1,00060054103 72307 Office Supplies 51 0 200 200 20060054103 72324 Purchased Transp 733,936 722,132 770,000 770,000 770,00060054103 72359 Small Tools and Equipment 0 0 200 200 20060054103 72399 Supplies & Services NOC 2,772 800 1,500 1,500 1,50060054103 72531 Repairs to Machines & Equip 5,420 4,546 6,000 6,000 5,50060054103 72533 Repairs to Vehicles 123,601 123,901 168,310 168,310 140,00060054103 72551 Motor Vehicle Fuel & Lube 20,715 24,062 21,000 21,000 55,000
Supplies & Services Total 896,599 883,424 978,900 978,900 982,02060054103 74070 PL & PD/Other Insurance 38,724 46,254 46,500 46,500 56,000
Insurances Total 38,724 46,254 46,500 46,500 56,000Dial-A-Ride Transit Total 935,323 929,678 1,025,400 1,025,400 1,038,020
Grapeline Fixed Route60054104 72201 Postage 0 0 50 50 060054104 72202 Telephone 5,706 3,974 4,000 4,000 4,00060054104 72203 Cellular phone charges 960 804 0 800 1,00060054104 72211 Electricity 6,013 5,506 6,000 6,000 6,00060054104 72212 Gas 43 362 500 500 50060054104 72213 Water 2,531 1,378 3,000 3,000 2,00060054104 72214 Sewer 211 218 220 220 22060054104 72301 Printing/Binding/Duplication 0 0 200 200 10060054104 72303 Advertising 721 410 2,000 2,000 1,00060054104 72307 Office Supplies 0 0 200 400 40060054104 72314 Business Expense 0 0 100 100 060054104 72315 Conference Expense 864 0 900 900 90060054104 72324 Purchased Transp 1,115,124 1,143,958 1,170,000 1,170,000 1,190,00060054104 72352 Special Dept Materials 3,229 349 2,000 2,000 2,20060054104 72353 Janitorial Supplies 0 0 200 200 20060054104 72355 General Supplies 4,781 379 4,800 4,800 4,80060054104 72359 Small Tools and Equipment 2,434 0 2,500 2,500 2,50060054104 72399 Supplies & Services NOC 4,018 1,671 4,000 4,000 4,00060054104 72499 Misc Contract Services 48,188 47,836 25,000 50,500 50,00060054104 72531 Repairs to Machines & Equip 8,315 4,850 8,400 8,400 5,00060054104 72533 Repairs to Vehicles 198,768 152,224 306,940 306,940 200,00060054104 72534 Repairs to Buildings 3,754 0 3,800 3,800 2,50060054104 72536 Car Wash 39 42 490 490 10060054104 72551 Motor Vehicle Fuel & Lube 73,385 43,683 74,000 74,000 96,000
Supplies & Services Total 1,479,082 1,407,644 1,619,300 1,645,800 1,573,42060054104 74070 PL & PD/Other Insurance 38,724 46,254 46,500 46,500 56,000
Insurances Total 38,724 46,254 46,500 46,500 56,000Grapeline Fixed Route Total 1,517,805 1,453,898 1,665,800 1,692,300 1,629,420
Transit Facilities60054105 72202 Telephone 2,344 1,923 2,000 2,000 2,00060054105 72211 Electricity 16,035 16,595 17,500 17,500 17,50060054105 72353 Janitorial Supplies 238 726 300 500 70060054105 72355 General Supplies 0 1,038 1,500 1,500 1,50060054105 72359 Small Tools and Equipment 2,007 0 2,000 2,000 1,00060054105 72399 Supplies & Services NOC 1,551 319 2,000 2,000 2,00060054105 72499 Misc Contract Services 113,301 134,288 200,000 150,000 200,00060054105 72531 Repairs to Machines & Equip 81 5,828 4,800 4,800 4,80060054105 72534 Repairs to Buildings 385 6,735 6,000 6,000 6,000
Supplies & Services Total 135,941 167,451 236,100 186,300 235,500Transit Facilities Total 135,941 167,451 236,100 186,300 235,500
CNG Fueling60054106 72202 Telephone 535 449 500 500 50060054106 72211 Electricity 24,302 15,960 25,000 25,000 17,00060054106 72499 Misc Contract Services 0 0 0 0 10060054106 72531 Repairs to Machines & Equip 0 3,938 2,000 2,000 4,00060054106 72533 Repairs to Vehicles 41,083 27,049 44,940 44,940 39,00060054106 72551 Motor Vehicle Fuel & Lube 170 279 360 360 350
Supplies & Services Total 66,089 47,676 72,800 72,800 60,950
195
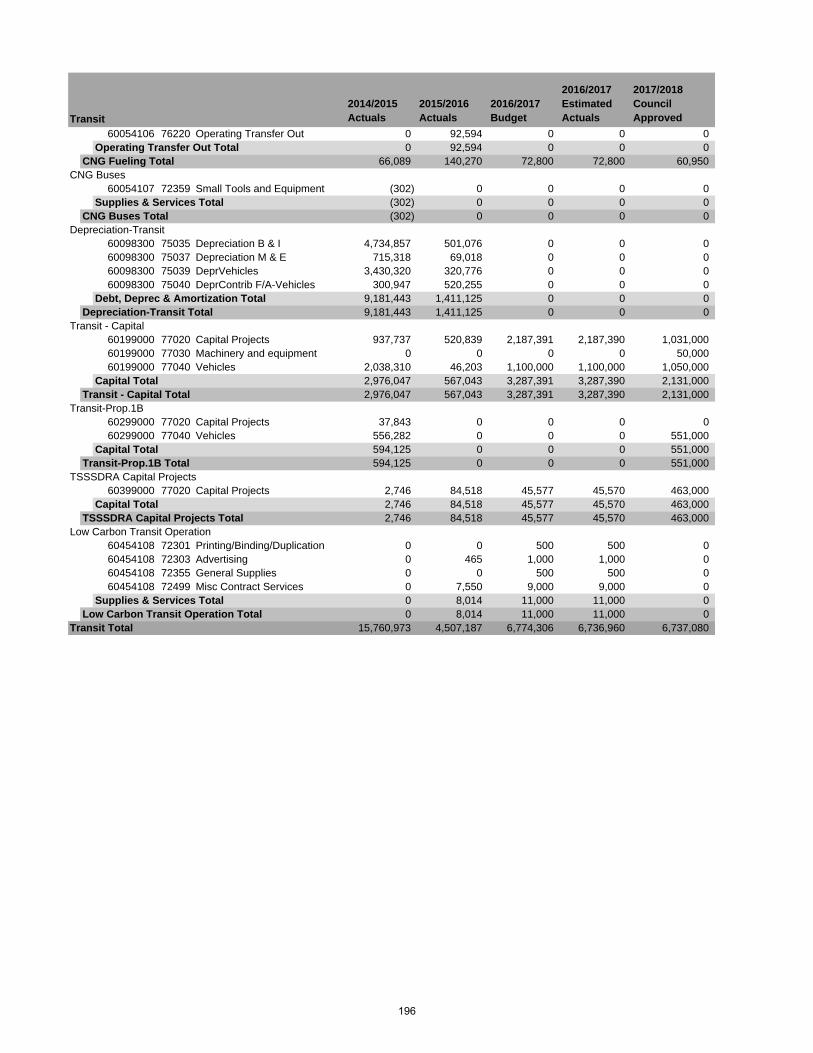
2014/2015 Actuals
2015/2016 Actuals
2016/2017 Budget
2016/2017 Estimated Actuals
2017/2018 Council ApprovedTransit
60054106 76220 Operating Transfer Out 0 92,594 0 0 0Operating Transfer Out Total 0 92,594 0 0 0
CNG Fueling Total 66,089 140,270 72,800 72,800 60,950CNG Buses
60054107 72359 Small Tools and Equipment (302) 0 0 0 0Supplies & Services Total (302) 0 0 0 0
CNG Buses Total (302) 0 0 0 0Depreciation-Transit
60098300 75035 Depreciation B & I 4,734,857 501,076 0 0 060098300 75037 Depreciation M & E 715,318 69,018 0 0 060098300 75039 DeprVehicles 3,430,320 320,776 0 0 060098300 75040 DeprContrib F/A-Vehicles 300,947 520,255 0 0 0
Debt, Deprec & Amortization Total 9,181,443 1,411,125 0 0 0Depreciation-Transit Total 9,181,443 1,411,125 0 0 0
Transit - Capital60199000 77020 Capital Projects 937,737 520,839 2,187,391 2,187,390 1,031,00060199000 77030 Machinery and equipment 0 0 0 0 50,00060199000 77040 Vehicles 2,038,310 46,203 1,100,000 1,100,000 1,050,000
Capital Total 2,976,047 567,043 3,287,391 3,287,390 2,131,000Transit - Capital Total 2,976,047 567,043 3,287,391 3,287,390 2,131,000
Transit-Prop.1B60299000 77020 Capital Projects 37,843 0 0 0 060299000 77040 Vehicles 556,282 0 0 0 551,000
Capital Total 594,125 0 0 0 551,000Transit-Prop.1B Total 594,125 0 0 0 551,000
TSSSDRA Capital Projects60399000 77020 Capital Projects 2,746 84,518 45,577 45,570 463,000
Capital Total 2,746 84,518 45,577 45,570 463,000TSSSDRA Capital Projects Total 2,746 84,518 45,577 45,570 463,000
Low Carbon Transit Operation60454108 72301 Printing/Binding/Duplication 0 0 500 500 060454108 72303 Advertising 0 465 1,000 1,000 060454108 72355 General Supplies 0 0 500 500 060454108 72499 Misc Contract Services 0 7,550 9,000 9,000 0
Supplies & Services Total 0 8,014 11,000 11,000 0Low Carbon Transit Operation Total 0 8,014 11,000 11,000 0
Transit Total 15,760,973 4,507,187 6,774,306 6,736,960 6,737,080
196
SPECIAL REVENUE FUNDS Special Revenue Funds are those that receive financial support from the General Fund and have other revenue sources, such as user fees, transfers from other funds or restricted government grants. The Special Revenue category includes the Streets and Drainage Division, Community Development Department, Parks, Recreation and Cultural Services and the Library. Organizational charts, staffing summaries, detailed activity descriptions and financial tables are included in the following pages.
197

(This page intentionally left blank)
198
STREETS AND DRAINAGE The Streets and Drainage Division of the Public Works Department is responsible for maintaining City streets, City-owned parking lots and sidewalks, traffic lights and signs. In addition, it maintains the City’s storm drain system. Most of the division’s revenue comes from State and local taxes. It has a budget of $4,213,430 in FY 2017/18, compared to $3,887,610 as originally budgeted in FY 2016/17. The 2016/17 budget shown in the following pages reflects adjustments made throughout the year. FY 2017/18 budgeted staffing is being maintained at 14 positions. An organizational chart, staffing summary, detailed activity descriptions and financial tables are included in the following pages.
199

(This page intentionally left blank)
200
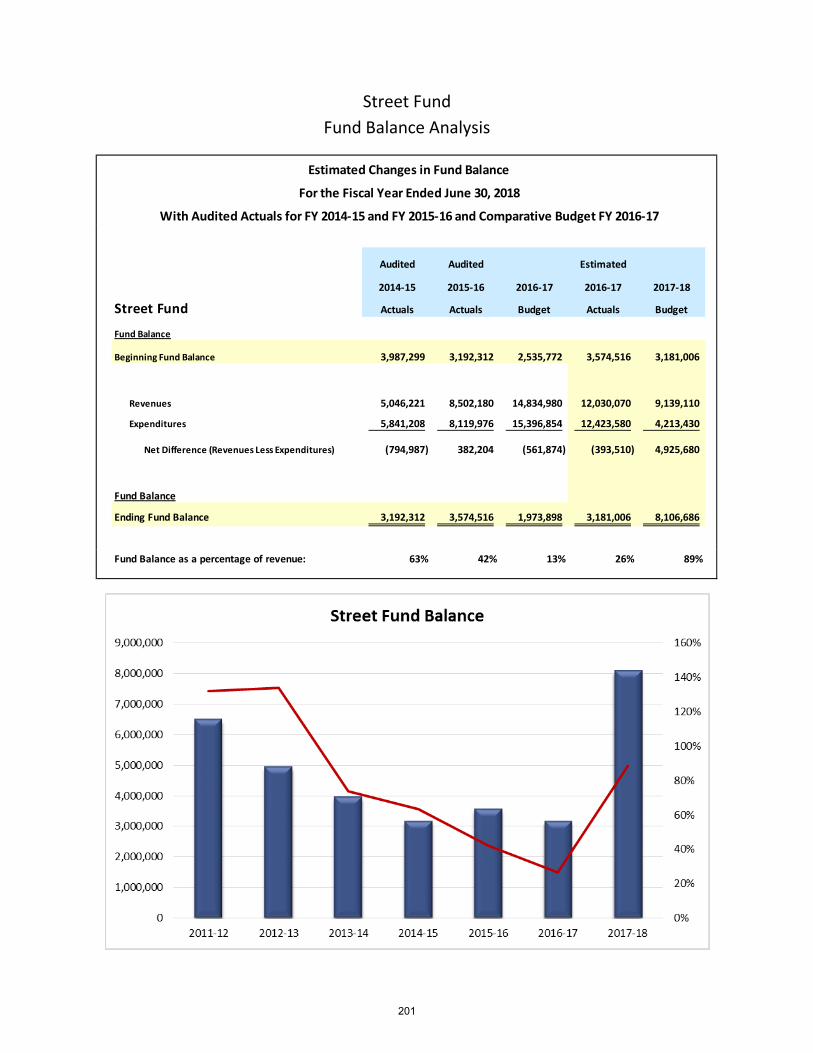
Street Fund Fund Balance Analysis
Audited Audited Estimated
2014-15 2015-16 2016-17 2016-17 2017-18
Street Fund Actuals Actuals Budget Actuals Budget
Fund Balance
Beginning Fund Balance 3,987,299 3,192,312 2,535,772 3,574,516 3,181,006
Revenues 5,046,221 8,502,180 14,834,980 12,030,070 9,139,110
Expenditures 5,841,208 8,119,976 15,396,854 12,423,580 4,213,430
Net Difference (Revenues Less Expenditures) (794,987) 382,204 (561,874) (393,510) 4,925,680
Fund Balance
Ending Fund Balance 3,192,312 3,574,516 1,973,898 3,181,006 8,106,686
Fund Balance as a percentage of revenue: 63% 42% 13% 26% 89%
Estimated Changes in Fund Balance
For the Fiscal Year Ended June 30, 2018
With Audited Actuals for FY 2014-15 and FY 2015-16 and Comparative Budget FY 2016-17
201
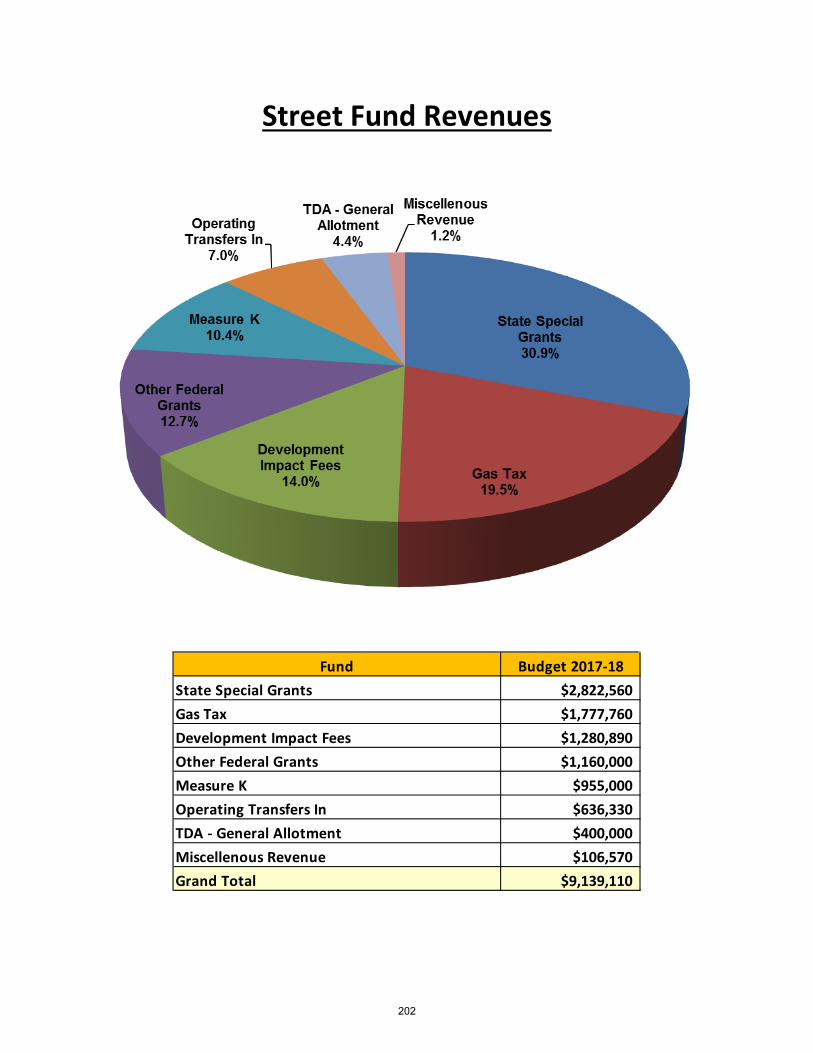
Street Fund Revenues
Fund Budget 2017-18State Special Grants $2,822,560Gas Tax $1,777,760Development Impact Fees $1,280,890Other Federal Grants $1,160,000Measure K $955,000Operating Transfers In $636,330TDA - General Allotment $400,000Miscellenous Revenue $106,570Grand Total $9,139,110
202
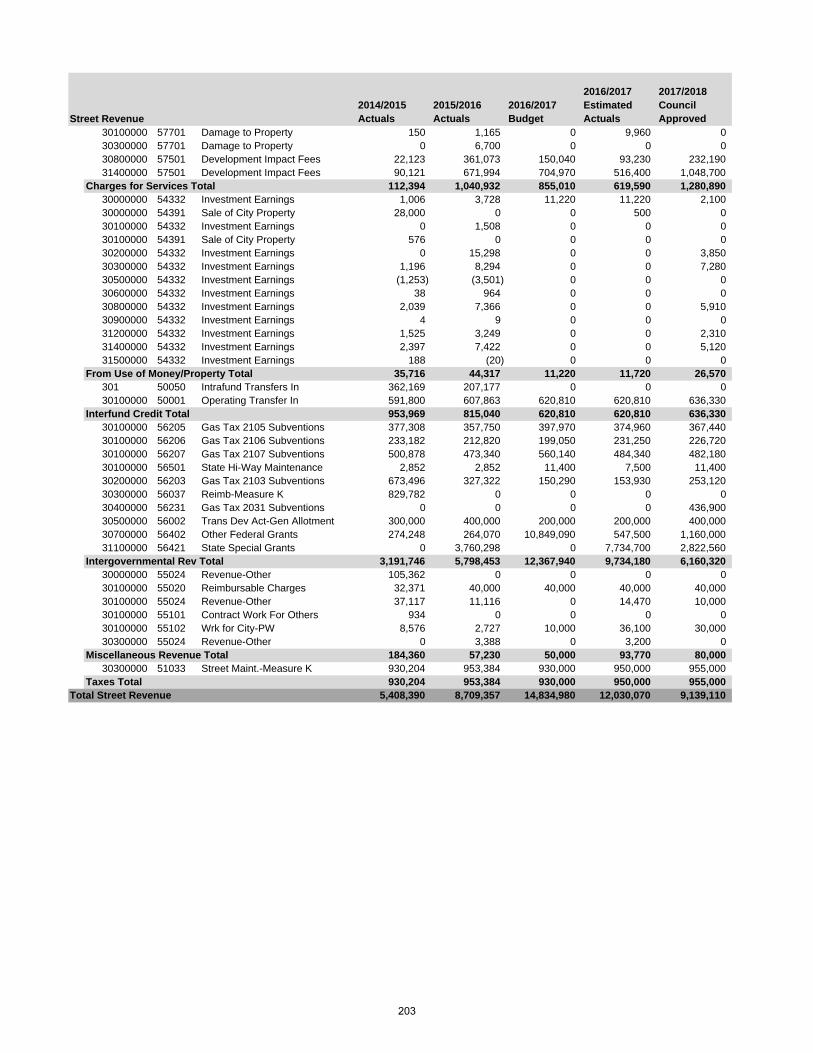
2014/2015 Actuals
2015/2016 Actuals
2016/2017 Budget
2016/2017 Estimated Actuals
2017/2018 Council Approved
30100000 57701 Damage to Property 150 1,165 0 9,960 030300000 57701 Damage to Property 0 6,700 0 0 030800000 57501 Development Impact Fees 22,123 361,073 150,040 93,230 232,19031400000 57501 Development Impact Fees 90,121 671,994 704,970 516,400 1,048,700
Charges for Services Total 112,394 1,040,932 855,010 619,590 1,280,89030000000 54332 Investment Earnings 1,006 3,728 11,220 11,220 2,10030000000 54391 Sale of City Property 28,000 0 0 500 030100000 54332 Investment Earnings 0 1,508 0 0 030100000 54391 Sale of City Property 576 0 0 0 030200000 54332 Investment Earnings 0 15,298 0 0 3,85030300000 54332 Investment Earnings 1,196 8,294 0 0 7,28030500000 54332 Investment Earnings (1,253) (3,501) 0 0 030600000 54332 Investment Earnings 38 964 0 0 030800000 54332 Investment Earnings 2,039 7,366 0 0 5,91030900000 54332 Investment Earnings 4 9 0 0 031200000 54332 Investment Earnings 1,525 3,249 0 0 2,31031400000 54332 Investment Earnings 2,397 7,422 0 0 5,12031500000 54332 Investment Earnings 188 (20) 0 0 0
From Use of Money/Property Total 35,716 44,317 11,220 11,720 26,570301 50050 Intrafund Transfers In 362,169 207,177 0 0 030100000 50001 Operating Transfer In 591,800 607,863 620,810 620,810 636,330
Interfund Credit Total 953,969 815,040 620,810 620,810 636,33030100000 56205 Gas Tax 2105 Subventions 377,308 357,750 397,970 374,960 367,44030100000 56206 Gas Tax 2106 Subventions 233,182 212,820 199,050 231,250 226,72030100000 56207 Gas Tax 2107 Subventions 500,878 473,340 560,140 484,340 482,18030100000 56501 State Hi-Way Maintenance 2,852 2,852 11,400 7,500 11,40030200000 56203 Gas Tax 2103 Subventions 673,496 327,322 150,290 153,930 253,12030300000 56037 Reimb-Measure K 829,782 0 0 0 030400000 56231 Gas Tax 2031 Subventions 0 0 0 0 436,90030500000 56002 Trans Dev Act-Gen Allotment 300,000 400,000 200,000 200,000 400,00030700000 56402 Other Federal Grants 274,248 264,070 10,849,090 547,500 1,160,00031100000 56421 State Special Grants 0 3,760,298 0 7,734,700 2,822,560
Intergovernmental Rev Total 3,191,746 5,798,453 12,367,940 9,734,180 6,160,32030000000 55024 Revenue-Other 105,362 0 0 0 030100000 55020 Reimbursable Charges 32,371 40,000 40,000 40,000 40,00030100000 55024 Revenue-Other 37,117 11,116 0 14,470 10,00030100000 55101 Contract Work For Others 934 0 0 0 030100000 55102 Wrk for City-PW 8,576 2,727 10,000 36,100 30,00030300000 55024 Revenue-Other 0 3,388 0 3,200 0
Miscellaneous Revenue Total 184,360 57,230 50,000 93,770 80,00030300000 51033 Street Maint.-Measure K 930,204 953,384 930,000 950,000 955,000
Taxes Total 930,204 953,384 930,000 950,000 955,000Total Street Revenue 5,408,390 8,709,357 14,834,980 12,030,070 9,139,110
Street Revenue
203

(This page intentionally left blank)
204
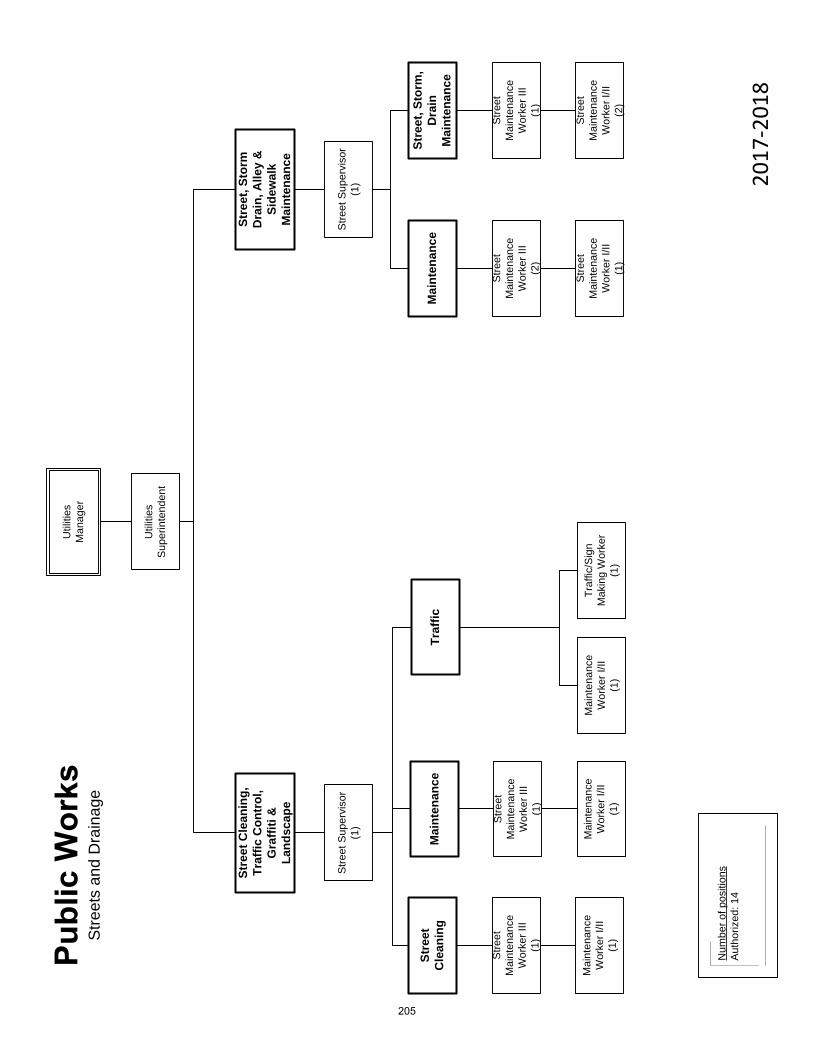
Stre
ets
and
Dra
inag
e
2017
-201
8
Num
ber o
f pos
ition
sA
utho
rized
: 14
Util
ities
Man
ager
Stre
et C
lean
ing,
Tr
affic
Con
trol
, G
raffi
ti &
La
ndsc
ape
Stre
et, S
torm
D
rain
, Alle
y &
Si
dew
alk
Mai
nten
ance
Stre
et S
uper
viso
r(1
)
Stre
et
Cle
anin
gM
aint
enan
ce
Stre
et
Mai
nten
ance
W
orke
r III
(1)
Mai
nten
ance
W
orke
r I/II
(1)
Traf
fic
Mai
nten
ance
W
orke
r I/II
(1)
Stre
et S
uper
viso
r (1
)
Mai
nten
ance
Stre
et, S
torm
, D
rain
M
aint
enan
ce
Stre
et
Mai
nten
ance
W
orke
r III
(2)
Stre
et
Mai
nten
ance
W
orke
r I/II
(1)
Stre
et
Mai
nten
ance
W
orke
r III
(1)
Stre
et
Mai
nten
ance
W
orke
r I/II
(2)
Traf
fic/S
ign
Mak
ing
Wor
ker
(1)
Stre
et
Mai
nten
ance
W
orke
r III
(1)
Mai
nten
ance
W
orke
r I/II
(1)
Util
ities
Su
perin
tend
ent
205
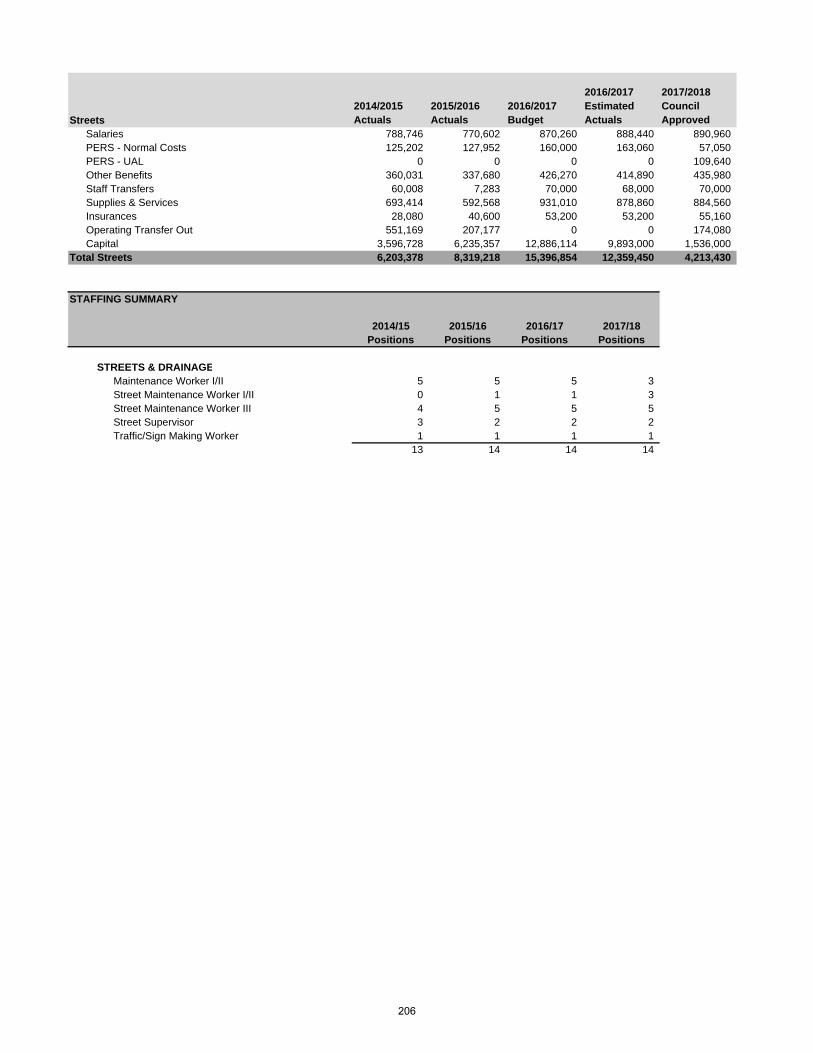
2014/2015 Actuals
2015/2016 Actuals
2016/2017 Budget
2016/2017 Estimated Actuals
2017/2018 Council Approved
Salaries 788,746 770,602 870,260 888,440 890,960PERS - Normal Costs 125,202 127,952 160,000 163,060 57,050PERS - UAL 0 0 0 0 109,640Other Benefits 360,031 337,680 426,270 414,890 435,980Staff Transfers 60,008 7,283 70,000 68,000 70,000Supplies & Services 693,414 592,568 931,010 878,860 884,560Insurances 28,080 40,600 53,200 53,200 55,160Operating Transfer Out 551,169 207,177 0 0 174,080Capital 3,596,728 6,235,357 12,886,114 9,893,000 1,536,000
Total Streets 6,203,378 8,319,218 15,396,854 12,359,450 4,213,430
STAFFING SUMMARY
2014/15 2015/16 2016/17 2017/18Positions Positions Positions Positions
STREETS & DRAINAGEMaintenance Worker I/II 5 5 5 3Street Maintenance Worker I/II 0 1 1 3Street Maintenance Worker III 4 5 5 5Street Supervisor 3 2 2 2Traffic/Sign Making Worker 1 1 1 1
13 14 14 14
Streets
206
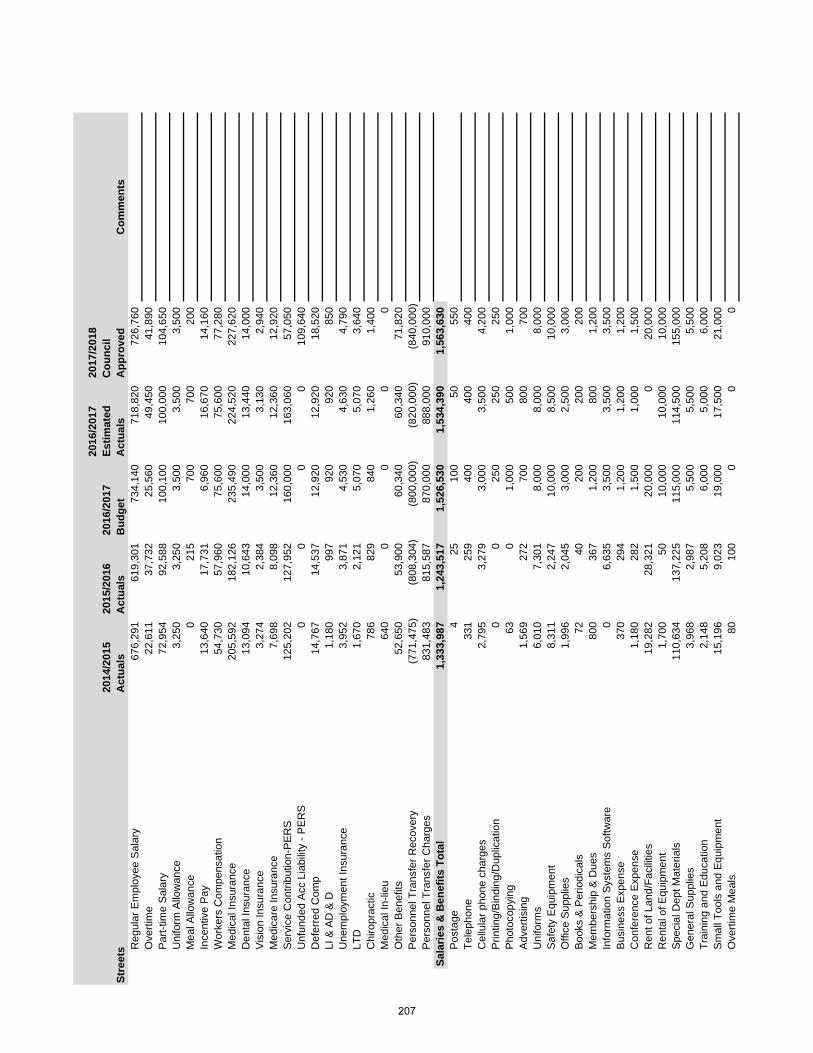
2014
/201
5 A
ctua
ls20
15/2
016
Act
uals
2016
/201
7 B
udge
t
2016
/201
7 Es
timat
ed
Act
uals
2017
/201
8 C
ounc
il A
ppro
ved
Com
men
tsR
egul
ar E
mpl
oyee
Sal
ary
676,
291
619,
301
734,
140
718,
820
726,
760
Ove
rtim
e 22
,611
37,7
3225
,560
49,4
5041
,890
Par
t-tim
e S
alar
y 72
,954
92,5
8810
0,10
010
0,00
010
4,65
0U
nifo
rm A
llow
ance
3,
250
3,25
03,
500
3,50
03,
500
Mea
l Allo
wan
ce
021
570
070
020
0In
cent
ive
Pay
13
,640
17,7
316,
960
16,6
7014
,160
Wor
kers
Com
pens
atio
n 54
,730
57,9
6075
,600
75,6
0077
,280
Med
ical
Insu
ranc
e 20
5,59
218
2,12
623
5,49
022
4,52
022
7,62
0D
enta
l Ins
uran
ce
13,0
9410
,643
14,0
0013
,440
14,0
00V
isio
n In
sura
nce
3,27
42,
384
3,50
03,
130
2,94
0M
edic
are
Insu
ranc
e 7,
698
8,09
812
,360
12,3
6012
,920
Ser
vice
Con
tribu
tion-
PE
RS
12
5,20
212
7,95
216
0,00
016
3,06
057
,050
Unf
unde
d A
cc L
iabi
lity
- PE
RS
0
00
010
9,64
0D
efer
red
Com
p 14
,767
14,5
3712
,920
12,9
2018
,520
LI &
AD
& D
1,
180
997
920
920
850
Une
mpl
oym
ent I
nsur
ance
3,
952
3,87
14,
530
4,63
04,
790
LTD
1,
670
2,12
15,
070
5,07
03,
640
Chi
ropr
actic
78
682
984
01,
260
1,40
0M
edic
al In
-lieu
64
00
00
0O
ther
Ben
efits
52
,650
53,9
0060
,340
60,3
4071
,820
Per
sonn
el T
rans
fer R
ecov
ery
(771
,475
)(8
08,3
04)
(800
,000
)(8
20,0
00)
(840
,000
)P
erso
nnel
Tra
nsfe
r Cha
rges
83
1,48
381
5,58
787
0,00
088
8,00
091
0,00
0Sa
larie
s &
Ben
efits
Tot
al1,
333,
987
1,24
3,51
71,
526,
530
1,53
4,39
01,
563,
630
Pos
tage
4
2510
050
550
Tele
phon
e 33
125
940
040
040
0C
ellu
lar p
hone
cha
rges
2,
795
3,27
93,
000
3,50
04,
200
Prin
ting/
Bin
ding
/Dup
licat
ion
00
250
250
250
Pho
toco
pyin
g 63
01,
000
500
1,00
0A
dver
tisin
g 1,
569
272
700
800
700
Uni
form
s 6,
010
7,30
18,
000
8,00
08,
000
Saf
ety
Equ
ipm
ent
8,31
12,
247
10,0
008,
500
10,0
00O
ffice
Sup
plie
s 1,
996
2,04
53,
000
2,50
03,
000
Boo
ks &
Per
iodi
cals
72
4020
020
020
0M
embe
rshi
p &
Due
s 80
036
71,
200
800
1,20
0In
form
atio
n S
yste
ms
Sof
twar
e 0
6,63
53,
500
3,50
03,
500
Bus
ines
s E
xpen
se
370
294
1,20
01,
200
1,20
0C
onfe
renc
e E
xpen
se
1,18
028
21,
500
1,00
01,
500
Ren
t of L
and/
Faci
litie
s 19
,282
28,3
2120
,000
020
,000
Ren
tal o
f Equ
ipm
ent
1,70
050
10,0
0010
,000
10,0
00S
peci
al D
ept M
ater
ials
11
0,63
413
7,22
511
5,00
011
4,50
015
5,00
0G
ener
al S
uppl
ies
3,96
82,
987
5,50
05,
500
5,50
0Tr
aini
ng a
nd E
duca
tion
2,14
85,
208
6,00
05,
000
6,00
0S
mal
l Too
ls a
nd E
quip
men
t 15
,196
9,02
319
,000
17,5
0021
,000
Ove
rtim
e M
eals
80
100
00
0
Stre
ets
207
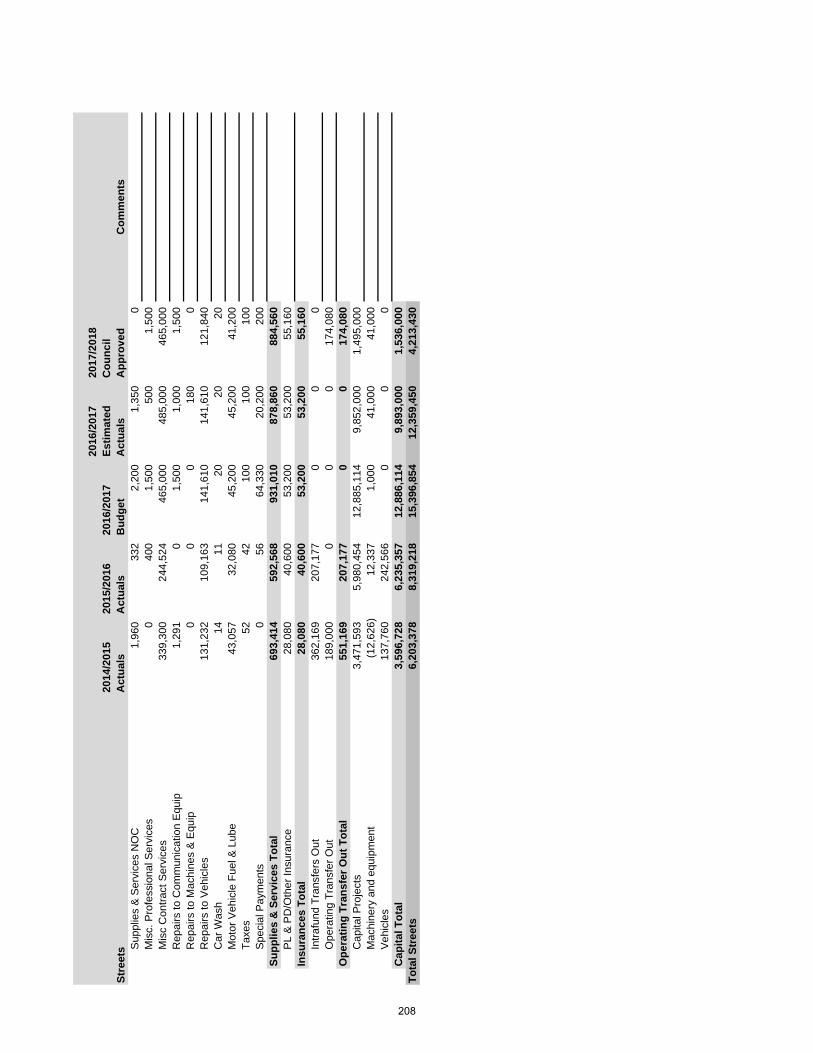
2014
/201
5 A
ctua
ls20
15/2
016
Act
uals
2016
/201
7 B
udge
t
2016
/201
7 Es
timat
ed
Act
uals
2017
/201
8 C
ounc
il A
ppro
ved
Com
men
tsSt
reet
s Sup
plie
s &
Ser
vice
s N
OC
1,
960
332
2,20
01,
350
0M
isc.
Pro
fess
iona
l Ser
vice
s 0
400
1,50
050
01,
500
Mis
c C
ontra
ct S
ervi
ces
339,
300
244,
524
465,
000
485,
000
465,
000
Rep
airs
to C
omm
unic
atio
n E
quip
1,
291
01,
500
1,00
01,
500
Rep
airs
to M
achi
nes
& E
quip
0
00
180
0R
epai
rs to
Veh
icle
s 13
1,23
210
9,16
314
1,61
014
1,61
012
1,84
0C
ar W
ash
1411
2020
20M
otor
Veh
icle
Fue
l & L
ube
43,0
5732
,080
45,2
0045
,200
41,2
00Ta
xes
5242
100
100
100
Spe
cial
Pay
men
ts
056
64,3
3020
,200
200
Supp
lies
& S
ervi
ces
Tota
l69
3,41
459
2,56
893
1,01
087
8,86
088
4,56
0P
L &
PD
/Oth
er In
sura
nce
28,0
8040
,600
53,2
0053
,200
55,1
60In
sura
nces
Tot
al28
,080
40,6
0053
,200
53,2
0055
,160
Intra
fund
Tra
nsfe
rs O
ut
362,
169
207,
177
00
0O
pera
ting
Tran
sfer
Out
18
9,00
00
00
174,
080
Ope
ratin
g Tr
ansf
er O
ut T
otal
551,
169
207,
177
00
174,
080
Cap
ital P
roje
cts
3,47
1,59
35,
980,
454
12,8
85,1
149,
852,
000
1,49
5,00
0M
achi
nery
and
equ
ipm
ent
(12,
626)
12,3
371,
000
41,0
0041
,000
Veh
icle
s 13
7,76
024
2,56
60
00
Cap
ital T
otal
3,59
6,72
86,
235,
357
12,8
86,1
149,
893,
000
1,53
6,00
0To
tal S
tree
ts6,
203,
378
8,31
9,21
815
,396
,854
12,3
59,4
504,
213,
430
208
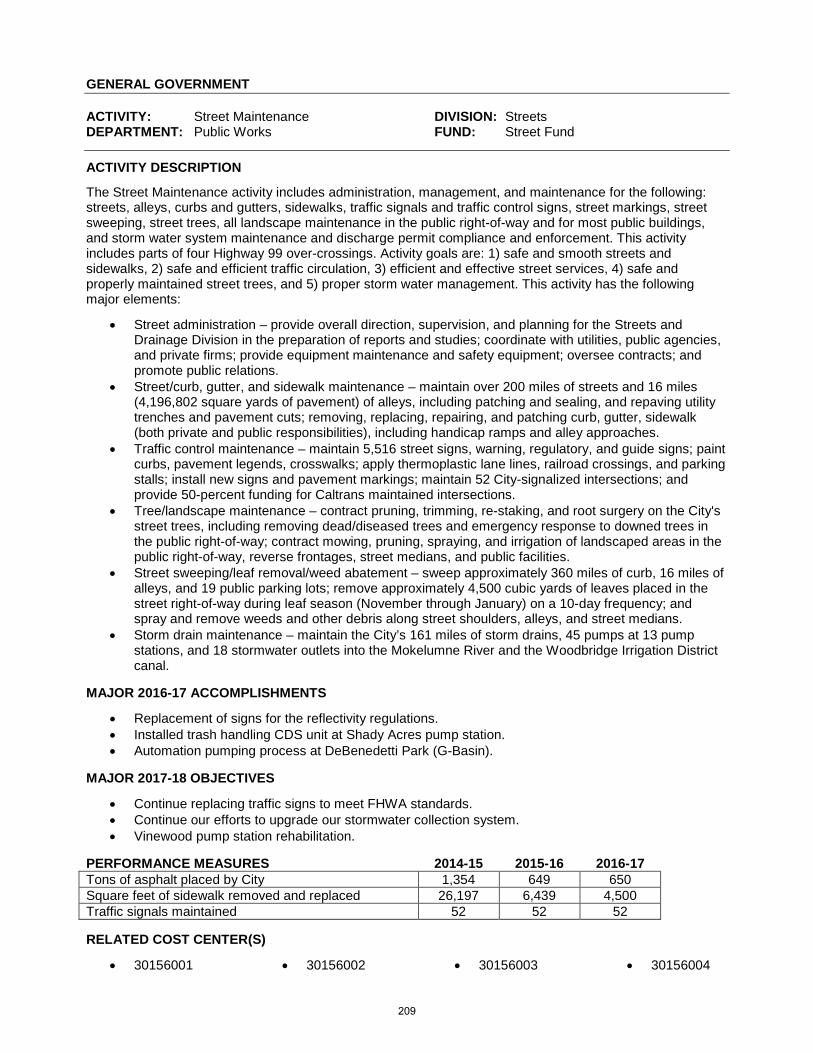
GENERAL GOVERNMENT ACTIVITY: Street Maintenance DIVISION: Streets DEPARTMENT: Public Works FUND: Street Fund
ACTIVITY DESCRIPTION
The Street Maintenance activity includes administration, management, and maintenance for the following: streets, alleys, curbs and gutters, sidewalks, traffic signals and traffic control signs, street markings, street sweeping, street trees, all landscape maintenance in the public right-of-way and for most public buildings, and storm water system maintenance and discharge permit compliance and enforcement. This activity includes parts of four Highway 99 over-crossings. Activity goals are: 1) safe and smooth streets and sidewalks, 2) safe and efficient traffic circulation, 3) efficient and effective street services, 4) safe and properly maintained street trees, and 5) proper storm water management. This activity has the following major elements:
• Street administration – provide overall direction, supervision, and planning for the Streets and Drainage Division in the preparation of reports and studies; coordinate with utilities, public agencies, and private firms; provide equipment maintenance and safety equipment; oversee contracts; and promote public relations.
• Street/curb, gutter, and sidewalk maintenance – maintain over 200 miles of streets and 16 miles (4,196,802 square yards of pavement) of alleys, including patching and sealing, and repaving utility trenches and pavement cuts; removing, replacing, repairing, and patching curb, gutter, sidewalk (both private and public responsibilities), including handicap ramps and alley approaches.
• Traffic control maintenance – maintain 5,516 street signs, warning, regulatory, and guide signs; paint curbs, pavement legends, crosswalks; apply thermoplastic lane lines, railroad crossings, and parking stalls; install new signs and pavement markings; maintain 52 City-signalized intersections; and provide 50-percent funding for Caltrans maintained intersections.
• Tree/landscape maintenance – contract pruning, trimming, re-staking, and root surgery on the City's street trees, including removing dead/diseased trees and emergency response to downed trees in the public right-of-way; contract mowing, pruning, spraying, and irrigation of landscaped areas in the public right-of-way, reverse frontages, street medians, and public facilities.
• Street sweeping/leaf removal/weed abatement – sweep approximately 360 miles of curb, 16 miles of alleys, and 19 public parking lots; remove approximately 4,500 cubic yards of leaves placed in the street right-of-way during leaf season (November through January) on a 10-day frequency; and spray and remove weeds and other debris along street shoulders, alleys, and street medians.
• Storm drain maintenance – maintain the City’s 161 miles of storm drains, 45 pumps at 13 pump stations, and 18 stormwater outlets into the Mokelumne River and the Woodbridge Irrigation District canal.
MAJOR 2016-17 ACCOMPLISHMENTS
• Replacement of signs for the reflectivity regulations. • Installed trash handling CDS unit at Shady Acres pump station. • Automation pumping process at DeBenedetti Park (G-Basin).
MAJOR 2017-18 OBJECTIVES
• Continue replacing traffic signs to meet FHWA standards. • Continue our efforts to upgrade our stormwater collection system. • Vinewood pump station rehabilitation.
PERFORMANCE MEASURES 2014-15 2015-16 2016-17 Tons of asphalt placed by City 1,354 649 650 Square feet of sidewalk removed and replaced 26,197 6,439 4,500 Traffic signals maintained 52 52 52 RELATED COST CENTER(S)
• 30156001 • 30156002 • 30156003 • 30156004
209
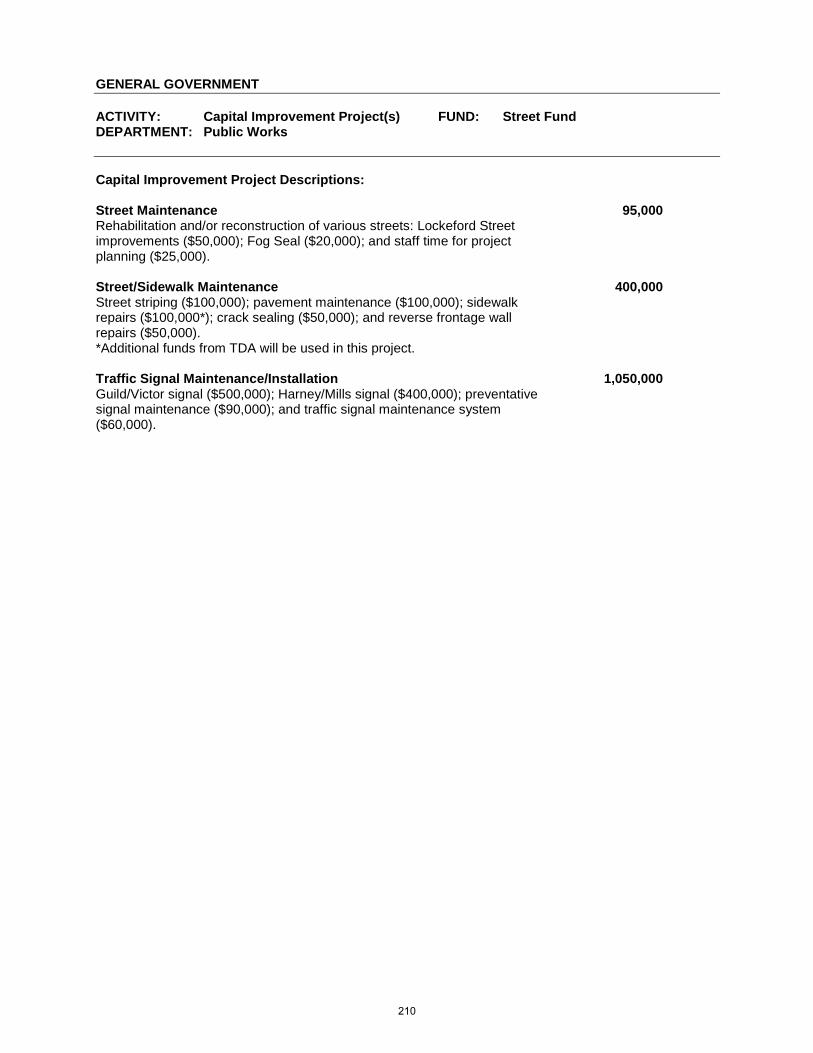
GENERAL GOVERNMENT ACTIVITY: Capital Improvement Project(s) FUND: Street Fund DEPARTMENT: Public Works Capital Improvement Project Descriptions: Street Maintenance 95,000 Rehabilitation and/or reconstruction of various streets: Lockeford Street improvements ($50,000); Fog Seal ($20,000); and staff time for project planning ($25,000).
Street/Sidewalk Maintenance 400,000 Street striping ($100,000); pavement maintenance ($100,000); sidewalk repairs ($100,000*); crack sealing ($50,000); and reverse frontage wall repairs ($50,000). *Additional funds from TDA will be used in this project.
Traffic Signal Maintenance/Installation 1,050,000 Guild/Victor signal ($500,000); Harney/Mills signal ($400,000); preventative signal maintenance ($90,000); and traffic signal maintenance system ($60,000).
210
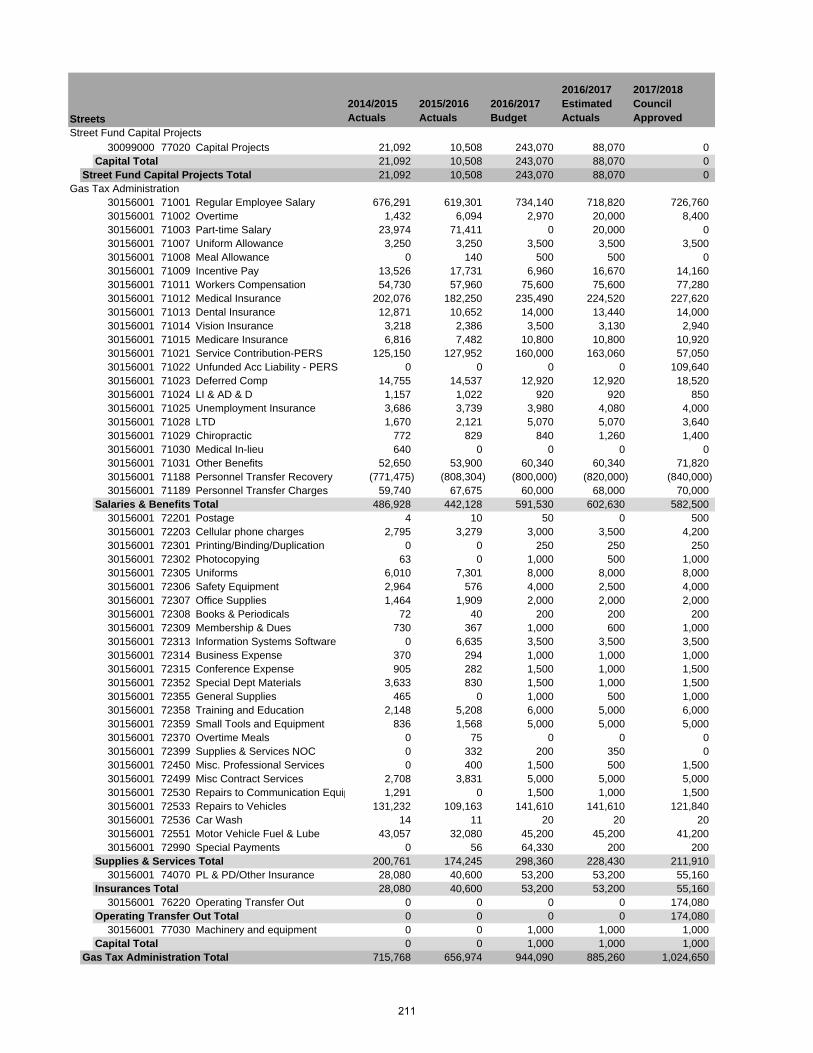
2014/2015 Actuals
2015/2016 Actuals
2016/2017 Budget
2016/2017 Estimated Actuals
2017/2018 Council Approved
Street Fund Capital Projects30099000 77020 Capital Projects 21,092 10,508 243,070 88,070 0
Capital Total 21,092 10,508 243,070 88,070 0Street Fund Capital Projects Total 21,092 10,508 243,070 88,070 0
Gas Tax Administration30156001 71001 Regular Employee Salary 676,291 619,301 734,140 718,820 726,76030156001 71002 Overtime 1,432 6,094 2,970 20,000 8,40030156001 71003 Part-time Salary 23,974 71,411 0 20,000 030156001 71007 Uniform Allowance 3,250 3,250 3,500 3,500 3,50030156001 71008 Meal Allowance 0 140 500 500 030156001 71009 Incentive Pay 13,526 17,731 6,960 16,670 14,16030156001 71011 Workers Compensation 54,730 57,960 75,600 75,600 77,28030156001 71012 Medical Insurance 202,076 182,250 235,490 224,520 227,62030156001 71013 Dental Insurance 12,871 10,652 14,000 13,440 14,00030156001 71014 Vision Insurance 3,218 2,386 3,500 3,130 2,94030156001 71015 Medicare Insurance 6,816 7,482 10,800 10,800 10,92030156001 71021 Service Contribution-PERS 125,150 127,952 160,000 163,060 57,05030156001 71022 Unfunded Acc Liability - PERS 0 0 0 0 109,64030156001 71023 Deferred Comp 14,755 14,537 12,920 12,920 18,52030156001 71024 LI & AD & D 1,157 1,022 920 920 85030156001 71025 Unemployment Insurance 3,686 3,739 3,980 4,080 4,00030156001 71028 LTD 1,670 2,121 5,070 5,070 3,64030156001 71029 Chiropractic 772 829 840 1,260 1,40030156001 71030 Medical In-lieu 640 0 0 0 030156001 71031 Other Benefits 52,650 53,900 60,340 60,340 71,82030156001 71188 Personnel Transfer Recovery (771,475) (808,304) (800,000) (820,000) (840,000)30156001 71189 Personnel Transfer Charges 59,740 67,675 60,000 68,000 70,000
Salaries & Benefits Total 486,928 442,128 591,530 602,630 582,50030156001 72201 Postage 4 10 50 0 50030156001 72203 Cellular phone charges 2,795 3,279 3,000 3,500 4,20030156001 72301 Printing/Binding/Duplication 0 0 250 250 25030156001 72302 Photocopying 63 0 1,000 500 1,00030156001 72305 Uniforms 6,010 7,301 8,000 8,000 8,00030156001 72306 Safety Equipment 2,964 576 4,000 2,500 4,00030156001 72307 Office Supplies 1,464 1,909 2,000 2,000 2,00030156001 72308 Books & Periodicals 72 40 200 200 20030156001 72309 Membership & Dues 730 367 1,000 600 1,00030156001 72313 Information Systems Software 0 6,635 3,500 3,500 3,50030156001 72314 Business Expense 370 294 1,000 1,000 1,00030156001 72315 Conference Expense 905 282 1,500 1,000 1,50030156001 72352 Special Dept Materials 3,633 830 1,500 1,000 1,50030156001 72355 General Supplies 465 0 1,000 500 1,00030156001 72358 Training and Education 2,148 5,208 6,000 5,000 6,00030156001 72359 Small Tools and Equipment 836 1,568 5,000 5,000 5,00030156001 72370 Overtime Meals 0 75 0 0 030156001 72399 Supplies & Services NOC 0 332 200 350 030156001 72450 Misc. Professional Services 0 400 1,500 500 1,50030156001 72499 Misc Contract Services 2,708 3,831 5,000 5,000 5,00030156001 72530 Repairs to Communication Equip 1,291 0 1,500 1,000 1,50030156001 72533 Repairs to Vehicles 131,232 109,163 141,610 141,610 121,84030156001 72536 Car Wash 14 11 20 20 2030156001 72551 Motor Vehicle Fuel & Lube 43,057 32,080 45,200 45,200 41,20030156001 72990 Special Payments 0 56 64,330 200 200
Supplies & Services Total 200,761 174,245 298,360 228,430 211,91030156001 74070 PL & PD/Other Insurance 28,080 40,600 53,200 53,200 55,160
Insurances Total 28,080 40,600 53,200 53,200 55,16030156001 76220 Operating Transfer Out 0 0 0 0 174,080
Operating Transfer Out Total 0 0 0 0 174,08030156001 77030 Machinery and equipment 0 0 1,000 1,000 1,000
Capital Total 0 0 1,000 1,000 1,000Gas Tax Administration Total 715,768 656,974 944,090 885,260 1,024,650
Streets
211
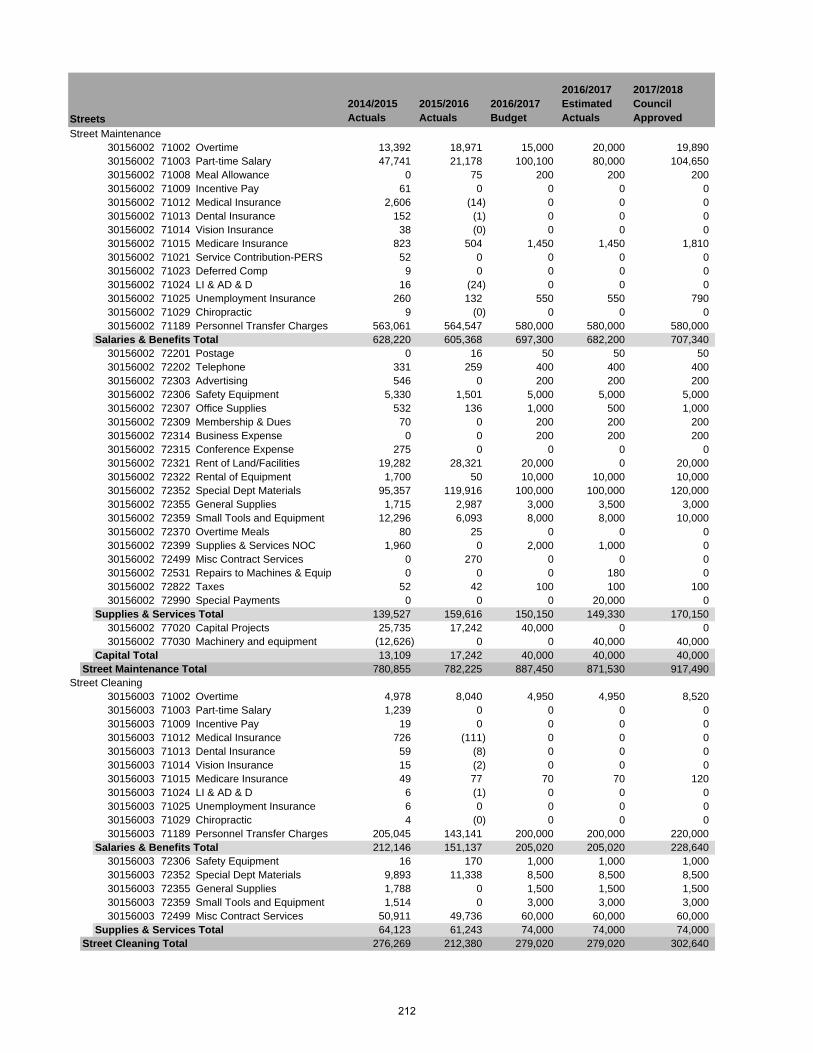
2014/2015 Actuals
2015/2016 Actuals
2016/2017 Budget
2016/2017 Estimated Actuals
2017/2018 Council ApprovedStreets
Street Maintenance30156002 71002 Overtime 13,392 18,971 15,000 20,000 19,89030156002 71003 Part-time Salary 47,741 21,178 100,100 80,000 104,65030156002 71008 Meal Allowance 0 75 200 200 20030156002 71009 Incentive Pay 61 0 0 0 030156002 71012 Medical Insurance 2,606 (14) 0 0 030156002 71013 Dental Insurance 152 (1) 0 0 030156002 71014 Vision Insurance 38 (0) 0 0 030156002 71015 Medicare Insurance 823 504 1,450 1,450 1,81030156002 71021 Service Contribution-PERS 52 0 0 0 030156002 71023 Deferred Comp 9 0 0 0 030156002 71024 LI & AD & D 16 (24) 0 0 030156002 71025 Unemployment Insurance 260 132 550 550 79030156002 71029 Chiropractic 9 (0) 0 0 030156002 71189 Personnel Transfer Charges 563,061 564,547 580,000 580,000 580,000
Salaries & Benefits Total 628,220 605,368 697,300 682,200 707,34030156002 72201 Postage 0 16 50 50 5030156002 72202 Telephone 331 259 400 400 40030156002 72303 Advertising 546 0 200 200 20030156002 72306 Safety Equipment 5,330 1,501 5,000 5,000 5,00030156002 72307 Office Supplies 532 136 1,000 500 1,00030156002 72309 Membership & Dues 70 0 200 200 20030156002 72314 Business Expense 0 0 200 200 20030156002 72315 Conference Expense 275 0 0 0 030156002 72321 Rent of Land/Facilities 19,282 28,321 20,000 0 20,00030156002 72322 Rental of Equipment 1,700 50 10,000 10,000 10,00030156002 72352 Special Dept Materials 95,357 119,916 100,000 100,000 120,00030156002 72355 General Supplies 1,715 2,987 3,000 3,500 3,00030156002 72359 Small Tools and Equipment 12,296 6,093 8,000 8,000 10,00030156002 72370 Overtime Meals 80 25 0 0 030156002 72399 Supplies & Services NOC 1,960 0 2,000 1,000 030156002 72499 Misc Contract Services 0 270 0 0 030156002 72531 Repairs to Machines & Equip 0 0 0 180 030156002 72822 Taxes 52 42 100 100 10030156002 72990 Special Payments 0 0 0 20,000 0
Supplies & Services Total 139,527 159,616 150,150 149,330 170,15030156002 77020 Capital Projects 25,735 17,242 40,000 0 030156002 77030 Machinery and equipment (12,626) 0 0 40,000 40,000
Capital Total 13,109 17,242 40,000 40,000 40,000Street Maintenance Total 780,855 782,225 887,450 871,530 917,490
Street Cleaning30156003 71002 Overtime 4,978 8,040 4,950 4,950 8,52030156003 71003 Part-time Salary 1,239 0 0 0 030156003 71009 Incentive Pay 19 0 0 0 030156003 71012 Medical Insurance 726 (111) 0 0 030156003 71013 Dental Insurance 59 (8) 0 0 030156003 71014 Vision Insurance 15 (2) 0 0 030156003 71015 Medicare Insurance 49 77 70 70 12030156003 71024 LI & AD & D 6 (1) 0 0 030156003 71025 Unemployment Insurance 6 0 0 0 030156003 71029 Chiropractic 4 (0) 0 0 030156003 71189 Personnel Transfer Charges 205,045 143,141 200,000 200,000 220,000
Salaries & Benefits Total 212,146 151,137 205,020 205,020 228,64030156003 72306 Safety Equipment 16 170 1,000 1,000 1,00030156003 72352 Special Dept Materials 9,893 11,338 8,500 8,500 8,50030156003 72355 General Supplies 1,788 0 1,500 1,500 1,50030156003 72359 Small Tools and Equipment 1,514 0 3,000 3,000 3,00030156003 72499 Misc Contract Services 50,911 49,736 60,000 60,000 60,000
Supplies & Services Total 64,123 61,243 74,000 74,000 74,000Street Cleaning Total 276,269 212,380 279,020 279,020 302,640
212
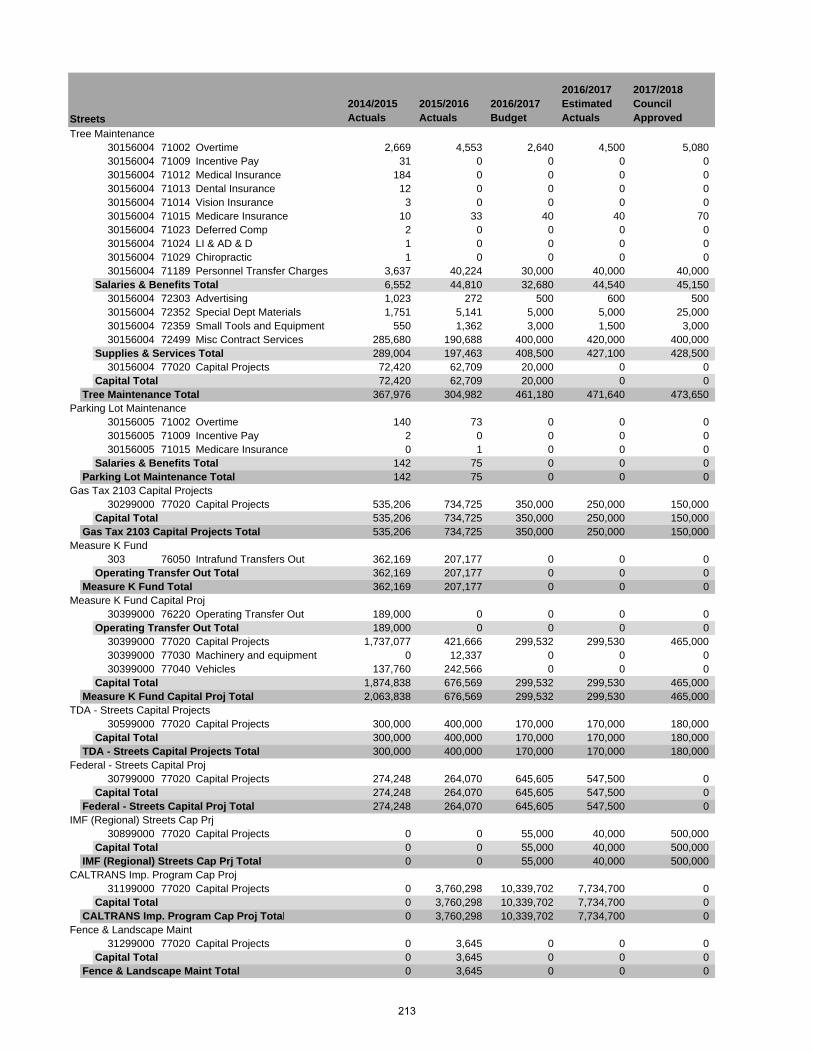
2014/2015 Actuals
2015/2016 Actuals
2016/2017 Budget
2016/2017 Estimated Actuals
2017/2018 Council ApprovedStreets
Tree Maintenance30156004 71002 Overtime 2,669 4,553 2,640 4,500 5,08030156004 71009 Incentive Pay 31 0 0 0 030156004 71012 Medical Insurance 184 0 0 0 030156004 71013 Dental Insurance 12 0 0 0 030156004 71014 Vision Insurance 3 0 0 0 030156004 71015 Medicare Insurance 10 33 40 40 7030156004 71023 Deferred Comp 2 0 0 0 030156004 71024 LI & AD & D 1 0 0 0 030156004 71029 Chiropractic 1 0 0 0 030156004 71189 Personnel Transfer Charges 3,637 40,224 30,000 40,000 40,000
Salaries & Benefits Total 6,552 44,810 32,680 44,540 45,15030156004 72303 Advertising 1,023 272 500 600 50030156004 72352 Special Dept Materials 1,751 5,141 5,000 5,000 25,00030156004 72359 Small Tools and Equipment 550 1,362 3,000 1,500 3,00030156004 72499 Misc Contract Services 285,680 190,688 400,000 420,000 400,000
Supplies & Services Total 289,004 197,463 408,500 427,100 428,50030156004 77020 Capital Projects 72,420 62,709 20,000 0 0
Capital Total 72,420 62,709 20,000 0 0Tree Maintenance Total 367,976 304,982 461,180 471,640 473,650
Parking Lot Maintenance30156005 71002 Overtime 140 73 0 0 030156005 71009 Incentive Pay 2 0 0 0 030156005 71015 Medicare Insurance 0 1 0 0 0
Salaries & Benefits Total 142 75 0 0 0Parking Lot Maintenance Total 142 75 0 0 0
Gas Tax 2103 Capital Projects30299000 77020 Capital Projects 535,206 734,725 350,000 250,000 150,000
Capital Total 535,206 734,725 350,000 250,000 150,000Gas Tax 2103 Capital Projects Total 535,206 734,725 350,000 250,000 150,000
Measure K Fund303 76050 Intrafund Transfers Out 362,169 207,177 0 0 0
Operating Transfer Out Total 362,169 207,177 0 0 0Measure K Fund Total 362,169 207,177 0 0 0
Measure K Fund Capital Proj30399000 76220 Operating Transfer Out 189,000 0 0 0 0
Operating Transfer Out Total 189,000 0 0 0 030399000 77020 Capital Projects 1,737,077 421,666 299,532 299,530 465,00030399000 77030 Machinery and equipment 0 12,337 0 0 030399000 77040 Vehicles 137,760 242,566 0 0 0
Capital Total 1,874,838 676,569 299,532 299,530 465,000Measure K Fund Capital Proj Total 2,063,838 676,569 299,532 299,530 465,000
TDA - Streets Capital Projects30599000 77020 Capital Projects 300,000 400,000 170,000 170,000 180,000
Capital Total 300,000 400,000 170,000 170,000 180,000TDA - Streets Capital Projects Total 300,000 400,000 170,000 170,000 180,000
Federal - Streets Capital Proj30799000 77020 Capital Projects 274,248 264,070 645,605 547,500 0
Capital Total 274,248 264,070 645,605 547,500 0Federal - Streets Capital Proj Total 274,248 264,070 645,605 547,500 0
IMF (Regional) Streets Cap Prj30899000 77020 Capital Projects 0 0 55,000 40,000 500,000
Capital Total 0 0 55,000 40,000 500,000IMF (Regional) Streets Cap Prj Total 0 0 55,000 40,000 500,000
CALTRANS Imp. Program Cap Proj31199000 77020 Capital Projects 0 3,760,298 10,339,702 7,734,700 0
Capital Total 0 3,760,298 10,339,702 7,734,700 0CALTRANS Imp. Program Cap Proj Total 0 3,760,298 10,339,702 7,734,700 0
Fence & Landscape Maint31299000 77020 Capital Projects 0 3,645 0 0 0
Capital Total 0 3,645 0 0 0Fence & Landscape Maint Total 0 3,645 0 0 0
213
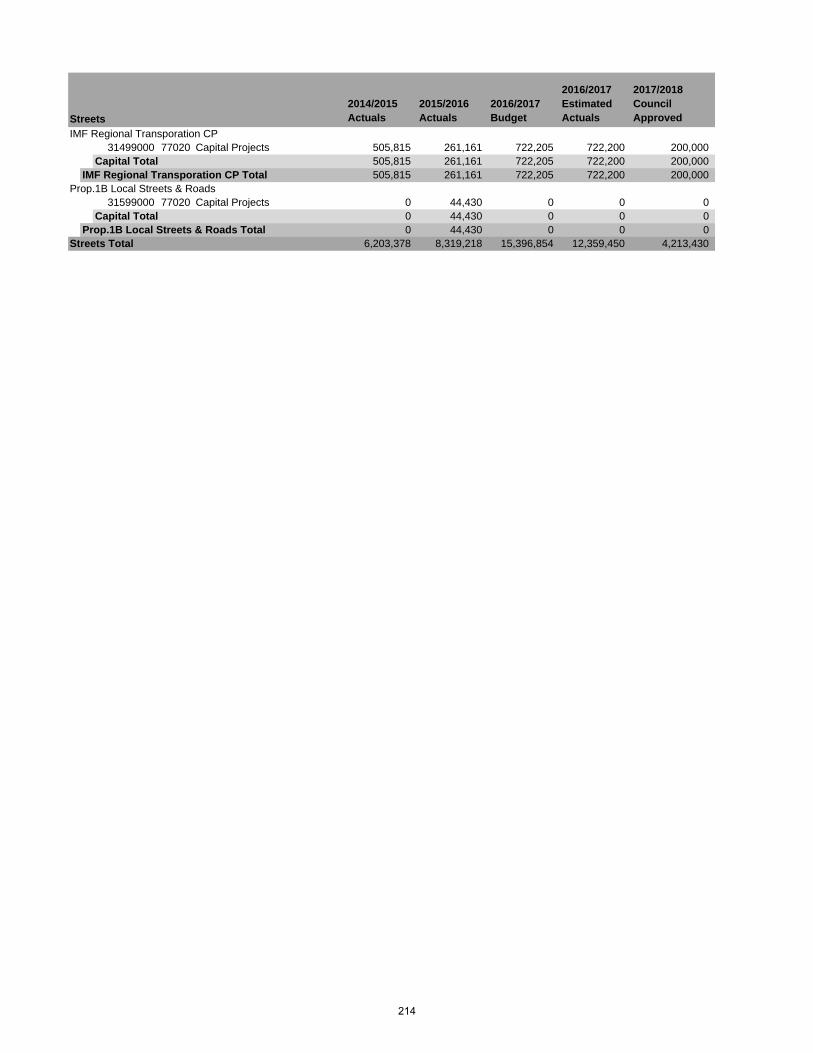
2014/2015 Actuals
2015/2016 Actuals
2016/2017 Budget
2016/2017 Estimated Actuals
2017/2018 Council ApprovedStreets
IMF Regional Transporation CP31499000 77020 Capital Projects 505,815 261,161 722,205 722,200 200,000
Capital Total 505,815 261,161 722,205 722,200 200,000IMF Regional Transporation CP Total 505,815 261,161 722,205 722,200 200,000
Prop.1B Local Streets & Roads31599000 77020 Capital Projects 0 44,430 0 0 0
Capital Total 0 44,430 0 0 0Prop.1B Local Streets & Roads Total 0 44,430 0 0 0
Streets Total 6,203,378 8,319,218 15,396,854 12,359,450 4,213,430
214
COMMUNITY DEVELOPMENT The Community Development Department includes the Planning, Building and Safety, and Neighborhood Services divisions. They oversee the City’s growth and development, ensure dwellings are constructed safely and provide housing assistance. The Department is funded through user fees and the General Fund. The Department’s budget is $3,906,660 in FY 2017/18, compared to $2,192,120 as originally budgeted in FY 2016/17. The 2016/17 budget shown in the following pages reflects adjustments made throughout the year. FY 2017/18 budgeted staffing is being maintained at 11 positions. An organizational chart, staffing summary, detailed activity descriptions and financial tables are included in the following pages.
215

(This page intentionally left blank)
216
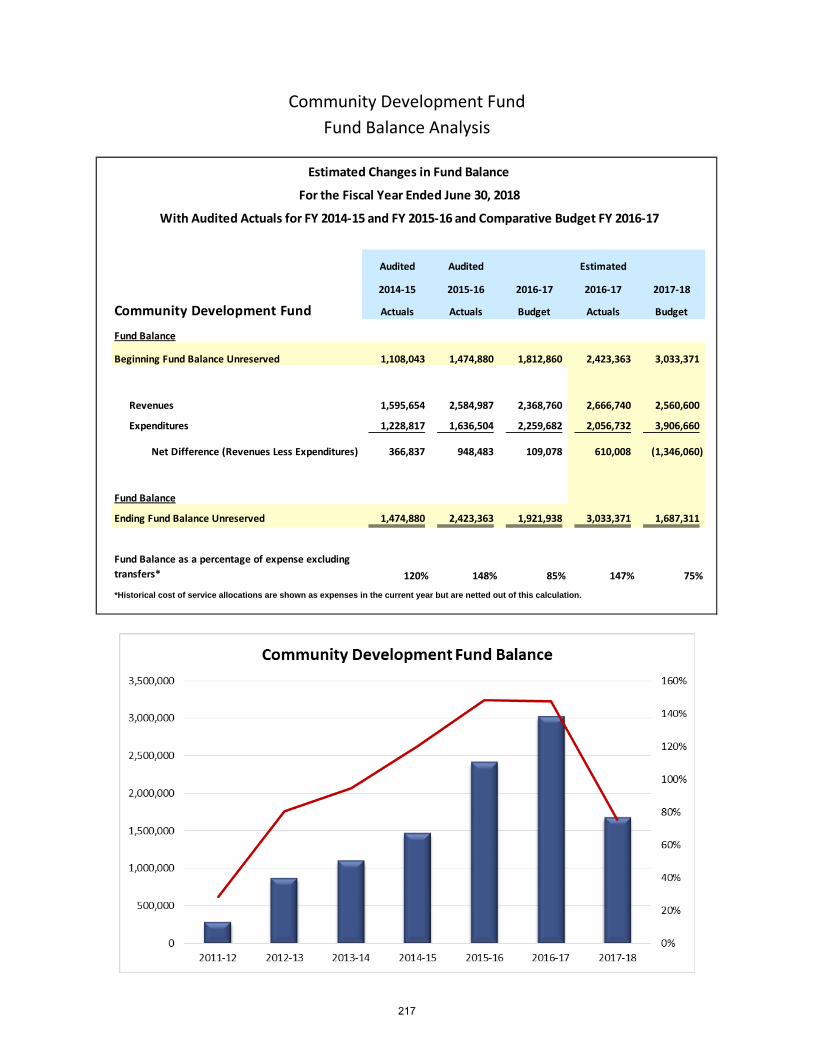
Community Development Fund Fund Balance Analysis
Audited Audited Estimated
2014-15 2015-16 2016-17 2016-17 2017-18
Community Development Fund Actuals Actuals Budget Actuals Budget
Fund Balance
Beginning Fund Balance Unreserved 1,108,043 1,474,880 1,812,860 2,423,363 3,033,371
Revenues 1,595,654 2,584,987 2,368,760 2,666,740 2,560,600
Expenditures 1,228,817 1,636,504 2,259,682 2,056,732 3,906,660
Net Difference (Revenues Less Expenditures) 366,837 948,483 109,078 610,008 (1,346,060)
Fund Balance
Ending Fund Balance Unreserved 1,474,880 2,423,363 1,921,938 3,033,371 1,687,311
120% 148% 85% 147% 75%
*Historical cost of service allocations are shown as expenses in the current year but are netted out of this calculation.
Fund Balance as a percentage of expense excluding transfers*
Estimated Changes in Fund Balance
For the Fiscal Year Ended June 30, 2018
With Audited Actuals for FY 2014-15 and FY 2015-16 and Comparative Budget FY 2016-17
217
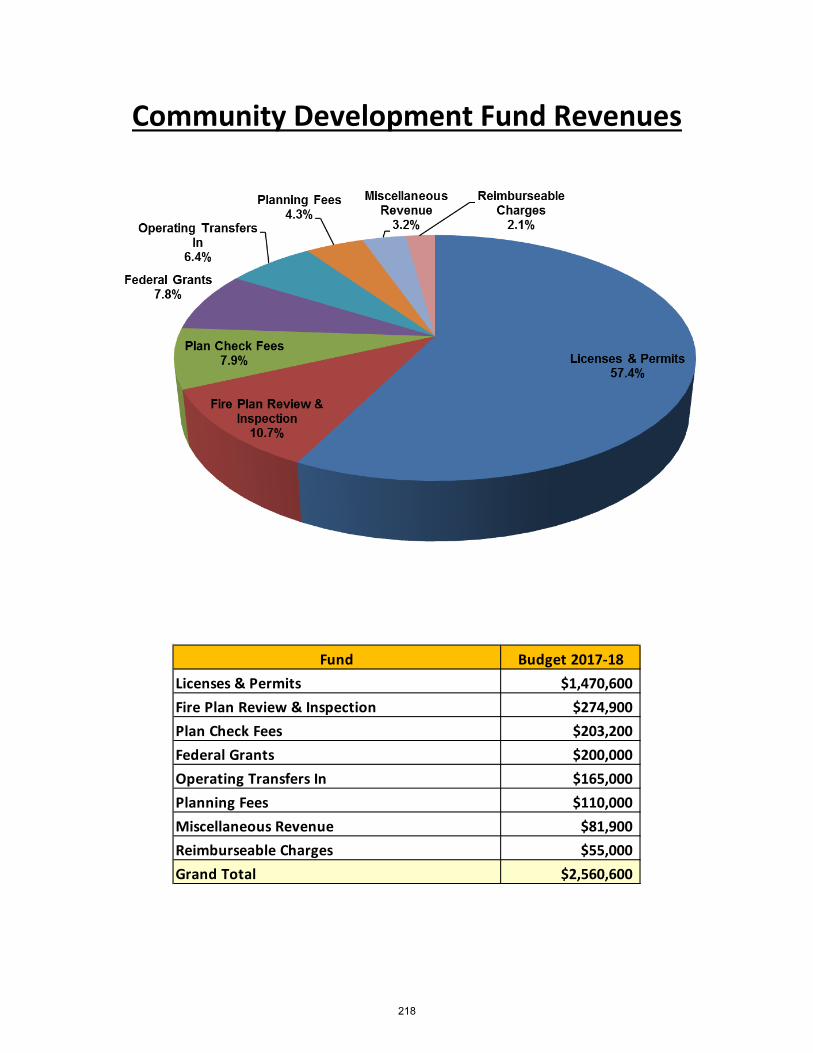
Community Development Fund Revenues
Fund Budget 2017-18Licenses & Permits $1,470,600Fire Plan Review & Inspection $274,900Plan Check Fees $203,200Federal Grants $200,000Operating Transfers In $165,000Planning Fees $110,000Miscellaneous Revenue $81,900Reimburseable Charges $55,000Grand Total $2,560,600
218
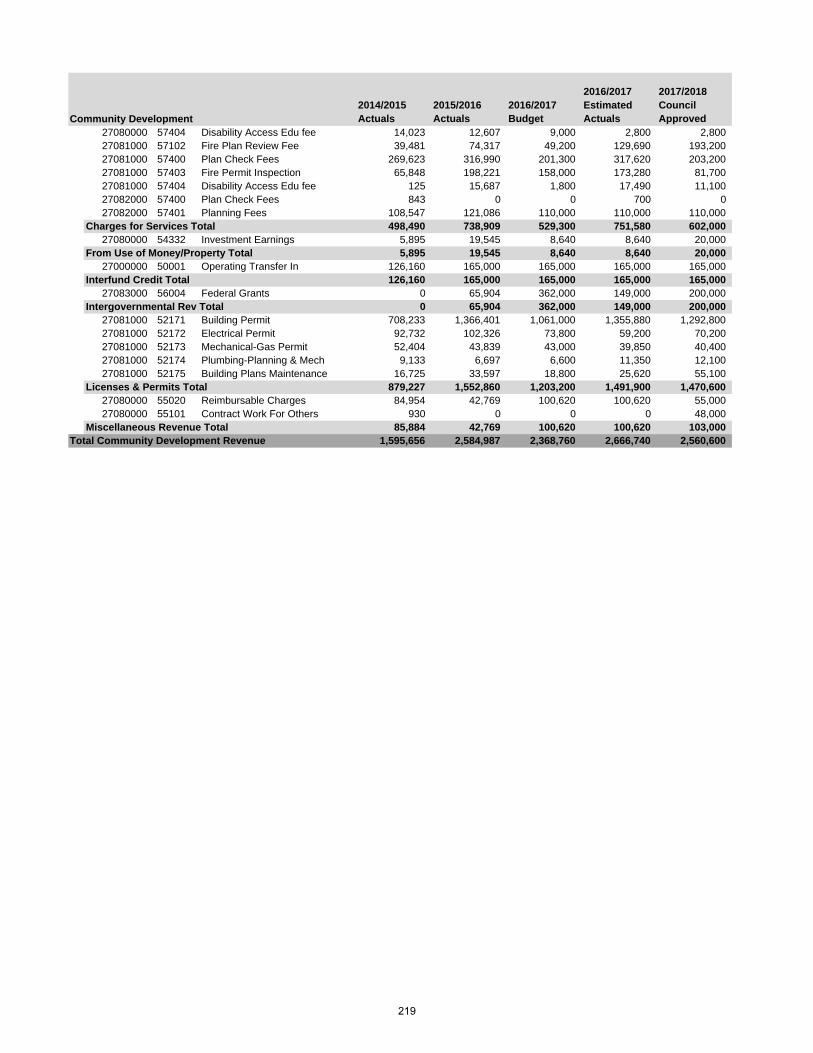
2014/2015 Actuals
2015/2016 Actuals
2016/2017 Budget
2016/2017 Estimated Actuals
2017/2018 Council Approved
27080000 57404 Disability Access Edu fee 14,023 12,607 9,000 2,800 2,80027081000 57102 Fire Plan Review Fee 39,481 74,317 49,200 129,690 193,20027081000 57400 Plan Check Fees 269,623 316,990 201,300 317,620 203,20027081000 57403 Fire Permit Inspection 65,848 198,221 158,000 173,280 81,70027081000 57404 Disability Access Edu fee 125 15,687 1,800 17,490 11,10027082000 57400 Plan Check Fees 843 0 0 700 027082000 57401 Planning Fees 108,547 121,086 110,000 110,000 110,000
Charges for Services Total 498,490 738,909 529,300 751,580 602,00027080000 54332 Investment Earnings 5,895 19,545 8,640 8,640 20,000
From Use of Money/Property Total 5,895 19,545 8,640 8,640 20,00027000000 50001 Operating Transfer In 126,160 165,000 165,000 165,000 165,000
Interfund Credit Total 126,160 165,000 165,000 165,000 165,00027083000 56004 Federal Grants 0 65,904 362,000 149,000 200,000
Intergovernmental Rev Total 0 65,904 362,000 149,000 200,00027081000 52171 Building Permit 708,233 1,366,401 1,061,000 1,355,880 1,292,80027081000 52172 Electrical Permit 92,732 102,326 73,800 59,200 70,20027081000 52173 Mechanical-Gas Permit 52,404 43,839 43,000 39,850 40,40027081000 52174 Plumbing-Planning & Mech 9,133 6,697 6,600 11,350 12,10027081000 52175 Building Plans Maintenance 16,725 33,597 18,800 25,620 55,100
Licenses & Permits Total 879,227 1,552,860 1,203,200 1,491,900 1,470,60027080000 55020 Reimbursable Charges 84,954 42,769 100,620 100,620 55,00027080000 55101 Contract Work For Others 930 0 0 0 48,000
Miscellaneous Revenue Total 85,884 42,769 100,620 100,620 103,000Total Community Development Revenue 1,595,656 2,584,987 2,368,760 2,666,740 2,560,600
Community Development
219

(This page intentionally left blank)
220
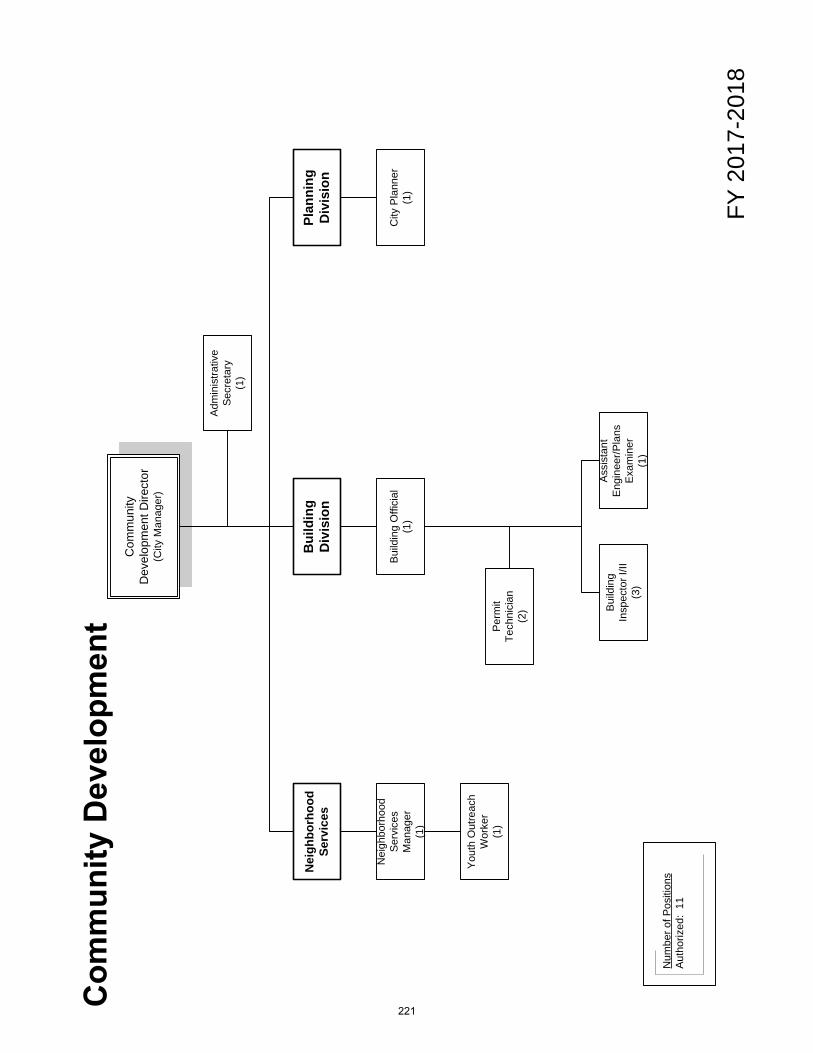
FY 2
017-
2018
Num
ber o
f Pos
ition
sAu
thor
ized
: 11
Com
mun
ity
Dev
elop
men
t Dire
ctor
(City
Man
ager
)
Adm
inis
trativ
e Se
cret
ary
(1)
Bui
ldin
g D
ivis
ion
Plan
ning
D
ivis
ion
Nei
ghbo
rhoo
d Se
rvic
es
Nei
ghbo
rhoo
d Se
rvic
es
Man
ager
(1
)
Build
ing
Offi
cial
(1)
Per
mit
Tech
nici
an(2
) Bui
ldin
g In
spec
tor I
/II
(3)
City
Pla
nner
(1
)
Ass
ista
nt
Eng
inee
r/Pla
ns
Exa
min
er
(1)
You
th O
utre
ach
Wor
ker
(1)
221
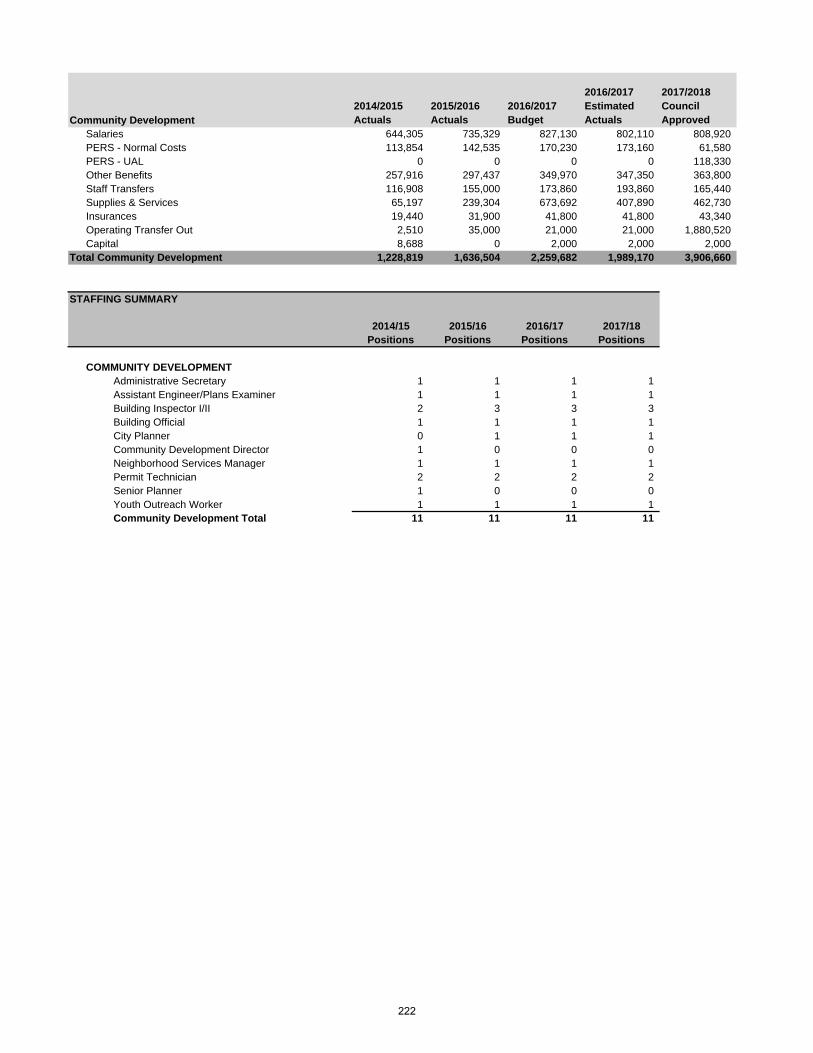
2014/2015 Actuals
2015/2016 Actuals
2016/2017 Budget
2016/2017 Estimated Actuals
2017/2018 Council Approved
Salaries 644,305 735,329 827,130 802,110 808,920PERS - Normal Costs 113,854 142,535 170,230 173,160 61,580PERS - UAL 0 0 0 0 118,330Other Benefits 257,916 297,437 349,970 347,350 363,800Staff Transfers 116,908 155,000 173,860 193,860 165,440Supplies & Services 65,197 239,304 673,692 407,890 462,730Insurances 19,440 31,900 41,800 41,800 43,340Operating Transfer Out 2,510 35,000 21,000 21,000 1,880,520Capital 8,688 0 2,000 2,000 2,000
Total Community Development 1,228,819 1,636,504 2,259,682 1,989,170 3,906,660
STAFFING SUMMARY
2014/15 2015/16 2016/17 2017/18Positions Positions Positions Positions
COMMUNITY DEVELOPMENTAdministrative Secretary 1 1 1 1Assistant Engineer/Plans Examiner 1 1 1 1Building Inspector I/II 2 3 3 3Building Official 1 1 1 1City Planner 0 1 1 1Community Development Director 1 0 0 0Neighborhood Services Manager 1 1 1 1Permit Technician 2 2 2 2Senior Planner 1 0 0 0Youth Outreach Worker 1 1 1 1Community Development Total 11 11 11 11
Community Development
222
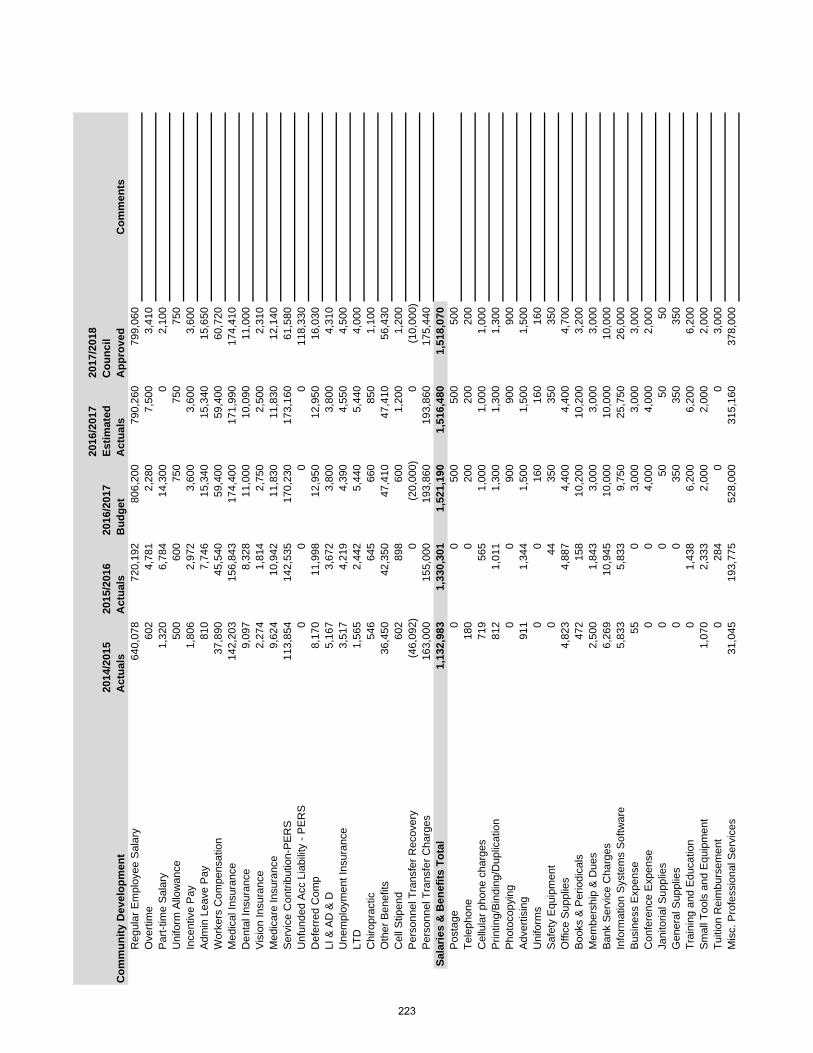
2014
/201
5 A
ctua
ls20
15/2
016
Act
uals
2016
/201
7 B
udge
t
2016
/201
7 Es
timat
ed
Act
uals
2017
/201
8 C
ounc
il A
ppro
ved
Com
men
tsR
egul
ar E
mpl
oyee
Sal
ary
640,
078
720,
192
806,
200
790,
260
799,
060
Ove
rtim
e 60
24,
781
2,28
07,
500
3,41
0P
art-t
ime
Sal
ary
1,32
06,
784
14,3
000
2,10
0U
nifo
rm A
llow
ance
50
060
075
075
075
0In
cent
ive
Pay
1,
806
2,97
23,
600
3,60
03,
600
Adm
in L
eave
Pay
81
07,
746
15,3
4015
,340
15,6
50W
orke
rs C
ompe
nsat
ion
37,8
9045
,540
59,4
0059
,400
60,7
20M
edic
al In
sura
nce
142,
203
156,
843
174,
400
171,
990
174,
410
Den
tal I
nsur
ance
9,
097
8,32
811
,000
10,0
9011
,000
Vis
ion
Insu
ranc
e 2,
274
1,81
42,
750
2,50
02,
310
Med
icar
e In
sura
nce
9,62
410
,942
11,8
3011
,830
12,1
40S
ervi
ce C
ontri
butio
n-P
ER
S
113,
854
142,
535
170,
230
173,
160
61,5
80U
nfun
ded
Acc
Lia
bilit
y - P
ER
S
00
00
118,
330
Def
erre
d C
omp
8,17
011
,998
12,9
5012
,950
16,0
30LI
& A
D &
D
5,16
73,
672
3,80
03,
800
4,31
0U
nem
ploy
men
t Ins
uran
ce
3,51
74,
219
4,39
04,
550
4,50
0LT
D
1,56
52,
442
5,44
05,
440
4,00
0C
hiro
prac
tic
546
645
660
850
1,10
0O
ther
Ben
efits
36
,450
42,3
5047
,410
47,4
1056
,430
Cel
l Stip
end
602
898
600
1,20
01,
200
Per
sonn
el T
rans
fer R
ecov
ery
(46,
092)
0(2
0,00
0)0
(10,
000)
Per
sonn
el T
rans
fer C
harg
es
163,
000
155,
000
193,
860
193,
860
175,
440
Sala
ries
& B
enef
its T
otal
1,13
2,98
31,
330,
301
1,52
1,19
01,
516,
480
1,51
8,07
0P
osta
ge
00
500
500
500
Tele
phon
e 18
00
200
200
200
Cel
lula
r pho
ne c
harg
es
719
565
1,00
01,
000
1,00
0P
rintin
g/B
indi
ng/D
uplic
atio
n 81
21,
011
1,30
01,
300
1,30
0P
hoto
copy
ing
00
900
900
900
Adv
ertis
ing
911
1,34
41,
500
1,50
01,
500
Uni
form
s 0
016
016
016
0S
afet
y E
quip
men
t 0
4435
035
035
0O
ffice
Sup
plie
s 4,
823
4,88
74,
400
4,40
04,
700
Boo
ks &
Per
iodi
cals
47
215
810
,200
10,2
003,
200
Mem
bers
hip
& D
ues
2,50
01,
843
3,00
03,
000
3,00
0B
ank
Ser
vice
Cha
rges
6,
269
10,9
4510
,000
10,0
0010
,000
Info
rmat
ion
Sys
tem
s S
oftw
are
5,83
35,
833
9,75
025
,750
26,0
00B
usin
ess
Exp
ense
55
03,
000
3,00
03,
000
Con
fere
nce
Exp
ense
0
04,
000
4,00
02,
000
Jani
toria
l Sup
plie
s 0
050
5050
Gen
eral
Sup
plie
s 0
035
035
035
0Tr
aini
ng a
nd E
duca
tion
01,
438
6,20
06,
200
6,20
0S
mal
l Too
ls a
nd E
quip
men
t 1,
070
2,33
32,
000
2,00
02,
000
Tuiti
on R
eim
burs
emen
t 0
284
00
3,00
0M
isc.
Pro
fess
iona
l Ser
vice
s 31
,045
193,
775
528,
000
315,
160
378,
000
Com
mun
ity D
evel
opm
ent
223
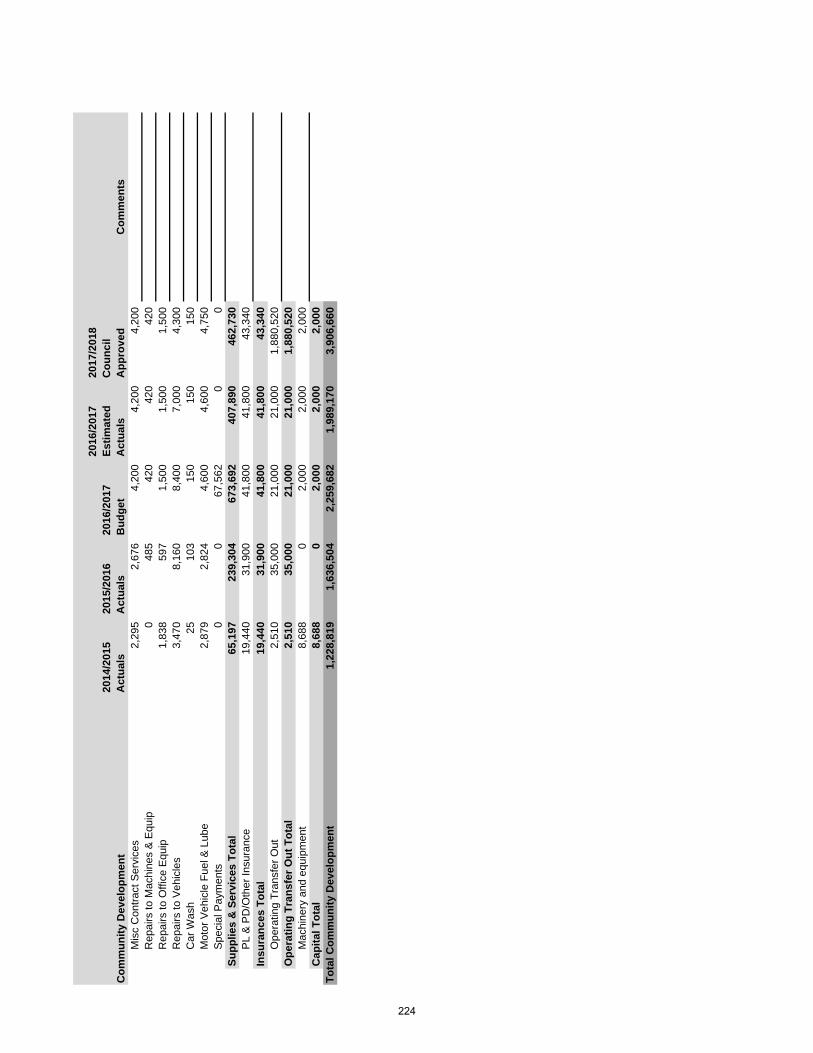
2014
/201
5 A
ctua
ls20
15/2
016
Act
uals
2016
/201
7 B
udge
t
2016
/201
7 Es
timat
ed
Act
uals
2017
/201
8 C
ounc
il A
ppro
ved
Com
men
tsC
omm
unity
Dev
elop
men
tM
isc
Con
tract
Ser
vice
s 2,
295
2,67
64,
200
4,20
04,
200
Rep
airs
to M
achi
nes
& E
quip
0
485
420
420
420
Rep
airs
to O
ffice
Equ
ip
1,83
859
71,
500
1,50
01,
500
Rep
airs
to V
ehic
les
3,47
08,
160
8,40
07,
000
4,30
0C
ar W
ash
2510
315
015
015
0M
otor
Veh
icle
Fue
l & L
ube
2,87
92,
824
4,60
04,
600
4,75
0S
peci
al P
aym
ents
0
067
,562
00
Supp
lies
& S
ervi
ces
Tota
l65
,197
239,
304
673,
692
407,
890
462,
730
PL
& P
D/O
ther
Insu
ranc
e 19
,440
31,9
0041
,800
41,8
0043
,340
Insu
ranc
es T
otal
19,4
4031
,900
41,8
0041
,800
43,3
40O
pera
ting
Tran
sfer
Out
2,
510
35,0
0021
,000
21,0
001,
880,
520
Ope
ratin
g Tr
ansf
er O
ut T
otal
2,51
035
,000
21,0
0021
,000
1,88
0,52
0M
achi
nery
and
equ
ipm
ent
8,68
80
2,00
02,
000
2,00
0C
apita
l Tot
al8,
688
02,
000
2,00
02,
000
Tota
l Com
mun
ity D
evel
opm
ent
1,22
8,81
91,
636,
504
2,25
9,68
21,
989,
170
3,90
6,66
0
224
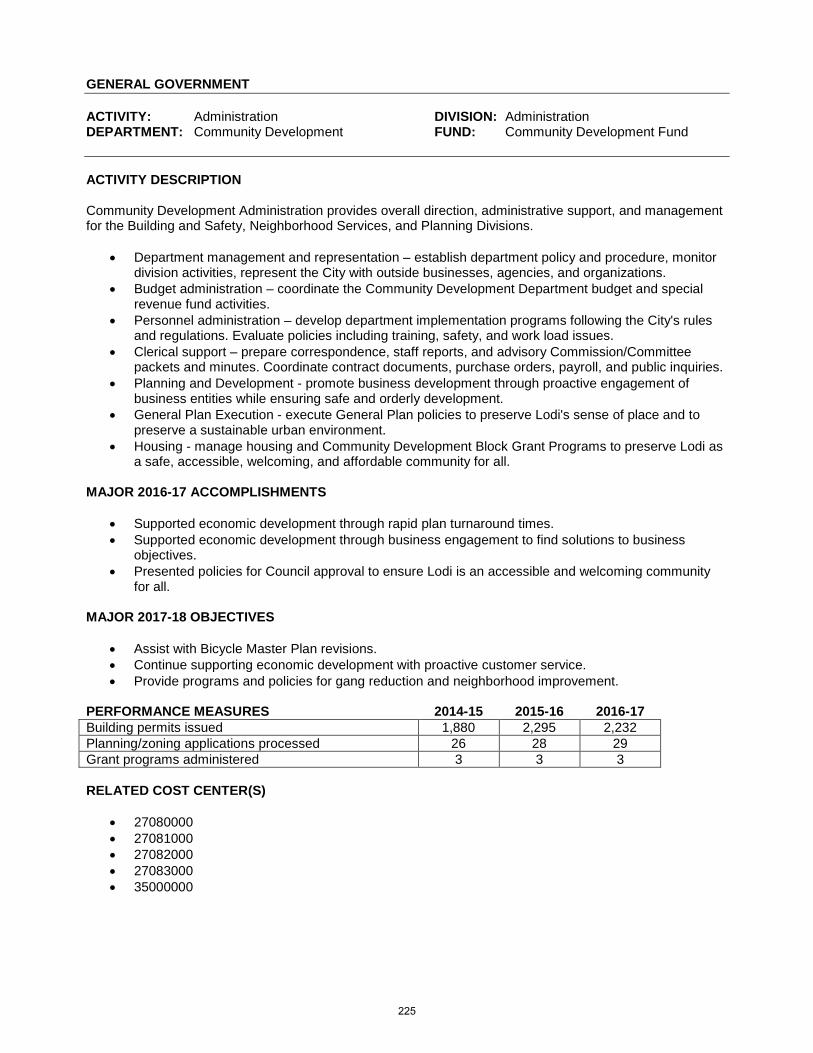
GENERAL GOVERNMENT ACTIVITY: Administration DIVISION: Administration DEPARTMENT: Community Development FUND: Community Development Fund ACTIVITY DESCRIPTION Community Development Administration provides overall direction, administrative support, and management for the Building and Safety, Neighborhood Services, and Planning Divisions.
• Department management and representation – establish department policy and procedure, monitor division activities, represent the City with outside businesses, agencies, and organizations.
• Budget administration – coordinate the Community Development Department budget and special revenue fund activities.
• Personnel administration – develop department implementation programs following the City's rules and regulations. Evaluate policies including training, safety, and work load issues.
• Clerical support – prepare correspondence, staff reports, and advisory Commission/Committee packets and minutes. Coordinate contract documents, purchase orders, payroll, and public inquiries.
• Planning and Development - promote business development through proactive engagement of business entities while ensuring safe and orderly development.
• General Plan Execution - execute General Plan policies to preserve Lodi's sense of place and to preserve a sustainable urban environment.
• Housing - manage housing and Community Development Block Grant Programs to preserve Lodi as a safe, accessible, welcoming, and affordable community for all.
MAJOR 2016-17 ACCOMPLISHMENTS
• Supported economic development through rapid plan turnaround times. • Supported economic development through business engagement to find solutions to business
objectives. • Presented policies for Council approval to ensure Lodi is an accessible and welcoming community
for all. MAJOR 2017-18 OBJECTIVES
• Assist with Bicycle Master Plan revisions. • Continue supporting economic development with proactive customer service. • Provide programs and policies for gang reduction and neighborhood improvement.
PERFORMANCE MEASURES 2014-15 2015-16 2016-17 Building permits issued 1,880 2,295 2,232 Planning/zoning applications processed 26 28 29 Grant programs administered 3 3 3 RELATED COST CENTER(S)
• 27080000 • 27081000 • 27082000 • 27083000 • 35000000
225
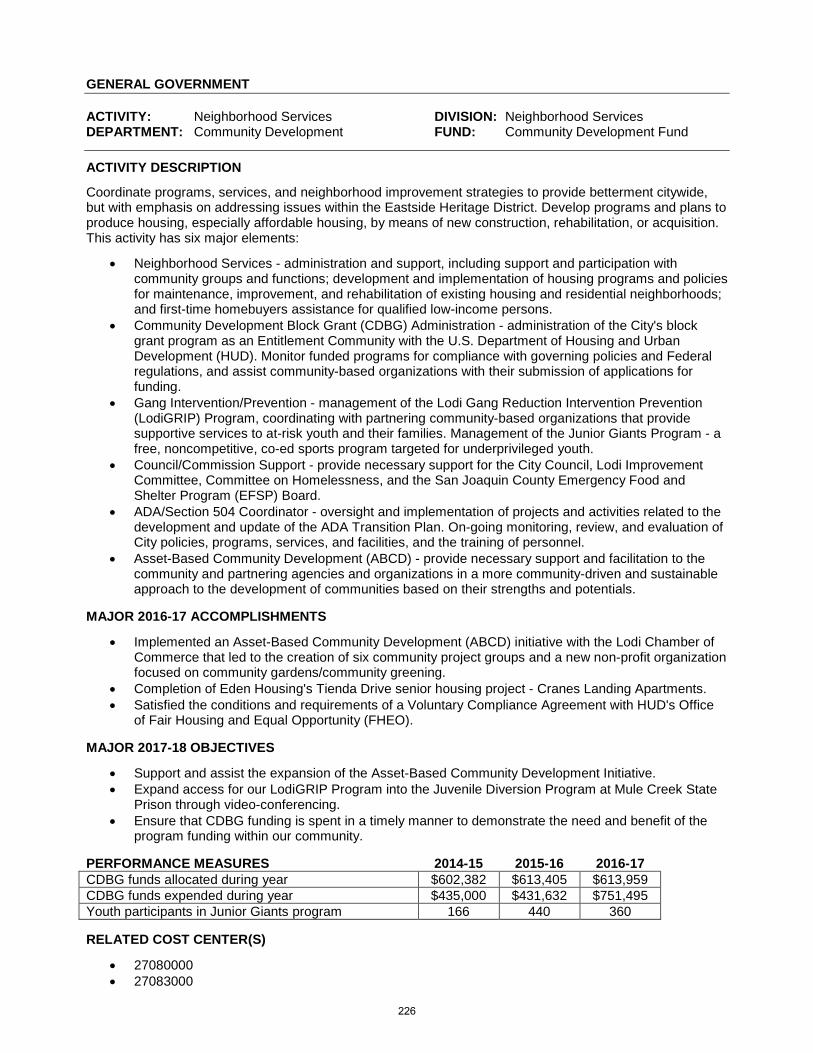
GENERAL GOVERNMENT ACTIVITY: Neighborhood Services DIVISION: Neighborhood Services DEPARTMENT: Community Development FUND: Community Development Fund
ACTIVITY DESCRIPTION
Coordinate programs, services, and neighborhood improvement strategies to provide betterment citywide, but with emphasis on addressing issues within the Eastside Heritage District. Develop programs and plans to produce housing, especially affordable housing, by means of new construction, rehabilitation, or acquisition. This activity has six major elements:
• Neighborhood Services - administration and support, including support and participation with community groups and functions; development and implementation of housing programs and policies for maintenance, improvement, and rehabilitation of existing housing and residential neighborhoods; and first-time homebuyers assistance for qualified low-income persons.
• Community Development Block Grant (CDBG) Administration - administration of the City's block grant program as an Entitlement Community with the U.S. Department of Housing and Urban Development (HUD). Monitor funded programs for compliance with governing policies and Federal regulations, and assist community-based organizations with their submission of applications for funding.
• Gang Intervention/Prevention - management of the Lodi Gang Reduction Intervention Prevention (LodiGRIP) Program, coordinating with partnering community-based organizations that provide supportive services to at-risk youth and their families. Management of the Junior Giants Program - a free, noncompetitive, co-ed sports program targeted for underprivileged youth.
• Council/Commission Support - provide necessary support for the City Council, Lodi Improvement Committee, Committee on Homelessness, and the San Joaquin County Emergency Food and Shelter Program (EFSP) Board.
• ADA/Section 504 Coordinator - oversight and implementation of projects and activities related to the development and update of the ADA Transition Plan. On-going monitoring, review, and evaluation of City policies, programs, services, and facilities, and the training of personnel.
• Asset-Based Community Development (ABCD) - provide necessary support and facilitation to the community and partnering agencies and organizations in a more community-driven and sustainable approach to the development of communities based on their strengths and potentials.
MAJOR 2016-17 ACCOMPLISHMENTS
• Implemented an Asset-Based Community Development (ABCD) initiative with the Lodi Chamber of Commerce that led to the creation of six community project groups and a new non-profit organization focused on community gardens/community greening.
• Completion of Eden Housing's Tienda Drive senior housing project - Cranes Landing Apartments. • Satisfied the conditions and requirements of a Voluntary Compliance Agreement with HUD's Office
of Fair Housing and Equal Opportunity (FHEO). MAJOR 2017-18 OBJECTIVES
• Support and assist the expansion of the Asset-Based Community Development Initiative. • Expand access for our LodiGRIP Program into the Juvenile Diversion Program at Mule Creek State
Prison through video-conferencing. • Ensure that CDBG funding is spent in a timely manner to demonstrate the need and benefit of the
program funding within our community. PERFORMANCE MEASURES 2014-15 2015-16 2016-17 CDBG funds allocated during year $602,382 $613,405 $613,959 CDBG funds expended during year $435,000 $431,632 $751,495 Youth participants in Junior Giants program 166 440 360 RELATED COST CENTER(S)
• 27080000 • 27083000
226
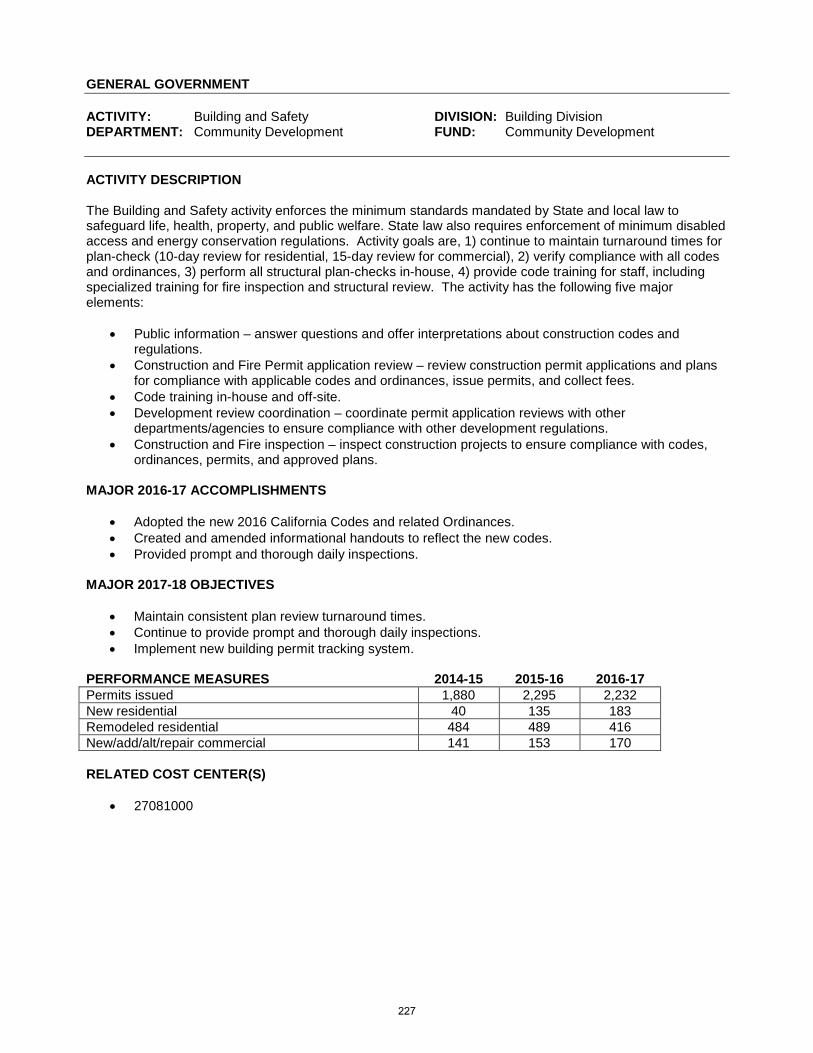
GENERAL GOVERNMENT ACTIVITY: Building and Safety DIVISION: Building Division DEPARTMENT: Community Development FUND: Community Development ACTIVITY DESCRIPTION The Building and Safety activity enforces the minimum standards mandated by State and local law to safeguard life, health, property, and public welfare. State law also requires enforcement of minimum disabled access and energy conservation regulations. Activity goals are, 1) continue to maintain turnaround times for plan-check (10-day review for residential, 15-day review for commercial), 2) verify compliance with all codes and ordinances, 3) perform all structural plan-checks in-house, 4) provide code training for staff, including specialized training for fire inspection and structural review. The activity has the following five major elements:
• Public information – answer questions and offer interpretations about construction codes and regulations.
• Construction and Fire Permit application review – review construction permit applications and plans for compliance with applicable codes and ordinances, issue permits, and collect fees.
• Code training in-house and off-site. • Development review coordination – coordinate permit application reviews with other
departments/agencies to ensure compliance with other development regulations. • Construction and Fire inspection – inspect construction projects to ensure compliance with codes,
ordinances, permits, and approved plans. MAJOR 2016-17 ACCOMPLISHMENTS
• Adopted the new 2016 California Codes and related Ordinances. • Created and amended informational handouts to reflect the new codes. • Provided prompt and thorough daily inspections.
MAJOR 2017-18 OBJECTIVES
• Maintain consistent plan review turnaround times. • Continue to provide prompt and thorough daily inspections. • Implement new building permit tracking system.
PERFORMANCE MEASURES 2014-15 2015-16 2016-17 Permits issued 1,880 2,295 2,232 New residential 40 135 183 Remodeled residential 484 489 416 New/add/alt/repair commercial 141 153 170 RELATED COST CENTER(S)
• 27081000
227
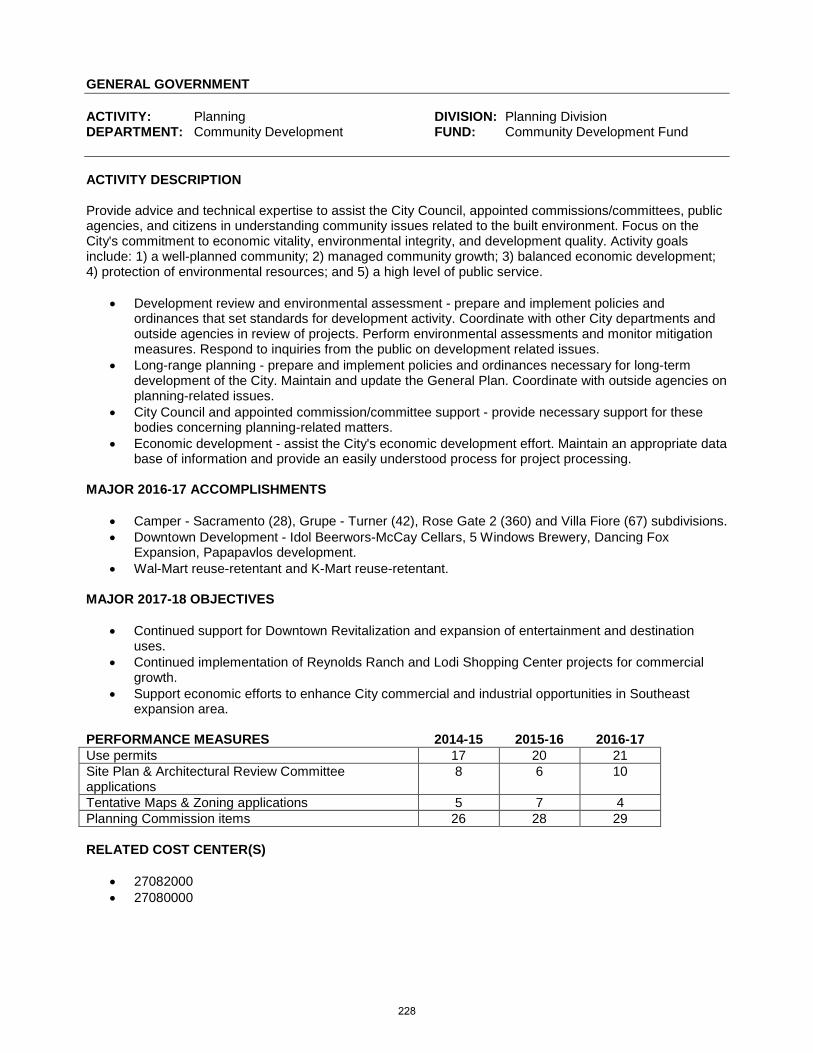
GENERAL GOVERNMENT ACTIVITY: Planning DIVISION: Planning Division DEPARTMENT: Community Development FUND: Community Development Fund ACTIVITY DESCRIPTION Provide advice and technical expertise to assist the City Council, appointed commissions/committees, public agencies, and citizens in understanding community issues related to the built environment. Focus on the City's commitment to economic vitality, environmental integrity, and development quality. Activity goals include: 1) a well-planned community; 2) managed community growth; 3) balanced economic development; 4) protection of environmental resources; and 5) a high level of public service.
• Development review and environmental assessment - prepare and implement policies and ordinances that set standards for development activity. Coordinate with other City departments and outside agencies in review of projects. Perform environmental assessments and monitor mitigation measures. Respond to inquiries from the public on development related issues.
• Long-range planning - prepare and implement policies and ordinances necessary for long-term development of the City. Maintain and update the General Plan. Coordinate with outside agencies on planning-related issues.
• City Council and appointed commission/committee support - provide necessary support for these bodies concerning planning-related matters.
• Economic development - assist the City's economic development effort. Maintain an appropriate data base of information and provide an easily understood process for project processing.
MAJOR 2016-17 ACCOMPLISHMENTS
• Camper - Sacramento (28), Grupe - Turner (42), Rose Gate 2 (360) and Villa Fiore (67) subdivisions. • Downtown Development - Idol Beerwors-McCay Cellars, 5 Windows Brewery, Dancing Fox
Expansion, Papapavlos development. • Wal-Mart reuse-retentant and K-Mart reuse-retentant.
MAJOR 2017-18 OBJECTIVES
• Continued support for Downtown Revitalization and expansion of entertainment and destination uses.
• Continued implementation of Reynolds Ranch and Lodi Shopping Center projects for commercial growth.
• Support economic efforts to enhance City commercial and industrial opportunities in Southeast expansion area.
PERFORMANCE MEASURES 2014-15 2015-16 2016-17 Use permits 17 20 21 Site Plan & Architectural Review Committee applications
8 6 10
Tentative Maps & Zoning applications 5 7 4 Planning Commission items 26 28 29 RELATED COST CENTER(S)
• 27082000 • 27080000
228
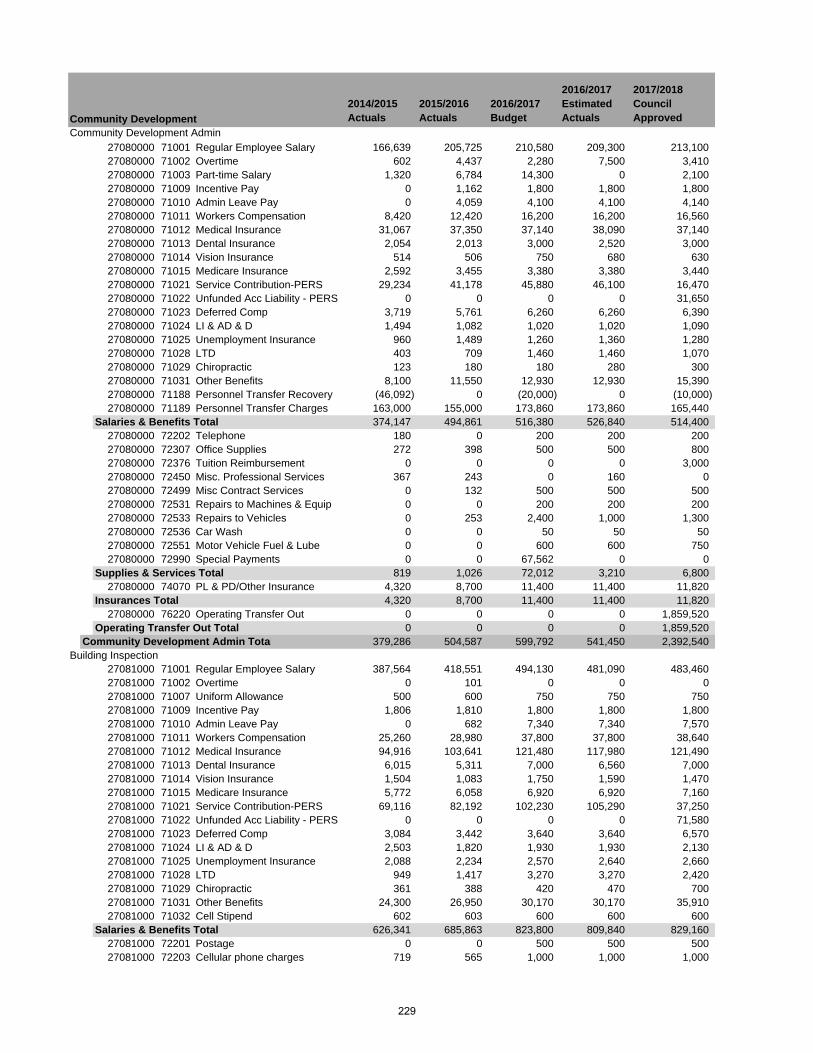
2014/2015 Actuals
2015/2016 Actuals
2016/2017 Budget
2016/2017 Estimated Actuals
2017/2018 Council Approved
Community Development Admin27080000 71001 Regular Employee Salary 166,639 205,725 210,580 209,300 213,10027080000 71002 Overtime 602 4,437 2,280 7,500 3,41027080000 71003 Part-time Salary 1,320 6,784 14,300 0 2,10027080000 71009 Incentive Pay 0 1,162 1,800 1,800 1,80027080000 71010 Admin Leave Pay 0 4,059 4,100 4,100 4,14027080000 71011 Workers Compensation 8,420 12,420 16,200 16,200 16,56027080000 71012 Medical Insurance 31,067 37,350 37,140 38,090 37,14027080000 71013 Dental Insurance 2,054 2,013 3,000 2,520 3,00027080000 71014 Vision Insurance 514 506 750 680 63027080000 71015 Medicare Insurance 2,592 3,455 3,380 3,380 3,44027080000 71021 Service Contribution-PERS 29,234 41,178 45,880 46,100 16,47027080000 71022 Unfunded Acc Liability - PERS 0 0 0 0 31,65027080000 71023 Deferred Comp 3,719 5,761 6,260 6,260 6,39027080000 71024 LI & AD & D 1,494 1,082 1,020 1,020 1,09027080000 71025 Unemployment Insurance 960 1,489 1,260 1,360 1,28027080000 71028 LTD 403 709 1,460 1,460 1,07027080000 71029 Chiropractic 123 180 180 280 30027080000 71031 Other Benefits 8,100 11,550 12,930 12,930 15,39027080000 71188 Personnel Transfer Recovery (46,092) 0 (20,000) 0 (10,000)27080000 71189 Personnel Transfer Charges 163,000 155,000 173,860 173,860 165,440
Salaries & Benefits Total 374,147 494,861 516,380 526,840 514,40027080000 72202 Telephone 180 0 200 200 20027080000 72307 Office Supplies 272 398 500 500 80027080000 72376 Tuition Reimbursement 0 0 0 0 3,00027080000 72450 Misc. Professional Services 367 243 0 160 027080000 72499 Misc Contract Services 0 132 500 500 50027080000 72531 Repairs to Machines & Equip 0 0 200 200 20027080000 72533 Repairs to Vehicles 0 253 2,400 1,000 1,30027080000 72536 Car Wash 0 0 50 50 5027080000 72551 Motor Vehicle Fuel & Lube 0 0 600 600 75027080000 72990 Special Payments 0 0 67,562 0 0
Supplies & Services Total 819 1,026 72,012 3,210 6,80027080000 74070 PL & PD/Other Insurance 4,320 8,700 11,400 11,400 11,820
Insurances Total 4,320 8,700 11,400 11,400 11,82027080000 76220 Operating Transfer Out 0 0 0 0 1,859,520
Operating Transfer Out Total 0 0 0 0 1,859,520Community Development Admin Total 379,286 504,587 599,792 541,450 2,392,540
Building Inspection27081000 71001 Regular Employee Salary 387,564 418,551 494,130 481,090 483,46027081000 71002 Overtime 0 101 0 0 027081000 71007 Uniform Allowance 500 600 750 750 75027081000 71009 Incentive Pay 1,806 1,810 1,800 1,800 1,80027081000 71010 Admin Leave Pay 0 682 7,340 7,340 7,57027081000 71011 Workers Compensation 25,260 28,980 37,800 37,800 38,64027081000 71012 Medical Insurance 94,916 103,641 121,480 117,980 121,49027081000 71013 Dental Insurance 6,015 5,311 7,000 6,560 7,00027081000 71014 Vision Insurance 1,504 1,083 1,750 1,590 1,47027081000 71015 Medicare Insurance 5,772 6,058 6,920 6,920 7,16027081000 71021 Service Contribution-PERS 69,116 82,192 102,230 105,290 37,25027081000 71022 Unfunded Acc Liability - PERS 0 0 0 0 71,58027081000 71023 Deferred Comp 3,084 3,442 3,640 3,640 6,57027081000 71024 LI & AD & D 2,503 1,820 1,930 1,930 2,13027081000 71025 Unemployment Insurance 2,088 2,234 2,570 2,640 2,66027081000 71028 LTD 949 1,417 3,270 3,270 2,42027081000 71029 Chiropractic 361 388 420 470 70027081000 71031 Other Benefits 24,300 26,950 30,170 30,170 35,91027081000 71032 Cell Stipend 602 603 600 600 600
Salaries & Benefits Total 626,341 685,863 823,800 809,840 829,16027081000 72201 Postage 0 0 500 500 50027081000 72203 Cellular phone charges 719 565 1,000 1,000 1,000
Community Development
229
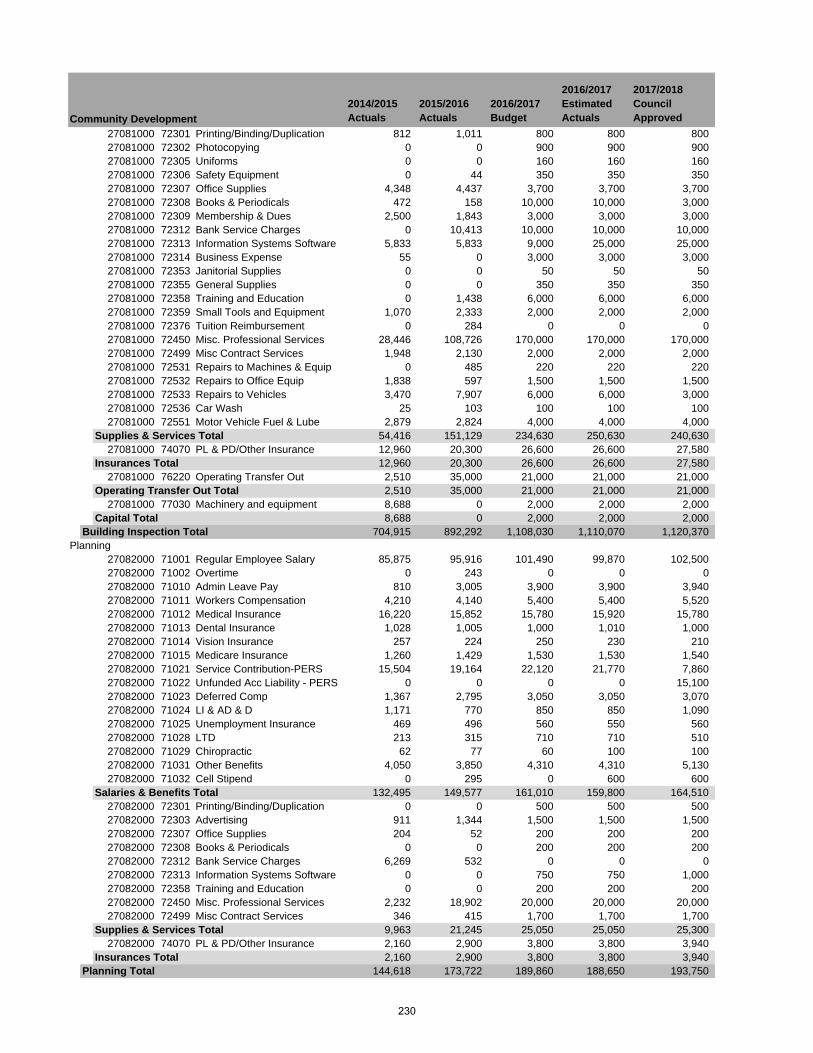
2014/2015 Actuals
2015/2016 Actuals
2016/2017 Budget
2016/2017 Estimated Actuals
2017/2018 Council ApprovedCommunity Development
27081000 72301 Printing/Binding/Duplication 812 1,011 800 800 80027081000 72302 Photocopying 0 0 900 900 90027081000 72305 Uniforms 0 0 160 160 16027081000 72306 Safety Equipment 0 44 350 350 35027081000 72307 Office Supplies 4,348 4,437 3,700 3,700 3,70027081000 72308 Books & Periodicals 472 158 10,000 10,000 3,00027081000 72309 Membership & Dues 2,500 1,843 3,000 3,000 3,00027081000 72312 Bank Service Charges 0 10,413 10,000 10,000 10,00027081000 72313 Information Systems Software 5,833 5,833 9,000 25,000 25,00027081000 72314 Business Expense 55 0 3,000 3,000 3,00027081000 72353 Janitorial Supplies 0 0 50 50 5027081000 72355 General Supplies 0 0 350 350 35027081000 72358 Training and Education 0 1,438 6,000 6,000 6,00027081000 72359 Small Tools and Equipment 1,070 2,333 2,000 2,000 2,00027081000 72376 Tuition Reimbursement 0 284 0 0 027081000 72450 Misc. Professional Services 28,446 108,726 170,000 170,000 170,00027081000 72499 Misc Contract Services 1,948 2,130 2,000 2,000 2,00027081000 72531 Repairs to Machines & Equip 0 485 220 220 22027081000 72532 Repairs to Office Equip 1,838 597 1,500 1,500 1,50027081000 72533 Repairs to Vehicles 3,470 7,907 6,000 6,000 3,00027081000 72536 Car Wash 25 103 100 100 10027081000 72551 Motor Vehicle Fuel & Lube 2,879 2,824 4,000 4,000 4,000
Supplies & Services Total 54,416 151,129 234,630 250,630 240,63027081000 74070 PL & PD/Other Insurance 12,960 20,300 26,600 26,600 27,580
Insurances Total 12,960 20,300 26,600 26,600 27,58027081000 76220 Operating Transfer Out 2,510 35,000 21,000 21,000 21,000
Operating Transfer Out Total 2,510 35,000 21,000 21,000 21,00027081000 77030 Machinery and equipment 8,688 0 2,000 2,000 2,000
Capital Total 8,688 0 2,000 2,000 2,000Building Inspection Total 704,915 892,292 1,108,030 1,110,070 1,120,370
Planning27082000 71001 Regular Employee Salary 85,875 95,916 101,490 99,870 102,50027082000 71002 Overtime 0 243 0 0 027082000 71010 Admin Leave Pay 810 3,005 3,900 3,900 3,94027082000 71011 Workers Compensation 4,210 4,140 5,400 5,400 5,52027082000 71012 Medical Insurance 16,220 15,852 15,780 15,920 15,78027082000 71013 Dental Insurance 1,028 1,005 1,000 1,010 1,00027082000 71014 Vision Insurance 257 224 250 230 21027082000 71015 Medicare Insurance 1,260 1,429 1,530 1,530 1,54027082000 71021 Service Contribution-PERS 15,504 19,164 22,120 21,770 7,86027082000 71022 Unfunded Acc Liability - PERS 0 0 0 0 15,10027082000 71023 Deferred Comp 1,367 2,795 3,050 3,050 3,07027082000 71024 LI & AD & D 1,171 770 850 850 1,09027082000 71025 Unemployment Insurance 469 496 560 550 56027082000 71028 LTD 213 315 710 710 51027082000 71029 Chiropractic 62 77 60 100 10027082000 71031 Other Benefits 4,050 3,850 4,310 4,310 5,13027082000 71032 Cell Stipend 0 295 0 600 600
Salaries & Benefits Total 132,495 149,577 161,010 159,800 164,51027082000 72301 Printing/Binding/Duplication 0 0 500 500 50027082000 72303 Advertising 911 1,344 1,500 1,500 1,50027082000 72307 Office Supplies 204 52 200 200 20027082000 72308 Books & Periodicals 0 0 200 200 20027082000 72312 Bank Service Charges 6,269 532 0 0 027082000 72313 Information Systems Software 0 0 750 750 1,00027082000 72358 Training and Education 0 0 200 200 20027082000 72450 Misc. Professional Services 2,232 18,902 20,000 20,000 20,00027082000 72499 Misc Contract Services 346 415 1,700 1,700 1,700
Supplies & Services Total 9,963 21,245 25,050 25,050 25,30027082000 74070 PL & PD/Other Insurance 2,160 2,900 3,800 3,800 3,940
Insurances Total 2,160 2,900 3,800 3,800 3,940Planning Total 144,618 173,722 189,860 188,650 193,750
230
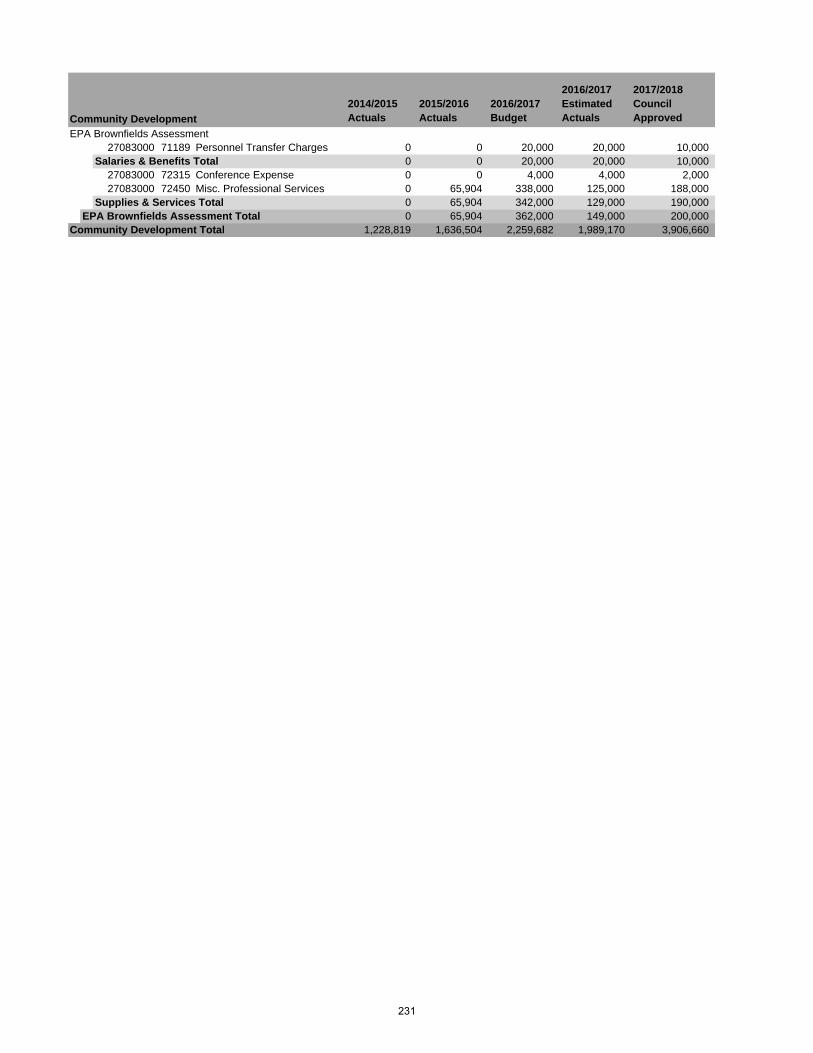
2014/2015 Actuals
2015/2016 Actuals
2016/2017 Budget
2016/2017 Estimated Actuals
2017/2018 Council ApprovedCommunity Development
EPA Brownfields Assessment27083000 71189 Personnel Transfer Charges 0 0 20,000 20,000 10,000
Salaries & Benefits Total 0 0 20,000 20,000 10,00027083000 72315 Conference Expense 0 0 4,000 4,000 2,00027083000 72450 Misc. Professional Services 0 65,904 338,000 125,000 188,000
Supplies & Services Total 0 65,904 342,000 129,000 190,000EPA Brownfields Assessment Total 0 65,904 362,000 149,000 200,000
Community Development Total 1,228,819 1,636,504 2,259,682 1,989,170 3,906,660
231

(This page intentionally left blank)
232
PARK, RECREATION AND CULTURAL SERVICES The Parks, Recreation and Cultural Services Department provides park maintenance, coordination of park activities, recreational programs, adult and youth sports, after school programs, boat rentals at Lodi Lake and aquatics, a venue for performing arts, and meeting and party rentals. The Department is funded through user fees and the General Fund. The Department’s budget is $6,160,970 in FY 2017/18, compared to $6,292,640 as originally budgeted in FY 2016/17. The 2016/17 budget shown in the following pages reflects adjustments made throughout the year. FY 2017/18 budgeted staffing is being reduced by 1 to 24 positions. An organizational chart, staffing summary, detailed activity descriptions and financial tables are included in the following pages.
233

(This page intentionally left blank)
234
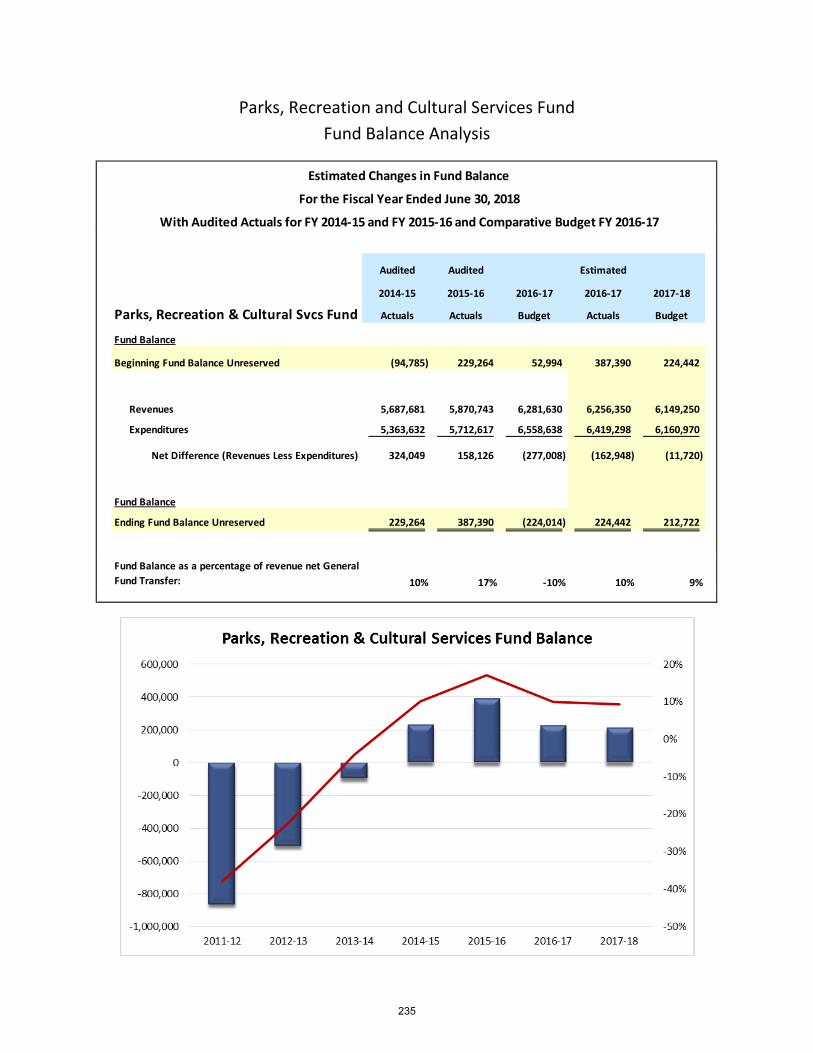
Parks, Recreation and Cultural Services Fund Fund Balance Analysis
Audited Audited Estimated
2014-15 2015-16 2016-17 2016-17 2017-18
Parks, Recreation & Cultural Svcs Fund Actuals Actuals Budget Actuals Budget
Fund Balance
Beginning Fund Balance Unreserved (94,785) 229,264 52,994 387,390 224,442
Revenues 5,687,681 5,870,743 6,281,630 6,256,350 6,149,250
Expenditures 5,363,632 5,712,617 6,558,638 6,419,298 6,160,970
Net Difference (Revenues Less Expenditures) 324,049 158,126 (277,008) (162,948) (11,720)
Fund Balance
Ending Fund Balance Unreserved 229,264 387,390 (224,014) 224,442 212,722
10% 17% -10% 10% 9%Fund Balance as a percentage of revenue net General Fund Transfer:
Estimated Changes in Fund Balance
For the Fiscal Year Ended June 30, 2018
With Audited Actuals for FY 2014-15 and FY 2015-16 and Comparative Budget FY 2016-17
235
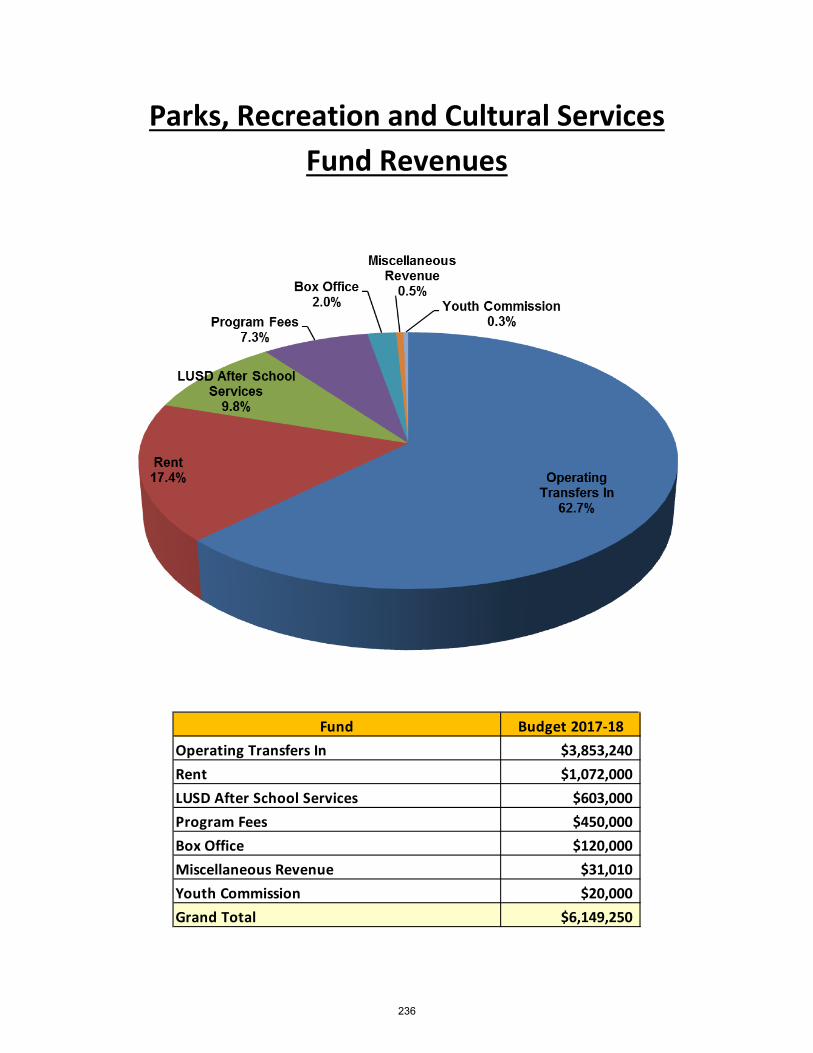
Parks, Recreation and Cultural Services Fund Revenues
Fund Budget 2017-18Operating Transfers In $3,853,240Rent $1,072,000LUSD After School Services $603,000Program Fees $450,000Box Office $120,000Miscellaneous Revenue $31,010Youth Commission $20,000Grand Total $6,149,250
236
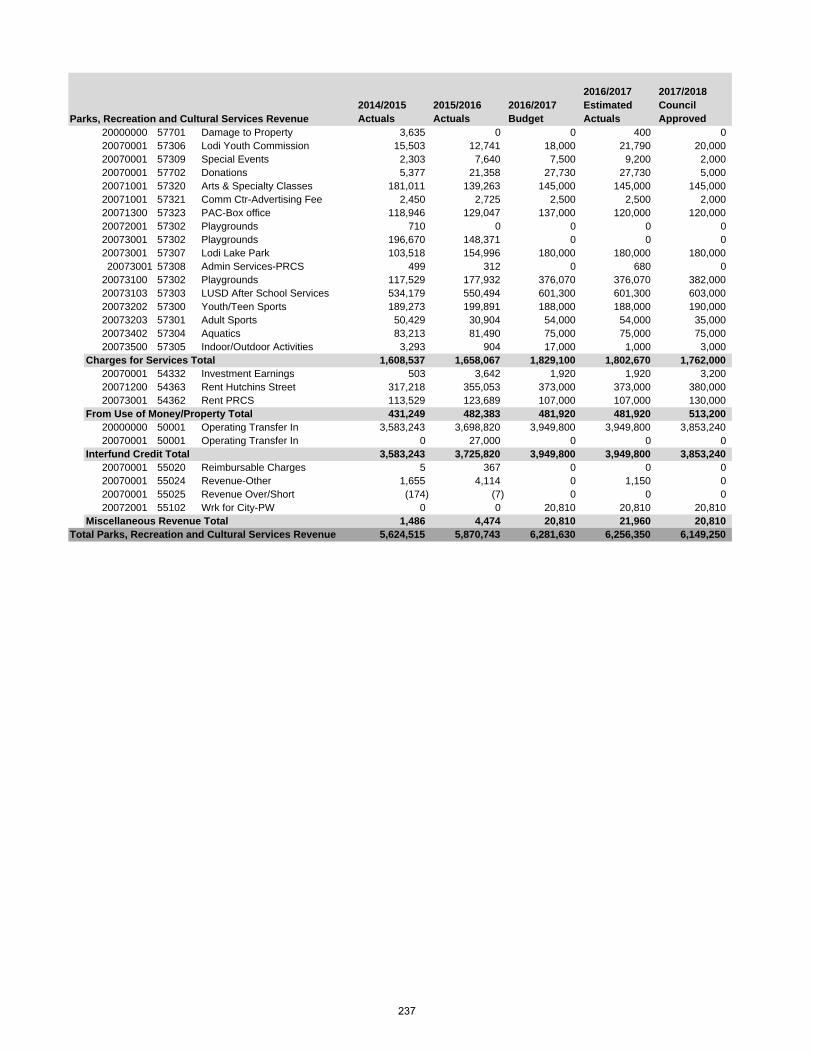
2014/2015 Actuals
2015/2016 Actuals
2016/2017 Budget
2016/2017 Estimated Actuals
2017/2018 Council Approved
20000000 57701 Damage to Property 3,635 0 0 400 020070001 57306 Lodi Youth Commission 15,503 12,741 18,000 21,790 20,00020070001 57309 Special Events 2,303 7,640 7,500 9,200 2,00020070001 57702 Donations 5,377 21,358 27,730 27,730 5,00020071001 57320 Arts & Specialty Classes 181,011 139,263 145,000 145,000 145,00020071001 57321 Comm Ctr-Advertising Fee 2,450 2,725 2,500 2,500 2,00020071300 57323 PAC-Box office 118,946 129,047 137,000 120,000 120,00020072001 57302 Playgrounds 710 0 0 0 020073001 57302 Playgrounds 196,670 148,371 0 0 020073001 57307 Lodi Lake Park 103,518 154,996 180,000 180,000 180,00020073001 57308 Admin Services-PRCS 499 312 0 680 0
20073100 57302 Playgrounds 117,529 177,932 376,070 376,070 382,00020073103 57303 LUSD After School Services 534,179 550,494 601,300 601,300 603,00020073202 57300 Youth/Teen Sports 189,273 199,891 188,000 188,000 190,00020073203 57301 Adult Sports 50,429 30,904 54,000 54,000 35,00020073402 57304 Aquatics 83,213 81,490 75,000 75,000 75,00020073500 57305 Indoor/Outdoor Activities 3,293 904 17,000 1,000 3,000
Charges for Services Total 1,608,537 1,658,067 1,829,100 1,802,670 1,762,00020070001 54332 Investment Earnings 503 3,642 1,920 1,920 3,20020071200 54363 Rent Hutchins Street 317,218 355,053 373,000 373,000 380,00020073001 54362 Rent PRCS 113,529 123,689 107,000 107,000 130,000
From Use of Money/Property Total 431,249 482,383 481,920 481,920 513,20020000000 50001 Operating Transfer In 3,583,243 3,698,820 3,949,800 3,949,800 3,853,24020070001 50001 Operating Transfer In 0 27,000 0 0 0
Interfund Credit Total 3,583,243 3,725,820 3,949,800 3,949,800 3,853,24020070001 55020 Reimbursable Charges 5 367 0 0 020070001 55024 Revenue-Other 1,655 4,114 0 1,150 020070001 55025 Revenue Over/Short (174) (7) 0 0 020072001 55102 Wrk for City-PW 0 0 20,810 20,810 20,810
Miscellaneous Revenue Total 1,486 4,474 20,810 21,960 20,810Total Parks, Recreation and Cultural Services Revenue 5,624,515 5,870,743 6,281,630 6,256,350 6,149,250
Parks, Recreation and Cultural Services Revenue
237

(This page intentionally left blank)
238
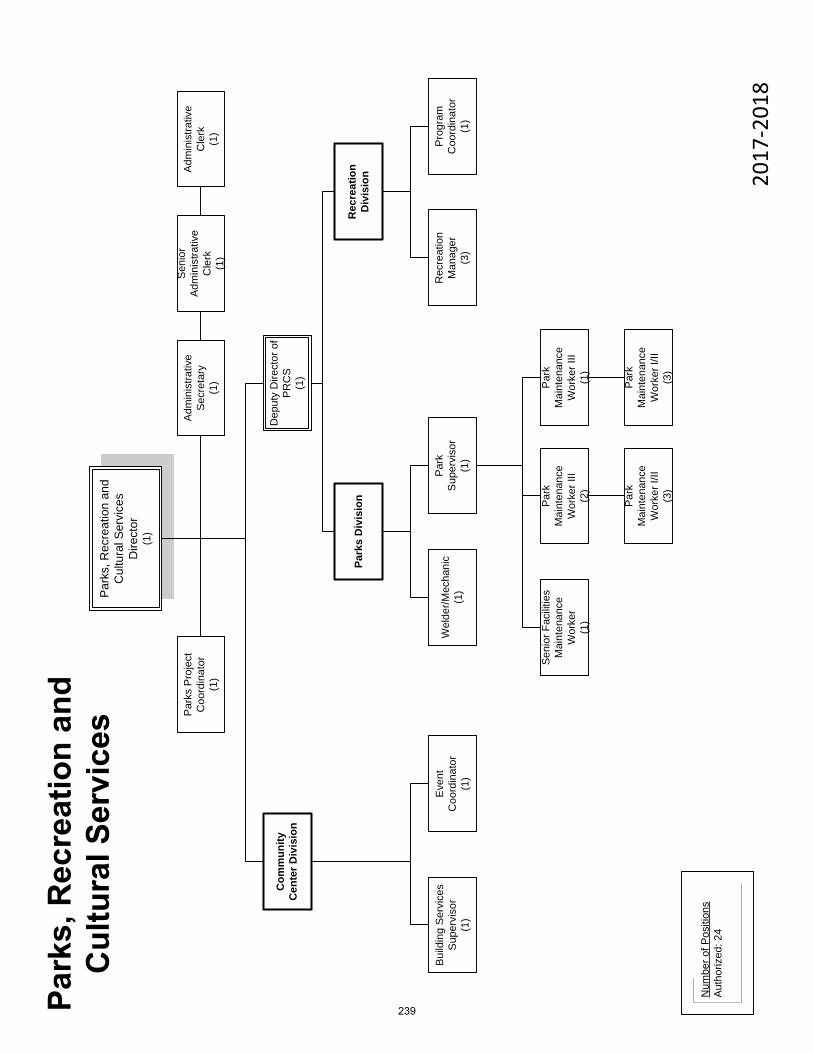
2017
-201
8
Num
ber o
f Pos
ition
sA
utho
rized
: 24
Park
s, R
ecre
atio
n an
d C
ultu
ral S
ervi
ces
Dire
ctor
(1)
Adm
inis
trativ
e S
ecre
tary
(1)
Par
ks P
roje
ct
Coo
rdin
ator
(1)
Park
s D
ivis
ion
Com
mun
ity
Cen
ter D
ivis
ion
Rec
reat
ion
Div
isio
n
Eve
nt
Coo
rdin
ator
(1
)
Bui
ldin
g S
ervi
ces
Sup
ervi
sor
(1)
Sen
ior
Adm
inis
trativ
e C
lerk
(1
)
Adm
inis
trativ
e C
lerk
(1)
Rec
reat
ion
Man
ager
(3)
Pro
gram
C
oord
inat
or(1
)
Par
k S
uper
viso
r (1
)
Wel
der/M
echa
nic
(1)
Park
M
aint
enan
ce
Wor
ker I
II (2
)
Park
M
aint
enan
ce
Wor
ker I
/II(3
)
Par
k M
aint
enan
ce
Wor
ker I
II (1
)
Sen
ior F
acilit
ies
Mai
nten
ance
W
orke
r (1
)
Par
k M
aint
enan
ce
Wor
ker I
/II(3
)
Dep
uty
Dire
ctor
of
PRC
S(1
)
239
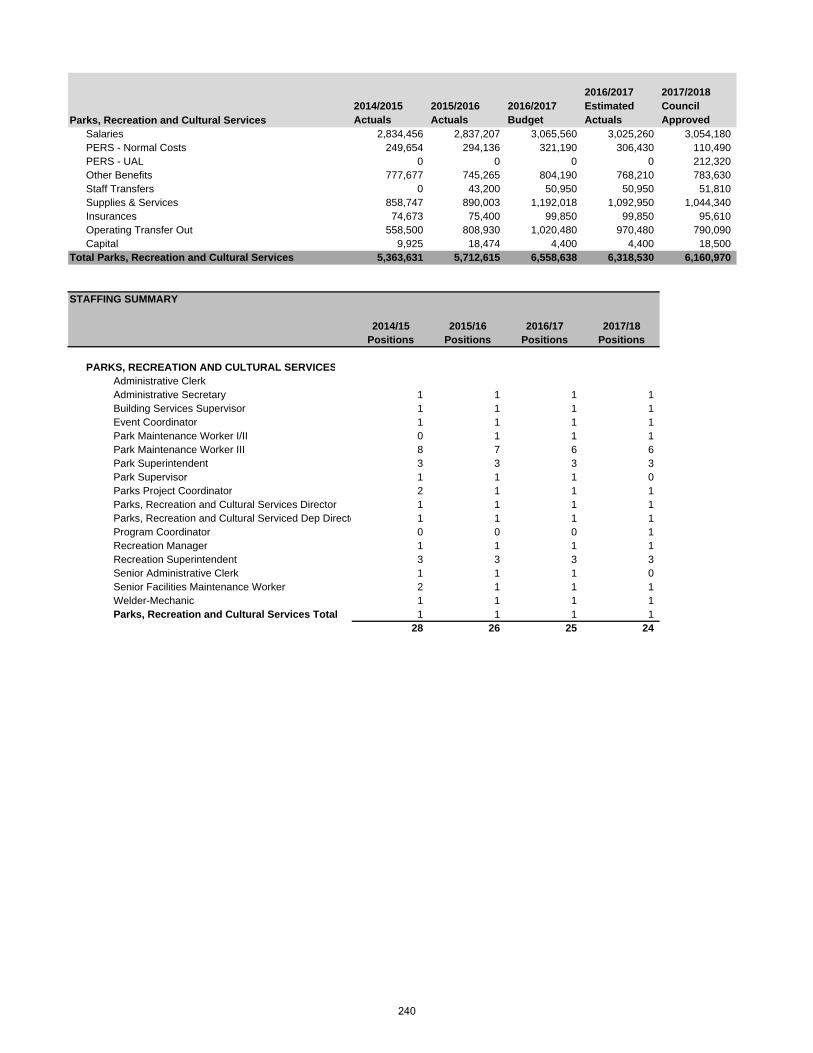
2014/2015 Actuals
2015/2016 Actuals
2016/2017 Budget
2016/2017 Estimated Actuals
2017/2018 Council Approved
Salaries 2,834,456 2,837,207 3,065,560 3,025,260 3,054,180PERS - Normal Costs 249,654 294,136 321,190 306,430 110,490PERS - UAL 0 0 0 0 212,320Other Benefits 777,677 745,265 804,190 768,210 783,630Staff Transfers 0 43,200 50,950 50,950 51,810Supplies & Services 858,747 890,003 1,192,018 1,092,950 1,044,340Insurances 74,673 75,400 99,850 99,850 95,610Operating Transfer Out 558,500 808,930 1,020,480 970,480 790,090Capital 9,925 18,474 4,400 4,400 18,500
Total Parks, Recreation and Cultural Services 5,363,631 5,712,615 6,558,638 6,318,530 6,160,970
STAFFING SUMMARY
2014/15 2015/16 2016/17 2017/18Positions Positions Positions Positions
PARKS, RECREATION AND CULTURAL SERVICESAdministrative Clerk Administrative Secretary 1 1 1 1Building Services Supervisor 1 1 1 1Event Coordinator 1 1 1 1Park Maintenance Worker I/II 0 1 1 1Park Maintenance Worker III 8 7 6 6Park Superintendent 3 3 3 3Park Supervisor 1 1 1 0Parks Project Coordinator 2 1 1 1Parks, Recreation and Cultural Services Director 1 1 1 1Parks, Recreation and Cultural Serviced Dep Directo 1 1 1 1Program Coordinator 0 0 0 1Recreation Manager 1 1 1 1Recreation Superintendent 3 3 3 3Senior Administrative Clerk 1 1 1 0Senior Facilities Maintenance Worker 2 1 1 1Welder-Mechanic 1 1 1 1Parks, Recreation and Cultural Services Total 1 1 1 1
28 26 25 24
Parks, Recreation and Cultural Services
240
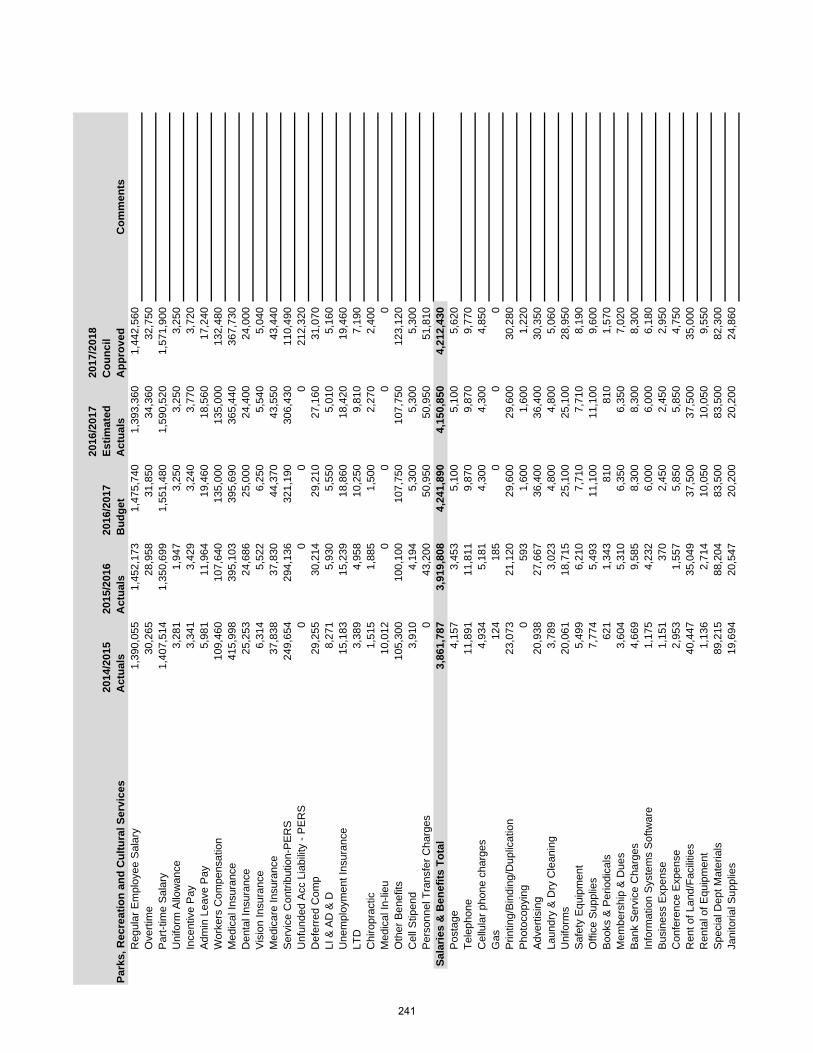
2014
/201
5 A
ctua
ls20
15/2
016
Act
uals
2016
/201
7 B
udge
t
2016
/201
7 Es
timat
ed
Act
uals
2017
/201
8 C
ounc
il A
ppro
ved
Com
men
tsR
egul
ar E
mpl
oyee
Sal
ary
1,39
0,05
51,
452,
173
1,47
5,74
01,
393,
360
1,44
2,56
0O
verti
me
30,2
6528
,958
31,8
5034
,360
32,7
50P
art-t
ime
Sal
ary
1,40
7,51
41,
350,
699
1,55
1,48
01,
590,
520
1,57
1,90
0U
nifo
rm A
llow
ance
3,
281
1,94
73,
250
3,25
03,
250
Ince
ntiv
e P
ay
3,34
13,
429
3,24
03,
770
3,72
0A
dmin
Lea
ve P
ay
5,98
111
,964
19,4
6018
,560
17,2
40W
orke
rs C
ompe
nsat
ion
109,
460
107,
640
135,
000
135,
000
132,
480
Med
ical
Insu
ranc
e 41
5,99
839
5,10
339
5,69
036
5,44
036
7,73
0D
enta
l Ins
uran
ce
25,2
5324
,686
25,0
0024
,400
24,0
00V
isio
n In
sura
nce
6,31
45,
522
6,25
05,
540
5,04
0M
edic
are
Insu
ranc
e 37
,838
37,8
3044
,370
43,5
5043
,440
Ser
vice
Con
tribu
tion-
PE
RS
24
9,65
429
4,13
632
1,19
030
6,43
011
0,49
0U
nfun
ded
Acc
Lia
bilit
y - P
ER
S
00
00
212,
320
Def
erre
d C
omp
29,2
5530
,214
29,2
1027
,160
31,0
70LI
& A
D &
D
8,27
15,
930
5,55
05,
010
5,16
0U
nem
ploy
men
t Ins
uran
ce
15,1
8315
,239
18,8
6018
,420
19,4
60LT
D
3,38
94,
958
10,2
509,
810
7,19
0C
hiro
prac
tic
1,51
51,
885
1,50
02,
270
2,40
0M
edic
al In
-lieu
10
,012
00
00
Oth
er B
enef
its
105,
300
100,
100
107,
750
107,
750
123,
120
Cel
l Stip
end
3,91
04,
194
5,30
05,
300
5,30
0P
erso
nnel
Tra
nsfe
r Cha
rges
0
43,2
0050
,950
50,9
5051
,810
Sala
ries
& B
enef
its T
otal
3,86
1,78
73,
919,
808
4,24
1,89
04,
150,
850
4,21
2,43
0P
osta
ge
4,15
73,
453
5,10
05,
100
5,62
0Te
leph
one
11,8
9111
,811
9,87
09,
870
9,77
0C
ellu
lar p
hone
cha
rges
4,
934
5,18
14,
300
4,30
04,
850
Gas
12
418
50
00
Prin
ting/
Bin
ding
/Dup
licat
ion
23,0
7321
,120
29,6
0029
,600
30,2
80P
hoto
copy
ing
059
31,
600
1,60
01,
220
Adv
ertis
ing
20,9
3827
,667
36,4
0036
,400
30,3
50La
undr
y &
Dry
Cle
anin
g 3,
789
3,02
34,
800
4,80
05,
060
Uni
form
s 20
,061
18,7
1525
,100
25,1
0028
,950
Saf
ety
Equ
ipm
ent
5,49
96,
210
7,71
07,
710
8,19
0O
ffice
Sup
plie
s 7,
774
5,49
311
,100
11,1
009,
600
Boo
ks &
Per
iodi
cals
62
11,
343
810
810
1,57
0M
embe
rshi
p &
Due
s 3,
604
5,31
06,
350
6,35
07,
020
Ban
k S
ervi
ce C
harg
es
4,66
99,
585
8,30
08,
300
8,30
0In
form
atio
n S
yste
ms
Sof
twar
e 1,
175
4,23
26,
000
6,00
06,
180
Bus
ines
s E
xpen
se
1,15
137
02,
450
2,45
02,
950
Con
fere
nce
Exp
ense
2,
953
1,55
75,
850
5,85
04,
750
Ren
t of L
and/
Faci
litie
s 40
,447
35,0
4937
,500
37,5
0035
,000
Ren
tal o
f Equ
ipm
ent
1,13
62,
714
10,0
5010
,050
9,55
0S
peci
al D
ept M
ater
ials
89
,215
88,2
0483
,500
83,5
0082
,300
Jani
toria
l Sup
plie
s 19
,694
20,5
4720
,200
20,2
0024
,860
Park
s, R
ecre
atio
n an
d C
ultu
ral S
ervi
ces
241
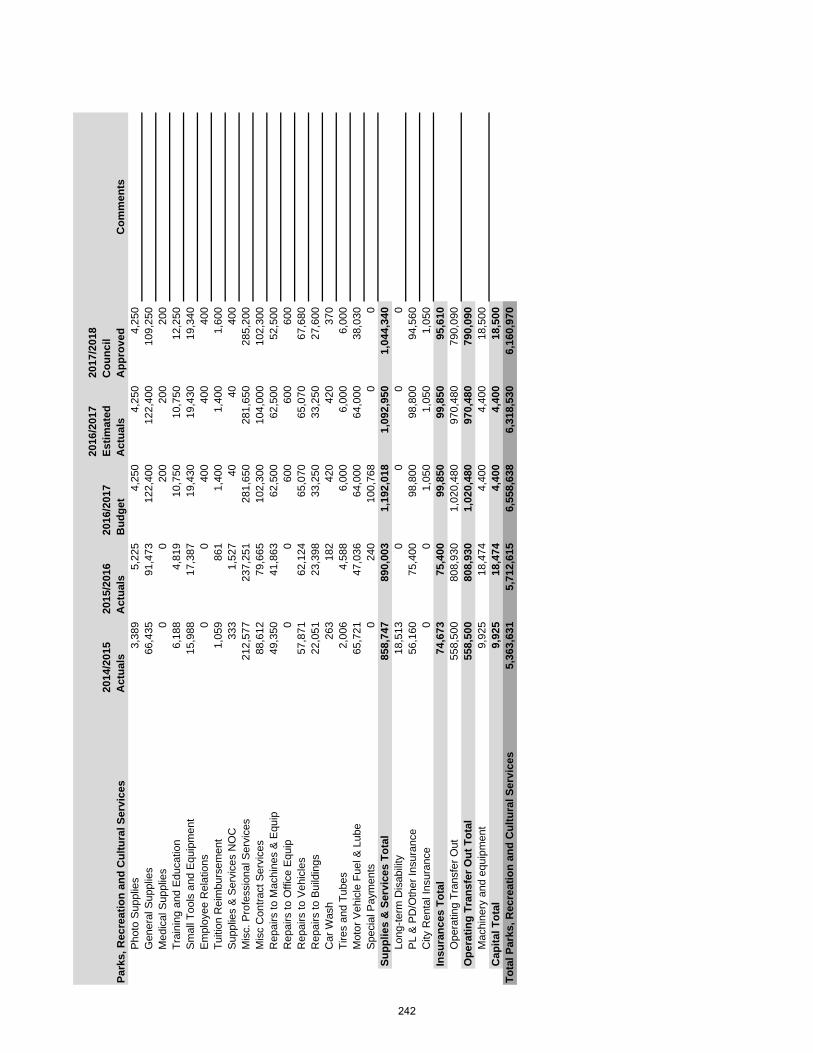
2014
/201
5 A
ctua
ls20
15/2
016
Act
uals
2016
/201
7 B
udge
t
2016
/201
7 Es
timat
ed
Act
uals
2017
/201
8 C
ounc
il A
ppro
ved
Com
men
tsPa
rks,
Rec
reat
ion
and
Cul
tura
l Ser
vice
sP
hoto
Sup
plie
s 3,
389
5,22
54,
250
4,25
04,
250
Gen
eral
Sup
plie
s 66
,435
91,4
7312
2,40
012
2,40
010
9,25
0M
edic
al S
uppl
ies
00
200
200
200
Trai
ning
and
Edu
catio
n 6,
188
4,81
910
,750
10,7
5012
,250
Sm
all T
ools
and
Equ
ipm
ent
15,9
8817
,387
19,4
3019
,430
19,3
40E
mpl
oyee
Rel
atio
ns
00
400
400
400
Tuiti
on R
eim
burs
emen
t 1,
059
861
1,40
01,
400
1,60
0S
uppl
ies
& S
ervi
ces
NO
C
333
1,52
740
4040
0M
isc.
Pro
fess
iona
l Ser
vice
s 21
2,57
723
7,25
128
1,65
028
1,65
028
5,20
0M
isc
Con
tract
Ser
vice
s 88
,612
79,6
6510
2,30
010
4,00
010
2,30
0R
epai
rs to
Mac
hine
s &
Equ
ip
49,3
5041
,863
62,5
0062
,500
52,5
00R
epai
rs to
Offi
ce E
quip
0
060
060
060
0R
epai
rs to
Veh
icle
s 57
,871
62,1
2465
,070
65,0
7067
,680
Rep
airs
to B
uild
ings
22
,051
23,3
9833
,250
33,2
5027
,600
Car
Was
h 26
318
242
042
037
0Ti
res
and
Tube
s 2,
006
4,58
86,
000
6,00
06,
000
Mot
or V
ehic
le F
uel &
Lub
e 65
,721
47,0
3664
,000
64,0
0038
,030
Spe
cial
Pay
men
ts
024
010
0,76
80
0Su
pplie
s &
Ser
vice
s To
tal
858,
747
890,
003
1,19
2,01
81,
092,
950
1,04
4,34
0Lo
ng-te
rm D
isab
ility
18
,513
00
00
PL
& P
D/O
ther
Insu
ranc
e 56
,160
75,4
0098
,800
98,8
0094
,560
City
Ren
tal I
nsur
ance
0
01,
050
1,05
01,
050
Insu
ranc
es T
otal
74,6
7375
,400
99,8
5099
,850
95,6
10O
pera
ting
Tran
sfer
Out
55
8,50
080
8,93
01,
020,
480
970,
480
790,
090
Ope
ratin
g Tr
ansf
er O
ut T
otal
558,
500
808,
930
1,02
0,48
097
0,48
079
0,09
0M
achi
nery
and
equ
ipm
ent
9,92
518
,474
4,40
04,
400
18,5
00C
apita
l Tot
al9,
925
18,4
744,
400
4,40
018
,500
Tota
l Par
ks, R
ecre
atio
n an
d C
ultu
ral S
ervi
ces
5,36
3,63
15,
712,
615
6,55
8,63
86,
318,
530
6,16
0,97
0
242
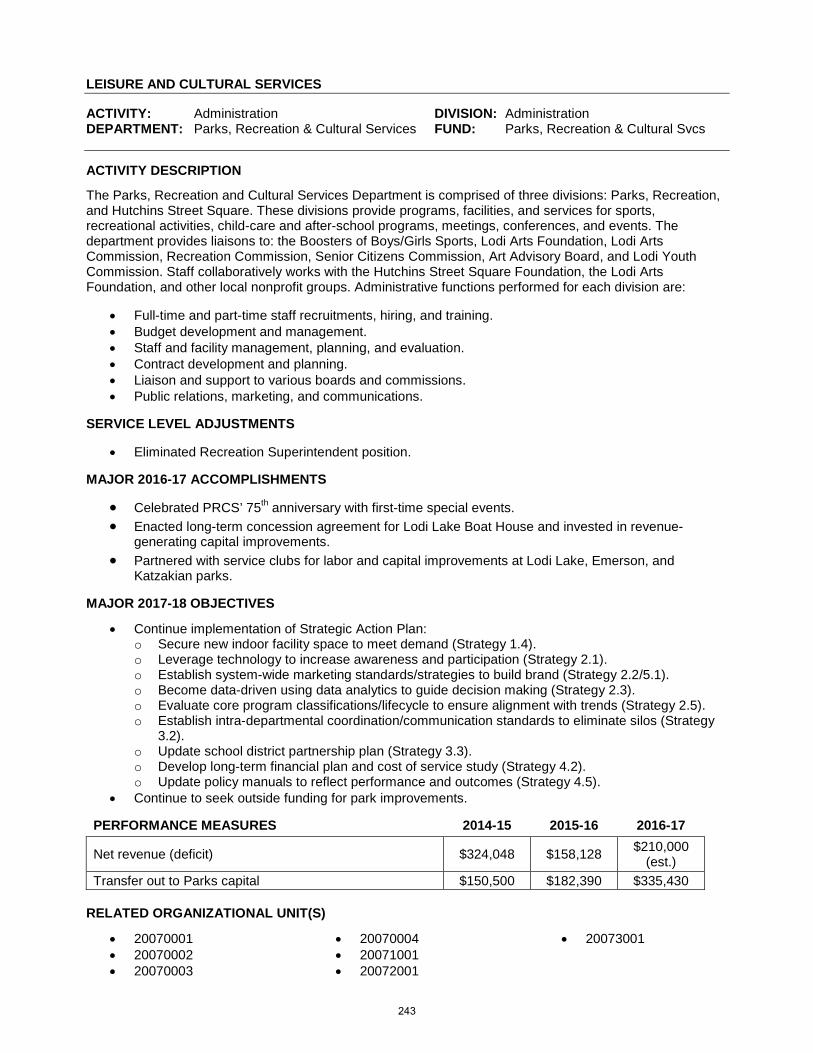
LEISURE AND CULTURAL SERVICES ACTIVITY: Administration DIVISION: Administration DEPARTMENT: Parks, Recreation & Cultural Services FUND: Parks, Recreation & Cultural Svcs ACTIVITY DESCRIPTION
The Parks, Recreation and Cultural Services Department is comprised of three divisions: Parks, Recreation, and Hutchins Street Square. These divisions provide programs, facilities, and services for sports, recreational activities, child-care and after-school programs, meetings, conferences, and events. The department provides liaisons to: the Boosters of Boys/Girls Sports, Lodi Arts Foundation, Lodi Arts Commission, Recreation Commission, Senior Citizens Commission, Art Advisory Board, and Lodi Youth Commission. Staff collaboratively works with the Hutchins Street Square Foundation, the Lodi Arts Foundation, and other local nonprofit groups. Administrative functions performed for each division are:
• Full-time and part-time staff recruitments, hiring, and training. • Budget development and management. • Staff and facility management, planning, and evaluation. • Contract development and planning. • Liaison and support to various boards and commissions. • Public relations, marketing, and communications.
SERVICE LEVEL ADJUSTMENTS
• Eliminated Recreation Superintendent position. MAJOR 2016-17 ACCOMPLISHMENTS
• Celebrated PRCS’ 75th anniversary with first-time special events. • Enacted long-term concession agreement for Lodi Lake Boat House and invested in revenue-
generating capital improvements. • Partnered with service clubs for labor and capital improvements at Lodi Lake, Emerson, and
Katzakian parks. MAJOR 2017-18 OBJECTIVES
• Continue implementation of Strategic Action Plan: o Secure new indoor facility space to meet demand (Strategy 1.4). o Leverage technology to increase awareness and participation (Strategy 2.1). o Establish system-wide marketing standards/strategies to build brand (Strategy 2.2/5.1). o Become data-driven using data analytics to guide decision making (Strategy 2.3). o Evaluate core program classifications/lifecycle to ensure alignment with trends (Strategy 2.5). o Establish intra-departmental coordination/communication standards to eliminate silos (Strategy
3.2). o Update school district partnership plan (Strategy 3.3). o Develop long-term financial plan and cost of service study (Strategy 4.2). o Update policy manuals to reflect performance and outcomes (Strategy 4.5).
• Continue to seek outside funding for park improvements. PERFORMANCE MEASURES 2014-15 2015-16 2016-17
Net revenue (deficit) $324,048 $158,128 $210,000 (est.)
Transfer out to Parks capital $150,500 $182,390 $335,430 RELATED ORGANIZATIONAL UNIT(S)
• 20070001 • 20070002 • 20070003
• 20070004 • 20071001 • 20072001
• 20073001
243
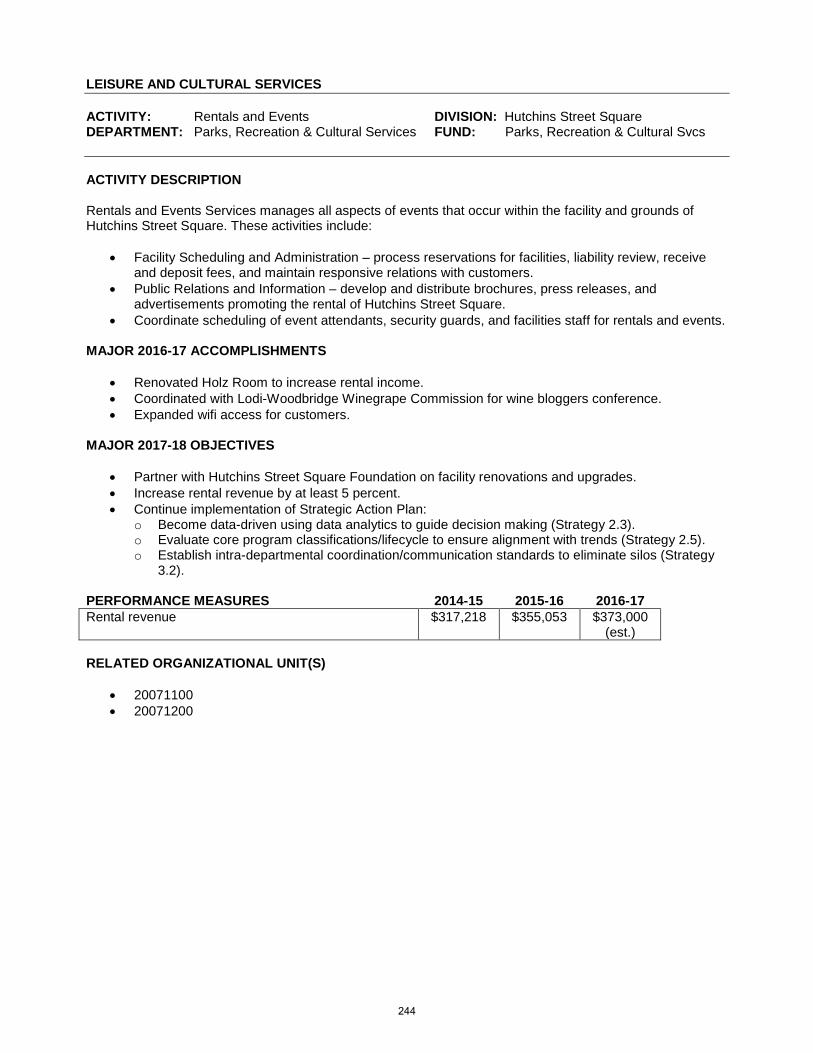
LEISURE AND CULTURAL SERVICES ACTIVITY: Rentals and Events DIVISION: Hutchins Street Square DEPARTMENT: Parks, Recreation & Cultural Services FUND: Parks, Recreation & Cultural Svcs ACTIVITY DESCRIPTION Rentals and Events Services manages all aspects of events that occur within the facility and grounds of Hutchins Street Square. These activities include:
• Facility Scheduling and Administration – process reservations for facilities, liability review, receive and deposit fees, and maintain responsive relations with customers.
• Public Relations and Information – develop and distribute brochures, press releases, and advertisements promoting the rental of Hutchins Street Square.
• Coordinate scheduling of event attendants, security guards, and facilities staff for rentals and events. MAJOR 2016-17 ACCOMPLISHMENTS
• Renovated Holz Room to increase rental income. • Coordinated with Lodi-Woodbridge Winegrape Commission for wine bloggers conference. • Expanded wifi access for customers.
MAJOR 2017-18 OBJECTIVES
• Partner with Hutchins Street Square Foundation on facility renovations and upgrades. • Increase rental revenue by at least 5 percent. • Continue implementation of Strategic Action Plan:
o Become data-driven using data analytics to guide decision making (Strategy 2.3). o Evaluate core program classifications/lifecycle to ensure alignment with trends (Strategy 2.5). o Establish intra-departmental coordination/communication standards to eliminate silos (Strategy
3.2). PERFORMANCE MEASURES 2014-15 2015-16 2016-17 Rental revenue $317,218 $355,053 $373,000
(est.) RELATED ORGANIZATIONAL UNIT(S)
• 20071100 • 20071200
244
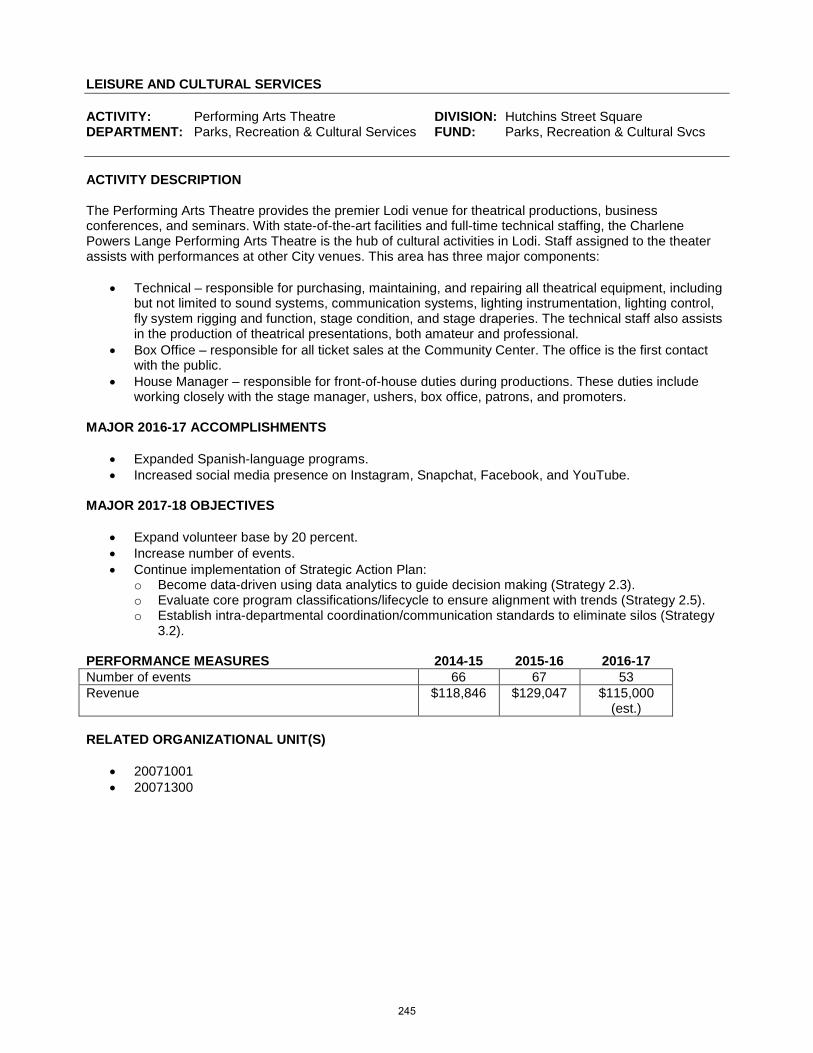
LEISURE AND CULTURAL SERVICES ACTIVITY: Performing Arts Theatre DIVISION: Hutchins Street Square DEPARTMENT: Parks, Recreation & Cultural Services FUND: Parks, Recreation & Cultural Svcs ACTIVITY DESCRIPTION The Performing Arts Theatre provides the premier Lodi venue for theatrical productions, business conferences, and seminars. With state-of-the-art facilities and full-time technical staffing, the Charlene Powers Lange Performing Arts Theatre is the hub of cultural activities in Lodi. Staff assigned to the theater assists with performances at other City venues. This area has three major components:
• Technical – responsible for purchasing, maintaining, and repairing all theatrical equipment, including but not limited to sound systems, communication systems, lighting instrumentation, lighting control, fly system rigging and function, stage condition, and stage draperies. The technical staff also assists in the production of theatrical presentations, both amateur and professional.
• Box Office – responsible for all ticket sales at the Community Center. The office is the first contact with the public.
• House Manager – responsible for front-of-house duties during productions. These duties include working closely with the stage manager, ushers, box office, patrons, and promoters.
MAJOR 2016-17 ACCOMPLISHMENTS
• Expanded Spanish-language programs. • Increased social media presence on Instagram, Snapchat, Facebook, and YouTube.
MAJOR 2017-18 OBJECTIVES
• Expand volunteer base by 20 percent. • Increase number of events. • Continue implementation of Strategic Action Plan:
o Become data-driven using data analytics to guide decision making (Strategy 2.3). o Evaluate core program classifications/lifecycle to ensure alignment with trends (Strategy 2.5). o Establish intra-departmental coordination/communication standards to eliminate silos (Strategy
3.2). PERFORMANCE MEASURES 2014-15 2015-16 2016-17 Number of events 66 67 53 Revenue $118,846 $129,047 $115,000
(est.) RELATED ORGANIZATIONAL UNIT(S)
• 20071001 • 20071300
245
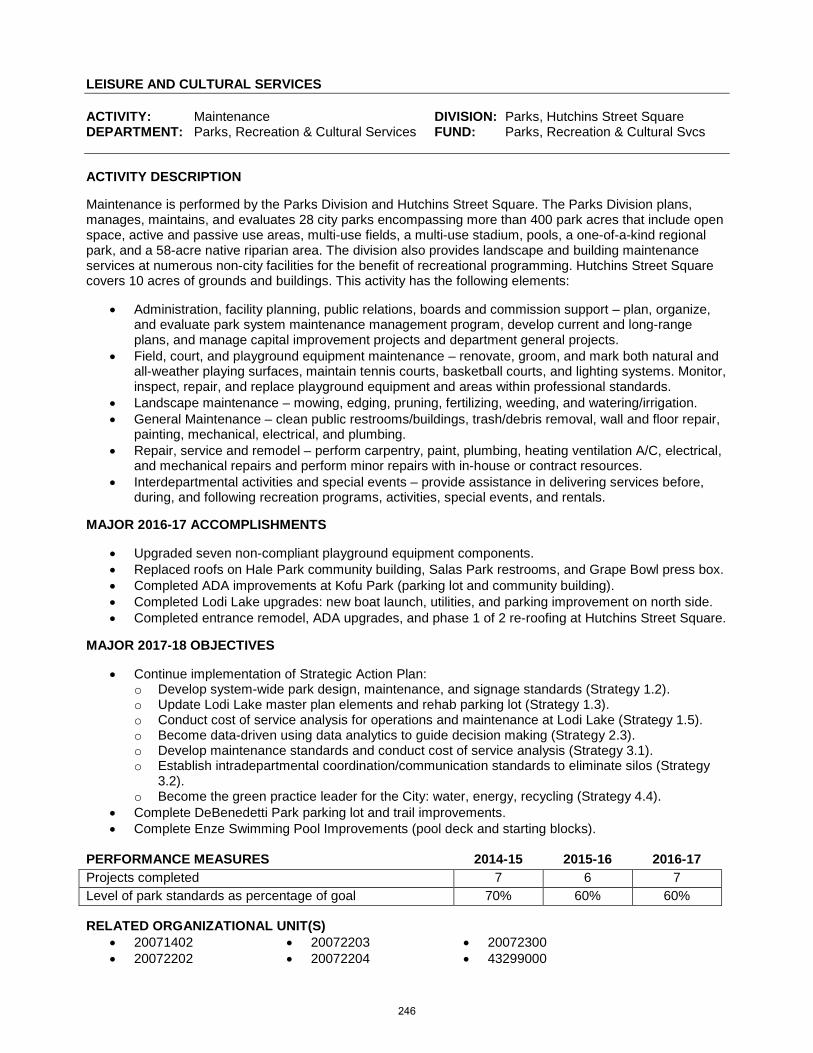
LEISURE AND CULTURAL SERVICES ACTIVITY: Maintenance DIVISION: Parks, Hutchins Street Square DEPARTMENT: Parks, Recreation & Cultural Services FUND: Parks, Recreation & Cultural Svcs ACTIVITY DESCRIPTION Maintenance is performed by the Parks Division and Hutchins Street Square. The Parks Division plans, manages, maintains, and evaluates 28 city parks encompassing more than 400 park acres that include open space, active and passive use areas, multi-use fields, a multi-use stadium, pools, a one-of-a-kind regional park, and a 58-acre native riparian area. The division also provides landscape and building maintenance services at numerous non-city facilities for the benefit of recreational programming. Hutchins Street Square covers 10 acres of grounds and buildings. This activity has the following elements:
• Administration, facility planning, public relations, boards and commission support – plan, organize, and evaluate park system maintenance management program, develop current and long-range plans, and manage capital improvement projects and department general projects.
• Field, court, and playground equipment maintenance – renovate, groom, and mark both natural and all-weather playing surfaces, maintain tennis courts, basketball courts, and lighting systems. Monitor, inspect, repair, and replace playground equipment and areas within professional standards.
• Landscape maintenance – mowing, edging, pruning, fertilizing, weeding, and watering/irrigation. • General Maintenance – clean public restrooms/buildings, trash/debris removal, wall and floor repair,
painting, mechanical, electrical, and plumbing. • Repair, service and remodel – perform carpentry, paint, plumbing, heating ventilation A/C, electrical,
and mechanical repairs and perform minor repairs with in-house or contract resources. • Interdepartmental activities and special events – provide assistance in delivering services before,
during, and following recreation programs, activities, special events, and rentals. MAJOR 2016-17 ACCOMPLISHMENTS
• Upgraded seven non-compliant playground equipment components. • Replaced roofs on Hale Park community building, Salas Park restrooms, and Grape Bowl press box. • Completed ADA improvements at Kofu Park (parking lot and community building). • Completed Lodi Lake upgrades: new boat launch, utilities, and parking improvement on north side. • Completed entrance remodel, ADA upgrades, and phase 1 of 2 re-roofing at Hutchins Street Square.
MAJOR 2017-18 OBJECTIVES
• Continue implementation of Strategic Action Plan: o Develop system-wide park design, maintenance, and signage standards (Strategy 1.2). o Update Lodi Lake master plan elements and rehab parking lot (Strategy 1.3). o Conduct cost of service analysis for operations and maintenance at Lodi Lake (Strategy 1.5). o Become data-driven using data analytics to guide decision making (Strategy 2.3). o Develop maintenance standards and conduct cost of service analysis (Strategy 3.1). o Establish intradepartmental coordination/communication standards to eliminate silos (Strategy
3.2). o Become the green practice leader for the City: water, energy, recycling (Strategy 4.4).
• Complete DeBenedetti Park parking lot and trail improvements. • Complete Enze Swimming Pool Improvements (pool deck and starting blocks).
PERFORMANCE MEASURES 2014-15 2015-16 2016-17 Projects completed 7 6 7 Level of park standards as percentage of goal 70% 60% 60% RELATED ORGANIZATIONAL UNIT(S)
• 20071402 • 20072202
• 20072203 • 20072204
• 20072300 • 43299000
246
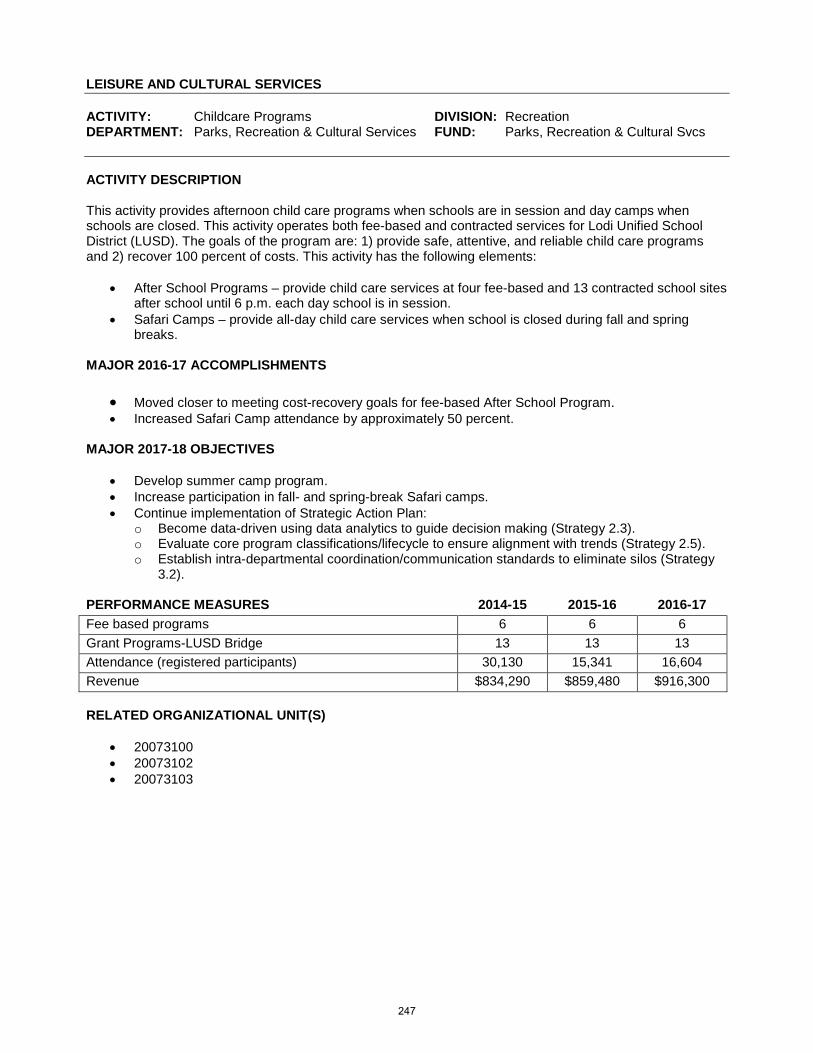
LEISURE AND CULTURAL SERVICES ACTIVITY: Childcare Programs DIVISION: Recreation DEPARTMENT: Parks, Recreation & Cultural Services FUND: Parks, Recreation & Cultural Svcs ACTIVITY DESCRIPTION This activity provides afternoon child care programs when schools are in session and day camps when schools are closed. This activity operates both fee-based and contracted services for Lodi Unified School District (LUSD). The goals of the program are: 1) provide safe, attentive, and reliable child care programs and 2) recover 100 percent of costs. This activity has the following elements:
• After School Programs – provide child care services at four fee-based and 13 contracted school sites after school until 6 p.m. each day school is in session.
• Safari Camps – provide all-day child care services when school is closed during fall and spring breaks.
MAJOR 2016-17 ACCOMPLISHMENTS
• Moved closer to meeting cost-recovery goals for fee-based After School Program. • Increased Safari Camp attendance by approximately 50 percent.
MAJOR 2017-18 OBJECTIVES
• Develop summer camp program. • Increase participation in fall- and spring-break Safari camps. • Continue implementation of Strategic Action Plan:
o Become data-driven using data analytics to guide decision making (Strategy 2.3). o Evaluate core program classifications/lifecycle to ensure alignment with trends (Strategy 2.5). o Establish intra-departmental coordination/communication standards to eliminate silos (Strategy
3.2). PERFORMANCE MEASURES 2014-15 2015-16 2016-17 Fee based programs 6 6 6 Grant Programs-LUSD Bridge 13 13 13 Attendance (registered participants) 30,130 15,341 16,604 Revenue $834,290 $859,480 $916,300 RELATED ORGANIZATIONAL UNIT(S)
• 20073100 • 20073102 • 20073103
247
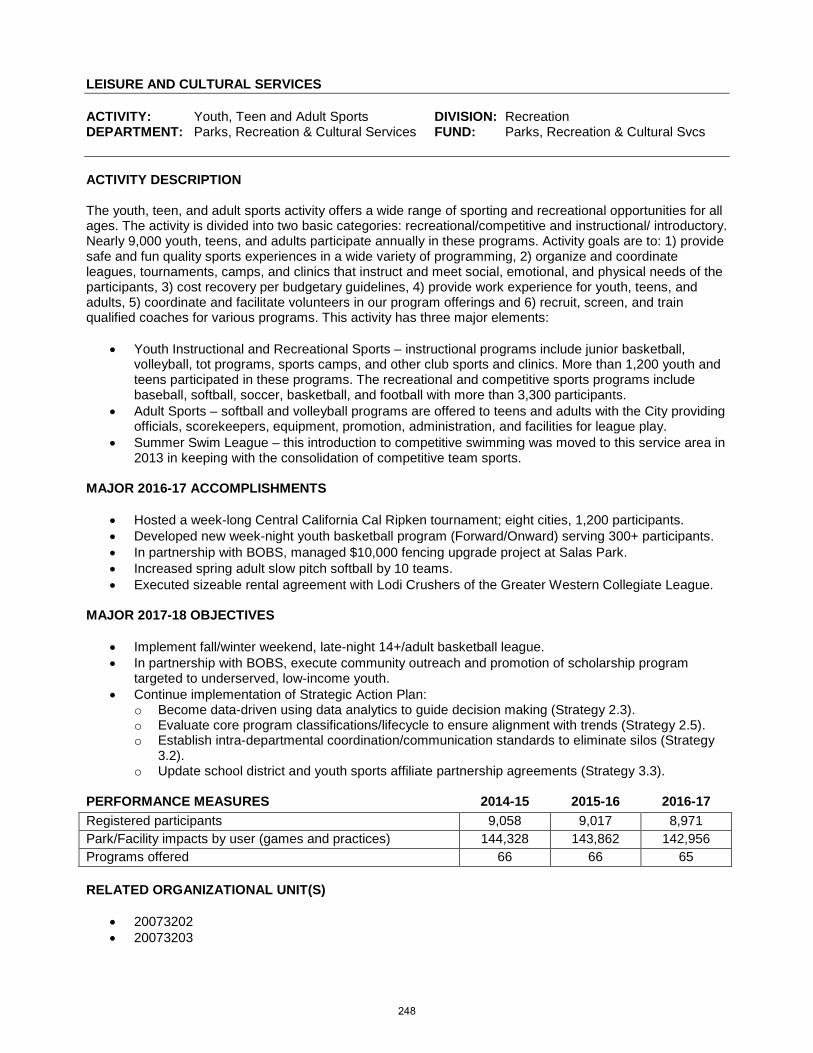
LEISURE AND CULTURAL SERVICES ACTIVITY: Youth, Teen and Adult Sports DIVISION: Recreation DEPARTMENT: Parks, Recreation & Cultural Services FUND: Parks, Recreation & Cultural Svcs ACTIVITY DESCRIPTION The youth, teen, and adult sports activity offers a wide range of sporting and recreational opportunities for all ages. The activity is divided into two basic categories: recreational/competitive and instructional/ introductory. Nearly 9,000 youth, teens, and adults participate annually in these programs. Activity goals are to: 1) provide safe and fun quality sports experiences in a wide variety of programming, 2) organize and coordinate leagues, tournaments, camps, and clinics that instruct and meet social, emotional, and physical needs of the participants, 3) cost recovery per budgetary guidelines, 4) provide work experience for youth, teens, and adults, 5) coordinate and facilitate volunteers in our program offerings and 6) recruit, screen, and train qualified coaches for various programs. This activity has three major elements:
• Youth Instructional and Recreational Sports – instructional programs include junior basketball, volleyball, tot programs, sports camps, and other club sports and clinics. More than 1,200 youth and teens participated in these programs. The recreational and competitive sports programs include baseball, softball, soccer, basketball, and football with more than 3,300 participants.
• Adult Sports – softball and volleyball programs are offered to teens and adults with the City providing officials, scorekeepers, equipment, promotion, administration, and facilities for league play.
• Summer Swim League – this introduction to competitive swimming was moved to this service area in 2013 in keeping with the consolidation of competitive team sports.
MAJOR 2016-17 ACCOMPLISHMENTS
• Hosted a week-long Central California Cal Ripken tournament; eight cities, 1,200 participants. • Developed new week-night youth basketball program (Forward/Onward) serving 300+ participants. • In partnership with BOBS, managed $10,000 fencing upgrade project at Salas Park. • Increased spring adult slow pitch softball by 10 teams. • Executed sizeable rental agreement with Lodi Crushers of the Greater Western Collegiate League.
MAJOR 2017-18 OBJECTIVES
• Implement fall/winter weekend, late-night 14+/adult basketball league. • In partnership with BOBS, execute community outreach and promotion of scholarship program
targeted to underserved, low-income youth. • Continue implementation of Strategic Action Plan:
o Become data-driven using data analytics to guide decision making (Strategy 2.3). o Evaluate core program classifications/lifecycle to ensure alignment with trends (Strategy 2.5). o Establish intra-departmental coordination/communication standards to eliminate silos (Strategy
3.2). o Update school district and youth sports affiliate partnership agreements (Strategy 3.3).
PERFORMANCE MEASURES 2014-15 2015-16 2016-17 Registered participants 9,058 9,017 8,971 Park/Facility impacts by user (games and practices) 144,328 143,862 142,956 Programs offered 66 66 65 RELATED ORGANIZATIONAL UNIT(S)
• 20073202 • 20073203
248
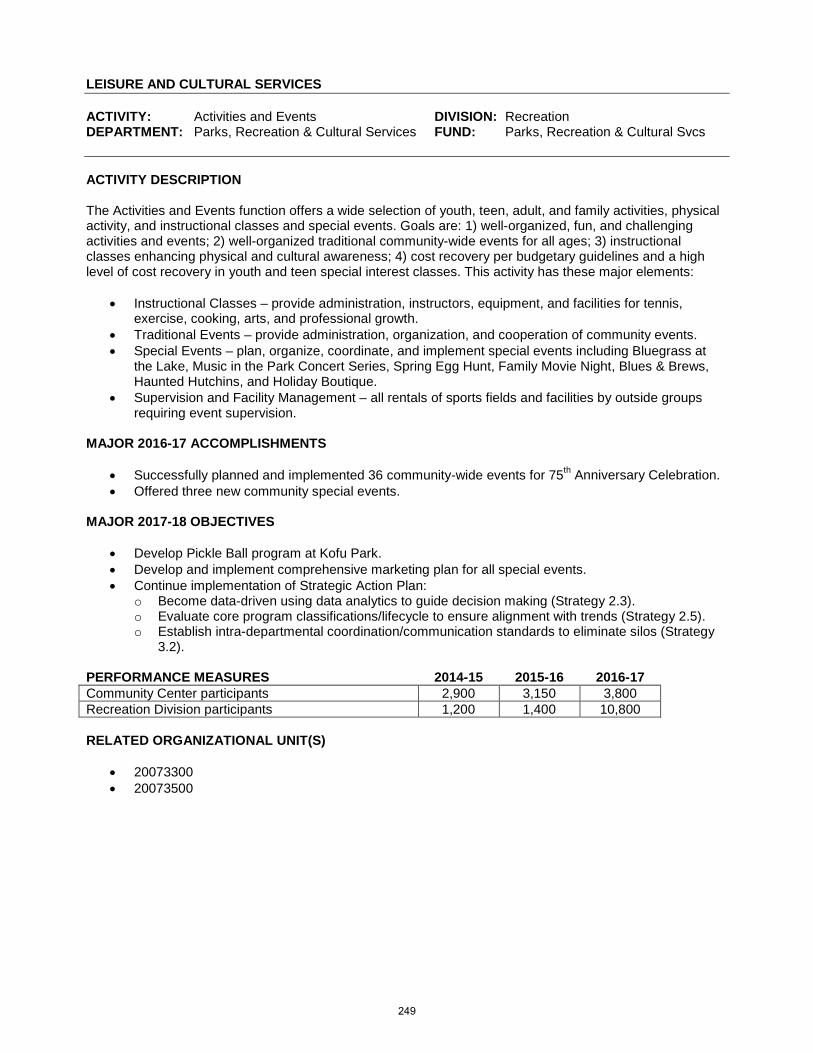
LEISURE AND CULTURAL SERVICES ACTIVITY: Activities and Events DIVISION: Recreation DEPARTMENT: Parks, Recreation & Cultural Services FUND: Parks, Recreation & Cultural Svcs ACTIVITY DESCRIPTION The Activities and Events function offers a wide selection of youth, teen, adult, and family activities, physical activity, and instructional classes and special events. Goals are: 1) well-organized, fun, and challenging activities and events; 2) well-organized traditional community-wide events for all ages; 3) instructional classes enhancing physical and cultural awareness; 4) cost recovery per budgetary guidelines and a high level of cost recovery in youth and teen special interest classes. This activity has these major elements:
• Instructional Classes – provide administration, instructors, equipment, and facilities for tennis, exercise, cooking, arts, and professional growth.
• Traditional Events – provide administration, organization, and cooperation of community events. • Special Events – plan, organize, coordinate, and implement special events including Bluegrass at
the Lake, Music in the Park Concert Series, Spring Egg Hunt, Family Movie Night, Blues & Brews, Haunted Hutchins, and Holiday Boutique.
• Supervision and Facility Management – all rentals of sports fields and facilities by outside groups requiring event supervision.
MAJOR 2016-17 ACCOMPLISHMENTS
• Successfully planned and implemented 36 community-wide events for 75th Anniversary Celebration. • Offered three new community special events.
MAJOR 2017-18 OBJECTIVES
• Develop Pickle Ball program at Kofu Park. • Develop and implement comprehensive marketing plan for all special events. • Continue implementation of Strategic Action Plan:
o Become data-driven using data analytics to guide decision making (Strategy 2.3). o Evaluate core program classifications/lifecycle to ensure alignment with trends (Strategy 2.5). o Establish intra-departmental coordination/communication standards to eliminate silos (Strategy
3.2). PERFORMANCE MEASURES 2014-15 2015-16 2016-17 Community Center participants 2,900 3,150 3,800 Recreation Division participants 1,200 1,400 10,800 RELATED ORGANIZATIONAL UNIT(S)
• 20073300 • 20073500
249
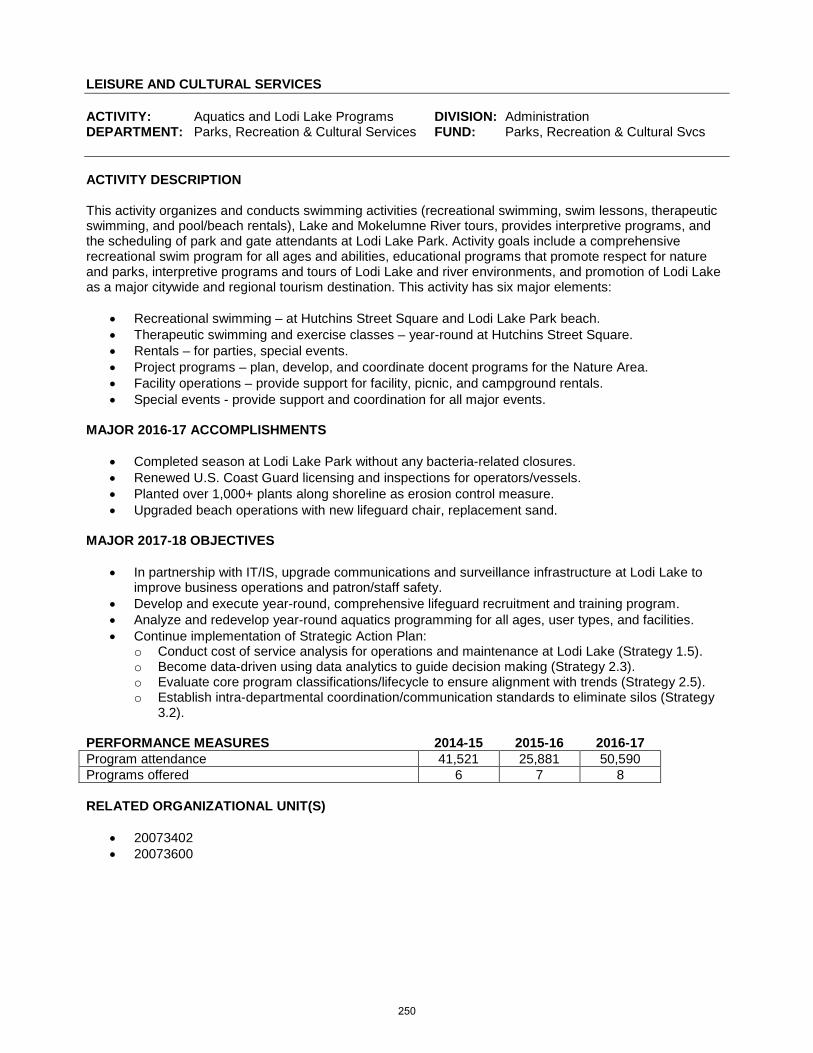
LEISURE AND CULTURAL SERVICES ACTIVITY: Aquatics and Lodi Lake Programs DIVISION: Administration DEPARTMENT: Parks, Recreation & Cultural Services FUND: Parks, Recreation & Cultural Svcs ACTIVITY DESCRIPTION This activity organizes and conducts swimming activities (recreational swimming, swim lessons, therapeutic swimming, and pool/beach rentals), Lake and Mokelumne River tours, provides interpretive programs, and the scheduling of park and gate attendants at Lodi Lake Park. Activity goals include a comprehensive recreational swim program for all ages and abilities, educational programs that promote respect for nature and parks, interpretive programs and tours of Lodi Lake and river environments, and promotion of Lodi Lake as a major citywide and regional tourism destination. This activity has six major elements:
• Recreational swimming – at Hutchins Street Square and Lodi Lake Park beach. • Therapeutic swimming and exercise classes – year-round at Hutchins Street Square. • Rentals – for parties, special events. • Project programs – plan, develop, and coordinate docent programs for the Nature Area. • Facility operations – provide support for facility, picnic, and campground rentals. • Special events - provide support and coordination for all major events.
MAJOR 2016-17 ACCOMPLISHMENTS
• Completed season at Lodi Lake Park without any bacteria-related closures. • Renewed U.S. Coast Guard licensing and inspections for operators/vessels. • Planted over 1,000+ plants along shoreline as erosion control measure. • Upgraded beach operations with new lifeguard chair, replacement sand.
MAJOR 2017-18 OBJECTIVES
• In partnership with IT/IS, upgrade communications and surveillance infrastructure at Lodi Lake to improve business operations and patron/staff safety.
• Develop and execute year-round, comprehensive lifeguard recruitment and training program. • Analyze and redevelop year-round aquatics programming for all ages, user types, and facilities. • Continue implementation of Strategic Action Plan:
o Conduct cost of service analysis for operations and maintenance at Lodi Lake (Strategy 1.5). o Become data-driven using data analytics to guide decision making (Strategy 2.3). o Evaluate core program classifications/lifecycle to ensure alignment with trends (Strategy 2.5). o Establish intra-departmental coordination/communication standards to eliminate silos (Strategy
3.2). PERFORMANCE MEASURES 2014-15 2015-16 2016-17 Program attendance 41,521 25,881 50,590 Programs offered 6 7 8 RELATED ORGANIZATIONAL UNIT(S)
• 20073402 • 20073600
250
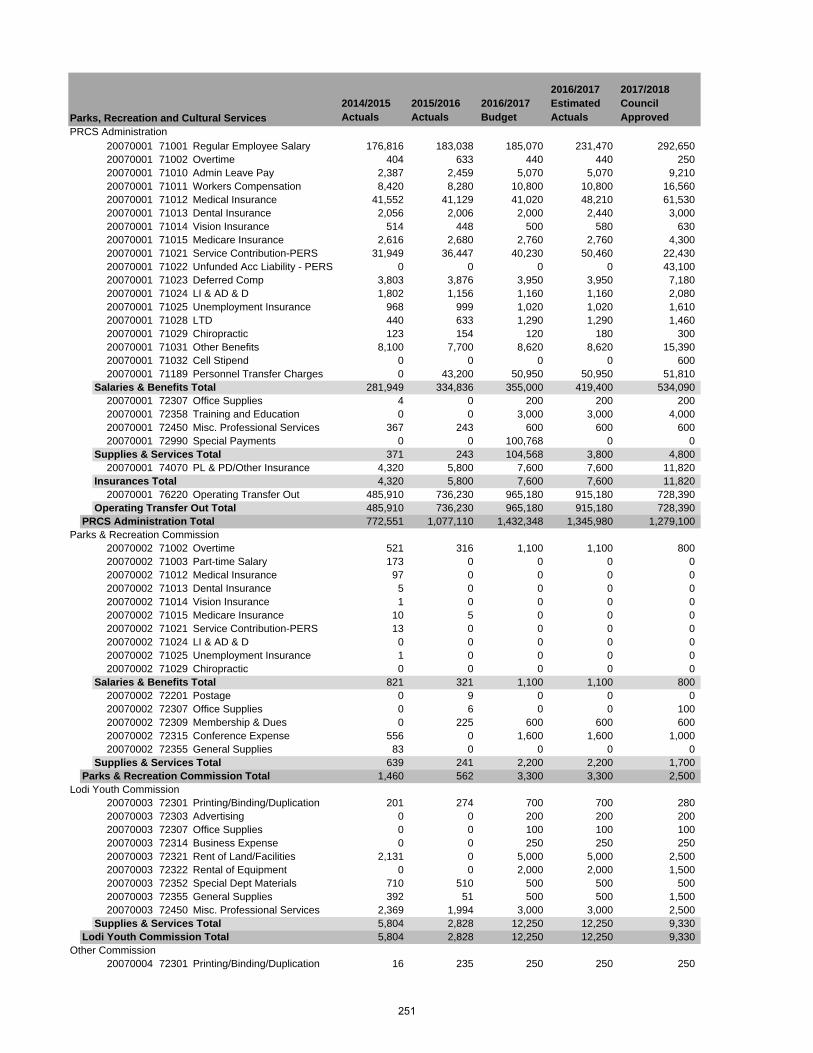
2014/2015 Actuals
2015/2016 Actuals
2016/2017 Budget
2016/2017 Estimated Actuals
2017/2018 Council Approved
PRCS Administration20070001 71001 Regular Employee Salary 176,816 183,038 185,070 231,470 292,65020070001 71002 Overtime 404 633 440 440 25020070001 71010 Admin Leave Pay 2,387 2,459 5,070 5,070 9,21020070001 71011 Workers Compensation 8,420 8,280 10,800 10,800 16,56020070001 71012 Medical Insurance 41,552 41,129 41,020 48,210 61,53020070001 71013 Dental Insurance 2,056 2,006 2,000 2,440 3,00020070001 71014 Vision Insurance 514 448 500 580 63020070001 71015 Medicare Insurance 2,616 2,680 2,760 2,760 4,30020070001 71021 Service Contribution-PERS 31,949 36,447 40,230 50,460 22,43020070001 71022 Unfunded Acc Liability - PERS 0 0 0 0 43,10020070001 71023 Deferred Comp 3,803 3,876 3,950 3,950 7,18020070001 71024 LI & AD & D 1,802 1,156 1,160 1,160 2,08020070001 71025 Unemployment Insurance 968 999 1,020 1,020 1,61020070001 71028 LTD 440 633 1,290 1,290 1,46020070001 71029 Chiropractic 123 154 120 180 30020070001 71031 Other Benefits 8,100 7,700 8,620 8,620 15,39020070001 71032 Cell Stipend 0 0 0 0 60020070001 71189 Personnel Transfer Charges 0 43,200 50,950 50,950 51,810
Salaries & Benefits Total 281,949 334,836 355,000 419,400 534,09020070001 72307 Office Supplies 4 0 200 200 20020070001 72358 Training and Education 0 0 3,000 3,000 4,00020070001 72450 Misc. Professional Services 367 243 600 600 60020070001 72990 Special Payments 0 0 100,768 0 0
Supplies & Services Total 371 243 104,568 3,800 4,80020070001 74070 PL & PD/Other Insurance 4,320 5,800 7,600 7,600 11,820
Insurances Total 4,320 5,800 7,600 7,600 11,82020070001 76220 Operating Transfer Out 485,910 736,230 965,180 915,180 728,390
Operating Transfer Out Total 485,910 736,230 965,180 915,180 728,390PRCS Administration Total 772,551 1,077,110 1,432,348 1,345,980 1,279,100
Parks & Recreation Commission20070002 71002 Overtime 521 316 1,100 1,100 80020070002 71003 Part-time Salary 173 0 0 0 020070002 71012 Medical Insurance 97 0 0 0 020070002 71013 Dental Insurance 5 0 0 0 020070002 71014 Vision Insurance 1 0 0 0 020070002 71015 Medicare Insurance 10 5 0 0 020070002 71021 Service Contribution-PERS 13 0 0 0 020070002 71024 LI & AD & D 0 0 0 0 020070002 71025 Unemployment Insurance 1 0 0 0 020070002 71029 Chiropractic 0 0 0 0 0
Salaries & Benefits Total 821 321 1,100 1,100 80020070002 72201 Postage 0 9 0 0 020070002 72307 Office Supplies 0 6 0 0 10020070002 72309 Membership & Dues 0 225 600 600 60020070002 72315 Conference Expense 556 0 1,600 1,600 1,00020070002 72355 General Supplies 83 0 0 0 0
Supplies & Services Total 639 241 2,200 2,200 1,700Parks & Recreation Commission Total 1,460 562 3,300 3,300 2,500
Lodi Youth Commission20070003 72301 Printing/Binding/Duplication 201 274 700 700 28020070003 72303 Advertising 0 0 200 200 20020070003 72307 Office Supplies 0 0 100 100 10020070003 72314 Business Expense 0 0 250 250 25020070003 72321 Rent of Land/Facilities 2,131 0 5,000 5,000 2,50020070003 72322 Rental of Equipment 0 0 2,000 2,000 1,50020070003 72352 Special Dept Materials 710 510 500 500 50020070003 72355 General Supplies 392 51 500 500 1,50020070003 72450 Misc. Professional Services 2,369 1,994 3,000 3,000 2,500
Supplies & Services Total 5,804 2,828 12,250 12,250 9,330Lodi Youth Commission Total 5,804 2,828 12,250 12,250 9,330
Other Commission20070004 72301 Printing/Binding/Duplication 16 235 250 250 250
Parks, Recreation and Cultural Services
251
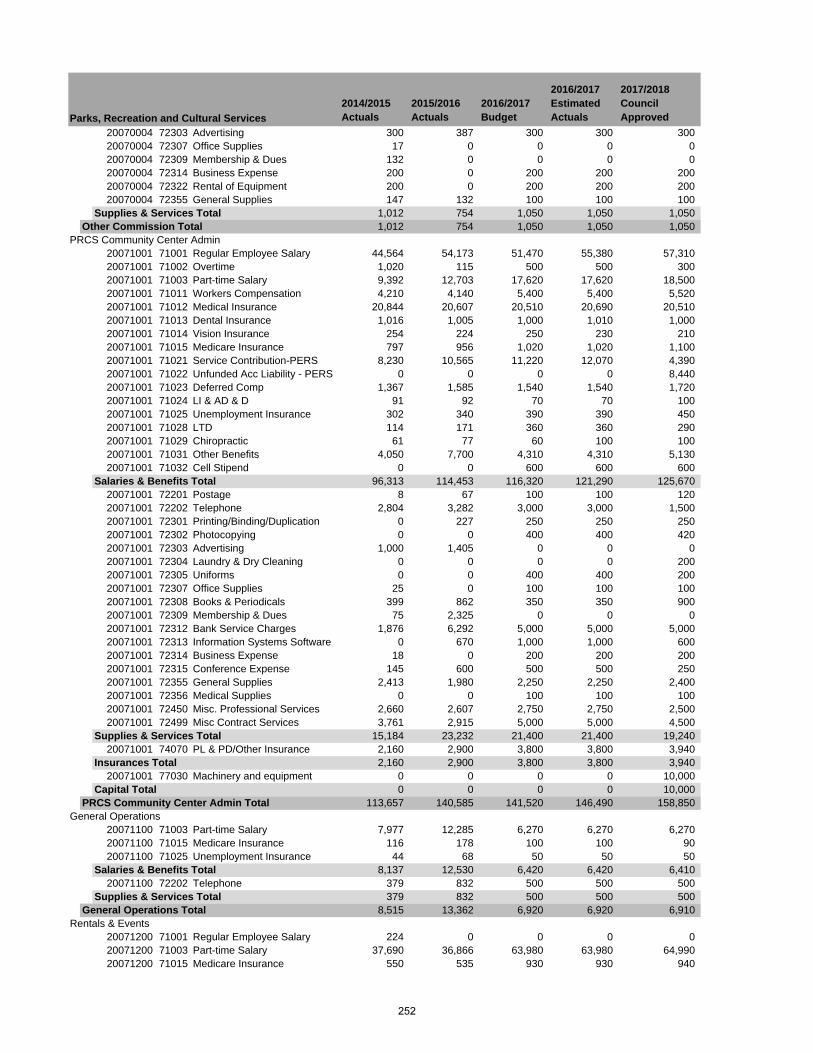
2014/2015 Actuals
2015/2016 Actuals
2016/2017 Budget
2016/2017 Estimated Actuals
2017/2018 Council ApprovedParks, Recreation and Cultural Services
20070004 72303 Advertising 300 387 300 300 30020070004 72307 Office Supplies 17 0 0 0 020070004 72309 Membership & Dues 132 0 0 0 020070004 72314 Business Expense 200 0 200 200 20020070004 72322 Rental of Equipment 200 0 200 200 20020070004 72355 General Supplies 147 132 100 100 100
Supplies & Services Total 1,012 754 1,050 1,050 1,050Other Commission Total 1,012 754 1,050 1,050 1,050
PRCS Community Center Admin20071001 71001 Regular Employee Salary 44,564 54,173 51,470 55,380 57,31020071001 71002 Overtime 1,020 115 500 500 30020071001 71003 Part-time Salary 9,392 12,703 17,620 17,620 18,50020071001 71011 Workers Compensation 4,210 4,140 5,400 5,400 5,52020071001 71012 Medical Insurance 20,844 20,607 20,510 20,690 20,51020071001 71013 Dental Insurance 1,016 1,005 1,000 1,010 1,00020071001 71014 Vision Insurance 254 224 250 230 21020071001 71015 Medicare Insurance 797 956 1,020 1,020 1,10020071001 71021 Service Contribution-PERS 8,230 10,565 11,220 12,070 4,39020071001 71022 Unfunded Acc Liability - PERS 0 0 0 0 8,44020071001 71023 Deferred Comp 1,367 1,585 1,540 1,540 1,72020071001 71024 LI & AD & D 91 92 70 70 10020071001 71025 Unemployment Insurance 302 340 390 390 45020071001 71028 LTD 114 171 360 360 29020071001 71029 Chiropractic 61 77 60 100 10020071001 71031 Other Benefits 4,050 7,700 4,310 4,310 5,13020071001 71032 Cell Stipend 0 0 600 600 600
Salaries & Benefits Total 96,313 114,453 116,320 121,290 125,67020071001 72201 Postage 8 67 100 100 12020071001 72202 Telephone 2,804 3,282 3,000 3,000 1,50020071001 72301 Printing/Binding/Duplication 0 227 250 250 25020071001 72302 Photocopying 0 0 400 400 42020071001 72303 Advertising 1,000 1,405 0 0 020071001 72304 Laundry & Dry Cleaning 0 0 0 0 20020071001 72305 Uniforms 0 0 400 400 20020071001 72307 Office Supplies 25 0 100 100 10020071001 72308 Books & Periodicals 399 862 350 350 90020071001 72309 Membership & Dues 75 2,325 0 0 020071001 72312 Bank Service Charges 1,876 6,292 5,000 5,000 5,00020071001 72313 Information Systems Software 0 670 1,000 1,000 60020071001 72314 Business Expense 18 0 200 200 20020071001 72315 Conference Expense 145 600 500 500 25020071001 72355 General Supplies 2,413 1,980 2,250 2,250 2,40020071001 72356 Medical Supplies 0 0 100 100 10020071001 72450 Misc. Professional Services 2,660 2,607 2,750 2,750 2,50020071001 72499 Misc Contract Services 3,761 2,915 5,000 5,000 4,500
Supplies & Services Total 15,184 23,232 21,400 21,400 19,24020071001 74070 PL & PD/Other Insurance 2,160 2,900 3,800 3,800 3,940
Insurances Total 2,160 2,900 3,800 3,800 3,94020071001 77030 Machinery and equipment 0 0 0 0 10,000
Capital Total 0 0 0 0 10,000PRCS Community Center Admin Total 113,657 140,585 141,520 146,490 158,850
General Operations20071100 71003 Part-time Salary 7,977 12,285 6,270 6,270 6,27020071100 71015 Medicare Insurance 116 178 100 100 9020071100 71025 Unemployment Insurance 44 68 50 50 50
Salaries & Benefits Total 8,137 12,530 6,420 6,420 6,41020071100 72202 Telephone 379 832 500 500 500
Supplies & Services Total 379 832 500 500 500General Operations Total 8,515 13,362 6,920 6,920 6,910
Rentals & Events20071200 71001 Regular Employee Salary 224 0 0 0 020071200 71003 Part-time Salary 37,690 36,866 63,980 63,980 64,99020071200 71015 Medicare Insurance 550 535 930 930 940
252
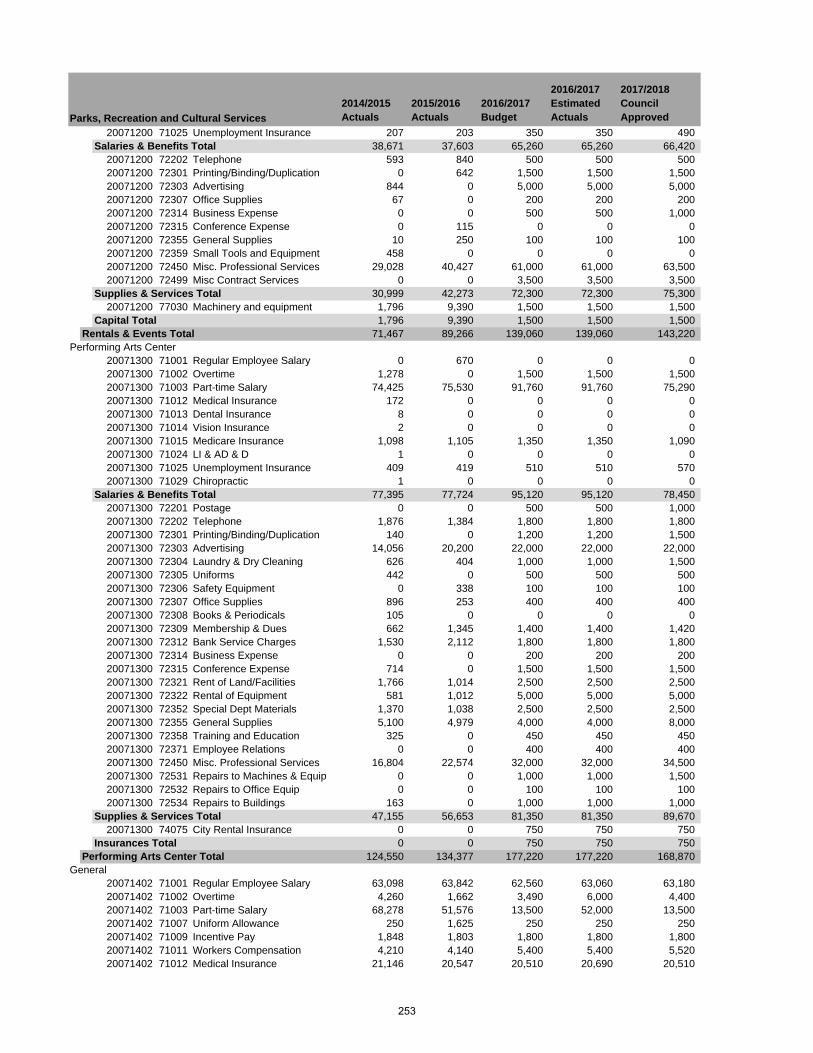
2014/2015 Actuals
2015/2016 Actuals
2016/2017 Budget
2016/2017 Estimated Actuals
2017/2018 Council ApprovedParks, Recreation and Cultural Services
20071200 71025 Unemployment Insurance 207 203 350 350 490Salaries & Benefits Total 38,671 37,603 65,260 65,260 66,420
20071200 72202 Telephone 593 840 500 500 50020071200 72301 Printing/Binding/Duplication 0 642 1,500 1,500 1,50020071200 72303 Advertising 844 0 5,000 5,000 5,00020071200 72307 Office Supplies 67 0 200 200 20020071200 72314 Business Expense 0 0 500 500 1,00020071200 72315 Conference Expense 0 115 0 0 020071200 72355 General Supplies 10 250 100 100 10020071200 72359 Small Tools and Equipment 458 0 0 0 020071200 72450 Misc. Professional Services 29,028 40,427 61,000 61,000 63,50020071200 72499 Misc Contract Services 0 0 3,500 3,500 3,500
Supplies & Services Total 30,999 42,273 72,300 72,300 75,30020071200 77030 Machinery and equipment 1,796 9,390 1,500 1,500 1,500
Capital Total 1,796 9,390 1,500 1,500 1,500Rentals & Events Total 71,467 89,266 139,060 139,060 143,220
Performing Arts Center20071300 71001 Regular Employee Salary 0 670 0 0 020071300 71002 Overtime 1,278 0 1,500 1,500 1,50020071300 71003 Part-time Salary 74,425 75,530 91,760 91,760 75,29020071300 71012 Medical Insurance 172 0 0 0 020071300 71013 Dental Insurance 8 0 0 0 020071300 71014 Vision Insurance 2 0 0 0 020071300 71015 Medicare Insurance 1,098 1,105 1,350 1,350 1,09020071300 71024 LI & AD & D 1 0 0 0 020071300 71025 Unemployment Insurance 409 419 510 510 57020071300 71029 Chiropractic 1 0 0 0 0
Salaries & Benefits Total 77,395 77,724 95,120 95,120 78,45020071300 72201 Postage 0 0 500 500 1,00020071300 72202 Telephone 1,876 1,384 1,800 1,800 1,80020071300 72301 Printing/Binding/Duplication 140 0 1,200 1,200 1,50020071300 72303 Advertising 14,056 20,200 22,000 22,000 22,00020071300 72304 Laundry & Dry Cleaning 626 404 1,000 1,000 1,50020071300 72305 Uniforms 442 0 500 500 50020071300 72306 Safety Equipment 0 338 100 100 10020071300 72307 Office Supplies 896 253 400 400 40020071300 72308 Books & Periodicals 105 0 0 0 020071300 72309 Membership & Dues 662 1,345 1,400 1,400 1,42020071300 72312 Bank Service Charges 1,530 2,112 1,800 1,800 1,80020071300 72314 Business Expense 0 0 200 200 20020071300 72315 Conference Expense 714 0 1,500 1,500 1,50020071300 72321 Rent of Land/Facilities 1,766 1,014 2,500 2,500 2,50020071300 72322 Rental of Equipment 581 1,012 5,000 5,000 5,00020071300 72352 Special Dept Materials 1,370 1,038 2,500 2,500 2,50020071300 72355 General Supplies 5,100 4,979 4,000 4,000 8,00020071300 72358 Training and Education 325 0 450 450 45020071300 72371 Employee Relations 0 0 400 400 40020071300 72450 Misc. Professional Services 16,804 22,574 32,000 32,000 34,50020071300 72531 Repairs to Machines & Equip 0 0 1,000 1,000 1,50020071300 72532 Repairs to Office Equip 0 0 100 100 10020071300 72534 Repairs to Buildings 163 0 1,000 1,000 1,000
Supplies & Services Total 47,155 56,653 81,350 81,350 89,67020071300 74075 City Rental Insurance 0 0 750 750 750
Insurances Total 0 0 750 750 750Performing Arts Center Total 124,550 134,377 177,220 177,220 168,870
General20071402 71001 Regular Employee Salary 63,098 63,842 62,560 63,060 63,18020071402 71002 Overtime 4,260 1,662 3,490 6,000 4,40020071402 71003 Part-time Salary 68,278 51,576 13,500 52,000 13,50020071402 71007 Uniform Allowance 250 1,625 250 250 25020071402 71009 Incentive Pay 1,848 1,803 1,800 1,800 1,80020071402 71011 Workers Compensation 4,210 4,140 5,400 5,400 5,52020071402 71012 Medical Insurance 21,146 20,547 20,510 20,690 20,510
253
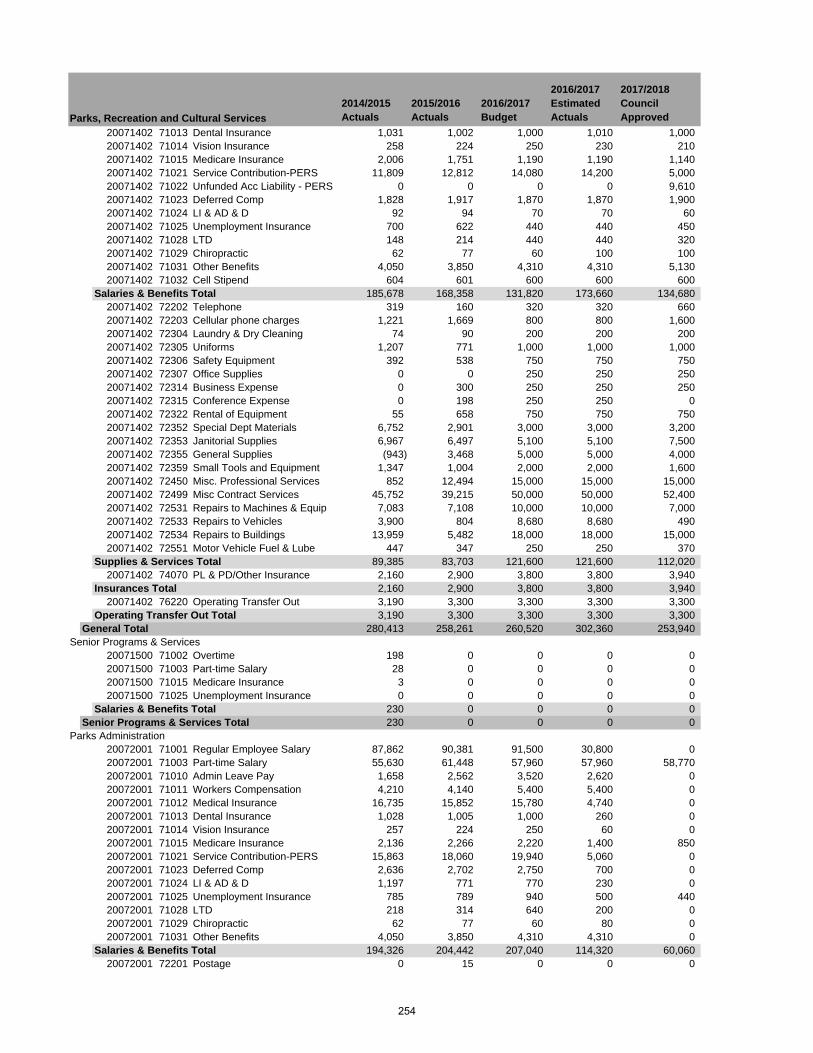
2014/2015 Actuals
2015/2016 Actuals
2016/2017 Budget
2016/2017 Estimated Actuals
2017/2018 Council ApprovedParks, Recreation and Cultural Services
20071402 71013 Dental Insurance 1,031 1,002 1,000 1,010 1,00020071402 71014 Vision Insurance 258 224 250 230 21020071402 71015 Medicare Insurance 2,006 1,751 1,190 1,190 1,14020071402 71021 Service Contribution-PERS 11,809 12,812 14,080 14,200 5,00020071402 71022 Unfunded Acc Liability - PERS 0 0 0 0 9,61020071402 71023 Deferred Comp 1,828 1,917 1,870 1,870 1,90020071402 71024 LI & AD & D 92 94 70 70 6020071402 71025 Unemployment Insurance 700 622 440 440 45020071402 71028 LTD 148 214 440 440 32020071402 71029 Chiropractic 62 77 60 100 10020071402 71031 Other Benefits 4,050 3,850 4,310 4,310 5,13020071402 71032 Cell Stipend 604 601 600 600 600
Salaries & Benefits Total 185,678 168,358 131,820 173,660 134,68020071402 72202 Telephone 319 160 320 320 66020071402 72203 Cellular phone charges 1,221 1,669 800 800 1,60020071402 72304 Laundry & Dry Cleaning 74 90 200 200 20020071402 72305 Uniforms 1,207 771 1,000 1,000 1,00020071402 72306 Safety Equipment 392 538 750 750 75020071402 72307 Office Supplies 0 0 250 250 25020071402 72314 Business Expense 0 300 250 250 25020071402 72315 Conference Expense 0 198 250 250 020071402 72322 Rental of Equipment 55 658 750 750 75020071402 72352 Special Dept Materials 6,752 2,901 3,000 3,000 3,20020071402 72353 Janitorial Supplies 6,967 6,497 5,100 5,100 7,50020071402 72355 General Supplies (943) 3,468 5,000 5,000 4,00020071402 72359 Small Tools and Equipment 1,347 1,004 2,000 2,000 1,60020071402 72450 Misc. Professional Services 852 12,494 15,000 15,000 15,00020071402 72499 Misc Contract Services 45,752 39,215 50,000 50,000 52,40020071402 72531 Repairs to Machines & Equip 7,083 7,108 10,000 10,000 7,00020071402 72533 Repairs to Vehicles 3,900 804 8,680 8,680 49020071402 72534 Repairs to Buildings 13,959 5,482 18,000 18,000 15,00020071402 72551 Motor Vehicle Fuel & Lube 447 347 250 250 370
Supplies & Services Total 89,385 83,703 121,600 121,600 112,02020071402 74070 PL & PD/Other Insurance 2,160 2,900 3,800 3,800 3,940
Insurances Total 2,160 2,900 3,800 3,800 3,94020071402 76220 Operating Transfer Out 3,190 3,300 3,300 3,300 3,300
Operating Transfer Out Total 3,190 3,300 3,300 3,300 3,300General Total 280,413 258,261 260,520 302,360 253,940
Senior Programs & Services20071500 71002 Overtime 198 0 0 0 020071500 71003 Part-time Salary 28 0 0 0 020071500 71015 Medicare Insurance 3 0 0 0 020071500 71025 Unemployment Insurance 0 0 0 0 0
Salaries & Benefits Total 230 0 0 0 0Senior Programs & Services Total 230 0 0 0 0
Parks Administration20072001 71001 Regular Employee Salary 87,862 90,381 91,500 30,800 020072001 71003 Part-time Salary 55,630 61,448 57,960 57,960 58,77020072001 71010 Admin Leave Pay 1,658 2,562 3,520 2,620 020072001 71011 Workers Compensation 4,210 4,140 5,400 5,400 020072001 71012 Medical Insurance 16,735 15,852 15,780 4,740 020072001 71013 Dental Insurance 1,028 1,005 1,000 260 020072001 71014 Vision Insurance 257 224 250 60 020072001 71015 Medicare Insurance 2,136 2,266 2,220 1,400 85020072001 71021 Service Contribution-PERS 15,863 18,060 19,940 5,060 020072001 71023 Deferred Comp 2,636 2,702 2,750 700 020072001 71024 LI & AD & D 1,197 771 770 230 020072001 71025 Unemployment Insurance 785 789 940 500 44020072001 71028 LTD 218 314 640 200 020072001 71029 Chiropractic 62 77 60 80 020072001 71031 Other Benefits 4,050 3,850 4,310 4,310 0
Salaries & Benefits Total 194,326 204,442 207,040 114,320 60,06020072001 72201 Postage 0 15 0 0 0
254
2014/2015 Actuals
2015/2016 Actuals
2016/2017 Budget
2016/2017 Estimated Actuals
2017/2018 Council ApprovedParks, Recreation and Cultural Services
20072001 72202 Telephone 911 822 500 500 68020072001 72301 Printing/Binding/Duplication 0 0 100 100 10020072001 72302 Photocopying 0 501 1,000 1,000 60020072001 72306 Safety Equipment 331 0 50 50 5020072001 72307 Office Supplies 1,579 958 2,000 2,000 1,60020072001 72308 Books & Periodicals 62 0 100 100 12020072001 72309 Membership & Dues 435 495 750 750 75020072001 72313 Information Systems Software 0 0 800 800 88020072001 72314 Business Expense 379 21 350 350 35020072001 72352 Special Dept Materials 143 2,561 2,500 2,500 1,00020072001 72353 Janitorial Supplies 476 552 100 100 70020072001 72355 General Supplies 256 1,017 100 100 30020072001 72358 Training and Education 2,209 1,735 2,000 2,000 2,60020072001 72359 Small Tools and Equipment 0 314 100 100 14020072001 72376 Tuition Reimbursement 390 400 400 400 60020072001 72399 Supplies & Services NOC 0 473 0 0 020072001 72450 Misc. Professional Services 750 4,936 0 0 5,00020072001 72499 Misc Contract Services 3,018 5,240 3,600 5,300 5,200
Supplies & Services Total 10,938 20,040 14,450 16,150 20,67020072001 74070 PL & PD/Other Insurance 2,160 2,900 3,800 3,800 0
Insurances Total 2,160 2,900 3,800 3,800 020072001 76220 Operating Transfer Out 66,000 66,000 52,000 52,000 55,000
Operating Transfer Out Total 66,000 66,000 52,000 52,000 55,000Parks Administration Total 273,424 293,382 277,290 186,270 135,730
PRCS Planning20072100 71001 Regular Employee Salary 70,515 75,485 74,360 78,030 75,09020072100 71002 Overtime 0 133 420 420 42020072100 71003 Part-time Salary 3,713 3,378 5,100 5,100 3,99020072100 71011 Workers Compensation 4,210 4,140 5,400 5,400 5,52020072100 71012 Medical Insurance 16,220 11,854 8,310 8,700 8,31020072100 71013 Dental Insurance 1,028 1,005 1,000 1,010 1,00020072100 71014 Vision Insurance 257 224 250 230 21020072100 71015 Medicare Insurance 1,076 1,209 1,160 1,160 1,15020072100 71021 Service Contribution-PERS 8,477 14,838 16,210 17,010 5,76020072100 71022 Unfunded Acc Liability - PERS 0 0 0 0 11,06020072100 71023 Deferred Comp 2,115 2,223 2,230 2,230 2,25020072100 71024 LI & AD & D 92 92 70 70 10020072100 71025 Unemployment Insurance 408 421 450 450 44020072100 71028 LTD 176 255 520 520 38020072100 71029 Chiropractic 62 77 60 100 10020072100 71031 Other Benefits 4,050 0 4,310 4,310 5,130
Salaries & Benefits Total 112,399 115,335 119,850 124,740 120,91020072100 72301 Printing/Binding/Duplication 0 108 0 0 020072100 72307 Office Supplies 1,256 934 2,200 2,200 1,40020072100 72313 Information Systems Software 425 670 800 800 1,200
Supplies & Services Total 1,681 1,712 3,000 3,000 2,60020072100 74070 PL & PD/Other Insurance 2,160 2,900 3,800 3,800 3,940
Insurances Total 2,160 2,900 3,800 3,800 3,94020072100 77030 Machinery and equipment 8,128 0 2,500 2,500 2,500
Capital Total 8,128 0 2,500 2,500 2,500PRCS Planning Total 124,369 119,946 129,150 134,040 129,950
Parks Maintenance20072202 71001 Regular Employee Salary 195,249 228,315 206,840 260,280 268,100
255
2014/2015 Actuals
2015/2016 Actuals
2016/2017 Budget
2016/2017 Estimated Actuals
2017/2018 Council ApprovedParks, Recreation and Cultural Services
20072202 71002 Overtime 4,015 4,432 3,780 3,780 4,00020072202 71003 Part-time Salary 103,884 101,445 109,260 109,260 97,41020072202 71007 Uniform Allowance 1,125 103 1,000 1,000 1,25020072202 71009 Incentive Pay 30 195 0 1,000 96020072202 71011 Workers Compensation 25,260 16,560 21,600 21,600 27,60020072202 71012 Medical Insurance 60,592 70,930 56,790 78,510 77,31020072202 71013 Dental Insurance 4,237 4,615 4,000 5,040 5,00020072202 71014 Vision Insurance 1,059 1,041 1,000 1,130 1,05020072202 71015 Medicare Insurance 3,629 3,956 4,550 4,550 5,47020072202 71021 Service Contribution-PERS 37,043 48,697 43,780 59,260 20,72020072202 71022 Unfunded Acc Liability - PERS 0 0 0 0 39,81020072202 71023 Deferred Comp 4,017 3,775 3,110 3,110 5,06020072202 71024 LI & AD & D 383 420 260 260 31020072202 71025 Unemployment Insurance 1,640 1,792 2,070 2,070 2,28020072202 71028 LTD 488 780 1,400 1,400 1,34020072202 71029 Chiropractic 254 347 240 470 50020072202 71030 Medical In-lieu 2,058 0 0 0 020072202 71031 Other Benefits 24,300 15,400 17,240 17,240 25,650
Salaries & Benefits Total 469,264 502,804 476,920 569,960 583,82020072202 72202 Telephone 331 263 250 250 1,00020072202 72203 Cellular phone charges 2,094 2,092 2,250 2,250 2,25020072202 72304 Laundry & Dry Cleaning 773 656 1,500 1,500 1,00020072202 72305 Uniforms 5,285 3,850 5,000 5,000 5,00020072202 72306 Safety Equipment 2,318 1,626 2,000 2,000 2,00020072202 72307 Office Supplies 0 370 0 0 020072202 72309 Membership & Dues 80 150 500 500 80020072202 72322 Rental of Equipment 0 0 750 750 50020072202 72352 Special Dept Materials 16,403 17,084 16,000 16,000 17,00020072202 72353 Janitorial Supplies 4,996 7,104 7,000 7,000 7,00020072202 72355 General Supplies 2,136 1,968 2,000 2,000 2,20020072202 72358 Training and Education 2,622 701 2,500 2,500 2,50020072202 72359 Small Tools and Equipment 4,316 2,197 2,000 2,000 2,20020072202 72376 Tuition Reimbursement 670 0 0 0 020072202 72450 Misc. Professional Services 10,623 19,778 15,000 15,000 16,00020072202 72499 Misc Contract Services 1,327 760 3,000 3,000 2,40020072202 72531 Repairs to Machines & Equip 2,888 7,575 7,500 7,500 8,00020072202 72534 Repairs to Buildings 2,713 8,204 7,500 7,500 3,000
Supplies & Services Total 59,574 74,379 74,750 74,750 72,85020072202 74070 PL & PD/Other Insurance 12,960 11,600 19,000 19,000 19,700
Insurances Total 12,960 11,600 19,000 19,000 19,700Parks Maintenance Total 541,798 588,782 570,670 663,710 676,370
Sports Facility Maintenance20072203 71001 Regular Employee Salary 237,121 165,197 201,750 231,930 236,18020072203 71002 Overtime 14,615 16,361 14,610 14,610 15,20020072203 71003 Part-time Salary 114,452 108,389 131,970 131,970 114,37020072203 71007 Uniform Allowance 1,281 24 1,000 1,000 1,25020072203 71009 Incentive Pay 1,459 1,431 1,440 970 96020072203 71011 Workers Compensation 21,050 24,840 21,600 21,600 27,60020072203 71012 Medical Insurance 75,852 38,271 57,220 54,360 52,92020072203 71013 Dental Insurance 5,363 3,110 4,000 4,540 5,00020072203 71014 Vision Insurance 1,341 695 1,000 1,130 1,05020072203 71015 Medicare Insurance 3,725 2,642 4,880 4,880 5,12020072203 71021 Service Contribution-PERS 42,990 33,550 44,250 51,660 18,27020072203 71022 Unfunded Acc Liability - PERS 0 0 0 0 35,11020072203 71023 Deferred Comp 4,193 4,270 4,970 4,970 4,55020072203 71024 LI & AD & D 490 290 260 260 31020072203 71025 Unemployment Insurance 1,888 1,507 2,090 2,090 2,16020072203 71028 LTD 573 567 1,400 1,400 1,18020072203 71029 Chiropractic 322 238 240 470 50020072203 71030 Medical In-lieu 3,977 0 0 0 020072203 71031 Other Benefits 20,250 23,100 17,240 17,240 25,650
Salaries & Benefits Total 550,941 424,481 509,920 545,080 547,380
256
2014/2015 Actuals
2015/2016 Actuals
2016/2017 Budget
2016/2017 Estimated Actuals
2017/2018 Council ApprovedParks, Recreation and Cultural Services
20072203 72202 Telephone 275 299 200 200 20020072203 72304 Laundry & Dry Cleaning 796 656 800 800 80020072203 72305 Uniforms 4,134 3,445 5,250 5,250 5,00020072203 72306 Safety Equipment 1,543 2,358 2,500 2,500 2,50020072203 72307 Office Supplies 0 86 100 100 10020072203 72309 Membership & Dues 325 0 300 300 45020072203 72322 Rental of Equipment 0 695 850 850 50020072203 72352 Special Dept Materials 38,122 38,912 35,000 35,000 32,50020072203 72353 Janitorial Supplies 3,208 5,100 5,000 5,000 5,60020072203 72355 General Supplies 996 1,362 1,000 1,000 1,10020072203 72358 Training and Education 80 555 2,000 2,000 1,00020072203 72359 Small Tools and Equipment 1,470 1,866 1,500 1,500 1,60020072203 72450 Misc. Professional Services 17,742 17,672 22,000 22,000 20,00020072203 72499 Misc Contract Services 24,314 16,063 20,000 20,000 20,00020072203 72531 Repairs to Machines & Equip 3,822 3,431 3,500 3,500 4,00020072203 72534 Repairs to Buildings 3,226 5,265 2,500 2,500 4,000
Supplies & Services Total 100,053 97,763 102,500 102,500 99,35020072203 74054 Long-term Disability 18,513 0 0 0 020072203 74070 PL & PD/Other Insurance 10,800 17,400 15,200 15,200 19,700
Insurances Total 29,313 17,400 15,200 15,200 19,700Sports Facility Maintenance Total 680,306 539,644 627,620 662,780 666,430
Lodi Lake Maintenance20072204 71001 Regular Employee Salary 69,223 122,993 132,780 43,420 53,12020072204 71002 Overtime 3,616 4,888 3,920 3,920 4,00020072204 71003 Part-time Salary 29,077 28,451 27,170 27,170 27,63020072204 71007 Uniform Allowance 375 194 750 750 25020072204 71009 Incentive Pay 4 0 0 0 020072204 71011 Workers Compensation 4,210 8,280 16,200 16,200 5,52020072204 71012 Medical Insurance 34,591 47,463 48,910 21,050 20,51020072204 71013 Dental Insurance 1,598 2,881 3,000 1,010 1,00020072204 71014 Vision Insurance 399 643 750 230 21020072204 71015 Medicare Insurance 1,483 2,253 2,340 2,340 1,06020072204 71021 Service Contribution-PERS 12,507 24,445 28,940 9,580 3,48020072204 71022 Unfunded Acc Liability - PERS 0 0 0 0 6,68020072204 71023 Deferred Comp 39 0 0 0 020072204 71024 LI & AD & D 145 258 200 200 6020072204 71025 Unemployment Insurance 537 827 890 890 46020072204 71028 LTD 173 423 920 920 23020072204 71029 Chiropractic 96 221 180 100 10020072204 71031 Other Benefits 4,050 7,700 12,930 12,930 5,130
Salaries & Benefits Total 162,123 251,921 279,880 140,710 129,44020072204 72306 Safety Equipment 872 1,035 600 600 80020072204 72322 Rental of Equipment 0 0 500 500 50020072204 72352 Special Dept Materials 9,236 9,475 7,000 7,000 8,00020072204 72353 Janitorial Supplies 3,487 717 2,500 2,500 3,00020072204 72355 General Supplies 624 1,051 1,000 1,000 1,20020072204 72359 Small Tools and Equipment 935 979 1,000 1,000 1,00020072204 72450 Misc. Professional Services 11,361 12,397 11,000 11,000 11,00020072204 72499 Misc Contract Services 1,217 1,139 1,500 1,500 1,30020072204 72531 Repairs to Machines & Equip 345 2,239 500 500 1,00020072204 72534 Repairs to Buildings 1,158 3,318 1,500 1,500 2,000
Supplies & Services Total 29,236 32,349 27,100 27,100 29,80020072204 74070 PL & PD/Other Insurance 2,160 5,800 11,400 11,400 3,940
Insurances Total 2,160 5,800 11,400 11,400 3,940Lodi Lake Maintenance Total 193,519 290,071 318,380 179,210 163,180
Equipment Maintenance20072300 71001 Regular Employee Salary 53,079 56,660 56,870 56,910 57,02020072300 71002 Overtime 0 0 390 390 020072300 71007 Uniform Allowance 250 0 250 250 25020072300 71011 Workers Compensation 4,210 4,140 5,400 5,400 5,52020072300 71012 Medical Insurance 21,085 20,607 20,510 20,690 20,51020072300 71013 Dental Insurance 1,028 1,005 1,000 1,010 1,00020072300 71014 Vision Insurance 257 224 250 230 210
257
2014/2015 Actuals
2015/2016 Actuals
2016/2017 Budget
2016/2017 Estimated Actuals
2017/2018 Council ApprovedParks, Recreation and Cultural Services
20072300 71015 Medicare Insurance 773 821 830 830 83020072300 71021 Service Contribution-PERS 9,584 11,266 12,360 12,460 4,39020072300 71022 Unfunded Acc Liability - PERS 0 0 0 0 8,44020072300 71023 Deferred Comp 1,592 1,688 1,690 1,690 1,71020072300 71024 LI & AD & D 91 92 70 70 6020072300 71025 Unemployment Insurance 292 306 310 310 31020072300 71028 LTD 133 194 400 400 29020072300 71029 Chiropractic 62 77 60 100 10020072300 71031 Other Benefits 4,050 3,850 4,310 4,310 5,130
Salaries & Benefits Total 96,486 100,930 104,700 105,050 105,77020072300 72304 Laundry & Dry Cleaning 834 864 800 800 86020072300 72306 Safety Equipment 43 104 300 300 24020072300 72307 Office Supplies 954 0 150 150 10020072300 72313 Information Systems Software 0 450 750 750 75020072300 72315 Conference Expense 389 0 0 0 020072300 72352 Special Dept Materials 14,966 13,716 15,000 15,000 15,00020072300 72353 Janitorial Supplies 30 0 0 0 6020072300 72355 General Supplies 2,589 2,638 5,000 5,000 3,00020072300 72358 Training and Education 0 1,650 300 300 30020072300 72359 Small Tools and Equipment 6,068 10,188 10,000 10,000 9,00020072300 72450 Misc. Professional Services 1,069 563 1,500 1,500 1,00020072300 72499 Misc Contract Services 1,316 576 1,200 1,200 1,00020072300 72531 Repairs to Machines & Equip 34,451 21,281 40,000 40,000 30,00020072300 72533 Repairs to Vehicles 48,131 57,883 50,000 50,000 63,03020072300 72534 Repairs to Buildings 0 26 750 750 50020072300 72536 Car Wash 151 56 150 150 7020072300 72550 Tires and Tubes 2,006 4,588 6,000 6,000 6,00020072300 72551 Motor Vehicle Fuel & Lube 62,030 43,573 60,000 60,000 27,53020072300 72990 Special Payments 0 240 0 0 0
Supplies & Services Total 175,026 158,398 191,900 191,900 158,44020072300 74070 PL & PD/Other Insurance 2,160 2,900 3,800 3,800 3,940
Insurances Total 2,160 2,900 3,800 3,800 3,940Equipment Maintenance Total 273,672 262,227 300,400 300,750 268,150
PRCS Recreation Administration20073001 71001 Regular Employee Salary 352,193 366,816 365,950 294,260 293,03020073001 71002 Overtime 339 93 0 0 18020073001 71010 Admin Leave Pay 1,936 6,943 10,870 10,870 8,03020073001 71011 Workers Compensation 25,260 24,840 32,400 32,400 27,60020073001 71012 Medical Insurance 98,972 99,949 98,240 79,630 77,73020073001 71013 Dental Insurance 6,155 6,048 6,000 6,060 5,00020073001 71014 Vision Insurance 1,539 1,351 1,500 1,260 1,05020073001 71015 Medicare Insurance 4,135 4,361 5,460 5,460 4,37020073001 71021 Service Contribution-PERS 62,458 72,397 79,770 63,900 22,46020073001 71022 Unfunded Acc Liability - PERS 0 0 0 0 43,16020073001 71023 Deferred Comp 7,665 8,179 7,100 7,100 6,70020073001 71024 LI & AD & D 3,825 2,574 2,550 2,550 1,98020073001 71025 Unemployment Insurance 1,888 1,980 2,010 2,010 1,61020073001 71028 LTD 858 1,254 2,560 2,560 1,47020073001 71029 Chiropractic 369 463 360 470 50020073001 71030 Medical In-lieu 3,977 0 0 0 020073001 71031 Other Benefits 24,300 23,100 25,860 25,860 25,65020073001 71032 Cell Stipend 2,408 2,412 2,400 2,400 1,800
Salaries & Benefits Total 598,278 622,758 643,030 536,790 522,32020073001 72201 Postage 4,012 3,361 4,500 4,500 4,50020073001 72202 Telephone 1,335 1,069 1,000 1,000 1,10020073001 72203 Cellular phone charges 1,176 1,218 750 750 50020073001 72301 Printing/Binding/Duplication 22,389 17,215 22,000 22,000 22,40020073001 72302 Photocopying 0 92 200 200 20020073001 72303 Advertising 3,433 1,489 1,200 1,200 1,40020073001 72304 Laundry & Dry Cleaning 673 352 500 500 50020073001 72305 Uniforms 0 0 300 300 500
258
2014/2015 Actuals
2015/2016 Actuals
2016/2017 Budget
2016/2017 Estimated Actuals
2017/2018 Council ApprovedParks, Recreation and Cultural Services
20073001 72306 Safety Equipment 0 200 260 260 60020073001 72307 Office Supplies 2,381 2,857 2,800 2,800 2,80020073001 72308 Books & Periodicals 55 481 210 210 40020073001 72309 Membership & Dues 995 770 1,200 1,200 1,40020073001 72313 Information Systems Software 750 2,108 1,250 1,250 1,25020073001 72314 Business Expense 529 49 300 300 30020073001 72315 Conference Expense 1,149 644 2,000 2,000 2,00020073001 72321 Rent of Land/Facilities 36,551 34,035 30,000 30,000 30,00020073001 72352 Special Dept Materials 1,358 1,867 1,000 1,000 1,00020073001 72353 Janitorial Supplies 476 552 500 500 60020073001 72355 General Supplies 934 2,096 1,200 1,200 1,00020073001 72356 Medical Supplies 0 0 100 100 10020073001 72358 Training and Education 572 178 500 500 1,40020073001 72359 Small Tools and Equipment 313 0 400 400 50020073001 72376 Tuition Reimbursement 0 461 1,000 1,000 1,00020073001 72399 Supplies & Services NOC 333 274 40 40 40020073001 72450 Misc. Professional Services 3,944 5,030 5,000 5,000 5,00020073001 72499 Misc Contract Services 4,944 13,173 7,500 7,500 7,50020073001 72532 Repairs to Office Equip 0 0 500 500 50020073001 72533 Repairs to Vehicles 5,840 3,437 6,390 6,390 4,16020073001 72534 Repairs to Buildings 276 518 1,500 1,500 1,00020073001 72536 Car Wash 112 126 120 120 15020073001 72551 Motor Vehicle Fuel & Lube 3,203 3,101 3,550 3,550 9,880
Supplies & Services Total 97,732 96,755 97,770 97,770 104,04020073001 74070 PL & PD/Other Insurance 12,960 17,400 22,800 22,800 19,700
Insurances Total 12,960 17,400 22,800 22,800 19,70020073001 76220 Operating Transfer Out 3,400 3,400 0 0 3,400
Operating Transfer Out Total 3,400 3,400 0 0 3,40020073001 77030 Machinery and equipment 0 9,084 400 400 4,500
Capital Total 0 9,084 400 400 4,500PRCS Recreation Administration Total 712,370 749,397 764,000 657,760 653,960
Child Care Programs20073100 71001 Regular Employee Salary 3,260 0 0 0 020073100 71003 Part-time Salary 120,400 161,564 194,240 194,240 236,35020073100 71015 Medicare Insurance 1,794 2,344 2,820 2,820 3,35020073100 71021 Service Contribution-PERS 0 69 0 0 020073100 71025 Unemployment Insurance 664 889 1,460 1,460 1,73020073100 71032 Cell Stipend 0 136 500 500 500
Salaries & Benefits Total 126,119 165,003 199,020 199,020 241,93020073100 72203 Cellular phone charges 444 202 500 500 50020073100 72301 Printing/Binding/Duplication 38 0 500 500 50020073100 72305 Uniforms 80 500 800 800 2,00020073100 72307 Office Supplies 593 29 100 100 25020073100 72313 Information Systems Software 0 112 400 400 50020073100 72322 Rental of Equipment 300 0 0 0 020073100 72355 General Supplies 28,995 31,013 40,000 40,000 40,00020073100 72359 Small Tools and Equipment 310 0 500 500 020073100 72450 Misc. Professional Services 822 1,939 2,000 2,000 2,000
Supplies & Services Total 31,581 33,794 44,800 44,800 45,750Child Care Programs Total 157,700 198,797 243,820 243,820 287,680
Camps20073102 71003 Part-time Salary 23,914 15,112 10,010 10,010 17,72020073102 71015 Medicare Insurance 347 219 150 150 25020073102 71025 Unemployment Insurance 132 83 80 80 130
Salaries & Benefits Total 24,393 15,414 10,240 10,240 18,10020073102 72305 Uniforms 0 300 700 700 1,00020073102 72313 Information Systems Software 0 112 0 0 020073102 72355 General Supplies 5,726 4,464 4,000 4,000 4,00020073102 72359 Small Tools and Equipment 0 0 400 400 1,60020073102 72450 Misc. Professional Services 2,858 135 0 0 020073102 72534 Repairs to Buildings 0 0 500 500 50020073102 72551 Motor Vehicle Fuel & Lube 41 15 200 200 250
Supplies & Services Total 8,624 5,026 5,800 5,800 7,350
259
2014/2015 Actuals
2015/2016 Actuals
2016/2017 Budget
2016/2017 Estimated Actuals
2017/2018 Council ApprovedParks, Recreation and Cultural Services
Camps Total 33,017 20,440 16,040 16,040 25,450LUSD-ASES
20073103 71001 Regular Employee Salary 9,382 219 0 0 020073103 71002 Overtime 0 126 0 0 020073103 71003 Part-time Salary 416,892 400,114 468,990 468,990 504,98020073103 71015 Medicare Insurance 6,187 5,813 6,800 6,800 7,17020073103 71021 Service Contribution-PERS 0 2,199 0 0 020073103 71025 Unemployment Insurance 2,295 2,205 3,520 3,520 3,71020073103 71032 Cell Stipend 511 445 600 600 600
Salaries & Benefits Total 435,267 411,121 479,910 479,910 516,46020073103 72202 Telephone 555 528 600 600 60020073103 72301 Printing/Binding/Duplication 0 0 100 100 10020073103 72305 Uniforms 1,511 1,550 2,500 2,500 5,00020073103 72307 Office Supplies 0 0 1,500 1,500 1,50020073103 72313 Information Systems Software 0 112 1,000 1,000 1,00020073103 72355 General Supplies 10,324 10,895 26,800 26,800 26,80020073103 72359 Small Tools and Equipment 593 0 500 500 50020073103 72450 Misc. Professional Services 1,881 1,200 2,000 2,000 2,00020073103 72536 Car Wash 0 0 150 150 150
Supplies & Services Total 14,864 14,285 35,150 35,150 37,650LUSD-ASES Total 450,131 425,405 515,060 515,060 554,110
Youth & Teen Sports20073202 71001 Regular Employee Salary 386 445 0 0 020073202 71003 Part-time Salary 103,925 100,460 101,450 101,450 98,40020073202 71015 Medicare Insurance 1,513 1,457 1,470 1,470 1,44020073202 71021 Service Contribution-PERS 1,195 0 0 0 020073202 71025 Unemployment Insurance 572 553 560 560 740
Salaries & Benefits Total 107,590 102,915 103,480 103,480 100,58020073202 72305 Uniforms 7,315 8,038 7,250 7,250 7,25020073202 72354 Photo Supplies 3,389 5,225 4,250 4,250 4,25020073202 72355 General Supplies 1,640 2,629 2,500 2,500 2,00020073202 72450 Misc. Professional Services 1,665 1,500 0 0 0
Supplies & Services Total 14,009 17,392 14,000 14,000 13,500Youth & Teen Sports Total 121,598 120,307 117,480 117,480 114,080
Adult Sports20073203 71003 Part-time Salary 24,412 14,462 39,180 39,180 29,00020073203 71015 Medicare Insurance 354 210 570 570 57020073203 71021 Service Contribution-PERS 0 0 290 290 020073203 71025 Unemployment Insurance 134 80 290 290 290
Salaries & Benefits Total 24,900 14,751 40,330 40,330 29,86020073203 72201 Postage 136 0 0 0 020073203 72202 Telephone 292 234 200 200 23020073203 72309 Membership & Dues 900 0 1,500 1,500 1,50020073203 72355 General Supplies 2,784 4,689 5,750 5,750 5,75020073203 72399 Supplies & Services NOC 0 780 0 0 0
Supplies & Services Total 4,112 5,703 7,450 7,450 7,48020073203 74075 City Rental Insurance 0 0 300 300 300
Insurances Total 0 0 300 300 300Adult Sports Total 29,012 20,454 48,080 48,080 37,640
General Activities & Events20073300 71003 Part-time Salary 4,059 3,818 14,230 14,770 2,50020073300 71015 Medicare Insurance 59 55 210 210 020073300 71025 Unemployment Insurance 22 21 80 80 0
Salaries & Benefits Total 4,140 3,895 14,520 15,060 2,50020073300 72202 Telephone 1,551 1,565 1,000 1,000 1,00020073300 72212 Gas 124 185 0 0 020073300 72301 Printing/Binding/Duplication 0 0 0 0 40020073300 72303 Advertising 0 3,689 6,600 6,600 75020073300 72305 Uniforms 0 0 500 500 020073300 72307 Office Supplies 0 0 500 500 020073300 72322 Rental of Equipment 0 350 0 0 60020073300 72355 General Supplies 810 13,834 16,500 16,500 1,00020073300 72359 Small Tools and Equipment 0 0 0 0 300
260
2014/2015 Actuals
2015/2016 Actuals
2016/2017 Budget
2016/2017 Estimated Actuals
2017/2018 Council ApprovedParks, Recreation and Cultural Services
20073300 72450 Misc. Professional Services 60 1,235 6,000 6,000 2,00020073300 72499 Misc Contract Services 102 105 4,000 4,000 1,500
Supplies & Services Total 2,646 20,963 35,100 35,100 7,550General Activities & Events Total 6,785 24,858 49,620 50,160 10,050
Blakely20073402 71001 Regular Employee Salary 100 6 0 0 020073402 71003 Part-time Salary 127,613 90,099 113,400 113,400 115,91020073402 71015 Medicare Insurance 1,852 1,306 1,640 1,640 1,64020073402 71025 Unemployment Insurance 702 496 620 620 850
Salaries & Benefits Total 130,267 91,907 115,660 115,660 118,40020073402 72202 Telephone 671 532 0 0 020073402 72305 Uniforms 0 0 400 400 1,00020073402 72306 Safety Equipment 0 0 1,000 1,000 1,00020073402 72307 Office Supplies 0 0 250 250 25020073402 72308 Books & Periodicals 0 0 150 150 15020073402 72309 Membership & Dues 0 0 100 100 10020073402 72352 Special Dept Materials 0 50 0 0 020073402 72355 General Supplies 116 1,385 3,000 3,000 3,00020073402 72358 Training and Education 380 0 0 0 020073402 72450 Misc. Professional Services 0 466 1,000 1,000 1,000
Supplies & Services Total 1,167 2,433 5,900 5,900 6,500Blakely Total 131,433 94,340 121,560 121,560 124,900
Arts & Specialty Classes20073500 71001 Regular Employee Salary 34 76 0 0 020073500 71003 Part-time Salary 47,117 55,189 56,010 56,010 56,94020073500 71015 Medicare Insurance 684 801 810 810 83020073500 71025 Unemployment Insurance 259 304 310 310 430
Salaries & Benefits Total 48,094 56,370 57,130 57,130 58,20020073500 72303 Advertising 1,305 497 500 500 50020073500 72312 Bank Service Charges 1,263 1,181 1,500 1,500 1,50020073500 72355 General Supplies 80 0 100 100 20020073500 72359 Small Tools and Equipment (92) 566 730 730 60020073500 72450 Misc. Professional Services 106,434 88,382 100,000 100,000 100,000
Supplies & Services Total 108,990 90,626 102,830 102,830 102,800Arts & Specialty Classes Total 157,084 146,997 159,960 159,960 161,000
Lodi Lake Programs20073600 71001 Regular Employee Salary 26,950 43,858 46,590 47,820 46,88020073600 71002 Overtime 0 200 1,700 1,700 1,70020073600 71003 Part-time Salary 34,465 17,811 29,380 29,380 29,38020073600 71011 Workers Compensation 4,210 4,140 5,400 5,400 5,52020073600 71012 Medical Insurance 8,139 7,897 7,890 8,170 7,89020073600 71013 Dental Insurance 699 1,002 1,000 1,010 1,00020073600 71014 Vision Insurance 175 223 250 230 21020073600 71015 Medicare Insurance 896 906 1,110 1,110 68020073600 71021 Service Contribution-PERS 7,536 8,792 10,120 10,480 3,59020073600 71022 Unfunded Acc Liability - PERS 0 0 0 0 6,91020073600 71024 LI & AD & D 61 91 70 70 10020073600 71025 Unemployment Insurance 331 337 420 420 26020073600 71028 LTD 67 151 320 320 23020073600 71029 Chiropractic 42 77 60 100 10020073600 71031 Other Benefits 4,050 3,850 4,310 4,310 5,13020073600 71032 Cell Stipend 387 600 600 600 600
Salaries & Benefits Total 88,007 89,936 109,220 111,120 110,18020073600 72301 Printing/Binding/Duplication 289 2,420 3,000 3,000 3,00020073600 72303 Advertising 0 0 600 600 20020073600 72304 Laundry & Dry Cleaning 13 0 0 0 020073600 72305 Uniforms 87 262 500 500 50020073600 72306 Safety Equipment 0 13 150 150 15020073600 72307 Office Supplies 0 0 250 250 25020073600 72314 Business Expense 25 0 200 200 20020073600 72352 Special Dept Materials 153 92 1,000 1,000 1,60020073600 72353 Janitorial Supplies 54 25 0 0 40020073600 72355 General Supplies 1,226 1,573 1,500 1,500 1,600
261
2014/2015 Actuals
2015/2016 Actuals
2016/2017 Budget
2016/2017 Estimated Actuals
2017/2018 Council ApprovedParks, Recreation and Cultural Services
20073600 72359 Small Tools and Equipment 270 272 300 300 30020073600 72450 Misc. Professional Services 1,289 1,680 1,800 1,800 1,60020073600 72499 Misc Contract Services 2,861 479 3,000 3,000 3,00020073600 72531 Repairs to Machines & Equip 762 229 0 0 1,00020073600 72534 Repairs to Buildings 557 583 0 0 600
Supplies & Services Total 7,585 7,628 12,300 12,300 14,40020073600 74070 PL & PD/Other Insurance 2,160 2,900 3,800 3,800 3,940
Insurances Total 2,160 2,900 3,800 3,800 3,940Lodi Lake Programs Total 97,752 100,464 125,320 127,220 128,520
Parks, Recreation and Cultural Services Total 5,363,631 5,712,615 6,558,638 6,318,530 6,160,970
262
LIBRARY The Lodi Public Library provides library services to the Lodi community. It is funded by the General Fund, Library fines and fees and donations. The Department’s budget is $1,527,940 in FY 2017/18, compared to $1,362,400 as originally budgeted in FY 2016/17. The 2016/17 budget shown in the following pages reflects adjustments made throughout the year. FY 2017/18 budgeted staffing is being reduced by 2 to 7 positions. One of reduced positions is moving to the Fire Department. An organizational chart, staffing summary, detailed activity descriptions and financial tables are included in the following pages.
263
(This page intentionally left blank)
264
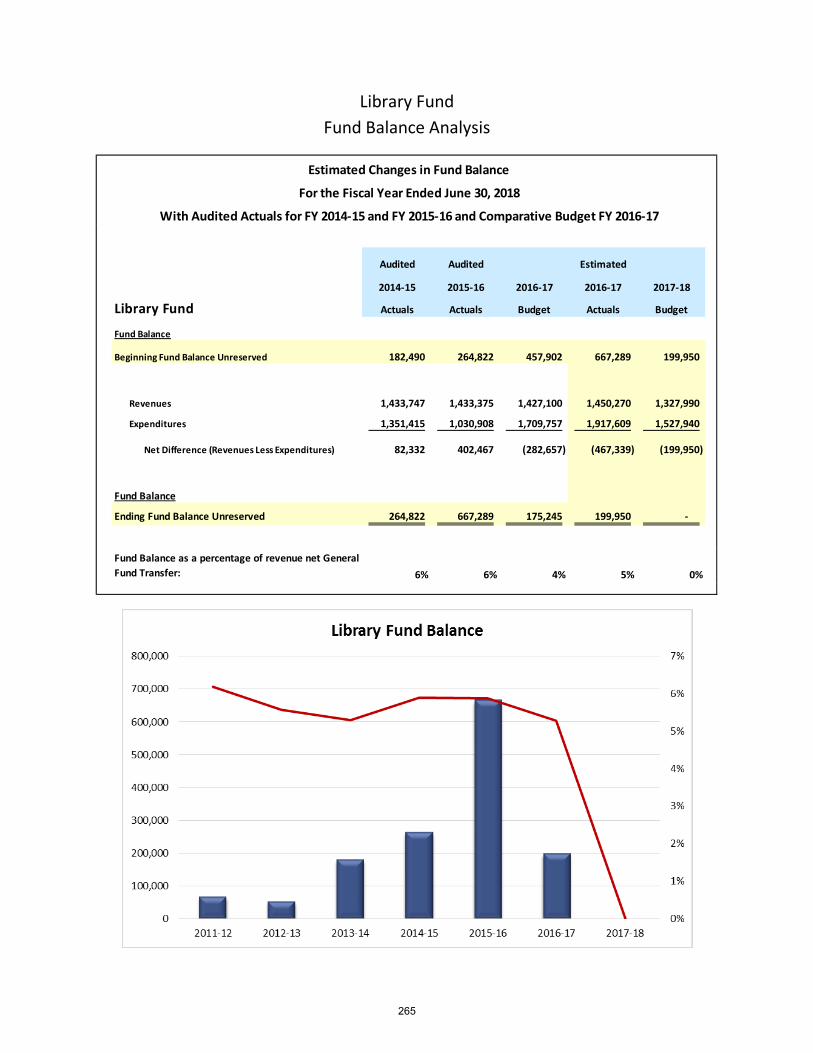
Library Fund Fund Balance Analysis
Audited Audited Estimated
2014-15 2015-16 2016-17 2016-17 2017-18
Library Fund Actuals Actuals Budget Actuals Budget
Fund Balance
Beginning Fund Balance Unreserved 182,490 264,822 457,902 667,289 199,950
Revenues 1,433,747 1,433,375 1,427,100 1,450,270 1,327,990
Expenditures 1,351,415 1,030,908 1,709,757 1,917,609 1,527,940
Net Difference (Revenues Less Expenditures) 82,332 402,467 (282,657) (467,339) (199,950)
Fund Balance
Ending Fund Balance Unreserved 264,822 667,289 175,245 199,950 -
6% 6% 4% 5% 0%
Estimated Changes in Fund Balance
For the Fiscal Year Ended June 30, 2018
With Audited Actuals for FY 2014-15 and FY 2015-16 and Comparative Budget FY 2016-17
Fund Balance as a percentage of revenue net General Fund Transfer:
265
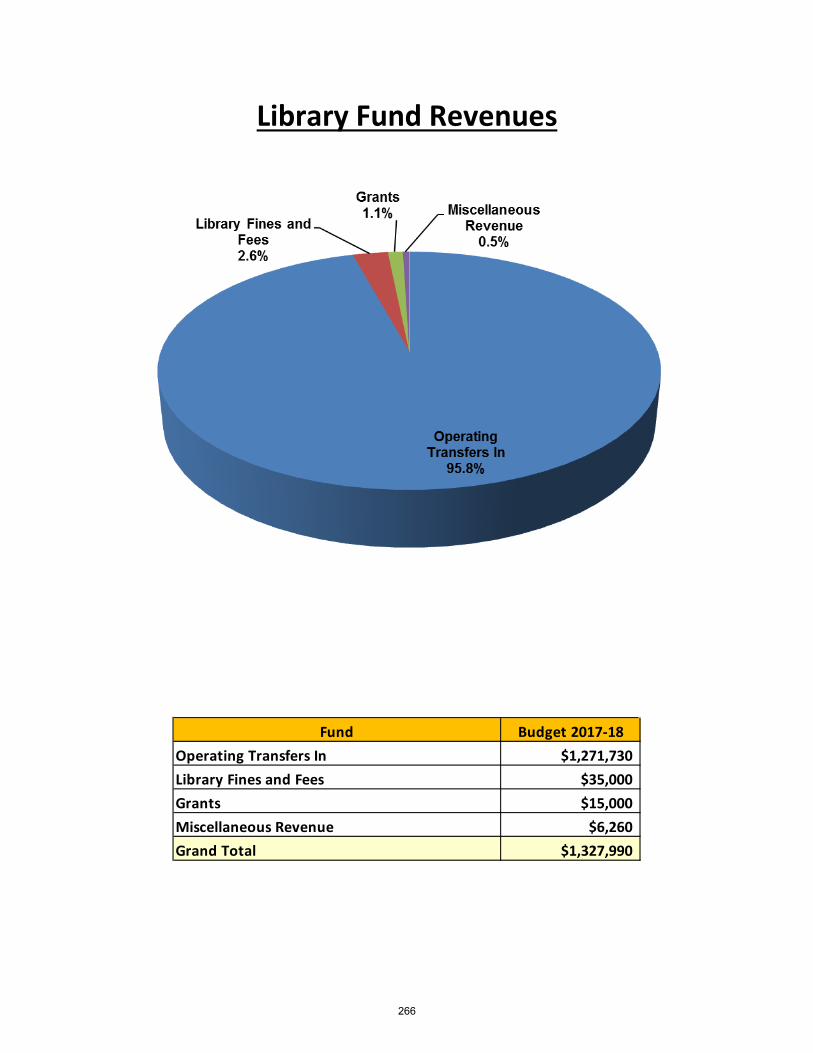
Library Fund Revenues
Fund Budget 2017-18Operating Transfers In $1,271,730Library Fines and Fees $35,000Grants $15,000Miscellaneous Revenue $6,260Grand Total $1,327,990
266
2014/2015 Actuals
2015/2016 Actuals
2016/2017 Budget
2016/2017 Estimated Actuals
2017/2018 Council Approved
12000000 57702 Donations 6,440 1,170 0 1,170 1,00041000000 57702 Donations (28,890) 189,391 0 0 0
Charges for Services Total (22,450) 190,561 0 1,170 1,00012000000 53210 Library Fines and Fees 43,456 62,908 35,000 35,000 35,000
Fines/Forfeiths & Penalites Total 43,456 62,908 35,000 35,000 35,00012000000 54332 Investment Earnings 1,148 5,075 2,360 2,360 4,26012000000 54361 Rent 1,825 1,320 1,000 2,000 1,000
From Use of Money/Property Total 2,973 6,395 3,360 4,360 5,26012000000 50001 Operating Transfer In 1,360,823 1,349,180 1,373,740 1,373,740 1,271,73041000000 50001 Operating Transfer In 0 152,000 0 0 0
Interfund Credit Total 1,360,823 1,501,180 1,373,740 1,373,740 1,271,73012000000 56451 Library Literacy Grant 19,670 13,472 15,000 36,000 15,000
Intergovernmental Rev Total 19,670 13,472 15,000 36,000 15,00012000000 55024 Revenue-Other 385 250 0 0 0
Miscellaneous Revenue Total 385 250 0 0 0Total Library Revenue 1,404,857 1,774,766 1,427,100 1,450,270 1,327,990
Library Revenue
267
(This page intentionally left blank)
268
Num
ber o
f Pos
ition
sAu
thor
ized
: 7
FY 2
017-
2018
Libr
ary
Serv
ices
D
irect
or(1
)
Publ
ic
Serv
ices
Supp
ort
Serv
ices
Libr
ary
Tech
nici
an(1
)
Lite
racy
/Vol
unte
erM
anag
er(1
)
Sen
ior L
ibra
ry
Ass
ista
nt(3
)
Libr
ary
Assi
stan
t(1
)
269
2014/2015 Actuals
2015/2016 Actuals
2016/2017 Budget
2016/2017 Estimated Actuals
2017/2018 Council Approved
Salaries 667,421 558,400 641,270 581,410 553,280PERS - Normal Costs 98,545 86,718 113,080 101,260 31,330PERS - UAL 0 0 0 0 67,970Other Benefits 256,328 201,748 252,250 216,580 174,140Supplies & Services 267,471 277,035 310,731 276,000 271,700Insurances 21,600 29,000 38,000 38,000 31,520Operating Transfer Out 48,000 200,000 48,000 48,000 48,000Capital Projects 0 15,897 306,426 622,000 350,000
Total Library 1,359,366 1,368,798 1,709,757 1,883,250 1,527,940
STAFFING SUMMARY
2014/15 2015/16 2016/17 2017/18Positions Positions Positions Positions
LIBRARYAdministrative Secretary 0 1 1 0Librarian 2 2 2 0Library Assistant 3 2 1 1Library Services Director 1 1 1 1Library Services Manager 1 0 0 0Library Technician 0 0 0 1Literacy/Volunteer Manager 1 1 1 1Senior Administrative Clerk 1 0 0 0Senior Library Assistant 2 3 3 3Library Total 11 10 9 7
Library
270
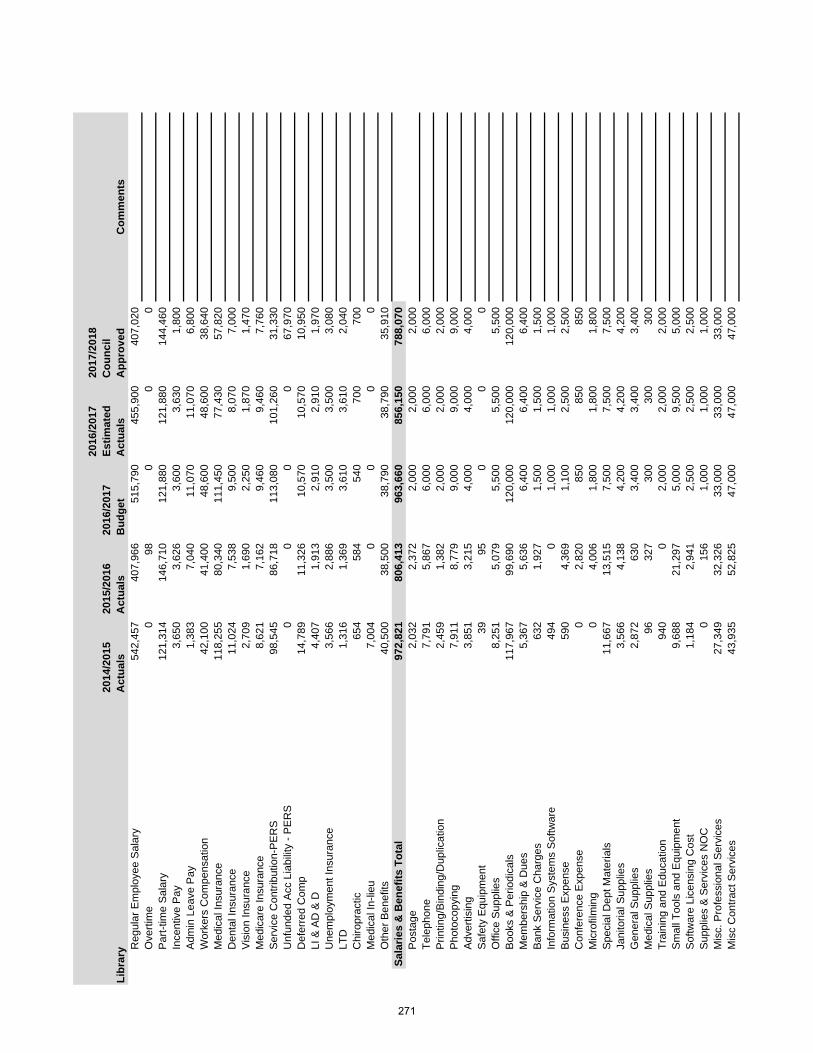
2014
/201
5 A
ctua
ls20
15/2
016
Act
uals
2016
/201
7 B
udge
t
2016
/201
7 Es
timat
ed
Act
uals
2017
/201
8 C
ounc
il A
ppro
ved
Com
men
tsR
egul
ar E
mpl
oyee
Sal
ary
542,
457
407,
966
515,
790
455,
900
407,
020
Ove
rtim
e 0
980
00
Par
t-tim
e S
alar
y 12
1,31
414
6,71
012
1,88
012
1,88
014
4,46
0In
cent
ive
Pay
3,
650
3,62
63,
600
3,63
01,
800
Adm
in L
eave
Pay
1,
383
7,04
011
,070
11,0
706,
800
Wor
kers
Com
pens
atio
n 42
,100
41,4
0048
,600
48,6
0038
,640
Med
ical
Insu
ranc
e 11
8,25
580
,340
111,
450
77,4
3057
,820
Den
tal I
nsur
ance
11
,024
7,53
89,
500
8,07
07,
000
Vis
ion
Insu
ranc
e 2,
709
1,69
02,
250
1,87
01,
470
Med
icar
e In
sura
nce
8,62
17,
162
9,46
09,
460
7,76
0S
ervi
ce C
ontri
butio
n-P
ER
S
98,5
4586
,718
113,
080
101,
260
31,3
30U
nfun
ded
Acc
Lia
bilit
y - P
ER
S
00
00
67,9
70D
efer
red
Com
p 14
,789
11,3
2610
,570
10,5
7010
,950
LI &
AD
& D
4,
407
1,91
32,
910
2,91
01,
970
Une
mpl
oym
ent I
nsur
ance
3,
566
2,88
63,
500
3,50
03,
080
LTD
1,
316
1,36
93,
610
3,61
02,
040
Chi
ropr
actic
65
458
454
070
070
0M
edic
al In
-lieu
7,
004
00
00
Oth
er B
enef
its
40,5
0038
,500
38,7
9038
,790
35,9
10Sa
larie
s &
Ben
efits
Tot
al97
2,82
180
6,41
396
3,66
085
6,15
078
8,07
0P
osta
ge
2,03
22,
372
2,00
02,
000
2,00
0Te
leph
one
7,79
15,
867
6,00
06,
000
6,00
0P
rintin
g/B
indi
ng/D
uplic
atio
n 2,
459
1,38
22,
000
2,00
02,
000
Pho
toco
pyin
g 7,
911
8,77
99,
000
9,00
09,
000
Adv
ertis
ing
3,85
13,
215
4,00
04,
000
4,00
0S
afet
y E
quip
men
t 39
950
00
Offi
ce S
uppl
ies
8,25
15,
079
5,50
05,
500
5,50
0B
ooks
& P
erio
dica
ls
117,
967
99,6
9012
0,00
012
0,00
012
0,00
0M
embe
rshi
p &
Due
s 5,
367
5,63
66,
400
6,40
06,
400
Ban
k S
ervi
ce C
harg
es
632
1,92
71,
500
1,50
01,
500
Info
rmat
ion
Sys
tem
s S
oftw
are
494
01,
000
1,00
01,
000
Bus
ines
s E
xpen
se
590
4,36
91,
100
2,50
02,
500
Con
fere
nce
Exp
ense
0
2,82
085
085
085
0M
icro
film
ing
04,
006
1,80
01,
800
1,80
0S
peci
al D
ept M
ater
ials
11
,667
13,5
157,
500
7,50
07,
500
Jani
toria
l Sup
plie
s 3,
566
4,13
84,
200
4,20
04,
200
Gen
eral
Sup
plie
s 2,
872
630
3,40
03,
400
3,40
0M
edic
al S
uppl
ies
9632
730
030
030
0Tr
aini
ng a
nd E
duca
tion
940
02,
000
2,00
02,
000
Sm
all T
ools
and
Equ
ipm
ent
9,68
821
,297
5,00
09,
500
5,00
0S
oftw
are
Lice
nsin
g C
ost
1,18
42,
941
2,50
02,
500
2,50
0S
uppl
ies
& S
ervi
ces
NO
C
015
61,
000
1,00
01,
000
Mis
c. P
rofe
ssio
nal S
ervi
ces
27,3
4932
,326
33,0
0033
,000
33,0
00M
isc
Con
tract
Ser
vice
s 43
,935
52,8
2547
,000
47,0
0047
,000
Libr
ary
271
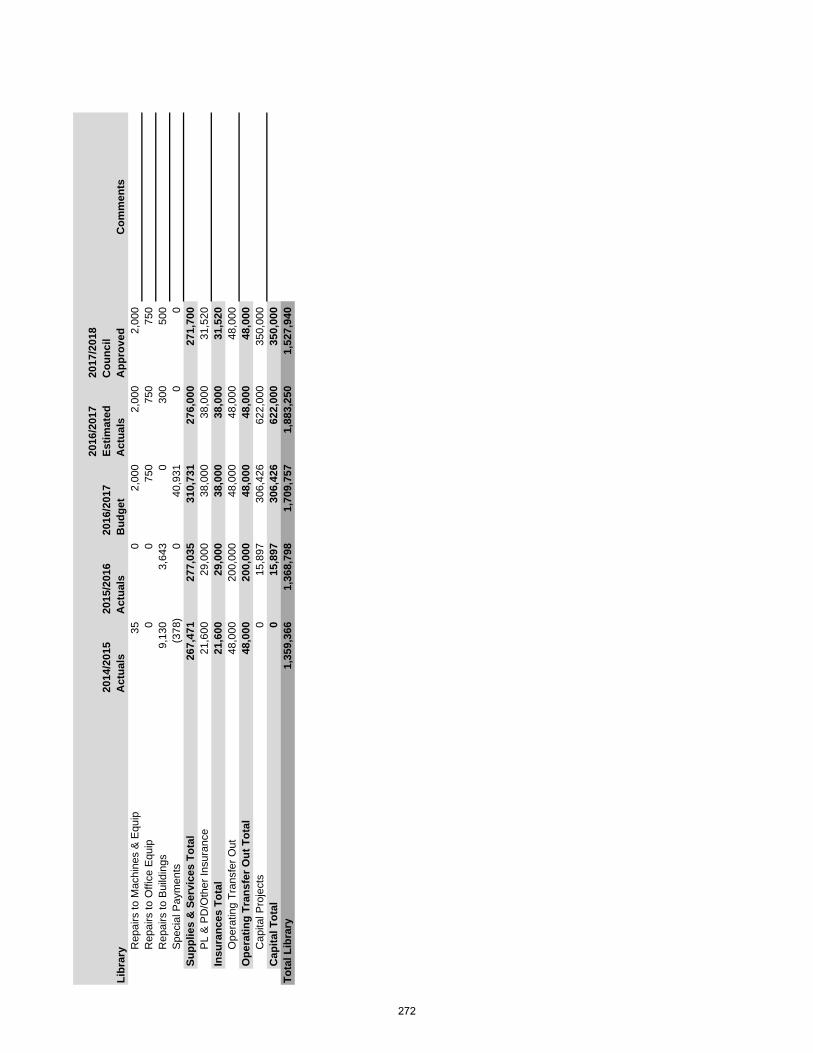
2014
/201
5 A
ctua
ls20
15/2
016
Act
uals
2016
/201
7 B
udge
t
2016
/201
7 Es
timat
ed
Act
uals
2017
/201
8 C
ounc
il A
ppro
ved
Com
men
tsLi
brar
y Rep
airs
to M
achi
nes
& E
quip
35
02,
000
2,00
02,
000
Rep
airs
to O
ffice
Equ
ip
00
750
750
750
Rep
airs
to B
uild
ings
9,
130
3,64
30
300
500
Spe
cial
Pay
men
ts
(378
)0
40,9
310
0Su
pplie
s &
Ser
vice
s To
tal
267,
471
277,
035
310,
731
276,
000
271,
700
PL
& P
D/O
ther
Insu
ranc
e 21
,600
29,0
0038
,000
38,0
0031
,520
Insu
ranc
es T
otal
21,6
0029
,000
38,0
0038
,000
31,5
20O
pera
ting
Tran
sfer
Out
48
,000
200,
000
48,0
0048
,000
48,0
00O
pera
ting
Tran
sfer
Out
Tot
al48
,000
200,
000
48,0
0048
,000
48,0
00C
apita
l Pro
ject
s0
15,8
9730
6,42
662
2,00
035
0,00
0C
apita
l Tot
al0
15,8
9730
6,42
662
2,00
035
0,00
0To
tal L
ibra
r y1,
359,
366
1,36
8,79
81,
709,
757
1,88
3,25
01,
527,
940
272
LEISURE AND CULTURAL SERVICES ACTIVITY: Administration and Public Services DIVISION: Library DEPARTMENT: Library FUND: Library Fund ACTIVITY DESCRIPTION Library Administration and Technical Services provide general administrative direction to the department to ensure that library collections and programs meet the needs of users. Library Public Services helps the Lodi community meet its needs for educational and recreational materials by providing comprehensive and efficient library service. These activities include:
• Provide direction to staff to achieve goals and objectives, and develop policies and procedures to improve effectiveness and efficiency.
• Provide a variety of current and relevant materials, both online and physical, to meet customer needs.
• Provide library facilities that are comfortable, inviting, and well-equipped for reading, information access, and holding meetings.
• Increase visibility and support of the library through marketing and public relations partnerships. • Seek, apply for, and receive grant funding to enhance library services. • Provide access to information through library personnel, current technologies, computers, and library
collections. SERVICE LEVEL ADJUSTMENTS
• Eliminated one Librarian position. • Eliminated one Administrative Secretary position (position moved to Fire Department).
MAJOR 2016-17 ACCOMPLISHMENTS
• Completed new Homework Help Tutoring Center. • Launched fundraising for the construction of a new Teen Scene area. • Completed purchase and installation of a new eBook system.
MAJOR 2017-18 OBJECTIVES
• Construct Teen Scene area. • Add Link+ access to patrons. • New library roof.
PERFORMANCE MEASURES 2014-15 2015-16 2016-17 Library visits, virtual and onsite 326,022 307,194 297,564 Volunteer hours 29,000 30,567 30,124 Materials checked out 216,597 195,915 192,711 RELATED COST CENTER(S)
• 12090000
273
LEISURE AND CULTURAL SERVICES ACTIVITY: Library Board of Trustees DIVISION: Library DEPARTMENT: Library FUND: Library Fund ACTIVITY DESCRIPTION The Library Board of Trustees governs operation of the Library. It is responsible for working with the City Council and the California legislature to ensure full funding for operations now and into the future. The Trustees speak for the citizens of the community regarding their needs for library services. This activity has five major elements:
• Ensure well-planned and well-maintained Library services and facilities. • Advocate for Library funding at all jurisdictional levels. • Ensure adequate funding for Library services. • Ensure well-organized and responsive Library programs. • Provide community input for Library planning.
MAJOR 2016-17 ACCOMPLISHMENTS
• Completed a $304,000 new Homework Help Tutoring Center. • Maintain open communication channels with library staff, Friends, and Foundation Boards.
MAJOR 2017-18 OBJECTIVES
• Ensure financial stability of the library. • Complete the expansion of the Teen Scene.
RELATED COST CENTER(S)
• 12090000
274
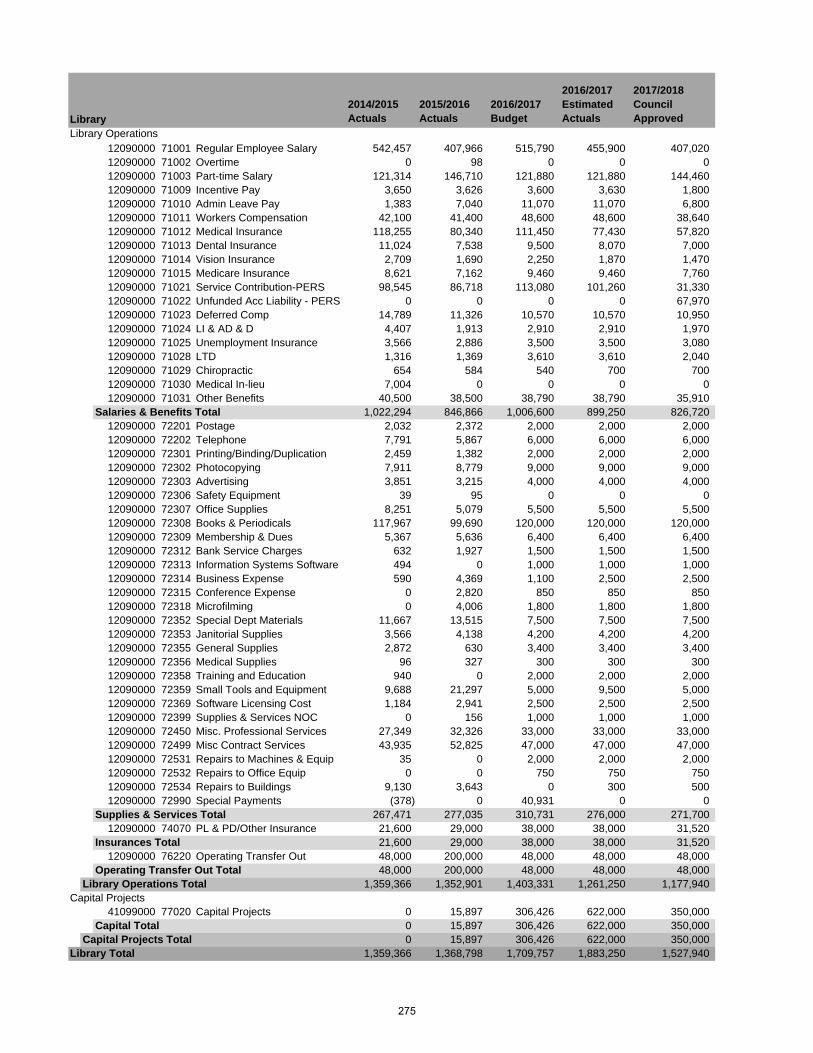
2014/2015 Actuals
2015/2016 Actuals
2016/2017 Budget
2016/2017 Estimated Actuals
2017/2018 Council Approved
Library Operations12090000 71001 Regular Employee Salary 542,457 407,966 515,790 455,900 407,02012090000 71002 Overtime 0 98 0 0 012090000 71003 Part-time Salary 121,314 146,710 121,880 121,880 144,46012090000 71009 Incentive Pay 3,650 3,626 3,600 3,630 1,80012090000 71010 Admin Leave Pay 1,383 7,040 11,070 11,070 6,80012090000 71011 Workers Compensation 42,100 41,400 48,600 48,600 38,64012090000 71012 Medical Insurance 118,255 80,340 111,450 77,430 57,82012090000 71013 Dental Insurance 11,024 7,538 9,500 8,070 7,00012090000 71014 Vision Insurance 2,709 1,690 2,250 1,870 1,47012090000 71015 Medicare Insurance 8,621 7,162 9,460 9,460 7,76012090000 71021 Service Contribution-PERS 98,545 86,718 113,080 101,260 31,33012090000 71022 Unfunded Acc Liability - PERS 0 0 0 0 67,97012090000 71023 Deferred Comp 14,789 11,326 10,570 10,570 10,95012090000 71024 LI & AD & D 4,407 1,913 2,910 2,910 1,97012090000 71025 Unemployment Insurance 3,566 2,886 3,500 3,500 3,08012090000 71028 LTD 1,316 1,369 3,610 3,610 2,04012090000 71029 Chiropractic 654 584 540 700 70012090000 71030 Medical In-lieu 7,004 0 0 0 012090000 71031 Other Benefits 40,500 38,500 38,790 38,790 35,910
Salaries & Benefits Total 1,022,294 846,866 1,006,600 899,250 826,72012090000 72201 Postage 2,032 2,372 2,000 2,000 2,00012090000 72202 Telephone 7,791 5,867 6,000 6,000 6,00012090000 72301 Printing/Binding/Duplication 2,459 1,382 2,000 2,000 2,00012090000 72302 Photocopying 7,911 8,779 9,000 9,000 9,00012090000 72303 Advertising 3,851 3,215 4,000 4,000 4,00012090000 72306 Safety Equipment 39 95 0 0 012090000 72307 Office Supplies 8,251 5,079 5,500 5,500 5,50012090000 72308 Books & Periodicals 117,967 99,690 120,000 120,000 120,00012090000 72309 Membership & Dues 5,367 5,636 6,400 6,400 6,40012090000 72312 Bank Service Charges 632 1,927 1,500 1,500 1,50012090000 72313 Information Systems Software 494 0 1,000 1,000 1,00012090000 72314 Business Expense 590 4,369 1,100 2,500 2,50012090000 72315 Conference Expense 0 2,820 850 850 85012090000 72318 Microfilming 0 4,006 1,800 1,800 1,80012090000 72352 Special Dept Materials 11,667 13,515 7,500 7,500 7,50012090000 72353 Janitorial Supplies 3,566 4,138 4,200 4,200 4,20012090000 72355 General Supplies 2,872 630 3,400 3,400 3,40012090000 72356 Medical Supplies 96 327 300 300 30012090000 72358 Training and Education 940 0 2,000 2,000 2,00012090000 72359 Small Tools and Equipment 9,688 21,297 5,000 9,500 5,00012090000 72369 Software Licensing Cost 1,184 2,941 2,500 2,500 2,50012090000 72399 Supplies & Services NOC 0 156 1,000 1,000 1,00012090000 72450 Misc. Professional Services 27,349 32,326 33,000 33,000 33,00012090000 72499 Misc Contract Services 43,935 52,825 47,000 47,000 47,00012090000 72531 Repairs to Machines & Equip 35 0 2,000 2,000 2,00012090000 72532 Repairs to Office Equip 0 0 750 750 75012090000 72534 Repairs to Buildings 9,130 3,643 0 300 50012090000 72990 Special Payments (378) 0 40,931 0 0
Supplies & Services Total 267,471 277,035 310,731 276,000 271,70012090000 74070 PL & PD/Other Insurance 21,600 29,000 38,000 38,000 31,520
Insurances Total 21,600 29,000 38,000 38,000 31,52012090000 76220 Operating Transfer Out 48,000 200,000 48,000 48,000 48,000
Operating Transfer Out Total 48,000 200,000 48,000 48,000 48,000Library Operations Total 1,359,366 1,352,901 1,403,331 1,261,250 1,177,940
Capital Projects41099000 77020 Capital Projects 0 15,897 306,426 622,000 350,000
Capital Total 0 15,897 306,426 622,000 350,000Capital Projects Total 0 15,897 306,426 622,000 350,000
Library Total 1,359,366 1,368,798 1,709,757 1,883,250 1,527,940
Library
275

(This page intentionally left blank)
276
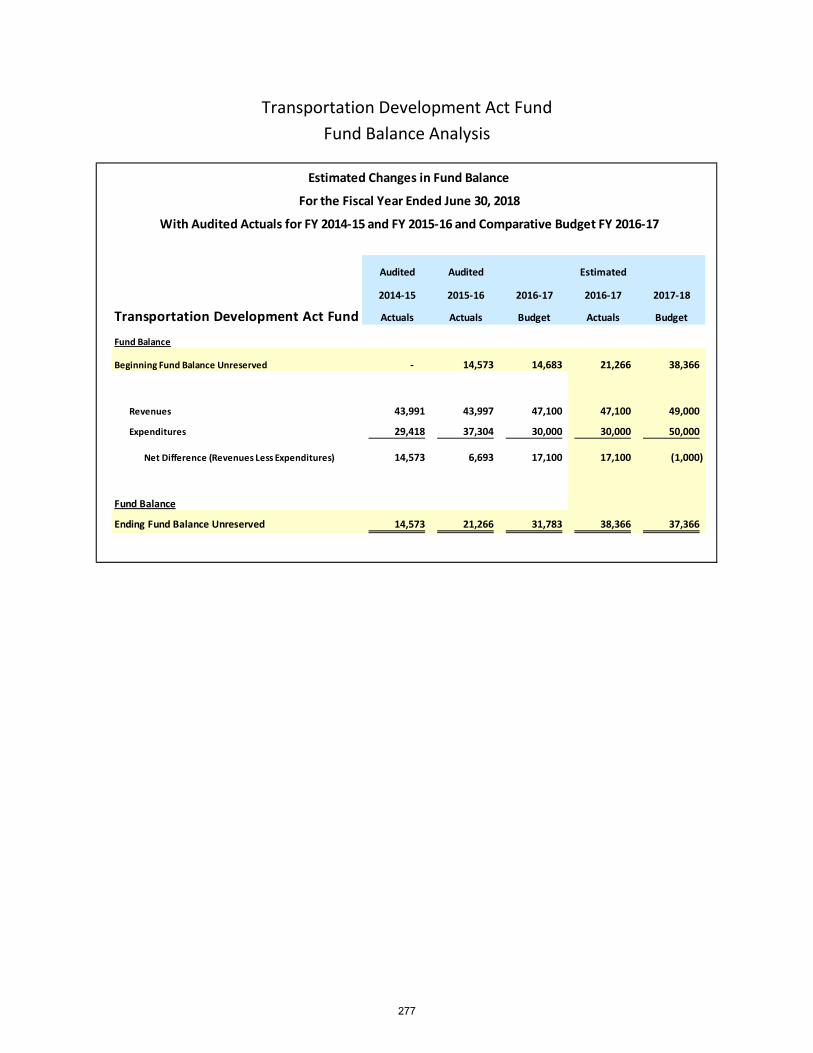
Transportation Development Act Fund Fund Balance Analysis
Audited Audited Estimated
2014-15 2015-16 2016-17 2016-17 2017-18
Transportation Development Act Fund Actuals Actuals Budget Actuals Budget
Fund Balance
Beginning Fund Balance Unreserved - 14,573 14,683 21,266 38,366
Revenues 43,991 43,997 47,100 47,100 49,000
Expenditures 29,418 37,304 30,000 30,000 50,000
Net Difference (Revenues Less Expenditures) 14,573 6,693 17,100 17,100 (1,000)
Fund Balance
Ending Fund Balance Unreserved 14,573 21,266 31,783 38,366 37,366
Estimated Changes in Fund Balance
For the Fiscal Year Ended June 30, 2018
With Audited Actuals for FY 2014-15 and FY 2015-16 and Comparative Budget FY 2016-17
277

2014/2015 Actuals
2015/2016 Actuals
2016/2017 Budget
2016/2017 Estimated Actuals
2017/2018 Council Approved
33100000 54332 Investment Earnings (120) (74) 0 0 0From Use of Money/Property Total (120) (74) 0 0 0
33100000 56001 Trans Dev Act-Ped/Bike 44,111 44,071 47,100 47,100 49,000Intergovernmental Rev Total 44,111 44,071 47,100 47,100 49,000
Total Transportation Development Act Revenue 43,991 43,997 47,100 47,100 49,000
Transportation Development Act Revenue
278
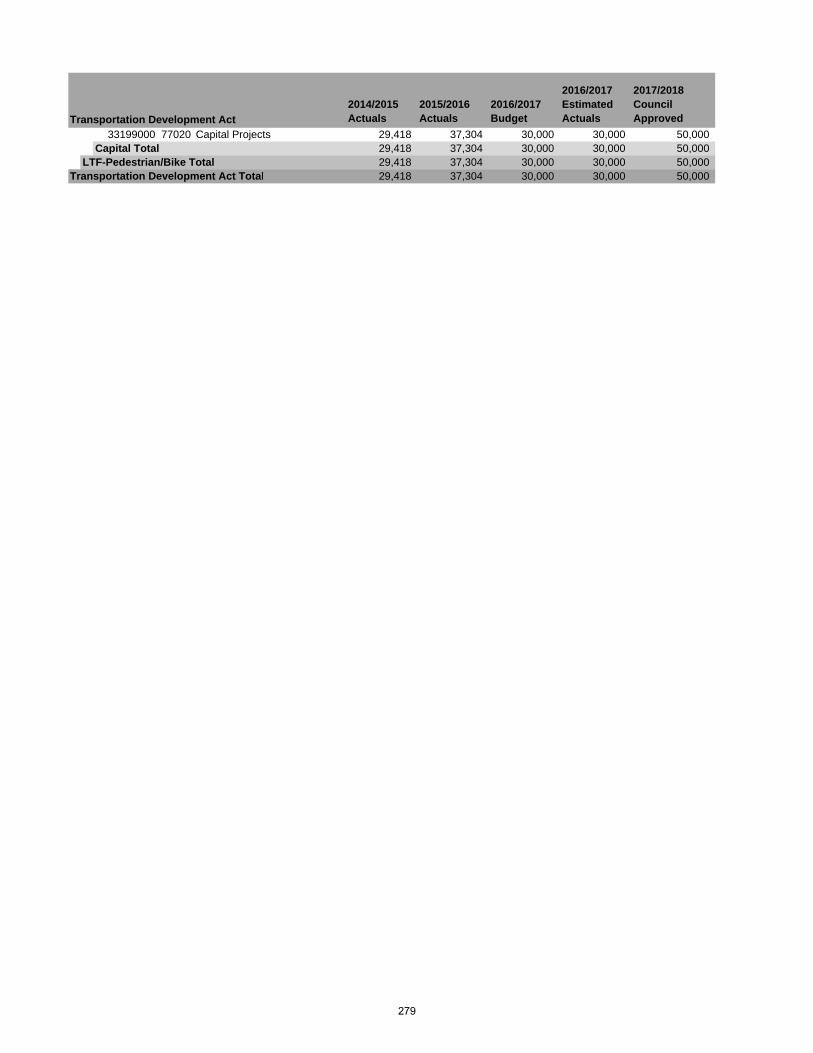
2014/2015 Actuals
2015/2016 Actuals
2016/2017 Budget
2016/2017 Estimated Actuals
2017/2018 Council Approved
33199000 77020 Capital Projects 29,418 37,304 30,000 30,000 50,000Capital Total 29,418 37,304 30,000 30,000 50,000
LTF-Pedestrian/Bike Total 29,418 37,304 30,000 30,000 50,000Transportation Development Act Total 29,418 37,304 30,000 30,000 50,000
Transportation Development Act
279

(This page intentionally left blank)
280
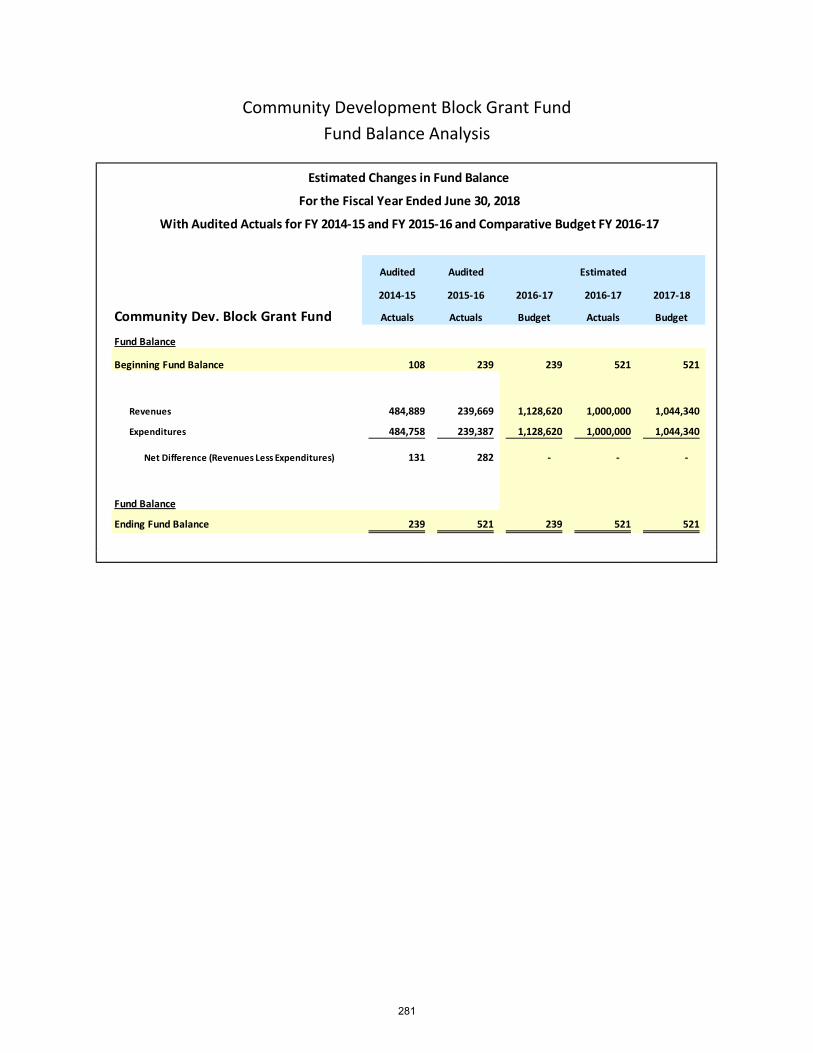
Community Development Block Grant Fund Fund Balance Analysis
Audited Audited Estimated
2014-15 2015-16 2016-17 2016-17 2017-18
Community Dev. Block Grant Fund Actuals Actuals Budget Actuals Budget
Fund Balance
Beginning Fund Balance 108 239 239 521 521
Revenues 484,889 239,669 1,128,620 1,000,000 1,044,340
Expenditures 484,758 239,387 1,128,620 1,000,000 1,044,340
Net Difference (Revenues Less Expenditures) 131 282 - - -
Fund Balance
Ending Fund Balance 239 521 239 521 521
For the Fiscal Year Ended June 30, 2018
With Audited Actuals for FY 2014-15 and FY 2015-16 and Comparative Budget FY 2016-17
Estimated Changes in Fund Balance
281
2014/2015 Actuals
2015/2016 Actuals
2016/2017 Budget
2016/2017 Estimated Actuals
2017/2018 Council Approved
36200000 54332 Investment Earnings 131 282 0 0 0From Use of Money/Property Total 131 282 0 0 0
35000000 56304 Comm Dev Block Grants 484,758 239,387 1,128,620 1,000,000 1,044,34036200000 56300 Home Funds 0 0 0 24,380 0
Intergovernmental Rev Total 484,758 239,387 1,128,620 1,024,380 1,044,340Total Community Development Block Grant Revenue 484,889 239,669 1,128,620 1,024,380 1,044,340
Community Development Block Grant Revenue
282
GENERAL GOVERNMENT ACTIVITY: Capital Improvement Project(s) FUND: Community Development DEPARTMENT: Community Development Block Grant Fund Capital Improvement Project Descriptions: Miscellaneous CDBG Capital Outlay Projects for FY 2017/2018 631,970 Blakely Swim Complex Ph. 1 ($150,000); Alley Improvement Project ($125,000); Administrative Costs ($122,800); One-Eighty Youth Façade Improvements ($78,900); City Hall/Carnegie ADA ($53,180); Lodi GRIP Support ($45,090); Graffiti Abatement ($32,000); Gracy & Mercy ADA Improvements ($10,000); LOEL Center Meals on Wheels ($7,500); and Second Harvest Food Programs ($7,500).
Miscellaneous CDBG Capital Outlay Projects Carried Forward from FY 2016/2017
412,370
Housing Rehab Program ($135,000); FTHB ($125,000); TSA Transitional Housing ($100,000); Housing Authority Phase IV ($27,000); and Grace & Mercy ($25,370).
283

2014/2015 Actuals
2015/2016 Actuals
2016/2017 Budget
2016/2017 Estimated Actuals
2017/2018 Council Approved
35099000 77020 Capital Projects 484,758 239,387 1,128,620 1,000,000 1,044,340Capital Total 484,758 239,387 1,128,620 1,000,000 1,044,340
CDBG Programs Total 484,758 239,387 1,128,620 1,000,000 1,044,340Community Development Block Grants Total 484,758 239,387 1,128,620 1,000,000 1,044,340
Community Development Block Grant
284
Public Safety Special Revenue Fund Fund Balance Analysis
Audited Audited Estimated
2014-15 2015-16 2016-17 2016-17 2017-18
Public Safety Special Revenue Fund Actuals Actuals Budget Actuals Budget
Fund Balance
Beginning Fund Balance Unreserved 271,213 249,258 328,048 474,399 233,296
Revenues 267,799 433,506 1,280,367 1,237,367 358,030
Expenditures 289,754 208,365 1,478,473 1,478,470 270,500
Net Difference (Revenues Less Expenditures) (21,955) 225,141 (198,106) (241,103) 87,530
Fund Balance
Ending Fund Balance Unreserved 249,258 474,399 129,942 233,296 320,826
For the Fiscal Year Ended June 30, 2018
With Audited Actuals for FY 2014-15 and FY 2015-16 and Comparative Budget FY 2016-17
Estimated Changes in Fund Balance
285
2014/2015 Actuals
2015/2016 Actuals
2016/2017 Budget
2016/2017 Estimated Actuals
2017/2018 Council Approved
21500000 53203 Overparking 0 0 3,000 0 0Fines/Forfeiths & Penalites Total 0 0 3,000 0 0
21000000 54332 Investment Earnings 376 804 0 0 021100000 54332 Investment Earnings 6 12 0 0 021200000 54332 Investment Earnings 95 283 0 0 021300000 54332 Investment Earnings 828 2,928 1,700 1,700 2,03021500000 54332 Investment Earnings (8) 0 0 0 0
From Use of Money/Property Total 1,297 4,028 1,700 1,700 2,03021000000 56503 Asset Forfeiture-County 5,899 1,729 0 0 10,00021200000 56400 Local Law Enforce-Block 9,846 40,522 39,780 39,780 40,00021300000 56422 Police State Safety Grant (853) 230,090 100,000 100,000 100,00021400000 56421 State Special Grants 170,139 124,861 170,000 130,000 135,00021600000 56421 State Special Grants 0 0 364,000 364,000 25,00021700000 56423 CalGRIP 78,589 0 0 0 021900000 56401 Police Other Grants 0 32,569 39,500 39,500 46,000
Intergovernmental Rev Total 263,621 429,771 713,280 673,280 356,00021200000 55025 Revenue Over/Short 2,401 0 0 0 021300000 55025 Revenue Over/Short 188 0 0 0 0
Miscellaneous Revenue Total 2,589 0 0 0 021399000 50005 Loan Proceeds 0 0 562,387 562,387 0
Other Financing Source Total 0 0 562,387 562,387 0Total Public Safety Special Revenue 267,506 433,798 1,280,367 1,237,367 358,030
Public Safety Special Revenue
286
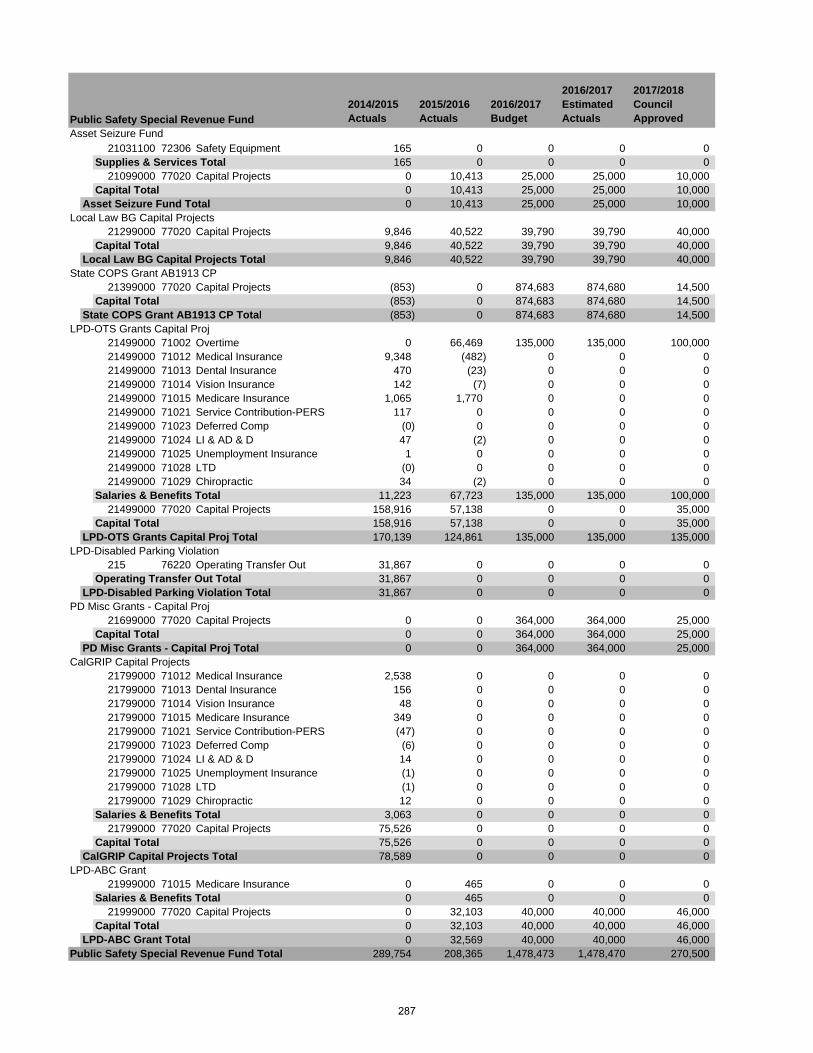
2014/2015 Actuals
2015/2016 Actuals
2016/2017 Budget
2016/2017 Estimated Actuals
2017/2018 Council Approved
Asset Seizure Fund21031100 72306 Safety Equipment 165 0 0 0 0
Supplies & Services Total 165 0 0 0 021099000 77020 Capital Projects 0 10,413 25,000 25,000 10,000
Capital Total 0 10,413 25,000 25,000 10,000Asset Seizure Fund Total 0 10,413 25,000 25,000 10,000
Local Law BG Capital Projects21299000 77020 Capital Projects 9,846 40,522 39,790 39,790 40,000
Capital Total 9,846 40,522 39,790 39,790 40,000Local Law BG Capital Projects Total 9,846 40,522 39,790 39,790 40,000
State COPS Grant AB1913 CP21399000 77020 Capital Projects (853) 0 874,683 874,680 14,500
Capital Total (853) 0 874,683 874,680 14,500State COPS Grant AB1913 CP Total (853) 0 874,683 874,680 14,500
LPD-OTS Grants Capital Proj21499000 71002 Overtime 0 66,469 135,000 135,000 100,00021499000 71012 Medical Insurance 9,348 (482) 0 0 021499000 71013 Dental Insurance 470 (23) 0 0 021499000 71014 Vision Insurance 142 (7) 0 0 021499000 71015 Medicare Insurance 1,065 1,770 0 0 021499000 71021 Service Contribution-PERS 117 0 0 0 021499000 71023 Deferred Comp (0) 0 0 0 021499000 71024 LI & AD & D 47 (2) 0 0 021499000 71025 Unemployment Insurance 1 0 0 0 021499000 71028 LTD (0) 0 0 0 021499000 71029 Chiropractic 34 (2) 0 0 0
Salaries & Benefits Total 11,223 67,723 135,000 135,000 100,00021499000 77020 Capital Projects 158,916 57,138 0 0 35,000
Capital Total 158,916 57,138 0 0 35,000LPD-OTS Grants Capital Proj Total 170,139 124,861 135,000 135,000 135,000
LPD-Disabled Parking Violation215 76220 Operating Transfer Out 31,867 0 0 0 0
Operating Transfer Out Total 31,867 0 0 0 0LPD-Disabled Parking Violation Total 31,867 0 0 0 0
PD Misc Grants - Capital Proj21699000 77020 Capital Projects 0 0 364,000 364,000 25,000
Capital Total 0 0 364,000 364,000 25,000PD Misc Grants - Capital Proj Total 0 0 364,000 364,000 25,000
CalGRIP Capital Projects21799000 71012 Medical Insurance 2,538 0 0 0 021799000 71013 Dental Insurance 156 0 0 0 021799000 71014 Vision Insurance 48 0 0 0 021799000 71015 Medicare Insurance 349 0 0 0 021799000 71021 Service Contribution-PERS (47) 0 0 0 021799000 71023 Deferred Comp (6) 0 0 0 021799000 71024 LI & AD & D 14 0 0 0 021799000 71025 Unemployment Insurance (1) 0 0 0 021799000 71028 LTD (1) 0 0 0 021799000 71029 Chiropractic 12 0 0 0 0
Salaries & Benefits Total 3,063 0 0 0 021799000 77020 Capital Projects 75,526 0 0 0 0
Capital Total 75,526 0 0 0 0CalGRIP Capital Projects Total 78,589 0 0 0 0
LPD-ABC Grant21999000 71015 Medicare Insurance 0 465 0 0 0
Salaries & Benefits Total 0 465 0 0 021999000 77020 Capital Projects 0 32,103 40,000 40,000 46,000
Capital Total 0 32,103 40,000 40,000 46,000LPD-ABC Grant Total 0 32,569 40,000 40,000 46,000
Public Safety Special Revenue Fund Total 289,754 208,365 1,478,473 1,478,470 270,500
Public Safety Special Revenue Fund
287

(This page intentionally left blank)
288
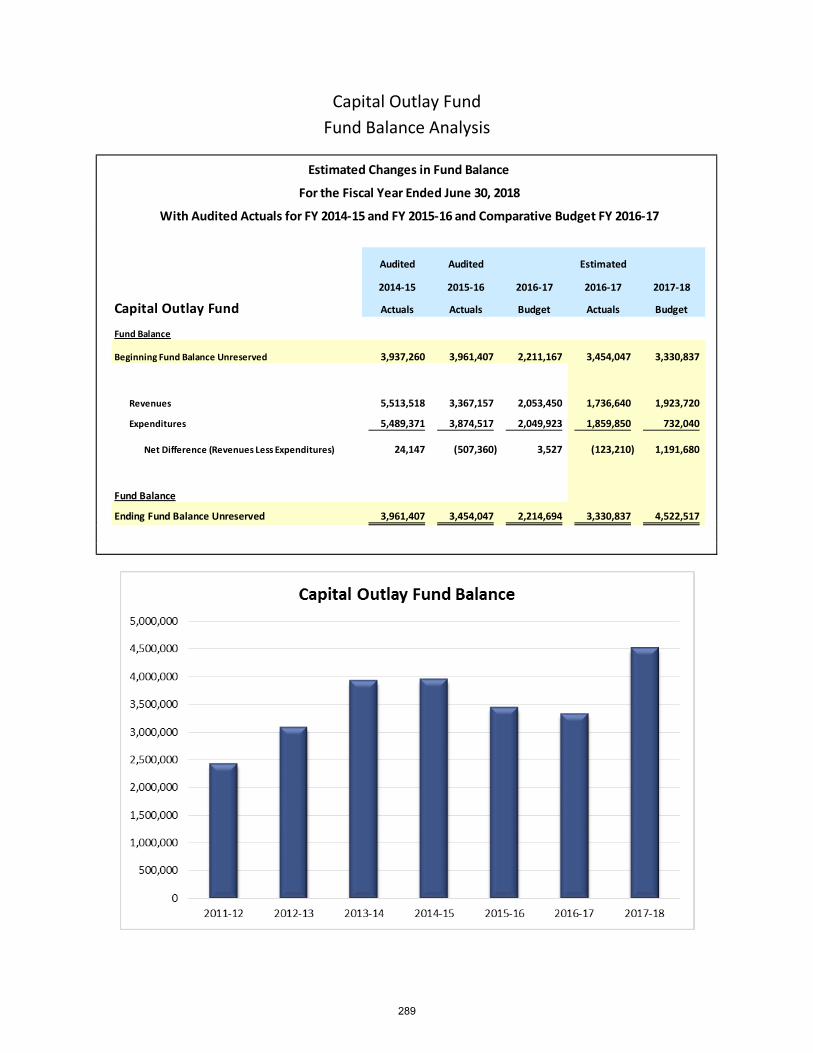
Capital Outlay Fund Fund Balance Analysis
Audited Audited Estimated
2014-15 2015-16 2016-17 2016-17 2017-18
Capital Outlay Fund Actuals Actuals Budget Actuals Budget
Fund Balance
Beginning Fund Balance Unreserved 3,937,260 3,961,407 2,211,167 3,454,047 3,330,837
Revenues 5,513,518 3,367,157 2,053,450 1,736,640 1,923,720
Expenditures 5,489,371 3,874,517 2,049,923 1,859,850 732,040
Net Difference (Revenues Less Expenditures) 24,147 (507,360) 3,527 (123,210) 1,191,680
Fund Balance
Ending Fund Balance Unreserved 3,961,407 3,454,047 2,214,694 3,330,837 4,522,517
For the Fiscal Year Ended June 30, 2018
With Audited Actuals for FY 2014-15 and FY 2015-16 and Comparative Budget FY 2016-17
Estimated Changes in Fund Balance
289
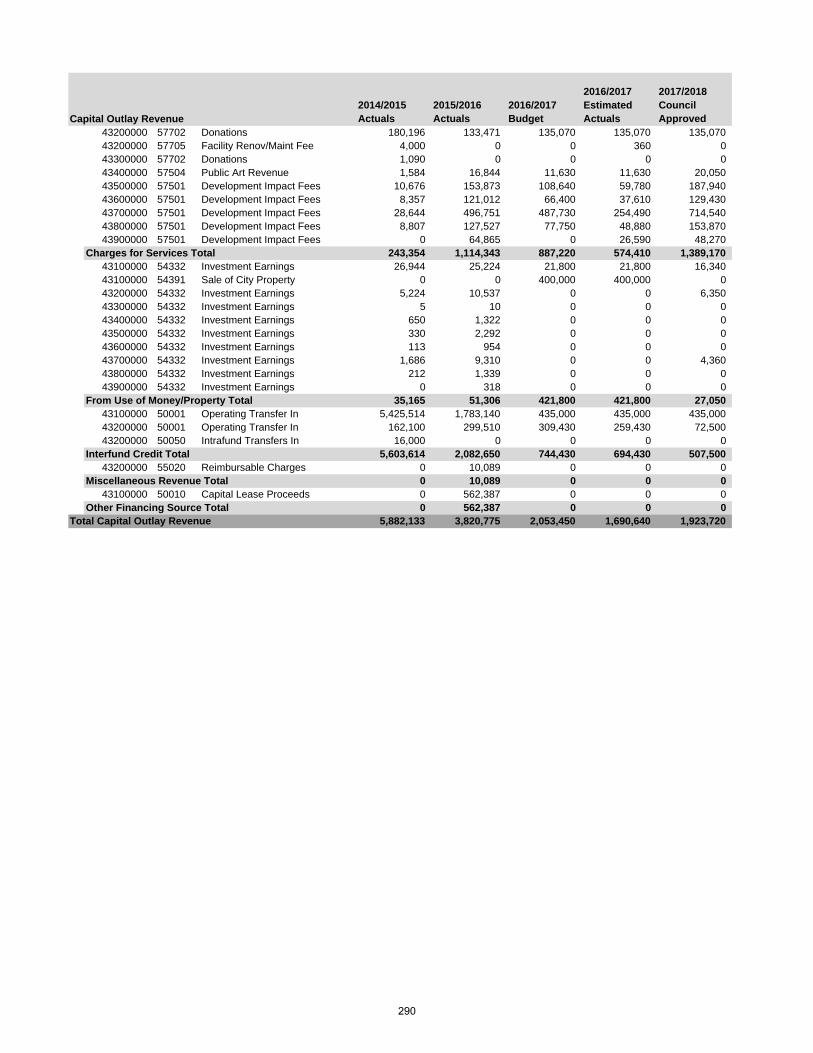
2014/2015 Actuals
2015/2016 Actuals
2016/2017 Budget
2016/2017 Estimated Actuals
2017/2018 Council Approved
43200000 57702 Donations 180,196 133,471 135,070 135,070 135,07043200000 57705 Facility Renov/Maint Fee 4,000 0 0 360 043300000 57702 Donations 1,090 0 0 0 043400000 57504 Public Art Revenue 1,584 16,844 11,630 11,630 20,05043500000 57501 Development Impact Fees 10,676 153,873 108,640 59,780 187,94043600000 57501 Development Impact Fees 8,357 121,012 66,400 37,610 129,43043700000 57501 Development Impact Fees 28,644 496,751 487,730 254,490 714,54043800000 57501 Development Impact Fees 8,807 127,527 77,750 48,880 153,87043900000 57501 Development Impact Fees 0 64,865 0 26,590 48,270
Charges for Services Total 243,354 1,114,343 887,220 574,410 1,389,17043100000 54332 Investment Earnings 26,944 25,224 21,800 21,800 16,34043100000 54391 Sale of City Property 0 0 400,000 400,000 043200000 54332 Investment Earnings 5,224 10,537 0 0 6,35043300000 54332 Investment Earnings 5 10 0 0 043400000 54332 Investment Earnings 650 1,322 0 0 043500000 54332 Investment Earnings 330 2,292 0 0 043600000 54332 Investment Earnings 113 954 0 0 043700000 54332 Investment Earnings 1,686 9,310 0 0 4,36043800000 54332 Investment Earnings 212 1,339 0 0 043900000 54332 Investment Earnings 0 318 0 0 0
From Use of Money/Property Total 35,165 51,306 421,800 421,800 27,05043100000 50001 Operating Transfer In 5,425,514 1,783,140 435,000 435,000 435,00043200000 50001 Operating Transfer In 162,100 299,510 309,430 259,430 72,50043200000 50050 Intrafund Transfers In 16,000 0 0 0 0
Interfund Credit Total 5,603,614 2,082,650 744,430 694,430 507,50043200000 55020 Reimbursable Charges 0 10,089 0 0 0
Miscellaneous Revenue Total 0 10,089 0 0 043100000 50010 Capital Lease Proceeds 0 562,387 0 0 0
Other Financing Source Total 0 562,387 0 0 0Total Capital Outlay Revenue 5,882,133 3,820,775 2,053,450 1,690,640 1,923,720
Capital Outlay Revenue
290
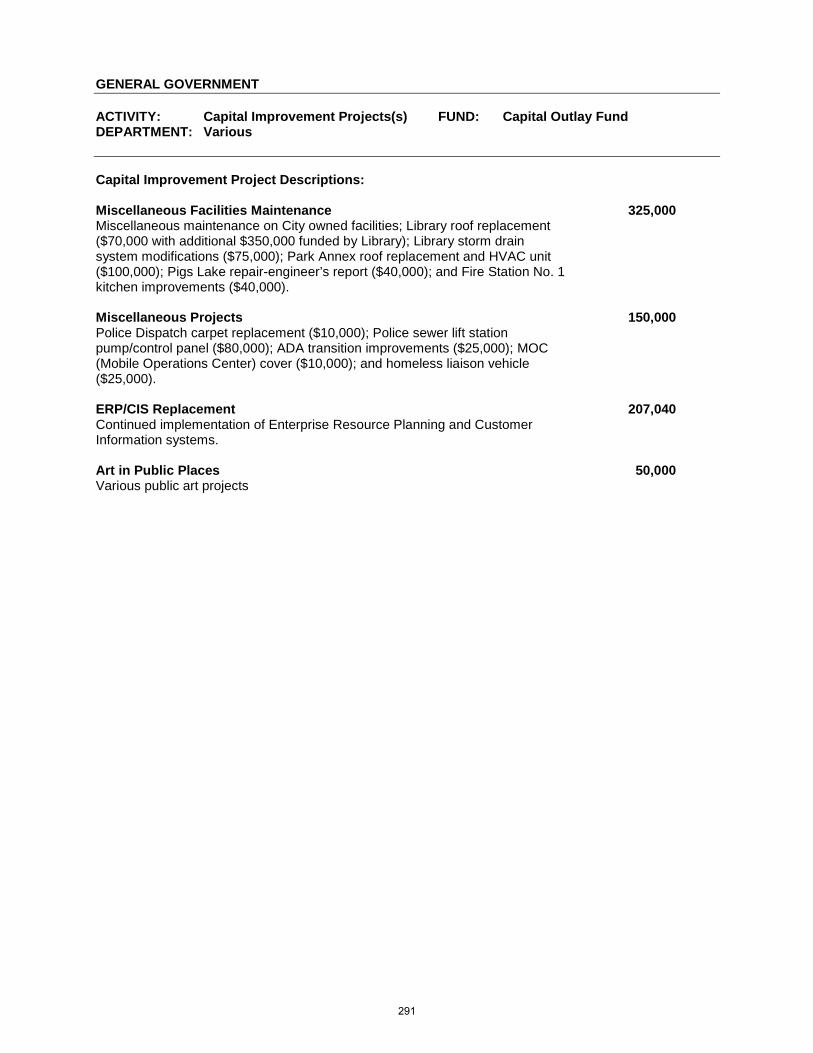
GENERAL GOVERNMENT ACTIVITY: Capital Improvement Projects(s) FUND: Capital Outlay Fund DEPARTMENT: Various Capital Improvement Project Descriptions: Miscellaneous Facilities Maintenance 325,000 Miscellaneous maintenance on City owned facilities; Library roof replacement ($70,000 with additional $350,000 funded by Library); Library storm drain system modifications ($75,000); Park Annex roof replacement and HVAC unit ($100,000); Pigs Lake repair-engineer’s report ($40,000); and Fire Station No. 1 kitchen improvements ($40,000).
Miscellaneous Projects 150,000 Police Dispatch carpet replacement ($10,000); Police sewer lift station pump/control panel ($80,000); ADA transition improvements ($25,000); MOC (Mobile Operations Center) cover ($10,000); and homeless liaison vehicle ($25,000).
ERP/CIS Replacement 207,040 Continued implementation of Enterprise Resource Planning and Customer Information systems.
Art in Public Places 50,000 Various public art projects
291
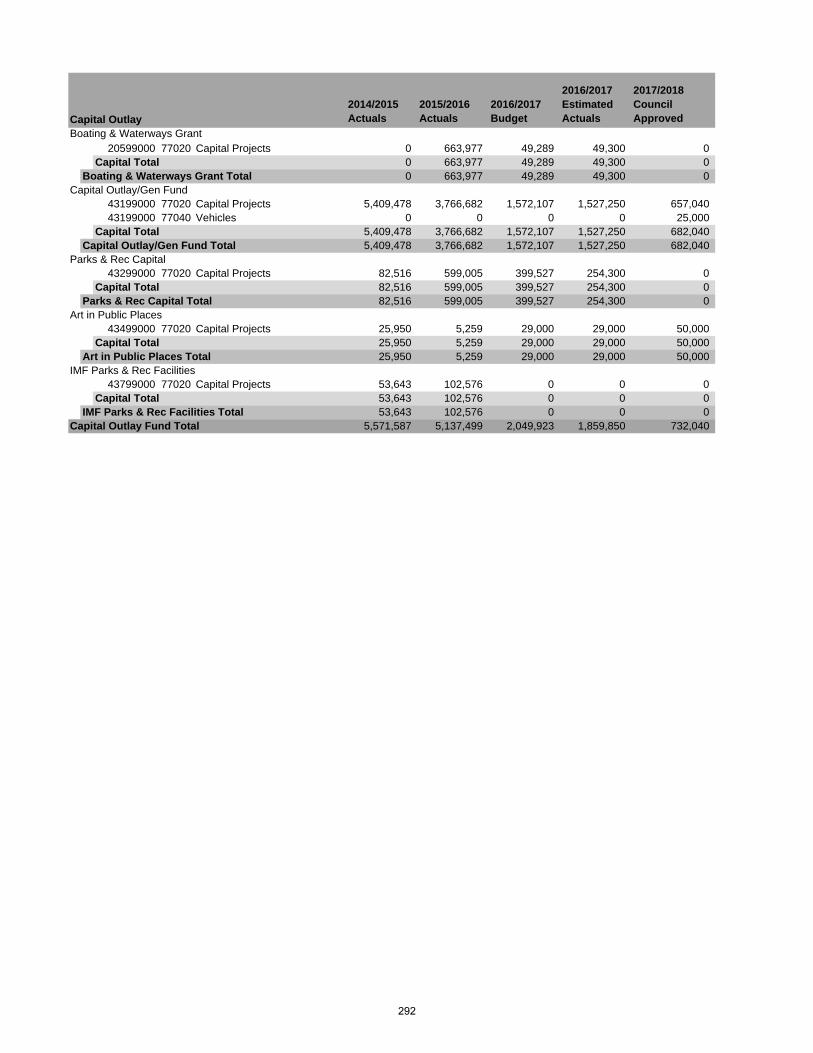
2014/2015 Actuals
2015/2016 Actuals
2016/2017 Budget
2016/2017 Estimated Actuals
2017/2018 Council Approved
Boating & Waterways Grant20599000 77020 Capital Projects 0 663,977 49,289 49,300 0
Capital Total 0 663,977 49,289 49,300 0Boating & Waterways Grant Total 0 663,977 49,289 49,300 0
Capital Outlay/Gen Fund43199000 77020 Capital Projects 5,409,478 3,766,682 1,572,107 1,527,250 657,04043199000 77040 Vehicles 0 0 0 0 25,000
Capital Total 5,409,478 3,766,682 1,572,107 1,527,250 682,040Capital Outlay/Gen Fund Total 5,409,478 3,766,682 1,572,107 1,527,250 682,040
Parks & Rec Capital43299000 77020 Capital Projects 82,516 599,005 399,527 254,300 0
Capital Total 82,516 599,005 399,527 254,300 0Parks & Rec Capital Total 82,516 599,005 399,527 254,300 0
Art in Public Places43499000 77020 Capital Projects 25,950 5,259 29,000 29,000 50,000
Capital Total 25,950 5,259 29,000 29,000 50,000Art in Public Places Total 25,950 5,259 29,000 29,000 50,000
IMF Parks & Rec Facilities43799000 77020 Capital Projects 53,643 102,576 0 0 0
Capital Total 53,643 102,576 0 0 0IMF Parks & Rec Facilities Total 53,643 102,576 0 0 0
Capital Outlay Fund Total 5,571,587 5,137,499 2,049,923 1,859,850 732,040
Capital Outlay
292
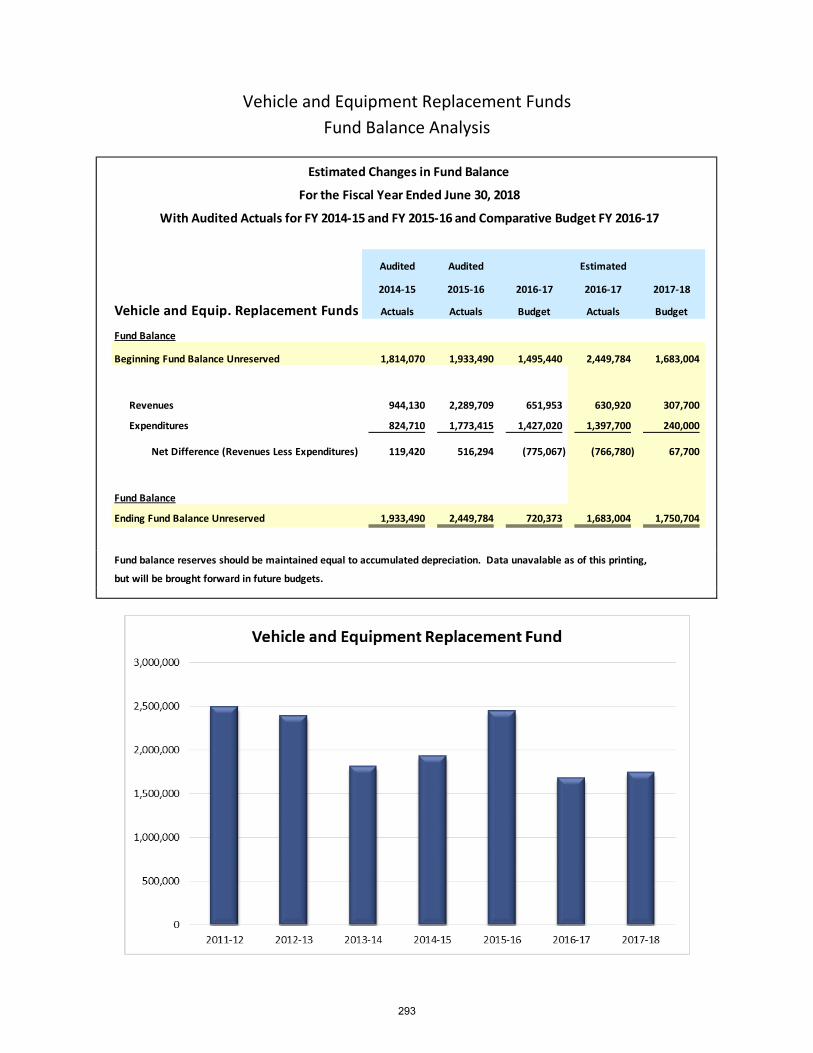
Vehicle and Equipment Replacement Funds Fund Balance Analysis
Audited Audited Estimated
2014-15 2015-16 2016-17 2016-17 2017-18
Vehicle and Equip. Replacement Funds Actuals Actuals Budget Actuals Budget
Fund Balance
Beginning Fund Balance Unreserved 1,814,070 1,933,490 1,495,440 2,449,784 1,683,004
Revenues 944,130 2,289,709 651,953 630,920 307,700
Expenditures 824,710 1,773,415 1,427,020 1,397,700 240,000
Net Difference (Revenues Less Expenditures) 119,420 516,294 (775,067) (766,780) 67,700
Fund Balance
Ending Fund Balance Unreserved 1,933,490 2,449,784 720,373 1,683,004 1,750,704
Fund balance reserves should be maintained equal to accumulated depreciation. Data unavalable as of this printing,
but will be brought forward in future budgets.
Estimated Changes in Fund Balance
For the Fiscal Year Ended June 30, 2018
With Audited Actuals for FY 2014-15 and FY 2015-16 and Comparative Budget FY 2016-17
293
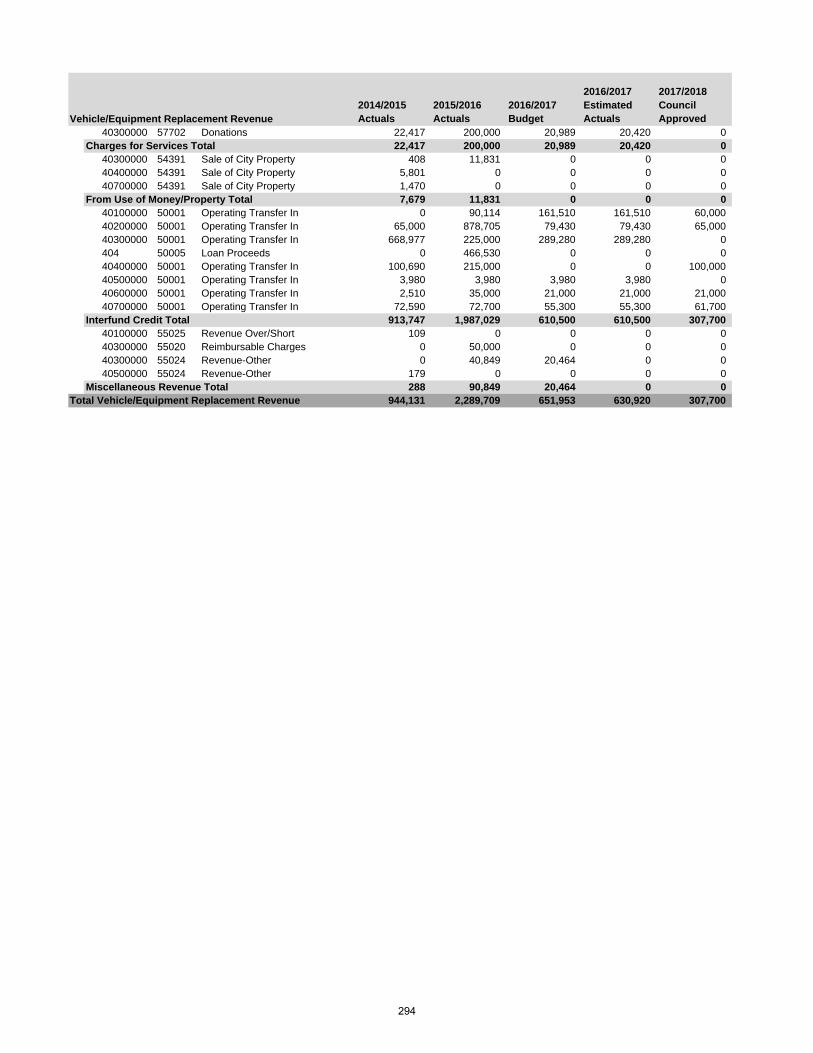
2014/2015 Actuals
2015/2016 Actuals
2016/2017 Budget
2016/2017 Estimated Actuals
2017/2018 Council Approved
40300000 57702 Donations 22,417 200,000 20,989 20,420 0Charges for Services Total 22,417 200,000 20,989 20,420 0
40300000 54391 Sale of City Property 408 11,831 0 0 040400000 54391 Sale of City Property 5,801 0 0 0 040700000 54391 Sale of City Property 1,470 0 0 0 0
From Use of Money/Property Total 7,679 11,831 0 0 040100000 50001 Operating Transfer In 0 90,114 161,510 161,510 60,00040200000 50001 Operating Transfer In 65,000 878,705 79,430 79,430 65,00040300000 50001 Operating Transfer In 668,977 225,000 289,280 289,280 0404 50005 Loan Proceeds 0 466,530 0 0 040400000 50001 Operating Transfer In 100,690 215,000 0 0 100,00040500000 50001 Operating Transfer In 3,980 3,980 3,980 3,980 040600000 50001 Operating Transfer In 2,510 35,000 21,000 21,000 21,00040700000 50001 Operating Transfer In 72,590 72,700 55,300 55,300 61,700
Interfund Credit Total 913,747 1,987,029 610,500 610,500 307,70040100000 55025 Revenue Over/Short 109 0 0 0 040300000 55020 Reimbursable Charges 0 50,000 0 0 040300000 55024 Revenue-Other 0 40,849 20,464 0 040500000 55024 Revenue-Other 179 0 0 0 0
Miscellaneous Revenue Total 288 90,849 20,464 0 0Total Vehicle/Equipment Replacement Revenue 944,131 2,289,709 651,953 630,920 307,700
Vehicle/Equipment Replacement Revenue
294
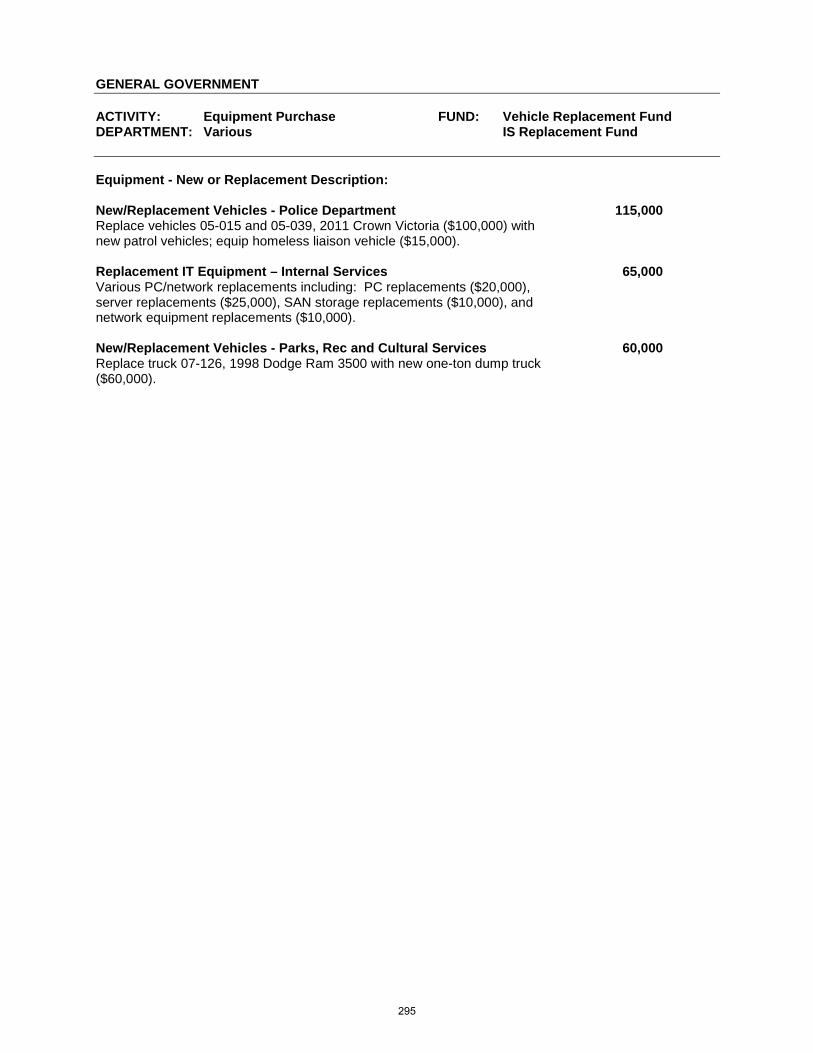
GENERAL GOVERNMENT ACTIVITY: Equipment Purchase FUND: Vehicle Replacement Fund DEPARTMENT: Various IS Replacement Fund Equipment - New or Replacement Description: New/Replacement Vehicles - Police Department 115,000 Replace vehicles 05-015 and 05-039, 2011 Crown Victoria ($100,000) with new patrol vehicles; equip homeless liaison vehicle ($15,000).
Replacement IT Equipment – Internal Services 65,000 Various PC/network replacements including: PC replacements ($20,000), server replacements ($25,000), SAN storage replacements ($10,000), and network equipment replacements ($10,000).
New/Replacement Vehicles - Parks, Rec and Cultural Services 60,000 Replace truck 07-126, 1998 Dodge Ram 3500 with new one-ton dump truck ($60,000).
295
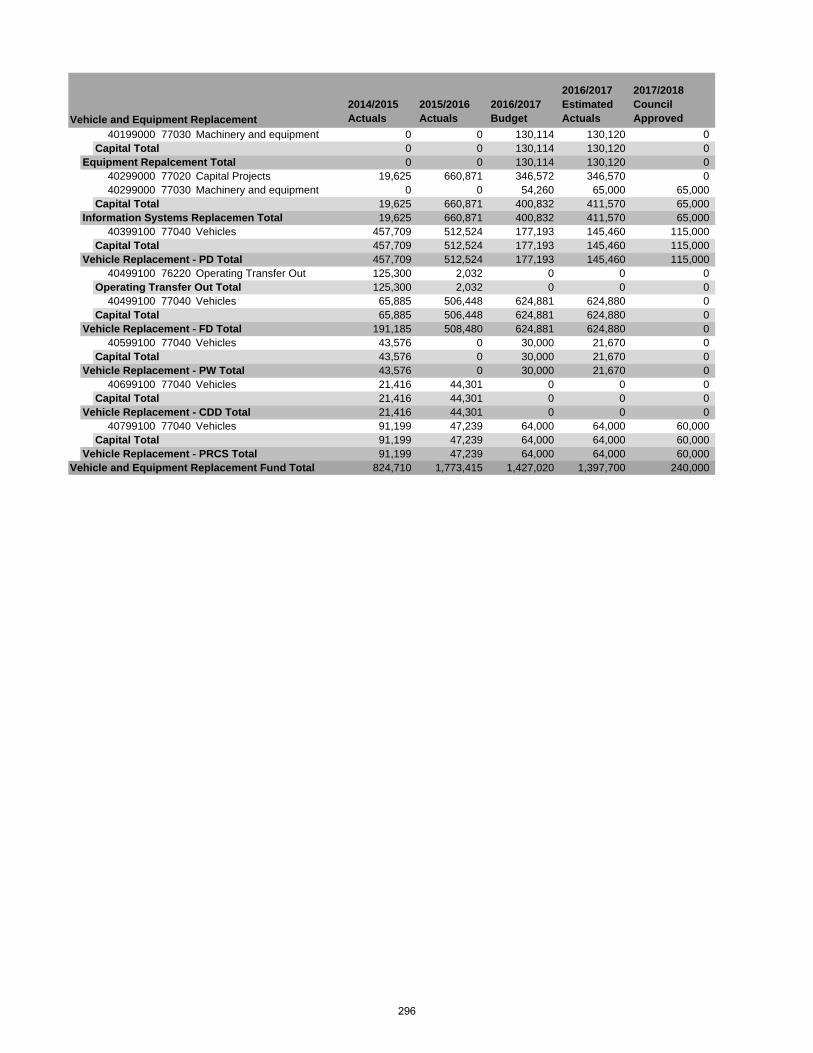
2014/2015 Actuals
2015/2016 Actuals
2016/2017 Budget
2016/2017 Estimated Actuals
2017/2018 Council Approved
40199000 77030 Machinery and equipment 0 0 130,114 130,120 0Capital Total 0 0 130,114 130,120 0
Equipment Repalcement Total 0 0 130,114 130,120 040299000 77020 Capital Projects 19,625 660,871 346,572 346,570 040299000 77030 Machinery and equipment 0 0 54,260 65,000 65,000
Capital Total 19,625 660,871 400,832 411,570 65,000Information Systems Replacemen Total 19,625 660,871 400,832 411,570 65,000
40399100 77040 Vehicles 457,709 512,524 177,193 145,460 115,000Capital Total 457,709 512,524 177,193 145,460 115,000
Vehicle Replacement - PD Total 457,709 512,524 177,193 145,460 115,00040499100 76220 Operating Transfer Out 125,300 2,032 0 0 0
Operating Transfer Out Total 125,300 2,032 0 0 040499100 77040 Vehicles 65,885 506,448 624,881 624,880 0
Capital Total 65,885 506,448 624,881 624,880 0Vehicle Replacement - FD Total 191,185 508,480 624,881 624,880 0
40599100 77040 Vehicles 43,576 0 30,000 21,670 0Capital Total 43,576 0 30,000 21,670 0
Vehicle Replacement - PW Total 43,576 0 30,000 21,670 040699100 77040 Vehicles 21,416 44,301 0 0 0
Capital Total 21,416 44,301 0 0 0Vehicle Replacement - CDD Total 21,416 44,301 0 0 0
40799100 77040 Vehicles 91,199 47,239 64,000 64,000 60,000Capital Total 91,199 47,239 64,000 64,000 60,000
Vehicle Replacement - PRCS Total 91,199 47,239 64,000 64,000 60,000Vehicle and Equipment Replacement Fund Total 824,710 1,773,415 1,427,020 1,397,700 240,000
Vehicle and Equipment Replacement
296
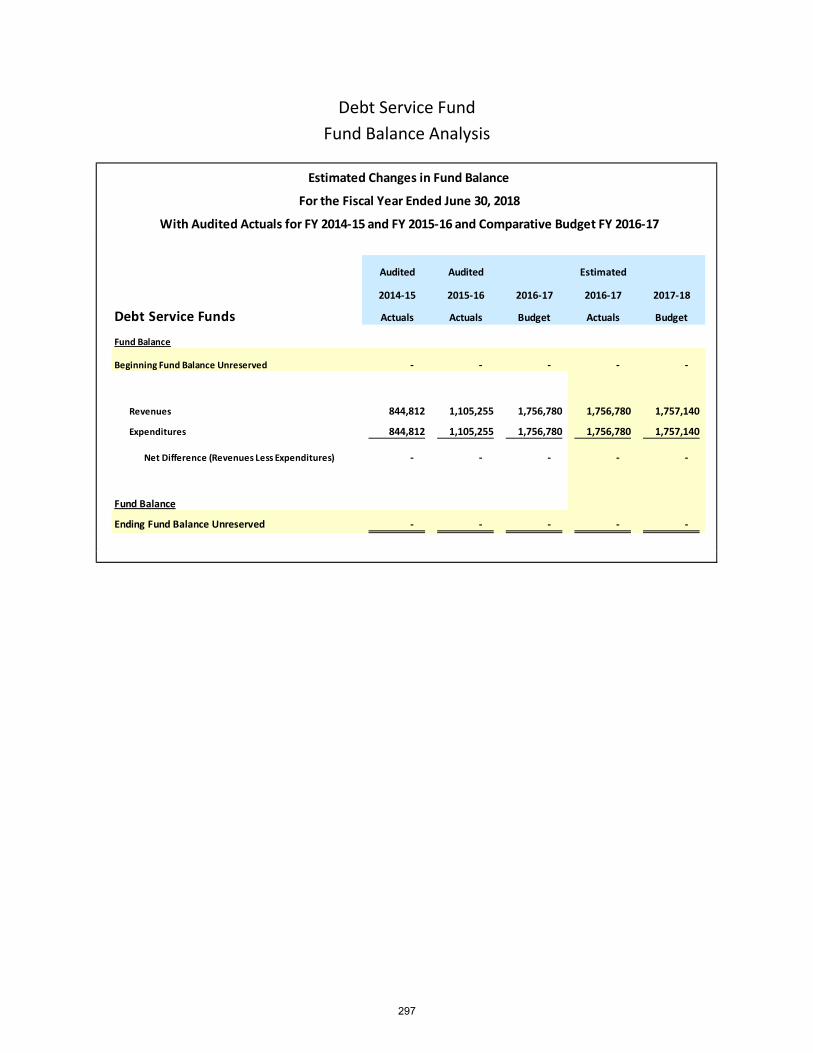
Debt Service Fund Fund Balance Analysis
Audited Audited Estimated
2014-15 2015-16 2016-17 2016-17 2017-18
Debt Service Funds Actuals Actuals Budget Actuals Budget
Fund Balance
Beginning Fund Balance Unreserved - - - - -
Revenues 844,812 1,105,255 1,756,780 1,756,780 1,757,140
Expenditures 844,812 1,105,255 1,756,780 1,756,780 1,757,140
Net Difference (Revenues Less Expenditures) - - - - -
Fund Balance
Ending Fund Balance Unreserved - - - - -
Estimated Changes in Fund Balance
For the Fiscal Year Ended June 30, 2018
With Audited Actuals for FY 2014-15 and FY 2015-16 and Comparative Budget FY 2016-17
297
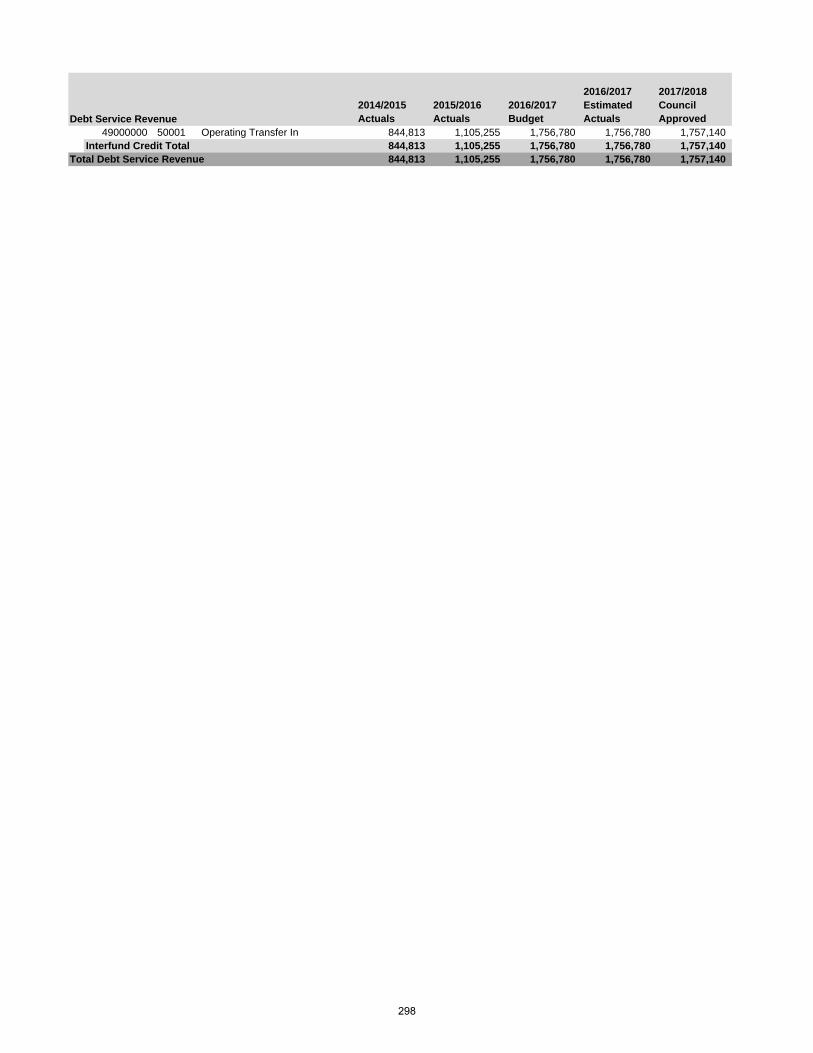
2014/2015 Actuals
2015/2016 Actuals
2016/2017 Budget
2016/2017 Estimated Actuals
2017/2018 Council Approved
49000000 50001 Operating Transfer In 844,813 1,105,255 1,756,780 1,756,780 1,757,140Interfund Credit Total 844,813 1,105,255 1,756,780 1,756,780 1,757,140
Total Debt Service Revenue 844,813 1,105,255 1,756,780 1,756,780 1,757,140
Debt Service Revenue
298

2014/2015 Actuals
2015/2016 Actuals
2016/2017 Budget
2016/2017 Estimated Actuals
2017/2018 Council Approved
49098100 75024 Bond Interest 844,813 840,913 824,567 824,570 794,92049098100 75025 Bond Principal 0 260,000 830,000 830,000 860,00049098100 75027 Loan Interest 0 2,032 9,183 9,180 9,19049098100 75028 Loan Principal 0 0 89,990 89,990 89,99049098100 75099 Misc Debt Service Charges 0 2,310 3,040 3,040 3,040
Debt, Deprec & Amortization Total 844,813 1,105,255 1,756,780 1,756,780 1,757,140Debt Service Total 844,813 1,105,255 1,756,780 1,756,780 1,757,140
Debt Service Fund Total 844,813 1,105,255 1,756,780 1,756,780 1,757,140
Debt Service
299

(This page intentionally left blank)
300
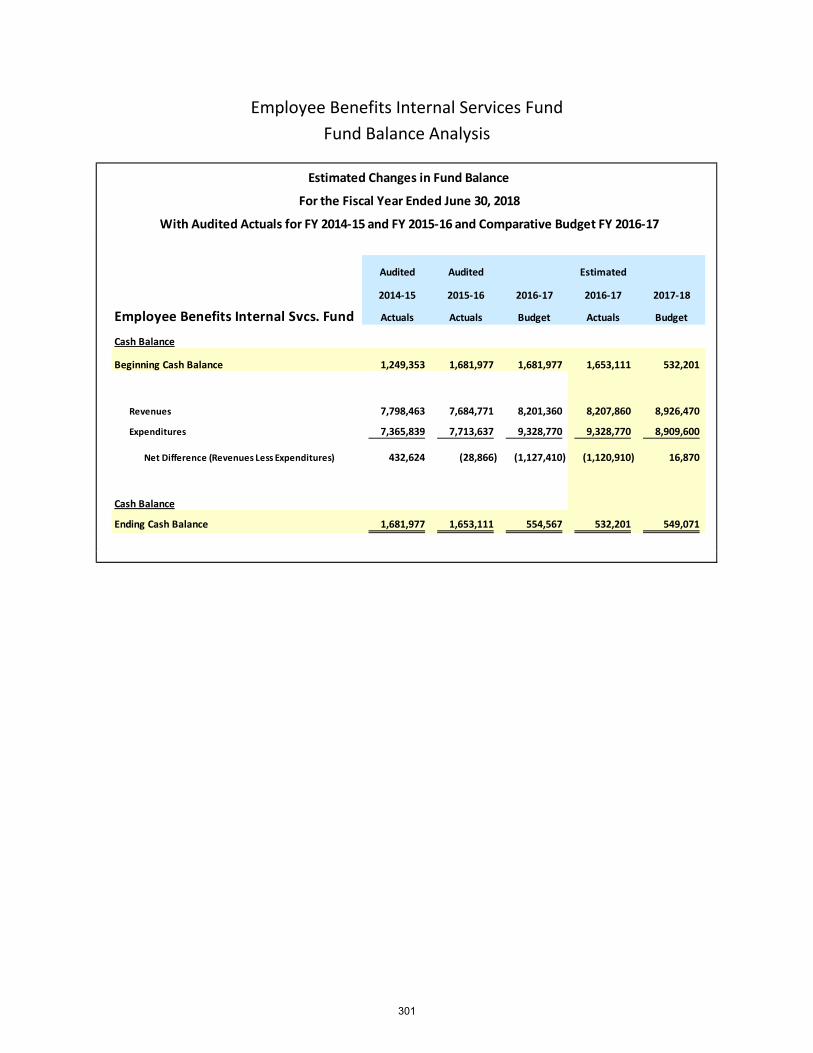
Employee Benefits Internal Services Fund Fund Balance Analysis
Audited Audited Estimated
2014-15 2015-16 2016-17 2016-17 2017-18
Employee Benefits Internal Svcs. Fund Actuals Actuals Budget Actuals Budget
Cash Balance
Beginning Cash Balance 1,249,353 1,681,977 1,681,977 1,653,111 532,201
Revenues 7,798,463 7,684,771 8,201,360 8,207,860 8,926,470
Expenditures 7,365,839 7,713,637 9,328,770 9,328,770 8,909,600
Net Difference (Revenues Less Expenditures) 432,624 (28,866) (1,127,410) (1,120,910) 16,870
Cash Balance
Ending Cash Balance 1,681,977 1,653,111 554,567 532,201 549,071
For the Fiscal Year Ended June 30, 2018
With Audited Actuals for FY 2014-15 and FY 2015-16 and Comparative Budget FY 2016-17
Estimated Changes in Fund Balance
301
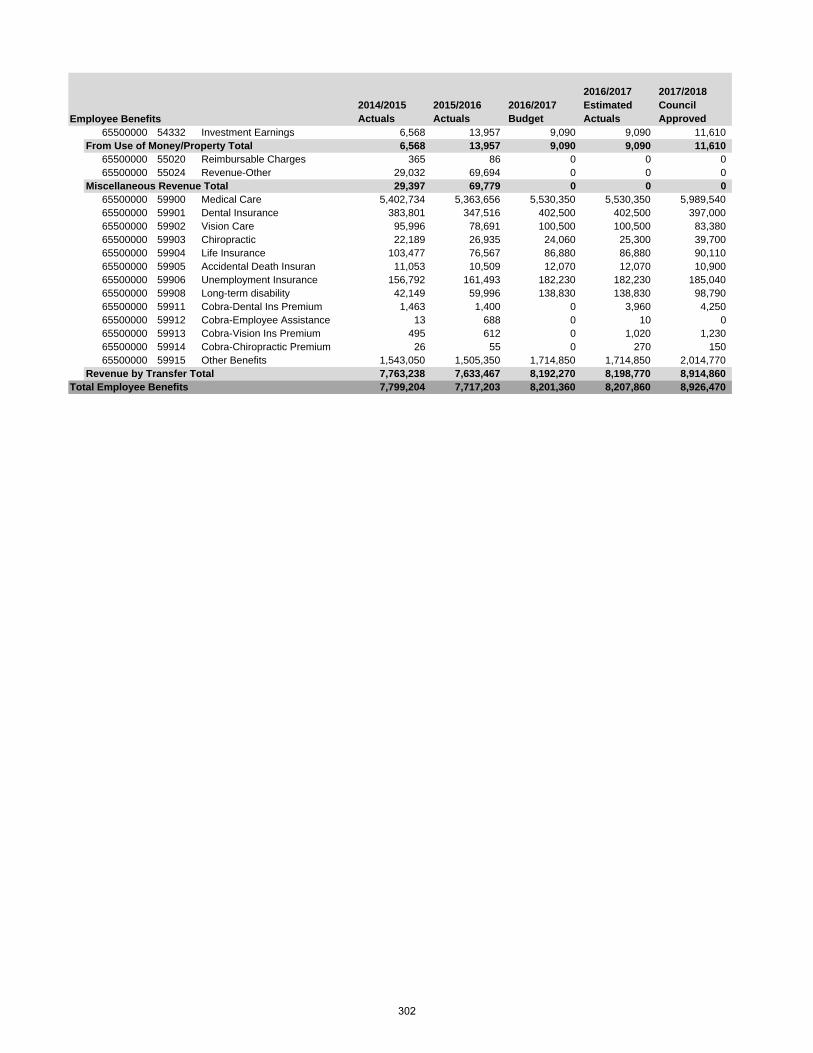
2014/2015 Actuals
2015/2016 Actuals
2016/2017 Budget
2016/2017 Estimated Actuals
2017/2018 Council Approved
65500000 54332 Investment Earnings 6,568 13,957 9,090 9,090 11,610From Use of Money/Property Total 6,568 13,957 9,090 9,090 11,610
65500000 55020 Reimbursable Charges 365 86 0 0 065500000 55024 Revenue-Other 29,032 69,694 0 0 0
Miscellaneous Revenue Total 29,397 69,779 0 0 065500000 59900 Medical Care 5,402,734 5,363,656 5,530,350 5,530,350 5,989,54065500000 59901 Dental Insurance 383,801 347,516 402,500 402,500 397,00065500000 59902 Vision Care 95,996 78,691 100,500 100,500 83,38065500000 59903 Chiropractic 22,189 26,935 24,060 25,300 39,70065500000 59904 Life Insurance 103,477 76,567 86,880 86,880 90,11065500000 59905 Accidental Death Insuran 11,053 10,509 12,070 12,070 10,90065500000 59906 Unemployment Insurance 156,792 161,493 182,230 182,230 185,04065500000 59908 Long-term disability 42,149 59,996 138,830 138,830 98,79065500000 59911 Cobra-Dental Ins Premium 1,463 1,400 0 3,960 4,25065500000 59912 Cobra-Employee Assistance 13 688 0 10 065500000 59913 Cobra-Vision Ins Premium 495 612 0 1,020 1,23065500000 59914 Cobra-Chiropractic Premium 26 55 0 270 15065500000 59915 Other Benefits 1,543,050 1,505,350 1,714,850 1,714,850 2,014,770
Revenue by Transfer Total 7,763,238 7,633,467 8,192,270 8,198,770 8,914,860Total Employee Benefits 7,799,204 7,717,203 8,201,360 8,207,860 8,926,470
Employee Benefits
302
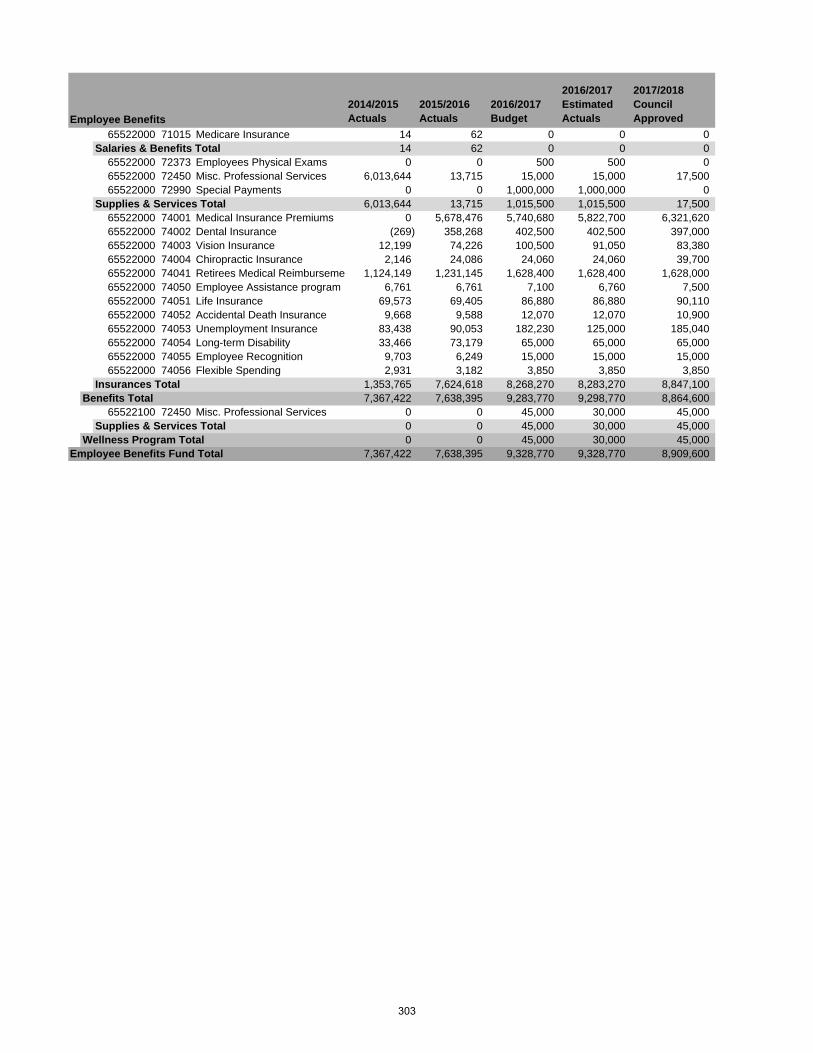
2014/2015 Actuals
2015/2016 Actuals
2016/2017 Budget
2016/2017 Estimated Actuals
2017/2018 Council Approved
65522000 71015 Medicare Insurance 14 62 0 0 0Salaries & Benefits Total 14 62 0 0 0
65522000 72373 Employees Physical Exams 0 0 500 500 065522000 72450 Misc. Professional Services 6,013,644 13,715 15,000 15,000 17,50065522000 72990 Special Payments 0 0 1,000,000 1,000,000 0
Supplies & Services Total 6,013,644 13,715 1,015,500 1,015,500 17,50065522000 74001 Medical Insurance Premiums 0 5,678,476 5,740,680 5,822,700 6,321,62065522000 74002 Dental Insurance (269) 358,268 402,500 402,500 397,00065522000 74003 Vision Insurance 12,199 74,226 100,500 91,050 83,38065522000 74004 Chiropractic Insurance 2,146 24,086 24,060 24,060 39,70065522000 74041 Retirees Medical Reimburseme 1,124,149 1,231,145 1,628,400 1,628,400 1,628,00065522000 74050 Employee Assistance program 6,761 6,761 7,100 6,760 7,50065522000 74051 Life Insurance 69,573 69,405 86,880 86,880 90,11065522000 74052 Accidental Death Insurance 9,668 9,588 12,070 12,070 10,90065522000 74053 Unemployment Insurance 83,438 90,053 182,230 125,000 185,04065522000 74054 Long-term Disability 33,466 73,179 65,000 65,000 65,00065522000 74055 Employee Recognition 9,703 6,249 15,000 15,000 15,00065522000 74056 Flexible Spending 2,931 3,182 3,850 3,850 3,850
Insurances Total 1,353,765 7,624,618 8,268,270 8,283,270 8,847,100Benefits Total 7,367,422 7,638,395 9,283,770 9,298,770 8,864,600
65522100 72450 Misc. Professional Services 0 0 45,000 30,000 45,000Supplies & Services Total 0 0 45,000 30,000 45,000
Wellness Program Total 0 0 45,000 30,000 45,000Employee Benefits Fund Total 7,367,422 7,638,395 9,328,770 9,328,770 8,909,600
Employee Benefits
303

(This page intentionally left blank)
304
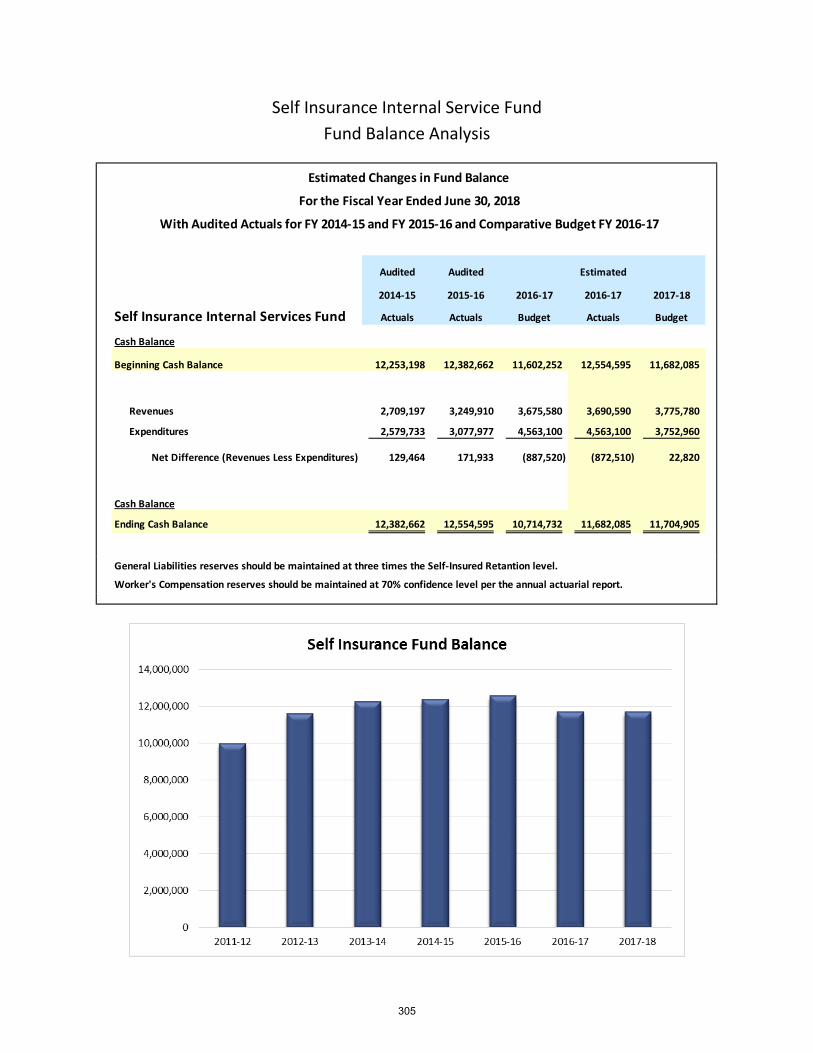
Self Insurance Internal Service Fund Fund Balance Analysis
Audited Audited Estimated
2014-15 2015-16 2016-17 2016-17 2017-18
Self Insurance Internal Services Fund Actuals Actuals Budget Actuals Budget
Cash Balance
Beginning Cash Balance 12,253,198 12,382,662 11,602,252 12,554,595 11,682,085
Revenues 2,709,197 3,249,910 3,675,580 3,690,590 3,775,780
Expenditures 2,579,733 3,077,977 4,563,100 4,563,100 3,752,960
Net Difference (Revenues Less Expenditures) 129,464 171,933 (887,520) (872,510) 22,820
Cash Balance
Ending Cash Balance 12,382,662 12,554,595 10,714,732 11,682,085 11,704,905
General Liabilities reserves should be maintained at three times the Self-Insured Retantion level.
Worker's Compensation reserves should be maintained at 70% confidence level per the annual actuarial report.
With Audited Actuals for FY 2014-15 and FY 2015-16 and Comparative Budget FY 2016-17
Estimated Changes in Fund Balance
For the Fiscal Year Ended June 30, 2018
305
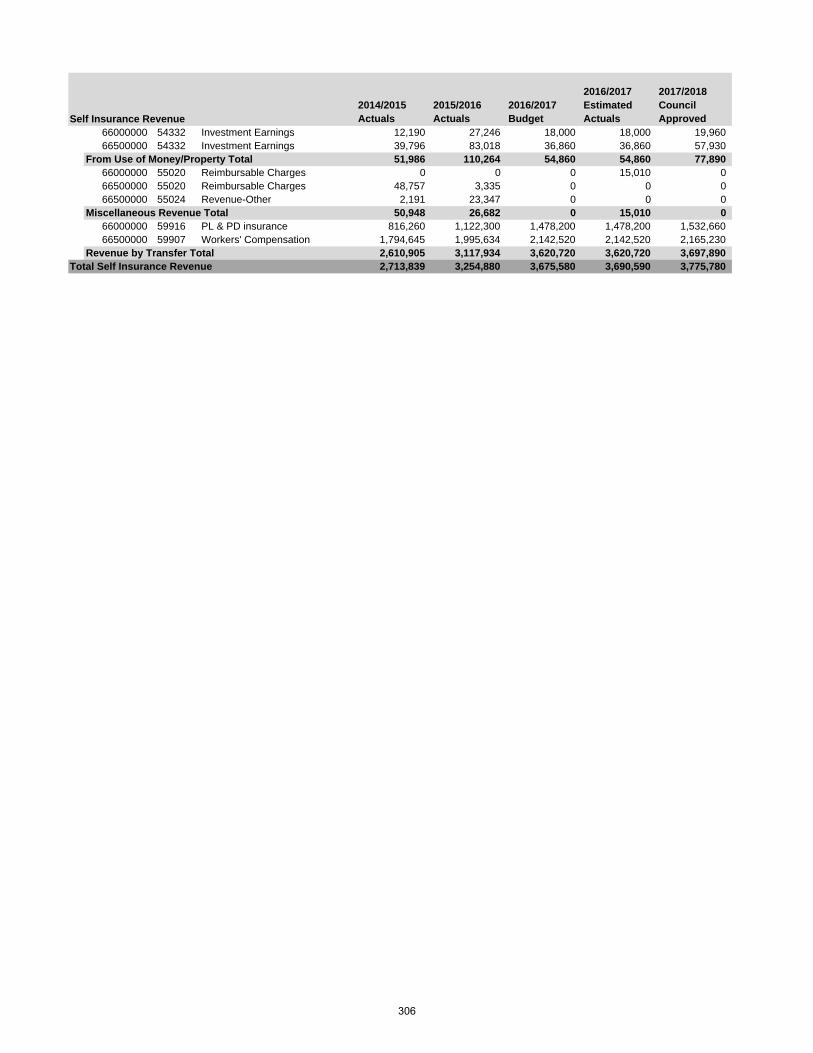
2014/2015 Actuals
2015/2016 Actuals
2016/2017 Budget
2016/2017 Estimated Actuals
2017/2018 Council Approved
66000000 54332 Investment Earnings 12,190 27,246 18,000 18,000 19,96066500000 54332 Investment Earnings 39,796 83,018 36,860 36,860 57,930
From Use of Money/Property Total 51,986 110,264 54,860 54,860 77,89066000000 55020 Reimbursable Charges 0 0 0 15,010 066500000 55020 Reimbursable Charges 48,757 3,335 0 0 066500000 55024 Revenue-Other 2,191 23,347 0 0 0
Miscellaneous Revenue Total 50,948 26,682 0 15,010 066000000 59916 PL & PD insurance 816,260 1,122,300 1,478,200 1,478,200 1,532,66066500000 59907 Workers' Compensation 1,794,645 1,995,634 2,142,520 2,142,520 2,165,230
Revenue by Transfer Total 2,610,905 3,117,934 3,620,720 3,620,720 3,697,890Total Self Insurance Revenue 2,713,839 3,254,880 3,675,580 3,690,590 3,775,780
Self Insurance Revenue
306
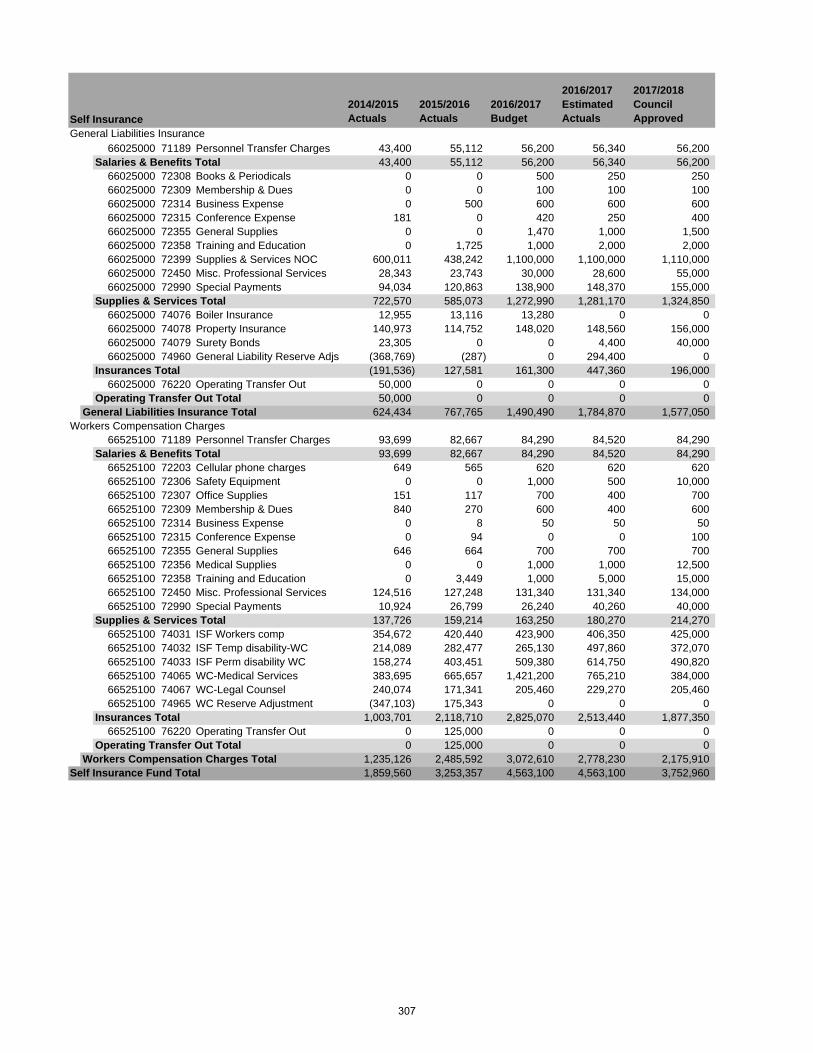
2014/2015 Actuals
2015/2016 Actuals
2016/2017 Budget
2016/2017 Estimated Actuals
2017/2018 Council Approved
General Liabilities Insurance66025000 71189 Personnel Transfer Charges 43,400 55,112 56,200 56,340 56,200
Salaries & Benefits Total 43,400 55,112 56,200 56,340 56,20066025000 72308 Books & Periodicals 0 0 500 250 25066025000 72309 Membership & Dues 0 0 100 100 10066025000 72314 Business Expense 0 500 600 600 60066025000 72315 Conference Expense 181 0 420 250 40066025000 72355 General Supplies 0 0 1,470 1,000 1,50066025000 72358 Training and Education 0 1,725 1,000 2,000 2,00066025000 72399 Supplies & Services NOC 600,011 438,242 1,100,000 1,100,000 1,110,00066025000 72450 Misc. Professional Services 28,343 23,743 30,000 28,600 55,00066025000 72990 Special Payments 94,034 120,863 138,900 148,370 155,000
Supplies & Services Total 722,570 585,073 1,272,990 1,281,170 1,324,85066025000 74076 Boiler Insurance 12,955 13,116 13,280 0 066025000 74078 Property Insurance 140,973 114,752 148,020 148,560 156,00066025000 74079 Surety Bonds 23,305 0 0 4,400 40,00066025000 74960 General Liability Reserve Adjs (368,769) (287) 0 294,400 0
Insurances Total (191,536) 127,581 161,300 447,360 196,00066025000 76220 Operating Transfer Out 50,000 0 0 0 0
Operating Transfer Out Total 50,000 0 0 0 0General Liabilities Insurance Total 624,434 767,765 1,490,490 1,784,870 1,577,050
Workers Compensation Charges66525100 71189 Personnel Transfer Charges 93,699 82,667 84,290 84,520 84,290
Salaries & Benefits Total 93,699 82,667 84,290 84,520 84,29066525100 72203 Cellular phone charges 649 565 620 620 62066525100 72306 Safety Equipment 0 0 1,000 500 10,00066525100 72307 Office Supplies 151 117 700 400 70066525100 72309 Membership & Dues 840 270 600 400 60066525100 72314 Business Expense 0 8 50 50 5066525100 72315 Conference Expense 0 94 0 0 10066525100 72355 General Supplies 646 664 700 700 70066525100 72356 Medical Supplies 0 0 1,000 1,000 12,50066525100 72358 Training and Education 0 3,449 1,000 5,000 15,00066525100 72450 Misc. Professional Services 124,516 127,248 131,340 131,340 134,00066525100 72990 Special Payments 10,924 26,799 26,240 40,260 40,000
Supplies & Services Total 137,726 159,214 163,250 180,270 214,27066525100 74031 ISF Workers comp 354,672 420,440 423,900 406,350 425,00066525100 74032 ISF Temp disability-WC 214,089 282,477 265,130 497,860 372,07066525100 74033 ISF Perm disability WC 158,274 403,451 509,380 614,750 490,82066525100 74065 WC-Medical Services 383,695 665,657 1,421,200 765,210 384,00066525100 74067 WC-Legal Counsel 240,074 171,341 205,460 229,270 205,46066525100 74965 WC Reserve Adjustment (347,103) 175,343 0 0 0
Insurances Total 1,003,701 2,118,710 2,825,070 2,513,440 1,877,35066525100 76220 Operating Transfer Out 0 125,000 0 0 0
Operating Transfer Out Total 0 125,000 0 0 0Workers Compensation Charges Total 1,235,126 2,485,592 3,072,610 2,778,230 2,175,910
Self Insurance Fund Total 1,859,560 3,253,357 4,563,100 4,563,100 3,752,960
Self Insurance
307
(This page intentionally left blank)
308
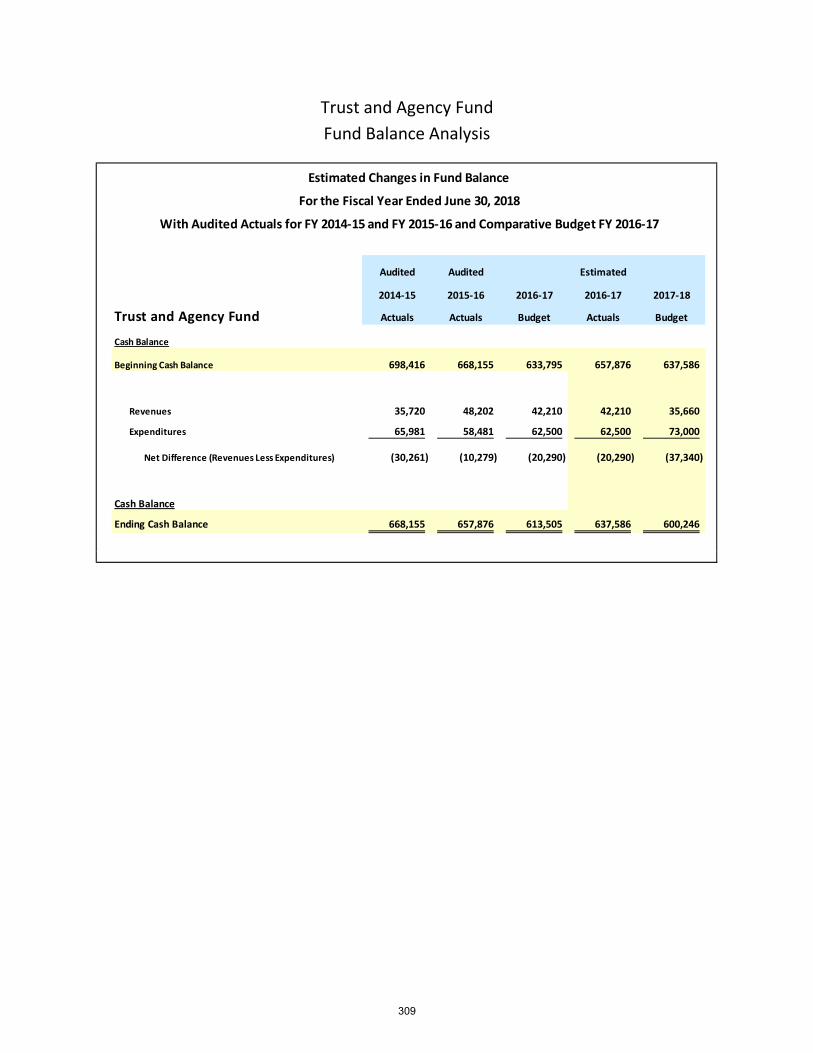
Trust and Agency Fund Fund Balance Analysis
Audited Audited Estimated
2014-15 2015-16 2016-17 2016-17 2017-18
Trust and Agency Fund Actuals Actuals Budget Actuals Budget
Cash Balance
Beginning Cash Balance 698,416 668,155 633,795 657,876 637,586
Revenues 35,720 48,202 42,210 42,210 35,660
Expenditures 65,981 58,481 62,500 62,500 73,000
Net Difference (Revenues Less Expenditures) (30,261) (10,279) (20,290) (20,290) (37,340)
Cash Balance
Ending Cash Balance 668,155 657,876 613,505 637,586 600,246
Estimated Changes in Fund Balance
For the Fiscal Year Ended June 30, 2018
With Audited Actuals for FY 2014-15 and FY 2015-16 and Comparative Budget FY 2016-17
309
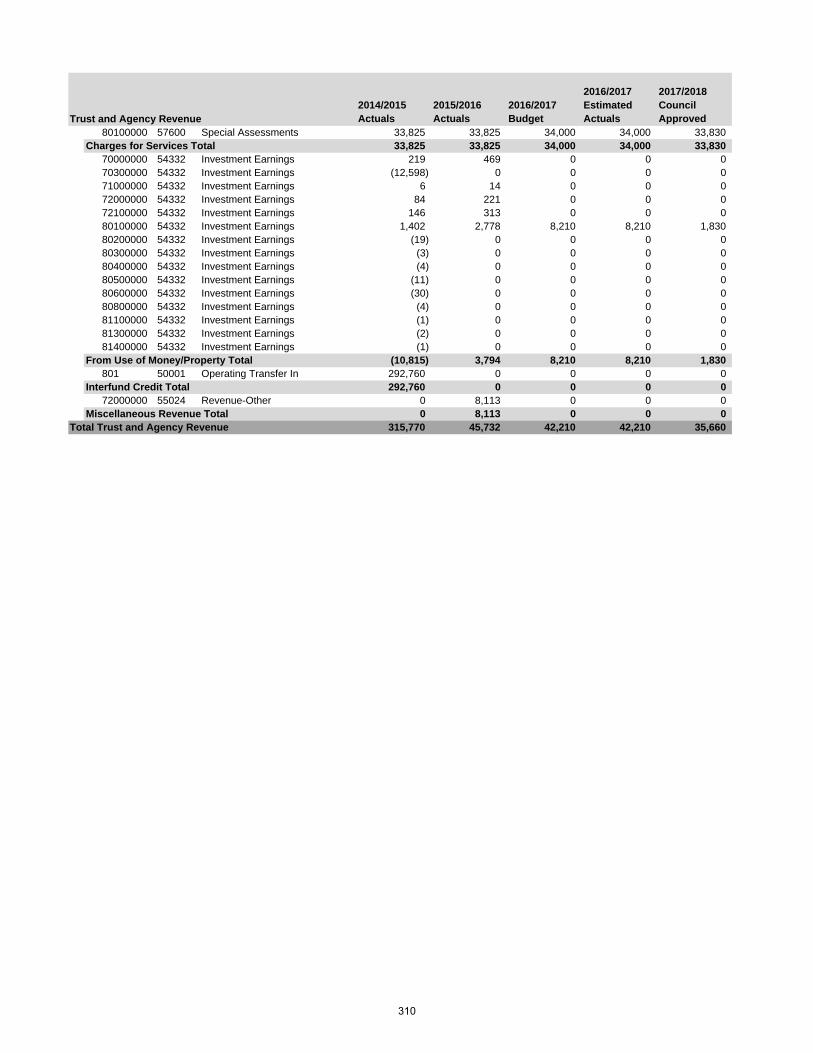
2014/2015 Actuals
2015/2016 Actuals
2016/2017 Budget
2016/2017 Estimated Actuals
2017/2018 Council Approved
80100000 57600 Special Assessments 33,825 33,825 34,000 34,000 33,830Charges for Services Total 33,825 33,825 34,000 34,000 33,830
70000000 54332 Investment Earnings 219 469 0 0 070300000 54332 Investment Earnings (12,598) 0 0 0 071000000 54332 Investment Earnings 6 14 0 0 072000000 54332 Investment Earnings 84 221 0 0 072100000 54332 Investment Earnings 146 313 0 0 080100000 54332 Investment Earnings 1,402 2,778 8,210 8,210 1,83080200000 54332 Investment Earnings (19) 0 0 0 080300000 54332 Investment Earnings (3) 0 0 0 080400000 54332 Investment Earnings (4) 0 0 0 080500000 54332 Investment Earnings (11) 0 0 0 080600000 54332 Investment Earnings (30) 0 0 0 080800000 54332 Investment Earnings (4) 0 0 0 081100000 54332 Investment Earnings (1) 0 0 0 081300000 54332 Investment Earnings (2) 0 0 0 081400000 54332 Investment Earnings (1) 0 0 0 0
From Use of Money/Property Total (10,815) 3,794 8,210 8,210 1,830801 50001 Operating Transfer In 292,760 0 0 0 0
Interfund Credit Total 292,760 0 0 0 072000000 55024 Revenue-Other 0 8,113 0 0 0
Miscellaneous Revenue Total 0 8,113 0 0 0Total Trust and Agency Revenue 315,770 45,732 42,210 42,210 35,660
Trust and Agency Revenue
310
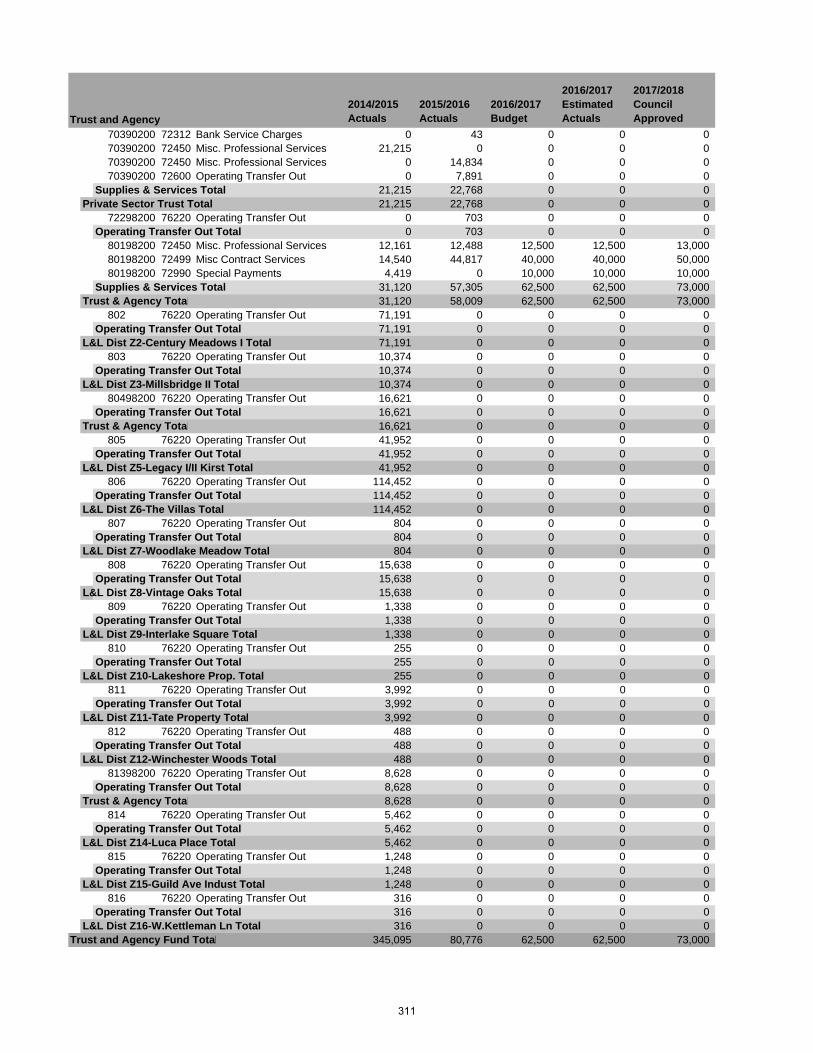
2014/2015 Actuals
2015/2016 Actuals
2016/2017 Budget
2016/2017 Estimated Actuals
2017/2018 Council Approved
70390200 72312 Bank Service Charges 0 43 0 0 070390200 72450 Misc. Professional Services 21,215 0 0 0 070390200 72450 Misc. Professional Services 0 14,834 0 0 070390200 72600 Operating Transfer Out 0 7,891 0 0 0
Supplies & Services Total 21,215 22,768 0 0 0Private Sector Trust Total 21,215 22,768 0 0 0
72298200 76220 Operating Transfer Out 0 703 0 0 0Operating Transfer Out Total 0 703 0 0 0
80198200 72450 Misc. Professional Services 12,161 12,488 12,500 12,500 13,00080198200 72499 Misc Contract Services 14,540 44,817 40,000 40,000 50,00080198200 72990 Special Payments 4,419 0 10,000 10,000 10,000
Supplies & Services Total 31,120 57,305 62,500 62,500 73,000Trust & Agency Total 31,120 58,009 62,500 62,500 73,000
802 76220 Operating Transfer Out 71,191 0 0 0 0Operating Transfer Out Total 71,191 0 0 0 0
L&L Dist Z2-Century Meadows I Total 71,191 0 0 0 0803 76220 Operating Transfer Out 10,374 0 0 0 0
Operating Transfer Out Total 10,374 0 0 0 0L&L Dist Z3-Millsbridge II Total 10,374 0 0 0 0
80498200 76220 Operating Transfer Out 16,621 0 0 0 0Operating Transfer Out Total 16,621 0 0 0 0
Trust & Agency Total 16,621 0 0 0 0805 76220 Operating Transfer Out 41,952 0 0 0 0
Operating Transfer Out Total 41,952 0 0 0 0L&L Dist Z5-Legacy I/II Kirst Total 41,952 0 0 0 0
806 76220 Operating Transfer Out 114,452 0 0 0 0Operating Transfer Out Total 114,452 0 0 0 0
L&L Dist Z6-The Villas Total 114,452 0 0 0 0807 76220 Operating Transfer Out 804 0 0 0 0
Operating Transfer Out Total 804 0 0 0 0L&L Dist Z7-Woodlake Meadow Total 804 0 0 0 0
808 76220 Operating Transfer Out 15,638 0 0 0 0Operating Transfer Out Total 15,638 0 0 0 0
L&L Dist Z8-Vintage Oaks Total 15,638 0 0 0 0809 76220 Operating Transfer Out 1,338 0 0 0 0
Operating Transfer Out Total 1,338 0 0 0 0L&L Dist Z9-Interlake Square Total 1,338 0 0 0 0
810 76220 Operating Transfer Out 255 0 0 0 0Operating Transfer Out Total 255 0 0 0 0
L&L Dist Z10-Lakeshore Prop. Total 255 0 0 0 0811 76220 Operating Transfer Out 3,992 0 0 0 0
Operating Transfer Out Total 3,992 0 0 0 0L&L Dist Z11-Tate Property Total 3,992 0 0 0 0
812 76220 Operating Transfer Out 488 0 0 0 0Operating Transfer Out Total 488 0 0 0 0
L&L Dist Z12-Winchester Woods Total 488 0 0 0 081398200 76220 Operating Transfer Out 8,628 0 0 0 0
Operating Transfer Out Total 8,628 0 0 0 0Trust & Agency Total 8,628 0 0 0 0
814 76220 Operating Transfer Out 5,462 0 0 0 0Operating Transfer Out Total 5,462 0 0 0 0
L&L Dist Z14-Luca Place Total 5,462 0 0 0 0815 76220 Operating Transfer Out 1,248 0 0 0 0
Operating Transfer Out Total 1,248 0 0 0 0L&L Dist Z15-Guild Ave Indust Total 1,248 0 0 0 0
816 76220 Operating Transfer Out 316 0 0 0 0Operating Transfer Out Total 316 0 0 0 0
L&L Dist Z16-W.Kettleman Ln Total 316 0 0 0 0Trust and Agency Fund Total 345,095 80,776 62,500 62,500 73,000
Trust and Agency
311

(This page intentionally left blank)
312
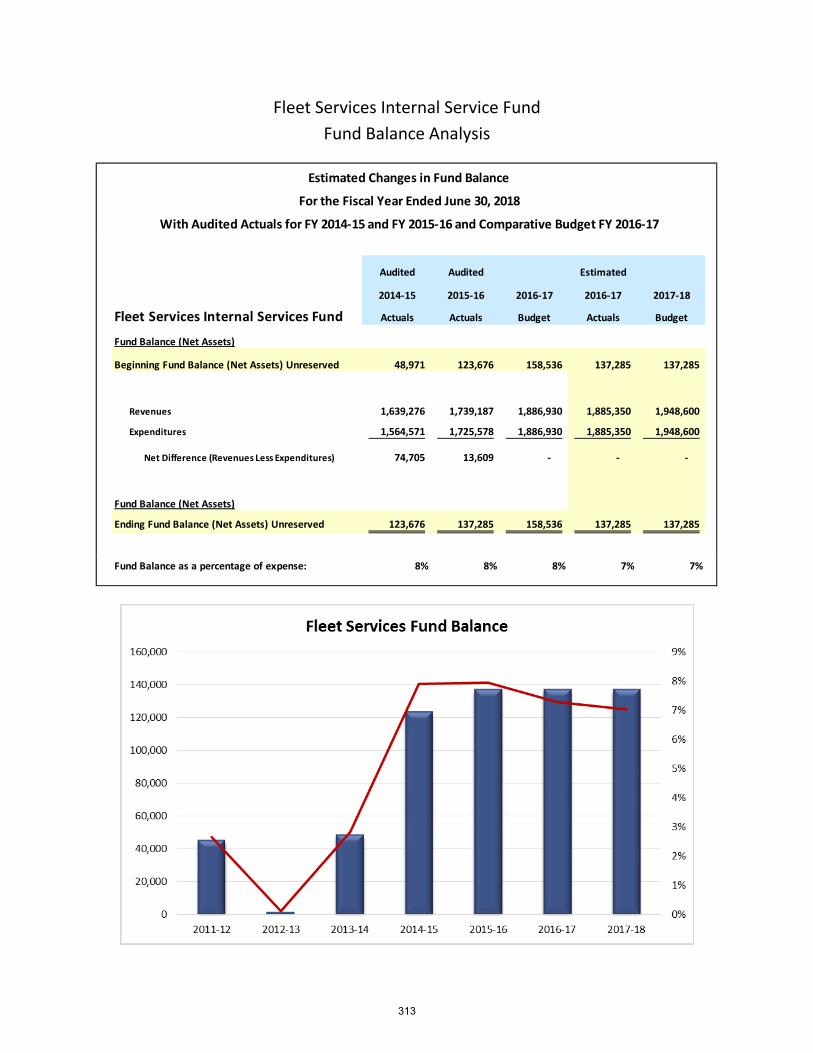
Fleet Services Internal Service Fund Fund Balance Analysis
Audited Audited Estimated
2014-15 2015-16 2016-17 2016-17 2017-18
Fleet Services Internal Services Fund Actuals Actuals Budget Actuals Budget
Fund Balance (Net Assets)
Beginning Fund Balance (Net Assets) Unreserved 48,971 123,676 158,536 137,285 137,285
Revenues 1,639,276 1,739,187 1,886,930 1,885,350 1,948,600
Expenditures 1,564,571 1,725,578 1,886,930 1,885,350 1,948,600
Net Difference (Revenues Less Expenditures) 74,705 13,609 - - -
Fund Balance (Net Assets)
Ending Fund Balance (Net Assets) Unreserved 123,676 137,285 158,536 137,285 137,285
Fund Balance as a percentage of expense: 8% 8% 8% 7% 7%
With Audited Actuals for FY 2014-15 and FY 2015-16 and Comparative Budget FY 2016-17
Estimated Changes in Fund Balance
For the Fiscal Year Ended June 30, 2018
313
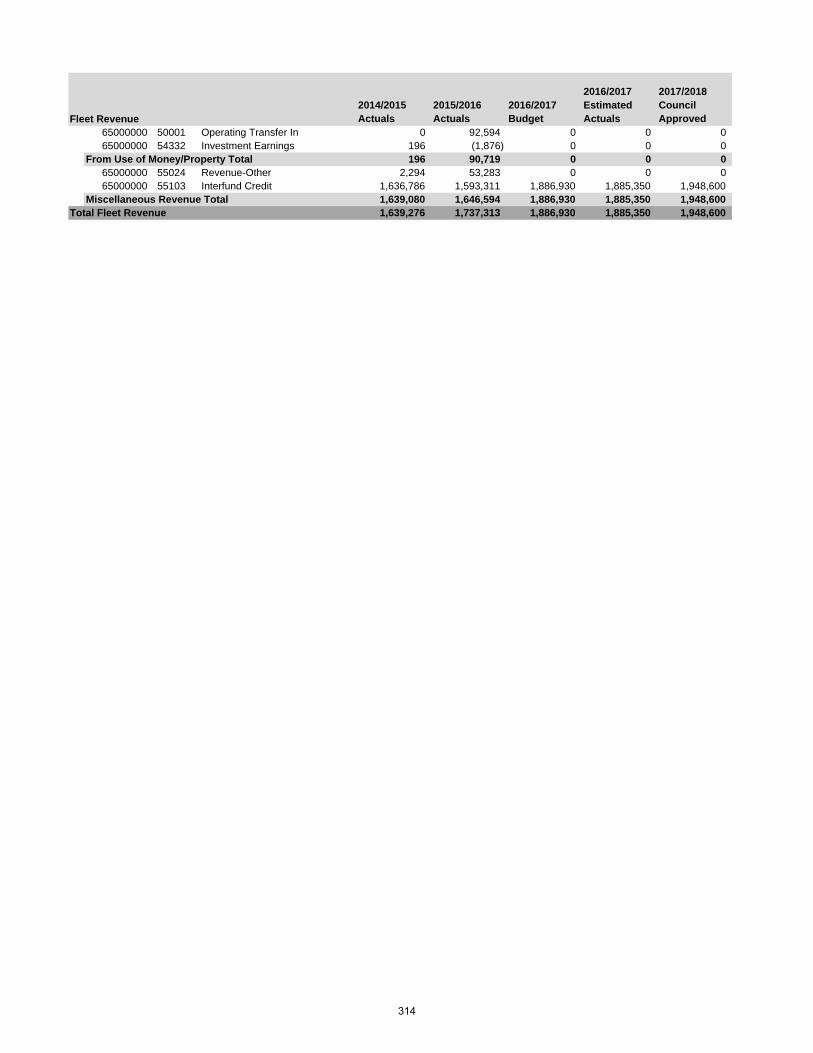
2014/2015 Actuals
2015/2016 Actuals
2016/2017 Budget
2016/2017 Estimated Actuals
2017/2018 Council Approved
65000000 50001 Operating Transfer In 0 92,594 0 0 065000000 54332 Investment Earnings 196 (1,876) 0 0 0
From Use of Money/Property Total 196 90,719 0 0 065000000 55024 Revenue-Other 2,294 53,283 0 0 065000000 55103 Interfund Credit 1,636,786 1,593,311 1,886,930 1,885,350 1,948,600
Miscellaneous Revenue Total 1,639,080 1,646,594 1,886,930 1,885,350 1,948,600Total Fleet Revenue 1,639,276 1,737,313 1,886,930 1,885,350 1,948,600
Fleet Revenue
314
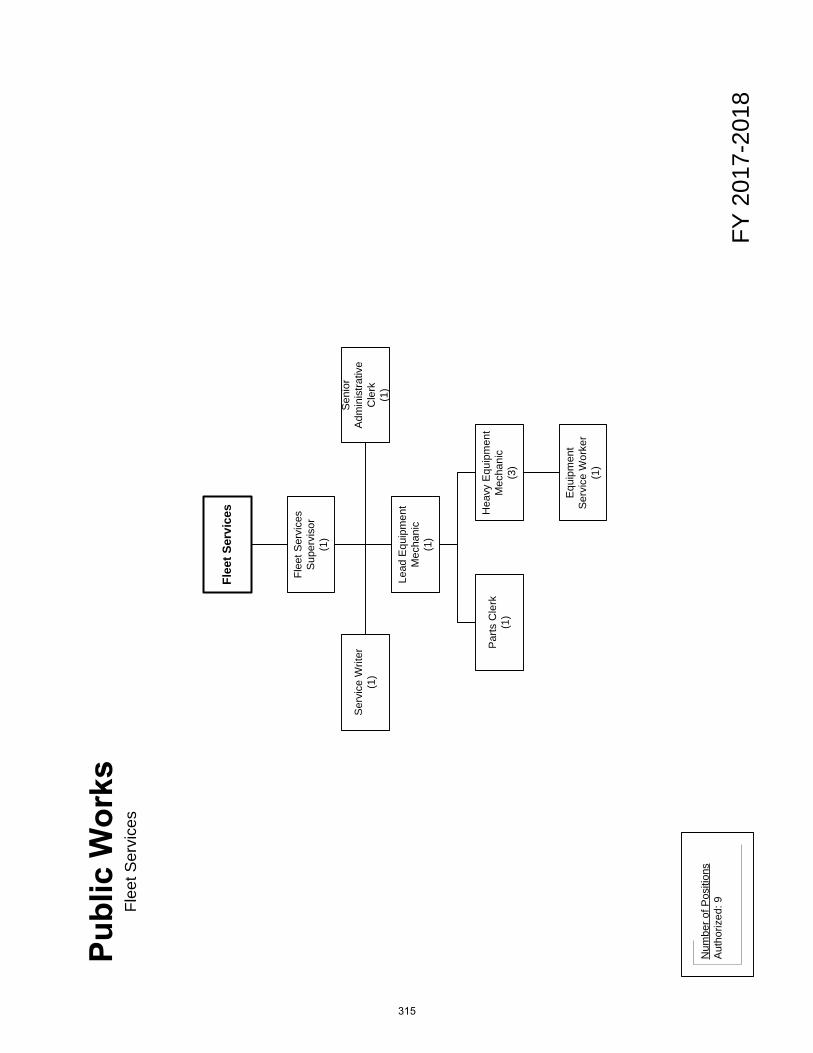
Flee
t Ser
vice
s
FY 2
017-
2018
Num
ber o
f Pos
ition
sA
utho
rized
: 9
Flee
t Ser
vice
s
Flee
t Ser
vice
s S
uper
viso
r(1
)
Seni
or
Adm
inis
trativ
e C
lerk
(1
)
Lead
Equ
ipm
ent
Mec
hani
c (1
)
Par
ts C
lerk
(1)
Hea
vy E
quip
men
t M
echa
nic
(3)
Equi
pmen
t Se
rvic
e W
orke
r (1
)
Ser
vice
Writ
er(1
)
315
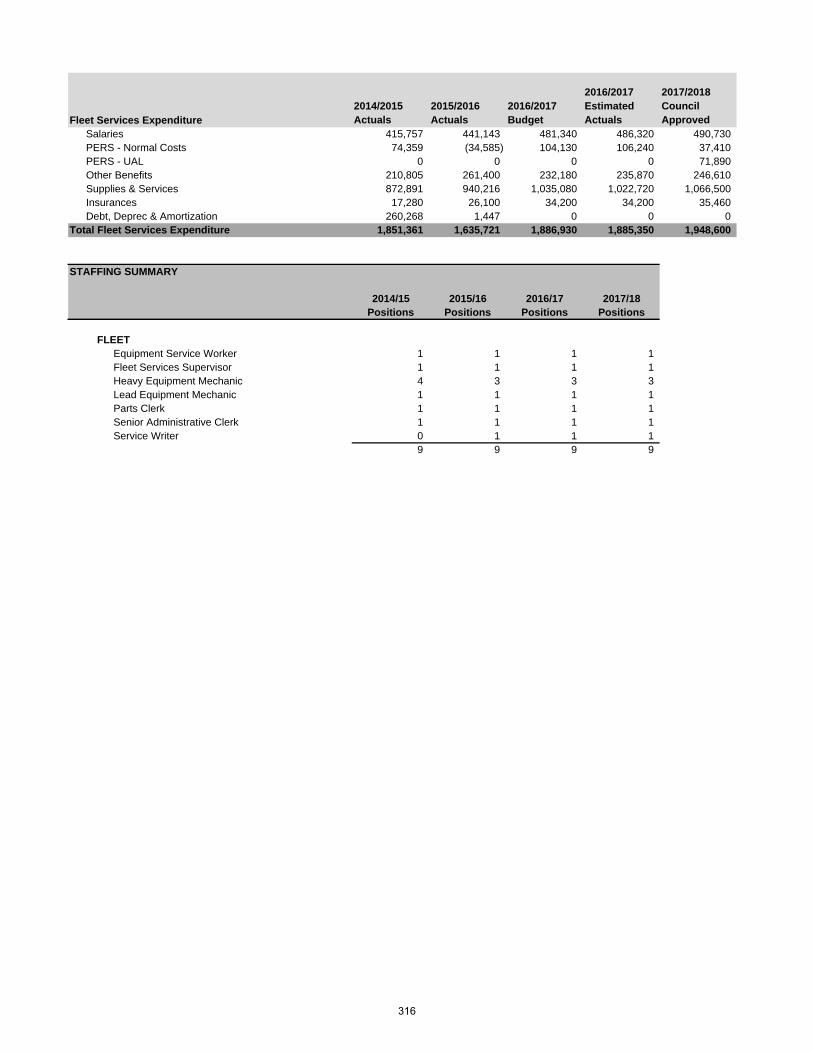
2014/2015 Actuals
2015/2016 Actuals
2016/2017 Budget
2016/2017 Estimated Actuals
2017/2018 Council Approved
Salaries 415,757 441,143 481,340 486,320 490,730PERS - Normal Costs 74,359 (34,585) 104,130 106,240 37,410PERS - UAL 0 0 0 0 71,890Other Benefits 210,805 261,400 232,180 235,870 246,610Supplies & Services 872,891 940,216 1,035,080 1,022,720 1,066,500Insurances 17,280 26,100 34,200 34,200 35,460Debt, Deprec & Amortization 260,268 1,447 0 0 0
Total Fleet Services Expenditure 1,851,361 1,635,721 1,886,930 1,885,350 1,948,600
STAFFING SUMMARY
2014/15 2015/16 2016/17 2017/18Positions Positions Positions Positions
FLEETEquipment Service Worker 1 1 1 1Fleet Services Supervisor 1 1 1 1Heavy Equipment Mechanic 4 3 3 3Lead Equipment Mechanic 1 1 1 1Parts Clerk 1 1 1 1Senior Administrative Clerk 1 1 1 1Service Writer 0 1 1 1
9 9 9 9
Fleet Services Expenditure
316
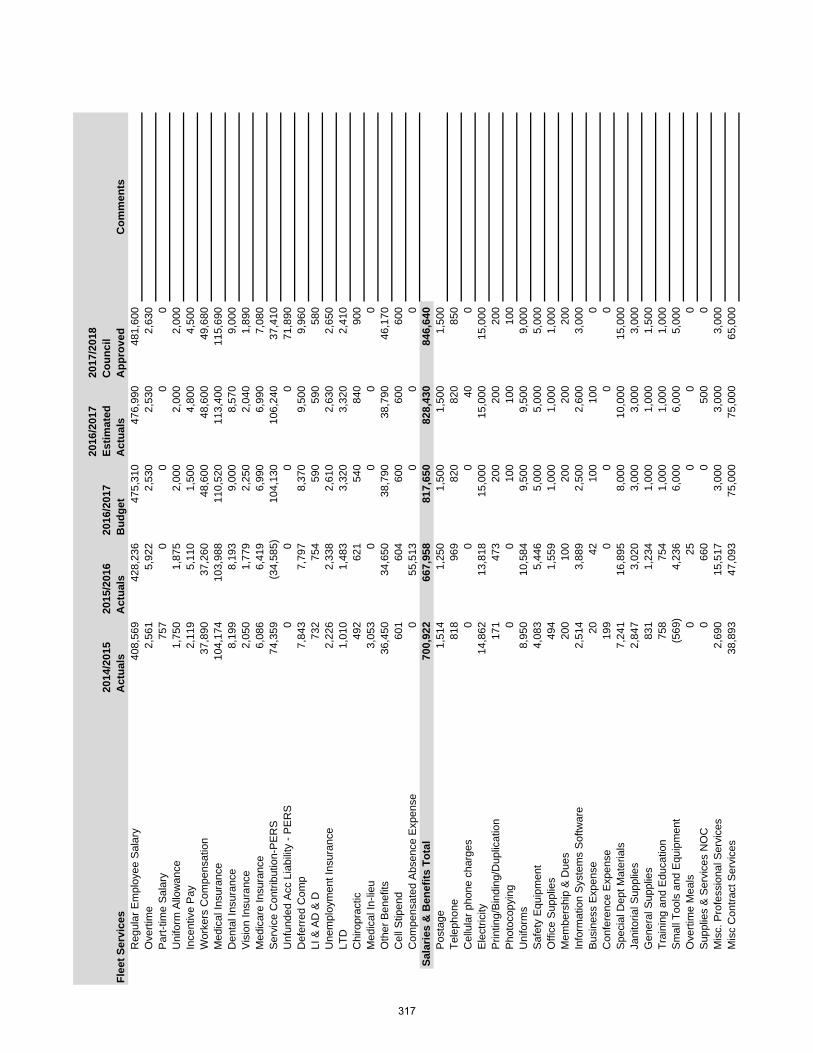
2014
/201
5 A
ctua
ls20
15/2
016
Act
uals
2016
/201
7 B
udge
t
2016
/201
7 Es
timat
ed
Act
uals
2017
/201
8 C
ounc
il A
ppro
ved
Com
men
tsR
egul
ar E
mpl
oyee
Sal
ary
408,
569
428,
236
475,
310
476,
990
481,
600
Ove
rtim
e 2,
561
5,92
22,
530
2,53
02,
630
Par
t-tim
e S
alar
y 75
70
00
0U
nifo
rm A
llow
ance
1,
750
1,87
52,
000
2,00
02,
000
Ince
ntiv
e P
ay
2,11
95,
110
1,50
04,
800
4,50
0W
orke
rs C
ompe
nsat
ion
37,8
9037
,260
48,6
0048
,600
49,6
80M
edic
al In
sura
nce
104,
174
103,
988
110,
520
113,
400
115,
690
Den
tal I
nsur
ance
8,
199
8,19
39,
000
8,57
09,
000
Vis
ion
Insu
ranc
e 2,
050
1,77
92,
250
2,04
01,
890
Med
icar
e In
sura
nce
6,08
66,
419
6,99
06,
990
7,08
0S
ervi
ce C
ontri
butio
n-P
ER
S
74,3
59(3
4,58
5)10
4,13
010
6,24
037
,410
Unf
unde
d A
cc L
iabi
lity
- PE
RS
0
00
071
,890
Def
erre
d C
omp
7,84
37,
797
8,37
09,
500
9,96
0LI
& A
D &
D
732
754
590
590
580
Une
mpl
oym
ent I
nsur
ance
2,
226
2,33
82,
610
2,63
02,
650
LTD
1,
010
1,48
33,
320
3,32
02,
410
Chi
ropr
actic
49
262
154
084
090
0M
edic
al In
-lieu
3,
053
00
00
Oth
er B
enef
its
36,4
5034
,650
38,7
9038
,790
46,1
70C
ell S
tipen
d 60
160
460
060
060
0C
ompe
nsat
ed A
bsen
ce E
xpen
se
055
,513
00
0Sa
larie
s &
Ben
efits
Tot
al70
0,92
266
7,95
881
7,65
082
8,43
084
6,64
0P
osta
ge
1,51
41,
250
1,50
01,
500
1,50
0Te
leph
one
818
969
820
820
850
Cel
lula
r pho
ne c
harg
es
00
040
0E
lect
ricity
14
,862
13,8
1815
,000
15,0
0015
,000
Prin
ting/
Bin
ding
/Dup
licat
ion
171
473
200
200
200
Pho
toco
pyin
g 0
010
010
010
0U
nifo
rms
8,95
010
,584
9,50
09,
500
9,00
0S
afet
y E
quip
men
t 4,
083
5,44
65,
000
5,00
05,
000
Offi
ce S
uppl
ies
494
1,55
91,
000
1,00
01,
000
Mem
bers
hip
& D
ues
200
100
200
200
200
Info
rmat
ion
Sys
tem
s S
oftw
are
2,51
43,
889
2,50
02,
600
3,00
0B
usin
ess
Exp
ense
20
4210
010
00
Con
fere
nce
Exp
ense
19
90
00
0S
peci
al D
ept M
ater
ials
7,
241
16,8
958,
000
10,0
0015
,000
Jani
toria
l Sup
plie
s 2,
847
3,02
03,
000
3,00
03,
000
Gen
eral
Sup
plie
s 83
11,
234
1,00
01,
000
1,50
0Tr
aini
ng a
nd E
duca
tion
758
754
1,00
01,
000
1,00
0S
mal
l Too
ls a
nd E
quip
men
t (5
69)
4,23
66,
000
6,00
05,
000
Ove
rtim
e M
eals
0
250
00
Sup
plie
s &
Ser
vice
s N
OC
0
660
050
00
Mis
c. P
rofe
ssio
nal S
ervi
ces
2,69
015
,517
3,00
03,
000
3,00
0M
isc
Con
tract
Ser
vice
s 38
,893
47,0
9375
,000
75,0
0065
,000
Flee
t Ser
vice
s
317
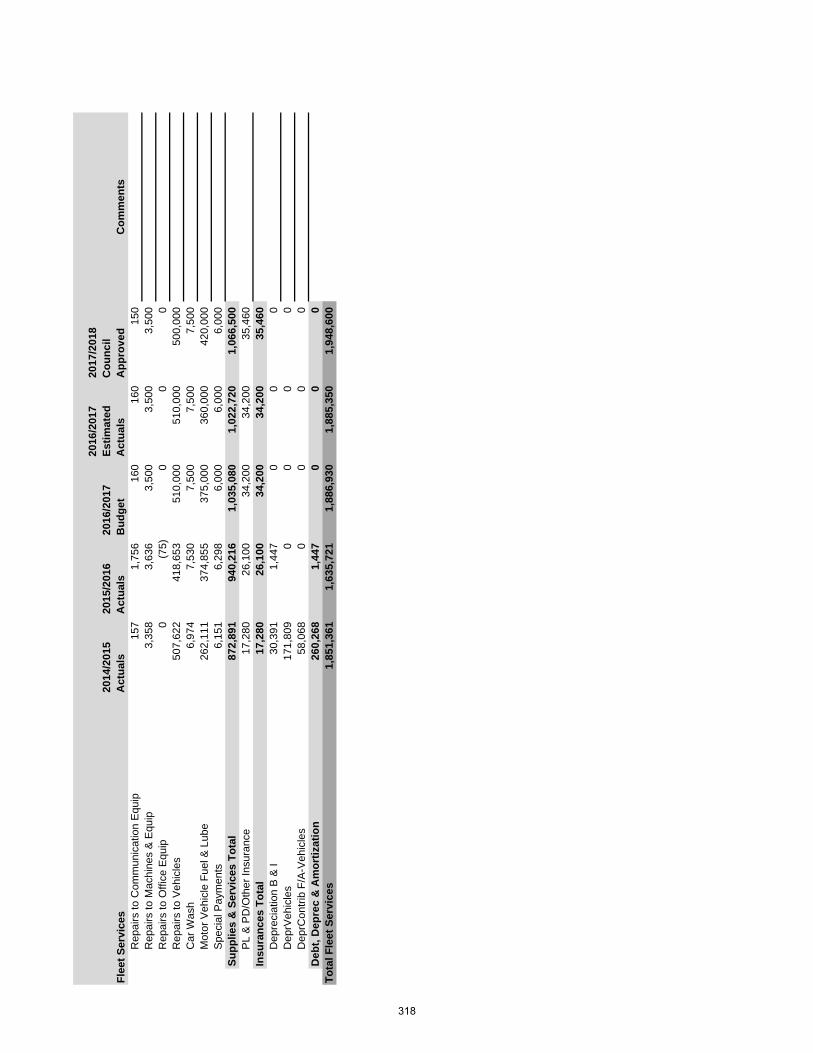
2014
/201
5 A
ctua
ls20
15/2
016
Act
uals
2016
/201
7 B
udge
t
2016
/201
7 Es
timat
ed
Act
uals
2017
/201
8 C
ounc
il A
ppro
ved
Com
men
tsFl
eet S
ervi
ces
Rep
airs
to C
omm
unic
atio
n E
quip
15
71,
756
160
160
150
Rep
airs
to M
achi
nes
& E
quip
3,
358
3,63
63,
500
3,50
03,
500
Rep
airs
to O
ffice
Equ
ip
0(7
5)0
00
Rep
airs
to V
ehic
les
507,
622
418,
653
510,
000
510,
000
500,
000
Car
Was
h 6,
974
7,53
07,
500
7,50
07,
500
Mot
or V
ehic
le F
uel &
Lub
e 26
2,11
137
4,85
537
5,00
036
0,00
042
0,00
0S
peci
al P
aym
ents
6,
151
6,29
86,
000
6,00
06,
000
Supp
lies
& S
ervi
ces
Tota
l87
2,89
194
0,21
61,
035,
080
1,02
2,72
01,
066,
500
PL
& P
D/O
ther
Insu
ranc
e 17
,280
26,1
0034
,200
34,2
0035
,460
Insu
ranc
es T
otal
17,2
8026
,100
34,2
0034
,200
35,4
60D
epre
ciat
ion
B &
I 30
,391
1,44
70
00
Dep
rVeh
icle
s 17
1,80
90
00
0D
eprC
ontri
b F/
A-V
ehic
les
58,0
680
00
0D
ebt,
Dep
rec
& A
mor
tizat
ion
260,
268
1,44
70
00
Tota
l Fle
et S
ervi
ces
1,85
1,36
11,
635,
721
1,88
6,93
01,
885,
350
1,94
8,60
0
318
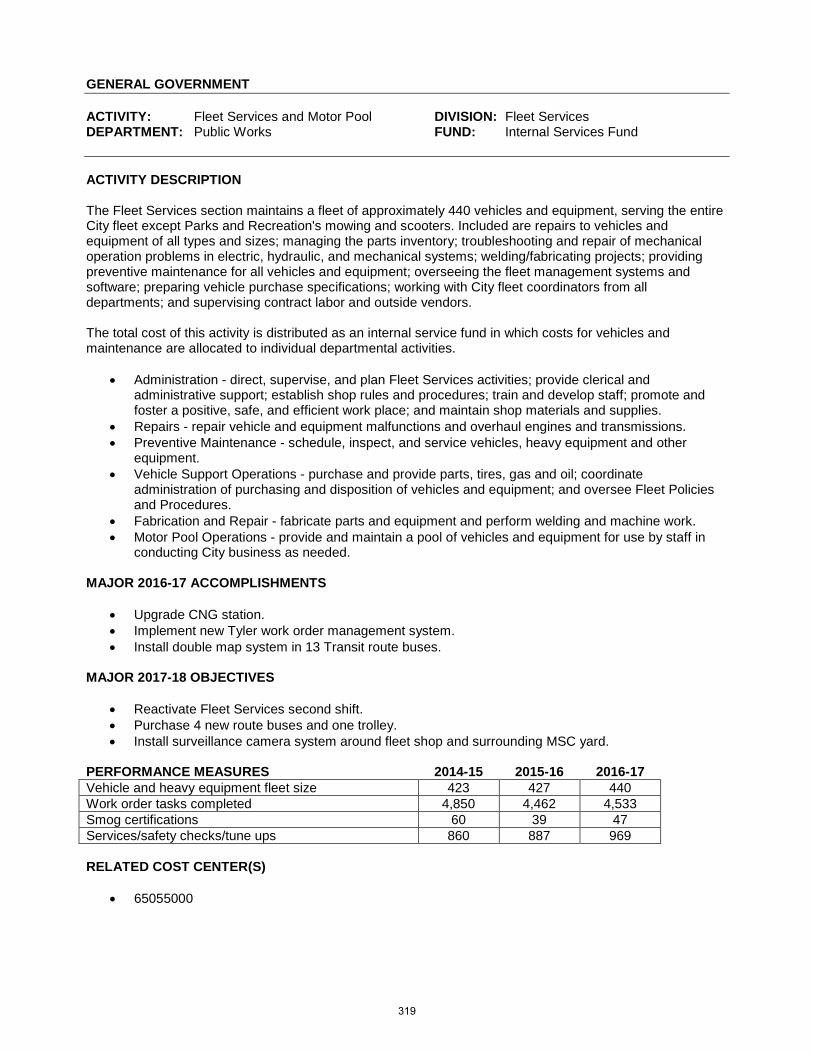
GENERAL GOVERNMENT ACTIVITY: Fleet Services and Motor Pool DIVISION: Fleet Services DEPARTMENT: Public Works FUND: Internal Services Fund ACTIVITY DESCRIPTION The Fleet Services section maintains a fleet of approximately 440 vehicles and equipment, serving the entire City fleet except Parks and Recreation's mowing and scooters. Included are repairs to vehicles and equipment of all types and sizes; managing the parts inventory; troubleshooting and repair of mechanical operation problems in electric, hydraulic, and mechanical systems; welding/fabricating projects; providing preventive maintenance for all vehicles and equipment; overseeing the fleet management systems and software; preparing vehicle purchase specifications; working with City fleet coordinators from all departments; and supervising contract labor and outside vendors. The total cost of this activity is distributed as an internal service fund in which costs for vehicles and maintenance are allocated to individual departmental activities.
• Administration - direct, supervise, and plan Fleet Services activities; provide clerical and administrative support; establish shop rules and procedures; train and develop staff; promote and foster a positive, safe, and efficient work place; and maintain shop materials and supplies.
• Repairs - repair vehicle and equipment malfunctions and overhaul engines and transmissions. • Preventive Maintenance - schedule, inspect, and service vehicles, heavy equipment and other
equipment. • Vehicle Support Operations - purchase and provide parts, tires, gas and oil; coordinate
administration of purchasing and disposition of vehicles and equipment; and oversee Fleet Policies and Procedures.
• Fabrication and Repair - fabricate parts and equipment and perform welding and machine work. • Motor Pool Operations - provide and maintain a pool of vehicles and equipment for use by staff in
conducting City business as needed. MAJOR 2016-17 ACCOMPLISHMENTS
• Upgrade CNG station. • Implement new Tyler work order management system. • Install double map system in 13 Transit route buses.
MAJOR 2017-18 OBJECTIVES
• Reactivate Fleet Services second shift. • Purchase 4 new route buses and one trolley. • Install surveillance camera system around fleet shop and surrounding MSC yard.
PERFORMANCE MEASURES 2014-15 2015-16 2016-17 Vehicle and heavy equipment fleet size 423 427 440 Work order tasks completed 4,850 4,462 4,533 Smog certifications 60 39 47 Services/safety checks/tune ups 860 887 969 RELATED COST CENTER(S)
• 65055000
319
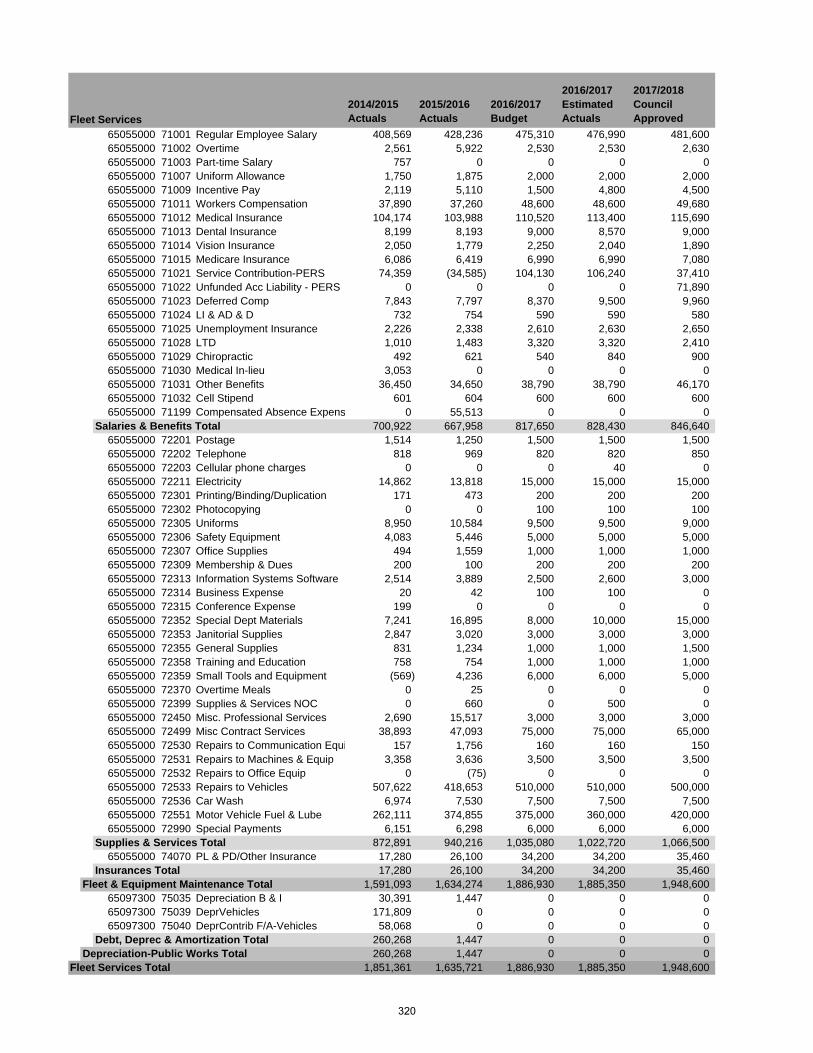
2014/2015 Actuals
2015/2016 Actuals
2016/2017 Budget
2016/2017 Estimated Actuals
2017/2018 Council Approved
65055000 71001 Regular Employee Salary 408,569 428,236 475,310 476,990 481,60065055000 71002 Overtime 2,561 5,922 2,530 2,530 2,63065055000 71003 Part-time Salary 757 0 0 0 065055000 71007 Uniform Allowance 1,750 1,875 2,000 2,000 2,00065055000 71009 Incentive Pay 2,119 5,110 1,500 4,800 4,50065055000 71011 Workers Compensation 37,890 37,260 48,600 48,600 49,68065055000 71012 Medical Insurance 104,174 103,988 110,520 113,400 115,69065055000 71013 Dental Insurance 8,199 8,193 9,000 8,570 9,00065055000 71014 Vision Insurance 2,050 1,779 2,250 2,040 1,89065055000 71015 Medicare Insurance 6,086 6,419 6,990 6,990 7,08065055000 71021 Service Contribution-PERS 74,359 (34,585) 104,130 106,240 37,41065055000 71022 Unfunded Acc Liability - PERS 0 0 0 0 71,89065055000 71023 Deferred Comp 7,843 7,797 8,370 9,500 9,96065055000 71024 LI & AD & D 732 754 590 590 58065055000 71025 Unemployment Insurance 2,226 2,338 2,610 2,630 2,65065055000 71028 LTD 1,010 1,483 3,320 3,320 2,41065055000 71029 Chiropractic 492 621 540 840 90065055000 71030 Medical In-lieu 3,053 0 0 0 065055000 71031 Other Benefits 36,450 34,650 38,790 38,790 46,17065055000 71032 Cell Stipend 601 604 600 600 60065055000 71199 Compensated Absence Expens 0 55,513 0 0 0
Salaries & Benefits Total 700,922 667,958 817,650 828,430 846,64065055000 72201 Postage 1,514 1,250 1,500 1,500 1,50065055000 72202 Telephone 818 969 820 820 85065055000 72203 Cellular phone charges 0 0 0 40 065055000 72211 Electricity 14,862 13,818 15,000 15,000 15,00065055000 72301 Printing/Binding/Duplication 171 473 200 200 20065055000 72302 Photocopying 0 0 100 100 10065055000 72305 Uniforms 8,950 10,584 9,500 9,500 9,00065055000 72306 Safety Equipment 4,083 5,446 5,000 5,000 5,00065055000 72307 Office Supplies 494 1,559 1,000 1,000 1,00065055000 72309 Membership & Dues 200 100 200 200 20065055000 72313 Information Systems Software 2,514 3,889 2,500 2,600 3,00065055000 72314 Business Expense 20 42 100 100 065055000 72315 Conference Expense 199 0 0 0 065055000 72352 Special Dept Materials 7,241 16,895 8,000 10,000 15,00065055000 72353 Janitorial Supplies 2,847 3,020 3,000 3,000 3,00065055000 72355 General Supplies 831 1,234 1,000 1,000 1,50065055000 72358 Training and Education 758 754 1,000 1,000 1,00065055000 72359 Small Tools and Equipment (569) 4,236 6,000 6,000 5,00065055000 72370 Overtime Meals 0 25 0 0 065055000 72399 Supplies & Services NOC 0 660 0 500 065055000 72450 Misc. Professional Services 2,690 15,517 3,000 3,000 3,00065055000 72499 Misc Contract Services 38,893 47,093 75,000 75,000 65,00065055000 72530 Repairs to Communication Equi 157 1,756 160 160 15065055000 72531 Repairs to Machines & Equip 3,358 3,636 3,500 3,500 3,50065055000 72532 Repairs to Office Equip 0 (75) 0 0 065055000 72533 Repairs to Vehicles 507,622 418,653 510,000 510,000 500,00065055000 72536 Car Wash 6,974 7,530 7,500 7,500 7,50065055000 72551 Motor Vehicle Fuel & Lube 262,111 374,855 375,000 360,000 420,00065055000 72990 Special Payments 6,151 6,298 6,000 6,000 6,000
Supplies & Services Total 872,891 940,216 1,035,080 1,022,720 1,066,50065055000 74070 PL & PD/Other Insurance 17,280 26,100 34,200 34,200 35,460
Insurances Total 17,280 26,100 34,200 34,200 35,460Fleet & Equipment Maintenance Total 1,591,093 1,634,274 1,886,930 1,885,350 1,948,600
65097300 75035 Depreciation B & I 30,391 1,447 0 0 065097300 75039 DeprVehicles 171,809 0 0 0 065097300 75040 DeprContrib F/A-Vehicles 58,068 0 0 0 0
Debt, Deprec & Amortization Total 260,268 1,447 0 0 0Depreciation-Public Works Total 260,268 1,447 0 0 0
Fleet Services Total 1,851,361 1,635,721 1,886,930 1,885,350 1,948,600
Fleet Services
320
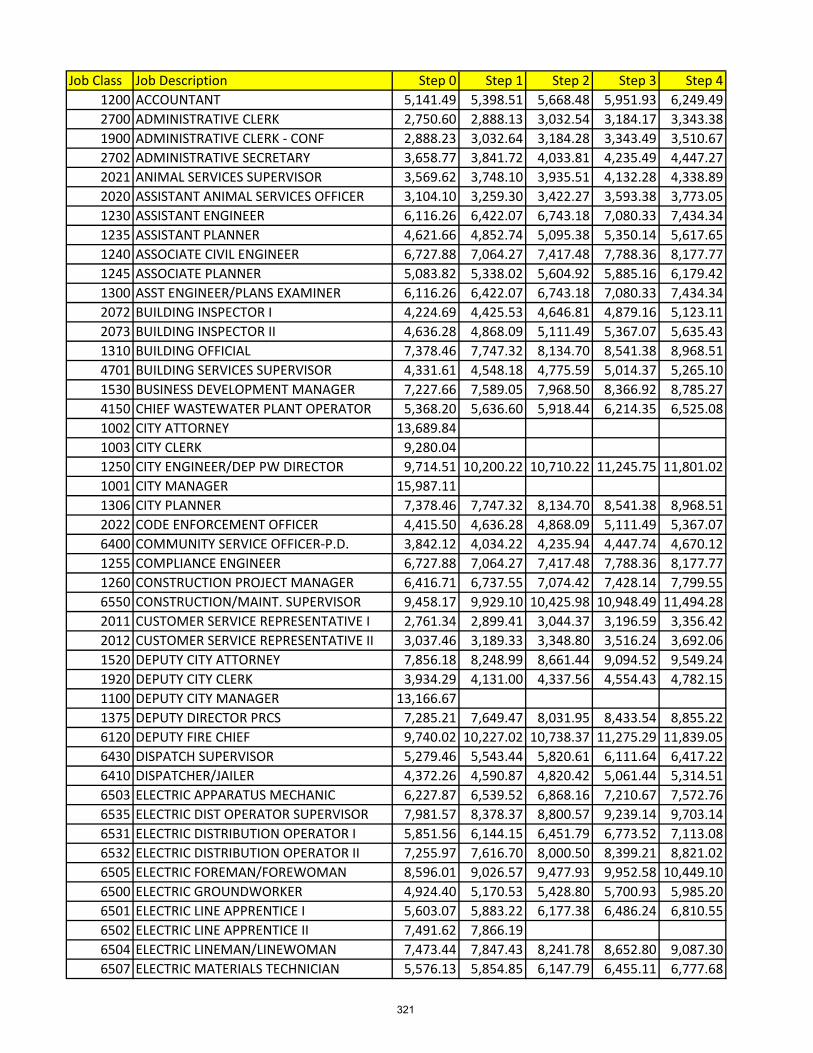
Job Class Job Description Step 0 Step 1 Step 2 Step 3 Step 41200 ACCOUNTANT 5,141.49 5,398.51 5,668.48 5,951.93 6,249.492700 ADMINISTRATIVE CLERK 2,750.60 2,888.13 3,032.54 3,184.17 3,343.381900 ADMINISTRATIVE CLERK - CONF 2,888.23 3,032.64 3,184.28 3,343.49 3,510.672702 ADMINISTRATIVE SECRETARY 3,658.77 3,841.72 4,033.81 4,235.49 4,447.272021 ANIMAL SERVICES SUPERVISOR 3,569.62 3,748.10 3,935.51 4,132.28 4,338.892020 ASSISTANT ANIMAL SERVICES OFFICER 3,104.10 3,259.30 3,422.27 3,593.38 3,773.051230 ASSISTANT ENGINEER 6,116.26 6,422.07 6,743.18 7,080.33 7,434.341235 ASSISTANT PLANNER 4,621.66 4,852.74 5,095.38 5,350.14 5,617.651240 ASSOCIATE CIVIL ENGINEER 6,727.88 7,064.27 7,417.48 7,788.36 8,177.771245 ASSOCIATE PLANNER 5,083.82 5,338.02 5,604.92 5,885.16 6,179.421300 ASST ENGINEER/PLANS EXAMINER 6,116.26 6,422.07 6,743.18 7,080.33 7,434.342072 BUILDING INSPECTOR I 4,224.69 4,425.53 4,646.81 4,879.16 5,123.112073 BUILDING INSPECTOR II 4,636.28 4,868.09 5,111.49 5,367.07 5,635.431310 BUILDING OFFICIAL 7,378.46 7,747.32 8,134.70 8,541.38 8,968.514701 BUILDING SERVICES SUPERVISOR 4,331.61 4,548.18 4,775.59 5,014.37 5,265.101530 BUSINESS DEVELOPMENT MANAGER 7,227.66 7,589.05 7,968.50 8,366.92 8,785.274150 CHIEF WASTEWATER PLANT OPERATOR 5,368.20 5,636.60 5,918.44 6,214.35 6,525.081002 CITY ATTORNEY 13,689.841003 CITY CLERK 9,280.041250 CITY ENGINEER/DEP PW DIRECTOR 9,714.51 10,200.22 10,710.22 11,245.75 11,801.021001 CITY MANAGER 15,987.111306 CITY PLANNER 7,378.46 7,747.32 8,134.70 8,541.38 8,968.512022 CODE ENFORCEMENT OFFICER 4,415.50 4,636.28 4,868.09 5,111.49 5,367.076400 COMMUNITY SERVICE OFFICER-P.D. 3,842.12 4,034.22 4,235.94 4,447.74 4,670.121255 COMPLIANCE ENGINEER 6,727.88 7,064.27 7,417.48 7,788.36 8,177.771260 CONSTRUCTION PROJECT MANAGER 6,416.71 6,737.55 7,074.42 7,428.14 7,799.556550 CONSTRUCTION/MAINT. SUPERVISOR 9,458.17 9,929.10 10,425.98 10,948.49 11,494.282011 CUSTOMER SERVICE REPRESENTATIVE I 2,761.34 2,899.41 3,044.37 3,196.59 3,356.422012 CUSTOMER SERVICE REPRESENTATIVE II 3,037.46 3,189.33 3,348.80 3,516.24 3,692.061520 DEPUTY CITY ATTORNEY 7,856.18 8,248.99 8,661.44 9,094.52 9,549.241920 DEPUTY CITY CLERK 3,934.29 4,131.00 4,337.56 4,554.43 4,782.151100 DEPUTY CITY MANAGER 13,166.671375 DEPUTY DIRECTOR PRCS 7,285.21 7,649.47 8,031.95 8,433.54 8,855.226120 DEPUTY FIRE CHIEF 9,740.02 10,227.02 10,738.37 11,275.29 11,839.056430 DISPATCH SUPERVISOR 5,279.46 5,543.44 5,820.61 6,111.64 6,417.226410 DISPATCHER/JAILER 4,372.26 4,590.87 4,820.42 5,061.44 5,314.516503 ELECTRIC APPARATUS MECHANIC 6,227.87 6,539.52 6,868.16 7,210.67 7,572.766535 ELECTRIC DIST OPERATOR SUPERVISOR 7,981.57 8,378.37 8,800.57 9,239.14 9,703.146531 ELECTRIC DISTRIBUTION OPERATOR I 5,851.56 6,144.15 6,451.79 6,773.52 7,113.086532 ELECTRIC DISTRIBUTION OPERATOR II 7,255.97 7,616.70 8,000.50 8,399.21 8,821.026505 ELECTRIC FOREMAN/FOREWOMAN 8,596.01 9,026.57 9,477.93 9,952.58 10,449.106500 ELECTRIC GROUNDWORKER 4,924.40 5,170.53 5,428.80 5,700.93 5,985.206501 ELECTRIC LINE APPRENTICE I 5,603.07 5,883.22 6,177.38 6,486.24 6,810.556502 ELECTRIC LINE APPRENTICE II 7,491.62 7,866.196504 ELECTRIC LINEMAN/LINEWOMAN 7,473.44 7,847.43 8,241.78 8,652.80 9,087.306507 ELECTRIC MATERIALS TECHNICIAN 5,576.13 5,854.85 6,147.79 6,455.11 6,777.68
321
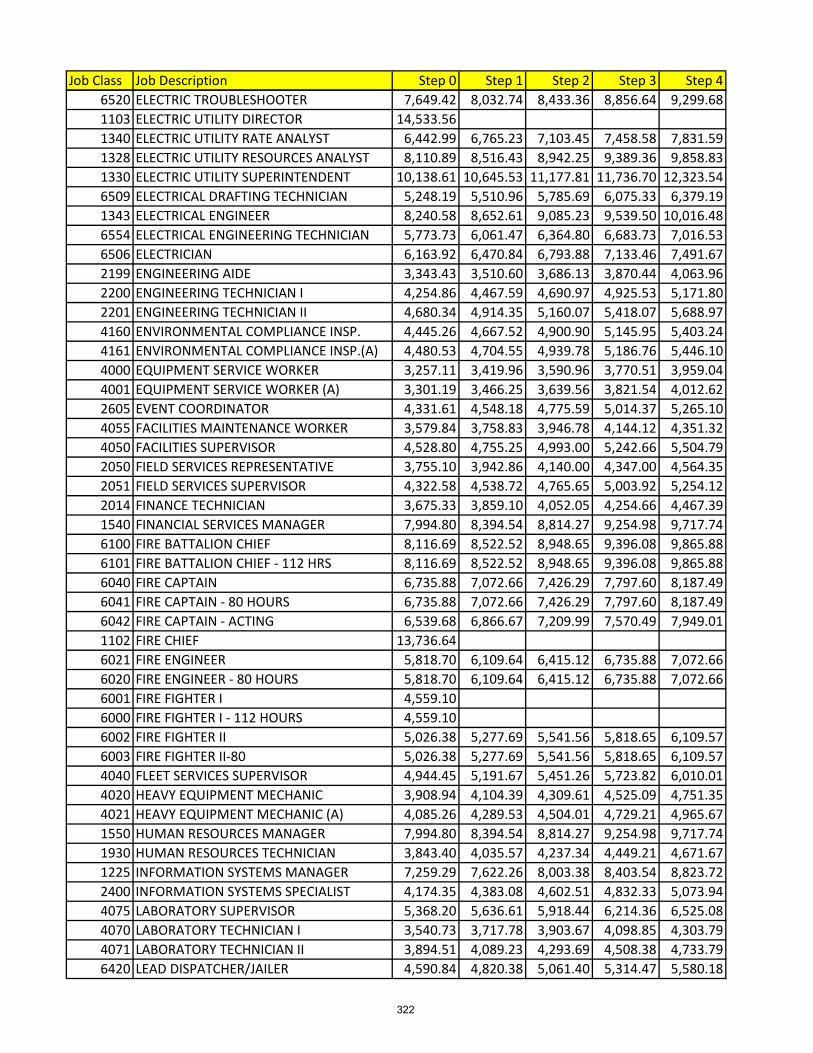
Job Class Job Description Step 0 Step 1 Step 2 Step 3 Step 46520 ELECTRIC TROUBLESHOOTER 7,649.42 8,032.74 8,433.36 8,856.64 9,299.681103 ELECTRIC UTILITY DIRECTOR 14,533.561340 ELECTRIC UTILITY RATE ANALYST 6,442.99 6,765.23 7,103.45 7,458.58 7,831.591328 ELECTRIC UTILITY RESOURCES ANALYST 8,110.89 8,516.43 8,942.25 9,389.36 9,858.831330 ELECTRIC UTILITY SUPERINTENDENT 10,138.61 10,645.53 11,177.81 11,736.70 12,323.546509 ELECTRICAL DRAFTING TECHNICIAN 5,248.19 5,510.96 5,785.69 6,075.33 6,379.191343 ELECTRICAL ENGINEER 8,240.58 8,652.61 9,085.23 9,539.50 10,016.486554 ELECTRICAL ENGINEERING TECHNICIAN 5,773.73 6,061.47 6,364.80 6,683.73 7,016.536506 ELECTRICIAN 6,163.92 6,470.84 6,793.88 7,133.46 7,491.672199 ENGINEERING AIDE 3,343.43 3,510.60 3,686.13 3,870.44 4,063.962200 ENGINEERING TECHNICIAN I 4,254.86 4,467.59 4,690.97 4,925.53 5,171.802201 ENGINEERING TECHNICIAN II 4,680.34 4,914.35 5,160.07 5,418.07 5,688.974160 ENVIRONMENTAL COMPLIANCE INSP. 4,445.26 4,667.52 4,900.90 5,145.95 5,403.244161 ENVIRONMENTAL COMPLIANCE INSP.(A) 4,480.53 4,704.55 4,939.78 5,186.76 5,446.104000 EQUIPMENT SERVICE WORKER 3,257.11 3,419.96 3,590.96 3,770.51 3,959.044001 EQUIPMENT SERVICE WORKER (A) 3,301.19 3,466.25 3,639.56 3,821.54 4,012.622605 EVENT COORDINATOR 4,331.61 4,548.18 4,775.59 5,014.37 5,265.104055 FACILITIES MAINTENANCE WORKER 3,579.84 3,758.83 3,946.78 4,144.12 4,351.324050 FACILITIES SUPERVISOR 4,528.80 4,755.25 4,993.00 5,242.66 5,504.792050 FIELD SERVICES REPRESENTATIVE 3,755.10 3,942.86 4,140.00 4,347.00 4,564.352051 FIELD SERVICES SUPERVISOR 4,322.58 4,538.72 4,765.65 5,003.92 5,254.122014 FINANCE TECHNICIAN 3,675.33 3,859.10 4,052.05 4,254.66 4,467.391540 FINANCIAL SERVICES MANAGER 7,994.80 8,394.54 8,814.27 9,254.98 9,717.746100 FIRE BATTALION CHIEF 8,116.69 8,522.52 8,948.65 9,396.08 9,865.886101 FIRE BATTALION CHIEF - 112 HRS 8,116.69 8,522.52 8,948.65 9,396.08 9,865.886040 FIRE CAPTAIN 6,735.88 7,072.66 7,426.29 7,797.60 8,187.496041 FIRE CAPTAIN - 80 HOURS 6,735.88 7,072.66 7,426.29 7,797.60 8,187.496042 FIRE CAPTAIN - ACTING 6,539.68 6,866.67 7,209.99 7,570.49 7,949.011102 FIRE CHIEF 13,736.646021 FIRE ENGINEER 5,818.70 6,109.64 6,415.12 6,735.88 7,072.666020 FIRE ENGINEER - 80 HOURS 5,818.70 6,109.64 6,415.12 6,735.88 7,072.666001 FIRE FIGHTER I 4,559.106000 FIRE FIGHTER I - 112 HOURS 4,559.106002 FIRE FIGHTER II 5,026.38 5,277.69 5,541.56 5,818.65 6,109.576003 FIRE FIGHTER II-80 5,026.38 5,277.69 5,541.56 5,818.65 6,109.574040 FLEET SERVICES SUPERVISOR 4,944.45 5,191.67 5,451.26 5,723.82 6,010.014020 HEAVY EQUIPMENT MECHANIC 3,908.94 4,104.39 4,309.61 4,525.09 4,751.354021 HEAVY EQUIPMENT MECHANIC (A) 4,085.26 4,289.53 4,504.01 4,729.21 4,965.671550 HUMAN RESOURCES MANAGER 7,994.80 8,394.54 8,814.27 9,254.98 9,717.741930 HUMAN RESOURCES TECHNICIAN 3,843.40 4,035.57 4,237.34 4,449.21 4,671.671225 INFORMATION SYSTEMS MANAGER 7,259.29 7,622.26 8,003.38 8,403.54 8,823.722400 INFORMATION SYSTEMS SPECIALIST 4,174.35 4,383.08 4,602.51 4,832.33 5,073.944075 LABORATORY SUPERVISOR 5,368.20 5,636.61 5,918.44 6,214.36 6,525.084070 LABORATORY TECHNICIAN I 3,540.73 3,717.78 3,903.67 4,098.85 4,303.794071 LABORATORY TECHNICIAN II 3,894.51 4,089.23 4,293.69 4,508.38 4,733.796420 LEAD DISPATCHER/JAILER 4,590.84 4,820.38 5,061.40 5,314.47 5,580.18
322
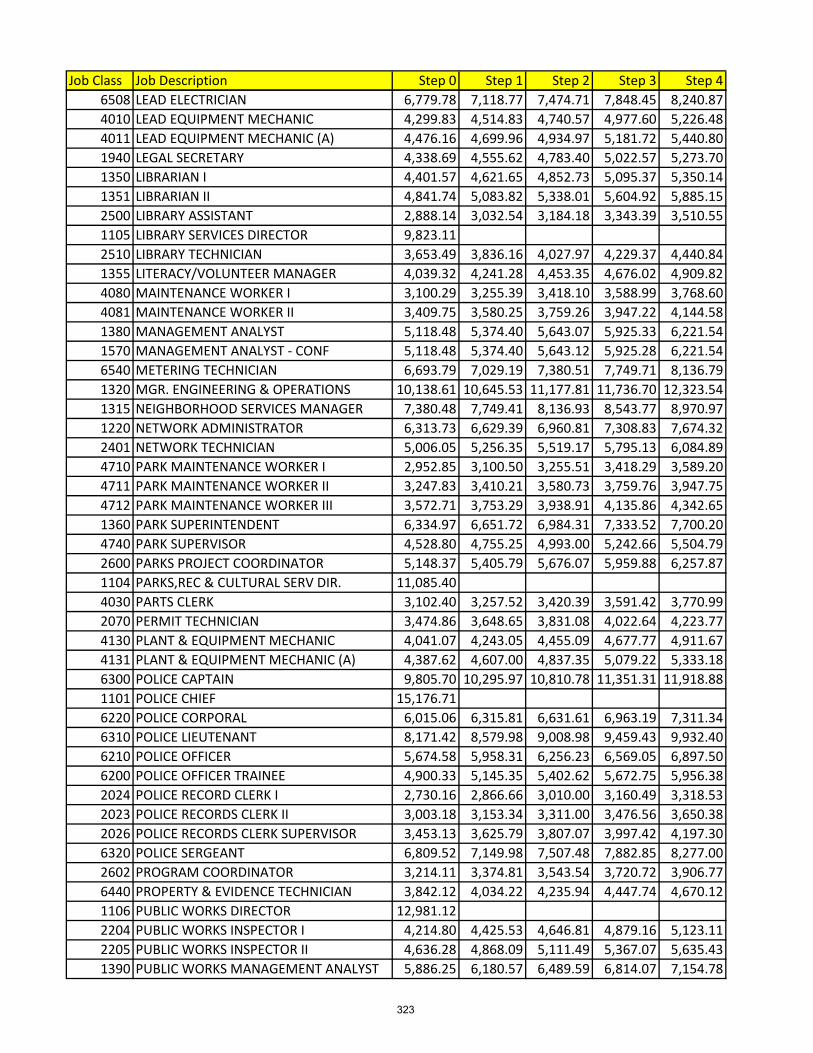
Job Class Job Description Step 0 Step 1 Step 2 Step 3 Step 46508 LEAD ELECTRICIAN 6,779.78 7,118.77 7,474.71 7,848.45 8,240.874010 LEAD EQUIPMENT MECHANIC 4,299.83 4,514.83 4,740.57 4,977.60 5,226.484011 LEAD EQUIPMENT MECHANIC (A) 4,476.16 4,699.96 4,934.97 5,181.72 5,440.801940 LEGAL SECRETARY 4,338.69 4,555.62 4,783.40 5,022.57 5,273.701350 LIBRARIAN I 4,401.57 4,621.65 4,852.73 5,095.37 5,350.141351 LIBRARIAN II 4,841.74 5,083.82 5,338.01 5,604.92 5,885.152500 LIBRARY ASSISTANT 2,888.14 3,032.54 3,184.18 3,343.39 3,510.551105 LIBRARY SERVICES DIRECTOR 9,823.112510 LIBRARY TECHNICIAN 3,653.49 3,836.16 4,027.97 4,229.37 4,440.841355 LITERACY/VOLUNTEER MANAGER 4,039.32 4,241.28 4,453.35 4,676.02 4,909.824080 MAINTENANCE WORKER I 3,100.29 3,255.39 3,418.10 3,588.99 3,768.604081 MAINTENANCE WORKER II 3,409.75 3,580.25 3,759.26 3,947.22 4,144.581380 MANAGEMENT ANALYST 5,118.48 5,374.40 5,643.07 5,925.33 6,221.541570 MANAGEMENT ANALYST - CONF 5,118.48 5,374.40 5,643.12 5,925.28 6,221.546540 METERING TECHNICIAN 6,693.79 7,029.19 7,380.51 7,749.71 8,136.791320 MGR. ENGINEERING & OPERATIONS 10,138.61 10,645.53 11,177.81 11,736.70 12,323.541315 NEIGHBORHOOD SERVICES MANAGER 7,380.48 7,749.41 8,136.93 8,543.77 8,970.971220 NETWORK ADMINISTRATOR 6,313.73 6,629.39 6,960.81 7,308.83 7,674.322401 NETWORK TECHNICIAN 5,006.05 5,256.35 5,519.17 5,795.13 6,084.894710 PARK MAINTENANCE WORKER I 2,952.85 3,100.50 3,255.51 3,418.29 3,589.204711 PARK MAINTENANCE WORKER II 3,247.83 3,410.21 3,580.73 3,759.76 3,947.754712 PARK MAINTENANCE WORKER III 3,572.71 3,753.29 3,938.91 4,135.86 4,342.651360 PARK SUPERINTENDENT 6,334.97 6,651.72 6,984.31 7,333.52 7,700.204740 PARK SUPERVISOR 4,528.80 4,755.25 4,993.00 5,242.66 5,504.792600 PARKS PROJECT COORDINATOR 5,148.37 5,405.79 5,676.07 5,959.88 6,257.871104 PARKS,REC & CULTURAL SERV DIR. 11,085.404030 PARTS CLERK 3,102.40 3,257.52 3,420.39 3,591.42 3,770.992070 PERMIT TECHNICIAN 3,474.86 3,648.65 3,831.08 4,022.64 4,223.774130 PLANT & EQUIPMENT MECHANIC 4,041.07 4,243.05 4,455.09 4,677.77 4,911.674131 PLANT & EQUIPMENT MECHANIC (A) 4,387.62 4,607.00 4,837.35 5,079.22 5,333.186300 POLICE CAPTAIN 9,805.70 10,295.97 10,810.78 11,351.31 11,918.881101 POLICE CHIEF 15,176.716220 POLICE CORPORAL 6,015.06 6,315.81 6,631.61 6,963.19 7,311.346310 POLICE LIEUTENANT 8,171.42 8,579.98 9,008.98 9,459.43 9,932.406210 POLICE OFFICER 5,674.58 5,958.31 6,256.23 6,569.05 6,897.506200 POLICE OFFICER TRAINEE 4,900.33 5,145.35 5,402.62 5,672.75 5,956.382024 POLICE RECORD CLERK I 2,730.16 2,866.66 3,010.00 3,160.49 3,318.532023 POLICE RECORDS CLERK II 3,003.18 3,153.34 3,311.00 3,476.56 3,650.382026 POLICE RECORDS CLERK SUPERVISOR 3,453.13 3,625.79 3,807.07 3,997.42 4,197.306320 POLICE SERGEANT 6,809.52 7,149.98 7,507.48 7,882.85 8,277.002602 PROGRAM COORDINATOR 3,214.11 3,374.81 3,543.54 3,720.72 3,906.776440 PROPERTY & EVIDENCE TECHNICIAN 3,842.12 4,034.22 4,235.94 4,447.74 4,670.121106 PUBLIC WORKS DIRECTOR 12,981.122204 PUBLIC WORKS INSPECTOR I 4,214.80 4,425.53 4,646.81 4,879.16 5,123.112205 PUBLIC WORKS INSPECTOR II 4,636.28 4,868.09 5,111.49 5,367.07 5,635.431390 PUBLIC WORKS MANAGEMENT ANALYST 5,886.25 6,180.57 6,489.59 6,814.07 7,154.78
323
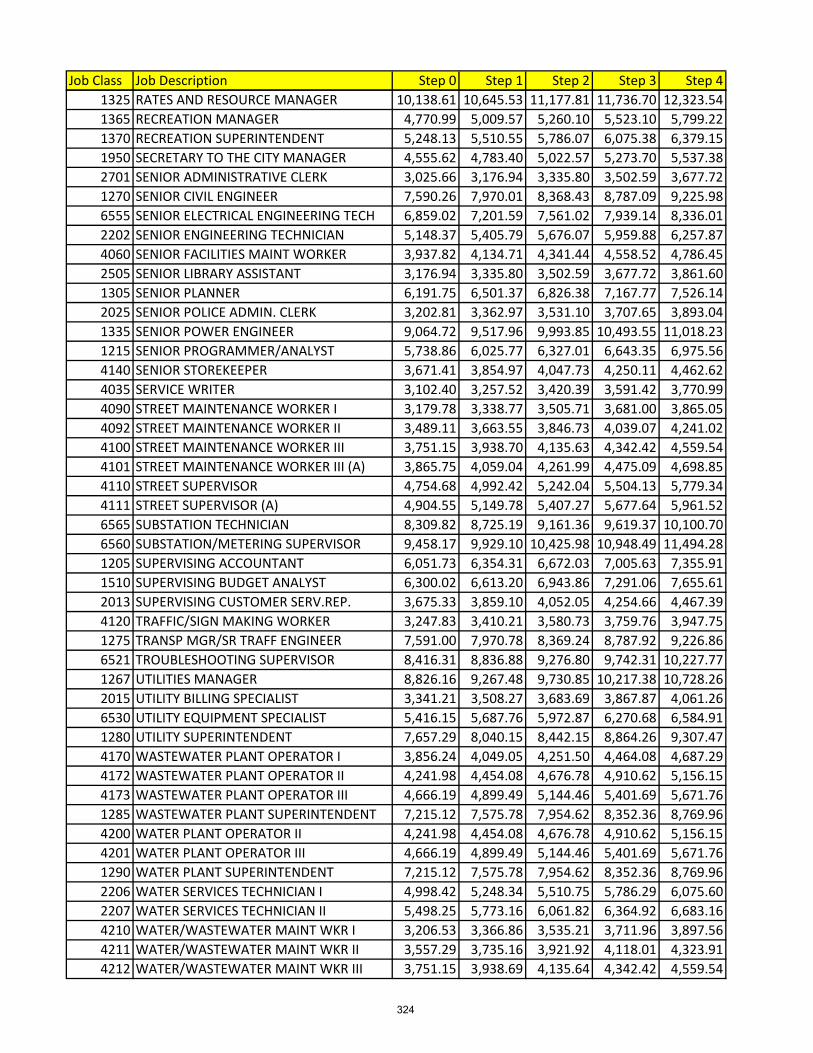
Job Class Job Description Step 0 Step 1 Step 2 Step 3 Step 41325 RATES AND RESOURCE MANAGER 10,138.61 10,645.53 11,177.81 11,736.70 12,323.541365 RECREATION MANAGER 4,770.99 5,009.57 5,260.10 5,523.10 5,799.221370 RECREATION SUPERINTENDENT 5,248.13 5,510.55 5,786.07 6,075.38 6,379.151950 SECRETARY TO THE CITY MANAGER 4,555.62 4,783.40 5,022.57 5,273.70 5,537.382701 SENIOR ADMINISTRATIVE CLERK 3,025.66 3,176.94 3,335.80 3,502.59 3,677.721270 SENIOR CIVIL ENGINEER 7,590.26 7,970.01 8,368.43 8,787.09 9,225.986555 SENIOR ELECTRICAL ENGINEERING TECH 6,859.02 7,201.59 7,561.02 7,939.14 8,336.012202 SENIOR ENGINEERING TECHNICIAN 5,148.37 5,405.79 5,676.07 5,959.88 6,257.874060 SENIOR FACILITIES MAINT WORKER 3,937.82 4,134.71 4,341.44 4,558.52 4,786.452505 SENIOR LIBRARY ASSISTANT 3,176.94 3,335.80 3,502.59 3,677.72 3,861.601305 SENIOR PLANNER 6,191.75 6,501.37 6,826.38 7,167.77 7,526.142025 SENIOR POLICE ADMIN. CLERK 3,202.81 3,362.97 3,531.10 3,707.65 3,893.041335 SENIOR POWER ENGINEER 9,064.72 9,517.96 9,993.85 10,493.55 11,018.231215 SENIOR PROGRAMMER/ANALYST 5,738.86 6,025.77 6,327.01 6,643.35 6,975.564140 SENIOR STOREKEEPER 3,671.41 3,854.97 4,047.73 4,250.11 4,462.624035 SERVICE WRITER 3,102.40 3,257.52 3,420.39 3,591.42 3,770.994090 STREET MAINTENANCE WORKER I 3,179.78 3,338.77 3,505.71 3,681.00 3,865.054092 STREET MAINTENANCE WORKER II 3,489.11 3,663.55 3,846.73 4,039.07 4,241.024100 STREET MAINTENANCE WORKER III 3,751.15 3,938.70 4,135.63 4,342.42 4,559.544101 STREET MAINTENANCE WORKER III (A) 3,865.75 4,059.04 4,261.99 4,475.09 4,698.854110 STREET SUPERVISOR 4,754.68 4,992.42 5,242.04 5,504.13 5,779.344111 STREET SUPERVISOR (A) 4,904.55 5,149.78 5,407.27 5,677.64 5,961.526565 SUBSTATION TECHNICIAN 8,309.82 8,725.19 9,161.36 9,619.37 10,100.706560 SUBSTATION/METERING SUPERVISOR 9,458.17 9,929.10 10,425.98 10,948.49 11,494.281205 SUPERVISING ACCOUNTANT 6,051.73 6,354.31 6,672.03 7,005.63 7,355.911510 SUPERVISING BUDGET ANALYST 6,300.02 6,613.20 6,943.86 7,291.06 7,655.612013 SUPERVISING CUSTOMER SERV.REP. 3,675.33 3,859.10 4,052.05 4,254.66 4,467.394120 TRAFFIC/SIGN MAKING WORKER 3,247.83 3,410.21 3,580.73 3,759.76 3,947.751275 TRANSP MGR/SR TRAFF ENGINEER 7,591.00 7,970.78 8,369.24 8,787.92 9,226.866521 TROUBLESHOOTING SUPERVISOR 8,416.31 8,836.88 9,276.80 9,742.31 10,227.771267 UTILITIES MANAGER 8,826.16 9,267.48 9,730.85 10,217.38 10,728.262015 UTILITY BILLING SPECIALIST 3,341.21 3,508.27 3,683.69 3,867.87 4,061.266530 UTILITY EQUIPMENT SPECIALIST 5,416.15 5,687.76 5,972.87 6,270.68 6,584.911280 UTILITY SUPERINTENDENT 7,657.29 8,040.15 8,442.15 8,864.26 9,307.474170 WASTEWATER PLANT OPERATOR I 3,856.24 4,049.05 4,251.50 4,464.08 4,687.294172 WASTEWATER PLANT OPERATOR II 4,241.98 4,454.08 4,676.78 4,910.62 5,156.154173 WASTEWATER PLANT OPERATOR III 4,666.19 4,899.49 5,144.46 5,401.69 5,671.761285 WASTEWATER PLANT SUPERINTENDENT 7,215.12 7,575.78 7,954.62 8,352.36 8,769.964200 WATER PLANT OPERATOR II 4,241.98 4,454.08 4,676.78 4,910.62 5,156.154201 WATER PLANT OPERATOR III 4,666.19 4,899.49 5,144.46 5,401.69 5,671.761290 WATER PLANT SUPERINTENDENT 7,215.12 7,575.78 7,954.62 8,352.36 8,769.962206 WATER SERVICES TECHNICIAN I 4,998.42 5,248.34 5,510.75 5,786.29 6,075.602207 WATER SERVICES TECHNICIAN II 5,498.25 5,773.16 6,061.82 6,364.92 6,683.164210 WATER/WASTEWATER MAINT WKR I 3,206.53 3,366.86 3,535.21 3,711.96 3,897.564211 WATER/WASTEWATER MAINT WKR II 3,557.29 3,735.16 3,921.92 4,118.01 4,323.914212 WATER/WASTEWATER MAINT WKR III 3,751.15 3,938.69 4,135.64 4,342.42 4,559.54
324
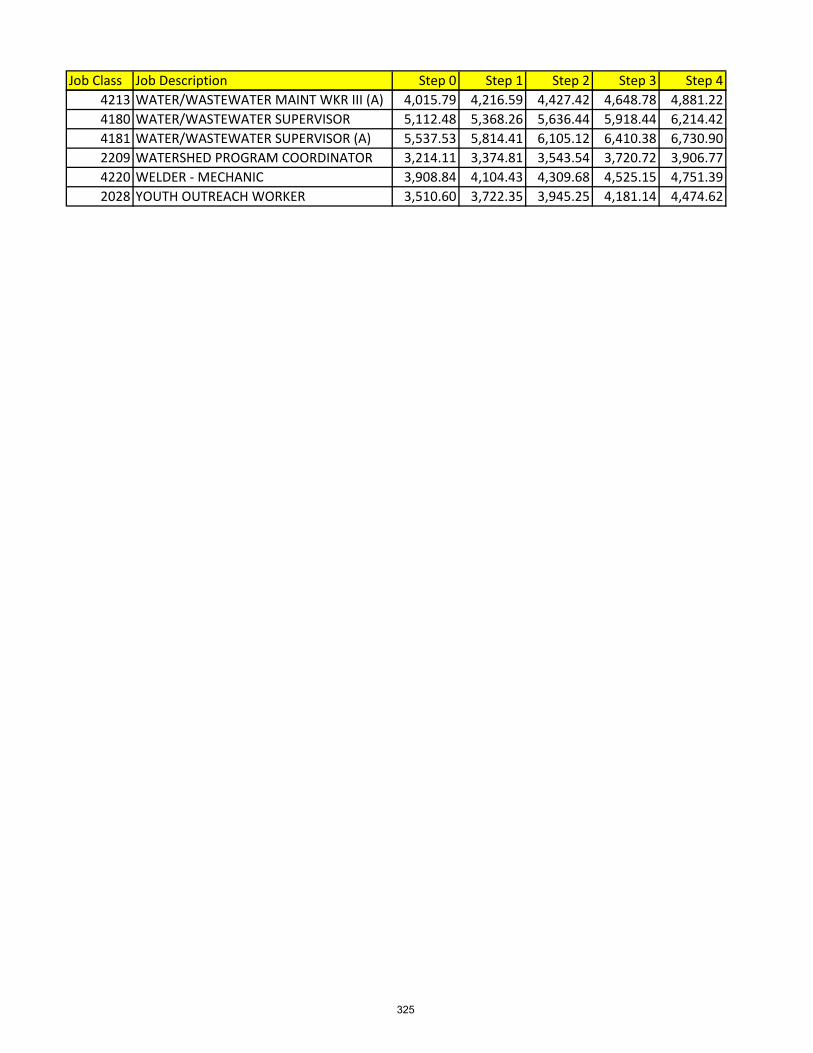
Job Class Job Description Step 0 Step 1 Step 2 Step 3 Step 44213 WATER/WASTEWATER MAINT WKR III (A) 4,015.79 4,216.59 4,427.42 4,648.78 4,881.224180 WATER/WASTEWATER SUPERVISOR 5,112.48 5,368.26 5,636.44 5,918.44 6,214.424181 WATER/WASTEWATER SUPERVISOR (A) 5,537.53 5,814.41 6,105.12 6,410.38 6,730.902209 WATERSHED PROGRAM COORDINATOR 3,214.11 3,374.81 3,543.54 3,720.72 3,906.774220 WELDER - MECHANIC 3,908.84 4,104.43 4,309.68 4,525.15 4,751.392028 YOUTH OUTREACH WORKER 3,510.60 3,722.35 3,945.25 4,181.14 4,474.62
325
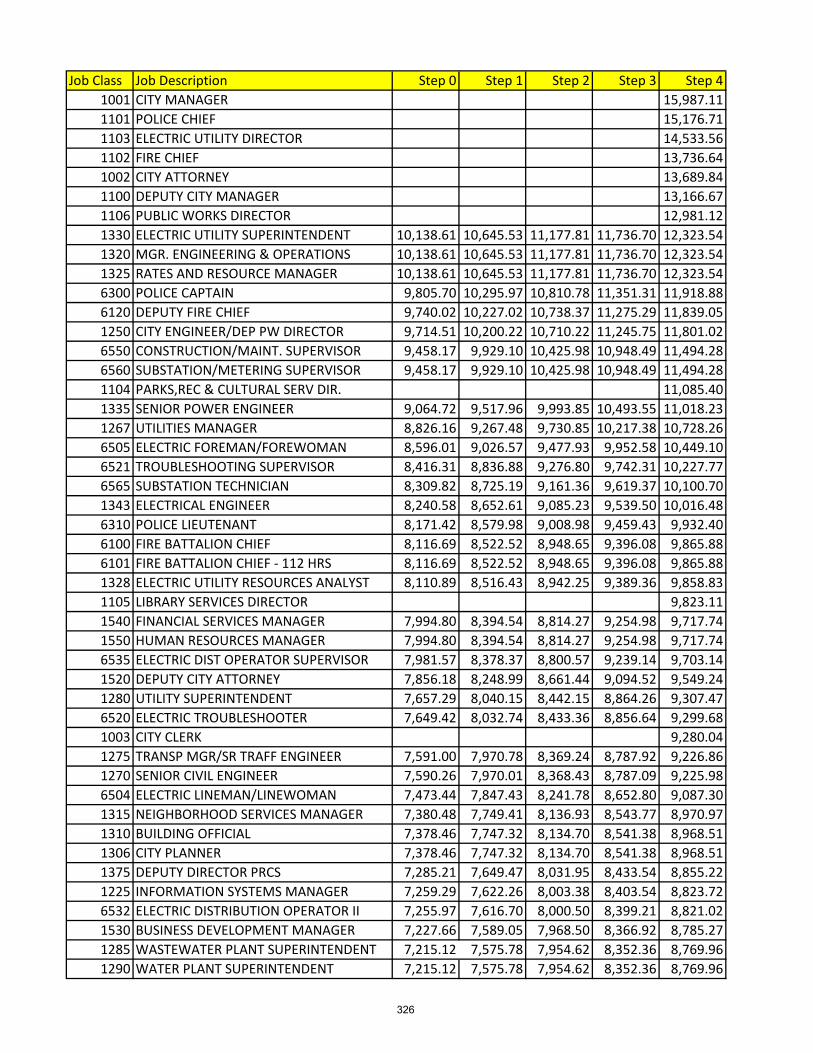
Job Class Job Description Step 0 Step 1 Step 2 Step 3 Step 41001 CITY MANAGER 15,987.111101 POLICE CHIEF 15,176.711103 ELECTRIC UTILITY DIRECTOR 14,533.561102 FIRE CHIEF 13,736.641002 CITY ATTORNEY 13,689.841100 DEPUTY CITY MANAGER 13,166.671106 PUBLIC WORKS DIRECTOR 12,981.121330 ELECTRIC UTILITY SUPERINTENDENT 10,138.61 10,645.53 11,177.81 11,736.70 12,323.541320 MGR. ENGINEERING & OPERATIONS 10,138.61 10,645.53 11,177.81 11,736.70 12,323.541325 RATES AND RESOURCE MANAGER 10,138.61 10,645.53 11,177.81 11,736.70 12,323.546300 POLICE CAPTAIN 9,805.70 10,295.97 10,810.78 11,351.31 11,918.886120 DEPUTY FIRE CHIEF 9,740.02 10,227.02 10,738.37 11,275.29 11,839.051250 CITY ENGINEER/DEP PW DIRECTOR 9,714.51 10,200.22 10,710.22 11,245.75 11,801.026550 CONSTRUCTION/MAINT. SUPERVISOR 9,458.17 9,929.10 10,425.98 10,948.49 11,494.286560 SUBSTATION/METERING SUPERVISOR 9,458.17 9,929.10 10,425.98 10,948.49 11,494.281104 PARKS,REC & CULTURAL SERV DIR. 11,085.401335 SENIOR POWER ENGINEER 9,064.72 9,517.96 9,993.85 10,493.55 11,018.231267 UTILITIES MANAGER 8,826.16 9,267.48 9,730.85 10,217.38 10,728.266505 ELECTRIC FOREMAN/FOREWOMAN 8,596.01 9,026.57 9,477.93 9,952.58 10,449.106521 TROUBLESHOOTING SUPERVISOR 8,416.31 8,836.88 9,276.80 9,742.31 10,227.776565 SUBSTATION TECHNICIAN 8,309.82 8,725.19 9,161.36 9,619.37 10,100.701343 ELECTRICAL ENGINEER 8,240.58 8,652.61 9,085.23 9,539.50 10,016.486310 POLICE LIEUTENANT 8,171.42 8,579.98 9,008.98 9,459.43 9,932.406100 FIRE BATTALION CHIEF 8,116.69 8,522.52 8,948.65 9,396.08 9,865.886101 FIRE BATTALION CHIEF - 112 HRS 8,116.69 8,522.52 8,948.65 9,396.08 9,865.881328 ELECTRIC UTILITY RESOURCES ANALYST 8,110.89 8,516.43 8,942.25 9,389.36 9,858.831105 LIBRARY SERVICES DIRECTOR 9,823.111540 FINANCIAL SERVICES MANAGER 7,994.80 8,394.54 8,814.27 9,254.98 9,717.741550 HUMAN RESOURCES MANAGER 7,994.80 8,394.54 8,814.27 9,254.98 9,717.746535 ELECTRIC DIST OPERATOR SUPERVISOR 7,981.57 8,378.37 8,800.57 9,239.14 9,703.141520 DEPUTY CITY ATTORNEY 7,856.18 8,248.99 8,661.44 9,094.52 9,549.241280 UTILITY SUPERINTENDENT 7,657.29 8,040.15 8,442.15 8,864.26 9,307.476520 ELECTRIC TROUBLESHOOTER 7,649.42 8,032.74 8,433.36 8,856.64 9,299.681003 CITY CLERK 9,280.041275 TRANSP MGR/SR TRAFF ENGINEER 7,591.00 7,970.78 8,369.24 8,787.92 9,226.861270 SENIOR CIVIL ENGINEER 7,590.26 7,970.01 8,368.43 8,787.09 9,225.986504 ELECTRIC LINEMAN/LINEWOMAN 7,473.44 7,847.43 8,241.78 8,652.80 9,087.301315 NEIGHBORHOOD SERVICES MANAGER 7,380.48 7,749.41 8,136.93 8,543.77 8,970.971310 BUILDING OFFICIAL 7,378.46 7,747.32 8,134.70 8,541.38 8,968.511306 CITY PLANNER 7,378.46 7,747.32 8,134.70 8,541.38 8,968.511375 DEPUTY DIRECTOR PRCS 7,285.21 7,649.47 8,031.95 8,433.54 8,855.221225 INFORMATION SYSTEMS MANAGER 7,259.29 7,622.26 8,003.38 8,403.54 8,823.726532 ELECTRIC DISTRIBUTION OPERATOR II 7,255.97 7,616.70 8,000.50 8,399.21 8,821.021530 BUSINESS DEVELOPMENT MANAGER 7,227.66 7,589.05 7,968.50 8,366.92 8,785.271285 WASTEWATER PLANT SUPERINTENDENT 7,215.12 7,575.78 7,954.62 8,352.36 8,769.961290 WATER PLANT SUPERINTENDENT 7,215.12 7,575.78 7,954.62 8,352.36 8,769.96
326
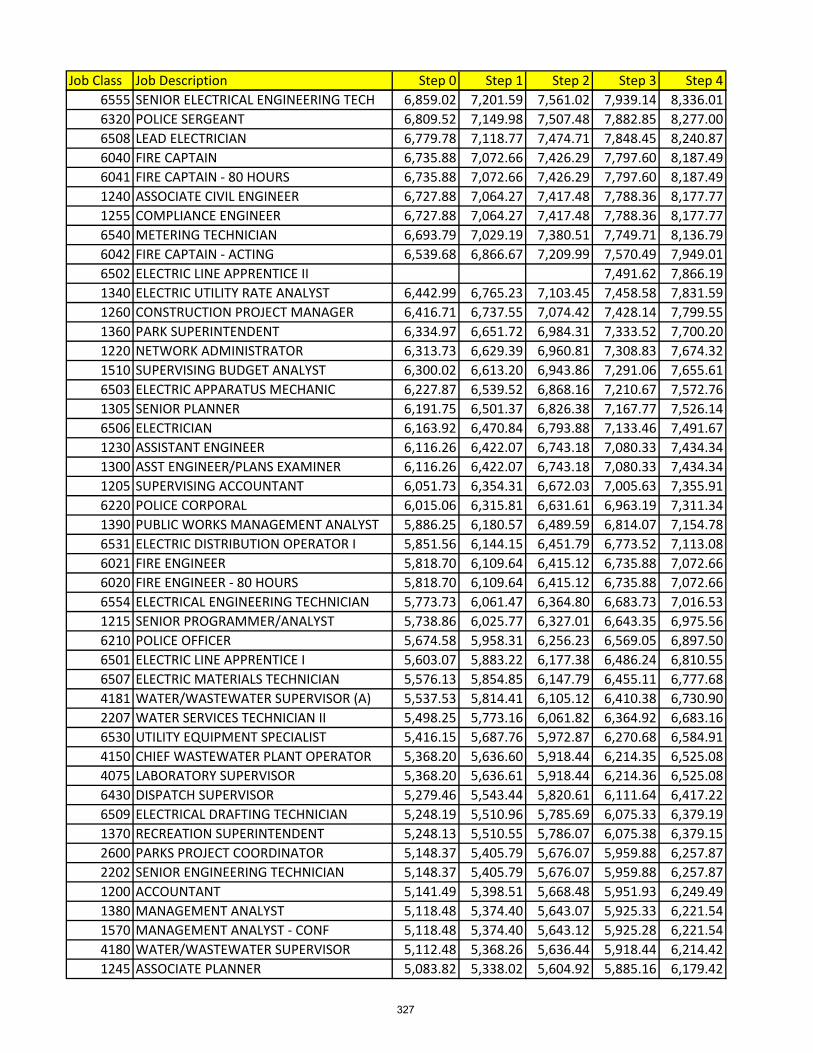
Job Class Job Description Step 0 Step 1 Step 2 Step 3 Step 46555 SENIOR ELECTRICAL ENGINEERING TECH 6,859.02 7,201.59 7,561.02 7,939.14 8,336.016320 POLICE SERGEANT 6,809.52 7,149.98 7,507.48 7,882.85 8,277.006508 LEAD ELECTRICIAN 6,779.78 7,118.77 7,474.71 7,848.45 8,240.876040 FIRE CAPTAIN 6,735.88 7,072.66 7,426.29 7,797.60 8,187.496041 FIRE CAPTAIN - 80 HOURS 6,735.88 7,072.66 7,426.29 7,797.60 8,187.491240 ASSOCIATE CIVIL ENGINEER 6,727.88 7,064.27 7,417.48 7,788.36 8,177.771255 COMPLIANCE ENGINEER 6,727.88 7,064.27 7,417.48 7,788.36 8,177.776540 METERING TECHNICIAN 6,693.79 7,029.19 7,380.51 7,749.71 8,136.796042 FIRE CAPTAIN - ACTING 6,539.68 6,866.67 7,209.99 7,570.49 7,949.016502 ELECTRIC LINE APPRENTICE II 7,491.62 7,866.191340 ELECTRIC UTILITY RATE ANALYST 6,442.99 6,765.23 7,103.45 7,458.58 7,831.591260 CONSTRUCTION PROJECT MANAGER 6,416.71 6,737.55 7,074.42 7,428.14 7,799.551360 PARK SUPERINTENDENT 6,334.97 6,651.72 6,984.31 7,333.52 7,700.201220 NETWORK ADMINISTRATOR 6,313.73 6,629.39 6,960.81 7,308.83 7,674.321510 SUPERVISING BUDGET ANALYST 6,300.02 6,613.20 6,943.86 7,291.06 7,655.616503 ELECTRIC APPARATUS MECHANIC 6,227.87 6,539.52 6,868.16 7,210.67 7,572.761305 SENIOR PLANNER 6,191.75 6,501.37 6,826.38 7,167.77 7,526.146506 ELECTRICIAN 6,163.92 6,470.84 6,793.88 7,133.46 7,491.671230 ASSISTANT ENGINEER 6,116.26 6,422.07 6,743.18 7,080.33 7,434.341300 ASST ENGINEER/PLANS EXAMINER 6,116.26 6,422.07 6,743.18 7,080.33 7,434.341205 SUPERVISING ACCOUNTANT 6,051.73 6,354.31 6,672.03 7,005.63 7,355.916220 POLICE CORPORAL 6,015.06 6,315.81 6,631.61 6,963.19 7,311.341390 PUBLIC WORKS MANAGEMENT ANALYST 5,886.25 6,180.57 6,489.59 6,814.07 7,154.786531 ELECTRIC DISTRIBUTION OPERATOR I 5,851.56 6,144.15 6,451.79 6,773.52 7,113.086021 FIRE ENGINEER 5,818.70 6,109.64 6,415.12 6,735.88 7,072.666020 FIRE ENGINEER - 80 HOURS 5,818.70 6,109.64 6,415.12 6,735.88 7,072.666554 ELECTRICAL ENGINEERING TECHNICIAN 5,773.73 6,061.47 6,364.80 6,683.73 7,016.531215 SENIOR PROGRAMMER/ANALYST 5,738.86 6,025.77 6,327.01 6,643.35 6,975.566210 POLICE OFFICER 5,674.58 5,958.31 6,256.23 6,569.05 6,897.506501 ELECTRIC LINE APPRENTICE I 5,603.07 5,883.22 6,177.38 6,486.24 6,810.556507 ELECTRIC MATERIALS TECHNICIAN 5,576.13 5,854.85 6,147.79 6,455.11 6,777.684181 WATER/WASTEWATER SUPERVISOR (A) 5,537.53 5,814.41 6,105.12 6,410.38 6,730.902207 WATER SERVICES TECHNICIAN II 5,498.25 5,773.16 6,061.82 6,364.92 6,683.166530 UTILITY EQUIPMENT SPECIALIST 5,416.15 5,687.76 5,972.87 6,270.68 6,584.914150 CHIEF WASTEWATER PLANT OPERATOR 5,368.20 5,636.60 5,918.44 6,214.35 6,525.084075 LABORATORY SUPERVISOR 5,368.20 5,636.61 5,918.44 6,214.36 6,525.086430 DISPATCH SUPERVISOR 5,279.46 5,543.44 5,820.61 6,111.64 6,417.226509 ELECTRICAL DRAFTING TECHNICIAN 5,248.19 5,510.96 5,785.69 6,075.33 6,379.191370 RECREATION SUPERINTENDENT 5,248.13 5,510.55 5,786.07 6,075.38 6,379.152600 PARKS PROJECT COORDINATOR 5,148.37 5,405.79 5,676.07 5,959.88 6,257.872202 SENIOR ENGINEERING TECHNICIAN 5,148.37 5,405.79 5,676.07 5,959.88 6,257.871200 ACCOUNTANT 5,141.49 5,398.51 5,668.48 5,951.93 6,249.491380 MANAGEMENT ANALYST 5,118.48 5,374.40 5,643.07 5,925.33 6,221.541570 MANAGEMENT ANALYST - CONF 5,118.48 5,374.40 5,643.12 5,925.28 6,221.544180 WATER/WASTEWATER SUPERVISOR 5,112.48 5,368.26 5,636.44 5,918.44 6,214.421245 ASSOCIATE PLANNER 5,083.82 5,338.02 5,604.92 5,885.16 6,179.42
327
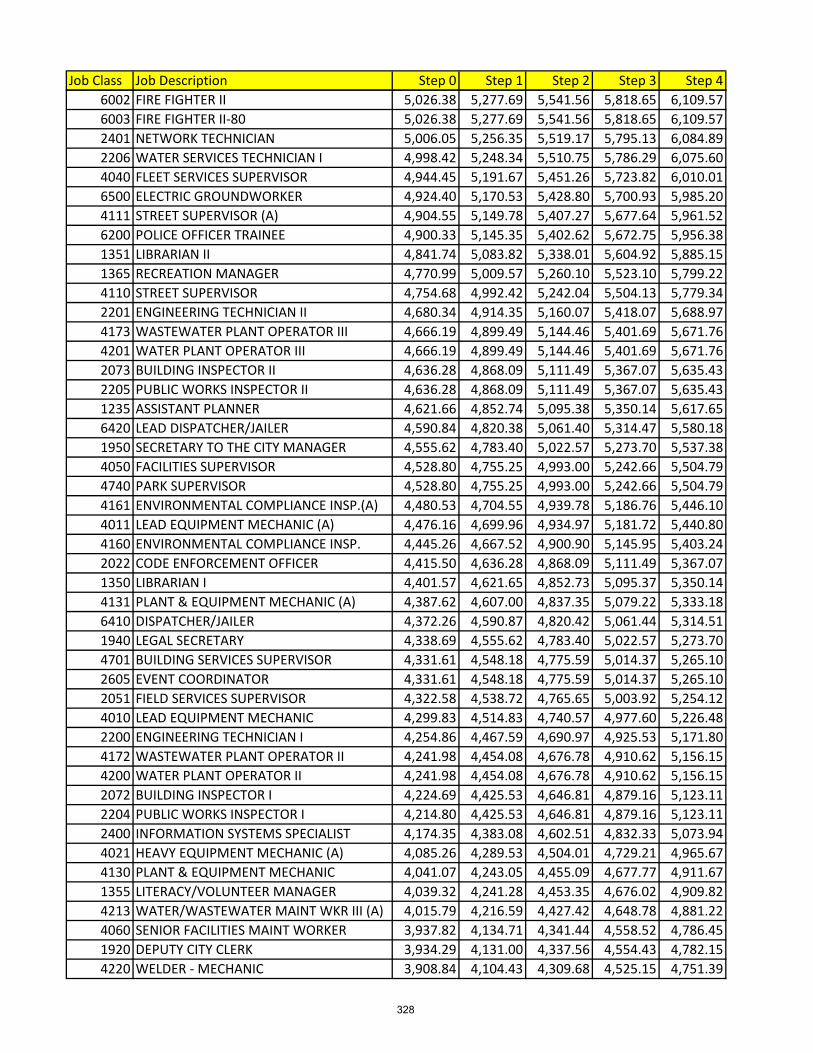
Job Class Job Description Step 0 Step 1 Step 2 Step 3 Step 46002 FIRE FIGHTER II 5,026.38 5,277.69 5,541.56 5,818.65 6,109.576003 FIRE FIGHTER II-80 5,026.38 5,277.69 5,541.56 5,818.65 6,109.572401 NETWORK TECHNICIAN 5,006.05 5,256.35 5,519.17 5,795.13 6,084.892206 WATER SERVICES TECHNICIAN I 4,998.42 5,248.34 5,510.75 5,786.29 6,075.604040 FLEET SERVICES SUPERVISOR 4,944.45 5,191.67 5,451.26 5,723.82 6,010.016500 ELECTRIC GROUNDWORKER 4,924.40 5,170.53 5,428.80 5,700.93 5,985.204111 STREET SUPERVISOR (A) 4,904.55 5,149.78 5,407.27 5,677.64 5,961.526200 POLICE OFFICER TRAINEE 4,900.33 5,145.35 5,402.62 5,672.75 5,956.381351 LIBRARIAN II 4,841.74 5,083.82 5,338.01 5,604.92 5,885.151365 RECREATION MANAGER 4,770.99 5,009.57 5,260.10 5,523.10 5,799.224110 STREET SUPERVISOR 4,754.68 4,992.42 5,242.04 5,504.13 5,779.342201 ENGINEERING TECHNICIAN II 4,680.34 4,914.35 5,160.07 5,418.07 5,688.974173 WASTEWATER PLANT OPERATOR III 4,666.19 4,899.49 5,144.46 5,401.69 5,671.764201 WATER PLANT OPERATOR III 4,666.19 4,899.49 5,144.46 5,401.69 5,671.762073 BUILDING INSPECTOR II 4,636.28 4,868.09 5,111.49 5,367.07 5,635.432205 PUBLIC WORKS INSPECTOR II 4,636.28 4,868.09 5,111.49 5,367.07 5,635.431235 ASSISTANT PLANNER 4,621.66 4,852.74 5,095.38 5,350.14 5,617.656420 LEAD DISPATCHER/JAILER 4,590.84 4,820.38 5,061.40 5,314.47 5,580.181950 SECRETARY TO THE CITY MANAGER 4,555.62 4,783.40 5,022.57 5,273.70 5,537.384050 FACILITIES SUPERVISOR 4,528.80 4,755.25 4,993.00 5,242.66 5,504.794740 PARK SUPERVISOR 4,528.80 4,755.25 4,993.00 5,242.66 5,504.794161 ENVIRONMENTAL COMPLIANCE INSP.(A) 4,480.53 4,704.55 4,939.78 5,186.76 5,446.104011 LEAD EQUIPMENT MECHANIC (A) 4,476.16 4,699.96 4,934.97 5,181.72 5,440.804160 ENVIRONMENTAL COMPLIANCE INSP. 4,445.26 4,667.52 4,900.90 5,145.95 5,403.242022 CODE ENFORCEMENT OFFICER 4,415.50 4,636.28 4,868.09 5,111.49 5,367.071350 LIBRARIAN I 4,401.57 4,621.65 4,852.73 5,095.37 5,350.144131 PLANT & EQUIPMENT MECHANIC (A) 4,387.62 4,607.00 4,837.35 5,079.22 5,333.186410 DISPATCHER/JAILER 4,372.26 4,590.87 4,820.42 5,061.44 5,314.511940 LEGAL SECRETARY 4,338.69 4,555.62 4,783.40 5,022.57 5,273.704701 BUILDING SERVICES SUPERVISOR 4,331.61 4,548.18 4,775.59 5,014.37 5,265.102605 EVENT COORDINATOR 4,331.61 4,548.18 4,775.59 5,014.37 5,265.102051 FIELD SERVICES SUPERVISOR 4,322.58 4,538.72 4,765.65 5,003.92 5,254.124010 LEAD EQUIPMENT MECHANIC 4,299.83 4,514.83 4,740.57 4,977.60 5,226.482200 ENGINEERING TECHNICIAN I 4,254.86 4,467.59 4,690.97 4,925.53 5,171.804172 WASTEWATER PLANT OPERATOR II 4,241.98 4,454.08 4,676.78 4,910.62 5,156.154200 WATER PLANT OPERATOR II 4,241.98 4,454.08 4,676.78 4,910.62 5,156.152072 BUILDING INSPECTOR I 4,224.69 4,425.53 4,646.81 4,879.16 5,123.112204 PUBLIC WORKS INSPECTOR I 4,214.80 4,425.53 4,646.81 4,879.16 5,123.112400 INFORMATION SYSTEMS SPECIALIST 4,174.35 4,383.08 4,602.51 4,832.33 5,073.944021 HEAVY EQUIPMENT MECHANIC (A) 4,085.26 4,289.53 4,504.01 4,729.21 4,965.674130 PLANT & EQUIPMENT MECHANIC 4,041.07 4,243.05 4,455.09 4,677.77 4,911.671355 LITERACY/VOLUNTEER MANAGER 4,039.32 4,241.28 4,453.35 4,676.02 4,909.824213 WATER/WASTEWATER MAINT WKR III (A) 4,015.79 4,216.59 4,427.42 4,648.78 4,881.224060 SENIOR FACILITIES MAINT WORKER 3,937.82 4,134.71 4,341.44 4,558.52 4,786.451920 DEPUTY CITY CLERK 3,934.29 4,131.00 4,337.56 4,554.43 4,782.154220 WELDER - MECHANIC 3,908.84 4,104.43 4,309.68 4,525.15 4,751.39
328
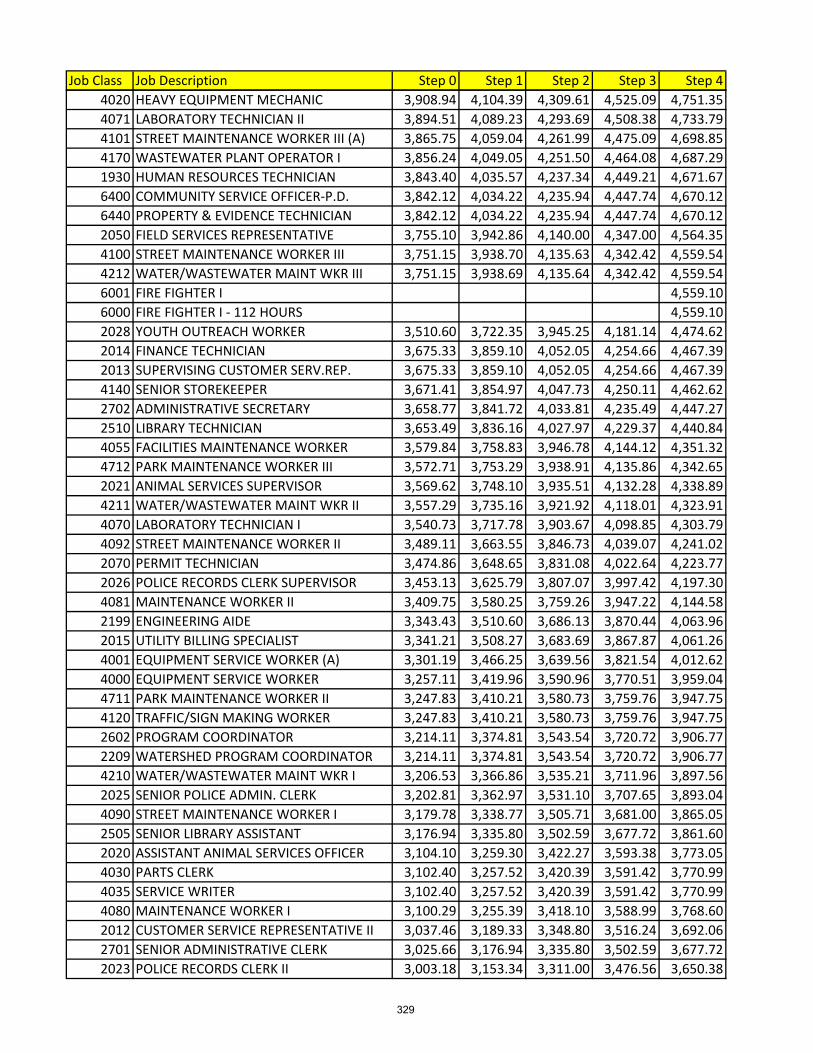
Job Class Job Description Step 0 Step 1 Step 2 Step 3 Step 44020 HEAVY EQUIPMENT MECHANIC 3,908.94 4,104.39 4,309.61 4,525.09 4,751.354071 LABORATORY TECHNICIAN II 3,894.51 4,089.23 4,293.69 4,508.38 4,733.794101 STREET MAINTENANCE WORKER III (A) 3,865.75 4,059.04 4,261.99 4,475.09 4,698.854170 WASTEWATER PLANT OPERATOR I 3,856.24 4,049.05 4,251.50 4,464.08 4,687.291930 HUMAN RESOURCES TECHNICIAN 3,843.40 4,035.57 4,237.34 4,449.21 4,671.676400 COMMUNITY SERVICE OFFICER-P.D. 3,842.12 4,034.22 4,235.94 4,447.74 4,670.126440 PROPERTY & EVIDENCE TECHNICIAN 3,842.12 4,034.22 4,235.94 4,447.74 4,670.122050 FIELD SERVICES REPRESENTATIVE 3,755.10 3,942.86 4,140.00 4,347.00 4,564.354100 STREET MAINTENANCE WORKER III 3,751.15 3,938.70 4,135.63 4,342.42 4,559.544212 WATER/WASTEWATER MAINT WKR III 3,751.15 3,938.69 4,135.64 4,342.42 4,559.546001 FIRE FIGHTER I 4,559.106000 FIRE FIGHTER I - 112 HOURS 4,559.102028 YOUTH OUTREACH WORKER 3,510.60 3,722.35 3,945.25 4,181.14 4,474.622014 FINANCE TECHNICIAN 3,675.33 3,859.10 4,052.05 4,254.66 4,467.392013 SUPERVISING CUSTOMER SERV.REP. 3,675.33 3,859.10 4,052.05 4,254.66 4,467.394140 SENIOR STOREKEEPER 3,671.41 3,854.97 4,047.73 4,250.11 4,462.622702 ADMINISTRATIVE SECRETARY 3,658.77 3,841.72 4,033.81 4,235.49 4,447.272510 LIBRARY TECHNICIAN 3,653.49 3,836.16 4,027.97 4,229.37 4,440.844055 FACILITIES MAINTENANCE WORKER 3,579.84 3,758.83 3,946.78 4,144.12 4,351.324712 PARK MAINTENANCE WORKER III 3,572.71 3,753.29 3,938.91 4,135.86 4,342.652021 ANIMAL SERVICES SUPERVISOR 3,569.62 3,748.10 3,935.51 4,132.28 4,338.894211 WATER/WASTEWATER MAINT WKR II 3,557.29 3,735.16 3,921.92 4,118.01 4,323.914070 LABORATORY TECHNICIAN I 3,540.73 3,717.78 3,903.67 4,098.85 4,303.794092 STREET MAINTENANCE WORKER II 3,489.11 3,663.55 3,846.73 4,039.07 4,241.022070 PERMIT TECHNICIAN 3,474.86 3,648.65 3,831.08 4,022.64 4,223.772026 POLICE RECORDS CLERK SUPERVISOR 3,453.13 3,625.79 3,807.07 3,997.42 4,197.304081 MAINTENANCE WORKER II 3,409.75 3,580.25 3,759.26 3,947.22 4,144.582199 ENGINEERING AIDE 3,343.43 3,510.60 3,686.13 3,870.44 4,063.962015 UTILITY BILLING SPECIALIST 3,341.21 3,508.27 3,683.69 3,867.87 4,061.264001 EQUIPMENT SERVICE WORKER (A) 3,301.19 3,466.25 3,639.56 3,821.54 4,012.624000 EQUIPMENT SERVICE WORKER 3,257.11 3,419.96 3,590.96 3,770.51 3,959.044711 PARK MAINTENANCE WORKER II 3,247.83 3,410.21 3,580.73 3,759.76 3,947.754120 TRAFFIC/SIGN MAKING WORKER 3,247.83 3,410.21 3,580.73 3,759.76 3,947.752602 PROGRAM COORDINATOR 3,214.11 3,374.81 3,543.54 3,720.72 3,906.772209 WATERSHED PROGRAM COORDINATOR 3,214.11 3,374.81 3,543.54 3,720.72 3,906.774210 WATER/WASTEWATER MAINT WKR I 3,206.53 3,366.86 3,535.21 3,711.96 3,897.562025 SENIOR POLICE ADMIN. CLERK 3,202.81 3,362.97 3,531.10 3,707.65 3,893.044090 STREET MAINTENANCE WORKER I 3,179.78 3,338.77 3,505.71 3,681.00 3,865.052505 SENIOR LIBRARY ASSISTANT 3,176.94 3,335.80 3,502.59 3,677.72 3,861.602020 ASSISTANT ANIMAL SERVICES OFFICER 3,104.10 3,259.30 3,422.27 3,593.38 3,773.054030 PARTS CLERK 3,102.40 3,257.52 3,420.39 3,591.42 3,770.994035 SERVICE WRITER 3,102.40 3,257.52 3,420.39 3,591.42 3,770.994080 MAINTENANCE WORKER I 3,100.29 3,255.39 3,418.10 3,588.99 3,768.602012 CUSTOMER SERVICE REPRESENTATIVE II 3,037.46 3,189.33 3,348.80 3,516.24 3,692.062701 SENIOR ADMINISTRATIVE CLERK 3,025.66 3,176.94 3,335.80 3,502.59 3,677.722023 POLICE RECORDS CLERK II 3,003.18 3,153.34 3,311.00 3,476.56 3,650.38
329
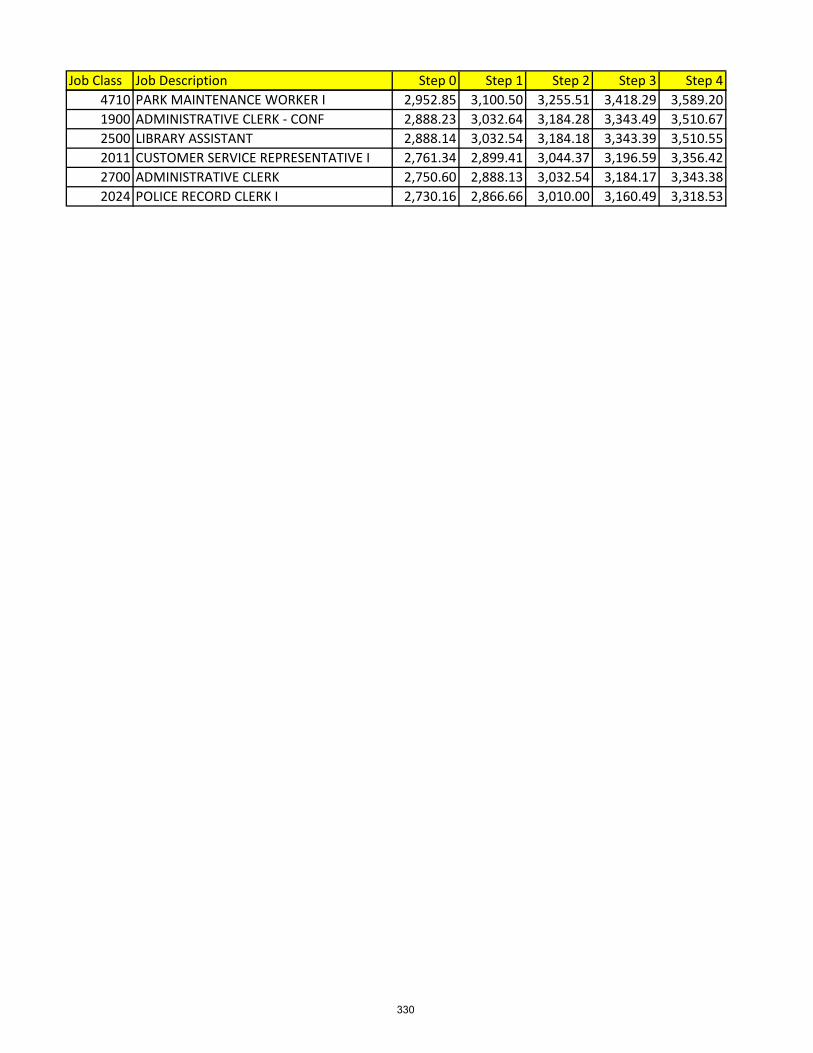
Job Class Job Description Step 0 Step 1 Step 2 Step 3 Step 44710 PARK MAINTENANCE WORKER I 2,952.85 3,100.50 3,255.51 3,418.29 3,589.201900 ADMINISTRATIVE CLERK - CONF 2,888.23 3,032.64 3,184.28 3,343.49 3,510.672500 LIBRARY ASSISTANT 2,888.14 3,032.54 3,184.18 3,343.39 3,510.552011 CUSTOMER SERVICE REPRESENTATIVE I 2,761.34 2,899.41 3,044.37 3,196.59 3,356.422700 ADMINISTRATIVE CLERK 2,750.60 2,888.13 3,032.54 3,184.17 3,343.382024 POLICE RECORD CLERK I 2,730.16 2,866.66 3,010.00 3,160.49 3,318.53
330
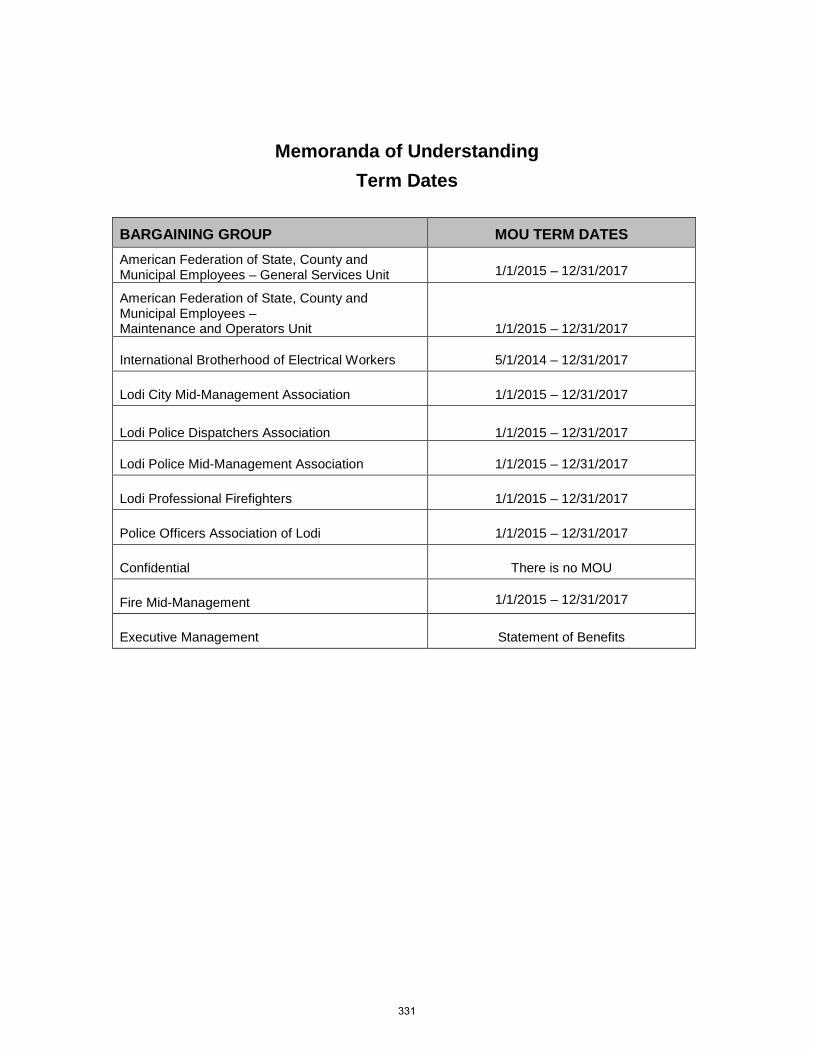
Memoranda of Understanding Term Dates
BARGAINING GROUP MOU TERM DATES American Federation of State, County and Municipal Employees – General Services Unit
1/1/2015 – 12/31/2017
American Federation of State, County and Municipal Employees – Maintenance and Operators Unit
1/1/2015 – 12/31/2017
International Brotherhood of Electrical Workers
5/1/2014 – 12/31/2017
Lodi City Mid-Management Association
1/1/2015 – 12/31/2017
Lodi Police Dispatchers Association 1/1/2015 – 12/31/2017 Lodi Police Mid-Management Association
1/1/2015 – 12/31/2017
Lodi Professional Firefighters
1/1/2015 – 12/31/2017
Police Officers Association of Lodi
1/1/2015 – 12/31/2017
Confidential
There is no MOU
Fire Mid-Management
1/1/2015 – 12/31/2017
Executive Management
Statement of Benefits
331
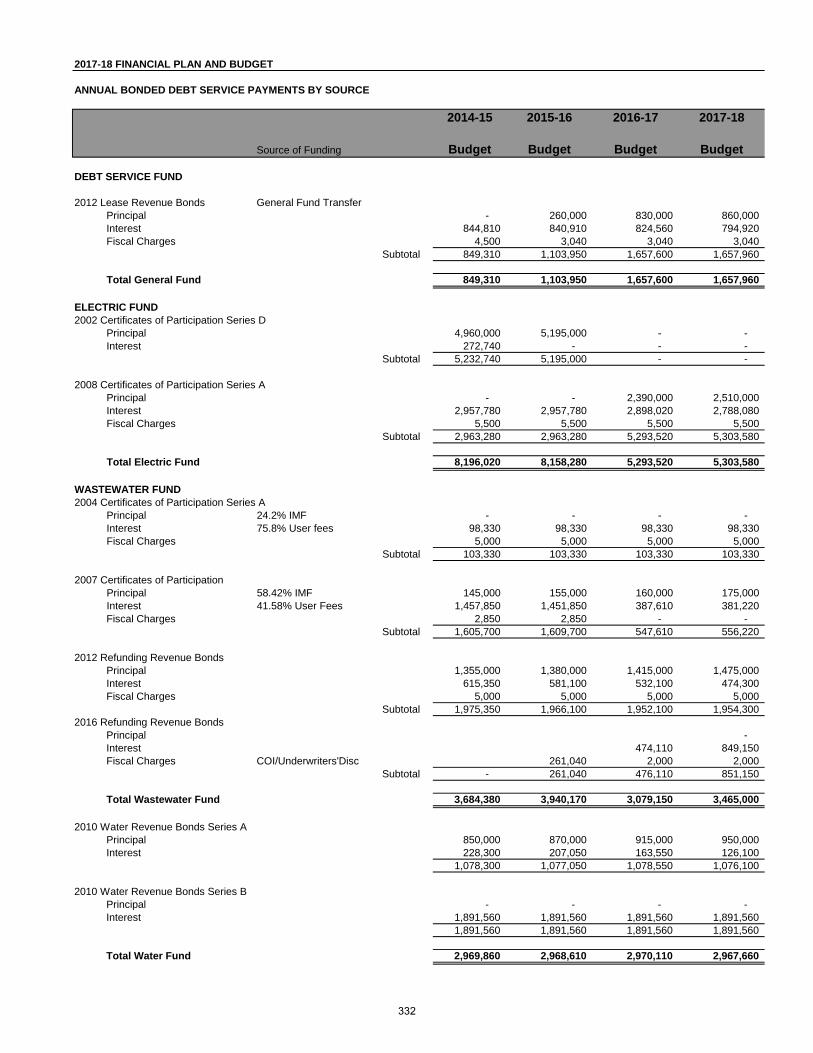
2017-18 FINANCIAL PLAN AND BUDGET
ANNUAL BONDED DEBT SERVICE PAYMENTS BY SOURCE
2014-15 2015-16 2016-17 2017-18
Source of Funding Budget Budget Budget Budget
DEBT SERVICE FUND
2012 Lease Revenue Bonds General Fund TransferPrincipal - 260,000 830,000 860,000 Interest 844,810 840,910 824,560 794,920 Fiscal Charges 4,500 3,040 3,040 3,040
Subtotal 849,310 1,103,950 1,657,600 1,657,960
Total General Fund 849,310 1,103,950 1,657,600 1,657,960
ELECTRIC FUND2002 Certificates of Participation Series D
Principal 4,960,000 5,195,000 - - Interest 272,740 - - -
Subtotal 5,232,740 5,195,000 - -
2008 Certificates of Participation Series APrincipal - - 2,390,000 2,510,000 Interest 2,957,780 2,957,780 2,898,020 2,788,080 Fiscal Charges 5,500 5,500 5,500 5,500
Subtotal 2,963,280 2,963,280 5,293,520 5,303,580
Total Electric Fund 8,196,020 8,158,280 5,293,520 5,303,580
WASTEWATER FUND2004 Certificates of Participation Series A
Principal 24.2% IMF - - - - Interest 75.8% User fees 98,330 98,330 98,330 98,330 Fiscal Charges 5,000 5,000 5,000 5,000
Subtotal 103,330 103,330 103,330 103,330
2007 Certificates of Participation Principal 58.42% IMF 145,000 155,000 160,000 175,000 Interest 41.58% User Fees 1,457,850 1,451,850 387,610 381,220 Fiscal Charges 2,850 2,850 - -
Subtotal 1,605,700 1,609,700 547,610 556,220
2012 Refunding Revenue BondsPrincipal 1,355,000 1,380,000 1,415,000 1,475,000 Interest 615,350 581,100 532,100 474,300 Fiscal Charges 5,000 5,000 5,000 5,000
Subtotal 1,975,350 1,966,100 1,952,100 1,954,300 2016 Refunding Revenue Bonds
Principal - Interest 474,110 849,150 Fiscal Charges COI/Underwriters'Disc 261,040 2,000 2,000
Subtotal - 261,040 476,110 851,150
Total Wastewater Fund 3,684,380 3,940,170 3,079,150 3,465,000
2010 Water Revenue Bonds Series APrincipal 850,000 870,000 915,000 950,000 Interest 228,300 207,050 163,550 126,100
1,078,300 1,077,050 1,078,550 1,076,100
2010 Water Revenue Bonds Series BPrincipal - - - - Interest 1,891,560 1,891,560 1,891,560 1,891,560
1,891,560 1,891,560 1,891,560 1,891,560
Total Water Fund 2,969,860 2,968,610 2,970,110 2,967,660
332
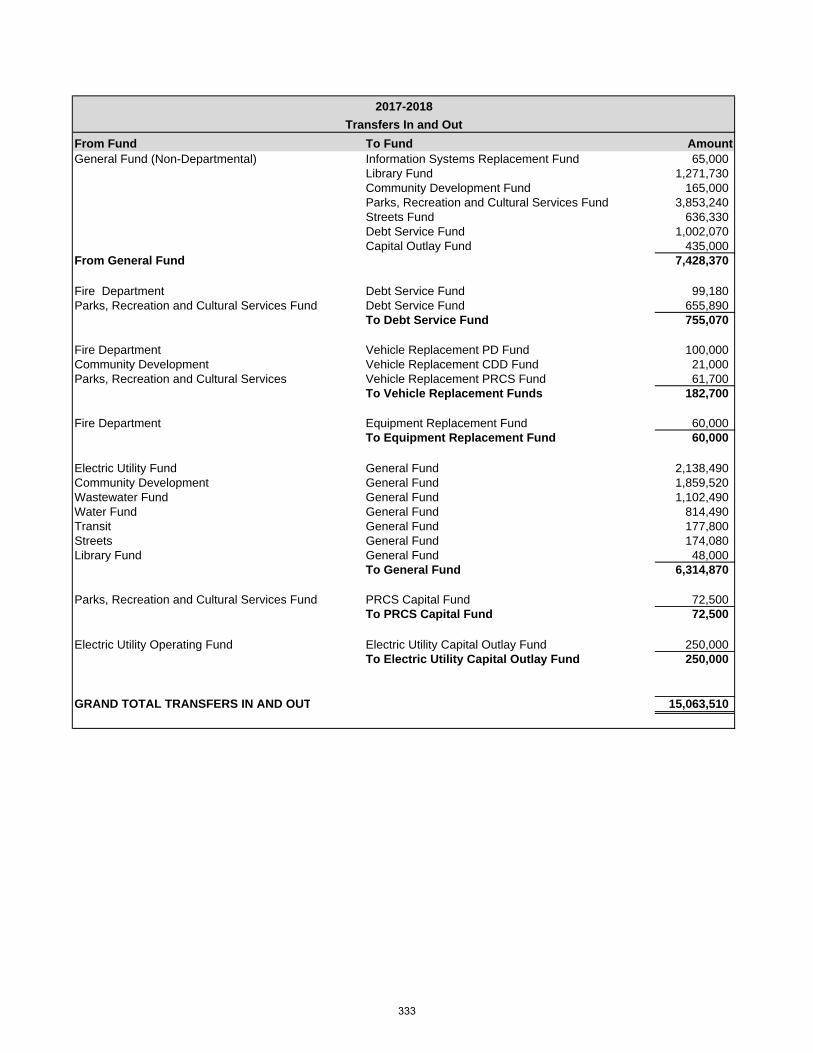
From Fund To Fund AmountGeneral Fund (Non-Departmental) Information Systems Replacement Fund 65,000
Library Fund 1,271,730 Community Development Fund 165,000 Parks, Recreation and Cultural Services Fund 3,853,240 Streets Fund 636,330 Debt Service Fund 1,002,070 Capital Outlay Fund 435,000
From General Fund 7,428,370
Fire Department Debt Service Fund 99,180 Parks, Recreation and Cultural Services Fund Debt Service Fund 655,890
To Debt Service Fund 755,070
Fire Department Vehicle Replacement PD Fund 100,000 Community Development Vehicle Replacement CDD Fund 21,000 Parks, Recreation and Cultural Services Vehicle Replacement PRCS Fund 61,700
To Vehicle Replacement Funds 182,700
Fire Department Equipment Replacement Fund 60,000 To Equipment Replacement Fund 60,000
Electric Utility Fund General Fund 2,138,490 Community Development General Fund 1,859,520 Wastewater Fund General Fund 1,102,490 Water Fund General Fund 814,490 Transit General Fund 177,800 Streets General Fund 174,080 Library Fund General Fund 48,000
To General Fund 6,314,870
Parks, Recreation and Cultural Services Fund PRCS Capital Fund 72,500 To PRCS Capital Fund 72,500
Electric Utility Operating Fund Electric Utility Capital Outlay Fund 250,000 To Electric Utility Capital Outlay Fund 250,000
GRAND TOTAL TRANSFERS IN AND OUT 15,063,510
Transfers In and Out2017-2018
333
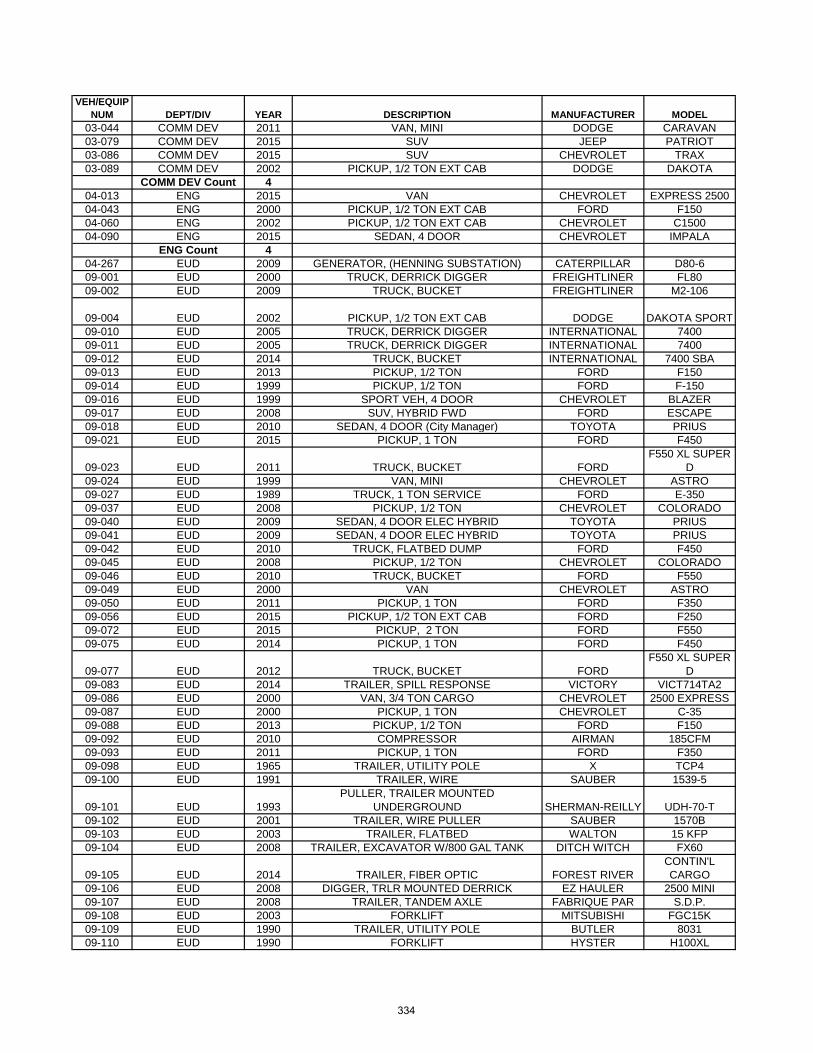
VEH/EQUIP NUM DEPT/DIV YEAR DESCRIPTION MANUFACTURER MODEL
03-044 COMM DEV 2011 VAN, MINI DODGE CARAVAN03-079 COMM DEV 2015 SUV JEEP PATRIOT03-086 COMM DEV 2015 SUV CHEVROLET TRAX03-089 COMM DEV 2002 PICKUP, 1/2 TON EXT CAB DODGE DAKOTA
COMM DEV Count 404-013 ENG 2015 VAN CHEVROLET EXPRESS 250004-043 ENG 2000 PICKUP, 1/2 TON EXT CAB FORD F15004-060 ENG 2002 PICKUP, 1/2 TON EXT CAB CHEVROLET C150004-090 ENG 2015 SEDAN, 4 DOOR CHEVROLET IMPALA
ENG Count 404-267 EUD 2009 GENERATOR, (HENNING SUBSTATION) CATERPILLAR D80-609-001 EUD 2000 TRUCK, DERRICK DIGGER FREIGHTLINER FL8009-002 EUD 2009 TRUCK, BUCKET FREIGHTLINER M2-106
09-004 EUD 2002 PICKUP, 1/2 TON EXT CAB DODGE DAKOTA SPORT09-010 EUD 2005 TRUCK, DERRICK DIGGER INTERNATIONAL 740009-011 EUD 2005 TRUCK, DERRICK DIGGER INTERNATIONAL 740009-012 EUD 2014 TRUCK, BUCKET INTERNATIONAL 7400 SBA09-013 EUD 2013 PICKUP, 1/2 TON FORD F15009-014 EUD 1999 PICKUP, 1/2 TON FORD F-15009-016 EUD 1999 SPORT VEH, 4 DOOR CHEVROLET BLAZER09-017 EUD 2008 SUV, HYBRID FWD FORD ESCAPE09-018 EUD 2010 SEDAN, 4 DOOR (City Manager) TOYOTA PRIUS09-021 EUD 2015 PICKUP, 1 TON FORD F450
09-023 EUD 2011 TRUCK, BUCKET FORDF550 XL SUPER
D09-024 EUD 1999 VAN, MINI CHEVROLET ASTRO09-027 EUD 1989 TRUCK, 1 TON SERVICE FORD E-35009-037 EUD 2008 PICKUP, 1/2 TON CHEVROLET COLORADO09-040 EUD 2009 SEDAN, 4 DOOR ELEC HYBRID TOYOTA PRIUS09-041 EUD 2009 SEDAN, 4 DOOR ELEC HYBRID TOYOTA PRIUS09-042 EUD 2010 TRUCK, FLATBED DUMP FORD F45009-045 EUD 2008 PICKUP, 1/2 TON CHEVROLET COLORADO09-046 EUD 2010 TRUCK, BUCKET FORD F55009-049 EUD 2000 VAN CHEVROLET ASTRO09-050 EUD 2011 PICKUP, 1 TON FORD F35009-056 EUD 2015 PICKUP, 1/2 TON EXT CAB FORD F25009-072 EUD 2015 PICKUP, 2 TON FORD F55009-075 EUD 2014 PICKUP, 1 TON FORD F450
09-077 EUD 2012 TRUCK, BUCKET FORDF550 XL SUPER
D09-083 EUD 2014 TRAILER, SPILL RESPONSE VICTORY VICT714TA209-086 EUD 2000 VAN, 3/4 TON CARGO CHEVROLET 2500 EXPRESS09-087 EUD 2000 PICKUP, 1 TON CHEVROLET C-3509-088 EUD 2013 PICKUP, 1/2 TON FORD F15009-092 EUD 2010 COMPRESSOR AIRMAN 185CFM09-093 EUD 2011 PICKUP, 1 TON FORD F35009-098 EUD 1965 TRAILER, UTILITY POLE X TCP409-100 EUD 1991 TRAILER, WIRE SAUBER 1539-5
09-101 EUD 1993PULLER, TRAILER MOUNTED
UNDERGROUND SHERMAN-REILLY UDH-70-T09-102 EUD 2001 TRAILER, WIRE PULLER SAUBER 1570B09-103 EUD 2003 TRAILER, FLATBED WALTON 15 KFP09-104 EUD 2008 TRAILER, EXCAVATOR W/800 GAL TANK DITCH WITCH FX60
09-105 EUD 2014 TRAILER, FIBER OPTIC FOREST RIVERCONTIN'L CARGO
09-106 EUD 2008 DIGGER, TRLR MOUNTED DERRICK EZ HAULER 2500 MINI09-107 EUD 2008 TRAILER, TANDEM AXLE FABRIQUE PAR S.D.P.09-108 EUD 2003 FORKLIFT MITSUBISHI FGC15K09-109 EUD 1990 TRAILER, UTILITY POLE BUTLER 803109-110 EUD 1990 FORKLIFT HYSTER H100XL
334
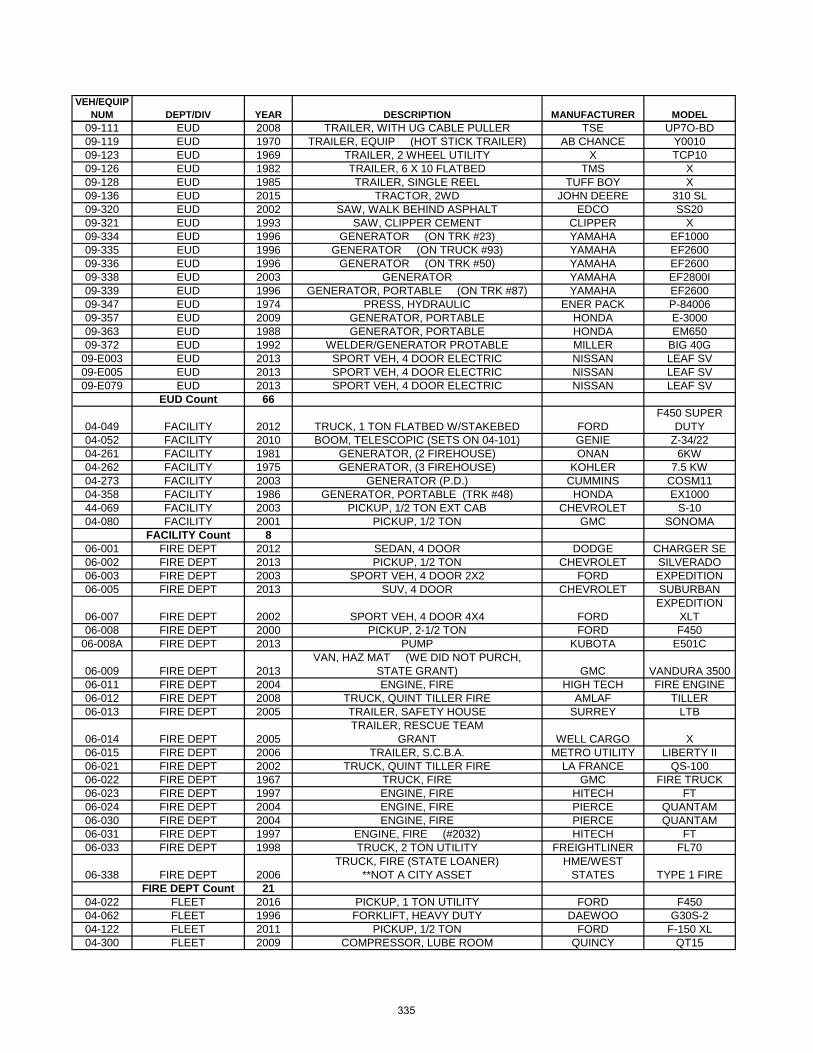
VEH/EQUIP NUM DEPT/DIV YEAR DESCRIPTION MANUFACTURER MODEL
09-111 EUD 2008 TRAILER, WITH UG CABLE PULLER TSE UP7O-BD09-119 EUD 1970 TRAILER, EQUIP (HOT STICK TRAILER) AB CHANCE Y001009-123 EUD 1969 TRAILER, 2 WHEEL UTILITY X TCP1009-126 EUD 1982 TRAILER, 6 X 10 FLATBED TMS X09-128 EUD 1985 TRAILER, SINGLE REEL TUFF BOY X09-136 EUD 2015 TRACTOR, 2WD JOHN DEERE 310 SL09-320 EUD 2002 SAW, WALK BEHIND ASPHALT EDCO SS2009-321 EUD 1993 SAW, CLIPPER CEMENT CLIPPER X09-334 EUD 1996 GENERATOR (ON TRK #23) YAMAHA EF100009-335 EUD 1996 GENERATOR (ON TRUCK #93) YAMAHA EF260009-336 EUD 1996 GENERATOR (ON TRK #50) YAMAHA EF260009-338 EUD 2003 GENERATOR YAMAHA EF2800I09-339 EUD 1996 GENERATOR, PORTABLE (ON TRK #87) YAMAHA EF260009-347 EUD 1974 PRESS, HYDRAULIC ENER PACK P-8400609-357 EUD 2009 GENERATOR, PORTABLE HONDA E-300009-363 EUD 1988 GENERATOR, PORTABLE HONDA EM65009-372 EUD 1992 WELDER/GENERATOR PROTABLE MILLER BIG 40G
09-E003 EUD 2013 SPORT VEH, 4 DOOR ELECTRIC NISSAN LEAF SV09-E005 EUD 2013 SPORT VEH, 4 DOOR ELECTRIC NISSAN LEAF SV09-E079 EUD 2013 SPORT VEH, 4 DOOR ELECTRIC NISSAN LEAF SV
EUD Count 66
04-049 FACILITY 2012 TRUCK, 1 TON FLATBED W/STAKEBED FORDF450 SUPER
DUTY04-052 FACILITY 2010 BOOM, TELESCOPIC (SETS ON 04-101) GENIE Z-34/2204-261 FACILITY 1981 GENERATOR, (2 FIREHOUSE) ONAN 6KW04-262 FACILITY 1975 GENERATOR, (3 FIREHOUSE) KOHLER 7.5 KW04-273 FACILITY 2003 GENERATOR (P.D.) CUMMINS COSM1104-358 FACILITY 1986 GENERATOR, PORTABLE (TRK #48) HONDA EX100044-069 FACILITY 2003 PICKUP, 1/2 TON EXT CAB CHEVROLET S-1004-080 FACILITY 2001 PICKUP, 1/2 TON GMC SONOMA
FACILITY Count 806-001 FIRE DEPT 2012 SEDAN, 4 DOOR DODGE CHARGER SE06-002 FIRE DEPT 2013 PICKUP, 1/2 TON CHEVROLET SILVERADO06-003 FIRE DEPT 2003 SPORT VEH, 4 DOOR 2X2 FORD EXPEDITION06-005 FIRE DEPT 2013 SUV, 4 DOOR CHEVROLET SUBURBAN
06-007 FIRE DEPT 2002 SPORT VEH, 4 DOOR 4X4 FORDEXPEDITION
XLT06-008 FIRE DEPT 2000 PICKUP, 2-1/2 TON FORD F450
06-008A FIRE DEPT 2013 PUMP KUBOTA E501C
06-009 FIRE DEPT 2013VAN, HAZ MAT (WE DID NOT PURCH,
STATE GRANT) GMC VANDURA 350006-011 FIRE DEPT 2004 ENGINE, FIRE HIGH TECH FIRE ENGINE06-012 FIRE DEPT 2008 TRUCK, QUINT TILLER FIRE AMLAF TILLER06-013 FIRE DEPT 2005 TRAILER, SAFETY HOUSE SURREY LTB
06-014 FIRE DEPT 2005TRAILER, RESCUE TEAM
GRANT WELL CARGO X06-015 FIRE DEPT 2006 TRAILER, S.C.B.A. METRO UTILITY LIBERTY II06-021 FIRE DEPT 2002 TRUCK, QUINT TILLER FIRE LA FRANCE QS-10006-022 FIRE DEPT 1967 TRUCK, FIRE GMC FIRE TRUCK06-023 FIRE DEPT 1997 ENGINE, FIRE HITECH FT06-024 FIRE DEPT 2004 ENGINE, FIRE PIERCE QUANTAM06-030 FIRE DEPT 2004 ENGINE, FIRE PIERCE QUANTAM06-031 FIRE DEPT 1997 ENGINE, FIRE (#2032) HITECH FT06-033 FIRE DEPT 1998 TRUCK, 2 TON UTILITY FREIGHTLINER FL70
06-338 FIRE DEPT 2006TRUCK, FIRE (STATE LOANER)
**NOT A CITY ASSETHME/WEST
STATES TYPE 1 FIREFIRE DEPT Count 21
04-022 FLEET 2016 PICKUP, 1 TON UTILITY FORD F45004-062 FLEET 1996 FORKLIFT, HEAVY DUTY DAEWOO G30S-204-122 FLEET 2011 PICKUP, 1/2 TON FORD F-150 XL04-300 FLEET 2009 COMPRESSOR, LUBE ROOM QUINCY QT15
335
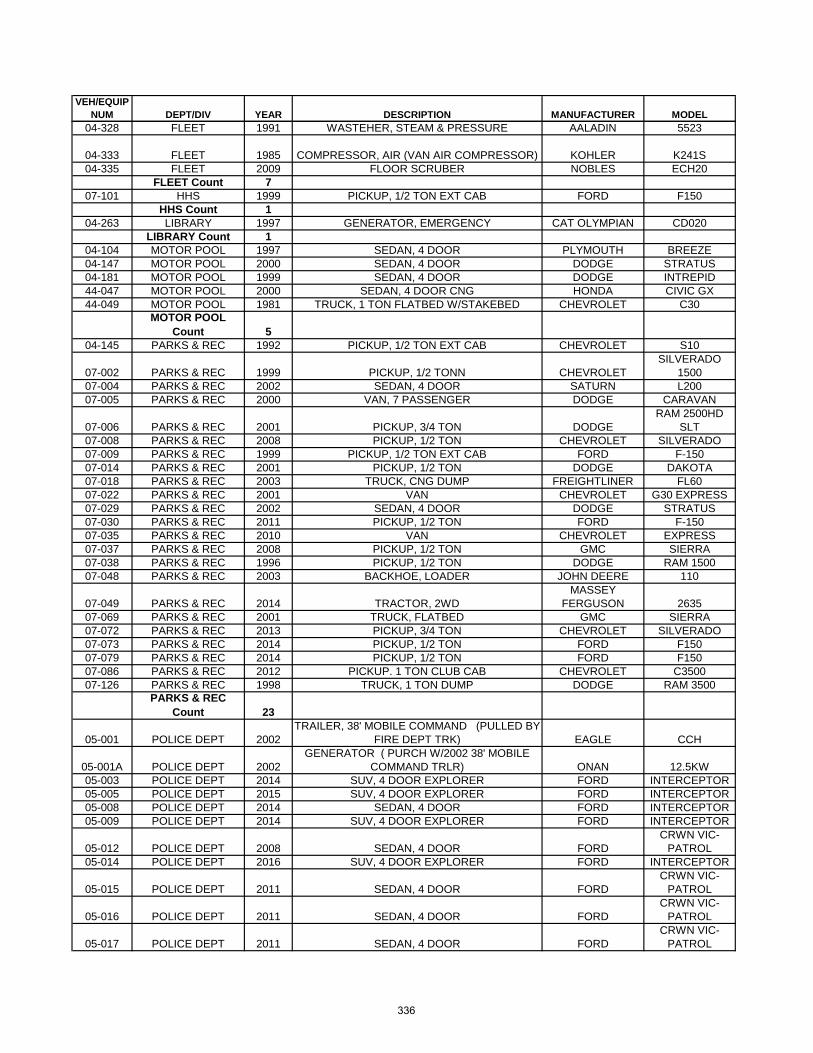
VEH/EQUIP NUM DEPT/DIV YEAR DESCRIPTION MANUFACTURER MODEL
04-328 FLEET 1991 WASTEHER, STEAM & PRESSURE AALADIN 5523
04-333 FLEET 1985 COMPRESSOR, AIR (VAN AIR COMPRESSOR) KOHLER K241S04-335 FLEET 2009 FLOOR SCRUBER NOBLES ECH20
FLEET Count 707-101 HHS 1999 PICKUP, 1/2 TON EXT CAB FORD F150
HHS Count 104-263 LIBRARY 1997 GENERATOR, EMERGENCY CAT OLYMPIAN CD020
LIBRARY Count 104-104 MOTOR POOL 1997 SEDAN, 4 DOOR PLYMOUTH BREEZE04-147 MOTOR POOL 2000 SEDAN, 4 DOOR DODGE STRATUS04-181 MOTOR POOL 1999 SEDAN, 4 DOOR DODGE INTREPID44-047 MOTOR POOL 2000 SEDAN, 4 DOOR CNG HONDA CIVIC GX44-049 MOTOR POOL 1981 TRUCK, 1 TON FLATBED W/STAKEBED CHEVROLET C30
MOTOR POOL Count 5
04-145 PARKS & REC 1992 PICKUP, 1/2 TON EXT CAB CHEVROLET S10
07-002 PARKS & REC 1999 PICKUP, 1/2 TONN CHEVROLETSILVERADO
150007-004 PARKS & REC 2002 SEDAN, 4 DOOR SATURN L20007-005 PARKS & REC 2000 VAN, 7 PASSENGER DODGE CARAVAN
07-006 PARKS & REC 2001 PICKUP, 3/4 TON DODGERAM 2500HD
SLT07-008 PARKS & REC 2008 PICKUP, 1/2 TON CHEVROLET SILVERADO07-009 PARKS & REC 1999 PICKUP, 1/2 TON EXT CAB FORD F-15007-014 PARKS & REC 2001 PICKUP, 1/2 TON DODGE DAKOTA07-018 PARKS & REC 2003 TRUCK, CNG DUMP FREIGHTLINER FL6007-022 PARKS & REC 2001 VAN CHEVROLET G30 EXPRESS07-029 PARKS & REC 2002 SEDAN, 4 DOOR DODGE STRATUS07-030 PARKS & REC 2011 PICKUP, 1/2 TON FORD F-15007-035 PARKS & REC 2010 VAN CHEVROLET EXPRESS07-037 PARKS & REC 2008 PICKUP, 1/2 TON GMC SIERRA07-038 PARKS & REC 1996 PICKUP, 1/2 TON DODGE RAM 150007-048 PARKS & REC 2003 BACKHOE, LOADER JOHN DEERE 110
07-049 PARKS & REC 2014 TRACTOR, 2WDMASSEY
FERGUSON 263507-069 PARKS & REC 2001 TRUCK, FLATBED GMC SIERRA07-072 PARKS & REC 2013 PICKUP, 3/4 TON CHEVROLET SILVERADO07-073 PARKS & REC 2014 PICKUP, 1/2 TON FORD F15007-079 PARKS & REC 2014 PICKUP, 1/2 TON FORD F15007-086 PARKS & REC 2012 PICKUP. 1 TON CLUB CAB CHEVROLET C350007-126 PARKS & REC 1998 TRUCK, 1 TON DUMP DODGE RAM 3500
PARKS & REC Count 23
05-001 POLICE DEPT 2002TRAILER, 38' MOBILE COMMAND (PULLED BY
FIRE DEPT TRK) EAGLE CCH
05-001A POLICE DEPT 2002GENERATOR ( PURCH W/2002 38' MOBILE
COMMAND TRLR) ONAN 12.5KW05-003 POLICE DEPT 2014 SUV, 4 DOOR EXPLORER FORD INTERCEPTOR05-005 POLICE DEPT 2015 SUV, 4 DOOR EXPLORER FORD INTERCEPTOR05-008 POLICE DEPT 2014 SEDAN, 4 DOOR FORD INTERCEPTOR05-009 POLICE DEPT 2014 SUV, 4 DOOR EXPLORER FORD INTERCEPTOR
05-012 POLICE DEPT 2008 SEDAN, 4 DOOR FORDCRWN VIC-
PATROL05-014 POLICE DEPT 2016 SUV, 4 DOOR EXPLORER FORD INTERCEPTOR
05-015 POLICE DEPT 2011 SEDAN, 4 DOOR FORDCRWN VIC-
PATROL
05-016 POLICE DEPT 2011 SEDAN, 4 DOOR FORDCRWN VIC-
PATROL
05-017 POLICE DEPT 2011 SEDAN, 4 DOOR FORDCRWN VIC-
PATROL
336
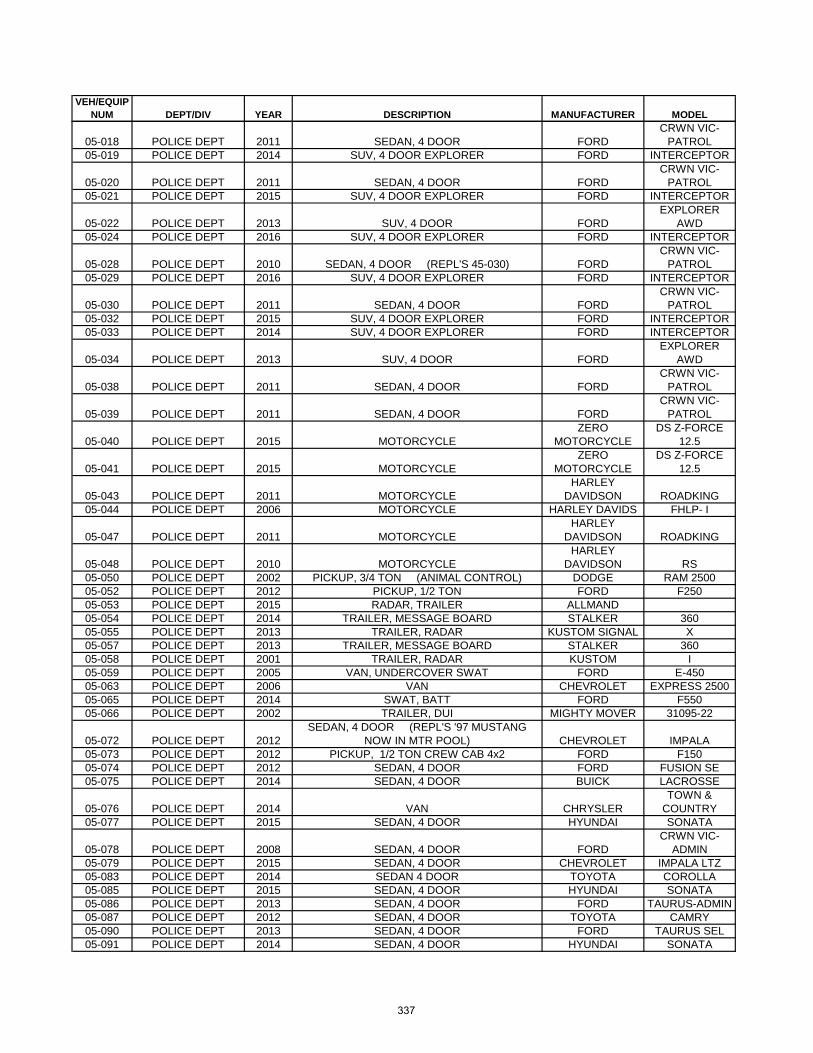
VEH/EQUIP NUM DEPT/DIV YEAR DESCRIPTION MANUFACTURER MODEL
05-018 POLICE DEPT 2011 SEDAN, 4 DOOR FORDCRWN VIC-
PATROL05-019 POLICE DEPT 2014 SUV, 4 DOOR EXPLORER FORD INTERCEPTOR
05-020 POLICE DEPT 2011 SEDAN, 4 DOOR FORDCRWN VIC-
PATROL05-021 POLICE DEPT 2015 SUV, 4 DOOR EXPLORER FORD INTERCEPTOR
05-022 POLICE DEPT 2013 SUV, 4 DOOR FORDEXPLORER
AWD05-024 POLICE DEPT 2016 SUV, 4 DOOR EXPLORER FORD INTERCEPTOR
05-028 POLICE DEPT 2010 SEDAN, 4 DOOR (REPL'S 45-030) FORDCRWN VIC-
PATROL05-029 POLICE DEPT 2016 SUV, 4 DOOR EXPLORER FORD INTERCEPTOR
05-030 POLICE DEPT 2011 SEDAN, 4 DOOR FORDCRWN VIC-
PATROL05-032 POLICE DEPT 2015 SUV, 4 DOOR EXPLORER FORD INTERCEPTOR05-033 POLICE DEPT 2014 SUV, 4 DOOR EXPLORER FORD INTERCEPTOR
05-034 POLICE DEPT 2013 SUV, 4 DOOR FORDEXPLORER
AWD
05-038 POLICE DEPT 2011 SEDAN, 4 DOOR FORDCRWN VIC-
PATROL
05-039 POLICE DEPT 2011 SEDAN, 4 DOOR FORDCRWN VIC-
PATROL
05-040 POLICE DEPT 2015 MOTORCYCLEZERO
MOTORCYCLEDS Z-FORCE
12.5
05-041 POLICE DEPT 2015 MOTORCYCLEZERO
MOTORCYCLEDS Z-FORCE
12.5
05-043 POLICE DEPT 2011 MOTORCYCLEHARLEY
DAVIDSON ROADKING05-044 POLICE DEPT 2006 MOTORCYCLE HARLEY DAVIDS FHLP- I
05-047 POLICE DEPT 2011 MOTORCYCLEHARLEY
DAVIDSON ROADKING
05-048 POLICE DEPT 2010 MOTORCYCLEHARLEY
DAVIDSON RS05-050 POLICE DEPT 2002 PICKUP, 3/4 TON (ANIMAL CONTROL) DODGE RAM 250005-052 POLICE DEPT 2012 PICKUP, 1/2 TON FORD F25005-053 POLICE DEPT 2015 RADAR, TRAILER ALLMAND05-054 POLICE DEPT 2014 TRAILER, MESSAGE BOARD STALKER 36005-055 POLICE DEPT 2013 TRAILER, RADAR KUSTOM SIGNAL X05-057 POLICE DEPT 2013 TRAILER, MESSAGE BOARD STALKER 36005-058 POLICE DEPT 2001 TRAILER, RADAR KUSTOM I05-059 POLICE DEPT 2005 VAN, UNDERCOVER SWAT FORD E-45005-063 POLICE DEPT 2006 VAN CHEVROLET EXPRESS 250005-065 POLICE DEPT 2014 SWAT, BATT FORD F55005-066 POLICE DEPT 2002 TRAILER, DUI MIGHTY MOVER 31095-22
05-072 POLICE DEPT 2012SEDAN, 4 DOOR (REPL'S '97 MUSTANG
NOW IN MTR POOL) CHEVROLET IMPALA05-073 POLICE DEPT 2012 PICKUP, 1/2 TON CREW CAB 4x2 FORD F15005-074 POLICE DEPT 2012 SEDAN, 4 DOOR FORD FUSION SE05-075 POLICE DEPT 2014 SEDAN, 4 DOOR BUICK LACROSSE
05-076 POLICE DEPT 2014 VAN CHRYSLERTOWN &
COUNTRY05-077 POLICE DEPT 2015 SEDAN, 4 DOOR HYUNDAI SONATA
05-078 POLICE DEPT 2008 SEDAN, 4 DOOR FORDCRWN VIC-
ADMIN05-079 POLICE DEPT 2015 SEDAN, 4 DOOR CHEVROLET IMPALA LTZ05-083 POLICE DEPT 2014 SEDAN 4 DOOR TOYOTA COROLLA05-085 POLICE DEPT 2015 SEDAN, 4 DOOR HYUNDAI SONATA05-086 POLICE DEPT 2013 SEDAN, 4 DOOR FORD TAURUS-ADMIN05-087 POLICE DEPT 2012 SEDAN, 4 DOOR TOYOTA CAMRY05-090 POLICE DEPT 2013 SEDAN, 4 DOOR FORD TAURUS SEL05-091 POLICE DEPT 2014 SEDAN, 4 DOOR HYUNDAI SONATA
337
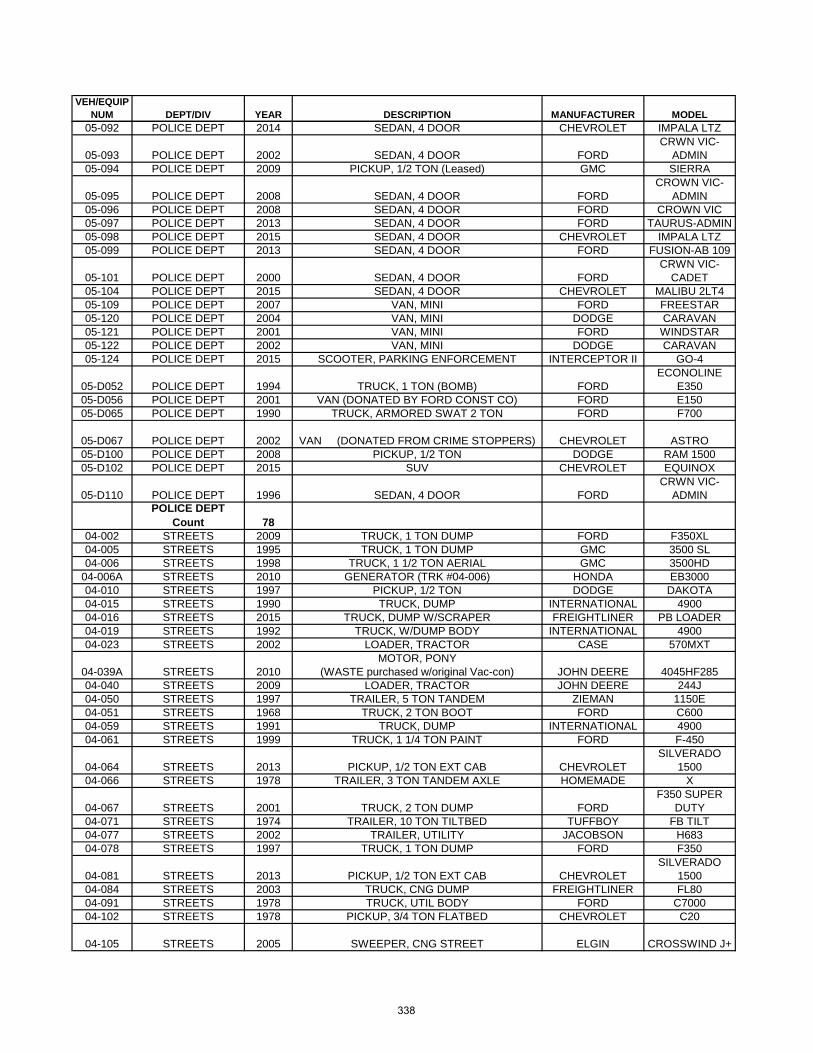
VEH/EQUIP NUM DEPT/DIV YEAR DESCRIPTION MANUFACTURER MODEL
05-092 POLICE DEPT 2014 SEDAN, 4 DOOR CHEVROLET IMPALA LTZ
05-093 POLICE DEPT 2002 SEDAN, 4 DOOR FORDCRWN VIC-
ADMIN05-094 POLICE DEPT 2009 PICKUP, 1/2 TON (Leased) GMC SIERRA
05-095 POLICE DEPT 2008 SEDAN, 4 DOOR FORDCROWN VIC-
ADMIN05-096 POLICE DEPT 2008 SEDAN, 4 DOOR FORD CROWN VIC05-097 POLICE DEPT 2013 SEDAN, 4 DOOR FORD TAURUS-ADMIN05-098 POLICE DEPT 2015 SEDAN, 4 DOOR CHEVROLET IMPALA LTZ05-099 POLICE DEPT 2013 SEDAN, 4 DOOR FORD FUSION-AB 109
05-101 POLICE DEPT 2000 SEDAN, 4 DOOR FORDCRWN VIC-
CADET05-104 POLICE DEPT 2015 SEDAN, 4 DOOR CHEVROLET MALIBU 2LT405-109 POLICE DEPT 2007 VAN, MINI FORD FREESTAR05-120 POLICE DEPT 2004 VAN, MINI DODGE CARAVAN05-121 POLICE DEPT 2001 VAN, MINI FORD WINDSTAR05-122 POLICE DEPT 2002 VAN, MINI DODGE CARAVAN05-124 POLICE DEPT 2015 SCOOTER, PARKING ENFORCEMENT INTERCEPTOR II GO-4
05-D052 POLICE DEPT 1994 TRUCK, 1 TON (BOMB) FORDECONOLINE
E35005-D056 POLICE DEPT 2001 VAN (DONATED BY FORD CONST CO) FORD E15005-D065 POLICE DEPT 1990 TRUCK, ARMORED SWAT 2 TON FORD F700
05-D067 POLICE DEPT 2002 VAN (DONATED FROM CRIME STOPPERS) CHEVROLET ASTRO05-D100 POLICE DEPT 2008 PICKUP, 1/2 TON DODGE RAM 150005-D102 POLICE DEPT 2015 SUV CHEVROLET EQUINOX
05-D110 POLICE DEPT 1996 SEDAN, 4 DOOR FORDCRWN VIC-
ADMINPOLICE DEPT
Count 7804-002 STREETS 2009 TRUCK, 1 TON DUMP FORD F350XL04-005 STREETS 1995 TRUCK, 1 TON DUMP GMC 3500 SL04-006 STREETS 1998 TRUCK, 1 1/2 TON AERIAL GMC 3500HD
04-006A STREETS 2010 GENERATOR (TRK #04-006) HONDA EB300004-010 STREETS 1997 PICKUP, 1/2 TON DODGE DAKOTA04-015 STREETS 1990 TRUCK, DUMP INTERNATIONAL 490004-016 STREETS 2015 TRUCK, DUMP W/SCRAPER FREIGHTLINER PB LOADER04-019 STREETS 1992 TRUCK, W/DUMP BODY INTERNATIONAL 490004-023 STREETS 2002 LOADER, TRACTOR CASE 570MXT
04-039A STREETS 2010MOTOR, PONY
(WASTE purchased w/original Vac-con) JOHN DEERE 4045HF28504-040 STREETS 2009 LOADER, TRACTOR JOHN DEERE 244J04-050 STREETS 1997 TRAILER, 5 TON TANDEM ZIEMAN 1150E04-051 STREETS 1968 TRUCK, 2 TON BOOT FORD C60004-059 STREETS 1991 TRUCK, DUMP INTERNATIONAL 490004-061 STREETS 1999 TRUCK, 1 1/4 TON PAINT FORD F-450
04-064 STREETS 2013 PICKUP, 1/2 TON EXT CAB CHEVROLETSILVERADO
150004-066 STREETS 1978 TRAILER, 3 TON TANDEM AXLE HOMEMADE X
04-067 STREETS 2001 TRUCK, 2 TON DUMP FORDF350 SUPER
DUTY04-071 STREETS 1974 TRAILER, 10 TON TILTBED TUFFBOY FB TILT04-077 STREETS 2002 TRAILER, UTILITY JACOBSON H68304-078 STREETS 1997 TRUCK, 1 TON DUMP FORD F350
04-081 STREETS 2013 PICKUP, 1/2 TON EXT CAB CHEVROLETSILVERADO
150004-084 STREETS 2003 TRUCK, CNG DUMP FREIGHTLINER FL8004-091 STREETS 1978 TRUCK, UTIL BODY FORD C700004-102 STREETS 1978 PICKUP, 3/4 TON FLATBED CHEVROLET C20
04-105 STREETS 2005 SWEEPER, CNG STREET ELGIN CROSSWIND J+
338
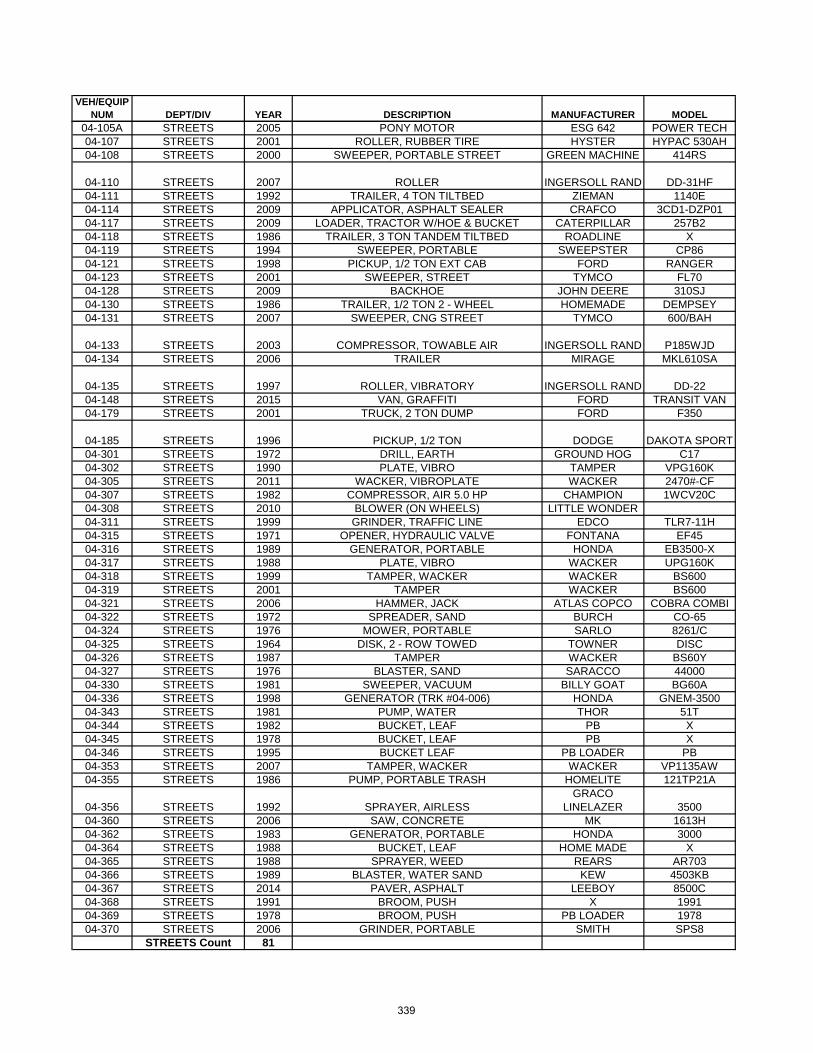
VEH/EQUIP NUM DEPT/DIV YEAR DESCRIPTION MANUFACTURER MODEL
04-105A STREETS 2005 PONY MOTOR ESG 642 POWER TECH04-107 STREETS 2001 ROLLER, RUBBER TIRE HYSTER HYPAC 530AH04-108 STREETS 2000 SWEEPER, PORTABLE STREET GREEN MACHINE 414RS
04-110 STREETS 2007 ROLLER INGERSOLL RAND DD-31HF04-111 STREETS 1992 TRAILER, 4 TON TILTBED ZIEMAN 1140E04-114 STREETS 2009 APPLICATOR, ASPHALT SEALER CRAFCO 3CD1-DZP0104-117 STREETS 2009 LOADER, TRACTOR W/HOE & BUCKET CATERPILLAR 257B204-118 STREETS 1986 TRAILER, 3 TON TANDEM TILTBED ROADLINE X04-119 STREETS 1994 SWEEPER, PORTABLE SWEEPSTER CP8604-121 STREETS 1998 PICKUP, 1/2 TON EXT CAB FORD RANGER04-123 STREETS 2001 SWEEPER, STREET TYMCO FL7004-128 STREETS 2009 BACKHOE JOHN DEERE 310SJ04-130 STREETS 1986 TRAILER, 1/2 TON 2 - WHEEL HOMEMADE DEMPSEY04-131 STREETS 2007 SWEEPER, CNG STREET TYMCO 600/BAH
04-133 STREETS 2003 COMPRESSOR, TOWABLE AIR INGERSOLL RAND P185WJD04-134 STREETS 2006 TRAILER MIRAGE MKL610SA
04-135 STREETS 1997 ROLLER, VIBRATORY INGERSOLL RAND DD-2204-148 STREETS 2015 VAN, GRAFFITI FORD TRANSIT VAN04-179 STREETS 2001 TRUCK, 2 TON DUMP FORD F350
04-185 STREETS 1996 PICKUP, 1/2 TON DODGE DAKOTA SPORT04-301 STREETS 1972 DRILL, EARTH GROUND HOG C1704-302 STREETS 1990 PLATE, VIBRO TAMPER VPG160K04-305 STREETS 2011 WACKER, VIBROPLATE WACKER 2470#-CF04-307 STREETS 1982 COMPRESSOR, AIR 5.0 HP CHAMPION 1WCV20C04-308 STREETS 2010 BLOWER (ON WHEELS) LITTLE WONDER04-311 STREETS 1999 GRINDER, TRAFFIC LINE EDCO TLR7-11H04-315 STREETS 1971 OPENER, HYDRAULIC VALVE FONTANA EF4504-316 STREETS 1989 GENERATOR, PORTABLE HONDA EB3500-X04-317 STREETS 1988 PLATE, VIBRO WACKER UPG160K04-318 STREETS 1999 TAMPER, WACKER WACKER BS60004-319 STREETS 2001 TAMPER WACKER BS60004-321 STREETS 2006 HAMMER, JACK ATLAS COPCO COBRA COMBI04-322 STREETS 1972 SPREADER, SAND BURCH CO-6504-324 STREETS 1976 MOWER, PORTABLE SARLO 8261/C04-325 STREETS 1964 DISK, 2 - ROW TOWED TOWNER DISC04-326 STREETS 1987 TAMPER WACKER BS60Y04-327 STREETS 1976 BLASTER, SAND SARACCO 4400004-330 STREETS 1981 SWEEPER, VACUUM BILLY GOAT BG60A04-336 STREETS 1998 GENERATOR (TRK #04-006) HONDA GNEM-350004-343 STREETS 1981 PUMP, WATER THOR 51T04-344 STREETS 1982 BUCKET, LEAF PB X04-345 STREETS 1978 BUCKET, LEAF PB X04-346 STREETS 1995 BUCKET LEAF PB LOADER PB04-353 STREETS 2007 TAMPER, WACKER WACKER VP1135AW04-355 STREETS 1986 PUMP, PORTABLE TRASH HOMELITE 121TP21A
04-356 STREETS 1992 SPRAYER, AIRLESSGRACO
LINELAZER 350004-360 STREETS 2006 SAW, CONCRETE MK 1613H04-362 STREETS 1983 GENERATOR, PORTABLE HONDA 300004-364 STREETS 1988 BUCKET, LEAF HOME MADE X04-365 STREETS 1988 SPRAYER, WEED REARS AR70304-366 STREETS 1989 BLASTER, WATER SAND KEW 4503KB04-367 STREETS 2014 PAVER, ASPHALT LEEBOY 8500C04-368 STREETS 1991 BROOM, PUSH X 199104-369 STREETS 1978 BROOM, PUSH PB LOADER 197804-370 STREETS 2006 GRINDER, PORTABLE SMITH SPS8
STREETS Count 81
339
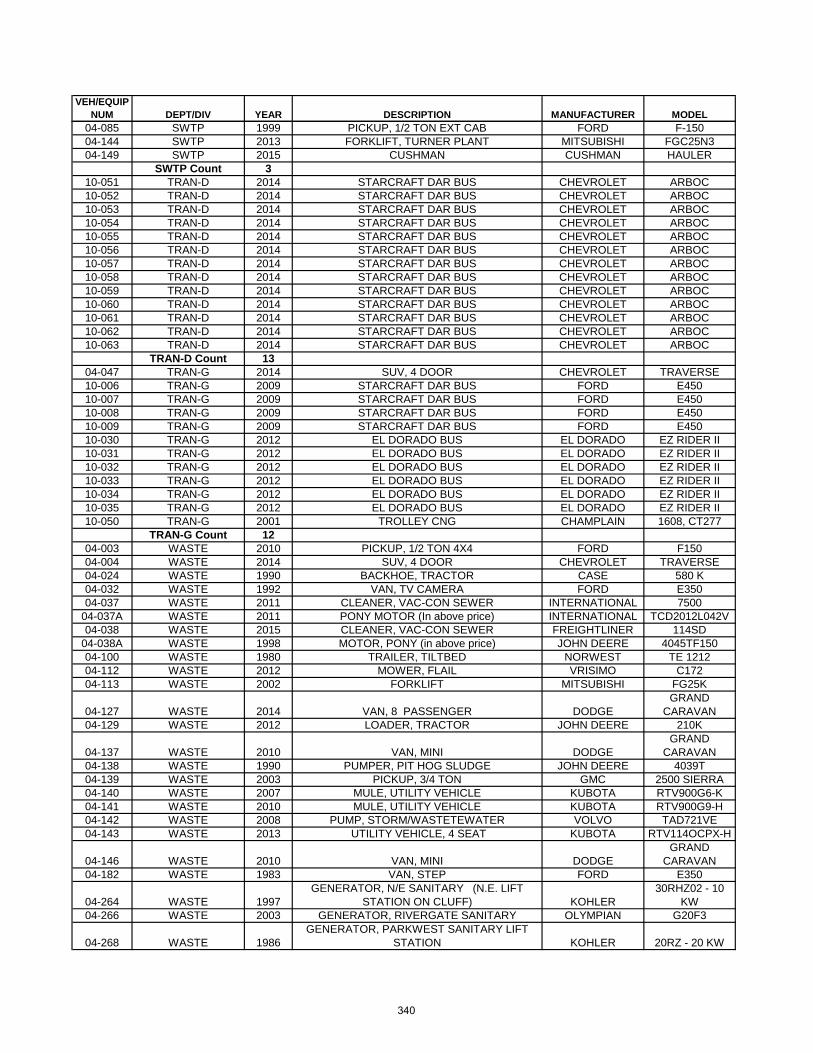
VEH/EQUIP NUM DEPT/DIV YEAR DESCRIPTION MANUFACTURER MODEL
04-085 SWTP 1999 PICKUP, 1/2 TON EXT CAB FORD F-15004-144 SWTP 2013 FORKLIFT, TURNER PLANT MITSUBISHI FGC25N304-149 SWTP 2015 CUSHMAN CUSHMAN HAULER
SWTP Count 310-051 TRAN-D 2014 STARCRAFT DAR BUS CHEVROLET ARBOC10-052 TRAN-D 2014 STARCRAFT DAR BUS CHEVROLET ARBOC10-053 TRAN-D 2014 STARCRAFT DAR BUS CHEVROLET ARBOC10-054 TRAN-D 2014 STARCRAFT DAR BUS CHEVROLET ARBOC10-055 TRAN-D 2014 STARCRAFT DAR BUS CHEVROLET ARBOC10-056 TRAN-D 2014 STARCRAFT DAR BUS CHEVROLET ARBOC10-057 TRAN-D 2014 STARCRAFT DAR BUS CHEVROLET ARBOC10-058 TRAN-D 2014 STARCRAFT DAR BUS CHEVROLET ARBOC10-059 TRAN-D 2014 STARCRAFT DAR BUS CHEVROLET ARBOC10-060 TRAN-D 2014 STARCRAFT DAR BUS CHEVROLET ARBOC10-061 TRAN-D 2014 STARCRAFT DAR BUS CHEVROLET ARBOC10-062 TRAN-D 2014 STARCRAFT DAR BUS CHEVROLET ARBOC10-063 TRAN-D 2014 STARCRAFT DAR BUS CHEVROLET ARBOC
TRAN-D Count 1304-047 TRAN-G 2014 SUV, 4 DOOR CHEVROLET TRAVERSE10-006 TRAN-G 2009 STARCRAFT DAR BUS FORD E45010-007 TRAN-G 2009 STARCRAFT DAR BUS FORD E45010-008 TRAN-G 2009 STARCRAFT DAR BUS FORD E45010-009 TRAN-G 2009 STARCRAFT DAR BUS FORD E45010-030 TRAN-G 2012 EL DORADO BUS EL DORADO EZ RIDER II10-031 TRAN-G 2012 EL DORADO BUS EL DORADO EZ RIDER II10-032 TRAN-G 2012 EL DORADO BUS EL DORADO EZ RIDER II10-033 TRAN-G 2012 EL DORADO BUS EL DORADO EZ RIDER II10-034 TRAN-G 2012 EL DORADO BUS EL DORADO EZ RIDER II10-035 TRAN-G 2012 EL DORADO BUS EL DORADO EZ RIDER II10-050 TRAN-G 2001 TROLLEY CNG CHAMPLAIN 1608, CT277
TRAN-G Count 1204-003 WASTE 2010 PICKUP, 1/2 TON 4X4 FORD F15004-004 WASTE 2014 SUV, 4 DOOR CHEVROLET TRAVERSE04-024 WASTE 1990 BACKHOE, TRACTOR CASE 580 K04-032 WASTE 1992 VAN, TV CAMERA FORD E35004-037 WASTE 2011 CLEANER, VAC-CON SEWER INTERNATIONAL 7500
04-037A WASTE 2011 PONY MOTOR (In above price) INTERNATIONAL TCD2012L042V04-038 WASTE 2015 CLEANER, VAC-CON SEWER FREIGHTLINER 114SD
04-038A WASTE 1998 MOTOR, PONY (in above price) JOHN DEERE 4045TF15004-100 WASTE 1980 TRAILER, TILTBED NORWEST TE 121204-112 WASTE 2012 MOWER, FLAIL VRISIMO C17204-113 WASTE 2002 FORKLIFT MITSUBISHI FG25K
04-127 WASTE 2014 VAN, 8 PASSENGER DODGEGRAND
CARAVAN04-129 WASTE 2012 LOADER, TRACTOR JOHN DEERE 210K
04-137 WASTE 2010 VAN, MINI DODGEGRAND
CARAVAN04-138 WASTE 1990 PUMPER, PIT HOG SLUDGE JOHN DEERE 4039T04-139 WASTE 2003 PICKUP, 3/4 TON GMC 2500 SIERRA04-140 WASTE 2007 MULE, UTILITY VEHICLE KUBOTA RTV900G6-K04-141 WASTE 2010 MULE, UTILITY VEHICLE KUBOTA RTV900G9-H04-142 WASTE 2008 PUMP, STORM/WASTETEWATER VOLVO TAD721VE04-143 WASTE 2013 UTILITY VEHICLE, 4 SEAT KUBOTA RTV114OCPX-H
04-146 WASTE 2010 VAN, MINI DODGEGRAND
CARAVAN04-182 WASTE 1983 VAN, STEP FORD E350
04-264 WASTE 1997GENERATOR, N/E SANITARY (N.E. LIFT
STATION ON CLUFF) KOHLER30RHZ02 - 10
KW04-266 WASTE 2003 GENERATOR, RIVERGATE SANITARY OLYMPIAN G20F3
04-268 WASTE 1986GENERATOR, PARKWEST SANITARY LIFT
STATION KOHLER 20RZ - 20 KW
340
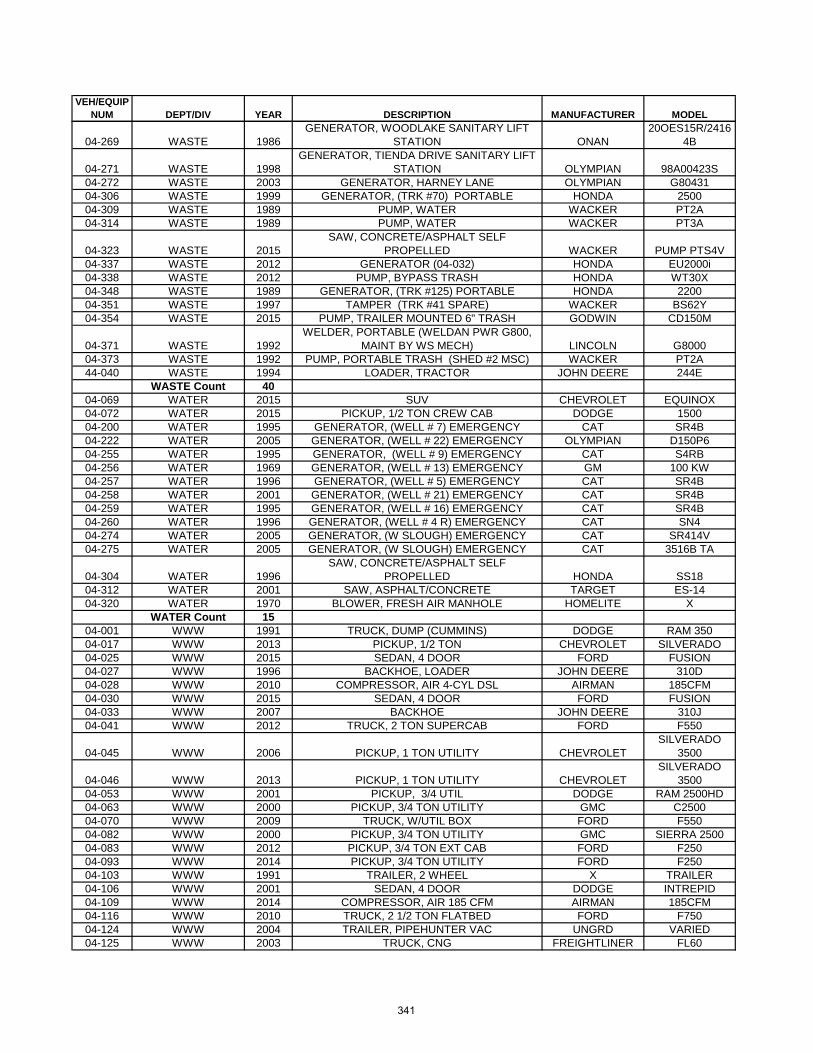
VEH/EQUIP NUM DEPT/DIV YEAR DESCRIPTION MANUFACTURER MODEL
04-269 WASTE 1986GENERATOR, WOODLAKE SANITARY LIFT
STATION ONAN20OES15R/2416
4B
04-271 WASTE 1998GENERATOR, TIENDA DRIVE SANITARY LIFT
STATION OLYMPIAN 98A00423S04-272 WASTE 2003 GENERATOR, HARNEY LANE OLYMPIAN G8043104-306 WASTE 1999 GENERATOR, (TRK #70) PORTABLE HONDA 250004-309 WASTE 1989 PUMP, WATER WACKER PT2A04-314 WASTE 1989 PUMP, WATER WACKER PT3A
04-323 WASTE 2015SAW, CONCRETE/ASPHALT SELF
PROPELLED WACKER PUMP PTS4V04-337 WASTE 2012 GENERATOR (04-032) HONDA EU2000i04-338 WASTE 2012 PUMP, BYPASS TRASH HONDA WT30X04-348 WASTE 1989 GENERATOR, (TRK #125) PORTABLE HONDA 220004-351 WASTE 1997 TAMPER (TRK #41 SPARE) WACKER BS62Y04-354 WASTE 2015 PUMP, TRAILER MOUNTED 6" TRASH GODWIN CD150M
04-371 WASTE 1992WELDER, PORTABLE (WELDAN PWR G800,
MAINT BY WS MECH) LINCOLN G800004-373 WASTE 1992 PUMP, PORTABLE TRASH (SHED #2 MSC) WACKER PT2A44-040 WASTE 1994 LOADER, TRACTOR JOHN DEERE 244E
WASTE Count 4004-069 WATER 2015 SUV CHEVROLET EQUINOX04-072 WATER 2015 PICKUP, 1/2 TON CREW CAB DODGE 150004-200 WATER 1995 GENERATOR, (WELL # 7) EMERGENCY CAT SR4B04-222 WATER 2005 GENERATOR, (WELL # 22) EMERGENCY OLYMPIAN D150P604-255 WATER 1995 GENERATOR, (WELL # 9) EMERGENCY CAT S4RB04-256 WATER 1969 GENERATOR, (WELL # 13) EMERGENCY GM 100 KW04-257 WATER 1996 GENERATOR, (WELL # 5) EMERGENCY CAT SR4B04-258 WATER 2001 GENERATOR, (WELL # 21) EMERGENCY CAT SR4B04-259 WATER 1995 GENERATOR, (WELL # 16) EMERGENCY CAT SR4B04-260 WATER 1996 GENERATOR, (WELL # 4 R) EMERGENCY CAT SN404-274 WATER 2005 GENERATOR, (W SLOUGH) EMERGENCY CAT SR414V04-275 WATER 2005 GENERATOR, (W SLOUGH) EMERGENCY CAT 3516B TA
04-304 WATER 1996SAW, CONCRETE/ASPHALT SELF
PROPELLED HONDA SS1804-312 WATER 2001 SAW, ASPHALT/CONCRETE TARGET ES-1404-320 WATER 1970 BLOWER, FRESH AIR MANHOLE HOMELITE X
WATER Count 1504-001 WWW 1991 TRUCK, DUMP (CUMMINS) DODGE RAM 35004-017 WWW 2013 PICKUP, 1/2 TON CHEVROLET SILVERADO04-025 WWW 2015 SEDAN, 4 DOOR FORD FUSION04-027 WWW 1996 BACKHOE, LOADER JOHN DEERE 310D04-028 WWW 2010 COMPRESSOR, AIR 4-CYL DSL AIRMAN 185CFM04-030 WWW 2015 SEDAN, 4 DOOR FORD FUSION04-033 WWW 2007 BACKHOE JOHN DEERE 310J04-041 WWW 2012 TRUCK, 2 TON SUPERCAB FORD F550
04-045 WWW 2006 PICKUP, 1 TON UTILITY CHEVROLETSILVERADO
3500
04-046 WWW 2013 PICKUP, 1 TON UTILITY CHEVROLETSILVERADO
350004-053 WWW 2001 PICKUP, 3/4 UTIL DODGE RAM 2500HD04-063 WWW 2000 PICKUP, 3/4 TON UTILITY GMC C250004-070 WWW 2009 TRUCK, W/UTIL BOX FORD F55004-082 WWW 2000 PICKUP, 3/4 TON UTILITY GMC SIERRA 250004-083 WWW 2012 PICKUP, 3/4 TON EXT CAB FORD F25004-093 WWW 2014 PICKUP, 3/4 TON UTILITY FORD F25004-103 WWW 1991 TRAILER, 2 WHEEL X TRAILER04-106 WWW 2001 SEDAN, 4 DOOR DODGE INTREPID04-109 WWW 2014 COMPRESSOR, AIR 185 CFM AIRMAN 185CFM04-116 WWW 2010 TRUCK, 2 1/2 TON FLATBED FORD F75004-124 WWW 2004 TRAILER, PIPEHUNTER VAC UNGRD VARIED04-125 WWW 2003 TRUCK, CNG FREIGHTLINER FL60
341
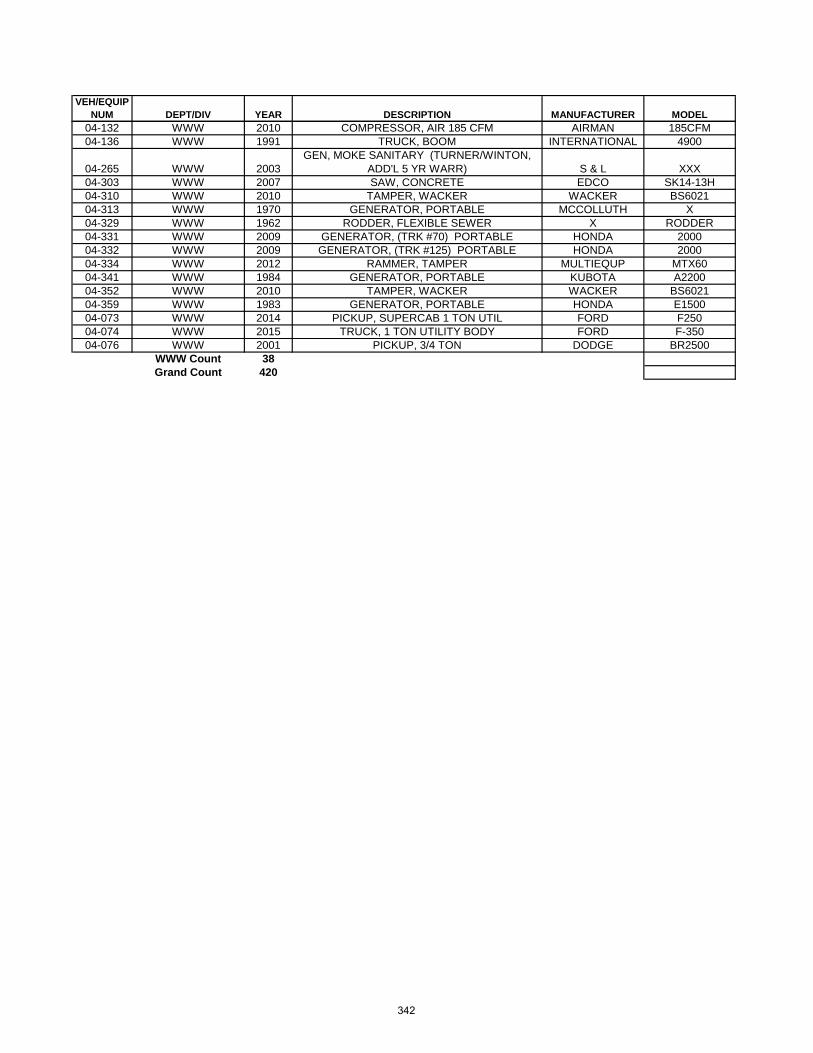
VEH/EQUIP NUM DEPT/DIV YEAR DESCRIPTION MANUFACTURER MODEL
04-132 WWW 2010 COMPRESSOR, AIR 185 CFM AIRMAN 185CFM04-136 WWW 1991 TRUCK, BOOM INTERNATIONAL 4900
04-265 WWW 2003GEN, MOKE SANITARY (TURNER/WINTON,
ADD'L 5 YR WARR) S & L XXX04-303 WWW 2007 SAW, CONCRETE EDCO SK14-13H04-310 WWW 2010 TAMPER, WACKER WACKER BS602104-313 WWW 1970 GENERATOR, PORTABLE MCCOLLUTH X04-329 WWW 1962 RODDER, FLEXIBLE SEWER X RODDER04-331 WWW 2009 GENERATOR, (TRK #70) PORTABLE HONDA 200004-332 WWW 2009 GENERATOR, (TRK #125) PORTABLE HONDA 200004-334 WWW 2012 RAMMER, TAMPER MULTIEQUP MTX6004-341 WWW 1984 GENERATOR, PORTABLE KUBOTA A220004-352 WWW 2010 TAMPER, WACKER WACKER BS602104-359 WWW 1983 GENERATOR, PORTABLE HONDA E150004-073 WWW 2014 PICKUP, SUPERCAB 1 TON UTIL FORD F25004-074 WWW 2015 TRUCK, 1 TON UTILITY BODY FORD F-35004-076 WWW 2001 PICKUP, 3/4 TON DODGE BR2500
WWW Count 38Grand Count 420
342


![FRP - StudiesToday.com Class 7... · History Picture Identification & discription- [10 Marks] Geography- Map ... Lodis Bahlul lodi Sikander Lodi Ibrahim Lodi](https://img.pdfslide.us/doc/110x75/5a9e2ce47f8b9a36788c4f5e/frp-class-7history-picture-identification-discription-10-marks-geography-.jpg)