Embed Size (px)
Citation preview
2017 – 2018 Budget August 28, 2017
2425 E. Main Street, League City, Texas 77573
Galveston & Harris County | Visit us Online @ www.ccisd.net
Greg Smith, Ph.D.
Superintendent
2425 East Main Street
League City, Texas 77573
(281) 284-0002
August 28, 2017
Board of Trustees
Clear Creek Independent School District
Galveston County, Texas
Sections 44.002 through 44.006 of the Texas Education Code establish the legal basis for budget
development in school districts. Budgets for the General Fund, Debt Service Fund and Food Service Fund
must be prepared and approved at least at the fund and function levels to comply with the State’s legal
level of control mandates. The District budget must be approved no later than August 31st.
Through the hard work, dedication and collaboration of board members, district administrators and staff,
the attached budgets for the General Fund, Debt Service Fund and Food Service Fund have been prepared
based upon the school finance provisions adopted by the 85th Legislature, Regular Session.
We appreciate the support of the Board, the residents of the District and business community, all who
work cooperatively to ensure the best education for its students and the prudent development of the
District. This cooperation is indicative of the strong support for the attainment of excellence in the
District’s educational programs.
Respectfully Submitted,
Greg Smith, Ph.D.
Superintendent
TABLE OF CONTENTS
Page
Executive Summary 2
Statistical Information 5
General Fund Budget Statistics 6
Average Daily Attendance and Enrollment 7
Enrollment by Grade 8
Enrollment by Ethnicity 9
Enrollment by Program 10
Other Enrollment Statistics 11
Full-time Equivalent Staffing 12
Administrative Cost Ratio 13
Comparison of Revenues by Source and Expenditures by Function 14
General Fund 15
Debt Service Fund 16
Food Service Fund 17
Comparison of Detail Revenues 18
General Fund 19
Debt Service Fund 20
Food Service Fund 21
Comparison of Expenditures by Function and Major Object 22
General Fund 23
Debt Service Fund 29
Food Service Fund 30
Comparison of Expenditures by Program Intent Code 31
General Fund 32
1

EXECUTIVE SUMMARY
General Fund Revenues
(see summary on page 15 and detail on page 19)
Local revenues increase $16.2M due to:
increases in tax collections of $15.0M as a result of higher 2016 property values than originally budgeted
during summer 2016 (budgeted value growth of 8.2% and actual was 8.3%) along with increased collections
for 2017-2018 due to higher 2017 property values (budgeted value growth of 8.0%),
increases in interest earnings of $0.9M due to increased rates of return on investments, and
increases in various other local revenues of $0.3M.
State revenues decrease a net of $7.2M due to:
increases in State funding of $0.8M due to increased TRS on-behalf payments (offset with an expenditure
increase mentioned below), and
net decreases in State funding of $8.0M as a result of projected enrollment growth of 550 students (517 ADA)
offset by decreases due to increased property values.
Federal revenues remained comparable to prior year.
Other resources increase $0.2M due to:
operating transfer from the Capital Replacement Fund back to the General Fund.
General Fund Expenditures
(see summary on page 15 and detail on page 23)
Generally, most Functions are increasing due to a 2.0% salary increase for teachers and all exempt employees and
3.0% for all non-exempt employees totaling approximately $6.6M
The remaining increase of $2.6M is due to a net of:
increases of $1.8M for additional instructional staffing (30 FTE’s)
increases of $0.8M due to increased TRS on-behalf payments (offset with revenue increase mentioned
above),
2

increases of $0.6M due to the 5th year implementation of a technology replacement fund,
increases of $0.5M due to a state mandated increase in the district contribution rate for TRS Care,
increases of $0.5M due to an increase in the district contribution toward employee health plan costs,
increases of $0.1M due to the transfer of federally funded special education positions to the General Fund,
decreases of $2.0M due to the removal of the facilities maintenance and repair fund due to the passage of
Bond 2017 which included such funding, and
decreases of $0.3M due to property and casualty insurance rate reductions.
As of August 31, 2017 the projected fund balance in the General Fund will be approximately $55.9M. This amount
represents 17% of the annual General Fund budget and satisfies our goal to maintain two months unassigned fund
balance.
Debt Service Fund
(see summary on page 16 and detail on pages 20 & 29)
Revenues in this fund are projected to increase $5.4M due to:
Local revenue increases of $5.4M due to increases in tax collections as a result of higher 2016 property values
than originally budgeted during summer 2016 (budgeted value growth of 8.2% and actual was 8.3%) along
with increased collections for 2017-2018 due to higher 2017 property values (budgeted value growth of
8.0%).
State revenue remained comparable to prior year. Other than this homestead exemption funding, the District
does not qualify for any State funding to cover debt service payments.
Expenditures in this fund are projected to decrease $2.1M due to:
decreases of $1.1M in principal and interest payments based on current amortization schedules,
increases of $8.8M in interest payments on a projected Spring 2018 bond sale related to Bond 2017, and
decreases of $9.8M in principal defeasance budgeted last fiscal year and settled in Spring 2017.
3

When voters approved the $487M bond referendum on May 6, 2017 to address enrollment growth, aging facilities
and repairs, safety improvements, student programs, and technology the tax rate for 2017-2018 was projected to be
$0.395. However, due to higher than projected value increases the District has been able to maintain the 2016-2017
rate of $0.36.
As of August 31, 2017 the projected fund balance in the Debt Service Fund will be approximately $13.1M. This
amount represents 18% of projected annual debt service payments and exceeds our goal to maintain a fund balance
of 10% of estimated annual payments. This surplus will be used to help offset future increases related to Bond 2017
bond payments.
Food Service Fund
(see summary on page 17 and detail on pages 21 & 30)
Revenues are budgeted to increase approximately $0.2M while expenditures are only budgeted to increase
approximately $0.1M in the Food Service Fund over 2016-2017. The increase revenue and decrease in expenditures
is due to continued fine tuning of the budget now that we have three years of experience with regard to high schools
and two years of experience with regard to intermediate schools on our locally developed food program. This budget
also includes salary increases of 2.0% for all exempt food service employees and 3.0% for all non-exempt food
service employees.
As of August 31, 2017 the projected non-capital fund balance in the Food Service Fund will be approximately $3.0M
which is below three month cap imposed by the Texas Department of Agriculture (TDA).
4

STATISTICAL INFORMATION
5
2017 - 2018 2016 - 2017
ORIGINAL ORIGINAL
BUDGET BUDGET
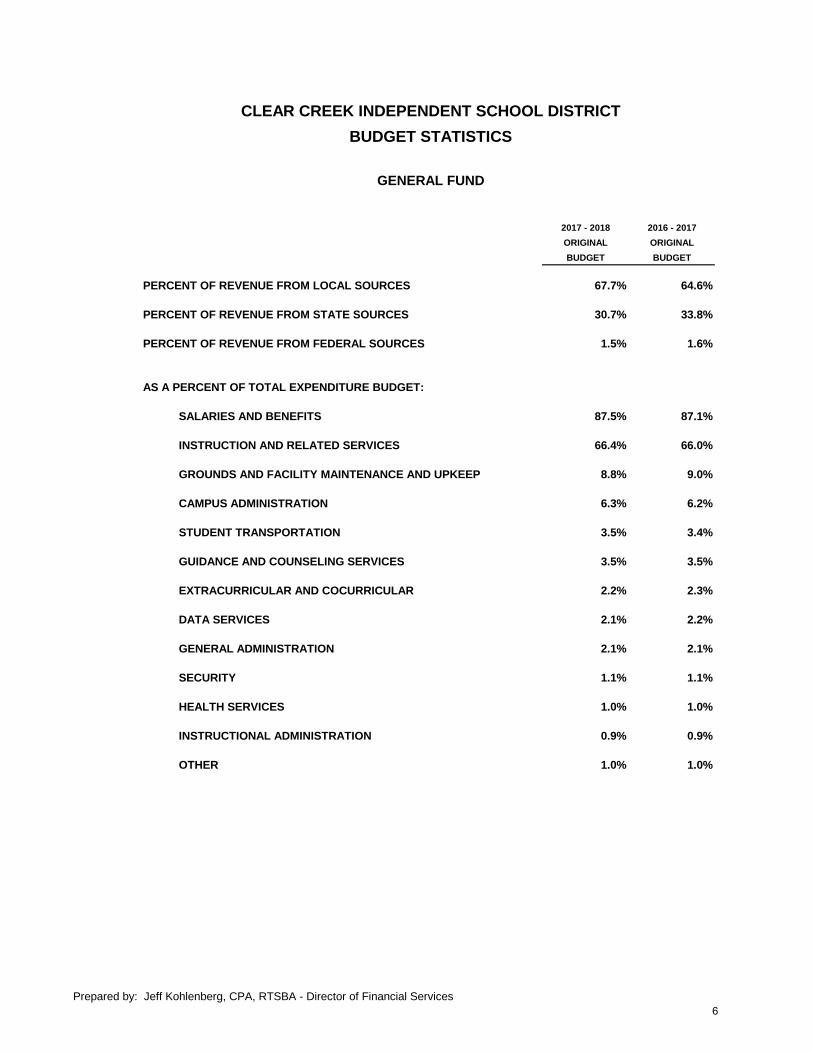
PERCENT OF REVENUE FROM LOCAL SOURCES 67.7% 64.6%
PERCENT OF REVENUE FROM STATE SOURCES 30.7% 33.8%
PERCENT OF REVENUE FROM FEDERAL SOURCES 1.5% 1.6%
AS A PERCENT OF TOTAL EXPENDITURE BUDGET:
SALARIES AND BENEFITS 87.5% 87.1%
INSTRUCTION AND RELATED SERVICES 66.4% 66.0%
GROUNDS AND FACILITY MAINTENANCE AND UPKEEP 8.8% 9.0%
CAMPUS ADMINISTRATION 6.3% 6.2%
STUDENT TRANSPORTATION 3.5% 3.4%
GUIDANCE AND COUNSELING SERVICES 3.5% 3.5%
EXTRACURRICULAR AND COCURRICULAR 2.2% 2.3%
DATA SERVICES 2.1% 2.2%
GENERAL ADMINISTRATION 2.1% 2.1%
SECURITY 1.1% 1.1%
HEALTH SERVICES 1.0% 1.0%
INSTRUCTIONAL ADMINISTRATION 0.9% 0.9%
OTHER 1.0% 1.0%
CLEAR CREEK INDEPENDENT SCHOOL DISTRICT
BUDGET STATISTICS
GENERAL FUND
Prepared by: Jeff Kohlenberg, CPA, RTSBA - Director of Financial Services
6

ADA as a Growth in
Average % of AEIS / PEIMS Growth in Enrollment
School Daily AEIS / PEIMS AEIS / PEIMS Attendance ADA from % from %
Year Attendance Enrollment Enrollment Rate Prior Year Growth Prior Year Growth Comments
2017 - 2018 39,743 42,202 94.2% N/A 517 1.3% 550 1.3% Based on Budgeted Data
2016 - 2017 39,226 41,652 94.2% N/A 556 1.4% 591 1.4%
2015 - 2016 38,670 41,061 94.2% N/A 442 1.2% 421 1.0%
2014 - 2015 38,228 40,640 94.1% 95.9% 688 1.8% 832 2.1%
2013 - 2014 37,540 39,808 94.3% 96.0% 342 0.9% 328 0.8%
2012 - 2013 37,198 39,480 94.2% 96.0% 375 1.0% 443 1.1%
2011 - 2012 36,823 39,037 94.3% 96.2% 599 1.7% 787 2.1%
2010 - 2011 36,224 38,250 94.7% 96.1% 863 2.4% 778 2.1%
2009 - 2010 35,361 37,472 94.4% 95.9% 457 1.3% 427 1.2%
2008 - 2009 34,904 37,045 94.2% 95.8% 936 2.8% 892 2.5% Hurricane Ike
2007 - 2008 33,967 36,153 94.0% 95.7% 749 2.3% 775 2.2%
2006 - 2007 33,218 35,378 93.9% 95.6% 393 1.2% 235 0.7%
2005 - 2006 32,825 35,143 93.4% 95.8% 1,229 3.9% 1,664 5.0% Hurricanes Katrina & Rita
2004 - 2005 31,595 33,479 94.4% 96.0% 660 2.1% 773 2.4%
2003 - 2004 30,936 32,706 94.6% 96.2% 853 2.8% 867 2.7%
2002 - 2003 30,083 31,839 94.5% 95.9% 707 2.4% 845 2.7%
2001 - 2002 29,376 30,994 94.8% 95.8% 1,360 4.9% 1,119 3.7% Full-day Kindergarten
2000 - 2001 28,016 29,875 93.8% 95.9% 1,143 4.3% 1,029 3.6% Full-day Kindergarten
1999 - 2000 26,873 28,846 93.2% 96.4% 591 2.2% 641 2.3%
1998 - 1999 26,282 28,205 93.2% 96.1% 264 1.0% 5 0.0%
1997 - 1998 26,018 28,200 92.3% 95.9% 816 3.2% 648 2.4%
1996 - 1997 25,202 27,552 91.5% 96.0% 854 3.5% 989 3.7%
1995 - 1996 24,348 26,563 91.7% 95.6% 1,188 5.1% 1,258 5.0%
Source: ADA pulled from PEIMS / Summary of Finance records and enrollment pulled from TAPR / AEIS / PEIMS.
CLEAR CREEK INDEPENDENT SCHOOL DISTRICT
AVERAGE DAILY ATTENDANCE AND ENROLLMENT
Prepared by: Jeff Kohlenberg, CPA, RTSBA - Director of Financial Services7

School
Year Total EC Pre-K K 1st 2nd 3rd 4th 5th 6th 7th 8th 9th 10th 11th 12th
2016 - 2017 41,652 137 1,176 2,787 2,943 2,970 3,029 3,082 3,100 3,081 3,290 3,227 3,552 3,269 3,096 2,913
2015 - 2016 41,061 180 1,109 2,789 2,876 2,916 2,989 2,995 2,996 3,173 3,207 3,133 3,442 3,221 3,173 2,862
2014 - 2015 40,640 161 1,152 2,795 2,860 2,866 2,906 2,889 3,025 3,108 3,096 3,163 3,356 3,238 3,077 2,948
2013 - 2014 39,808 148 1,163 2,725 2,816 2,844 2,788 2,944 2,984 2,975 3,065 3,049 3,345 3,106 3,117 2,739
2012 - 2013 39,480 135 1,166 2,706 2,750 2,740 2,900 2,929 2,889 2,966 2,996 3,106 3,272 3,189 2,960 2,776
2011 - 2012 39,037 133 1,138 2,613 2,701 2,812 2,854 2,807 2,894 2,946 3,073 3,024 3,320 3,074 2,949 2,699
2010 - 2011 38,250 132 944 2,594 2,745 2,751 2,771 2,781 2,789 2,968 2,994 3,074 3,195 2,965 2,902 2,645
2009 - 2010 37,472 170 692 2,590 2,704 2,677 2,756 2,727 2,851 2,961 3,001 2,899 3,147 2,997 2,753 2,547
2008 - 2009 37,045 165 603 2,585 2,659 2,732 2,710 2,806 2,892 2,937 2,860 2,943 3,098 2,826 2,767 2,462
2007 - 2008 36,153 201 536 2,467 2,638 2,645 2,723 2,773 2,825 2,800 2,873 2,852 3,051 2,827 2,708 2,234
2006 - 2007 35,378 182 504 2,441 2,582 2,613 2,671 2,738 2,699 2,769 2,760 2,783 3,043 2,790 2,490 2,313
2005 - 2006 35,143 149 604 2,396 2,588 2,614 2,685 2,641 2,648 2,713 2,787 2,720 3,137 2,604 2,484 2,373
2004 - 2005 33,479 120 503 2,372 2,432 2,539 2,496 2,494 2,547 2,670 2,632 2,732 2,832 2,492 2,401 2,217
2003 - 2004 32,706 116 480 2,312 2,475 2,483 2,431 2,445 2,546 2,559 2,697 2,569 2,790 2,479 2,261 2,063
2002 - 2003 31,839 87 432 2,282 2,406 2,366 2,376 2,474 2,469 2,559 2,529 2,545 2,759 2,363 2,164 2,028
2001 - 2002 30,994 91 449 2,156 2,276 2,285 2,393 2,394 2,462 2,460 2,512 2,523 2,659 2,243 2,161 1,930
2000 - 2001 29,875 105 377 1,994 2,203 2,277 2,316 2,408 2,361 2,411 2,464 2,366 2,532 2,274 2,046 1,741
1999 - 2000 28,846 158 415 1,827 2,189 2,218 2,298 2,273 2,298 2,425 2,339 2,203 2,531 2,063 1,861 1,748
1998 - 1999 28,205 174 313 1,908 2,130 2,269 2,243 2,250 2,326 2,168 2,263 2,305 2,450 1,915 1,852 1,639
1997 - 1998 28,200 170 353 1,901 2,218 2,240 2,195 2,298 2,262 2,228 2,320 2,204 2,386 1,934 1,799 1,692
1996 - 1997 27,552 173 339 1,905 2,211 2,152 2,256 2,183 2,137 2,307 2,170 2,098 2,343 1,851 1,878 1,549
1995 - 1996 26,563 91 310 1,918 2,069 2,191 2,114 2,061 2,173 2,044 2,080 2,053 2,298 1,915 1,689 1,557
1994 - 1995 25,305 89 274 1,834 2,078 2,038 1,969 2,073 1,983 1,992 1,987 1,892 2,234 1,693 1,607 1,562
Grade
CLEAR CREEK INDEPENDENT SCHOOL DISTRICT
ENROLLMENT BY GRADE
Source: Data pulled from TAPR / AEIS.
Prepared by: Jeff Kohlenberg, CPA, RTSBA - Director of Financial Services 8
School
Year Total
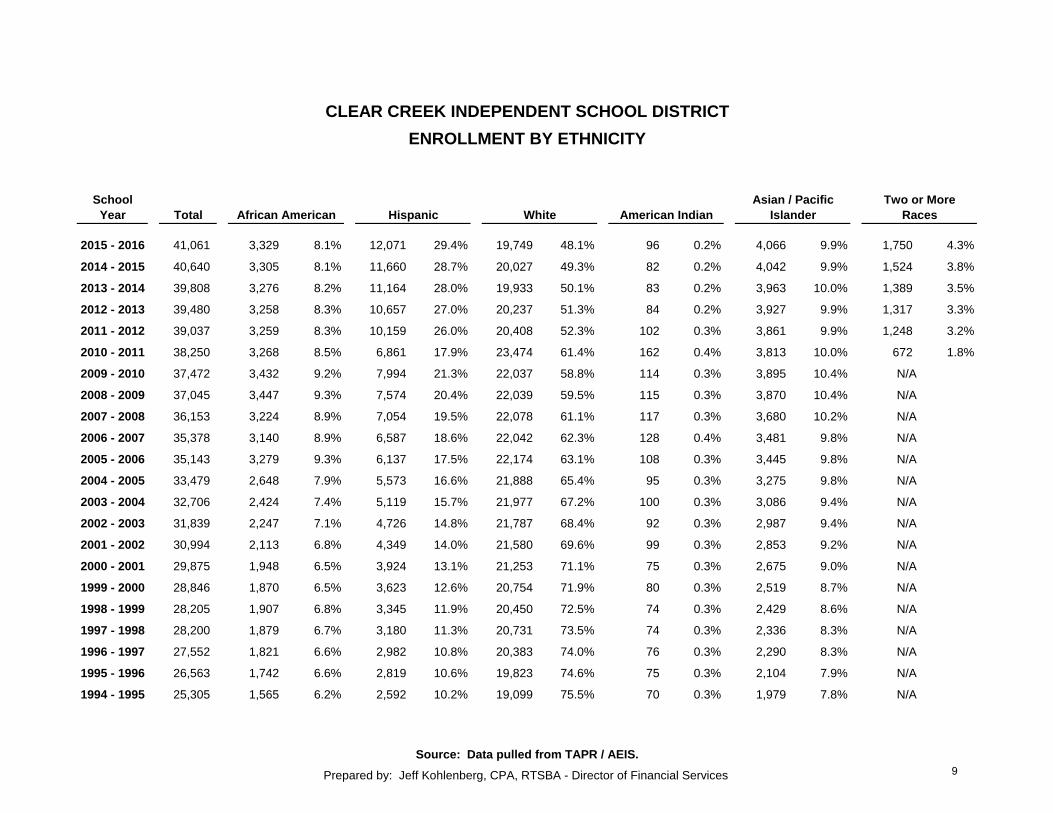
2015 - 2016 41,061 3,329 8.1% 12,071 29.4% 19,749 48.1% 96 0.2% 4,066 9.9% 1,750 4.3%
2014 - 2015 40,640 3,305 8.1% 11,660 28.7% 20,027 49.3% 82 0.2% 4,042 9.9% 1,524 3.8%
2013 - 2014 39,808 3,276 8.2% 11,164 28.0% 19,933 50.1% 83 0.2% 3,963 10.0% 1,389 3.5%
2012 - 2013 39,480 3,258 8.3% 10,657 27.0% 20,237 51.3% 84 0.2% 3,927 9.9% 1,317 3.3%
2011 - 2012 39,037 3,259 8.3% 10,159 26.0% 20,408 52.3% 102 0.3% 3,861 9.9% 1,248 3.2%
2010 - 2011 38,250 3,268 8.5% 6,861 17.9% 23,474 61.4% 162 0.4% 3,813 10.0% 672 1.8%
2009 - 2010 37,472 3,432 9.2% 7,994 21.3% 22,037 58.8% 114 0.3% 3,895 10.4% N/A
2008 - 2009 37,045 3,447 9.3% 7,574 20.4% 22,039 59.5% 115 0.3% 3,870 10.4% N/A
2007 - 2008 36,153 3,224 8.9% 7,054 19.5% 22,078 61.1% 117 0.3% 3,680 10.2% N/A
2006 - 2007 35,378 3,140 8.9% 6,587 18.6% 22,042 62.3% 128 0.4% 3,481 9.8% N/A
2005 - 2006 35,143 3,279 9.3% 6,137 17.5% 22,174 63.1% 108 0.3% 3,445 9.8% N/A
2004 - 2005 33,479 2,648 7.9% 5,573 16.6% 21,888 65.4% 95 0.3% 3,275 9.8% N/A
2003 - 2004 32,706 2,424 7.4% 5,119 15.7% 21,977 67.2% 100 0.3% 3,086 9.4% N/A
2002 - 2003 31,839 2,247 7.1% 4,726 14.8% 21,787 68.4% 92 0.3% 2,987 9.4% N/A
2001 - 2002 30,994 2,113 6.8% 4,349 14.0% 21,580 69.6% 99 0.3% 2,853 9.2% N/A
2000 - 2001 29,875 1,948 6.5% 3,924 13.1% 21,253 71.1% 75 0.3% 2,675 9.0% N/A
1999 - 2000 28,846 1,870 6.5% 3,623 12.6% 20,754 71.9% 80 0.3% 2,519 8.7% N/A
1998 - 1999 28,205 1,907 6.8% 3,345 11.9% 20,450 72.5% 74 0.3% 2,429 8.6% N/A
1997 - 1998 28,200 1,879 6.7% 3,180 11.3% 20,731 73.5% 74 0.3% 2,336 8.3% N/A
1996 - 1997 27,552 1,821 6.6% 2,982 10.8% 20,383 74.0% 76 0.3% 2,290 8.3% N/A
1995 - 1996 26,563 1,742 6.6% 2,819 10.6% 19,823 74.6% 75 0.3% 2,104 7.9% N/A
1994 - 1995 25,305 1,565 6.2% 2,592 10.2% 19,099 75.5% 70 0.3% 1,979 7.8% N/A
Source: Data pulled from TAPR / AEIS.
Two or More
Races
CLEAR CREEK INDEPENDENT SCHOOL DISTRICT
ENROLLMENT BY ETHNICITY
African American Hispanic White American Indian Islander
Asian / Pacific
Prepared by: Jeff Kohlenberg, CPA, RTSBA - Director of Financial Services 9

School
Year Total
2015 - 2016 41,061 4,194 10.2% 13,151 32.0% 4,074 9.9% 3,947 9.6%
2014 - 2015 40,640 3,934 9.7% 12,448 30.6% 3,844 9.5% 3,890 9.6%
2013 - 2014 39,808 3,611 9.1% 11,598 29.1% 3,570 9.0% 3,778 9.5%
2012 - 2013 39,480 3,339 8.5% 11,300 28.6% 3,333 8.4% 3,707 9.4%
2011 - 2012 39,037 3,085 7.9% 11,915 30.5% 3,073 7.9% 3,599 9.2%
2010 - 2011 38,250 2,860 7.5% 10,083 26.4% 2,984 7.8% 3,423 8.9%
2009 - 2010 37,472 2,696 7.2% 9,354 25.0% 2,817 7.5% 3,454 9.2%
2008 - 2009 37,045 2,578 7.0% 10,513 28.4% 2,648 7.1% 3,607 9.7%
2007 - 2008 36,153 2,499 6.9% 10,419 28.8% 2,632 7.3% 3,619 10.0%
2006 - 2007 35,378 2,173 6.1% 8,694 24.6% 2,522 7.1% 3,512 9.9%
2005 - 2006 35,143 2,047 5.8% 6,340 18.0% 2,506 7.1% 3,394 9.7%
2004 - 2005 33,479 1,976 5.9% 7,441 22.2% 2,662 8.0% 3,173 9.5%
2003 - 2004 32,706 1,913 5.8% 5,564 17.0% 2,750 8.4% 2,901 8.9%
2002 - 2003 31,839 1,879 5.9% 4,729 14.9% 2,834 8.9% 2,671 8.4%
2001 - 2002 30,994 1,622 5.2% 5,105 16.5% 2,875 9.3% 2,587 8.3%
2000 - 2001 29,875 1,414 4.7% 4,749 15.9% 2,805 9.4% 2,553 8.5%
1999 - 2000 28,846 1,178 4.1% 3,082 10.7% 2,694 9.3% 2,434 8.4%
1998 - 1999 28,205 1,167 4.1% 2,423 8.6% 2,636 9.3% 2,255 8.0%
1997 - 1998 28,200 1,113 3.9% 3,061 10.9% 2,242 8.0% 2,290 8.1%
1996 - 1997 27,552 1,035 3.8% 3,261 11.8% 2,148 7.8% 2,346 8.5%
1995 - 1996 26,563 1,049 3.9% 3,690 13.9% 1,860 7.0% 2,072 7.8%
1994 - 1995 25,305 962 3.8% 3,416 13.5% 1,684 6.7% 2,021 8.0%
Source: Data pulled from TAPR / AEIS.
Gifted & Talented
Education
Special
CLEAR CREEK INDEPENDENT SCHOOL DISTRICT
ENROLLMENT BY PROGRAM
Bilingual / ESL Career & Technical
Education Education Education
Prepared by: Jeff Kohlenberg, CPA, RTSBA - Director of Financial Services 10

School
Year Total
2015 - 2016 41,061 11,347 27.6% 4,177 10.2% 15,400 37.5%
2014 - 2015 40,640 10,953 27.0% 3,976 9.8% 15,315 37.7%
2013 - 2014 39,808 10,944 27.5% 3,670 9.2% 14,537 36.5%
2012 - 2013 39,480 11,089 28.1% 3,390 8.6% 11,237 28.5%
2011 - 2012 39,037 10,967 28.1% 3,161 8.1% 11,379 29.1%
2010 - 2011 38,250 9,714 25.4% 2,971 7.8% 9,856 25.8%
2009 - 2010 37,472 8,519 22.7% 2,826 7.5% 11,336 30.3%
2008 - 2009 37,045 8,168 22.0% 2,701 7.3% 10,564 28.5%
2007 - 2008 36,153 6,316 17.5% 2,636 7.3% 8,898 24.6%
2006 - 2007 35,378 6,449 18.2% 2,350 6.6% 9,409 26.6%
2005 - 2006 35,143 6,526 18.6% 2,233 6.4% 8,983 25.6%
2004 - 2005 33,479 6,214 18.6% 2,196 6.6% 7,498 22.4%
2003 - 2004 32,706 4,950 15.1% 2,186 6.7% N/A N/A
2002 - 2003 31,839 4,419 13.9% 2,085 6.5% N/A N/A
2001 - 2002 30,994 3,897 12.6% 1,836 5.9% N/A N/A
2000 - 2001 29,875 3,718 12.4% 1,506 5.0% N/A N/A
1999 - 2000 28,846 2,786 9.7% 1,275 4.4% N/A N/A
1998 - 1999 28,205 3,213 11.4% 1,284 4.6% N/A N/A
1997 - 1998 28,200 3,053 10.8% 1,303 4.6% N/A N/A
1996 - 1997 27,552 2,235 8.1% 1,200 4.4% N/A N/A
1995 - 1996 26,563 2,894 10.9% 1,131 4.3% N/A N/A
1994 - 1995 25,305 2,782 11.0% 1,107 4.4% N/A N/A
Source: Data pulled from TAPR / AEIS.
At-Risk
CLEAR CREEK INDEPENDENT SCHOOL DISTRICT
OTHER ENROLLMENT STATISTICS
English Language
Disadvantaged Learners
Economically
Prepared by: Jeff Kohlenberg, CPA, RTSBA - Director of Financial Services 11
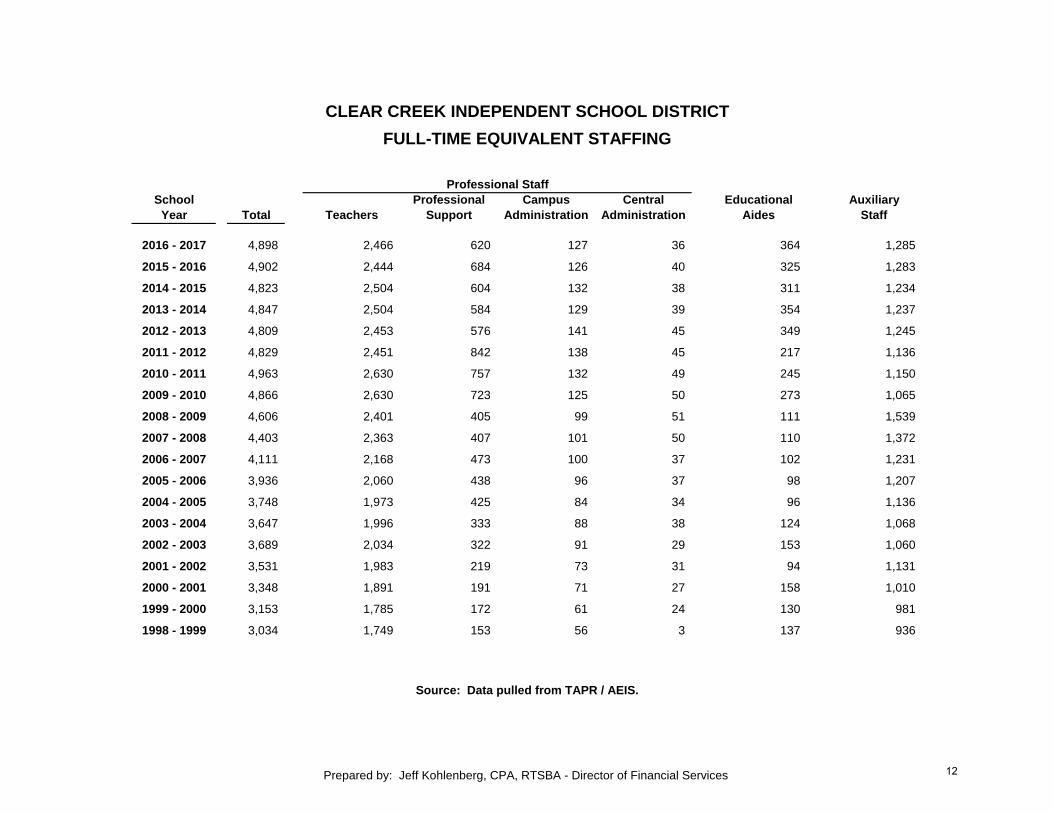
School Professional Campus Central Educational Auxiliary
Year Total Teachers Support Administration Administration Aides Staff
2016 - 2017 4,898 2,466 620 127 36 364 1,285
2015 - 2016 4,902 2,444 684 126 40 325 1,283
2014 - 2015 4,823 2,504 604 132 38 311 1,234
2013 - 2014 4,847 2,504 584 129 39 354 1,237
2012 - 2013 4,809 2,453 576 141 45 349 1,245
2011 - 2012 4,829 2,451 842 138 45 217 1,136
2010 - 2011 4,963 2,630 757 132 49 245 1,150
2009 - 2010 4,866 2,630 723 125 50 273 1,065
2008 - 2009 4,606 2,401 405 99 51 111 1,539
2007 - 2008 4,403 2,363 407 101 50 110 1,372
2006 - 2007 4,111 2,168 473 100 37 102 1,231
2005 - 2006 3,936 2,060 438 96 37 98 1,207
2004 - 2005 3,748 1,973 425 84 34 96 1,136
2003 - 2004 3,647 1,996 333 88 38 124 1,068
2002 - 2003 3,689 2,034 322 91 29 153 1,060
2001 - 2002 3,531 1,983 219 73 31 94 1,131
2000 - 2001 3,348 1,891 191 71 27 158 1,010
1999 - 2000 3,153 1,785 172 61 24 130 981
1998 - 1999 3,034 1,749 153 56 3 137 936
CLEAR CREEK INDEPENDENT SCHOOL DISTRICT
FULL-TIME EQUIVALENT STAFFING
Source: Data pulled from TAPR / AEIS.
Professional Staff
Prepared by: Jeff Kohlenberg, CPA, RTSBA - Director of Financial Services 12
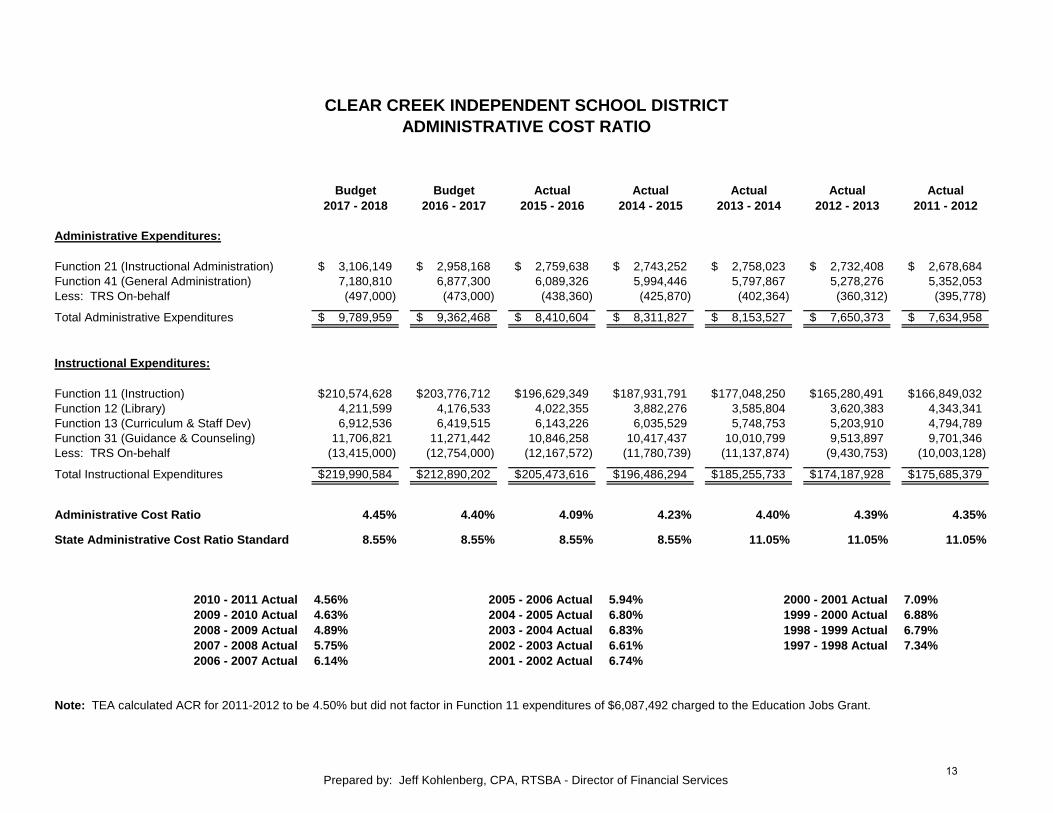
Budget Budget Actual Actual Actual Actual Actual
2017 - 2018 2016 - 2017 2015 - 2016 2014 - 2015 2013 - 2014 2012 - 2013 2011 - 2012
Administrative Expenditures:
Function 21 (Instructional Administration) 3,106,149$ 2,958,168$ 2,759,638$ 2,743,252$ 2,758,023$ 2,732,408$ 2,678,684$
Function 41 (General Administration) 7,180,810 6,877,300 6,089,326 5,994,446 5,797,867 5,278,276 5,352,053
Less: TRS On-behalf (497,000) (473,000) (438,360) (425,870) (402,364) (360,312) (395,778)
Total Administrative Expenditures 9,789,959$ 9,362,468$ 8,410,604$ 8,311,827$ 8,153,527$ 7,650,373$ 7,634,958$
Instructional Expenditures:
Function 11 (Instruction) 210,574,628$ 203,776,712$ 196,629,349$ 187,931,791$ 177,048,250$ 165,280,491$ 166,849,032$
Function 12 (Library) 4,211,599 4,176,533 4,022,355 3,882,276 3,585,804 3,620,383 4,343,341
Function 13 (Curriculum & Staff Dev) 6,912,536 6,419,515 6,143,226 6,035,529 5,748,753 5,203,910 4,794,789
Function 31 (Guidance & Counseling) 11,706,821 11,271,442 10,846,258 10,417,437 10,010,799 9,513,897 9,701,346
Less: TRS On-behalf (13,415,000) (12,754,000) (12,167,572) (11,780,739) (11,137,874) (9,430,753) (10,003,128)
Total Instructional Expenditures 219,990,584$ 212,890,202$ 205,473,616$ 196,486,294$ 185,255,733$ 174,187,928$ 175,685,379$
Administrative Cost Ratio 4.45% 4.40% 4.09% 4.23% 4.40% 4.39% 4.35%
State Administrative Cost Ratio Standard 8.55% 8.55% 8.55% 8.55% 11.05% 11.05% 11.05%
2010 - 2011 Actual 4.56% 2005 - 2006 Actual 5.94% 2000 - 2001 Actual 7.09%
2009 - 2010 Actual 4.63% 2004 - 2005 Actual 6.80% 1999 - 2000 Actual 6.88%
2008 - 2009 Actual 4.89% 2003 - 2004 Actual 6.83% 1998 - 1999 Actual 6.79%
2007 - 2008 Actual 5.75% 2002 - 2003 Actual 6.61% 1997 - 1998 Actual 7.34%
2006 - 2007 Actual 6.14% 2001 - 2002 Actual 6.74%
Note: TEA calculated ACR for 2011-2012 to be 4.50% but did not factor in Function 11 expenditures of $6,087,492 charged to the Education Jobs Grant.
CLEAR CREEK INDEPENDENT SCHOOL DISTRICT
ADMINISTRATIVE COST RATIO
Prepared by: Jeff Kohlenberg, CPA, RTSBA - Director of Financial Services13

COMPARISON OF
REVENUES BY SOURCE
AND
EXPENDITURES BY FUNCTION
14

2017 - 2018 2016 - 2017
ORIGINAL ORIGINAL INCREASE
BUDGET BUDGET (DECREASE)
REVENUES
LOCAL & INTERMEDIATE SOURCES 224,702,000$ 208,505,000$ 16,197,000$
STATE PROGRAM REVENUES 102,992,000 110,170,000 (7,178,000)
FEDERAL PROGRAM REVENUES 5,140,000 5,135,000 5,000
OTHER RESOURCES / NON-OPERATING REVENUES 2,220,000 2,050,000 170,000
TOTAL REVENUES 335,054,000$ 325,860,000$ 9,194,000$
EXPENDITURES
FUNCTION: 11 INSTRUCTION 210,574,628$ 203,776,712$ 6,797,916$
FUNCTION: 12 INSTRUCTIONAL RESOURCES 4,211,599 4,176,533 35,066
FUNCTION: 13 CURRICULUM & STAFF DEVELOPMENT 6,912,536 6,419,515 493,021
FUNCTION: 21 INSTRUCTIONAL ADMINISTRATION 3,106,149 2,958,168 147,981
FUNCTION: 23 SCHOOL ADMINISTRATION 21,060,216 20,248,918 811,298
FUNCTION: 31 GUIDANCE & COUNSELING 11,706,821 11,271,442 435,379
FUNCTION: 32 SOCIAL WORK SERVICES 683,870 715,771 (31,901)
FUNCTION: 33 HEALTH SERVICES 3,433,679 3,196,897 236,782
FUNCTION: 34 STUDENT TRANSPORTATION 11,789,800 11,140,800 649,000
FUNCTION: 35 FOOD SERVICES 302,900 297,600 5,300
FUNCTION: 36 COCURRICULAR 7,459,506 7,362,531 96,975
FUNCTION: 41 GENERAL ADMINISTRATION 7,180,810 6,877,300 303,510
FUNCTION: 51 PLANT MAINTENANCE 29,593,870 29,294,090 299,780
FUNCTION: 52 SECURITY AND MONITORING SERVICES 3,789,430 3,472,940 316,490
FUNCTION: 53 DATA SERVICES 7,164,880 7,226,476 (61,596)
FUNCTION: 61 COMMUNITY SERVICES 72,800 109,475 (36,675)
FUNCTION: 81 FACILITIES ACQUISITION & CONSTRUCTION - - -
FUNCTION: 93 PAYMENTS TO FISCAL AGENT 799,500 650,500 149,000
FUNCTION: 95 PAYMENTS TO JJAEP - - -
FUNCTION: 97 PAYMENTS TO T.I.F. - - -
FUNCTION: 99 OTHER INTERGOVERNMENTAL CHARGES 2,210,000 2,225,000 (15,000)
OTHER USES / NON-OPERATING EXPENDITURES 3,000,000 4,400,000 (1,400,000)
TOTAL EXPENDITURES 335,052,994$ 325,820,668$ 9,232,326$
EXCESS (DEFICIENCY) OF REVENUES OVER (UNDER) EXPENDITURES 1,006$ 39,332$ (38,326)$
CLEAR CREEK INDEPENDENT SCHOOL DISTRICT
2017 - 2018 BUDGET SUMMARY
GENERAL FUND
Prepared by: Jeff Kohlenberg, CPA, RTSBA - Director of Financial Services
15

2017 - 2018 2016 - 2017
ORIGINAL ORIGINAL INCREASE
BUDGET BUDGET (DECREASE)
REVENUES
LOCAL & INTERMEDIATE SOURCES 76,640,000$ 71,205,000$ 5,435,000$
STATE PROGRAM REVENUES 1,625,000 1,695,000 (70,000)
TOTAL REVENUES 78,265,000$ 72,900,000$ 5,365,000$
EXPENDITURES
FUNCTION: 71 DEBT SERVICES 72,945,000$ 75,100,000$ (2,155,000)$
TOTAL EXPENDITURES 72,945,000$ 75,100,000$ (2,155,000)$
EXCESS (DEFICIENCY) OF REVENUES OVER (UNDER) EXPENDITURES 5,320,000$ (2,200,000)$ 7,520,000$
CLEAR CREEK INDEPENDENT SCHOOL DISTRICT
2017 - 2018 BUDGET SUMMARY
DEBT SERVICE FUND
Prepared by: Jeff Kohlenberg, CPA, RTSBA - Director of Financial Services
16
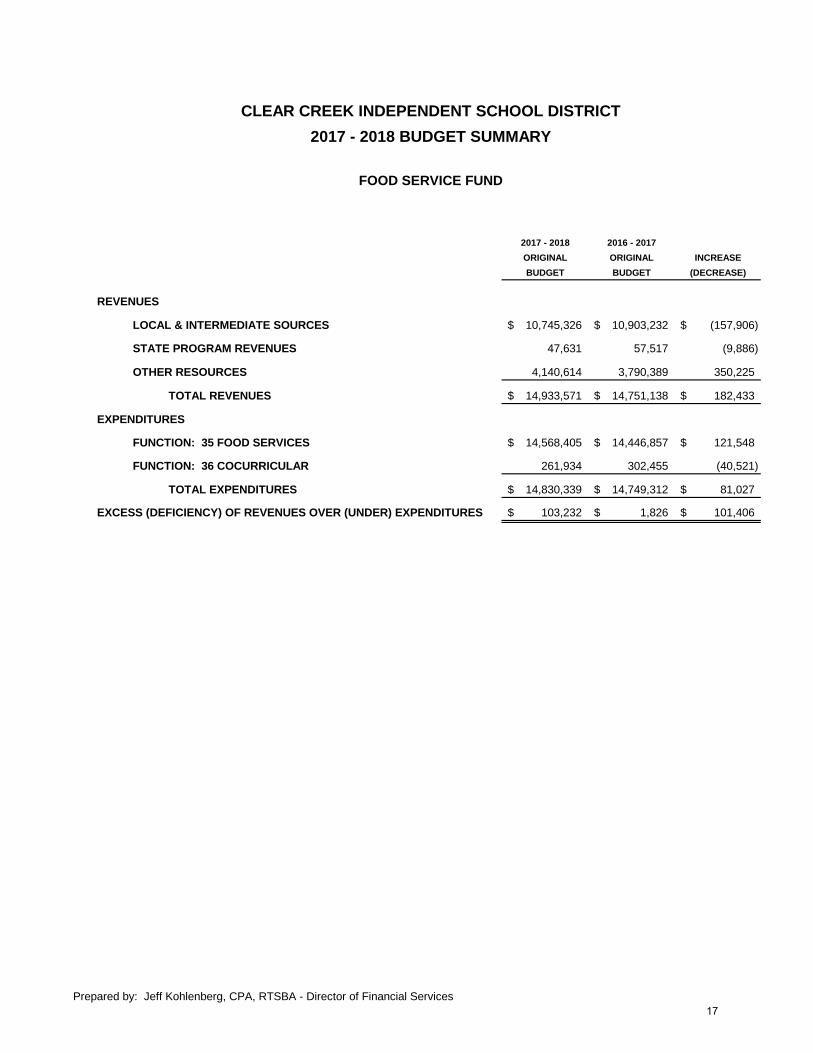
2017 - 2018 2016 - 2017
ORIGINAL ORIGINAL INCREASE
BUDGET BUDGET (DECREASE)
REVENUES
LOCAL & INTERMEDIATE SOURCES 10,745,326$ 10,903,232$ (157,906)$
STATE PROGRAM REVENUES 47,631 57,517 (9,886)
OTHER RESOURCES 4,140,614 3,790,389 350,225
TOTAL REVENUES 14,933,571$ 14,751,138$ 182,433$
EXPENDITURES
FUNCTION: 35 FOOD SERVICES 14,568,405$ 14,446,857$ 121,548$
FUNCTION: 36 COCURRICULAR 261,934 302,455 (40,521)
TOTAL EXPENDITURES 14,830,339$ 14,749,312$ 81,027$
EXCESS (DEFICIENCY) OF REVENUES OVER (UNDER) EXPENDITURES 103,232$ 1,826$ 101,406$
CLEAR CREEK INDEPENDENT SCHOOL DISTRICT
2017 - 2018 BUDGET SUMMARY
FOOD SERVICE FUND
Prepared by: Jeff Kohlenberg, CPA, RTSBA - Director of Financial Services
17
COMPARISON OF
DETAIL REVENUES
18

2017 - 2018 2016 - 2017
ORIGINAL ORIGINAL INCREASE
BUDGET BUDGET (DECREASE)
5700 LOCAL & INTERMEDIATE SOURCES
5711 CURRENT TAXES 219,800,000$ 204,800,000$ 15,000,000$
5713 DELINQUENT TAXES 400,000 400,000 -
5719 PENALTIES, INTEREST & OTHER ON TAXES 982,000 912,000 70,000
5722 SHARED SERVCES ARRANGEMENTS - GBCHI 35,000 30,000 5,000
5737 SERVICES TO OTHER DISTRICTS - CLEAR PATH 80,000 80,000 -
5739 TUITION & FEES 525,000 520,000 5,000
5742 INTEREST 1,325,000 400,000 925,000
5743 FACILITY & EQUIPMENT RENTAL 620,000 465,000 155,000
5746 T.I.F. - - -
5749 OTHER LOCAL 176,000 165,000 11,000
5752 GATE RECEIPTS 655,000 630,000 25,000
5769 OTHER INTERMEDIATE 104,000 103,000 1,000
TOTAL FROM LOCAL & INTERMEDIATE SOURCES 224,702,000$ 208,505,000$ 16,197,000$
5800 STATE PROGRAM REVENUES
5811 AVAILABLE SCHOOL FUND 7,700,000$ 15,000,000$ (7,300,000)$
5812 FOUNDATION SCHOOL FUND 77,900,000 78,600,000 (700,000)
5829 OTHER 80,000 80,000 -
5831 TRS ON-BEHALF 17,312,000 16,490,000 822,000
TOTAL FROM STATE PROGRAM REVENUES 102,992,000$ 110,170,000$ (7,178,000)$
5900 FEDERAL PROGRAM REVENUES
592x INDIRECT COSTS 640,000$ 640,000$ -$
5931 SCHOOL HEALTH & RELATED SERVICES 4,200,000 4,200,000 -
5941 IMPACT AID - - -
5949 ROTC 300,000 295,000 5,000
TOTAL FROM FEDERAL PROGRAM REVENUES 5,140,000$ 5,135,000$ 5,000$
OTHER RESOURCES / NON-OPERATING REVENUES
7912 SALE OF PROPERTY 25,000$ 25,000$ -$
7915 OPERATING TRANSFERS IN 2,195,000 2,025,000 170,000
TOTAL FROM OTHER RESOURCES / NON-OPERATING REVENUES 2,220,000$ 2,050,000$ 170,000$
TOTAL FOR GENERAL FUND 335,054,000$ 325,860,000$ 9,194,000$
CLEAR CREEK INDEPENDENT SCHOOL DISTRICT
2017 - 2018 BUDGET SUMMARY
REVENUE BY SOURCE
GENERAL FUND
Prepared by: Jeff Kohlenberg, CPA, RTSBA - Director of Financial Services
19

2017 - 2018 2016 - 2017
ORIGINAL ORIGINAL INCREASE
BUDGET BUDGET (DECREASE)
5700 LOCAL & INTERMEDIATE SOURCES
5711 CURRENT TAXES 76,000,000$ 70,800,000$ 5,200,000$
5713 DELINQUENT TAXES 100,000 75,000 25,000
5719 PENALTY & INTEREST 300,000 265,000 35,000
5742 INTEREST 240,000 65,000 175,000
TOTAL FROM LOCAL & INTERMEDIATE SOURCES 76,640,000$ 71,205,000$ 5,435,000$
5800 STATE PROGRAM REVENUES
5829 OTHER 1,625,000$ 1,695,000$ (70,000)$
TOTAL FROM STATE PROGRAM REVENUES 1,625,000$ 1,695,000$ (70,000)$
TOTAL FOR DEBT SERVICE FUND 78,265,000$ 72,900,000$ 5,365,000$
CLEAR CREEK INDEPENDENT SCHOOL DISTRICT
2017 - 2018 BUDGET SUMMARY
REVENUE BY SOURCE
DEBT SERVICE FUND
Prepared by: Jeff Kohlenberg, CPA, RTSBA - Director of Financial Services
20

2017 - 2018 2016 - 2017
ORIGINAL ORIGINAL INCREASE
BUDGET BUDGET (DECREASE)
5700 LOCAL & INTERMEDIATE SOURCES
5751 CASH SALES 10,221,381$ 10,469,639$ (248,258)$
5759 CATERING & VENDING 523,945 433,593 90,352
TOTAL FROM LOCAL & INTERMEDIATE SOURCES 10,745,326$ 10,903,232$ (157,906)$
5800 STATE PROGRAM REVENUES
5829 OTHER 47,631$ 57,517$ (9,886)$
TOTAL FROM STATE PROGRAM REVENUES 47,631$ 57,517$ (9,886)$
7900 OTHER RESOURCES
7952 NATIONAL SCHOOL BREAKFAST PROGRAM 783,506$ 751,610$ 31,896$
7953 NATIONAL SCHOOL LUNCH PROGRAM 2,655,574 2,328,676 326,898
7954 USDA COMMODITIES 641,534 690,103 (48,569)
7955 INTEREST 60,000 20,000 40,000
TOTAL FROM OTHER RESOURCES 4,140,614$ 3,790,389$ 350,225$
TOTAL FOR FOOD SERVICE FUND 14,933,571$ 14,751,138$ 182,433$
CLEAR CREEK INDEPENDENT SCHOOL DISTRICT
2017 - 2018 BUDGET SUMMARY
REVENUE BY SOURCE
FOOD SERVICE FUND
Prepared by: Jeff Kohlenberg, CPA, RTSBA - Director of Financial Services
21
COMPARISON OF
EXPENDITURES BY
FUNCTION AND MAJOR OBJECT
22

2017 - 2018 2016 - 2017
ORIGINAL ORIGINAL INCREASE
BUDGET BUDGET (DECREASE)
FUNCTION : 11 INSTRUCTION
6100 PAYROLL COSTS 204,855,563$ 197,486,811$ 7,368,752$
6200 CONTRACTED SERVICES 1,450,968 1,489,123 (38,155)
6300 SUPPLIES AND MATERIALS 3,902,513 4,446,912 (544,399)
6400 OTHER COSTS 365,584 353,866 11,718
6600 CAPITAL OUTLAY - - -
TOTAL FOR FUNCTION 210,574,628$ 203,776,712$ 6,797,916$
FUNCTION : 12 INSTRUCTIONAL RESOURCES
6100 PAYROLL COST 3,552,200$ 3,537,000$ 15,200$
6200 CONTRACTED SERVICES 47,576 47,576 -
6300 SUPPLIES AND MATERIALS 601,953 579,787 22,166
6400 OTHER COSTS 9,870 12,170 (2,300)
6600 CAPITAL OUTLAY - - -
TOTAL FOR FUNCTION 4,211,599$ 4,176,533$ 35,066$
FUNCTION: 13 CURRICULUM & STAFF DEVELOPMENT
6100 PAYROLL COST 6,133,481$ 5,667,736$ 465,745$
6200 CONTRACTED SERVICES 141,237 145,717 (4,480)
6300 SUPPLIES AND MATERIALS 168,836 174,520 (5,684)
6400 OTHER COSTS 468,982 431,542 37,440
6600 CAPITAL OUTLAY - - -
TOTAL FOR FUNCTION 6,912,536$ 6,419,515$ 493,021$
FUNCTION: 21 INSTRUCTIONAL ADMINISTRATION
6100 PAYROLL COST 2,893,680$ 2,744,180$ 149,500$
6200 CONTRACTED SERVICES 40,473 40,173 300
6300 SUPPLIES AND MATERIALS 72,469 71,263 1,206
6400 OTHER COSTS 99,527 102,552 (3,025)
6600 CAPITAL OUTLAY - - -
TOTAL FOR FUNCTION 3,106,149$ 2,958,168$ 147,981$
CLEAR CREEK INDEPENDENT SCHOOL DISTRICT
2017 - 2018 BUDGET SUMMARY
BY FUNCTION AND MAJOR OBJECT
GENERAL FUND
Prepared by: Jeff Kohlenberg, CPA, RTSBA - Director of Financial Services
23

2017 - 2018 2016 - 2017
ORIGINAL ORIGINAL INCREASE
BUDGET BUDGET (DECREASE)
CLEAR CREEK INDEPENDENT SCHOOL DISTRICT
2017 - 2018 BUDGET SUMMARY
BY FUNCTION AND MAJOR OBJECT
GENERAL FUND
FUNCTION : 23 SCHOOL ADMINISTRATION
6100 PAYROLL COST 20,713,750$ 19,904,250$ 809,500$
6200 CONTRACTED SERVICES 79,617 77,288 2,329
6300 SUPPLIES AND MATERIALS 156,814 156,210 604
6400 OTHER COSTS 110,035 111,170 (1,135)
6600 CAPITAL OUTLAY - - -
TOTAL FOR FUNCTION 21,060,216$ 20,248,918$ 811,298$
FUNCTION : 31 GUIDANCE & COUNSELING
6100 PAYROLL COST 11,010,645$ 10,582,445$ 428,200$
6200 CONTRACTED SERVICES 174,050 171,850 2,200
6300 SUPPLIES AND MATERIALS 471,311 475,911 (4,600)
6400 OTHER COSTS 50,815 41,236 9,579
6600 CAPITAL OUTLAY - - -
TOTAL FOR FUNCTION 11,706,821$ 11,271,442$ 435,379$
FUNCTION : 32 SOCIAL WORK SERVICES
6100 PAYROLL COST 414,015$ 417,416$ (3,401)$
6200 CONTRACTED SERVICES 260,780 288,780 (28,000)
6300 SUPPLIES AND MATERIALS 7,000 8,000 (1,000)
6400 OTHER COSTS 2,075 1,575 500
6600 CAPITAL OUTLAY - - -
TOTAL FOR FUNCTION 683,870$ 715,771$ (31,901)$
FUNCTION: 33 HEALTH SERVICES
6100 PAYROLL COST 3,336,935$ 3,115,935$ 221,000$
6200 CONTRACTED SERVICES 11,300 11,300 -
6300 SUPPLIES AND MATERIALS 78,809 62,877 15,932
6400 OTHER COSTS 6,635 6,785 (150)
6600 CAPITAL OUTLAY - - -
TOTAL FOR FUNCTION 3,433,679$ 3,196,897$ 236,782$
Prepared by: Jeff Kohlenberg, CPA, RTSBA - Director of Financial Services
24

2017 - 2018 2016 - 2017
ORIGINAL ORIGINAL INCREASE
BUDGET BUDGET (DECREASE)
CLEAR CREEK INDEPENDENT SCHOOL DISTRICT
2017 - 2018 BUDGET SUMMARY
BY FUNCTION AND MAJOR OBJECT
GENERAL FUND
FUNCTION: 34 STUDENT TRANSPORTATION
6100 PAYROLL COST 9,927,000$ 9,223,000$ 704,000$
6200 CONTRACTED SERVICES 366,750 366,750 -
6300 SUPPLIES AND MATERIALS 1,986,626 2,036,626 (50,000)
6400 OTHER COSTS (490,576) (485,576) (5,000)
6600 CAPITAL OUTLAY - - -
TOTAL FOR FUNCTION 11,789,800$ 11,140,800$ 649,000$
FUNCTION: 35 FOOD SERVICES
6100 PAYROLL COST 292,900$ 287,600$ 5,300$
6200 CONTRACTED SERVICES - - -
6300 SUPPLIES AND MATERIALS - - -
6400 OTHER COSTS 10,000 10,000 -
6600 CAPITAL OUTLAY - - -
TOTAL FOR FUNCTION 302,900$ 297,600$ 5,300$
FUNCTION: 36 COCURRICULAR
6100 PAYROLL COST 4,543,496$ 4,496,796$ 46,700$
6200 CONTRACTED SERVICES 803,318 705,443 97,875
6300 SUPPLIES AND MATERIALS 668,810 694,810 (26,000)
6400 OTHER COSTS 1,443,882 1,465,482 (21,600)
6600 CAPITAL OUTLAY - - -
TOTAL FOR FUNCTION 7,459,506$ 7,362,531$ 96,975$
FUNCTION: 41 GENERAL ADMINISTRATION
6100 PAYROLL COST 5,273,030$ 4,979,530$ 293,500$
6200 CONTRACTED SERVICES 1,091,365 1,114,385 (23,020)
6300 SUPPLIES AND MATERIALS 379,940 382,940 (3,000)
6400 OTHER COSTS 436,475 400,445 36,030
6600 CAPITAL OUTLAY - - -
TOTAL FOR FUNCTION 7,180,810$ 6,877,300$ 303,510$
Prepared by: Jeff Kohlenberg, CPA, RTSBA - Director of Financial Services
25

2017 - 2018 2016 - 2017
ORIGINAL ORIGINAL INCREASE
BUDGET BUDGET (DECREASE)
CLEAR CREEK INDEPENDENT SCHOOL DISTRICT
2017 - 2018 BUDGET SUMMARY
BY FUNCTION AND MAJOR OBJECT
GENERAL FUND
FUNCTION: 51 PLANT MAINTENANCE
6100 PAYROLL COST 12,022,145$ 11,955,245$ 66,900$
6200 CONTRACTED SERVICES 12,547,959 12,108,079 439,880
6300 SUPPLIES AND MATERIALS 1,943,233 1,927,008 16,225
6400 OTHER COSTS 3,049,994 3,251,219 (201,225)
6600 CAPITAL OUTLAY 30,539 52,539 (22,000)
TOTAL FOR FUNCTION 29,593,870$ 29,294,090$ 299,780$
FUNCTION: 52 SECURITY AND MONITORING SERVICE
6100 PAYROLL COST 857,500$ 728,300$ 129,200$
6200 CONTRACTED SERVICES 2,757,185 2,644,440 112,745
6300 SUPPLIES AND MATERIALS 164,045 86,500 77,545
6400 OTHER COSTS 10,700 13,700 (3,000)
6600 CAPITAL OUTLAY - - -
TOTAL FOR FUNCTION 3,789,430$ 3,472,940$ 316,490$
FUNCTION: 53 DATA SERVICES
6100 PAYROLL COST 4,845,695$ 4,851,795$ (6,100)$
6200 CONTRACTED SERVICES 1,293,206 1,287,705 5,501
6300 SUPPLIES AND MATERIALS 984,879 1,045,876 (60,997)
6400 OTHER COSTS 30,100 30,100 -
6600 CAPITAL OUTLAY 11,000 11,000 -
TOTAL FOR FUNCTION 7,164,880$ 7,226,476$ (61,596)$
FUNCTION: 61 COMMUNITY SERVICES
6100 PAYROLL COST 25,300$ 65,900$ (40,600)$
6200 CONTRACTED SERVICES - - -
6300 SUPPLIES AND MATERIALS 43,800 42,200 1,600
6400 OTHER COSTS 3,700 1,375 2,325
6600 CAPITAL OUTLAY - - -
TOTAL FOR FUNCTION 72,800$ 109,475$ (36,675)$
Prepared by: Jeff Kohlenberg, CPA, RTSBA - Director of Financial Services
26
2017 - 2018 2016 - 2017
ORIGINAL ORIGINAL INCREASE
BUDGET BUDGET (DECREASE)
CLEAR CREEK INDEPENDENT SCHOOL DISTRICT
2017 - 2018 BUDGET SUMMARY
BY FUNCTION AND MAJOR OBJECT
GENERAL FUND
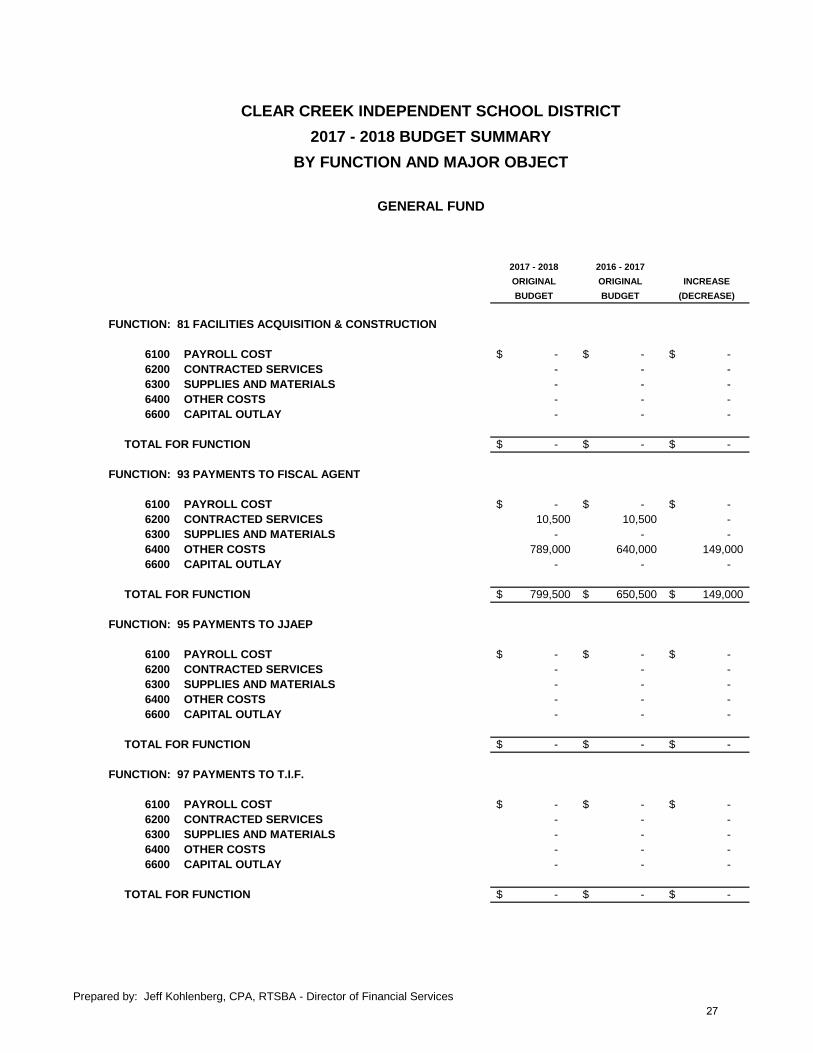
FUNCTION: 81 FACILITIES ACQUISITION & CONSTRUCTION
6100 PAYROLL COST -$ -$ -$
6200 CONTRACTED SERVICES - - -
6300 SUPPLIES AND MATERIALS - - -
6400 OTHER COSTS - - -
6600 CAPITAL OUTLAY - - -
TOTAL FOR FUNCTION -$ -$ -$
FUNCTION: 93 PAYMENTS TO FISCAL AGENT
6100 PAYROLL COST -$ -$ -$
6200 CONTRACTED SERVICES 10,500 10,500 -
6300 SUPPLIES AND MATERIALS - - -
6400 OTHER COSTS 789,000 640,000 149,000
6600 CAPITAL OUTLAY - - -
TOTAL FOR FUNCTION 799,500$ 650,500$ 149,000$
FUNCTION: 95 PAYMENTS TO JJAEP
6100 PAYROLL COST -$ -$ -$
6200 CONTRACTED SERVICES - - -
6300 SUPPLIES AND MATERIALS - - -
6400 OTHER COSTS - - -
6600 CAPITAL OUTLAY - - -
TOTAL FOR FUNCTION -$ -$ -$
FUNCTION: 97 PAYMENTS TO T.I.F.
6100 PAYROLL COST -$ -$ -$
6200 CONTRACTED SERVICES - - -
6300 SUPPLIES AND MATERIALS - - -
6400 OTHER COSTS - - -
6600 CAPITAL OUTLAY - - -
TOTAL FOR FUNCTION -$ -$ -$
Prepared by: Jeff Kohlenberg, CPA, RTSBA - Director of Financial Services
27
2017 - 2018 2016 - 2017
ORIGINAL ORIGINAL INCREASE
BUDGET BUDGET (DECREASE)
CLEAR CREEK INDEPENDENT SCHOOL DISTRICT
2017 - 2018 BUDGET SUMMARY
BY FUNCTION AND MAJOR OBJECT
GENERAL FUND
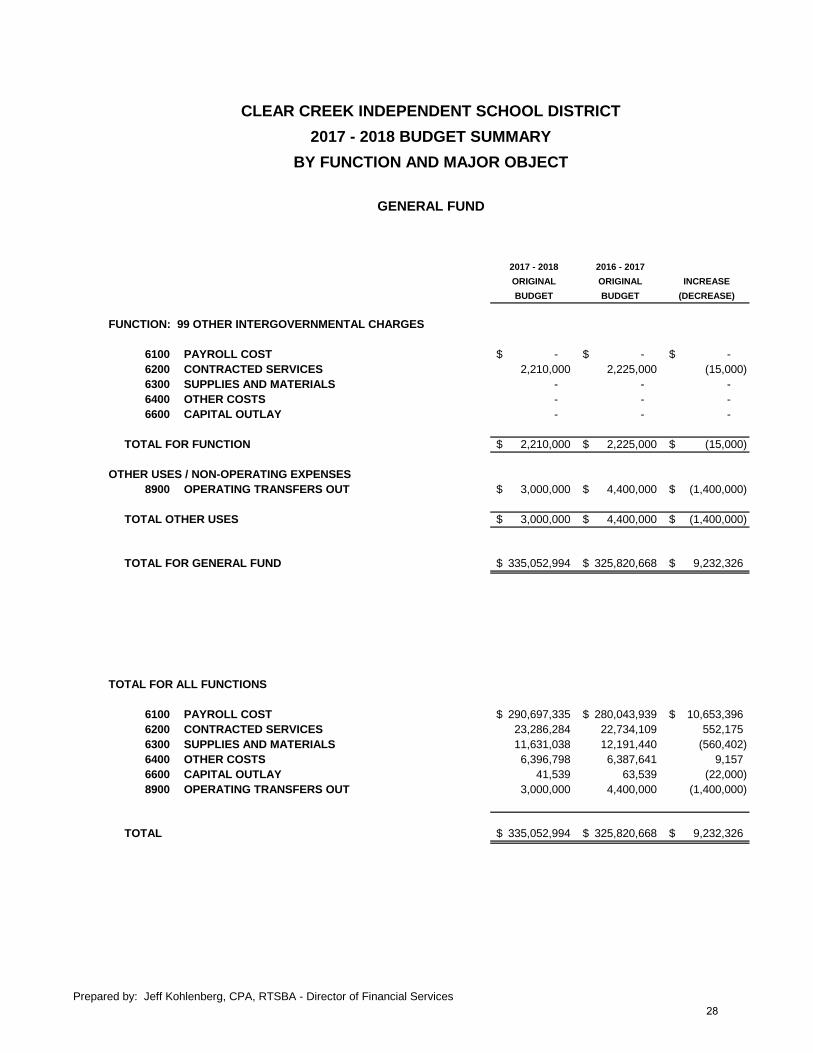
FUNCTION: 99 OTHER INTERGOVERNMENTAL CHARGES
6100 PAYROLL COST -$ -$ -$
6200 CONTRACTED SERVICES 2,210,000 2,225,000 (15,000)
6300 SUPPLIES AND MATERIALS - - -
6400 OTHER COSTS - - -
6600 CAPITAL OUTLAY - - -
TOTAL FOR FUNCTION 2,210,000$ 2,225,000$ (15,000)$
OTHER USES / NON-OPERATING EXPENSES
8900 OPERATING TRANSFERS OUT 3,000,000$ 4,400,000$ (1,400,000)$
TOTAL OTHER USES 3,000,000$ 4,400,000$ (1,400,000)$
TOTAL FOR GENERAL FUND 335,052,994$ 325,820,668$ 9,232,326$
TOTAL FOR ALL FUNCTIONS
6100 PAYROLL COST 290,697,335$ 280,043,939$ 10,653,396$
6200 CONTRACTED SERVICES 23,286,284 22,734,109 552,175
6300 SUPPLIES AND MATERIALS 11,631,038 12,191,440 (560,402)
6400 OTHER COSTS 6,396,798 6,387,641 9,157
6600 CAPITAL OUTLAY 41,539 63,539 (22,000)
8900 OPERATING TRANSFERS OUT 3,000,000 4,400,000 (1,400,000)
TOTAL 335,052,994$ 325,820,668$ 9,232,326$
Prepared by: Jeff Kohlenberg, CPA, RTSBA - Director of Financial Services
28
2017 - 2018 2016 - 2017
ORIGINAL ORIGINAL INCREASE
BUDGET BUDGET (DECREASE)
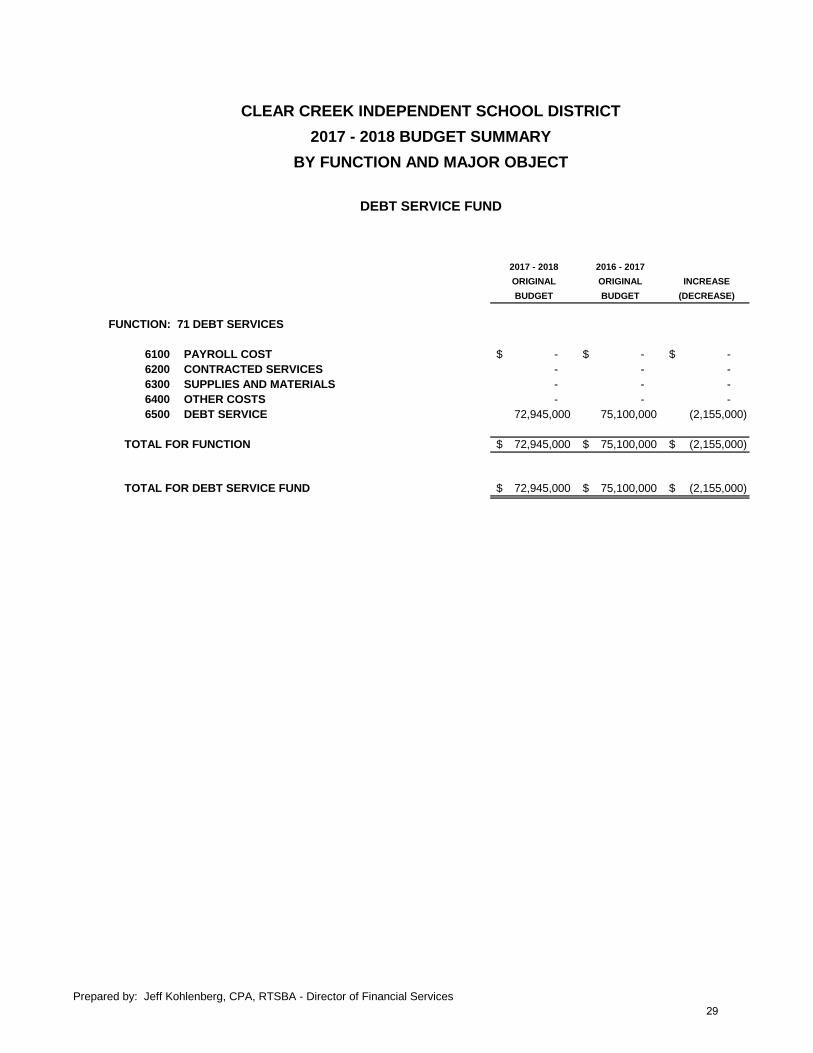
FUNCTION: 71 DEBT SERVICES
6100 PAYROLL COST -$ -$ -$
6200 CONTRACTED SERVICES - - -
6300 SUPPLIES AND MATERIALS - - -
6400 OTHER COSTS - - -
6500 DEBT SERVICE 72,945,000 75,100,000 (2,155,000)
TOTAL FOR FUNCTION 72,945,000$ 75,100,000$ (2,155,000)$
TOTAL FOR DEBT SERVICE FUND 72,945,000$ 75,100,000$ (2,155,000)$
CLEAR CREEK INDEPENDENT SCHOOL DISTRICT
2017 - 2018 BUDGET SUMMARY
BY FUNCTION AND MAJOR OBJECT
DEBT SERVICE FUND
Prepared by: Jeff Kohlenberg, CPA, RTSBA - Director of Financial Services
29
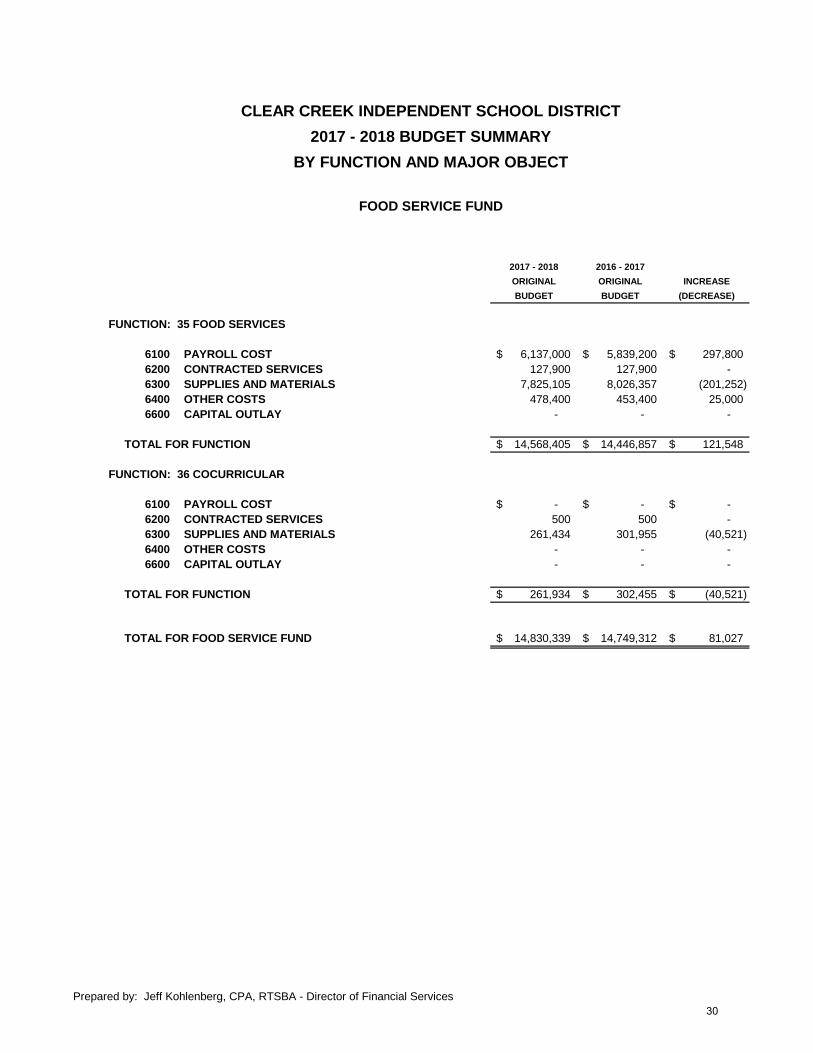
2017 - 2018 2016 - 2017
ORIGINAL ORIGINAL INCREASE
BUDGET BUDGET (DECREASE)
FUNCTION: 35 FOOD SERVICES
6100 PAYROLL COST 6,137,000$ 5,839,200$ 297,800$
6200 CONTRACTED SERVICES 127,900 127,900 -
6300 SUPPLIES AND MATERIALS 7,825,105 8,026,357 (201,252)
6400 OTHER COSTS 478,400 453,400 25,000
6600 CAPITAL OUTLAY - - -
TOTAL FOR FUNCTION 14,568,405$ 14,446,857$ 121,548$
FUNCTION: 36 COCURRICULAR
6100 PAYROLL COST -$ -$ -$
6200 CONTRACTED SERVICES 500 500 -
6300 SUPPLIES AND MATERIALS 261,434 301,955 (40,521)
6400 OTHER COSTS - - -
6600 CAPITAL OUTLAY - - -
TOTAL FOR FUNCTION 261,934$ 302,455$ (40,521)$
TOTAL FOR FOOD SERVICE FUND 14,830,339$ 14,749,312$ 81,027$
CLEAR CREEK INDEPENDENT SCHOOL DISTRICT
2017 - 2018 BUDGET SUMMARY
BY FUNCTION AND MAJOR OBJECT
FOOD SERVICE FUND
Prepared by: Jeff Kohlenberg, CPA, RTSBA - Director of Financial Services
30

COMPARISON OF
EXPENDITURES BY
PROGRAM INTENT CODE
31

2017 - 2018 2016 - 2017
ORIGINAL ORIGINAL INCREASE
BUDGET BUDGET (DECREASE)
PROGRAM: 11 BASIC EDUCATIONAL SERVICES
6100 PAYROLL COSTS 152,796,191$ 147,644,134$ 5,152,057$
6200 CONTRACTED SERVICES 1,129,387 1,156,452 (27,065)
6300 SUPPLIES AND MATERIALS 2,580,308 3,160,768 (580,460)
6400 OTHER COSTS 224,174 203,936 20,238
6600 CAPITAL OUTLAY - - -
TOTAL FOR PROGRAM 156,730,060$ 152,165,290$ 4,564,770$
PROGRAM: 21 GIFTED & TALENTED
6100 PAYROLL COST 3,681,590$ 3,487,090$ 194,500$
6200 CONTRACTED SERVICES 48,800 48,400 400
6300 SUPPLIES AND MATERIALS 50,270 81,170 (30,900)
6400 OTHER COSTS 54,540 24,040 30,500
6600 CAPITAL OUTLAY - - -
TOTAL FOR PROGRAM 3,835,200$ 3,640,700$ 194,500$
PROGRAM: 22 CAREER & TECHNICAL
6100 PAYROLL COST 7,101,100$ 7,214,025$ (112,925)$
6200 CONTRACTED SERVICES 87,400 9,500 77,900
6300 SUPPLIES AND MATERIALS 530,675 550,675 (20,000)
6400 OTHER COSTS 231,850 234,725 (2,875)
6600 CAPITAL OUTLAY - - -
TOTAL FOR PROGRAM 7,951,025$ 8,008,925$ (57,900)$
PROGRAM: 23 SERVICES TO STUDENTS WITH DISABILITIES
6100 PAYROLL COST 37,247,500$ 35,292,800$ 1,954,700$
6200 CONTRACTED SERVICES 386,621 336,321 50,300
6300 SUPPLIES AND MATERIALS 101,750 125,370 (23,620)
6400 OTHER COSTS 892,370 742,840 149,530
6600 CAPITAL OUTLAY - - -
TOTAL FOR PROGRAM 38,628,241$ 36,497,331$ 2,130,910$
CLEAR CREEK INDEPENDENT SCHOOL DISTRICT
2017 - 2018 BUDGET SUMMARY
BY PROGRAM INTENT CODE
GENERAL FUND
Prepared by: Jeff Kohlenberg, CPA, RTSBA - Director of Financial Services
32

2017 - 2018 2016 - 2017
ORIGINAL ORIGINAL INCREASE
BUDGET BUDGET (DECREASE)
CLEAR CREEK INDEPENDENT SCHOOL DISTRICT
2017 - 2018 BUDGET SUMMARY
BY PROGRAM INTENT CODE
GENERAL FUND
PROGRAM: 24 ACCELERATED EDUCATION
6100 PAYROLL COST 5,394,325$ 4,892,425$ 501,900$
6200 CONTRACTED SERVICES 263,880 264,080 (200)
6300 SUPPLIES AND MATERIALS 159,650 159,850 (200)
6400 OTHER COSTS 43,750 48,900 (5,150)
6600 CAPITAL OUTLAY - - -
TOTAL FOR PROGRAM 5,861,605$ 5,365,255$ 496,350$
PROGRAM: 25 BILINGUAL EDUCATION & SPECIAL LANGUAGE PROGRAMS
6100 PAYROLL COST 1,276,760$ 1,176,941$ 99,819$
6200 CONTRACTED SERVICES 19,575 22,575 (3,000)
6300 SUPPLIES AND MATERIALS 91,420 112,839 (21,419)
6400 OTHER COSTS 20,930 34,830 (13,900)
6600 CAPITAL OUTLAY - - -
TOTAL FOR PROGRAM 1,408,685$ 1,347,185$ 61,500$
PROGRAM: 28 DISCIPLINARY ALTERNATIVE EDUCATION PROGRAM
6100 PAYROLL COST 1,589,400$ 1,490,800$ 98,600$
6200 CONTRACTED SERVICES 6,800 7,100 (300)
6300 SUPPLIES AND MATERIALS 25,950 26,800 (850)
6400 OTHER COSTS 20,250 19,350 900
6600 CAPITAL OUTLAY - - -
TOTAL FOR PROGRAM 1,642,400$ 1,544,050$ 98,350$
PROGRAM 31: HIGH SCHOOL ALLOTMENT
6100 PAYROLL COST 3,215,095$ 3,082,995$ 132,100$
6200 CONTRACTED SERVICES 246,050 287,290 (41,240)
6300 SUPPLIES AND MATERIALS 190,265 148,065 42,200
6400 OTHER COSTS 9,925 8,625 1,300
6600 CAPITAL OUTLAY - - -
TOTAL FOR PROGRAM 3,661,335$ 3,526,975$ 134,360$
Prepared by: Jeff Kohlenberg, CPA, RTSBA - Director of Financial Services
33

2017 - 2018 2016 - 2017
ORIGINAL ORIGINAL INCREASE
BUDGET BUDGET (DECREASE)
CLEAR CREEK INDEPENDENT SCHOOL DISTRICT
2017 - 2018 BUDGET SUMMARY
BY PROGRAM INTENT CODE
GENERAL FUND
PROGRAM 32: PREKINDERGARTEN
6100 PAYROLL COST 3,184,500$ 3,252,200$ (67,700)$
6200 CONTRACTED SERVICES - - -
6300 SUPPLIES AND MATERIALS - - -
6400 OTHER COSTS - - -
6600 CAPITAL OUTLAY - - -
TOTAL FOR PROGRAM 3,184,500$ 3,252,200$ (67,700)$
PROGRAM: 91 ATHLETICS AND RELATED ACTIVITIES
6100 PAYROLL COST 3,209,892$ 3,213,292$ (3,400)$
6200 CONTRACTED SERVICES 831,280 808,805 22,475
6300 SUPPLIES AND MATERIALS 554,285 556,285 (2,000)
6400 OTHER COSTS 631,167 662,967 (31,800)
6600 CAPITAL OUTLAY - - -
TOTAL FOR PROGRAM 5,226,624$ 5,241,349$ (14,725)$
PROGRAM: 99 UNDISTRIBUTED
6100 PAYROLL COST 72,000,982$ 69,297,237$ 2,703,745$
6200 CONTRACTED SERVICES 20,266,491 19,793,586 472,905
6300 SUPPLIES AND MATERIALS 7,316,465 7,269,618 46,847
6400 OTHER COSTS 4,297,842 4,407,428 (109,586)
6600 CAPITAL OUTLAY 41,539 63,539 (22,000)
TOTAL FOR PROGRAM 103,923,319$ 100,831,408$ 3,091,911$
OTHER USES / NON-OPERATING EXPENSES
8900 OPERATING TRANSFERS OUT 3,000,000$ 4,400,000$ (1,400,000)$
TOTAL OTHER USES 3,000,000$ 4,400,000$ (1,400,000)$
TOTAL FOR GENERAL FUND 335,052,994$ 325,820,668$ 9,232,326$
Prepared by: Jeff Kohlenberg, CPA, RTSBA - Director of Financial Services
34

2017 - 2018 2016 - 2017
ORIGINAL ORIGINAL INCREASE
BUDGET BUDGET (DECREASE)
CLEAR CREEK INDEPENDENT SCHOOL DISTRICT
2017 - 2018 BUDGET SUMMARY
BY PROGRAM INTENT CODE
GENERAL FUND
TOTAL FOR ALL PROGRAMS
6100 PAYROLL COST 290,697,335$ 280,043,939$ 10,653,396$
6200 CONTRACTED SERVICES 23,286,284 22,734,109 552,175
6300 SUPPLIES AND MATERIALS 11,601,038 12,191,440 (590,402)
6400 OTHER COSTS 6,426,798 6,387,641 39,157
6600 CAPITAL OUTLAY 41,539 63,539 (22,000)
8900 OPERATING TRANSFERS OUT 3,000,000 4,400,000 (1,400,000)
TOTAL 335,052,994$ 325,820,668$ 9,232,326$
Prepared by: Jeff Kohlenberg, CPA, RTSBA - Director of Financial Services
35