Embed Size (px)
Citation preview

MATH NATION Algebra 1 2017-2018 Scope and Sequence
MathNation.com
1
TABLE OF CONTENTS
SECTION 1: EXPRESSIONS .................................................................................................................................................................................................................................... 2 SECTION 2: EQUATIONS AND INEQUALITIES ................................................................................................................................................................................................. 4 SECTION 3: INTRODUCTION TO FUNCTIONS ................................................................................................................................................................................................. 7 SECTION 4: LINEAR EQUATIONS, FUNCTIONS, AND INEQUALITIES .................................................................................................................................................... 10 SECTION 5: QUADRATIC EQUATIONS AND FUNCTIONS – PART 1 ....................................................................................................................................................... 16 SECTION 6: QUADRATIC EQUATIONS AND FUNCTIONS – PART 2 ....................................................................................................................................................... 20 SECTION 7: EXPONENTIAL FUNCTIONS ........................................................................................................................................................................................................ 24 SECTION 8: SUMMARY OF FUNCTIONS ......................................................................................................................................................................................................... 28 SECTION 9: ONE-‐‑VARIABLE STATISTICS ...................................................................................................................................................................................................... 34 SECTION 10: TWO-‐‑VARIABLE STATISTICS .................................................................................................................................................................................................. 36

MATH NATION Algebra 1 2017-2018 Scope and Sequence
MathNation.com
2
Section 1: Expressions
Topic Title Standards Objective
1 Using Expressions to Represent Real-World Situations
MAFS.912.A-APR.1.1 Understand that polynomials form a system analogous to the integers, namely, they are closed under the operations of addition, subtraction, and multiplication; add, subtract, and multiply polynomials. MAFS.912.A-SSE.1.1 Interpret expressions that represent a quantity in terms of its context. Interpret parts of an expression, such as terms, factors, and coefficients.
This topic focuses on writing, interpreting, and evaluating
algebraic expressions in a real-world context.
2 Understanding Polynomial Expressions
MAFS.912.A-SSE.1.1 Interpret expressions that represent a quantity in terms of its context. Interpret parts of an expression, such as terms, factors, and coefficients.
This topic focuses on classifying polynomials by their term and
degree. Students will also learn how to identify the leading term and
coefficient of a polynomial.
3 Algebraic Expressions Using the Distributive Property
MAFS.912.A-SSE.1.2 Use the structure of an expression to identify ways to rewrite it.
This topic focuses on rewriting expressions using the distributive
property.
4 Algebraic Expressions Using the Commutative and Associative
Properties
MAFS.912.A-SSE.1.2 Use the structure of an expression to identify ways to rewrite it.
This topic focuses on using the commutative and associative properties to write equivalent expressions. Students will also
determine which properties have been used when writing equivalent
expressions.
5 Properties of Exponents MAFS.912.A-SSE.1.2 Use the structure of an expression to identify ways to rewrite it.
This topic reviews the properties of exponents. Students will apply the properties to rewrite expressions.
6 Radical Expressions and Expressions with Rational Exponents
MAFS.912.N-RN.1.1 Explain how the definition of the meaning of rational exponents follows from extending the properties of integer exponents to those values, allowing for a notation for radicals in terms of rational exponents. MAFS.912.N-RN.1.2 Rewrite expressions involving radicals and rational exponents using the properties of exponents.
This topic focuses on the meaning of rational exponents. Students will
rewrite expressions with radicals and rational exponents.

MATH NATION Algebra 1 2017-2018 Scope and Sequence
MathNation.com
3
7 Adding Expressions with Radicals and Rational Exponents
MAFS.912.N-RN.1.2 Rewrite expressions involving radicals and rational exponents using the properties of exponents.
This topic focuses on using the definition of rational exponents and
properties of exponents to add expressions with radicals and
rational exponents.
8 More Operations with Radicals and Rational Exponents
MAFS.912.N-RN.1.2 Rewrite expressions involving radicals and rational exponents using the properties of exponents.
This topic focuses on using the definition of rational exponents and
properties of exponents to find products and quotients of
expressions with radicals and rational exponents.
9 Operations with Rational and Irrational Numbers
MAFS.912.N-RN.2.3 Explain why the sum or product of two rational numbers is rational; that the sum of a rational number and an irrational number is irrational; and that the product of a nonzero rational number and an irrational number is irrational.
This topic focuses on performing and analyzing various operations
and proofs with rational and irrational numbers, and making
generalizations on the relationships between rational and irrational
numbers.

MATH NATION Algebra 1 2017-2018 Scope and Sequence
MathNation.com
4
Section 2: Equations and Inequalities
Topic Title Standards Objective
1 Equations: True or False? MAFS.912.A-REI.2.3 Solve linear equations and inequalities in one variable, including equations with coefficients represented by letters.
This topic focuses on truth values of number sentences and
algebraic equations. Students will find the value of a variable that
makes an equation a true statement.
2 Identifying Properties When Solving Equations
MAFS.912.A-REI.1.1 Explain each step in solving a simple equation as following from the equality of numbers asserted at the previous step, starting from the assumption that they original equation has a solution. Construct a viable argument to justify a solution method. MAFS.912.A-SSE.1.2 Use the structure of an expression to identify ways to rewrite it. MAFS.912.A-REI.2.3 Solve linear equations and inequalities in one variable, including equations with coefficients represented by letters.
This topic introduces the addition and multiplication properties of equality. Students will use those
along with associative, commutative, and distributive properties to justify the steps to
solving an equation in one variable.
3 Solving Equations
MAFS.912.A-REI.2.3 Solve linear equations and inequalities in one variable, including equations with coefficients represented by letters. MAFS.912.A-CED.1.1 Create equations and inequalities in one variable and use them to solve problems. Include equations arising from linear and quadratic functions, and simple rational and exponential functions. MAFS.912.A-REI.1.1 Explain each step in solving a simple equation as following from the equality of numbers asserted at the previous step, starting from the assumption that they original equation has a solution. Construct a viable argument to justify a solution method.
This topic continues to build on justifications for solving equations. Additionally, students will create
and solve equations that represent real-world situations.

MATH NATION Algebra 1 2017-2018 Scope and Sequence
MathNation.com
5
4 Solving Equations Using the Zero Product Property MAFS.912.A-REI.2.4. Solve quadratic equations in one variable.
This topic introduces the zero product property and how it is
used to solve equations.
5 Solving Inequalities – Part 1
MAFS.912.A-REI.2.3 Solve linear equations and inequalities in one variable, including equations with coefficients represented by letters. MAFS.912.A-CED.1.1 Create equations and inequalities in one variable and use them to solve problems. Include equations arising from linear and quadratic functions, and simple rational and exponential functions.
This topic reviews graphing inequalities and introduces the
addition and subtraction properties of inequalities.
6 Solving Inequalities – Part 2
MAFS.912.A-REI.2.3 Solve linear equations and inequalities in one variable, including equations with coefficients represented by letters. MAFS.912.A-CED.1.1 Create equations and inequalities in one variable and use them to solve problems. Include equations arising from linear and quadratic functions, and simple rational and exponential functions.
This topic introduces the multiplication property of
inequality. Students will use all the new properties to solve
inequalities.
7 Solving Compound Inequalities MAFS.912.A-REI.2.3 Solve linear equations and inequalities in one variable, including equations with coefficients represented by letters.
This topic focuses on solving compound inequalities and
learning about the differences between "and" and "or" compound inequalities.
8 Rearranging Formulas
MAFS.912.A-CED.1.2 Create equations in two or more variables to represent relationships between quantities; graph equations on coordinate axes with labels and scales. MAFS.912.A-CED.1.4 Rearrange formulas to highlight a quantity of interest, using the same reasoning as in solving equations. MAFS.912.A-REI.2.3 Solve linear equations and inequalities in one variable, including equations with coefficients represented by letters.
This topic focuses on solving equations for a specified variable.

MATH NATION Algebra 1 2017-2018 Scope and Sequence
MathNation.com
6
9 Solution Sets to Equations with Two Variables
MAFS.912.A-CED.1.2 Create equations in two or more variables to represent relationships between quantities; graph equations on coordinate axes with labels and scales. MAFS.912.A-REI.4.10 Understand that the graph of an equation in two variables is the set of all its solutions plotted in the coordinate plane, often forming a curve (which could be a line).
This topic introduces equations in two variables. Students will
represent the solutions on a graph and determine if the functions are
discrete or continuous.

MATH NATION Algebra 1 2017-2018 Scope and Sequence
MathNation.com
7
Section 3: Introduction to Functions
Topic Title Standards Objective
1 Input and Output Values
MAFS.912.F-IF.1.1Understand that a function from one set (called the domain) to another set (called the range) assigns to each element of the domain exactly one element of the range. If is a function and is an element of its domain, then denotes the output of corresponding to the input. The graph of is the graph of the equation. MAFS.912.F-IF.1.2 Use function notation, evaluate functions for inputs in their domains, and interpret statements that use function notation in terms of a context.
This topic introduces the concepts of domain and range, relating
them to independent and dependent variables. Students
learn to represent real-world situations in function notation and
solve these situations.
2 Representing, Naming, and Evaluating Functions
MAFS.912.F-IF.1.1Understand that a function from one set (called the domain) to another set (called the range) assigns to each element of the domain exactly one element of the range. If is a function and is an element of its domain, then denotes the output of corresponding to the input. The graph of is the graph of the equation. MAFS.912.F-IF.1.2 Use function notation, evaluate functions for inputs in their domains, and interpret statements that use function notation in terms of a context. MAFS.912.F-IF.2.5 Relate the domain of a function to its graph and, where applicable, to the quantitative relationship it describes.
This topic focuses on finding domain and range for given
functions and evaluating functions for specific values of the domain.
Students also write and solve functions to represent real-world
situations.

MATH NATION Algebra 1 2017-2018 Scope and Sequence
MathNation.com
8
3 Adding and Subtracting Functions
MAFS.912.A-SSE.1.1Interpret expressions that represent a quantity in terms of its context. Interpret parts of an expression, such as terms, factors, and coefficients. MAFS.912.A-SSE.1.2 Use the structure of an expression to identify ways to rewrite it. MAFS.912.A-APR.1.1Understand that polynomials form a system analogous to the integers, namely, they are closed under the operations of addition, subtraction, and multiplication; add, subtract, and multiply polynomials.
This topic focuses on adding and subtracting polynomials written in
function notation.
4 Multiplying Functions
MAFS.912.A-SSE.1.1Interpret expressions that represent a quantity in terms of its context. Interpret parts of an expression, such as terms, factors, and coefficients. MAFS.912.A-SSE.1.2 Use the structure of an expression to identify ways to rewrite it. MAFS.912.A-APR.1.1Understand that polynomials form a system analogous to the integers, namely, they are closed under the operations of addition, subtraction, and multiplication; add, subtract, and multiply polynomials.
This topic focuses on multiplying polynomial expressions using both
modeling techniques and the distributive property. The
polynomials are written in function notation.
5 Closure Property
MAFS.912.A-APR.1.1Understand that polynomials form a system analogous to the integers, namely, they are closed under the operations of addition, subtraction, and multiplication; add, subtract, and multiply polynomials.
Students explore the closure property with polynomials and
discover polynomials are closed under the same operations as
integers.
6 Real-World Combinations and Compositions of Functions
MAFS.912.F-BF.1.1.b.c.Write a function that describes a relationship between two quantities. b. Combine standard function types using arithmetic operations. For example, build a function that models the temperature of a cooling body by adding a constant function to a decaying exponential, and relate these functions to the model. c. Compose functions. For example, if is the temperature in the atmosphere as a function of height, and is the height of a weather balloon as a function of time, then is the temperature at the location of the weather balloon as a function of time.
This topic focuses applying student knowledge of function operations to real-world situations. Students
are also introduced to compositions of functions.

MATH NATION Algebra 1 2017-2018 Scope and Sequence
MathNation.com
9
7 Key Features of Graphs of Functions – Part 1
MAFS.912.F-IF.2.4 For a function that models a relationship between two quantities, interpret key features of graphs and tables in terms of the quantities, and sketch graphs showing key features given a verbal description of the relationship. Key features include: intercepts; intervals where the function is increasing, decreasing, positive, or negative; relative maximums and minimums; symmetries; end behavior; and periodicity.
This topic introduces the graphs of functions. Students also explore
solutions andintercepts of functions, when functions are
increasing and decreasing, and relative maximums and minimums.
8 Key Features of Graphs of Functions – Part 2
MAFS.912.F-IF.2.4 For a function that models a relationship between two quantities, interpret key features of graphs and tables in terms of the quantities, and sketch graphs showing key features given a verbal description of the relationship. Key features include: intercepts; intervals where the function is increasing, decreasing, positive, or negative; relative maximums and minimums; symmetries; end behavior; and periodicity.
This topic introduces the graphs of functions. Students explore solutions andintercepts of
functions, when functions are increasing and decreasing, and
relative maximums and minimums.
9 Average Rate of Change Over An Interval
MAFS.912.F-IF.2.6 Calculate and interpret the average rate of change of a function (presented symbolically or as a table) over a specified interval. Estimate the rate of change from a graph.
This topic introduces the concept of determining the rate of change
over a specified interval.
10 Transformations of Functions
MAFS.912.F-BF.2.3 Identify the effect on the graph of replacing by,, and for specific values of (both positive and negative); find the value of given the graphs. Experiment with cases and illustrate an explanation of the effects on the graph using technology. Include recognizing even and odd functions from their graphs and algebraic expressions for them.
This topic focuses on the horizontal and vertical transformations of any
function.

MATH NATION Algebra 1 2017-2018 Scope and Sequence
MathNation.com
10
Section 4: Linear Equations, Functions, and Inequalities
Topic Title Standards Objective
1 Arithmetic Sequences
MAFS.912.F-IF.1.3 Recognize that sequences are functions, sometimes defined recursively, whose domain is a subset of the integers. MAFS.912.F-LE.1.2 Construct linear and exponential functions, including arithmetic and geometric sequences, given a graph, a description of a relationship, or two input/output pairs (including reading these from a table). MAFS.912.F-BF.1.1a Write a function that describes a relationship between two quantities. a. Determine an explicit expression, a recursive process, or steps for calculation from a context.
This topic focuses on arithmetic sequences. Students discover how
to write recursive and explicit formulas when given a table of
values. Students are also asked to find terms using the formulas they create. Students will also discover
the connections between arithmetic sequences and linear
functions.
2 Rate of Change of Linear Functions
MAFS.912.A-CED.1.3 Represent constraints by equations or inequalities and by systems of equations and/or inequalities, and interpret solutions as viable or nonviable options in a modeling context. MAFS.912.A-REI.4.10 Understand that the graph of an equation in two variables is the set of all its solutions plotted in the coordinate plane, often forming a curve (which could be a line). MAFS.912.S-ID.3.7 Interpret the slope (rate of change) and the intercept (constant term) of a linear model in the context of the data. MAFS.912.F-LE.2.5 Interpret the parameters in a linear or exponential function in terms of a context. MAFS.912.F-IF.3.7.a Graph functions expressed symbolically and show key features of the graph, by hand in simple cases and using technology in more complicated cases. a. Graph linear and quadratic functions and show intercepts, maxima, and minima.
This topic reviews the concept of slope. Students will graph a series of real-world situations and then
analyze the rate of change.
MATH NATION Algebra 1 2017-2018 Scope and Sequence
MathNation.com
11
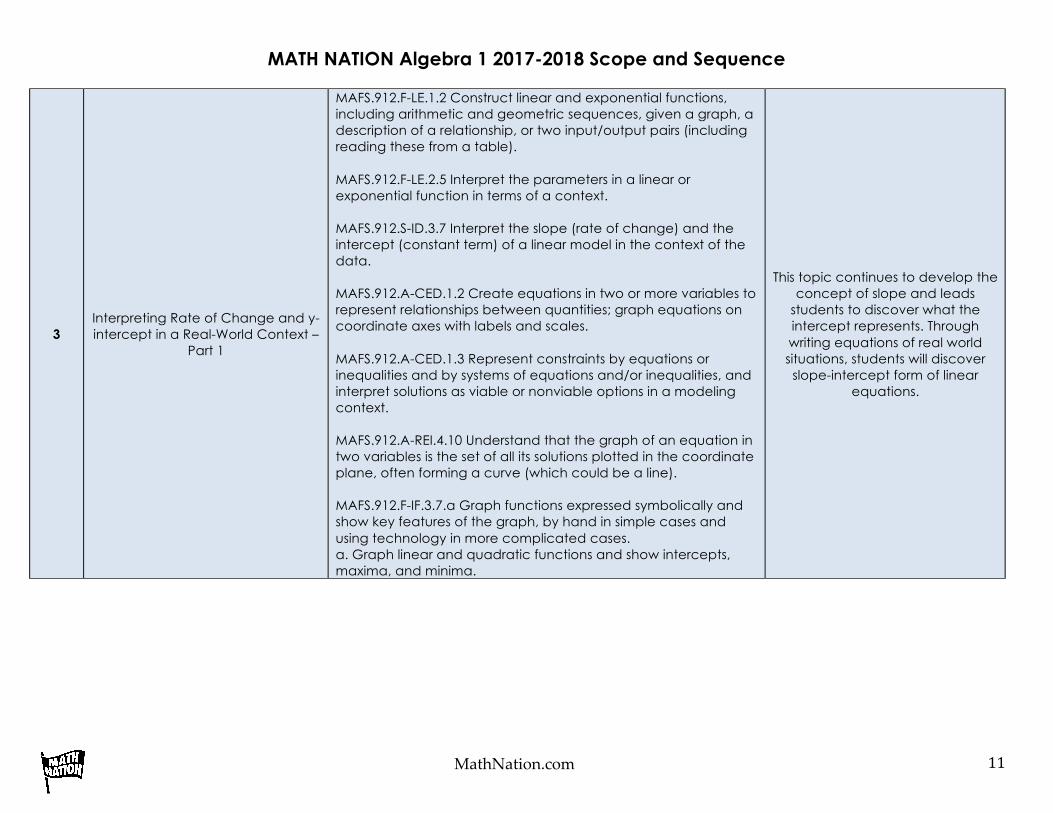
3 Interpreting Rate of Change and y-intercept in a Real-World Context –
Part 1
MAFS.912.F-LE.1.2 Construct linear and exponential functions, including arithmetic and geometric sequences, given a graph, a description of a relationship, or two input/output pairs (including reading these from a table). MAFS.912.F-LE.2.5 Interpret the parameters in a linear or exponential function in terms of a context. MAFS.912.S-ID.3.7 Interpret the slope (rate of change) and the intercept (constant term) of a linear model in the context of the data. MAFS.912.A-CED.1.2 Create equations in two or more variables to represent relationships between quantities; graph equations on coordinate axes with labels and scales. MAFS.912.A-CED.1.3 Represent constraints by equations or inequalities and by systems of equations and/or inequalities, and interpret solutions as viable or nonviable options in a modeling context. MAFS.912.A-REI.4.10 Understand that the graph of an equation in two variables is the set of all its solutions plotted in the coordinate plane, often forming a curve (which could be a line). MAFS.912.F-IF.3.7.a Graph functions expressed symbolically and show key features of the graph, by hand in simple cases and using technology in more complicated cases. a. Graph linear and quadratic functions and show intercepts, maxima, and minima.
This topic continues to develop the concept of slope and leads
students to discover what the intercept represents. Through writing equations of real world situations, students will discover slope-intercept form of linear
equations.

MATH NATION Algebra 1 2017-2018 Scope and Sequence
MathNation.com
12
4 Interpreting Rate of Change and y-intercept in a Real-World Context –
Part 2
a. MAFS.912.S-ID.3.7 Interpret the slope (rate of change) and the intercept (constant term) of a linear model in the context of the data. MAFS.912.A-CED.1.2 Create equations in two or more variables to represent relationships between quantities; graph equations on coordinate axes with labels and scales. MAFS.912.A-CED.1.3 Represent constraints by equations or inequalities and by systems of equations and/or inequalities, and interpret solutions as viable or nonviable options in a modeling context. MAFS.912.A-REI.4.10 Understand that the graph of an equation in two variables is the set of all its solutions plotted in the coordinate plane, often forming a curve (which could be a line). MAFS.912.F-IF.3.7.a Graph functions expressed symbolically and show key features of the graph, by hand in simple cases and using technology in more complicated cases. a. Graph linear and quadratic functions and show intercepts, maxima, and minima.
This topic continues to develop the concept of slope and leads
students to discover what theintercept represents. Through
writing equations of real world situations, students will discover slope-intercept form of linear
equations.
5 Introduction to Systems of Equations
a. MAFS.912.A-REI.4.10Understand that the graph of an equation in two variables is the set of all its solutions plotted in the coordinate plane, often forming a curve (which could be a line). MAFS.912.A-REI.3.6Solve systems of linear equations exactly and approximately (e.g., with graphs), focusing on pairs of linear equations in two variables. MAFS.912.F-IF.3.7.a Graph functions expressed symbolically and show key features of the graph, by hand in simple cases and using technology in more complicated cases. a. Graph linear and quadratic functions and show intercepts, maxima, and minima.
The topic introduces systems of linear equations. Students will discover that the solution to a
system is the point of intersection of the two lines.

MATH NATION Algebra 1 2017-2018 Scope and Sequence
MathNation.com
13
6 Finding Solution Sets to Systems of Equations Using Substitution and
Graphing
a. MAFS.912.A-CED.1.3 Represent constraints by equations or inequalities and by systems of equations and/or inequalities, and interpret solutions as viable or nonviable options in a modeling context. MAFS.912.A-REI.4.10 Understand that the graph of an equation in two variables is the set of all its solutions plotted in the coordinate plane, often forming a curve (which could be a line). MAFS.912.A-REI.4.11Explain why the-coordinates of the points where the graphs of the equations and intersect are the solutions of the equation; find the solutions approximately (e.g., using technology to graph the functions, make tables of values, or find successive approximations). Include cases where and/or are linear, polynomial, rational, absolute value, exponential, and logarithmic functions. MAFS.912.A-REI.3.6 Solve systems of linear equations exactly and approximately (e.g., with graphs), focusing on pairs of linear equations in two variables. MAFS.912.F-LE.2.5 Interpret the parameters in a linear or exponential function in terms of a context. MAFS.912.F-IF.3.7.a Graph functions expressed symbolically and show key features of the graph, by hand in simple cases and using technology in more complicated cases. a. Graph linear and quadratic functions and show intercepts, maxima, and minima.
This topic focuses on systems of linear equations. Students write
and solve systems of linear equations that represent real-world situations. They will also discover that given a system
containing and, the solution is that value of for which.
MATH NATION Algebra 1 2017-2018 Scope and Sequence
MathNation.com
14
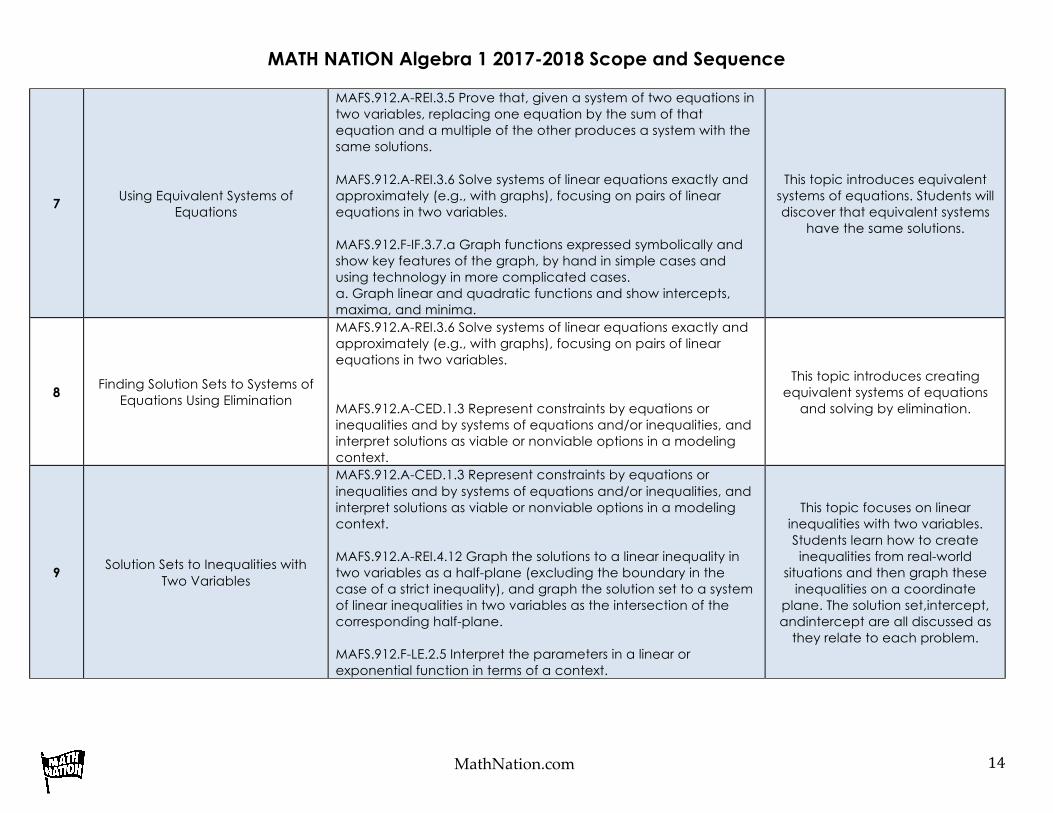
7 Using Equivalent Systems of Equations
MAFS.912.A-REI.3.5 Prove that, given a system of two equations in two variables, replacing one equation by the sum of that equation and a multiple of the other produces a system with the same solutions. MAFS.912.A-REI.3.6 Solve systems of linear equations exactly and approximately (e.g., with graphs), focusing on pairs of linear equations in two variables. MAFS.912.F-IF.3.7.a Graph functions expressed symbolically and show key features of the graph, by hand in simple cases and using technology in more complicated cases. a. Graph linear and quadratic functions and show intercepts, maxima, and minima.
This topic introduces equivalent systems of equations. Students will discover that equivalent systems
have the same solutions.
8 Finding Solution Sets to Systems of Equations Using Elimination
MAFS.912.A-REI.3.6 Solve systems of linear equations exactly and approximately (e.g., with graphs), focusing on pairs of linear equations in two variables. MAFS.912.A-CED.1.3 Represent constraints by equations or inequalities and by systems of equations and/or inequalities, and interpret solutions as viable or nonviable options in a modeling context.
This topic introduces creating equivalent systems of equations
and solving by elimination.
9 Solution Sets to Inequalities with Two Variables
MAFS.912.A-CED.1.3 Represent constraints by equations or inequalities and by systems of equations and/or inequalities, and interpret solutions as viable or nonviable options in a modeling context. MAFS.912.A-REI.4.12 Graph the solutions to a linear inequality in two variables as a half-plane (excluding the boundary in the case of a strict inequality), and graph the solution set to a system of linear inequalities in two variables as the intersection of the corresponding half-plane. MAFS.912.F-LE.2.5 Interpret the parameters in a linear or exponential function in terms of a context.
This topic focuses on linear inequalities with two variables. Students learn how to create inequalities from real-world
situations and then graph these inequalities on a coordinate
plane. The solution set,intercept, andintercept are all discussed as
they relate to each problem.

MATH NATION Algebra 1 2017-2018 Scope and Sequence
MathNation.com
15
10 Finding Solution Sets to Systems of Linear Inequalities
MAFS.912.A-CED.1.3 Represent constraints by equations or inequalities and by systems of equations and/or inequalities, and interpret solutions as viable or nonviable options in a modeling context. MAFS.912.A-REI.4.12 Graph the solutions to a linear inequality in two variables as a half-plane (excluding the boundary in the case of a strict inequality), and graph the solution set to a system of linear inequalities in two variables as the intersection of the corresponding half-plane.
This topic focuses on finding solution sets to systems of linear
inequalities. Students will learn how to write a system of linear
inequalities, graph the system and then find various solution sets.

MATH NATION Algebra 1 2017-2018 Scope and Sequence
MathNation.com
16
Section 5: Quadratic Equations and Functions – Part 1
Topic Title Standards Objective
1 Real-World Examples of Quadratic Functions
MAFS.912.F-IF.2.4 For a function that models a relationship between two quantities, interpret key features of graphs and tables in terms of the quantities, and sketch graphs showing key features given a verbal description of the relationship. Key features include: intercepts; intervals where the function is increasing, decreasing, positive, or negative; relative maximums and minimums; symmetries; end behavior; and periodicity.
This topic focuses on real-world examples of quadratics. Students
are first introduced to the concept of a quadratic function by
analyzing a real-world situation where the rate of change is not
constant. Students are also introduced to some of the key
features of quadratics.
2 Factoring Quadratic Expressions
MAFS.912.A-SSE.2.3.a Choose and produce an equivalent expression to reveal and explain properties of the quantity represented by the expression. a. Factor a quadratic expression to reveal the zeros of the function it defines. MAFS.912.A-SSE.1.2 Use the structure of an expression to identify ways to rewrite it.
This topic focuses on factoring quadratics. Students are introduced
to two methods of factoring: 1. Using the Area Model; 2. Factoring
by Grouping and Using the Distributive Property.
3 Solving Quadratic Equations by Factoring
MAFS.912.A-SSE.2.3.a Choose and produce an equivalent expression to reveal and explain properties of the quantity represented by the expression. a. Factor a quadratic expression to reveal the zeros of the function it defines. MAFS.912.A-REI.2.4.b Solve quadratic equations in one variable. b. Solve quadratic equations by inspection, taking square roots, completing the square, the quadratic formula, and factoring, as appropriate to the initial form of the equation. Recognize when the quadratic formula gives complex solutions.
This topic introduces solving quadratic equations. Students will
find the factors of a quadratic equation and use the zero product property to determine the solutions.

MATH NATION Algebra 1 2017-2018 Scope and Sequence
MathNation.com
17
4 Solving Other Quadratic Equations by Factoring
MAFS.912.A-SSE.2.3.aChoose and produce an equivalent expression to reveal and explain properties of the quantity represented by the expression. a. Factor a quadratic expression to reveal the zeros of the function it defines. MAFS.912.A-REI.2.4.b Solve quadratic equations in one variable. b. Solve quadratic equations by inspection, taking square roots, completing the square, the quadratic formula, and factoring, as appropriate to the initial form of the equation. Recognize when the quadratic formula gives complex solutions.
This topic focuses on factoring and solving quadratic equations not in standard form and quadratics with coefficient of the quadratic term
not equal to one.
5 Solving Quadratic Equations by Factoring – Special Cases
MAFS.912.A-SSE.2.3.a Choose and produce an equivalent expression to reveal and explain properties of the quantity represented by the expression. a. Factor a quadratic expression to reveal the zeros of the function it defines. MAFS.912.A-REI.2.4.b Solve quadratic equations in one variable. b. Solve quadratic equations by inspection, taking square roots, completing the square, the quadratic formula, and factoring, as appropriate to the initial form of the equation. Recognize when the quadratic formula gives complex solutions. MAFS.912.A-SSE.1.2 Use the structure of an expression to identify ways to rewrite it.
This topic focuses on factoring and solving the special cases of quadratics: perfect square
trinomials and difference of squares.
6 Solving Quadratic Equations by Taking Square Roots
MAFS.912.A-CED.1.1 Create equations and inequalities in one variable and use them to solve problems. Include equations arising from linear and quadratic functions, and simple rational and exponential functions. MAFS.912.A-REI.2.4.bSolve quadratic equations in one variable. b. Solve quadratic equations by inspection, taking square roots, completing the square, the quadratic formula, and factoring, as appropriate to the initial form of the equation. Recognize when the quadratic formula gives complex solutions. MAFS.912.A-SSE.1.2 Use the structure of an expression to identify ways to rewrite it.
This topic focuses on solving quadratics equations in the form by
taking the square root.

MATH NATION Algebra 1 2017-2018 Scope and Sequence
MathNation.com
18
7 Solving Quadratic Equations by Completing the Square
MAFS.912.A-REI.2.4.a.bSolve quadratic equations in one variable. a. Use the method of completing the square to transform any quadratic equation in into an equation of the form that has the same solutions. Derive the quadratic formula from this form. b. Solve quadratic equations by inspection, taking square roots, completing the square, the quadratic formula, and factoring, as appropriate to the initial form of the equation. Recognize when the quadratic formula gives complex solutions.
This topic introduces students to the process of the completing the
square of a quadratic equation and using this equivalent form to solve
the equation.
8 Deriving the Quadratic Formula
MAFS.912.A-REI.2.4.aSolve quadratic equations in one variable. a. Use the method of completing the square to transform any quadratic equation in into an equation of the form that has the same solutions. Derive the quadratic formula from this form.
This topic guides students through the process of deriving the
Quadratic Formula by completing the square.
9 Solving Quadratic Equations Using the Quadratic Formula
MAFS.912.A-CED.1.1 Create equations and inequalities in one variable and use them to solve problems. Include equations arising from linear and quadratic functions, and simple rational and exponential functions. MAFS.912.A-REI.2.4.bSolve quadratic equations in one variable. b. Solve quadratic equations by inspection, taking square roots, completing the square, the quadratic formula, and factoring, as appropriate to the initial form of the equation. Recognize when the quadratic formula gives complex solutions.
This topic focuses on using the Quadratic Formula to find solutions
to quadratic equations.

MATH NATION Algebra 1 2017-2018 Scope and Sequence
MathNation.com
19
10 Quadratic Functions in Action
MAFS.912.A-CED.1.1 Create equations and inequalities in one variable and use them to solve problems. Include equations arising from linear and quadratic functions, and simple rational and exponential functions. MAFS.912.A-REI.2.4.bSolve quadratic equations in one variable. b. Solve quadratic equations by inspection, taking square roots, completing the square, the quadratic formula and factoring, as appropriate to the initial form of the equation. Recognize when the quadratic formula gives complex solutions and write them as for real numbers and. MAFS.912.A-SSE.2.3.a.bChoose and produce an equivalent form of an expression to reveal and explain properties of the quantity represented by the expression. a. Factor a quadratic expression to reveal the zeros of the function it defines. b. Complete the square in a quadratic expression to reveal the maximum or minimum value of the function it defines. MAFS.912.F-IF.3.8.aWrite a function defined by an expression in different but equivalent forms to reveal and explain different properties of the function. a. Use the process of factoring and completing the square in quadratic function to show zeros, extreme values, and symmetry of the graph, and interpret these in terms of a context.
This topic revisits quadratics in the real-world and focuses on writing quadratic functions in equivalent
forms to reveal key features. Students will interpret what those key features represent in a real-
world context.

MATH NATION Algebra 1 2017-2018 Scope and Sequence
MathNation.com
20
Section 6: Quadratic Equations and Functions – Part 2
Topic Title Standards Objective
1 Observations from a Graph of a Quadratic Function
MAFS.912.F-IF.2.4 For a function that models a relationship between two quantities, interpret key features of graphs and tables in terms of the quantities, and sketch graphs showing key features given a verbal description of the relationship. Key features include: intercepts; intervals where the function is increasing, decreasing, positive, or negative; relative maximums and minimums; symmetries; end behavior; and periodicity. MAFS.912.F-IF.3.8.a Write a function defined by an expression in different but equivalent forms to reveal explain different properties of a function. a. Use the process of factoring and completing the square in quadratic function to show zeros, extreme values, and symmetry of the graph, and interpret these in terms of a context. MAFS.912.A-CED.1.2 Create equations in two or more variables to represent relationships between quantities; graph equations on coordinate axes with labels and scales.
This topic focuses on interpreting key features of a graph. Students are also introduced to the vertex form of a quadratic function and
will create equations from the graph of the function.
2 Nature of the Solutions of Quadratic Equations and Functions
MAFS.912.A-REI.2.4.b Solve quadratic equations in one variable. Solve quadratic equations by inspection, taking square roots, completing the square, the quadratic formula and factoring, as appropriate to the initial form of the equation. Recognize when the quadratic formula gives complex solutions and write them as for real numbers and.
This topic helps students discover how to use the discriminant to
determine the nature of solutions of quadratics.

MATH NATION Algebra 1 2017-2018 Scope and Sequence
MathNation.com
21
3 Graphing Quadratic Functions Using a Table
MAFS.912.A-CED.1.1 Create equations and inequalities in one variable and use them to solve problems. Include equations arising from linear and quadratic functions, and simple rational and exponential functions. MAFS.912.A-CED.1.2 Create equations in two or more variables to represent relationships between quantities; graph equations on coordinate axes with labels and scales. MAFS.912.F-IF.3.7.aGraph functions expressed symbolically and show key features of the graph, by hand in simple cases and using technology in more complicated cases. a. Graph linear and quadratic functions and show intercepts, maxima, and minima.
This topic focuses on graphing quadratic functions by using a
table of values.
4 Graphing Quadratic Functions Using the Vertex and Intercepts
MAFS.912.A-CED.1.1 Create equations and inequalities in one variable and use them to solve problems. Include equations arising from linear and quadratic functions, and simple rational and exponential functions.
MAFS.912.F-IF.3.7.aGraph functions expressed symbolically and show key features of the graph, by hand in simple cases and using technology in more complicated cases. a. Graph linear and quadratic functions and show intercepts, maxima, and minima. MAFS.912.F-IF.3.8.aWrite a function defined by an expression in different but equivalent forms to reveal and explain different properties of the function. a. Use the process of factoring and completing the square in a quadratic function to show zeros, extreme values, and symmetry of the graph, and interpret these in terms of a context.
This topic focuses on graphing quadratic functions when given a
quadratic function in standard form. Students will find the vertex and the intercepts and graph the
quadratic.

MATH NATION Algebra 1 2017-2018 Scope and Sequence
MathNation.com
22
5 Graphing Quadratic Functions Using Vertex Form – Part 1
MAFS.912.F-IF.3.7.aGraph functions expressed symbolically and show key features of the graph, by hand in simple cases and using technology in more complicated cases. a. Graph linear and quadratic functions and show intercepts, maxima, and minima. MAFS.912.F-IF.3.8.aWrite a function defined by an expression in different but equivalent forms to reveal explain different properties of a function. a. Use the process of factoring and completing the square in quadratic function to show zeros, extreme values, and symmetry of the graph, and interpret these in terms of a context. MAFS.912.A-SSE.1.1.b Interpret expressions that represent a quantity in terms of its context. b. Interpret complicated expressions by viewing one or more of their parts as a single entity. For example, interpret P(1+r)n as the product of P and a factor not depending on P.
This topic focuses on graphing quadratic functions in vertex form. If quadratics are not in vertex form,
students will write the function in vertex form to reveal the vertex.
6 Graphing Quadratic Functions Using Vertex Form – Part 2
MAFS.912.F-IF.3.7.a Graph functions expressed symbolically and show key features of the graph, by hand in simple cases and using technology in more complicated cases. a. Graph linear and quadratic functions and show intercepts, maxima, and minima. MAFS.912.F-IF.3.8.a Write a function defined by an expression in different but equivalent forms to reveal explain different properties of a function. a. Use the process of factoring and completing the square in quadratic function to show zeros, extreme values, and symmetry of the graph, and interpret these in terms of a context. MAFS.912.F-IF.3.9Compare properties of two functions each represented in a different way (algebraically, graphically, numerically in tables, or by verbal descriptions).
This topic focuses on graphing quadratic functions in vertex form. If quadratics are not in vertex form,
students will write the function in vertex form to reveal the vertex.
7 Transformations of the Dependent Variable of Quadratic Functions
MAFS.912.F-BF.2.3 Identify the effect on the graph of replacing by,,, and for specific values of (both positive and negative); find the value of given the graphs. Experiment with cases and illustrate an explanation of the effects on the graph using technology. Include recognizing even and odd functions from their graphs and algebraic expressions for them.
This topic focuses on transformations of quadratic
functions, including vertical shifts, reflections, and vertical stretching
and compressing.

MATH NATION Algebra 1 2017-2018 Scope and Sequence
MathNation.com
23
8 Transformations of the Independent Variable of Quadratic Functions
MAFS.912.F-BF.2.3 Identify the effect on the graph of replacing by,,, and for specific values of (both positive and negative); find the value of given the graphs. Experiment with cases and illustrate an explanation of the effects on the graph using technology. Include recognizing even and odd functions from their graphs and algebraic expressions for them.
This topic focuses on transformations of quadratic
functions, including horizontal shifts and horizontal stretching and
compressing.
9 Finding Solution Sets to Systems of Equations Using Tables of Values and Successive Approximations
MAFS.912.A-REI.4.11 Explain why thecoordinates of the points where the graphs of the equations and intersect are the solutions of the equation; find the solutions approximately, e.g., using technology to graph the functions, make tables of values, or find successive approximations. Include cases where and/or are linear, polynomial, rational, absolute value, exponential, and logarithmic functions.
This topic introduces systems of linear and quadratic functions.
Students will find the solutions by graphing, looking at tables, and
successive approximations.

MATH NATION Algebra 1 2017-2018 Scope and Sequence
MathNation.com
24
Section 7: Exponential Functions
Topic Title Standards Objective
1 Geometric Sequences
MAFS.912.F-IF.1.3 Recognize that sequences are functions, sometimes defined recursively, whose domain is a subset of the integers. MAFS.912.F-LE.1.2 Construct linear and exponential functions, including arithmetic and geometric sequences, given a graph, a description of a relationship, or two input/output pairs (including reading these from a table). MAFS.912.F-BF.1.1a Write a function that describes a relationship between two quantities. a. Determine an explicit expression, a recursive process, or steps for calculation from a context.
This topic introduces geometric sequences. Students learn to find
a recursive formula and an explicit formula for each geometric
sequence, and then find the value of an "nth" term in the sequence.
Students use these formulas to sketch a graph of the function.
Students will also make the connection between geometric
sequences and exponential functions.
2 Exponential Functions
MAFS.912.F-LE.1.2Construct linear and exponential functions, including arithmetic and geometric sequences, given a graph, a description of a relationship, or two input/output pairs (including reading these from a table).
This topic introduces exponential functions. Students will represent
exponential functions graphically, algebraically, verbally, and in
tables. Additionaly, students will write equations of exponential
functions.

MATH NATION Algebra 1 2017-2018 Scope and Sequence
MathNation.com
25
3 Graphs of Exponential Functions – Part 1
MAFS.912.A-SSE.2.3.cChoose and produce an equivalent form of an expression to reveal and explain properties of the quantity represented by the expression. c. Use the properties of exponents to transform expressions for exponential functions. MAFS.912.F-IF.2.4For a function that models a relationship between two quantities, interpret key features of graphs and tables in terms of the quantities, and sketch graphs showing key features given a verbal description of the relationship. Key features include: intercepts; intervals where the function is increasing, decreasing, positive, or negative; relative maximums and minimums; symmetries; end behavior; and periodicity. MAFS.912.F-IF.3.7.eGraph functions expressed symbolically and show key features of the graph by hand in simple cases and using technology for more complicated cases. e. Graph exponential and logarithmic functions, showing intercepts and end behavior, and trigonometric functions, showing period, midline, and amplitude and using phase shift. MAFS.912.F-IF.3.8.bWrite a function defined by an expression in different but equivalent forms to reveal and explain different properties of the function. b. Use the properties of exponents to interpret expressions for exponential functions.
This topic focuses on graphing exponential functions and
describing the end behavior of the functions. Students will understand
the connection between the y-intercept, the rate of growth or
decay, and end behavior.

MATH NATION Algebra 1 2017-2018 Scope and Sequence
MathNation.com
26
4 Graphs of Exponential Functions – Part 2
MAFS.912.A-SSE.2.3.cChoose and produce an equivalent form of an expression to reveal and explain properties of the quantity represented by the expression. c. Use the properties of exponents to transform expressions for exponential functions. MAFS.912.F-IF.2.4For a function that models a relationship between two quantities, interpret key features of graphs and tables in terms of the quantities, and sketch graphs showing key features given a verbal description of the relationship. Key features include: intercepts; intervals where the function is increasing, decreasing, positive, or negative; relative maximums and minimums; symmetries; end behavior; and periodicity. MAFS.912.F-IF.3.7.eGraph functions expressed symbolically and show key features of the graph by hand in simple cases and using technology for more complicated cases. e. Graph exponential and logarithmic functions, showing intercepts and end behavior, and trigonometric functions, showing period, midline, and amplitude and using phase shift. MAFS.912.F-IF.3.8.bWrite a function defined by an expression in different but equivalent forms to reveal and explain different properties of the function. b. Use the properties of exponents to interpret expressions for exponential functions.
This topic focuses on graphing exponential functions and
describing the end behavior of the functions. Students will understand
the connection between the y-intercept, the rate of growth or
decay, and end behavior.
5 Growth and Decay Rates of Exponential Functions
MAFS.912.A-CED.1.1 Create equations and inequalities in one variable and use them to solve problems. Include equations arising from linear and quadratic functions, and simple rational and exponential functions. MAFS.912.F-IF.3.8.b Write a function defined by an expression in different but equivalent forms to reveal and explain different properties of the function. b. Use the properties of exponents to interpret expressions for exponential functions. For example, identify percent rate of change in functions such as,,, and, classify them as representing exponential growth or decay. MAFS.912.F-LE.2.5 Interpret the parameters in a linear or exponential function in terms of a context.
In this topic, students learn how to determine if a real-life situation
can be modeled by an exponential growth or exponential decay function and what the rate
of growth or decay is.

MATH NATION Algebra 1 2017-2018 Scope and Sequence
MathNation.com
27
6 Transformations of Exponential Functions
MAFS.912.F-BF.2.3 Identify the effect on the graph of replacing by,,, and for specific values of (both positive and negative); find the value of given the graphs. Experiment with cases and illustrate an explanation of the effects on the graph using technology.
In this topic, students learn about vertical and horizontal translations and compressions of exponential
functions algebraically and graphically.

MATH NATION Algebra 1 2017-2018 Scope and Sequence
MathNation.com
28
Section 8: Summary of Functions
Topic Title Standards Objective
1 Comparing Linear, Quadratic, and Exponential Functions – Part 1
MAFS.912.F-IF.3.9 Compare properties of two functions each represented in a different way (algebraically, graphically, numerically in tables, or by verbal descriptions). For example, given a graph of one quadratic function and an algebraic expression for another, say which has the larger maximum. MAFS.912.F-IF.2.4 For a function that models a relationship between two quantities, interpret key features of graphs and tables in terms of the quantities, and sketch graphs showing key features given a verbal description of the relationship. Key features include: intercepts; intervals where the function is increasing, decreasing, positive, or negative; relative maximums and minimums; symmetries; end behavior; and periodicity. MAFS.912.F-IF.2.6 Calculate and interpret the average rate of change of a function (presented symbolically or as a table) over a specified interval. Estimate the rate of change from a graph. MAFS.912.F-LE.1.1.a.b.c Distinguish between situations that can be modeled with linear functions and with exponential functions. a. Prove that linear functions grow by equal differences over equal intervals, and that exponential functions grow by equal factors over equal intervals. b. Recognize situations in which one quantity changes at a constant rate per unit interval relative to another. c. Recognize situations in which a quantity grows or decays by a constant percent rate per unit interval relative to another. MAFS.912.F-LE.1.3 Observe using graphs and tables that a quantity increasing exponentially eventually exceeds a quantity increasing linearly, quadratically or (more generally) as a polynomial function.
This topic focuses on comparing and contrasting the key features of
linear, quadratic, and exponential functions.

MATH NATION Algebra 1 2017-2018 Scope and Sequence
MathNation.com
29
2 Comparing Linear, Quadratic, and Exponential Functions – Part 2
MAFS.912.F-IF.3.9 Compare properties of two functions each represented in a different way (algebraically, graphically, numerically in tables, or by verbal descriptions). For example, given a graph of one quadratic function and an algebraic expression for another, say which has the larger maximum. MAFS.912.F-IF.2.4 For a function that models a relationship between two quantities, interpret key features of graphs and tables in terms of the quantities, and sketch graphs showing key features given a verbal description of the relationship. Key features include: intercepts; intervals where the function is increasing, decreasing, positive, or negative; relative maximums and minimums; symmetries; end behavior; and periodicity. MAFS.912.F-IF.2.6 Calculate and interpret the average rate of change of a function (presented symbolically or as a table) over a specified interval. Estimate the rate of change from a graph. MAFS.912.F-LE.1.1.a.b.c Distinguish between situations that can be modeled with linear functions and with exponential functions. a. Prove that linear functions grow by equal differences over equal intervals, and that exponential functions grow by equal factors over equal intervals. b. Recognize situations in which one quantity changes at a constant rate per unit interval relative to another. c. Recognize situations in which a quantity grows or decays by a constant percent rate per unit interval relative to another. MAFS.912.F-LE.1.3 Observe using graphs and tables that a quantity increasing exponentially eventually exceeds a quantity increasing linearly, quadratically or (more generally) as a polynomial function.
This topic focuses on comparing and contrasting the key features of
linear, quadratic, and exponential functions.

MATH NATION Algebra 1 2017-2018 Scope and Sequence
MathNation.com
30
3 Comparing Arithmetic and Geometric Sequences
MAFS.912.F-IF.1.3 Recognize that sequences are functions, sometimes defined recursively, whose domain is a subset of the integers. MAFS.912.F-LE.1.1.a.b Distinguish between situations that can be modeled with linear functions and with exponential functions. a. Prove that linear functions grow by equal differences over equal intervals, and that exponential functions grow by equal factors over equal intervals. b. Recognize situations in which one quantity changes at a constant rate per unit interval relative to another. MAFS.912.F-LE.1.3 Observe using graphs and tables that a quantity increasing exponentially eventually exceeds a quantity increasing linearly, quadratically or (more generally) as a polynomial function.
This topic compares real-world situations that model arithmetic and
geometric sequences. Students determine which type of sequence
represents given situations; and it also explains why the domain of
sequences are a set or a subset of integers
4 Exploring non-Arithmetic, non-Geometric Sequences
MAFS.912.F-BF.1.1.a. Write a function that describes a relationship between two quantities. a. Determine an explicit expression, a recursive process, or steps for calculation from a context. MAFS.912.F-IF.1.3 Recognize that sequences are functions, sometimes defined recursively, whose domain is a subset of the integers.
In this topic, students will write and solve a recursive and/or explicit
formula for a sequence that is not arithmetic or geometric.

MATH NATION Algebra 1 2017-2018 Scope and Sequence
MathNation.com
31
5 Modeling with Functions
MAFS.912.A-CED.1.1 Create equations and inequalities in one variable and use them to solve problems. Include equations arising from linear and quadratic functions, and simple rational and exponential functions. MAFS.912.A-CED.1.2 Create equations in two or more variables to represent relationships between quantities; graph equations on coordinate axes with labels and scales. MAFS.912.A-CED.1.3 Represent constraints by equations or inequalities and by systems of equations and/or inequalities, and interpret solutions as viable or nonviable options in a modeling context. MAFS.912.A-REI.2.4.b Solve quadratic equations in one variable. b. Solve quadratic equations by inspection, taking square roots, completing the square, the quadratic formula, and factoring, as appropriate to the initial form of the equation. Recognize when the quadratic formula gives complex solutions. MAFS.912.F-IF.2.5 Relate the domain of a function to its graph and, where applicable, to the quantitative relationship it describes. MAFS.912.F-IF.3.7.a Graph functions expressed symbolically and show key features of the graph, by hand in simple cases and using technology in more complicated cases. a. Graph linear and quadratic functions and show intercepts, maxima, and minima.
In this topic, students will model with situations given in a verbal, tabular,
and graphical representation.

MATH NATION Algebra 1 2017-2018 Scope and Sequence
MathNation.com
32
6 Understanding Piecewise-Defined Functions
MAFS.912.F-IF.1.2 Use function notation, evaluate functions for inputs in their domains, and interpret statements that use function notation in terms of a context. MAFS.912.F-IF.1.1 Understand that a function from one set (called the domain) to another set (called the range) assigns to each element of the domain exactly one element of the range. If is a function and is an element of its domain, then denotes the output of corresponding to the input. The graph of is the graph of the equation. MAFS.912.F-IF.3.7b Graph functions expressed symbolically and show key features of the graph by hand in simple cases and using technology for more complicated cases. b. Graph square root, cube root, and piecewise-defined functions, including step functions and absolute value functions
This topic introduces the concept of a piecewise-defined function.
Students learn that a function can be comprised of specific "pieces" as defined by its domain. Students will graph piece-wise defined functions
set within real-world contexts.
7 Absolute Value Functions
MAFS.912.F-IF.3.7b Graph functions expressed symbolically and show key features of the graph by hand in simple cases and using technology for more complicated cases. b. Graph square root, cube root, and piecewise-defined functions, including step functions and absolute value functions
This topic introduces students to the concept of absolute value functions
and shows how they are an example of a piecewise-defined
function.
8 Graphing Power Functions – Part 1
MAFS.912.F-IF.3.7b Graph functions expressed symbolically and show key features of the graph by hand in simple cases and using technology for more complicated cases. b. Graph square root, cube root, and piecewise-defined functions, including step functions and absolute value functions
This topic focuses on square root, cube root, and cubic functions.
9 Graphing Power Functions – Part 2
MAFS.912.F-IF.3.7b Graph functions expressed symbolically and show key features of the graph by hand in simple cases and using technology for more complicated cases. b. Graph square root, cube root, and piecewise-defined functions, including step functions and absolute value functions
This topic focuses on square root, cube root, and cubic functions.

MATH NATION Algebra 1 2017-2018 Scope and Sequence
MathNation.com
33
10 Finding Zeroes of Polynomial Functions of Higher Degrees
MAFS.912.A-APR.2.3 Identify zeros of polynomials when suitable factorizations are available, and use the zeros to construct a rough graph of the function defined by the polynomial.
This topic focuses on finding the zeroes of a higher degree
polynomial equations. Additionally, students will recognize graphs of
polynomial functions by finding the zeroes.
11 End Behavior of Graphs of Polynomial
MAFS.912.F-IF.3.7.c Graph functions expressed symbolically and show key features of the graph, by hand in simple cases and using technology in more complicated cases. c. Graph polynomial functions, identifying zeros when suitable functions are available, and showing end behavior.
This topic focuses on end behavior of graphs of polynomials. Students
will use this knowledge to sketch the graph of polynomials.
12 Graphing Polynomial Functions of Higher Degrees
MAFS.912.F-IF.3.7c Graph functions expressed symbolically and show key features of the graph, by hand in simple cases and using technology for more complicated cases. c. Graph polynomial functions, identifying zeros when suitable functions are available, and showing end behavior. MAFS.912.A-APR.2.3 Identify zeros of polynomials when suitable factorizations are available, and use the zeros to construct a rough graph of the function defined by the polynomial.
This topic provides an introduction to graphing polynomial functions.
Students will identify the zeros of a polynomial and its end behavior
depending on its leading coefficient and degree. Students will use this
information to sketch a graph of a polynomial function in factored
form.
13 Recognizing Even and Odd Functions
MAFS.912.F-BF.2.3 Identify the effect on the graph of replacing by,,, and for specific values of (both positive and negative); find the value of given the graphs. Experiment with cases and illustrate an explanation of the effects on the graph using technology. Include recognizing even and odd functions from their graphs and algebraic expressions for them.
This topic teaches the skill of recognizing even and odd functions
from their graphs and algebraic expressions for them.
14 Solutions to Systems of Functions
MAFS.912.A-REI.4.11 Explain why the-coordinates of the points where the graphs of the equations and intersect are the solutions of the equation; find the solutions approximately (e.g., using technology to graph the functions, make tables of values, or find successive approximations). Include cases where and/or are linear, polynomial, rational, absolute value, exponential, and logarithmic functions.
This topic focuses on systems of functions involving polynomial,
rational, absolute value, exponential, and logarithmic
functions. Students will find solutions using tables and a graph.

MATH NATION Algebra 1 2017-2018 Scope and Sequence
MathNation.com
34
Section 9: One-‐Variable Statistics
Topic Title Standards Objective
1 Dot Plots MAFS.912.S-ID.1.1 Represent data with plots on the real number line (dot plots, histograms, and box plots).
This topic introduces statistics and the two types of data: quantitative
and categorical. Students learn how to create dot plots.
2 Histograms MAFS.912.S-ID.1.1 Represent data with plots on the real number line (dot plots, histograms, and box plots).
This topic focuses creating histograms and determining the
number of groups and the range of values within groups.
3 Box Plots – Part 1 MAFS.912.S-ID.1.1 Represent data with plots on the real number line (dot plots, histograms, and box plots).
This topic focuses on box plots. Students learn how to
calculatenumber summaries and how to use this information to
construct box plots.
4 Box Plots – Part 2 MAFS.912.S-ID.1.1 Represent data with plots on the real number line (dot plots, histograms, and box plots).
This topic focuses on box plots. Students keep learning on how to
construct box plots.
5 Measures of Center and Shapes of Distributions
MAFS.912.S-ID.1.2 Use statistics appropriate to the shape of the data distribution to compare center (median, mean) and spread (interquartile range, standard deviation) of two or more different data sets.
This topic discusses three common measures of center: mean, median,
and mode. Students learn the difference between normal and skewed distributions and which
measures of center are most appropriate given particular
situations.
6 Measures of Spread – Part 1
MAFS.912.S-ID.1.2 Use statistics appropriate to the shape of the data distribution to compare center (median, mean) and spread (interquartile range, standard deviation) of two or more different data sets.
This topic introduces two common ways to measure spread:
interquartile range and standard deviation. Students learn the
Empirical Rule and how it is used to measure spread in a normal
distribution.

MATH NATION Algebra 1 2017-2018 Scope and Sequence
MathNation.com
35
7 Measures of Spread – Part 2
MAFS.912.S-ID.1.2 Use statistics appropriate to the shape of the data distribution to compare center (median, mean) and spread (interquartile range, standard deviation) of two or more different data sets.
This topic introduces two common ways to measure spread:
interquartile range and standard deviation. Students learn the
Empirical Rule and how it is used to measure spread in a normal
distribution.
8 The Empirical Rule
MAFS.912.S-ID.1.2 Use statistics appropriate to the shape of the data distribution to compare center (median, mean) and spread (interquartile range, standard deviation) of two or more different data sets.
This topic introduces the concept of the Empirical Rule and how it is used
to determine probabilities in a normal distribution.
9 Outliers in Data Sets MAFS.912.S-ID.1.3 Interpret differences in shape, center, and spread in the context of the data sets, accounting for possible effects of extreme data points (outliers).
This topic focuses on outliers and how they affect the measurement
of center and spread.

MATH NATION Algebra 1 2017-2018 Scope and Sequence
MathNation.com
36
Section 10: Two-‐Variable Statistics
Topic Title Standards Objective
1
Relationship between Two Categorical Variables – Marginal
and Joint Relative Frequency – Part 1
MAFS.912.S-ID.2.5 Summarize categorical data for two categories in two-way frequency tables. Interpret relative frequencies in the context of the data (including joint, marginal, and conditional relative frequencies). Recognize possible associations and trends in the data.
This topic introduces two-way frequency (contingency) tables as a
way to represent two categorical variables. Students learn the
difference between marginal frequencies and joint frequencies.
2
Relationship between Two Categorical Variables – Marginal
and Joint Relative Frequency – Part 2
MAFS.912.S-ID.2.5 Summarize categorical data for two categories in two-way frequency tables. Interpret relative frequencies in the context of the data (including joint, marginal, and conditional relative frequencies). Recognize possible associations and trends in the data.
This topic introduces two-way frequency (contingency) tables as a
way to represent two categorical variables. Students learn the
difference between marginal frequencies and joint frequencies.
3 Relationship between Two
Categorical Variables – Conditional Frequency
MAFS.912.S-ID.2.5 Summarize categorical data for two categories in two-way frequency tables. Interpret relative frequencies in the context of the data (including joint, marginal, and conditional relative frequencies). Recognize possible associations and trends in the data.
In this topic, students learn about conditional relative frequencies and how they can be used to determine if there is a relationship between two
categorical variables.
4 Scatter Plots and Function Models
MAFS.912.S-ID.2.6.a.b.c Represent data on two quantitative variables on a scatter plot, and describe how the variables are related. a. Fit the function to the data; use functions fitted to data to solve problems in the context of the data. Use given functions or choose a function suggested by the context. Emphasize linear, quadratic, and exponential models. b. Informally assess the fit of a function by plotting and analyzing residuals. c. Fit a linear function for a scatter plot that suggests a linear association. MAFS.912.S-ID.3.7 Interpret the slope (rate of change) and the intercept (constant term) of a linear model in the context of the data.
In this topic, students learn to classify and interpret scatterplots. Students
also learn how to find the line of best fit using graphing technology.

MATH NATION Algebra 1 2017-2018 Scope and Sequence
MathNation.com
37
5 Residuals and Residual Plots – Part 1
MAFS.912.S-ID.2.6.b Represent data on two quantitative variables on a scatter plot, and describe how the variables are related. b. Informally assess the fit of a function by plotting and analyzing residuals.
This topic focuses on residuals and residual plots and how they are used
to determine whether a certain function is a good fit for a model.
6 Residuals and Residual Plots – Part 2
MAFS.912.S-ID.2.6.b Represent data on two quantitative variables on a scatter plot, and describe how the variables are related. b. Informally assess the fit of a function by plotting and analyzing residuals.
This topic focuses on residuals and residual plots and how they are used
to determine whether a certain function is a good fit for the data.
7 Examining Correlation
MAFS.912.S-ID.2.6.c Represent data on two quantitative variables on a scatter plot, and describe how the variables are related. c. Fit a linear function for a scatter plot that suggests a linear association. MAFS.912.S-ID.3.8 Compute (using technology) and interpret the correlation coefficient of a linear fit. MAFS.912.S-ID.3.9 Distinguish between correlation and causation.
This topic introduces the concept of correlation, the correlation
coefficient, and what "r" tells us about the type of linear relationship
between two variables. The topic also discusses the concept of
causation and how this is different than correlation.