Embed Size (px)
Citation preview

2017-18Staff Compensation &Demographics Survey
Executive Summary
aacsb.edu

Copyright © 2018 AACSB International
2017–18 Staff Compensation and Demographics Survey Executive Summary
Changes in 2017-18 Survey The 2017-18 academic year marked the 50th anniversary of the AACSB International Salary Survey, and the 11th year that the survey has been available to all AACSB member schools worldwide, regardless of location. This year, changes were introduced to create a broader context for understanding faculty and staff compensation across global business schools, and to align with other data related to faculty and staff demographics. These changes are reflected in the new name—the AACSB International Staff Compensation and Demographic Survey (SCDS).
Specific changes this year include the introduction of some new variables, such that we now track year hired, specific tenure status (tenured, tenure-track, neither, not applicable), and the base salary as a percentage of total compensation for each faculty member reported. Other demographics collected at the person level were primary field/discipline appointment, pay period (9 to 10 months vs. 11 to 12 months), faculty qualification types, and gender.
Participation This executive summary provides an overview of the results for the all participating schools whose surveys were submitted and validated by February 27, 2018 (n = 500). AACSB invited over 1,600 business school members and their academic units to participate in this year’s survey. Twenty-five total countries and territories were represented in the survey responses. Reflecting the high value placed on the reports created using the survey data, member participation was high among accredited institutions, where 55 percent of all AACSB-accredited schools and 76 percent of U.S.-based AACSB-accredited schools participated in the survey. While approximately 67 percent of all U.S. member schools participated in this year’s survey, only 32 percent of all member schools worldwide participated in the survey. The 500 participating schools provided data on 33,274 business faculty members across all ranks and 36 business fields plus an “other” category, as well as data on 6,185 administrators in 24 positions normally found in business schools. Of 6,185 administrators reported, 1,178 were on a nine-month contract, while 5,007 were on a 12-month contract.
Twenty-five total countries and territories were represented in the survey responses, providing responses on 33,274 business faculty members and 6,185 administrators.
Copyright © 2018 AACSB International
Table 1. Number of Participating Schools by Region
REGION PARTICIPANTS
Asia (excl. Middle & Near East) 9
Oceania 4
Total: Asia Pacific 13
Africa 0
Europe & Near East 15
Middle East 3
Total: Europe, Middle East and Africa (EMEA) 18
Canada 36
Latin America and Caribbean 2
United States (excluding territories) 431
Total: The Americas 469
Total: All Participating Schools 500
Time in Role When looking across all full-time faculty members reported in the survey, the average amount of years a faculty member had been at their current institution was 11 years. The average number of years a female faculty member had been at their current institution was nine years, and the average for males was 12 years. The average number of years that a faculty member at a private school had been at the current institution was around 12 years, and at public schools about 11 years. Faculty from the statistics discipline had been at their current institutions longer than those from other disciplines, at an average of 16 years, while faculty from business law and quantitative methods were a close second, with an average of 14 years each. While the largest number of faculty reported was in the discipline of accounting (n = 5,579), the average number of years that an accounting faculty member had been at an institution was about 11 years. Averages can be impacted by high numbers of new hires in certain fields; the discipline that had the largest number of new hires was data analytics, where about 32 percent of the faculty teaching in that field were hired in 2017 (the current survey year).
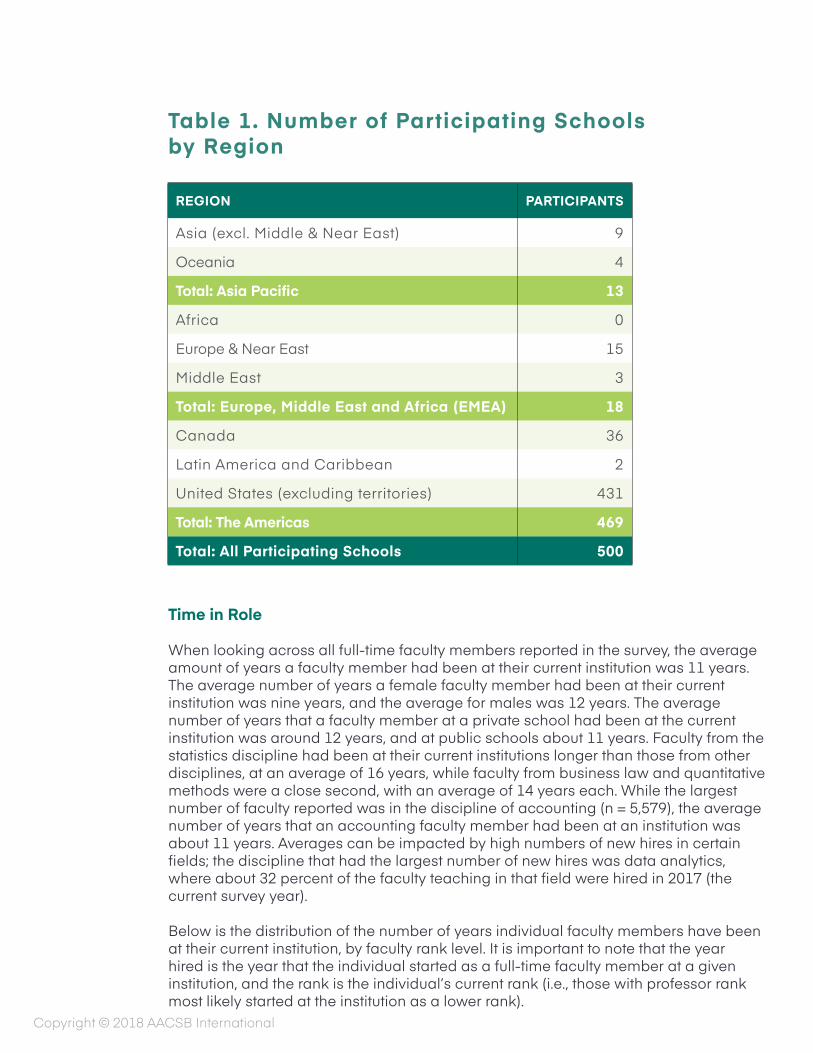
Below is the distribution of the number of years individual faculty members have been at their current institution, by faculty rank level. It is important to note that the year hired is the year that the individual started as a full-time faculty member at a given institution, and the rank is the individual’s current rank (i.e., those with professor rank most likely started at the institution as a lower rank).
Copyright © 2018 AACSB International
NUMBER OF YEARS AT CURRENT BUSINESS SCHOOL AACSB 2017–18 SCDS
Professor Associate Professor
Assistant Professor Instructor
Maximum 64 53 53 51
75th Percentile 28 16 4 12
Median 18 10 2 5
25th Percentile 12 6 1 2
Minimum 2017 Hire 2017 Hire 2017 Hire 2017 Hire
Mean 19.8 12.3 3.7 7.6
Standard Deviation 10.6 8.9 4.9 7.6
Total Count 9,114 8,883 8,732 6,545
Figure 1. Number of Years at Business School by Faculty Rank
Table 2. Distribution of Number of Years by Faculty Rank
Copyright © 2018 AACSB International
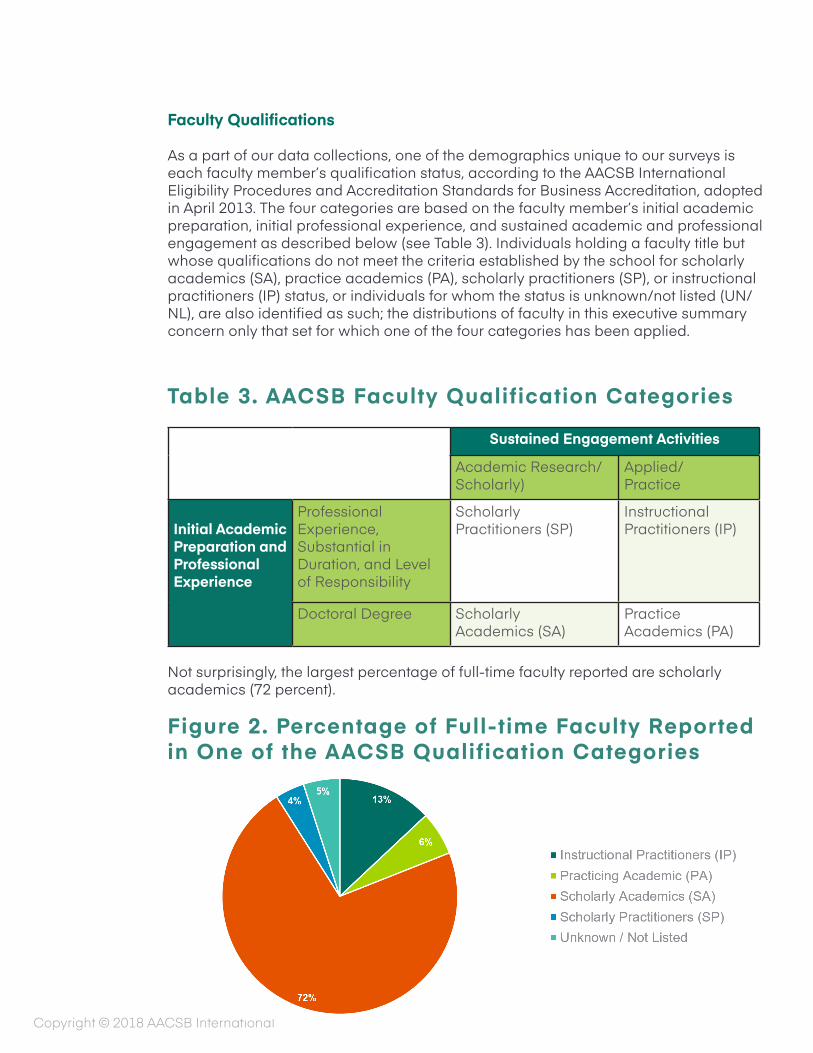
Faculty Qualifications As a part of our data collections, one of the demographics unique to our surveys is each faculty member’s qualification status, according to the AACSB International Eligibility Procedures and Accreditation Standards for Business Accreditation, adopted in April 2013. The four categories are based on the faculty member’s initial academic preparation, initial professional experience, and sustained academic and professional engagement as described below (see Table 3). Individuals holding a faculty title but whose qualifications do not meet the criteria established by the school for scholarly academics (SA), practice academics (PA), scholarly practitioners (SP), or instructional practitioners (IP) status, or individuals for whom the status is unknown/not listed (UN/NL), are also identified as such; the distributions of faculty in this executive summary concern only that set for which one of the four categories has been applied.
Table 3. AACSB Faculty Qualification Categories
Sustained Engagement Activities
Academic Research/Scholarly)
Applied/ Practice
Initial Academic Preparation and Professional Experience
Professional Experience, Substantial in Duration, and Level of Responsibility
Scholarly Practitioners (SP)
Instructional Practitioners (IP)
Doctoral Degree Scholarly Academics (SA)
Practice Academics (PA)
Not surprisingly, the largest percentage of full-time faculty reported are scholarly academics (72 percent).
Figure 2. Percentage of Full-time Faculty Reported in One of the AACSB Qualification Categories

Copyright © 2018 AACSB International
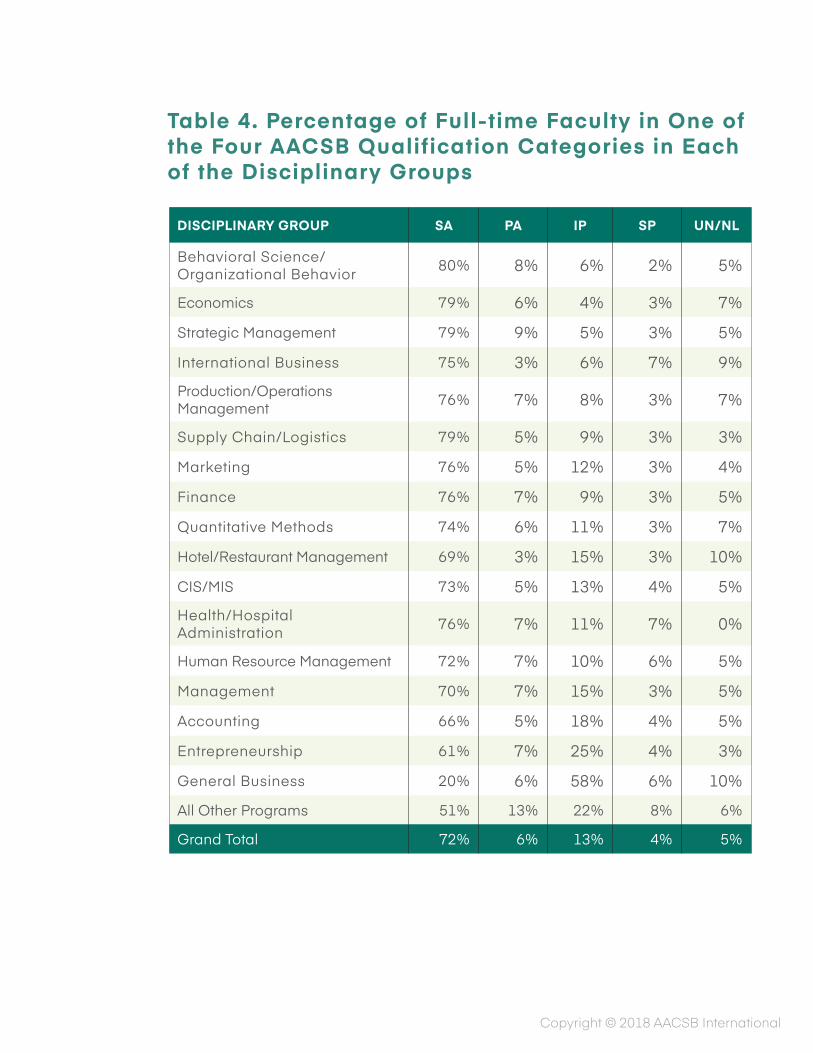
In contrast, only 20 percent of faculty in the discipline of general business are categorized as scholarly academics. Figure 3 below contains the percentages for all 18 disciplinary groups.
Figure 3. Percentage of Full-time Faculty That are Scholarly Academics by Discipline
Looking at Scholarly Academics in terms of disciplines (aggregated into 18 main areas), behavioral science/organizational behavior had the highest percentage, where 80 percent of all faculty reported in this field were categorized as scholarly academics.

Copyright © 2018 AACSB International
Table 4 contains information regarding the percentage of full-time faculty in one of the four AACSB qualification categories by discipline groups. As noted in Figure 2, only a very small percentage (6 percent) of faculty are practicing academics (PA). This was also the case when faculty were broken out by discipline.
The percentage of PA faculty ranged from 3 percent (hotel/restaurant management and international business) to 9 percent (strategic management) with a collection of all other programs having 13 percent of their faculty reported as practice academics. Only 4 percent of the overall faculty were reported as scholarly practitioners, with the highest disciplinary percentages at around 7 percent in both international business and health/hospital administration, while only 2 percent of the faculty teaching in the discipline of behavioral science/organizational behavior were reported in this category.
Overall, 13 percent of the full-time faculty reported in the SCDS were instructional practitioners. The discipline with the largest percentage of instructional practitioners was general business at 58 percent. Entrepreneurship also had a substantially large percentage at 25 percent, and accounting faculty followed at 18 percent. Only 4 percent of economics full-time faculty were considered as instructional practitioners.
Copyright © 2018 AACSB International
DISCIPLINARY GROUP SA PA IP SP UN/NL
Behavioral Science/Organizational Behavior 80% 8% 6% 2% 5%
Economics 79% 6% 4% 3% 7%
Strategic Management 79% 9% 5% 3% 5%
International Business 75% 3% 6% 7% 9%
Production/Operations Management 76% 7% 8% 3% 7%
Supply Chain/Logistics 79% 5% 9% 3% 3%
Marketing 76% 5% 12% 3% 4%
Finance 76% 7% 9% 3% 5%
Quantitative Methods 74% 6% 11% 3% 7%
Hotel/Restaurant Management 69% 3% 15% 3% 10%
CIS/MIS 73% 5% 13% 4% 5%
Health/Hospital Administration 76% 7% 11% 7% 0%
Human Resource Management 72% 7% 10% 6% 5%
Management 70% 7% 15% 3% 5%
Accounting 66% 5% 18% 4% 5%
Entrepreneurship 61% 7% 25% 4% 3%
General Business 20% 6% 58% 6% 10%
All Other Programs 51% 13% 22% 8% 6%
Grand Total 72% 6% 13% 4% 5%
Table 4. Percentage of Full-time Faculty in One of the Four AACSB Qualification Categories in Each of the Disciplinary Groups
Copyright © 2018 AACSB International
Full-time Faculty Compensation Practices
Number of Schools Reporting
Average Number of Total Full-time Faculty
Average Number of Faculty Receiving Compensation
Average Annual Amount in USD
a. Summer research funds 285 76 24 16,481
b. Summer teaching compensation 388 63 23 11,038
c. Overload/stipends for teaching credit courses
390 67 18 9,435
d. Stipends for teaching non-credit courses
141 85 13 8,663
e. Additional funds for research 212 76 27 7,578
f. Additional pay for administrative duties (above and beyond teach-ing/research)
70 74 14 9,976
g. Additional pay for teaching at international partner institution(s)
29 80 10 8,112
h. Additional pay for production of intellectual contributions beyond expected standards
17 96 17 11,653
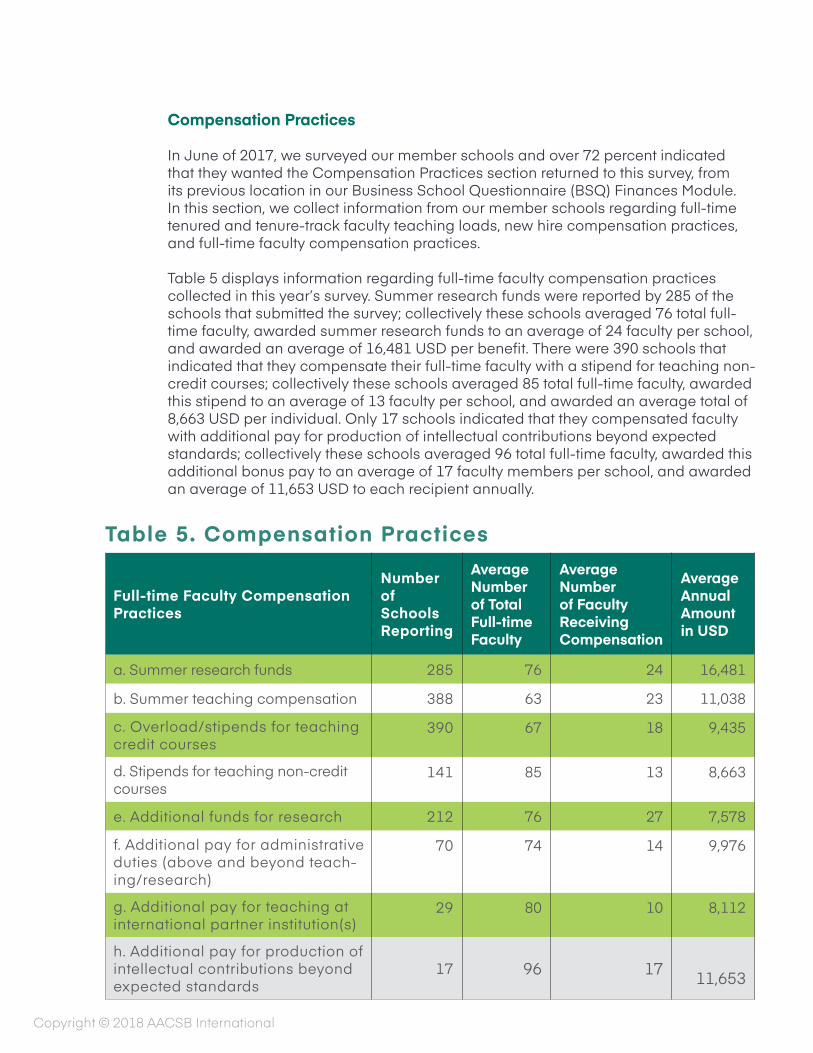
Compensation Practices In June of 2017, we surveyed our member schools and over 72 percent indicated that they wanted the Compensation Practices section returned to this survey, from its previous location in our Business School Questionnaire (BSQ) Finances Module. In this section, we collect information from our member schools regarding full-time tenured and tenure-track faculty teaching loads, new hire compensation practices, and full-time faculty compensation practices.
Table 5 displays information regarding full-time faculty compensation practices collected in this year’s survey. Summer research funds were reported by 285 of the schools that submitted the survey; collectively these schools averaged 76 total full-time faculty, awarded summer research funds to an average of 24 faculty per school, and awarded an average of 16,481 USD per benefit. There were 390 schools that indicated that they compensate their full-time faculty with a stipend for teaching non-credit courses; collectively these schools averaged 85 total full-time faculty, awarded this stipend to an average of 13 faculty per school, and awarded an average total of 8,663 USD per individual. Only 17 schools indicated that they compensated faculty with additional pay for production of intellectual contributions beyond expected standards; collectively these schools averaged 96 total full-time faculty, awarded this additional bonus pay to an average of 17 faculty members per school, and awarded an average of 11,653 USD to each recipient annually.
Table 5. Compensation Practices

Copyright © 2018 AACSB International
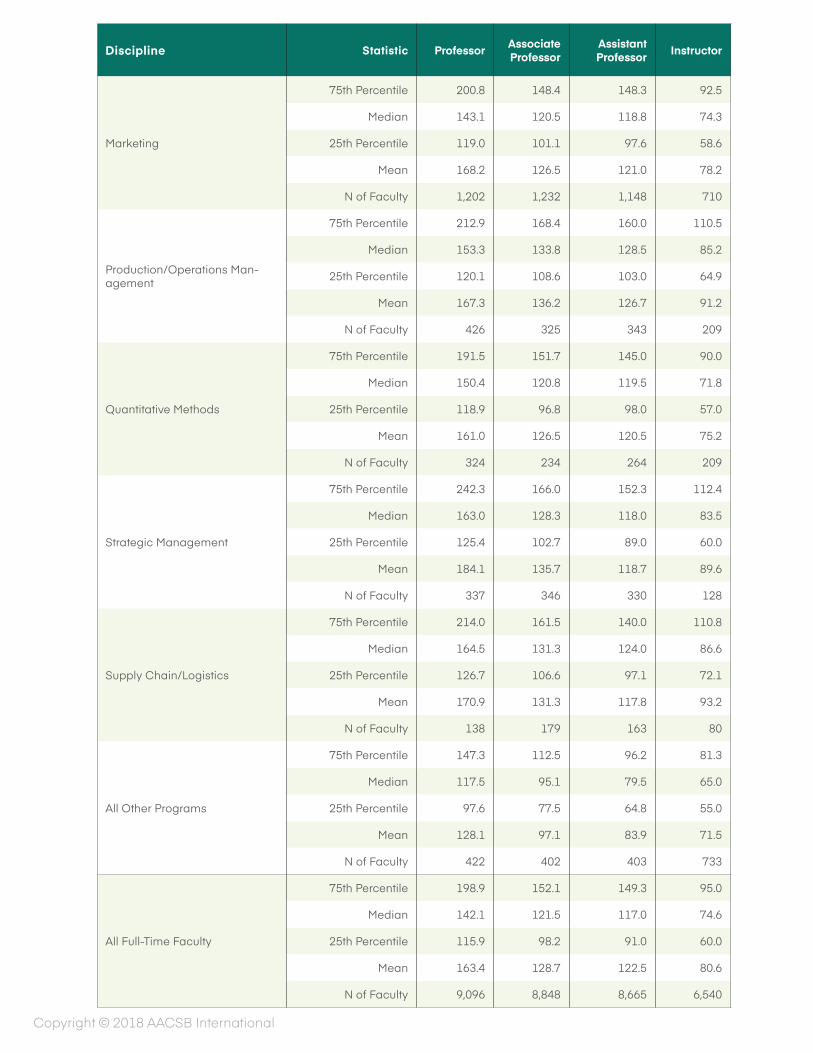
Faculty Salary The overall average nine-month salary* for all 33,141 full-time faculty whose salaries were reported, across all regions, was around 127.1 thousand USD; the median was 117.5 thousand USD. Information regarding full-time faculty salaries is displayed in Table 6. As expected, there was quite a range depending on the discipline and the rank. The median salary for instructors was 74.6 thousand USD, with the largest median salary in this rank at 89.8 thousand USD in the discipline of health/hospital administration. The lowest median salary reported for this rank was 59.0 thousand USD in general business. For the rank of assistant professor, the median salary was 117 thousand USD, and for associate professor the median salary was 121.5 thousand USD, where finance was the discipline with largest median salaries for both ranks (142.3 thousand USD and 137.4 thousand USD, respectively). The lowest median salaries for these two ranks was also general business (56.4 thousand USD and 73.1 thousand USD, respectively). For the highest faculty rank (e.g., professor), the median salary across all faculty (and all disciplines) was 142.1 thousand USD; the highest median salary was in the discipline of behavioral science/organizational behavior, and the lowest median salary for this rank was found in general business at 105.1 thousand USD. Information regarding salaries broken out by new hires and regions is available via the DataDirect custom benchmarking tool and related overview reports for member schools that participated in the survey. These reports are also available for purchase.
*Faculty Salaries that were reported at a 12-month rate were converted to an equivalent nine-month salary. Reporting salary was not required for this year’s survey; this table contains information from 497 schools that reported salary.
Among schools that award a stipend for teaching non-credit courses, the average stipend was 8,663 USD.

Copyright © 2018 AACSB International
Discipline Statistic Professor Associate Professor
Assistant Professor Instructor
Accounting
75th Percentile 207.8 167.2 181.4 94.0
Median 148.6 135.0 138.3 76.3
25th Percentile 124.0 112.1 112.1 62.6
Mean 170.7 143.3 143.7 82.1
N of Faculty 1,264 1,459 1,552 1,295
Behavioral Science/Organizational Behavior
75th Percentile 242.5 171.0 153.5 110.1
Median 172.4 127.6 123.0 80.2
25th Percentile 123.5 98.1 86.8 57.6
Mean 184.1 133.5 121.3 87.1
N of Faculty 335 354 269 156
CIS/MIS
75th Percentile 177.1 142.8 136.7 93.7
Median 141.2 121.5 113.1 73.3
25th Percentile 120.7 104.6 93.6 60.0
Mean 153.9 124.2 114.3 78.8
N of Faculty 747 721 646 549
Economics
75th Percentile 169.2 125.0 116.4 84.4
Median 124.0 101.0 93.0 67.0
25th Percentile 101.5 87.4 81.1 56.0
Mean 146.7 109.6 99.9 70.8
N of Faculty 990 830 786 382
Entrepreneurship
75th Percentile 208.2 150.0 128.8 106.6
Median 147.2 117.7 110.0 80.2
25th Percentile 119.8 97.6 84.4 65.0
Mean 166.4 123.5 107.1 88.9
N of Faculty 149 163 180 223
Finance
75th Percentile 244.6 182.9 200.0 116.1
Median 164.0 137.4 142.3 87.6
25th Percentile 127.1 111.5 110.0 65.9
Mean 189.6 148.7 148.6 93.2
N of Faculty 1,449 1,301 1,273 765
Table 6. Nine-month Full-time Faculty Salary by Discipline and Level

Copyright © 2018 AACSB International
Discipline Statistic Professor Associate Professor
Assistant Professor Instructor
General Business
75th Percentile 119.5 117.3 91.3 73.0
Median 105.1 73.1 56.4 59.0
25th Percentile 75.5 65.4 53.2 48.8
Mean 108.6 92.2 84.8 67.2
N of Faculty 12 13 11 98
Health/Hospital Administration
75th Percentile 178.0 123.0 117.2 102.1
Median 130.0 109.3 104.1 89.8
25th Percentile 103.4 98.0 87.4 73.7
Mean 147.4 114.9 101.0 90.3
N of Faculty 31 27 40 24
Hotel/Restaurant Management
75th Percentile 147.6 110.6 97.9 86.9
Median 118.4 98.2 82.8 75.7
25th Percentile 100.0 87.0 77.5 68.8
Mean 125.1 99.7 86.6 77.3
N of Faculty 47 65 57 47
Human Resource Management
75th Percentile 151.8 123.8 116.0 82.4
Median 127.5 102.7 99.0 72.0
25th Percentile 104.7 83.2 77.1 60.6
Mean 137.5 105.4 97.7 72.1
N of Faculty 194 188 136 89
International Business
75th Percentile 170.8 137.0 134.7 100.3
Median 139.5 109.0 110.3 81.3
25th Percentile 121.0 76.7 83.4 70.0
Mean 149.4 109.0 109.5 83.6
N of Faculty 157 133 84 56
Management
75th Percentile 165.8 133.3 125.0 89.4
Median 126.0 113.6 105.8 72.0
25th Percentile 104.7 96.9 89.5 57.4
Mean 139.6 118.6 108.1 77.2
N of Faculty 872 876 980 787
Discipline Statistic Professor Associate Professor
Assistant Professor Instructor
Accounting
75th Percentile 207.8 167.2 181.4 94.0
Median 148.6 135.0 138.3 76.3
25th Percentile 124.0 112.1 112.1 62.6
Mean 170.7 143.3 143.7 82.1
N of Faculty 1,264 1,459 1,552 1,295
Behavioral Science/Organizational Behavior
75th Percentile 242.5 171.0 153.5 110.1
Median 172.4 127.6 123.0 80.2
25th Percentile 123.5 98.1 86.8 57.6
Mean 184.1 133.5 121.3 87.1
N of Faculty 335 354 269 156
CIS/MIS
75th Percentile 177.1 142.8 136.7 93.7
Median 141.2 121.5 113.1 73.3
25th Percentile 120.7 104.6 93.6 60.0
Mean 153.9 124.2 114.3 78.8
N of Faculty 747 721 646 549
Economics
75th Percentile 169.2 125.0 116.4 84.4
Median 124.0 101.0 93.0 67.0
25th Percentile 101.5 87.4 81.1 56.0
Mean 146.7 109.6 99.9 70.8
N of Faculty 990 830 786 382
Entrepreneurship
75th Percentile 208.2 150.0 128.8 106.6
Median 147.2 117.7 110.0 80.2
25th Percentile 119.8 97.6 84.4 65.0
Mean 166.4 123.5 107.1 88.9
N of Faculty 149 163 180 223
Finance
75th Percentile 244.6 182.9 200.0 116.1
Median 164.0 137.4 142.3 87.6
25th Percentile 127.1 111.5 110.0 65.9
Mean 189.6 148.7 148.6 93.2
N of Faculty 1,449 1,301 1,273 765
Copyright © 2018 AACSB International
Discipline Statistic Professor Associate Professor
Assistant Professor Instructor
Marketing
75th Percentile 200.8 148.4 148.3 92.5
Median 143.1 120.5 118.8 74.3
25th Percentile 119.0 101.1 97.6 58.6
Mean 168.2 126.5 121.0 78.2
N of Faculty 1,202 1,232 1,148 710
Production/Operations Man-agement
75th Percentile 212.9 168.4 160.0 110.5
Median 153.3 133.8 128.5 85.2
25th Percentile 120.1 108.6 103.0 64.9
Mean 167.3 136.2 126.7 91.2
N of Faculty 426 325 343 209
Quantitative Methods
75th Percentile 191.5 151.7 145.0 90.0
Median 150.4 120.8 119.5 71.8
25th Percentile 118.9 96.8 98.0 57.0
Mean 161.0 126.5 120.5 75.2
N of Faculty 324 234 264 209
Strategic Management
75th Percentile 242.3 166.0 152.3 112.4
Median 163.0 128.3 118.0 83.5
25th Percentile 125.4 102.7 89.0 60.0
Mean 184.1 135.7 118.7 89.6
N of Faculty 337 346 330 128
Supply Chain/Logistics
75th Percentile 214.0 161.5 140.0 110.8
Median 164.5 131.3 124.0 86.6
25th Percentile 126.7 106.6 97.1 72.1
Mean 170.9 131.3 117.8 93.2
N of Faculty 138 179 163 80
All Other Programs
75th Percentile 147.3 112.5 96.2 81.3
Median 117.5 95.1 79.5 65.0
25th Percentile 97.6 77.5 64.8 55.0
Mean 128.1 97.1 83.9 71.5
N of Faculty 422 402 403 733
All Full-Time Faculty
75th Percentile 198.9 152.1 149.3 95.0
Median 142.1 121.5 117.0 74.6
25th Percentile 115.9 98.2 91.0 60.0
Mean 163.4 128.7 122.5 80.6
N of Faculty 9,096 8,848 8,665 6,540

Copyright © 2018 AACSB International
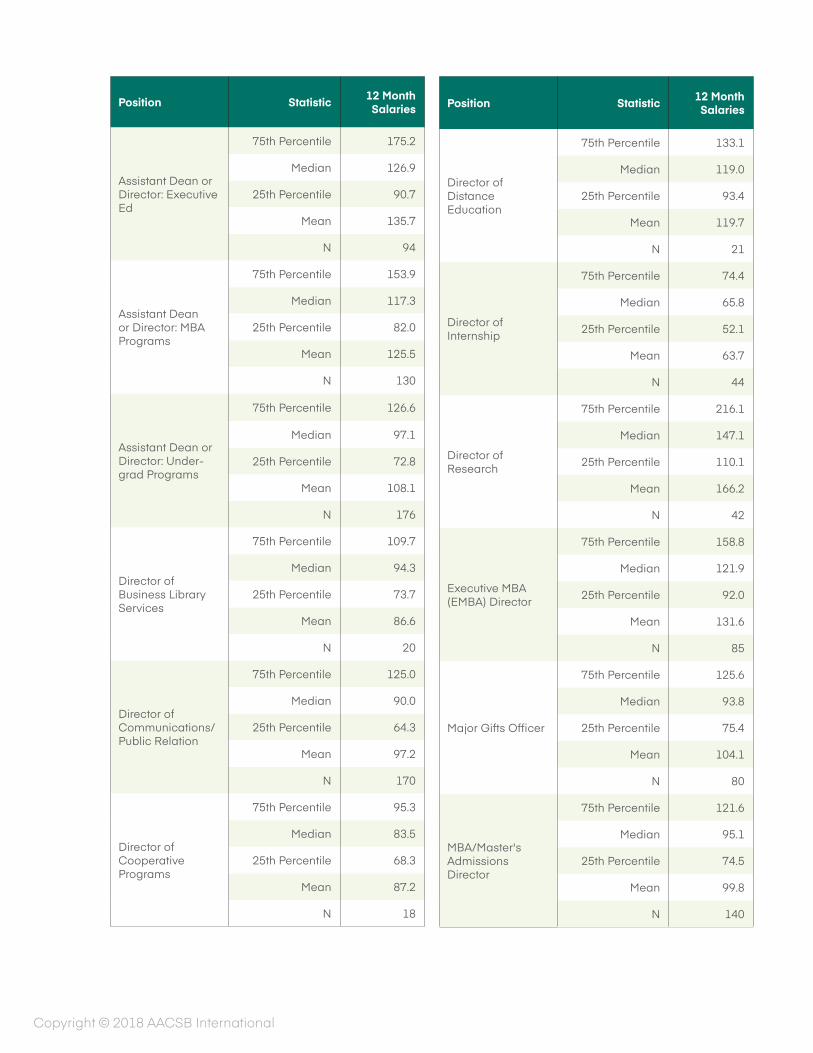
The information collected regarding administrative roles at each school is also reported at the individual level. In regard to gender, 75 percent of deans and 66 percent of associate deans were male. Overall, 51 percent of the individuals serving in administrative leadership roles (not including department chairs) were male. Also collected was information regarding the salaries for all administrative ranks. Table 7 contains information regarding salaries for administrative roles.
Position Statistic 12 Month Salaries
Dean
75th Percentile 305.0
Median 228.0
25th Percentile 180.0
Mean 260.4
N 455
Associate Dean
75th Percentile 222.9
Median 172.1
25th Percentile 136.0
Mean 183.0
N 658
Assistant Dean
75th Percentile 146.9
Median 105.4
25th Percentile 85.0
Mean 121.7
N 145
Assistant Dean or Director: Development
75th Percentile 158.0
Median 121.5
25th Percentile 92.0
Mean 139.5
N 109
Position Statistic 12 Month Salaries
Assistant Dean or Director: Finance and Admin
75th Percentile 144.6
Median 110.0
25th Percentile 78.8
Mean 115.3
N 163
Assistant Dean or Director: Info Technology
75th Percentile 128.7
Median 105.8
25th Percentile 82.6
Mean 110.6
N 131
Assistant Dean or Director of Graduate Programs
75th Percentile 144.7
Median 115.0
25th Percentile 78.7
Mean 120.0
N 164
Assistant Dean or Director: Career Services/Place
75th Percentile 123.7
Median 95.6
25th Percentile 72.0
Mean 101.7
N 174
Table 7. Twelve-month Administrator Salary by Position
Copyright © 2018 AACSB International
Position Statistic 12 Month Salaries
Assistant Dean or Director: Executive Ed
75th Percentile 175.2
Median 126.9
25th Percentile 90.7
Mean 135.7
N 94
Assistant Dean or Director: MBA Programs
75th Percentile 153.9
Median 117.3
25th Percentile 82.0
Mean 125.5
N 130
Assistant Dean or Director: Under-grad Programs
75th Percentile 126.6
Median 97.1
25th Percentile 72.8
Mean 108.1
N 176
Director of Business Library Services
75th Percentile 109.7
Median 94.3
25th Percentile 73.7
Mean 86.6
N 20
Director of Communications/Public Relation
75th Percentile 125.0
Median 90.0
25th Percentile 64.3
Mean 97.2
N 170
Director of Cooperative Programs
75th Percentile 95.3
Median 83.5
25th Percentile 68.3
Mean 87.2
N 18
Position Statistic 12 Month Salaries
Director of Distance Education
75th Percentile 133.1
Median 119.0
25th Percentile 93.4
Mean 119.7
N 21
Director of Internship
75th Percentile 74.4
Median 65.8
25th Percentile 52.1
Mean 63.7
N 44
Director of Research
75th Percentile 216.1
Median 147.1
25th Percentile 110.1
Mean 166.2
N 42
Executive MBA (EMBA) Director
75th Percentile 158.8
Median 121.9
25th Percentile 92.0
Mean 131.6
N 85
Major Gifts Officer
75th Percentile 125.6
Median 93.8
25th Percentile 75.4
Mean 104.1
N 80
MBA/Master's Admissions Director
75th Percentile 121.6
Median 95.1
25th Percentile 74.5
Mean 99.8
N 140

Copyright © 2018 AACSB International
Position Statistic 12 Month Salaries
Director of Distance Education
75th Percentile 133.1
Median 119.0
25th Percentile 93.4
Mean 119.7
N 21
Director of Internship
75th Percentile 74.4
Median 65.8
25th Percentile 52.1
Mean 63.7
N 44
Director of Research
75th Percentile 216.1
Median 147.1
25th Percentile 110.1
Mean 166.2
N 42
Executive MBA (EMBA) Director
75th Percentile 158.8
Median 121.9
25th Percentile 92.0
Mean 131.6
N 85
Major Gifts Officer
75th Percentile 125.6
Median 93.8
25th Percentile 75.4
Mean 104.1
N 80
MBA/Master's Admissions Director
75th Percentile 121.6
Median 95.1
25th Percentile 74.5
Mean 99.8
N 140
Position Statistic 12 Month Salaries
School of Accounting, Director, etc.
75th Percentile 250.6
Median 184.5
25th Percentile 145.5
Mean 201.9
N 26
Small Business Administration Director
75th Percentile 116.4
Median 84.7
25th Percentile 73.6
Mean 94.2
N 71
Other
75th Percentile 104.0
Median 70.2
25th Percentile 49.2
Mean 83.0
N 969
By expanding our survey, the information we now collect via the Staff Compensation and Demographic Survey (SCDS) is more robust and comprehensive, containing not only salary information for full-time faculty and administrators but also additional information regarding part-time faculty and staff demographics. By adding the year hired as one of our person-level demographics, in the future we will be able to track annual cohorts at the school level. In addition, by taking all faculty-related sections from other surveys and incorporating them into one collection, we can now incorporate more efficient and pragmatic validation processes.
Full overview reports are available to all participating schools that provide detailed breakouts by field/discipline, accreditation status, and institutional control (public vs. private), in addition to custom reports available via the AACSB DataDirect benchmarking tools. The overview reports are available for purchase.
For additional requests and questions, please contact us at [email protected].