Embed Size (px)
Citation preview
2016Committed to People, Committed to the Future.
Year ended March 31, 2016 Financial Review Annual Report
Paper Printing
Paper certi�ed by Forest Stewardship Council (FSC) is used, which is made from wood from FSC-certi�ed forests.
We believe that it is important to make proactive use of domestic wood products and to grow forests, and we support the forestry Agency’s e�orts to promote “tree trainer activies”. Domestic timber provided the raw material for the paper on which this report is printed, and its use contribused to increased absorption of CO2 by native forests.
Waterless PrintingWaterless printing, a printing process that eliminates the use of water, is adopted, taking advantage of the characteristics of printing plates made of ink-shedding material.
Non-VOC Ink100% vegetable ink containing no volatile organic compounds (VOCs) is used.
Toshiba Group supports forest thinning project in Misawa City, Aomori prefecture, aiming to preserve the nature for the next generation.
Contacts:
Tree use cycle mark
The production and printing of this report re�ect the following considerations :
Public Relations & Investor Relations DivisionTel: +81-3-3457-2096 Fax: +81-3-5444-9202
Inquiry page on Investor RelationsURL http://www.toshiba.co.jp/about/ir/en/contact.htm
1-1, Shibaura 1-chome, Minato-ku, Tokyo,105-8001, Japan
Use of FSC-certi�ed Paper A-(2)-060001Use of Forest Thinning Support Paper
02 TOSHIBA Annual Report 2016
Management’s Discussion and Analysis
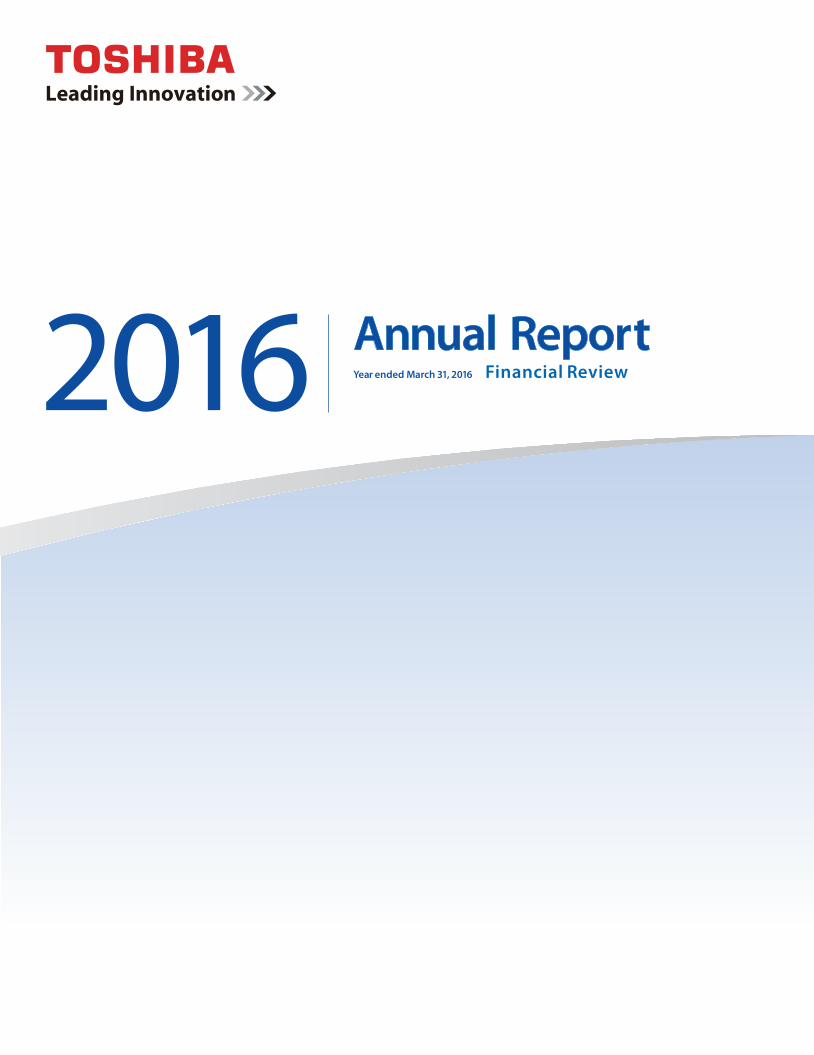
FIVE-YEAR SUMMARYToshiba Corporation and SubsidiariesYears ended March 31
Millions of yen,except per share amounts and ratio
2016 2015 2014 2013 2012
Net sales ¥ 5,668,688 ¥ 6,114,682 ¥ 5,904,288 ¥ 5,168,398 ¥ 5,469,119Operating income (loss) (Note 4) (708,738) 188,409 229,364 72,176 97,846Income (Loss) from continuing operations, before income
taxes and noncontrolling interests (633,145) 156,615 158,546 51,418 47,341
Net income (loss) attributable to shareholders of the Company (460,013) (37,825) 60,240 13,425 3,194
Comprehensive income (loss) attributable to shereholders of the Company (752,518) 90,638 236,392 179,852 (42,752)
Equity attributable to shareholders of the Company 328,874 1,083,996 1,027,189 824,584 718,664Total equity (Note 5) 672,258 1,565,357 1,445,994 1,205,823 1,083,858
Total assets 5,433,341 6,334,778 6,172,519 6,021,603 5,673,064Per share of common stock: (Yen) (Note 6) 77.67 256.01 242.58 194.72 169.70Earnings (loss) per share attributable to shareholders of the
Company (Yen) (Notes 7 and 8)−Basic (108.64) (8.93) 14.23 3.17 0.75−Diluted − − − − 0.74
Shareholdrers’ equity ratio (%) (Note 6) 6.1 17.1 16.6 13.7 12.7Return on equity ratio (%) (Note 6) (65.1) (3.6) 6.5 1.7 0.4Price-to-earnings ratio (PER) (Note9) − − 30.72 148.89 482.64Net cash provided by (used in) operating activities (1,230) 330,442 284,132 132,316 337,497Net cash provided by (used in) investing activities 653,442 (190,130) (244,101) (196,347) (377,227)Net cash provided by (used in) financing activities 135,747 (125,795) (89,309) 41,772 (2,740)Cash and cash equivalents at end of year 975,529 199,366 171,340 209,169 214,305Number of employees (Note 10) 187,809 198,741 200,260 206,087 209,784Notes: 1) Toshiba Group’s Consolidated Financial Statements are based on US generally accepted accounting princiles. 2) The Healthcare Systems & Services segment and Home Appriances business are classified as discontinued operations in accordance with ASC 205-20 “Presentation of Financial Statements -
Discontinued Operations”. Results of the past fiscal year have been revised to reflect these changes. 3) Consumption tax is not included in the Net sales. 4) Operating income (loss) is derived by deducting the cost of sales, selling, general and administrative expenses and impairment loss on goodwill from net sales, and reported as a measurement of
segment profit or loss. This result is regularly reviewed to support decision-making in allocation of resources and to assess performance. Certain operating expenses such as restructuring charges and legal settlement costs are not charged to operating income (loss). 5) Total equity is the sum of Equity attributable to shareholders of the Company and Equity attributable to noncontrolling interests. 6) The calculation of “Per share of common stock”, “Shareholders’ equity ratio” and “Return on equity ratio” is based on Equity attributable to shareholders of the Company of consolidated balance
sheets. 7) Basic earnings (loss) per share attributable to shareholders of the Company (EPS) are computed based on the weighted-average number of shares of common stock outstanding during each
period. Diluted EPS assumes the dilution that could occur if convertible bonds were converted or stock acquisition rights were exercised to issue common stock, unless their inclusion would have an
antidilutive effect. 8) Diluted net earnings per share attributable to shareholders of the Company for the years ended on or after March 31, 2013 have been omitted because the Company did not have potential
common stock that were outstanding for the period. 9) Price-to-earnings ratio (PER) for the years ended on March 31, 2016 and 2015 have been omitted because of Net loss attributable to shareholders of the Company.
10) The number of employees are the sum of the workers who are expected to work or have worked over a year between the regular employees and fixed-term emproyees.
2. Management’s Discussion and Analysis 18. Consolidated Balance Sheets 20. Consolidated Statements of Operations21. Consolidated Statements of Comprehensive Income 22. Consolidated Statements of Equity24. Consolidated Statements of Cash Flows 25. Notes to Consolidated Financial Statements83. Independent Auditor’s Report
03TOSHIBA Annual Report 2016
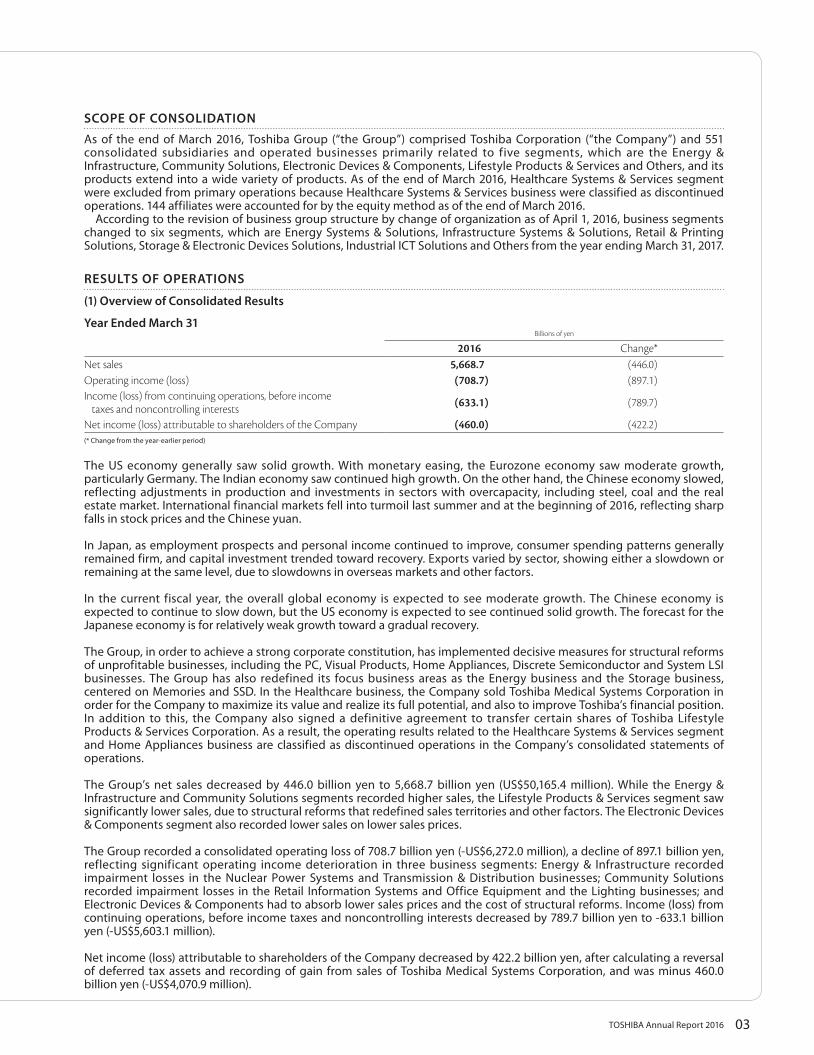
SCOPE OF CONSOLIDATION
As of the end of March 2016, Toshiba Group (“the Group”) comprised Toshiba Corporation (“the Company”) and 551 consolidated subsidiaries and operated businesses primarily related to five segments, which are the Energy & Infrastructure, Community Solutions, Electronic Devices & Components, Lifestyle Products & Services and Others, and its products extend into a wide variety of products. As of the end of March 2016, Healthcare Systems & Services segment were excluded from primary operations because Healthcare Systems & Services business were classified as discontinued operations. 144 affiliates were accounted for by the equity method as of the end of March 2016. According to the revision of business group structure by change of organization as of April 1, 2016, business segments changed to six segments, which are Energy Systems & Solutions, Infrastructure Systems & Solutions, Retail & Printing Solutions, Storage & Electronic Devices Solutions, Industrial ICT Solutions and Others from the year ending March 31, 2017.
RESULTS OF OPERATIONS
(1) Overview of Consolidated Results
Year Ended March 31Billions of yen
2016 Change*Net sales 5,668.7 (446.0)Operating income (loss) (708.7) (897.1)Income (loss) from continuing operations, before income
taxes and noncontrolling interests (633.1) (789.7)
Net income (loss) attributable to shareholders of the Company (460.0) (422.2)(* Change from the year-earlier period)
The US economy generally saw solid growth. With monetary easing, the Eurozone economy saw moderate growth, particularly Germany. The Indian economy saw continued high growth. On the other hand, the Chinese economy slowed, reflecting adjustments in production and investments in sectors with overcapacity, including steel, coal and the real estate market. International financial markets fell into turmoil last summer and at the beginning of 2016, reflecting sharp falls in stock prices and the Chinese yuan.
In Japan, as employment prospects and personal income continued to improve, consumer spending patterns generally remained firm, and capital investment trended toward recovery. Exports varied by sector, showing either a slowdown or remaining at the same level, due to slowdowns in overseas markets and other factors.
In the current fiscal year, the overall global economy is expected to see moderate growth. The Chinese economy is expected to continue to slow down, but the US economy is expected to see continued solid growth. The forecast for the Japanese economy is for relatively weak growth toward a gradual recovery.
The Group, in order to achieve a strong corporate constitution, has implemented decisive measures for structural reforms of unprofitable businesses, including the PC, Visual Products, Home Appliances, Discrete Semiconductor and System LSI businesses. The Group has also redefined its focus business areas as the Energy business and the Storage business, centered on Memories and SSD. In the Healthcare business, the Company sold Toshiba Medical Systems Corporation in order for the Company to maximize its value and realize its full potential, and also to improve Toshiba’s financial position. In addition to this, the Company also signed a definitive agreement to transfer certain shares of Toshiba Lifestyle Products & Services Corporation. As a result, the operating results related to the Healthcare Systems & Services segment and Home Appliances business are classified as discontinued operations in the Company’s consolidated statements of operations.
The Group’s net sales decreased by 446.0 billion yen to 5,668.7 billion yen (US$50,165.4 million). While the Energy & Infrastructure and Community Solutions segments recorded higher sales, the Lifestyle Products & Services segment saw significantly lower sales, due to structural reforms that redefined sales territories and other factors. The Electronic Devices & Components segment also recorded lower sales on lower sales prices.
The Group recorded a consolidated operating loss of 708.7 billion yen (-US$6,272.0 million), a decline of 897.1 billion yen, reflecting significant operating income deterioration in three business segments: Energy & Infrastructure recorded impairment losses in the Nuclear Power Systems and Transmission & Distribution businesses; Community Solutions recorded impairment losses in the Retail Information Systems and Office Equipment and the Lighting businesses; and Electronic Devices & Components had to absorb lower sales prices and the cost of structural reforms. Income (loss) from continuing operations, before income taxes and noncontrolling interests decreased by 789.7 billion yen to -633.1 billion yen (-US$5,603.1 million).
Net income (loss) attributable to shareholders of the Company decreased by 422.2 billion yen, after calculating a reversal of deferred tax assets and recording of gain from sales of Toshiba Medical Systems Corporation, and was minus 460.0 billion yen (-US$4,070.9 million).
04 TOSHIBA Annual Report 2016
Management’s Discussion and Analysis
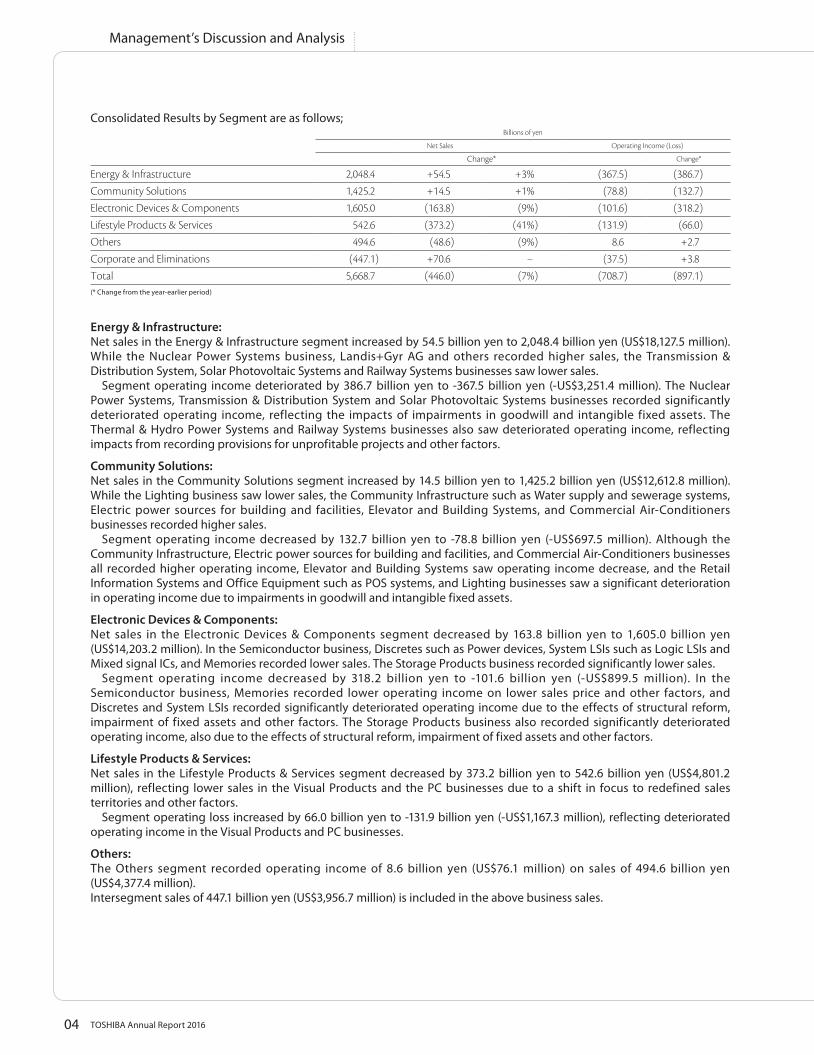
Consolidated Results by Segment are as follows;Billions of yen
Net Sales Operating Income (Loss)
Change* Change*
Energy & Infrastructure 2,048.4 +54.5 +3% (367.5) (386.7)Community Solutions 1,425.2 +14.5 +1% (78.8) (132.7)Electronic Devices & Components 1,605.0 (163.8) (9%) (101.6) (318.2)Lifestyle Products & Services 542.6 (373.2) (41%) (131.9) (66.0)Others 494.6 (48.6) (9%) 8.6 +2.7Corporate and Eliminations (447.1) +70.6 − (37.5) +3.8Total 5,668.7 (446.0) (7%) (708.7) (897.1)(* Change from the year-earlier period)
Energy & Infrastructure:Net sales in the Energy & Infrastructure segment increased by 54.5 billion yen to 2,048.4 billion yen (US$18,127.5 million). While the Nuclear Power Systems business, Landis+Gyr AG and others recorded higher sales, the Transmission & Distribution System, Solar Photovoltaic Systems and Railway Systems businesses saw lower sales. Segment operating income deteriorated by 386.7 billion yen to -367.5 billion yen (-US$3,251.4 million). The Nuclear Power Systems, Transmission & Distribution System and Solar Photovoltaic Systems businesses recorded significantly deteriorated operating income, reflecting the impacts of impairments in goodwill and intangible fixed assets. The Thermal & Hydro Power Systems and Railway Systems businesses also saw deteriorated operating income, reflecting impacts from recording provisions for unprofitable projects and other factors.
Community Solutions:Net sales in the Community Solutions segment increased by 14.5 billion yen to 1,425.2 billion yen (US$12,612.8 million). While the Lighting business saw lower sales, the Community Infrastructure such as Water supply and sewerage systems, Electric power sources for building and facilities, Elevator and Building Systems, and Commercial Air-Conditioners businesses recorded higher sales. Segment operating income decreased by 132.7 billion yen to -78.8 billion yen (-US$697.5 million). Although the Community Infrastructure, Electric power sources for building and facilities, and Commercial Air-Conditioners businesses all recorded higher operating income, Elevator and Building Systems saw operating income decrease, and the Retail Information Systems and Office Equipment such as POS systems, and Lighting businesses saw a significant deterioration in operating income due to impairments in goodwill and intangible fixed assets.
Electronic Devices & Components:Net sales in the Electronic Devices & Components segment decreased by 163.8 billion yen to 1,605.0 billion yen (US$14,203.2 million). In the Semiconductor business, Discretes such as Power devices, System LSIs such as Logic LSIs and Mixed signal ICs, and Memories recorded lower sales. The Storage Products business recorded significantly lower sales. Segment operating income decreased by 318.2 billion yen to -101.6 billion yen (-US$899.5 million). In the Semiconductor business, Memories recorded lower operating income on lower sales price and other factors, and Discretes and System LSIs recorded significantly deteriorated operating income due to the effects of structural reform, impairment of fixed assets and other factors. The Storage Products business also recorded significantly deteriorated operating income, also due to the effects of structural reform, impairment of fixed assets and other factors.
Lifestyle Products & Services:Net sales in the Lifestyle Products & Services segment decreased by 373.2 billion yen to 542.6 billion yen (US$4,801.2 million), reflecting lower sales in the Visual Products and the PC businesses due to a shift in focus to redefined sales territories and other factors. Segment operating loss increased by 66.0 billion yen to -131.9 billion yen (-US$1,167.3 million), reflecting deteriorated operating income in the Visual Products and PC businesses.
Others:The Others segment recorded operating income of 8.6 billion yen (US$76.1 million) on sales of 494.6 billion yen (US$4,377.4 million).Intersegment sales of 447.1 billion yen (US$3,956.7 million) is included in the above business sales.
05TOSHIBA Annual Report 2016
(2) Cash FlowsIn the fiscal year under review, net cash used in operating activities amounted to 1.2 billion yen, a decrease of 331.6 billion yen from net cash provided by operating activities of 330.4 billion yen in the previous year due to deterioration of net income (loss). Net cash provided by investing activities amounted to 653.4 billion yen, an increase of 843.5 billion yen from -190.1 billion yen in the previous year due to a sale of Toshiba Medical Systems Corporation. As a result of the foregoing, free cash flow increased by 511.9 billion yen to 652.2 billion yen (US$5,771.8 million) from 140.3 billion yen in the previous year. Net cash provided by financing activities amounted to 135.7 billion yen, an increase of 261.5 billion yen from -125.8 billion yen in the previous year. The effect of exchange rate changes was to decrease cash by 11.8 billion yen. Cash and cash equivalents at the end of the fiscal year increased 776.1 billion yen, from 199.4 billion yen at the end of the previous fiscal year to 975.5 billion yen. In addition, the balance of cash and cash equivalents in continuing operations amounted to 969.7 billion yen, deducting 5.8 billion yen of balance of cash and cash equivalents at the end of fiscal year in discontinued operations.
Note:Toshiba’s consolidated financial statements are based on U.S. generally accepted accounting principles (“GAAP”). Operating income (loss) is derived by deducting the cost of sales and selling, general and administrative expenses from net sales. This result is regularly reviewed to support decision-making in allocations of resources and to assess performance. Certain operating expenses such as restructuring charges, litigation settlement and other costs are not charged to operating income (loss). The Healthcare Systems & Services segment and the Home Appliances business are classified as discontinued operations in accordance with ASC 205-20 “Presentation of Financial Statements - Discontinued Operations”. The results of these businesses have been excluded from net sales, operating income (loss), and income (loss) from continuing operations, before income taxes and noncontrolling interests. Net income of the Group is calculated by reflecting the results of these businesses to income (loss) from continuing operations, before income taxes and noncontrolling interests. In addition, these businesses are also classified as discontinued operations for the Group’s consolidated balance sheets and are indicated separately. Results of the past fiscal year have been revised to reflect these changes.
DIVIDENDWhile giving full consideration to such factors as the strategic investments necessary to secure medium- to long-term growth, the Company seeks to achieve continuous increases in its actual dividend payments, in line with a payout ratio in the region of 30 percent, on a consolidated basis. It is highly regrettable that the Group posted a record operating loss and net loss for the fiscal year ended March 31, 2016. In light of this situation, the Company decided not to pay dividends of surplus for the fiscal year under review.
06 TOSHIBA Annual Report 2016
Management’s Discussion and Analysis
RESEARCH AND DEVELOPMENT
The Group is aiming to solve social challenges with a focus on Energy, Storage and Social Infrastructure areas and realize a safe, secure and comfortable society. The Group produces a synergistic effect and generates new value by being among the first to identify the society’s potential needs and challenges, creating innovative technologies and utilizing the Group’s wide range of technological assets in many fields. In the Energy area, further safe and stable supply and efficient use of traditional energy are promoted. In addition, the Group will control CO2 emissions by providing technologies and services for generating, transmitting and storing clean energy to the world to contribute to the realization of a low-carbon society. In the Storage area, the Group will contribute to the creation of infrastructure for the information-driven society by further strengthening large-capacity storage technologies and providing information systems and cloud foundations based on those technologies in order to deal with the dramatically increasing information amount. In the Social Infrastructure area, the Group provides highly reliable technologies and services to a broad range of customers who support the society and the industry in the field of buildings and facilities, public infrastructure, etc., aiming to realize a secure, safe and reliable society.
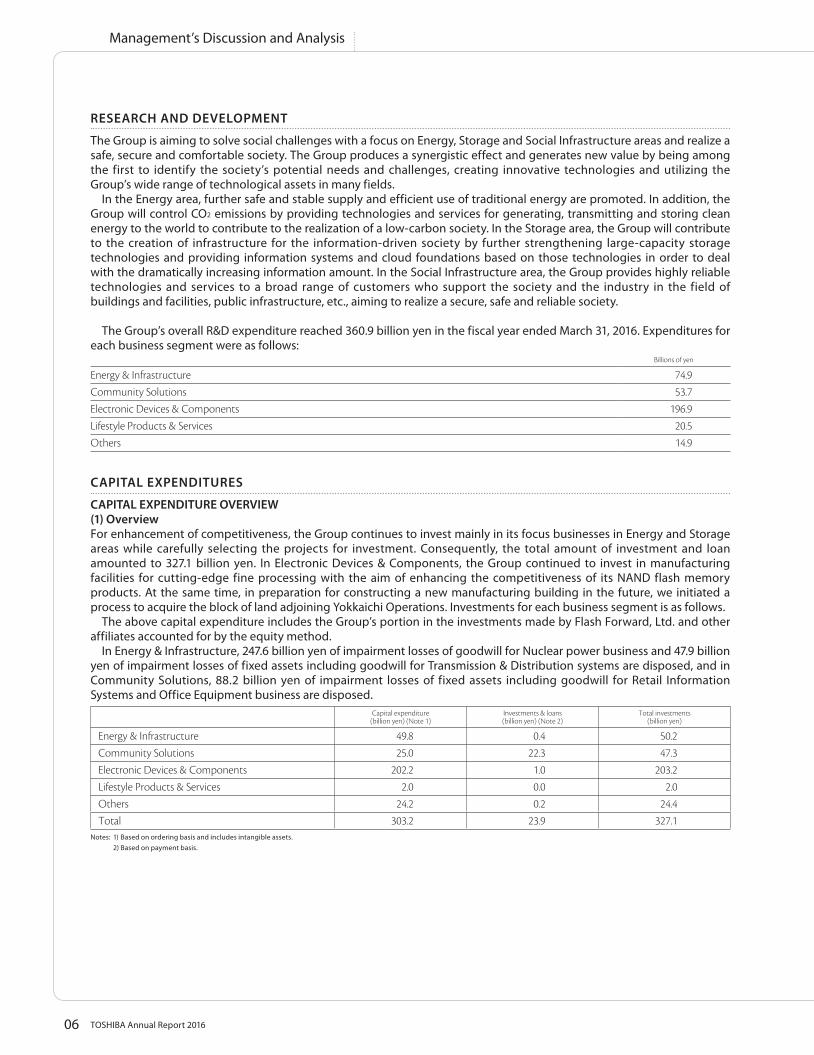
The Group’s overall R&D expenditure reached 360.9 billion yen in the fiscal year ended March 31, 2016. Expenditures for each business segment were as follows:
Billions of yen
Energy & Infrastructure 74.9Community Solutions 53.7Electronic Devices & Components 196.9Lifestyle Products & Services 20.5Others 14.9
CAPITAL EXPENDITURES
CAPITAL EXPENDITURE OVERVIEW(1) OverviewFor enhancement of competitiveness, the Group continues to invest mainly in its focus businesses in Energy and Storage areas while carefully selecting the projects for investment. Consequently, the total amount of investment and loan amounted to 327.1 billion yen. In Electronic Devices & Components, the Group continued to invest in manufacturing facilities for cutting-edge fine processing with the aim of enhancing the competitiveness of its NAND flash memory products. At the same time, in preparation for constructing a new manufacturing building in the future, we initiated a process to acquire the block of land adjoining Yokkaichi Operations. Investments for each business segment is as follows. The above capital expenditure includes the Group’s portion in the investments made by Flash Forward, Ltd. and other affiliates accounted for by the equity method. In Energy & Infrastructure, 247.6 billion yen of impairment losses of goodwill for Nuclear power business and 47.9 billion yen of impairment losses of fixed assets including goodwill for Transmission & Distribution systems are disposed, and in Community Solutions, 88.2 billion yen of impairment losses of fixed assets including goodwill for Retail Information Systems and Office Equipment business are disposed.
Capital expenditure(billion yen) (Note 1)
Investments & loans(billion yen) (Note 2)
Total investments(billion yen)
Energy & Infrastructure 49.8 0.4 50.2Community Solutions 25.0 22.3 47.3Electronic Devices & Components 202.2 1.0 203.2Lifestyle Products & Services 2.0 0.0 2.0Others 24.2 0.2 24.4Total 303.2 23.9 327.1
Notes: 1) Based on ordering basis and includes intangible assets. 2) Based on payment basis.
07TOSHIBA Annual Report 2016
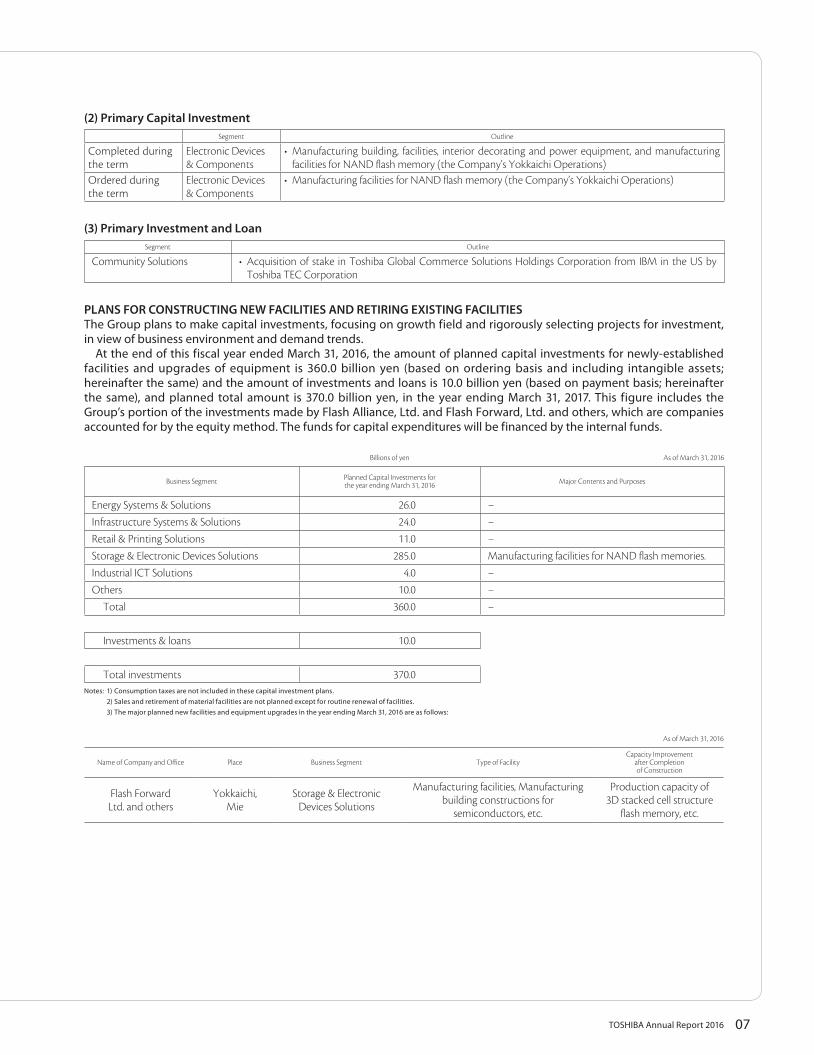
(2) Primary Capital InvestmentSegment Outline
Completed duringthe term
Electronic Devices& Components
• Manufacturing building, facilities, interior decorating and power equipment, and manufacturing facilities for NAND flash memory (the Company’s Yokkaichi Operations)
Ordered duringthe term
Electronic Devices& Components
• Manufacturing facilities for NAND flash memory (the Company’s Yokkaichi Operations)
(3) Primary Investment and LoanSegment Outline
Community Solutions • Acquisition of stake in Toshiba Global Commerce Solutions Holdings Corporation from IBM in the US by Toshiba TEC Corporation
PLANS FOR CONSTRUCTING NEW FACILITIES AND RETIRING EXISTING FACILITIESThe Group plans to make capital investments, focusing on growth field and rigorously selecting projects for investment, in view of business environment and demand trends. At the end of this fiscal year ended March 31, 2016, the amount of planned capital investments for newly-established facilities and upgrades of equipment is 360.0 billion yen (based on ordering basis and including intangible assets; hereinafter the same) and the amount of investments and loans is 10.0 billion yen (based on payment basis; hereinafter the same), and planned total amount is 370.0 billion yen, in the year ending March 31, 2017. This figure includes the Group’s portion of the investments made by Flash Alliance, Ltd. and Flash Forward, Ltd. and others, which are companies accounted for by the equity method. The funds for capital expenditures will be financed by the internal funds.
Billions of yen As of March 31, 2016
Business Segment Planned Capital Investments forthe year ending March 31, 2016 Major Contents and Purposes
Energy Systems & Solutions 26.0 −Infrastructure Systems & Solutions 24.0 −Retail & Printing Solutions 11.0 −Storage & Electronic Devices Solutions 285.0 Manufacturing facilities for NAND flash memories.Industrial ICT Solutions 4.0 −Others 10.0 −
Total 360.0 −
Investments & loans 10.0
Total investments 370.0Notes: 1) Consumption taxes are not included in these capital investment plans. 2) Sales and retirement of material facilities are not planned except for routine renewal of facilities. 3) The major planned new facilities and equipment upgrades in the year ending March 31, 2016 are as follows:
As of March 31, 2016
Name of Company and Office Place Business Segment Type of FacilityCapacity Improvement
after Completionof Construction
Flash ForwardLtd. and others
Yokkaichi, Mie
Storage & Electronic Devices Solutions
Manufacturing facilities, Manufacturing building constructions for
semiconductors, etc.
Production capacity of 3D stacked cell structure
flash memory, etc.
08 TOSHIBA Annual Report 2016
Management’s Discussion and Analysis
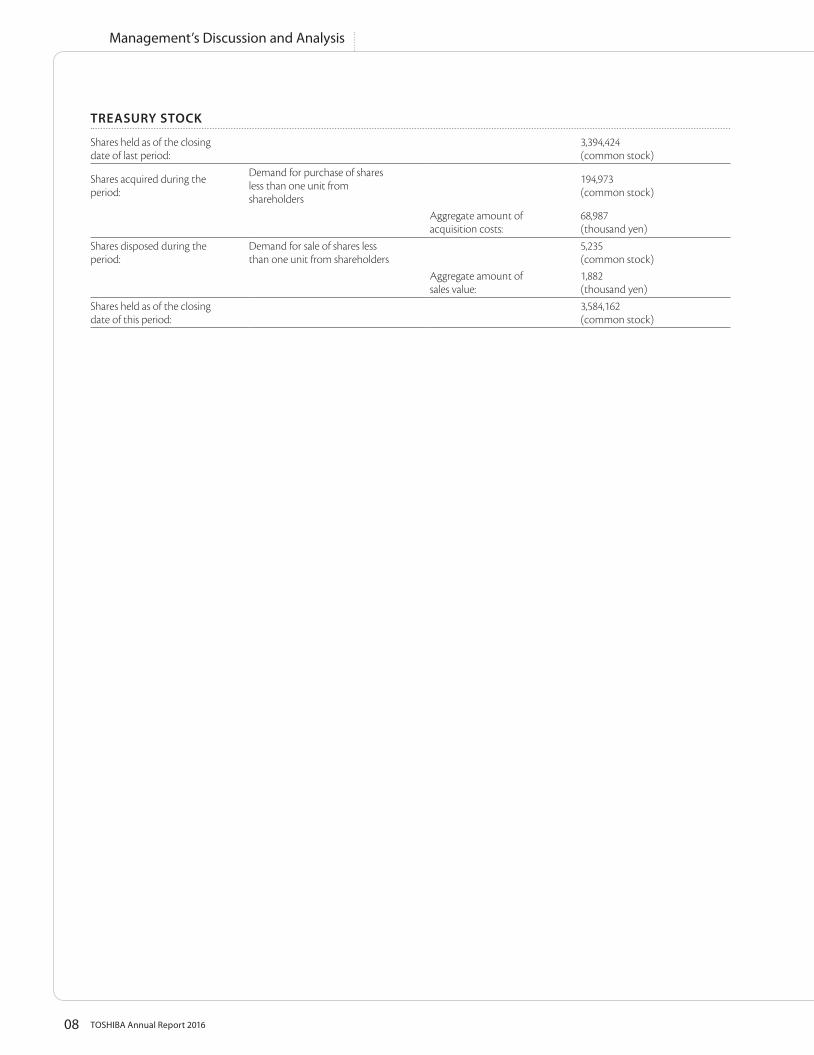
TREASURY STOCK
Shares held as of the closingdate of last period:
3,394,424(common stock)
Shares acquired during theperiod:
Demand for purchase of sharesless than one unit fromshareholders
194,973(common stock)
Aggregate amount ofacquisition costs:
68,987(thousand yen)
Shares disposed during theperiod:
Demand for sale of shares lessthan one unit from shareholders
5,235(common stock)
Aggregate amount ofsales value:
1,882(thousand yen)
Shares held as of the closingdate of this period:
3,584,162(common stock)
09TOSHIBA Annual Report 2016
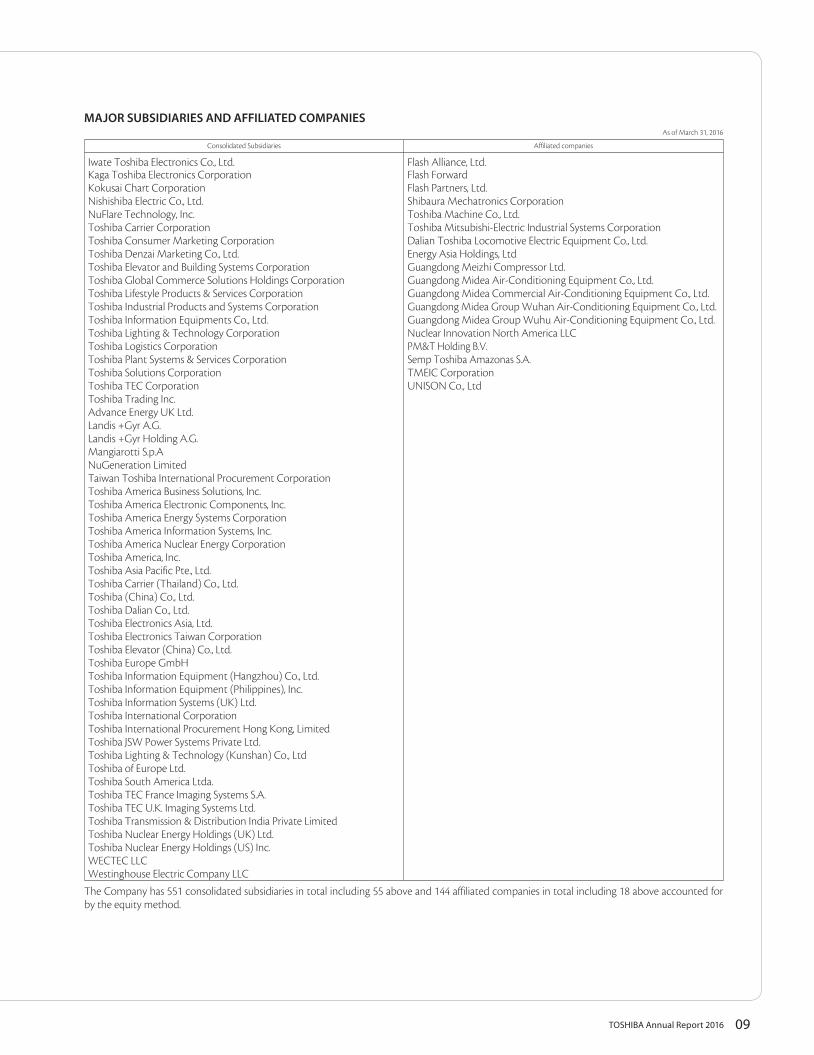
MAJOR SUBSIDIARIES AND AFFILIATED COMPANIESAs of March 31, 2016
Consolidated Subsidiaries Affiliated companies
Iwate Toshiba Electronics Co., Ltd. Flash Alliance, Ltd.Kaga Toshiba Electronics Corporation Flash ForwardKokusai Chart Corporation Flash Partners, Ltd.Nishishiba Electric Co., Ltd. Shibaura Mechatronics CorporationNuFlare Technology, Inc. Toshiba Machine Co., Ltd.Toshiba Carrier Corporation Toshiba Mitsubishi-Electric Industrial Systems CorporationToshiba Consumer Marketing Corporation Dalian Toshiba Locomotive Electric Equipment Co., Ltd.Toshiba Denzai Marketing Co., Ltd. Energy Asia Holdings, LtdToshiba Elevator and Building Systems Corporation Guangdong Meizhi Compressor Ltd.Toshiba Global Commerce Solutions Holdings Corporation Guangdong Midea Air-Conditioning Equipment Co., Ltd.Toshiba Lifestyle Products & Services Corporation Guangdong Midea Commercial Air-Conditioning Equipment Co., Ltd.Toshiba Industrial Products and Systems Corporation Guangdong Midea Group Wuhan Air-Conditioning Equipment Co., Ltd.Toshiba Information Equipments Co., Ltd. Guangdong Midea Group Wuhu Air-Conditioning Equipment Co., Ltd.Toshiba Lighting & Technology Corporation Nuclear Innovation North America LLCToshiba Logistics Corporation PM&T Holding B.V.Toshiba Plant Systems & Services Corporation Semp Toshiba Amazonas S.A.Toshiba Solutions Corporation TMEIC CorporationToshiba TEC Corporation UNISON Co., LtdToshiba Trading Inc.Advance Energy UK Ltd.Landis +Gyr A.G.Landis +Gyr Holding A.G.Mangiarotti S.p.ANuGeneration LimitedTaiwan Toshiba International Procurement CorporationToshiba America Business Solutions, Inc.Toshiba America Electronic Components, Inc.Toshiba America Energy Systems CorporationToshiba America Information Systems, Inc.Toshiba America Nuclear Energy CorporationToshiba America, Inc.Toshiba Asia Pacific Pte., Ltd.Toshiba Carrier (Thailand) Co., Ltd.Toshiba (China) Co., Ltd.Toshiba Dalian Co., Ltd.Toshiba Electronics Asia, Ltd.Toshiba Electronics Taiwan CorporationToshiba Elevator (China) Co., Ltd.Toshiba Europe GmbHToshiba Information Equipment (Hangzhou) Co., Ltd.Toshiba Information Equipment (Philippines), Inc.Toshiba Information Systems (UK) Ltd.Toshiba International CorporationToshiba International Procurement Hong Kong, LimitedToshiba JSW Power Systems Private Ltd.Toshiba Lighting & Technology (Kunshan) Co., LtdToshiba of Europe Ltd.Toshiba South America Ltda.Toshiba TEC France Imaging Systems S.A.Toshiba TEC U.K. Imaging Systems Ltd.Toshiba Transmission & Distribution India Private LimitedToshiba Nuclear Energy Holdings (UK) Ltd.Toshiba Nuclear Energy Holdings (US) Inc.WECTEC LLCWestinghouse Electric Company LLC
The Company has 551 consolidated subsidiaries in total including 55 above and 144 affiliated companies in total including 18 above accounted for by the equity method.
10 TOSHIBA Annual Report 2016
Management’s Discussion and Analysis
RISK FACTORS RELATING THE GROUP AND ITS BUSINESS
The business areas of energy, infrastructure and storage, on which the Group focuses, require highly advanced technology for their operation. At the same time, the Group faces fierce global competition. Under such circumstance, major risk factors related to the Group recognized by the Company are described below. However, they should not be regarded as a complete and comprehensive statement of risk factors relating to the Group, and there are unforeseeable risk factors other than those described below. The actual occurrence of any of those risk factors may adversely affect the Group’s operating results and financial condition. The risks described below are identified by the Group based on information available to the Group as of June 22, 2016 and involve inherent uncertainties, and, therefore, the actual results may differ.
1. Risks related to management policy(1) Strategic concentrated investmentThe Group now focuses its capital expenditure and its investments and lending on the memory area. However, this area may not grow as anticipated, the Group may not maintain or strengthen its competitive power in such area, or the relevant investments may not fully generate the anticipated level of profit.
(2) Success of strategic business alliances and acquisitionsThe Group has actively promoted business alliances with other companies, including the formation of joint ventures, and acquisitions, in order to grow new businesses in research and development, production, marketing and various other areas. If the Group has any disagreement with its partner in a business alliance or an acquisition in respect of financing, technological management, product development, management strategies or otherwise, such business alliance may be terminated or such business alliance or acquisition may not have the expected effects. In addition, additional capital expenditures and provision of guaranties may be needed to meet the obligations for such partnership business that may be incurred due to the deterioration of the financial condition of the partner, as well as for other reasons, and as a result, the Group’s operating results and financial condition may be adversely affected.
(3) Business structure reformationThe Group as a whole forced through large scale business structure reform in the fiscal year ended March 31, 2016 (“FY2015”), and the Group has incurred a large amount of expenses for such business structure reform. Now we have some good prospect that we can complete our business structure reform. However, in the event of the failure of the reform programs to produce the expected results, the Group may incur additional expenses for business structure reform due to the necessity of additional measures and in such case the Group’s operating results or financial condition may be adversely affected.
2. Risks related to financial condition, results of operations and cash flow(1) Business environment of the Energy Systems & Solutions businessA significant portion of the net sales in the Energy Systems & Solutions business is attributable to sales related to capital expenditures by the private sector centering on operators of electricity utilities in Japan and overseas. Accordingly, this business could be affected by trends in such capital expenditures, and low levels of private capital expenditures due to the economic recession, and exchange rate fluctuations may have a negative impact on this business. Furthermore, this business promotes and involves the supply of products and services for large-scale projects on a worldwide basis. Post order changes in the specifications or other terms, delays, appreciation of material costs, changes to and suspension or stoppage of plans for various reasons, including policy changes, natural and other disasters and other factors, may adversely and substantially affect the progress of such projects. In addition, in the projects where the percentage-of-completion method is used for revenue recognition, the Group may retroactively reassess profits that had been recorded as accrued and record them as losses if, among other things, the original estimate is underestimated, the expected profits from such projects do not meet original expectations, or the projects are delayed or cancelled for some reason. In the past, the Group recorded losses on certain projects. Furthermore, it may not be possible to pass on to the customer or others any additional costs incurred due to the stoppage of the project, changes in regulations or other terms, delays in the work process, or unexpected events specific to first models and such costs may not be collected, or a dispute may arise over such costs. In fact, there are certain projects regarding which the Group is taking legal action. With respect to the investments in an operator that promotes a certain project which investment is made in order to secure the order from such operator, there may be impairments in investments, increases in the financial burden, delays in payouts depending upon the trends in projects. Although difficulties may arise for the continuance of certain currently ongoing projects due to a change in the policies of fund providers and other factors, the Group is making every effort to obtain other fund providers for such pending projects.
(2) Business environment of the Infrastructure Systems & Solutions businessThe Infrastructure Systems & Solutions business provides diversified solutions for the areas of public infrastructure,
11TOSHIBA Annual Report 2016
buildings and facilities, and industrial systems. Since a significant portion of the net sales in this business is attributable to sales related to expenditures on public works and capital expenditures by the private sector, reductions or delays in spending on public works, low levels of private capital expenditures due to the economic recession, and trends in building and housing construction on a worldwide basis and other factors may have a negative impact on this business. This business is promoting its business development on a worldwide basis. Post order changes in the specifications or other terms, changes to and stoppages of plans for various reasons including policy changes, changes in regulations, appreciation of material costs and personnel expenses, natural and other disasters and other factors, may adversely and substantially affect the progress of this business. In addition, exchange rate fluctuations and other factors may also have a negative impact on this business. In addition, in projects where the percentage-of-completion method is used for revenue recognition, the Group may retroactively reassess profits that had been recorded as accrued and record them as losses if, among other things, the original estimate is underestimated, the expected profits from such projects do not meet original expectations, or the projects are delayed or cancelled for some reason. In the past, the Group recorded losses on certain projects.
(3) Business environment of the Retail & Printing Solutions businessThe Retail & Printing Solutions business provides retail solutions for the retail distribution industry and service industry, offices, manufacturing and logistics industries and particular customers, as well as printing solutions for offices, and manufacturing and logistics industries. The results of this business may be adversely affected by any changes in political and economic conditions, taxation, environmental regulations and foreign exchange; and postponement or suspension of capital expenditure by reason of customers’ earnings deterioration, acceleration of industrial realignment due to compounding and systemization, more intensified market competition with competitors, new entries into such industry, and similar events.
(4) Business environment of the Storage & Electronic Devices Solutions businessWhile the substantial portion of operating income/loss of the Group relies on the Storage & Electronic Devices Solutions business, the market for this business is highly cyclical, depending on demand and supply, and intensely competitive, with many companies, mainly in overseas markets, manufacturing and selling products similar to those offered by the Group. The results of this business tend to change with economic fluctuations and, in particular, to be heavily affected by exchange rate fluctuations. Unforeseen market changes such as changes in the consumer market or in semiconductor heavy users and corresponding changes in demand at the time of production may result in a mismatch between the production of particular products based on the sales volume initially expected and the actual demand for such products, or cause the business to be adversely affected by a decrease in product unit prices due to oversupply. In particular, the price for NAND flash memory, the Group’s major product in this business, may undergo rapid change. Fluctuations in the results of this business may materially and adversely affect the Group’s overall business performance. In addition, the market may face a downturn, the Group may fail to market new products in a timely manner, production may not go as planned, or a rapid introduction of new technology may make the Group’s current products obsolete. Economies of scale with respect to the manufacture of NAND flash memory are significant and there is intense competition to develop and market new products. Therefore, significant levels of capital expenditures are required to maintain and improve competitiveness in both the price and quality of products. However, there is a possibility that the necessary amount of capital expenditure cannot be secured at appropriate timing depending on the financing environment of the Group and other factors.
(5) Business environment of the Industrial ICT Solutions businessA significant portion of the net sales in the Industrial ICT Solutions business is attributable to sales related to private IT investments by, among others, the financial sector and major manufacturers, as well as national and local government expenditures on public IT investments. Accordingly, this business could be affected by changes in such investments. Low levels of private IT investments due to economic recession, and reductions and delays in spending on public IT investments may have a negative impact on this business. Since the solution services field of this business accepts most orders by executing service contracts and the term from order to delivery is relatively long, additional costs over original expectations may be incurred, if, among others, the original estimate is underestimated or a problem occurs in project management. Furthermore, in the case of delay of delivery or defects of delivered systems, the Group may be required to pay damages.
(6) Business environment of OthersThe market for personal computers and televisions is intensely competitive, with many companies manufacturing and selling products similar to those offered by the Group and under the circumstances where earnings are structurally difficult to be recorded. Additionally, such businesses may be significantly affected by exchange rate fluctuations, wide availability of alternative products or lower priced products, economic fluctuations and consumer spending trends which may be affected by the scheduled increase in consumption tax, among other things. Moreover, any rapid fluctuation in
12 TOSHIBA Annual Report 2016
Management’s Discussion and Analysis
demand may result in price erosion or increases in prices of parts and components, which may adversely affect the Group’s financial results with respect to this business. Large scale business structure reform was implemented in such businesses, but in the event where the reform programs fail to produce the expected results, or in case of similar events, additional measures may be needed.
(7) Financial riskApart from being affected by the business operations of the Company or the Group, the Company’s consolidated and nonconsolidated results and financial condition may be affected by the following major financial factors:
(i) Deferred tax assetsThe Group accounted for deferred tax assets. The Group reduces deferred tax assets by a valuation allowance if, based on the weight of available evidence, some portion or all of the deferred tax assets are unlikely to be realized. Recording of valuation allowances includes estimates and therefore involves inherent uncertainty. The Group may also be required hereafter to record further valuation allowances, and the Group’s future results and financial condition may be adversely affected thereby. In addition, the Group may be affected by future tax regulatory changes as the recordation of deferred tax assets and valuation allowances have been made based on the currently-effective tax regulations.
(ii) Exchange rate fluctuationsThe Group conducts business in various regions worldwide using a variety of foreign currencies and is therefore exposed to exchange rate fluctuations. Although the Group makes efforts to minimize the effect of fluctuation in exchange rates by balancing sales in foreign currencies and purchase in foreign currencies, there is a possibility that operating income/loss will be affected by exchange rate fluctuations due to a change in the balance in each business segments and other factors. Also, there is a possibility that such foreign exchange losses will occur, as resulting from a difference between the exchange rates at the time of recognizing and at the time of settlement of the credits and debts in foreign currencies, in case of steep exchange rate fluctuations. Foreign currency denominated assets and liabilities held by the Group are translated into yen as the currency for reporting consolidated financial results. The effects of currency translation adjustments are included in “accumulated other comprehensive income (loss)” reported as a component of equity attributable to shareholders of the Company (“shareholders’ equity”). As a result, the Group’s shareholders’ equity may be adversely affected by exchange rate fluctuations.
(iii) Accrued pension and severance costsThe Group recognizes the funded status (i.e., the difference between the fair value of plan assets and the benefit obligations) of its pension plan in the consolidated balance sheets, with a corresponding adjustment, net of tax, included in “accumulated other comprehensive loss” reported as a component of shareholders’ equity. Such adjustment to “accumulated other comprehensive loss” represents the result of adjustment for the net unrecognized actuarial losses, unrecognized prior service costs, and unrecognized transition obligations. These amounts will be subsequently recognized as net periodic pension and severance costs calculated pursuant to the applicable accounting standards. The funded status of the Group’s pension plan may deteriorate due to declines in the fair value of plan assets caused by lower returns, increases of severance benefit obligations caused by changes in the discount rate, salary increase rates or other actuarial assumptions. As a result, the Group’s shareholders’ equity may be adversely affected, and the net periodic pension and severance costs to be recorded in “cost of sales” or “selling, general and administrative expenses” may increase.
(iv) Impairment of long-lived assets, goodwill and listed shares.If there is an indication of impairment for a long-lived asset and the carrying amount of such asset will not be recovered by the future undiscounted cash flow, the carrying amount may be reduced to its fair value and a loss may be recognized as an impairment with respect to such difference. As of March 31, 2016, 337.3 billion yen of goodwill was recorded in the Company’s consolidated balance sheets in accordance with U.S. generally accepted accounting principles. Out of the above, 268.1 billion yen was allocated to the Energy Systems & Solutions business, most of which was recorded due to the acquisition of Westinghouse group conducted in October 2006 and the acquisition of Landis+Gyr conducted in July 2011. Goodwill is required to be tested for impairment annually. If an impairment test shows that the total of the carrying amounts, including goodwill, in relation to the business related to such goodwill exceeds its fair value, the relevant goodwill must be recalculated, and the difference between the current amount and the recalculated amount will be recognized as an impairment. In addition to the above annual impairment test, if any event indicating a decline in corporate value owing to changes in the business environment or other factors arises, and the total of the carrying amounts exceeds its fair value, an impairment will be recognized. Therefore, additional impairments may be recorded, depending on the valuation of long- lived assets, the estimate of future cash flow from business related to goodwill, and
13TOSHIBA Annual Report 2016
changes in the discount rate for the weighted average capital cost. Also, if the market price of listed shares held by the Group as the marketable securities declines, there is a possibility that an impairment loss on the relevant shares will be recorded or that the net unrealized losses on securities will be negatively recognized.
(v) Shareholders’ equityThe Group recorded a very large operating loss and net loss attributable to shareholders of the Company in FY2015 owing to, among others, the impact of impairment of goodwill and intangible assets, provisions for unprofitable projects, and expenses incurred for business structure reform, and as a result, substantial consolidated net assets of the Group decreased. Therefore, when the Company executes an EPC (Engineering, Procurement and Construction) agreement in overseas markets, the Company may not be able to satisfy the financial standards required by the ordering party, and as a result, the Company’s ability to accept orders may be adversely affected.
(8) Changes in financing environment and othersThe Group has substantial amounts of interest-bearing debt for financing that is highly susceptible to market environments, including the financial crisis, interest rate movements and fund supply and demand. Thus, changes in these factors may have an adverse effect on the Group’s funding activities. The Group has also been raising funds by issuing bonds or taking loans from financial institutions. In the case the financial markets fall into unstable turmoil, the financial institutions’ reduction in their lending in response to the change in capital adequacy requirements, or the downgrading of the credit rating of the Company given by rating agencies, there can be no assurance that the Group will obtain refinancing loans or new loans in the future on similar terms. If the Group is unable to obtain loans for the amount needed by the Group in a timely manner, the Group’s financing may be adversely affected. Moreover, because of the amendments of the past Annual Securities Reports and other reports, which is described in “10. Past inappropriate accountings,” below and the continuing deterioration in the operating results, the long-term credit rating assigned by Moody’s Japan K.K. was downgraded by 7 notches, the long-term credit rating assigned by Standard & Poor’s Ratings Japan K.K. was downgraded by 6 notches, and the long-term credit rating assigned by Rating and Investment Information, Inc. was downgraded by 3 notches for the period from the filing date of the Annual Securities Report for the 176th term of the previous fiscal year to June 22, 2016, and the credit ratings may be downgraded further in the future. In addition, loan agreements entered into between the Company and several financial institutions provide for financial covenants. Therefore, if the Company’s consolidated net assets, consolidated operating income or credit rating falls below the respective levels provided for in the financial covenants, the Company’s obligations with respect to the relevant loan repayments may be accelerated upon demand by the relevant lending financial institutions. Furthermore, any breach by the Company of those financial covenants may trigger acceleration of the bonds or other borrowings of the Company. The Company will make all possible efforts to obtain the understanding of the lending financial institutions with respect to this, in order to avoid breaching financial covenants and the consequent acceleration of repayments. However, if any acceleration of the Company’s loan repayments occurs, it may materially and adversely affect the Company’s business operations.
3. Risks related to business partners and others(1) Procurement of components and materialsIt is important for the Group’s business activities to procure materials, components and other goods in a timely and appropriate manner. However, such materials, components and goods may only be obtainable from a limited number of suppliers due to the particularity of such materials, components and goods, and, therefore, such suppliers may not be easily replaced [if the need to do so arises]. In cases of delay or other problems in receiving supply of such materials, components and other goods, shortages may occur or procurement costs may rise. It is necessary to procure materials, components and other goods at competitive costs and to optimize the entire supply chain, including suppliers, in order for the Group to bring competitive products to market. In addition, a shortage in the electric power supply resulted from the suspension of the operation of nuclear power plants in Japan and a further rise in electricity costs due to the rise of fuel costs affected by exchange rate fluctuations may affect business activities, including manufacturing operations, of the Group, since a stable supply of electricity is essential to the Group’s business activities. Any failure by the Group to procure such materials, components and other goods from key suppliers or any shortage in the power supply or further rise in electricity costs may adversely impact the Group’s competitiveness. Furthermore, any case of defective materials, components or other goods, or any failure to meet required specifications with respect to such materials, components or other goods, may also have an adverse effect on the reliability and reputation of the Group and Toshiba brand products.
(2) Securing human resourcesA large part of the success of the Group’s businesses depends on securing excellent human resources in every business area and process, including product development, production, marketing and business management. In particular,
14 TOSHIBA Annual Report 2016
Management’s Discussion and Analysis
securing the necessary human resources is essential in respect of achieving globalization of the Group’s businesses. However, competition to secure human resources is intensifying, as the number of qualified personnel in each area and process is limited, while demand for such personnel is increasing. As a result, the Group may fail to retain existing employees or to obtain new human resources or require costs more than in the past in order to obtain such human resources. In order to reduce fixed costs, the Group carried out in FY2015 a personnel rationalization through rearrangement of personnel and early retirement incentive program including re-employment support and is implementing personnel measures, including the reallocation of human resources to focus on strong and promising businesses, bonus reduction, reduction of remuneration of the management, revision of various allowances and daily wages, reclaiming jobs that are outsourced to third parties or conducted by limited-term employees, and reducing the number of limited-term employees. However, fixed costs may not be reduced as anticipated or the implementation of such personnel measures may adversely affect the Group’s employee morale, production efficiency or the ability to secure capable human resources.
4. Risks related to products and technologies(1) Investments in new businessesThe Group invests in companies involved in new businesses, enters into alliances with other companies with respect to new businesses, and actively develops its own new businesses. Cultivation of new businesses entails substantial uncertainty, and if any new business in which the Group invests or which the Group attempts to develop does not progress as planned, the Group may be adversely affected by incurring investment expenses that do not lead to the anticipated results.
5. Risks related to trade practices(1) Parent company’s guaranteesWhen a subsidiary of the Company accepts an order for a large project, such as a plant, the Company, as the parent company, may, at the request of the customer, provide guarantees with respect to the subsidiary’s performance under the contract. Such parent guarantees are made pursuant to standard business practices and in the ordinary course of business. If the subsidiary subsequently fails to fulfill its obligations, the Company may be obligated to bear losses as a result. In addition, if the Company’s consolidated net assets, consolidated operating income or credit ratings fall below the respective levels provided for in the contracts with such customers, the relevant guarantees could be required to be replaced by letters of credit or bonds. In fact, certain contracts have been so replaced.
6. Risks related to new products and new technology(1) Development of new productsIt is critically important for the Group to offer innovative and attractive new products and services. However, due to the rapid pace of technological innovation, the emergence of alternative technologies and products and changes in technological standards, the optimum introduction of new products to the market may not be accomplished, or new products may be accepted by the market for a shorter period than anticipated. In addition, any failure on the part of the Group to continuously obtain sufficient funding and resources for development of technologies may affect the Group’s ability to develop new products and services and to introduce them to market. From the viewpoint of enhancing concentration and selection of managerial resources, the Group now selects research and development themes more rigorously, with a primary focus on developing original and advanced technologies, with close consideration for the timing of market introduction. In certain products and technological fields, the research and development may not proceed due to more focus on research and development in other products and technological fields, and as a result, the Group’s technological superiority may be impaired.
7. Risks related to laws and regulations(1) Information securityThe Group maintains and manages personal information obtained through business operations. Even though the Group makes every effort to manage this information appropriately, the Group’s brand image, reputation and business performance may be subject to negative influences, or the Group may be found to be liable for damages in the event of an unanticipated leak of such information which results in illegal retention or usage of such information by a third party. The Group also maintains and manages trade secrets regarding the Group’s technology, marketing and other business operations. The Group is implementing measures to prevent leakage of such trade secrets outside the Group through maintaining and tightening control of its information management system, training its employees, and other measures. However, in the past, situations have occurred in which leakage of trade secrets was suspected. The Group’s competitive power may be weakened and the Group’s business, operating results and financial condition may be subject to negative influences, in the event of an unanticipated leak of such information which results in illegal retention or usage of such information by a third party.
15TOSHIBA Annual Report 2016
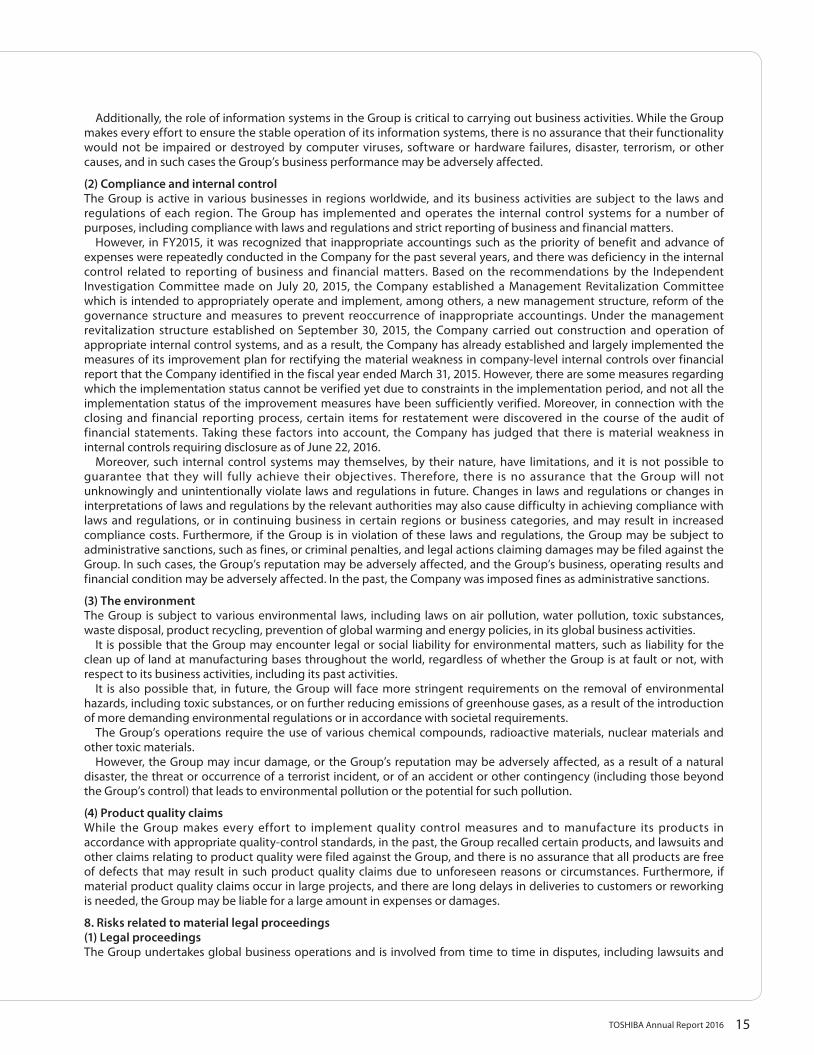
Additionally, the role of information systems in the Group is critical to carrying out business activities. While the Group makes every effort to ensure the stable operation of its information systems, there is no assurance that their functionality would not be impaired or destroyed by computer viruses, software or hardware failures, disaster, terrorism, or other causes, and in such cases the Group’s business performance may be adversely affected.
(2) Compliance and internal controlThe Group is active in various businesses in regions worldwide, and its business activities are subject to the laws and regulations of each region. The Group has implemented and operates the internal control systems for a number of purposes, including compliance with laws and regulations and strict reporting of business and financial matters. However, in FY2015, it was recognized that inappropriate accountings such as the priority of benefit and advance of expenses were repeatedly conducted in the Company for the past several years, and there was deficiency in the internal control related to reporting of business and financial matters. Based on the recommendations by the Independent Investigation Committee made on July 20, 2015, the Company established a Management Revitalization Committee which is intended to appropriately operate and implement, among others, a new management structure, reform of the governance structure and measures to prevent reoccurrence of inappropriate accountings. Under the management revitalization structure established on September 30, 2015, the Company carried out construction and operation of appropriate internal control systems, and as a result, the Company has already established and largely implemented the measures of its improvement plan for rectifying the material weakness in company-level internal controls over financial report that the Company identified in the fiscal year ended March 31, 2015. However, there are some measures regarding which the implementation status cannot be verified yet due to constraints in the implementation period, and not all the implementation status of the improvement measures have been sufficiently verified. Moreover, in connection with the closing and financial reporting process, certain items for restatement were discovered in the course of the audit of financial statements. Taking these factors into account, the Company has judged that there is material weakness in internal controls requiring disclosure as of June 22, 2016. Moreover, such internal control systems may themselves, by their nature, have limitations, and it is not possible to guarantee that they will fully achieve their objectives. Therefore, there is no assurance that the Group will not unknowingly and unintentionally violate laws and regulations in future. Changes in laws and regulations or changes in interpretations of laws and regulations by the relevant authorities may also cause difficulty in achieving compliance with laws and regulations, or in continuing business in certain regions or business categories, and may result in increased compliance costs. Furthermore, if the Group is in violation of these laws and regulations, the Group may be subject to administrative sanctions, such as fines, or criminal penalties, and legal actions claiming damages may be filed against the Group. In such cases, the Group’s reputation may be adversely affected, and the Group’s business, operating results and financial condition may be adversely affected. In the past, the Company was imposed fines as administrative sanctions.
(3) The environmentThe Group is subject to various environmental laws, including laws on air pollution, water pollution, toxic substances, waste disposal, product recycling, prevention of global warming and energy policies, in its global business activities. It is possible that the Group may encounter legal or social liability for environmental matters, such as liability for the clean up of land at manufacturing bases throughout the world, regardless of whether the Group is at fault or not, with respect to its business activities, including its past activities. It is also possible that, in future, the Group will face more stringent requirements on the removal of environmental hazards, including toxic substances, or on further reducing emissions of greenhouse gases, as a result of the introduction of more demanding environmental regulations or in accordance with societal requirements. The Group’s operations require the use of various chemical compounds, radioactive materials, nuclear materials and other toxic materials. However, the Group may incur damage, or the Group’s reputation may be adversely affected, as a result of a natural disaster, the threat or occurrence of a terrorist incident, or of an accident or other contingency (including those beyond the Group’s control) that leads to environmental pollution or the potential for such pollution.
(4) Product quality claimsWhile the Group makes every effort to implement quality control measures and to manufacture its products in accordance with appropriate quality-control standards, in the past, the Group recalled certain products, and lawsuits and other claims relating to product quality were filed against the Group, and there is no assurance that all products are free of defects that may result in such product quality claims due to unforeseen reasons or circumstances. Furthermore, if material product quality claims occur in large projects, and there are long delays in deliveries to customers or reworking is needed, the Group may be liable for a large amount in expenses or damages.
8. Risks related to material legal proceedings(1) Legal proceedingsThe Group undertakes global business operations and is involved from time to time in disputes, including lawsuits and
16 TOSHIBA Annual Report 2016
Management’s Discussion and Analysis
other legal proceedings, and investigations by relevant authorities. It is possible that such cases may arise in the future. Due to the differences in judicial systems and the uncertainties inherent in such proceedings, the Group may be subject to a ruling requiring payment of amounts far exceeding its expectations. Any judgment or decision unfavorable to the Group could also have a material adverse effect on the Group’s business, operating results or financial condition. In addition, due to various circumstances, there can be no assurance that lawsuits involving claims for large sums will not be brought, even if the possibility of receiving orders for such payment is quite low. The Group is under investigation by the European Commission, and other competition regulatory authorities, for alleged violations of competition laws with respect to products that include semiconductors, cathode ray tubes (CRT), heavy electrical equipment, and optical disc devices. In addition, class action lawsuits and other claims with respect to alleged anti-competitive behavior regarding certain products brought against the Group are currently pending. In November 2014, there was an arbitral award against the Group to find the breach of contracts with clients for the reason of defect of electricity meter in Europe. In July 2015, new arbitration seeking damages and others was filed. Now, the Group is asserting its opinion in the arbitration.
9. Risks related to directors, employees, major shareholders and affiliates(1) Alliance in NAND flash memoryThe Group has a strategic alliance with a U.S. company, SanDisk Corporation (“SanDisk”), for the production of NAND flash memory, which includes production joint ventures (equity method affiliates). Under the joint venture agreement, the Group may purchase SanDisk’s ownership interests in the production joint ventures. In addition, the Company and SanDisk each provide a 50% guaranty in respect of the lease agreements of production facilities held by the production joint ventures. In the event that SanDisk’s operating results and financial condition deteriorate, the Company may succeed to SanDisk’s guaranty obligations or purchase SanDisk’s ownership interests in the relevant production joint ventures, in which case the production joint ventures will be treated as consolidated subsidiaries of the Company.
(2) Alliance in nuclear power systems businessThe Group acquired Westinghouse group in October 2006. The Company’s ownership interest in Westinghouse group (including the holding companies) is currently 87% at present. The remainder is held by two companies in Japan and overseas (the “Minority Shareholders”). The Company is considering inviting the participation of new investors in Westinghouse, on the condition that the Company retains a majority-in-interest. The Minority Shareholders, based on a separate agreement with the Company, have been given an option to sell all or part of their ownership interests to the Company (“Put Options”). The Group also has an option to purchase from the Minority Shareholders all or part of their respective ownership interests in companies of Westinghouse group under certain conditions. These options are in place for the purpose of protecting the interests of the Minority Shareholders, while preventing equity participation by a third party which may put the Group at disadvantage. The Company makes every effort to maintain a favorable relationship with the Minority Shareholders in connection with Westinghouse group’s business. However in the event that the Minority Shareholders exercise their respective Put Options, or the Group exercises its purchase option, the Group will seek investment from a new strategic partner. Prior to such an investment, the Group may need to procure a certain amount of funds in connection with the exercise of Put Options or purchase options.
(3) Agreements regarding natural gasThe Company executed (i) the service agreements for processing liquefied natural gas (the “Service Agreements”) with the companies providing services for liquefying natural gas in the United States, and (ii) the pipeline agreements with the pipeline companies in United States, for the purpose to sell natural gas to the users in other countries including Japan. Pursuant to these agreements, the Company will be provided the series of services. In these agreements, it is assumed that the Company will use certain amount of the liquefying ability of the companies providing services for liquefying natural gas and the pipelines of the pipeline companies for the period of twenty (20) years from 2019. The Company generally expects to execute long-term transaction agreements with users with respect to the total amount of liquefied natural gas (LNG) the Company will obtain. However, depending on the movement of crude-oil prices or other prices, there is a possibility that the Company cannot sell LNG to the users or in the market under conditions (including the price) the Company expects. Even in that case, fixed service fee payment obligations to such companies continue, and as a result, the Company may be obligated to bear losses.
10. Past inappropriate accountingsIn February 2015, the Company received an order from the Securities and Exchange Surveillance Commission, based on Article 26 of the Financial Instruments and Exchange Act, requiring submission of a report. The Company was then subject to inspection regarding projects that used percentage-of-completion accounting. Later, after establishing the Independent Investigation Committee and conducting the investigation, it was found that the Company made inappropriate accountings and, therefore, the Company filed amendments of the past Annual Securities Reports and other reports. The Tokyo Stock Exchange (“TSE”) and the Nagoya Stock Exchange (“NSE”) deemed that the Company had
17TOSHIBA Annual Report 2016
a serious problem in its internal control systems and that improvement of such internal control systems was essential, due to the fact that the Company made misstatements in such Annual Securities Reports and other reports. Therefore, in September 2015, TSE and NSE imposed sanctions under which the shares of the Company were designated as “Securities on Alert”. After a year from the designation of “Securities on Alert”, the Company will be required to submit to stock exchanges on which the Company is listed a “Whitten Confirmation of Internal Management Systems”, and, if, among others, it is deemed that the Company has any problems in its internal management systems, the shares of the Company may be delisted, and such delisting may adversely affect the Group’s operating results and financial condition and may restrict opportunities for the Company’s shareholders to sell their shares. In a class action brought against the Company as defendant in the State of California in the U.S. with respect to the Group’s inappropriate accountings, an order granting a motion to dismiss was issued. However, such order is subject to an appeal by the plaintiffs, and is not definitive. Several lawsuits have been initiated in Japan. Going forward, the Company may also be sued by its shareholders and others and depending on the progress of such procedures, the Group’s business, operating results and financial condition may be adversely affected. In addition, the Company may be charged administrative actions or investigations by Japanese or overseas authorities, including the suspension of business related to construction. If the Company receives such sanctions, the Group may suffer from opportunity loss such as nomination stop by governmental authorities, or degradation of social reputation accompanied thereby, and as a result, the Group’s business, operating results and financial condition may be adversely affected. The Company was ordered to pay administrative monetary penalty of 7,373.5 million yen by the Financial Services Agency of Japan in December 2015 with respect to the relevant inappropriate accountings issues, and completed the payment of such penalty.
11. Others(1) Measures against counterfeit productsWhile the Group protects and seeks to enhance the value of the Toshiba brand, counterfeit products created by third parties are found worldwide. While the Group makes every effort to prevent counterfeit products, the heavy circulation of counterfeit products may dilute the value of the Toshiba brand, and the Group’s net sales may be adversely affected.
(2) Protection of intellectual property rightsThe Group makes every effort to secure intellectual property rights. However, in some regions, it may not be possible to secure sufficient protection. The Group uses the intellectual property of third parties pursuant to licenses. It is possible that the Group may fail to receive the necessary third-party licenses for new technology or is unable to obtain the renewal of existing licenses or receives them on unfavorable terms. In the past, law suits or similar actions or proceedings have been brought against the Group in respect of intellectual property rights, and the Group has filed law suits in order to protect its intellectual property rights. Such lawsuits and actions may be brought against the Group or the Group may file lawsuits against infringing third parties in the future. Such lawsuits may require time, costs and other management resources, and depending on the outcome of these lawsuits, the Group may not be able to use important technology, or the Group may be found to be liable for damages.
(3) Political, economic and social conditionsThe Group undertakes global business operations. Any changes in political, economic, and social conditions and policies, legal or regulatory changes, including rules and regulations concerning investment, repatriation of profits, export and import controls, foreign exchange, and taxation, and exchange rate fluctuations, in Japan or overseas, may adversely impact market demand and the Group’s business operations.
(4) Natural disastersMost of the Group’s Japanese production facilities are located in the Keihin region of Japan, which includes Tokyo, Kawasaki City, Yokohama City and the surrounding area, while key semiconductor production facilities are located in Kyushu, Tokai, Hanshin, Hokuriku and Tohoku. The Group is currently expanding its production facilities in Asia. As a result, any occurrence of a wide-scale disaster, strike, terrorism or epidemic illness, such as a new type of flu, particularly in any of these areas could have a significant adverse effect on the Group’s results. Additionally, large-scale disasters, such as earthquakes, floods or typhoons, in regions where production or distribution sites are located may damage or destroy production capabilities, suspend procurement of raw materials or components, and cause transportation and sales interruptions or other similar disruptions, which could adversely affect asset value and production capabilities significantly. The massive flooding was caused by heavy rains that fell on Chennai and its surrounding region in South India, which forced the flooded factory of the Group to suspend operations on and after November 2015. Going forward, such suspension may affect the delivery schedule of the products to be produced at that factory, and penalty charges may be claimed by the relevant customers. In the past, the businesses of the Group were affected to a certain extent by the Great East Japan Earthquake and the floods in Thailand.
18 TOSHIBA Annual Report 2016
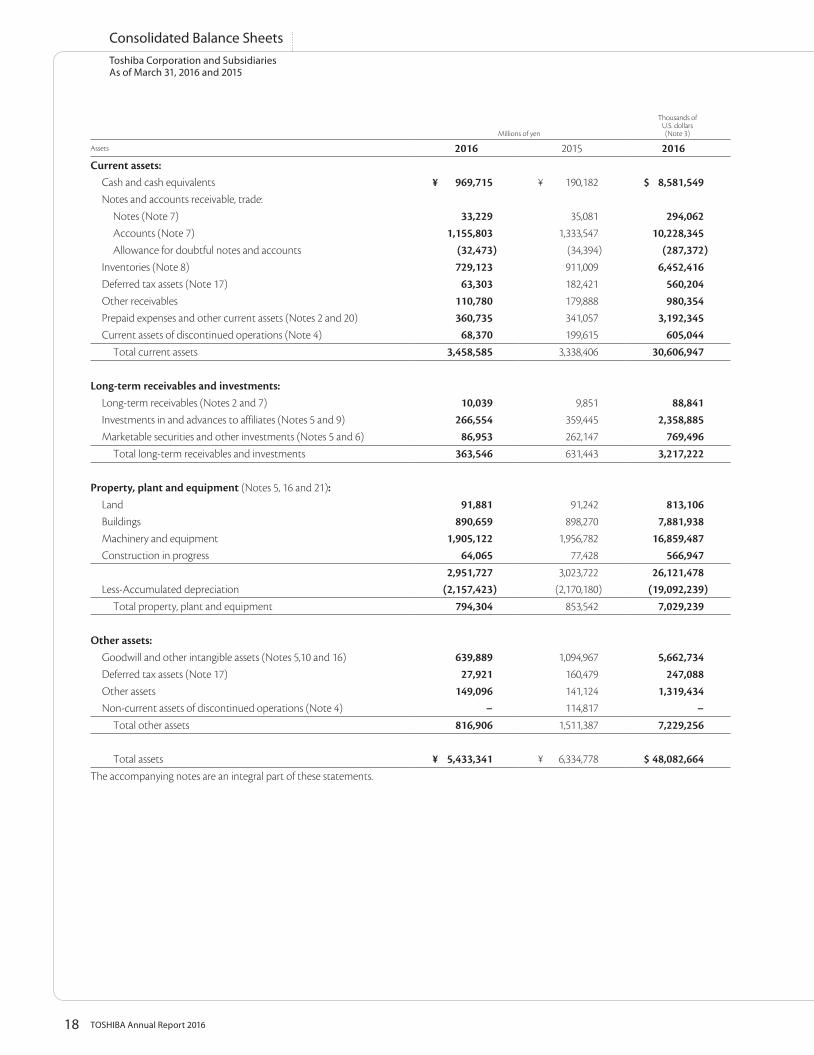
Toshiba Corporation and SubsidiariesAs of March 31, 2016 and 2015
Consolidated Balance Sheets
Millions of yen
Thousands ofU.S. dollars(Note 3)
Assets 2016 2015 2016Current assets:
Cash and cash equivalents ¥ 969,715 ¥ 190,182 $ 8,581,549Notes and accounts receivable, trade:
Notes (Note 7) 33,229 35,081 294,062Accounts (Note 7) 1,155,803 1,333,547 10,228,345Allowance for doubtful notes and accounts (32,473) (34,394) (287,372)
Inventories (Note 8) 729,123 911,009 6,452,416Deferred tax assets (Note 17) 63,303 182,421 560,204Other receivables 110,780 179,888 980,354Prepaid expenses and other current assets (Notes 2 and 20) 360,735 341,057 3,192,345Current assets of discontinued operations (Note 4) 68,370 199,615 605,044
Total current assets 3,458,585 3,338,406 30,606,947
Long-term receivables and investments:Long-term receivables (Notes 2 and 7) 10,039 9,851 88,841Investments in and advances to affiliates (Notes 5 and 9) 266,554 359,445 2,358,885Marketable securities and other investments (Notes 5 and 6) 86,953 262,147 769,496
Total long-term receivables and investments 363,546 631,443 3,217,222
Property, plant and equipment (Notes 5, 16 and 21):Land 91,881 91,242 813,106Buildings 890,659 898,270 7,881,938Machinery and equipment 1,905,122 1,956,782 16,859,487Construction in progress 64,065 77,428 566,947
2,951,727 3,023,722 26,121,478Less-Accumulated depreciation (2,157,423) (2,170,180) (19,092,239)
Total property, plant and equipment 794,304 853,542 7,029,239
Other assets:Goodwill and other intangible assets (Notes 5,10 and 16) 639,889 1,094,967 5,662,734Deferred tax assets (Note 17) 27,921 160,479 247,088Other assets 149,096 141,124 1,319,434Non-current assets of discontinued operations (Note 4) − 114,817 −
Total other assets 816,906 1,511,387 7,229,256
Total assets ¥ 5,433,341 ¥ 6,334,778 $ 48,082,664The accompanying notes are an integral part of these statements.
19TOSHIBA Annual Report 2016
Millions of yen
Thousands ofU.S. dollars(Note 3)
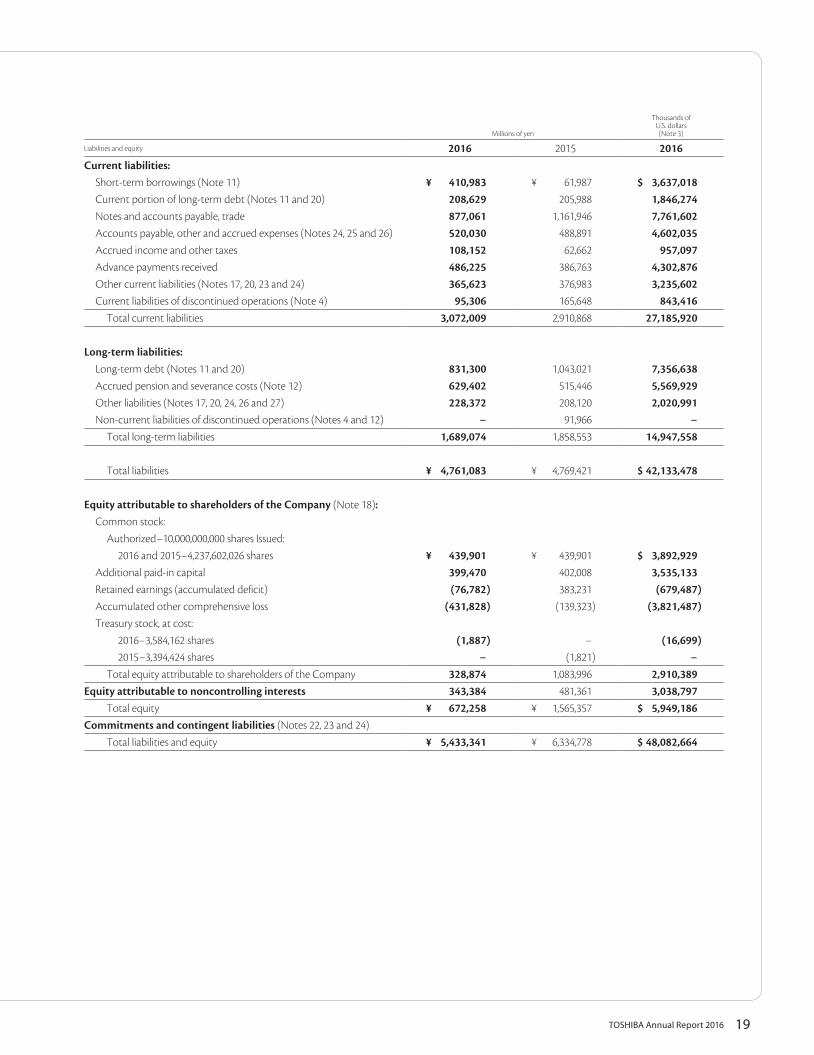
Liabilities and equity 2016 2015 2016Current liabilities:
Short-term borrowings (Note 11) ¥ 410,983 ¥ 61,987 $ 3,637,018Current portion of long-term debt (Notes 11 and 20) 208,629 205,988 1,846,274Notes and accounts payable, trade 877,061 1,161,946 7,761,602Accounts payable, other and accrued expenses (Notes 24, 25 and 26) 520,030 488,891 4,602,035Accrued income and other taxes 108,152 62,662 957,097Advance payments received 486,225 386,763 4,302,876Other current liabilities (Notes 17, 20, 23 and 24) 365,623 376,983 3,235,602Current liabilities of discontinued operations (Note 4) 95,306 165,648 843,416
Total current liabilities 3,072,009 2,910,868 27,185,920
Long-term liabilities:Long-term debt (Notes 11 and 20) 831,300 1,043,021 7,356,638Accrued pension and severance costs (Note 12) 629,402 515,446 5,569,929Other liabilities (Notes 17, 20, 24, 26 and 27) 228,372 208,120 2,020,991Non-current liabilities of discontinued operations (Notes 4 and 12) − 91,966 −
Total long-term liabilities 1,689,074 1,858,553 14,947,558
Total liabilities ¥ 4,761,083 ¥ 4,769,421 $ 42,133,478
Equity attributable to shareholders of the Company (Note 18):Common stock:
Authorized−10,000,000,000 shares Issued:2016 and 2015−4,237,602,026 shares ¥ 439,901 ¥ 439,901 $ 3,892,929
Additional paid-in capital 399,470 402,008 3,535,133Retained earnings (accumulated deficit) (76,782) 383,231 (679,487)Accumulated other comprehensive loss (431,828) (139,323) (3,821,487)Treasury stock, at cost:
2016−3,584,162 shares (1,887) − (16,699)2015−3,394,424 shares − (1,821) −
Total equity attributable to shareholders of the Company 328,874 1,083,996 2,910,389Equity attributable to noncontrolling interests 343,384 481,361 3,038,797
Total equity ¥ 672,258 ¥ 1,565,357 $ 5,949,186Commitments and contingent liabilities (Notes 22, 23 and 24)
Total liabilities and equity ¥ 5,433,341 ¥ 6,334,778 $ 48,082,664
20 TOSHIBA Annual Report 2016
Toshiba Corporation and SubsidiariesFor the years ended March 31, 2016 and 2015
Consolidated Statements of Operations
Millions of yen
Thousands ofU.S. dollars(Note 3)
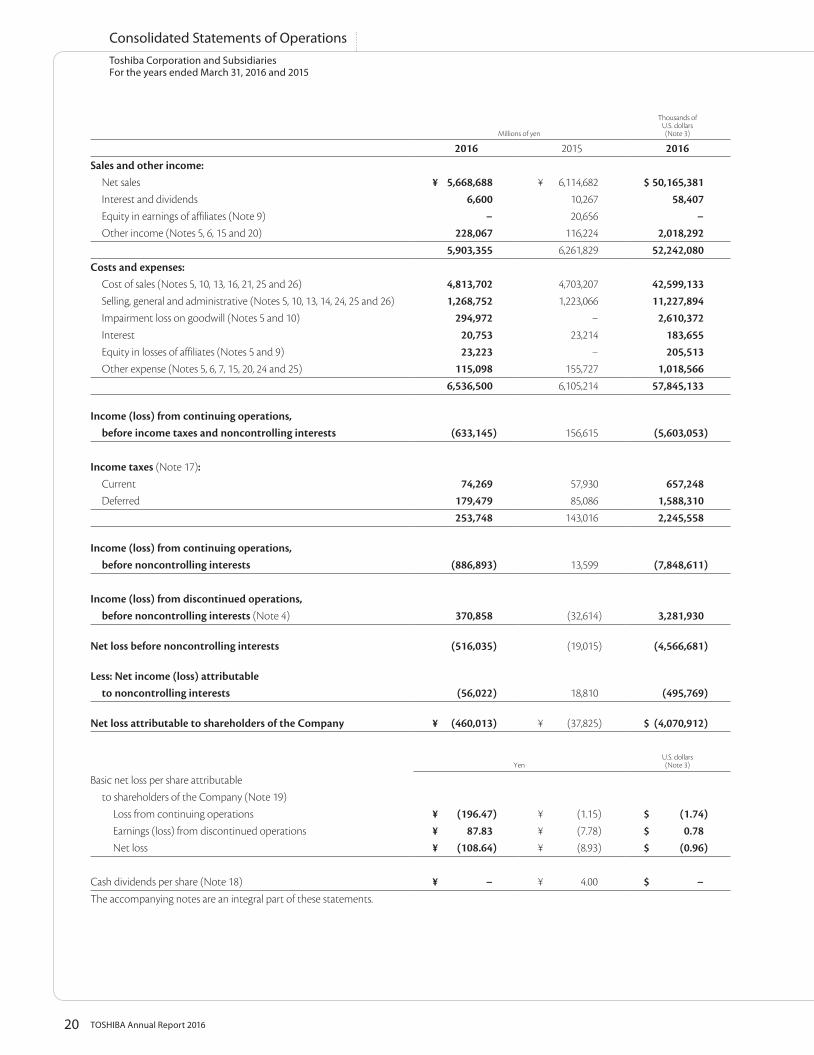
2016 2015 2016Sales and other income:
Net sales ¥ 5,668,688 ¥ 6,114,682 $ 50,165,381Interest and dividends 6,600 10,267 58,407Equity in earnings of affiliates (Note 9) − 20,656 −Other income (Notes 5, 6, 15 and 20) 228,067 116,224 2,018,292
5,903,355 6,261,829 52,242,080Costs and expenses:
Cost of sales (Notes 5, 10, 13, 16, 21, 25 and 26) 4,813,702 4,703,207 42,599,133Selling, general and administrative (Notes 5, 10, 13, 14, 24, 25 and 26) 1,268,752 1,223,066 11,227,894Impairment loss on goodwill (Notes 5 and 10) 294,972 − 2,610,372Interest 20,753 23,214 183,655Equity in losses of affiliates (Notes 5 and 9) 23,223 − 205,513Other expense (Notes 5, 6, 7, 15, 20, 24 and 25) 115,098 155,727 1,018,566
6,536,500 6,105,214 57,845,133
Income (loss) from continuing operations,before income taxes and noncontrolling interests (633,145) 156,615 (5,603,053)
Income taxes (Note 17):Current 74,269 57,930 657,248Deferred 179,479 85,086 1,588,310
253,748 143,016 2,245,558
Income (loss) from continuing operations,before noncontrolling interests (886,893) 13,599 (7,848,611)
Income (loss) from discontinued operations,before noncontrolling interests (Note 4) 370,858 (32,614) 3,281,930
Net loss before noncontrolling interests (516,035) (19,015) (4,566,681)
Less: Net income (loss) attributableto noncontrolling interests (56,022) 18,810 (495,769)
Net loss attributable to shareholders of the Company ¥ (460,013) ¥ (37,825) $ (4,070,912)
YenU.S. dollars(Note 3)
Basic net loss per share attributableto shareholders of the Company (Note 19)
Loss from continuing operations ¥ (196.47) ¥ (1.15) $ (1.74)Earnings (loss) from discontinued operations ¥ 87.83 ¥ (7.78) $ 0.78Net loss ¥ (108.64) ¥ (8.93) $ (0.96)
Cash dividends per share (Note 18) ¥ − ¥ 4.00 $ −The accompanying notes are an integral part of these statements.
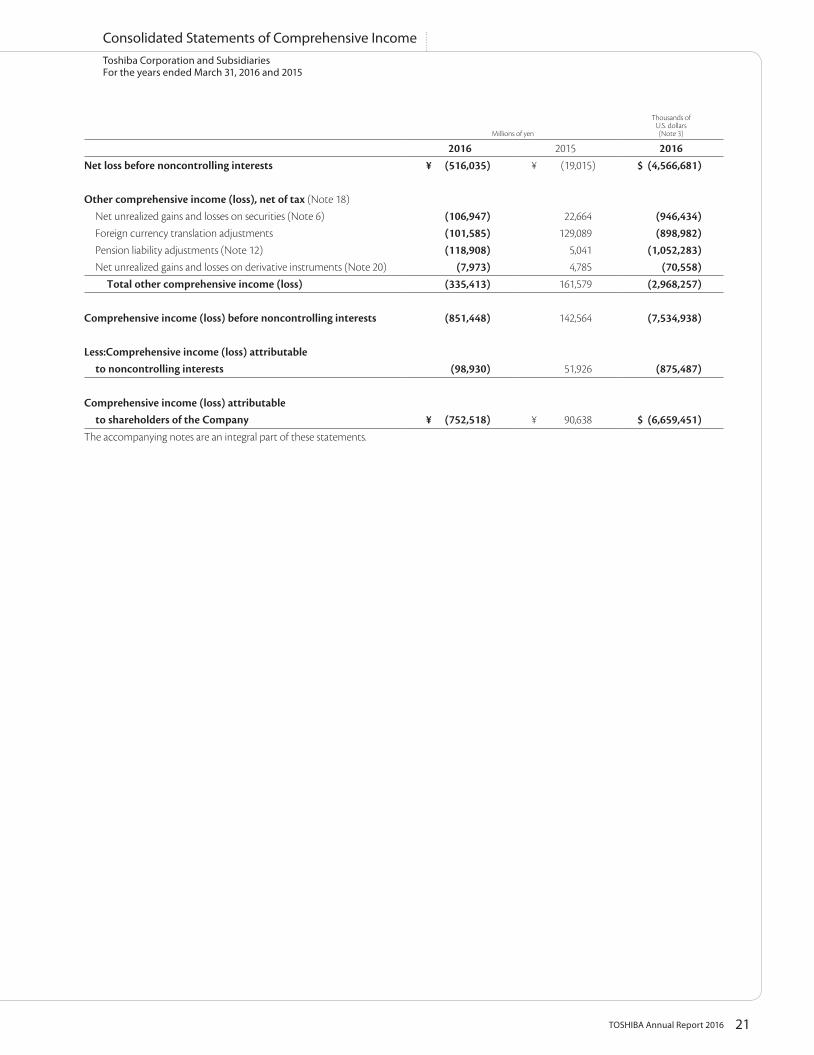
21TOSHIBA Annual Report 2016
Toshiba Corporation and SubsidiariesFor the years ended March 31, 2016 and 2015
Consolidated Statements of Comprehensive Income
Millions of yen
Thousands ofU.S. dollars(Note 3)
2016 2015 2016Net loss before noncontrolling interests ¥ (516,035) ¥ (19,015) $ (4,566,681)
Other comprehensive income (loss), net of tax (Note 18)Net unrealized gains and losses on securities (Note 6) (106,947) 22,664 (946,434)Foreign currency translation adjustments (101,585) 129,089 (898,982)Pension liability adjustments (Note 12) (118,908) 5,041 (1,052,283)Net unrealized gains and losses on derivative instruments (Note 20) (7,973) 4,785 (70,558)
Total other comprehensive income (loss) (335,413) 161,579 (2,968,257)
Comprehensive income (loss) before noncontrolling interests (851,448) 142,564 (7,534,938)
Less:Comprehensive income (loss) attributableto noncontrolling interests (98,930) 51,926 (875,487)
Comprehensive income (loss) attributableto shareholders of the Company ¥ (752,518) ¥ 90,638 $ (6,659,451)
The accompanying notes are an integral part of these statements.
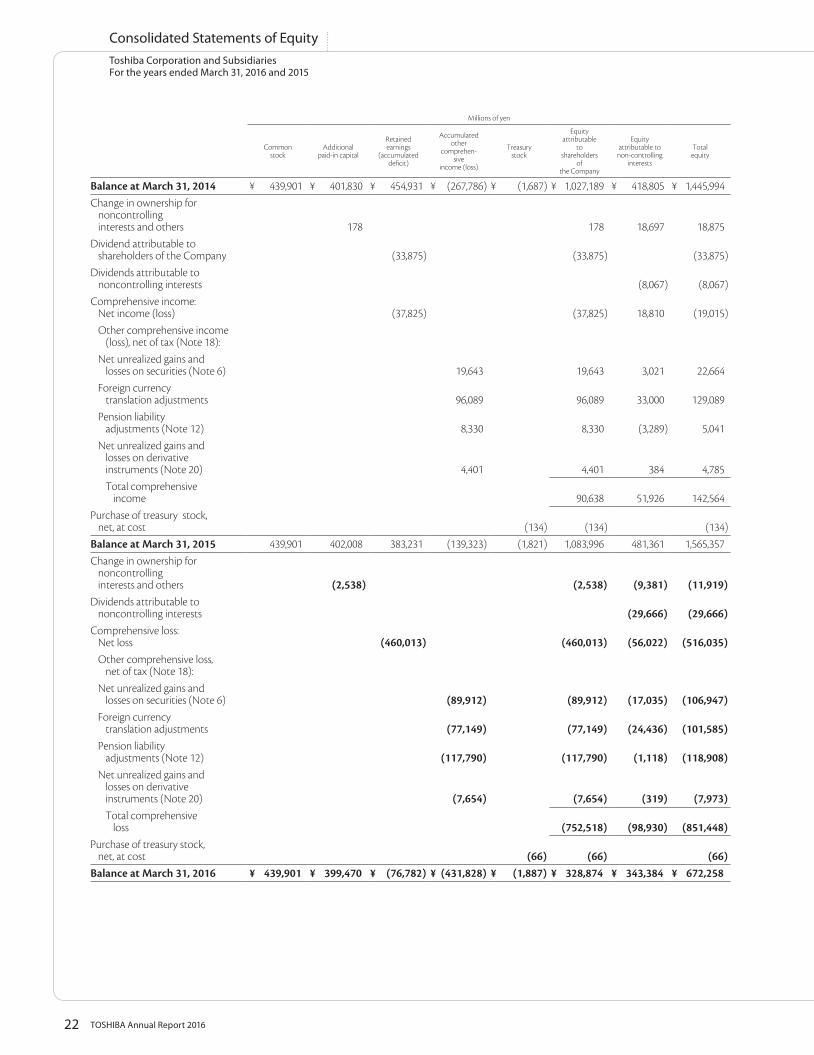
22 TOSHIBA Annual Report 2016
Toshiba Corporation and SubsidiariesFor the years ended March 31, 2016 and 2015
Consolidated Statements of Equity
Millions of yen
Commonstock
Additionalpaid-in capital
Retainedearnings
(accumulated deficit)
Accumulatedother
comprehen-sive
income (loss)
Treasurystock
Equityattributable
toshareholders
ofthe Company
Equity attributable to
non-controllinginterests
Totalequity
Balance at March 31, 2014 ¥ 439,901 ¥ 401,830 ¥ 454,931 ¥ (267,786) ¥ (1,687) ¥ 1,027,189 ¥ 418,805 ¥ 1,445,994Change in ownership for
noncontrolling interests and others 178 178 18,697 18,875
Dividend attributable to shareholders of the Company (33,875) (33,875) (33,875)
Dividends attributable to noncontrolling interests (8,067) (8,067)
Comprehensive income: Net income (loss) (37,825) (37,825) 18,810 (19,015)Other comprehensive income
(loss), net of tax (Note 18):Net unrealized gains and
losses on securities (Note 6) 19,643 19,643 3,021 22,664Foreign currency
translation adjustments 96,089 96,089 33,000 129,089Pension liability
adjustments (Note 12) 8,330 8,330 (3,289) 5,041Net unrealized gains and
losses on derivative instruments (Note 20) 4,401 4,401 384 4,785Total comprehensive
income 90,638 51,926 142,564Purchase of treasury stock,
net, at cost (134) (134) (134)Balance at March 31, 2015 439,901 402,008 383,231 (139,323) (1,821) 1,083,996 481,361 1,565,357Change in ownership for
noncontrolling interests and others (2,538) (2,538) (9,381) (11,919)
Dividends attributable to noncontrolling interests (29,666) (29,666)
Comprehensive loss: Net loss (460,013) (460,013) (56,022) (516,035)Other comprehensive loss,
net of tax (Note 18):Net unrealized gains and
losses on securities (Note 6) (89,912) (89,912) (17,035) (106,947)Foreign currency
translation adjustments (77,149) (77,149) (24,436) (101,585)Pension liability
adjustments (Note 12) (117,790) (117,790) (1,118) (118,908)Net unrealized gains and
losses on derivative instruments (Note 20) (7,654) (7,654) (319) (7,973)Total comprehensive
loss (752,518) (98,930) (851,448)Purchase of treasury stock,
net, at cost (66) (66) (66)Balance at March 31, 2016 ¥ 439,901 ¥ 399,470 ¥ (76,782) ¥ (431,828) ¥ (1,887) ¥ 328,874 ¥ 343,384 ¥ 672,258
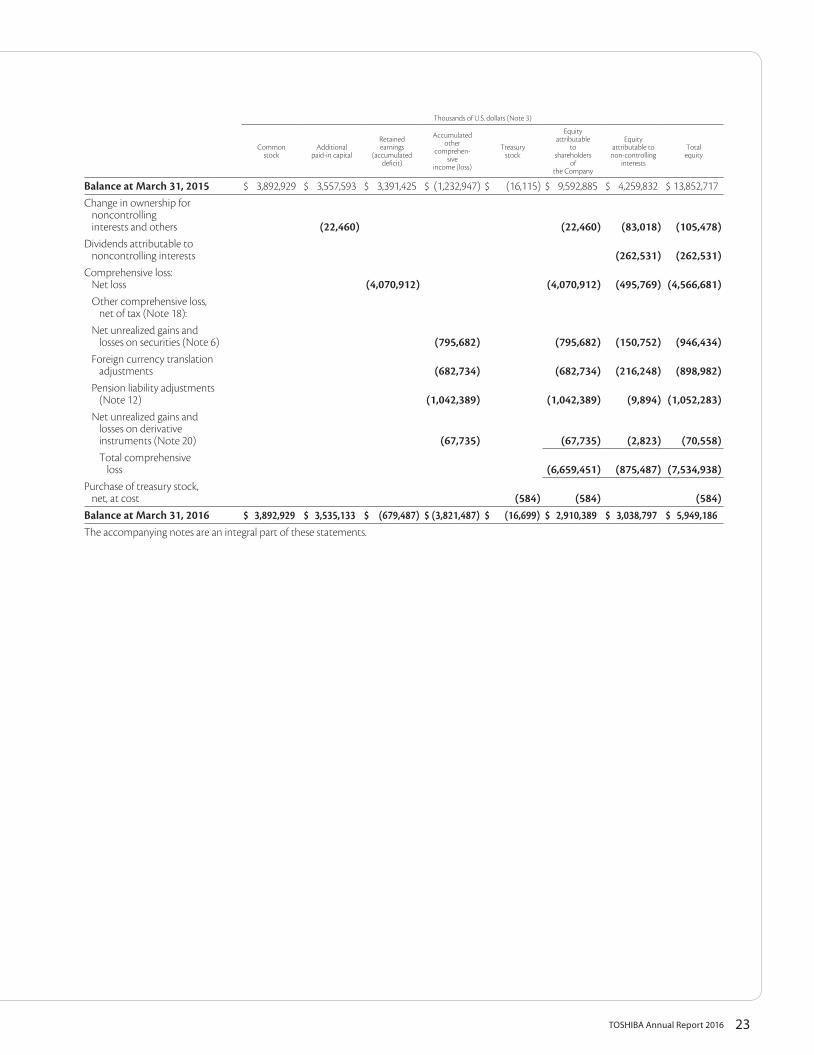
23TOSHIBA Annual Report 2016
Thousands of U.S. dollars (Note 3)
Commonstock
Additionalpaid-in capital
Retainedearnings
(accumulated deficit)
Accumulatedother
comprehen-sive
income (loss)
Treasurystock
Equityattributable
toshareholders
ofthe Company
Equityattributable to
non-controllinginterests
Totalequity
Balance at March 31, 2015 $ 3,892,929 $ 3,557,593 $ 3,391,425 $ (1,232,947) $ (16,115) $ 9,592,885 $ 4,259,832 $ 13,852,717Change in ownership for
noncontrolling interests and others (22,460) (22,460) (83,018) (105,478)
Dividends attributable to noncontrolling interests (262,531) (262,531)
Comprehensive loss: Net loss (4,070,912) (4,070,912) (495,769) (4,566,681)Other comprehensive loss,
net of tax (Note 18):Net unrealized gains and
losses on securities (Note 6) (795,682) (795,682) (150,752) (946,434)Foreign currency translation
adjustments (682,734) (682,734) (216,248) (898,982)Pension liability adjustments
(Note 12) (1,042,389) (1,042,389) (9,894) (1,052,283)Net unrealized gains and
losses on derivative instruments (Note 20) (67,735) (67,735) (2,823) (70,558)Total comprehensive
loss (6,659,451) (875,487) (7,534,938)Purchase of treasury stock,
net, at cost (584) (584) (584)Balance at March 31, 2016 $ 3,892,929 $ 3,535,133 $ (679,487) $ (3,821,487) $ (16,699) $ 2,910,389 $ 3,038,797 $ 5,949,186The accompanying notes are an integral part of these statements.
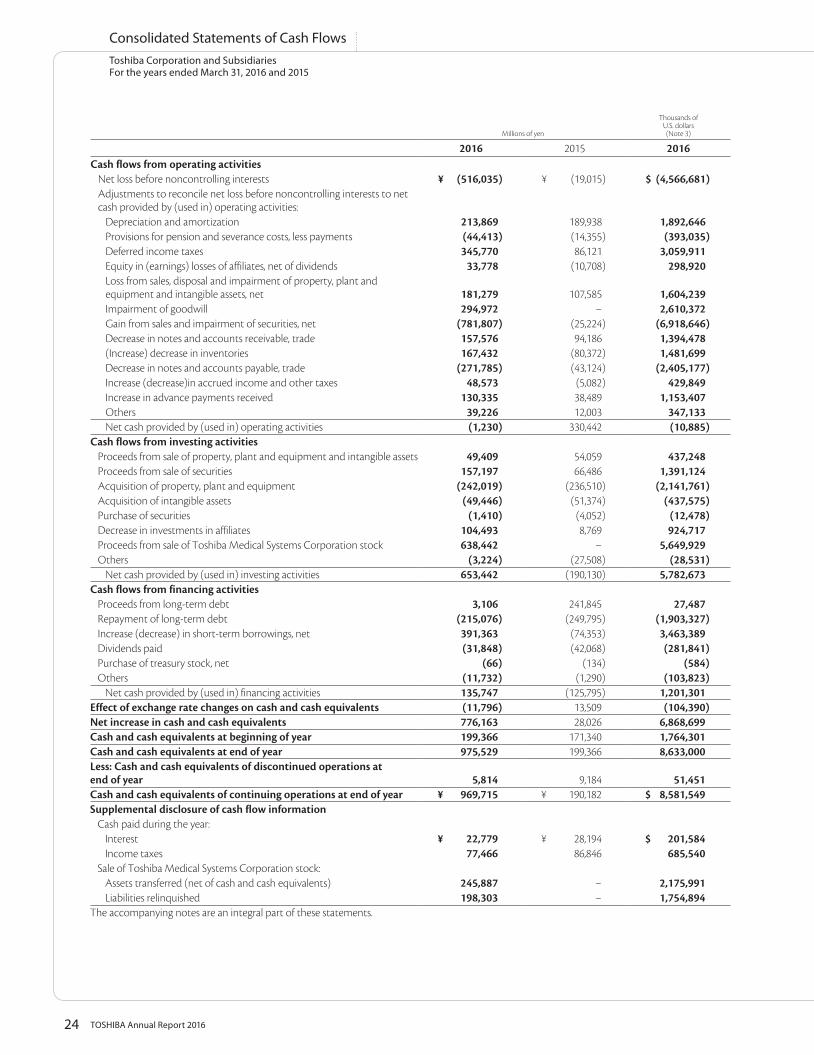
24 TOSHIBA Annual Report 2016
Toshiba Corporation and SubsidiariesFor the years ended March 31, 2016 and 2015
Consolidated Statements of Cash Flows
Millions of yen
Thousands ofU.S. dollars(Note 3)
2016 2015 2016Cash flows from operating activities
Net loss before noncontrolling interests ¥ (516,035) ¥ (19,015) $ (4,566,681)Adjustments to reconcile net loss before noncontrolling interests to net cash provided by (used in) operating activities:
Depreciation and amortization 213,869 189,938 1,892,646Provisions for pension and severance costs, less payments (44,413) (14,355) (393,035)Deferred income taxes 345,770 86,121 3,059,911Equity in (earnings) losses of affiliates, net of dividends 33,778 (10,708) 298,920Loss from sales, disposal and impairment of property, plant and equipment and intangible assets, net 181,279 107,585 1,604,239Impairment of goodwill 294,972 − 2,610,372Gain from sales and impairment of securities, net (781,807) (25,224) (6,918,646)Decrease in notes and accounts receivable, trade 157,576 94,186 1,394,478(Increase) decrease in inventories 167,432 (80,372) 1,481,699Decrease in notes and accounts payable, trade (271,785) (43,124) (2,405,177)Increase (decrease)in accrued income and other taxes 48,573 (5,082) 429,849Increase in advance payments received 130,335 38,489 1,153,407Others 39,226 12,003 347,133Net cash provided by (used in) operating activities (1,230) 330,442 (10,885)
Cash flows from investing activitiesProceeds from sale of property, plant and equipment and intangible assets 49,409 54,059 437,248Proceeds from sale of securities 157,197 66,486 1,391,124Acquisition of property, plant and equipment (242,019) (236,510) (2,141,761)Acquisition of intangible assets (49,446) (51,374) (437,575)Purchase of securities (1,410) (4,052) (12,478)Decrease in investments in affiliates 104,493 8,769 924,717Proceeds from sale of Toshiba Medical Systems Corporation stock 638,442 − 5,649,929Others (3,224) (27,508) (28,531)
Net cash provided by (used in) investing activities 653,442 (190,130) 5,782,673Cash flows from financing activities
Proceeds from long-term debt 3,106 241,845 27,487Repayment of long-term debt (215,076) (249,795) (1,903,327)Increase (decrease) in short-term borrowings, net 391,363 (74,353) 3,463,389Dividends paid (31,848) (42,068) (281,841)Purchase of treasury stock, net (66) (134) (584)Others (11,732) (1,290) (103,823)
Net cash provided by (used in) financing activities 135,747 (125,795) 1,201,301Effect of exchange rate changes on cash and cash equivalents (11,796) 13,509 (104,390)Net increase in cash and cash equivalents 776,163 28,026 6,868,699Cash and cash equivalents at beginning of year 199,366 171,340 1,764,301Cash and cash equivalents at end of year 975,529 199,366 8,633,000Less: Cash and cash equivalents of discontinued operations at end of year 5,814 9,184 51,451Cash and cash equivalents of continuing operations at end of year ¥ 969,715 ¥ 190,182 $ 8,581,549Supplemental disclosure of cash flow information
Cash paid during the year:Interest ¥ 22,779 ¥ 28,194 $ 201,584Income taxes 77,466 86,846 685,540
Sale of Toshiba Medical Systems Corporation stock:Assets transferred (net of cash and cash equivalents) 245,887 − 2,175,991Liabilities relinquished 198,303 − 1,754,894
The accompanying notes are an integral part of these statements.
25TOSHIBA Annual Report 2016
Toshiba Corporation and SubsidiariesMarch 31, 2016
Notes to Consolidated Financial Statements
1. DESCRIPTION OF BUSINESS
Toshiba Corporation (“the Company”) and its subsidiaries (hereinafter collectively, “the Group”) are engaged in research and development, manufacturing and sales of high-technology electronic and energy products, which range (1)Energy & Infrastructure, (2)Community Solutions, (3)Electronic Devices & Components, (4)Lifestyle Products & Services, and (5)Others. For the year ended March 31, 2016, sales of Energy & Infrastructure represented the most significant portion of the Group’s total sales or approximately 33 percent. Electronic Devices & Components, second to Energy & Infrastructure, represented approximately 26 percent, Community Solutions approximately 23 percent, Lifestyle Products & Services approximately 9 percent of the Group’s total sales. For the year ended March 31, 2015, sales of Energy & Infrastructure represented the most significant portion of the Group’s total sales or approximately 30 percent. Electronic Devices & Components represented approximately 27 percent, Community Solutions approximately 21 percent, Lifestyle Products & Services approximately 14 percent of the Group’s total sales. The Group’s products are manufactured and marketed throughout the world with approximately 41 percent and 39 percent of its sales in Japan for the years ended March 31, 2016 and 2015, respectively, and the remainder in Asia, North America, Europe and other parts of the world.
2. SUMMARY OF SIGNIFICANT ACCOUNTING POLICIES
PREPARATION OF FINANCIAL STATEMENTSThe Company and its domestic subsidiaries maintain their records and prepare their financial statements in accordance with accounting principles generally accepted in Japan, and its foreign subsidiaries in conformity with those of the countries of their domicile. Certain adjustments and reclassifications have been incorporated in the accompanying consolidated financial statements to conform with accounting principles generally accepted in the United States. These adjustments were not recorded in the statutory books of account.
BASIS OF CONSOLIDATION AND INVESTMENTS IN AFFILIATESThe consolidated financial statements include the accounts of the Company, its majority-owned subsidiaries and variable interest entities (“VIEs”) for which the Group is the primary beneficiary in accordance with the Accounting Standards Codification (“ASC”) No.810 “Consolidation” (“ASC No.810”). All significant intra-entity transactions and account balances are eliminated in consolidation. Investments in affiliates over which the Group has the ability to exercise significant influence are accounted for under the equity method of accounting. Net income (loss) attributable to shareholders of the Company includes its equity in the current net income (loss) of such companies after elimination of unrealized intra-entity gains. The proportionate share of the income or loss of some companies accounted for under the equity method is recognized from the most recent available financial statements.
USE OF ESTIMATESThe preparation of the consolidated financial statements in conformity with accounting principles generally accepted in the United States requires management to make estimates and assumptions that affect the reported amounts of assets and liabilities, disclosure of contingent assets and liabilities at the date of the consolidated financial statements and the reported amounts of revenues and expenses during the reporting periods. The Group has identified significant areas where it believes assumptions and estimates are particularly critical to the consolidated financial statements. These are determination of impairment on long-lived tangible and intangible assets and goodwill, recoverability of receivables, realization of deferred tax assets, uncertain tax positions, pension accounting measurement, revenue recognition and other valuation allowances and reserves including contingencies for litigations. Actual results could differ from those estimates.
CASH EQUIVALENTSAll highly liquid investments with original maturities of 3 months or less at the date of purchase are considered to be cash equivalents.
FOREIGN CURRENCY TRANSLATIONThe assets and liabilities of foreign consolidated subsidiaries and affiliates that operate in a local currency environment are translated into Japanese yen at applicable current exchange rates at year end. Income and expense items are translated at average exchange rates prevailing during the year. The effects of these translation adjustments are included in accumulated other comprehensive income (loss) and reported as a component of equity. Exchange gains and losses resulting from foreign currency transactions and translation of assets and liabilities denominated in foreign currencies are included in other income or other expense in the consolidated statements of operations.
ALLOWANCE FOR DOUBTFUL RECEIVABLESAn allowance for doubtful trade receivables is recorded based on a combination of the write-off history, aging analysis and an evaluation of any specific known troubled accounts. When all collection efforts are exhausted including legal
26 TOSHIBA Annual Report 2016
Toshiba Corporation and SubsidiariesMarch 31, 2016
Notes to Consolidated Financial Statements
recourse, the accounts or portions thereof are deemed to be uncollectible and charged against the allowance.
MARKETABLE SECURITIES AND OTHER INVESTMENTSThe Group classifies all of its marketable securities as available-for-sale which are reported at fair value, with unrealized gains and losses included in accumulated other comprehensive income (loss), net of tax. Other investments without quoted market prices are stated at cost. Realized gains or losses on the sale of securities are based on the average cost of a particular security held at the time of sale. Marketable securities and other investment securities are regularly reviewed for other-than-temporary impairments in carrying amount based on criteria that include the length of time and the extent to which the market value has been less than cost, the financial condition and near-term prospects of the issuer and the Group’s intent and ability to retain marketable securities and investment securities for a period of time sufficient to allow for any anticipated recovery in market value. When such a decline exists, the Group recognizes an impairment loss to the extent of such decline.
INVENTORIESRaw materials, finished products and work in process for products are stated at the lower of cost or net realizable value, cost being determined principally by the average method. Finished products and work in process for contract items are stated at the lower of cost or estimated realizable value, cost being determined by accumulated production costs. In accordance with general industry practice, items with long manufacturing periods are included in inventories even when not realizable within one year.
PROPERTY, PLANT AND EQUIPMENTProperty, plant and equipment, including significant renewals and additions, are carried at cost. Depreciation for property, plant and equipment is computed generally by the straight-line method. The estimated useful lives of buildings are 3 to 60 years, and those of machinery and equipment are 2 to 20 years. Maintenance and repairs, including minor renewals and betterments, are expensed as incurred.
IMPAIRMENT OF LONG-LIVED ASSETSLong-lived assets, other than goodwill and intangible assets with indefinite useful lives, are evaluated for impairment using an estimate of undiscounted cash flows whenever events or changes in circumstances indicate that the carrying amount of such asset may not be recoverable. If the estimate of undiscounted cash flow is less than the carrying amount of the asset, an impairment loss is recorded based on the fair value of the asset. Fair value is determined primarily by using the anticipated cash flows discounted at a rate commensurate with the risk involved. For assets held for sale, an impairment loss is further increased by costs to sell. Long-lived assets to be disposed of other than by sale are considered held and used until disposed of.
GOODWILL AND OTHER INTANGIBLE ASSETSGoodwill and intangible assets with indefinite useful lives are not amortized, but instead are tested for impairment at least annually. Goodwill is assigned to reporting units. If the carrying amount of a reporting unit exceeds its fair value, the implied fair value of goodwill is calculated. If the carrying amount of reporting unit goodwill exceeds the implied fair value of that goodwill, an impairment loss shall be recognized in an amount equal to that excess. The annual goodwill measurement dates are October 1 for the reporting unit related to the Nuclear Power Systems business and January 1 for other reporting units. In addition to the annual impairment test, an impairment test is performed if any situation that indicates a decline in enterprise market capitalization (for example, adverse change in the business climate, etc.) arises. Intangible assets with finite useful lives, consisting primarily of core and current technology and software, are amortized using the straight-line method over their respective contractual periods or estimated useful lives.
ENVIRONMENTAL LIABILITIESLiabilities for environmental remediation and other environmental costs are accrued when environmental assessments or remedial efforts are probable and the costs can be reasonably estimated, based on current law and existing technologies. Such liabilities are adjusted as further information develops or circumstances change. Costs of future obligations are not discounted to their present values.
INCOME TAXESThe provision for income taxes is computed based on the income (loss) from continuing operations, before income taxes and noncontrolling interests included in the consolidated statements of operations. Deferred income taxes are recorded to reflect the expected future tax consequences of temporary differences between the tax basis of assets and liabilities and their reported amounts in the financial statements, and are measured by applying currently enacted tax laws. The effect on deferred tax assets and liabilities of a change in tax rates is recognized in income in the period that a law regarding the change is enacted. Valuation allowances are recorded to reduce deferred tax assets when it is more likely than not that a tax benefit will not be realized. The Group recognizes the financial statement effects of tax positions when they are more likely than not, based on the technical merits, that the tax positions will be sustained upon examination by the tax authorities. Benefits from tax
27TOSHIBA Annual Report 2016
positions that meet the more-likely-than-not recognition threshold are measured at the largest amount of benefit that is greater than 50 percent likely of being realized upon settlement.
ACCRUED PENSION AND SEVERANCE COSTSThe Company and certain subsidiaries have various retirement benefit plans covering substantially all employees. Prior service costs resulting from amendments to the plans are amortized over the average remaining service period of employees expected to receive benefits. Unrecognized actuarial gains and losses that exceed 10 percent of the greater of the projected benefit obligation or the fair value of plan assets are also amortized over the average remaining service period of employees expected to receive benefits.
NET EARNINGS (LOSS) PER SHARE ATTRIBUTABLE TO SHAREHOLDERS OF THE COMPANYBasic net earnings (loss) per share attributable to shareholders of the Company (“EPS”) are computed based on the weighted-average number of shares of common stock outstanding during each period.
REVENUE RECOGNITIONRevenue of mass-produced standard products, such as Electronic Devices & Components and Lifestyle Products & Services, is recognized when there is persuasive evidence of an arrangement, the product has been delivered, the sales price is fixed or determinable, and collectibility is reasonably assured. Mass-produced standard products are considered delivered to customers once they have been shipped, and the title and risk of loss have transferred. Revenue related to equipment that requires installation, such as Energy & Infrastructure, is recognized when the installation of the equipment is completed, the equipment is accepted by the customer and other specific criteria of the equipment are demonstrated by the Group. Revenue from services, such as maintenance service for plant and other systems, that are priced and sold separately from the equipment is recognized ratably over the contract term or as the services are provided. Revenue on long-term contracts is recorded under the percentage of completion method. To measure the extent of progress toward completion, the Group generally compares the costs incurred to date to the estimated total costs to complete based upon the most recent available information. When estimates of the extent of progress toward completion and contract costs are reasonably dependable, revenue from the contract is recognized based on the percentage of completion. A provision for contract losses is recorded in its entirety when the loss first becomes evident. The Company has recognized revenue from several claims and unapproved change orders where the amounts can be estimated reliably, realization is probable and there is a legal basis for recognition. Revenue is recorded only to the extent that costs associated with claims or unapproved change orders have been incurred. Recognized revenue from several claims and unapproved change orders was approximately ¥8,785 million ($77,743 thousand) in long-term receivables and ¥42,303 million ($374,363 thousand) in prepaid expenses and other current assets on the consolidated balance sheet as of March 31, 2016, and ¥54,745 million in prepaid expenses and other current assets on the consolidated balance sheet as of March 31, 2015, respectively. Revenue from arrangements with multiple elements, which may include any combination of products, equipment, installment and maintenance, is allocated to each element based on its relative selling price if such element meets the criteria for treatment as a separate unit of accounting as prescribed in ASC No. 605 “Revenue Recognition.” Otherwise, revenue is deferred until the undelivered elements are fulfilled as a single unit of accounting. Revenue from the development of custom software products is recognized when there is persuasive evidence of an arrangement, the sales price is fixed or determinable, collectibility is probable, and the software product has been delivered and accepted by the customer.
SHIPPING AND HANDLING COSTSThe Group includes shipping and handling costs, which totaled ¥70,552 million ($624,354 thousand) and ¥71,519 million for the years ended March 31, 2016 and 2015, respectively, in selling, general and administrative expenses.
DERIVATIVE FINANCIAL INSTRUMENTSThe Group uses a variety of derivative financial instruments, which include forward exchange contracts, interest rate swap agreements, currency swap agreements and currency options for the purpose of currency exchange rate and interest rate risk management. Refer to Note 20 for descriptions of these financial instruments. The Group recognizes all derivative financial instruments, such as forward exchange contracts, interest rate swap agreements, currency swap agreements and currency options in the consolidated financial statements at fair value regardless of the purpose or intent for holding the derivative financial instruments. Changes in the fair value of derivative financial instruments are either recognized periodically in income or in equity as a component of accumulated other comprehensive income (loss) depending on whether the derivative financial instruments qualify for hedge accounting, and if so, whether they qualify as a fair value hedge or a cash flow hedge. Changes in fair value of derivative financial instruments accounted for as fair value hedges are recorded in income along with the portion of the change in the fair value of the hedged item that relates to the hedged risk. Changes in fair value of derivative financial instruments accounted for as cash flow hedges, to the extent they are effective as a hedge, are recorded in accumulated other
28 TOSHIBA Annual Report 2016
Toshiba Corporation and SubsidiariesMarch 31, 2016
Notes to Consolidated Financial Statements
comprehensive income (loss), net of tax. Changes in the fair value of derivative financial instruments not qualifying as a hedge are reported in income.
SALES OF RECEIVABLESThe Group has transferred certain trade notes and accounts receivable under several securitization programs. When a transfer of financial assets is eligible to be accounted for as a sale under ASC No.860 “Transfers and Servicing” (“ASC No.860”), these securitization transactions are accounted for as a sale and the receivables sold under these facilities are excluded from the accompanying consolidated balance sheets.
ASSET RETIREMENT OBLIGATIONSThe Group records asset retirement obligations at fair value in the period incurred. The fair value of the liability is added to the carrying amount of the associated asset. This additional carrying amount is then depreciated over the life of the asset. The liability increases due to the passage of time based on the time value of money until the obligation is settled. Subsequent to the initial recognition, the liability is adjusted for any revisions to the expected amount of the retirement obligation, and for accretion of the liability due to the passage of time.
NEW ACCOUNTING STANDARDSThe Company adopted Accounting Standards Update (“ASU”) No.2014-08 “Presentation of Financial Statements and Property, Plant, and Equipment - Reporting Discontinued Operations and Disclosures of Disposals of Components of an Entity” from the fiscal year beginning on April 1, 2015. ASU No.2014-08 amends ASC No.205-20 “Presentation of Financial Statements - Discontinued Operations” (“ASC No.205-20”), changes the requirements for reporting discontinued operations in ASC No.205-20 and requires a company to provide information on cash flows related to its discontinued operations as well as additional disclosure about disposals of significant components of an entity that do not qualify for discontinued operations presentation. In response, Note “4. Discontinued Operations” discloses information on discontinued operations pursuant to ASU 2014-08. In September 2015, the Financial Accounting Standards Board (“FASB”) issued ASU No.2015-16 “Business Combinations - Simplifying the Accounting for Measurement-Period Adjustments.” To simplify the accounting for adjustments made to provisional amounts during a measurement period recognized in a business combination, ASU No.2015-16 eliminates the requirement to retrospectively account for those adjustments. The amendments in this update require that an acquirer recognize adjustments to provisional amounts that are identified during the measurement period in the reporting period in which the amounts of the adjustments are determined. The Company early adopted ASU No.2015-16 from the third quarter of the fiscal year ended March 31, 2016, which began on October 1, 2015. The Company is currently evaluating the impact of adoption of ASU No.2015-16 on the Company’s financial position and operating results.
RECENT PRONOUNCEMENTSIn May 2014, the FASB issued ASU No.2014-09 “Revenue from Contracts with Customers.” ASU No.2014-09 supersedes the revenue recognition requirements, and affects any entity that either enters into contracts with customers to transfer goods or services or enters into contracts for the transfer of nonfinancial assets unless those contracts are within the scope of other standards. To achieve the core principle, an entity should apply the five steps. ASU No.2014-09 requires an entity to disclose the qualitative and quantitative information, contracts with customers, significant judgments and changes in judgments, and assets recognized from the costs to obtain or fulfill a contract. ASU No.2014-09 is effective for fiscal years beginning after December 15, 2017, and the Company will adopt ASU No.2014-09 effective April 1, 2018. The Company is currently evaluating the impact of adoption of ASU No.2014-09 on the Company’s financial position and operating results. In January 2016, the FASB issued ASU No.2016-01 “Recognition and Measurement of Financial Assets and Financial Liabilities.” ASU No. 2016-01 has made revisions concerning recognition, measurement, presentation and disclosure of financial instruments. The amendments in this update require equity investments to be measured at fair value with changes in fair value recognized in net income or loss. ASU No.2016-01 is effective for fiscal years beginning after December 15, 2017, and the Company will adopt ASU No.2016-01 effective April 1, 2018. The Company is currently evaluating the impact of adoption of ASU No.2016-01 on the Company’s financial position and operating results. In February 2016, the FASB issued ASU No.2016-02 “Leases.” ASU No. 2016-02 requires lessees to recognize lease assets and lease liabilities in the consolidated balance sheets, with some exceptions, in the lessee’s lease agreements that are classified as operating leases. ASU No.2016-02 is effective for fiscal years beginning after December 15, 2018, and the Company will adopt ASU No.2016-02 effective April 1, 2019. The Company is currently evaluating the impact of adoption of ASU No.2016-02 on the Company’s financial position and operating results.
SUBSEQUENT EVENTSThe Group has evaluated subsequent events up to June 22, 2016 in accordance with ASC No.855 “Subsequent Events.”
RECLASSIFICATIONSCertain reclassifications to the prior year’s consolidated financial statements and related footnote amounts have been made to conform to the presentation for the current year.
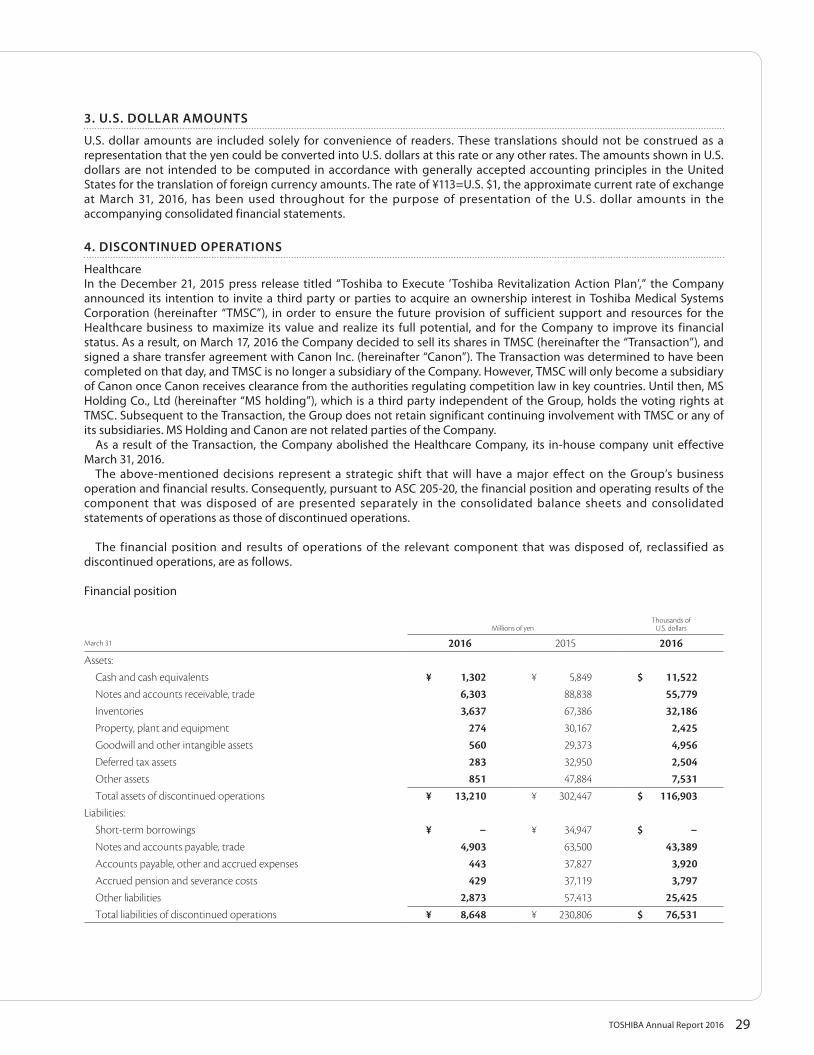
29TOSHIBA Annual Report 2016
3. U.S. DOLLAR AMOUNTS
U.S. dollar amounts are included solely for convenience of readers. These translations should not be construed as a representation that the yen could be converted into U.S. dollars at this rate or any other rates. The amounts shown in U.S. dollars are not intended to be computed in accordance with generally accepted accounting principles in the United States for the translation of foreign currency amounts. The rate of ¥113=U.S. $1, the approximate current rate of exchange at March 31, 2016, has been used throughout for the purpose of presentation of the U.S. dollar amounts in the accompanying consolidated financial statements.
4. DISCONTINUED OPERATIONS
HealthcareIn the December 21, 2015 press release titled “Toshiba to Execute ’Toshiba Revitalization Action Plan’,” the Company announced its intention to invite a third party or parties to acquire an ownership interest in Toshiba Medical Systems Corporation (hereinafter “TMSC”), in order to ensure the future provision of sufficient support and resources for the Healthcare business to maximize its value and realize its full potential, and for the Company to improve its financial status. As a result, on March 17, 2016 the Company decided to sell its shares in TMSC (hereinafter the “Transaction”), and signed a share transfer agreement with Canon Inc. (hereinafter “Canon”). The Transaction was determined to have been completed on that day, and TMSC is no longer a subsidiary of the Company. However, TMSC will only become a subsidiary of Canon once Canon receives clearance from the authorities regulating competition law in key countries. Until then, MS Holding Co., Ltd (hereinafter “MS holding”), which is a third party independent of the Group, holds the voting rights at TMSC. Subsequent to the Transaction, the Group does not retain significant continuing involvement with TMSC or any of its subsidiaries. MS Holding and Canon are not related parties of the Company. As a result of the Transaction, the Company abolished the Healthcare Company, its in-house company unit effective March 31, 2016. The above-mentioned decisions represent a strategic shift that will have a major effect on the Group’s business operation and financial results. Consequently, pursuant to ASC 205-20, the financial position and operating results of the component that was disposed of are presented separately in the consolidated balance sheets and consolidated statements of operations as those of discontinued operations.
The financial position and results of operations of the relevant component that was disposed of, reclassified as discontinued operations, are as follows.
Financial position
Millions of yenThousands of
U.S. dollars
March 31 2016 2015 2016Assets:
Cash and cash equivalents ¥ 1,302 ¥ 5,849 $ 11,522Notes and accounts receivable, trade 6,303 88,838 55,779Inventories 3,637 67,386 32,186Property, plant and equipment 274 30,167 2,425Goodwill and other intangible assets 560 29,373 4,956Deferred tax assets 283 32,950 2,504Other assets 851 47,884 7,531Total assets of discontinued operations ¥ 13,210 ¥ 302,447 $ 116,903
Liabilities:Short-term borrowings ¥ − ¥ 34,947 $ −Notes and accounts payable, trade 4,903 63,500 43,389Accounts payable, other and accrued expenses 443 37,827 3,920Accrued pension and severance costs 429 37,119 3,797Other liabilities 2,873 57,413 25,425Total liabilities of discontinued operations ¥ 8,648 ¥ 230,806 $ 76,531
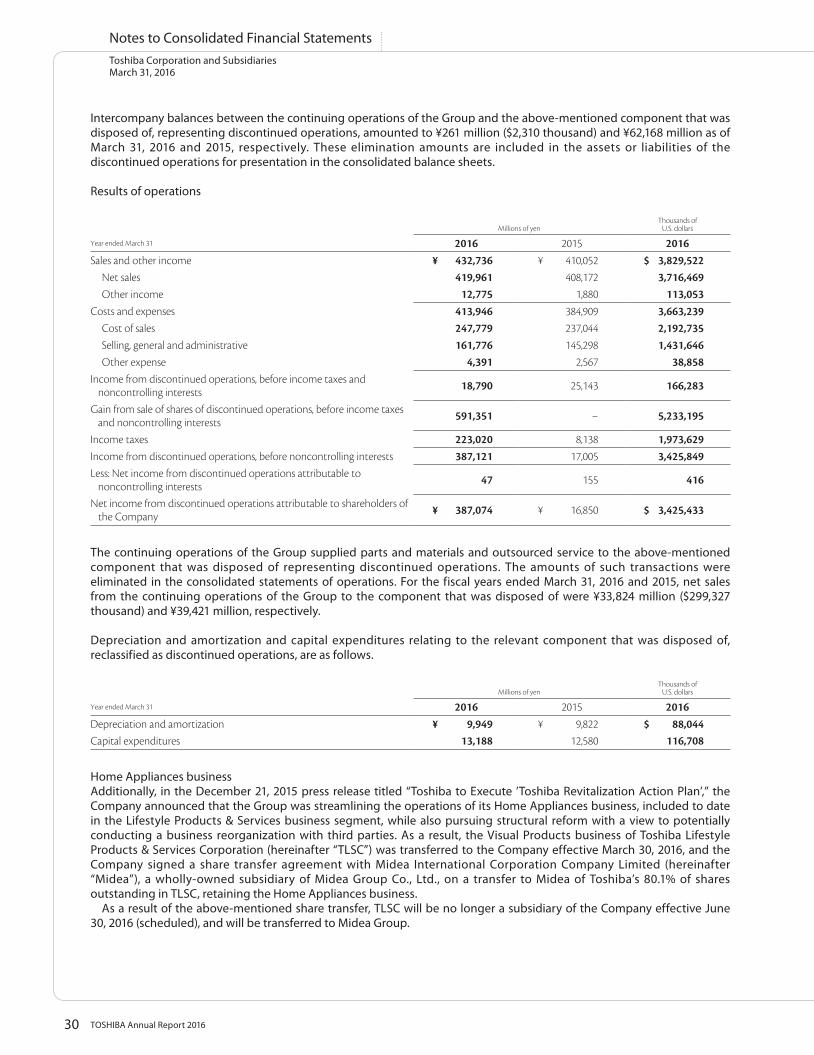
30 TOSHIBA Annual Report 2016
Toshiba Corporation and SubsidiariesMarch 31, 2016
Notes to Consolidated Financial Statements
Intercompany balances between the continuing operations of the Group and the above-mentioned component that was disposed of, representing discontinued operations, amounted to ¥261 million ($2,310 thousand) and ¥62,168 million as of March 31, 2016 and 2015, respectively. These elimination amounts are included in the assets or liabilities of the discontinued operations for presentation in the consolidated balance sheets.
Results of operations
Millions of yenThousands of
U.S. dollars
Year ended March 31 2016 2015 2016Sales and other income ¥ 432,736 ¥ 410,052 $ 3,829,522
Net sales 419,961 408,172 3,716,469Other income 12,775 1,880 113,053
Costs and expenses 413,946 384,909 3,663,239Cost of sales 247,779 237,044 2,192,735Selling, general and administrative 161,776 145,298 1,431,646Other expense 4,391 2,567 38,858
Income from discontinued operations, before income taxes and noncontrolling interests 18,790 25,143 166,283
Gain from sale of shares of discontinued operations, before income taxes and noncontrolling interests 591,351 − 5,233,195
Income taxes 223,020 8,138 1,973,629Income from discontinued operations, before noncontrolling interests 387,121 17,005 3,425,849Less: Net income from discontinued operations attributable to
noncontrolling interests 47 155 416
Net income from discontinued operations attributable to shareholders of the Company ¥ 387,074 ¥ 16,850 $ 3,425,433
The continuing operations of the Group supplied parts and materials and outsourced service to the above-mentioned component that was disposed of representing discontinued operations. The amounts of such transactions were eliminated in the consolidated statements of operations. For the fiscal years ended March 31, 2016 and 2015, net sales from the continuing operations of the Group to the component that was disposed of were ¥33,824 million ($299,327 thousand) and ¥39,421 million, respectively.
Depreciation and amortization and capital expenditures relating to the relevant component that was disposed of, reclassified as discontinued operations, are as follows.
Millions of yenThousands of
U.S. dollars
Year ended March 31 2016 2015 2016Depreciation and amortization ¥ 9,949 ¥ 9,822 $ 88,044Capital expenditures 13,188 12,580 116,708
Home Appliances businessAdditionally, in the December 21, 2015 press release titled “Toshiba to Execute ’Toshiba Revitalization Action Plan’,” the Company announced that the Group was streamlining the operations of its Home Appliances business, included to date in the Lifestyle Products & Services business segment, while also pursuing structural reform with a view to potentially conducting a business reorganization with third parties. As a result, the Visual Products business of Toshiba Lifestyle Products & Services Corporation (hereinafter “TLSC”) was transferred to the Company effective March 30, 2016, and the Company signed a share transfer agreement with Midea International Corporation Company Limited (hereinafter “Midea”), a wholly-owned subsidiary of Midea Group Co., Ltd., on a transfer to Midea of Toshiba’s 80.1% of shares outstanding in TLSC, retaining the Home Appliances business. As a result of the above-mentioned share transfer, TLSC will be no longer a subsidiary of the Company effective June 30, 2016 (scheduled), and will be transferred to Midea Group.
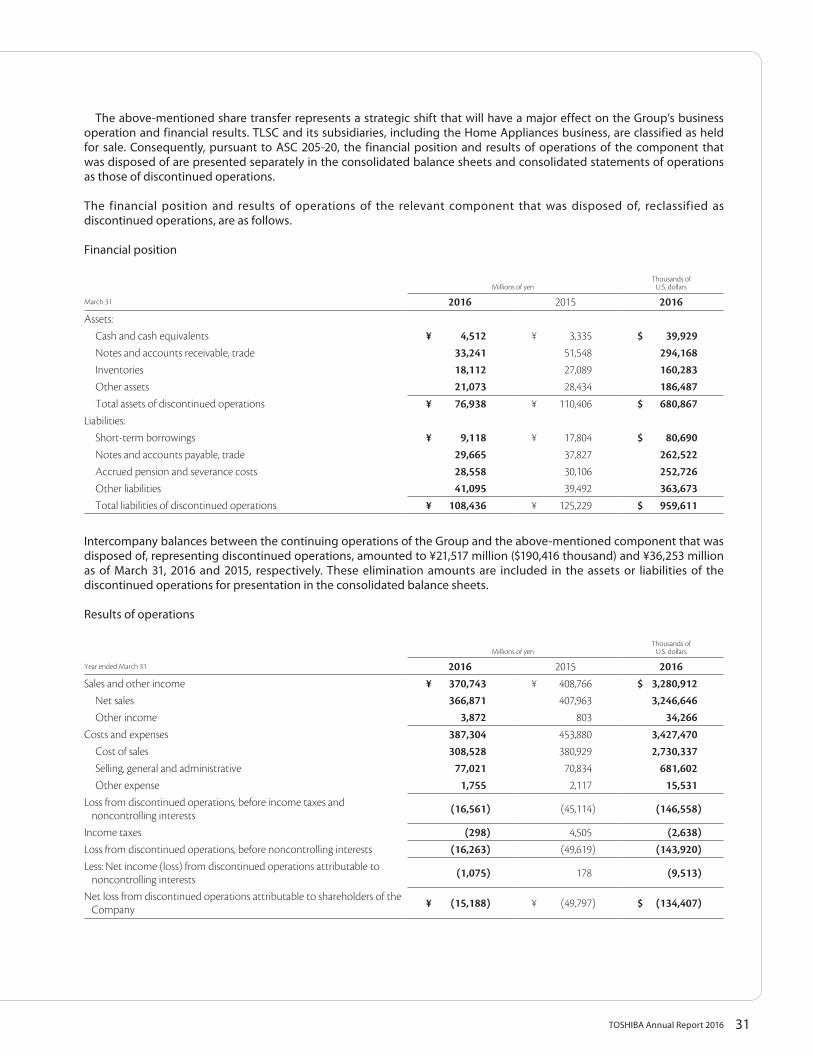
31TOSHIBA Annual Report 2016
The above-mentioned share transfer represents a strategic shift that will have a major effect on the Group’s business operation and financial results. TLSC and its subsidiaries, including the Home Appliances business, are classified as held for sale. Consequently, pursuant to ASC 205-20, the financial position and results of operations of the component that was disposed of are presented separately in the consolidated balance sheets and consolidated statements of operations as those of discontinued operations.
The financial position and results of operations of the relevant component that was disposed of, reclassified as discontinued operations, are as follows.
Financial position
Millions of yenThousands of
U.S. dollars
March 31 2016 2015 2016Assets:
Cash and cash equivalents ¥ 4,512 ¥ 3,335 $ 39,929Notes and accounts receivable, trade 33,241 51,548 294,168Inventories 18,112 27,089 160,283Other assets 21,073 28,434 186,487Total assets of discontinued operations ¥ 76,938 ¥ 110,406 $ 680,867
Liabilities:Short-term borrowings ¥ 9,118 ¥ 17,804 $ 80,690Notes and accounts payable, trade 29,665 37,827 262,522Accrued pension and severance costs 28,558 30,106 252,726Other liabilities 41,095 39,492 363,673Total liabilities of discontinued operations ¥ 108,436 ¥ 125,229 $ 959,611
Intercompany balances between the continuing operations of the Group and the above-mentioned component that was disposed of, representing discontinued operations, amounted to ¥21,517 million ($190,416 thousand) and ¥36,253 million as of March 31, 2016 and 2015, respectively. These elimination amounts are included in the assets or liabilities of the discontinued operations for presentation in the consolidated balance sheets.
Results of operations
Millions of yenThousands of
U.S. dollars
Year ended March 31 2016 2015 2016Sales and other income ¥ 370,743 ¥ 408,766 $ 3,280,912
Net sales 366,871 407,963 3,246,646Other income 3,872 803 34,266
Costs and expenses 387,304 453,880 3,427,470Cost of sales 308,528 380,929 2,730,337Selling, general and administrative 77,021 70,834 681,602Other expense 1,755 2,117 15,531
Loss from discontinued operations, before income taxes and noncontrolling interests (16,561) (45,114) (146,558)
Income taxes (298) 4,505 (2,638)Loss from discontinued operations, before noncontrolling interests (16,263) (49,619) (143,920)Less: Net income (loss) from discontinued operations attributable to
noncontrolling interests (1,075) 178 (9,513)
Net loss from discontinued operations attributable to shareholders of the Company ¥ (15,188) ¥ (49,797) $ (134,407)
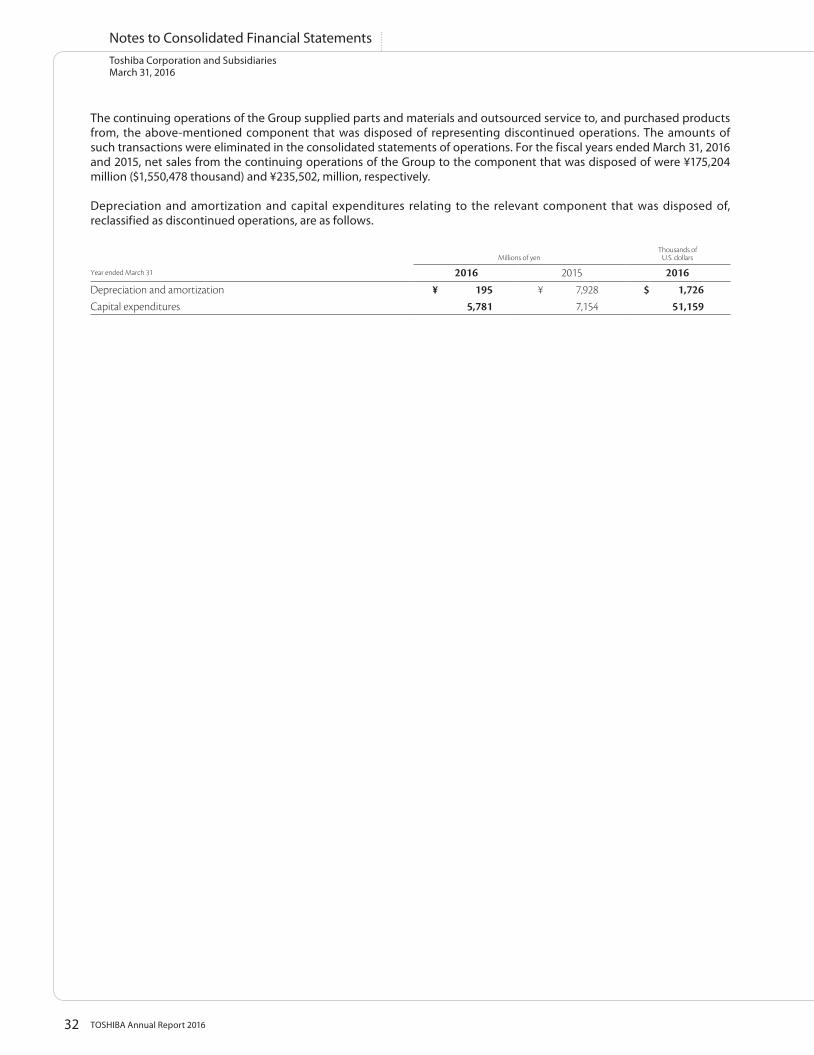
32 TOSHIBA Annual Report 2016
Toshiba Corporation and SubsidiariesMarch 31, 2016
Notes to Consolidated Financial Statements
The continuing operations of the Group supplied parts and materials and outsourced service to, and purchased products from, the above-mentioned component that was disposed of representing discontinued operations. The amounts of such transactions were eliminated in the consolidated statements of operations. For the fiscal years ended March 31, 2016 and 2015, net sales from the continuing operations of the Group to the component that was disposed of were ¥175,204 million ($1,550,478 thousand) and ¥235,502, million, respectively.
Depreciation and amortization and capital expenditures relating to the relevant component that was disposed of, reclassified as discontinued operations, are as follows.
Millions of yenThousands of
U.S. dollars
Year ended March 31 2016 2015 2016Depreciation and amortization ¥ 195 ¥ 7,928 $ 1,726Capital expenditures 5,781 7,154 51,159
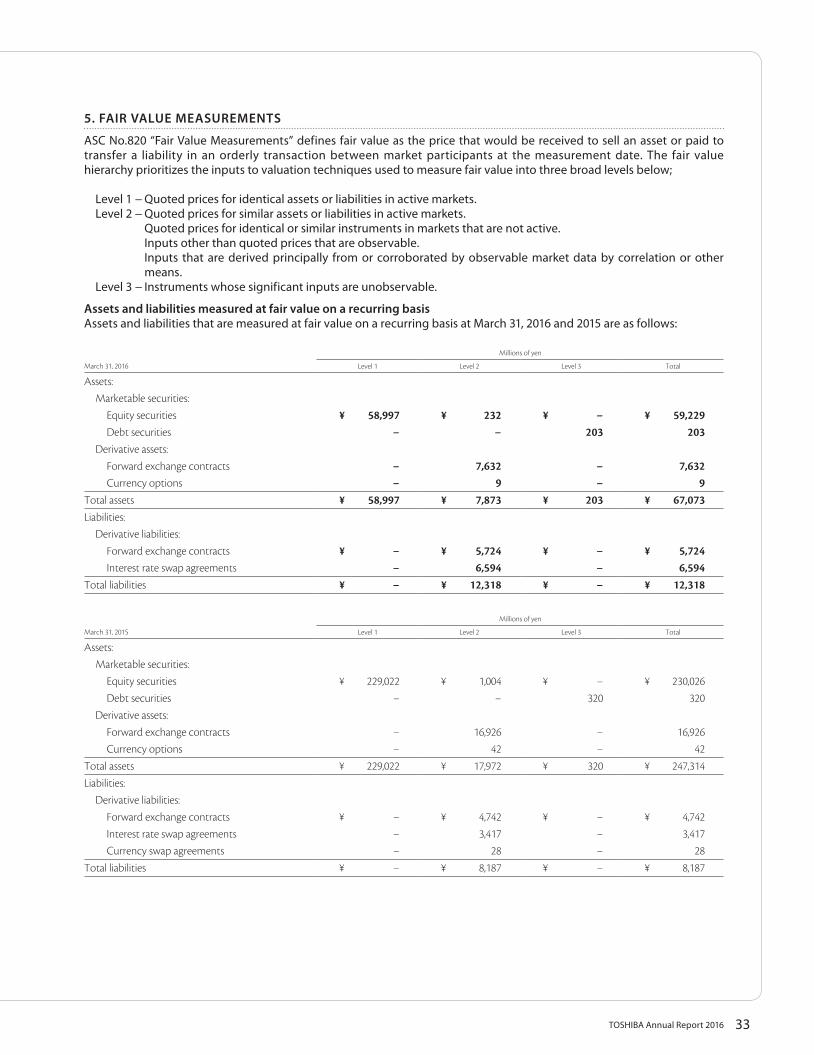
33TOSHIBA Annual Report 2016
5. FAIR VALUE MEASUREMENTS
ASC No.820 “Fair Value Measurements” defines fair value as the price that would be received to sell an asset or paid to transfer a liability in an orderly transaction between market participants at the measurement date. The fair value hierarchy prioritizes the inputs to valuation techniques used to measure fair value into three broad levels below;
Level 1 − Quoted prices for identical assets or liabilities in active markets.Level 2 − Quoted prices for similar assets or liabilities in active markets. Quoted prices for identical or similar instruments in markets that are not active. Inputs other than quoted prices that are observable. Inputs that are derived principally from or corroborated by observable market data by correlation or other
means.Level 3 − Instruments whose significant inputs are unobservable.
Assets and liabilities measured at fair value on a recurring basisAssets and liabilities that are measured at fair value on a recurring basis at March 31, 2016 and 2015 are as follows:
Millions of yen
March 31, 2016 Level 1 Level 2 Level 3 Total
Assets:Marketable securities:
Equity securities ¥ 58,997 ¥ 232 ¥ − ¥ 59,229Debt securities − − 203 203
Derivative assets:Forward exchange contracts − 7,632 − 7,632Currency options − 9 − 9
Total assets ¥ 58,997 ¥ 7,873 ¥ 203 ¥ 67,073Liabilities:
Derivative liabilities:Forward exchange contracts ¥ − ¥ 5,724 ¥ − ¥ 5,724Interest rate swap agreements − 6,594 − 6,594
Total liabilities ¥ − ¥ 12,318 ¥ − ¥ 12,318
Millions of yen
March 31, 2015 Level 1 Level 2 Level 3 Total
Assets:Marketable securities:
Equity securities ¥ 229,022 ¥ 1,004 ¥ − ¥ 230,026Debt securities − − 320 320
Derivative assets:Forward exchange contracts − 16,926 − 16,926Currency options − 42 − 42
Total assets ¥ 229,022 ¥ 17,972 ¥ 320 ¥ 247,314
Liabilities:Derivative liabilities:
Forward exchange contracts ¥ − ¥ 4,742 ¥ − ¥ 4,742Interest rate swap agreements − 3,417 − 3,417Currency swap agreements − 28 − 28
Total liabilities ¥ − ¥ 8,187 ¥ − ¥ 8,187
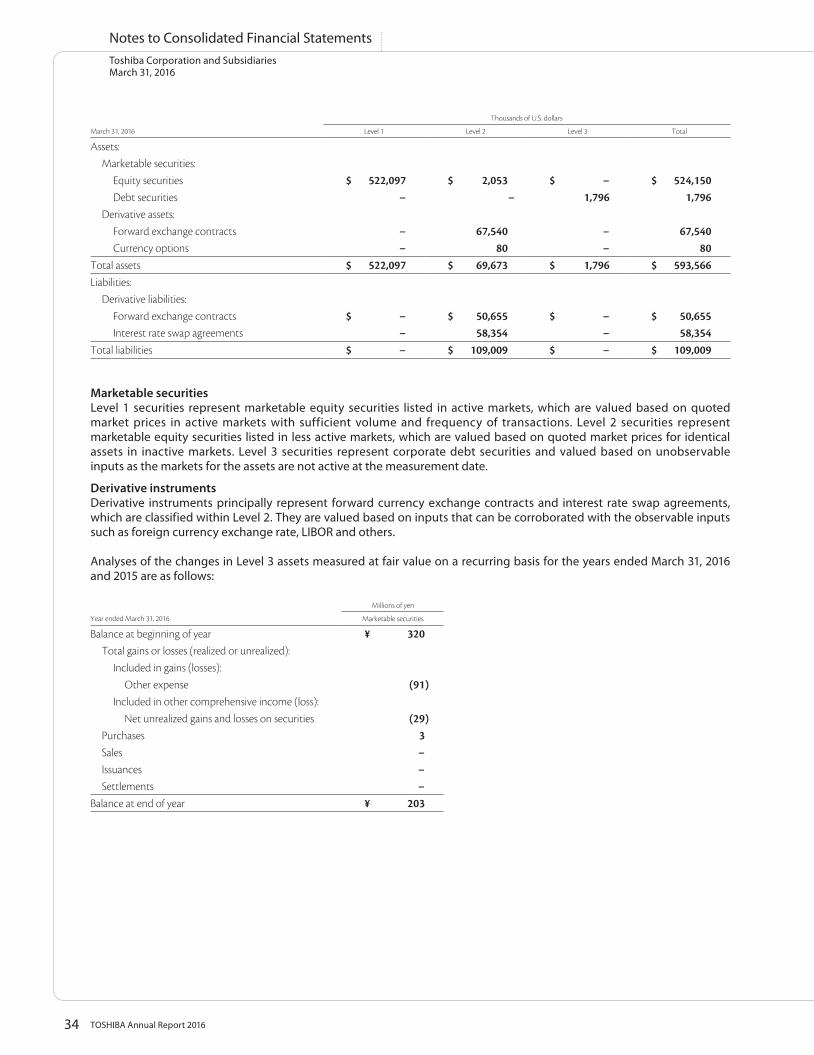
34 TOSHIBA Annual Report 2016
Toshiba Corporation and SubsidiariesMarch 31, 2016
Notes to Consolidated Financial Statements
Thousands of U.S. dollars
March 31, 2016 Level 1 Level 2 Level 3 Total
Assets:Marketable securities:
Equity securities $ 522,097 $ 2,053 $ − $ 524,150Debt securities − − 1,796 1,796
Derivative assets:Forward exchange contracts − 67,540 − 67,540Currency options − 80 − 80
Total assets $ 522,097 $ 69,673 $ 1,796 $ 593,566Liabilities:
Derivative liabilities:Forward exchange contracts $ − $ 50,655 $ − $ 50,655Interest rate swap agreements − 58,354 − 58,354
Total liabilities $ − $ 109,009 $ − $ 109,009
Marketable securitiesLevel 1 securities represent marketable equity securities listed in active markets, which are valued based on quoted market prices in active markets with sufficient volume and frequency of transactions. Level 2 securities represent marketable equity securities listed in less active markets, which are valued based on quoted market prices for identical assets in inactive markets. Level 3 securities represent corporate debt securities and valued based on unobservable inputs as the markets for the assets are not active at the measurement date.
Derivative instrumentsDerivative instruments principally represent forward currency exchange contracts and interest rate swap agreements, which are classified within Level 2. They are valued based on inputs that can be corroborated with the observable inputs such as foreign currency exchange rate, LIBOR and others.
Analyses of the changes in Level 3 assets measured at fair value on a recurring basis for the years ended March 31, 2016 and 2015 are as follows:
Millions of yen
Year ended March 31, 2016 Marketable securities
Balance at beginning of year ¥ 320Total gains or losses (realized or unrealized):
Included in gains (losses):Other expense (91)
Included in other comprehensive income (loss):Net unrealized gains and losses on securities (29)
Purchases 3Sales −Issuances −Settlements −
Balance at end of year ¥ 203
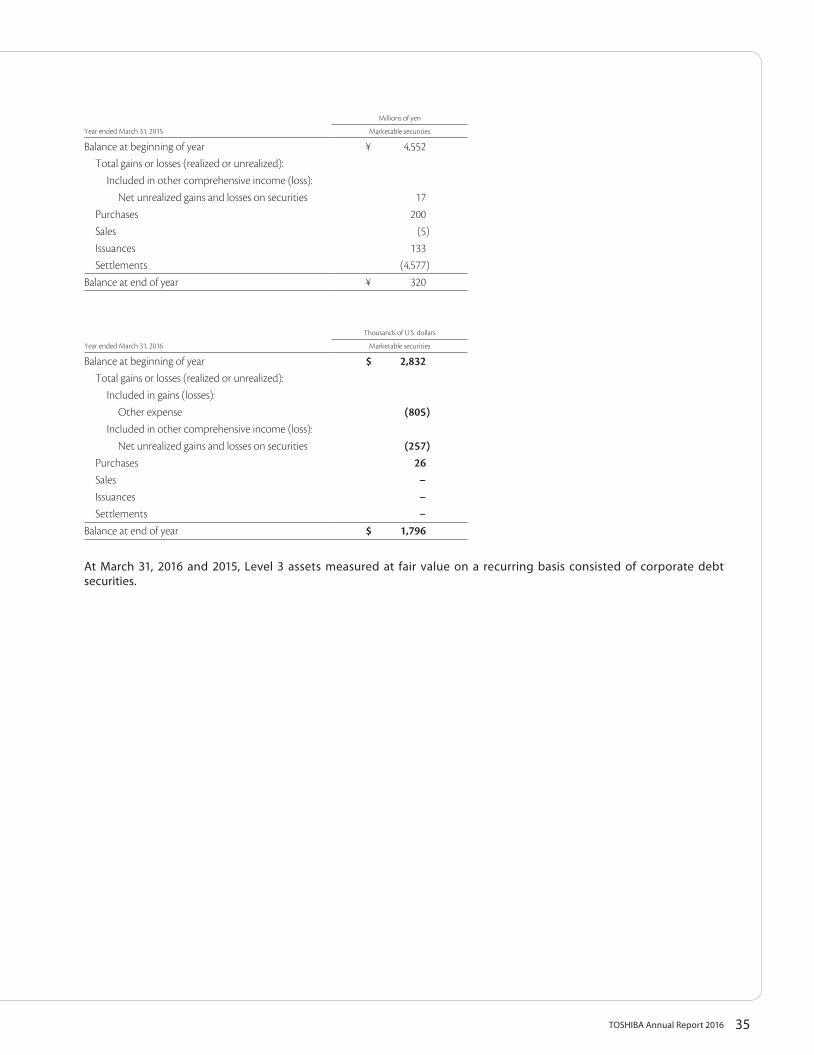
35TOSHIBA Annual Report 2016
Millions of yen
Year ended March 31, 2015 Marketable securities
Balance at beginning of year ¥ 4,552Total gains or losses (realized or unrealized):
Included in other comprehensive income (loss):Net unrealized gains and losses on securities 17
Purchases 200Sales (5)Issuances 133Settlements (4,577)
Balance at end of year ¥ 320
Thousands of U.S. dollars
Year ended March 31, 2016 Marketable securities
Balance at beginning of year $ 2,832Total gains or losses (realized or unrealized):
Included in gains (losses):Other expense (805)
Included in other comprehensive income (loss):Net unrealized gains and losses on securities (257)
Purchases 26Sales −Issuances −Settlements −
Balance at end of year $ 1,796
At March 31, 2016 and 2015, Level 3 assets measured at fair value on a recurring basis consisted of corporate debt securities.
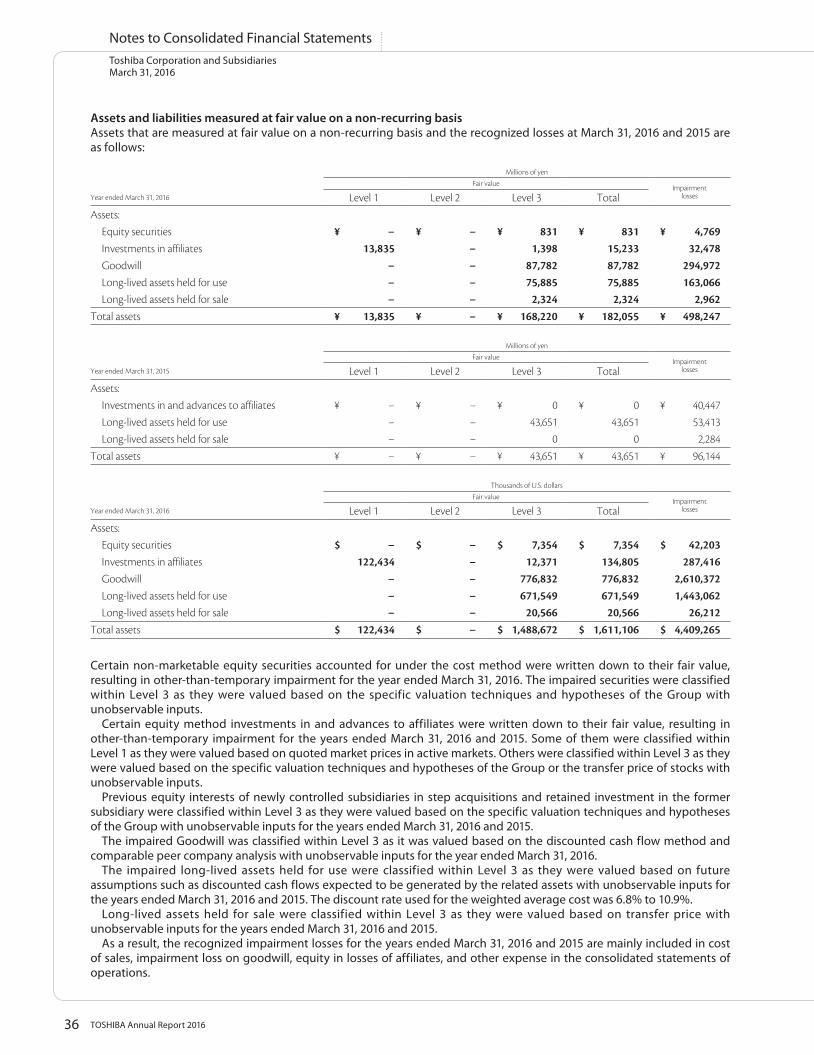
36 TOSHIBA Annual Report 2016
Toshiba Corporation and SubsidiariesMarch 31, 2016
Notes to Consolidated Financial Statements
Assets and liabilities measured at fair value on a non-recurring basisAssets that are measured at fair value on a non-recurring basis and the recognized losses at March 31, 2016 and 2015 are as follows:
Millions of yen
Fair value Impairment lossesYear ended March 31, 2016 Level 1 Level 2 Level 3 Total
Assets:Equity securities ¥ − ¥ − ¥ 831 ¥ 831 ¥ 4,769Investments in affiliates 13,835 − 1,398 15,233 32,478Goodwill − − 87,782 87,782 294,972Long-lived assets held for use − − 75,885 75,885 163,066Long-lived assets held for sale − − 2,324 2,324 2,962
Total assets ¥ 13,835 ¥ − ¥ 168,220 ¥ 182,055 ¥ 498,247
Millions of yen
Fair value Impairment lossesYear ended March 31, 2015 Level 1 Level 2 Level 3 Total
Assets:Investments in and advances to affiliates ¥ − ¥ − ¥ 0 ¥ 0 ¥ 40,447Long-lived assets held for use − − 43,651 43,651 53,413Long-lived assets held for sale − − 0 0 2,284
Total assets ¥ − ¥ − ¥ 43,651 ¥ 43,651 ¥ 96,144
Thousands of U.S. dollars
Fair value Impairment lossesYear ended March 31, 2016 Level 1 Level 2 Level 3 Total
Assets:Equity securities $ − $ − $ 7,354 $ 7,354 $ 42,203Investments in affiliates 122,434 − 12,371 134,805 287,416Goodwill − − 776,832 776,832 2,610,372Long-lived assets held for use − − 671,549 671,549 1,443,062Long-lived assets held for sale − − 20,566 20,566 26,212
Total assets $ 122,434 $ − $ 1,488,672 $ 1,611,106 $ 4,409,265
Certain non-marketable equity securities accounted for under the cost method were written down to their fair value, resulting in other-than-temporary impairment for the year ended March 31, 2016. The impaired securities were classified within Level 3 as they were valued based on the specific valuation techniques and hypotheses of the Group with unobservable inputs. Certain equity method investments in and advances to affiliates were written down to their fair value, resulting in other-than-temporary impairment for the years ended March 31, 2016 and 2015. Some of them were classified within Level 1 as they were valued based on quoted market prices in active markets. Others were classified within Level 3 as they were valued based on the specific valuation techniques and hypotheses of the Group or the transfer price of stocks with unobservable inputs. Previous equity interests of newly controlled subsidiaries in step acquisitions and retained investment in the former subsidiary were classified within Level 3 as they were valued based on the specific valuation techniques and hypotheses of the Group with unobservable inputs for the years ended March 31, 2016 and 2015. The impaired Goodwill was classified within Level 3 as it was valued based on the discounted cash flow method and comparable peer company analysis with unobservable inputs for the year ended March 31, 2016. The impaired long-lived assets held for use were classified within Level 3 as they were valued based on future assumptions such as discounted cash flows expected to be generated by the related assets with unobservable inputs for the years ended March 31, 2016 and 2015. The discount rate used for the weighted average cost was 6.8% to 10.9%. Long-lived assets held for sale were classified within Level 3 as they were valued based on transfer price with unobservable inputs for the years ended March 31, 2016 and 2015. As a result, the recognized impairment losses for the years ended March 31, 2016 and 2015 are mainly included in cost of sales, impairment loss on goodwill, equity in losses of affiliates, and other expense in the consolidated statements of operations.
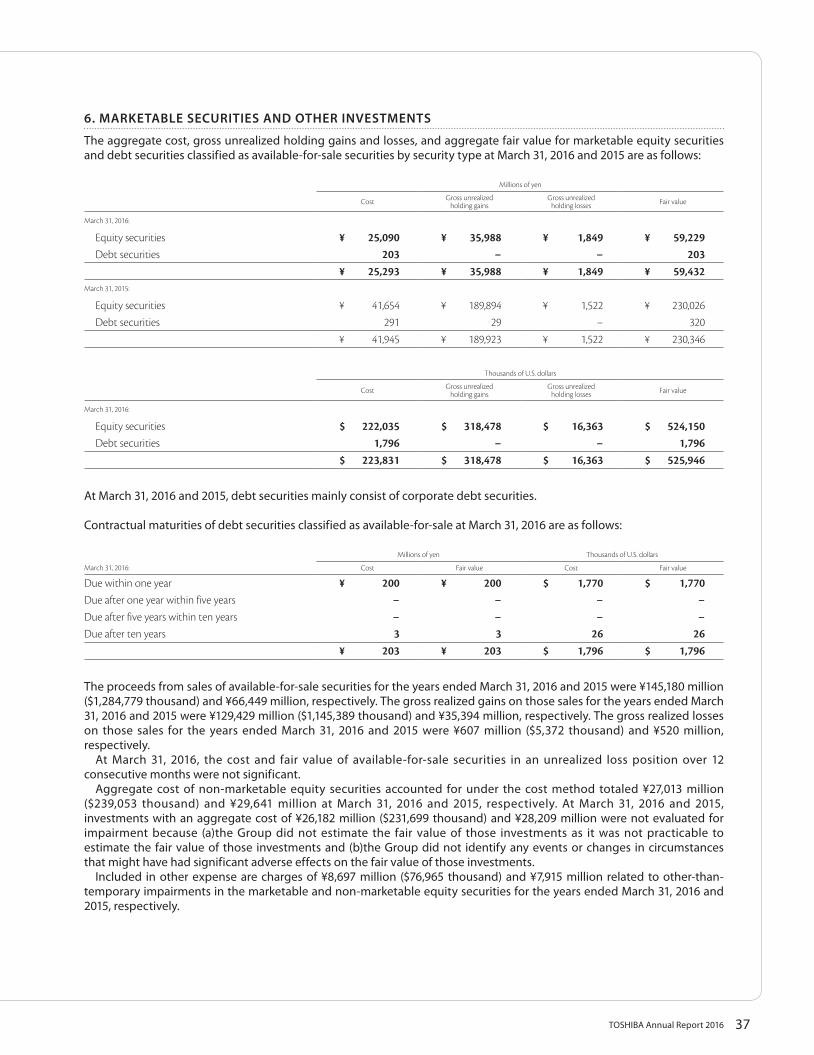
37TOSHIBA Annual Report 2016
6. MARKETABLE SECURITIES AND OTHER INVESTMENTS
The aggregate cost, gross unrealized holding gains and losses, and aggregate fair value for marketable equity securities and debt securities classified as available-for-sale securities by security type at March 31, 2016 and 2015 are as follows:
Millions of yen
Cost Gross unrealizedholding gains
Gross unrealizedholding losses Fair value
March 31, 2016:
Equity securities ¥ 25,090 ¥ 35,988 ¥ 1,849 ¥ 59,229Debt securities 203 − − 203
¥ 25,293 ¥ 35,988 ¥ 1,849 ¥ 59,432March 31, 2015:
Equity securities ¥ 41,654 ¥ 189,894 ¥ 1,522 ¥ 230,026Debt securities 291 29 − 320
¥ 41,945 ¥ 189,923 ¥ 1,522 ¥ 230,346
Thousands of U.S. dollars
Cost Gross unrealizedholding gains
Gross unrealizedholding losses Fair value
March 31, 2016:
Equity securities $ 222,035 $ 318,478 $ 16,363 $ 524,150Debt securities 1,796 − − 1,796
$ 223,831 $ 318,478 $ 16,363 $ 525,946
At March 31, 2016 and 2015, debt securities mainly consist of corporate debt securities.
Contractual maturities of debt securities classified as available-for-sale at March 31, 2016 are as follows:
Millions of yen Thousands of U.S. dollars
March 31, 2016: Cost Fair value Cost Fair value
Due within one year ¥ 200 ¥ 200 $ 1,770 $ 1,770Due after one year within five years − − − −Due after five years within ten years − − − −Due after ten years 3 3 26 26
¥ 203 ¥ 203 $ 1,796 $ 1,796
The proceeds from sales of available-for-sale securities for the years ended March 31, 2016 and 2015 were ¥145,180 million ($1,284,779 thousand) and ¥66,449 million, respectively. The gross realized gains on those sales for the years ended March 31, 2016 and 2015 were ¥129,429 million ($1,145,389 thousand) and ¥35,394 million, respectively. The gross realized losses on those sales for the years ended March 31, 2016 and 2015 were ¥607 million ($5,372 thousand) and ¥520 million, respectively. At March 31, 2016, the cost and fair value of available-for-sale securities in an unrealized loss position over 12 consecutive months were not significant. Aggregate cost of non-marketable equity securities accounted for under the cost method totaled ¥27,013 million ($239,053 thousand) and ¥29,641 million at March 31, 2016 and 2015, respectively. At March 31, 2016 and 2015, investments with an aggregate cost of ¥26,182 million ($231,699 thousand) and ¥28,209 million were not evaluated for impairment because (a)the Group did not estimate the fair value of those investments as it was not practicable to estimate the fair value of those investments and (b)the Group did not identify any events or changes in circumstances that might have had significant adverse effects on the fair value of those investments. Included in other expense are charges of ¥8,697 million ($76,965 thousand) and ¥7,915 million related to other-than-temporary impairments in the marketable and non-marketable equity securities for the years ended March 31, 2016 and 2015, respectively.
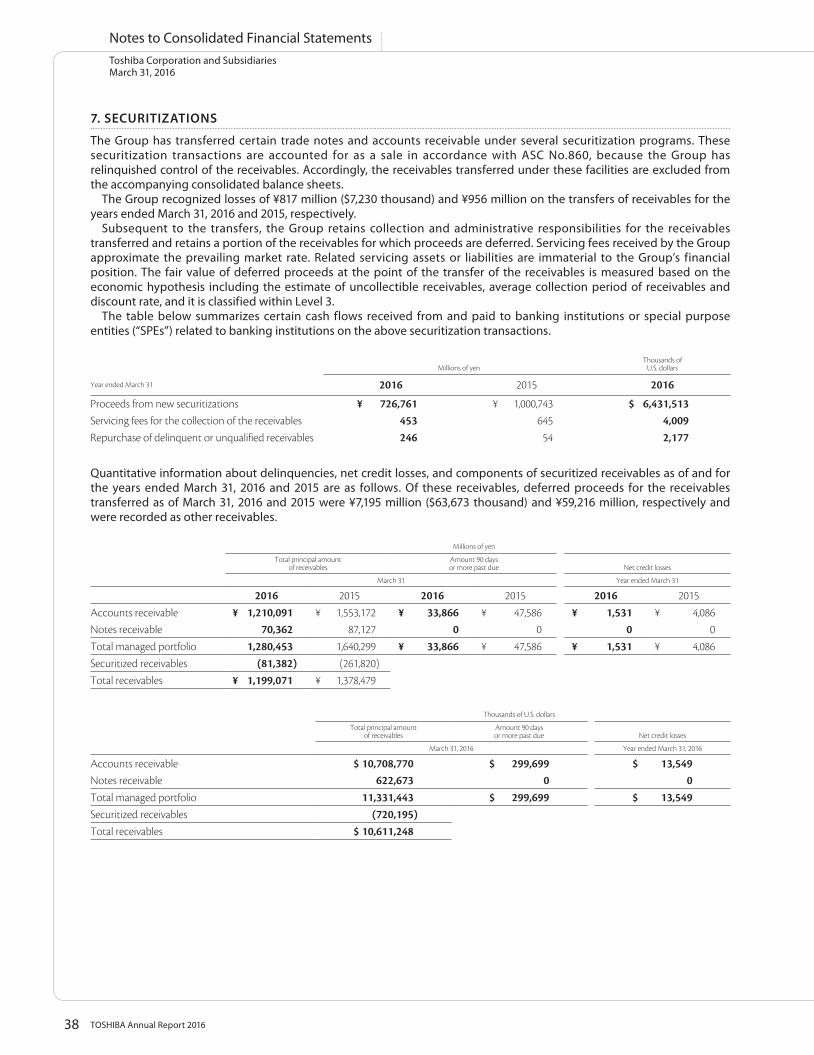
38 TOSHIBA Annual Report 2016
Toshiba Corporation and SubsidiariesMarch 31, 2016
Notes to Consolidated Financial Statements
7. SECURITIZATIONS
The Group has transferred certain trade notes and accounts receivable under several securitization programs. These securitization transactions are accounted for as a sale in accordance with ASC No.860, because the Group has relinquished control of the receivables. Accordingly, the receivables transferred under these facilities are excluded from the accompanying consolidated balance sheets. The Group recognized losses of ¥817 million ($7,230 thousand) and ¥956 million on the transfers of receivables for the years ended March 31, 2016 and 2015, respectively. Subsequent to the transfers, the Group retains collection and administrative responsibilities for the receivables transferred and retains a portion of the receivables for which proceeds are deferred. Servicing fees received by the Group approximate the prevailing market rate. Related servicing assets or liabilities are immaterial to the Group’s financial position. The fair value of deferred proceeds at the point of the transfer of the receivables is measured based on the economic hypothesis including the estimate of uncollectible receivables, average collection period of receivables and discount rate, and it is classified within Level 3. The table below summarizes certain cash flows received from and paid to banking institutions or special purpose entities (“SPEs”) related to banking institutions on the above securitization transactions.
Millions of yenThousands of
U.S. dollars
Year ended March 31 2016 2015 2016
Proceeds from new securitizations ¥ 726,761 ¥ 1,000,743 $ 6,431,513Servicing fees for the collection of the receivables 453 645 4,009Repurchase of delinquent or unqualified receivables 246 54 2,177
Quantitative information about delinquencies, net credit losses, and components of securitized receivables as of and for the years ended March 31, 2016 and 2015 are as follows. Of these receivables, deferred proceeds for the receivables transferred as of March 31, 2016 and 2015 were ¥7,195 million ($63,673 thousand) and ¥59,216 million, respectively and were recorded as other receivables.
Millions of yen
Total principal amountof receivables
Amount 90 daysor more past due Net credit losses
March 31 Year ended March 31
2016 2015 2016 2015 2016 2015
Accounts receivable ¥ 1,210,091 ¥ 1,553,172 ¥ 33,866 ¥ 47,586 ¥ 1,531 ¥ 4,086Notes receivable 70,362 87,127 0 0 0 0
Total managed portfolio 1,280,453 1,640,299 ¥ 33,866 ¥ 47,586 ¥ 1,531 ¥ 4,086Securitized receivables (81,382) (261,820)Total receivables ¥ 1,199,071 ¥ 1,378,479
Thousands of U.S. dollars
Total principal amountof receivables
Amount 90 daysor more past due Net credit losses
March 31, 2016 Year ended March 31, 2016
Accounts receivable $ 10,708,770 $ 299,699 $ 13,549Notes receivable 622,673 0 0Total managed portfolio 11,331,443 $ 299,699 $ 13,549Securitized receivables (720,195)Total receivables $ 10,611,248
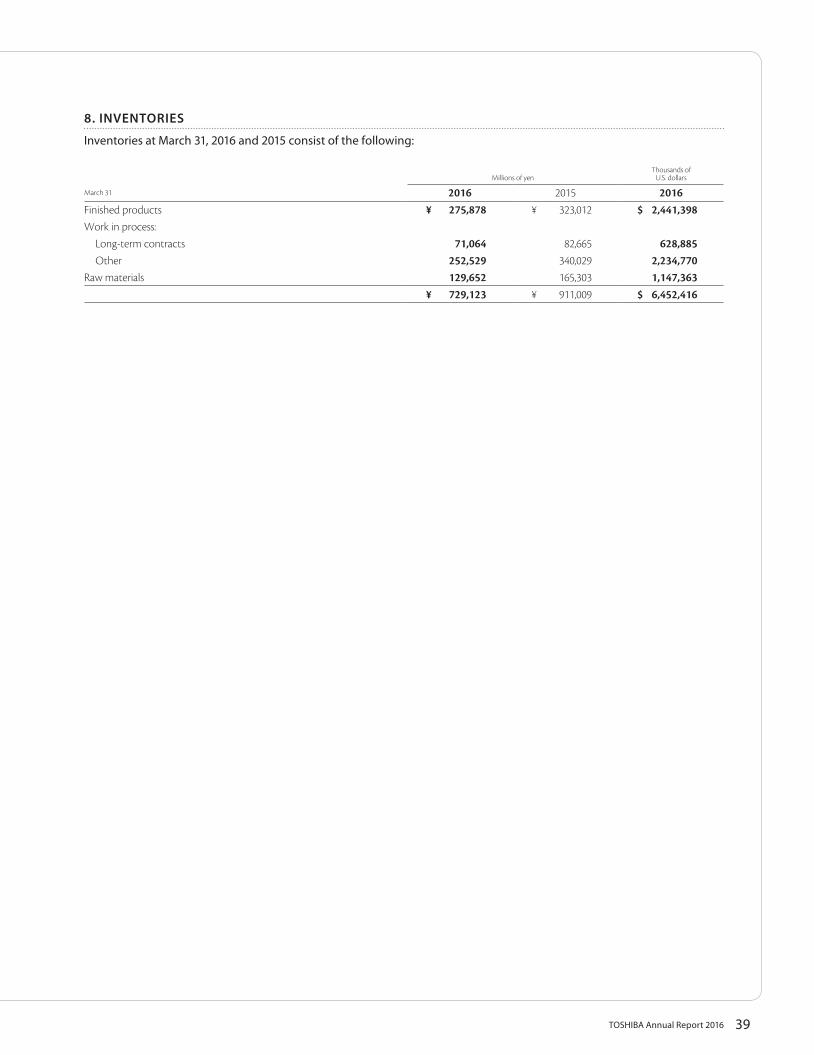
39TOSHIBA Annual Report 2016
8. INVENTORIES
Inventories at March 31, 2016 and 2015 consist of the following:
Millions of yenThousands of
U.S. dollars
March 31 2016 2015 2016Finished products ¥ 275,878 ¥ 323,012 $ 2,441,398Work in process:
Long-term contracts 71,064 82,665 628,885Other 252,529 340,029 2,234,770
Raw materials 129,652 165,303 1,147,363¥ 729,123 ¥ 911,009 $ 6,452,416
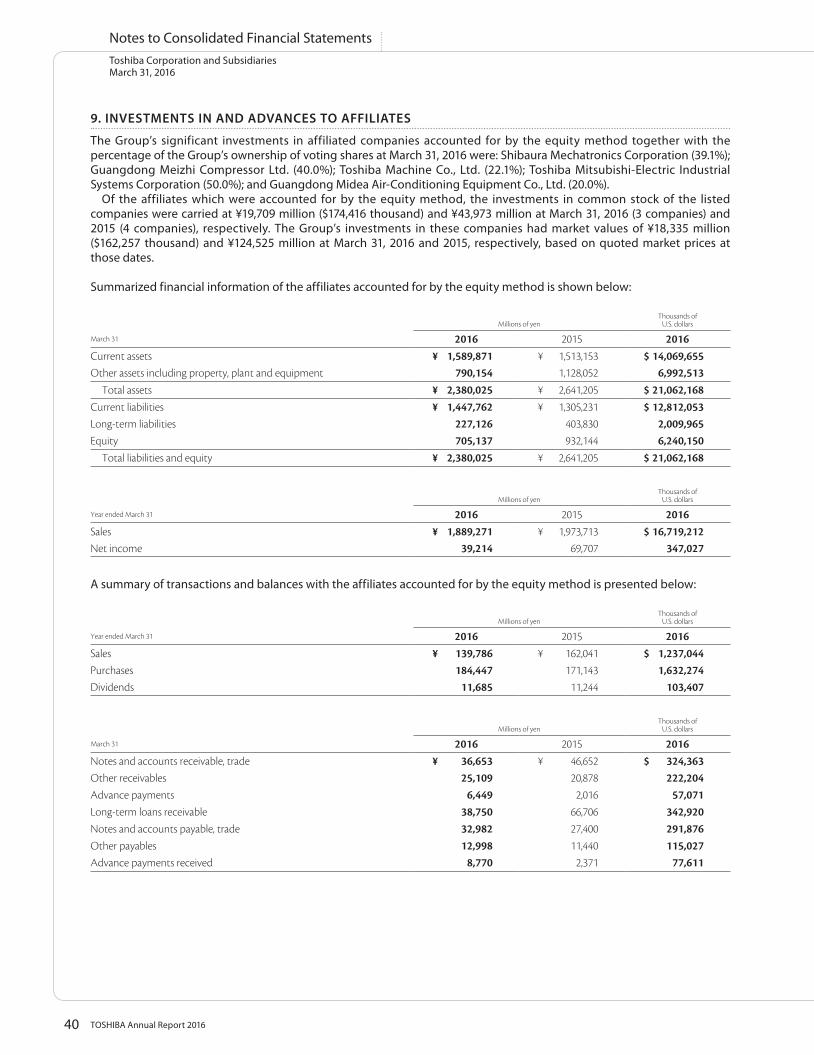
40 TOSHIBA Annual Report 2016
Toshiba Corporation and SubsidiariesMarch 31, 2016
Notes to Consolidated Financial Statements
9. INVESTMENTS IN AND ADVANCES TO AFFILIATES
The Group’s significant investments in affiliated companies accounted for by the equity method together with the percentage of the Group’s ownership of voting shares at March 31, 2016 were: Shibaura Mechatronics Corporation (39.1%); Guangdong Meizhi Compressor Ltd. (40.0%); Toshiba Machine Co., Ltd. (22.1%); Toshiba Mitsubishi-Electric Industrial Systems Corporation (50.0%); and Guangdong Midea Air-Conditioning Equipment Co., Ltd. (20.0%). Of the affiliates which were accounted for by the equity method, the investments in common stock of the listed companies were carried at ¥19,709 million ($174,416 thousand) and ¥43,973 million at March 31, 2016 (3 companies) and 2015 (4 companies), respectively. The Group’s investments in these companies had market values of ¥18,335 million ($162,257 thousand) and ¥124,525 million at March 31, 2016 and 2015, respectively, based on quoted market prices at those dates.
Summarized financial information of the affiliates accounted for by the equity method is shown below:
Millions of yenThousands of
U.S. dollars
March 31 2016 2015 2016Current assets ¥ 1,589,871 ¥ 1,513,153 $ 14,069,655Other assets including property, plant and equipment 790,154 1,128,052 6,992,513
Total assets ¥ 2,380,025 ¥ 2,641,205 $ 21,062,168Current liabilities ¥ 1,447,762 ¥ 1,305,231 $ 12,812,053Long-term liabilities 227,126 403,830 2,009,965Equity 705,137 932,144 6,240,150
Total liabilities and equity ¥ 2,380,025 ¥ 2,641,205 $ 21,062,168
Millions of yenThousands of
U.S. dollars
Year ended March 31 2016 2015 2016Sales ¥ 1,889,271 ¥ 1,973,713 $ 16,719,212Net income 39,214 69,707 347,027
A summary of transactions and balances with the affiliates accounted for by the equity method is presented below:
Millions of yenThousands of
U.S. dollars
Year ended March 31 2016 2015 2016Sales ¥ 139,786 ¥ 162,041 $ 1,237,044Purchases 184,447 171,143 1,632,274Dividends 11,685 11,244 103,407
Millions of yenThousands of
U.S. dollars
March 31 2016 2015 2016Notes and accounts receivable, trade ¥ 36,653 ¥ 46,652 $ 324,363Other receivables 25,109 20,878 222,204Advance payments 6,449 2,016 57,071Long-term loans receivable 38,750 66,706 342,920Notes and accounts payable, trade 32,982 27,400 291,876Other payables 12,998 11,440 115,027Advance payments received 8,770 2,371 77,611
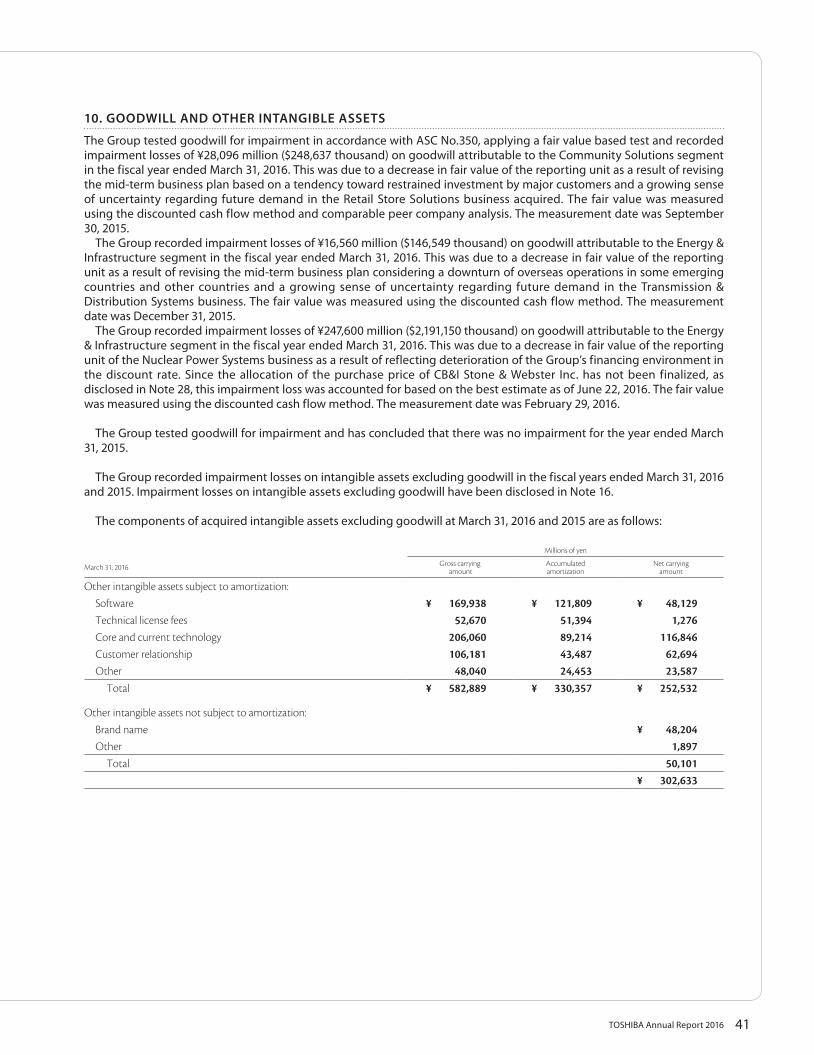
41TOSHIBA Annual Report 2016
10. GOODWILL AND OTHER INTANGIBLE ASSETS
The Group tested goodwill for impairment in accordance with ASC No.350, applying a fair value based test and recorded impairment losses of ¥28,096 million ($248,637 thousand) on goodwill attributable to the Community Solutions segment in the fiscal year ended March 31, 2016. This was due to a decrease in fair value of the reporting unit as a result of revising the mid-term business plan based on a tendency toward restrained investment by major customers and a growing sense of uncertainty regarding future demand in the Retail Store Solutions business acquired. The fair value was measured using the discounted cash flow method and comparable peer company analysis. The measurement date was September 30, 2015. The Group recorded impairment losses of ¥16,560 million ($146,549 thousand) on goodwill attributable to the Energy & Infrastructure segment in the fiscal year ended March 31, 2016. This was due to a decrease in fair value of the reporting unit as a result of revising the mid-term business plan considering a downturn of overseas operations in some emerging countries and other countries and a growing sense of uncertainty regarding future demand in the Transmission & Distribution Systems business. The fair value was measured using the discounted cash flow method. The measurement date was December 31, 2015. The Group recorded impairment losses of ¥247,600 million ($2,191,150 thousand) on goodwill attributable to the Energy & Infrastructure segment in the fiscal year ended March 31, 2016. This was due to a decrease in fair value of the reporting unit of the Nuclear Power Systems business as a result of reflecting deterioration of the Group’s financing environment in the discount rate. Since the allocation of the purchase price of CB&I Stone & Webster Inc. has not been finalized, as disclosed in Note 28, this impairment loss was accounted for based on the best estimate as of June 22, 2016. The fair value was measured using the discounted cash flow method. The measurement date was February 29, 2016.
The Group tested goodwill for impairment and has concluded that there was no impairment for the year ended March 31, 2015.
The Group recorded impairment losses on intangible assets excluding goodwill in the fiscal years ended March 31, 2016 and 2015. Impairment losses on intangible assets excluding goodwill have been disclosed in Note 16.
The components of acquired intangible assets excluding goodwill at March 31, 2016 and 2015 are as follows:
Millions of yen
March 31, 2016 Gross carrying amount
Accumulated amortization
Net carrying amount
Other intangible assets subject to amortization:Software ¥ 169,938 ¥ 121,809 ¥ 48,129Technical license fees 52,670 51,394 1,276Core and current technology 206,060 89,214 116,846Customer relationship 106,181 43,487 62,694Other 48,040 24,453 23,587
Total ¥ 582,889 ¥ 330,357 ¥ 252,532
Other intangible assets not subject to amortization:Brand name ¥ 48,204Other 1,897
Total 50,101¥ 302,633
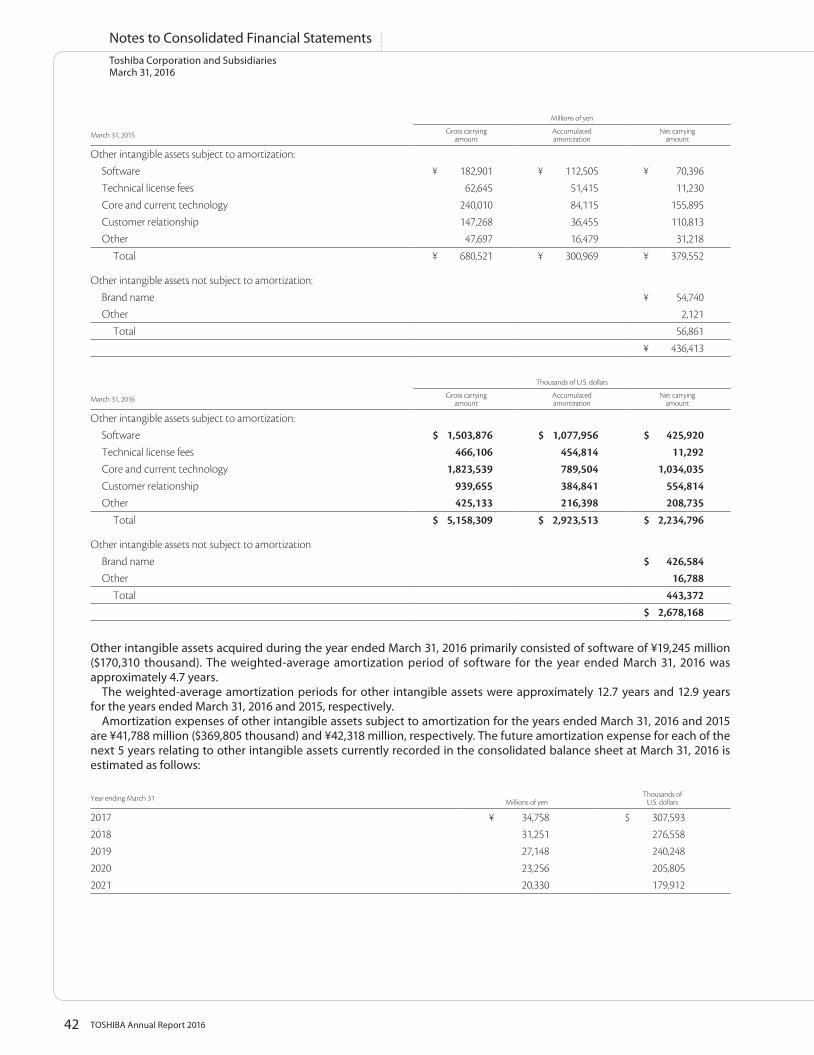
42 TOSHIBA Annual Report 2016
Toshiba Corporation and SubsidiariesMarch 31, 2016
Notes to Consolidated Financial Statements
Millions of yen
March 31, 2015 Gross carrying amount
Accumulated amortization
Net carrying amount
Other intangible assets subject to amortization:Software ¥ 182,901 ¥ 112,505 ¥ 70,396Technical license fees 62,645 51,415 11,230Core and current technology 240,010 84,115 155,895Customer relationship 147,268 36,455 110,813Other 47,697 16,479 31,218
Total ¥ 680,521 ¥ 300,969 ¥ 379,552
Other intangible assets not subject to amortization:Brand name ¥ 54,740Other 2,121
Total 56,861¥ 436,413
Thousands of U.S. dollars
March 31, 2016 Gross carrying amount
Accumulated amortization
Net carrying amount
Other intangible assets subject to amortization:Software $ 1,503,876 $ 1,077,956 $ 425,920Technical license fees 466,106 454,814 11,292Core and current technology 1,823,539 789,504 1,034,035Customer relationship 939,655 384,841 554,814Other 425,133 216,398 208,735
Total $ 5,158,309 $ 2,923,513 $ 2,234,796
Other intangible assets not subject to amortizationBrand name $ 426,584Other 16,788
Total 443,372$ 2,678,168
Other intangible assets acquired during the year ended March 31, 2016 primarily consisted of software of ¥19,245 million ($170,310 thousand). The weighted-average amortization period of software for the year ended March 31, 2016 was approximately 4.7 years. The weighted-average amortization periods for other intangible assets were approximately 12.7 years and 12.9 years for the years ended March 31, 2016 and 2015, respectively. Amortization expenses of other intangible assets subject to amortization for the years ended March 31, 2016 and 2015 are ¥41,788 million ($369,805 thousand) and ¥42,318 million, respectively. The future amortization expense for each of the next 5 years relating to other intangible assets currently recorded in the consolidated balance sheet at March 31, 2016 is estimated as follows:
Year ending March 31 Millions of yenThousands of
U.S. dollars
2017 ¥ 34,758 $ 307,5932018 31,251 276,5582019 27,148 240,2482020 23,256 205,8052021 20,330 179,912
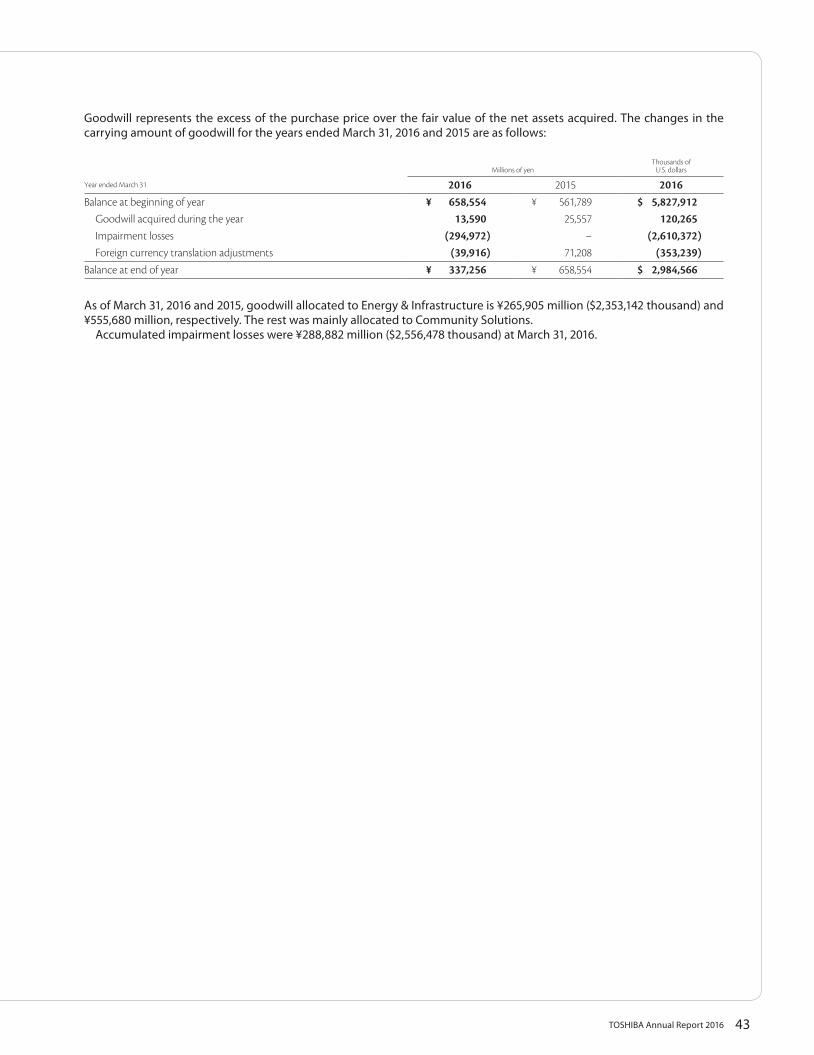
43TOSHIBA Annual Report 2016
Goodwill represents the excess of the purchase price over the fair value of the net assets acquired. The changes in the carrying amount of goodwill for the years ended March 31, 2016 and 2015 are as follows:
Millions of yenThousands of
U.S. dollars
Year ended March 31 2016 2015 2016Balance at beginning of year ¥ 658,554 ¥ 561,789 $ 5,827,912
Goodwill acquired during the year 13,590 25,557 120,265Impairment losses (294,972) − (2,610,372)Foreign currency translation adjustments (39,916) 71,208 (353,239)
Balance at end of year ¥ 337,256 ¥ 658,554 $ 2,984,566
As of March 31, 2016 and 2015, goodwill allocated to Energy & Infrastructure is ¥265,905 million ($2,353,142 thousand) and ¥555,680 million, respectively. The rest was mainly allocated to Community Solutions. Accumulated impairment losses were ¥288,882 million ($2,556,478 thousand) at March 31, 2016.
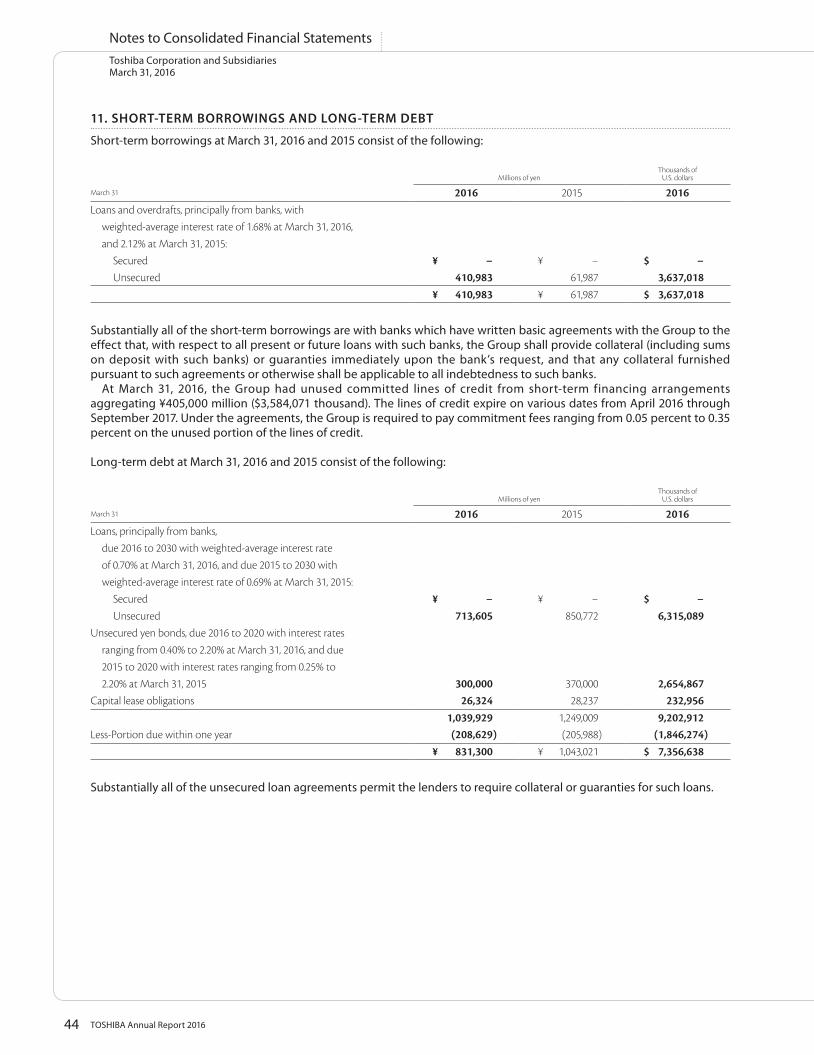
44 TOSHIBA Annual Report 2016
Toshiba Corporation and SubsidiariesMarch 31, 2016
Notes to Consolidated Financial Statements
11. SHORT-TERM BORROWINGS AND LONG-TERM DEBT
Short-term borrowings at March 31, 2016 and 2015 consist of the following:
Millions of yenThousands of
U.S. dollars
March 31 2016 2015 2016Loans and overdrafts, principally from banks, with
weighted-average interest rate of 1.68% at March 31, 2016, and 2.12% at March 31, 2015:
Secured ¥ − ¥ − $ −Unsecured 410,983 61,987 3,637,018
¥ 410,983 ¥ 61,987 $ 3,637,018
Substantially all of the short-term borrowings are with banks which have written basic agreements with the Group to the effect that, with respect to all present or future loans with such banks, the Group shall provide collateral (including sums on deposit with such banks) or guaranties immediately upon the bank’s request, and that any collateral furnished pursuant to such agreements or otherwise shall be applicable to all indebtedness to such banks. At March 31, 2016, the Group had unused committed lines of credit from short-term financing arrangements aggregating ¥405,000 million ($3,584,071 thousand). The lines of credit expire on various dates from April 2016 through September 2017. Under the agreements, the Group is required to pay commitment fees ranging from 0.05 percent to 0.35 percent on the unused portion of the lines of credit.
Long-term debt at March 31, 2016 and 2015 consist of the following:
Millions of yenThousands of
U.S. dollars
March 31 2016 2015 2016Loans, principally from banks,
due 2016 to 2030 with weighted-average interest rateof 0.70% at March 31, 2016, and due 2015 to 2030 withweighted-average interest rate of 0.69% at March 31, 2015:
Secured ¥ − ¥ − $ −Unsecured 713,605 850,772 6,315,089
Unsecured yen bonds, due 2016 to 2020 with interest ratesranging from 0.40% to 2.20% at March 31, 2016, and due2015 to 2020 with interest rates ranging from 0.25% to2.20% at March 31, 2015 300,000 370,000 2,654,867
Capital lease obligations 26,324 28,237 232,9561,039,929 1,249,009 9,202,912
Less-Portion due within one year (208,629) (205,988) (1,846,274)¥ 831,300 ¥ 1,043,021 $ 7,356,638
Substantially all of the unsecured loan agreements permit the lenders to require collateral or guaranties for such loans.
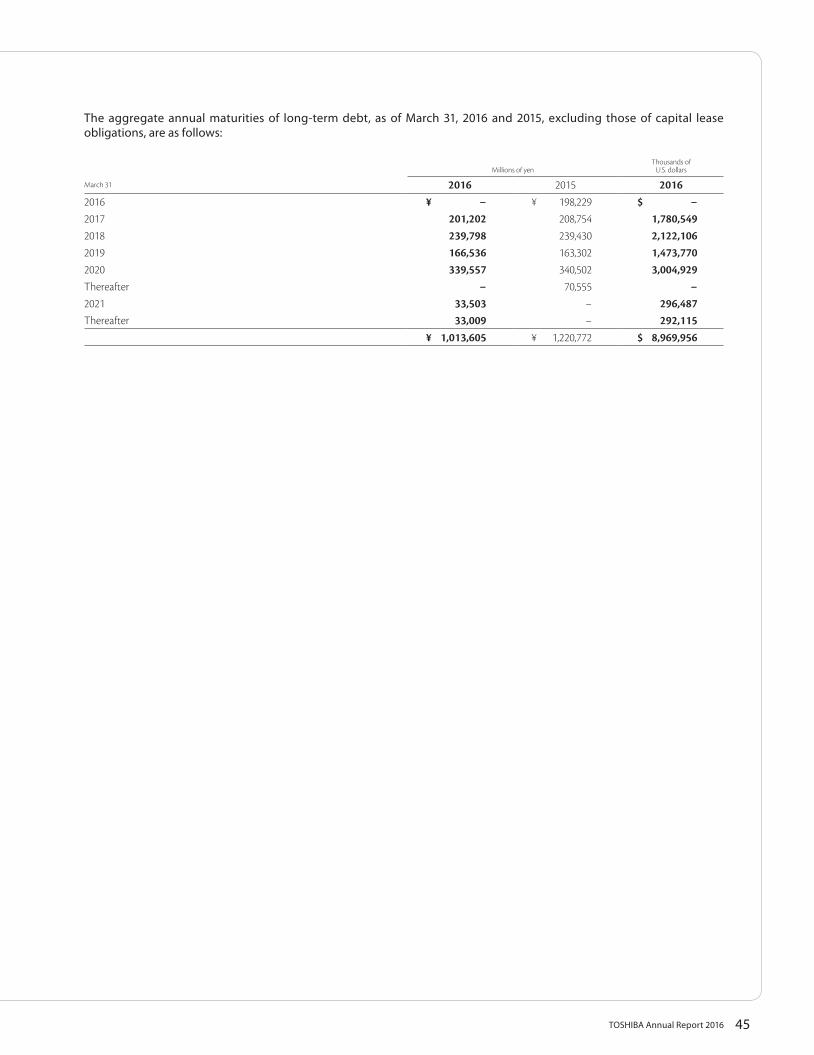
45TOSHIBA Annual Report 2016
The aggregate annual maturities of long-term debt, as of March 31, 2016 and 2015, excluding those of capital lease obligations, are as follows:
Millions of yenThousands of
U.S. dollars
March 31 2016 2015 20162016 ¥ − ¥ 198,229 $ −2017 201,202 208,754 1,780,5492018 239,798 239,430 2,122,1062019 166,536 163,302 1,473,7702020 339,557 340,502 3,004,929Thereafter − 70,555 −2021 33,503 − 296,487Thereafter 33,009 − 292,115
¥ 1,013,605 ¥ 1,220,772 $ 8,969,956
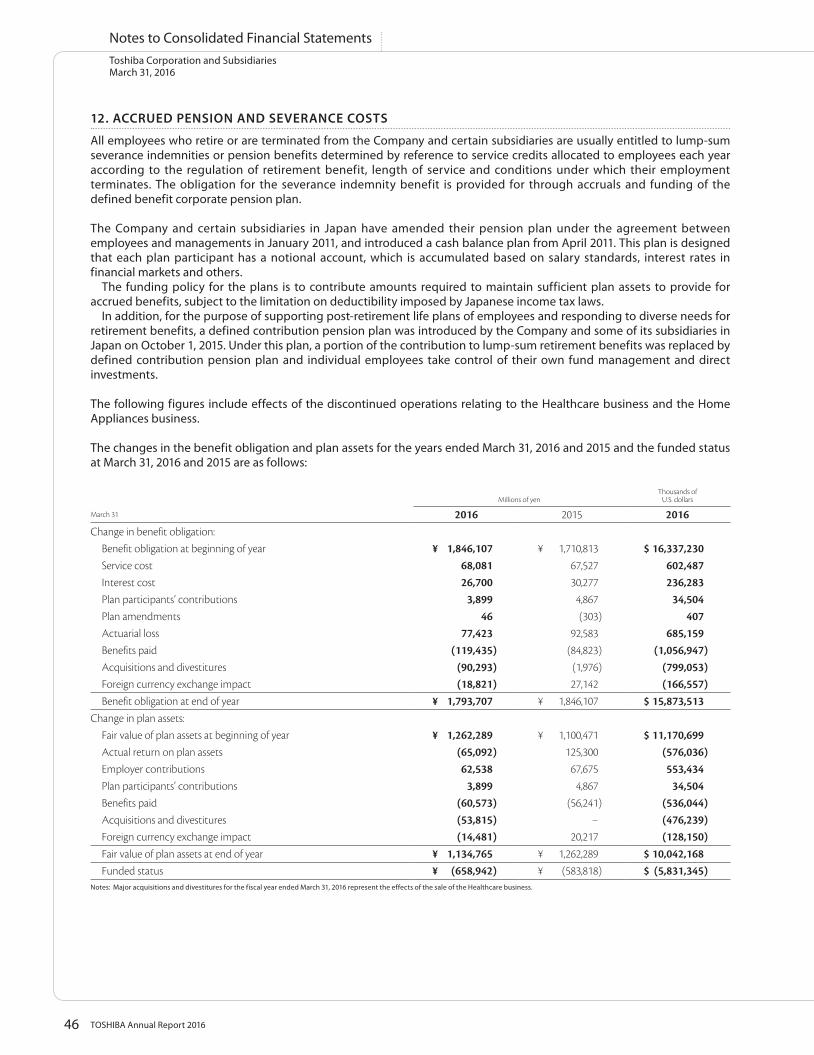
46 TOSHIBA Annual Report 2016
Toshiba Corporation and SubsidiariesMarch 31, 2016
Notes to Consolidated Financial Statements
12. ACCRUED PENSION AND SEVERANCE COSTS
All employees who retire or are terminated from the Company and certain subsidiaries are usually entitled to lump-sum severance indemnities or pension benefits determined by reference to service credits allocated to employees each year according to the regulation of retirement benefit, length of service and conditions under which their employment terminates. The obligation for the severance indemnity benefit is provided for through accruals and funding of the defined benefit corporate pension plan.
The Company and certain subsidiaries in Japan have amended their pension plan under the agreement between employees and managements in January 2011, and introduced a cash balance plan from April 2011. This plan is designed that each plan participant has a notional account, which is accumulated based on salary standards, interest rates in financial markets and others. The funding policy for the plans is to contribute amounts required to maintain sufficient plan assets to provide for accrued benefits, subject to the limitation on deductibility imposed by Japanese income tax laws. In addition, for the purpose of supporting post-retirement life plans of employees and responding to diverse needs for retirement benefits, a defined contribution pension plan was introduced by the Company and some of its subsidiaries in Japan on October 1, 2015. Under this plan, a portion of the contribution to lump-sum retirement benefits was replaced by defined contribution pension plan and individual employees take control of their own fund management and direct investments.
The following figures include effects of the discontinued operations relating to the Healthcare business and the Home Appliances business.
The changes in the benefit obligation and plan assets for the years ended March 31, 2016 and 2015 and the funded status at March 31, 2016 and 2015 are as follows:
Millions of yenThousands of
U.S. dollars
March 31 2016 2015 2016Change in benefit obligation:
Benefit obligation at beginning of year ¥ 1,846,107 ¥ 1,710,813 $ 16,337,230Service cost 68,081 67,527 602,487Interest cost 26,700 30,277 236,283Plan participants’ contributions 3,899 4,867 34,504Plan amendments 46 (303) 407Actuarial loss 77,423 92,583 685,159Benefits paid (119,435) (84,823) (1,056,947)Acquisitions and divestitures (90,293) (1,976) (799,053)Foreign currency exchange impact (18,821) 27,142 (166,557)Benefit obligation at end of year ¥ 1,793,707 ¥ 1,846,107 $ 15,873,513
Change in plan assets:Fair value of plan assets at beginning of year ¥ 1,262,289 ¥ 1,100,471 $ 11,170,699Actual return on plan assets (65,092) 125,300 (576,036)Employer contributions 62,538 67,675 553,434Plan participants’ contributions 3,899 4,867 34,504Benefits paid (60,573) (56,241) (536,044)Acquisitions and divestitures (53,815) − (476,239)Foreign currency exchange impact (14,481) 20,217 (128,150)Fair value of plan assets at end of year ¥ 1,134,765 ¥ 1,262,289 $ 10,042,168Funded status ¥ (658,942) ¥ (583,818) $ (5,831,345)
Notes: Major acquisitions and divestitures for the fiscal year ended March 31, 2016 represent the effects of the sale of the Healthcare business.
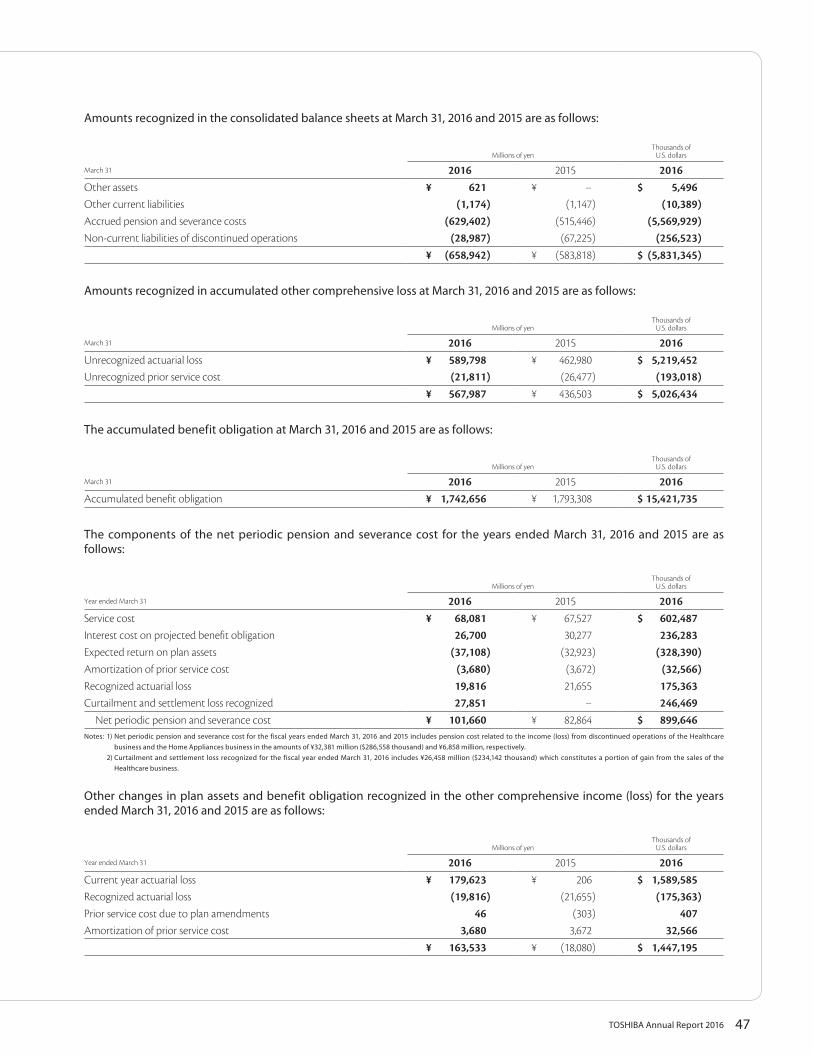
47TOSHIBA Annual Report 2016
Amounts recognized in the consolidated balance sheets at March 31, 2016 and 2015 are as follows:
Millions of yenThousands of
U.S. dollars
March 31 2016 2015 2016Other assets ¥ 621 ¥ − $ 5,496Other current liabilities (1,174) (1,147) (10,389)Accrued pension and severance costs (629,402) (515,446) (5,569,929)Non-current liabilities of discontinued operations (28,987) (67,225) (256,523)
¥ (658,942) ¥ (583,818) $ (5,831,345)
Amounts recognized in accumulated other comprehensive loss at March 31, 2016 and 2015 are as follows:
Millions of yenThousands of
U.S. dollars
March 31 2016 2015 2016Unrecognized actuarial loss ¥ 589,798 ¥ 462,980 $ 5,219,452Unrecognized prior service cost (21,811) (26,477) (193,018)
¥ 567,987 ¥ 436,503 $ 5,026,434
The accumulated benefit obligation at March 31, 2016 and 2015 are as follows:
Millions of yenThousands of
U.S. dollars
March 31 2016 2015 2016Accumulated benefit obligation ¥ 1,742,656 ¥ 1,793,308 $ 15,421,735
The components of the net periodic pension and severance cost for the years ended March 31, 2016 and 2015 are as follows:
Millions of yenThousands of
U.S. dollars
Year ended March 31 2016 2015 2016Service cost ¥ 68,081 ¥ 67,527 $ 602,487Interest cost on projected benefit obligation 26,700 30,277 236,283Expected return on plan assets (37,108) (32,923) (328,390)Amortization of prior service cost (3,680) (3,672) (32,566)Recognized actuarial loss 19,816 21,655 175,363Curtailment and settlement loss recognized 27,851 − 246,469
Net periodic pension and severance cost ¥ 101,660 ¥ 82,864 $ 899,646Notes: 1) Net periodic pension and severance cost for the fiscal years ended March 31, 2016 and 2015 includes pension cost related to the income (loss) from discontinued operations of the Healthcare
business and the Home Appliances business in the amounts of ¥32,381 million ($286,558 thousand) and ¥6,858 million, respectively. 2) Curtailment and settlement loss recognized for the fiscal year ended March 31, 2016 includes ¥26,458 million ($234,142 thousand) which constitutes a portion of gain from the sales of the
Healthcare business.
Other changes in plan assets and benefit obligation recognized in the other comprehensive income (loss) for the years ended March 31, 2016 and 2015 are as follows:
Millions of yenThousands of
U.S. dollars
Year ended March 31 2016 2015 2016Current year actuarial loss ¥ 179,623 ¥ 206 $ 1,589,585Recognized actuarial loss (19,816) (21,655) (175,363)Prior service cost due to plan amendments 46 (303) 407Amortization of prior service cost 3,680 3,672 32,566
¥ 163,533 ¥ (18,080) $ 1,447,195
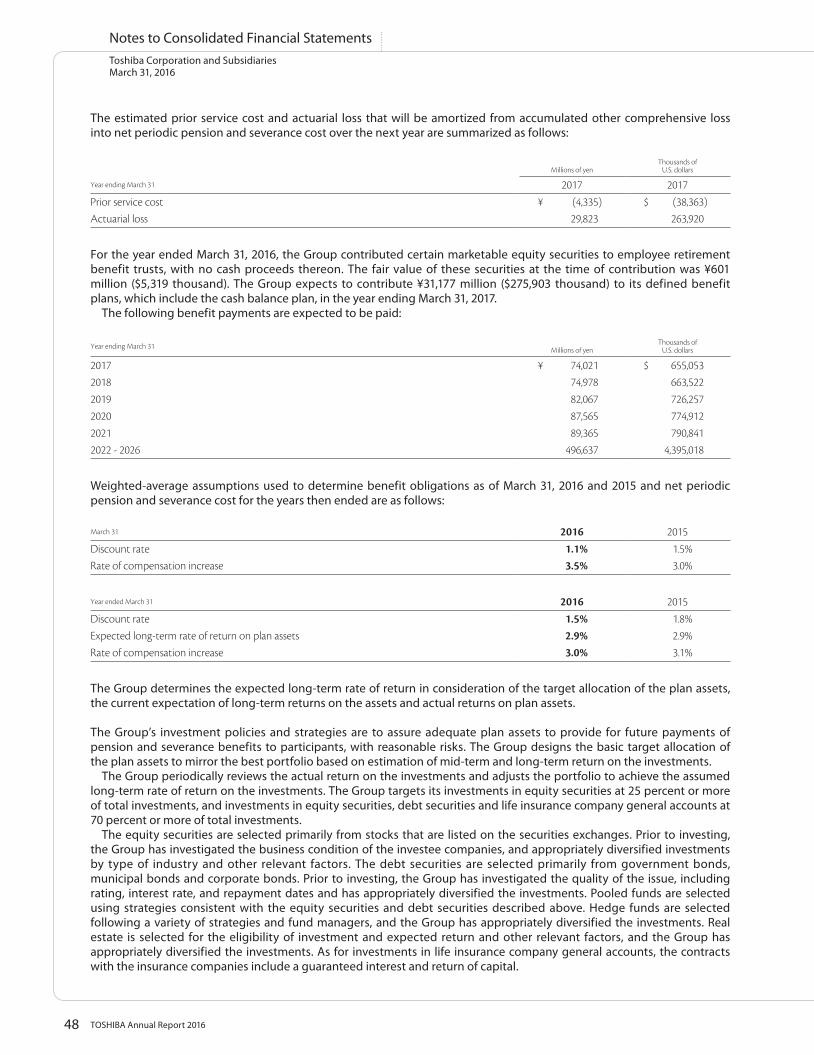
48 TOSHIBA Annual Report 2016
Toshiba Corporation and SubsidiariesMarch 31, 2016
Notes to Consolidated Financial Statements
The estimated prior service cost and actuarial loss that will be amortized from accumulated other comprehensive loss into net periodic pension and severance cost over the next year are summarized as follows:
Millions of yenThousands of
U.S. dollars
Year ending March 31 2017 2017
Prior service cost ¥ (4,335) $ (38,363)Actuarial loss 29,823 263,920
For the year ended March 31, 2016, the Group contributed certain marketable equity securities to employee retirement benefit trusts, with no cash proceeds thereon. The fair value of these securities at the time of contribution was ¥601 million ($5,319 thousand). The Group expects to contribute ¥31,177 million ($275,903 thousand) to its defined benefit plans, which include the cash balance plan, in the year ending March 31, 2017. The following benefit payments are expected to be paid:
Year ending March 31 Millions of yenThousands of
U.S. dollars
2017 ¥ 74,021 $ 655,0532018 74,978 663,5222019 82,067 726,2572020 87,565 774,9122021 89,365 790,8412022 - 2026 496,637 4,395,018
Weighted-average assumptions used to determine benefit obligations as of March 31, 2016 and 2015 and net periodic pension and severance cost for the years then ended are as follows:
March 31 2016 2015
Discount rate 1.1% 1.5%Rate of compensation increase 3.5% 3.0%
Year ended March 31 2016 2015
Discount rate 1.5% 1.8%Expected long-term rate of return on plan assets 2.9% 2.9%Rate of compensation increase 3.0% 3.1%
The Group determines the expected long-term rate of return in consideration of the target allocation of the plan assets, the current expectation of long-term returns on the assets and actual returns on plan assets.
The Group’s investment policies and strategies are to assure adequate plan assets to provide for future payments of pension and severance benefits to participants, with reasonable risks. The Group designs the basic target allocation of the plan assets to mirror the best portfolio based on estimation of mid-term and long-term return on the investments. The Group periodically reviews the actual return on the investments and adjusts the portfolio to achieve the assumed long-term rate of return on the investments. The Group targets its investments in equity securities at 25 percent or more of total investments, and investments in equity securities, debt securities and life insurance company general accounts at 70 percent or more of total investments. The equity securities are selected primarily from stocks that are listed on the securities exchanges. Prior to investing, the Group has investigated the business condition of the investee companies, and appropriately diversified investments by type of industry and other relevant factors. The debt securities are selected primarily from government bonds, municipal bonds and corporate bonds. Prior to investing, the Group has investigated the quality of the issue, including rating, interest rate, and repayment dates and has appropriately diversified the investments. Pooled funds are selected using strategies consistent with the equity securities and debt securities described above. Hedge funds are selected following a variety of strategies and fund managers, and the Group has appropriately diversified the investments. Real estate is selected for the eligibility of investment and expected return and other relevant factors, and the Group has appropriately diversified the investments. As for investments in life insurance company general accounts, the contracts with the insurance companies include a guaranteed interest and return of capital.
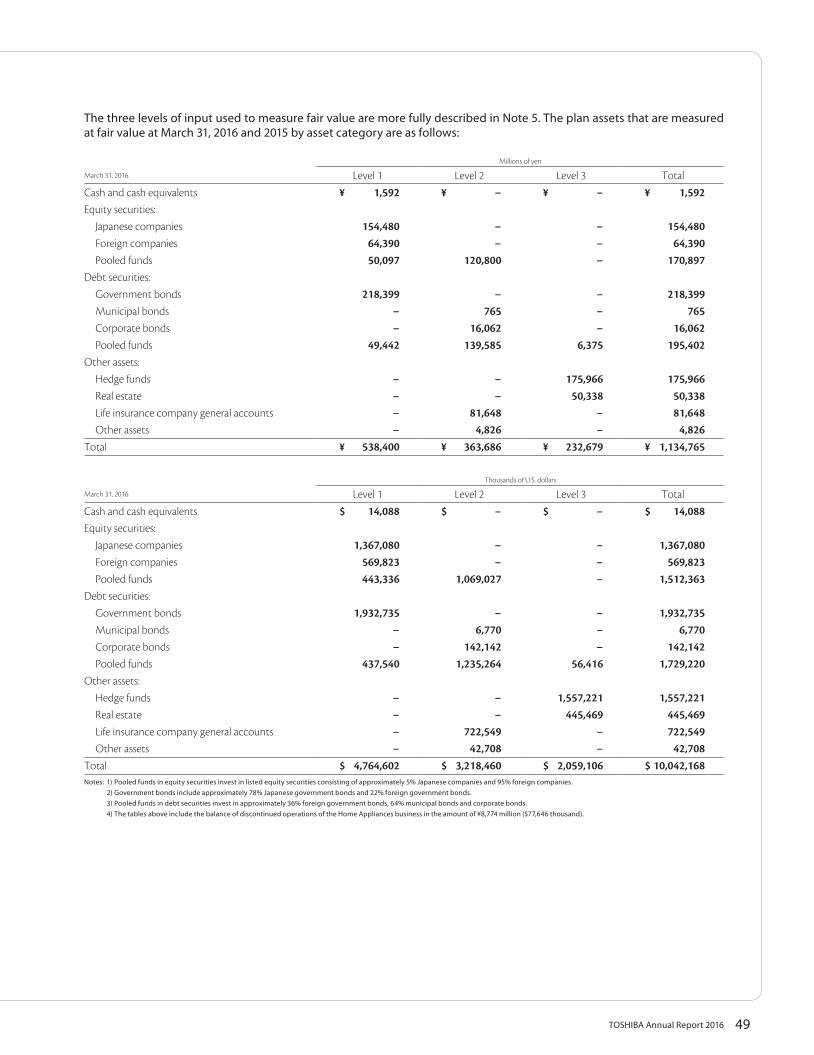
49TOSHIBA Annual Report 2016
The three levels of input used to measure fair value are more fully described in Note 5. The plan assets that are measured at fair value at March 31, 2016 and 2015 by asset category are as follows:
Millions of yen
March 31, 2016 Level 1 Level 2 Level 3 Total
Cash and cash equivalents ¥ 1,592 ¥ − ¥ − ¥ 1,592Equity securities:
Japanese companies 154,480 − − 154,480Foreign companies 64,390 − − 64,390Pooled funds 50,097 120,800 − 170,897
Debt securities:Government bonds 218,399 − − 218,399Municipal bonds − 765 − 765Corporate bonds − 16,062 − 16,062Pooled funds 49,442 139,585 6,375 195,402
Other assets:Hedge funds − − 175,966 175,966Real estate − − 50,338 50,338Life insurance company general accounts − 81,648 − 81,648Other assets − 4,826 − 4,826
Total ¥ 538,400 ¥ 363,686 ¥ 232,679 ¥ 1,134,765
Thousands of U.S. dollars
March 31, 2016 Level 1 Level 2 Level 3 Total
Cash and cash equivalents $ 14,088 $ − $ − $ 14,088Equity securities:
Japanese companies 1,367,080 − − 1,367,080Foreign companies 569,823 − − 569,823Pooled funds 443,336 1,069,027 − 1,512,363
Debt securities:Government bonds 1,932,735 − − 1,932,735Municipal bonds − 6,770 − 6,770Corporate bonds − 142,142 − 142,142Pooled funds 437,540 1,235,264 56,416 1,729,220
Other assets:Hedge funds − − 1,557,221 1,557,221Real estate − − 445,469 445,469Life insurance company general accounts − 722,549 − 722,549Other assets − 42,708 − 42,708
Total $ 4,764,602 $ 3,218,460 $ 2,059,106 $ 10,042,168Notes: 1) Pooled funds in equity securities invest in listed equity securities consisting of approximately 5% Japanese companies and 95% foreign companies. 2) Government bonds include approximately 78% Japanese government bonds and 22% foreign government bonds. 3) Pooled funds in debt securities invest in approximately 36% foreign government bonds, 64% municipal bonds and corporate bonds. 4) The tables above include the balance of discontinued operations of the Home Appliances business in the amount of ¥8,774 million ($77,646 thousand).
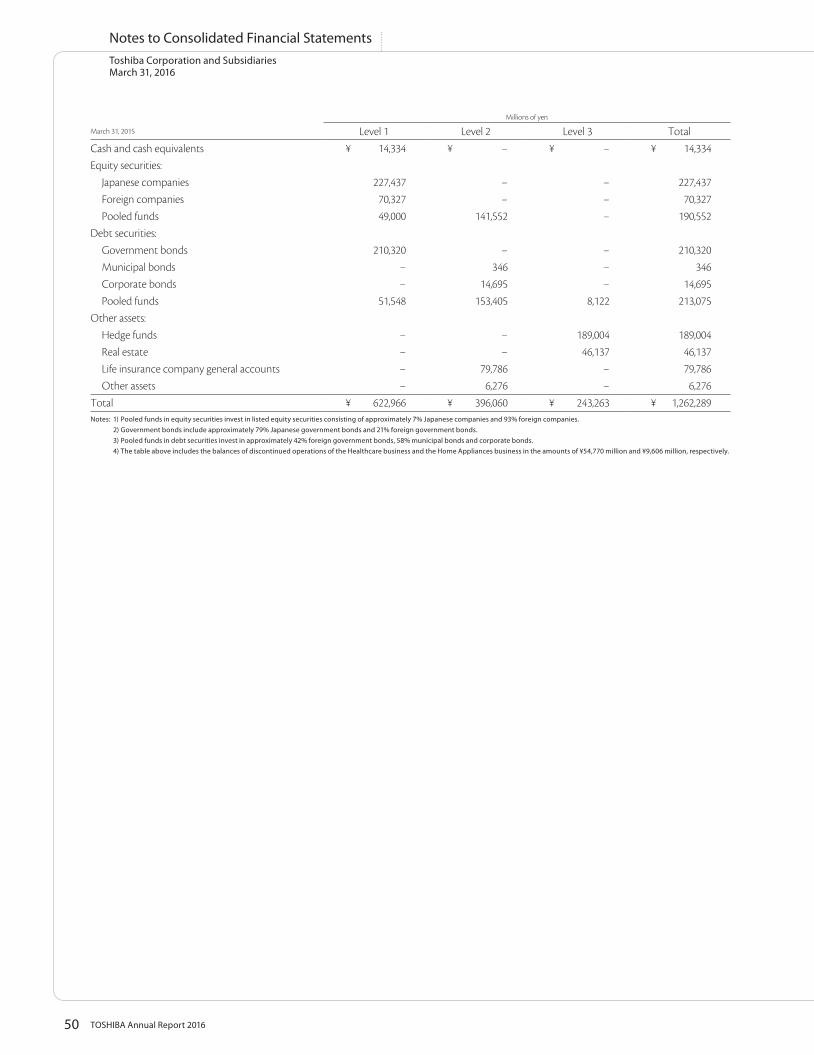
50 TOSHIBA Annual Report 2016
Toshiba Corporation and SubsidiariesMarch 31, 2016
Notes to Consolidated Financial Statements
Millions of yen
March 31, 2015 Level 1 Level 2 Level 3 Total
Cash and cash equivalents ¥ 14,334 ¥ − ¥ − ¥ 14,334Equity securities:
Japanese companies 227,437 − − 227,437Foreign companies 70,327 − − 70,327Pooled funds 49,000 141,552 − 190,552
Debt securities:Government bonds 210,320 − − 210,320Municipal bonds − 346 − 346Corporate bonds − 14,695 − 14,695Pooled funds 51,548 153,405 8,122 213,075
Other assets:Hedge funds − − 189,004 189,004Real estate − − 46,137 46,137Life insurance company general accounts − 79,786 − 79,786Other assets − 6,276 − 6,276
Total ¥ 622,966 ¥ 396,060 ¥ 243,263 ¥ 1,262,289Notes: 1) Pooled funds in equity securities invest in listed equity securities consisting of approximately 7% Japanese companies and 93% foreign companies. 2) Government bonds include approximately 79% Japanese government bonds and 21% foreign government bonds. 3) Pooled funds in debt securities invest in approximately 42% foreign government bonds, 58% municipal bonds and corporate bonds. 4) The table above includes the balances of discontinued operations of the Healthcare business and the Home Appliances business in the amounts of ¥54,770 million and ¥9,606 million, respectively.
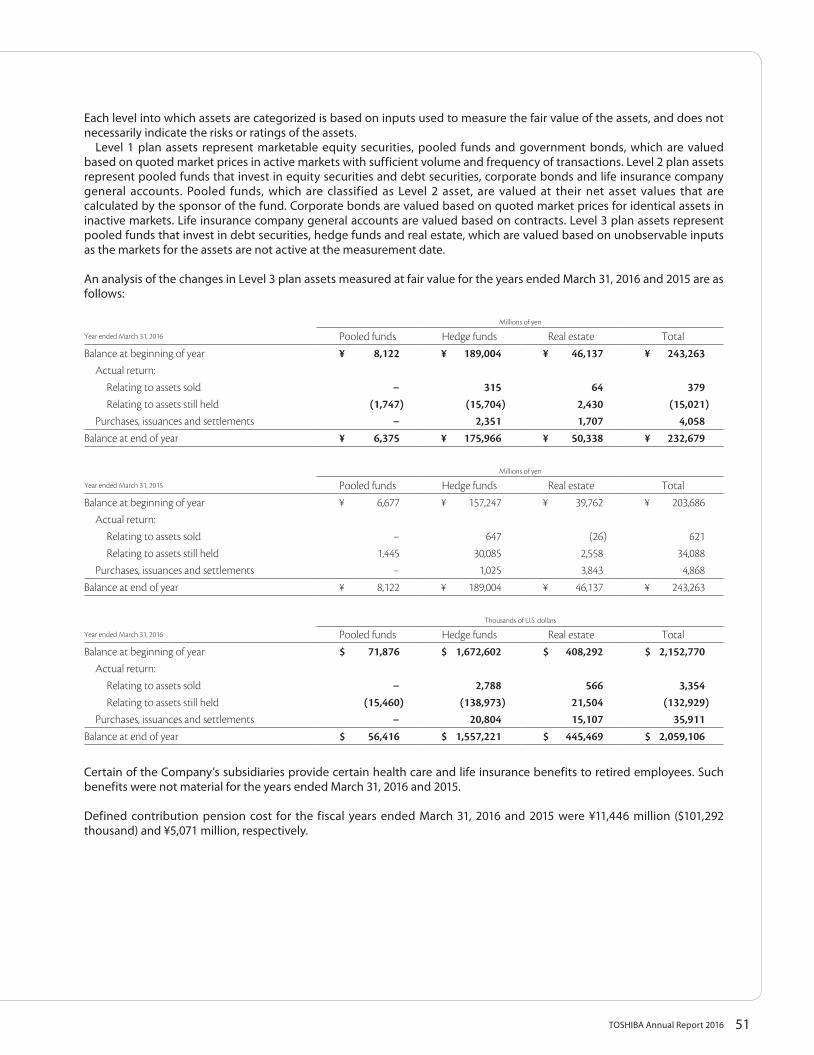
51TOSHIBA Annual Report 2016
Each level into which assets are categorized is based on inputs used to measure the fair value of the assets, and does not necessarily indicate the risks or ratings of the assets. Level 1 plan assets represent marketable equity securities, pooled funds and government bonds, which are valued based on quoted market prices in active markets with sufficient volume and frequency of transactions. Level 2 plan assets represent pooled funds that invest in equity securities and debt securities, corporate bonds and life insurance company general accounts. Pooled funds, which are classified as Level 2 asset, are valued at their net asset values that are calculated by the sponsor of the fund. Corporate bonds are valued based on quoted market prices for identical assets in inactive markets. Life insurance company general accounts are valued based on contracts. Level 3 plan assets represent pooled funds that invest in debt securities, hedge funds and real estate, which are valued based on unobservable inputs as the markets for the assets are not active at the measurement date.
An analysis of the changes in Level 3 plan assets measured at fair value for the years ended March 31, 2016 and 2015 are as follows:
Millions of yen
Year ended March 31, 2016 Pooled funds Hedge funds Real estate Total
Balance at beginning of year ¥ 8,122 ¥ 189,004 ¥ 46,137 ¥ 243,263Actual return:
Relating to assets sold − 315 64 379Relating to assets still held (1,747) (15,704) 2,430 (15,021)
Purchases, issuances and settlements − 2,351 1,707 4,058Balance at end of year ¥ 6,375 ¥ 175,966 ¥ 50,338 ¥ 232,679
Millions of yen
Year ended March 31, 2015 Pooled funds Hedge funds Real estate Total
Balance at beginning of year ¥ 6,677 ¥ 157,247 ¥ 39,762 ¥ 203,686Actual return:
Relating to assets sold − 647 (26) 621Relating to assets still held 1,445 30,085 2,558 34,088
Purchases, issuances and settlements − 1,025 3,843 4,868
Balance at end of year ¥ 8,122 ¥ 189,004 ¥ 46,137 ¥ 243,263
Thousands of U.S. dollars
Year ended March 31, 2016 Pooled funds Hedge funds Real estate Total
Balance at beginning of year $ 71,876 $ 1,672,602 $ 408,292 $ 2,152,770Actual return:
Relating to assets sold − 2,788 566 3,354Relating to assets still held (15,460) (138,973) 21,504 (132,929)
Purchases, issuances and settlements − 20,804 15,107 35,911Balance at end of year $ 56,416 $ 1,557,221 $ 445,469 $ 2,059,106
Certain of the Company’s subsidiaries provide certain health care and life insurance benefits to retired employees. Such benefits were not material for the years ended March 31, 2016 and 2015.
Defined contribution pension cost for the fiscal years ended March 31, 2016 and 2015 were ¥11,446 million ($101,292 thousand) and ¥5,071 million, respectively.
52 TOSHIBA Annual Report 2016
Toshiba Corporation and SubsidiariesMarch 31, 2016
Notes to Consolidated Financial Statements
13. RESEARCH AND DEVELOPMENT COSTS
Research and development costs are expensed as incurred and amounted to ¥360,858 million ($3,193,434 thousand) and ¥309,713 million for the years ended March 31, 2016 and 2015, respectively.
14. ADVERTISING COSTS
Advertising costs are expensed as incurred and amounted to ¥22,917 million ($202,805 thousand) and ¥29,640 million for the years ended March 31, 2016 and 2015, respectively.
15. OTHER INCOME AND OTHER EXPENSE
FOREIGN EXCHANGE GAINS AND LOSSESFor the years ended March 31, 2016 and 2015, the net foreign exchange gains (losses) were ¥16,417 million ($145,283 thousand) loss and ¥20,120 million gain, respectively.
GAINS ON SALES OF SECURITIESThe gains on sales of securities for the year ended March 31, 2016, were ¥184,949 million ($1,636,717 thousand). They were mainly related to the sales of securities of KONE Corporation in Finland, Topcon Corporation and NREG Toshiba Building Co., Ltd. The gains on sales of securities for the year ended March 31, 2015, were ¥35,533 million. These gains were mainly related to the sales of equity securities.
GAINS AND LOSSES ON SALES OR DISPOSAL OF FIXED ASSETSFor the years ended March 31, 2016 and 2015, the sales and disposal of fixed assets were ¥8,598 million ($76,088 thousand) loss and ¥14,598 million loss, respectively. Gains on sales of fixed assets were ¥4,503 million ($39,850 thousand), and losses on disposal of fixed assets were ¥13,101 million ($115,938 thousand) for the year ended March 31, 2016. Gains on sales of fixed assets were ¥2,302 million, and losses on disposal of fixed assets were ¥16,900 million for the year ended March 31, 2015.
PROCEED FROM LEGAL SETTLEMENT WITH SK HYNIX INC.In December 2014, the Company has reached a settlement with Korea’s SK hynix Inc. (“SK hynix”) in connection with a civil lawsuit that the Company initiated against SK hynix on March 2014 to seek damages under Japan’s Unfair Competition Prevention Act. Proceed from legal settlement with SK hynix of ¥32,868 million was recorded for the year ended March 31, 2015.
PENALTIES RELATED TO THE REVISION OF INAPPROPRIATE ACCOUNTING TREATMENTS IN PREVIOUS YEARSOn February 12, 2015, the Company received an order to report from the Securities and Exchange Surveillance Commission (“SESC”), based on Article 26 of the Financial Instruments and Exchange Act, requiring submission of a report. Through subsequent investigations by the Special Investigation Committee and the Independent Investigation Committee and self-checks, inappropriate accounting treatments in previous years to be corrected were identified. Consequently, the Company received a payment order of administrative monetary penalty from the Financial Services Agency for the act that the Company submitted the financial statements including material misstatements due to inappropriate accounting treatments pursuant to Article 172-4, Paragraphs 1 and 2 of the Financial Instruments and Exchange Act and the act that its securities were traded based on the published disclosure documents including material misstatements due to inappropriate accounting treatments pursuant to Article 172-2, Paragraph 1 of the Financial Instruments and Exchange Act. The Company paid the penalty in the year ended March 31, 2016. For the fiscal year ended March 31, 2015, provision for estimated penalties related to this revision of inappropriate accounting treatments in previous years amounted to ¥8,427 million were recorded.
53TOSHIBA Annual Report 2016
16. IMPAIRMENT OF LONG-LIVED ASSETS
Due to a decrease in profitability of the following business, the Group recorded impairment losses related to the property, plant and equipment, and finite-lived intangible assets. Impairment losses recorded in the year ended March 31, 2016 consisted of ¥60,083 million ($531,708 thousand) in the POS business, ¥31,324 million ($277,204 thousand) in the Transmission & Distribution Systems business, ¥20,278 million ($179,451 thousand) in the Lighting business, ¥19,060 million ($168,673 thousand) in the Storage Products business, ¥18,088 million ($160,071 thousand) in the Discrete business, ¥11,571 million ($102,398 thousand) in the Mixed Signal IC business, ¥2,186 million ($19,345 thousand) in the PC business, ¥1,795 million ($15,885 thousand) in the System LSI business, and ¥1,643 million ($14,539 thousand) in the Visual Products business. Impairment losses recorded in the year ended March 31, 2015 consisted of ¥41,875 million in the Discrete business, ¥3,439 million in the System LSI business, ¥3,116 million in the PC business, ¥2,596 million in the Battery business, and ¥2,387 million in the Automotive Applications business. Impairment losses for the Visual Products business for the year ended March 31, 2015 and for the Automotive Applications business for the year ended March 31, 2016 were not significant. These impairment losses are included in cost of sales in the consolidated statements of operations. Impairment losses recorded in the Home Appliances business were ¥4,200 million ($37,168 thousand) in the year ended March 31, 2016, and ¥38,869 million in the year ended March 31, 2015. These results have been reclassified as discontinued operations. Impairment losses in the POS business and the Lighting business are related to Community Solutions, those in the Transmission & Distribution Systems business and the Automotive Applications business are related to Energy & Infrastructure, those in the Storage Products business, the Discrete business, the Mixed Signal IC business, and the System LSI business are related to Electronic Devices & Components, and those in the PC business and the Visual Products business are related to Lifestyle Products & Services.
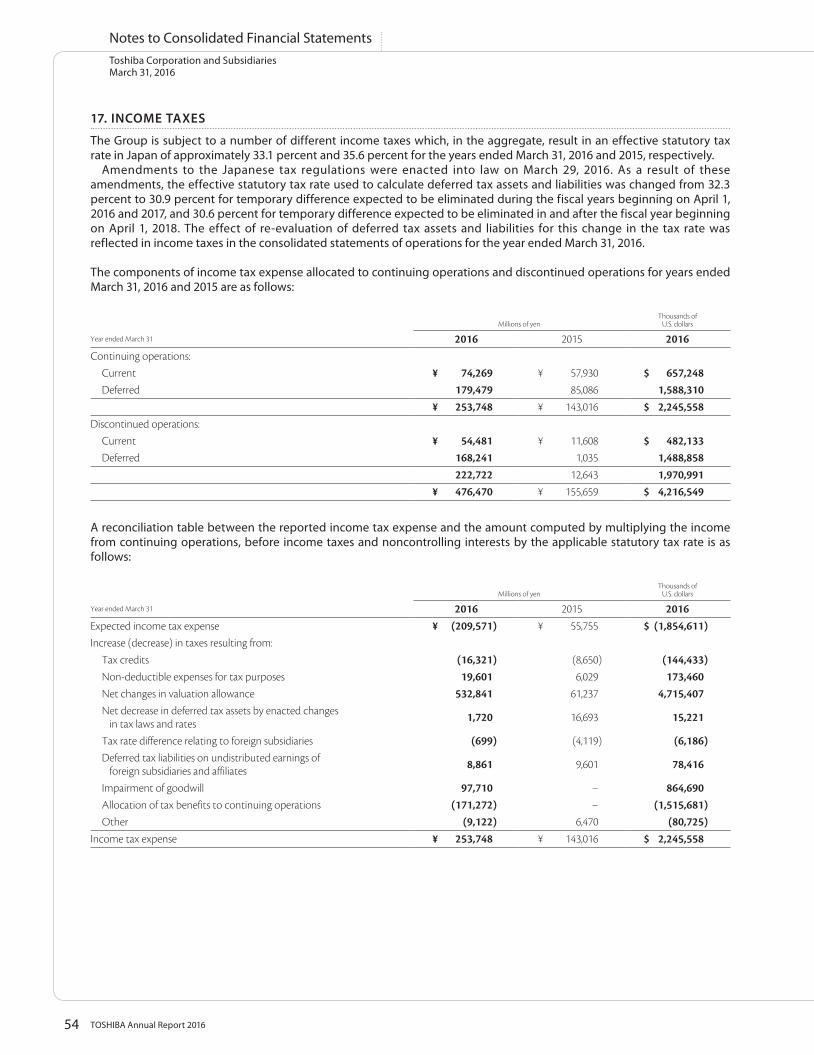
54 TOSHIBA Annual Report 2016
Toshiba Corporation and SubsidiariesMarch 31, 2016
Notes to Consolidated Financial Statements
17. INCOME TAXES
The Group is subject to a number of different income taxes which, in the aggregate, result in an effective statutory tax rate in Japan of approximately 33.1 percent and 35.6 percent for the years ended March 31, 2016 and 2015, respectively. Amendments to the Japanese tax regulations were enacted into law on March 29, 2016. As a result of these amendments, the effective statutory tax rate used to calculate deferred tax assets and liabilities was changed from 32.3 percent to 30.9 percent for temporary difference expected to be eliminated during the fiscal years beginning on April 1, 2016 and 2017, and 30.6 percent for temporary difference expected to be eliminated in and after the fiscal year beginning on April 1, 2018. The effect of re-evaluation of deferred tax assets and liabilities for this change in the tax rate was reflected in income taxes in the consolidated statements of operations for the year ended March 31, 2016.
The components of income tax expense allocated to continuing operations and discontinued operations for years ended March 31, 2016 and 2015 are as follows:
Millions of yenThousands of
U.S. dollars
Year ended March 31 2016 2015 2016Continuing operations:
Current ¥ 74,269 ¥ 57,930 $ 657,248Deferred 179,479 85,086 1,588,310
¥ 253,748 ¥ 143,016 $ 2,245,558Discontinued operations:
Current ¥ 54,481 ¥ 11,608 $ 482,133Deferred 168,241 1,035 1,488,858
222,722 12,643 1,970,991¥ 476,470 ¥ 155,659 $ 4,216,549
A reconciliation table between the reported income tax expense and the amount computed by multiplying the income from continuing operations, before income taxes and noncontrolling interests by the applicable statutory tax rate is as follows:
Millions of yenThousands of
U.S. dollars
Year ended March 31 2016 2015 2016Expected income tax expense ¥ (209,571) ¥ 55,755 $ (1,854,611)Increase (decrease) in taxes resulting from:
Tax credits (16,321) (8,650) (144,433)Non-deductible expenses for tax purposes 19,601 6,029 173,460Net changes in valuation allowance 532,841 61,237 4,715,407Net decrease in deferred tax assets by enacted changes
in tax laws and rates 1,720 16,693 15,221
Tax rate difference relating to foreign subsidiaries (699) (4,119) (6,186)Deferred tax liabilities on undistributed earnings of
foreign subsidiaries and affiliates 8,861 9,601 78,416
Impairment of goodwill 97,710 − 864,690Allocation of tax benefits to continuing operations (171,272) − (1,515,681)Other (9,122) 6,470 (80,725)
Income tax expense ¥ 253,748 ¥ 143,016 $ 2,245,558
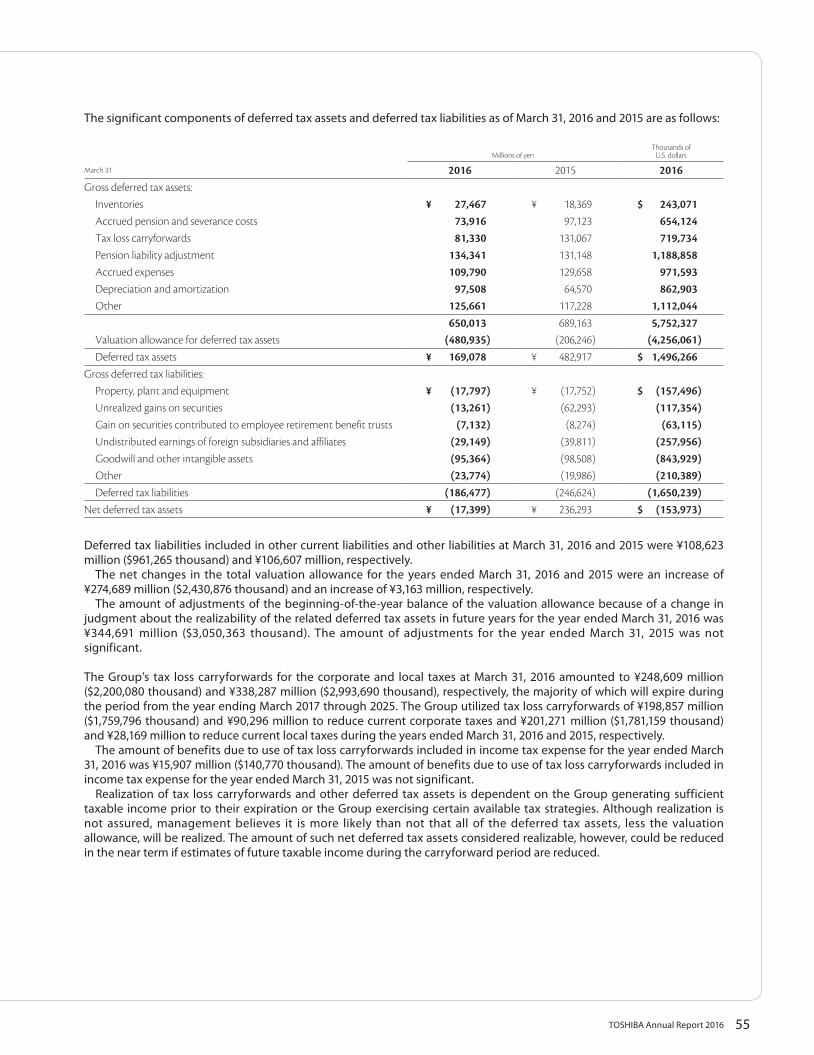
55TOSHIBA Annual Report 2016
The significant components of deferred tax assets and deferred tax liabilities as of March 31, 2016 and 2015 are as follows:
Millions of yenThousands of
U.S. dollars
March 31 2016 2015 2016Gross deferred tax assets:
Inventories ¥ 27,467 ¥ 18,369 $ 243,071Accrued pension and severance costs 73,916 97,123 654,124Tax loss carryforwards 81,330 131,067 719,734Pension liability adjustment 134,341 131,148 1,188,858Accrued expenses 109,790 129,658 971,593Depreciation and amortization 97,508 64,570 862,903Other 125,661 117,228 1,112,044
650,013 689,163 5,752,327Valuation allowance for deferred tax assets (480,935) (206,246) (4,256,061)Deferred tax assets ¥ 169,078 ¥ 482,917 $ 1,496,266
Gross deferred tax liabilities:Property, plant and equipment ¥ (17,797) ¥ (17,752) $ (157,496)Unrealized gains on securities (13,261) (62,293) (117,354)Gain on securities contributed to employee retirement benefit trusts (7,132) (8,274) (63,115)Undistributed earnings of foreign subsidiaries and affiliates (29,149) (39,811) (257,956)Goodwill and other intangible assets (95,364) (98,508) (843,929)Other (23,774) (19,986) (210,389)Deferred tax liabilities (186,477) (246,624) (1,650,239)
Net deferred tax assets ¥ (17,399) ¥ 236,293 $ (153,973)
Deferred tax liabilities included in other current liabilities and other liabilities at March 31, 2016 and 2015 were ¥108,623 million ($961,265 thousand) and ¥106,607 million, respectively. The net changes in the total valuation allowance for the years ended March 31, 2016 and 2015 were an increase of ¥274,689 million ($2,430,876 thousand) and an increase of ¥3,163 million, respectively. The amount of adjustments of the beginning-of-the-year balance of the valuation allowance because of a change in judgment about the realizability of the related deferred tax assets in future years for the year ended March 31, 2016 was ¥344,691 million ($3,050,363 thousand). The amount of adjustments for the year ended March 31, 2015 was not significant.
The Group’s tax loss carryforwards for the corporate and local taxes at March 31, 2016 amounted to ¥248,609 million ($2,200,080 thousand) and ¥338,287 million ($2,993,690 thousand), respectively, the majority of which will expire during the period from the year ending March 2017 through 2025. The Group utilized tax loss carryforwards of ¥198,857 million ($1,759,796 thousand) and ¥90,296 million to reduce current corporate taxes and ¥201,271 million ($1,781,159 thousand) and ¥28,169 million to reduce current local taxes during the years ended March 31, 2016 and 2015, respectively. The amount of benefits due to use of tax loss carryforwards included in income tax expense for the year ended March 31, 2016 was ¥15,907 million ($140,770 thousand). The amount of benefits due to use of tax loss carryforwards included in income tax expense for the year ended March 31, 2015 was not significant. Realization of tax loss carryforwards and other deferred tax assets is dependent on the Group generating sufficient taxable income prior to their expiration or the Group exercising certain available tax strategies. Although realization is not assured, management believes it is more likely than not that all of the deferred tax assets, less the valuation allowance, will be realized. The amount of such net deferred tax assets considered realizable, however, could be reduced in the near term if estimates of future taxable income during the carryforward period are reduced.
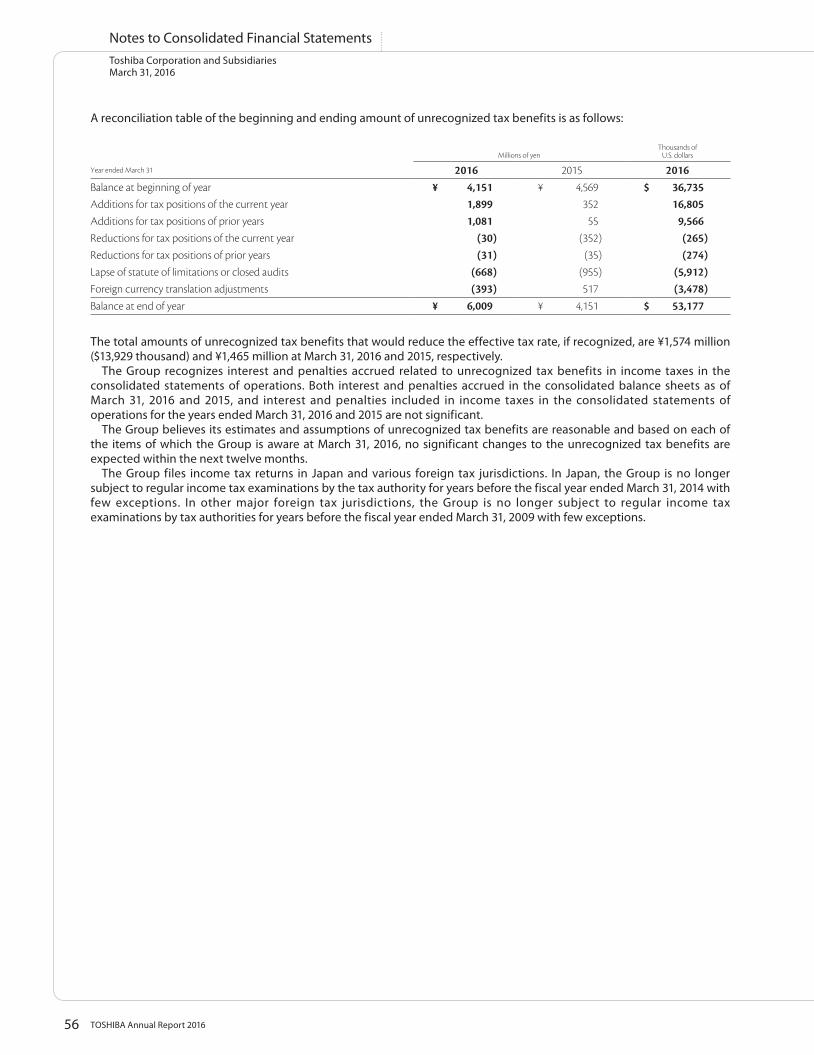
56 TOSHIBA Annual Report 2016
Toshiba Corporation and SubsidiariesMarch 31, 2016
Notes to Consolidated Financial Statements
A reconciliation table of the beginning and ending amount of unrecognized tax benefits is as follows:
Millions of yenThousands of
U.S. dollars
Year ended March 31 2016 2015 2016Balance at beginning of year ¥ 4,151 ¥ 4,569 $ 36,735Additions for tax positions of the current year 1,899 352 16,805Additions for tax positions of prior years 1,081 55 9,566Reductions for tax positions of the current year (30) (352) (265)Reductions for tax positions of prior years (31) (35) (274)Lapse of statute of limitations or closed audits (668) (955) (5,912)Foreign currency translation adjustments (393) 517 (3,478)Balance at end of year ¥ 6,009 ¥ 4,151 $ 53,177
The total amounts of unrecognized tax benefits that would reduce the effective tax rate, if recognized, are ¥1,574 million ($13,929 thousand) and ¥1,465 million at March 31, 2016 and 2015, respectively. The Group recognizes interest and penalties accrued related to unrecognized tax benefits in income taxes in the consolidated statements of operations. Both interest and penalties accrued in the consolidated balance sheets as of March 31, 2016 and 2015, and interest and penalties included in income taxes in the consolidated statements of operations for the years ended March 31, 2016 and 2015 are not significant. The Group believes its estimates and assumptions of unrecognized tax benefits are reasonable and based on each of the items of which the Group is aware at March 31, 2016, no significant changes to the unrecognized tax benefits are expected within the next twelve months. The Group files income tax returns in Japan and various foreign tax jurisdictions. In Japan, the Group is no longer subject to regular income tax examinations by the tax authority for years before the fiscal year ended March 31, 2014 with few exceptions. In other major foreign tax jurisdictions, the Group is no longer subject to regular income tax examinations by tax authorities for years before the fiscal year ended March 31, 2009 with few exceptions.
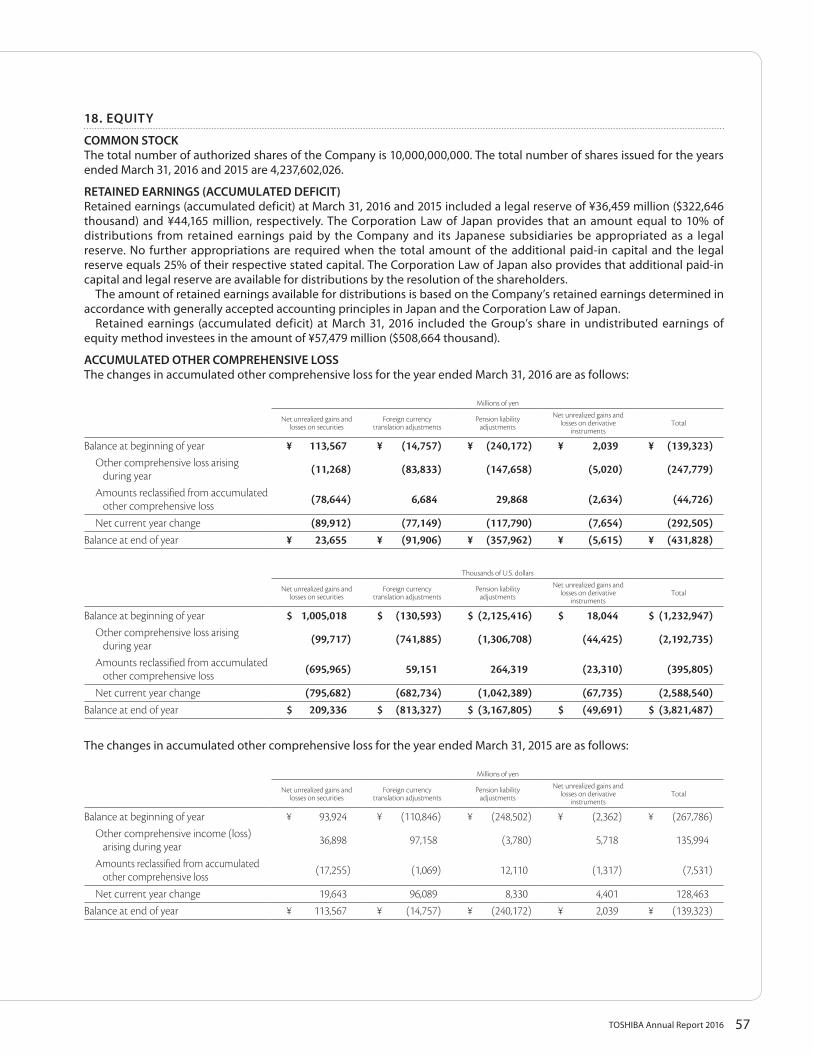
57TOSHIBA Annual Report 2016
18. EQUITY
COMMON STOCKThe total number of authorized shares of the Company is 10,000,000,000. The total number of shares issued for the years ended March 31, 2016 and 2015 are 4,237,602,026.
RETAINED EARNINGS (ACCUMULATED DEFICIT)Retained earnings (accumulated deficit) at March 31, 2016 and 2015 included a legal reserve of ¥36,459 million ($322,646 thousand) and ¥44,165 million, respectively. The Corporation Law of Japan provides that an amount equal to 10% of distributions from retained earnings paid by the Company and its Japanese subsidiaries be appropriated as a legal reserve. No further appropriations are required when the total amount of the additional paid-in capital and the legal reserve equals 25% of their respective stated capital. The Corporation Law of Japan also provides that additional paid-in capital and legal reserve are available for distributions by the resolution of the shareholders. The amount of retained earnings available for distributions is based on the Company’s retained earnings determined in accordance with generally accepted accounting principles in Japan and the Corporation Law of Japan. Retained earnings (accumulated deficit) at March 31, 2016 included the Group’s share in undistributed earnings of equity method investees in the amount of ¥57,479 million ($508,664 thousand).
ACCUMULATED OTHER COMPREHENSIVE LOSSThe changes in accumulated other comprehensive loss for the year ended March 31, 2016 are as follows:
Millions of yen
Net unrealized gains and losses on securities
Foreign currency translation adjustments
Pension liability adjustments
Net unrealized gains and losses on derivative
instruments Total
Balance at beginning of year ¥ 113,567 ¥ (14,757) ¥ (240,172) ¥ 2,039 ¥ (139,323)Other comprehensive loss arising
during year (11,268) (83,833) (147,658) (5,020) (247,779)
Amounts reclassified from accumulated other comprehensive loss (78,644) 6,684 29,868 (2,634) (44,726)
Net current year change (89,912) (77,149) (117,790) (7,654) (292,505)Balance at end of year ¥ 23,655 ¥ (91,906) ¥ (357,962) ¥ (5,615) ¥ (431,828)
Thousands of U.S. dollars
Net unrealized gains and losses on securities
Foreign currency translation adjustments
Pension liability adjustments
Net unrealized gains and losses on derivative
instrumentsTotal
Balance at beginning of year $ 1,005,018 $ (130,593) $ (2,125,416) $ 18,044 $ (1,232,947)Other comprehensive loss arising
during year (99,717) (741,885) (1,306,708) (44,425) (2,192,735)
Amounts reclassified from accumulated other comprehensive loss (695,965) 59,151 264,319 (23,310) (395,805)
Net current year change (795,682) (682,734) (1,042,389) (67,735) (2,588,540)Balance at end of year $ 209,336 $ (813,327) $ (3,167,805) $ (49,691) $ (3,821,487)
The changes in accumulated other comprehensive loss for the year ended March 31, 2015 are as follows:
Millions of yen
Net unrealized gains and losses on securities
Foreign currency translation adjustments
Pension liability adjustments
Net unrealized gains and losses on derivative
instrumentsTotal
Balance at beginning of year ¥ 93,924 ¥ (110,846) ¥ (248,502) ¥ (2,362) ¥ (267,786)Other comprehensive income (loss)
arising during year 36,898 97,158 (3,780) 5,718 135,994
Amounts reclassified from accumulated other comprehensive loss (17,255) (1,069) 12,110 (1,317) (7,531)
Net current year change 19,643 96,089 8,330 4,401 128,463Balance at end of year ¥ 113,567 ¥ (14,757) ¥ (240,172) ¥ 2,039 ¥ (139,323)
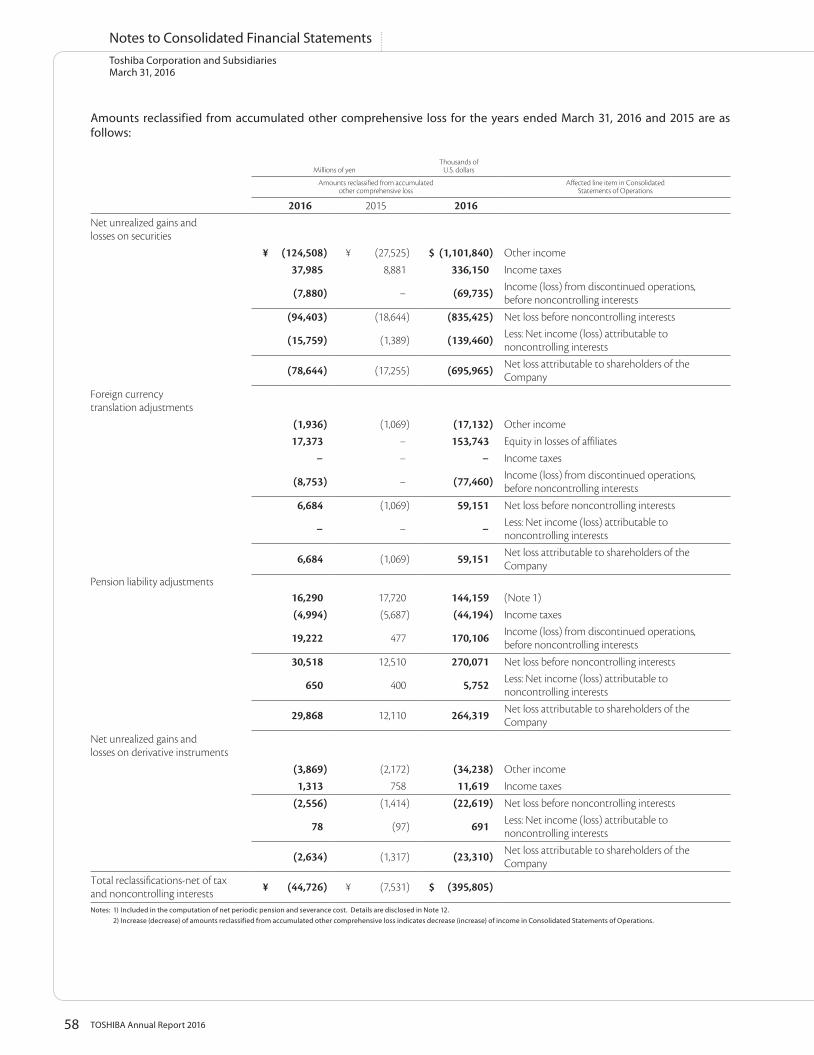
58 TOSHIBA Annual Report 2016
Toshiba Corporation and SubsidiariesMarch 31, 2016
Notes to Consolidated Financial Statements
Amounts reclassified from accumulated other comprehensive loss for the years ended March 31, 2016 and 2015 are as follows:
Millions of yenThousands of
U.S. dollars
Amounts reclassified from accumulated other comprehensive loss
Affected line item in Consolidated Statements of Operations
2016 2015 2016Net unrealized gains and losses on securities
¥ (124,508) ¥ (27,525) $ (1,101,840) Other income37,985 8,881 336,150 Income taxes
(7,880) − (69,735) Income (loss) from discontinued operations, before noncontrolling interests
(94,403) (18,644) (835,425) Net loss before noncontrolling interests
(15,759) (1,389) (139,460) Less: Net income (loss) attributable to noncontrolling interests
(78,644) (17,255) (695,965) Net loss attributable to shareholders of the Company
Foreign currency translation adjustments
(1,936) (1,069) (17,132) Other income17,373 − 153,743 Equity in losses of affiliates
− − − Income taxes
(8,753) − (77,460) Income (loss) from discontinued operations, before noncontrolling interests
6,684 (1,069) 59,151 Net loss before noncontrolling interests
− − − Less: Net income (loss) attributable to noncontrolling interests
6,684 (1,069) 59,151 Net loss attributable to shareholders of the Company
Pension liability adjustments16,290 17,720 144,159 (Note 1)(4,994) (5,687) (44,194) Income taxes
19,222 477 170,106 Income (loss) from discontinued operations, before noncontrolling interests
30,518 12,510 270,071 Net loss before noncontrolling interests
650 400 5,752 Less: Net income (loss) attributable to noncontrolling interests
29,868 12,110 264,319 Net loss attributable to shareholders of the Company
Net unrealized gains and losses on derivative instruments
(3,869) (2,172) (34,238) Other income1,313 758 11,619 Income taxes
(2,556) (1,414) (22,619) Net loss before noncontrolling interests
78 (97) 691 Less: Net income (loss) attributable to noncontrolling interests
(2,634) (1,317) (23,310) Net loss attributable to shareholders of the Company
Total reclassifications-net of tax and noncontrolling interests ¥ (44,726) ¥ (7,531) $ (395,805)
Notes: 1) Included in the computation of net periodic pension and severance cost. Details are disclosed in Note 12. 2) Increase (decrease) of amounts reclassified from accumulated other comprehensive loss indicates decrease (increase) of income in Consolidated Statements of Operations.
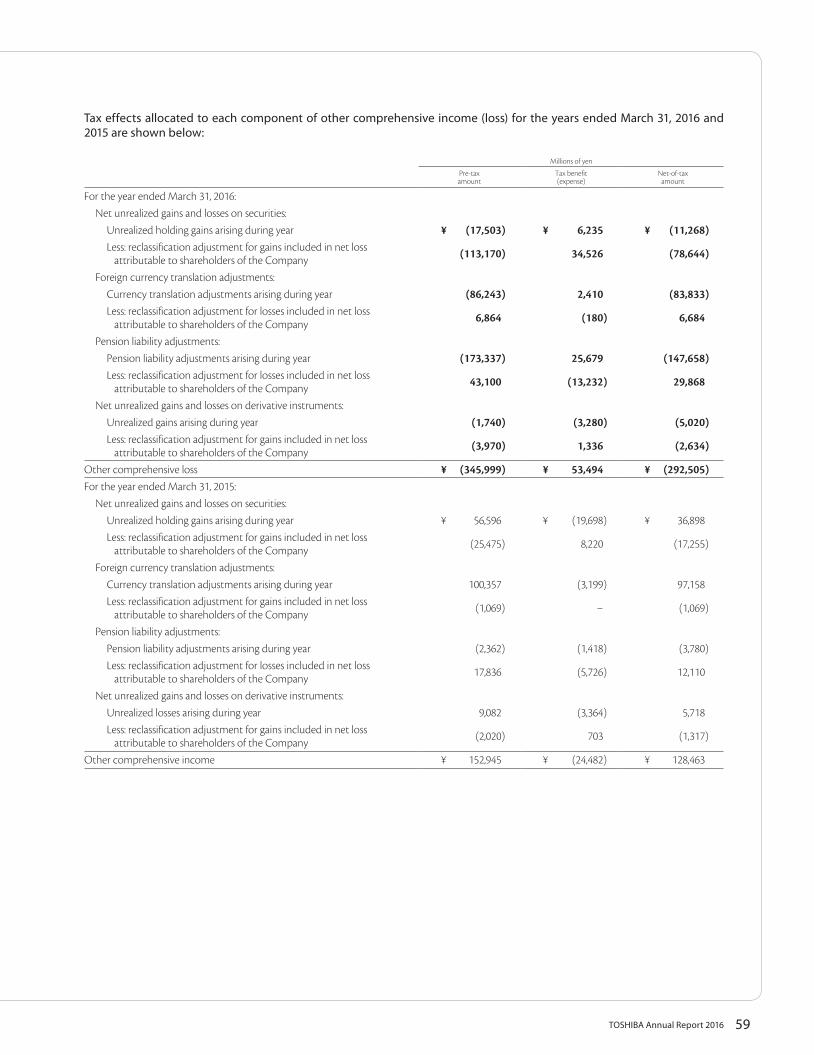
59TOSHIBA Annual Report 2016
Tax effects allocated to each component of other comprehensive income (loss) for the years ended March 31, 2016 and 2015 are shown below:
Millions of yen
Pre-taxamount
Tax benefit(expense)
Net-of-taxamount
For the year ended March 31, 2016:Net unrealized gains and losses on securities:
Unrealized holding gains arising during year ¥ (17,503) ¥ 6,235 ¥ (11,268)Less: reclassification adjustment for gains included in net loss
attributable to shareholders of the Company (113,170) 34,526 (78,644)
Foreign currency translation adjustments:Currency translation adjustments arising during year (86,243) 2,410 (83,833)Less: reclassification adjustment for losses included in net loss
attributable to shareholders of the Company 6,864 (180) 6,684
Pension liability adjustments:Pension liability adjustments arising during year (173,337) 25,679 (147,658)Less: reclassification adjustment for losses included in net loss
attributable to shareholders of the Company 43,100 (13,232) 29,868
Net unrealized gains and losses on derivative instruments:Unrealized gains arising during year (1,740) (3,280) (5,020)Less: reclassification adjustment for gains included in net loss
attributable to shareholders of the Company (3,970) 1,336 (2,634)
Other comprehensive loss ¥ (345,999) ¥ 53,494 ¥ (292,505)For the year ended March 31, 2015:
Net unrealized gains and losses on securities:Unrealized holding gains arising during year ¥ 56,596 ¥ (19,698) ¥ 36,898Less: reclassification adjustment for gains included in net loss
attributable to shareholders of the Company (25,475) 8,220 (17,255)
Foreign currency translation adjustments:Currency translation adjustments arising during year 100,357 (3,199) 97,158Less: reclassification adjustment for gains included in net loss
attributable to shareholders of the Company (1,069) − (1,069)
Pension liability adjustments:Pension liability adjustments arising during year (2,362) (1,418) (3,780)Less: reclassification adjustment for losses included in net loss
attributable to shareholders of the Company 17,836 (5,726) 12,110
Net unrealized gains and losses on derivative instruments:Unrealized losses arising during year 9,082 (3,364) 5,718Less: reclassification adjustment for gains included in net loss
attributable to shareholders of the Company (2,020) 703 (1,317)
Other comprehensive income ¥ 152,945 ¥ (24,482) ¥ 128,463
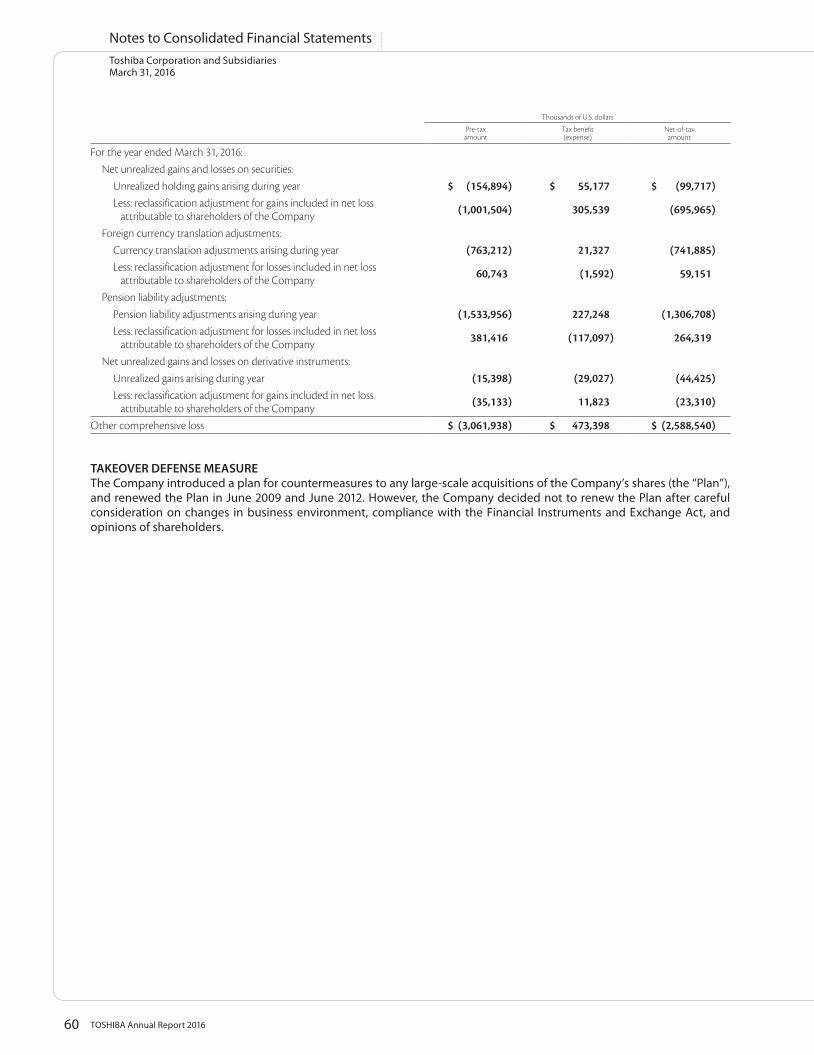
60 TOSHIBA Annual Report 2016
Toshiba Corporation and SubsidiariesMarch 31, 2016
Notes to Consolidated Financial Statements
Thousands of U.S. dollars
Pre-taxamount
Tax benefit(expense)
Net-of-taxamount
For the year ended March 31, 2016:Net unrealized gains and losses on securities:
Unrealized holding gains arising during year $ (154,894) $ 55,177 $ (99,717)Less: reclassification adjustment for gains included in net loss
attributable to shareholders of the Company (1,001,504) 305,539 (695,965)
Foreign currency translation adjustments:Currency translation adjustments arising during year (763,212) 21,327 (741,885)Less: reclassification adjustment for losses included in net loss
attributable to shareholders of the Company 60,743 (1,592) 59,151
Pension liability adjustments:Pension liability adjustments arising during year (1,533,956) 227,248 (1,306,708)Less: reclassification adjustment for losses included in net loss
attributable to shareholders of the Company 381,416 (117,097) 264,319
Net unrealized gains and losses on derivative instruments:Unrealized gains arising during year (15,398) (29,027) (44,425)Less: reclassification adjustment for gains included in net loss
attributable to shareholders of the Company (35,133) 11,823 (23,310)
Other comprehensive loss $ (3,061,938) $ 473,398 $ (2,588,540)
TAKEOVER DEFENSE MEASUREThe Company introduced a plan for countermeasures to any large-scale acquisitions of the Company’s shares (the “Plan”), and renewed the Plan in June 2009 and June 2012. However, the Company decided not to renew the Plan after careful consideration on changes in business environment, compliance with the Financial Instruments and Exchange Act, and opinions of shareholders.
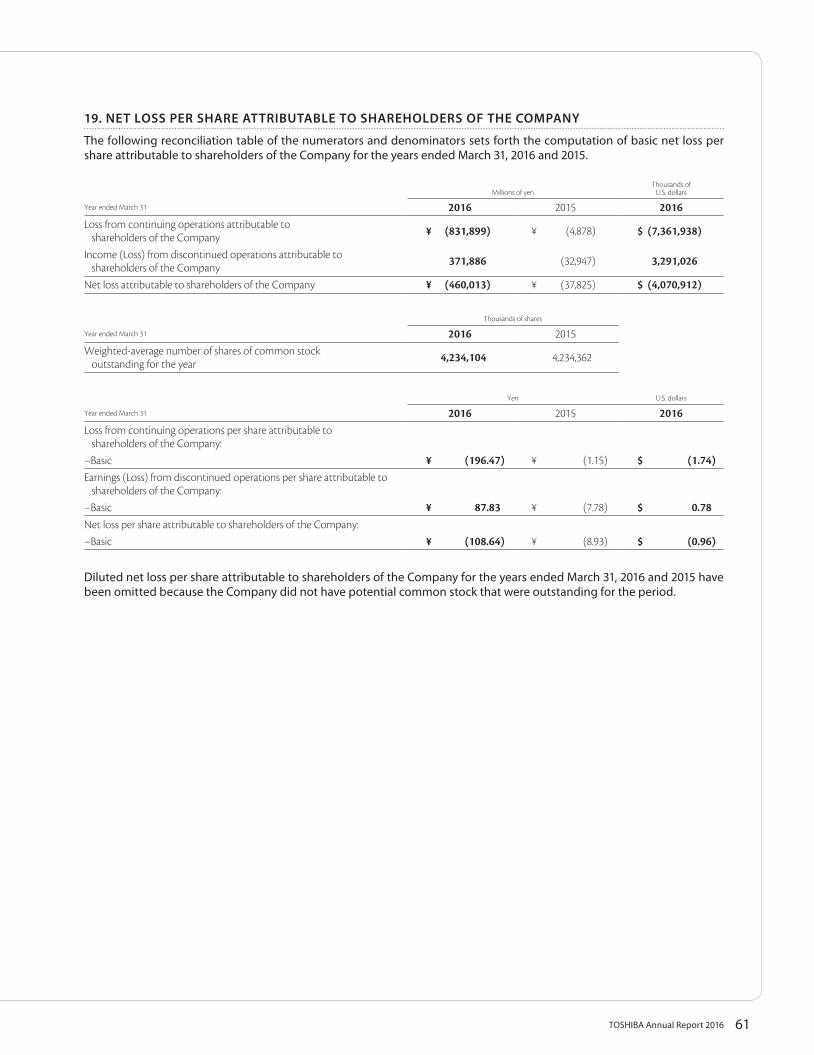
61TOSHIBA Annual Report 2016
19. NET LOSS PER SHARE ATTRIBUTABLE TO SHAREHOLDERS OF THE COMPANY
The following reconciliation table of the numerators and denominators sets forth the computation of basic net loss per share attributable to shareholders of the Company for the years ended March 31, 2016 and 2015.
Millions of yenThousands of
U.S. dollars
Year ended March 31 2016 2015 2016Loss from continuing operations attributable to
shareholders of the Company ¥ (831,899) ¥ (4,878) $ (7,361,938)
Income (Loss) from discontinued operations attributable to shareholders of the Company 371,886 (32,947) 3,291,026
Net loss attributable to shareholders of the Company ¥ (460,013) ¥ (37,825) $ (4,070,912)
Thousands of shares
Year ended March 31 2016 2015Weighted-average number of shares of common stock
outstanding for the year 4,234,104 4,234,362
Yen U.S. dollars
Year ended March 31 2016 2015 2016Loss from continuing operations per share attributable to
shareholders of the Company:−Basic ¥ (196.47) ¥ (1.15) $ (1.74)Earnings (Loss) from discontinued operations per share attributable to
shareholders of the Company:−Basic ¥ 87.83 ¥ (7.78) $ 0.78Net loss per share attributable to shareholders of the Company:−Basic ¥ (108.64) ¥ (8.93) $ (0.96)
Diluted net loss per share attributable to shareholders of the Company for the years ended March 31, 2016 and 2015 have been omitted because the Company did not have potential common stock that were outstanding for the period.
62 TOSHIBA Annual Report 2016
Toshiba Corporation and SubsidiariesMarch 31, 2016
Notes to Consolidated Financial Statements
20. FINANCIAL INSTRUMENTS
(1) DERIVATIVE FINANCIAL INSTRUMENTSThe Group operates internationally, giving rise to exposure to market risks from fluctuations in foreign currency exchange and interest rates. In the normal course of its risk management efforts, the Group employs a variety of derivative financial instruments, which are consisted principally of forward exchange contracts, interest rate swap agreements, currency swap agreements and currency options to reduce its exposures. The Group has policies and procedures for risk management and the approval, reporting and monitoring of derivative financial instruments. The Group’s policies prohibit holding or issuing derivative financial instruments for trading purposes. The Group is exposed to credit-related losses in the event of nonperformance by counterparties to derivative financial instruments, but the Group does not anticipate any credit-related loss from nonperformance by the counterparties because the counterparties are financial institutions of high credit standing and contracts are diversified across a number of major financial institutions. The Group has entered into forward exchange contracts with financial institutions as hedges against fluctuations in foreign currency exchange rates on monetary assets and liabilities denominated in foreign currencies. The forward exchange contracts related to accounts receivable and payable, and commitments on future trade transactions denominated in foreign currencies, mature primarily within a few years of the balance sheet date. Interest rate swap agreements, currency swap agreements and currency options are used to limit the Group’s exposure to losses in relation to underlying debt instruments and accounts receivable and payable denominated in foreign currencies resulting from adverse fluctuations in foreign currency exchange and interest rates. These agreements mature during the period 2016 to 2021. Forward exchange contracts, interest rate swap agreements, currency swap agreements and currency options are designated as either fair value hedges or cash flow hedges, except for some contracts, depending on accounts receivable and payable denominated in foreign currencies or commitments on future trade transactions and the interest rate characteristics of the underlying debt as discussed below.
Fair Value Hedge StrategyThe forward exchange contracts and currency swap agreements utilized by the Group effectively reduce fluctuation in fair value of accounts receivable and payable denominated in foreign currencies. The interest rate swap agreements utilized by the Group effectively convert a portion of its fixed-rate debt to a floating-rate basis. The gain or loss on the derivative financial instruments designated as fair value hedges is offset by the loss or gain on the hedged items in the same location of the consolidated statements of operations.
Cash Flow Hedge StrategyThe forward exchange contracts and currency options utilized by the Group effectively reduce fluctuation in cash flow from commitments on future trade transactions denominated in foreign currencies for the next 5 years and 1 year, respectively. The interest rate swap agreements utilized by the Group effectively convert a portion of its floating-rate debt to a fixed-rate basis for the next 5 years. The Group expects to reclassify ¥1,019 million ($9,018 thousand) of net income on derivative financial instruments from accumulated other comprehensive loss to net income (loss) attributable to shareholders of the Company during the next 12 months due to the collection of accounts receivable denominated in foreign currencies and the payments of accounts payable denominated in foreign currencies and variable interest associated with the floating-rate debts.
Derivatives Not Designated as Hedging Instruments StrategyThe Group has entered into certain forward exchange contracts, interest rate swap agreements, currency swap agreements and currency options to offset the earnings impact related to fluctuations in foreign currency exchange rates on monetary assets and liabilities denominated in foreign currencies and in interest rates on debt instruments. Although some of these contracts have not been designated as hedges as required in order to apply hedge accounting, the contracts are effective from an economic perspective. The changes in the fair value of those contracts are recorded in earnings immediately.
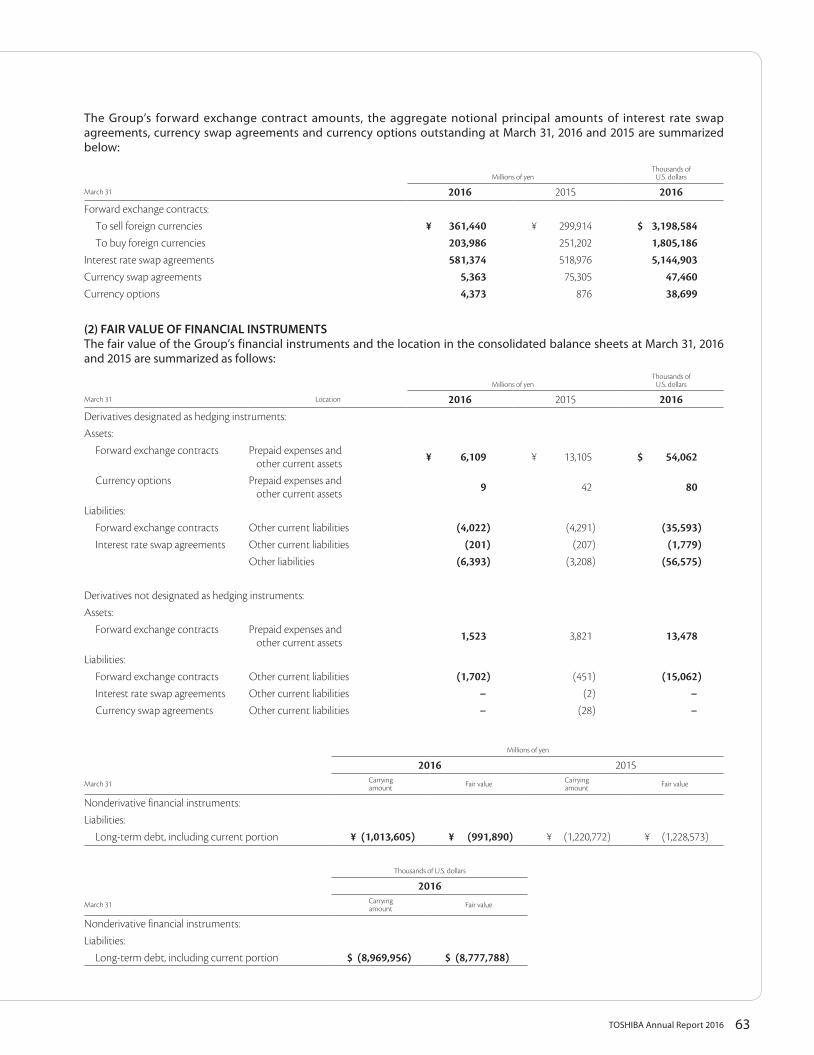
63TOSHIBA Annual Report 2016
The Group’s forward exchange contract amounts, the aggregate notional principal amounts of interest rate swap agreements, currency swap agreements and currency options outstanding at March 31, 2016 and 2015 are summarized below:
Millions of yenThousands of
U.S. dollars
March 31 2016 2015 2016Forward exchange contracts:
To sell foreign currencies ¥ 361,440 ¥ 299,914 $ 3,198,584To buy foreign currencies 203,986 251,202 1,805,186
Interest rate swap agreements 581,374 518,976 5,144,903Currency swap agreements 5,363 75,305 47,460Currency options 4,373 876 38,699
(2) FAIR VALUE OF FINANCIAL INSTRUMENTSThe fair value of the Group’s financial instruments and the location in the consolidated balance sheets at March 31, 2016 and 2015 are summarized as follows:
Millions of yenThousands of
U.S. dollars
March 31 Location 2016 2015 2016Derivatives designated as hedging instruments:Assets:
Forward exchange contracts Prepaid expenses andother current assets ¥ 6,109 ¥ 13,105 $ 54,062
Currency options Prepaid expenses andother current assets 9 42 80
Liabilities:Forward exchange contracts Other current liabilities (4,022) (4,291) (35,593)Interest rate swap agreements Other current liabilities (201) (207) (1,779)
Other liabilities (6,393) (3,208) (56,575)
Derivatives not designated as hedging instruments:Assets:
Forward exchange contracts Prepaid expenses andother current assets 1,523 3,821 13,478
Liabilities:Forward exchange contracts Other current liabilities (1,702) (451) (15,062)Interest rate swap agreements Other current liabilities − (2) −Currency swap agreements Other current liabilities − (28) −
Millions of yen
2016 2015
March 31 Carryingamount Fair value Carrying
amount Fair value
Nonderivative financial instruments:Liabilities:
Long-term debt, including current portion ¥ (1,013,605) ¥ (991,890) ¥ (1,220,772) ¥ (1,228,573)
Thousands of U.S. dollars
2016March 31 Carrying
amount Fair value
Nonderivative financial instruments:Liabilities:
Long-term debt, including current portion $ (8,969,956) $ (8,777,788)
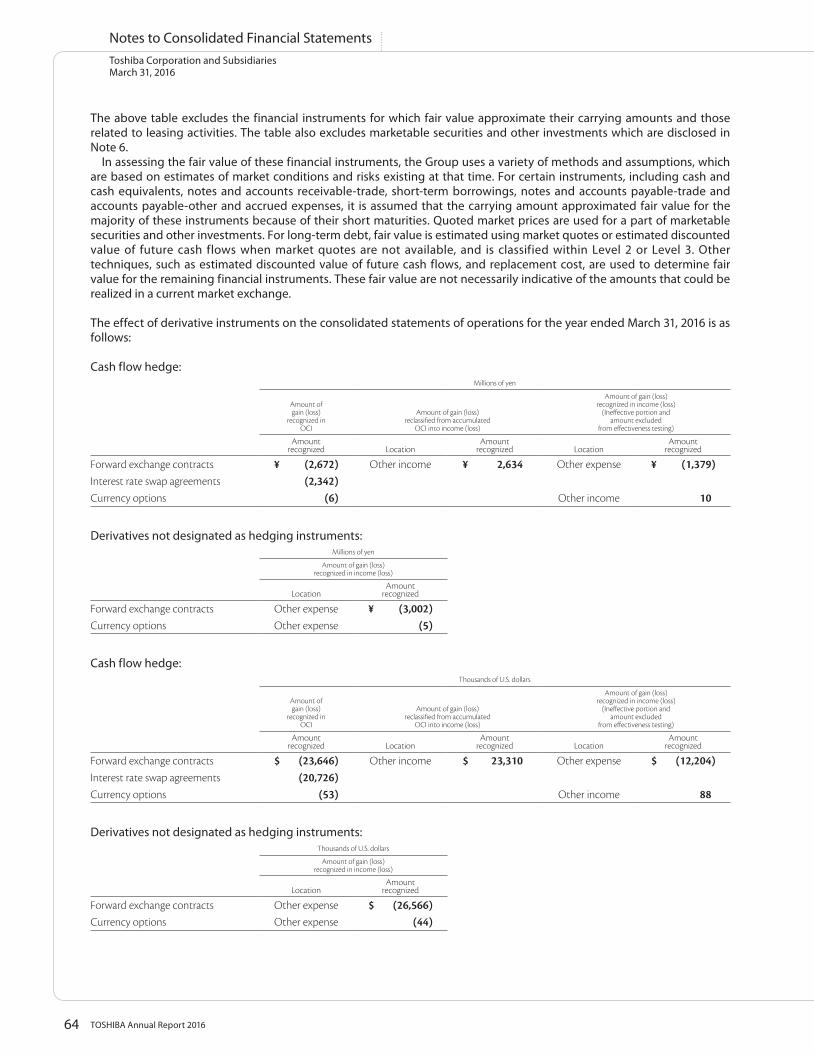
64 TOSHIBA Annual Report 2016
Toshiba Corporation and SubsidiariesMarch 31, 2016
Notes to Consolidated Financial Statements
The above table excludes the financial instruments for which fair value approximate their carrying amounts and those related to leasing activities. The table also excludes marketable securities and other investments which are disclosed in Note 6. In assessing the fair value of these financial instruments, the Group uses a variety of methods and assumptions, which are based on estimates of market conditions and risks existing at that time. For certain instruments, including cash and cash equivalents, notes and accounts receivable-trade, short-term borrowings, notes and accounts payable-trade and accounts payable-other and accrued expenses, it is assumed that the carrying amount approximated fair value for the majority of these instruments because of their short maturities. Quoted market prices are used for a part of marketable securities and other investments. For long-term debt, fair value is estimated using market quotes or estimated discounted value of future cash flows when market quotes are not available, and is classified within Level 2 or Level 3. Other techniques, such as estimated discounted value of future cash flows, and replacement cost, are used to determine fair value for the remaining financial instruments. These fair value are not necessarily indicative of the amounts that could be realized in a current market exchange.
The effect of derivative instruments on the consolidated statements of operations for the year ended March 31, 2016 is as follows:
Cash flow hedge:Millions of yen
Amount ofgain (loss)
recognized inOCI
Amount of gain (loss)reclassified from accumulated
OCI into income (loss)
Amount of gain (loss)recognized in income (loss)
(Ineffective portion andamount excluded
from effectiveness testing)
Amountrecognized Location
Amountrecognized Location
Amountrecognized
Forward exchange contracts ¥ (2,672) Other income ¥ 2,634 Other expense ¥ (1,379)Interest rate swap agreements (2,342)Currency options (6) Other income 10
Derivatives not designated as hedging instruments:Millions of yen
Amount of gain (loss)recognized in income (loss)
LocationAmount
recognized
Forward exchange contracts Other expense ¥ (3,002)Currency options Other expense (5)
Cash flow hedge:Thousands of U.S. dollars
Amount ofgain (loss)
recognized inOCI
Amount of gain (loss)reclassified from accumulated
OCI into income (loss)
Amount of gain (loss)recognized in income (loss)
(Ineffective portion andamount excluded
from effectiveness testing)
Amountrecognized Location
Amountrecognized Location
Amountrecognized
Forward exchange contracts $ (23,646) Other income $ 23,310 Other expense $ (12,204)Interest rate swap agreements (20,726)Currency options (53) Other income 88
Derivatives not designated as hedging instruments:Thousands of U.S. dollars
Amount of gain (loss)recognized in income (loss)
LocationAmount
recognized
Forward exchange contracts Other expense $ (26,566)Currency options Other expense (44)
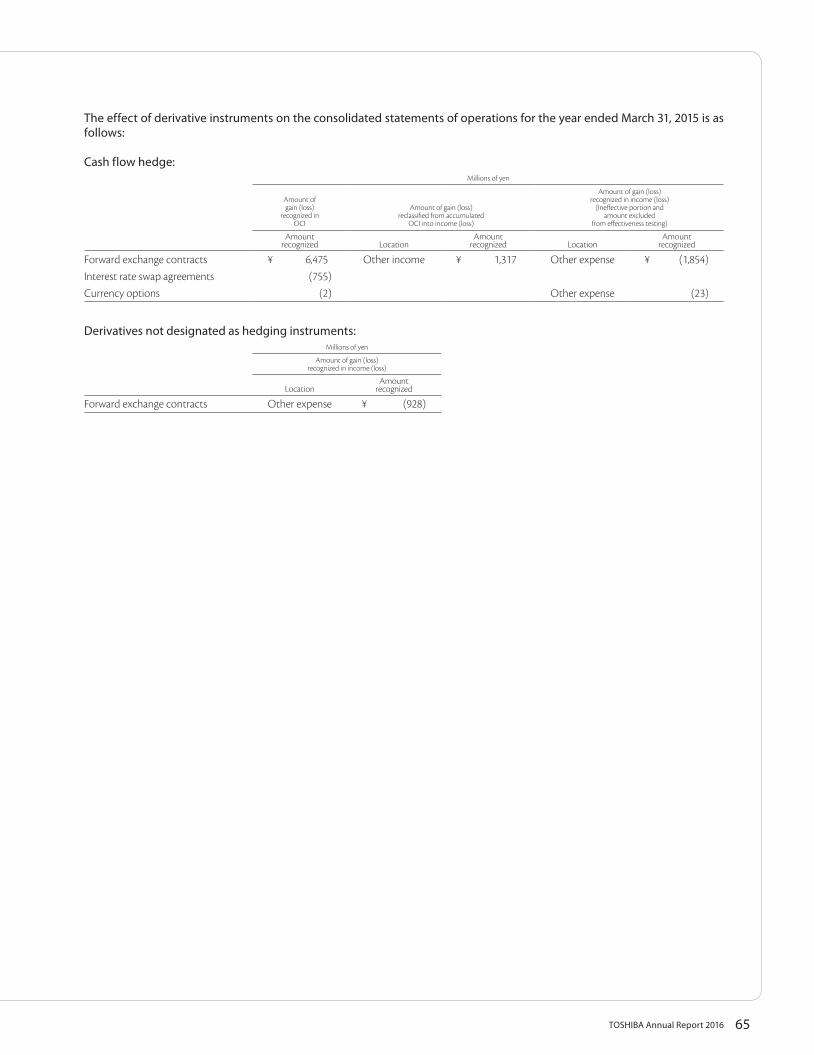
65TOSHIBA Annual Report 2016
The effect of derivative instruments on the consolidated statements of operations for the year ended March 31, 2015 is as follows:
Cash flow hedge:Millions of yen
Amount ofgain (loss)
recognized inOCI
Amount of gain (loss)reclassified from accumulated
OCI into income (loss)
Amount of gain (loss)recognized in income (loss)
(Ineffective portion andamount excluded
from effectiveness testing)
Amount recognized Location
Amount recognized Location
Amount recognized
Forward exchange contracts ¥ 6,475 Other income ¥ 1,317 Other expense ¥ (1,854)Interest rate swap agreements (755)Currency options (2) Other expense (23)
Derivatives not designated as hedging instruments:Millions of yen
Amount of gain (loss)recognized in income (loss)
LocationAmount
recognized
Forward exchange contracts Other expense ¥ (928)
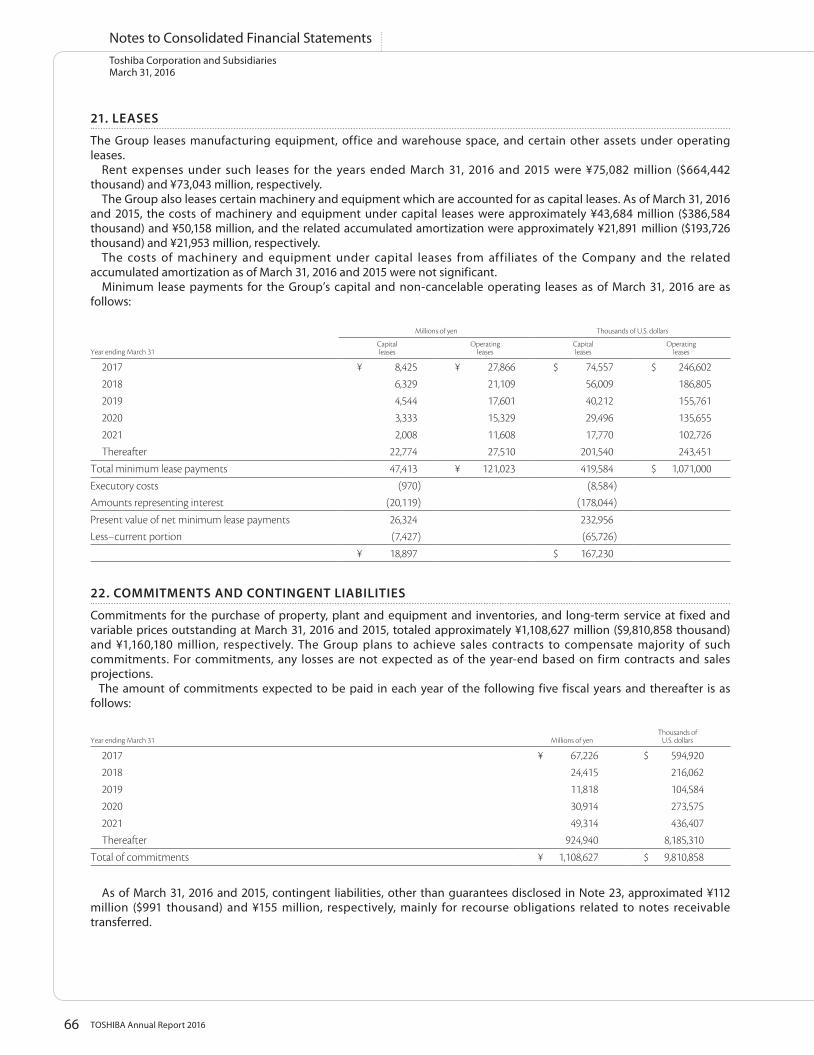
66 TOSHIBA Annual Report 2016
Toshiba Corporation and SubsidiariesMarch 31, 2016
Notes to Consolidated Financial Statements
21. LEASES
The Group leases manufacturing equipment, office and warehouse space, and certain other assets under operating leases. Rent expenses under such leases for the years ended March 31, 2016 and 2015 were ¥75,082 million ($664,442 thousand) and ¥73,043 million, respectively. The Group also leases certain machinery and equipment which are accounted for as capital leases. As of March 31, 2016 and 2015, the costs of machinery and equipment under capital leases were approximately ¥43,684 million ($386,584 thousand) and ¥50,158 million, and the related accumulated amortization were approximately ¥21,891 million ($193,726 thousand) and ¥21,953 million, respectively. The costs of machinery and equipment under capital leases from affiliates of the Company and the related accumulated amortization as of March 31, 2016 and 2015 were not significant. Minimum lease payments for the Group’s capital and non-cancelable operating leases as of March 31, 2016 are as follows:
Millions of yen Thousands of U.S. dollars
Year ending March 31Capitalleases
Operatingleases
Capitalleases
Operatingleases
2017 ¥ 8,425 ¥ 27,866 $ 74,557 $ 246,6022018 6,329 21,109 56,009 186,8052019 4,544 17,601 40,212 155,7612020 3,333 15,329 29,496 135,6552021 2,008 11,608 17,770 102,726Thereafter 22,774 27,510 201,540 243,451
Total minimum lease payments 47,413 ¥ 121,023 419,584 $ 1,071,000
Executory costs (970) (8,584)Amounts representing interest (20,119) (178,044)
Present value of net minimum lease payments 26,324 232,956Less−current portion (7,427) (65,726)
¥ 18,897 $ 167,230
22. COMMITMENTS AND CONTINGENT LIABILITIES
Commitments for the purchase of property, plant and equipment and inventories, and long-term service at fixed and variable prices outstanding at March 31, 2016 and 2015, totaled approximately ¥1,108,627 million ($9,810,858 thousand) and ¥1,160,180 million, respectively. The Group plans to achieve sales contracts to compensate majority of such commitments. For commitments, any losses are not expected as of the year-end based on firm contracts and sales projections. The amount of commitments expected to be paid in each year of the following five fiscal years and thereafter is as follows:
Year ending March 31 Millions of yenThousands of
U.S. dollars
2017 ¥ 67,226 $ 594,9202018 24,415 216,0622019 11,818 104,5842020 30,914 273,5752021 49,314 436,407Thereafter 924,940 8,185,310
Total of commitments ¥ 1,108,627 $ 9,810,858
As of March 31, 2016 and 2015, contingent liabilities, other than guarantees disclosed in Note 23, approximated ¥112 million ($991 thousand) and ¥155 million, respectively, mainly for recourse obligations related to notes receivable transferred.
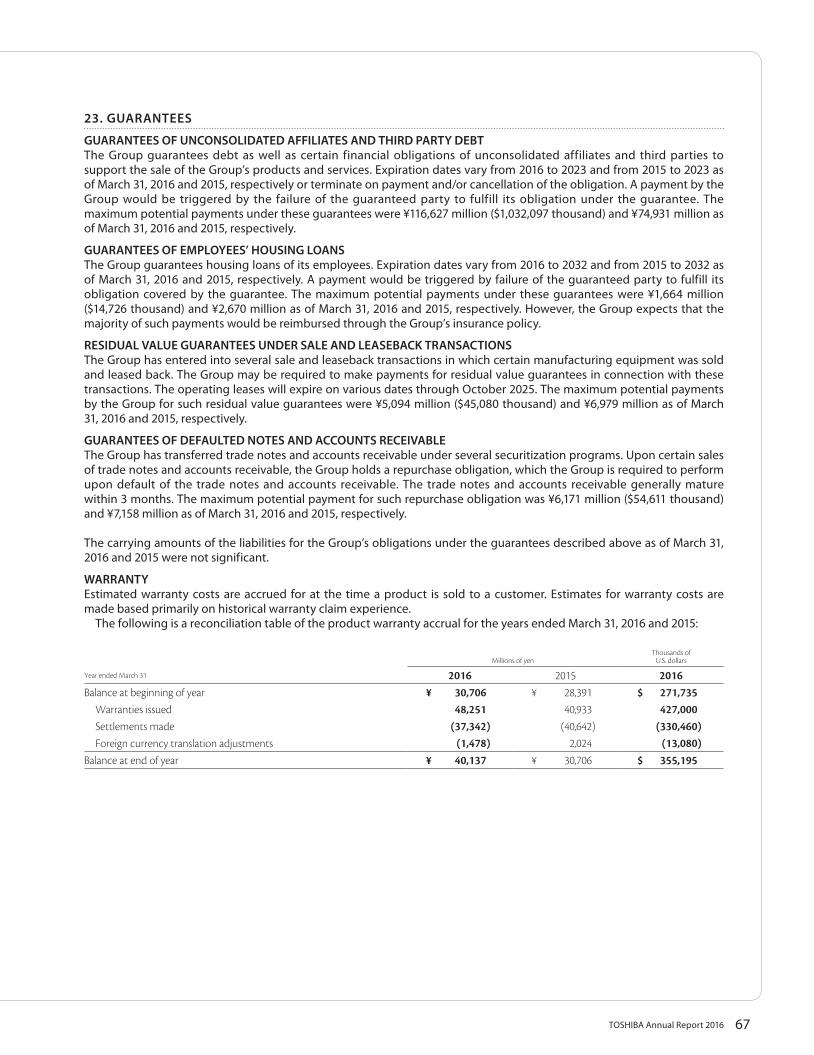
67TOSHIBA Annual Report 2016
23. GUARANTEES
GUARANTEES OF UNCONSOLIDATED AFFILIATES AND THIRD PARTY DEBTThe Group guarantees debt as well as certain financial obligations of unconsolidated affiliates and third parties to support the sale of the Group’s products and services. Expiration dates vary from 2016 to 2023 and from 2015 to 2023 as of March 31, 2016 and 2015, respectively or terminate on payment and/or cancellation of the obligation. A payment by the Group would be triggered by the failure of the guaranteed party to fulfill its obligation under the guarantee. The maximum potential payments under these guarantees were ¥116,627 million ($1,032,097 thousand) and ¥74,931 million as of March 31, 2016 and 2015, respectively.
GUARANTEES OF EMPLOYEES’ HOUSING LOANSThe Group guarantees housing loans of its employees. Expiration dates vary from 2016 to 2032 and from 2015 to 2032 as of March 31, 2016 and 2015, respectively. A payment would be triggered by failure of the guaranteed party to fulfill its obligation covered by the guarantee. The maximum potential payments under these guarantees were ¥1,664 million ($14,726 thousand) and ¥2,670 million as of March 31, 2016 and 2015, respectively. However, the Group expects that the majority of such payments would be reimbursed through the Group’s insurance policy.
RESIDUAL VALUE GUARANTEES UNDER SALE AND LEASEBACK TRANSACTIONSThe Group has entered into several sale and leaseback transactions in which certain manufacturing equipment was sold and leased back. The Group may be required to make payments for residual value guarantees in connection with these transactions. The operating leases will expire on various dates through October 2025. The maximum potential payments by the Group for such residual value guarantees were ¥5,094 million ($45,080 thousand) and ¥6,979 million as of March 31, 2016 and 2015, respectively.
GUARANTEES OF DEFAULTED NOTES AND ACCOUNTS RECEIVABLEThe Group has transferred trade notes and accounts receivable under several securitization programs. Upon certain sales of trade notes and accounts receivable, the Group holds a repurchase obligation, which the Group is required to perform upon default of the trade notes and accounts receivable. The trade notes and accounts receivable generally mature within 3 months. The maximum potential payment for such repurchase obligation was ¥6,171 million ($54,611 thousand) and ¥7,158 million as of March 31, 2016 and 2015, respectively.
The carrying amounts of the liabilities for the Group’s obligations under the guarantees described above as of March 31, 2016 and 2015 were not significant.
WARRANTYEstimated warranty costs are accrued for at the time a product is sold to a customer. Estimates for warranty costs are made based primarily on historical warranty claim experience. The following is a reconciliation table of the product warranty accrual for the years ended March 31, 2016 and 2015:
Millions of yenThousands of
U.S. dollars
Year ended March 31 2016 2015 2016Balance at beginning of year ¥ 30,706 ¥ 28,391 $ 271,735
Warranties issued 48,251 40,933 427,000Settlements made (37,342) (40,642) (330,460)Foreign currency translation adjustments (1,478) 2,024 (13,080)
Balance at end of year ¥ 40,137 ¥ 30,706 $ 355,195
68 TOSHIBA Annual Report 2016
Toshiba Corporation and SubsidiariesMarch 31, 2016
Notes to Consolidated Financial Statements
24. LEGAL PROCEEDINGS
In January 2007, the European Commission (the “Commission”) adopted a decision imposing fines on 19 companies, including the Company, for violating EU competition laws in the gas insulated switchgear market. In April 2007, the Company filed an appeal to the General Court of the European Union (the “GC”) seeking annulment of the Commission’s decision. In July 2011, the GC handed down a judgment and annulled the entire fine imposed on the Company, but upheld the Commission’s determination about alleged anti-competitive behavior. The Company appealed the GC’s judgment to the European Court of Justice (the “ECJ”) in September 2011. In June 2012, the Commission adopted a decision re-imposing fines on the Company, by recalculating the above-mentioned fines. In this decision, the Company was individually fined €56.8 million and was also fined €4.65 million jointly and severally with Mitsubishi Electric Corporation. The Company filed an appeal with the GC seeking annulment of this decision in September 2012 on the ground that the procedure and substance of the new decision are unreasonable. In January 2016, the GC upheld the Commission’s decision to re-impose fines on the Company. After a careful review of the judgment, the Company decided to file an appeal to the ECJ in March 2016 and the dispute is still ongoing. The Company accrued the reasonably estimated amount expected to be paid for the fines. In December 2013, the ECJ delivered its final ruling to support the Commission’s decision in respect of the alleged infringement of EU competition laws in the gas insulated switchgear market. In February 2011, the Ministry of Defense of Japan (the “MOD”) cancelled a contract for development and manufacture of “reconnaissance system for F-15” between the MOD and the Company. In July 2011, the Company filed a lawsuit against the MOD to Tokyo District Court seeking payment of approximately ¥9,319 million ($82,469 thousand) including payment for parts which have been already completed. In October 2012, the MOD filed a counterclaim seeking payment for the penalty of the cancellation of the contract. In March 2014, the Company expanded seeking payment of approximately ¥3,017 million ($26,699 thousand). In March 2016, the Tokyo District Court handed down a judgment of first instance, dismissing the Company’s claim. However, as the ruling was deemed unacceptable, the Company filed an appeal to the Tokyo High Court in the same month. The Company properly executed its duties pursuant to conditions of the contract. Therefore, the Company thinks that the MOD’s cancellation of the contract and the claim for penalty is unreasonable and will assert its position in the Court. In December 2012, the Commission adopted a decision imposing a fine of approximately €28 million on the Company, plus a fine of €87 million jointly and severally with Panasonic Corporation and MT Picture Display Co., Ltd. (“MTPD”) for infringement of EU Competition Law in the color picture tube (used for Televisions) market. Finding this decision unreasonable, the Company filed in February 2013 an appeal to the GC, which in September 2015 handed down a verdict, withdrawing the entirety of the fine of approximately €28 million previously imposed on the Company and reducing the joint fine imposed on Panasonic Corporation and MTPD and the Company to €83 million. Moreover, the Company filed an appeal to the ECJ in November 2015, demanding a withdrawal of the joint fine portion related to MTPD. For the fiscal year ended March 31, 2016, the Company accrued the reasonably estimated amount expected to be paid for the fines. Also in the U.S., some purchasers of cathode ray tube-related products have filed a lawsuit asking for payment of damages based on U.S. Antitrust Law. Believing that it has never breached the Law in the cathode ray tube business, the Group will take any legal actions to demonstrate its assertion. In November 2013, Japan Post Co., Ltd. (“JP”) filed a lawsuit against the Company and NEC Corporation to Tokyo High Court for violating the antitrust law concerning a bid for postal code automatic reading and sorting equipment, seeking payment of approximately ¥3,756 million ($33,239 thousand) and delayed damages. This claim is based on the cease and desist order issued by the Japan Fair Trade Commission in December 2010. The Company continued to assert its position in the Court because it considered there was no causal association between its action and damage claimed by JP and that JP’s claim was unreasonable in the Tokyo High Court. In February 2016, a settlement proposal was issued by the Tokyo High Court, which was followed by the court settlement being reached between both parties in April 2016, marking the closing of this litigation. In November 2014, there was an arbitral award against the Group to find the breach of contracts with clients for the reason of defect of electricity meter in Europe. In July 2015, new arbitration demanding damage compensation was filed. The Group intends to assert its opinion in the arbitration. In February 2015, the Company received an order from the Securities and Exchange Surveillance Commission, based on Article 26 of the Financial Instruments and Exchange Act, requiring submission of a report. The Company was then subject to inspection regarding projects that used percentage-of-completion accounting. Later, after establishing the Independent Investigation Committee and conducting the investigation, it was found that the Company continuously made inappropriate accountings and, therefore, the Company filed amendments of the past Annual Securities Reports and other reports. Holders of American Depositary Receipts (ADRs) filed a class action lawsuit against the Company in the State of California, in the U.S. in relation to the inappropriate financial reporting by the Company. While it filed a petition with the court for rejection of the lawsuit on the grounds that securities laws of the U.S. do not apply to the above-mentioned securities, among other reasons, the decision to reject the lawsuit was made as of May 20, 2016 (U.S. time).
69TOSHIBA Annual Report 2016
This decision accepted the Company’s claim. Since the plaintiffs can appeal, the decision has not been finalized. Damage compensation lawsuits were filed with several courts against the Company in Japan as well with the plaintiffs claiming to have suffered damage due to inappropriate financial reporting by the Company. The Company accrued the reasonably estimated amount expected to be paid for the damage compensation. There is a likelihood that shareholders and other entities will file a lawsuit against the Company in the future. The Group undertakes global business operations and is involved from time to time in disputes, including lawsuits and other legal proceedings and investigations by relevant authorities. Due to differences in judicial systems and the uncertainties inherent in such proceedings, the Group may be subject to a ruling requiring payment of amounts far exceeding its expectations. Any judgment or decision unfavorable to the Group could have a materially adverse effect on the Group’s business, results of operations or financial condition. However based on the information currently available to both the Group and its legal counsel, Management believes that such legal procedures, if any, would not have a material adverse effect on the financial position or the results of operations of the Group.
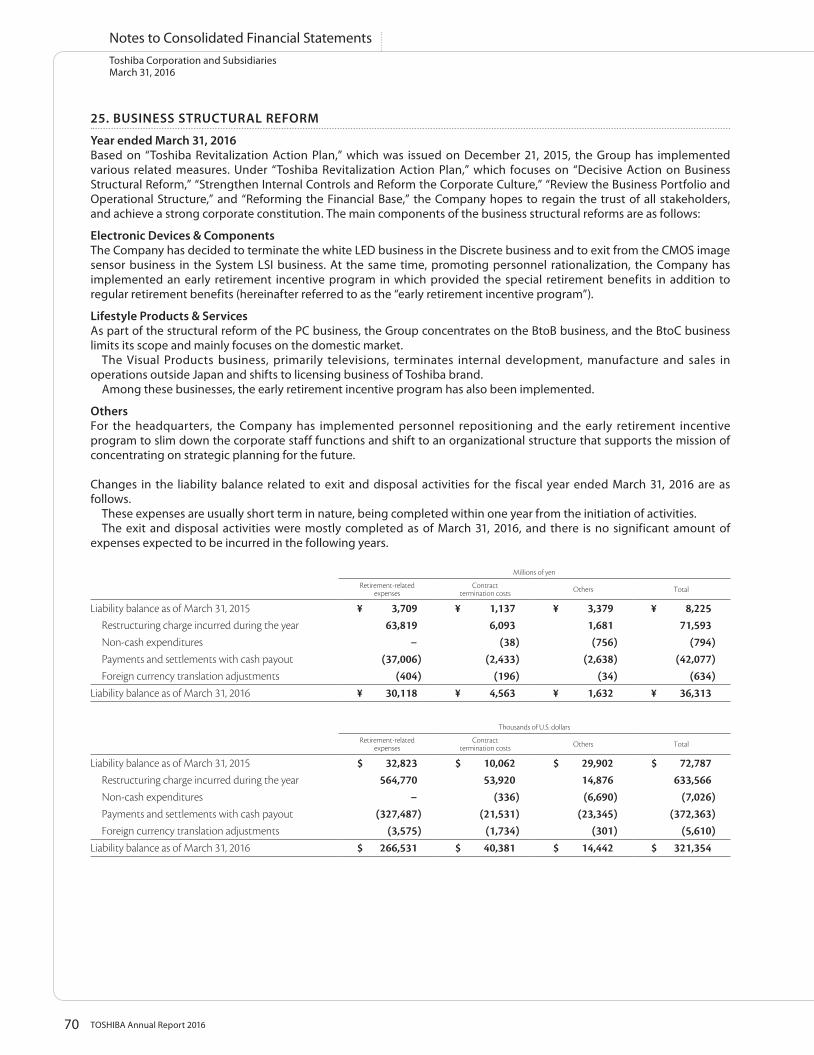
70 TOSHIBA Annual Report 2016
25. BUSINESS STRUCTURAL REFORM
Year ended March 31, 2016Based on “Toshiba Revitalization Action Plan,” which was issued on December 21, 2015, the Group has implemented various related measures. Under “Toshiba Revitalization Action Plan,” which focuses on “Decisive Action on Business Structural Reform,” “Strengthen Internal Controls and Reform the Corporate Culture,” “Review the Business Portfolio and Operational Structure,” and “Reforming the Financial Base,” the Company hopes to regain the trust of all stakeholders, and achieve a strong corporate constitution. The main components of the business structural reforms are as follows:
Electronic Devices & ComponentsThe Company has decided to terminate the white LED business in the Discrete business and to exit from the CMOS image sensor business in the System LSI business. At the same time, promoting personnel rationalization, the Company has implemented an early retirement incentive program in which provided the special retirement benefits in addition to regular retirement benefits (hereinafter referred to as the “early retirement incentive program”).
Lifestyle Products & ServicesAs part of the structural reform of the PC business, the Group concentrates on the BtoB business, and the BtoC business limits its scope and mainly focuses on the domestic market. The Visual Products business, primarily televisions, terminates internal development, manufacture and sales in operations outside Japan and shifts to licensing business of Toshiba brand. Among these businesses, the early retirement incentive program has also been implemented.
OthersFor the headquarters, the Company has implemented personnel repositioning and the early retirement incentive program to slim down the corporate staff functions and shift to an organizational structure that supports the mission of concentrating on strategic planning for the future.
Changes in the liability balance related to exit and disposal activities for the fiscal year ended March 31, 2016 are as follows. These expenses are usually short term in nature, being completed within one year from the initiation of activities. The exit and disposal activities were mostly completed as of March 31, 2016, and there is no significant amount of expenses expected to be incurred in the following years.
Millions of yen
Retirement-relatedexpenses
Contract termination costs Others Total
Liability balance as of March 31, 2015 ¥ 3,709 ¥ 1,137 ¥ 3,379 ¥ 8,225Restructuring charge incurred during the year 63,819 6,093 1,681 71,593Non-cash expenditures − (38) (756) (794)Payments and settlements with cash payout (37,006) (2,433) (2,638) (42,077)Foreign currency translation adjustments (404) (196) (34) (634)
Liability balance as of March 31, 2016 ¥ 30,118 ¥ 4,563 ¥ 1,632 ¥ 36,313
Thousands of U.S. dollars
Retirement-relatedexpenses
Contract termination costs Others Total
Liability balance as of March 31, 2015 $ 32,823 $ 10,062 $ 29,902 $ 72,787Restructuring charge incurred during the year 564,770 53,920 14,876 633,566Non-cash expenditures − (336) (6,690) (7,026)Payments and settlements with cash payout (327,487) (21,531) (23,345) (372,363)Foreign currency translation adjustments (3,575) (1,734) (301) (5,610)
Liability balance as of March 31, 2016 $ 266,531 $ 40,381 $ 14,442 $ 321,354
Toshiba Corporation and SubsidiariesMarch 31, 2016
Notes to Consolidated Financial Statements
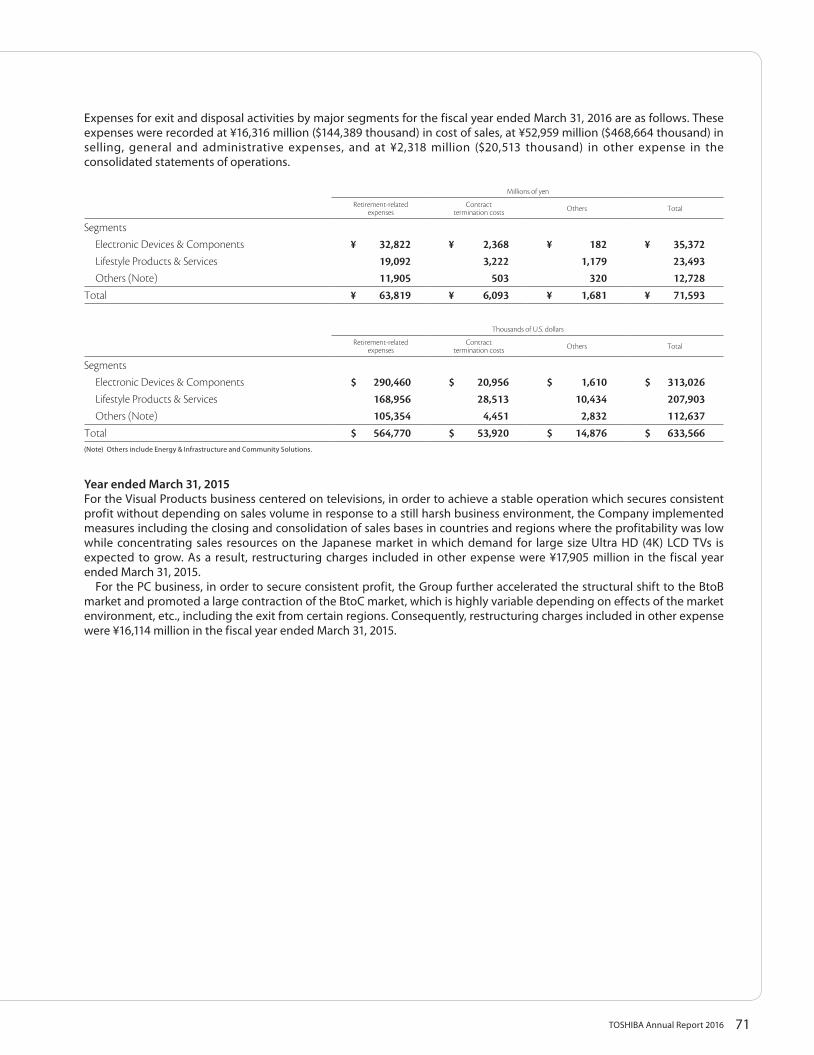
71TOSHIBA Annual Report 2016
Expenses for exit and disposal activities by major segments for the fiscal year ended March 31, 2016 are as follows. These expenses were recorded at ¥16,316 million ($144,389 thousand) in cost of sales, at ¥52,959 million ($468,664 thousand) in selling, general and administrative expenses, and at ¥2,318 million ($20,513 thousand) in other expense in the consolidated statements of operations.
Millions of yen
Retirement-relatedexpenses
Contract termination costs Others Total
SegmentsElectronic Devices & Components ¥ 32,822 ¥ 2,368 ¥ 182 ¥ 35,372Lifestyle Products & Services 19,092 3,222 1,179 23,493Others (Note) 11,905 503 320 12,728
Total ¥ 63,819 ¥ 6,093 ¥ 1,681 ¥ 71,593
Thousands of U.S. dollars
Retirement-relatedexpenses
Contract termination costs Others Total
SegmentsElectronic Devices & Components $ 290,460 $ 20,956 $ 1,610 $ 313,026Lifestyle Products & Services 168,956 28,513 10,434 207,903Others (Note) 105,354 4,451 2,832 112,637
Total $ 564,770 $ 53,920 $ 14,876 $ 633,566(Note) Others include Energy & Infrastructure and Community Solutions.
Year ended March 31, 2015For the Visual Products business centered on televisions, in order to achieve a stable operation which secures consistent profit without depending on sales volume in response to a still harsh business environment, the Company implemented measures including the closing and consolidation of sales bases in countries and regions where the profitability was low while concentrating sales resources on the Japanese market in which demand for large size Ultra HD (4K) LCD TVs is expected to grow. As a result, restructuring charges included in other expense were ¥17,905 million in the fiscal year ended March 31, 2015. For the PC business, in order to secure consistent profit, the Group further accelerated the structural shift to the BtoB market and promoted a large contraction of the BtoC market, which is highly variable depending on effects of the market environment, etc., including the exit from certain regions. Consequently, restructuring charges included in other expense were ¥16,114 million in the fiscal year ended March 31, 2015.
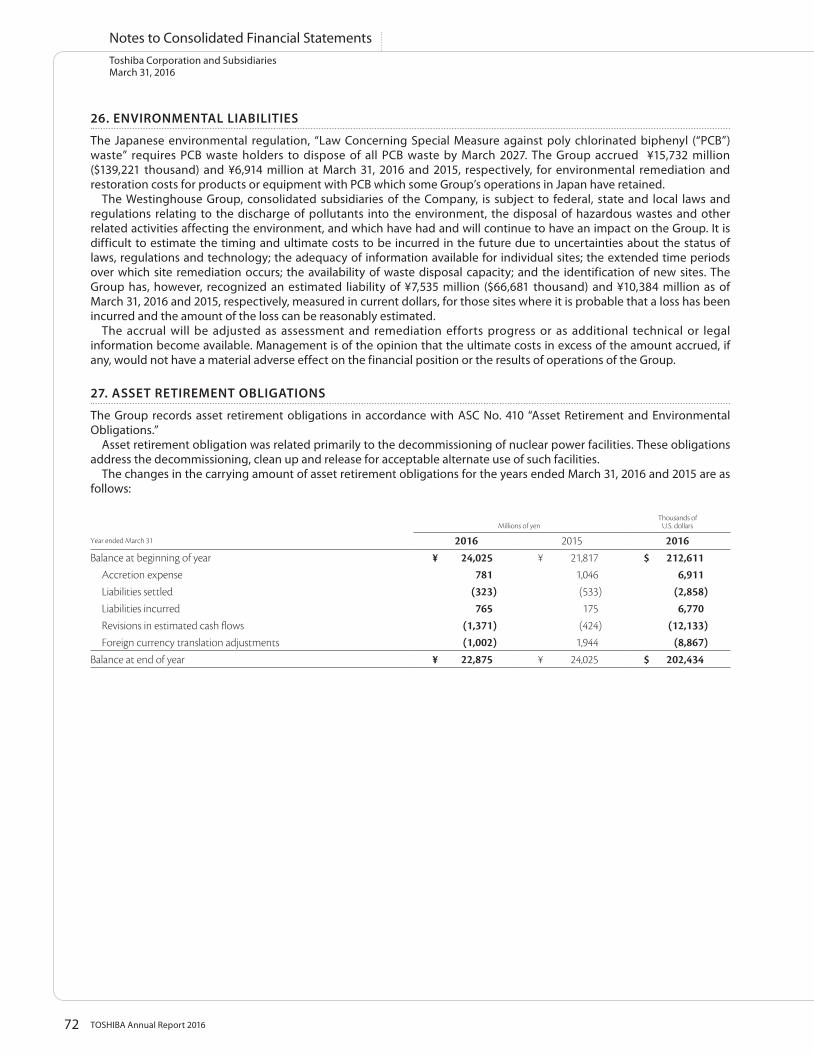
72 TOSHIBA Annual Report 2016
Toshiba Corporation and SubsidiariesMarch 31, 2016
Notes to Consolidated Financial Statements
26. ENVIRONMENTAL LIABILITIES
The Japanese environmental regulation, “Law Concerning Special Measure against poly chlorinated biphenyl (“PCB”) waste” requires PCB waste holders to dispose of all PCB waste by March 2027. The Group accrued ¥15,732 million ($139,221 thousand) and ¥6,914 million at March 31, 2016 and 2015, respectively, for environmental remediation and restoration costs for products or equipment with PCB which some Group’s operations in Japan have retained. The Westinghouse Group, consolidated subsidiaries of the Company, is subject to federal, state and local laws and regulations relating to the discharge of pollutants into the environment, the disposal of hazardous wastes and other related activities affecting the environment, and which have had and will continue to have an impact on the Group. It is difficult to estimate the timing and ultimate costs to be incurred in the future due to uncertainties about the status of laws, regulations and technology; the adequacy of information available for individual sites; the extended time periods over which site remediation occurs; the availability of waste disposal capacity; and the identification of new sites. The Group has, however, recognized an estimated liability of ¥7,535 million ($66,681 thousand) and ¥10,384 million as of March 31, 2016 and 2015, respectively, measured in current dollars, for those sites where it is probable that a loss has been incurred and the amount of the loss can be reasonably estimated. The accrual will be adjusted as assessment and remediation efforts progress or as additional technical or legal information become available. Management is of the opinion that the ultimate costs in excess of the amount accrued, if any, would not have a material adverse effect on the financial position or the results of operations of the Group.
27. ASSET RETIREMENT OBLIGATIONS
The Group records asset retirement obligations in accordance with ASC No. 410 “Asset Retirement and Environmental Obligations.” Asset retirement obligation was related primarily to the decommissioning of nuclear power facilities. These obligations address the decommissioning, clean up and release for acceptable alternate use of such facilities. The changes in the carrying amount of asset retirement obligations for the years ended March 31, 2016 and 2015 are as follows:
Millions of yenThousands of
U.S. dollars
Year ended March 31 2016 2015 2016Balance at beginning of year ¥ 24,025 ¥ 21,817 $ 212,611
Accretion expense 781 1,046 6,911Liabilities settled (323) (533) (2,858)Liabilities incurred 765 175 6,770Revisions in estimated cash flows (1,371) (424) (12,133)Foreign currency translation adjustments (1,002) 1,944 (8,867)
Balance at end of year ¥ 22,875 ¥ 24,025 $ 202,434
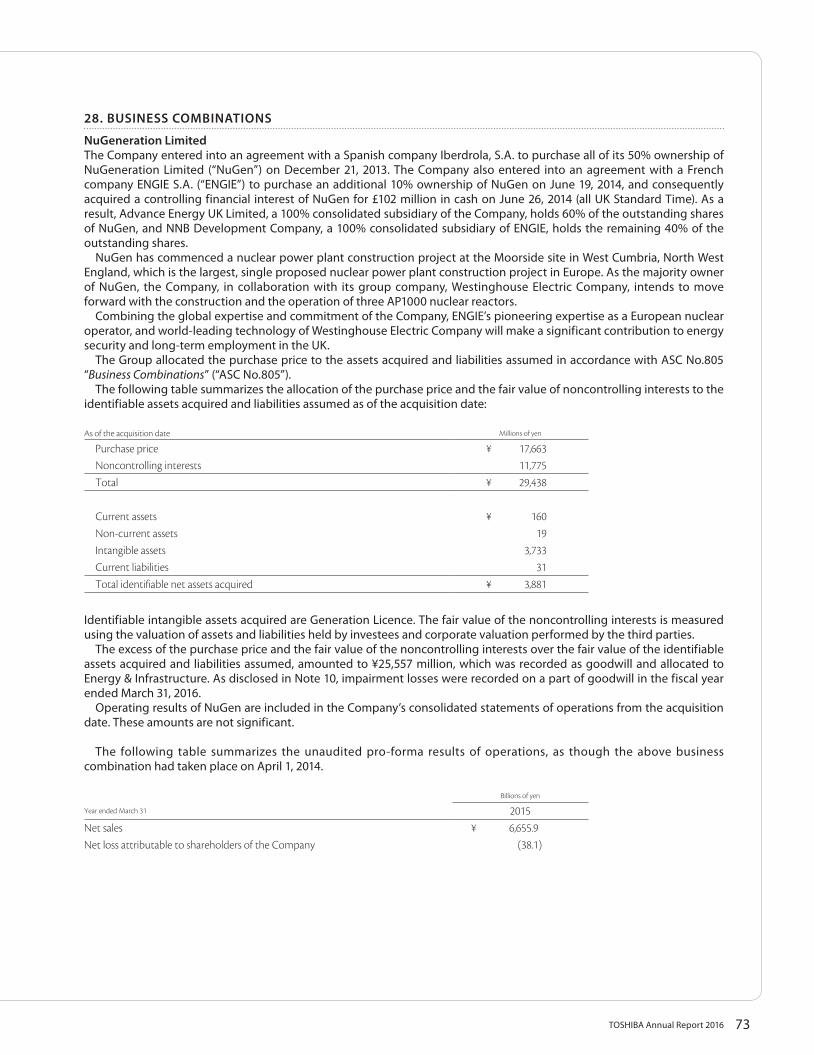
73TOSHIBA Annual Report 2016
28. BUSINESS COMBINATIONS
NuGeneration LimitedThe Company entered into an agreement with a Spanish company Iberdrola, S.A. to purchase all of its 50% ownership of NuGeneration Limited (“NuGen”) on December 21, 2013. The Company also entered into an agreement with a French company ENGIE S.A. (“ENGIE”) to purchase an additional 10% ownership of NuGen on June 19, 2014, and consequently acquired a controlling financial interest of NuGen for £102 million in cash on June 26, 2014 (all UK Standard Time). As a result, Advance Energy UK Limited, a 100% consolidated subsidiary of the Company, holds 60% of the outstanding shares of NuGen, and NNB Development Company, a 100% consolidated subsidiary of ENGIE, holds the remaining 40% of the outstanding shares. NuGen has commenced a nuclear power plant construction project at the Moorside site in West Cumbria, North West England, which is the largest, single proposed nuclear power plant construction project in Europe. As the majority owner of NuGen, the Company, in collaboration with its group company, Westinghouse Electric Company, intends to move forward with the construction and the operation of three AP1000 nuclear reactors. Combining the global expertise and commitment of the Company, ENGIE’s pioneering expertise as a European nuclear operator, and world-leading technology of Westinghouse Electric Company will make a significant contribution to energy security and long-term employment in the UK. The Group allocated the purchase price to the assets acquired and liabilities assumed in accordance with ASC No.805 “Business Combinations” (“ASC No.805”). The following table summarizes the allocation of the purchase price and the fair value of noncontrolling interests to the identifiable assets acquired and liabilities assumed as of the acquisition date:
As of the acquisition date Millions of yen
Purchase price ¥ 17,663Noncontrolling interests 11,775
Total ¥ 29,438
Current assets ¥ 160Non-current assets 19Intangible assets 3,733Current liabilities 31
Total identifiable net assets acquired ¥ 3,881
Identifiable intangible assets acquired are Generation Licence. The fair value of the noncontrolling interests is measured using the valuation of assets and liabilities held by investees and corporate valuation performed by the third parties. The excess of the purchase price and the fair value of the noncontrolling interests over the fair value of the identifiable assets acquired and liabilities assumed, amounted to ¥25,557 million, which was recorded as goodwill and allocated to Energy & Infrastructure. As disclosed in Note 10, impairment losses were recorded on a part of goodwill in the fiscal year ended March 31, 2016. Operating results of NuGen are included in the Company’s consolidated statements of operations from the acquisition date. These amounts are not significant.
The following table summarizes the unaudited pro-forma results of operations, as though the above business combination had taken place on April 1, 2014.
Billions of yen
Year ended March 31 2015Net sales ¥ 6,655.9Net loss attributable to shareholders of the Company (38.1)
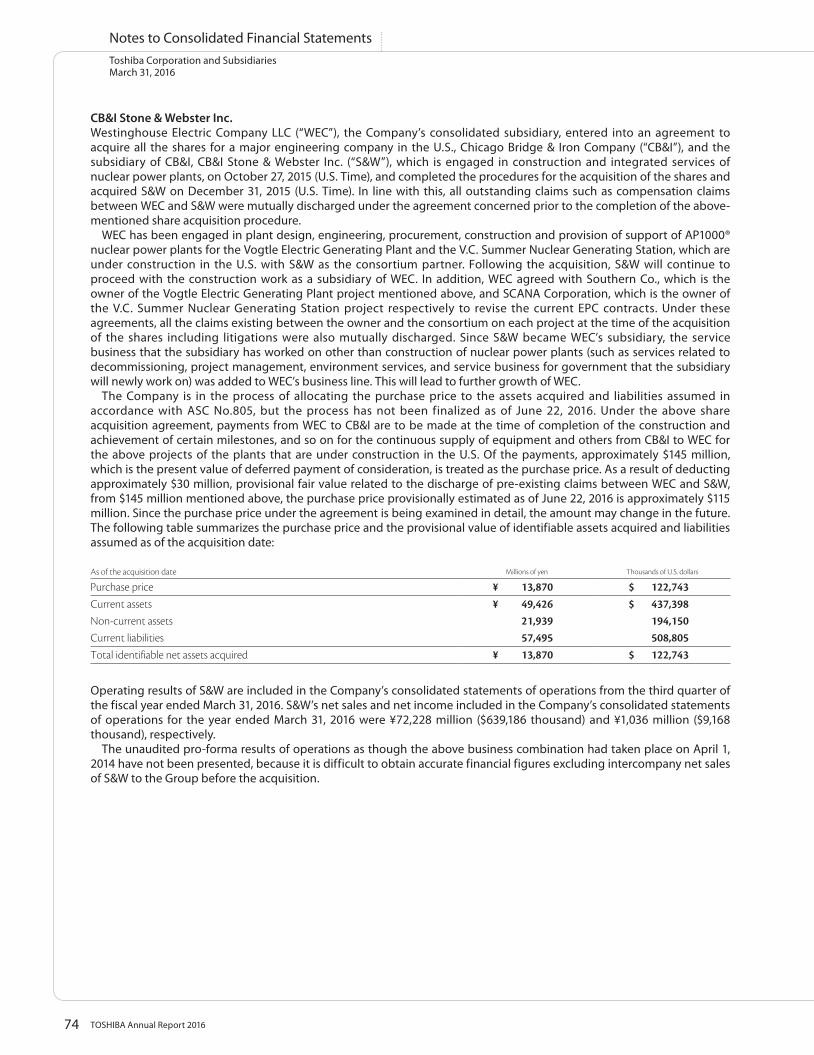
74 TOSHIBA Annual Report 2016
Toshiba Corporation and SubsidiariesMarch 31, 2016
Notes to Consolidated Financial Statements
CB&I Stone & Webster Inc.Westinghouse Electric Company LLC (“WEC”), the Company’s consolidated subsidiary, entered into an agreement to acquire all the shares for a major engineering company in the U.S., Chicago Bridge & Iron Company (“CB&I”), and the subsidiary of CB&I, CB&I Stone & Webster Inc. (“S&W”), which is engaged in construction and integrated services of nuclear power plants, on October 27, 2015 (U.S. Time), and completed the procedures for the acquisition of the shares and acquired S&W on December 31, 2015 (U.S. Time). In line with this, all outstanding claims such as compensation claims between WEC and S&W were mutually discharged under the agreement concerned prior to the completion of the above-mentioned share acquisition procedure. WEC has been engaged in plant design, engineering, procurement, construction and provision of support of AP1000® nuclear power plants for the Vogtle Electric Generating Plant and the V.C. Summer Nuclear Generating Station, which are under construction in the U.S. with S&W as the consortium partner. Following the acquisition, S&W will continue to proceed with the construction work as a subsidiary of WEC. In addition, WEC agreed with Southern Co., which is the owner of the Vogtle Electric Generating Plant project mentioned above, and SCANA Corporation, which is the owner of the V.C. Summer Nuclear Generating Station project respectively to revise the current EPC contracts. Under these agreements, all the claims existing between the owner and the consortium on each project at the time of the acquisition of the shares including litigations were also mutually discharged. Since S&W became WEC’s subsidiary, the service business that the subsidiary has worked on other than construction of nuclear power plants (such as services related to decommissioning, project management, environment services, and service business for government that the subsidiary will newly work on) was added to WEC’s business line. This will lead to further growth of WEC. The Company is in the process of allocating the purchase price to the assets acquired and liabilities assumed in accordance with ASC No.805, but the process has not been finalized as of June 22, 2016. Under the above share acquisition agreement, payments from WEC to CB&I are to be made at the time of completion of the construction and achievement of certain milestones, and so on for the continuous supply of equipment and others from CB&I to WEC for the above projects of the plants that are under construction in the U.S. Of the payments, approximately $145 million, which is the present value of deferred payment of consideration, is treated as the purchase price. As a result of deducting approximately $30 million, provisional fair value related to the discharge of pre-existing claims between WEC and S&W, from $145 million mentioned above, the purchase price provisionally estimated as of June 22, 2016 is approximately $115 million. Since the purchase price under the agreement is being examined in detail, the amount may change in the future. The following table summarizes the purchase price and the provisional value of identifiable assets acquired and liabilities assumed as of the acquisition date:
As of the acquisition date Millions of yen Thousands of U.S. dollars
Purchase price ¥ 13,870 $ 122,743Current assets ¥ 49,426 $ 437,398Non-current assets 21,939 194,150Current liabilities 57,495 508,805Total identifiable net assets acquired ¥ 13,870 $ 122,743
Operating results of S&W are included in the Company’s consolidated statements of operations from the third quarter of the fiscal year ended March 31, 2016. S&W’s net sales and net income included in the Company’s consolidated statements of operations for the year ended March 31, 2016 were ¥72,228 million ($639,186 thousand) and ¥1,036 million ($9,168 thousand), respectively. The unaudited pro-forma results of operations as though the above business combination had taken place on April 1, 2014 have not been presented, because it is difficult to obtain accurate financial figures excluding intercompany net sales of S&W to the Group before the acquisition.
75TOSHIBA Annual Report 2016
29. VARIABLE INTEREST ENTITIES
The Group recognizes entities, in accordance with ASC No.810, as VIEs that have either (a) equity investors whose voting right is limited and not having an ability to control it effectively or (b) insufficient equity to permit the entity to finance its activities without additional subordinated financial support. The Group retains variable interests through equity investments, loans and guarantees. In evaluating whether the Group is the primary beneficiary of the VIE and consolidates it, the Group assesses if the Group has both (a) the power to direct the activities of the VIE that most significantly impact the VIE’s economic performance and (b) the obligation to absorb losses or the right to receive benefits that could potentially be significant to the VIE.
Consolidated Variable Interest EntitiesVIEs, of which the Group is the primary beneficiary, are involved in Energy & Infrastructure, and most of those are entities involved in the Power and Social Infrastructure Systems. The Group has both the power to direct the activities that most significantly affect those VIEs’ economic performance and the obligation to absorb losses or the right to receive benefits from the VIEs. The Group is also required to contribute capital to each VIE on an as needed basis based on percentage of ownership interest. As of March 31, 2016 and 2015, the total assets of VIEs on the consolidated balance sheets were ¥34,718 million ($307,239 thousand) and ¥47,724 million, and the total liabilities of VIEs on the consolidated balance sheets were ¥20,239 million ($179,106 thousand) and ¥28,652 million, respectively. The assets consisted primarily of machinery and equipment. The liabilities consisted primarily of long-term debt and advance payments received. The assets are restricted for use only by those VIEs, and are not available for the Group’s general operations. In addition, the creditors or beneficial interest holders of those VIEs do not have recourse to the general credit of the Group.
Unconsolidated Variable Interest EntitiesVIEs, of which the Group is not the primary beneficiary but retains significant variable interests, are involved in Electronic Devices and Energy & Infrastructure. Unconsolidated VIEs involved in Electronic Devices are joint ventures established with SanDisk Corporation (“SanDisk”) for the purpose of strengthening the production of NAND flash memories. For those joint ventures, the Group and SanDisk share power equally. Unconsolidated VIEs involved in Energy & Infrastructure are established for the purpose of developing nuclear power plants, supplying stable electric power systems, and providing electric services and equipment to electric power operators. For the year ended March 31, 2015, the Group recorded a loss of ¥38,543 million due to a reassessment of the value of assets of the VIE involved in Energy & Infrastructure in the United States. The Group is not the primary beneficiary of those VIEs because the Group does not have the power to direct the activities that most significantly affect those VIEs’ economic performance. The Group accounts for those VIEs under the equity method. The Group entered into an agreement for natural gas liquefaction, Liquefaction Tolling Agreement (“LTA”) with a U.S. company, FLNG Liquefaction 3, LLC (“FLIQ3”), which is an entity related to Energy & Infrastructure. This agreement has come into effect from April, 2015. Under the LTA, the Group has secured a commitment for the liquefaction of 2.2 million tons of natural gas produced in the U.S. per annum over 20 years from 2019. Procurement of natural gas and transportation of liquefied natural gas are not included in this agreement. Because the Group is obliged to purchase the service for liquefying natural gas of 2.2 million tons per annum due to the LTA coming into effect and holds variable interests in FLIQ3, FLIQ3 was evaluated as a variable interest entity. The Group is not the primary beneficiary of this VIE because the Group does not have the power to direct the activities that most significantly affect the VIE’s economic performance. In addition, the Group has not incorporated operating results of FLIQ3 into the consolidated financial statements.
76 TOSHIBA Annual Report 2016
Toshiba Corporation and SubsidiariesMarch 31, 2016
Notes to Consolidated Financial Statements
As of March 31, 2016 and 2015, the total assets of those VIEs, carrying amounts of assets and liabilities that relate to the Group’s variable interests in the VIEs and the Group’s maximum exposures to losses as a result of the Group’s involvement with the VIEs are summarized as follows: With regard to FLIQ3, since the Group is a party to the LTA and it is difficult to obtain information on the variable interest entity, only maximum exposures to losses are included in the following summary table. The maximum exposures to losses are included in commitments and the unconditional purchase obligation disclosed in Note 22.
Millions of yen
March 31, 2016VIEs involved in
Electronic DevicesVIEs involved in
Energy & Infrastructure
Total assets of VIEs ¥ 402,069 ¥ 60,208Carrying amounts of assets that relate to the Group’s variable interests in the VIEs 132,328 12,717Carrying amounts of liabilities that relate to the Group’s variable interests in the VIEs 31,170 8,633Maximum exposures to losses 211,518 971,384
Millions of yen
March 31, 2015 VIEs involved inElectronic Devices
VIEs involved inEnergy & Infrastructure
Total assets of VIEs ¥ 373,899 ¥ 53,604Carrying amounts of assets that relate to the Group’s variable interests in the VIEs 130,179 1,303Carrying amounts of liabilities that relate to the Group’s variable interests in the VIEs 18,311 0Maximum exposures to losses 178,934 1,303
Thousands of U.S. dollars
March 31, 2016VIEs involved in
Electronic DevicesVIEs involved in
Energy & Infrastructure
Total assets of VIEs $ 3,558,133 $ 532,814Carrying amounts of assets that relate to the Group’s variable interests in the VIEs 1,171,044 112,540Carrying amounts of liabilities that relate to the Group’s variable interests in the VIEs 275,841 76,398Maximum exposures to losses 1,871,841 8,596,319
Carrying amounts of assets that relate to the Group’s variable interests in the VIEs consisted primarily of investment in and advances to affiliates. The Group’s maximum exposures to losses, which include primarily equity investments, loans, guarantees and commitments, generally do not have relations to the losses anticipated to be incurred from the Group’s involvement with the VIEs and are considered to exceed the anticipated losses. With regard to FLIQ3, the portion corresponding to the purchase obligation for 20 years is deemed as the maximum exposure to losses at the moment, and represents the amount of losses that may arise if the Company cannot receive any natural gas liquefied in this project over 20 years due to own convenience.
77TOSHIBA Annual Report 2016
30. SEGMENT INFORMATION
The segments reported below are the components of the Group for which discrete financial information is available and whose results are regularly reviewed by the management of the Group to make decisions about allocation on resources and assess performance. The Group evaluates the performance of its business segments based on segment operating income (loss). The Group’s segment operating income (loss) is derived by deducting the segment’s cost of sales, selling, general and administrative expenses and impairment loss on goodwill from net sales. A part of restructuring charges and legal settlement costs etc. are not included in it. The Group has 5 business segments, (1)Energy & Infrastructure, (2)Community Solutions, (3)Electronic Devices & Components, (4)Lifestyle Products & Services and (5)Others, identified in accordance with the similarities of the nature of the products, the production processes and markets, etc. Principal products that belong to each segment are as follows.
(1) Energy & Infrastructure: Energy-related equipment, Transportation systems, etc.(2) Community Solutions: Building facilities (Elevators, Light fixtures, and Air-conditioners), POS systems,
Multi-function peripherals, etc.(3) Electronic Devices & Components: Semiconductors, Hard disk drives, etc.(4) Lifestyle Products & Services: Personal computers, Visual products, etc.(5) Others: Cloud Solutions, Logistics Service, etc.
In line with the review of the business group structure due to the reorganization as of April 1, 2016, the business segments will be changed to six segments, “Energy Systems & Solutions,” “Infrastructure Systems & Solutions,” “Retail & Printing Solutions,” “Storage & Electronic Devices Solutions,” “Industrial ICT Solutions” and “Others” from the fiscal year ending March 31, 2017.
BUSINESS SEGMENTSFinancial information by segments as of and for the years ended March 31, 2016 and 2015 are as follows:
As of and for the year ended March 31, 2016 Millions of yen
Energy &Infrastructure
CommunitySolutions
Electronic Devices & Components
Lifestyle Products & Services Others Total Corporate and
Eliminations Consolidated
Net sales(1) Unaffiliated customers ¥ 1,948,208 ¥ 1,388,527 ¥ 1,564,557 ¥ 506,604 ¥ 260,792 ¥ 5,668,688 ¥ − ¥ 5,668,688(2) Intersegment 100,194 36,722 40,406 35,931 233,852 447,105 (447,105) −
Total ¥ 2,048,402 ¥ 1,425,249 ¥ 1,604,963 ¥ 542,535 ¥ 494,644 ¥ 6,115,793 ¥ (447,105) ¥ 5,668,688Segment operating income
(loss) ¥ (367,404) ¥ (78,820) ¥ (101,640) ¥ (131,910) ¥ 8,601 ¥ (671,173) ¥ (37,565) ¥ (708,738)
Identifiable assets ¥ 2,428,266 ¥ 859,776 ¥ 1,016,066 ¥ 164,587 ¥ 904,488 ¥ 5,373,183 ¥ (8,212) ¥ 5,364,971Depreciation and amortization 73,468 31,530 89,262 1,145 8,320 203,725 − 203,725Capital expenditures 91,347 28,542 150,493 4,242 4,564 279,188 − 279,188
As of and for the year ended March 31, 2015 Millions of yen
Energy &Infrastructure
CommunitySolutions
Electronic Devices & Components
Lifestyle Products & Services Others Total Corporate and
Eliminations Consolidated
Net sales(1) Unaffiliated customers ¥ 1,887,742 ¥ 1,379,723 ¥ 1,690,524 ¥ 888,017 ¥ 268,676 ¥ 6,114,682 ¥ − ¥ 6,114,682(2) Intersegment 106,169 30,963 78,228 27,733 274,591 517,684 (517,684) −
Total ¥ 1,993,911 ¥ 1,410,686 ¥ 1,768,752 ¥ 915,750 ¥ 543,267 ¥ 6,632,366 ¥ (517,684) ¥ 6,114,682Segment operating income
(loss) ¥ 19,245 ¥ 53,900 ¥ 216,642 ¥ (65,947) ¥ 5,836 ¥ 229,676 ¥ (41,267) ¥ 188,409
Identifiable assets ¥ 2,842,069 ¥ 1,063,957 ¥ 1,380,509 ¥ 409,412 ¥ 413,723 ¥ 6,109,670 ¥ (89,324) ¥ 6,020,346Depreciation and amortization 64,966 28,575 67,455 3,609 7,583 172,188 − 172,188Capital expenditures 73,701 45,433 120,030 3,685 1,082 243,931 − 243,931
78 TOSHIBA Annual Report 2016
Toshiba Corporation and SubsidiariesMarch 31, 2016
Notes to Consolidated Financial Statements
As of and for the year ended March 31, 2016 Thousands of U.S. dollars
Energy &Infrastructure
CommunitySolutions
Electronic Devices & Components
Lifestyle Products & Services Others Total Corporate and
Eliminations Consolidated
Net sales(1) Unaffiliated customers $ 17,240,779 $ 12,287,850 $ 13,845,637 $ 4,483,221 $ 2,307,894 $ 50,165,381 $ − $ 50,165,381(2) Intersegment 886,673 324,973 357,575 317,973 2,069,487 3,956,681 (3,956,681) −
Total $ 18,127,452 $ 12,612,823 $ 14,203,212 $ 4,801,194 $ 4,377,381 $ 54,122,062 $ (3,956,681) $ 50,165,381Segment operating income
(loss) $ (3,251,363) $ (697,522) $ (899,469) $ (1,167,345) $ 76,115 $ (5,939,584) $ (332,434) $ (6,272,018)
Identifiable assets $ 21,489,080 $ 7,608,637 $ 8,991,734 $ 1,456,522 $ 8,004,319 $ 47,550,292 $ (72,672) $ 47,477,620Depreciation and amortization 650,159 279,027 789,929 10,133 73,628 1,802,876 − 1,802,876Capital expenditures 808,381 252,584 1,331,796 37,540 40,389 2,470,690 − 2,470,690
Notes: 1) Transfers between segments are made at arm’s length prices. 2) Corporate assets, included in Corporate and Eliminations of Identifiable assets, are mainly marketable securities of the Company. 3) Business results in the segment information are presented on the basis of the current organizational structure. 4) The table represents the amount excluding the discontinued operation for the previous fiscal year. 5) Assets related to discontinued operations for the fiscal years ended March 31, 2016 and 2015 were ¥68,370 million ($605,044 thousand) and ¥314,432 million, respectively, and are not included in
the above assets.
A reconciliation table between the total of the segment operating income (loss) and the income (loss) from continuing operations, before income taxes and noncontrolling interests for the years ended March 31, 2016 and 2015 are as follows:
Millions of yenThousands of
U.S. dollars
Year ended March 31 2016 2015 2016The total of the segment operating income (loss) ¥ (671,173) ¥ 229,676 $ (5,939,584)
Corporate and Eliminations (37,565) (41,267) (332,434)Sub Total ¥ (708,738) ¥ 188,409 $ (6,272,018)
Interest and dividends 6,600 10,267 58,407Equity in earnings of affiliates − 20,656 −Other income 228,067 116,224 2,018,292Interest (20,753) (23,214) (183,655)Equity in losses of affiliates (23,223) − (205,513)Other expense (115,098) (155,727) (1,018,566)
Income (loss) from continuing operations, before income taxes and noncontrolling interests ¥ (633,145) ¥ 156,615 $ (5,603,053)
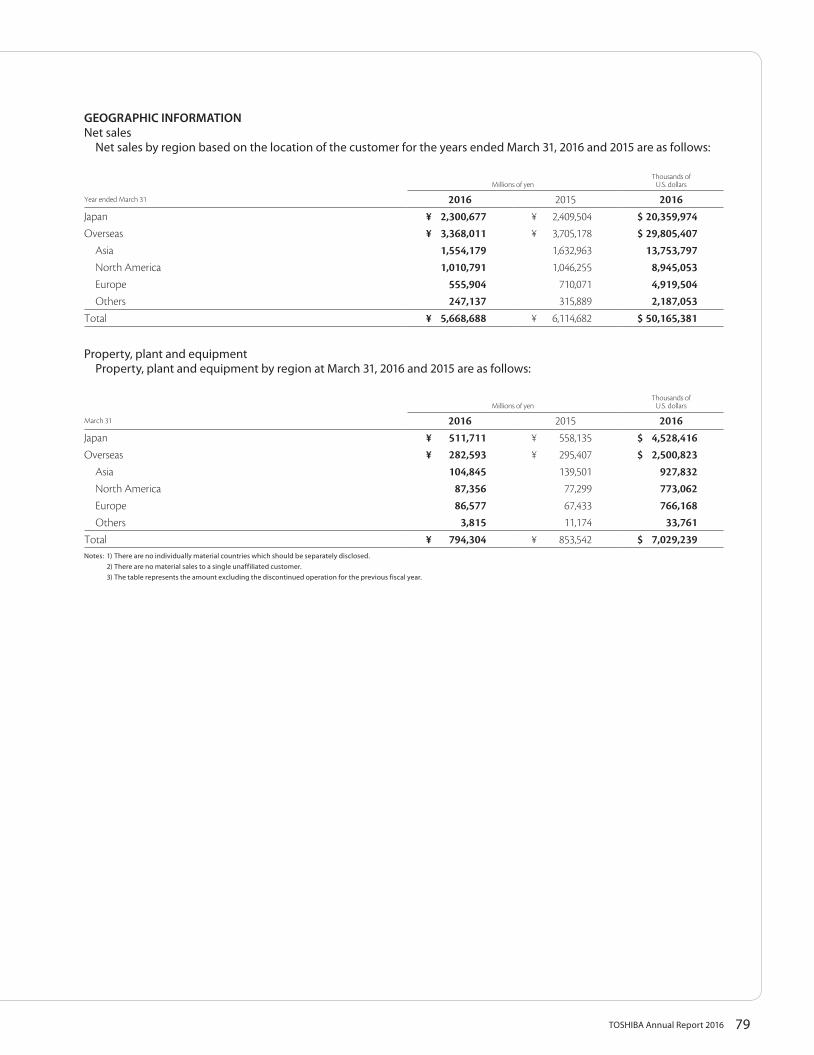
79TOSHIBA Annual Report 2016
GEOGRAPHIC INFORMATIONNet sales Net sales by region based on the location of the customer for the years ended March 31, 2016 and 2015 are as follows:
Millions of yenThousands of
U.S. dollars
Year ended March 31 2016 2015 2016Japan ¥ 2,300,677 ¥ 2,409,504 $ 20,359,974Overseas ¥ 3,368,011 ¥ 3,705,178 $ 29,805,407
Asia 1,554,179 1,632,963 13,753,797North America 1,010,791 1,046,255 8,945,053Europe 555,904 710,071 4,919,504Others 247,137 315,889 2,187,053
Total ¥ 5,668,688 ¥ 6,114,682 $ 50,165,381
Property, plant and equipment Property, plant and equipment by region at March 31, 2016 and 2015 are as follows:
Millions of yenThousands of
U.S. dollars
March 31 2016 2015 2016Japan ¥ 511,711 ¥ 558,135 $ 4,528,416Overseas ¥ 282,593 ¥ 295,407 $ 2,500,823
Asia 104,845 139,501 927,832North America 87,356 77,299 773,062Europe 86,577 67,433 766,168Others 3,815 11,174 33,761
Total ¥ 794,304 ¥ 853,542 $ 7,029,239Notes: 1) There are no individually material countries which should be separately disclosed. 2) There are no material sales to a single unaffiliated customer. 3) The table represents the amount excluding the discontinued operation for the previous fiscal year.
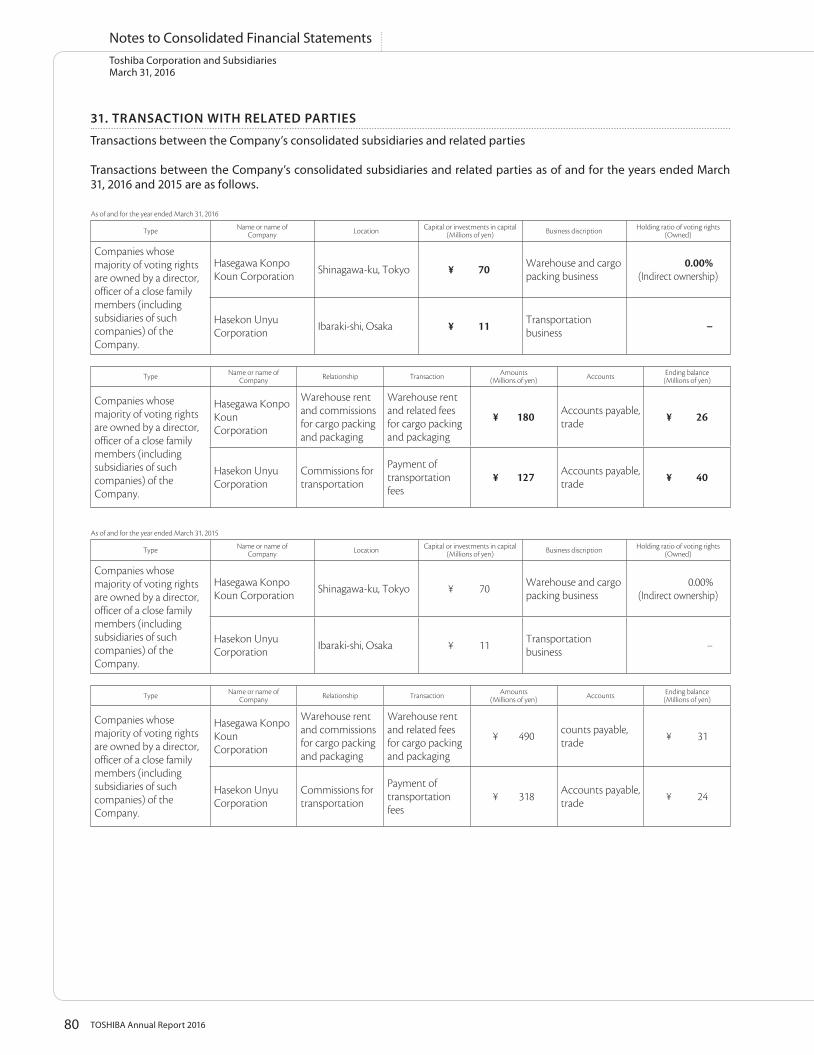
80 TOSHIBA Annual Report 2016
Toshiba Corporation and SubsidiariesMarch 31, 2016
Notes to Consolidated Financial Statements
31. TRANSACTION WITH RELATED PARTIES
Transactions between the Company’s consolidated subsidiaries and related parties
Transactions between the Company’s consolidated subsidiaries and related parties as of and for the years ended March 31, 2016 and 2015 are as follows.
As of and for the year ended March 31, 2016
Type Name or name of Company Location Capital or investments in capital
(Millions of yen) Business discription Holding ratio of voting rights (Owned)
Companies whose majority of voting rights are owned by a director, officer of a close family members (including subsidiaries of such companies) of the Company.
Hasegawa Konpo Koun Corporation Shinagawa-ku, Tokyo ¥ 70 Warehouse and cargo
packing business0.00%
(Indirect ownership)
Hasekon Unyu Corporation Ibaraki-shi, Osaka ¥ 11 Transportation
business −
Type Name or name of Company Relationship Transaction Amounts
(Millions of yen) Accounts Ending balance (Millions of yen)
Companies whose majority of voting rights are owned by a director, officer of a close family members (including subsidiaries of such companies) of the Company.
Hasegawa Konpo Koun Corporation
Warehouse rent and commissions for cargo packing and packaging
Warehouse rent and related fees for cargo packing and packaging
¥ 180 Accounts payable, trade ¥ 26
Hasekon Unyu Corporation
Commissions for transportation
Payment of transportation fees
¥ 127 Accounts payable, trade ¥ 40
As of and for the year ended March 31, 2015
Type Name or name of Company Location Capital or investments in capital
(Millions of yen) Business discription Holding ratio of voting rights (Owned)
Companies whose majority of voting rights are owned by a director, officer of a close family members (including subsidiaries of such companies) of the Company.
Hasegawa Konpo Koun Corporation Shinagawa-ku, Tokyo ¥ 70 Warehouse and cargo
packing business0.00%
(Indirect ownership)
Hasekon Unyu Corporation Ibaraki-shi, Osaka ¥ 11 Transportation
business −
Type Name or name of Company Relationship Transaction Amounts
(Millions of yen) Accounts Ending balance (Millions of yen)
Companies whose majority of voting rights are owned by a director, officer of a close family members (including subsidiaries of such companies) of the Company.
Hasegawa Konpo Koun Corporation
Warehouse rent and commissions for cargo packing and packaging
Warehouse rent and related fees for cargo packing and packaging
¥ 490 counts payable, trade ¥ 31
Hasekon Unyu Corporation
Commissions for transportation
Payment of transportation fees
¥ 318 Accounts payable, trade ¥ 24
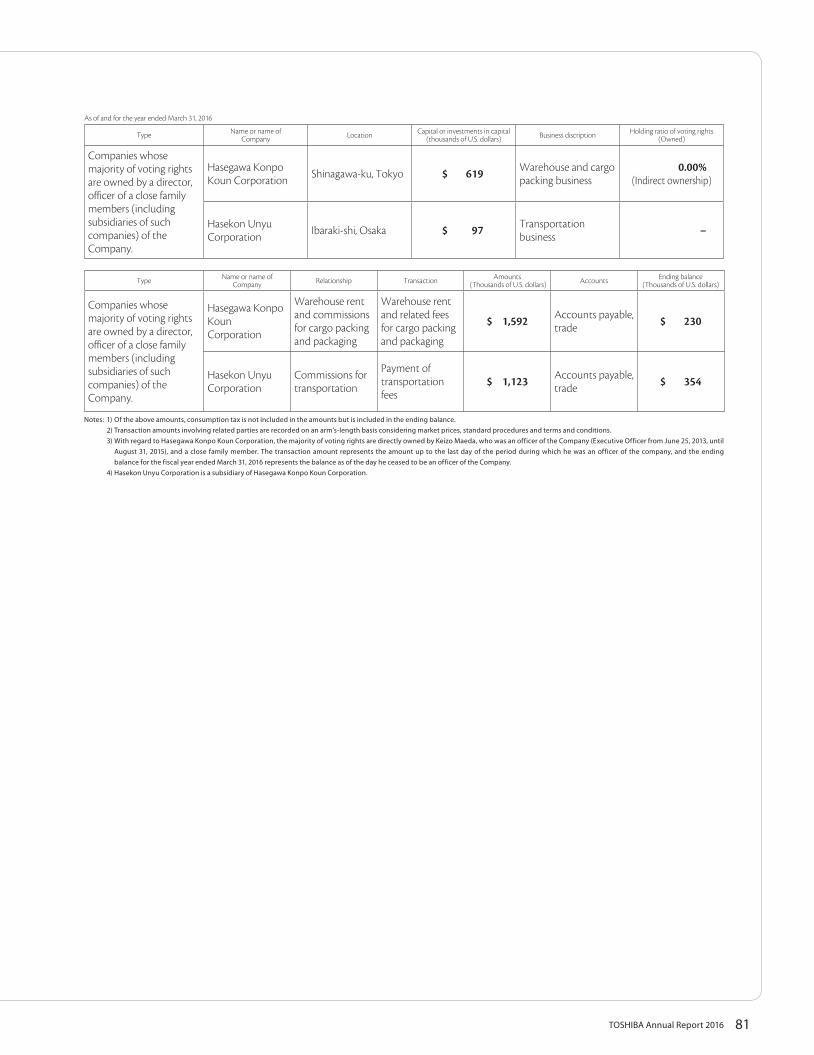
81TOSHIBA Annual Report 2016
As of and for the year ended March 31, 2016
Type Name or name of Company Location Capital or investments in capital
(thousands of U.S. dollars) Business discription Holding ratio of voting rights (Owned)
Companies whose majority of voting rights are owned by a director, officer of a close family members (including subsidiaries of such companies) of the Company.
Hasegawa Konpo Koun Corporation Shinagawa-ku, Tokyo $ 619 Warehouse and cargo
packing business0.00%
(Indirect ownership)
Hasekon Unyu Corporation Ibaraki-shi, Osaka $ 97 Transportation
business −
Type Name or name of Company Relationship Transaction Amounts
(Thousands of U.S. dollars) Accounts Ending balance (Thousands of U.S. dollars)
Companies whose majority of voting rights are owned by a director, officer of a close family members (including subsidiaries of such companies) of the Company.
Hasegawa Konpo Koun Corporation
Warehouse rent and commissions for cargo packing and packaging
Warehouse rent and related fees for cargo packing and packaging
$ 1,592 Accounts payable, trade $ 230
Hasekon Unyu Corporation
Commissions for transportation
Payment of transportation fees
$ 1,123 Accounts payable, trade $ 354
Notes: 1) Of the above amounts, consumption tax is not included in the amounts but is included in the ending balance. 2) Transaction amounts involving related parties are recorded on an arm’s-length basis considering market prices, standard procedures and terms and conditions. 3) With regard to Hasegawa Konpo Koun Corporation, the majority of voting rights are directly owned by Keizo Maeda, who was an officer of the Company (Executive Officer from June 25, 2013, until
August 31, 2015), and a close family member. The transaction amount represents the amount up to the last day of the period during which he was an officer of the company, and the ending balance for the fiscal year ended March 31, 2016 represents the balance as of the day he ceased to be an officer of the Company.
4) Hasekon Unyu Corporation is a subsidiary of Hasegawa Konpo Koun Corporation.
82 TOSHIBA Annual Report 2016
Toshiba Corporation and SubsidiariesMarch 31, 2016
Notes to Consolidated Financial Statements
32. SUBSEQUENT EVENT
Reduction in common stock and transfer of other capital surplus to accumulated deficitThe Company resolved at its Board of Directors’ meeting held on May 23, 2016, to submit a proposal for ¥239,901 million ($2,123,018 thousand) of reduction in common stock pursuant to Article 447, Paragraph 1 of the Corporation Law of Japan to the Ordinary General Meeting of Shareholders for the 177th fiscal period held on June 22, 2016, and to transfer ¥462,049 million ($4,088,929 thousand) of other capital surplus (including the amount of the increase due to the reduction in common stock) to accumulated deficit pursuant to Article 452 of the Corporation Law of Japan. The reduction in common stock was approved at the above Ordinary General Meeting of Shareholders.
83TOSHIBA Annual Report 2016
Ernst & Young ShinNihon LLCHibiya Kokusai Bldg.2-2-3 Uchisaiwai-choChiyoda-ku,Tokyo,Japan 100-0011
TEL : +813 3503 1100FAX : +813 3503 1197
Independent Auditor’s Report
The Board of Directors of Toshiba Corporation
We have audited the accompanying consolidated financial statements of Toshiba Corporation (the “Company”) and its consolidated subsidiaries, which comprise the consolidated balance sheets as at March 31, 2016 and 2015, and the consolidated statements of operations, comprehensive income, equity, and cash flows for the years then ended and a summary of significant accounting policies and other explanatory information, all expressed in Japanese yen.
Management’s Responsibility for the Consolidated Financial StatementsManagement is responsible for the preparation and fair presentation of these consolidated financial statements in accordance with accounting principles generally accepted in the United States of America, and for designing and operating such internal control as management determines is necessary to enable the preparation and fair presentation of the consolidated financial statements that are free from material misstatement, whether due to fraud or error.
Auditor’s ResponsibilityOur responsibility is to express an opinion on these consolidated financial statements based on our audits. We conducted our audits in accordance with auditing standards generally accepted in Japan. Those standards require that we plan and perform the audit to obtain reasonable assurance about whether the consolidated financial statements are free from material misstatement.
An audit involves performing procedures to obtain audit evidence about the amounts and disclosures in the consolidated financial statements. The procedures selected depend on the auditor’s judgment, including the assessment of the risks of material misstatement of the consolidated financial statements, whether due to fraud or error. The purpose of an audit of the consolidated financial statements is not to express an opinion on the effectiveness of the entity’s internal control, but in making these risk assessments the auditor considers internal controls relevant to the entity’s preparation and fair presentation of the consolidated financial statements in order to design audit procedures that are appropriate in the circumstances. An audit also includes evaluating the appropriateness of accounting policies used and the reasonableness of accounting estimates made by management, as well as evaluating the overall presentation of the consolidated financial statements.
We believe that the audit evidence we have obtained is sufficient and appropriate to provide a basis for our audit opinion.
OpinionIn our opinion, the consolidated financial statements referred to above present fairly, in all material respects, the consolidated financial position of Toshiba Corporation and its consolidated subsidiaries as at March 31, 2016 and 2015, and their consolidated financial performance and cash flows for the years then ended in conformity with accounting principles generally accepted in the United States of America.
Emphasis of MatterWe draw attention to Note 32 to the consolidated financial statements, which describes that the Company resolved at its Board of Directors’ meeting held on May 23, 2016, to submit a proposal for reduction in common stock to the Ordinary General Meeting of Shareholders for the 177th fiscal period held on June 22, 2016, which was subsequently approved at the Ordinary General Meeting of Shareholders, and to transfer other capital surplus to accumulated deficit. Our opinion is not qualified in respect of this matter.
Convenience TranslationWe have reviewed the translation of these consolidated financial statements into U.S. dollars, presented for the convenience of readers, and, in our opinion, the accompanying consolidated financial statements have been properly translated on the basis described in Note 3.
June 22, 2016
The information contained in this facsimile message may be privileged and confidential and is intended only for the use of the individual entity named above. If the reader of this message is not the intended recipient, or an employee or agent responsible for delivering this message to the intended recipient, you are hereby notified that any dissemination, distribution, or copying of this communication is strictly prohibited. If you have received this communication in error, please notify us immediately by telephone and return the original message to the above address via the postal service. Thank you. Ernst & Young
2016Committed to People, Committed to the Future.
Year ended March 31, 2016 Financial Review Annual Report
Paper Printing
Paper certi�ed by Forest Stewardship Council (FSC) is used, which is made from wood from FSC-certi�ed forests.
We believe that it is important to make proactive use of domestic wood products and to grow forests, and we support the forestry Agency’s e�orts to promote “tree trainer activies”. Domestic timber provided the raw material for the paper on which this report is printed, and its use contribused to increased absorption of CO2 by native forests.
Waterless PrintingWaterless printing, a printing process that eliminates the use of water, is adopted, taking advantage of the characteristics of printing plates made of ink-shedding material.
Non-VOC Ink100% vegetable ink containing no volatile organic compounds (VOCs) is used.
Toshiba Group supports forest thinning project in Misawa City, Aomori prefecture, aiming to preserve the nature for the next generation.
Contacts:
Tree use cycle mark
The production and printing of this report re�ect the following considerations :
Public Relations & Investor Relations DivisionTel: +81-3-3457-2096 Fax: +81-3-5444-9202
Inquiry page on Investor RelationsURL http://www.toshiba.co.jp/about/ir/en/contact.htm
1-1, Shibaura 1-chome, Minato-ku, Tokyo,105-8001, Japan
Use of FSC-certi�ed Paper A-(2)-060001Use of Forest Thinning Support Paper