Embed Size (px)
Citation preview

UEFAROUTE DE GENÈVE 46CH-1260 NYON 2 SWITZERLANDTELEPHONE: +41 848 00 27 27TELEFAX: +41 848 01 27 27
Financial Report2016/17
42nd Ordinary UEFA CongressBratislava, 26 February 2018
Setting: LargeNetwork, Geneva. Printing: Artgraphic Cavin, Grandson, Switzerland

Facts and figures
Introduction Financial strategy Income statement Distribution Solidarity The flow of solidarity payments Balance sheet Own resources Result by competition and activity Source of income Use of income Governing expenses Four-year cycle European Qualifiers Club competitions UEFA Champions League UEFA Europa League
Annex
Financial statements as at 30 June 2017 Reports of the statutory auditors
TABLE OF CONTENTS
I.
14689
101214161718202224263034
II.
Co
ver :
Get
ty Im
ages
1FINANCIAL REPORT | 2016/17
UEFA is pleased to present its Financial Report 2016/17 – a football season which delivered its customary share of memorable moments and exciting events, on and off the pitch, in Europe’s club and national team competitions and throughout UEFA’s diverse range of activities accomplished in the service of European football.
The structure of the report follows its usual path, and it was not felt necessary to significantly change the way that the financial figures are published. Consequently, the report is once again divided into a straightforward descriptive part, and an annex containing detailed financial statements and the auditor’s reports.
EURO 2016 revenue and expenses were recognised in the year the tournament took place, despite the fact that the semi-finals and finals were played in the following financial year. Consequently, some revenue streams ran over into 2016/17. In addition, UEFA had been prudent in assessing latent risks and estimating costs, which also had a positive impact on the final result once the project accounts were closed, contributing to additional tournament earnings of €6.1 million.
Revenue from EURO 2016 provides the bulk of the funding for the HatTrick IV solidarity programme, which comprises €611 million in total. HatTrick payments are now being made to UEFA’s 55 member associations for the four years of the fourth cycle of the programme, which started in 2016/17. During the financial year under review, HatTrick investment payments totalled €91.2 million, while annual HatTrick incentive payments amounted to €102.6 million.
Staying on the national team front, the concept of the Week of Football for the European Qualifiers, featuring matches across six days from Thursday to Tuesday every match week, continued for the European Qualifiers for the 2018 FIFA World Cup in Russia. This constitutes the second part of the first cycle (2014–18) of centralised broadcasting and commercial rights for all qualifying matches and some friendlies. Total revenue of just over €1 billion is expected to accrue from both sets of qualifiers, which will be redistributed to our member associations.
Also worthy of mention is the European Under-21 Championship final tournament in Poland, which saw an expanded field of 12 teams compared with the eight team finals that had been in place since 2000. This increase in participants, as well as an interesting line-up of teams, brought improved revenue of €11.6 million – around 20% up on the 2015 tournament in the Czech Republic.
Investment to bolster European football’s well-being remains a cornerstone of UEFA’s financial vision. Besides organising football competitions, UEFA has various additional statutory duties, and invested €36.7 million in football projects such as development tournaments and education. Indeed, UEFA’s portfolio of solidarity and development programmes provides constant reminders that the organisation’s prime mission is to put football first, and to defend and promote the game with a view to achieving the best possible marriage with business practices. Investment and funding in key areas and activities – especially for the benefit of our member associations – is therefore essential for UEFA to be able to fulfil its mission and adhere to its values.
The operating result before solidarity payments comes to €277.5 million (excluding EURO 2016 and HatTrick transactions) and represents a 3% increase on 2015/16. Despite the fact that the downward trend in the financial markets stabilised somewhat towards the end of the financial year, the situation remains very challenging, and means that the struggle for positive returns is continuing. UEFA is compelled to invest high liquidity in the short term, to cater for the major outflows in distribution and solidarity payments to clubs and associations. The high amounts involved make it increasingly difficult to avoid negative interest rates while at the same time preserving a conservative investment policy and working with reliable counterparties.
Nevertheless, thanks to the higher total revenue, and despite disappointments as far as the asset management performance is concerned, the audited financial statements for 2016/17 show a satisfying net result of €-6.7 million.
In the meantime, UEFA is continuing to reinforce its support for youth and amateur football, as well as women’s competitions. European football’s governing body has also stepped up its activities in areas such as the fight to eliminate match-fixing, the financial fair play to safeguard European club football’s stability, and the promotion of diversity and inclusion within the game.
As a consequence, it is evident that UEFA’s financial performance must remain solid, focussed and well-planned, as it is a crucial factor in generating resources that help create important overall benefits for football.
INTRODUCTION
2
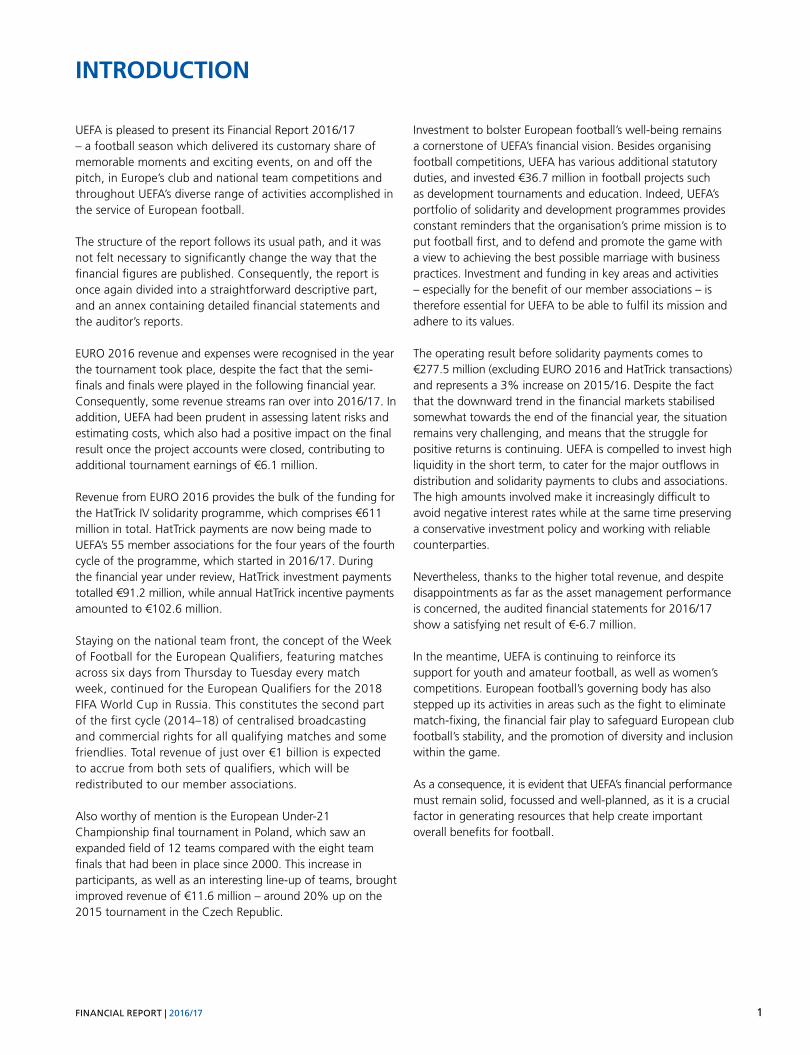
Money distributed €m
Revenue €m
solidaritypayments
268.3
1 163.7
participatingteams
2 119.4
2 269.8
UCLwinners
81.1
80.1
Real Madrid CF (16/17) Real Madrid CF (15/16)
UELwinners
44.5
13.8
Manchester United FC (16/17) Sevilla FC (15/16)
Under-21winners
4.0
2.1
Germany (2017) Sweden (2015)
Other information
Number ofemployees
500 946 (as at 30 June andincl. EURO 2016 SAS)
Number ofmatches played
2 0732 089
in 2016/17in 2015/16
in 2016/17in 2015/16
2 835.9
4 579.8
2 099.4
1 730.4
1 698.9
2 795.7
2016/17
2015/16
2014/15
2013/14
2012/13
2011/12

3FINANCIAL REPORT | 2016/17
Revenue by nature and competition €m
Revenue by competition and other income
Revenue and income by nature
• National team competitions
308.0 10.9%
• Club competitions
2 487.4 88.2%
• Other competitions,revenue andasset management
25.5 0.9%
Broadcasting rights
2 322.2
82.3%
Commercial rights
458.1
16.2%
Tickets and hospitality
37.8
1.3%
Other revenue and asset management
2.8
0.2%
4
Year after year, our financial report reiterates UEFA’s core principles – and that repetition is not accidental. To omit to do so would be to suggest that those core principles have been forgotten. To repeat them is an invitation to reflect on whether those principles continue to be respected and whether UEFA has implemented them successfully.
UEFA is committed to encouraging its member associations to work together in putting football first and to constantly pursue the betterment of football, right from the grassroots levels to the role-model pinnacles of the professional game. UEFA is committed to strengthening solidarity, to protecting the future of the game and to maximising UEFA’s finances in a way that reflects and highlights the concept of solidarity.
UEFA is committed to good governance and to the promotion of good governance throughout its member associations. Leadership in this sphere implies responsibilities and duties. UEFA’s finances must therefore aim to demonstrate that good governance begins at home.
UEFA is committed to maintaining and enhancing the balance between national team and club football as complementary elements within the game. The distribution of financial resources therefore needs to achieve an equitable balance between the two.
UEFA is committed to safeguarding sporting integrity and preserving the true spirit of the game while running its competitions in an efficient way and optimising revenues from commercial contracts to benefit and develop European football. The financial results offer an indication as to whether sporting and business criteria have been successfully married and whether those objectives have been achieved.
UEFA is committed to promoting fair play on and off the pitch. Financial fair play is high on the agenda and if UEFA is to lead European football in the right direction and provide top-class administrative support, its economic status must be an illustration of financial fair play in terms of responsibility, fairness and transparency. These principles need to be attached to all existing and future projects.
This financial report aims to provide the reader with transparent indications about where income has come from and how it is being used for the benefit of the game.
FINANCIAL STRATEGY

5FINANCIAL REPORT | 2016/17
Get
ty Im
ages

6
Clearly, the income statement for 2016/17 cannot be compared with that of the previous year because of the big impact of EURO 2016 on last year’s financial statements, with the whole tournament revenue and expenses fully recognised in one financial year. That is why a third column has been added to the table on the opposite page with the EURO 2016 figures removed. The following comments on the income statements refer to the figures in that column for comparison purposes.
UEFA has experienced a growth in revenue of over 6% compared with the previous year, thanks mainly to higher broadcasting rights. Ticketing and hospitality revenue also increased due to the higher capacities and sold-out stadiums for the UEFA Champions League and UEFA Europa League finals in Cardiff and Stockholm. ‘Other revenue’ is, however, down on 2015/16. This decrease is due to the fact that the contribution from the FIFA Forward programme was postponed and higher revenue will therefore be recognised in 2017/18. The two main UEFA club competitions and the European Qualifiers contributed to the higher revenue, with a higher number of matches played in the first year of the European Qualifiers for the FIFA World Cup in Russia than during the previous season, which was the last season of the European Qualifiers for EURO 2016. European Qualifiers’ revenue is recognised on the basis of the number of matches in the financial year in question.
The distribution to teams participating in UEFA competitions is by far the biggest cost driver, passing the €2 billion mark even in a year without a EURO and amounting to €2.12 billion in the year under review (2015/16: €1.97bn) or 75% of total revenue. A detailed breakdown by competition can be found in the following section of this report.
‘Event expenses’ are another major item, standing at €177.1 million. Despite higher revenue, this is actually lower than the previous year due to the fact that investments in the club competitions are usually made in the first year of a new cycle. ‘Employee salaries and benefits’ are up 4% because the Swiss franc strengthened slightly further in the year under review. The increase is also linked to the decision taken to retain a higher number of EURO 2016 fixed-term staff in order to benefit from their experience for EURO 2020 or for new competitions such as the UEFA Nations League.
The operating result before solidarity payments comes to €277.5 million and is 3% up on 2015/16.
Higher club competition revenue led to higher solidarity payments both for non-participating clubs as well as for clubs eliminated in the qualifying phase. Total solidarity stands at €268.3 million and is up roughly 2% in 2016/17.
The situation in the financial markets and the interest environment stabilised somewhat in 2016/17, although interest rates remained very low, making it very difficult once more for UEFA to manage short-term investments. So far, we have succeeded in avoiding negative interest rates despite our substantial financial assets, but the overall result is again disappointing. Nevertheless, total gross financial income for 2016/17 amounted to €7.9 million and is up on the previous year (2015/16: €5.6m), because of income from matured long-term structured products.
UEFA’s main operating currencies are the Swiss franc, US dollar and the British pound, with only the Swiss franc remaining strong. The two other currencies experienced devaluation against the euro during the reporting period, leading to unrealised currency losses of €8.7 million. Adding in these unrealised currency effects, the overall net result for ‘Financial items and taxes’ again shows a loss.
In conclusion, thanks to higher total revenue and despite the disappointing asset management performance, the audited financial statements for 2016/17 show a net result of €-6.7 million (2015/16: €3.8m), which is still a significant improvement on the budgeted figure of €-16 million approved by the Extraordinary UEFA Congress in Zurich in February 2016.
INCOME STATEMENT

7FINANCIAL REPORT | 2016/17
Consolidated income statement | table
€m 2016/17 *2015/16 2015/16
Broadcasting rights 2 322.2 2 161.0 3 185.2
Commercial rights 458.1 445.0 928.3
Tickets and hospitality 37.8 31.7 429.0
Other revenue 17.8 26.1 37.3
Total revenue 2 835.9 2 663.8 4 579.8
Distribution to participating teams -2 119.4 -1 968.7 -2 269.8
Contributions to associations -32.8 -28.3 -69.5
Event expenses -177.1 -182.7 -537.7
Referees and match officers -32.4 -37.0 -40.1
Information and communications technology -54.2 -43.2 -107.1
Employee salaries and benefits -83.2 -79.8 -158.5
Depreciation and amortisation -9.3 -7.8 -9.9
Other expenses -50.0 -45.6 -117.6
Total expenses -2 558.4 -2 393.1 -3 310.2
Operating result before solidarity payments 277.5 270.7 1 269.6
Solidarity payments -268.3 -263.2 -1 163.7
Financial items and taxes -15.9 -3.7 -3.8
Net result for the period -6.7 3.8 102.1
2013/14
2009/10
2010/11
2011/12
2012/13
2016/17
2014/15
2015/16
30/06/2014
30/06/2011
30/06/2012
30/06/2013
30/06/2015
30/06/2016
UCL/USC
UEL
0
500
1 000
1 500
2 000
2012/13
2009/10
2010/11
2011/12
2015/16
2013/14
2014/15
2016/17
30/06/2017
0
500
1 000
1 500
2 000
2011/12
2012/13
2013/14
2014/15
2015/16
2016/17
2015-18
2000-03
2003-06
2006-09
2009-12
2012-15
1 852.5
1 449.4
2 006.5
3 214.8
4 053.3
6 027.8
351.1
373.9
599.8
817.6
950.9
1 287.1
PAGE 8
2012/13
2009/10
2010/11
2011/12
2015/16
2013/14
2014/15
2016/17
2012/13
2007/08
2008/09
2009/10
2010/11
2011/12
2015/16
2013/14
2014/15
Page 7
Page 26b
Page 9
Page 13
Page 15
Page 25
Page 26a
Page 21
Page 28
2012/13
2007/08
2008/09
2009/10
2010/11
2011/12
821.9
820.3
1 110.8
1 153.1
1 165.8
1 424.3
53.1
53.7
196.5
210.1
219.6
2015/16
2013/14
2014/15
1 444.0
1 496.5
2 060.9
247.5
258.6
355.9
2016/17 2 120.5 366.9
242.0
Page 26
Champions League/Super Cup Europa League Total
€m
Club competitions and other revenue EURO and European Qualifiers Total
Broadcasting Commercial Total
Solidarity Total
%As % of average total revenue
Broadcasting Commercial Total
Distribution Total
Assets
Non-current
Current
Liabilities Reserves
Revenue Costs Solidarity ContributionDistribution
Champions League/Super Cup Europa League Total
Reserves Total
€m
€m
€m
€m
€m
€m
€m
€m
€m
875.0
874.0
1 307.3
1 363.2
1 385.4
1 666.3
1 691.5
1 755.1
2 416.8
2 487.4
Total: 2 487.4
366.9243.2
211.4
2 120.5 1 819.3
213.5
Total: 2 372.1
1 746.01 883.9
488.2626.1
1 208.7
960.2
995.7
1 202.4
2 269.8
1 238.1
1 570.2
2 119.4
493.7
622.5
601.1
558.7
530.7
632.8
626.1
2 203.6
1 823.3
2 606.3
4 032.4
5 004.2
7 314.9
5.1
4.3
3.8
3.5
3.1
3.0
159.8
134.6
130.1
642.3
1 163.7
175.6
171.4
268.3
1 309.8
1 384.1
2 795.7
1 698.9
1 730.4
1 309.8
1 384.1
1 404.8
1 697.2
1 730.4
1 390.9
2 099.4
4 579.8
2 835.9
1 800.0
2 456.0
2 527.9
2 123.8
308.0
1.7
299.4
507.2
528.3
1 035.5977.7 57.8
875.0
874.0
1 307.3
1 363.2
1 385.4
1 666.3
821.9
820.3
1 110.8
1 153.1
1 165.8
1 424.3
53.1
53.7
196.5
210.1
219.6
1 691.5
1 755.1
2 416.8
1 444.0
1 496.5
2 060.9
247.5
258.6
355.9
242.0
UEFA EURO 2016 qualifiers
FIFA 2018 World Cup qualifiers
Total revenue
Total revenue | graph
*2015/16: column without UEFA EURO 2016 and HatTrick transactions

8
The amount distributed to member associations and clubs participating in UEFA’s competitions is 7% lower than in the previous season. It goes without saying that a big share of the total amount distributed last year came from EURO 2016 revenue. By contrast, distribution for the European Qualifiers is up 47% due to the higher number of matches this season. From total club competition gross revenue, 73% was distributed to the clubs. There is a slight increase in nominal values, which can be explained by the higher revenue in 2016/17. For this club competition cycle only (i.e. from 2015/16 to 2017/18), there is a fixed distribution ratio of 3.3 to 1 between UEFA Champions League and UEFA Europa League clubs.
From total revenue of roughly €2.84 billion, 75% was made available for distribution. Distributions are made according to the regulations in place and based on the revenue generated – with some exceptions, such as the Women’s EURO, the UEFA Women’s Champions League or an Under-21 final tournament, where it is a clear objective to financially compensate member associations and clubs even though these competitions are not financially self-sufficient.
This section discloses the amounts by competition paid out in the last two seasons. Some competitions are not played annually, which explains why expenses vary between financial years. The amounts distributed to teams participating in other competitions is higher than for 2015/16 because of the Under-21 final tournament in Poland with a distribution of €4 million.
75% of total revenue was paid out to the associations and clubs participating in UEFA’s competitions.
DISTRIBUTION
Distribution to participating teams | table
€m 2016/17 2015/16
UEFA EURO 2016 0.0 -301.0
European Qualifiers -295.4 -200.4
UEFA Champions League (incl. UEFA Super Cup) -1 389.1 -1 349.4
UEFA Europa League -423.2 -411.2
UEFA Super Cup -7.0 -7.0
Other competitions -4.7 -0.8
Total -2 119.4 -2 269.8
Distribution to participating teams | graph2013/14
2009/10
2010/11
2011/12
2012/13
2016/17
2014/15
2015/16
30/06/2014
30/06/2011
30/06/2012
30/06/2013
30/06/2015
30/06/2016
UCL/USC
UEL
0
500
1 000
1 500
2 000
2012/13
2009/10
2010/11
2011/12
2015/16
2013/14
2014/15
2016/17
30/06/2017
0
500
1 000
1 500
2 000
2011/12
2012/13
2013/14
2014/15
2015/16
2016/17
2015-18
2000-03
2003-06
2006-09
2009-12
2012-15
1 852.5
1 449.4
2 006.5
3 214.8
4 053.3
6 027.8
351.1
373.9
599.8
817.6
950.9
1 287.1
PAGE 8
2012/13
2009/10
2010/11
2011/12
2015/16
2013/14
2014/15
2016/17
2012/13
2007/08
2008/09
2009/10
2010/11
2011/12
2015/16
2013/14
2014/15
Page 7
Page 26b
Page 9
Page 13
Page 15
Page 25
Page 26a
Page 21
Page 28
2012/13
2007/08
2008/09
2009/10
2010/11
2011/12
821.9
820.3
1 110.8
1 153.1
1 165.8
1 424.3
53.1
53.7
196.5
210.1
219.6
2015/16
2013/14
2014/15
1 444.0
1 496.5
2 060.9
247.5
258.6
355.9
2016/17 2 120.5 366.9
242.0
Page 26
Champions League/Super Cup Europa League Total
€m
Club competitions and other revenue EURO and European Qualifiers Total
Broadcasting Commercial Total
Solidarity Total
%As % of average total revenue
Broadcasting Commercial Total
Distribution Total
Assets
Non-current
Current
Liabilities Reserves
Revenue Costs Solidarity ContributionDistribution
Champions League/Super Cup Europa League Total
Reserves Total
€m
€m
€m
€m
€m
€m
€m
€m
€m
875.0
874.0
1 307.3
1 363.2
1 385.4
1 666.3
1 691.5
1 755.1
2 416.8
2 487.4
Total: 2 487.4
366.9243.2
211.4
2 120.5 1 819.3
213.5
Total: 2 372.1
1 746.01 883.9
488.2626.1
1 208.7
960.2
995.7
1 202.4
2 269.8
1 238.1
1 570.2
2 119.4
493.7
622.5
601.1
558.7
530.7
632.8
626.1
2 203.6
1 823.3
2 606.3
4 032.4
5 004.2
7 314.9
5.1
4.3
3.8
3.5
3.1
3.0
159.8
134.6
130.1
642.3
1 163.7
175.6
171.4
268.3
1 309.8
1 384.1
2 795.7
1 698.9
1 730.4
1 309.8
1 384.1
1 404.8
1 697.2
1 730.4
1 390.9
2 099.4
4 579.8
2 835.9
1 800.0
2 456.0
2 527.9
2 123.8
308.0
1.7
299.4
507.2
528.3
1 035.5977.7 57.8
875.0
874.0
1 307.3
1 363.2
1 385.4
1 666.3
821.9
820.3
1 110.8
1 153.1
1 165.8
1 424.3
53.1
53.7
196.5
210.1
219.6
1 691.5
1 755.1
2 416.8
1 444.0
1 496.5
2 060.9
247.5
258.6
355.9
242.0
UEFA EURO 2016 qualifiers
FIFA 2018 World Cup qualifiers
Total revenue

9FINANCIAL REPORT | 2016/17
UEFA’s main objective is to reinvest as much as possible in European football, not only by way of payments to participating clubs and member associations, but also to those which do not qualify to take part in our competitions.
This has a two-fold benefit, given that reducing financial gaps also reduces sporting gaps and opens up UEFA’s elite competitions to a maximum number of member associations and clubs. At the same time, reinvesting and sharing resources boosts the development of football at grassroots and youth levels. Thus, the solidarity concept is first and foremost an unwritten mutual contract aimed at developing European football as a whole and promoting the social values of the game.
Solidarity payments are made available to:
• member associations to develop their infrastructure;
• member associations to contribute to their running costs;
• member associations as incentive payments;
• clubs eliminated in the preliminary stages of the UEFA Champions League and UEFA Europa League;
• other top-division clubs that do not qualify for UEFA's main competitions, with payments distributed by the leagues or associations for youth development;
• clubs that contribute to the success of national team football in general and the EURO in particular through the participation of some of their players.
UEFA also makes donations to the UEFA Foundation for Children as well as to other core and associated partners to support social responsibility activities and initiatives. A detailed breakdown can be found on page 22 of the annex to this financial report.
The chart below shows the amounts made available to member associations and clubs and accrued in UEFA’s accounts on an annual basis. The actual payments are not necessarily made within the same financial year because of internal approval processes or because they are split over a whole cycle (e.g. yearly HatTrick solidarity payments). A table detailing all actual payments made to member associations during 2016/17 can be found on page 11.
SOLIDARITY
Solidarity per beneficiary | table
€m 2016/17 2015/16
Member assocations 31.1 801.4
Clubs 231.4 355.4
Donations 5.8 6.9
Solidarity 268.3 1 163.7
Solidarity per season | graph
2013/14
2009/10
2010/11
2011/12
2012/13
2016/17
2014/15
2015/16
30/06/2014
30/06/2011
30/06/2012
30/06/2013
30/06/2015
30/06/2016
UCL/USC
UEL
0
500
1 000
1 500
2 000
2012/13
2009/10
2010/11
2011/12
2015/16
2013/14
2014/15
2016/17
30/06/2017
0
500
1 000
1 500
2 000
2011/12
2012/13
2013/14
2014/15
2015/16
2016/17
2015-18
2000-03
2003-06
2006-09
2009-12
2012-15
1 852.5
1 449.4
2 006.5
3 214.8
4 053.3
6 027.8
351.1
373.9
599.8
817.6
950.9
1 287.1
PAGE 8
2012/13
2009/10
2010/11
2011/12
2015/16
2013/14
2014/15
2016/17
2012/13
2007/08
2008/09
2009/10
2010/11
2011/12
2015/16
2013/14
2014/15
Page 7
Page 26b
Page 9
Page 13
Page 15
Page 25
Page 26a
Page 21
Page 28
2012/13
2007/08
2008/09
2009/10
2010/11
2011/12
821.9
820.3
1 110.8
1 153.1
1 165.8
1 424.3
53.1
53.7
196.5
210.1
219.6
2015/16
2013/14
2014/15
1 444.0
1 496.5
2 060.9
247.5
258.6
355.9
2016/17 2 120.5 366.9
242.0
Page 26
Champions League/Super Cup Europa League Total
€m
Club competitions and other revenue EURO and European Qualifiers Total
Broadcasting Commercial Total
Solidarity Total
%As % of average total revenue
Broadcasting Commercial Total
Distribution Total
Assets
Non-current
Current
Liabilities Reserves
Revenue Costs Solidarity ContributionDistribution
Champions League/Super Cup Europa League Total
Reserves Total
€m
€m
€m
€m
€m
€m
€m
€m
€m
875.0
874.0
1 307.3
1 363.2
1 385.4
1 666.3
1 691.5
1 755.1
2 416.8
2 487.4
Total: 2 487.4
366.9243.2
211.4
2 120.5 1 819.3
213.5
Total: 2 372.1
1 746.01 883.9
488.2626.1
1 208.7
960.2
995.7
1 202.4
2 269.8
1 238.1
1 570.2
2 119.4
493.7
622.5
601.1
558.7
530.7
632.8
626.1
2 203.6
1 823.3
2 606.3
4 032.4
5 004.2
7 314.9
5.1
4.3
3.8
3.5
3.1
3.0
159.8
134.6
130.1
642.3
1 163.7
175.6
171.4
268.3
1 309.8
1 384.1
2 795.7
1 698.9
1 730.4
1 309.8
1 384.1
1 404.8
1 697.2
1 730.4
1 390.9
2 099.4
4 579.8
2 835.9
1 800.0
2 456.0
2 527.9
2 123.8
308.0
1.7
299.4
507.2
528.3
1 035.5977.7 57.8
875.0
874.0
1 307.3
1 363.2
1 385.4
1 666.3
821.9
820.3
1 110.8
1 153.1
1 165.8
1 424.3
53.1
53.7
196.5
210.1
219.6
1 691.5
1 755.1
2 416.8
1 444.0
1 496.5
2 060.9
247.5
258.6
355.9
242.0
UEFA EURO 2016 qualifiers
FIFA 2018 World Cup qualifiers
Total revenue

10
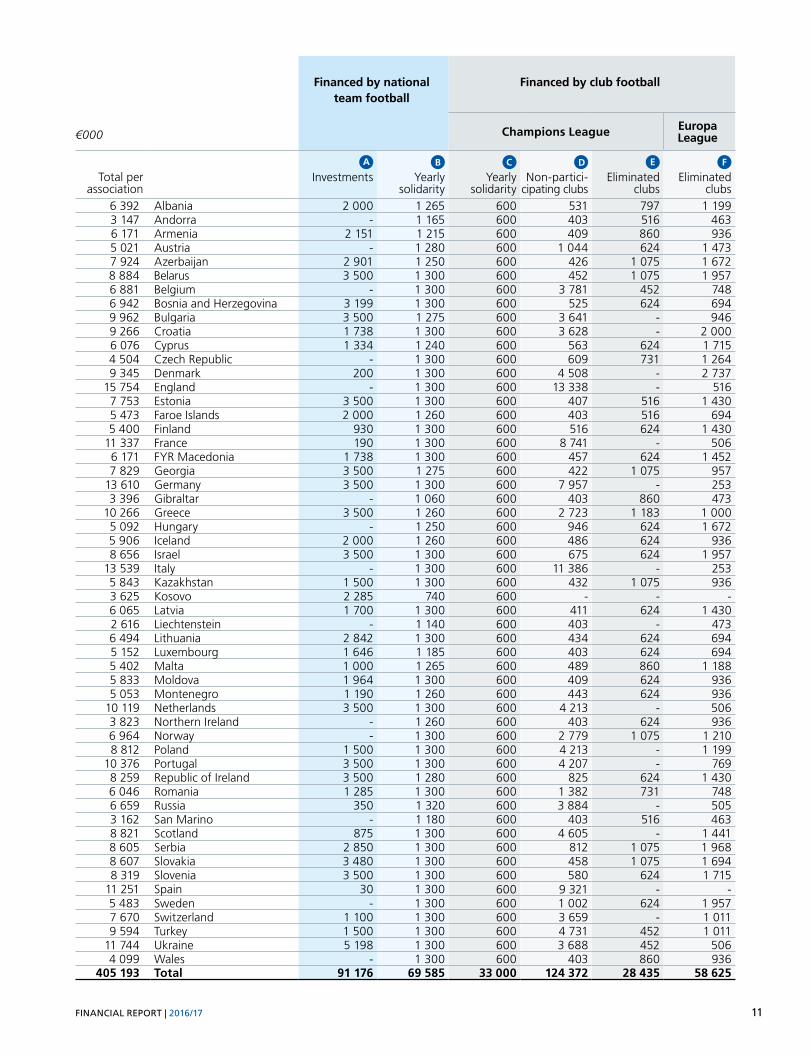
This section provides a transparent overview of all solidarity payments to member associations and clubs. The various beneficiaries are disclosed by country in the table on the opposite page.
Account needs to be taken of the fact that solidarity payments stem in part from revenue generated by club competitions and that this part therefore mainly benefits club football. The rest, financed by national team football and derived from EUROs, is, to a large extent, made available to member associations within the framework of the HatTrick programme. However, European football is not divided into two separate parts, but is an integrated, interrelated whole. Solidarity within European football is based on mutual values, which means that earnings are channelled into club and national team football. These interrelationships can be illustrated by the fact that when a EURO takes place every four years, a significant portion of the revenue goes to the clubs which participate in the success of the tournament and national team football in general. Likewise, as the table on the next page shows, a proportion of the annual income generated by club football benefits member associations.
Solidarity payments: national team football
A The HatTrick IV programme for the 2016/17 to 2019/20 four-year cycle provides for a one-off € 3.5 million solidarity payment to each UEFA member association to be used for investments in football infrastructure. The amounts distributed during the 2016/17 financial year are disclosed in this section. In some cases, these might include payments from previous HatTrick cycles.
B The HatTrick programme also provides for yearly solidarity payments in favour of member associations, consisting of the following elements:
• €750,000 as a solidarity payment to cover the running costs of the member association and good governance projects
• €1,150,000 in maximum annual incentive payments, divided up as follows:
– € 250,000 for participating in UEFA youth, women’s and futsal competitions
– € 250,000 for implementing and applying the UEFA club licensing system
– € 150,000 for implementing and applying the UEFA Grassroots Charter
– € 100,000 for implementing and applying the UEFA Coaching Convention
– € 100,000 for implementing and applying the UEFA Referee Convention
– €100,000 for implementing the UEFA women’s football development programme
– €100,000 for implementing the UEFA elite youth player development programme
– €50,000 for implementing the UEFA football and social responsibility programme
– €50,000 for integrity activities
Altogether, each association receives a maximum of €1.3 million each year from national team football.
Solidarity payments: club football
C € 33 million was channelled from the UEFA Champions League to member associations to contribute to the aforementioned yearly HatTrick solidarity payments.
The total solidarity payment received by each member association in 2016/17 is therefore the sum of columns B and C. The maximum amount available was € 1.9 million.
D A substantial amount was made available for youth development to clubs not involved in either of the two main UEFA club competitions. As decided by the relevant leagues and/or member associations, clubs in the domestic top division and, in some cases, the next division down benefited from these payments.
E A lump sum, calculated according to the number of matches played, was paid to clubs which played in the qualifiers but failed to reach the group stage of the UEFA Champions League, with an additional €260,000 for a domestic champion club. No payments were made to clubs involved in UEFA Champions League qualifying rounds which succeeded in reaching the group stage.
F The formula described in point E above was also applied to the UEFA Europa League.
THE FLOW OF SOLIDARITY PAYMENTS
11FINANCIAL REPORT | 2016/17
Financed by national team football
Financed by club football
€000 Champions League Europa League
Total per association
A
Investments B
Yearly solidarity
C Yearly
solidarity
D Non-partici-
cipating clubs
E
Eliminatedclubs
F Eliminated
clubs 6 392 Albania 2 000 1 265 600 531 797 1 199 3 147 Andorra - 1 165 600 403 516 463 6 171 Armenia 2 151 1 215 600 409 860 936 5 021 Austria - 1 280 600 1 044 624 1 473 7 924 Azerbaijan 2 901 1 250 600 426 1 075 1 672 8 884 Belarus 3 500 1 300 600 452 1 075 1 957 6 881 Belgium - 1 300 600 3 781 452 748 6 942 Bosnia and Herzegovina 3 199 1 300 600 525 624 694 9 962 Bulgaria 3 500 1 275 600 3 641 - 946 9 266 Croatia 1 738 1 300 600 3 628 - 2 000 6 076 Cyprus 1 334 1 240 600 563 624 1 715 4 504 Czech Republic - 1 300 600 609 731 1 264 9 345 Denmark 200 1 300 600 4 508 - 2 737
15 754 England - 1 300 600 13 338 - 516 7 753 Estonia 3 500 1 300 600 407 516 1 430 5 473 Faroe Islands 2 000 1 260 600 403 516 694 5 400 Finland 930 1 300 600 516 624 1 430
11 337 France 190 1 300 600 8 741 - 506 6 171 FYR Macedonia 1 738 1 300 600 457 624 1 452 7 829 Georgia 3 500 1 275 600 422 1 075 957
13 610 Germany 3 500 1 300 600 7 957 - 253 3 396 Gibraltar - 1 060 600 403 860 473
10 266 Greece 3 500 1 260 600 2 723 1 183 1 000 5 092 Hungary - 1 250 600 946 624 1 672 5 906 Iceland 2 000 1 260 600 486 624 936 8 656 Israel 3 500 1 300 600 675 624 1 957
13 539 Italy - 1 300 600 11 386 - 253 5 843 Kazakhstan 1 500 1 300 600 432 1 075 936 3 625 Kosovo 2 285 740 600 - - - 6 065 Latvia 1 700 1 300 600 411 624 1 430 2 616 Liechtenstein - 1 140 600 403 - 473 6 494 Lithuania 2 842 1 300 600 434 624 694 5 152 Luxembourg 1 646 1 185 600 403 624 694 5 402 Malta 1 000 1 265 600 489 860 1 188 5 833 Moldova 1 964 1 300 600 409 624 936 5 053 Montenegro 1 190 1 260 600 443 624 936
10 119 Netherlands 3 500 1 300 600 4 213 - 506 3 823 Northern Ireland - 1 260 600 403 624 936 6 964 Norway - 1 300 600 2 779 1 075 1 210 8 812 Poland 1 500 1 300 600 4 213 - 1 199
10 376 Portugal 3 500 1 300 600 4 207 - 769 8 259 Republic of Ireland 3 500 1 280 600 825 624 1 430 6 046 Romania 1 285 1 300 600 1 382 731 748 6 659 Russia 350 1 320 600 3 884 - 505 3 162 San Marino - 1 180 600 403 516 463 8 821 Scotland 875 1 300 600 4 605 - 1 441 8 605 Serbia 2 850 1 300 600 812 1 075 1 968 8 607 Slovakia 3 480 1 300 600 458 1 075 1 694 8 319 Slovenia 3 500 1 300 600 580 624 1 715
11 251 Spain 30 1 300 600 9 321 - - 5 483 Sweden - 1 300 600 1 002 624 1 957 7 670 Switzerland 1 100 1 300 600 3 659 - 1 011 9 594 Turkey 1 500 1 300 600 4 731 452 1 011
11 744 Ukraine 5 198 1 300 600 3 688 452 506 4 099 Wales - 1 300 600 403 860 936
405 193 Total 91 176 69 585 33 000 124 372 28 435 58 625

12
The balance sheet total stood at €2.37 billion as at 30 June 2017. This represents a 40% reduction compared with the previous year-end. The reasons are twofold. On the one side, there is a natural decrease because of the last EURO 2016 payments to participating associations and related suppliers as well as the first HatTrick IV payments to member associations. However, there is also a technical explanation for the substantial drop of over €1.58 billion. As from 2016/17, all amounts invoiced to club competition partners are now being accounted for at contractual due date in the financial year of the season in which the matches take place, even though those invoices might be sent out before. This new invoicing procedure prevents the balance sheet from being inflated, as is clearly visible when comparing ‘Other current assets’ or ‘Current liabilities’ for 2016/17 with the previous year.
As at the end of June 2017, cash and cash equivalents and other financial assets stood at €2.07 billion, down from €2.25 billion at the end of the previous year. This downswing is explained by outflows related to EURO 2016 and HatTrick being higher than advances received for the 2017/18 season. Altogether, those financial assets represent 87% of total assets (2015/16: 57%). This significant increase compared with the previous year-end is a consequence of and can be explained by the overall reduction in the balance sheet total. 83% of UEFA’s total financial assets are invested short-term to cover all commitments related to the HatTrick solidarity programme and the UEFA club competitions. The remainder is invested in long-term capital-protected securities and, to a lesser extent, to provide loans.
In 2016/17 capital expenditure represented a volume of almost €4 million – slightly down on the previous year (2015/16: €5.9m). Depreciation and amortisation for the period is slightly lower due to the end of the useful life of EURO 2016-related investments.
Current liabilities decreased by €1.8 billion to €1.2 billion as at the end of June 2017 for the reasons detailed above. Under current liabilities, a substantial portion relates to the
‘Accrued expenses and deferred income’ item, amounting to €324.9 million as at the end of June 2017 (€1.61bn as at 30 June 2016). This item contains rights revenue received for upcoming seasons that is reported as deferred income in the balance sheet.
UEFA’s cash base is strong and its financial position is sound, with a surplus of current assets over current liabilities of €673 million, leading to a coverage ratio of 156% (114% as at 30 June 2016). This comfortable cushion is needed to finance HatTrick IV solidarity payments, which are reported under non-current liabilities. As a result of the decrease in the balance sheet total, UEFA’s reserves as a percentage of the total balance sheet increased to 26% (16% as at 30 June 2016). More details on UEFA’s reserves and their use can be found on page 14, under 'Own resources'.
The reduction in the balance sheet total reflects the last EURO 2016 payments and a technical change in UEFA’s accounting procedures.
BALANCE SHEET

13FINANCIAL REPORT | 2016/17
Balance sheet | graph
Balance sheet | table
€m 30/06/2017 30/06/2016
Cash and cash equivalents 803.4 1 138.2
Other financial assets 908.8 739.8
Other current assets 171.7 1 554.4
Current assets 1 883.9 3 432.4
Other non-current assets 15.6 33.3
Property and equipment 101.9 105.8
Intangible assets 9.3 10.9
Other financial assets 361.4 372.6
Non-current assets 488.2 522.6
Total assets 2 372.1 3 955.0
Current liabilities 1 210.9 3 004.0
Non-current liabilities 535.1 318.2
Liabilities 1 746.0 3 322.2
Undesignated reserves 500.0 500.0
Retained earnings 132.8 30.7
Net result for the period -6.7 102.1
Reserves 626.1 632.8
Total liabilities and reserves 2 372.1 3 955.0
2013/14
2009/10
2010/11
2011/12
2012/13
2016/17
2014/15
2015/16
30/06/2014
30/06/2011
30/06/2012
30/06/2013
30/06/2015
30/06/2016
UCL/USC
UEL
0
500
1 000
1 500
2 000
2012/13
2009/10
2010/11
2011/12
2015/16
2013/14
2014/15
2016/17
30/06/2017
0
500
1 000
1 500
2 000
2011/12
2012/13
2013/14
2014/15
2015/16
2016/17
2015-18
2000-03
2003-06
2006-09
2009-12
2012-15
1 852.5
1 449.4
2 006.5
3 214.8
4 053.3
6 027.8
351.1
373.9
599.8
817.6
950.9
1 287.1
PAGE 8
2012/13
2009/10
2010/11
2011/12
2015/16
2013/14
2014/15
2016/17
2012/13
2007/08
2008/09
2009/10
2010/11
2011/12
2015/16
2013/14
2014/15
Page 7
Page 26b
Page 9
Page 13
Page 15
Page 25
Page 26a
Page 21
Page 28
2012/13
2007/08
2008/09
2009/10
2010/11
2011/12
821.9
820.3
1 110.8
1 153.1
1 165.8
1 424.3
53.1
53.7
196.5
210.1
219.6
2015/16
2013/14
2014/15
1 444.0
1 496.5
2 060.9
247.5
258.6
355.9
2016/17 2 120.5 366.9
242.0
Page 26
Champions League/Super Cup Europa League Total
€m
Club competitions and other revenue EURO and European Qualifiers Total
Broadcasting Commercial Total
Solidarity Total
%As % of average total revenue
Broadcasting Commercial Total
Distribution Total
Assets
Non-current
Current
Liabilities Reserves
Revenue Costs Solidarity ContributionDistribution
Champions League/Super Cup Europa League Total
Reserves Total
€m
€m
€m
€m
€m
€m
€m
€m
€m
875.0
874.0
1 307.3
1 363.2
1 385.4
1 666.3
1 691.5
1 755.1
2 416.8
2 487.4
Total: 2 487.4
366.9243.2
211.4
2 120.5 1 819.3
213.5
Total: 2 372.1
1 746.01 883.9
488.2626.1
1 208.7
960.2
995.7
1 202.4
2 269.8
1 238.1
1 570.2
2 119.4
493.7
622.5
601.1
558.7
530.7
632.8
626.1
2 203.6
1 823.3
2 606.3
4 032.4
5 004.2
7 314.9
5.1
4.3
3.8
3.5
3.1
3.0
159.8
134.6
130.1
642.3
1 163.7
175.6
171.4
268.3
1 309.8
1 384.1
2 795.7
1 698.9
1 730.4
1 309.8
1 384.1
1 404.8
1 697.2
1 730.4
1 390.9
2 099.4
4 579.8
2 835.9
1 800.0
2 456.0
2 527.9
2 123.8
308.0
1.7
299.4
507.2
528.3
1 035.5977.7 57.8
875.0
874.0
1 307.3
1 363.2
1 385.4
1 666.3
821.9
820.3
1 110.8
1 153.1
1 165.8
1 424.3
53.1
53.7
196.5
210.1
219.6
1 691.5
1 755.1
2 416.8
1 444.0
1 496.5
2 060.9
247.5
258.6
355.9
242.0
UEFA EURO 2016 qualifiers
FIFA 2018 World Cup qualifiers
Total revenue

14
UEFA’s own resources are divided into:
• undesignated reserves
• retained earnings
• net result for the period
The UEFA Congress agreed that undesignated reserves be fixed at €500 million. This decision was based on the assumption that undesignated reserves correspond to the reserves UEFA needs to be covered against any business risk. Undesignated reserves reflect its actual risk exposure as at the end of this reporting period. However, given the continued increase in revenue as a result of, for instance, the centralisation of the European Qualifiers and the creation of the UEFA Nations League, the requirements may need to be reconsidered. For this reason, the risk situation is monitored. If needed, the Executive Committee could propose to the UEFA Congress that special designated reserves be created to allow funds to be put aside to finance specific long-term projects. For transparency reasons, those designated reserves would be separate from the undesignated reserves.
Retained earnings constitute part of the amount UEFA needs to cover its running expenses in years when there is no EURO. Retained earnings move close to zero before the end of a EURO cycle (i.e. 2018/19), reflecting the not-for-profit status of the organisation.
The net result for the period shows the financial outcome for the year under review. UEFA’s total reserves decreased as a consequence of the negative net result generated in 2016/17.
OWN RESOURCES
Get
ty Im
ages

15FINANCIAL REPORT | 2016/17
Details on reserves | table
€m 30/06/2017 30/06/2016
Undesignated reserves 500.0 500.0
Retained earnings 132.8 30.7
Net result for the period -6.7 102.1
Reserves 626.1 632.8
Average revenue over four years 2 811.4 2 527.1
Undesignated reserves as a % of average revenue 17.8% 19.8%
Reserves per season | graph
2013/14
2009/10
2010/11
2011/12
2012/13
2016/17
2014/15
2015/16
30/06/2014
30/06/2011
30/06/2012
30/06/2013
30/06/2015
30/06/2016
UCL/USC
UEL
0
500
1 000
1 500
2 000
2012/13
2009/10
2010/11
2011/12
2015/16
2013/14
2014/15
2016/17
30/06/2017
0
500
1 000
1 500
2 000
2011/12
2012/13
2013/14
2014/15
2015/16
2016/17
2015-18
2000-03
2003-06
2006-09
2009-12
2012-15
1 852.5
1 449.4
2 006.5
3 214.8
4 053.3
6 027.8
351.1
373.9
599.8
817.6
950.9
1 287.1
PAGE 8
2012/13
2009/10
2010/11
2011/12
2015/16
2013/14
2014/15
2016/17
2012/13
2007/08
2008/09
2009/10
2010/11
2011/12
2015/16
2013/14
2014/15
Page 7
Page 26b
Page 9
Page 13
Page 15
Page 25
Page 26a
Page 21
Page 28
2012/13
2007/08
2008/09
2009/10
2010/11
2011/12
821.9
820.3
1 110.8
1 153.1
1 165.8
1 424.3
53.1
53.7
196.5
210.1
219.6
2015/16
2013/14
2014/15
1 444.0
1 496.5
2 060.9
247.5
258.6
355.9
2016/17 2 120.5 366.9
242.0
Page 26
Champions League/Super Cup Europa League Total
€m
Club competitions and other revenue EURO and European Qualifiers Total
Broadcasting Commercial Total
Solidarity Total
%As % of average total revenue
Broadcasting Commercial Total
Distribution Total
Assets
Non-current
Current
Liabilities Reserves
Revenue Costs Solidarity ContributionDistribution
Champions League/Super Cup Europa League Total
Reserves Total
€m
€m
€m
€m
€m
€m
€m
€m
€m
875.0
874.0
1 307.3
1 363.2
1 385.4
1 666.3
1 691.5
1 755.1
2 416.8
2 487.4
Total: 2 487.4
366.9243.2
211.4
2 120.5 1 819.3
213.5
Total: 2 372.1
1 746.01 883.9
488.2626.1
1 208.7
960.2
995.7
1 202.4
2 269.8
1 238.1
1 570.2
2 119.4
493.7
622.5
601.1
558.7
530.7
632.8
626.1
2 203.6
1 823.3
2 606.3
4 032.4
5 004.2
7 314.9
5.1
4.3
3.8
3.5
3.1
3.0
159.8
134.6
130.1
642.3
1 163.7
175.6
171.4
268.3
1 309.8
1 384.1
2 795.7
1 698.9
1 730.4
1 309.8
1 384.1
1 404.8
1 697.2
1 730.4
1 390.9
2 099.4
4 579.8
2 835.9
1 800.0
2 456.0
2 527.9
2 123.8
308.0
1.7
299.4
507.2
528.3
1 035.5977.7 57.8
875.0
874.0
1 307.3
1 363.2
1 385.4
1 666.3
821.9
820.3
1 110.8
1 153.1
1 165.8
1 424.3
53.1
53.7
196.5
210.1
219.6
1 691.5
1 755.1
2 416.8
1 444.0
1 496.5
2 060.9
247.5
258.6
355.9
242.0
UEFA EURO 2016 qualifiers
FIFA 2018 World Cup qualifiers
Total revenue

16
UEFA’s cost accounting is set up in such a way that the result can be analysed from different angles. The financial statements are classified by nature and checked by our external auditors, as published in the annex to this financial report as well as on page 7.
However, it is also useful to disclose supplementary information on the source and use of income, or in other words, how funds are generated and how they are invested. Therefore, in parallel and as complementary information, UEFA breaks down its result by competition and activity.
The source of net income (revenue minus expenses) reflects the net result from:
• Main competitions: this shows the net result of national team and club competitions. The income from a EURO is recognised in the year the tournament takes place, i.e. in 2019/20 in the case of EURO 2020.
• Other revenue and asset management: other revenue represents income from fines, contributions from FIFA and other non-football related matters. Asset management reflects income from financial investments net of any fees, as well as currency exchange differences.
The use of net income is divided into four sections, with more details published on page 19 under ‘Use of income’:
• HatTrick programme and social responsibility: this is the sum of accruals made for the HatTrick solidarity programme and HatTrick administrative costs as well as football and social responsibility activities.
• Other competitions: these are net investments in women’s, youth and amateur football, as well as futsal competitions.
• Other football activities: this relates to development, education and conferences, and includes a range of initiatives that UEFA undertakes to further improve football in areas such as knowledge exchange between associations, refereeing, coaching, stadium and security, grassroots, as well as doping and medical matters.
• Governing expenses: this groups administrative overheads and institutional costs, as explained on page 20.
‘Net financing’ corresponds to the ‘Net result for the period’ in the income statement and shows how much has been put into reserves (positive net result in 2015/16) or how much has been taken from the reserves (negative net result in 2016/17).
RESULT BY COMPETITION AND ACTIVITY
Result by competition and activity | table
€m 2016/17Net result
2015/16 Net result
National team competitions -13.5 828.9
Club competitions 213.5 198.7
Other revenue and asset management 9.0 30.7
Source of net income 209.0 1 058.3
HatTrick and social responsibility -57.2 -806.9
Other competitions -36.7 -37.8
Other football activities -36.8 -33.4
Governing expenses -85.0 -78.1
Subtotal -215.7 -956.2
Net financing to (-) / from reserves (+) 6.7 -102.1
Use of net income -209.0 -1 058.3

17FINANCIAL REPORT | 2016/17
EURO 2016 net earnings were recognised in 2015/16, but with the last matches played in July 2016. Therefore, the actual closing of the project only took place in 2016/17, which led to additional revenue and reversed accruals with an overall positive outcome of €6.1 million. The UEFA club competitions were, however, the main source of income, producing net earnings of €213.5 million in 2016/17.
More information on club competitions is provided in the different competition sections of this financial report. ‘Other revenue’, which comes to €24 million, is 28% down on last year (2015/16: €33.5m). The reasons for this decrease are lower income from fines and the fact that contributions from FIFA for
its Forward programme will only be released and recognised as revenue in 2017/18. Income from asset management further decreased from a negative €2.8 million in 2015/16 to a negative €15.0 million in 2016/17. UEFA holds positions in US dollars and British pounds, which both weakened, leading to unrealised currency losses.
A comparison of the total source of net income between the year under review and the previous financial year is not very meaningful because of the huge impact of the European Championship on the 2015/16 financial statements.
SOURCE OF INCOME
Source of net income per competition and other income | table
2016/17Revenue
2016/17Expenses €m 2016/17
Net result2015/16
Net result
1.9 4.2 UEFA EURO 2016 6.1 847.4
306.1 -325.7 European Qualifiers -19.6 -18.4
2 487.4 -2 273.9 Club competitions 213.5 198.7
2 795.4 -2 595.4 Main competitions 200.0 1 027.6
24.0 0.0 Other revenue 24.0 33.5
0.0 -15.0 Asset management -15.0 -2.8
2 819.4 -2 610.4 Source of net income 209.0 1 058.3

18
The table on the opposite page details investments made under the ‘HatTrick programme and social responsibility’, ‘Other competitions’ and ‘Other football activities’.
The provision for the HatTrick IV solidarity programme was accrued for the largest part in 2015/16 and the remaining 15% will be accrued in the following three financial years. This explains the major variance between the two financial years.
UEFA invests a substantial amount in staging women’s, youth and futsal competitions, and the UEFA Regions’ Cup. In the year under review, the only major final tournament to take place was the Under-21 final tournament in Poland, with a net investment of €7.2 million, similar to the amount invested in 2015/16. This can be explained by the fact that the final round generated €12 million in revenue and therefore largely covered its own competition and distribution costs. Altogether, total investment in ‘Other competitions’ came to €36.7 million (2015/16: €37.8m).
An important statutory duty of UEFA is to promote and monitor the development of every type of football in Europe. The different activities that come under the heading of ‘Other football activities’ are described in the UEFA administrative report, but it is still important to disclose here how much has been invested in these types of activity. In 2016/17, €37 million was invested in football development, conferences and education. This increase of more than €3 million is mainly related to development competitions (e.g. youth elite player development) and anti-doping matters, and a change in the allocation of administrative costs.
UEFA’s governing expenses amounted to €85.1 million (2015/16: €78.1m). These refer to all expenses not attributed to a competition or a project, and are grouped as administrative overheads and institutional expenses. Further details are published under ‘Governing expenses’ on page 21.
Finally, the net result for the period stands at €-6.7 million (2015/16: €102.1m).
USE OF INCOME
UEF
AU
EFA
Spo
rtsl
ife

19FINANCIAL REPORT | 2016/17
Details on the use of income | table
2016/17Revenue
2016/17Expenses €m 2016/17
Net result2015/16
Net result
- -51.09 HatTrick programme -51.09 -801.45
- -0.67 HatTrick administrative costs -0.67 -0.67
- -5.43 Social responsibility -5.43 -4.78
- -57.19 HatTrick and social responsibility -57.19 -806.90
- -1.19 UEFA European Women's Championship -1.19 -2.20
0.03 -3.72 UEFA European Women's Under-19 Championship -3.69 -4.01
0.02 -3.48 UEFA European Women's Under-17 Championship -3.46 -3.61
0.91 -5.02 UEFA Women's Champions League -4.11 -4.04
0.96 -13.41 Women's competitions -12.45 -13.86
11.60 -18.83 UEFA European Under-21 Championship -7.23 -6.96
0.04 -4.82 UEFA European Under-19 Championship -4.78 -4.26
0.11 -5.94 UEFA European Under-17 Championship -5.83 -5.65
3.31 -6.11 UEFA Youth League -2.80 -2.51
- -1.64 UEFA Regions' Cup -1.64 -0.16
15.06 -37.34 Youth and amateur competitions -22.28 -19.54
- -0.63 UEFA European Futsal Championship -0.63 -3.11
0.10 -1.45 UEFA Futsal Cup -1.35 -1.30
0.10 -2.08 Futsal competitions -1.98 -4.41
16.12 -52.83 Other competitions -36.71 -37.81
- -0.77 Study Group Scheme -0.77 -1.02
- -7.44 National association development -7.44 -7.03
- -9.34 Competition development -9.34 -5.59
0.19 -4.56 Referee education -4.37 -5.33
- -0.59 Match officer education -0.59 -0.35
- -3.10 Coach education -3.10 -3.16
- -2.01 Anti-doping and medical -2.01 -0.72
- -1.68 Technical conferences -1.68 -2.46
- -1.34 Stadium and security -1.34 -1.49
- -1.77 Football facilities -1.77 -1.70
- -1.19 Grassroots development -1.19 -1.61
- -1.35 Supporters' movement -1.35 -0.77
- -1.80 Other confederation support -1.80 -2.13
0.21 -85.27 Other football activities -36.75 -33.36
0.14 -85.25 Governing expenses -85.06 -78.09
16.52 -232.23 Subtotal -215.71 -956.16
Net financing to (-) / from reserves (+) 6.70 -102.12
Use of net income -209.01 -1 058.28

20
UEF
A
Expenses related to the running of UEFA as a governing body are classified under two headings:
• Institutional: this relates to the costs of running UEFA as a political and governing institution, which includes the UEFA Congress, committees and disciplinary proceedings, among other items. Costs are on the same level as last year, despite higher ‘Publications and media’ expenses.
• Administrative overheads: these comprise personnel and other general administrative costs such as travel and office running costs which are not allocated to a competition or an activity. Essentially, these costs are for ‘division management’ as well as unit costs for legal, finance, language services and human resources. Total administrative overheads went up mainly due to a lower corporate ICT allocation to competi-tions and other projects. This is a one-off adjustment and has no impact on the overall bottom-line result. As a high share of the administrative overheads are in Swiss francs, the slightly stronger Swiss franc continued to have a strong impact on total costs.
UEFA’s commitment to keeping governing expenses as low as possible to allow maximum resources to be allocated to solidarity, football development and to teams participating in its competitions is reflected both in the stable total costs and the stable percentage of governing expenses in relation to total average revenue.
The table opposite shows governing expenses and details of institutional expenses and total administrative overheads. Governing expenses are set against the average total revenue over four years. This percentage offers a good basis for comparison, bearing in mind that such comparisons would otherwise be distorted by a EURO every fourth year.
GOVERNING EXPENSES
Get
ty Im
ages

21FINANCIAL REPORT | 2016/17
Governing expenses as % of average total revenue | graph
Governing expenses | table
€m 2016/17 2015/16
Executive Committee and presidency -6.10 -7.35
Committees and expert panels -2.77 -2.35
Congress -2.47 -1.58
Disciplinary proceedings -2.86 -2.48
Club licensing and financial fair play -4.99 -5.42
Top Executive Programme -1.27 -0.94
Betting fraud detection -1.58 -2.88
Players' status and transfer issues -0.18 -0.33
Publications and media -9.33 -5.99
Other institutional matters -2.37 -3.95
Institutional -33.92 -33.27
Administrative overheads -51.14 -44.82
Governing expenses -85.06 -78.09
Average total revenue over four years 2 811 2 527
As % of average total revenue 3.0% 3.1%
2013/14
2009/10
2010/11
2011/12
2012/13
2016/17
2014/15
2015/16
30/06/2014
30/06/2011
30/06/2012
30/06/2013
30/06/2015
30/06/2016
UCL/USC
UEL
0
500
1 000
1 500
2 000
2012/13
2009/10
2010/11
2011/12
2015/16
2013/14
2014/15
2016/17
30/06/2017
0
500
1 000
1 500
2 000
2011/12
2012/13
2013/14
2014/15
2015/16
2016/17
2015-18
2000-03
2003-06
2006-09
2009-12
2012-15
1 852.5
1 449.4
2 006.5
3 214.8
4 053.3
6 027.8
351.1
373.9
599.8
817.6
950.9
1 287.1
PAGE 8
2012/13
2009/10
2010/11
2011/12
2015/16
2013/14
2014/15
2016/17
2012/13
2007/08
2008/09
2009/10
2010/11
2011/12
2015/16
2013/14
2014/15
Page 7
Page 26b
Page 9
Page 13
Page 15
Page 25
Page 26a
Page 21
Page 28
2012/13
2007/08
2008/09
2009/10
2010/11
2011/12
821.9
820.3
1 110.8
1 153.1
1 165.8
1 424.3
53.1
53.7
196.5
210.1
219.6
2015/16
2013/14
2014/15
1 444.0
1 496.5
2 060.9
247.5
258.6
355.9
2016/17 2 120.5 366.9
242.0
Page 26
Champions League/Super Cup Europa League Total
€m
Club competitions and other revenue EURO and European Qualifiers Total
Broadcasting Commercial Total
Solidarity Total
%As % of average total revenue
Broadcasting Commercial Total
Distribution Total
Assets
Non-current
Current
Liabilities Reserves
Revenue Costs Solidarity ContributionDistribution
Champions League/Super Cup Europa League Total
Reserves Total
€m
€m
€m
€m
€m
€m
€m
€m
€m
875.0
874.0
1 307.3
1 363.2
1 385.4
1 666.3
1 691.5
1 755.1
2 416.8
2 487.4
Total: 2 487.4
366.9243.2
211.4
2 120.5 1 819.3
213.5
Total: 2 372.1
1 746.01 883.9
488.2626.1
1 208.7
960.2
995.7
1 202.4
2 269.8
1 238.1
1 570.2
2 119.4
493.7
622.5
601.1
558.7
530.7
632.8
626.1
2 203.6
1 823.3
2 606.3
4 032.4
5 004.2
7 314.9
5.1
4.3
3.8
3.5
3.1
3.0
159.8
134.6
130.1
642.3
1 163.7
175.6
171.4
268.3
1 309.8
1 384.1
2 795.7
1 698.9
1 730.4
1 309.8
1 384.1
1 404.8
1 697.2
1 730.4
1 390.9
2 099.4
4 579.8
2 835.9
1 800.0
2 456.0
2 527.9
2 123.8
308.0
1.7
299.4
507.2
528.3
1 035.5977.7 57.8
875.0
874.0
1 307.3
1 363.2
1 385.4
1 666.3
821.9
820.3
1 110.8
1 153.1
1 165.8
1 424.3
53.1
53.7
196.5
210.1
219.6
1 691.5
1 755.1
2 416.8
1 444.0
1 496.5
2 060.9
247.5
258.6
355.9
242.0
UEFA EURO 2016 qualifiers
FIFA 2018 World Cup qualifiers
Total revenue

22
Analysing UEFA’s financial figures for one single year in isolation would distort the picture. Therefore, the fundamental aspect of UEFA as a not-for-profit organisation is only visible if results over a period of four years are cumulated, as a financial year during which a EURO takes place produces a positive net result, whereas years without tend to yield a negative result. In other words, the positive result generated in a financial year with a EURO is used to co-finance the following three years. Consequently, the overall revenue and expense streams have to be combined over the whole four-year financial period.
2015/16 was the first year of the EURO 2016 cycle, which ends in 2018/19. UEFA’s status as a not-for-profit organisation means that the aim is to end every four-year cycle with a balance just above zero and to put any earnings generated back into football, while at the same time making sure that UEFA’s reserves of €500 million do not have to be touched.
In the case of 2015/16, the surplus of €102.1 million will be used to co-finance the three years until the end of the EURO 2016 cycle. The table below shows the actuals for 2015/16 and 2016/17, the estimates for the remaining two financial years as well as the total for both the EURO 2016 and EURO 2012 cycles.
In addition, the table also shows the cumulative figures as a percentage, disclosing, on the one side, where the income came from and how much, and on the other side, how it was invested. In a nutshell, roughly 47% is financed by national team competitions for both the EURO 2012 and EURO 2016 cycles, while club competitions contribute 47% and 36% respectively. The substantial increase in the club competition contribution is explained by the fact that asset management contributed more than €100 million to the total source of net income in the 2012 cycle and even expected negative contribution of €8 million for the 2016 cycle.
The distribution of the use of income shows an increase in ‘HatTrick and social responsibility’, reflecting the higher amount available for solidarity payments thanks to the success of EURO 2016.
It goes without saying that the table below is forward-looking and for information purposes only.
FOUR-YEAR CYCLE
Source and use of income over two cycles | table
€m 2015/16 2016/17 2017/18 2018/19EURO 2016 cycle
as %EURO 2012 cycle
as %
National team competitions 829 -14 -18 -17 780 47% 570 47%
Club competitions 199 214 195 178 786 47% 433 36%
Other competitions and revenue 33 24 40 19 116 7% 101 8%
Asset management -3 -15 4 6 -8 -1% 103 9%
Source of net income 1 058 209 221 186 1'674 100% 1 207 100%
HatTrick and social responsibility -807 -57 -59 -41 -964 58% -586 49%
Other competitions -38 -37 -64 -61 -200 12% -149 12%
Other football activities -33 -37 -51 -49 -170 10% -131 11%
Governing expenses -78 -85 -80 -81 -324 19% -304 25%
Subtotal -956 -216 -254 -232 -1'658 99% -1 170 97%
Net financing to (-) / from reserves (+) -102 7 33 46 -16 1% -37 3%
Use of net income 1 058 -209 -221 -186 -1'674 100% -1 207 100%

23FINANCIAL REPORT | 2016/17
Mir
an K
amb
ic /
NZS

24
The concept of the Week of Football, featuring qualifying matches across six days from Thursday to Tuesday every match week, continued for the European Qualifiers for the 2018 FIFA World Cup in Russia. The preliminary draw for the qualifying stage was held on 25 July 2015 at the Konstantinovsky Palace in St Petersburg. Apart from Russia, who qualify automatically as hosts, 13 slots in the final tournament were available for UEFA member associations. The 54 teams were divided into nine groups of six, with the winners of each group going through to the finals, leaving the eight best runners-up to contest play-offs to determine which four would also be travelling to Russia.
The European Qualifiers for the 2018 World Cup represent the second part of the first cycle of centralised media and sponsorship rights for all qualifying matches and some friendlies. The home associations keep the revenue generated from ticket and hospitality sales.
Total revenue of just over €1 billion is expected from the first cycle of European Qualifiers (EURO 2016 and 2018 World Cup qualifiers). Revenue is recognised according to the number of matches played in a given season. As there were more matches in 2016/17 than in 2017/18, revenue will be slightly lower in 2017/18 than the €306.1 million recorded in 2016/17. Total revenue for the European Qualifiers for EURO 2016 came to €507.2 million, while for the European Qualifiers for the 2018 World Cup, total revenue is estimated at €528.3 million. This represents a 4% increase compared with the qualifiers for EURO 2016 and is again linked to the recognition of revenue by season. Altogether, 298 matches are used as the basis for the 2018 FIFA World Cup qualifiers compared with 288 matches for EURO 2016.
In 2016/17, €295.4 million was distributed to the participating associations based on individual declarations signed between the corresponding member associations and UEFA. Those amounts are fixed, with no performance bonus awarded for a win or for a draw.
The overall result for the full cycle of European Qualifiers will be negative and requires a contribution from European football. The estimated total shortfall of roughly €84 million over four years, which basically represents the operating costs of the competition, has to be seen as an important investment to put national teams in a prime position and to give them greater visibility, while at the same time, the Week of Football concept gives fans more excitement and more matches to follow.
The centralisation of the European Qualifiers is an important investment to put national teams in a prime position and to give them greater visibility.
EUROPEAN QUALIFIERS

25FINANCIAL REPORT | 2016/17
European Qualifiers: project accounts | table
€m 2016/17 2017/18 Total : 2016–18 Total : 2014–16 Cycle
Broadcasting rights 286.1 209.5 495.6 482.1 977.7
Commercial rights 20.0 12.7 32.7 25.1 57.8
Rights revenue 306.1 222.2 528.3 507.2 1 035.5
Other revenue - - - - -
Total revenue 306.1 222.2 528.3 507.2 1 035.5
Competition costs -30.3 -26.1 -56.4 -64.0 -120.4
Distribution to participating associations -295.4 -214.5 -509.9 -489.4 -999.3
Contribution from European Football -19.6 -18.4 -38.0 -46.2 -84.2
Total revenue 100.0%
Competition costs 11.6%
Distribution to participating associations 96.5%
Contribution from European Football -8.1%
European Qualifiers: total expected revenue | graph
2013/14
2009/10
2010/11
2011/12
2012/13
2016/17
2014/15
2015/16
30/06/2014
30/06/2011
30/06/2012
30/06/2013
30/06/2015
30/06/2016
UCL/USC
UEL
0
500
1 000
1 500
2 000
2012/13
2009/10
2010/11
2011/12
2015/16
2013/14
2014/15
2016/17
30/06/2017
0
500
1 000
1 500
2 000
2011/12
2012/13
2013/14
2014/15
2015/16
2016/17
2015-18
2000-03
2003-06
2006-09
2009-12
2012-15
1 852.5
1 449.4
2 006.5
3 214.8
4 053.3
6 027.8
351.1
373.9
599.8
817.6
950.9
1 287.1
PAGE 8
2012/13
2009/10
2010/11
2011/12
2015/16
2013/14
2014/15
2016/17
2012/13
2007/08
2008/09
2009/10
2010/11
2011/12
2015/16
2013/14
2014/15
Page 7
Page 26b
Page 9
Page 13
Page 15
Page 25
Page 26a
Page 21
Page 28
2012/13
2007/08
2008/09
2009/10
2010/11
2011/12
821.9
820.3
1 110.8
1 153.1
1 165.8
1 424.3
53.1
53.7
196.5
210.1
219.6
2015/16
2013/14
2014/15
1 444.0
1 496.5
2 060.9
247.5
258.6
355.9
2016/17 2 120.5 366.9
242.0
Page 26
Champions League/Super Cup Europa League Total
€m
Club competitions and other revenue EURO and European Qualifiers Total
Broadcasting Commercial Total
Solidarity Total
%As % of average total revenue
Broadcasting Commercial Total
Distribution Total
Assets
Non-current
Current
Liabilities Reserves
Revenue Costs Solidarity ContributionDistribution
Champions League/Super Cup Europa League Total
Reserves Total
€m
€m
€m
€m
€m
€m
€m
€m
€m
875.0
874.0
1 307.3
1 363.2
1 385.4
1 666.3
1 691.5
1 755.1
2 416.8
2 487.4
Total: 2 487.4
366.9243.2
211.4
2 120.5 1 819.3
213.5
Total: 2 372.1
1 746.01 883.9
488.2626.1
1 208.7
960.2
995.7
1 202.4
2 269.8
1 238.1
1 570.2
2 119.4
493.7
622.5
601.1
558.7
530.7
632.8
626.1
2 203.6
1 823.3
2 606.3
4 032.4
5 004.2
7 314.9
5.1
4.3
3.8
3.5
3.1
3.0
159.8
134.6
130.1
642.3
1 163.7
175.6
171.4
268.3
1 309.8
1 384.1
2 795.7
1 698.9
1 730.4
1 309.8
1 384.1
1 404.8
1 697.2
1 730.4
1 390.9
2 099.4
4 579.8
2 835.9
1 800.0
2 456.0
2 527.9
2 123.8
308.0
1.7
299.4
507.2
528.3
1 035.5977.7 57.8
875.0
874.0
1 307.3
1 363.2
1 385.4
1 666.3
821.9
820.3
1 110.8
1 153.1
1 165.8
1 424.3
53.1
53.7
196.5
210.1
219.6
1 691.5
1 755.1
2 416.8
1 444.0
1 496.5
2 060.9
247.5
258.6
355.9
242.0
UEFA EURO 2016 qualifiers
FIFA 2018 World Cup qualifiers
Total revenue

26
Revenue
2016/17 is the second season of the current three-year club competition cycle (2015–18). The centralised marketing of sales of broadcasting and commercial rights comprises the main club competitions: the UEFA Champions League (including the UEFA Super Cup), and a separate sales process for the UEFA Europa League. The first graph on the opposite page charts the figures per cycle and for rights revenue only (i.e. broadcasting and commercial). Cumulative rights revenue for the current cycle is expected to increase by 46% to reach €7.31 billion (2012–15: €5bn). Broadcasting rights increased by as much as 49% thanks to general increases in most markets, in particular in Latin America and in Europe. The commercial rights inventory for the Europa League now includes full centralisation and pitchside LED boards as from the knockout stage. New sponsors such as Nissan and Pepsico for the Champions League,
and FedEx, Enterprise Rent-A-Car and Amstel for the Europa League were welcomed last year. The total expected increase in commercial rights revenue adds up to 35%.
The second graph shows total revenue per season and per competition. Besides rights revenue, total revenue also includes ticket and hospitality sales for the Champions League and Europa League finals as well as for the Super Cup. This additional revenue is largely dependent on the stadium seating capacity, the teams playing and the venue. The 2017 finals were played in Cardiff (Champions League), Solna (Europa League) and Trondheim for the Super Cup. Total ticket and hospitality revenue for all three games stood at €36.9 million, which is roughly €5 million up on 2015/16. Total gross revenue was 3% higher than in 2015/16.
Distribution
Following close cooperation between UEFA and the European Club Association (ECA), a more simplified financial distribution system was put in place for the 2015–18 cycle, based on gross revenue and now including ticket and hospitality revenue. All Champions League and Europa League gross revenue is put into one single distribution pot, from which fixed percentages are used for competition costs (12%) and solidarity payments (8.5%), leaving the remaining net revenue of 79.5% to be split
between the clubs (92%) and UEFA (8%). The major share goes to the participating clubs, with a fixed ratio of 3.3 to 1 between the Champions League and Europa League. The total amount available for distribution came to €1.82 billion (2015/16: €1.77bn). Full details of the distribution per club are shown on pages 32 and 33 for the Champions League and Super Cup, and on pages 36 to 39 for the Europa League.
CLUB COMPETITIONS

27FINANCIAL REPORT | 2016/17
Total revenue | per season
Rights revenue | per cycle
2013/14
2009/10
2010/11
2011/12
2012/13
2016/17
2014/15
2015/16
30/06/2014
30/06/2011
30/06/2012
30/06/2013
30/06/2015
30/06/2016
UCL/USC
UEL
0
500
1 000
1 500
2 000
2012/13
2009/10
2010/11
2011/12
2015/16
2013/14
2014/15
2016/17
30/06/2017
0
500
1 000
1 500
2 000
2011/12
2012/13
2013/14
2014/15
2015/16
2016/17
2015-18
2000-03
2003-06
2006-09
2009-12
2012-15
1 852.5
1 449.4
2 006.5
3 214.8
4 053.3
6 027.8
351.1
373.9
599.8
817.6
950.9
1 287.1
PAGE 8
2012/13
2009/10
2010/11
2011/12
2015/16
2013/14
2014/15
2016/17
2012/13
2007/08
2008/09
2009/10
2010/11
2011/12
2015/16
2013/14
2014/15
Page 7
Page 26b
Page 9
Page 13
Page 15
Page 25
Page 26a
Page 21
Page 28
2012/13
2007/08
2008/09
2009/10
2010/11
2011/12
821.9
820.3
1 110.8
1 153.1
1 165.8
1 424.3
53.1
53.7
196.5
210.1
219.6
2015/16
2013/14
2014/15
1 444.0
1 496.5
2 060.9
247.5
258.6
355.9
2016/17 2 120.5 366.9
242.0
Page 26
Champions League/Super Cup Europa League Total
€m
Club competitions and other revenue EURO and European Qualifiers Total
Broadcasting Commercial Total
Solidarity Total
%As % of average total revenue
Broadcasting Commercial Total
Distribution Total
Assets
Non-current
Current
Liabilities Reserves
Revenue Costs Solidarity ContributionDistribution
Champions League/Super Cup Europa League Total
Reserves Total
€m
€m
€m
€m
€m
€m
€m
€m
€m
875.0
874.0
1 307.3
1 363.2
1 385.4
1 666.3
1 691.5
1 755.1
2 416.8
2 487.4
Total: 2 487.4
366.9243.2
211.4
2 120.5 1 819.3
213.5
Total: 2 372.1
1 746.01 883.9
488.2626.1
1 208.7
960.2
995.7
1 202.4
2 269.8
1 238.1
1 570.2
2 119.4
493.7
622.5
601.1
558.7
530.7
632.8
626.1
2 203.6
1 823.3
2 606.3
4 032.4
5 004.2
7 314.9
5.1
4.3
3.8
3.5
3.1
3.0
159.8
134.6
130.1
642.3
1 163.7
175.6
171.4
268.3
1 309.8
1 384.1
2 795.7
1 698.9
1 730.4
1 309.8
1 384.1
1 404.8
1 697.2
1 730.4
1 390.9
2 099.4
4 579.8
2 835.9
1 800.0
2 456.0
2 527.9
2 123.8
308.0
1.7
299.4
507.2
528.3
1 035.5977.7 57.8
875.0
874.0
1 307.3
1 363.2
1 385.4
1 666.3
821.9
820.3
1 110.8
1 153.1
1 165.8
1 424.3
53.1
53.7
196.5
210.1
219.6
1 691.5
1 755.1
2 416.8
1 444.0
1 496.5
2 060.9
247.5
258.6
355.9
242.0
UEFA EURO 2016 qualifiers
FIFA 2018 World Cup qualifiers
Total revenue
2013/14
2009/10
2010/11
2011/12
2012/13
2016/17
2014/15
2015/16
30/06/2014
30/06/2011
30/06/2012
30/06/2013
30/06/2015
30/06/2016
UCL/USC
UEL
0
500
1 000
1 500
2 000
2012/13
2009/10
2010/11
2011/12
2015/16
2013/14
2014/15
2016/17
30/06/2017
0
500
1 000
1 500
2 000
2011/12
2012/13
2013/14
2014/15
2015/16
2016/17
2015-18
2000-03
2003-06
2006-09
2009-12
2012-15
1 852.5
1 449.4
2 006.5
3 214.8
4 053.3
6 027.8
351.1
373.9
599.8
817.6
950.9
1 287.1
PAGE 8
2012/13
2009/10
2010/11
2011/12
2015/16
2013/14
2014/15
2016/17
2012/13
2007/08
2008/09
2009/10
2010/11
2011/12
2015/16
2013/14
2014/15
Page 7
Page 26b
Page 9
Page 13
Page 15
Page 25
Page 26a
Page 21
Page 28
2012/13
2007/08
2008/09
2009/10
2010/11
2011/12
821.9
820.3
1 110.8
1 153.1
1 165.8
1 424.3
53.1
53.7
196.5
210.1
219.6
2015/16
2013/14
2014/15
1 444.0
1 496.5
2 060.9
247.5
258.6
355.9
2016/17 2 120.5 366.9
242.0
Page 26
Champions League/Super Cup Europa League Total
€m
Club competitions and other revenue EURO and European Qualifiers Total
Broadcasting Commercial Total
Solidarity Total
%As % of average total revenue
Broadcasting Commercial Total
Distribution Total
Assets
Non-current
Current
Liabilities Reserves
Revenue Costs Solidarity ContributionDistribution
Champions League/Super Cup Europa League Total
Reserves Total
€m
€m
€m
€m
€m
€m
€m
€m
€m
875.0
874.0
1 307.3
1 363.2
1 385.4
1 666.3
1 691.5
1 755.1
2 416.8
2 487.4
Total: 2 487.4
366.9243.2
211.4
2 120.5 1 819.3
213.5
Total: 2 372.1
1 746.01 883.9
488.2626.1
1 208.7
960.2
995.7
1 202.4
2 269.8
1 238.1
1 570.2
2 119.4
493.7
622.5
601.1
558.7
530.7
632.8
626.1
2 203.6
1 823.3
2 606.3
4 032.4
5 004.2
7 314.9
5.1
4.3
3.8
3.5
3.1
3.0
159.8
134.6
130.1
642.3
1 163.7
175.6
171.4
268.3
1 309.8
1 384.1
2 795.7
1 698.9
1 730.4
1 309.8
1 384.1
1 404.8
1 697.2
1 730.4
1 390.9
2 099.4
4 579.8
2 835.9
1 800.0
2 456.0
2 527.9
2 123.8
308.0
1.7
299.4
507.2
528.3
1 035.5977.7 57.8
875.0
874.0
1 307.3
1 363.2
1 385.4
1 666.3
821.9
820.3
1 110.8
1 153.1
1 165.8
1 424.3
53.1
53.7
196.5
210.1
219.6
1 691.5
1 755.1
2 416.8
1 444.0
1 496.5
2 060.9
247.5
258.6
355.9
242.0
UEFA EURO 2016 qualifiers
FIFA 2018 World Cup qualifiers
Total revenue

28
Club competitions: project accounts | table
€m UCL/USC UEL 2016/17 2015/16
Broadcasting rights 1 701.1 320.0 2 021.1 1 958.1
Commercial rights 388.3 41.1 429.4 427.1
Rights revenue 2 089.4 361.1 2 450.5 2 385.2
Tickets 14.7 4.1 18.8 17.0
Hospitality 16.4 1.7 18.1 14.6
Gross revenue 2 120.5 366.9 2 487.4 2 416.8
Competition costs -174.9 -68.3 -243.2 -245.1
Solidarity payments -211.4 -205.4
- to non-participating clubs -124.4 -120.8
- to clubs eliminated in qualifying phase -87.1 -84.6
Net revenue 2 032.8 1 966.3
- Distribution to participating clubs -1 396.1 -423.2 -1 819.3 -1 767.6
- Contribution to European football -213.5 -198.7
Total of gross revenue 100.0% 100.0%
Competition costs 9.8% 10.1%
Solidarity payments 8.5% 8.5%
Net revenue 81.7% 81.4%
- share distributed to clubs 89.5% 89.9%
- share contributed to European football 10.5% 10.1%
Club competitions: project accounts | graph
2013/14
2009/10
2010/11
2011/12
2012/13
2016/17
2014/15
2015/16
30/06/2014
30/06/2011
30/06/2012
30/06/2013
30/06/2015
30/06/2016
UCL/USC
UEL
0
500
1 000
1 500
2 000
2012/13
2009/10
2010/11
2011/12
2015/16
2013/14
2014/15
2016/17
30/06/2017
0
500
1 000
1 500
2 000
2011/12
2012/13
2013/14
2014/15
2015/16
2016/17
2015-18
2000-03
2003-06
2006-09
2009-12
2012-15
1 852.5
1 449.4
2 006.5
3 214.8
4 053.3
6 027.8
351.1
373.9
599.8
817.6
950.9
1 287.1
PAGE 8
2012/13
2009/10
2010/11
2011/12
2015/16
2013/14
2014/15
2016/17
2012/13
2007/08
2008/09
2009/10
2010/11
2011/12
2015/16
2013/14
2014/15
Page 7
Page 26b
Page 9
Page 13
Page 15
Page 25
Page 26a
Page 21
Page 28
2012/13
2007/08
2008/09
2009/10
2010/11
2011/12
821.9
820.3
1 110.8
1 153.1
1 165.8
1 424.3
53.1
53.7
196.5
210.1
219.6
2015/16
2013/14
2014/15
1 444.0
1 496.5
2 060.9
247.5
258.6
355.9
2016/17 2 120.5 366.9
242.0
Page 26
Champions League/Super Cup Europa League Total
€m
Club competitions and other revenue EURO and European Qualifiers Total
Broadcasting Commercial Total
Solidarity Total
%As % of average total revenue
Broadcasting Commercial Total
Distribution Total
Assets
Non-current
Current
Liabilities Reserves
Revenue Costs Solidarity ContributionDistribution
Champions League/Super Cup Europa League Total
Reserves Total
€m
€m
€m
€m
€m
€m
€m
€m
€m
875.0
874.0
1 307.3
1 363.2
1 385.4
1 666.3
1 691.5
1 755.1
2 416.8
2 487.4
Total: 2 487.4
366.9243.2
211.4
2 120.5 1 819.3
213.5
Total: 2 372.1
1 746.01 883.9
488.2626.1
1 208.7
960.2
995.7
1 202.4
2 269.8
1 238.1
1 570.2
2 119.4
493.7
622.5
601.1
558.7
530.7
632.8
626.1
2 203.6
1 823.3
2 606.3
4 032.4
5 004.2
7 314.9
5.1
4.3
3.8
3.5
3.1
3.0
159.8
134.6
130.1
642.3
1 163.7
175.6
171.4
268.3
1 309.8
1 384.1
2 795.7
1 698.9
1 730.4
1 309.8
1 384.1
1 404.8
1 697.2
1 730.4
1 390.9
2 099.4
4 579.8
2 835.9
1 800.0
2 456.0
2 527.9
2 123.8
308.0
1.7
299.4
507.2
528.3
1 035.5977.7 57.8
875.0
874.0
1 307.3
1 363.2
1 385.4
1 666.3
821.9
820.3
1 110.8
1 153.1
1 165.8
1 424.3
53.1
53.7
196.5
210.1
219.6
1 691.5
1 755.1
2 416.8
1 444.0
1 496.5
2 060.9
247.5
258.6
355.9
242.0
UEFA EURO 2016 qualifiers
FIFA 2018 World Cup qualifiers
Total revenue

29FINANCIAL REPORT | 2016/17
Solidarity payments for the qualifying phase | table
€m Number of clubs
Amount in €000 2016/17 2015/16
Domestic champion 35 260 9.10 9.00
First qualifying round 8 220 1.76 1.60
Second qualifying round 29 320 9.28 8.70
Third qualifying round (eliminated clubs only) 15 420 6.30 6.60
Surplus (average per club) 41 49 1.99 1.75
UEFA Champions League 28.43 27.65
First qualifying round 96 215 20.64 20.40
Second qualifying round 66 225 14.85 13.86
Third qualifying round 58 235 13.63 12.76
Play-offs (eliminated clubs only) 22 245 5.39 5.06
Surplus (average per club) 144 29 4.11 4.86
UEFA Europa League 58.62 56.94
Total eliminated clubs 87.05 84.58
Solidarity
Contribution to European football
The aim of centralised marketing in the Champions League is to ensure that clubs which do not participate in or qualify for the Champions League or Europa League still participate in the success of UEFA’s flagship club competition by way of solidarity payments, with the pot available fixed at 8.5% of gross revenue. Total solidarity came to €211.4 million (2015/16: €205.4m).
Out of the pot of 8.5% of gross revenue, 3.5% (€87.1m) is paid to the clubs participating in the Champions League and Europa League qualifying rounds, leaving a 5% solidarity portion for non-participating clubs, to be used for youth development. The amount available in 2016/17 was €124.4 million (2015/16: €120.8m), 80% of which was distributed to national associations and/or leagues with at least one
club participating in the Champions League group stage and 20% to those with no participating clubs in the group stage. This amount is accrued on actual revenue in the 2016/17 financial year and will be paid out during the following season (2017/18).
The solidarity payment process for clubs involved in the qualifying phases is more complex because the basis (i.e. gross revenue) is only known once the accounts have been audited. To overcome this, fixed amounts are calculated beforehand on the basis of a forecast of gross revenue and paid out during the year. Thanks to higher actual gross revenue, it was then possible to pay a surplus to all clubs involved in the 2016/17 qualifying rounds. The following table shows the amounts per qualifying round as well as the surplus.
The contribution in favour of European football is higher than last year, coming to €213.5 million (2015/16: €198.7m). The main reason for this increase is the higher gross revenue generated. At the same time, competition costs were lower, because investments concerning the whole cycle were written off in 2015/16. The ‘Contribution to European football’ is an important part of the total net source of income and
will be reinvested directly in football, first and foremost in other competitions, to further develop the game at the base of the footballing pyramid and for the benefit of European football as a whole. But it will also be used to finance football development and education activities, as well as to cover UEFA’s administrative and institutional costs.

30
UEFA CHAMPIONS LEAGUE
The format of the UEFA Champions League remained unchanged and started with 20 play-off matches to finalise the list of 32 group stage participants. These play-offs, from which the ten losing teams move into the group stage of the UEFA Europa League, are included in the Champions League contracts, bringing the total number of Champions League matches to 145. The UEFA Super Cup (USC) is also part of the Champions League package.
The principles governing the distribution of revenue among the 32 Champions League group stage clubs also remained the same, with a fixed amount, a performance bonus and an important part of the financial benefits distributed through the market pool concept. Market pool shares in favour of Champions League clubs are in proportion to the value of the broadcasting rights revenue within the territory of their respective national associations. Being directly linked to the increase in gross revenue, the amounts distributed to clubs followed the same upward trend. Obviously, this type of distribution system with variable parameters has a significant impact on the individual amounts received by the clubs, even
among clubs that achieve similar results in the competition. Consequently, it is not necessarily the club which lifts the trophy that receives the biggest financial reward. UEFA is aware of this trend and measures to improve the distribution model have been agreed with the European Club Association (ECA) to correct this for the next cycle. Given that the final total of club competition net revenue was higher than had been anticipated when the amounts for distribution in 2015/16 were fixed, a surplus of €73 million was available at the end of the season. This surplus was shared among the 32 clubs in proportion to the total of the fixed amounts and market pool shares already received by each club during the season. The surplus amounts per club are included in the market pool column on page 33. The two clubs involved in the Super Cup were also rewarded with a fixed amount of €4 million for the winners, Real Madrid CF, and €3 million for Sevilla FC. It should also be noted that the home clubs kept all the gate receipts for all their matches, except for the final at the National Stadium of Wales in Cardiff, for which the ticketing share for the two finalists is included in the performance bonus.

31FINANCIAL REPORT | 2016/17
UEF
A

32
UEFA Champions League 2016/17 : distribution to clubs | graph
€000
Club Association Total
Gro
up
A
PFC Ludogorets 1945 BUL 18 752
Paris Saint-Germain FRA 55 313
Arsenal FC ENG 64 573
FC Basel 1893 SUI 16 268
Gro
up
B
Beşiktaş JK TUR 33 795
FC Dynamo Kyiv UKR 18 682
SSC Napoli ITA 66 009
SL Benfica POR 28 540
Gro
up
C
VfL Borussia Mönchengladbach GER 26 603
FC Barcelona ESP 59 847
Celtic FC SCO 31 740
Manchester City FC ENG 50 204
Gro
up
D
Club Atlético de Madrid ESP 60 615
FC Bayern München GER 54 762
FC Rostov RUS 20 448
PSV Eindhoven NED 22 986
Gro
up
E
AS Monaco FC FRA 64 685
Bayer 04 Leverkusen GER 38 593
PFC CSKA Moskva RUS 17 899
Tottenham Hotspur FC ENG 43 280
Gro
up
F
Borussia Dortmund GER 52 825
Real Madrid CF ESP 81 051
Sporting Clube de Portugal POR 18 180
Legia Warszawa SA POL 27 228
Gro
up
G
F.C. København DEN 34 098
Club Brugge KV BEL 17 047
Leicester City FC ENG 81 681
FC Porto POR 30 730
Gro
up
H
Sevilla FC ESP 32 880
Olympique Lyonnais FRA 38 613
GNK Dinamo CRO 16 982
Juventus Football Club ITA 110 434
Clu
bs
elim
inat
ed
APOEL FC CYP 3 000
FC Salzburg AUT 3 000
FC Steaua Bucureşti ROU 3 000
AFC Ajax NED 3 943
BSC Young Boys SUI 3 197
FC Viktoria Plzeň CZE 3 000
Hapoel Beer-Sheva FC ISR 3 000
Dundalk FC IRL 3 000
AS Roma ITA 13 612
Villarreal CF ESP 10 830
USC
Real Madrid CF ESP 4 000
Sevilla FC ESP 3 000

33FINANCIAL REPORT | 2016/17
€000
Club Association Total
Gro
up
A
PFC Ludogorets 1945 BUL 18 752
Paris Saint-Germain FRA 55 313
Arsenal FC ENG 64 573
FC Basel 1893 SUI 16 268
Gro
up
B
Beşiktaş JK TUR 33 795
FC Dynamo Kyiv UKR 18 682
SSC Napoli ITA 66 009
SL Benfica POR 28 540
Gro
up
C
VfL Borussia Mönchengladbach GER 26 603
FC Barcelona ESP 59 847
Celtic FC SCO 31 740
Manchester City FC ENG 50 204
Gro
up
D
Club Atlético de Madrid ESP 60 615
FC Bayern München GER 54 762
FC Rostov RUS 20 448
PSV Eindhoven NED 22 986
Gro
up
E
AS Monaco FC FRA 64 685
Bayer 04 Leverkusen GER 38 593
PFC CSKA Moskva RUS 17 899
Tottenham Hotspur FC ENG 43 280
Gro
up
F
Borussia Dortmund GER 52 825
Real Madrid CF ESP 81 051
Sporting Clube de Portugal POR 18 180
Legia Warszawa SA POL 27 228
Gro
up
G
F.C. København DEN 34 098
Club Brugge KV BEL 17 047
Leicester City FC ENG 81 681
FC Porto POR 30 730
Gro
up
H
Sevilla FC ESP 32 880
Olympique Lyonnais FRA 38 613
GNK Dinamo CRO 16 982
Juventus Football Club ITA 110 434
Clu
bs
elim
inat
ed
APOEL FC CYP 3 000
FC Salzburg AUT 3 000
FC Steaua Bucureşti ROU 3 000
AFC Ajax NED 3 943
BSC Young Boys SUI 3 197
FC Viktoria Plzeň CZE 3 000
Hapoel Beer-Sheva FC ISR 3 000
Dundalk FC IRL 3 000
AS Roma ITA 13 612
Villarreal CF ESP 10 830
USC
Real Madrid CF ESP 4 000
Sevilla FC ESP 3 000
UEFA Champions League 2016/17 : distribution to clubs | table
Play-offs Group matches Knockout matches Total
€000 Fixed amount Bonus Market
poolRound of 16
Quarter- finals
Semi- finals Final
Gro
up
A
PFC Ludogorets 1945 2 000 12 700 1 500 2 552 - - - - 18 752
Paris Saint-Germain - 12 700 6 681 29 932 6 000 - - - 55 313
Arsenal FC - 12 700 7 908 37 965 6 000 - - - 64 573
FC Basel 1893 - 12 700 1 000 2 568 - - - - 16 268
Gro
up
B
Beşiktaş JK - 12 700 3 727 17 368 - - - - 33 795
FC Dynamo Kyiv - 12 700 2 727 3 255 - - - - 18 682
SSC Napoli - 12 700 6 181 41 128 6 000 - - - 66 009
SL Benfica - 12 700 4 454 5 386 6 000 - - - 28 540
Gro
up
C
VfL Borussia Mönchengladbach 2 000 12 700 2 727 9 176 - - - - 26 603
FC Barcelona - 12 700 8 635 26 012 6 000 6 500 - - 59 847
Celtic FC 2 000 12 700 1 500 15 540 - - - - 31 740
Manchester City FC 2 000 12 700 4 954 24 550 6 000 - - - 50 204
Gro
up
D
Club Atlético de Madrid - 12 700 8 635 19 280 6 000 6 500 7 500 - 60 615
FC Bayern München - 12 700 6 908 22 654 6 000 6 500 - - 54 762
FC Rostov 2 000 12 700 2 727 3 021 - - - - 20 448
PSV Eindhoven - 12 700 1 000 9 286 - - - - 22 986
Gro
up
E
AS Monaco FC 2 000 12 700 6 181 23 804 6 000 6 500 7 500 - 64 685
Bayer 04 Leverkusen - 12 700 5 454 14 439 6 000 - - - 38 593
PFC CSKA Moskva - 12 700 1 500 3 699 - - - - 17 899
Tottenham Hotspur FC - 12 700 3 954 26 626 - - - - 43 280
Gro
up
F
Borussia Dortmund - 12 700 7 908 19 717 6 000 6 500 - - 52 825
Real Madrid CF - 12 700 6 681 26 170 6 000 6 500 7 500 15 500 81 051
Sporting Clube de Portugal - 12 700 1 727 3 753 - - - - 18 180
Legia Warszawa SA 2 000 12 700 2 227 10 301 - - - - 27 228
Gro
up
G
F.C. København 2 000 12 700 4 954 14 444 - - - - 34 098
Club Brugge KV - 12 700 - 4 347 - - - - 17 047
Leicester City FC - 12 700 7 408 49 073 6 000 6 500 - - 81 681
FC Porto 2 000 12 700 6 181 3 849 6 000 - - - 30 730
Gro
up
H
Sevilla FC - 12 700 6 181 7 999 6 000 - - - 32 880
Olympique Lyonnais - 12 700 4 454 21 459 - - - - 38 613
GNK Dinamo 2 000 12 700 - 2 282 - - - - 16 982
Juventus Football Club - 12 700 7 908 58 826 6 000 6 500 7 500 11 000 110 434
Elim
inat
ed c
lub
s
APOEL FC 3 000 - - - - - - - 3 000
FC Salzburg 3 000 - - - - - - - 3 000
FC Steaua Bucureşti 3 000 - - - - - - - 3 000
AFC Ajax 3 000 - - 943 - - - - 3 943
BSC Young Boys 3 000 - - 197 - - - - 3 197
FC Viktoria Plzeň 3 000 - - - - - - - 3 000
Hapoel Beer-Sheva FC 3 000 - - - - - - - 3 000
Dundalk FC 3 000 - - - - - - - 3 000
AS Roma 3 000 - - 10 612 - - - - 13 612
Villarreal CF 3 000 - - 7 830 - - - - 10 830
USC
Real Madrid CF - 4 000 - - - - - - 4 000
Sevilla FC - 3 000 - - - - - - 3 000
Allocated in accordance with the Memorandum of Understanding with the ECA 4 200
Total 50 000 413 400 143 982 580 043 96 000 52 000 30 000 26 500 1 396 125

34
UEFA EUROPA LEAGUE
The 48 teams which qualify for the group stage of the UEFA Europa League are drawn into 12 groups, meaning that every team plays a minimum of three home matches. The winners and runners-up from each of the 12 groups are joined in the round of 32 by the eight teams which earn the right to continue their European campaign by finishing third in their UEFA Champions League group. In all, 205 UEFA Europa League matches – including the final at the Friends Arena in Solna, Sweden – were staged all over Europe in 2016/17.
As mentioned in this report, 92% of net revenue is distributed to Champions League and Europa League clubs at an agreed fixed ratio of 3.3 to 1 between the two competitions. For 2016/17, this allowed a total of €423.2 million (2015/16: €411.2m) to be distributed to the participating teams – 3% more than in the previous season and 72% more than in the
previous cycle. The Champions League distribution model also applies to the Europa League, where the participating clubs are also entitled to a fixed amount, a performance bonus and a share of the market pool based on the commercial value of their domestic media rights markets. Given that the final total gross revenue for club competitions was higher than had been anticipated when the amounts for distribution in 2016/17 were set, a surplus of €23.5 million was available at the end of the season. This surplus was split among the clubs in proportion to the total of the fixed amount and market pool shares already received by each club during the season. These surplus amounts are included in the market pool columns on pages 37 and 39. Ticket revenue is treated in the same way as in the Champions League, with the home club retaining all gate receipts, except for the final, for which the ticketing share for the two finalists is included in the performance bonus.

35FINANCIAL REPORT | 2016/17
UEF
A

36
UEFA Europa League 2016/17 : distribution to clubs | graph
€000
Club Association Total
Gro
up
A
Fenerbahçe SK TUR 10 815
Feyenoord NED 5 378
Manchester United FC ENG 44 503
FC Zorya Luhansk UKR 3 740
Gro
up
B
FC Astana KAZ 3 679
BSC Young Boys SUI 4 357
Olympiacos FC GRE 7 608
APOEL FC CYP 6 683
Gro
up
C
FC Qäbälä AZE 2 900
1. FSV Mainz 05 GER 10 689
AS Saint-Étienne FRA 13 467
RSC Anderlecht BEL 7 347
Gro
up
D
Football Club Zenit RUS 8 141
AZ NED 6 298
Dundalk FC IRL 3 704
Maccabi Tel-Aviv FC ISR 3 960
Gro
up
E
FK Austria Wien AUT 4 070
FC Viktoria Plzeň CZE 3 827
AS Roma ITA 14 215
FC Astra ROU 5 774
Gro
up
F
Athletic Club ESP 9 520
SK Rapid Wien AUT 4 190
KRC Genk BEL 7 808
US Sassuolo Calcio ITA 8 005
Gro
up
G
AFC Ajax NED 16 195
R. Standard de Liège BEL 4 229
RC Celta de Vigo ESP 16 997
Panathinaikos FC GRE 4 360
Gro
up
H
KAA Gent BEL 5 869
Konyaspor TUR 7 474
FC Shakhtar Donetsk UKR 7 409
SC Braga POR 5 558
Gro
up
I
FC Schalke 04 GER 17 736
FC Salzburg AUT 4 475
FC Krasnodar RUS 7 224
OGC Nice FRA 10 618
Gro
up
J
ACF Fiorentina ITA 11 464
FK Qarabağ AZE 3 824
FC Slovan Liberec CZE 3 587
PAOK FC GRE 6 651

37FINANCIAL REPORT | 2016/17
€000
Club Association Total
Gro
up
A
Fenerbahçe SK TUR 10 815
Feyenoord NED 5 378
Manchester United FC ENG 44 503
FC Zorya Luhansk UKR 3 740
Gro
up
B
FC Astana KAZ 3 679
BSC Young Boys SUI 4 357
Olympiacos FC GRE 7 608
APOEL FC CYP 6 683
Gro
up
C
FC Qäbälä AZE 2 900
1. FSV Mainz 05 GER 10 689
AS Saint-Étienne FRA 13 467
RSC Anderlecht BEL 7 347
Gro
up
D
Football Club Zenit RUS 8 141
AZ NED 6 298
Dundalk FC IRL 3 704
Maccabi Tel-Aviv FC ISR 3 960
Gro
up
E
FK Austria Wien AUT 4 070
FC Viktoria Plzeň CZE 3 827
AS Roma ITA 14 215
FC Astra ROU 5 774
Gro
up
F
Athletic Club ESP 9 520
SK Rapid Wien AUT 4 190
KRC Genk BEL 7 808
US Sassuolo Calcio ITA 8 005
Gro
up
G
AFC Ajax NED 16 195
R. Standard de Liège BEL 4 229
RC Celta de Vigo ESP 16 997
Panathinaikos FC GRE 4 360
Gro
up
H
KAA Gent BEL 5 869
Konyaspor TUR 7 474
FC Shakhtar Donetsk UKR 7 409
SC Braga POR 5 558
Gro
up
I
FC Schalke 04 GER 17 736
FC Salzburg AUT 4 475
FC Krasnodar RUS 7 224
OGC Nice FRA 10 618
Gro
up
J
ACF Fiorentina ITA 11 464
FK Qarabağ AZE 3 824
FC Slovan Liberec CZE 3 587
PAOK FC GRE 6 651
UEFA Europa League 2016/17 : distribution to clubs | table
Group matches Knockout matches Total
€000 Fixed amount Bonus Market
poolRound of 32
Round of 16
Quarter- finals
Semi- finals Final
Gro
up
A
Fenerbahçe SK 2 600 2 324 5 391 500 - - - - 10 815
Feyenoord 2 600 922 1 856 - - - - - 5 378
Manchester United FC 2 600 1 904 29 649 500 750 1 000 1 600 6 500 44 503
FC Zorya Luhansk 2 600 240 900 - - - - - 3 740
Gro
up
B
FC Astana 2 600 641 438 - - - - - 3 679
BSC Young Boys 2 600 1 042 715 - - - - - 4 357
Olympiacos FC 2 600 1 342 2 416 500 750 - - - 7 608
APOEL FC 2 600 2 204 629 500 750 - - - 6 683
Gro
up
C
FC Qäbälä 2 600 - 300 - - - - - 2 900
1. FSV Mainz 05 2 600 1 162 6 927 - - - - - 10 689
AS Saint-Étienne 2 600 2 163 8 204 500 - - - - 13 467
RSC Anderlecht 2 600 1 743 754 500 750 1 000 - - 7 347
Gro
up
D
Football Club Zenit 2 600 2 605 2 436 500 - - - - 8 141
AZ 2 600 1 342 1 856 500 - - - - 6 298
Dundalk FC 2 600 521 583 - - - - - 3 704
Maccabi Tel-Aviv FC 2 600 922 438 - - - - - 3 960
Gro
up
E
FK Austria Wien 2 600 641 829 - - - - - 4 070
FC Viktoria Plzeň 2 600 761 466 - - - - - 3 827
AS Roma 2 600 2 163 8 202 500 750 - - - 14 215
FC Astra 2 600 1 342 1 332 500 - - - - 5 774
Gro
up
F
Athletic Club 2 600 1 623 4 797 500 - - - - 9 520
SK Rapid Wien 2 600 761 829 - - - - - 4 190
KRC Genk 2 600 2 204 754 500 750 1 000 - - 7 808
US Sassuolo Calcio 2 600 641 4 764 - - - - - 8 005
Gro
up
G
AFC Ajax 2 600 2 444 3 801 500 750 1 000 1 600 3 500 16 195
R. Standard de Liège 2 600 881 748 - - - - - 4 229
RC Celta de Vigo 2 600 1 462 9 085 500 750 1 000 1 600 - 16 997
Panathinaikos FC 2 600 120 1 640 - - - - - 4 360
Gro
up
H
KAA Gent 2 600 1 342 677 500 750 - - - 5 869
Konyaspor 2 600 120 4 754 - - - - - 7 474
FC Shakhtar Donetsk 2 600 3 006 1 303 500 - - - - 7 409
SC Braga 2 600 761 2 197 - - - - - 5 558
Gro
up
I
FC Schalke 04 2 600 2 605 10 281 500 750 1 000 - - 17 736
FC Salzburg 2 600 922 953 - - - - - 4 475
FC Krasnodar 2 600 1 222 2 152 500 750 - - - 7 224
OGC Nice 2 600 802 7 216 - - - - - 10 618
Gro
up
J
ACF Fiorentina 2 600 2 324 6 040 500 - - - - 11 464
FK Qarabağ 2 600 922 302 - - - - - 3 824
FC Slovan Liberec 2 600 521 466 - - - - - 3 587
PAOK FC 2 600 1 623 1 928 500 - - - - 6 651

38
UEFA Europa League 2016/17 : distribution to clubs | graph
€000
Club Association Total
Gro
up
K
AC Sparta Praha CZE 5 843
F.C. Internazionale Milano ITA 8 166
Hapoel Beer-Sheva FC ISR 4 921
Southampton FC ENG 15 200
Gro
up
L
FC Zürich SUI 4 215
Osmanlıspor FK TUR 10 414
FC Steaua Bucureşti ROU 4 462
Villarreal CF ESP 9 359
Clu
bs
fro
m U
CL
PFC Ludogorets 1945 BUL 603
Beşiktaş JK TUR 6 123
VfL Borussia Mönchengladbach GER 2 999
FC Rostov RUS 1 624
Tottenham Hotspur FC ENG 2 376
Legia Warszawa SA POL 788
F.C. København DEN 1 889
Olympique Lyonnais FRA 9 858
UEF
AU
EFA

39FINANCIAL REPORT | 2016/17
€000
Club Association Total
Gro
up
K
AC Sparta Praha CZE 5 843
F.C. Internazionale Milano ITA 8 166
Hapoel Beer-Sheva FC ISR 4 921
Southampton FC ENG 15 200
Gro
up
L
FC Zürich SUI 4 215
Osmanlıspor FK TUR 10 414
FC Steaua Bucureşti ROU 4 462
Villarreal CF ESP 9 359
Clu
bs
fro
m U
CL
PFC Ludogorets 1945 BUL 603
Beşiktaş JK TUR 6 123
VfL Borussia Mönchengladbach GER 2 999
FC Rostov RUS 1 624
Tottenham Hotspur FC ENG 2 376
Legia Warszawa SA POL 788
F.C. København DEN 1 889
Olympique Lyonnais FRA 9 858
UEFA Europa League 2016/17 : distribution to clubs | table
Group matches Knockout matches Total
€000 Fixed amount Bonus Market
poolRound of 32
Round of 16
Quarter- finals
Semi- finals Final
Gro
up
K
AC Sparta Praha 2 600 2 204 539 500 - - - - 5 843
F.C. Internazionale Milano 2 600 802 4 764 - - - - - 8 166
Hapoel Beer-Sheva FC 2 600 1 342 479 500 - - - - 4 921
Southampton FC 2 600 1 042 11 558 - - - - - 15 200
Gro
up
L
FC Zürich 2 600 761 854 - - - - - 4 215
Osmanlıspor FK 2 600 1 923 5 391 500 - - - - 10 414
FC Steaua Bucureşti 2 600 761 1 101 - - - - - 4 462
Villarreal CF 2 600 1 462 4 797 500 - - - - 9 359
Clu
bs
fro
m U
CL
PFC Ludogorets 1945 - - 103 500 - - - - 603
Beşiktaş JK - - 3 873 500 750 1 000 - - 6 123
VfL Borussia Mönchengladbach - - 1 749 500 750 - - - 2 999
FC Rostov - - 374 500 750 - - - 1 624
Tottenham Hotspur FC - - 1 876 500 - - - - 2 376
Legia Warszawa SA - - 288 500 - - - - 788
F.C. København - - 639 500 750 - - - 1 889
Olympique Lyonnais - - 6 008 500 750 1 000 1 600 - 9 858
Total 124 800 62 587 183 401 16 000 12 000 8 000 6 400 10 000 423 188
40
This document is published in English, French and German. The English version is authoritative, in accordance with Article 4.3 of the UEFA Statutes.
Spo
rtsl
ife

Facts and figures
Introduction Financial strategy Income statement Distribution Solidarity The flow of solidarity payments Balance sheet Own resources Result by competition and activity Source of income Use of income Governing expenses Four-year cycle European Qualifiers Club competitions UEFA Champions League UEFA Europa League
Annex
Financial statements as at 30 June 2017 Reports of the statutory auditors
TABLE OF CONTENTS
I.
14689
101214161718202224263034
II.
Co
ver :
Get
ty Im
ages
UEFAROUTE DE GENÈVE 46CH-1260 NYON 2 SWITZERLANDTELEPHONE: +41 848 00 27 27TELEFAX: +41 848 01 27 27
Financial Report2016/17
42nd Ordinary UEFA CongressBratislava, 26 February 2018
Setting: LargeNetwork, Geneva. Printing: Artgraphic Cavin, Grandson, Switzerland