Embed Size (px)
Citation preview

1U.S. DEPARTMENT OF ENERGY OFFICE OF ENERGY EFFICIENCY & RENEWABLE ENERGY
2016 Wind Technologies Market Report: SummaryRyan Wiser & Mark BolingerLawrence Berkeley National LaboratoryAugust 2017

2U.S. DEPARTMENT OF ENERGY OFFICE OF ENERGY EFFICIENCY & RENEWABLE ENERGY
2016 Wind Technologies Market Report
Purpose, Scope, and Data:• Publicly available annual report summarizing key trends in the U.S. wind
power market, with a focus on 2016
• Scope primarily includes wind turbines over 100 kW in size
• Separate DOE-funded reports on distributed and offshore wind
• Data sources include EIA, FERC, SEC, AWEA, etc. (see full report)
Report Authors:• Primary authors: Ryan Wiser and Mark Bolinger, Berkeley Lab
• Contributions from others at Berkeley Lab, Exeter Associates, NREL
Funded by: U.S. DOE Wind Energy Technologies Office
Available at: http://energy.gov/eere/wind

3U.S. DEPARTMENT OF ENERGY OFFICE OF ENERGY EFFICIENCY & RENEWABLE ENERGY
Report Contents
• Installation trends• Industry trends• Technology trends• Performance trends• Cost trends• Wind power price trends• Policy & market drivers• Future outlook

4U.S. DEPARTMENT OF ENERGY OFFICE OF ENERGY EFFICIENCY & RENEWABLE ENERGY
Key Findings
• Wind capacity additions continued at a rapid pace in 2016, w/ significant additional new builds anticipated over next four years in part due to PTC
• Wind has been a significant source of new electric generation capacity additions in the U.S. in recent years
• Supply chain continued to adjust to swings in domestic demand, but domestic content for nacelle assembly, towers, and blades is strong
• Turbine scaling is significantly boosting wind project performance, while the installed cost of wind projects has declined
• Wind power sales prices are at all-time lows, enabling economic competitiveness despite low natural gas prices
• Growth beyond current PTC cycle remains uncertain: could be blunted by declining federal tax support, expectations for low natural gas prices and solar costs, and modest electricity demand growth

5U.S. DEPARTMENT OF ENERGY OFFICE OF ENERGY EFFICIENCY & RENEWABLE ENERGY
Installation Trends

6U.S. DEPARTMENT OF ENERGY OFFICE OF ENERGY EFFICIENCY & RENEWABLE ENERGY
• $13 billion invested in wind power project additions in 2016• Nearly 90% of new 2016 capacity located in the Interior region• First offshore project—30 MW in Rhode Island—commissioned
Wind Additions Continued at a Rapid Pace in 2016, with 8,203 MW of New Capacity, Bringing Total to 82 GW
0612182430364248546066727884
0123456789
1011121314
1998
1999
2000
2001
2002
2003
2004
2005
2006
2007
2008
2009
2010
2011
2012
2013
2014
2015
2016
Southeast (annual, left scale)
Northeast (annual, left scale)
Great Lakes (annual, left scale)
West (annual, left scale)
Interior (annual, left scale)
Total US (cumulative, right scale)
Cum
ulat
ive
Cap
acity
(GW
)
Annu
al C
apac
ity (G
W)
Installation Trends

7U.S. DEPARTMENT OF ENERGY OFFICE OF ENERGY EFFICIENCY & RENEWABLE ENERGY
Wind Power Represented 27% of Electric-Generating Capacity Additions in 2016
• Over last decade, wind has comprised 31% of capacity additions nation-wide, and a much higher proportion in some regions
InteriorGreatLakes
West
Southeast
Northeast
Installation Trends

8U.S. DEPARTMENT OF ENERGY OFFICE OF ENERGY EFFICIENCY & RENEWABLE ENERGY
• U.S. also remains a distant second to China in cumulative capacity• Global wind additions in 2016 were 14% below their record high in 2015
The U.S. Placed 2rd in Annual Wind Power Capacity Additions in 2016
Annual Capacity (2016, MW)
Cumulative Capacity (end of 2016, MW)
China 23,370 China 168,732 United States 8,203 United States 82,143 Germany 5,443 Germany 50,018 India 3,612 India 28,700 Brazil 2,014 Spain 23,074 France 1,561 United Kingdom 14,543 Turkey 1,387 France 12,066 Netherlands 887 Canada 11,900 United Kingdom 736 Brazil 10,740 Canada 702 Italy 9,257 Rest of World 6,727 Rest of World 75,576 TOTAL 54,642 TOTAL 486,749
Installation Trends
9U.S. DEPARTMENT OF ENERGY OFFICE OF ENERGY EFFICIENCY & RENEWABLE ENERGY
0%
5%
10%
15%
20%
25%
30%
35%
40%
45%
50%
Denm
ark
Port
ugal
Irela
nd
Spai
n
Ger
man
y
Rom
ania
U.K
.
Swed
en
Aust
ria
Net
herla
nds
Pola
nd
Turk
ey
Uni
ted
Stat
es
Italy
Cana
da
Fran
ce
Aust
ralia
Braz
il
Indi
a
Chin
a
Mex
ico
Japa
n
GLO
BAL
Approximate Incremental Wind Penetration, end of 2016
Approximate Cumulative Wind Penetration, end of 2015
Estim
ated
Win
d Ge
nera
tion
as a
Prop
ortio
n of
Ele
ctric
ity C
onsu
mpt
ion
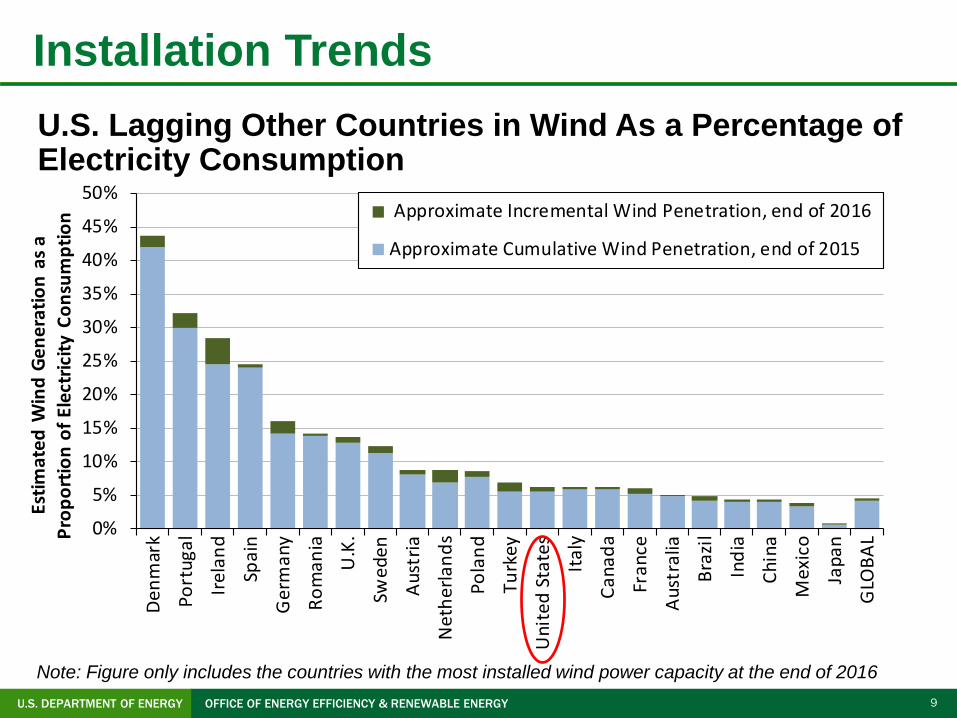
U.S. Lagging Other Countries in Wind As a Percentage of Electricity Consumption
Note: Figure only includes the countries with the most installed wind power capacity at the end of 2016
Installation Trends

10U.S. DEPARTMENT OF ENERGY OFFICE OF ENERGY EFFICIENCY & RENEWABLE ENERGY
Geographic Spread of Wind Projects in the United States Is Reasonably Broad
Note: Numbers within states represent cumulative installed wind capacity and, in brackets, annual additions in 2016
Installation Trends

11U.S. DEPARTMENT OF ENERGY OFFICE OF ENERGY EFFICIENCY & RENEWABLE ENERGY
Texas Installed the Most Wind Capacity in 2016; 14 States >10% Wind Energy
• Texas had almost 3 times as much wind capacity as the next-highest state
• 26 states had > 500 MW of capacity at end of 2016 (18 > 1 GW, 10 > 3 GW)
• IA = 37% of total in-state generation from wind; SD = 30%, KS = 30%; 14 states > 10%)
Installed Capacity (MW) Percentage of In-State Generation
Annual (2016) Cumulative (end of 2016) Actual (2016)* Texas 2,611 Texas 20,320 Iowa 36.6% Oklahoma 1,462 Iowa 6,911 South Dakota 30.3% Iowa 707 Oklahoma 6,645 Kansas 29.6% Kansas 687 California 5,656 Oklahoma 25.1% North Dakota 603 Kansas 4,451 North Dakota 21.5% Nebraska 438 Illinois 4,026 Minnesota 17.7% Minnesota 291 Minnesota 3,499 Colorado 17.3% Maine 288 Oregon 3,163 Vermont 15.4% Missouri 201 Washington 3,075 Idaho 15.2% Illinois 184 Colorado 3,026 Maine 13.9% West Virginia 103 North Dakota 2,746 Texas 12.6% Ohio 102 Indiana 1,897 Oregon 12.1% Michigan 80 New York 1,827 New Mexico 10.9% Wyoming 80 Michigan 1,611 Nebraska 10.1% New York 78 Wyoming 1,489 Wyoming 9.4% Utah 64 Pennsylvania 1,369 Montana 7.6% Colorado 61 Nebraska 1,328 Washington 7.1% Rhode Island 45 New Mexico 1,112 California 6.9% Pennsylvania 40 South Dakota 977 Hawaii 6.7% New Mexico 32 Idaho 973 Illinois 5.7% Rest of U.S. 48 Rest of U.S. 6,041 Rest of U.S. 1.0% TOTAL 8,203 TOTAL 82,143 TOTAL 5.6%
* Based on 2016 wind and total generation by state from EIA’s Electric Power Monthly.
Installation Trends

12U.S. DEPARTMENT OF ENERGY OFFICE OF ENERGY EFFICIENCY & RENEWABLE ENERGY
0
20
40
60
80
100
120
140
160
Wind Natural Gas Solar Storage Other Nuclear Coal
Nam
epla
te C
apac
ity (G
W)
Entered queue in 2016 Total in queue at end of 2016
Interconnection Queues Demonstrate that a Substantial Amount of Wind Is Under Consideration
• Wind = 34% of capacity in sampled 35 queues
• Wind additions in 2016 = largest amount since 2009
Note: Not all of this capacity will be built
• AWEA reports 21 GW of capacity under construction or in advanced development at end of 1Q2017
Installation Trends

13U.S. DEPARTMENT OF ENERGY OFFICE OF ENERGY EFFICIENCY & RENEWABLE ENERGY
0
5
10
15
20
25
30
35
40
MISO /Midwest
SPP ERCOT Mountain Northwest PJM ISO-NewEngland
New YorkISO
California Southeast
Nam
epla
te W
ind
Pow
er C
apac
ity (G
W) Entered queue in 2016 Total in queue at end of 2016
Larger Amounts of Wind Planned for Midwest, Southwest Power Pool, Texas
Note: Not all of this capacity will be built
Installation Trends

14U.S. DEPARTMENT OF ENERGY OFFICE OF ENERGY EFFICIENCY & RENEWABLE ENERGY
Industry Trends

15U.S. DEPARTMENT OF ENERGY OFFICE OF ENERGY EFFICIENCY & RENEWABLE ENERGY
Vestas and GE Captured 85% of the U.S. Market in 2016
• Globally, Vestas, GE, and Goldwind were the top suppliers • Chinese suppliers occupied 4 of the top 10 spots in the global ranking,
based almost entirely on sales within their domestic market
0
2
4
6
8
10
12
14
16
18
20
0%
10%
20%
30%
40%
50%
60%
70%
80%
90%
100%
2005 2006 2007 2008 2009 2010 2011 2012 2013 2014 2015 2016
Turb
ine
OEM
US
Mar
ket S
hare
by
MW
Other REpower Acciona Clipper Suzlon Mitsubishi Goldwind Vensys Nordex Gamesa Siemens GE Wind Vestas
# of
OEM
s Ser
ving
>1%
of Y
early
Mar
ket
# of OEMs (right scale)
Industry Trends

16U.S. DEPARTMENT OF ENERGY OFFICE OF ENERGY EFFICIENCY & RENEWABLE ENERGY
Manufacturing Supply Chain Continued to Adjust to Swings in Domestic Demand
Note: map not intended to be exhaustive
• Continued near-term expected growth, but strong competitive pressures and possible reduced demand as PTC is phased down
• 3 domestic manufacturing facility closures in 2016; 2 new openings
• Many manufacturers remain, and “Big 3” OEMs all have at least one facility
• Wind related jobs increased 32% from 2015, to 102,000
Industry Trends

17U.S. DEPARTMENT OF ENERGY OFFICE OF ENERGY EFFICIENCY & RENEWABLE ENERGY
Domestic Manufacturing Capability for Nacelle Assembly, Towers, and Blades Is Reasonably Well Balanced Against Near-Term Demand Forecasts
Industry Trends

18U.S. DEPARTMENT OF ENERGY OFFICE OF ENERGY EFFICIENCY & RENEWABLE ENERGY
Turbine OEM Profitability Has Generally Rebounded Over the Last Four Years
Industry Trends

19U.S. DEPARTMENT OF ENERGY OFFICE OF ENERGY EFFICIENCY & RENEWABLE ENERGY
Imports of Wind Equipment Are Sizable; Exports Continued to Decline in 2016
Notes: Figure only includes tracked trade categories; misses other wind-related imports; see full report for the assumptions used to generate this figure
Industry Trends
• U.S. is a net importer of wind equipment
• Exports of wind-powered generating sets decreased to just $17 million in 2016; no ability to track other wind-specific exports, but total ‘tower and lattice mast’ exports equalled $46 million

20U.S. DEPARTMENT OF ENERGY OFFICE OF ENERGY EFFICIENCY & RENEWABLE ENERGY
Tracked Wind Equipment Imports in 2016: 46% Asia, 40% Europe, 14% Americas
Industry Trends
Note: Tracked wind-specific equipment includes: wind-powered generating sets, towers, hubs and blades, wind generators and parts

21U.S. DEPARTMENT OF ENERGY OFFICE OF ENERGY EFFICIENCY & RENEWABLE ENERGY
Source Markets for Imports Vary Over Time, and By Type of Wind Equipment
• Majority of imports of wind-powered generating sets from home countries of OEMs, dominated by Europe
• Significant imports of towers from Asia, but some decline over time as tariff measures affected imports from China and Vietnam
• Majority of imports of blades & hubs from China, Brazil, Europe
• Globally diverse sourcing strategy for generators & parts
0%
10%
20%
30%
40%
50%
60%
70%
80%
90%
100%
20050.6B
20061.4B
20072.8B
20082.8B
20092.6B
20101.3B
20111.3B
20121B
20130.02B
20140.3B
20150.2B
20160.1B
Expo
rtin
g Co
untr
y (%
of a
nnua
l im
port
s)
Annual Imports
Wind-powered Generating SetsCanada
China
Denmark
Spain
20120.9B
20130.3B
20140.5B
20150.8B
20160.9B
Blades & Hubs
SpainDenmarkItaly
Brazil
China
0%
10%
20%
30%
40%
50%
60%
70%
80%
90%
100%
20110.5B
20120.9B
20130.1B
20140.2B
20150.3B
20160.3B
Spain
Canada
Vietnam
S. Korea
Indonesia
Towers
20120.5B
20130.2B
20140.3B
20150.4B
20160.3B
Mexico
Germany
Serbia
Vietnam
China
Generators & Parts
Industry Trends

22U.S. DEPARTMENT OF ENERGY OFFICE OF ENERGY EFFICIENCY & RENEWABLE ENERGY
Domestic Manufacturing Content Is Strong for Nacelle Assembly, Towers, and Blades, but U.S. Is Highly Reliant on Imports for Equipment Internal to the Nacelle
• Imports occur in untracked trade categories, including many nacelle internals; nacelle internals generally have domestic content of < 20%
Domestic Content for 2016 Turbine Installations in the U.S. Towers Blades & Hubs Nacelle Assembly
65-80% 50-70% > 90% of nacelle assembly
Industry Trends

23U.S. DEPARTMENT OF ENERGY OFFICE OF ENERGY EFFICIENCY & RENEWABLE ENERGY
The Project Finance Environment Remained Strong in 2016
• Sponsors raised $6.4 billion of tax equity and $3.4 billion of debt in 2016• Tax equity yields drifted slightly higher, as did debt interest rates late in
the year—albeit from a particularly low starting point early in 2016
0%
2%
4%
6%
8%
10%
12%
Jan-
05Ju
l-05
Jan-
06Ju
l-06
Jan-
07Ju
l-07
Jan-
08Ju
l-08
Jan-
09Ju
l-09
Jan-
10Ju
l-10
Jan-
11Ju
l-11
Jan-
12Ju
l-12
Jan-
13Ju
l-13
Jan-
14Ju
l-14
Jan-
15Ju
l-15
Jan-
16Ju
l-16
Jan-
17
Tax Equity Yield (after-tax)
15-Year Debt Interest Rate (after-tax)
15-Year Debt Interest Rate (pre-tax)
Industry Trends

24U.S. DEPARTMENT OF ENERGY OFFICE OF ENERGY EFFICIENCY & RENEWABLE ENERGY
IPPs Own the Majority of Wind Assets Built in 2016
0%
10%
20%
30%
40%
50%
60%
70%
80%
90%
100%
0%
10%
20%
30%
40%
50%
60%
70%
80%
90%
100%
1998
1999
2000
2001
2002
2003
2004
2005
2006
2007
2008
2009
2010
2011
2012
2013
2014
2015
2016
Other
Publicly Owned Utility (POU)
Investor-Owned Utility (IOU)
Independent Power Producer (IPP)% o
f Cum
ulat
ive
Inst
alle
d Ca
paci
ty
Other:43 MW (0.5%)
IPP:7,142 MW (87%)
IOU:1,017 MW
(12%)
2016 Capacity byOwner Type
Industry Trends

25U.S. DEPARTMENT OF ENERGY OFFICE OF ENERGY EFFICIENCY & RENEWABLE ENERGY
Long-Term Sales to Utilities Remained the Most Common Off-Take Arrangement, but Direct Retail Sales Gained Ground
• 24% of added wind capacity in 2016 are from direct retail sales; 39% of total wind capacity contracted through PPAs in 2016 involve non-utility buyers
0%
10%
20%
30%
40%
50%
60%
70%
80%
90%
100%
0%
10%
20%
30%
40%
50%
60%
70%
80%
90%
100%
1998
1999
2000
2001
2002
2003
2004
2005
2006
2007
2008
2009
2010
2011
2012
2013
2014
2015
2016
Merchant/Quasi-Merchant On-Site Direct Retail Power Marketer POU IOU
% o
f Cum
ulat
ive
Inst
alle
d Ca
paci
ty
IOU:2,283 MW
(28%)
POU:2,014 MW
(25%)
Direct Retail2,005 MW
(24%)
Merchant:1,816 MW
(22%)
Power Marketer81 MW (1%)
2016 Capacity byOff-Take Category
Industry Trends

26U.S. DEPARTMENT OF ENERGY OFFICE OF ENERGY EFFICIENCY & RENEWABLE ENERGY
Technology Trends

27U.S. DEPARTMENT OF ENERGY OFFICE OF ENERGY EFFICIENCY & RENEWABLE ENERGY
Turbine Nameplate Capacity, Hub Height, and Rotor Diameter Have All Increased Significantly Over the Long Term
0
10
20
30
40
50
60
70
80
90
100
110
0.0
0.2
0.4
0.6
0.8
1.0
1.2
1.4
1.6
1.8
2.0
2.2
1998-99
2000-01
2002-03
2004-05
2006 2007 2008 2009 2010 2011 2012 2013 2014 2015 2016
Commercial Operation Year
Average Nameplate Capacity (left scale)Average Rotor Diameter (right scale)Average Hub Height (right scale)Av
erag
e N
amep
late
Cap
acity
(MW
)
Aver
age
Hub
Heig
ht &
Rot
or D
iam
eter
(m)
Technology Trends

28U.S. DEPARTMENT OF ENERGY OFFICE OF ENERGY EFFICIENCY & RENEWABLE ENERGY
Growth in Rotor Diameter Has Outpaced Growth in Nameplate Capacity and Hub Height in Recent Years
Nameplate Capacity
Hub Height
Rotor Diameter
0102030405060708090100110120
0%
10%
20%
30%
40%
50%
60%
70%
80%
90%
100%
1998-99
2000-01
2002-03
2004-05
2006 2007 2008 2009 2010 2011 2012 2013 2014 2015 2016
Ave
rage
Rot
or D
iam
eter
(m
eter
s)
Turb
ine
Roto
r D
iam
eter
(%
of t
otal
tur
bine
s fo
r yea
r)
Commercial Operation Year
≥120 m110 - 120 m100 - 110 m90 - 100 m80 - 90 m70 - 80 m<70 mAverage
0.00.20.40.60.81.01.21.41.61.82.02.22.4
0%
10%
20%
30%
40%
50%
60%
70%
80%
90%
100%
1998-99
2000-01
2002-03
2004-05
2006 2007 2008 2009 2010 2011 2012 2013 2014 2015 2016
Aver
age
Nam
epla
te C
apac
ity (M
W)
Turb
ine
Nam
epla
te C
apac
ity(%
of t
otal
turb
ines
for y
ear)
Commercial Operation Year
≥ 3.0 MW2.5 - 3.0 MW2.0 - 2.5 MW1.5 - 2.0 MW1.0 - 1.5 MW<1.0 MWAverage
0
10
20
30
40
50
60
70
80
90
100
0%
10%
20%
30%
40%
50%
60%
70%
80%
90%
100%
1998-99
2000-01
2002-03
2004-05
2006 2007 2008 2009 2010 2011 2012 2013 2014 2015 2016
Aver
age
Hub
Hei
ght (
met
ers)
Turb
ine
Hub
Heig
ht
(% o
f tot
al tu
rbin
es fo
r yea
r)
Commercial Operation Year
≥100 m90 - 100 m80 - 90 m70 - 80 m<70 m
Technology Trends
29U.S. DEPARTMENT OF ENERGY OFFICE OF ENERGY EFFICIENCY & RENEWABLE ENERGY
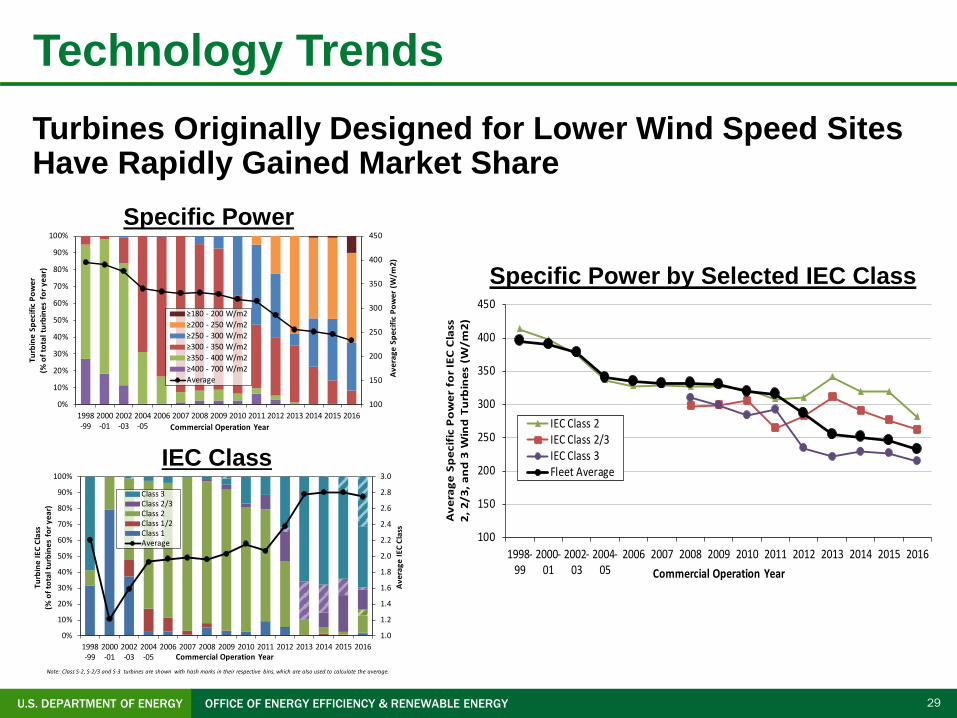
Turbines Originally Designed for Lower Wind Speed Sites Have Rapidly Gained Market Share
Specific Power
IEC Class
Specific Power by Selected IEC Class
100
150
200
250
300
350
400
450
0%
10%
20%
30%
40%
50%
60%
70%
80%
90%
100%
1998-99
2000-01
2002-03
2004-05
2006 2007 2008 2009 2010 2011 2012 2013 2014 2015 2016
Ave
rage
Spe
cific
Pow
er (
W/m
2)
Turb
ine
Spec
ific
Pow
er
(% o
f tot
al t
urbi
nes
for y
ear)
Commercial Operation Year
≥180 - 200 W/m2≥200 - 250 W/m2≥250 - 300 W/m2≥300 - 350 W/m2≥350 - 400 W/m2≥400 - 700 W/m2Average
1.0
1.2
1.4
1.6
1.8
2.0
2.2
2.4
2.6
2.8
3.0
0%
10%
20%
30%
40%
50%
60%
70%
80%
90%
100%
1998-99
2000-01
2002-03
2004-05
2006 2007 2008 2009 2010 2011 2012 2013 2014 2015 2016
Ave
rage
IEC
Clas
s
Turb
ine
IEC
Clas
s(%
of t
otal
tur
bine
s fo
r yea
r)
Commercial Operation Year
Class 3Class 2/3Class 2Class 1/2Class 1Average
Note: Class S-2, S-2/3 and S-3 turbines are shown with hash marks in their respective bins, which are also used to calculate the average.
100
150
200
250
300
350
400
450
1998-99
2000-01
2002-03
2004-05
2006 2007 2008 2009 2010 2011 2012 2013 2014 2015 2016
Ave
rage
Sp
ecif
ic P
ow
er f
or
IEC
Cla
ss
2, 2
/3, a
nd
3 W
ind
Tu
rbin
es (
W/m
2)
Commercial Operation Year
IEC Class 2IEC Class 2/3IEC Class 3Fleet Average
Technology Trends

30U.S. DEPARTMENT OF ENERGY OFFICE OF ENERGY EFFICIENCY & RENEWABLE ENERGY
Turbines Originally Designed for Lower Wind Speeds Regularly Used in Lower & Higher Wind Sites; Taller Towers Mostly in Great Lakes and Northeast
By Region By Wind Resource Quality
Technology Trends

31U.S. DEPARTMENT OF ENERGY OFFICE OF ENERGY EFFICIENCY & RENEWABLE ENERGY
Pending & Proposed Projects Continue Trend of Even-Taller Turbines as Lower Wind Sites Appear to Be Targeted
75
80
85
90
95
100
0
20
40
60
80
100
120
140
160
1998
-99
2000
-01
2002
-03
2004
-05
2006
2007
2008
2009
2010
2011
2012
2013
2014
2015
2016
Pend
ing
Prop
osed
Win
d Re
sour
ce Q
ualit
y at
80
met
ers
(199
8-99
= 1
00)
Tota
l Tur
bine
Hei
ght (
met
ers)
Commercial Operation Year
Wind Resource QualityTurbine Height (actual)Turbine Height (FAA)
Technology Trends

32U.S. DEPARTMENT OF ENERGY OFFICE OF ENERGY EFFICIENCY & RENEWABLE ENERGY
A Large Number of Projects in 2016 Employed Multiple Turbine Configurations from a Single OEM
Note: Turbine configuration = unique combination of hub height, rotor diameter, and/or capacities
Technology Trends

33U.S. DEPARTMENT OF ENERGY OFFICE OF ENERGY EFFICIENCY & RENEWABLE ENERGY
Performance Trends

34U.S. DEPARTMENT OF ENERGY OFFICE OF ENERGY EFFICIENCY & RENEWABLE ENERGY
Sample-Wide Capacity Factors Have Increased, but Impacted by Curtailment and Inter-Year Wind Resource Variability
Note: The wind resource index is compiled from NextEra Energy Resources reports
0%
20%
40%
60%
80%
100%
120%
0%
6%
12%
18%
24%
30%
36%
2000100.6
2001300.9
2002732.7
2003843.1
20041064.5
20051295.1
20061538.0
200719610.0
200824014.9
200933923.6
201045233.4
201151538.6
201260044.7
201374558.2
201476059.4
201580764.4
201667571.5
Capacity Factor Based on Estimated Generation (if no curtailment) Capacity Factor Based on Actual Generation (with curtailment) Index of Inter-Annual Variability in Wind Generation (right scale)
# GW:# Projects:
Year:
Aver
age
Capa
city
Fac
tor i
n Ca
lend
ar Y
ear
Inde
x of
Inte
r-An
nual
Varia
bilit
y in
Win
d G
ener
atio
n
Performance Trends
35U.S. DEPARTMENT OF ENERGY OFFICE OF ENERGY EFFICIENCY & RENEWABLE ENERGY
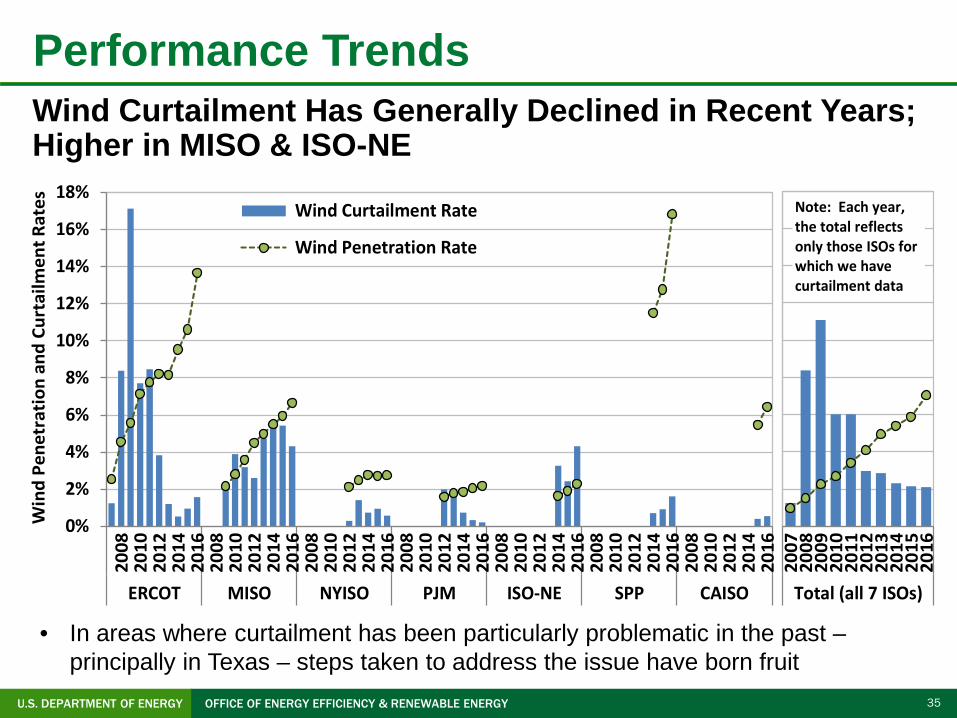
Wind Curtailment Has Generally Declined in Recent Years; Higher in MISO & ISO-NE
• In areas where curtailment has been particularly problematic in the past –principally in Texas – steps taken to address the issue have born fruit
0%
2%
4%
6%
8%
10%
12%
14%
16%
18%
2008
2010
2012
2014
2016
2008
2010
2012
2014
2016
2008
2010
2012
2014
2016
2008
2010
2012
2014
2016
2008
2010
2012
2014
2016
2008
2010
2012
2014
2016
2008
2010
2012
2014
2016
ERCOT MISO NYISO PJM ISO-NE SPP CAISO
Wind Curtailment Rate
Wind Penetration Rate
Win
d Pe
netr
atio
nan
d Cu
rtai
lmen
t Rat
es
2007
2008
2009
2010
2011
2012
2013
2014
2015
2016
Total (all 7 ISOs)
Note: Each year, the total reflects only those ISOs for which we have curtailment data
Performance Trends

36U.S. DEPARTMENT OF ENERGY OFFICE OF ENERGY EFFICIENCY & RENEWABLE ENERGY
Impact of Technology Trends on Capacity Factors Becomes More Apparent When Parsed by Project Vintage
0%
10%
20%
30%
40%
50%
60%
'98-9923
894
'00-0126
1,750
'02-0334
1,979
'04-0527
3,634
200620
1,738
200737
5,282
200879
8,498
200996
9,578
201047
4,632
201169
5,904
2012121
13,672
20138
969
201435
4,917
201553
8,063
Weighted Average (by project vintage) Individual Project (by project vintage)
Capa
city
Fac
tor i
n 20
16 (b
y pr
ojec
t vin
tage
)
Sample includes 675 projects totaling 71.5 GW
Vintage:# projects:
# MW:
Performance Trends

37U.S. DEPARTMENT OF ENERGY OFFICE OF ENERGY EFFICIENCY & RENEWABLE ENERGY
Trends Explained by Competing Influence of Lower Specific Power and Higher Hub Heights vs. Build-Out of Lower Quality Wind Resource Sites through 2012
• Reversal of build-out in lower wind speed sites in 2013-2016
80
90
100
110
120
130
140
150
160
170
180
0%
5%
10%
15%
20%
25%
30%
35%
40%
45%
50%
1998-99
2000-01
2002-03
2004-05
2006 2007 2008 2009 2010 2011 2012 2013 2014 2015 2016
Aver
age
Capa
city
Fac
tor i
n 20
16
Project Vintage
Weighted-Average Capacity Factor in 2016 (left scale) Index of the Inverse of Built Specific Power (right scale) Index of Built Turbine Hub Height (right scale) Index of Built Wind Resource Quality at 80m (right scale)
Inde
xof
Cap
acity
Fac
tor I
nflu
ence
s (19
98-9
9=10
0)
Performance Trends

38U.S. DEPARTMENT OF ENERGY OFFICE OF ENERGY EFFICIENCY & RENEWABLE ENERGY
Controlling for Wind Resource Quality and Specific Power Demonstrates Impact of Turbine Evolution
• Turbine design changes are driving capacity factors higher for projects located in given wind resource regimes
0%
5%
10%
15%
20%
25%
30%
35%
40%
45%
50%
Lower188 projects
14.1 GW
Medium122 projects
15.9 GW
Higher170 projects
22.0 GW
Highest174 projects
19.1 GWEstimated Wind Resource Quality at Site
Specific Power ≥ 400 (30 projects, 3.0 GW) Specific Power range of 350-400 (86 projects, 7.1 GW) Specific Power range of 300-350 (323 projects, 36.3 GW) Specific Power range of 250-300 (142 projects, 15.4 GW) Specific Power < 250 (73 projects, 9.4 GW)
Sample includes 654 projects totaling 71.1 GW with a commercial operation date of 1998-2015
Aver
age
Capa
city
Fac
tor i
n 20
16Performance Trends

39U.S. DEPARTMENT OF ENERGY OFFICE OF ENERGY EFFICIENCY & RENEWABLE ENERGY
Controlling for Wind Resource Quality and Commercial Operation Date Also Illustrates Impact of Turbine Evolution
0%
5%
10%
15%
20%
25%
30%
35%
40%
45%
50%
1998-99
2000-01
2002-03
2004-05
2006 2007 2008 2009 2010 2011 2012 2013 2014 2015Project Vintage
Highest Wind Resource Quality Higher Wind Resource Quality Medium Wind Resource Quality Lower Wind Resource Quality
Aver
age
Capa
city
Fac
tor i
n 20
16Performance Trends

40U.S. DEPARTMENT OF ENERGY OFFICE OF ENERGY EFFICIENCY & RENEWABLE ENERGY
Change in Performance as Projects Age Also Impacts Overall Trends
Note: See full report for caveats associated with this figure
60%
70%
80%
90%
100%
110%
120%
130%
140%
1 2 3 4 5 6 7 8 9 10 11 12 13 14 15 16 17
71.9 63.7 58.7 57.7 44.0 37.9 33.2 23.5 15.1 9.7 8.0 4.9 4.3 2.8 2.3 0.6 0.6
819 754 715 681 545 462 400 282 200 141 118 91 83 61 36 12 9
Median (with 10th/90th percentile error bars) Capacity-Weighted Average
Years post-COD:
Sample GW:
Sample projects:
Inde
xed
Capa
city
Fac
tor (
Year
1=1
00%
)
Sample includes projects with COD from 1998-2015
Performance Trends
41U.S. DEPARTMENT OF ENERGY OFFICE OF ENERGY EFFICIENCY & RENEWABLE ENERGY
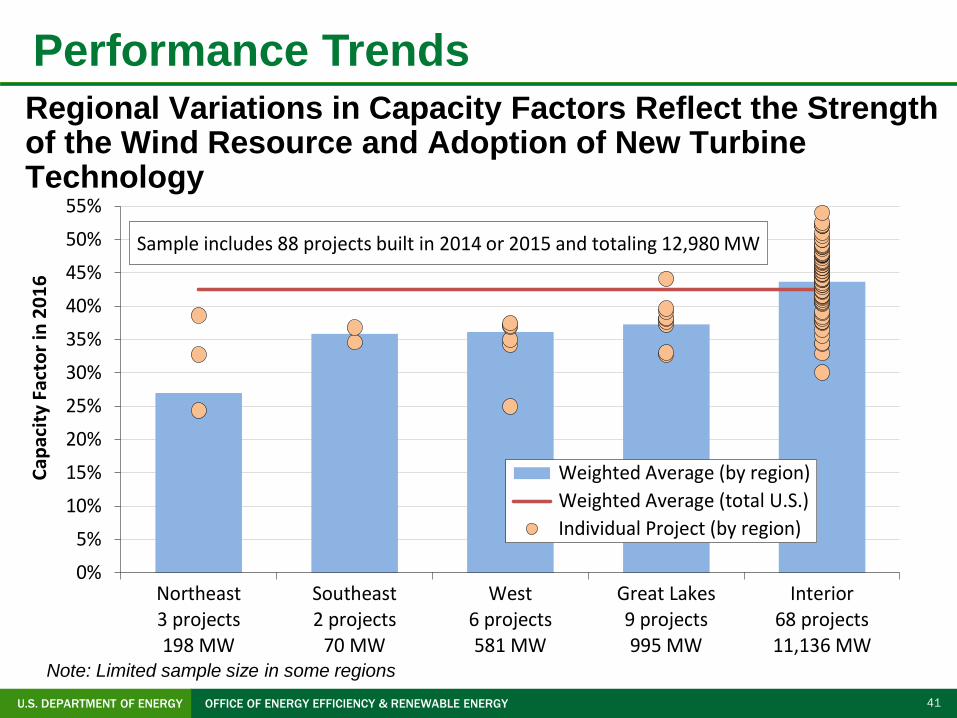
Regional Variations in Capacity Factors Reflect the Strength of the Wind Resource and Adoption of New Turbine Technology
Note: Limited sample size in some regions
0%5%
10%15%20%25%30%35%40%45%50%55%
Northeast3 projects198 MW
Southeast2 projects
70 MW
West6 projects581 MW
Great Lakes9 projects995 MW
Interior68 projects11,136 MW
Weighted Average (by region) Weighted Average (total U.S.) Individual Project (by region)
Capa
city
Fac
tor i
n 20
16
Sample includes 88 projects built in 2014 or 2015 and totaling 12,980 MW
Performance Trends
42U.S. DEPARTMENT OF ENERGY OFFICE OF ENERGY EFFICIENCY & RENEWABLE ENERGY
Cost Trends

43U.S. DEPARTMENT OF ENERGY OFFICE OF ENERGY EFFICIENCY & RENEWABLE ENERGY
Wind Turbine Prices Remained Well Below the Levels Seen Several Years Ago
• Recent turbine orders in the range of $800-1,100/kW
0200400600800
1,0001,2001,4001,6001,8002,0002,2002,4002,600
Jan-
97
Jan-
98
Jan-
99
Jan-
00
Jan-
01
Jan-
02
Jan-
03
Jan-
04
Jan-
05
Jan-
06
Jan-
07
Jan-
08
Jan-
09
Jan-
10
Jan-
11
Jan-
12
Jan-
13
Jan-
14
Jan-
15
Jan-
16
Jan-
17
Announcement Date
U.S. Orders <5 MWU.S. Orders from 5 - 100 MWU.S. Orders >100 MWVestas Global AverageBNEF Global IndexMAKE U.S. IndexTrend Line for U.S. Orders
Turb
ine
Tran
sact
ion
Pric
e (2
016$
/kW
)Cost Trends

44U.S. DEPARTMENT OF ENERGY OFFICE OF ENERGY EFFICIENCY & RENEWABLE ENERGY
Lower Turbine Prices Drive Reductions in Reported Installed Project Costs
• 2016 projects had an average cost of $1,590/kW, down $780/kW since 2009 and 2010; limited sample of under-construction projects slated for completion in 2017 suggest no material change in costs
0
1,000
2,000
3,000
4,000
5,000
6,000
1982
1983
1984
1985
1986
1987
1988
1989
1990
1991
1992
1993
1994
1995
1996
1997
1998
1999
2000
2001
2002
2003
2004
2005
2006
2007
2008
2009
2010
2011
2012
2013
2014
2015
2016
Inst
alle
d Pr
ojec
t Cos
t (20
16 $
/kW
)
Commercial Operation Date
Interior (474 projects, 45,619 MW) West (175 projects, 12,380 MW) Great Lakes (98 projects, 7,513 MW) Northeast (118 projects, 4,479 MW) Southeast (15 projects, 907 MW) Capacity-Weighted Avg. Project Cost
Cost Trends

45U.S. DEPARTMENT OF ENERGY OFFICE OF ENERGY EFFICIENCY & RENEWABLE ENERGY
Economies of Scale, Especially at Lower End of Project Size Range
Project Size
Turbine Size
0
500
1,000
1,500
2,000
2,500
3,000
3,500
4,000
4,500
≤5 MW11 MW
7 projects
5-20 MW9 MW
1 project
20-50 MW119 MW
3 projects
50-100 MW790 MW
11 projects
100-200 MW2,974 MW19 projects
>200 MW3,232 MW13 projects
Inst
alle
d Pr
ojec
t Cos
t (20
16 $
/kW
) Capacity-Weighted Average Project Cost
Individual Project Cost
Project size:# MW:
# projects:
0
500
1,000
1,500
2,000
2,500
3,000
3,500
4,000
4,500
≥1 & <2 MW1,133 MW17 projects
≥2 & <3 MW5,132 MW31 projects
≥3 MW870 MW
6 projects
Inst
alle
d Pr
ojec
t Cos
t (20
16 $/
kW)
Capacity-Weighted Average Project Cost Individual Project Cost
Turbine size:# MW:
# projects:
Cost Trends

46U.S. DEPARTMENT OF ENERGY OFFICE OF ENERGY EFFICIENCY & RENEWABLE ENERGY
Regional Differences in Average Wind Power Project Costs Are Apparent, but Sample Size Is Limited
0
500
1,000
1,500
2,000
2,500
3,000
3,500
4,000
4,500
Interior38 projects6,321 MW
Great Lakes3 projects237 MW
Southeast1 project103 MW
West2 projects
64 MW
Northeast10 projects
411 MW
Inst
alle
d Pr
ojec
t Cos
t (20
16 $
/kW
)
Capacity-Weighted Average Project Cost Individual Project Cost Capacity-Weighted Average Cost, Total U.S.
Cost Trends

47U.S. DEPARTMENT OF ENERGY OFFICE OF ENERGY EFFICIENCY & RENEWABLE ENERGY
Most 2016 Projects—and All of the Low-Cost Projects—Are Located in the Interior; Other Regions Have Higher Costs
0
2
4
6
8
10
12
1200
1500
1800
2100
2400
2700
3000
3300
3600
3900
4200
Num
ber o
f Pro
ject
s
CapEx ≥ (2016 $/kW)
Southeast
Northeast
Great Lakes
West
Interior
0
200
400
600
800
1000
1200
1400
1600
1800
1200
1500
1800
2100
2400
2700
3000
3300
3600
3900
4200
Num
ber o
f MW
CapEx ≥ (2016 $/kW)
Southeast
Northeast
Great Lakes
West
Interior
Cost Trends
48U.S. DEPARTMENT OF ENERGY OFFICE OF ENERGY EFFICIENCY & RENEWABLE ENERGY
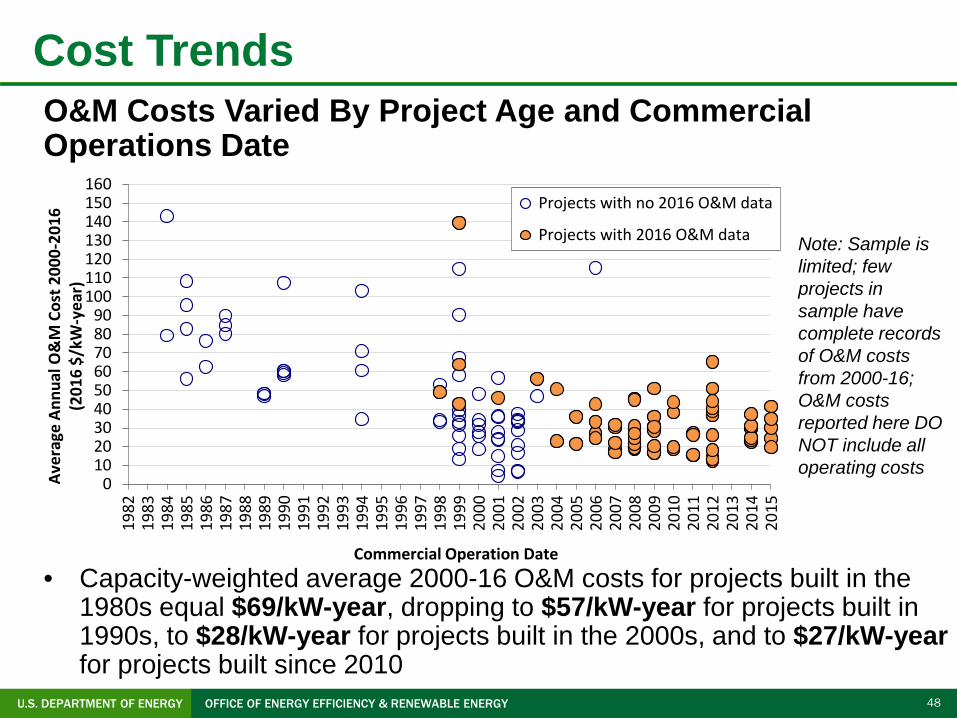
O&M Costs Varied By Project Age and Commercial Operations Date
• Capacity-weighted average 2000-16 O&M costs for projects built in the 1980s equal $69/kW-year, dropping to $57/kW-year for projects built in 1990s, to $28/kW-year for projects built in the 2000s, and to $27/kW-year for projects built since 2010
0102030405060708090
100110120130140150160
1982
1983
1984
1985
1986
1987
1988
1989
1990
1991
1992
1993
1994
1995
1996
1997
1998
1999
2000
2001
2002
2003
2004
2005
2006
2007
2008
2009
2010
2011
2012
2013
2014
2015
Commercial Operation Date
Projects with no 2016 O&M data
Projects with 2016 O&M data
Aver
age
Annu
al O
&M
Cos
t 200
0-20
16
(201
6 $/
kW-y
ear)
Cost Trends
Note: Sample is limited; few projects in sample have complete records of O&M costs from 2000-16; O&M costs reported here DO NOT include all operating costs

49U.S. DEPARTMENT OF ENERGY OFFICE OF ENERGY EFFICIENCY & RENEWABLE ENERGY
O&M Costs Varied By Project Age and Commercial Operations Date
Note: Sample size is limited
• O&M reported in figure does not include all operating costs: Statements from public companies with large U.S. wind portfolios report total operating costs in 2016 for projects built in the 2000s of ~$55/kW-year
05
1015202530354045505560657075
1 2 3 4 5 6 7 8 9 10 11 12 13 14 15Project Age (Number of Years Since Commercial Operation Date)
1998-2005
2006-2011
2012-2015
Commercial Operation Date:
n=19
Med
ian
Annu
al O
&M
Cos
t (20
16 $
/kW
-yea
r)
n=40
n=41
n=11
n=8
n=6
n=32
n=42
n=25
n=41
n=12
n=41
n=9
n=23
n=37
n=32
n=24
n=19
n=12
n=8
n=9
n=8
n=6
n=5
n=5
n=7
n=8
n=23
n=4
Cost Trends

50U.S. DEPARTMENT OF ENERGY OFFICE OF ENERGY EFFICIENCY & RENEWABLE ENERGY
Wind Power Price Trends

51U.S. DEPARTMENT OF ENERGY OFFICE OF ENERGY EFFICIENCY & RENEWABLE ENERGY
Sample of Wind Power Prices• Berkeley Lab collects data on historical wind power sales
prices, and long-term PPA prices
• PPA sample includes 414 contracts totaling 38,819 MW from projects built from 1998-2016, or planned for installation in 2017 or beyond
• Prices reflect the bundled price of electricity and RECs as sold by the project owner under a PPA– Dataset excludes merchant plants, projects that sell renewable
energy certificates (RECs) separately, and direct retail sales
– Prices reflect receipt of state and federal incentives (e.g., the PTC or Treasury grant), as well as various local policy and market influences; as a result, prices do not reflect wind energy generation costs
Wind Power Price Trends

52U.S. DEPARTMENT OF ENERGY OFFICE OF ENERGY EFFICIENCY & RENEWABLE ENERGY
Wind PPA Prices Very Low, Competitive with Levelized Fuel Cost of a Gas Plant
$0
$20
$40
$60
$80
$100
$120
Jan-
96
Jan-
97
Jan-
98
Jan-
99
Jan-
00
Jan-
01
Jan-
02
Jan-
03
Jan-
04
Jan-
05
Jan-
06
Jan-
07
Jan-
08
Jan-
09
Jan-
10
Jan-
11
Jan-
12
Jan-
13
Jan-
14
Jan-
15
Jan-
16
Jan-
17
PPA Execution Date
Interior (25,382 MW, 244 contracts) West (7,421 MW, 77 contracts) Great Lakes (4,104 MW, 51 contracts) Northeast (1,436 MW, 29 contracts) Southeast (476 MW, 7 contracts)
Leve
lized
PPA
Pric
e (2
016
$/M
Wh)
25 MW
150 MW
50 MW
200 MW
Levelized 20-year EIA gas price projections (converted at 7.5 MMBtu/MWh)
Wind Power Price Trends

53U.S. DEPARTMENT OF ENERGY OFFICE OF ENERGY EFFICIENCY & RENEWABLE ENERGY
A Smoother Look at the Time Trend Shows Steep Decline in Pricing Since 2009; Especially Low Pricing in Interior Region
$0
$10
$20
$30
$40
$50
$60
$70
$80
$90
$100
96-9910
553
00-0117
1,249
02-0324
1,382
04-0530
2,190
200631
2,436
200726
1,781
200839
3,465
200949
4,048
201049
4,790
201144
4,835
201214
1,172
201337
5,412
201417
2,015
201517
2,249
20169
1,012
20171
230
Nationwide Interior Great Lakes West Northeast
PPA Year:Contracts:
MW:
Aver
age
Leve
lized
PPA
Pric
e (2
016
$/M
Wh)
Wind Power Price Trends

54U.S. DEPARTMENT OF ENERGY OFFICE OF ENERGY EFFICIENCY & RENEWABLE ENERGY
Relative Competitiveness of Wind Power Has Been Affected by the Continued Decline in Wholesale Power Prices
• Wholesale price range reflects flat block of power across 23 pricing nodes across the U.S. (and Interior)
• Price comparison shown here is far from perfect – see full report for caveats
0
10
20
30
40
50
60
70
80
90
100
110
20039
570
200413
547
200517
1,643
200631
2,436
200726
1,781
200839
3,465
200949
4,048
201049
4,790
201144
4,835
201214
1,172
201337
5,412
201417
2,015
201517
2,249
20169
1,012
2016
$/M
Wh
Nationwide Wholesale Power Price Range (by calendar year) Interior Region Wholesale Power Price Range (by calendar year) Average Levelized Wind PPA Price with 10th/90th Percentiles (by year of PPA execution)
Year:Contracts:
MW:
Wind Power Price Trends

55U.S. DEPARTMENT OF ENERGY OFFICE OF ENERGY EFFICIENCY & RENEWABLE ENERGY
Recent Wind Prices Are Hard to Beat: Competitive with Expected Future Cost of Burning Fuel in Natural Gas Plants
• Price comparison shown here is far from perfect – see full report for caveats
0
10
20
30
40
50
60
70
80
2017
2018
2019
2020
2021
2022
2023
2024
2025
2026
2027
2028
2029
2030
2031
2032
2033
2034
2035
2036
2037
2038
2039
2040
2041
2042
2043
2044
2045
2046
2047
2048
2049
2050
2016
$/M
Wh
Generation-weighted average wind PPA price among 44 PPAs signed in 2014-2017 Median wind PPA price (and 10th/90th percentiles) among 44 PPAs signed in 2014-2017
Range of AEO17 natural gas fuel cost projectionsAEO17 reference case natural gas fuel cost projection
Wind Power Price Trends
56U.S. DEPARTMENT OF ENERGY OFFICE OF ENERGY EFFICIENCY & RENEWABLE ENERGY
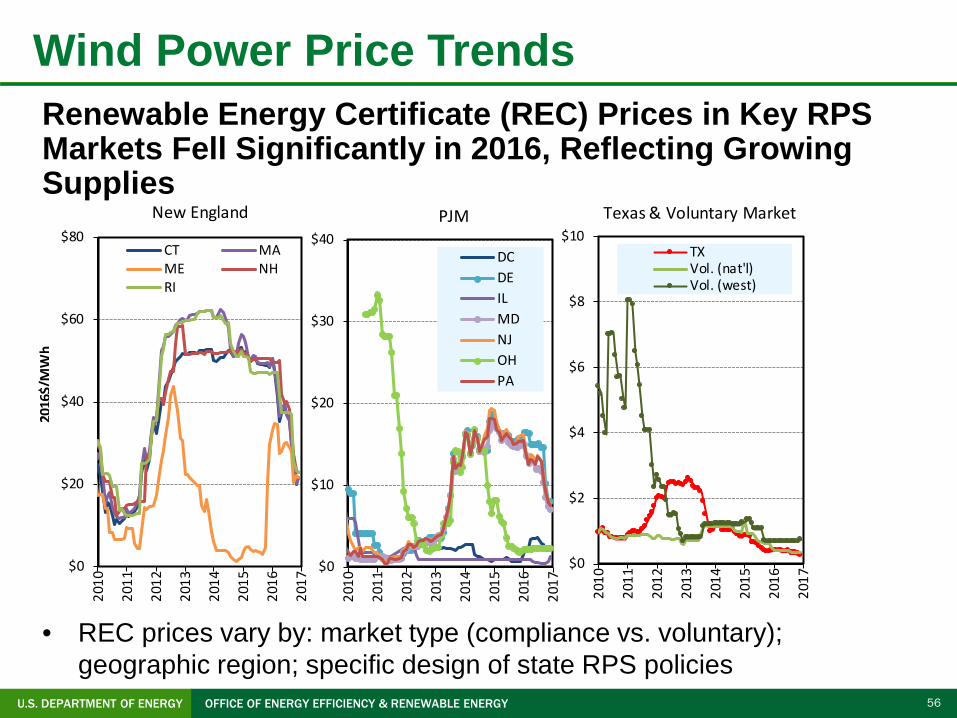
Renewable Energy Certificate (REC) Prices in Key RPS Markets Fell Significantly in 2016, Reflecting Growing Supplies
• REC prices vary by: market type (compliance vs. voluntary); geographic region; specific design of state RPS policies
$0
$10
$20
$30
$40
2010
2011
2012
2013
2014
2015
2016
2017
PJM
DCDEILMDNJOHPA
$0
$20
$40
$60
$80
2010
2011
2012
2013
2014
2015
2016
2017
New England
CT MAME NHRI
2016
$/M
Wh
$0
$2
$4
$6
$8
$10
2010
2011
2012
2013
2014
2015
2016
2017
Texas & Voluntary Market
TXVol. (nat'l)Vol. (west)
Wind Power Price Trends

57U.S. DEPARTMENT OF ENERGY OFFICE OF ENERGY EFFICIENCY & RENEWABLE ENERGY
Levelized Cost of Wind Energy Is at an All-Time Low
• Estimates only reflect variations in installed cost and capacity factors; include accelerated depreciation but exclude PTC
$0
$20
$40
$60
$80
$100
$120
98-9926
849
00-0126
1,694
02-0330
1,885
04-0529
2,005
200623
1,820
200730
3,597
200864
6,305
2009103
9,575
201063
5,129
201185
6,281
2012109
9,378
201312
852
201446
5,100
201550
7,763
Nationwide (696 projects, 62,234 MW) Interior (383 projects, 38,730 MW) Great Lakes (72 projects, 7,231 MW) West (140 projects, 11,453 MW) Northeast (88 projects, 4,017 MW) Southeast (13 projects, 802 MW)
COD Year:Projects:
MW:
Aver
age
LCO
E (2
016
$/M
Wh)
Wind Power Price Trends

58U.S. DEPARTMENT OF ENERGY OFFICE OF ENERGY EFFICIENCY & RENEWABLE ENERGY
Policy and Market Drivers

59U.S. DEPARTMENT OF ENERGY OFFICE OF ENERGY EFFICIENCY & RENEWABLE ENERGY
Federal Production Tax Credit (PTC) Remains a Core Motivator for Wind Power Deployment
• 5-year extension of PTC, plus favorable guidance allowing 4 years for project completion after the start of construction
• PTC phase-out, with progressive reduction in the value of the credit for projects starting construction after 2016
• PTC phases down in 20%-per-year increments for projects starting construction in 2017 (80% PTC value), 2018 (60%), and 2019 (40%)
Policy and Market Drivers

60U.S. DEPARTMENT OF ENERGY OFFICE OF ENERGY EFFICIENCY & RENEWABLE ENERGY
State Policies Help Direct the Location and Amount of Wind Development, but Current Policies Cannot Support Continued Growth at Recent Levels
• 29 states and D.C. have mandatory RPS programs• State RPS’ can support ~3.9 GW/yr of renewable energy additions on
average through 2030 (less for wind specifically)
WI: 10% by 2015
NV: 25% by 2025
TX: 5,880 MW by 2015
PA: 8.5% by 2020
NJ: 22.5% by 2020CT: 23% by 2020
MA: 11.1% by 2009 +1%/yr
ME: 40% by 2017
NM: 20% by 2020 (IOUs)10% by 2020 (co-ops)
CA: 50% by 2030
MN: 26.5% by 2025Xcel: 31.5% by 2020
IA: 105 MW by 1999
MD: 25% by 2020
RI: 38.5% by 2035
HI: 100% by 2045
AZ: 15% by 2025
NY: 50% by 2030
CO: 30% by 2020 (IOUs)20% by 2020 (co-ops)10% by 2020 (munis)
MT: 15% by 2015
DE: 25% by 2025
DC: 50% by 2032
WA: 15% by 2020
NH: 24.8% by 2025
OR: 50% by 2040 (large IOUs)5-25% by 2025 (other utilities)
NC: 12.5% by 2021 (IOUs)10% by 2018 (co-ops and munis)
IL: 25% by 2025
VT: 75% by 2032
MO: 15% by 2021
OH: 12.5% by 2026
MI: 15% by 2021
Policy and Market Drivers

61U.S. DEPARTMENT OF ENERGY OFFICE OF ENERGY EFFICIENCY & RENEWABLE ENERGY
System Operators Are Implementing Methods to Accommodate Increased Penetrations of Wind
Notes: Because methods vary and a consistent set of operational impacts has not been included in each study, results from the different analyses of integration costs are not fully comparable.
Integrating wind energy into power systems is manageable, but not free of additional costs
Transmission Barriers Remain
0
500
1000
1500
2000
2500
3000
3500
4000
4500
5000
2009 2010 2011 2012 2013 2014 2015 2016
Com
plet
ed T
rans
miss
ion
(mile
s/ye
ar)
≥500 kV345 kV≤ 230 kV
Policy and Market Drivers

62U.S. DEPARTMENT OF ENERGY OFFICE OF ENERGY EFFICIENCY & RENEWABLE ENERGY
Future Outlook
63U.S. DEPARTMENT OF ENERGY OFFICE OF ENERGY EFFICIENCY & RENEWABLE ENERGY
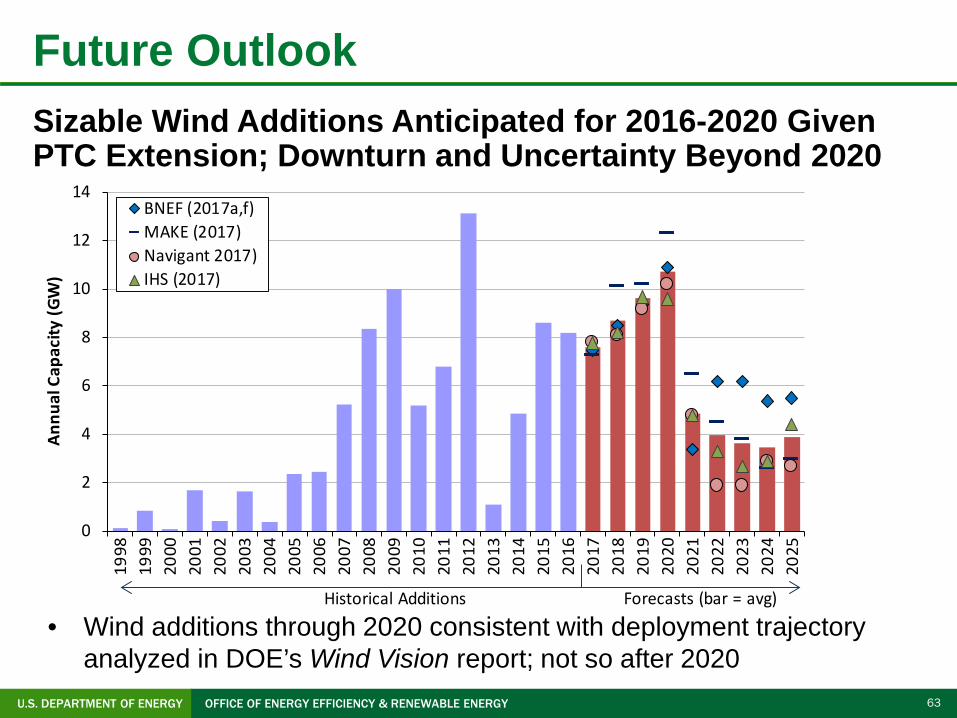
Sizable Wind Additions Anticipated for 2016-2020 Given PTC Extension; Downturn and Uncertainty Beyond 2020
• Wind additions through 2020 consistent with deployment trajectory analyzed in DOE’s Wind Vision report; not so after 2020
0
2
4
6
8
10
12
14
1998
1999
2000
2001
2002
2003
2004
2005
2006
2007
2008
2009
2010
2011
2012
2013
2014
2015
2016
2017
2018
2019
2020
2021
2022
2023
2024
2025
BNEF (2017a,f)MAKE (2017)Navigant 2017)IHS (2017)
Annu
al C
apac
ity (G
W)
Historical Additions Forecasts (bar = avg)
Future Outlook

64U.S. DEPARTMENT OF ENERGY OFFICE OF ENERGY EFFICIENCY & RENEWABLE ENERGY
Current Low Prices for Wind, Future Technological Advancement, and Direct Retail Sales May Support Higher Growth in Future, but Headwinds Include:
• Phase-down of federal tax incentives • Continued low natural gas and wholesale electricity prices• Modest electricity demand growth• Limited near-term demand from state RPS policies• Inadequate transmission infrastructure in some areas• Growing competition from solar in some regions
Future Outlook

65U.S. DEPARTMENT OF ENERGY OFFICE OF ENERGY EFFICIENCY & RENEWABLE ENERGY
• Wind capacity additions continued at a rapid pace in 2016, w/ significant additional new builds anticipated over next four years in part due to PTC
• Wind has been a significant source of new electric generation capacity additions in the U.S. in recent years
• Supply chain continued to adjust to swings in domestic demand, but domestic content for nacelle assembly, towers, and blades is strong
• Turbine scaling is significantly boosting wind project performance, while the installed cost of wind projects has declined
• Wind power sales prices are at all-time lows, enabling economic competitiveness despite low natural gas prices
• Growth beyond current PTC cycle remains uncertain: could be blunted by declining federal tax support, expectations for low natural gas prices and solar costs, and modest electricity demand growth
Conclusions
66U.S. DEPARTMENT OF ENERGY OFFICE OF ENERGY EFFICIENCY & RENEWABLE ENERGY
For More Information
See full report for additional findings, a discussion of the sources of data used, etc.:
• https://energy.gov/eere/wind/downloads/2016-wind-technologies-market-report
To contact the primary authors:• Ryan Wiser, Lawrence Berkeley National Laboratory
510-486-5474, [email protected]• Mark Bolinger, Lawrence Berkeley National Laboratory
603-795-4937, [email protected]
Berkeley Lab’s contributions to this report were funded by the Wind Energy Technologies Office, Office of Energy Efficiency and Renewable Energy of the U.S. Department of Energy under Contract No. DE-AC02-05CH11231. The authors are solely responsible for any omissions or errors contained herein.