Embed Size (px)
Citation preview

153
153
255
10
41
115
212
225
240
161
11
72
153
51
102
221
221
221
2016 VTB Group Investor Day
London / May 17, 2016

153
153
255
10
41
115
212
225
240
161
11
72
153
51
102
221
221
221
Some of the information in this presentation may contain projections or other forward-looking statements regarding future events or the future
financial performance of JSC VTB Bank ("VTB") and its subsidiaries (together with VTB, the "Group").
Such forward-looking statements are based on numerous assumptions regarding the Group's present and future business strategies and the
environment in which the Group will operate in the future.
We caution you that these statements are not guarantees of future performance and involve risks, uncertainties and other important factors that
we cannot predict with certainty. Accordingly, our actual outcomes and results may differ materially from what we have expressed or forecasted
in the forward-looking statements.
These forward-looking statements speak only as at the date of this presentation and are subject to change without notice. We do not intend to
update these statements to make them conform with actual results.
153
153
255
10
41
115
212
225
240
161
11
72
153
51
102
221
221
221
Andrey Kostin
President and Chairman of VTB Bank Management Board
VTB Group Overview
4
153
153
255
10
41
115
212
225
240
161
11
72
153
51
102
221
221
221
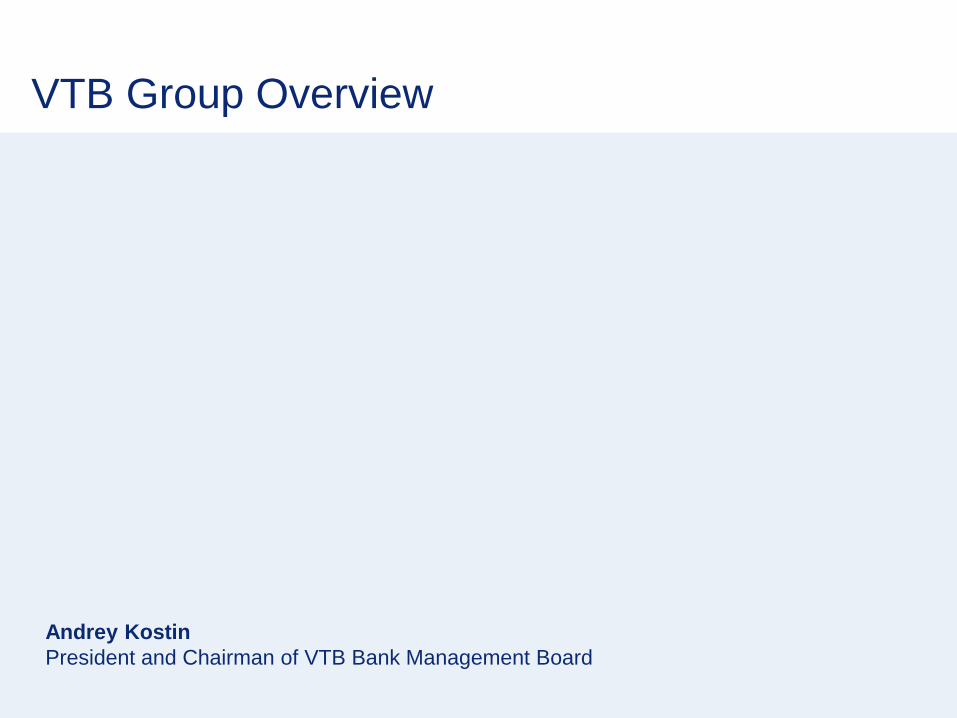
IMPRESSIVE GROWTH STORY AND
STRONG COMPETITIVE POSITIONS IN ALL KEY SEGMENTS
2013
1.1
13.6
2005 2014 2015
8.8
12.2
7.4
2012
Legal entities
Individuals
2015
18%
2005
2%
2015
11%
2005
5%
17% 13%
19%
7%
Customer loans Customer deposits
Total assets RUB trln
VTB market share in Russia
Leading player in Russia
− 2nd largest banking group in Russia
− 18% market share in Russia
Successful growth story
− 12-fold asset growth for the past
ten years
Well-established universal banking
model
− leading Russian banking group
with strong positioning in all key
segments: CIB, Retail banking,
Insurance, Leasing, Factoring, etc.
Extensive branch network
− over 1,900 branches in Russia
− presence in 22 countries
Solid client base
– over 20 mln active retail and corporate
customers
2015 2005 2015 2005
+29% y-o-y
vs market +24% y-o-y
today
5
153
153
255
10
41
115
212
225
240
161
11
72
153
51
102
221
221
221
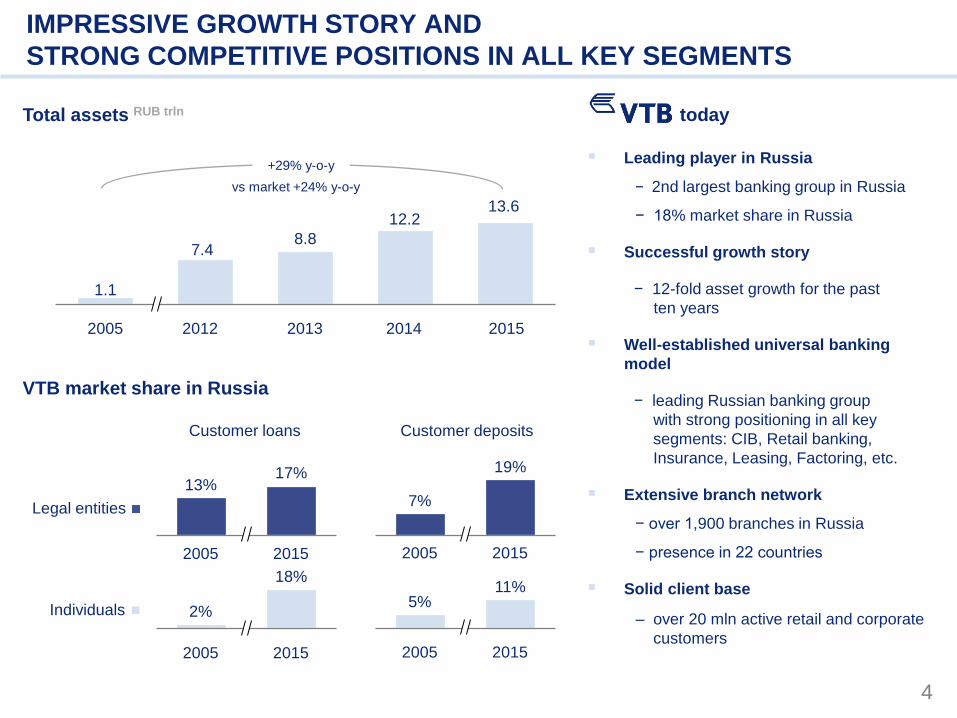
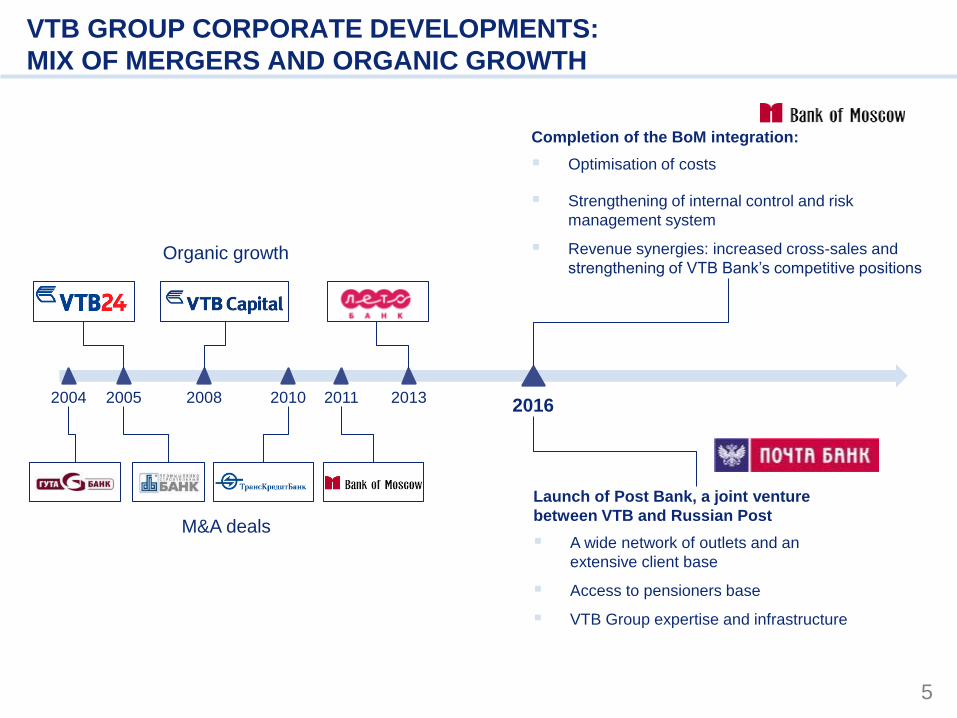
VTB GROUP CORPORATE DEVELOPMENTS:
MIX OF MERGERS AND ORGANIC GROWTH
2016 2004 2005 2008 2010 2011 2013
Launch of Post Bank, a joint venture
between VTB and Russian Post
A wide network of outlets and an
extensive client base
Access to pensioners base
VTB Group expertise and infrastructure
Completion of the BoM integration:
Optimisation of costs
Strengthening of internal control and risk
management system
Revenue synergies: increased cross-sales and
strengthening of VTB Bank’s competitive positions Organic growth
M&A deals

6
153
153
255
10
41
115
212
225
240
161
11
72
153
51
102
221
221
221
Retail Business
global business line
Corporate – Investment Banking
global business line
IT Risk
management
Audit and
Compliance Finance Admin HR Legal PR Security
VTB GROUP FLEXIBLE OPERATING MODEL
Assets (1) RUB trln 7.6 44% 3.8 22% 0.8 5%
Large corporate clients
(revenue > RUB 10 bn)
Broad corporate client base with
long term relationships with leading
Russian companies across all
economic sectors
#2 Corporate bank in Russia
#1 Investment bank in Russia
Mid-corporate clients
(revenue RUB 0.3 – RUB 10 bn)
Separate global business line and
profit centre since 2014
Wide regional franchise
Small corporate clients and individuals
(revenue <RUB 0.3 bn)
#2 Retail bank in Russia
Network: 1,648 outlets and
13 thousand ATMs
Post bank
Mid-Corporate Banking
global business line
Corporate Centre
(1) Second number represents share of each global business line in VTB Group’s total assets, %

7
153
153
255
10
41
115
212
225
240
161
11
72
153
51
102
221
221
221
SUMMARY
2017 – 2019 New development strategy 2014 – 2016 Strategy of quality growth
Maintaining position of Сorporate-Investment
banking while further improving its efficiency
Outperforming the market growth in Retail
banking, and further increasing the share of Retail
in the Group’s business mix
Prioritising Mid-Corporate banking as a
separate operating segment and profit centre while
further increasing the market share in Russia
Focusing on operating efficiency and stringent
cost control
Enhancement of Group level risk management
and controls
Transitioning the Group to unified functional and
technological platforms
Outperforming the market growth in Retail banking,
and further increasing the share of Retail in the
Group’s business mix
Outperforming the market growth in Mid-Corporate
banking in loans and transaction fee income while
further growing customer base
Maintaining position of Сorporate-Investment
banking while further diversifying CIB business mix
Prioritising investments in technological platform
development and innovations
Further consolidation of VTB Group governance
structure and enhancement of Group level risk
management and controls
Focusing on operating efficiency and stringent cost
control
1
2
3
4
5
6
1
2
3
4
5
6

153
153
255
10
41
115
212
225
240
161
11
72
153
51
102
221
221
221
Yuri Soloviev
First Deputy President and Chairman of VTB Bank Management Board
VTB Group Corporate-Investment Banking

10
41
115
212
225
240
252
25
33
248
164
74
254
194
120
253
225
185
198
76
155
216
132
186
146
205
81
183
223
131
219
240
189
153
153
153
58
75
140
235
193
219
118
141
188
9
In 2015 CIB managed to achieve
Four-fold year-on-year increase in NOI driven
by strong revenue growth, tight cost control
and a reduction in provisions vs high 2014
base
CIB increased / maintained its leading market
position in loans (~23%), deposits (~14%),
current accounts (~15%) and across all
investment banking products
Improved portfolio mix: increase share of Oil
and Gas, Metals and Mining, Retail, Telecom,
Chemicals and lower exposure to
Construction, Utilities, Public Sector
Year-on-year 30% increase of fees and
commissions driven by cross-sell and new
product development
CIB: 2015 KEY ACHIEVEMENTS
76%
9%
15%
45%
10%
45%
NII
NCI
Other Income
CIB net income and costs dynamics RUB bn
CIB structure of net operating income before
provisions
2014
2015
24.2
101.6
-34.2
29.9
2014 2015
Net operating income Net profit
Other income

10
41
115
212
225
240
252
25
33
248
164
74
254
194
120
253
225
185
198
76
155
216
132
186
146
205
81
183
223
131
219
240
189
153
153
153
58
75
140
235
193
219
118
141
188
10
13.6
19.7
23.8 23-24
30-31
2013 2014 2015 2016 (F) 2019 (F)
13.2
19.6
22.8 23-24
29-30
2013 2014 2015 2016 (F) 2019 (F)
CIB: 2013-2019 MARKET IN RUSSIA
CIB loans RUB trln
CIB deposits and current accounts RUB trln
Significant banking market growth in 2013-2016 driven by currency impact, closed international capital market and
low risk appetite of foreign banks to Russia;
We expect slower market growth in 2016-2019 both in lending and deposit / current accounts markets in Russia due
to low investment demand and high interest rates.
~22% CAGR
~8% CAGR
~23% ~7% CAGR CAGR
2016F 2019F 2016F 2019F

10
41
115
212
225
240
252
25
33
248
164
74
254
194
120
253
225
185
198
76
155
216
132
186
146
205
81
183
223
131
219
240
189
153
153
153
58
75
140
235
193
219
118
141
188
11
Managed to increase CIB segment loan portfolio by 18% and
ensure strong revenue growth
Maintained strong positions in corporate lending; worked with
more than 400 active client groups
Kept leading position: VTB market share of CIB Russian
credit portfolio rose from 19.3% in 2013 to 23% in 2015
International franchise development: VTB Group established
itself as one of the leading lenders and arrangers of private
financings in Sub-Saharan Africa and arranged some
strategic financing transactions in CEEMEA and Asia
(including debt restructurings, holding company financings
and event driven transactions)
Key 2015 achievements
CIB CREDIT BUSINESS(1): 2014-2015 HIGHLIGHTS
Loan portfolio RUB bn
VTB has extended its presence in infrastructure finance by moving forward with the financing of a landmark toll road
construction project and several new deals in mining, airport and shipping finance
VTB has taken the leading position in terms of volume of deals approved under the Government investment projects
support program (P-1044)
Development of Trade Finance franchise and further build-up relations with counterparties from 55 countries
Since 2013 Trade Finance business volume has been increased by 7.0x
Became one of the key partner banks for Russian Export Credit Agency (EXIAR)
(1) Key products in L&D segment are Credit, Leveraged Finance and Investments, Infrastructure credits and project finance, Trade finance, Leasing
6,748 7,671
5,186 6,139
2014 2015
+18%
CIB loans and advances (net)
Loans and advances to legal entities (net)
+14%
10
41
115
212
225
240
252
25
33
248
164
74
254
194
120
253
225
185
198
76
155
216
132
186
146
205
81
183
223
131
219
240
189
153
153
153
58
75
140
235
193
219
118
141
188
12
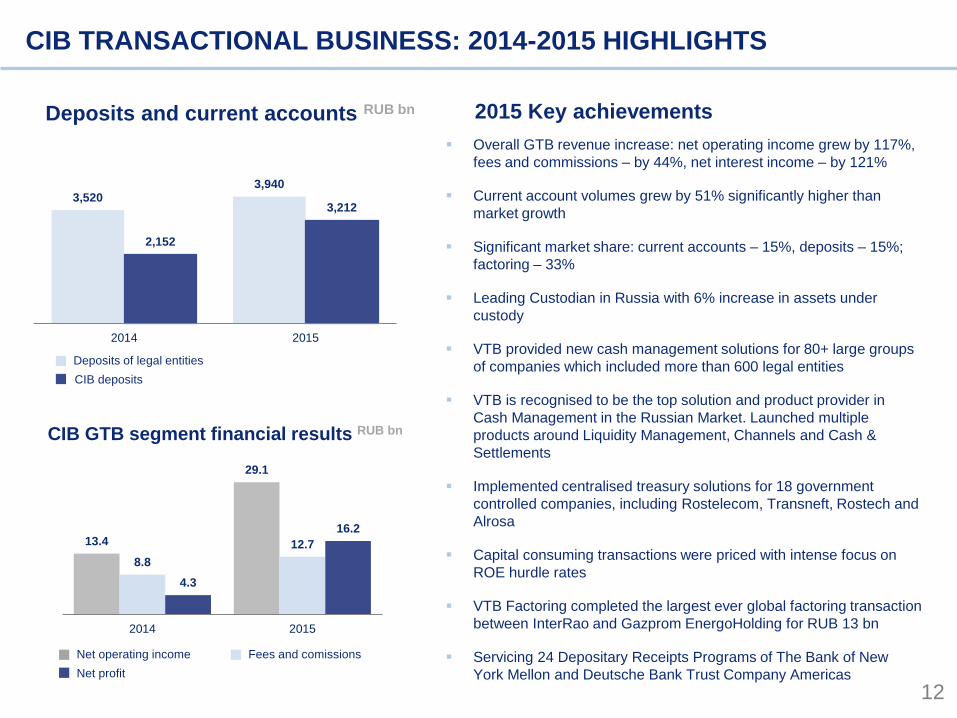
CIB GTB segment financial results RUB bn
Deposits and current accounts RUB bn
Overall GTB revenue increase: net operating income grew by 117%,
fees and commissions – by 44%, net interest income – by 121%
Current account volumes grew by 51% significantly higher than
market growth
Significant market share: current accounts – 15%, deposits – 15%;
factoring – 33%
Leading Custodian in Russia with 6% increase in assets under
custody
VTB provided new cash management solutions for 80+ large groups
of companies which included more than 600 legal entities
VTB is recognised to be the top solution and product provider in
Cash Management in the Russian Market. Launched multiple
products around Liquidity Management, Channels and Cash &
Settlements
Implemented centralised treasury solutions for 18 government
controlled companies, including Rostelecom, Transneft, Rostech and
Alrosa
Capital consuming transactions were priced with intense focus on
ROE hurdle rates
VTB Factoring completed the largest ever global factoring transaction
between InterRao and Gazprom EnergoHolding for RUB 13 bn
Servicing 24 Depositary Receipts Programs of The Bank of New
York Mellon and Deutsche Bank Trust Company Americas
2015 Key achievements
CIB TRANSACTIONAL BUSINESS: 2014-2015 HIGHLIGHTS
13.4
29.1
8.8
12.7
4.3
16.2
2014 2015
3,520 3,940
2,152
3,212
2014 2015
Net profit
Net operating income Fees and comissions
CIB deposits
Deposits of legal entities
10
41
115
212
225
240
252
25
33
248
164
74
254
194
120
253
225
185
198
76
155
216
132
186
146
205
81
183
223
131
219
240
189
153
153
153
58
75
140
235
193
219
118
141
188
13
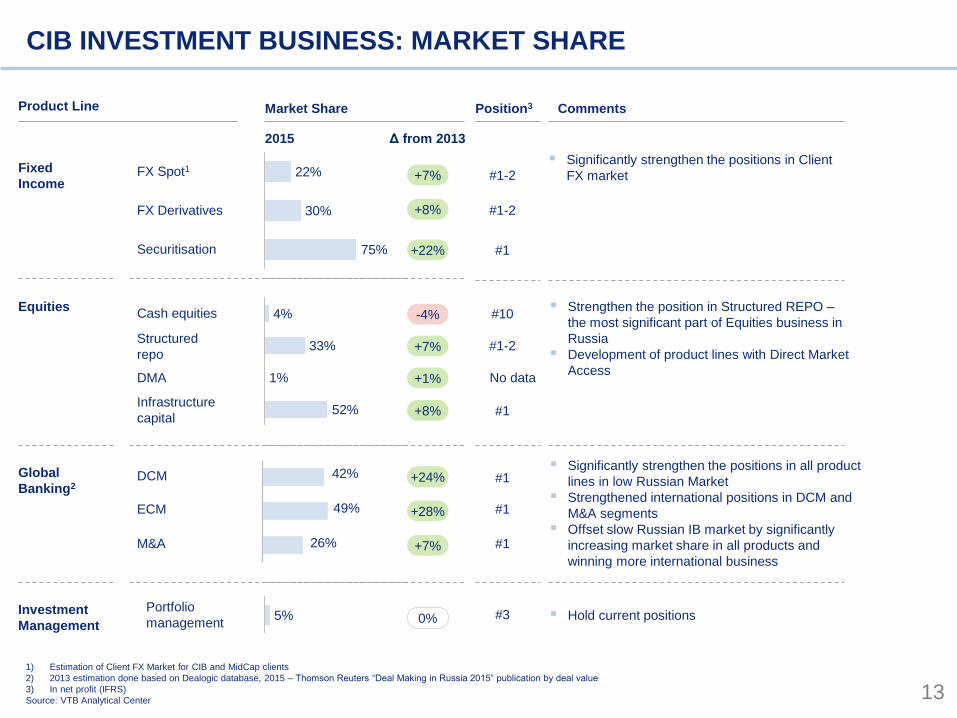
CIB INVESTMENT BUSINESS: MARKET SHARE
Securitisation
FX Derivatives
FX Spot1
Market Share Product Line
Fixed
Income
Equities
Global
Banking2
42%
49%
26%
75%
30%
22%
2015 Δ from 2013
+22%
52%
1%
33%
4% -4%
+7%
+1%
+24%
+28%
+7%
Portfolio
management Investment
Management 5%
+8%
0%
1) Estimation of Client FX Market for CIB and MidCap clients
2) 2013 estimation done based on Dealogic database, 2015 – Thomson Reuters “Deal Making in Russia 2015” publication by deal value
3) In net profit (IFRS)
Source: VTB Analytical Center
+7%
+8%
Significantly strengthen the positions in all product
lines in low Russian Market
Strengthened international positions in DCM and
M&A segments
Offset slow Russian IB market by significantly
increasing market share in all products and
winning more international business
Strengthen the position in Structured REPO –
the most significant part of Equities business in
Russia
Development of product lines with Direct Market
Access
Hold current positions
Comments
DCM
ECM
M&A
Cash equities
Structured
repo
DMA
Infrastructure
capital
Position3
#1
#1
#1
#1
#1
#1-2
#1-2
#10
#1-2
No data
#3
Significantly strengthen the positions in Client
FX market

10
41
115
212
225
240
252
25
33
248
164
74
254
194
120
253
225
185
198
76
155
216
132
186
146
205
81
183
223
131
219
240
189
153
153
153
58
75
140
235
193
219
118
141
188
14
FX and Rates:
VTB has been recognised as the best Russian Foreign Exchange Provider every year by Global
Finance magazine
2014 VTB Started trading African and Asian currencies
2015 VTB prints record-high volumes in trading RUBCNY in the onshore interdealer market in China
Local RUB Spot market share in 2015 reaches about 25%, derivatives are over 30%
Technological advances in FX allow VTB to enter into strategic partnerships with Alibaba Group and
Ant Financial Group
Credit Trading:
Over the course of the past year in response to rising capital requirements and secondary liquidity
adjustments Credit trading has significantly reduced balance sheet use for linear/non-linear risk and
has increased the velocity of position turnover
VTB has won 10 CBonds awards, including Best Bond Market Sales and Best Bond Market Trading
Commodities business:
Launch of physical trading and financing in VTBCT Zug. Zug became operating entity and completed
first physical deals in crude oil, oil products and base metals
First official member on Shanghai Gold Exchange
Physical Commodity financing set up in VTB Austria
Fixed Income
IB: 2014-2015 HIGHLIGHTS (1/2)
10
41
115
212
225
240
252
25
33
248
164
74
254
194
120
253
225
185
198
76
155
216
132
186
146
205
81
183
223
131
219
240
189
153
153
153
58
75
140
235
193
219
118
141
188
15
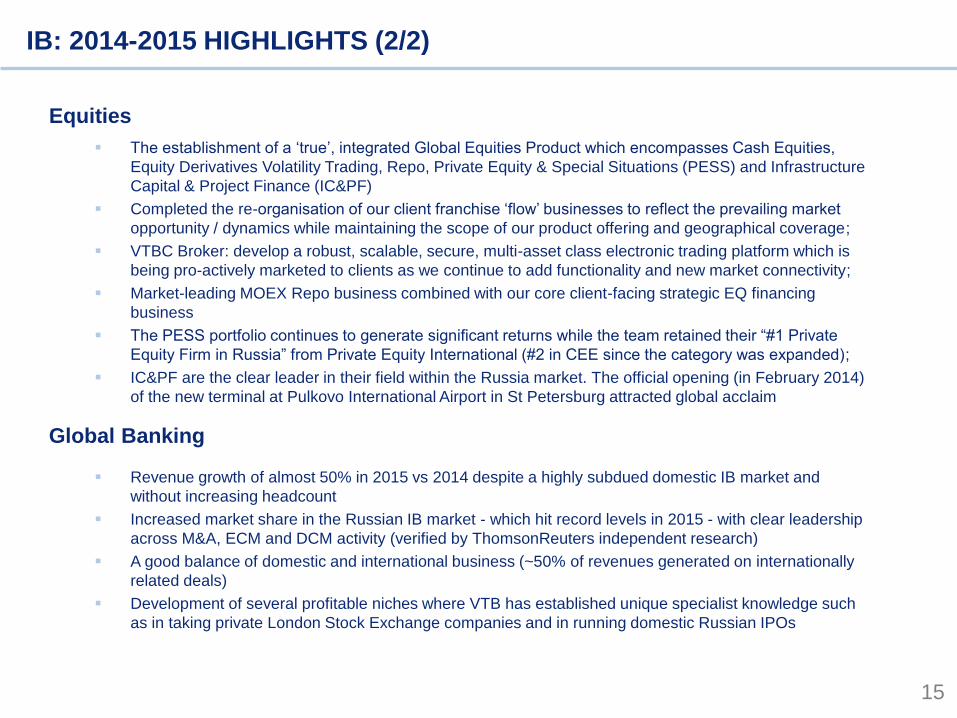
The establishment of a ‘true’, integrated Global Equities Product which encompasses Cash Equities,
Equity Derivatives Volatility Trading, Repo, Private Equity & Special Situations (PESS) and Infrastructure
Capital & Project Finance (IC&PF)
Completed the re-organisation of our client franchise ‘flow’ businesses to reflect the prevailing market
opportunity / dynamics while maintaining the scope of our product offering and geographical coverage;
VTBC Broker: develop a robust, scalable, secure, multi-asset class electronic trading platform which is
being pro-actively marketed to clients as we continue to add functionality and new market connectivity;
Market-leading MOEX Repo business combined with our core client-facing strategic EQ financing
business
The PESS portfolio continues to generate significant returns while the team retained their “#1 Private
Equity Firm in Russia” from Private Equity International (#2 in CEE since the category was expanded);
IC&PF are the clear leader in their field within the Russia market. The official opening (in February 2014)
of the new terminal at Pulkovo International Airport in St Petersburg attracted global acclaim
Revenue growth of almost 50% in 2015 vs 2014 despite a highly subdued domestic IB market and
without increasing headcount
Increased market share in the Russian IB market - which hit record levels in 2015 - with clear leadership
across M&A, ECM and DCM activity (verified by ThomsonReuters independent research)
A good balance of domestic and international business (~50% of revenues generated on internationally
related deals)
Development of several profitable niches where VTB has established unique specialist knowledge such
as in taking private London Stock Exchange companies and in running domestic Russian IPOs
Equities
Global Banking
IB: 2014-2015 HIGHLIGHTS (2/2)
10
41
115
212
225
240
252
25
33
248
164
74
254
194
120
253
225
185
198
76
155
216
132
186
146
205
81
183
223
131
219
240
189
153
153
153
58
75
140
235
193
219
118
141
188
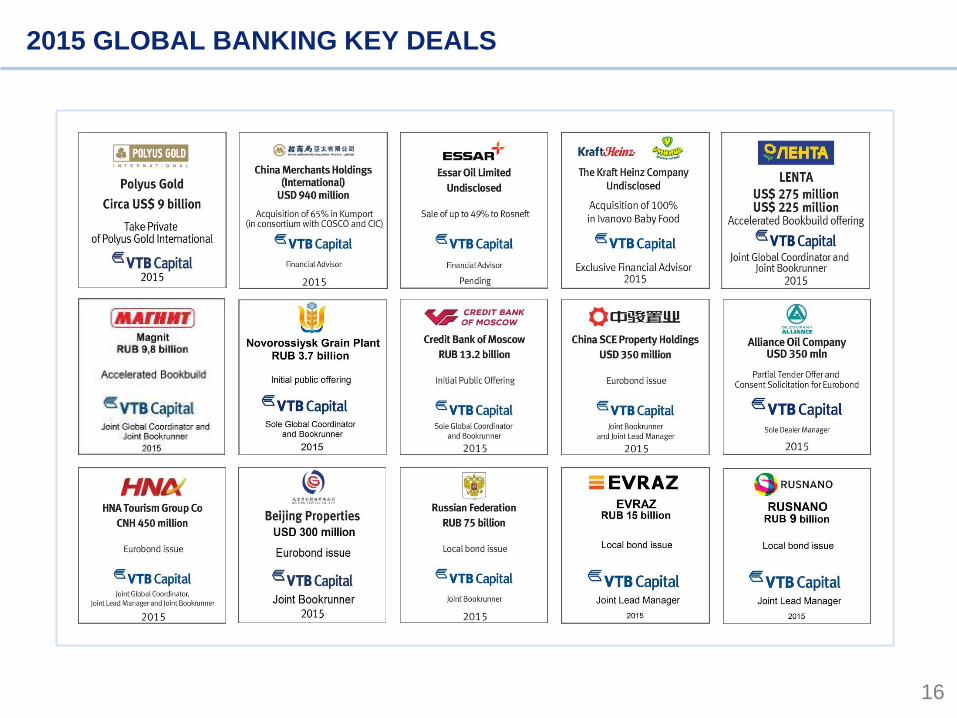
16
2015 GLOBAL BANKING KEY DEALS
10
41
115
212
225
240
252
25
33
248
164
74
254
194
120
253
225
185
198
76
155
216
132
186
146
205
81
183
223
131
219
240
189
153
153
153
58
75
140
235
193
219
118
141
188
17
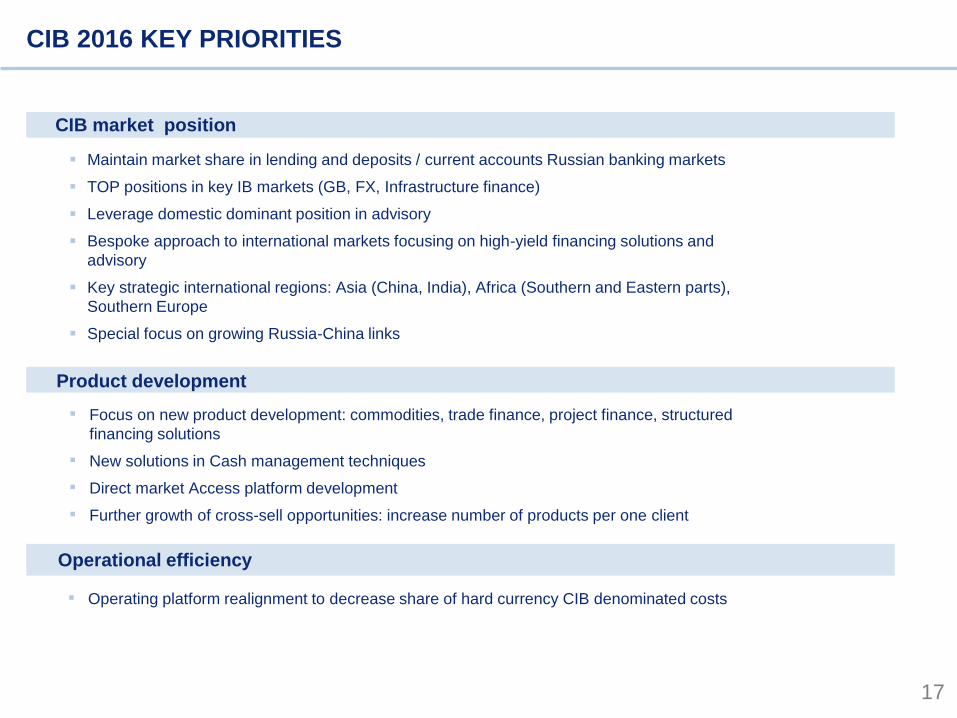
CIB market position
Product development
Operational efficiency
Maintain market share in lending and deposits / current accounts Russian banking markets
TOP positions in key IB markets (GB, FX, Infrastructure finance)
Leverage domestic dominant position in advisory
Bespoke approach to international markets focusing on high-yield financing solutions and
advisory
Key strategic international regions: Asia (China, India), Africa (Southern and Eastern parts),
Southern Europe
Special focus on growing Russia-China links
d CIB 2016 KEY PRIORITIES
▪ Focus on new product development: commodities, trade finance, project finance, structured
financing solutions
▪ New solutions in Cash management techniques
▪ Direct market Access platform development
▪ Further growth of cross-sell opportunities: increase number of products per one client
▪ Operating platform realignment to decrease share of hard currency CIB denominated costs

153
153
255
10
41
115
212
225
240
161
11
72
153
51
102
221
221
221
Mikhail Zadornov
President and Chairman of VTB24 Management Board
VTB Group Retail Banking

10
41
115
212
225
240
252
25
33
248
164
74
254
194
120
253
225
185
198
76
155
216
132
186
146
205
81
183
223
131
219
240
189
153
153
153
58
75
140
235
193
219
118
141
188
19
RETAIL BANKING MARKET IN RUSSIA
10%
38%
46%
10.9 10.7
10%
40%
45%
5%
27% 10%
10% 7.7
6% 8%
50%
10%
9%
28%
10.0
53%
11.3
54%
9%
42%
15 - 15.5
43%
10%
6%
32%
Retail loans RUB trln
18.6
82%
18% 19%
19%
14.3
15% 23.2
83%
26.0
85%
17%
81%
17.0
81%
16%
34 - 35
84%
Retail deposits RUB trln
Car loans Credit cards
Cash loans Mortgage
Small business loans RUB trln Small business RUB trln
2.4 2.7
2.9 2.7 2.6
3.1-3.3
2013 2012 2014 2016F 2015 2019F
3.1 3.0
30%
2015
70%
2016F
81%
19% 21%
79%
2.6
2014
69%
31% 31%
69%
2013 2012
2.1 2.4
69%
31%
2019F
3.3-3.5
CAGR
+11%
+10%
+18%
+11%
CAGR
CAGR
CAGR
+4% CAGR
+6%
CAGR
2013 2012 2014 2016F 2015 2019F 2013 2012 2014 2016F 2015 2019F
+13% CAGR
+3% CAGR Current accounts Term deposits
Current accounts Term deposits

10
41
115
212
225
240
252
25
33
248
164
74
254
194
120
253
225
185
198
76
155
216
132
186
146
205
81
183
223
131
219
240
189
153
153
153
58
75
140
235
193
219
118
141
188
20
VTB GROUP MARKET POSITION IN RETAIL BUSINESS IN RUSSIA
12.7% 14.4% 15.0%
1.2%
2.7% 2.9%
0.6% 0.9%
18.8% 17.8%
13.9%
7.5% 8.7% 9.2%
1.2%
1.8% 1.8%
11.2% 10.7% 8.7%
5.0% 5.6% 6.7%
0.6% 1.2%
1.2%
5.2%
10.0% 11.3% 1.4%
1.3%
1.7%
Retail loans Retail deposits and current accounts
Small business loans
Small business deposits and current accounts
VTB24
Ex-Bank of Moscow
2012 2015 2016F 2012 2015 2016F
+3.9 p.p. +1.0 p.p.
+2.0 p.p. +0.5 p.p.
2012 2015 2016F
7.9% 6.9%
5.6%
+1.3 p.p.
+1.0 p.p.
2012 2015 2016F
13.1% 11.4%
6.6%
+4.8 p.p. +1.7 p.p.
0.1% 0.2% 0.2%
VTB24
Ex-Bank of Moscow
VTB24
Ex-Bank of Moscow
Leto / Post Bank
VTB24
Ex-Bank of Moscow
Leto / Post Bank
& VTB Bank

10
41
115
212
225
240
252
25
33
248
164
74
254
194
120
253
225
185
198
76
155
216
132
186
146
205
81
183
223
131
219
240
189
153
153
153
58
75
140
235
193
219
118
141
188
21
50.8
37.6
16.9
RETAIL BUSINESS CONTINUES TO BE THE KEY CONTRIBUTOR
TO VTB GROUP P&L AND EFFICIENCY
2013 2014 2015
Profitability of VTB Group’s Retail business RUB bn
48% 46% 56% CIR
136.2
157.6
Net operating income
Net profit
166.0

10
41
115
212
225
240
252
25
33
248
164
74
254
194
120
253
225
185
198
76
155
216
132
186
146
205
81
183
223
131
219
240
189
153
153
153
58
75
140
235
193
219
118
141
188
22
VTB Group customer base (active customers) in 2015 mln
9.0 1.1
1.9
11.5
10.4
1.3
19.9
Total
customer
base
VTB
Pension
Fund
VTB
Insurance
Banking
customers,
total
BoM Post Bank
(ex-Leto Bank)
VTB24 De-duplication
-0.5
-3.3
VTB GROUP CUSTOMER BASE IN RUSSIA BY ENTITY
De-duplication

10
41
115
212
225
240
252
25
33
248
164
74
254
194
120
253
225
185
198
76
155
216
132
186
146
205
81
183
223
131
219
240
189
153
153
153
58
75
140
235
193
219
118
141
188
23
2,544 (29%) 1,679
(19%)
2,526 (29%)
2,290 (25%)
2,466 (28%)
3,133 (35%)
1,253 (14%)
1,932 (21%)
VTB24 CUSTOMER BASE BY SEGMENT
8,789 9,033
VTB24 customer segments (active customers) thsd
2013 2015
Affluent + HNWI
Upper mass
Mass
Lower mass
+7 p.p.
+7 p.p.
-4 p.p.
-10 p.p.
10
41
115
212
225
240
252
25
33
248
164
74
254
194
120
253
225
185
198
76
155
216
132
186
146
205
81
183
223
131
219
240
189
153
153
153
58
75
140
235
193
219
118
141
188
24
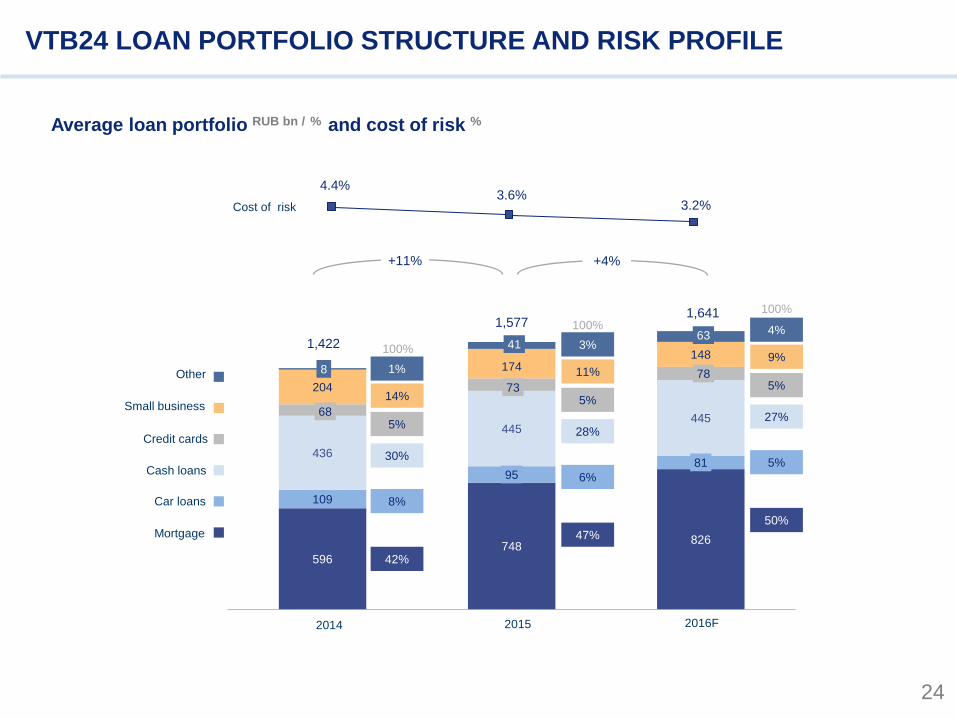
VTB24 LOAN PORTFOLIO STRUCTURE AND RISK PROFILE
Average loan portfolio RUB bn / % and cost of risk %
596 748
826
109
95 81
436
445 445
68
73 78
204
174 148
8
41 63
2015 2016F 2014
1,422
1,577 1,641
Small business
Mortgage
Car loans
Cash loans
Credit cards
Other
+11% +4%
42%
8%
30%
5%
14%
1%
47%
6%
28%
5%
11%
3%
50%
5%
27%
5%
9%
4%
100%
100%
100%
Cost of risk
4.4% 3.6%
3.2%

10
41
115
212
225
240
252
25
33
248
164
74
254
194
120
253
225
185
198
76
155
216
132
186
146
205
81
183
223
131
219
240
189
153
153
153
58
75
140
235
193
219
118
141
188
25
10.1 11.0
17.0
2.0
2.0
VTB GROUP BRANCH AND ATM NETWORKS IN RUSSIA
378
530 576 627
646 603 630
2,600
4,312
455
(42%)
2016F
+52%
1,713
309
(45%)
687
2012
537
(50%)
2014
470
(45%)
1,649
2015
Standard offices
Offices with affluent zones
Leto/Post Bank and ex-BoM
Post-office branches
2014
12.1
13.4
2017F 2015
0.4
VTB24
Ex-BoM
Leto/Post Bank
Branch network ATM thsd
+11%
+27%
-4%
+161%
10
41
115
212
225
240
252
25
33
248
164
74
254
194
120
253
225
185
198
76
155
216
132
186
146
205
81
183
223
131
219
240
189
153
153
153
58
75
140
235
193
219
118
141
188
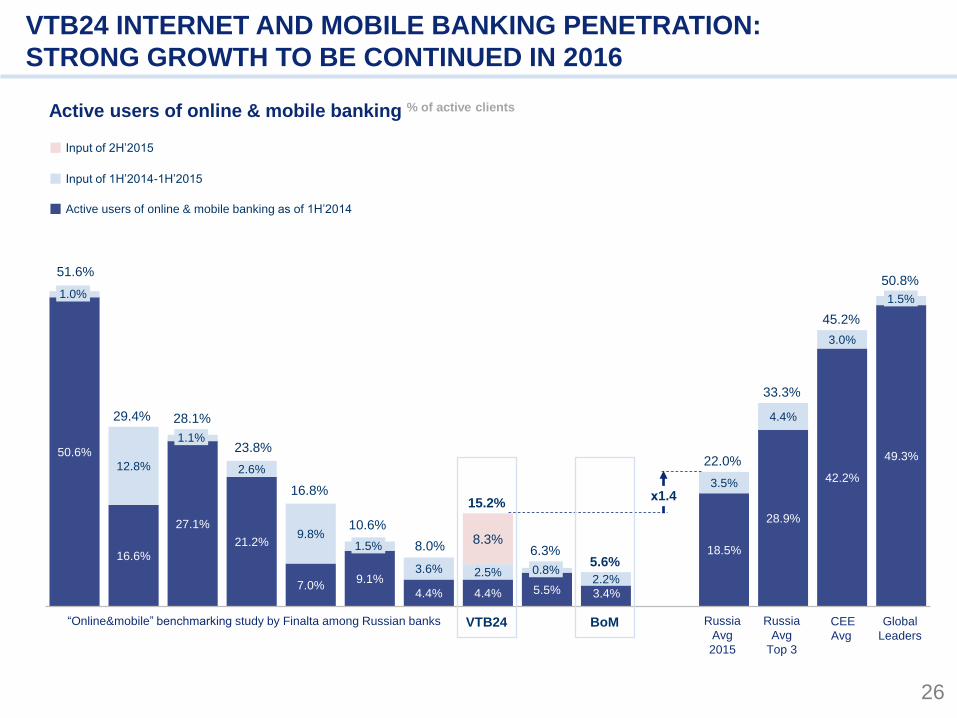
26
VTB24 INTERNET AND MOBILE BANKING PENETRATION:
STRONG GROWTH TO BE CONTINUED IN 2016
Active users of online & mobile banking % of active clients
50.6%
16.6%
27.1%
21.2%
7.0% 9.1%
4.4% 4.4% 5.5% 3.4%
18.5%
28.9%
42.2%
49.3% 12.8% 2.6%
9.8%
3.6% 2.5% 2.2%
3.5%
4.4%
3.0%
8.3%
45.2%
33.3%
22.0%
BoM
5.6% 6.3%
0.8%
VTB24
15.2%
8.0%
10.6%
Global
Leaders
50.8%
1.5%
CEE
Avg
1.5%
16.8%
23.8%
28.1%
1.1%
29.4%
51.6%
1.0%
х1.4
Active users of online & mobile banking as of 1H’2014
Input of 1H’2014-1H’2015
Input of 2H’2015
“Online&mobile” benchmarking study by Finalta among Russian banks Russia
Avg
2015
Russia
Avg
Top 3

10
41
115
212
225
240
252
25
33
248
164
74
254
194
120
253
225
185
198
76
155
216
132
186
146
205
81
183
223
131
219
240
189
153
153
153
58
75
140
235
193
219
118
141
188
27
CRM ACTIVITIES PLAY INCREASINGLY IMPORTANT ROLE IN
SUPPORTING DYNAMIC GROWTH OF RETAIL BUSINESS
2015 2016F
151,969
49%
316,091
54%
+129%
Sales of consumer loans RUB mln
2016F
41%
364,256
449,144
27%
2015
+87%
Sales of credit cards No. of cards
49%
2016F
418,956
2015
195,724
56%
+87%
Sales of affluent bundles
(“Privilege”) No. of bundles
Share of CRM VTB24 business plans for selected products and CRM
+108% +23% +114%

10
41
115
212
225
240
252
25
33
248
164
74
254
194
120
253
225
185
198
76
155
216
132
186
146
205
81
183
223
131
219
240
189
153
153
153
58
75
140
235
193
219
118
141
188
28
SHARE OF CLIENTS WITH SALARY ACCOUNTS
Share of clients with salary accounts, 2014 % of active clients
47.0%
42.0%
36.0% 35.0%
32.0% 32.0%
22.0%
19.0%
12.0%
3.0%
29.0%
Russia
Average
BoM VTB24 “Branch productivity” benchmarking study by Finalta among Russian banks

10
41
115
212
225
240
252
25
33
248
164
74
254
194
120
253
225
185
198
76
155
216
132
186
146
205
81
183
223
131
219
240
189
153
153
153
58
75
140
235
193
219
118
141
188
29
VTB GROUP RETAIL BUSINESS KEY STRATEGIC INITIATIVES
FOR THE NEXT 3 YEARS
Market share and financial performance
Increase market share (as a Group) both in loans and deposits
+ 5% in loans
+ 5% in deposits and CA
Maintain high level of financial efficiency / profitability (ROE ~18%)
Customers
▪ Increase number of active customers through new customers acquisition and current customers reactivation
▪ Continue developing as a multi-brand model to target different client segments (e.g. focus VTB24 on mass-affluent and affluent segments and Post Bank
on mass segment and retirees)
▪ X-sell: increase number of products per customer
▪ Customer experience: improve customer satisfaction (NPS)
Multi-channel
▪ Continue developing multi-channel model:
Increase sales network - mainly by Post Bank
Increase penetration of Internet and Mobile bank
Increase share of sales in alternative channels (CRM, Internet)
Operational efficiency
▪ Achieve high-level of operational efficiency: number of customers per branch employee, sales per branch employee
▪ Continue further centralisation of back-office functions
Post bank
▪ Successfully realise a joint project with Russian Post
IT
▪ Mid 2017 – completion of VTB24 IT overhaul
▪ YE’2019 – harmonisation of VTB Group retail IT landscape

10
41
115
212
225
240
252
25
33
248
164
74
254
194
120
253
225
185
198
76
155
216
132
186
146
205
81
183
223
131
219
240
189
153
153
153
58
75
140
235
193
219
118
141
188
30
Customers
POST BANK OFFICIALLY LAUNCHED IN APRIL 2016
Post Bank logo and branch format
Key numbers (2023): Branches in Post offices
Top-3 retail bank in Russia
15,000
>17 mln
Top-3
Key numbers (2023)

10
41
115
212
225
240
252
25
33
248
164
74
254
194
120
253
225
185
198
76
155
216
132
186
146
205
81
183
223
131
219
240
189
153
153
153
58
75
140
235
193
219
118
141
188
31
6.7
15.6
52% 60%
1
20
2
5
3
25
POST BANK 2016 BUSINESS PLAN
Loan portfolio (gross) RUB bn Customer deposits RUB bn
Net operating income RUB bn
60
103 14
15
4
8
78
126
2015 2016F
Credit cards
POS
Net profit RUB bn
-1.7
0.1
CIR
+62%
2015 2016F
х8.6
Term deposits
Current accounts
+131%
Cash loans
2015 2016F 2015 2016F
153
153
255
10
41
115
212
225
240
161
11
72
153
51
102
221
221
221
Herbert Moos
Deputy President and Chairman of VTB Bank Management Board
VTB Group Financial Performance and Outlook

33
153
153
255
10
41
115
212
225
240
161
11
72
153
51
102
221
221
221
5.5% 7.9%
12.6%
108.0 98.0
52.0
2013 2014 2015
31.8 38.0 61.2
MACRO ENVIRONMENT SIGNIFICANTLY DETERIORATED
Oil price USD and exchange rate RUB Inflation and CBR key rate
Russian macroeconomic indicators
USD/RUB
(avg)
Oil price
(Urals, avg)
Investments in fixed capital
GDP
Industrial production
Retail turnover
1.3% 0.6%
-3.7%
0.8%
-1.5%
-8.4%
0.4% 1.7%
-3.4%
3.9% 2.7%
-10.0%
2013 2014 2015
6.8% 7.8%
15.6%
2013 2014 2015
(1) In its current form key rate was introduced by the Bank of Russia in September 2013. Average figure for 2013 is calculated based on the period from
September 13, 2013 till December 31, 2013.
-47% -9%
CPI inflation
(avg)
CBR key rate
(avg) (1)
+7.8 p.p. +1 p.p.

34
153
153
255
10
41
115
212
225
240
161
11
72
153
51
102
221
221
221
313
534 635
2013 2014 2015
4.7% 5.8% 6.3%
10.9% 9.8%
12.4%
14.7%
12.0%
14.3%
807 998 1,316
1,516 1,217 1,093
2013 2014 2015
VTB SIGNIFICANTLY IMPROVED BALANCE SHEET METRICS
AND CAPITAL
Total assets RUB bn Customer funding RUB bn
8,769
12,191 13,642
2013 2014 2015
4,383 5,669
7,267
2013 2014 2015
BIS Group capital RUB bn NPLs (90+) RUB bn
115.5% 114.8% 105.8%
Total CAR
Tier I ratio
Tier I capital
Total capital
NPL coverage
ratio
151% 157% 139%
LDR +12% +39%
+28% +29%
+25% +11%
NPL ratio
NPL

35
153
153
255
10
41
115
212
225
240
161
11
72
153
51
102
221
221
221
99.2
275.4
178.1
2013 2014 2015
1.6%
3.4%
1.8%
PROFITABILITY HIT BY LOWER NIM AND RISE IN CREDIT COSTS
PARTLY OFFSET BY SOLID FEES GROWTH
Net interest income RUB bn Provisions charge (1) RUB bn
Net fee and commission income (NFCI) RUB bn Net profit RUB bn
316.9 347.3
289.1
2013 2014 2015
4.4% 4.0%
2.6%
100.5
0.8 1.7
2013 2014 2015
11.8% 0.1% 0.1%
55.4 63.1
76.2
2013 2014 2015
NIM
Share of NFCI in operating
income before provisions
13% 12% 19%
-17% +10%
+21% +14%
CoR
ROE
-35% +178%
+113%
-99%
(1) Including provision charge for impairment of debt financial assets and provision charge for impairment of other assets, credit related commitments and legal claims.
36
153
153
255
10
41
115
212
225
240
161
11
72
153
51
102
221
221
221
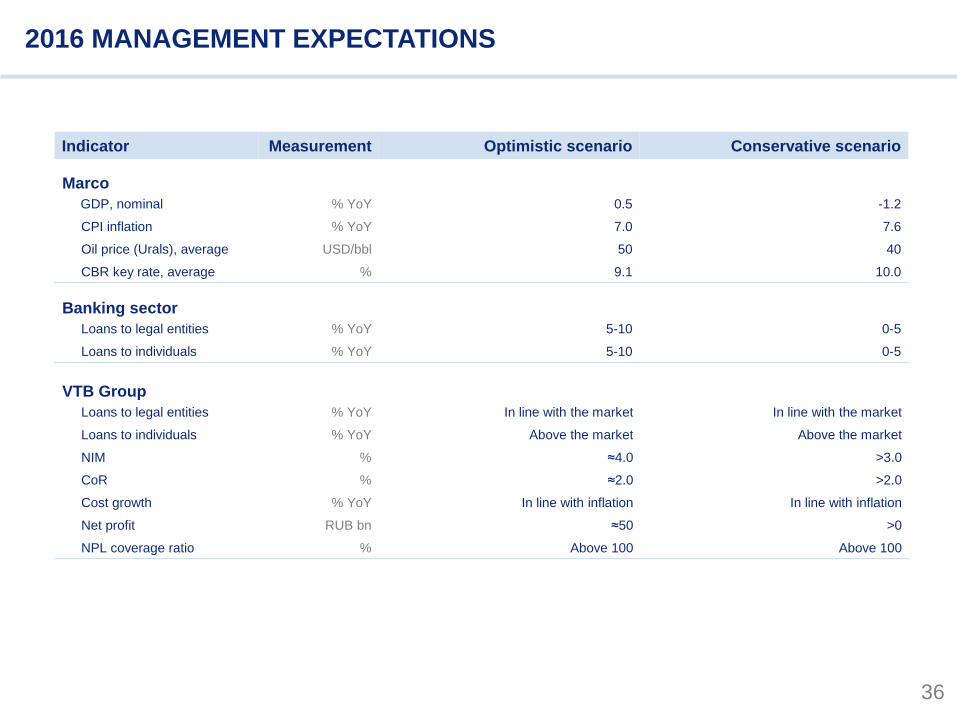
2016 MANAGEMENT EXPECTATIONS
Indicator Measurement Optimistic scenario Conservative scenario
Marco
GDP, nominal % YoY 0.5 -1.2
CPI inflation % YoY 7.0 7.6
Oil price (Urals), average USD/bbl 50 40
CBR key rate, average % 9.1 10.0
Banking sector
Loans to legal entities % YoY 5-10 0-5
Loans to individuals % YoY 5-10 0-5
VTB Group
Loans to legal entities % YoY In line with the market In line with the market
Loans to individuals % YoY Above the market Above the market
NIM % ≈4.0 >3.0
CoR % ≈2.0 >2.0
Cost growth % YoY In line with inflation In line with inflation
Net profit RUB bn ≈50 >0
NPL coverage ratio % Above 100 Above 100

37
153
153
255
10
41
115
212
225
240
161
11
72
153
51
102
221
221
221
VTB GROUP MACRO EXPECTATIONS TILL 2019
GDP growth Y-o-Y Oil price (Urals), average USD/bbl
CPI inflation Dec / Dec CBR key policy rate EOP
≈2%
≈2.0-2.5% ≈2.0-2.5%
2017F 2018F 2019F
55 60 60
2017F 2018F 2019F
5.5 – 6.5%
4.5 – 5.5% 4.0 – 5.0%
2017F 2018F 2019F
6.5 – 7.5%
5.5 – 6.5% 5.5 – 6.5%
2017F 2018F 2019F

38
153
153
255
10
41
115
212
225
240
161
11
72
153
51
102
221
221
221
12.0 - 12.5 13.0 - 13.5 15.0 - 15.5
2017F 2018F 2019F
RUSSIAN BANKING SECTOR TILL 2019
Loans to legal entities RUB trln Loans to individuals RUB trln
Deposits of legal entities RUB trln Deposits of individuals RUB trln
36 - 37 40 - 41
44 - 45
2017F 2018F 2019F
+10-12%
Y-o-Y avg growth rate
VTB market share
+10-15%
Y-o-Y avg growth rate
VTB market share
32 - 33 36 - 37
40 - 41
2017F 2018F 2019F
28 - 29 31 - 32 34 - 35
2017F 2018F 2019F
VTB market share VTB market share
+10-12%
Y-o-Y avg growth rate +9-11%
Y-o-Y avg growth rate
2015 2019 2015 2019
2015 2019 2015 2019
18% 23%
11% 16%
14%
11%
13%
11%

39
153
153
255
10
41
115
212
225
240
161
11
72
153
51
102
221
221
221
VTB GROUP KEY FINANCIAL TARGETS TILL 2019
Indicator Measurement 2017 – 2019
Loans to legal entities % YoY In line with the market
Loans to individuals % YoY Above the market
NIM % ≈4.0
CoR % ≈2.0
CIR % 2019: low 40th
ROE % 2017-2018: >5.0
2019: ≈11.0
NPL coverage ratio % Above 100

40
153
153
255
10
41
115
212
225
240
161
11
72
153
51
102
221
221
221
IT AND INFRASTRUCTURE DEVELOPMENT
Key objectives
Productivity increase
Reduced maintenance
cost
Overall improvement of
IT reliability and
security
Reduced time-to-
market Consolidation and virtualisation of IT infrastructure
Product and channel innovation
New data processing center,
integrated infrastructure of
data processing centers in
Russia
Private cloud
and dynamic
capacity
management
Virtualisation of
workstations
Workplace
mobility
Product and channel innovation
Broadening the list of products and
services available through mobile and
internet banking
Omnichannel and seamless customer
experience
New customer interaction channels
Market place (integrated group-wide
product platform)
Organisational setup to support
innovation cycle
Simplification of IT landscape
Unification of corporate support
applications
Centralised IT architecture management
Data analytics
Enhancement of data quality and
granularity through introduction of CDO
function and methodology
MIS improvement through visualisation
tools and mobile analytics
Centralised risk modelling
Cyber security
Development of authentication tools (including biometric authentication)
Introduction of adaptive anti-fraud systems
41
153
153
255
10
41
115
212
225
240
161
11
72
153
51
102
221
221
221
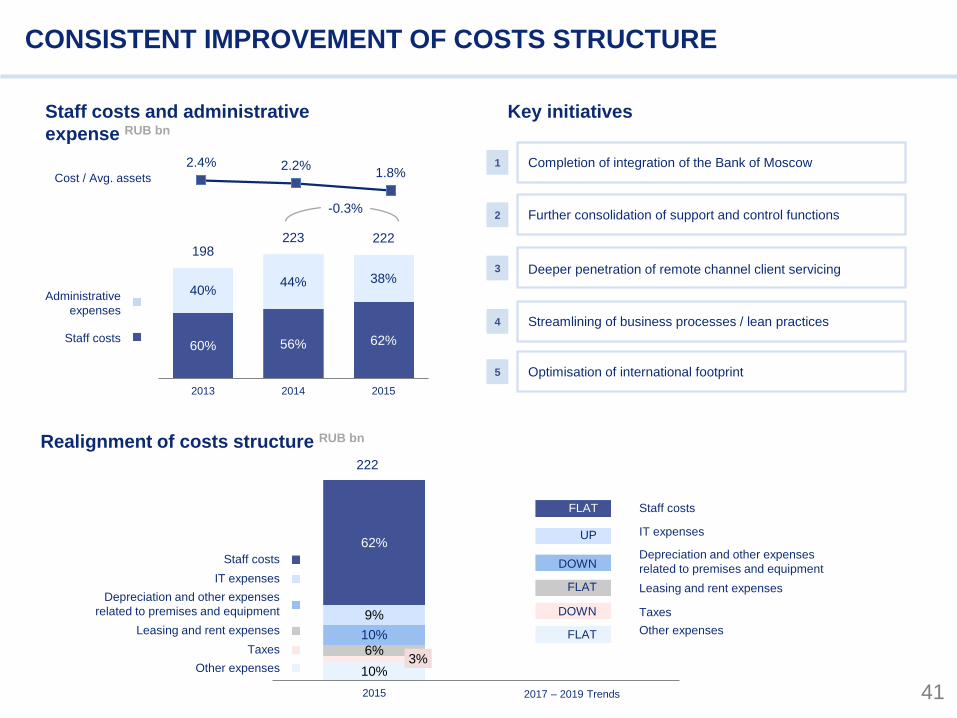
10% 3%
6%
10%
9%
62%
222
Future projections2015
CONSISTENT IMPROVEMENT OF COSTS STRUCTURE
Key initiatives Staff costs and administrative
expense RUB bn
Realignment of costs structure RUB bn
Staff costs
Administrative
expenses
Cost / Avg. assets
62% 56% 60%
38% 44% 40%
222 223 198
201520142013
-0.3%
1.8% 2.2% 2.4%
1 Completion of integration of the Bank of Moscow
2
3
4
5
Further consolidation of support and control functions
Deeper penetration of remote channel client servicing
Streamlining of business processes / lean practices
Optimisation of international footprint
Other expenses
Taxes
Leasing and rent expenses
IT expenses
Depreciation and other expenses
related to premises and equipment
Staff costs
Other expenses
Taxes
Leasing and rent expenses
IT expenses
Depreciation and other expenses
related to premises and equipment
Staff costs
FLAT
DOWN
UP
DOWN
FLAT
FLAT
2017 – 2019 Trends
42
153
153
255
10
41
115
212
225
240
161
11
72
153
51
102
221
221
221
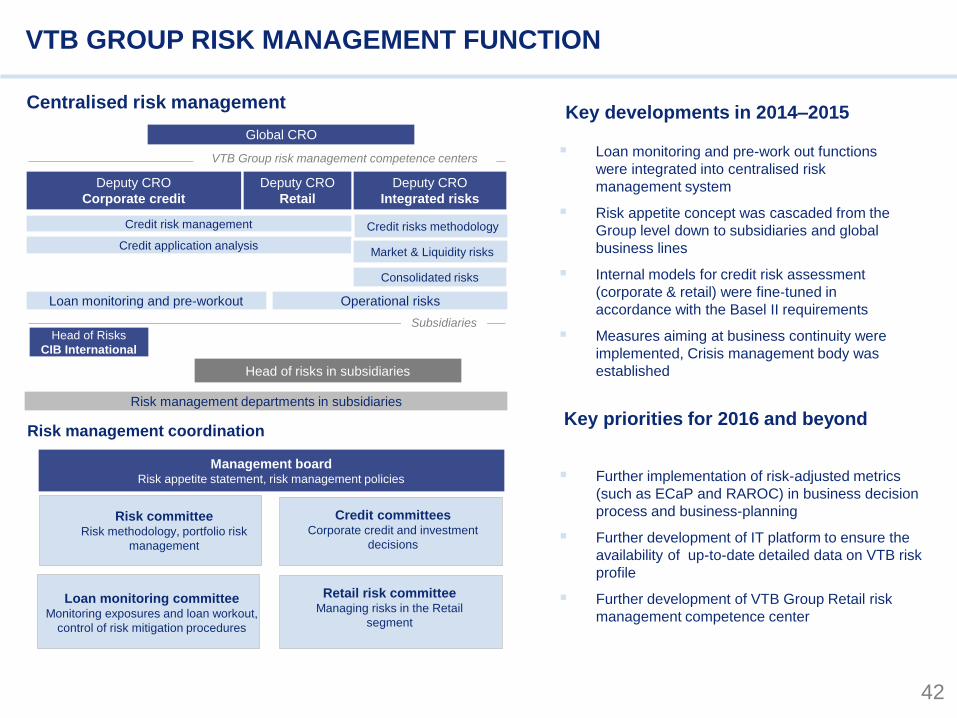
VTB GROUP RISK MANAGEMENT FUNCTION
Loan monitoring and pre-work out functions
were integrated into centralised risk
management system
Risk appetite concept was cascaded from the
Group level down to subsidiaries and global
business lines
Internal models for credit risk assessment
(corporate & retail) were fine‐tuned in
accordance with the Basel II requirements
Measures aiming at business continuity were
implemented, Crisis management body was
established
Global CRO
Deputy CRO
Corporate credit
Deputy CRO
Integrated risks
Deputy CRO
Retail
Credit risk management
Credit application analysis
Consolidated risks
Head of Risks
CIB International
Loan monitoring and pre-workout Operational risks
Head of risks in subsidiaries
VTB Group risk management competence centers
Risk management departments in subsidiaries
Market & Liquidity risks
Subsidiaries
Centralised risk management
Risk management coordination
Key developments in 2014–2015
Key priorities for 2016 and beyond
Further implementation of risk-adjusted metrics
(such as ECaP and RAROC) in business decision
process and business-planning
Further development of IT platform to ensure the
availability of up-to-date detailed data on VTB risk
profile
Further development of VTB Group Retail risk
management competence center
Management board Risk appetite statement, risk management policies
Credit committees Corporate credit and investment
decisions
Loan monitoring committee Monitoring exposures and loan workout,
control of risk mitigation procedures
Retail risk committee Managing risks in the Retail
segment
Credit risks methodology
Risk committee Risk methodology, portfolio risk
management
43
153
153
255
10
41
115
212
225
240
161
11
72
153
51
102
221
221
221
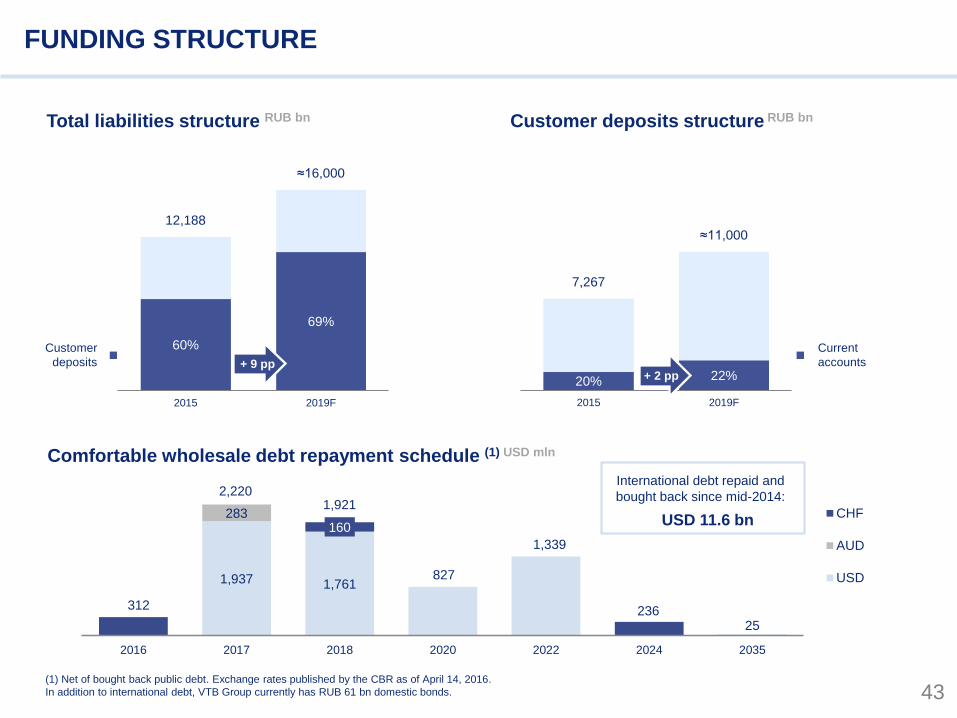
FUNDING STRUCTURE
Total liabilities structure RUB bn Customer deposits structure RUB bn
Comfortable wholesale debt repayment schedule (1) USD mln
1,937 1,761
25
283 160
312
2,220 1,921
827
1,339
236
2016 2017 2018 2020 2022 2024 2035
CHF
AUD
USD
60%
69%
12,188
≈16,000
2015 2019F
Customer
deposits
20% 22%
7,267
≈11,000
2015 2019F
Current
accounts
(1) Net of bought back public debt. Exchange rates published by the CBR as of April 14, 2016.
In addition to international debt, VTB Group currently has RUB 61 bn domestic bonds.
+ 9 pp + 2 pp
International debt repaid and
bought back since mid-2014:
USD 11.6 bn
44
153
153
255
10
41
115
212
225
240
161
11
72
153
51
102
221
221
221
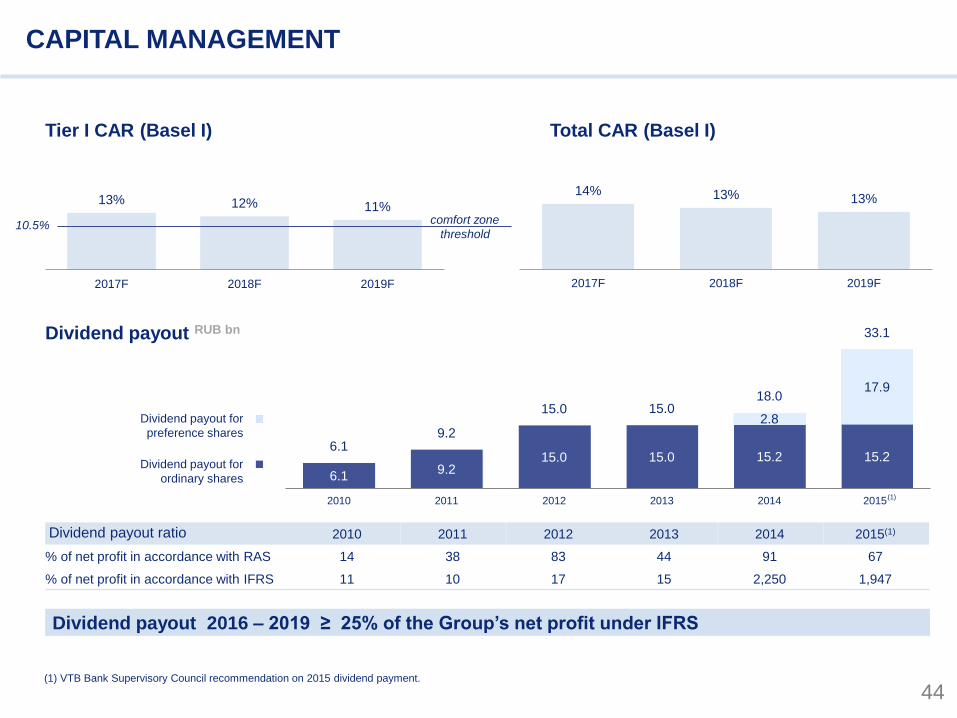
6.1 9.2
15.0 15.0 15.2 15.2
2.8
17.9
6.1 9.2
15.0 15.0 18.0
33.1
2010 2011 2012 2013 2014 2015*
CAPITAL MANAGEMENT
Tier I CAR (Basel I)
13% 12% 11%
2017F 2018F 2019F
10.5% comfort zone
threshold
Dividend payout 2016 – 2019 ≥ 25% of the Group’s net profit under IFRS
Dividend payout RUB bn
14% 13% 13%
2017F 2018F 2019F
Total CAR (Basel I)
Dividend payout ratio 2010 2011 2012 2013 2014 2015(1)
% of net profit in accordance with RAS 14 38 83 44 91 67
% of net profit in accordance with IFRS 11 10 17 15 2,250 1,947
Dividend payout for
preference shares
Dividend payout for
ordinary shares
(1) VTB Bank Supervisory Council recommendation on 2015 dividend payment.
(1)