Embed Size (px)
Citation preview
© Globe View 2016

30°
120°
180°
60°S
0° 30°30° 60°60° 90°90° 120°120° 150°150° 180°180°
0°
30°
60°N
0° 30°30° 60°
60°
90°
90°
120°
0°
30°
30°
60°N
150°
60°S
30°W 0°
60°
90°
120°
120°
90°
60°
60°
90°
120°
120°
90°
60°
150°W 180°
150°W 180°
30°W 0°
60°N 60°S
30°
60°S
120°
180°
60°S
0° 30°30° 60°60° 90°90° 120°120° 150°150° 180°180°
0°
30°
60°N
0° 30°30° 60°
60°
90°
90°
120°
0°
30°
30°
60°N
150°
30°W 0°
60°
90°
120°
120°
90°
60°
60°
90°
120°
120°
90°
60°
150°W 180°
150°W 180°
30°W 0°
60°N 60°S
0 10001000 2000 3000km
Equator Equator
East of Greenwich
West of Greenwich East of Greenwich
30°E
150°E
150°E
30°E
Equator Equator
East of Greenwich
West of Greenwich East of Greenwich
30°E
150°E
150°E
30°E
Satellite images
Europe index map
Maps covering small areas, mainly derived from high resolution satellite images
Maps covering large areas
World index map(See the index map for Europe on the back inside cover)
Scale on Equator
AntarcticaArctic
The World Map Index
272
266
246
251
254
256, 257
258
235234
220
226
184
179
162 162
161
168
168
137
136
143
142, 143
145144
151
150, 151
154
156
86142
87
90
90
91
94
94-97
100
100-101
101
115
114
116
114
115
118
119
122
122-123127126
126-127
36
44
273
169
280281
279
260
242, 243
255
247
264
263
227
223
203
199
189
185
213
208
230
157
151
149
134-135134
118
118-119
103
103
210, 211
136, 137
128-129
128
224-225
216-217, 216
124, 125
193, 194, 195
148
160
160
168
192
198
186-187
188
210, 211
212218, 219
220-221
222
223
230
230-231
239238
250 251
260
262
262
265
278
278278
280
281
282
283
246
174175
155
199
234
82
145
144
173
174175
156
128, 129
128
260157
173
82
179
178
99
8985
85
85
81
49
48
48
23
2119
17
15
269241
233
229
205
201
197
191
183
171
153
147
133
131
131
121113
141
81
23
15
131
48
171
93215
99
8985
85
85
81
49
48
48
23
2119
17
15
269241
233
229
205
201
197
191
183
171
153
147
133
131
131
121113
141
81
23
15
131
48
171
93215
© Globe View 2016
Contributors in alphabetical order
OriginatorESA/ESRIN
ConceptLothar Beckel, Markus Eisl, Mario Fest
Project managementMarkus Eisl, Mario Fest, Martin Unterdechler
Satellite image processingMarco Fröhner, Judith Grubinger, Gerald Mansberger, Gerald Ziegler
CartographyMarkus Daichendt, Manfred Egger, Marko Fröhner, Astrid Köpf, Hannes Krause, Daniela Kühnlenz, Helmut Perl, René Pfahlbusch, Andrea Spannring
Layout and typesettingMario Fest, Hannes Krause, René Pfahlbusch
Authors (if not stated differently)Nicolas Ackermann, Markus Daichendt, Markus Eisl, Mario Fest, Hannes Krause, Kerstin Peuker, Michael Rast, Francesco Sarti, William White
EditingNicolas Ackermann, Fabiano Costantini, Mathieu Depoorter Reinhold Drazansky, Markus Eisl, Diego Fernandez, Mario Fest, Mario Hernandez, Benjamin Kötz, Juerg Lichtenegger, Antonios Mouratidis, Michael Rast, Ute Rosner, Roberto Sabia, Francesco Sarti, Peter Brøgger Sørensen, Chris Stewart, William White
TranslationToptranslation, Germany
PrintUeberreuter, 2015, Austria
1st English Edition, 2015ISBN 978-3-903073-00-5, Globe View press, Austria
Web resources:http://www.world-of-water.orghttps://earth.esa.int/web/guest/ESA_World_of_Water
© Copyright2015 ESA/ESRIN, Frascati, Italy.
All rights reserved. No part of this work may be reproduced in any form (photocopy, microfilm or any other method) with-out the prior written consent of ESA/ESRIN, Frascati, Italy or processed, reproduced or distributed using any electronic system.
© Satellite image data•BlackBridge AG (formerly RapidEye), Berlin, Germany•Canadian Space Agency (CSA), Longueuil, Canada, Defence Research and Development Canada (DRDC and MacDonald Dettwiler and Associates Geospatial Services Inc. (MDA GSI), Richmond, Canada
•Centre National d’Études Spatiales (CNES), Distribution Astrium Services/Spot Image, France
•CNES, distributed by VITO, Mol, Belgium•DigitalGlobe, Longmont, USA•e-GEOS - TELESPAZIO, Rome, Italy•Earth Resources Observation and Science (EROS) Center, U.S. Geological Survey, Sioux Falls, USA
•EUMETSAT, Darmstadt, Germany•European Space Agency ESA-ESTEC, Noordwijk, Netherlands•European Space Agency ESA-ESRIN, Frascati, Italy•European Space Agency (ESA, HQ), Paris, France•EUROPEAN SPACE IMAGING (EUSI), Munich, Germany•NASA, Goddard Space Flight Center, USA
Notes:This atlas is not to be used as a reference work for political borders.Unless specified differently, all maps in this book are oriented north.Please use the map index in the front and back covers to locate the individual maps.
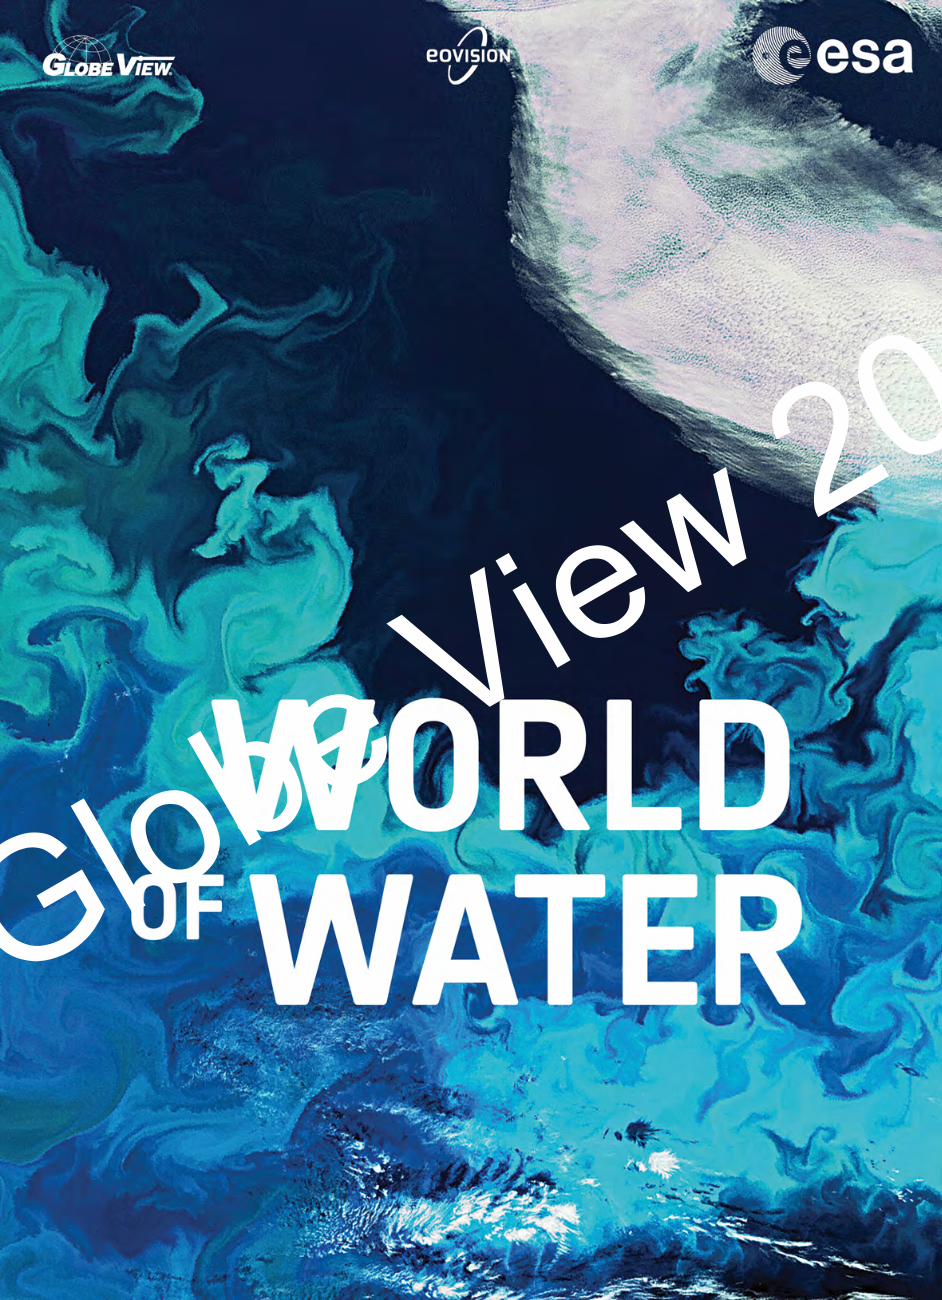
WATERWORLD
OF
A contribution of theEuropean Space Agency
towards a better understandingof a global challenge© Globe View 2016

Contents6 PREFACE6 Synoptic View from Space7 Global Responses to
Global Challenges
9 WoRld oF WAtER11 The Blue Gold of the 21st century11 The physical states of water12 The hydrosphere12 The water cycle12 The Sun as a driving force13 Water reservoirs13 Freshwater resources
25 PERSPECTIVES FROM SPACE
27 EuRoPE in sPACE28 The European Space Agency (ESA)28 The concept of Geographic Return
for Europe29 The European Environmental
Satellite (Envisat)30 The Copernicus Programme30 The Sentinels31 The Earth Explorers31 GOCE 31 SMOS31 CryoSat-2 32 Swarm32 ADM-Aeolus32 EarthCARE32 Biomass32 Earth Explorer 833 Navigation and telecommunication
satellites34 What’s the weather like?37 Water for Africa – the ESA TIGER
initiative37 TIGER projects
39 WAtER And sAtEllitEs40 Milestones in Earth Observation
from space40 Satellite orbits41 Characteristics of satellite data43 Satellite image resolution43 From the global to the local scale44 What can maps reveal?44 “We own the Night”45 From satellite images to maps46 Geographic Information Systems46 Data and Information47 Representing our world and
predicting its future48 Satellite image applications
51 WATER – THE GLOBAL PERSPECTIVE
53 thE bluE PlAnEt54 Water in the geological eras55 Water – the essence of life56 Topography and bathymetry58 Precipitation distribution60 Temperature distribution61 Evapotranspiration63 Climate zones of the world65 Land cover and land use66 Population distribution69 Natural hazards70 Availability and consumption of
water
73 WAtER tREAtiEs74 International water resources74 Water conflicts and hydro-diplomacy75 “Water for Peace”75 Development of international water
resources norms and institutions76 International water agencies
79 WATERS OF THE EARTH
81 GlACiERs82 Malaspina Glacier82 David Glacier83 Aletsch Glacier
85 RivERs oF thE EARth86 The end of the journey − the river's
mouth86 Deltas87 Estuaries
89 Colorado90 Agreements for the Colorado River90 Large-scale projects on the Colorado91 Water management with satellite
data
93 Mississippi93 Mississippi River Delta94 Flooding as a recurring event
99 Amazon101 The Amazon Basin101 The mouth of the Amazon102 Impact of population and industry
in the Amazon Basin
105 danube105 Danube Delta – World Heritage site105 The exploitation of the Danube107 The Iron Gate 1 hydroelectricity plant107 Gabcíkovo hydroelectric power
station108 The Danube as a waterway
111 Rhine111 The Rhine as a waterway
113 nile113 The Nile Delta115 The Aswan Dam
117 A precious resource for many countries
117 Egypt – a gift of the Nile
119 Congo119 The Congo Basin
121 Yangtze121 The Yangtze Delta124 The Yangtze Dams
127 brahmaputra127 The Ganges Delta
129 ob129 Industry on the banks of the Ob
131 lAkEs oF thE EARth
133 Great lakes133 Saint Lawrence Seaway –
the link to the North Atlantic135 Niagara Falls – natural wonder
and energy source135 Welland Canal
137 lake titicaca137 The floating islands of the Uros
people
139 lake Garda
141 the Aral sea142 The slow poisoning of the Aral Sea
and its effects142 Climate change and the shrinking
lake143 Possible solutions
145 lake baikal
147 lake victoria148 Population density148 The invation of water hyacinths148 The Nile perch – a voracious predator148 Water pollution149 Falling water levels
151 lake Eyre151 A lake in Australia’s outback
153 lake Chad154 Significance of Lake Chad
for the local populations154 Why is Lake Chad shrinking?155 Lake Chad Basin Commission
157 tundra lakes157 Is the tundra drying out?157 Life on the tundra
159 oCEAns160 Global ocean currents160 The Gulf Stream and its formation161 The Gulf Stream and the climate161 Currents in the Mediterranean Sea162 El Niño, La Niña and ENSO162 Coupling between currents163 Far-reaching consequences163 The future of El Niño164 Phytoplankton164 Algal bloom166 Low and high tides167 Global rise in sea levels167 Effects of sea level rise on
coastal regions
167 Coastal protection measures168 The rubbish dump of developed
and developing countries168 Great Pacific Garbage Patch –
a new continent?169 Treat the cause or the effect?169 The Seventh Continent and satellite
technology
171 PolAR REGions171 Floating ice in the oceans
and ice on land171 Differences between the Arctic
and Antarctica172 Satellites and ice monitoring
173 Arctic173 Living conditions in the Arctic173 Arctic sea ice extent174 Arctic sea ice thickness175 Permafrost175 Greenland and Petermann Glacier175 Sea level rise
177 Antarctica178 The ice sheet of Antarctica 178 Ice thickness in Antarctica179 Antarctic ice streams179 Ice sheet movements:
the Ross Ice Shelf
181 WATER FOR HUMANITY
183 CitiEs185 Cities built on water185 Major cities – the proximity to water186 Land reclamation and prosperity189 Spatial patterns of rural settlements
in the Jiangsu Province189 The Grand Canal in China
191 Mexico City191 Water availability192 Main sources of water for
Mexico City195 Wastewater management
197 Johannesburg197 Urban development198 Water supply198 The Lesotho Highlands Water Project199 The Vaal Dam199 Wastewater treatment in
Johannesburg
201 dhaka201 Monsoon floods203 Drinking water supply and
wastewater disposal
205 WAtER ACCEss206 The fog-harvesting technique206 Eritrea project:
the success of fog-harvesting207 Fog-harvesting in Morocco –
providing water to villages207 The future of fog-harvesting208 Transporting water
211 Groundwater in the Sahara211 AQUIFER project211 Monitoring of subsidence using
radar satellites213 Water supply in Saudi Arabia –
a challenge213 Seawater desalination plants
215 iRRiGAtion217 Paddy field farming217 Rice terraces in Bali217 Rice and methane218 Inner Niger Delta218 Agriculture around the Inner Niger
Delta219 "Office du Niger"219 Desertification in the Sahel221 Irrigated farming in the southeast of
Australia221 Shepparton Irrigation Region221 Barossa Valley223 Dryland salinity in the southwest of
Australia225 The Al Kufra oases225 The Great Man-Made River project227 Irrigation in Saudi Arabia227 Centre-pivot irrigation systems
229 WAtER-usE CoMPEtition229 Hypoxia in the Gulf of Mexico231 The Caribbean – a paradise whose
days are numbered
233 utilisAtion ConFliCts233 Water usage rights on the Tigris
and the Euphrates237 Bilateral water management
between Spain and Portugal237 The Albufeira Drought
Management Agreement238 The Okavango Delta239 Biodiversity in the Okavango Delta239 Utilisation conflicts in the Okavango
Delta
241 industRY And tRAnsPoRt242 Salt from the Dead Sea243 Characteristics of the Dead Sea243 The Red Sea-Dead Sea Conduit –
“Two Seas Canal”244 Oil pollution in the seas245 The sinking of the ‘Prestige’245 Oil slicks: impacts and clearance245 Tracking oil spills from space246 Deepwater Horizon –
oil spill in the Gulf of Mexico246 The chronology of the disaster247 Oil slicks and ocean currents247 The oil slick below the sea surface247 Countermeasures and consequences249 Cyanide and heavy metal mining
accident in the Tisza basin249 Cyanide in gold mining249 Damage from the cyanide disaster
in 2000 at Baia Mare251 The Great Barrier Reef251 Coral bleaching –
a worldwide threat to reefs251 Nature and business on the Great
Barrier Reef
253 The Kaprun hydroelectric stations253 The hydroelectric power stations
and the Kapruner Ache254 Lake Powell254 Itaipu Reservoir255 Iguaçu/Iguazú Falls257 Lake Maracaibo257 Oil underneath Lake Maracaibo257 Lemna minor258 Global shipping258 The Suez Canal259 The English Channel259 The Port of Rotterdam261 Sea ice navigation in the Arctic
supported by satellite images261 The danger of icebergs263 The fishing industry 263 Fishing techniques265 Aquaculture267 Aquaculture – a blessing or a curse?267 Squid fishing at night267 Do we have to stop eating fish?
269 nAtuRAl hAzARds270 Causes of floods270 Storm surges271 River floods271 Flash floods272 Tsunamis273 Increasing impact of worldwide
floods274 Prevention strategies against floods275 The potential risks for the future276 Central European floods
in 2002276 The Elbe floods in Saxony and Czech
Republic276 Flood damage along the Elbe and
Danube277 The Danube floods in Austria277 Flood mapping using radar279 Hurricane Katrina279 Katrina’s course279 Katrina´s damages in New Orleans281 The Sumatra-Andaman earthquake281 Propagation speed of the tsunami281 Mapping tsunami damages using
satellite images281 GITEWS – The German-Indonesian
Tsunami Early-Warning System283 Droughts and soil moisture
monitoring283 The rainy season in southern Africa
284 ExtERnAl AuthoRs
285 indEx oF GEoGRAPhiCAl nAMEs
291 subJECt indEx
294 iMAGE CREdits
296 GlossARY
299 REFEREnCEs
4 5
© Globe View 2016

WATER FOR HUMANITYWater will play a major role in our future. Many of humanity's problems are either directly or indirectly linked to it. This includes not only access
to water but also dealing with water shortages and water surpluses
© Globe View 2016
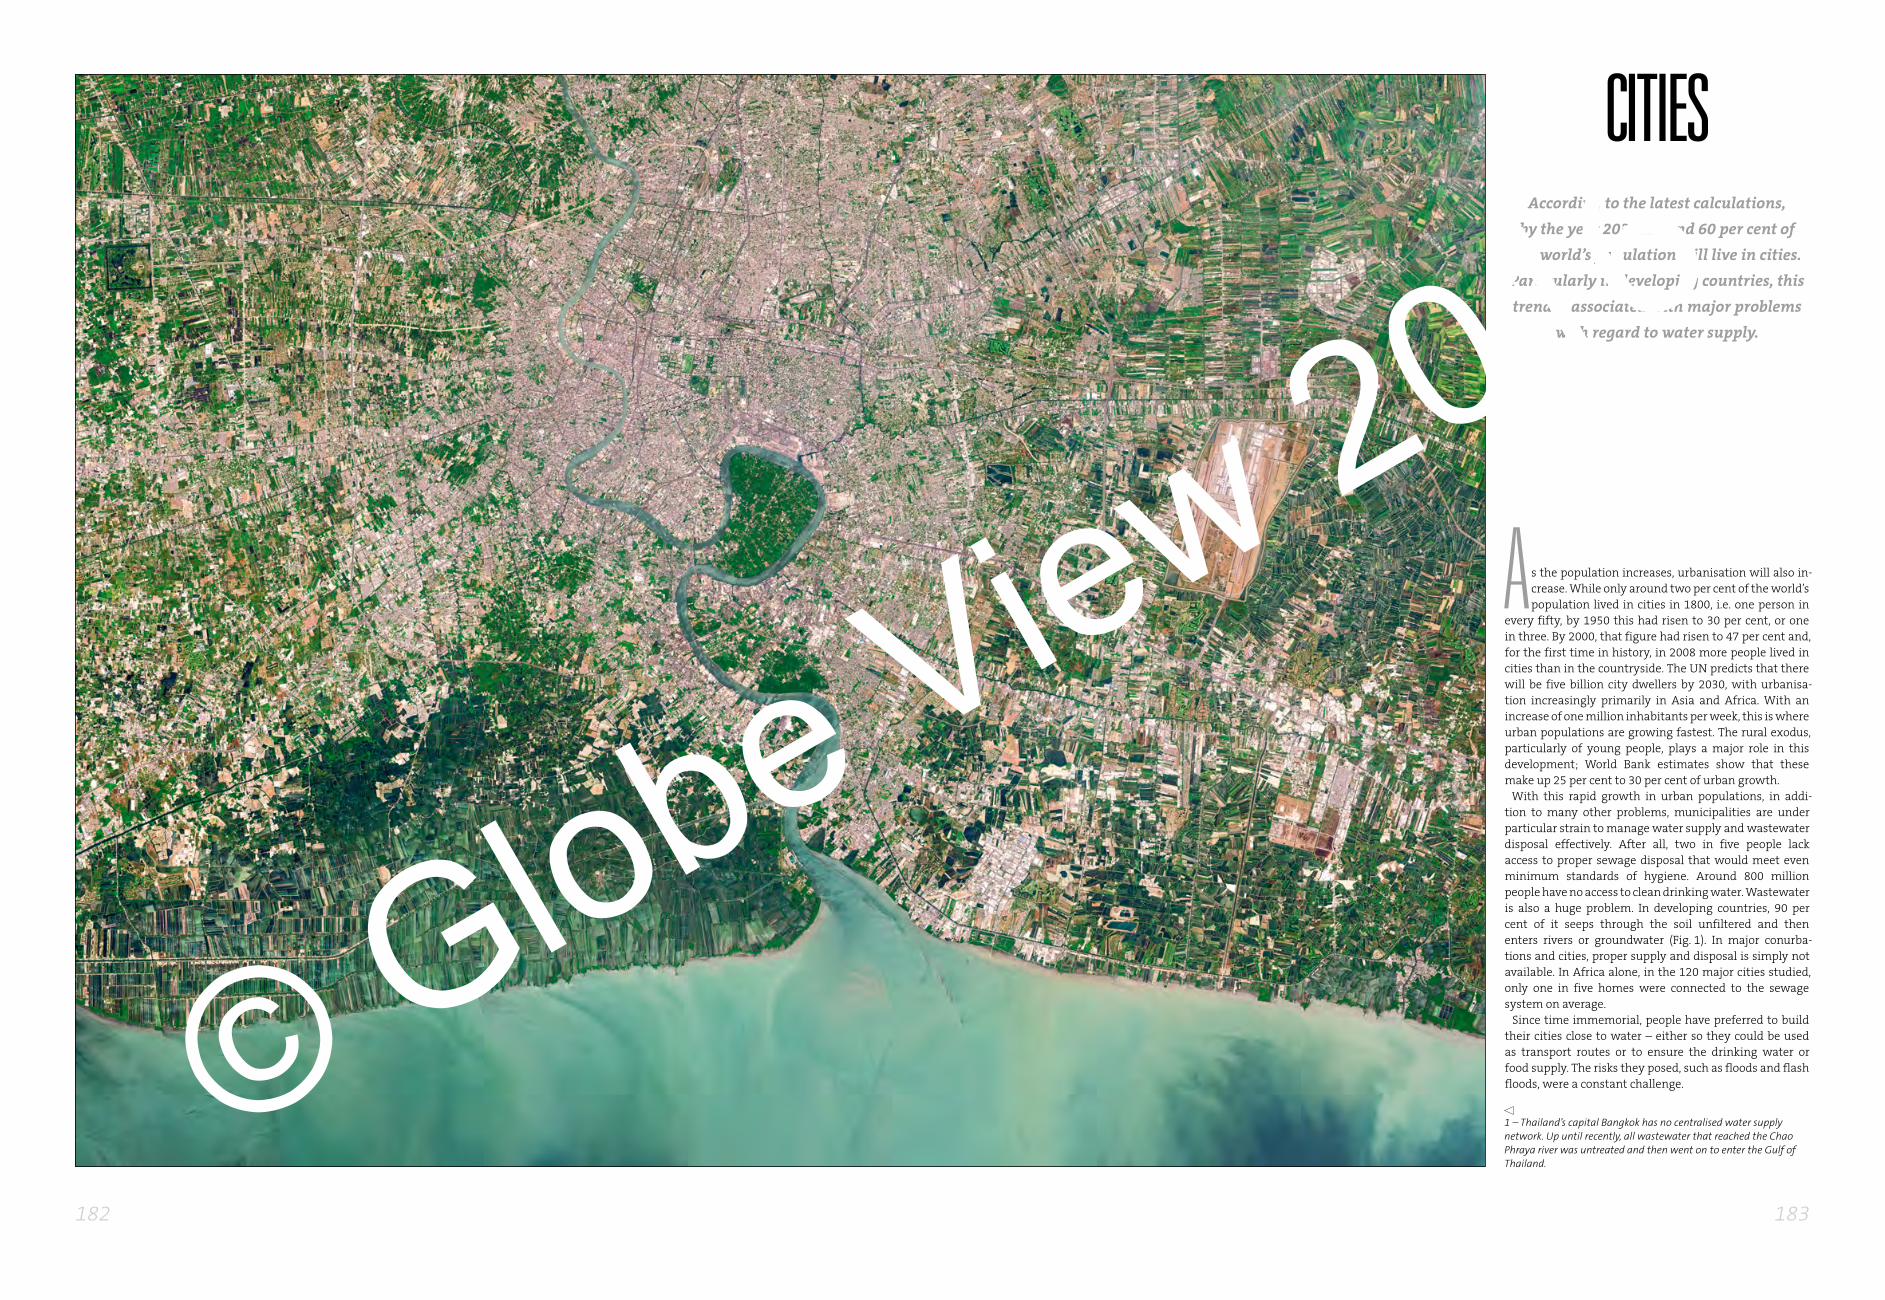
1 – Thailand’s capital Bangkok has no centralised water supply network. Up until recently, all wastewater that reached the Chao Phraya river was untreated and then went on to enter the Gulf of Thailand.
citiesAccording to the latest calculations,
by the year 2030 around 60 per cent of
the world’s population will live in cities.
Particularly in developing countries, this
trend is associated with major problems
with regard to water supply.
A s the population increases, urbanisation will also in-crease. While only around two per cent of the world’s population lived in cities in 1800, i.e. one person in
every fifty, by 1950 this had risen to 30 per cent, or one in three. By 2000, that figure had risen to 47 per cent and, for the first time in history, in 2008 more people lived in cities than in the countryside. The UN predicts that there will be five billion city dwellers by 2030, with urbanisa-tion increasingly primarily in Asia and Africa. With an increase of one million inhabitants per week, this is where urban populations are growing fastest. The rural exodus, particularly of young people, plays a major role in this development; World Bank estimates show that these make up 25 per cent to 30 per cent of urban growth.
With this rapid growth in urban populations, in addi-tion to many other problems, municipalities are under particular strain to manage water supply and wastewater disposal effectively. After all, two in five people lack access to proper sewage disposal that would meet even minimum standards of hygiene. Around 800 million people have no access to clean drinking water. Wastewater is also a huge problem. In developing countries, 90 per cent of it seeps through the soil unfiltered and then enters rivers or groundwater (Fig. 1). In major conurba-tions and cities, proper supply and disposal is simply not available. In Africa alone, in the 120 major cities studied, only one in five homes were connected to the sewage system on average.
Since time immemorial, people have preferred to build their cities close to water – either so they could be used as transport routes or to ensure the drinking water or food supply. The risks they posed, such as floods and flash floods, were a constant challenge.
182 183
© Globe View 2016

The Metropolitan Area of Valley of Mexico (of which Mexico City is part), spreads over 7,815 square kilo-metres, of which 1,484 square kilometres are taken up
by the capital itself (Fig. 1). At 2,310 metres above sea level, Mexico City is one of the highest capitals on Earth. With more than 21 million inhabitants, the metropolitan area also has the highest population in the country and 20 per cent of Mexico´s entire population. Around 9 million peo-ple lived in the city itself in 2013. Mexico City is one of the largest and fastest-growing cities in the world. Between 1990 and 2000, the growth rate for the metropolitan region was 2.9 per cent and 0.4 per cent for Mexico City.
The expanding population, as well as the rapidly increas-ing industrial, services and commercial activities, have represented a formidable challenge for the institutions responsible for providing the necessary services, includ-ing water and sanitation, primarily in terms of manage-ment, investments and energy consumption.
Water availabilityThe water supply in the metropolitan area depends pri-marily on local groundwater sources and on interbasin transfers. Mexico City, and the most populated 17 mu-nicipalities of the State of Mexico, share the same sources of water, as well as the infrastructure for water distribu-tion. In 2002, the volume of water supplied to the metro-
Mexico ciTyMexico City is the capital of the
Latin American country Mexico and
one of the biggest cities in the world.
The metropolitan area of the city is
home to more than 21 million people.
1 – The agglomeration of Mexico City sprawls within the approx.
2,300 m high Valley of Mexico, closed in by mountains. The
Popocatépetl and Iztaccíhuatl volcanoes lie southeast of the city.
190 191
© Globe View 2016
100°W 99°
20°N
19°
99°10'W
19°30'N
19°20'
99° 98°50'
0
10
20
30
40
010 10 20km 02 2 4km
Toluca
Heroica Zitácuaro
Mexico City
Stabilization PondDonato Guerra
Sta. Isabel Tank
Pericos Tank
Tank No. 3
Emiliano ZapataTank
Barrientos Tank
Coacalca Tank
Cerro Gordo Tank
La Caldera Tank
Teuhtli Tank
Pungaran
cho
Tuxp
an
Cutzam
ala
Cutzamala
Villa Victoria Dam
El Bosque Dam
Valle de Bravo Dam
Ixtapan del Oro Dam
El TuleDam
Chilesdo Dam
Colorines Dam
Tuxpan Dam
Lerma
Subsidence rate in cm/year
No data
Raw wastewater
Wastewater used
Diluted wastewater
Natural treated water
Drainage water
Settlement
Main outfall of wastewater
River with dam
Tunnel
Aqueduct
Water tank
Flow direction ofdrinking water
Drinking water supplyWater treatment plant
Data acquired between20.06. and 29.08.2003
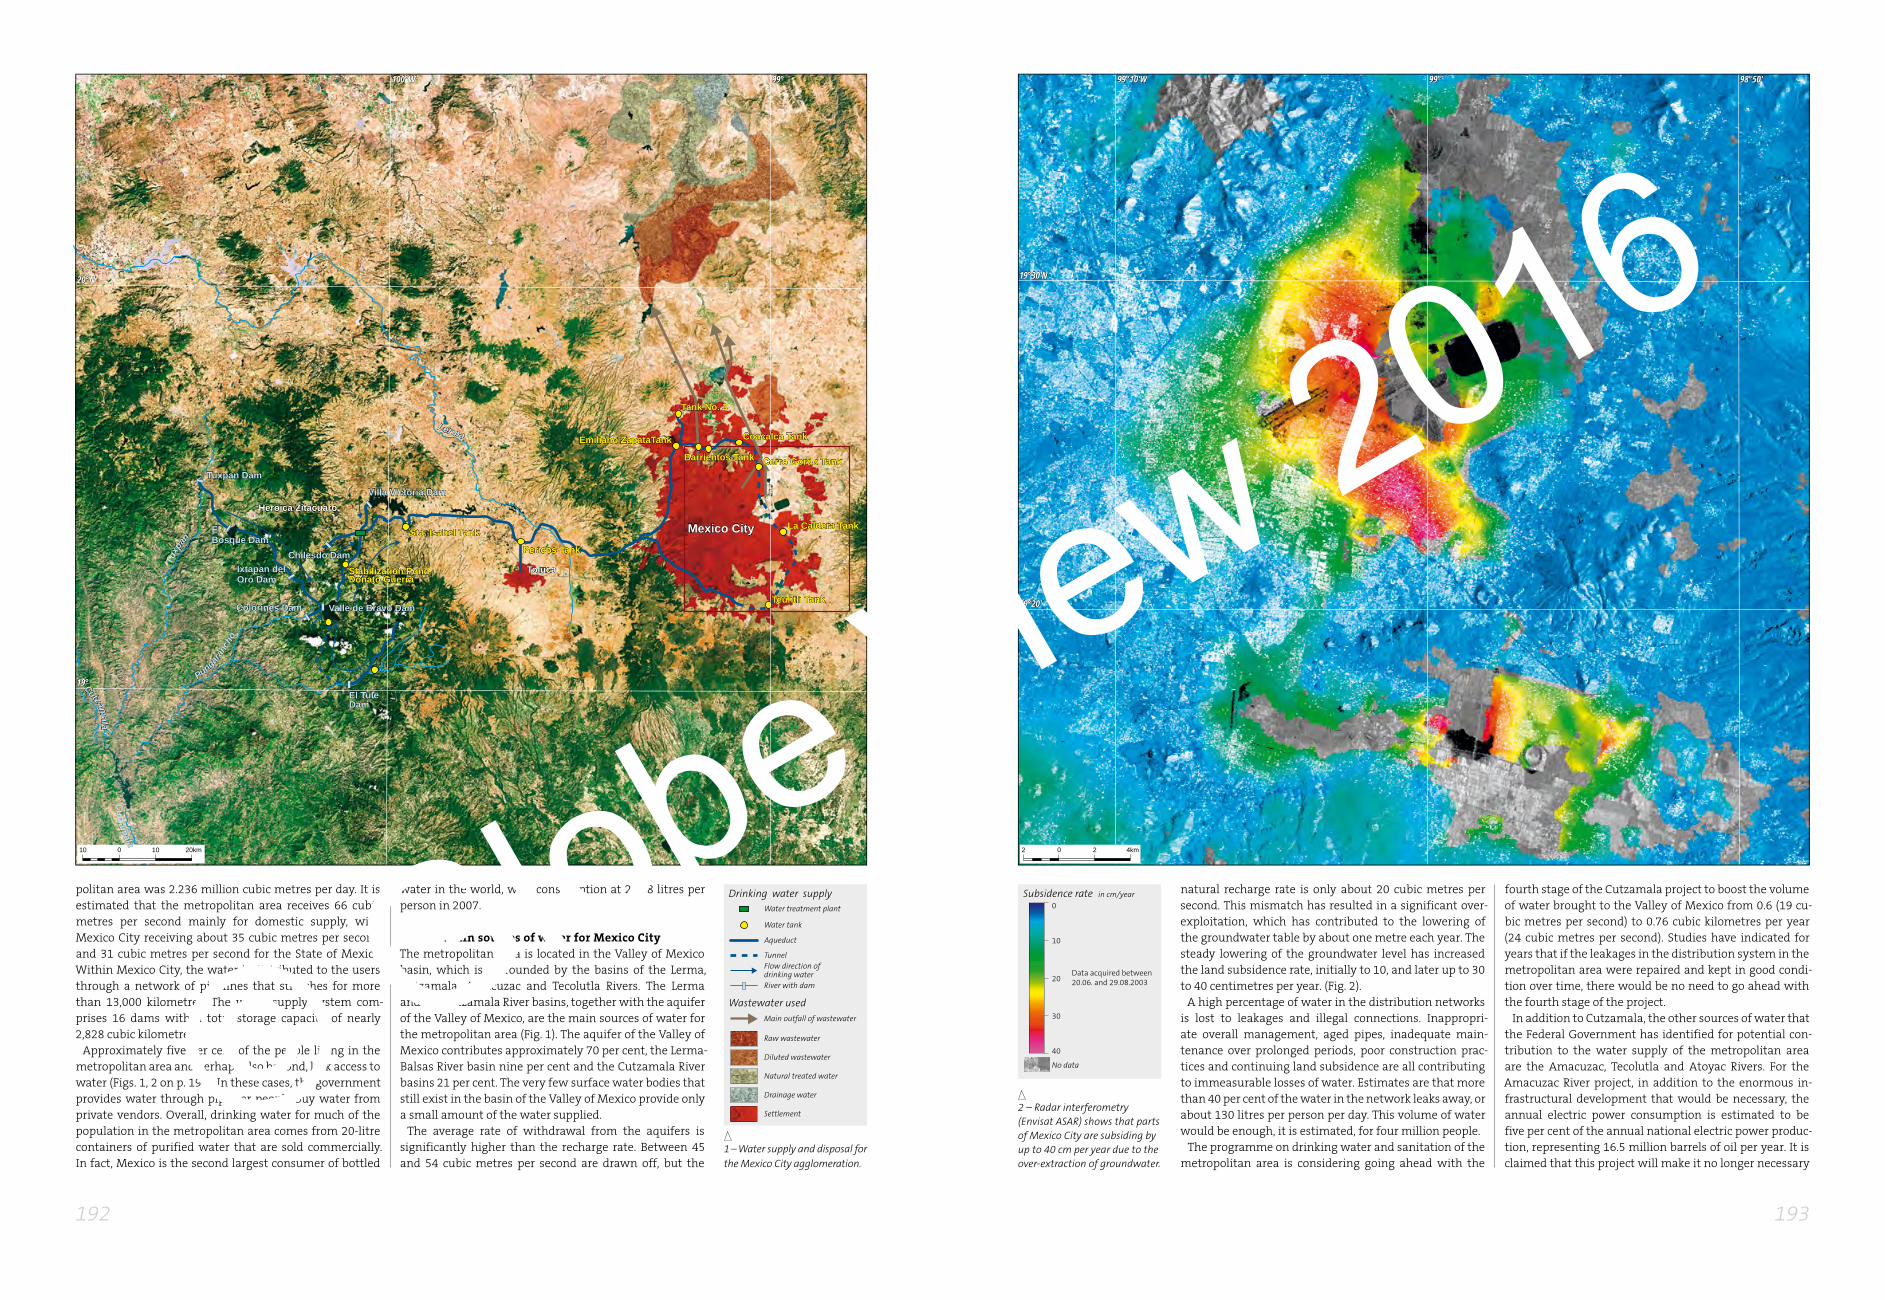
politan area was 2.236 million cubic metres per day. It is estimated that the metropolitan area receives 66 cubic metres per second mainly for domestic supply, with Mexico City receiving about 35 cubic metres per second and 31 cubic metres per second for the State of Mexico. Within Mexico City, the water is distributed to the users through a network of pipelines that stretches for more than 13,000 kilometres. The water supply system com-prises 16 dams with a total storage capacity of nearly 2,828 cubic kilometres.
Approximately five per cent of the people living in the metropolitan area and perhaps also beyond, lack access to water (Figs. 1, 2 on p. 194). In these cases, the government provides water through pipes or people buy water from private vendors. Overall, drinking water for much of the population in the metropolitan area comes from 20-litre containers of purified water that are sold commercially. In fact, Mexico is the second largest consumer of bottled
water in the world, with consumption at 204.8 litres per person in 2007.
Main sources of water for Mexico CityThe metropolitan area is located in the Valley of Mexico basin, which is surrounded by the basins of the Lerma, Cutzamala, Amacuzac and Tecolutla Rivers. The Lerma and the Cutzamala River basins, together with the aquifer of the Valley of Mexico, are the main sources of water for the metropolitan area (Fig. 1). The aquifer of the Valley of Mexico contributes approximately 70 per cent, the Lerma-Balsas River basin nine per cent and the Cutzamala River basins 21 per cent. The very few surface water bodies that still exist in the basin of the Valley of Mexico provide only a small amount of the water supplied.
The average rate of withdrawal from the aquifers is significantly higher than the recharge rate. Between 45 and 54 cubic metres per second are drawn off, but the
1 – Water supply and disposal for the Mexico City agglomeration.
natural recharge rate is only about 20 cubic metres per second. This mismatch has resulted in a significant over-exploitation, which has contributed to the lowering of the groundwater table by about one metre each year. The steady lowering of the groundwater level has increased the land subsidence rate, initially to 10, and later up to 30 to 40 centimetres per year. (Fig. 2).
A high percentage of water in the distribution networks is lost to leakages and illegal connections. Inappropri-ate overall management, aged pipes, inadequate main-tenance over prolonged periods, poor construction prac-tices and continuing land subsidence are all contributing to immeasurable losses of water. Estimates are that more than 40 per cent of the water in the network leaks away, or about 130 litres per person per day. This volume of water would be enough, it is estimated, for four million people.
The programme on drinking water and sanitation of the metropolitan area is considering going ahead with the
fourth stage of the Cutzamala project to boost the volume of water brought to the Valley of Mexico from 0.6 (19 cu-bic metres per second) to 0.76 cubic kilometres per year (24 cubic metres per second). Studies have indicated for years that if the leakages in the distribution system in the metropolitan area were repaired and kept in good condi-tion over time, there would be no need to go ahead with the fourth stage of the project.
In addition to Cutzamala, the other sources of water that the Federal Government has identified for potential con-tribution to the water supply of the metropolitan area are the Amacuzac, Tecolutla and Atoyac Rivers. For the Amacuzac River project, in addition to the enormous in-frastructural development that would be necessary, the annual electric power consumption is estimated to be five per cent of the annual national electric power produc-tion, representing 16.5 million barrels of oil per year. It is claimed that this project will make it no longer necessary
2 – Radar interferometry (Envisat ASAR) shows that parts of Mexico City are subsiding by up to 40 cm per year due to the over-extraction of groundwater.
192 193
© Globe View 2016

99°20'W 99°
19°40'N
19°20'
99°20'W 99°
19°40'N
19°20'
99°20'W 99°
19°40'N
19°20'
M É X I C O
HIDALGO
D I S T R I T O F E D E R A L
M É X I C O
D I S T R I T O F E D E R A L
M É X I C O
D I S T R I T O F E D E R A L
HIDALGO HIDALGOHIDALGOHIDALGO
HIDALGO
05 5 10km
05 5 10km
05 5 10km
Socioeconomic levelHouses without drinkingwater
Houses without sewageinfrastructure
State boundary
Very low
Low
Medium low
Medium
Medium high
High
State boundary
State boundary
Data: CentroGEO, National Research Councilfor Science and Technology, Mexico
Data: CentroGEO, National Research Councilfor Science and Technology, Mexico
Mid
Low
High
Very high
High
Medium high
Medium
Low
No data
Data: CentroGEO, National Research Councilfor Science and Technology, Mexico
1 – More than five per cent of Mexico City’s inhabitants are not connected to a drinking water supply network. Mexico is the second largest consumer of bottled water in the world.
2 – A wastewater disposal network is completely missing in some parts of the city, mainly due to the volcanic ground. Most of the houses use septic tanks, but nevertheless a great amount of untreated wastewater seeps away.
to draw off 50 cubic metres per second of groundwater from the Valley of Mexico aquifer. The rational is that the groundwater would be used only during severe droughts, or when the other water distribution systems shut down for maintenance. It has been estimated that, while each cubic metre of water from the Cutzamala River has required an investment of 23 million dollars, this estimate would increase four-fold for the Amacuzac River Project. Alternatives to this infrastructural development could be reduction of losses, water pricing and other water conser-vation practices.
Wastewater management The soil of Mexico City is basically clay, and thus suscepti-ble to compaction. Accordingly, the higher the volume of water abstracted, the higher the rate of land subsidence. The sinking of the city has resulted in extensive damages to its infrastructure, including water supply and sewer-age systems and degradation of the groundwater quali-ty. It has also required the construction of costly pump-ing stations to remove wastewater and stormwater from the city. The average volume of waste- and stormwater discharged into the metropolitan area sewerage system is about 2,897 million cubic metres, of which only six per cent is treated.
Since the city is located within a naturally closed hydro-logic basin, it is especially vulnerable to floods. Through-out history, artificial channels had to be constructed to bear waste- and stormwater away from the city. The rainy season in the metropolitan area is characterised by storms of high intensity over short duration. The average annual rainfall in the city is 800 millimetres: 500 in the eastern part and around 1000 towards the southern and west-ern parts. The main collector of the Deep Sewerage was
designed to carry about 200 cubic metres per second of water over a 45-hour period. However, it has carried up to 340 cubic metres per second. Such sudden fluctuations in the amounts of water create major operational and main-tenance problems. The 62-kilometre underground waste-water tunnel Túnel Emisor Oriente was started in 2009 and it is scheduled to be completed in 2014 (Fig. 1, p. 192). This eastern tunnel has been primarily built for flood control. It will provide support for the existing Emisor Central drainage tunnel (Deep Sewerage Tunnel).
The problems of water quantity and quality in the met-ropolitan area are multidimensional and are directly linked to regional economic development policies and steady increases in population. The government policies have attempted to promote the development of other urban centres to alleviate poverty and to provide improved standards of living as well as quality of life. One constraint stems from the fact that the demand for living spaces from the increasing population has contributed to major changes in land-use practices. Concrete and asphalt now cover areas that are needed for ground- water recharge. The southern area of the city is now heav-ily urbanised and hence is also one of the main sources of groundwater contamination due of the absence of a sew-erage network, which cannot be built at a reasonable cost (Fig. 2).
Lastly, there is no doubt that the potential for improving the existing and proposed water management practices is enormous. In order to be successful, it needs concurrently to consider linkages to policies on urban development (an issue that has been so far ignored), spatial planning and economic and environmental policy.
Text: Cecilia Tortajada
3 – The access to drinking water supply and to wastewater disposal networks is reflected in the socioeconomic levels of Mexico City.
4 – Dating back into the early 18th century, Mexico City’s Chapultepec Aqueduct is based on an even older Aztec construction.
194 195
© Globe View 2016
DEHU
0150 150 300 450km
DEBE
NL
UK
IE
ESPT
DK
CH AU
GR
IT
NOSE
FI
CZLU
FR
HURO
PL
SK
CY
EE
LV
LT
SI
MT
40°
50°
60°N
40°
50°
60°N
0° 20° 30° 40°
40°30°20°
30° 10°W20°
0°
50° 60°
40°
50°
60°N
40°
50°
60°N
0° 20° 30° 40°
40°30°20°
30° 10°W20°
0°
50° 60°10°E10°E
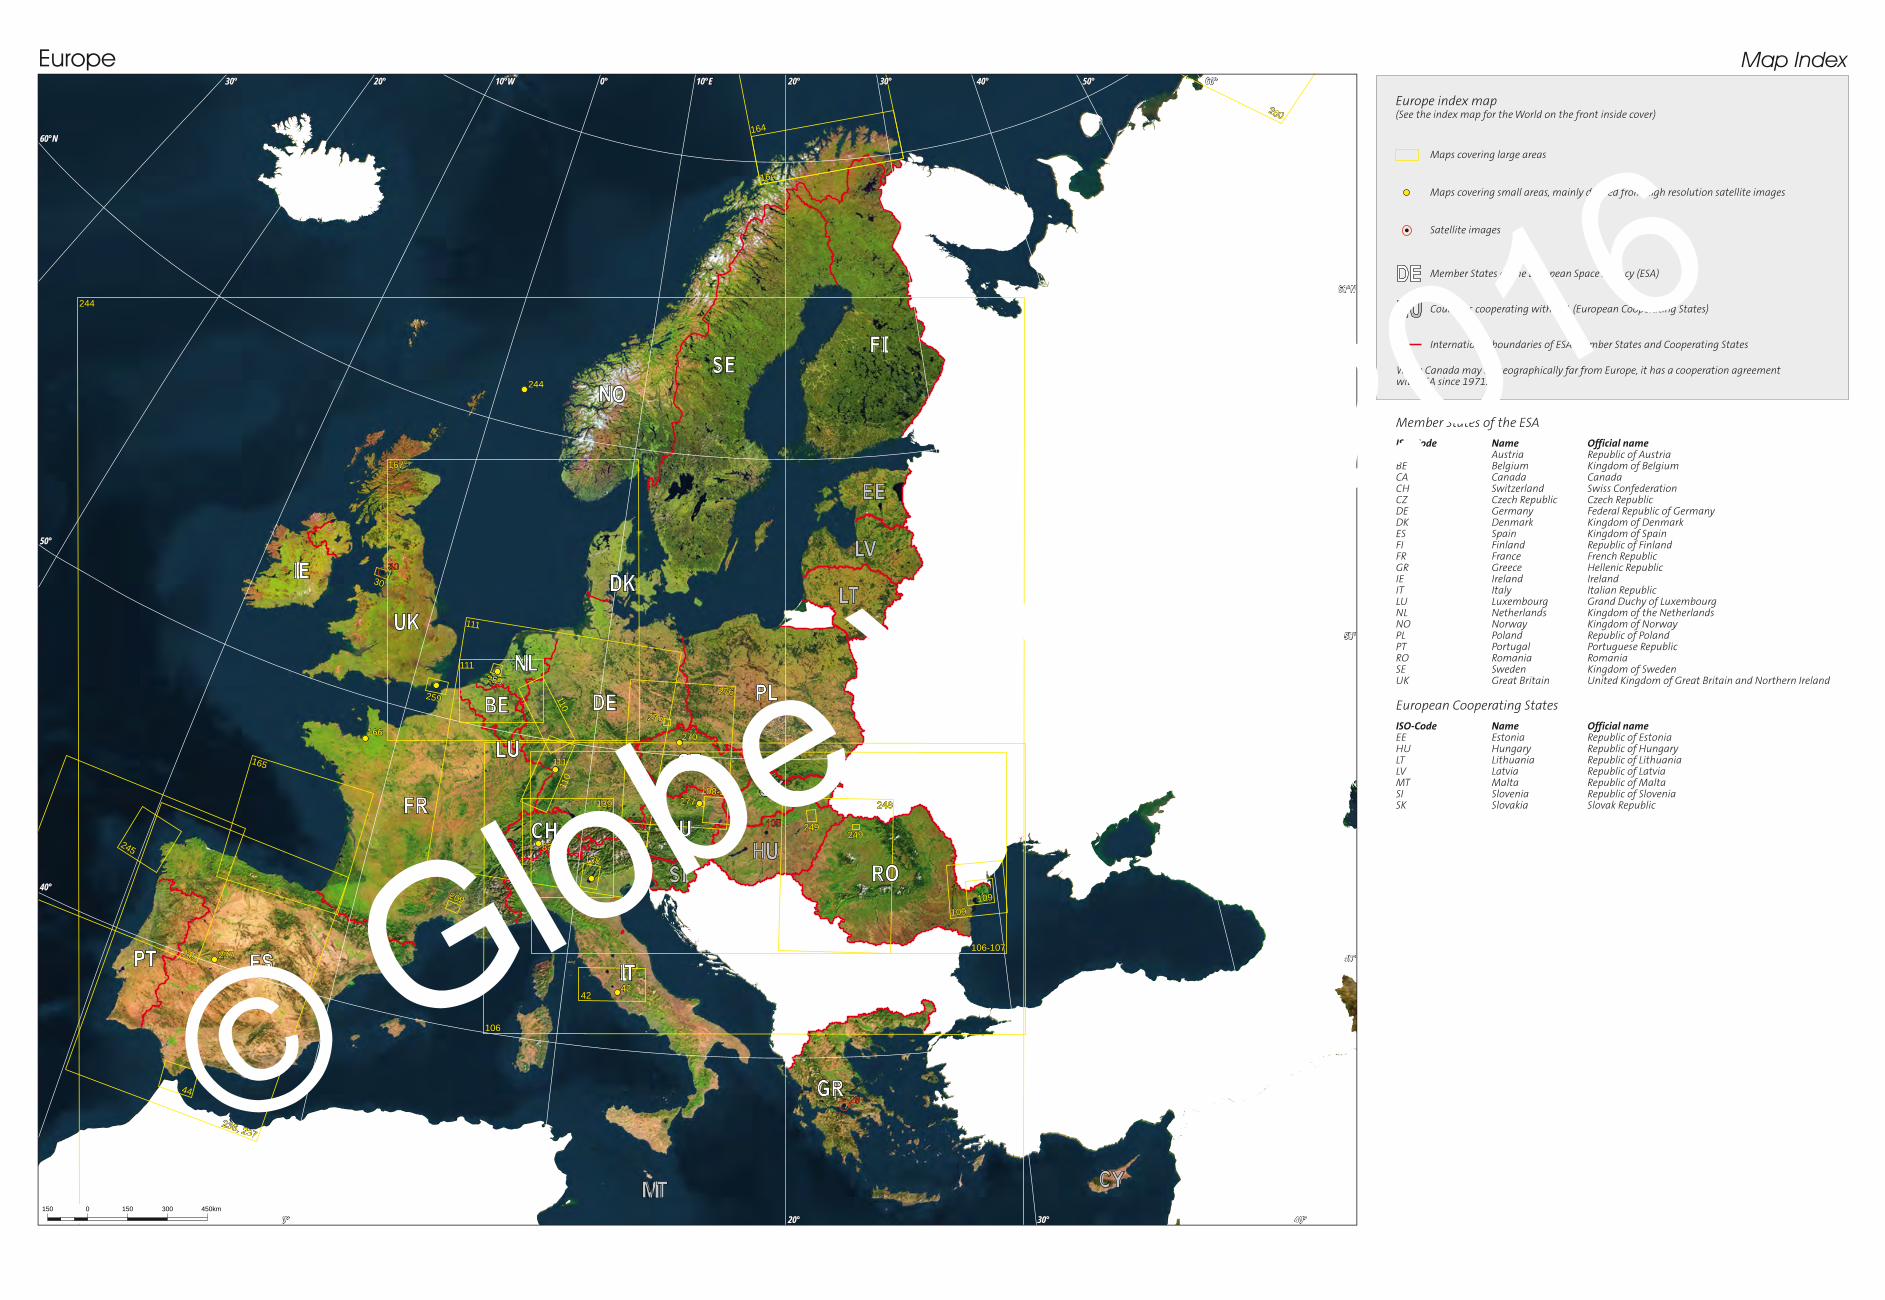
Europe Map Index
Europe index map(See the index map for the World on the front inside cover)
Maps covering small areas, mainly derived from high resolution satellite images
Maps covering large areas
Member States of the European Space Agency (ESA)
Countries cooperating with ESA (European Cooperating States)
International boundaries of ESA Member States and Cooperating States
While Canada may be geographically far from Europe, it has a cooperation agreementwith ESA since 1971.
Member States of the ESA
European Cooperating States
ISO-Code Name Official nameEE Estonia Republic of EstoniaHU Hungary Republic of HungaryLT Lithuania Republic of LithuaniaLV Latvia Republic of LatviaMT Malta Republic of MaltaSI Slovenia Republic of SloveniaSK Slovakia Slovak Republic
ISO-Code Name Official nameAT Austria Republic of Austria BE Belgium Kingdom of BelgiumCA Canada CanadaCH Switzerland Swiss ConfederationCZ Czech Republic Czech RepublicDE Germany Federal Republic of GermanyDK Denmark Kingdom of DenmarkES Spain Kingdom of SpainFI Finland Republic of FinlandFR France French RepublicGR Greece Hellenic RepublicIE Ireland IrelandIT Italy Italian RepublicLU Luxembourg Grand Duchy of LuxembourgNL Netherlands Kingdom of the NetherlandsNO Norway Kingdom of NorwayPL Poland Republic of PolandPT Portugal Portuguese RepublicRO Romania RomaniaSE Sweden Kingdom of SwedenUK Great Britain United Kingdom of Great Britain and Northern Ireland
Satellite images
276
277
276
106
245
245
248
249249
253
260
259
259
236, 237
209
165
164
164
167
139
138
106-107
109
108-109
109
111
110
111
110
30
42
44
83
47
42
270
244
237
111
166
244
49
30
29
10
10549
30
29
10
105
© Globe View 2016
© Globe View 2016


![[RTF] of 452 DOCUMENTS Copyright 2005 Globe Newspaper Company The Boston Globe December 31, 2005 Saturday THIRD EDITION SECTION: LIFE AT HOME; Pg. A10 LENGTH: 116 words HEADLINE: WINNING](https://img.pdfslide.us/doc/110x75/5ad8bd397f8b9a3e578dbb6f/rtf-of-452-documents-copyright-2005-globe-newspaper-company-the-boston-globe-december.jpg)