Embed Size (px)
Citation preview
THE SOCIETY OF MOTOR MANUFACTURERS
AND TRADERS LIMITED
2016 UK AUTOMOTIVE SUSTAINABILITY REPORT17th edition – 2015 data
THE SOCIETY OF MOTOR MANUFACTURERS AND TRADERSPage 2 | 2016 UK Automotive Sustainability Report
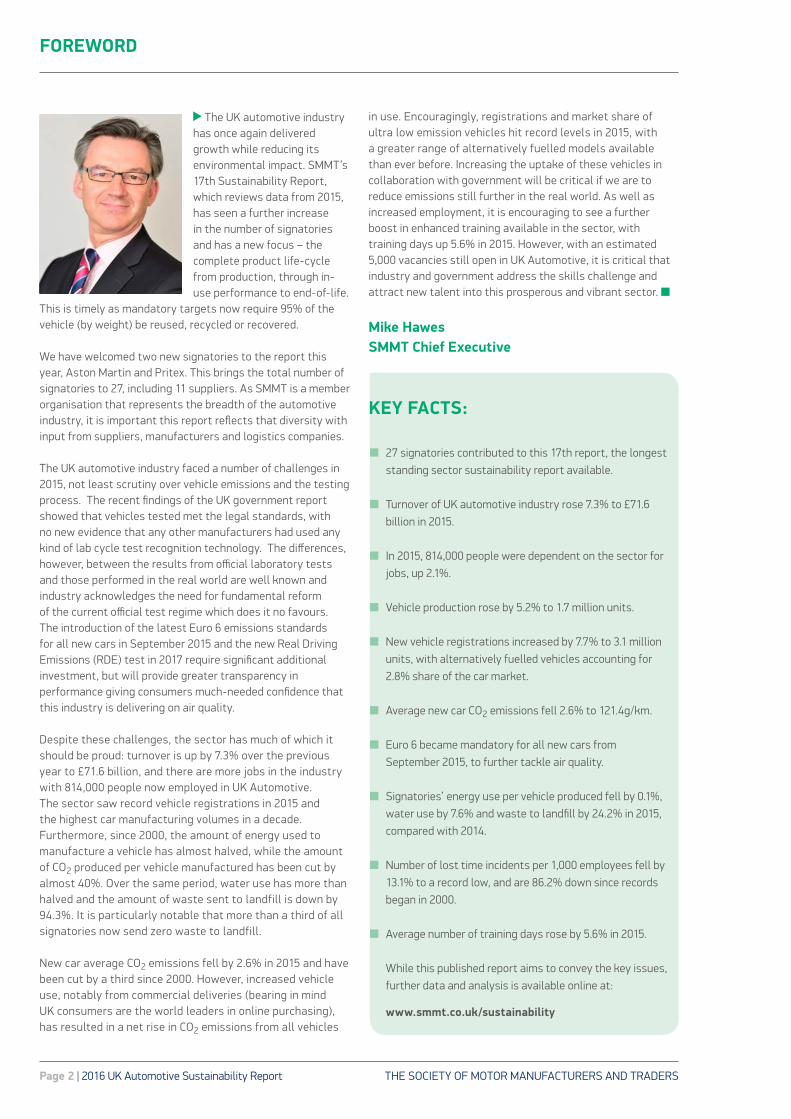
The UK automotive industry has once again delivered growth while reducing its environmental impact. SMMT’s 17th Sustainability Report, which reviews data from 2015, has seen a further increase in the number of signatories and has a new focus – the complete product life-cycle from production, through in-use performance to end-of-life.
This is timely as mandatory targets now require 95% of the vehicle (by weight) be reused, recycled or recovered.
We have welcomed two new signatories to the report this year, Aston Martin and Pritex. This brings the total number of signatories to 27, including 11 suppliers. As SMMT is a member organisation that represents the breadth of the automotive industry, it is important this report reflects that diversity with input from suppliers, manufacturers and logistics companies. The UK automotive industry faced a number of challenges in 2015, not least scrutiny over vehicle emissions and the testing process. The recent findings of the UK government report showed that vehicles tested met the legal standards, with no new evidence that any other manufacturers had used any kind of lab cycle test recognition technology. The differences, however, between the results from official laboratory tests and those performed in the real world are well known and industry acknowledges the need for fundamental reform of the current official test regime which does it no favours. The introduction of the latest Euro 6 emissions standards for all new cars in September 2015 and the new Real Driving Emissions (RDE) test in 2017 require significant additional investment, but will provide greater transparency in performance giving consumers much-needed confidence that this industry is delivering on air quality.
Despite these challenges, the sector has much of which it should be proud: turnover is up by 7.3% over the previous year to £71.6 billion, and there are more jobs in the industry with 814,000 people now employed in UK Automotive. The sector saw record vehicle registrations in 2015 and the highest car manufacturing volumes in a decade. Furthermore, since 2000, the amount of energy used to manufacture a vehicle has almost halved, while the amount of CO2 produced per vehicle manufactured has been cut by almost 40%. Over the same period, water use has more than halved and the amount of waste sent to landfill is down by 94.3%. It is particularly notable that more than a third of all signatories now send zero waste to landfill.
New car average CO2 emissions fell by 2.6% in 2015 and have been cut by a third since 2000. However, increased vehicle use, notably from commercial deliveries (bearing in mind UK consumers are the world leaders in online purchasing), has resulted in a net rise in CO2 emissions from all vehicles
in use. Encouragingly, registrations and market share of ultra low emission vehicles hit record levels in 2015, with a greater range of alternatively fuelled models available than ever before. Increasing the uptake of these vehicles in collaboration with government will be critical if we are to reduce emissions still further in the real world. As well as increased employment, it is encouraging to see a further boost in enhanced training available in the sector, with training days up 5.6% in 2015. However, with an estimated 5,000 vacancies still open in UK Automotive, it is critical that industry and government address the skills challenge and attract new talent into this prosperous and vibrant sector. n
Mike HawesSMMT Chief Executive
KEY FACTS:
n 27 signatories contributed to this 17th report, the longest standing sector sustainability report available.
n Turnover of UK automotive industry rose 7.3% to £71.6 billion in 2015.
n In 2015, 814,000 people were dependent on the sector for jobs, up 2.1%.
n Vehicle production rose by 5.2% to 1.7 million units.
n New vehicle registrations increased by 7.7% to 3.1 million units, with alternatively fuelled vehicles accounting for 2.8% share of the car market.
n Average new car CO2 emissions fell 2.6% to 121.4g/km.
n Euro 6 became mandatory for all new cars from September 2015, to further tackle air quality.
n Signatories’ energy use per vehicle produced fell by 0.1%, water use by 7.6% and waste to landfill by 24.2% in 2015, compared with 2014.
n Number of lost time incidents per 1,000 employees fell by 13.1% to a record low, and are 86.2% down since records began in 2000.
n Average number of training days rose by 5.6% in 2015.
While this published report aims to convey the key issues, further data and analysis is available online at: www.smmt.co.uk/sustainability
FOREWORD
THE SOCIETY OF MOTOR MANUFACTURERS AND TRADERS 2016 UK Automotive Sustainability Report Page 3
SUMMARY
ORPHAN VEHICLE SCHEM
E CO2 EMISSIONS
ORPHAN VEHICLE RECYCLING
SCHEME SET UP
WORKPLACE INCIDENTSDOWN 13.1%
> P
RO
DU
CTIO
N
> EN
D 0F LIFE VEH
ICLE
> U
SE
PEOPLE
RENEWABLE ENERGY
OUTPUT UP 5.2%1.7
MILLION UNITS
TO
REGISTRATIONS UP 7.7%
3.1 TO
95%
NEW CAR CO2 DOWN
2.6%TO 121.4G/KM
> VE
HIC
LE R
EG
ISTR
ATION
S >
> A
LTER
NAT
IVEL
Y FU
ELLE
D VE
HICL
ES (A
FV)
AFVs UP 40.7%MARKETSHARE2.8%
A RECORD HIGH
A RECORD LOW
WASTE PER VEHICLEDOWN 24.2%
A RECORD LOW
MILLION UNITS
BILLION
OF VEHICLE BY WEIGHT
RECYCLED/RECOVERED
> VEH
ICLE P
RO
DU
CTIO
N >
>
VE
HIC
LE W
AS
TE
RENEWABLE ENERGY REACHED
58.4 GWhA RECORD HIGH
VEHICLE REMANUFACTURING INDUSTRY WORTH
> R
EM
AN
UFA
CT
UR
ING
>
> VE
HIC
LE R
ECYC
LIN
G/RE
COVE
RY
£2.4
TRAINING
UP 5.3%
SECTOREMPLOYMENT UP 3.5%
814,000 TO
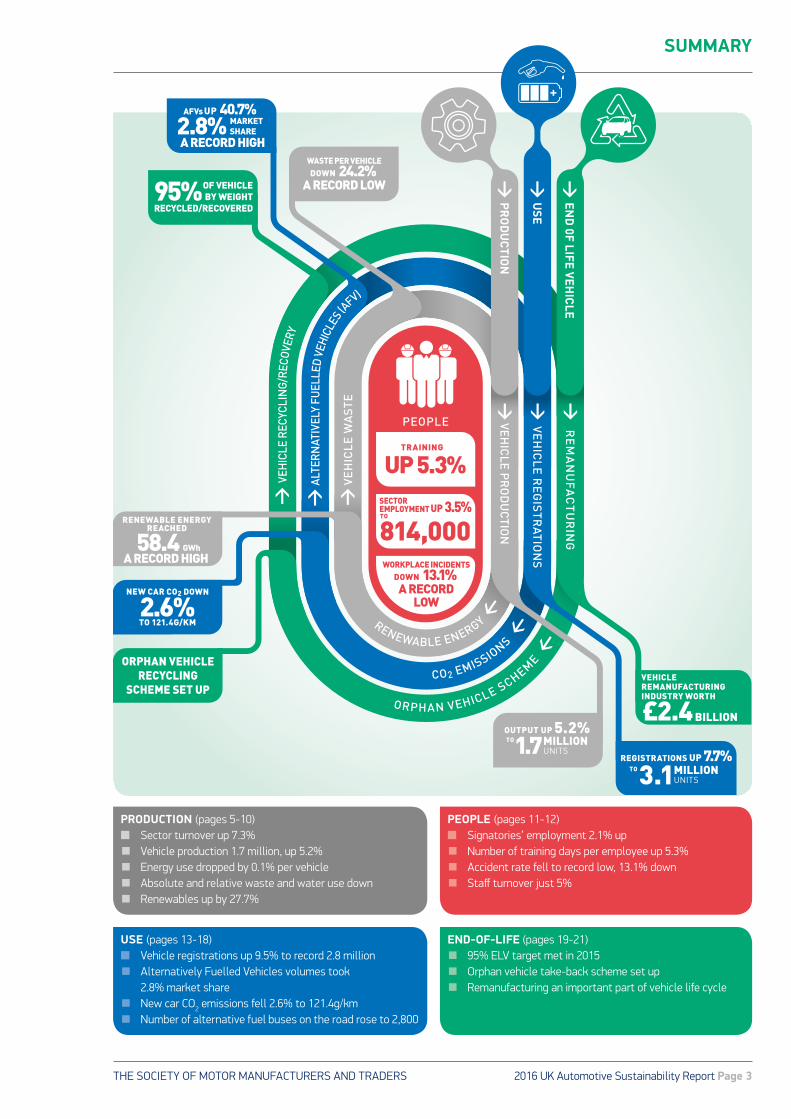
PRODUCTION (pages 5-10)n Sector turnover up 7.3%■ Vehicle production 1.7 million, up 5.2%■ Energy use dropped by 0.1% per vehicle■ Absolute and relative waste and water use down■ Renewables up by 27.7%
USE (pages 13-18)n Vehicle registrations up 9.5% to record 2.8 million■ Alternatively Fuelled Vehicles volumes took 2.8% market share■ New car CO2 emissions fell 2.6% to 121.4g/km■ Number of alternative fuel buses on the road rose to 2,800
END-OF-LIFE (pages 19-21)■ 95% ELV target met in 2015■ Orphan vehicle take-back scheme set up■ Remanufacturing an important part of vehicle life cycle
PEOPLE (pages 11-12)n Signatories’ employment 2.1% up■ Number of training days per employee up 5.3%■ Accident rate fell to record low, 13.1% down■ Staff turnover just 5%
THE SOCIETY OF MOTOR MANUFACTURERS AND TRADERSPage 4 | 2016 UK Automotive Sustainability Report
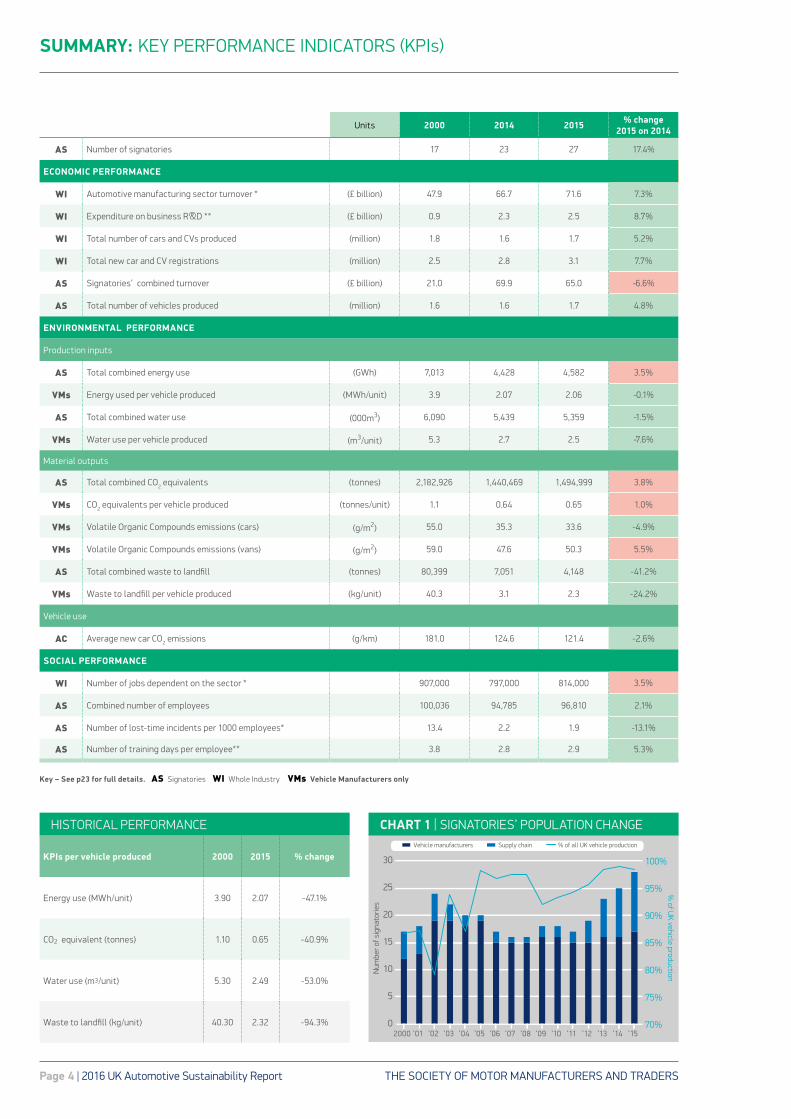
SUMMARY: KEY PERFORMANCE INDICATORS (KPIs)
Key – See p23 for full details. AS Signatories WI Whole Industry VMs Vehicle Manufacturers only
KPIs per vehicle produced 2000 2015 % change
Energy use (MWh/unit) 3.90 2.07 -47.1%
CO2 equivalent (tonnes) 1.10 0.65 -40.9%
Water use (m3/unit) 5.30 2.49 -53.0%
Waste to landfill (kg/unit) 40.30 2.32 -94.3% 70%
75%
80%
85%
90%
95%
100%
0
5
10
15
20
25
30
Vehicle manufacturers Supply chain % of all UK vehicle production
2000 ’01 ’02 ’03 ’04 ’05 ’06 ’07 ’08 ’09 ’10 ’11 ’12 ’13 ’14 ’15
Num
ber o
f sig
nato
ries
% of U
K vehicle production
CHART 1 | SIGNATORIES’ POPULATION CHANGEHISTORICAL PERFORMANCE
Units 2000 2014 2015 % change 2015 on 2014
AS Number of signatories 17 23 27 17.4%
ECONOMIC PERFORMANCE
WI Automotive manufacturing sector turnover * (£ billion) 47.9 66.7 71.6 7.3%
WI Expenditure on business R&D ** (£ billion) 0.9 2.3 2.5 8.7%
WI Total number of cars and CVs produced (million) 1.8 1.6 1.7 5.2%
WI Total new car and CV registrations (million) 2.5 2.8 3.1 7.7%
AS Signatories’ combined turnover (£ billion) 21.0 69.9 65.0 -6.6%
AS Total number of vehicles produced (million) 1.6 1.6 1.7 4.8%
ENVIRONMENTAL PERFORMANCE
Production inputs
AS Total combined energy use (GWh) 7,013 4,428 4,582 3.5%
VMs Energy used per vehicle produced (MWh/unit) 3.9 2.07 2.06 -0.1%
AS Total combined water use (000m3) 6,090 5,439 5,359 -1.5%
VMs Water use per vehicle produced (m3/unit) 5.3 2.7 2.5 -7.6%
Material outputs
AS Total combined CO2 equivalents (tonnes) 2,182,926 1,440,469 1,494,999 3.8%
VMs CO2 equivalents per vehicle produced (tonnes/unit) 1.1 0.64 0.65 1.0%
VMs Volatile Organic Compounds emissions (cars) (g/m2) 55.0 35.3 33.6 -4.9%
VMs Volatile Organic Compounds emissions (vans) (g/m2) 59.0 47.6 50.3 5.5%
AS Total combined waste to landfill (tonnes) 80,399 7,051 4,148 -41.2%
VMs Waste to landfill per vehicle produced (kg/unit) 40.3 3.1 2.3 -24.2%
Vehicle use
AC Average new car CO2 emissions (g/km) 181.0 124.6 121.4 -2.6%
SOCIAL PERFORMANCE
WI Number of jobs dependent on the sector * 907,000 797,000 814,000 3.5%
AS Combined number of employees 100,036 94,785 96,810 2.1%
AS Number of lost-time incidents per 1000 employees* 13.4 2.2 1.9 -13.1%
AS Number of training days per employee** 3.8 2.8 2.9 5.3%
THE SOCIETY OF MOTOR MANUFACTURERS AND TRADERS 2016 UK Automotive Sustainability Report Page 5
UK AUTOMOTIVE PRODUCTION 2015 was the sixth successive year of growth in vehicle output in the UK, with volumes up 5.2% to 1.68 million units. This was the best performance since 2007 (pre-recession) when 1.75 million units were produced. Car output rose 3.6% to 1.59 million units, while commercial vehicle (CV) output grew 33.6%. While exports still account for 75.8% of vehicle output, manufacturing for the home market has grown more strongly in each of the past four years.
Light vehicle engine output was down 1%, to 2.37 million units in 2015 (please note this does not include the new Jaguar Land Rover Engine Manufacturing Centre (EMC) in Wolverhampton, but figures from 2016 will). Engine output is broadly on a par with the level recorded since 2010 and is now widely expected to pick up following recent investment in UK engine plants.
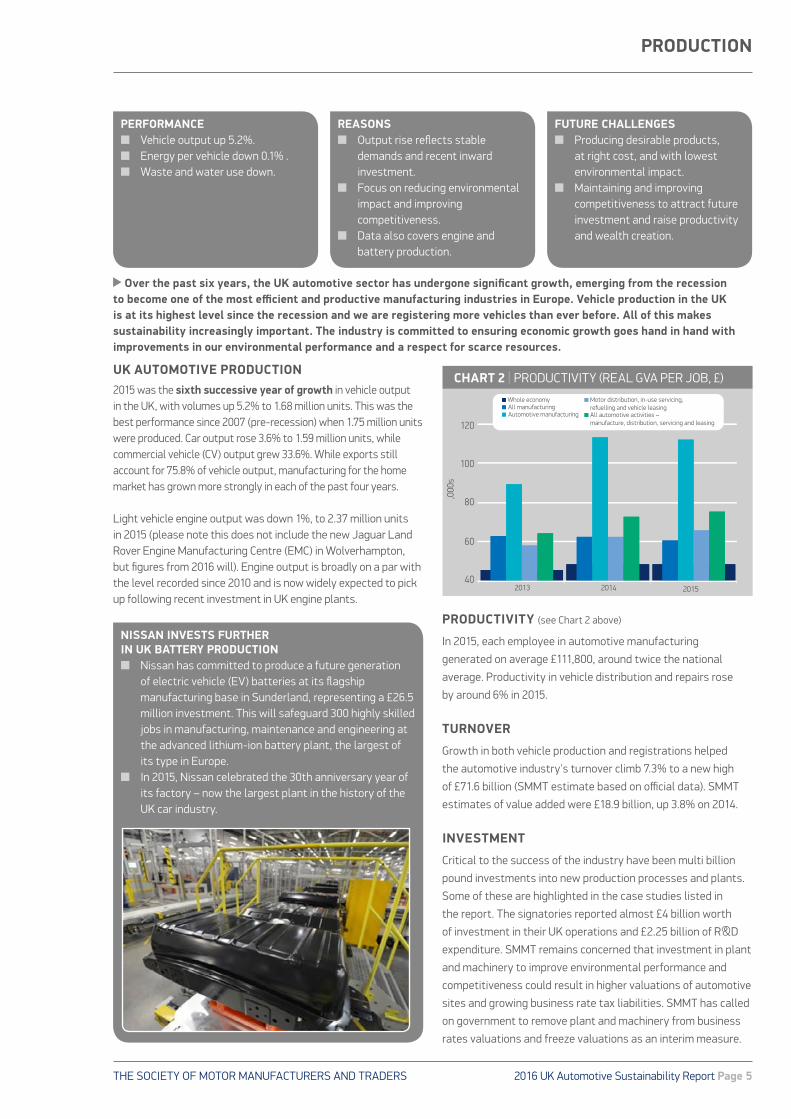
PRODUCTIVITY (see Chart 2 above)
In 2015, each employee in automotive manufacturing
generated on average £111,800, around twice the national
average. Productivity in vehicle distribution and repairs rose
by around 6% in 2015.
TURNOVER
Growth in both vehicle production and registrations helped
the automotive industry's turnover climb 7.3% to a new high
of £71.6 billion (SMMT estimate based on official data). SMMT
estimates of value added were £18.9 billion, up 3.8% on 2014.
INVESTMENT
Critical to the success of the industry have been multi billion
pound investments into new production processes and plants.
Some of these are highlighted in the case studies listed in
the report. The signatories reported almost £4 billion worth
of investment in their UK operations and £2.25 billion of R&D
expenditure. SMMT remains concerned that investment in plant
and machinery to improve environmental performance and
competitiveness could result in higher valuations of automotive
sites and growing business rate tax liabilities. SMMT has called
on government to remove plant and machinery from business
rates valuations and freeze valuations as an interim measure.
NISSAN INVESTS FURTHER IN UK BATTERY PRODUCTION n Nissan has committed to produce a future generation
of electric vehicle (EV) batteries at its flagship manufacturing base in Sunderland, representing a £26.5 million investment. This will safeguard 300 highly skilled jobs in manufacturing, maintenance and engineering at the advanced lithium-ion battery plant, the largest of its type in Europe.
n In 2015, Nissan celebrated the 30th anniversary year of its factory – now the largest plant in the history of the UK car industry.
PRODUCTION
PERFORMANCEn Vehicle output up 5.2%.n Energy per vehicle down 0.1% .n Waste and water use down.
REASONSn Output rise reflects stable
demands and recent inward investment.
n Focus on reducing environmental impact and improving competitiveness.
n Data also covers engine and battery production.
FUTURE CHALLENGES n Producing desirable products,
at right cost, and with lowest environmental impact.
n Maintaining and improving competitiveness to attract future investment and raise productivity and wealth creation.
Over the past six years, the UK automotive sector has undergone significant growth, emerging from the recession to become one of the most efficient and productive manufacturing industries in Europe. Vehicle production in the UK is at its highest level since the recession and we are registering more vehicles than ever before. All of this makes sustainability increasingly important. The industry is committed to ensuring economic growth goes hand in hand with improvements in our environmental performance and a respect for scarce resources.
40
60
80
100
120
2013 2014 2015
Whole economy All manufacturing Automotive manufacturing
Motor distribution, in-use servicing, refuelling and vehicle leasing All automotive activities – manufacture, distribution, servicing and leasing
,000
s
CHART 2 | PRODUCTIVITY (REAL GVA PER JOB, £)
THE SOCIETY OF MOTOR MANUFACTURERS AND TRADERSPage 6 | 2016 UK Automotive Sustainability Report
PRODUCTION: ENVIRONMENTAL PERFORMANCE
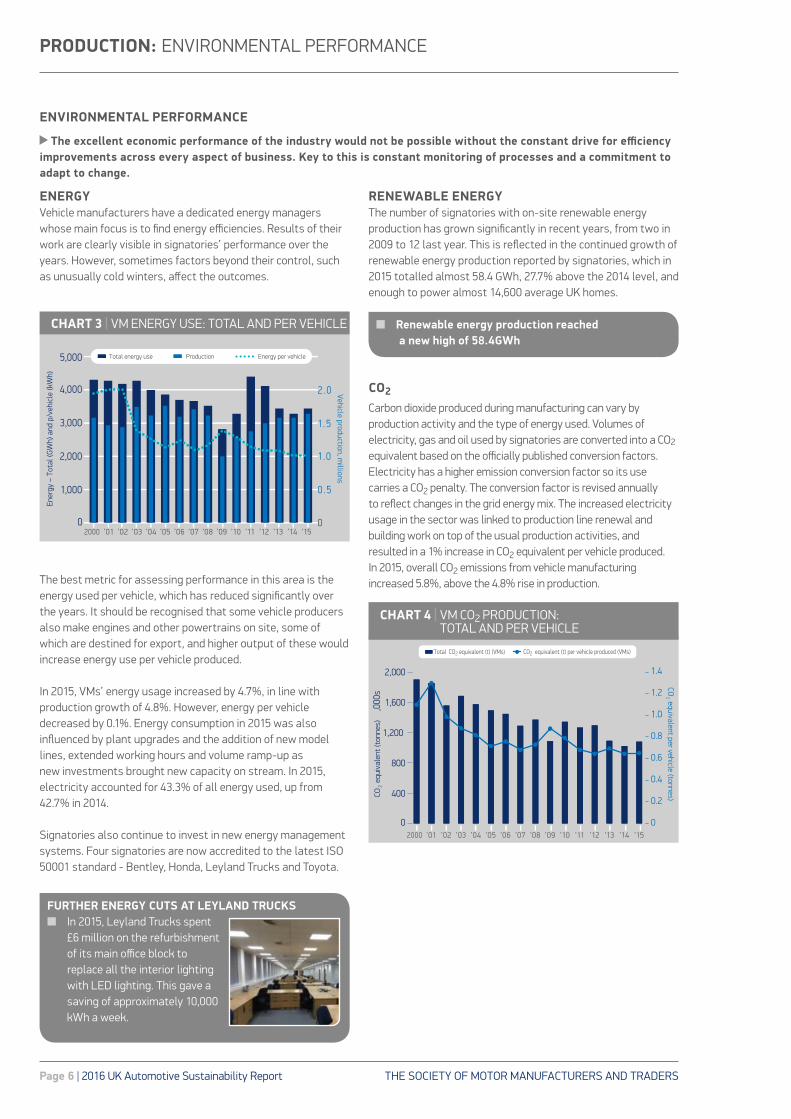
ENERGYVehicle manufacturers have a dedicated energy managers whose main focus is to find energy efficiencies. Results of their work are clearly visible in signatories’ performance over the years. However, sometimes factors beyond their control, such as unusually cold winters, affect the outcomes.
The best metric for assessing performance in this area is the energy used per vehicle, which has reduced significantly over the years. It should be recognised that some vehicle producers also make engines and other powertrains on site, some of which are destined for export, and higher output of these would increase energy use per vehicle produced.
In 2015, VMs’ energy usage increased by 4.7%, in line with production growth of 4.8%. However, energy per vehicle decreased by 0.1%. Energy consumption in 2015 was also influenced by plant upgrades and the addition of new model lines, extended working hours and volume ramp-up as new investments brought new capacity on stream. In 2015, electricity accounted for 43.3% of all energy used, up from 42.7% in 2014. Signatories also continue to invest in new energy management systems. Four signatories are now accredited to the latest ISO 50001 standard - Bentley, Honda, Leyland Trucks and Toyota.
RENEWABLE ENERGYThe number of signatories with on-site renewable energy production has grown significantly in recent years, from two in 2009 to 12 last year. This is reflected in the continued growth of renewable energy production reported by signatories, which in 2015 totalled almost 58.4 GWh, 27.7% above the 2014 level, and enough to power almost 14,600 average UK homes.
CO2
Carbon dioxide produced during manufacturing can vary by production activity and the type of energy used. Volumes of electricity, gas and oil used by signatories are converted into a CO2 equivalent based on the officially published conversion factors. Electricity has a higher emission conversion factor so its use carries a CO2 penalty. The conversion factor is revised annually to reflect changes in the grid energy mix. The increased electricity usage in the sector was linked to production line renewal and building work on top of the usual production activities, and resulted in a 1% increase in CO2 equivalent per vehicle produced. In 2015, overall CO2 emissions from vehicle manufacturing increased 5.8%, above the 4.8% rise in production.
5,000
2 .0
1. 5
1.0
0 . 5
0
4,000
3,000
2,000
1,000
02000 ’01 ’02 ’03 ’04 ’05 ’06 ’07 ’08 ’09 ’10 ’11 ’12 ’13 ’14 ’15
Total energy use Energy per vehicleProduction
Ener
gy –
Tot
al (G
Wh)
and
p/v
ehic
le (k
Wh)
Vehicle production, millions
CHART 3 | VM ENERGY USE: TOTAL AND PER VEHICLE
0
0.2
0.4
0.6
0.8
1.0
1.2
1.4
0
400
800
1,200
1,600
2,000
CO 2 equivalent per vehicle (tonnes) CO
2 e
quiv
alen
t (to
nnes
)
,000
s
Total CO2 equivalent (t) (VMs) CO2 equivalent (t) per vehicle produced (VMs)
2000 ’01 ’02 ’03 ’04 ’05 ’06 ’07 ’08 ’09 ’10 ’11 ’12 ’13 ’14 ’15
CHART 4 | VM CO2 PRODUCTION: TOTAL AND PER VEHICLE
FURTHER ENERGY CUTS AT LEYLAND TRUCKS n In 2015, Leyland Trucks spent
£6 million on the refurbishment of its main office block to replace all the interior lighting with LED lighting. This gave a saving of approximately 10,000 kWh a week.
n Renewable energy production reached a new high of 58.4GWh
ENVIRONMENTAL PERFORMANCE
The excellent economic performance of the industry would not be possible without the constant drive for efficiency improvements across every aspect of business. Key to this is constant monitoring of processes and a commitment to adapt to change.
THE SOCIETY OF MOTOR MANUFACTURERS AND TRADERS 2016 UK Automotive Sustainability Report Page 7
PRODUCTION: ENVIRONMENTAL PERFORMANCE
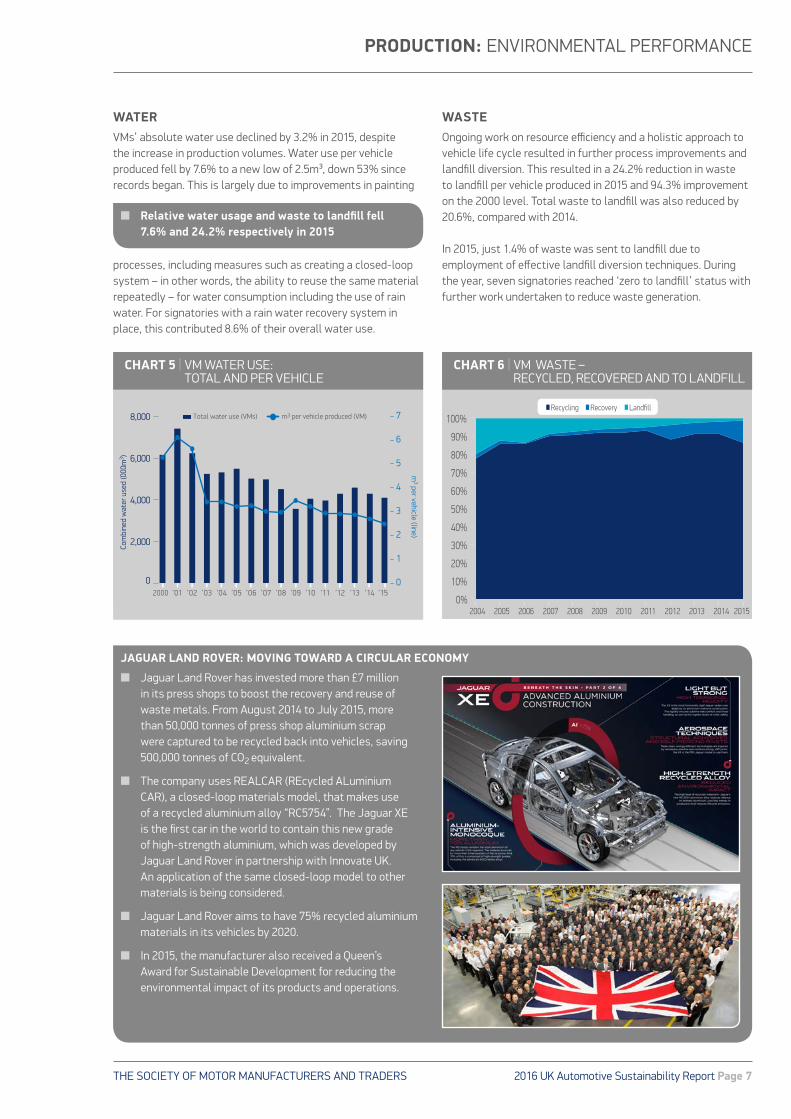
WATERVMs’ absolute water use declined by 3.2% in 2015, despite the increase in production volumes. Water use per vehicle produced fell by 7.6% to a new low of 2.5m³, down 53% since records began. This is largely due to improvements in painting
processes, including measures such as creating a closed-loop system – in other words, the ability to reuse the same material repeatedly – for water consumption including the use of rain water. For signatories with a rain water recovery system in place, this contributed 8.6% of their overall water use.
WASTEOngoing work on resource efficiency and a holistic approach to vehicle life cycle resulted in further process improvements and landfill diversion. This resulted in a 24.2% reduction in waste to landfill per vehicle produced in 2015 and 94.3% improvement on the 2000 level. Total waste to landfill was also reduced by 20.6%, compared with 2014.
In 2015, just 1.4% of waste was sent to landfill due to employment of effective landfill diversion techniques. During the year, seven signatories reached ‘zero to landfill’ status with further work undertaken to reduce waste generation.
0
1
2
3
4
5
6
7
2,000
0
4,000
6,000
8,000
m3 per vehicle (line)
Com
bine
d w
ater
use
d (0
00m
3 )
Total water use (VMs) m3 per vehicle produced (VM)
2000 ’01 ’02 ’03 ’04 ’05 ’06 ’07 ’08 ’09 ’10 ’11 ’12 ’13 ’14 ’15
2004 2005 2006 2007 2008 2009 2010 2011 2012 2013 2014 2015 0%
10%
20%
30%
40%
50%
60%
70%
80%
90%
100% Recycling Recovery Landfill
CHART 5 | VM WATER USE: TOTAL AND PER VEHICLE
CHART 6 | VM WASTE – RECYCLED, RECOVERED AND TO LANDFILL
n Relative water usage and waste to landfill fell 7.6% and 24.2% respectively in 2015
JAGUAR LAND ROVER: MOVING TOWARD A CIRCULAR ECONOMY
n Jaguar Land Rover has invested more than £7 million in its press shops to boost the recovery and reuse of waste metals. From August 2014 to July 2015, more than 50,000 tonnes of press shop aluminium scrap were captured to be recycled back into vehicles, saving 500,000 tonnes of CO2 equivalent.
n The company uses REALCAR (REcycled ALuminium CAR), a closed-loop materials model, that makes use of a recycled aluminium alloy “RC5754”. The Jaguar XE is the first car in the world to contain this new grade of high-strength aluminium, which was developed by Jaguar Land Rover in partnership with Innovate UK. An application of the same closed-loop model to other materials is being considered.
n Jaguar Land Rover aims to have 75% recycled aluminium materials in its vehicles by 2020.
n In 2015, the manufacturer also received a Queen’s Award for Sustainable Development for reducing the environmental impact of its products and operations.
THE SOCIETY OF MOTOR MANUFACTURERS AND TRADERSPage 8 | 2016 UK Automotive Sustainability Report
PRODUCTION: ENVIRONMENTAL PERFORMANCE
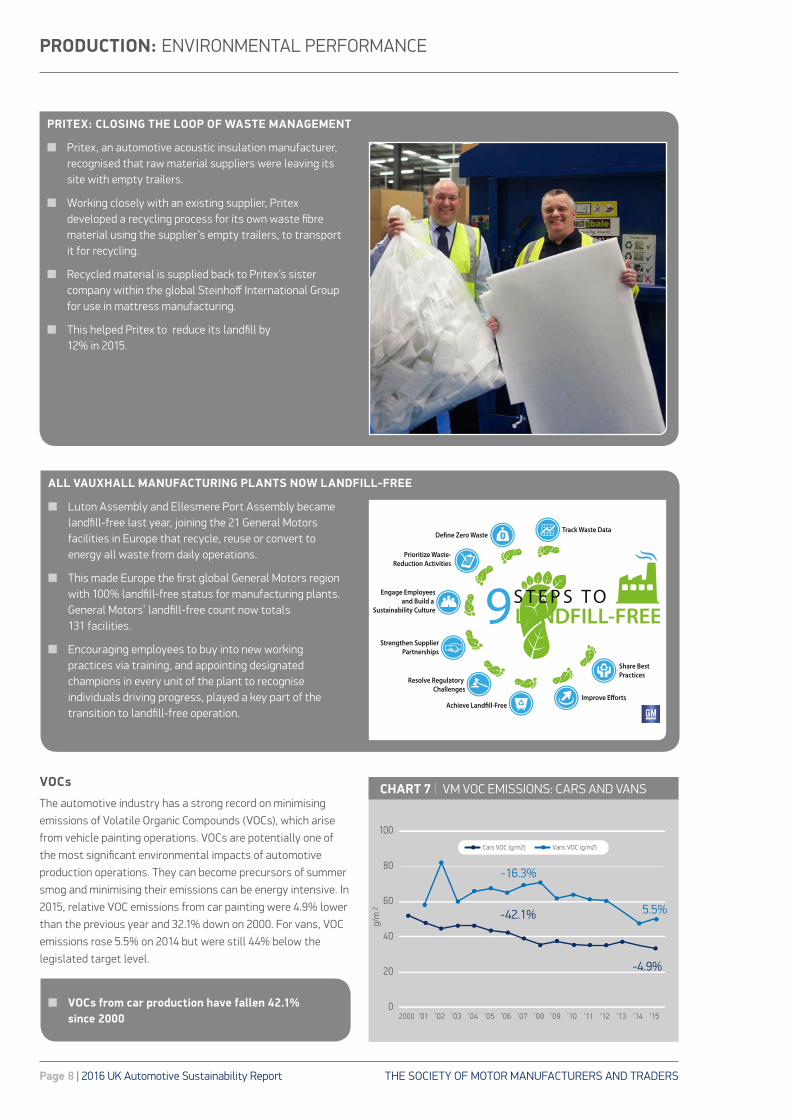
VOCs
The automotive industry has a strong record on minimising emissions of Volatile Organic Compounds (VOCs), which arise from vehicle painting operations. VOCs are potentially one of the most significant environmental impacts of automotive production operations. They can become precursors of summer smog and minimising their emissions can be energy intensive. In 2015, relative VOC emissions from car painting were 4.9% lower than the previous year and 32.1% down on 2000. For vans, VOC emissions rose 5.5% on 2014 but were still 44% below the legislated target level.
0
20
40
60
80
100
g/m
2
-4.9%
5.5% -42.1%
-16.3%
Cars VOC (g/m2) Vans VOC (g/m2)
2000 ’01 ’02 ’03 ’04 ’05 ’06 ’07 ’08 ’09 ’10 ’11 ’12 ’13 ’14 ’15
CHART 7 | VM VOC EMISSIONS: CARS AND VANS
n VOCs from car production have fallen 42.1% since 2000
PRITEX: CLOSING THE LOOP OF WASTE MANAGEMENT
n Pritex, an automotive acoustic insulation manufacturer, recognised that raw material suppliers were leaving its site with empty trailers.
n Working closely with an existing supplier, Pritex developed a recycling process for its own waste fibre material using the supplier’s empty trailers, to transport it for recycling.
n Recycled material is supplied back to Pritex’s sister company within the global Steinhoff International Group for use in mattress manufacturing.
n This helped Pritex to reduce its landfill by 12% in 2015.
ALL VAUXHALL MANUFACTURING PLANTS NOW LANDFILL-FREE
n Luton Assembly and Ellesmere Port Assembly became landfill-free last year, joining the 21 General Motors facilities in Europe that recycle, reuse or convert to energy all waste from daily operations.
n This made Europe the first global General Motors region with 100% landfill-free status for manufacturing plants. General Motors’ landfill-free count now totals 131 facilities.
n Encouraging employees to buy into new working practices via training, and appointing designated champions in every unit of the plant to recognise individuals driving progress, played a key part of the transition to landfill-free operation.
THE SOCIETY OF MOTOR MANUFACTURERS AND TRADERS 2016 UK Automotive Sustainability Report Page 9
PRODUCTION: AUTOMOTIVE SUPPLY CHAIN
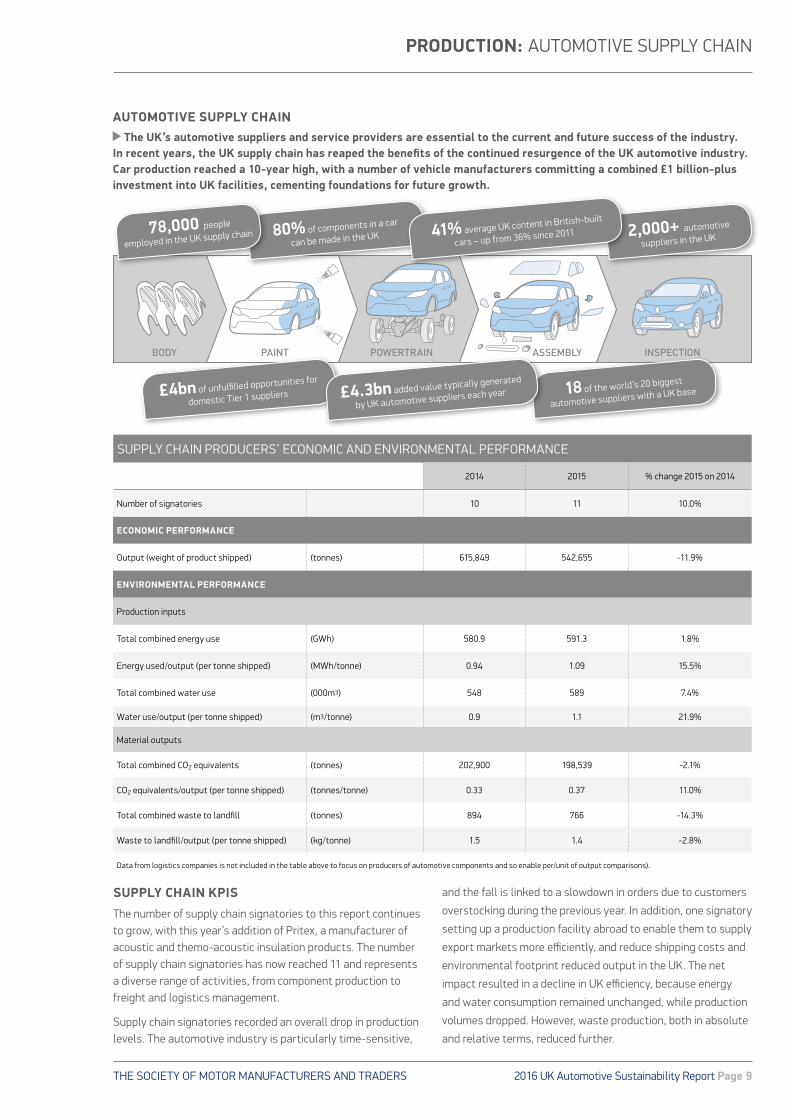
SUPPLY CHAIN KPISThe number of supply chain signatories to this report continues to grow, with this year’s addition of Pritex, a manufacturer of acoustic and themo-acoustic insulation products. The number of supply chain signatories has now reached 11 and represents a diverse range of activities, from component production to freight and logistics management.
Supply chain signatories recorded an overall drop in production levels. The automotive industry is particularly time-sensitive,
and the fall is linked to a slowdown in orders due to customers
overstocking during the previous year. In addition, one signatory
setting up a production facility abroad to enable them to supply
export markets more efficiently, and reduce shipping costs and
environmental footprint reduced output in the UK. The net
impact resulted in a decline in UK efficiency, because energy
and water consumption remained unchanged, while production
volumes dropped. However, waste production, both in absolute
and relative terms, reduced further.
BODY PAINT POWERTRAIN ASSEMBLY INSPECTION
2,000+ automotive
suppliers in the UK 80% of components in a car
can be made in the UK
£4bn of unfulfilled opportunities for
domestic Tier 1 suppliers 18 of the world’s 20 biggest
automotive suppliers with a UK base
41% average UK content in British-built
cars – up from 36% since 2011 78,000 people
employed in the UK supply chain
£4.3bn added value typically generated
by UK automotive suppliers each year
AUTOMOTIVE SUPPLY CHAIN The UK’s automotive suppliers and service providers are essential to the current and future success of the industry.
In recent years, the UK supply chain has reaped the benefits of the continued resurgence of the UK automotive industry. Car production reached a 10-year high, with a number of vehicle manufacturers committing a combined £1 billion-plus investment into UK facilities, cementing foundations for future growth.
SUPPLY CHAIN PRODUCERS’ ECONOMIC AND ENVIRONMENTAL PERFORMANCE
2014 2015 % change 2015 on 2014
Number of signatories 10 11 10.0%
ECONOMIC PERFORMANCE
Output (weight of product shipped) (tonnes) 615,849 542,655 -11.9%
ENVIRONMENTAL PERFORMANCE
Production inputs
Total combined energy use (GWh) 580.9 591.3 1.8%
Energy used/output (per tonne shipped) (MWh/tonne) 0.94 1.09 15.5%
Total combined water use (000m3) 548 589 7.4%
Water use/output (per tonne shipped) (m3/tonne) 0.9 1.1 21.9%
Material outputs
Total combined CO2 equivalents (tonnes) 202,900 198,539 -2.1%
CO2 equivalents/output (per tonne shipped) (tonnes/tonne) 0.33 0.37 11.0%
Total combined waste to landfill (tonnes) 894 766 -14.3%
Waste to landfill/output (per tonne shipped) (kg/tonne) 1.5 1.4 -2.8%
Data from logistics companies is not included in the table above to focus on producers of automotive components and so enable per/unit of output comparisons).
THE SOCIETY OF MOTOR MANUFACTURERS AND TRADERSPage 10 | 2016 UK Automotive Sustainability Report
PRODUCTION: AUTOMOTIVE SUPPLY CHAIN
UK SUPPLY CHAINAs vehicle manufacturers continue to streamline operations, drive productivity and minimise risk, there has been a rise in opportunities for domestic suppliers, highlighted by an increase in the average local content in UK manufactured vehicles. This now stands at 41%, up five percentage points from 36% in 2011. With car production volume growth factored in, this suggests UK Tier 1 supplier sales have grown by 32% over the same period. Compounded growth rates are expected to increase throughout 2016 and beyond as the UK’s production of passenger cars edges towards the 2 million mark (1).
Despite a positive year, there are a still several underlying issues that pose challenges to the UK supply chain. Companies face increasing global competition from rivals in countries with more competitive labour and business rates, although the UK does perform well in terms of labour productivity and flexibility(2).
The Automotive Council has also identified a significant skills
gap in the UK, with 5,000 job vacancies in UK automotive manufacturing. Further, with 37,000 new jobs forecast to be needed by 2020 to support increased production levels, skills shortages are likely to have an impact on the UK supply chain’s ability to grow. This underlines a critical need to attract more young people into the industry(3).
In order for the UK supply chain to capture the opportunities available now and in the coming years, these issues will need to be addressed.
The 2015 Automotive Council report Growing the Automotive Supply Chain – The Opportunity Ahead, identified Tier 1 re-shoring opportunities worth £4 billion-per-year over the next four to five years(4).n
n Local content of UK-built vehicles rose to 41% in 2015
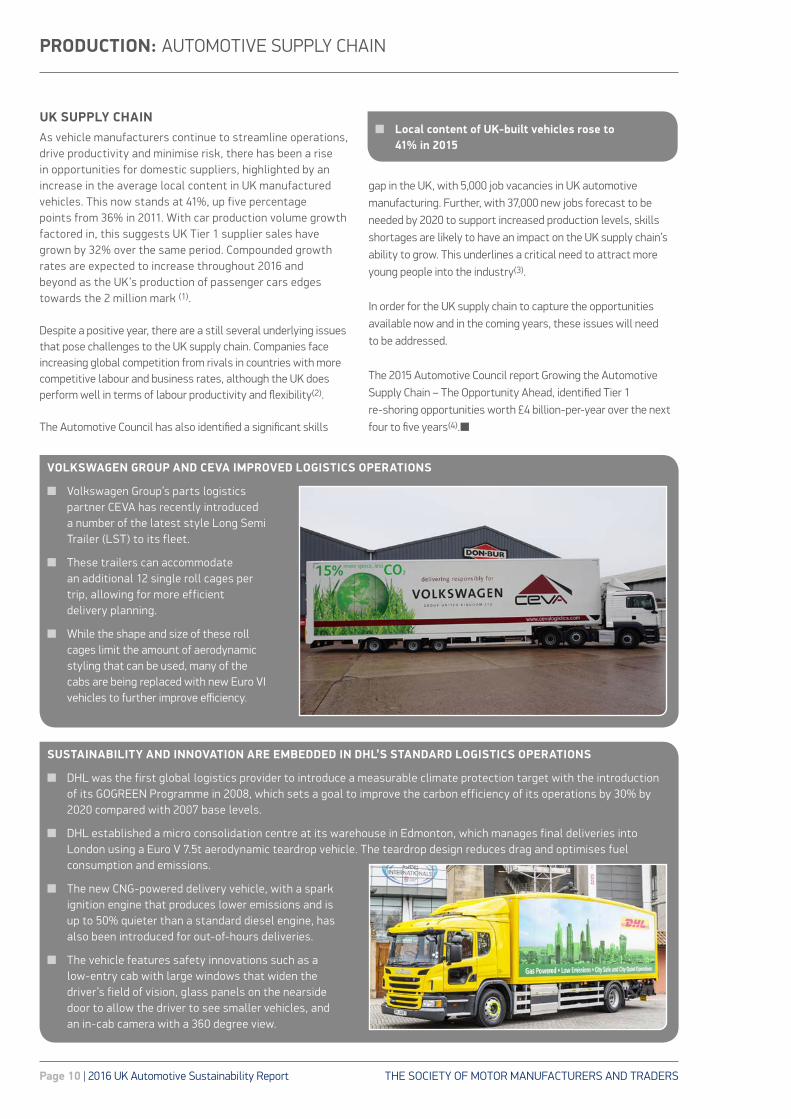
SUSTAINABILITY AND INNOVATION ARE EMBEDDED IN DHL’S STANDARD LOGISTICS OPERATIONS
n DHL was the first global logistics provider to introduce a measurable climate protection target with the introduction of its GOGREEN Programme in 2008, which sets a goal to improve the carbon efficiency of its operations by 30% by 2020 compared with 2007 base levels.
n DHL established a micro consolidation centre at its warehouse in Edmonton, which manages final deliveries into London using a Euro V 7.5t aerodynamic teardrop vehicle. The teardrop design reduces drag and optimises fuel consumption and emissions.
n The new CNG-powered delivery vehicle, with a spark ignition engine that produces lower emissions and is up to 50% quieter than a standard diesel engine, has also been introduced for out-of-hours deliveries.
n The vehicle features safety innovations such as a low-entry cab with large windows that widen the driver’s field of vision, glass panels on the nearside door to allow the driver to see smaller vehicles, and an in-cab camera with a 360 degree view.
VOLKSWAGEN GROUP AND CEVA IMPROVED LOGISTICS OPERATIONS
n Volkswagen Group’s parts logistics partner CEVA has recently introduced a number of the latest style Long Semi Trailer (LST) to its fleet.
n These trailers can accommodate an additional 12 single roll cages per trip, allowing for more efficient delivery planning.
n While the shape and size of these roll cages limit the amount of aerodynamic styling that can be used, many of the cabs are being replaced with new Euro VI vehicles to further improve efficiency.
THE SOCIETY OF MOTOR MANUFACTURERS AND TRADERS 2016 UK Automotive Sustainability Report Page 11
PEOPLE
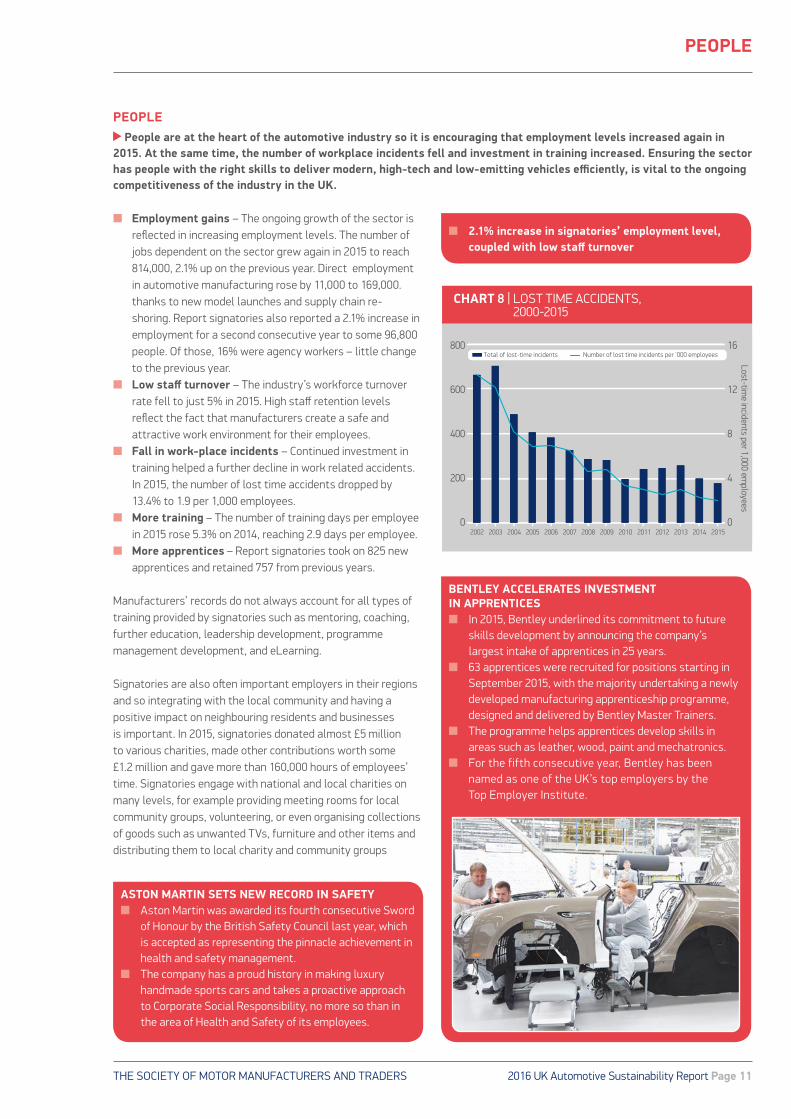
n Employment gains – The ongoing growth of the sector is reflected in increasing employment levels. The number of jobs dependent on the sector grew again in 2015 to reach 814,000, 2.1% up on the previous year. Direct employment in automotive manufacturing rose by 11,000 to 169,000. thanks to new model launches and supply chain re-shoring. Report signatories also reported a 2.1% increase in employment for a second consecutive year to some 96,800 people. Of those, 16% were agency workers – little change to the previous year.
n Low staff turnover – The industry’s workforce turnover rate fell to just 5% in 2015. High staff retention levels reflect the fact that manufacturers create a safe and attractive work environment for their employees.
n Fall in work-place incidents – Continued investment in training helped a further decline in work related accidents. In 2015, the number of lost time accidents dropped by 13.4% to 1.9 per 1,000 employees.
n More training – The number of training days per employee in 2015 rose 5.3% on 2014, reaching 2.9 days per employee.
n More apprentices – Report signatories took on 825 new apprentices and retained 757 from previous years.
Manufacturers’ records do not always account for all types of training provided by signatories such as mentoring, coaching, further education, leadership development, programme management development, and eLearning.
Signatories are also often important employers in their regions and so integrating with the local community and having a positive impact on neighbouring residents and businesses is important. In 2015, signatories donated almost £5 million to various charities, made other contributions worth some £1.2 million and gave more than 160,000 hours of employees’ time. Signatories engage with national and local charities on many levels, for example providing meeting rooms for local community groups, volunteering, or even organising collections of goods such as unwanted TVs, furniture and other items and distributing them to local charity and community groups
0
4
8
12
16
0
200
400
600
800
2002 2003 2004 2005 2006 2007 2008 2009 2010 2011 2012 2013 2014 2015
Lost-time incidents per 1,000 em
ployees
Total of lost-time incidents Number of lost time incidents per '000 employees
CHART 8 | LOST TIME ACCIDENTS, 2000-2015
PEOPLE People are at the heart of the automotive industry so it is encouraging that employment levels increased again in
2015. At the same time, the number of workplace incidents fell and investment in training increased. Ensuring the sector has people with the right skills to deliver modern, high-tech and low-emitting vehicles efficiently, is vital to the ongoing competitiveness of the industry in the UK.
BENTLEY ACCELERATES INVESTMENT IN APPRENTICES n In 2015, Bentley underlined its commitment to future
skills development by announcing the company’s largest intake of apprentices in 25 years.
n 63 apprentices were recruited for positions starting in September 2015, with the majority undertaking a newly developed manufacturing apprenticeship programme, designed and delivered by Bentley Master Trainers.
n The programme helps apprentices develop skills in areas such as leather, wood, paint and mechatronics.
n For the fifth consecutive year, Bentley has been named as one of the UK’s top employers by the Top Employer Institute.
ASTON MARTIN SETS NEW RECORD IN SAFETY n Aston Martin was awarded its fourth consecutive Sword
of Honour by the British Safety Council last year, which is accepted as representing the pinnacle achievement in health and safety management.
n The company has a proud history in making luxury handmade sports cars and takes a proactive approach to Corporate Social Responsibility, no more so than in the area of Health and Safety of its employees.
n 2.1% increase in signatories’ employment level, coupled with low staff turnover
THE SOCIETY OF MOTOR MANUFACTURERS AND TRADERSPage 12 | 2016 UK Automotive Sustainability Report
PEOPLE
AUTOMOTIVE INDUSTRIAL PARTNERSHIP (AIP)
The Automotive Industrial Partnership (AIP), established by the Automotive Council in 2014, continued its work of bringing together leading automotive companies and government to ensure the UK’s automotive sector has the pipeline of skills and talent it needs now and for the future. www.automotiveip.co.uk/
AUTOMOTIVE COUNCIL SKILLS REPORT: AUTOMOTIVE JOBS FRAMEWORK AND SKILLS REQUIREMENTS
In 2015, the AIP collaborated to design an industry-approved jobs framework for UK automotive, including 119 industry standard job descriptions, and surveyed industry to establish the sector’s current and future skills requirements.
Developed by SMMT Industry Forum on behalf of the AIP, this work identifies skills needs to fill current vacancies and to meet the needs of a growing industry. It offers proposals to meet these needs through training, apprenticeships and promoting the industry as one that offers secure, rewarding employment opportunities. Of particular use for business, the report identifies the top skills requirements and job vacancies nationally and by region across the UK. The full report and regional documents are available online at: www.automotiveip.co.uk
AUTOMOTIVE APPRENTICESHIP MATCHING SERVICEThe Automotive Apprenticeship Matching Service was developed by the AIP in 2015 to help build a skilled workforce for the future. The service, which was launched officially in April 2016, re-directs high quality talent from over-subscribed automotive apprenticeship programmes to other companies that have similar opportunities within the sector. Working with both companies and candidates, the mission of the Matching Service is to ensure talent is harnessed and retained within the
industry. Further information on the Matching Service can be found at www.automotiveapprenticeships.co.uk/
APPRENTICESHIP LEVYSMMT is working with government to ensure the Apprenticeship Levy, due to come into force in April 2017, will work for industry by supporting the uptake of high-quality automotive apprenticeships.
The Levy will apply to all UK businesses, with the money generated used to fund new apprenticeships. It will be set at a rate of 0.5% of an employer’s gross pay bill, with each employer receiving a £15,000 allowance - effectively meaning only those with pay bills in excess of £3 million will pay. The Levy will be collected through PAYE and put back in the hands of employers through a newly developed Digital Apprenticeship Service. Government will also apply a 10% top-up to monthly funds entering levy paying employers’ digital accounts, for apprenticeship training in England. Further information on the Apprenticeship Levy can be found at www.gov.uk/government/publications/apprenticeship-levy-how-it-will-work/apprenticeship-levy-how-it-will-work
TRANSPARENCY IN SUPPLY CHAINS: MODERN SLAVERY
In 2015, the automotive industry began taking action to respond to government ambitions around increasing transparency in supply chains through the first companies publishing their public modern slavery statements. These statements set out the actions companies are taking to ensure that slavery and human trafficking is not taking place in a company’s supply chain or in any part of their business. SMMT supported this activity through member briefings and communications, as well as facilitating an industry webinar with the Home Office in December 2015. n
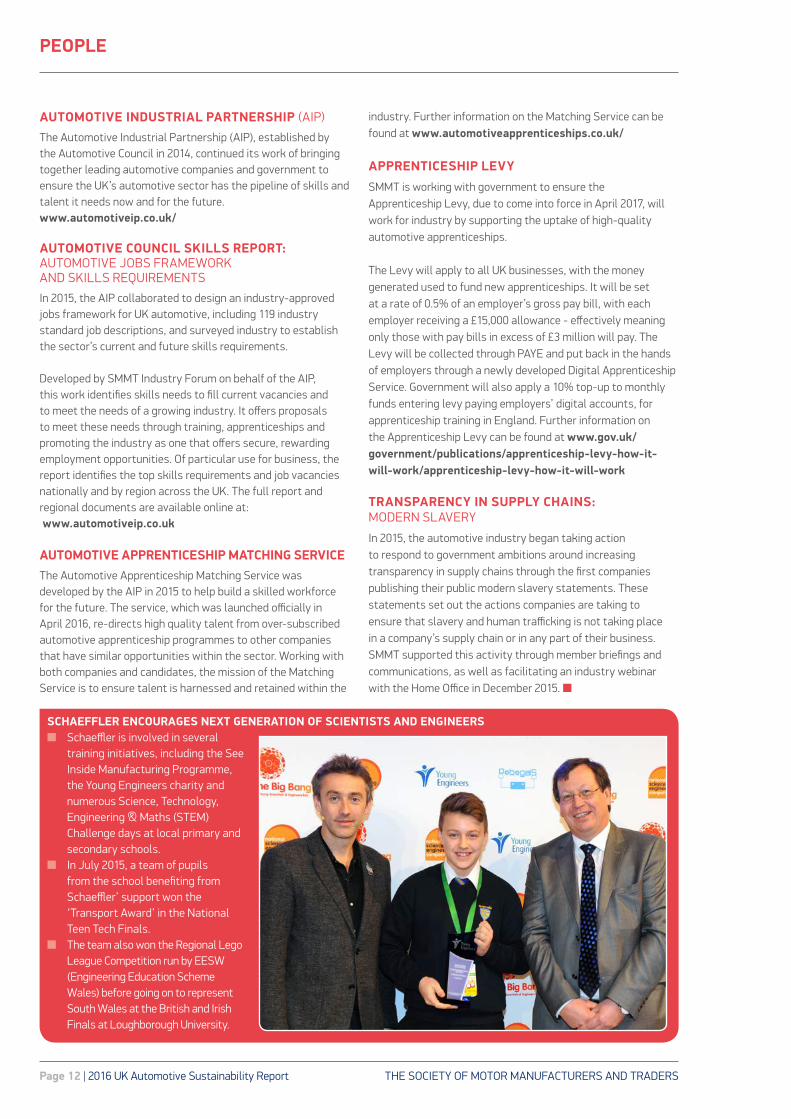
SCHAEFFLER ENCOURAGES NEXT GENERATION OF SCIENTISTS AND ENGINEERS n Schaeffler is involved in several
training initiatives, including the See Inside Manufacturing Programme, the Young Engineers charity and numerous Science, Technology, Engineering & Maths (STEM) Challenge days at local primary and secondary schools.
n In July 2015, a team of pupils from the school benefiting from Schaeffler’ support won the ‘Transport Award’ in the National Teen Tech Finals.
n The team also won the Regional Lego League Competition run by EESW (Engineering Education Scheme Wales) before going on to represent South Wales at the British and Irish Finals at Loughborough University.
THE SOCIETY OF MOTOR MANUFACTURERS AND TRADERS 2016 UK Automotive Sustainability Report Page 13
USE
NEW VEHICLE REGISTRATIONSTotal UK new vehicle registrations surpassed three million units for the first time in 2015 - a 7.7% rise on 2014, and up 9.5% on 2007 and 21.7% on 2000. The growth reflects increased demand for both car and commercial vehicles, in part linked to wider economic growth and enhanced finance packages enabling easier access to new vehicles by consumers.
In 2015, new car registrations rose by 6.3% to a record 2.63 million units. Growth was supported by an 11.8% rise in fleet demand, while private registrations rose by a more modest 2.5% after particularly strong growth in previous years.
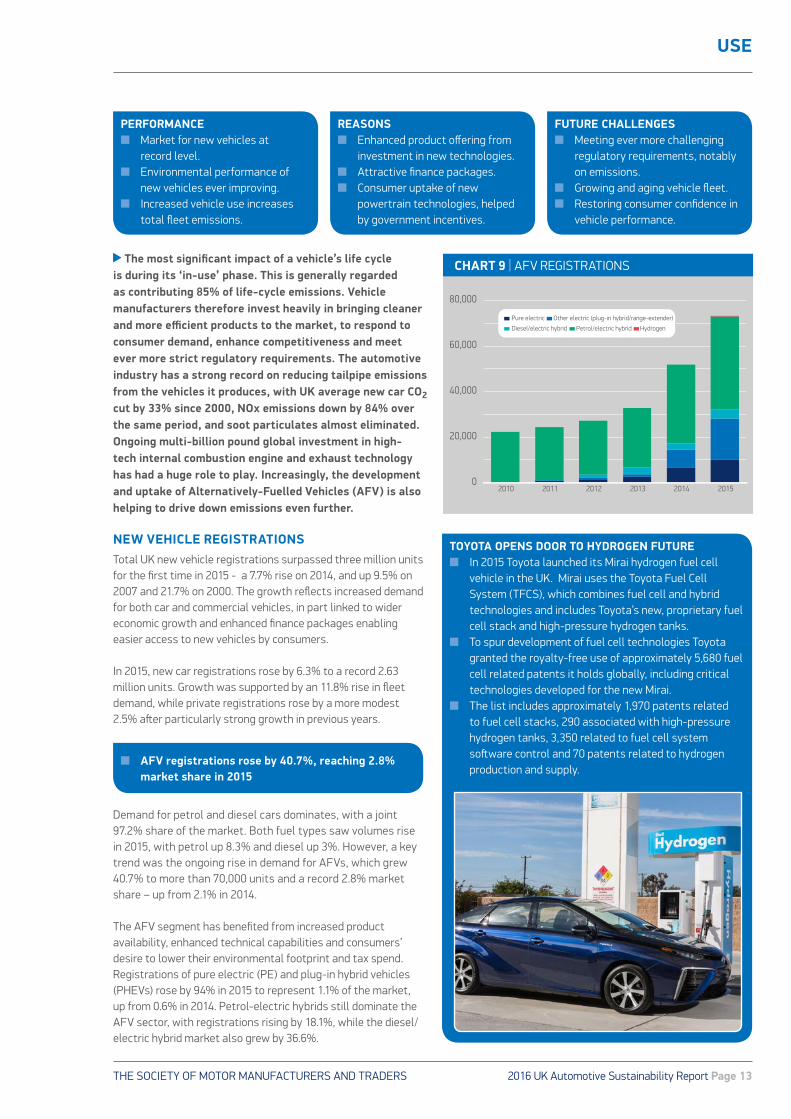
Demand for petrol and diesel cars dominates, with a joint 97.2% share of the market. Both fuel types saw volumes rise in 2015, with petrol up 8.3% and diesel up 3%. However, a key trend was the ongoing rise in demand for AFVs, which grew 40.7% to more than 70,000 units and a record 2.8% market share – up from 2.1% in 2014.
The AFV segment has benefited from increased product availability, enhanced technical capabilities and consumers’ desire to lower their environmental footprint and tax spend. Registrations of pure electric (PE) and plug-in hybrid vehicles (PHEVs) rose by 94% in 2015 to represent 1.1% of the market, up from 0.6% in 2014. Petrol-electric hybrids still dominate the AFV sector, with registrations rising by 18.1%, while the diesel/ electric hybrid market also grew by 36.6%.
PERFORMANCEn Market for new vehicles at
record level.n Environmental performance of
new vehicles ever improving.n Increased vehicle use increases
total fleet emissions.
REASONSn Enhanced product offering from
investment in new technologies.n Attractive finance packages.n Consumer uptake of new
powertrain technologies, helped by government incentives.
FUTURE CHALLENGES n Meeting ever more challenging
regulatory requirements, notably on emissions.
n Growing and aging vehicle fleet.n Restoring consumer confidence in
vehicle performance.
n AFV registrations rose by 40.7%, reaching 2.8% market share in 2015
The most significant impact of a vehicle’s life cycle is during its ‘in-use’ phase. This is generally regarded as contributing 85% of life-cycle emissions. Vehicle manufacturers therefore invest heavily in bringing cleaner and more efficient products to the market, to respond to consumer demand, enhance competitiveness and meet ever more strict regulatory requirements. The automotive industry has a strong record on reducing tailpipe emissions from the vehicles it produces, with UK average new car CO2 cut by 33% since 2000, NOx emissions down by 84% over the same period, and soot particulates almost eliminated. Ongoing multi-billion pound global investment in high-tech internal combustion engine and exhaust technology has had a huge role to play. Increasingly, the development and uptake of Alternatively-Fuelled Vehicles (AFV) is also helping to drive down emissions even further.
0
20,000
40,000
60,000
80,000
2010 2011 2012 2013 2014 2015
Pure electric Other electric (plug-in hybrid/range-extender)
Diesel/electric hybrid Petrol/electric hybrid Hydrogen
CHART 9 | AFV REGISTRATIONS
TOYOTA OPENS DOOR TO HYDROGEN FUTURE n In 2015 Toyota launched its Mirai hydrogen fuel cell
vehicle in the UK. Mirai uses the Toyota Fuel Cell System (TFCS), which combines fuel cell and hybrid technologies and includes Toyota’s new, proprietary fuel cell stack and high-pressure hydrogen tanks.
n To spur development of fuel cell technologies Toyota granted the royalty-free use of approximately 5,680 fuel cell related patents it holds globally, including critical technologies developed for the new Mirai.
n The list includes approximately 1,970 patents related to fuel cell stacks, 290 associated with high-pressure hydrogen tanks, 3,350 related to fuel cell system software control and 70 patents related to hydrogen production and supply.
THE SOCIETY OF MOTOR MANUFACTURERS AND TRADERSPage 14 | 2016 UK Automotive Sustainability Report
USE
NEW CAR CO2
CO2 emissions from the average new car in the UK fell again in 2015 to a new low of 121.4g/km – a 2.6% reduction on 2014 (124.6g/km), and 32.9% less than in 2000 (181g/km). These improvements have been delivered together with huge strides in safety and in-car technologies – many of which will add weight to the vehicle – not to mention the significant reductions in other emissions. These figures are based on the official NEDC laboratory test, which is required by law. While the rate of progress in 2015 is on a par with the 2.6% average annual fall since 2000, it does represent a slowdown when compared to figures from immediately after the recession – with the average rate of improvement being 3.9% annually between 2008 and 2014.
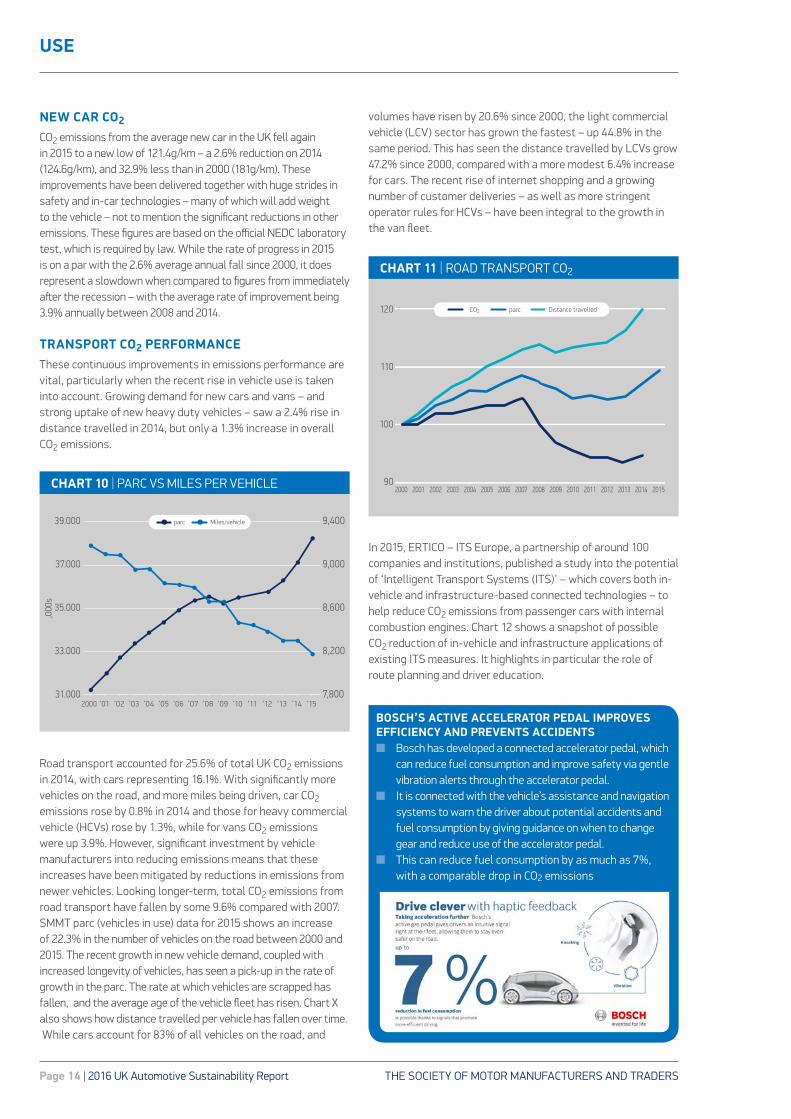
TRANSPORT CO2 PERFORMANCEThese continuous improvements in emissions performance are vital, particularly when the recent rise in vehicle use is taken into account. Growing demand for new cars and vans – and strong uptake of new heavy duty vehicles – saw a 2.4% rise in distance travelled in 2014, but only a 1.3% increase in overall CO2 emissions.
Road transport accounted for 25.6% of total UK CO2 emissions in 2014, with cars representing 16.1%. With significantly more vehicles on the road, and more miles being driven, car CO2 emissions rose by 0.8% in 2014 and those for heavy commercial vehicle (HCVs) rose by 1.3%, while for vans CO2 emissions were up 3.9%. However, significant investment by vehicle manufacturers into reducing emissions means that these increases have been mitigated by reductions in emissions from newer vehicles. Looking longer-term, total CO2 emissions from road transport have fallen by some 9.6% compared with 2007. SMMT parc (vehicles in use) data for 2015 shows an increase of 22.3% in the number of vehicles on the road between 2000 and 2015. The recent growth in new vehicle demand, coupled with increased longevity of vehicles, has seen a pick-up in the rate of growth in the parc. The rate at which vehicles are scrapped has fallen, and the average age of the vehicle fleet has risen. Chart X also shows how distance travelled per vehicle has fallen over time. While cars account for 83% of all vehicles on the road, and
volumes have risen by 20.6% since 2000, the light commercial vehicle (LCV) sector has grown the fastest – up 44.8% in the same period. This has seen the distance travelled by LCVs grow 47.2% since 2000, compared with a more modest 6.4% increase for cars. The recent rise of internet shopping and a growing number of customer deliveries – as well as more stringent operator rules for HCVs – have been integral to the growth in the van fleet.
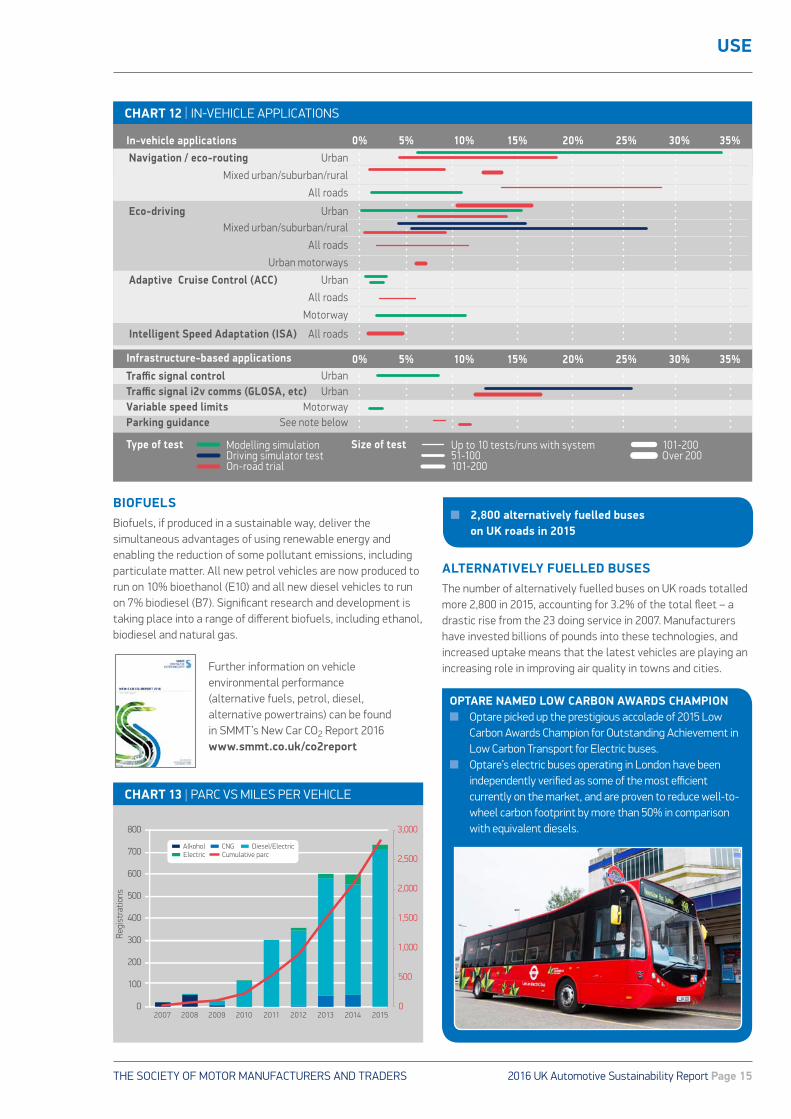
In 2015, ERTICO – ITS Europe, a partnership of around 100 companies and institutions, published a study into the potential of ‘Intelligent Transport Systems (ITS)’ – which covers both in-vehicle and infrastructure-based connected technologies – to help reduce CO2 emissions from passenger cars with internal combustion engines. Chart 12 shows a snapshot of possible CO2 reduction of in-vehicle and infrastructure applications of existing ITS measures. It highlights in particular the role of route planning and driver education.
CO2 parc Distance travelled
90
100
110
120
2000 2001 2002 2003 2004 2005 2006 2007 2008 2009 2010 2011 2012 2013 2014 2015
CHART 11 | ROAD TRANSPORT CO2
,000
s
parc Miles/vehicle
7,800
8,200
8,600
9,000
9,400
31.000
33.000
35.000
37.000
39.000
2000 ’01 ’02 ’03 ’04 ’05 ’06 ’07 ’08 ’09 ’10 ’11 ’12 ’13 ’14 ’15
CHART 10 | PARC VS MILES PER VEHICLE
BOSCH’S ACTIVE ACCELERATOR PEDAL IMPROVES EFFICIENCY AND PREVENTS ACCIDENTS n Bosch has developed a connected accelerator pedal, which
can reduce fuel consumption and improve safety via gentle vibration alerts through the accelerator pedal.
n It is connected with the vehicle’s assistance and navigation systems to warn the driver about potential accidents and fuel consumption by giving guidance on when to change gear and reduce use of the accelerator pedal.
n This can reduce fuel consumption by as much as 7%, with a comparable drop in CO2 emissions
THE SOCIETY OF MOTOR MANUFACTURERS AND TRADERS 2016 UK Automotive Sustainability Report Page 15
USE
BIOFUELSBiofuels, if produced in a sustainable way, deliver the simultaneous advantages of using renewable energy and enabling the reduction of some pollutant emissions, including particulate matter. All new petrol vehicles are now produced to run on 10% bioethanol (E10) and all new diesel vehicles to run on 7% biodiesel (B7). Significant research and development is taking place into a range of different biofuels, including ethanol, biodiesel and natural gas.
Further information on vehicle environmental performance (alternative fuels, petrol, diesel, alternative powertrains) can be found in SMMT’s New Car CO2 Report 2016 www.smmt.co.uk/co2report
ALTERNATIVELY FUELLED BUSES The number of alternatively fuelled buses on UK roads totalled more 2,800 in 2015, accounting for 3.2% of the total fleet – a drastic rise from the 23 doing service in 2007. Manufacturers have invested billions of pounds into these technologies, and increased uptake means that the latest vehicles are playing an increasing role in improving air quality in towns and cities.
In-vehicle applicationsNavigation / eco-routing
Eco-driving
Adaptive Cruise Control (ACC)
Intelligent Speed Adaptation (ISA)
0% 5% 10% 15% 20% 25% 30% 35%
Infrastructure-based applicationsTraffic signal controlTraffic signal i2v comms (GLOSA, etc)Variable speed limitsParking guidance
Type of test
Urban
Mixed urban/suburban/rural
All roads
Urban
Urban
UrbanUrban
Mixed urban/suburban/rural
All roads
All roads
All roads
Motorway
MotorwaySee note below
Modelling simulationDriving simulator testOn-road trial
Urban motorways
0% 5% 10% 15% 20% 25% 30% 35%
Size of test Up to 10 tests/runs with system51-100101-200
101-200Over 200
CHART 12 | IN-VEHICLE APPLICATIONS
OPTARE NAMED LOW CARBON AWARDS CHAMPION n Optare picked up the prestigious accolade of 2015 Low
Carbon Awards Champion for Outstanding Achievement in Low Carbon Transport for Electric buses.
n Optare’s electric buses operating in London have been independently verified as some of the most efficient currently on the market, and are proven to reduce well-to-wheel carbon footprint by more than 50% in comparison with equivalent diesels.
n 2,800 alternatively fuelled buses on UK roads in 2015
0
500
1,000
1,500
2,000
2,500
3,000
0
100
200
300
400
500
600
700
800
2007 2008 2009 2010 2011 2012 2013 2014 2015
Regi
stra
tions
Alkohol CNG Diesel/ElectricElectric Cumulative parc
CHART 13 | PARC VS MILES PER VEHICLE
THE SOCIETY OF MOTOR MANUFACTURERS AND TRADERSPage 16 | 2016 UK Automotive Sustainability Report
USE
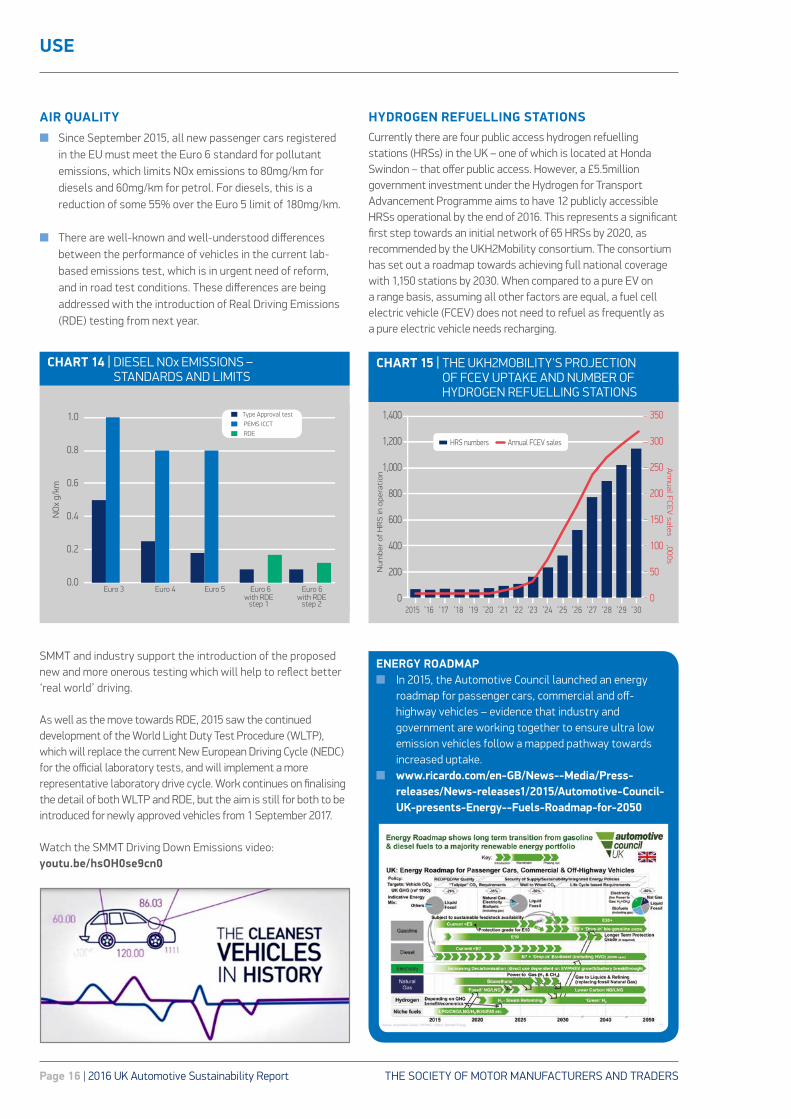
AIR QUALITY n Since September 2015, all new passenger cars registered
in the EU must meet the Euro 6 standard for pollutant emissions, which limits NOx emissions to 80mg/km for diesels and 60mg/km for petrol. For diesels, this is a reduction of some 55% over the Euro 5 limit of 180mg/km.
n There are well-known and well-understood differences between the performance of vehicles in the current lab-based emissions test, which is in urgent need of reform, and in road test conditions. These differences are being addressed with the introduction of Real Driving Emissions (RDE) testing from next year.
SMMT and industry support the introduction of the proposed new and more onerous testing which will help to reflect better ‘real world’ driving. As well as the move towards RDE, 2015 saw the continued development of the World Light Duty Test Procedure (WLTP), which will replace the current New European Driving Cycle (NEDC) for the official laboratory tests, and will implement a more representative laboratory drive cycle. Work continues on finalising the detail of both WLTP and RDE, but the aim is still for both to be introduced for newly approved vehicles from 1 September 2017.
Watch the SMMT Driving Down Emissions video: youtu.be/hsOH0se9cn0
HYDROGEN REFUELLING STATIONSCurrently there are four public access hydrogen refuelling stations (HRSs) in the UK – one of which is located at Honda Swindon – that offer public access. However, a £5.5million government investment under the Hydrogen for Transport Advancement Programme aims to have 12 publicly accessible HRSs operational by the end of 2016. This represents a significant first step towards an initial network of 65 HRSs by 2020, as recommended by the UKH2Mobility consortium. The consortium has set out a roadmap towards achieving full national coverage with 1,150 stations by 2030. When compared to a pure EV on a range basis, assuming all other factors are equal, a fuel cell electric vehicle (FCEV) does not need to refuel as frequently as a pure electric vehicle needs recharging.
0.0
0.2
0.4
0.6
0.8
1.0
Euro 3 Euro 4 Euro 5 Euro 6 with RDE
step 1 with RDE
step 2
Euro 6
Type Approval test PEMS ICCT RDE
NO
x g/
km
CHART 14 | DIESEL NOx EMISSIONS – STANDARDS AND LIMITS
0
50
100
150
200
250
300
350
0
200
400
600
800
1,000
1,200
1,400
Annual F
CE
V sales ,000s
Num
ber
of H
RS
in o
pera
tion
HRS numbers Annual FCEV sales
2015 ’16 ’17 ’18 ’19 ’20 ’21 ’22 ’23 ’24 ’25 ’26 ’27 ’28 ’29 ’30
CHART 15 | THE UKH2MOBILITY'S PROJECTION OF FCEV UPTAKE AND NUMBER OF HYDROGEN REFUELLING STATIONS
ENERGY ROADMAP n In 2015, the Automotive Council launched an energy
roadmap for passenger cars, commercial and off-highway vehicles – evidence that industry and government are working together to ensure ultra low emission vehicles follow a mapped pathway towards increased uptake.
n www.ricardo.com/en-GB/News--Media/Press-releases/News-releases1/2015/Automotive-Council-UK-presents-Energy--Fuels-Roadmap-for-2050
THE SOCIETY OF MOTOR MANUFACTURERS AND TRADERS 2016 UK Automotive Sustainability Report Page 17
USE
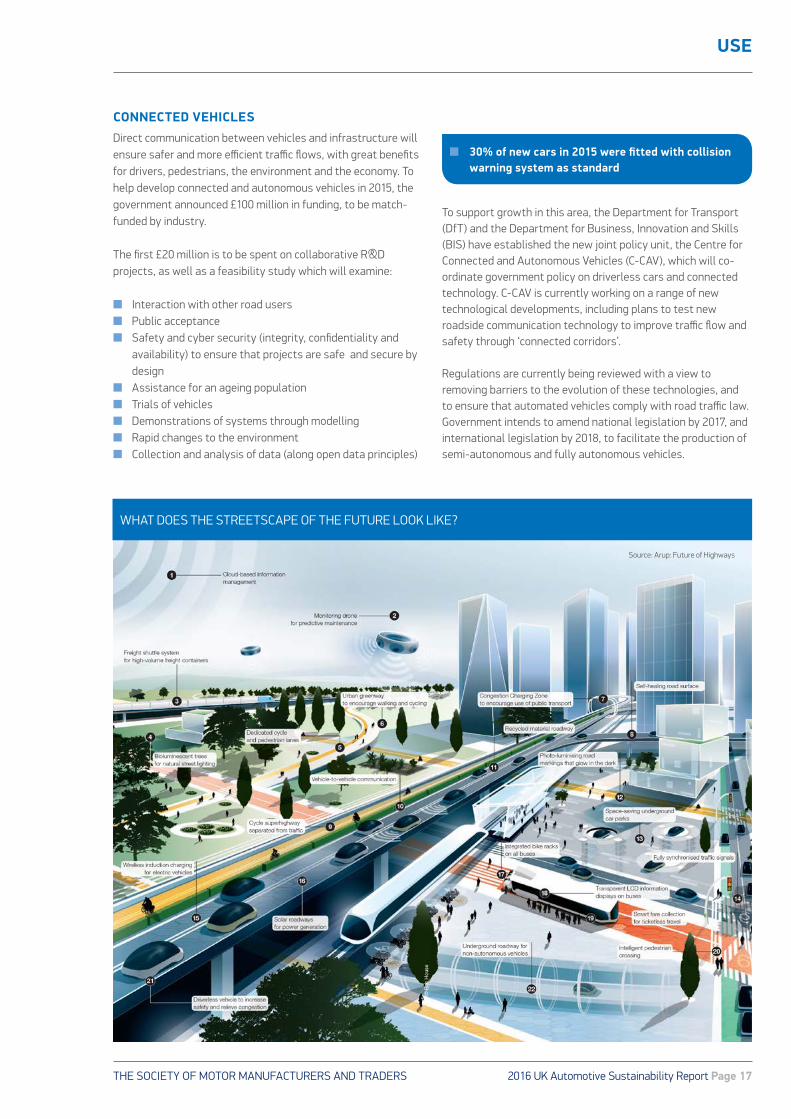
CONNECTED VEHICLES Direct communication between vehicles and infrastructure will ensure safer and more efficient traffic flows, with great benefits for drivers, pedestrians, the environment and the economy. To help develop connected and autonomous vehicles in 2015, the government announced £100 million in funding, to be match-funded by industry.
The first £20 million is to be spent on collaborative R&D projects, as well as a feasibility study which will examine:
n Interaction with other road users n Public acceptance n Safety and cyber security (integrity, confidentiality and
availability) to ensure that projects are safe and secure by design
n Assistance for an ageing populationn Trials of vehicles n Demonstrations of systems through modelling n Rapid changes to the environment n Collection and analysis of data (along open data principles)
To support growth in this area, the Department for Transport (DfT) and the Department for Business, Innovation and Skills (BIS) have established the new joint policy unit, the Centre for Connected and Autonomous Vehicles (C-CAV), which will co-ordinate government policy on driverless cars and connected technology. C-CAV is currently working on a range of new technological developments, including plans to test new roadside communication technology to improve traffic flow and safety through ‘connected corridors’.
Regulations are currently being reviewed with a view to removing barriers to the evolution of these technologies, and to ensure that automated vehicles comply with road traffic law. Government intends to amend national legislation by 2017, and international legislation by 2018, to facilitate the production of semi-autonomous and fully autonomous vehicles.
n 30% of new cars in 2015 were fitted with collision warning system as standard
WHAT DOES THE STREETSCAPE OF THE FUTURE LOOK LIKE?
Source: Arup: Future of Highways
THE SOCIETY OF MOTOR MANUFACTURERS AND TRADERSPage 18 | 2016 UK Automotive Sustainability Report
USE
VEHICLE SAFETY Autonomous safety technology
Connected and autonomous vehicle technologies not only ease the task of driving, but importantly also have the potential to reduce significantly the risk of serious accidents.
The motor industry is investing heavily in such technologies: data from SMMT and JATO Dynamics shows that 30.7% of new cars registered in 2015 were fitted with safety-enhancing collision warning systems as standard, with the technology offered as an option on an additional 27.4% of cars. Other technologies such as adaptive cruise control, autonomous emergency braking and blind spot monitoring are also surging in popularity.
The potential benefits to society are significant: a KPMG report, commissioned by SMMT in 2015, found that driverless technologies could see the number of serious accidents fall by more than 25,000, saving 2,500 lives every year, by 2030. Besides improving safety, these cars also offer the scope to reduce congestion-induced stress, providing drivers with more free time and allowing them to be more productive. It is estimated that the annual saving to consumers by the end of the next decade could be as high as £40 billion, with motorists able to multi-task while
behind the wheel, get to their destinations more quickly, and save money on fuel and insurance.
The KPMG report forecasts that by 2030 the development, production and use of these systems could generate up to 320,000 new jobs in the UK, with a boost to the economy of £51 billion.
With the emergence of connected and autonomous technology, which will deliver new efficiencies and reduce congestion, the industry is continuing to push the boundaries of progress. For new technologies to become commonplace, the development of new infrastructures, conducive regulatory environment and highly skilled workers are needed.
Vehicle safety has improved dramatically over the last decade with manufacturers committing to improve the safety performance of vehicles. Euro NCAP, the European car safety assessment programme which crash-tests vehicles, is an important non-compulsory mechanism that helps manufacturers to build ever-safer, more intelligent cars. It now devotes a proportion of a vehicle’s overall safety score to the implementation of collision avoidance systems.
In 2014, Euro NCAP added autonomous emergency braking to its safety rating scheme. This tests the ability of the vehicle to avoid rear-end collisions with the vehicle in front, and the assessment is being developed to cover head-on and junction collisions by 2020. From 2016, Euro NCAP also rewards vehicles that can avoid collisions with pedestrians, with the same being introduced for cyclists from 2018. n
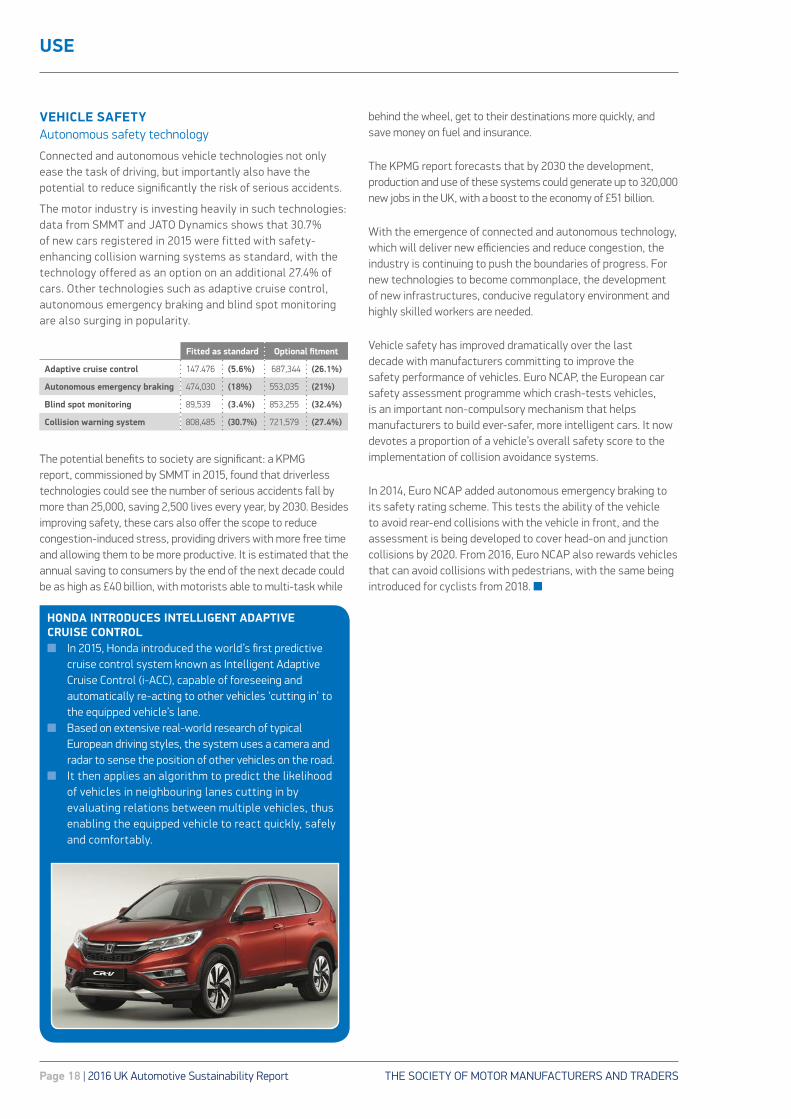
HONDA INTRODUCES INTELLIGENT ADAPTIVE CRUISE CONTROL n In 2015, Honda introduced the world’s first predictive
cruise control system known as Intelligent Adaptive Cruise Control (i-ACC), capable of foreseeing and automatically re-acting to other vehicles ‘cutting in’ to the equipped vehicle’s lane.
n Based on extensive real-world research of typical European driving styles, the system uses a camera and radar to sense the position of other vehicles on the road.
n It then applies an algorithm to predict the likelihood of vehicles in neighbouring lanes cutting in by evaluating relations between multiple vehicles, thus enabling the equipped vehicle to react quickly, safely and comfortably.
Fitted as standard Optional fitment
Adaptive cruise control 147.476 (5.6%) 687,344 (26.1%)
Autonomous emergency braking 474,030 (18%) 553,035 (21%)
Blind spot monitoring 89,539 (3.4%) 853,255 (32.4%)
Collision warning system 808,485 (30.7%) 721,579 (27.4%)
THE SOCIETY OF MOTOR MANUFACTURERS AND TRADERS 2016 UK Automotive Sustainability Report Page 19
END-OF-LIFE
PRODUCER RESPONSIBILITYSince 2006, under the EU End of Life Vehicles Directive, manufacturers have had to offer free of charge disposal of cars and vans that have reached the end of their usable life. The Directive specifies a proportion of the vehicle’s weight to be reused, which increased to 95% in January 2015. This includes a minimum of 85% reuse/recycling, by average weight of the vehicle. That was another 10% on top of the level required in 2014. Last year the Authorised Treatment Facilities (ATFs) – disposal locations authorised by vehicle manufacturers – succeeded in achieving this ambitious new target.
In 2015, SMMT launched a scheme to ensure owners of orphan vehicles – those vehicles whose manufacturer is no longer in existence (e.g. Rover) – can also have their vehicle disposed of free of charge.
CLOSING THE LOOPSo that various parts are in the right condition to be reused and remanufactured, ATFs are given detailed instructions on dismantling each model of vehicle within six months of it going on sale. This is done through the International Dismantling Information System (IDIS).
Many parts from ELVs go on to serve a useful second life. Some individual components can be directly re-used, while others can be profitably remanufactured and used for servicing and repairing other vehicles.
Ferrous metals make up the largest amount of material recovered from an ELV. These are in global demand, as indeed are non-ferrous metals which can be recycled into raw materials.
Glass, meanwhile, is extracted from the shredding process, and can be used as a substitute for other materials that would otherwise have to be made from scratch or extracted.
Fluids such as oils can be reused, while batteries are recycled. Tyres, once recycled, have an increasing number of applications, including protective surfacing for children’s playgrounds or fuel in cement kilns.
Wheels – both alloy and steel – are sent for recycling, as are lead wheel balance weights.
Component remanufacturing is a valuable part of the UK’s vibrant aftermarket sector, with parts recovered in the recycling process or during in-life servicing refurbished for reuse in future servicing and repair. Recovering resource-intensive components – such as engines, starters, alternators, brakes, pumps and turbochargers – vastly reduces costs and raw material demand.
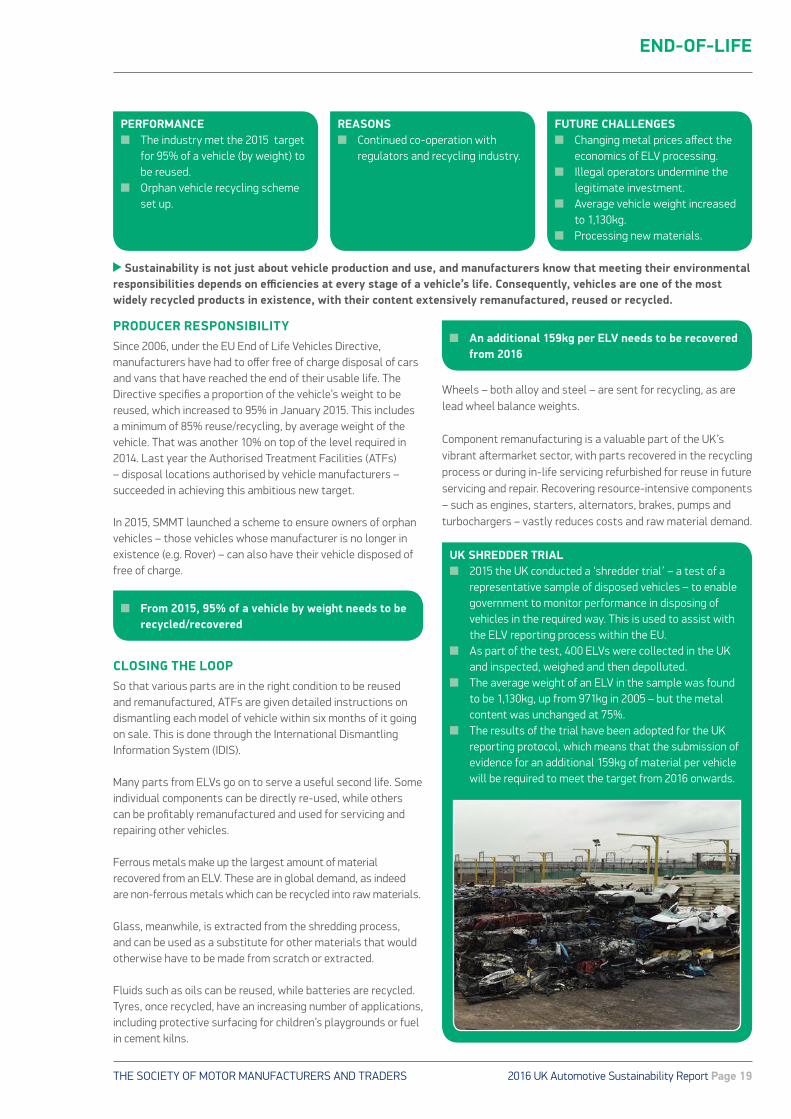
UK SHREDDER TRIAL n 2015 the UK conducted a ‘shredder trial’ – a test of a
representative sample of disposed vehicles – to enable government to monitor performance in disposing of vehicles in the required way. This is used to assist with the ELV reporting process within the EU.
n As part of the test, 400 ELVs were collected in the UK and inspected, weighed and then depolluted.
n The average weight of an ELV in the sample was found to be 1,130kg, up from 971kg in 2005 – but the metal content was unchanged at 75%.
n The results of the trial have been adopted for the UK reporting protocol, which means that the submission of evidence for an additional 159kg of material per vehicle will be required to meet the target from 2016 onwards.
PERFORMANCEn The industry met the 2015 target
for 95% of a vehicle (by weight) to be reused.
n Orphan vehicle recycling scheme set up.
REASONSn Continued co-operation with
regulators and recycling industry.
Sustainability is not just about vehicle production and use, and manufacturers know that meeting their environmental responsibilities depends on efficiencies at every stage of a vehicle’s life. Consequently, vehicles are one of the most widely recycled products in existence, with their content extensively remanufactured, reused or recycled.
n From 2015, 95% of a vehicle by weight needs to be recycled/recovered
n An additional 159kg per ELV needs to be recovered from 2016
FUTURE CHALLENGES n Changing metal prices affect the
economics of ELV processing.n Illegal operators undermine the
legitimate investment. n Average vehicle weight increased
to 1,130kg.n Processing new materials.
THE SOCIETY OF MOTOR MANUFACTURERS AND TRADERSPage 20 | 2016 UK Automotive Sustainability Report
END-OF-LIFE
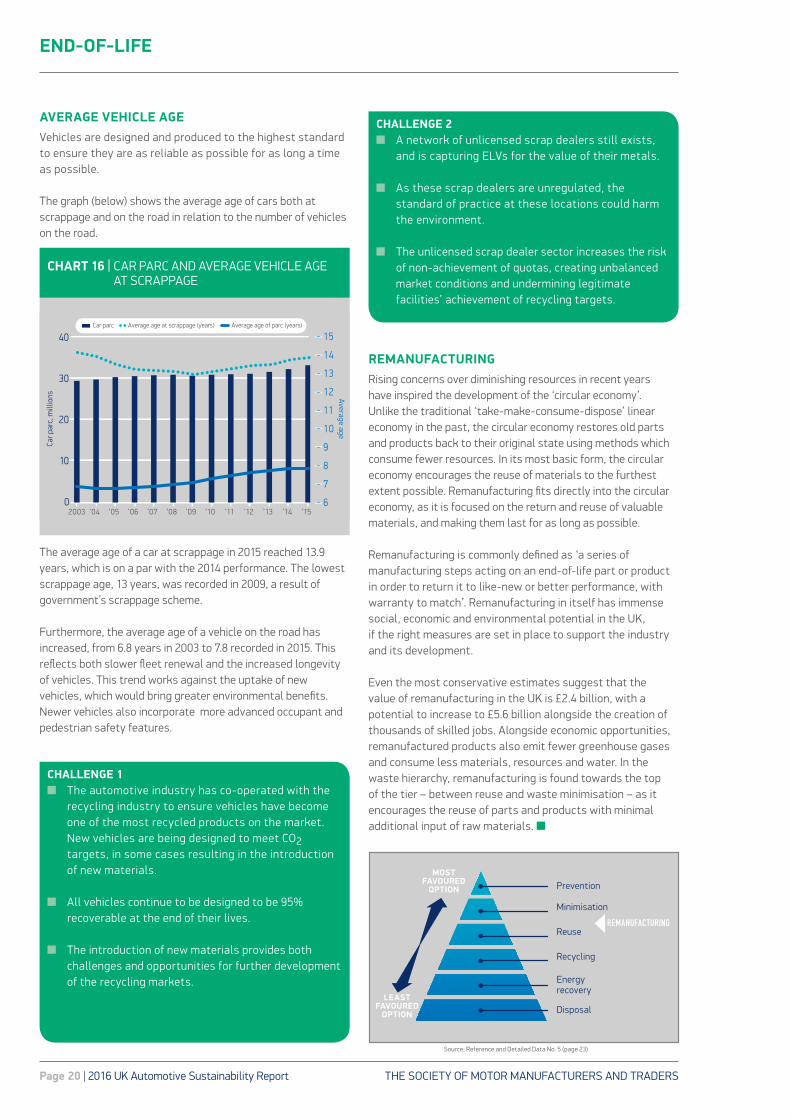
AVERAGE VEHICLE AGEVehicles are designed and produced to the highest standard to ensure they are as reliable as possible for as long a time as possible.
The graph (below) shows the average age of cars both at scrappage and on the road in relation to the number of vehicles on the road.
The average age of a car at scrappage in 2015 reached 13.9 years, which is on a par with the 2014 performance. The lowest scrappage age, 13 years, was recorded in 2009, a result of government’s scrappage scheme.
Furthermore, the average age of a vehicle on the road has increased, from 6.8 years in 2003 to 7.8 recorded in 2015. This reflects both slower fleet renewal and the increased longevity of vehicles. This trend works against the uptake of new vehicles, which would bring greater environmental benefits. Newer vehicles also incorporate more advanced occupant and pedestrian safety features.
REMANUFACTURING Rising concerns over diminishing resources in recent years have inspired the development of the ‘circular economy’. Unlike the traditional ‘take-make-consume-dispose’ linear economy in the past, the circular economy restores old parts and products back to their original state using methods which consume fewer resources. In its most basic form, the circular economy encourages the reuse of materials to the furthest extent possible. Remanufacturing fits directly into the circular economy, as it is focused on the return and reuse of valuable materials, and making them last for as long as possible.
Remanufacturing is commonly defined as ‘a series of manufacturing steps acting on an end-of-life part or product in order to return it to like-new or better performance, with warranty to match’. Remanufacturing in itself has immense social, economic and environmental potential in the UK, if the right measures are set in place to support the industry and its development.
Even the most conservative estimates suggest that the value of remanufacturing in the UK is £2.4 billion, with a potential to increase to £5.6 billion alongside the creation of thousands of skilled jobs. Alongside economic opportunities, remanufactured products also emit fewer greenhouse gases and consume less materials, resources and water. In the waste hierarchy, remanufacturing is found towards the top of the tier – between reuse and waste minimisation – as it encourages the reuse of parts and products with minimal additional input of raw materials. n
CHALLENGE 1n The automotive industry has co-operated with the
recycling industry to ensure vehicles have become one of the most recycled products on the market. New vehicles are being designed to meet CO2 targets, in some cases resulting in the introduction of new materials.
n All vehicles continue to be designed to be 95% recoverable at the end of their lives.
n The introduction of new materials provides both challenges and opportunities for further development of the recycling markets.
CHALLENGE 2n A network of unlicensed scrap dealers still exists,
and is capturing ELVs for the value of their metals.
n As these scrap dealers are unregulated, the standard of practice at these locations could harm the environment.
n The unlicensed scrap dealer sector increases the risk of non-achievement of quotas, creating unbalanced market conditions and undermining legitimate facilities’ achievement of recycling targets.
6
7
8
9
10
11
12
13
14
15 40
30
20
10
02003 ’04 ’05 ’06 ’07 ’08 ’09 ’10 ’11 ’12 ’13 ’14 ’15
Car p
arc,
mill
ions A
verage age
Car parc Average age at scrappage (years) Average age of parc (years)
CHART 16 | CAR PARC AND AVERAGE VEHICLE AGE AT SCRAPPAGE
Prevention
REMANUFACTURING
MOST FAVOURED
OPTION
LEASTFAVOURED
OPTION
Minimisation
Reuse
Recycling
Energy recovery
Disposal
Source: Reference and Detailed Data No. 5 (page 23)
THE SOCIETY OF MOTOR MANUFACTURERS AND TRADERS 2016 UK Automotive Sustainability Report Page 21
END-OF-LIFE
RAW MATERIAL
PROCESSING
RECYCLE
REMANUFACTURE
REUSE
MANUACTURE USEEND OF
LIFEWASTE
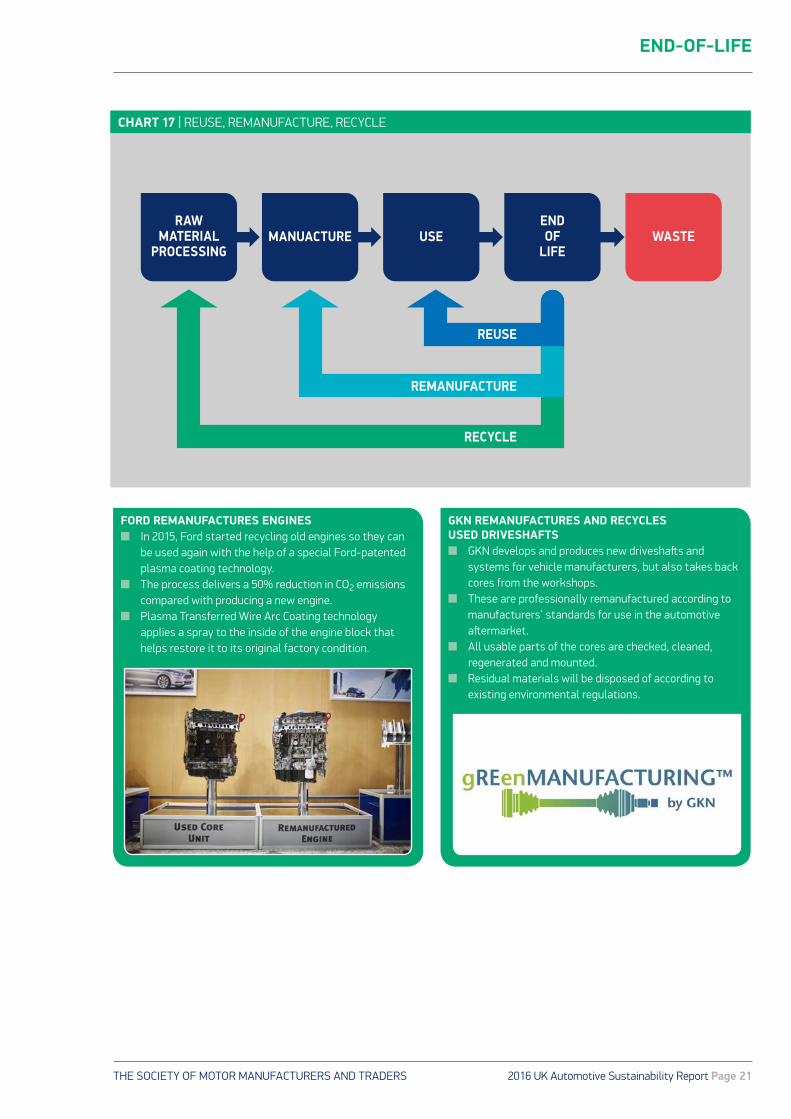
CHART 17 | REUSE, REMANUFACTURE, RECYCLE
FORD REMANUFACTURES ENGINES n In 2015, Ford started recycling old engines so they can
be used again with the help of a special Ford-patented plasma coating technology.
n The process delivers a 50% reduction in CO2 emissions compared with producing a new engine.
n Plasma Transferred Wire Arc Coating technology applies a spray to the inside of the engine block that helps restore it to its original factory condition.
GKN REMANUFACTURES AND RECYCLES USED DRIVESHAFTS n GKN develops and produces new driveshafts and
systems for vehicle manufacturers, but also takes back cores from the workshops.
n These are professionally remanufactured according to manufacturers’ standards for use in the automotive aftermarket.
n All usable parts of the cores are checked, cleaned, regenerated and mounted.
n Residual materials will be disposed of according to existing environmental regulations.
THE SOCIETY OF MOTOR MANUFACTURERS AND TRADERSPage 22 | 2016 UK Automotive Sustainability Report
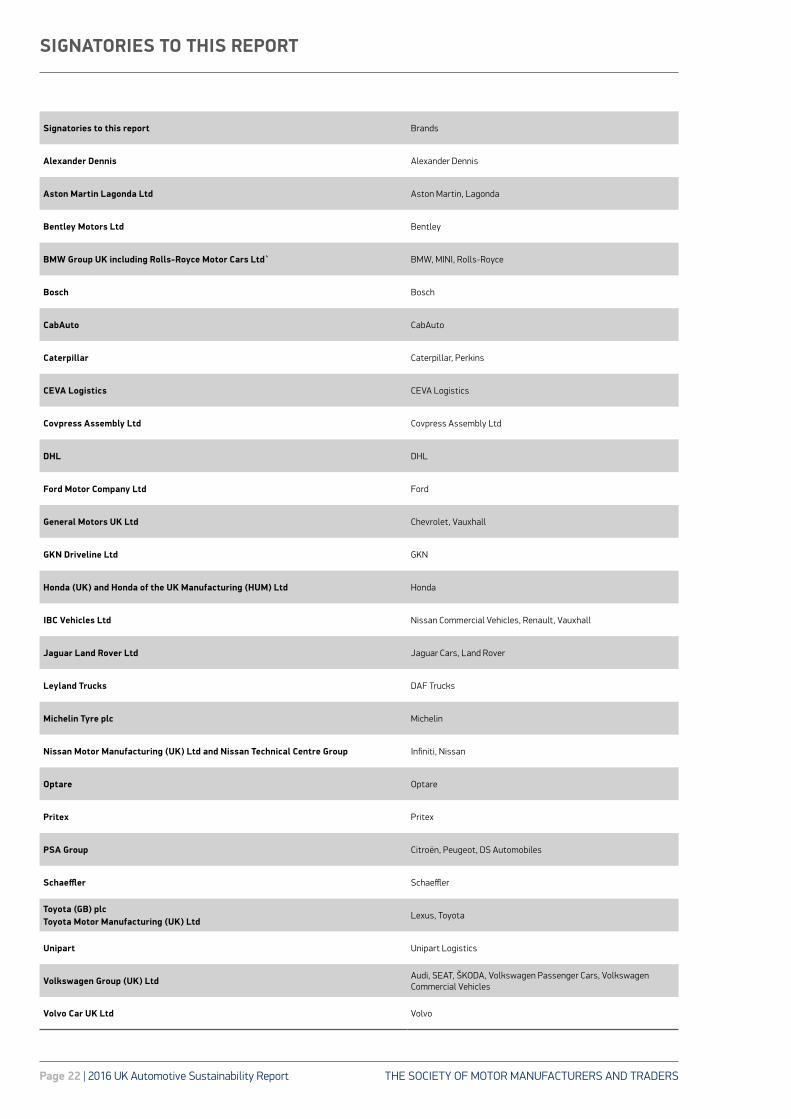
SIGNATORIES TO THIS REPORT
Signatories to this report Brands
Alexander Dennis Alexander Dennis
Aston Martin Lagonda Ltd Aston Martin, Lagonda
Bentley Motors Ltd Bentley
BMW Group UK including Rolls-Royce Motor Cars Ltd` BMW, MINI, Rolls-Royce
Bosch Bosch
CabAuto CabAuto
Caterpillar Caterpillar, Perkins
CEVA Logistics CEVA Logistics
Covpress Assembly Ltd Covpress Assembly Ltd
DHL DHL
Ford Motor Company Ltd Ford
General Motors UK Ltd Chevrolet, Vauxhall
GKN Driveline Ltd GKN
Honda (UK) and Honda of the UK Manufacturing (HUM) Ltd Honda
IBC Vehicles Ltd Nissan Commercial Vehicles, Renault, Vauxhall
Jaguar Land Rover Ltd Jaguar Cars, Land Rover
Leyland Trucks DAF Trucks
Michelin Tyre plc Michelin
Nissan Motor Manufacturing (UK) Ltd and Nissan Technical Centre Group Infiniti, Nissan
Optare Optare
Pritex Pritex
PSA Group Citroën, Peugeot, DS Automobiles
Schaeffler Schaeffler
Toyota (GB) plcToyota Motor Manufacturing (UK) Ltd
Lexus, Toyota
Unipart Unipart Logistics
Volkswagen Group (UK) Ltd Audi, SEAT, ŠKODA, Volkswagen Passenger Cars, Volkswagen Commercial Vehicles
Volvo Car UK Ltd Volvo
THE SOCIETY OF MOTOR MANUFACTURERS AND TRADERS 2016 UK Automotive Sustainability Report Page 23
REFERENCES AND ONLINE CONTENT
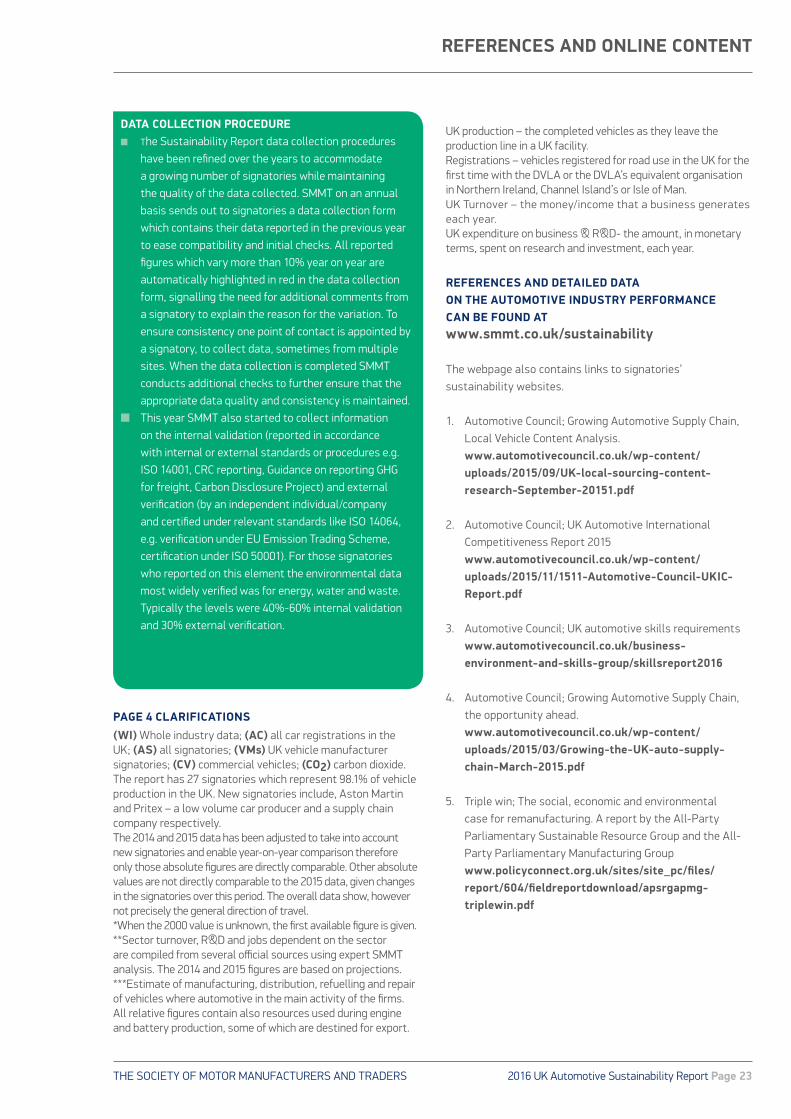
PAGE 4 CLARIFICATIONS(WI) Whole industry data; (AC) all car registrations in the UK; (AS) all signatories; (VMs) UK vehicle manufacturer signatories; (CV) commercial vehicles; (CO2) carbon dioxide.The report has 27 signatories which represent 98.1% of vehicle production in the UK. New signatories include, Aston Martin and Pritex – a low volume car producer and a supply chain company respectively.The 2014 and 2015 data has been adjusted to take into account new signatories and enable year-on-year comparison therefore only those absolute figures are directly comparable. Other absolute values are not directly comparable to the 2015 data, given changes in the signatories over this period. The overall data show, however not precisely the general direction of travel.*When the 2000 value is unknown, the first available figure is given. **Sector turnover, R&D and jobs dependent on the sector are compiled from several official sources using expert SMMT analysis. The 2014 and 2015 figures are based on projections.***Estimate of manufacturing, distribution, refuelling and repair of vehicles where automotive in the main activity of the firms. All relative figures contain also resources used during engine and battery production, some of which are destined for export.
UK production – the completed vehicles as they leave the production line in a UK facility.Registrations – vehicles registered for road use in the UK for the first time with the DVLA or the DVLA’s equivalent organisation in Northern Ireland, Channel Island’s or Isle of Man.UK Turnover – the money/income that a business generates each year.UK expenditure on business & R&D- the amount, in monetary terms, spent on research and investment, each year.
REFERENCES AND DETAILED DATA ON THE AUTOMOTIVE INDUSTRY PERFORMANCE CAN BE FOUND ATwww.smmt.co.uk/sustainability
The webpage also contains links to signatories’ sustainability websites.
1. Automotive Council; Growing Automotive Supply Chain, Local Vehicle Content Analysis. www.automotivecouncil.co.uk/wp-content/uploads/2015/09/UK-local-sourcing-content-research-September-20151.pdf
2. Automotive Council; UK Automotive International Competitiveness Report 2015 www.automotivecouncil.co.uk/wp-content/uploads/2015/11/1511-Automotive-Council-UKIC-Report.pdf
3. Automotive Council; UK automotive skills requirements www.automotivecouncil.co.uk/business-environment-and-skills-group/skillsreport2016
4. Automotive Council; Growing Automotive Supply Chain, the opportunity ahead. www.automotivecouncil.co.uk/wp-content/uploads/2015/03/Growing-the-UK-auto-supply-chain-March-2015.pdf
5. Triple win; The social, economic and environmental case for remanufacturing. A report by the All-Party Parliamentary Sustainable Resource Group and the All-Party Parliamentary Manufacturing Group www.policyconnect.org.uk/sites/site_pc/files/report/604/fieldreportdownload/apsrgapmg-triplewin.pdf
DATA COLLECTION PROCEDURE n The Sustainability Report data collection procedures
have been refined over the years to accommodate a growing number of signatories while maintaining the quality of the data collected. SMMT on an annual basis sends out to signatories a data collection form which contains their data reported in the previous year to ease compatibility and initial checks. All reported figures which vary more than 10% year on year are automatically highlighted in red in the data collection form, signalling the need for additional comments from a signatory to explain the reason for the variation. To ensure consistency one point of contact is appointed by a signatory, to collect data, sometimes from multiple sites. When the data collection is completed SMMT conducts additional checks to further ensure that the appropriate data quality and consistency is maintained.
n This year SMMT also started to collect information on the internal validation (reported in accordance with internal or external standards or procedures e.g. ISO 14001, CRC reporting, Guidance on reporting GHG for freight, Carbon Disclosure Project) and external verification (by an independent individual/company and certified under relevant standards like ISO 14064, e.g. verification under EU Emission Trading Scheme, certification under ISO 50001). For those signatories who reported on this element the environmental data most widely verified was for energy, water and waste. Typically the levels were 40%-60% internal validation and 30% external verification.
THE SOCIETY OF MOTOR MANUFACTURERS AND TRADERS71 Great Peter Street, London, SW1P 2BNTel: +44 (0)20 7235 7000E-mail: [email protected]
:@SMMT :SMMT
www.smmt.co.uk
SMMT, the ‘S’ symbol and the ‘Driving the motor industry’ brandline are registered trademarks of SMMT Ltd
DisclaimerThis publication contains general information and, although SMMT endeavours to ensure that the content
is accurate and up-to-date at the date of publication, no representation or warranty, express or implied, is
made as to its accuracy or completeness and therefore the information in this publication should not be
relied upon. Readers should always seek appropriate advice from a suitably qualified expert before taking,
or refraining from taking, any action. The contents of this publication should not be construed as advice or
guidance and SMMT disclaims liability for any loss, howsoever caused, arising directly or indirectly from
reliance on the information in this publication.
Printed in a sustainable manner, using FSC® certified paper from responsibly managed forests. The paper mill and printer are ISO14001 Environmental Management certified and the printer is based within 10 miles of SMMT, reducing the carbon impact of transporting this printed product. The booklet can be recycled after use.