Embed Size (px)
Citation preview
2016 Third Party RFP PlanningStakeholder Presentation
Karen Zelmar Director, EE Programs
Welcome and Safety
Message
2
Agenda
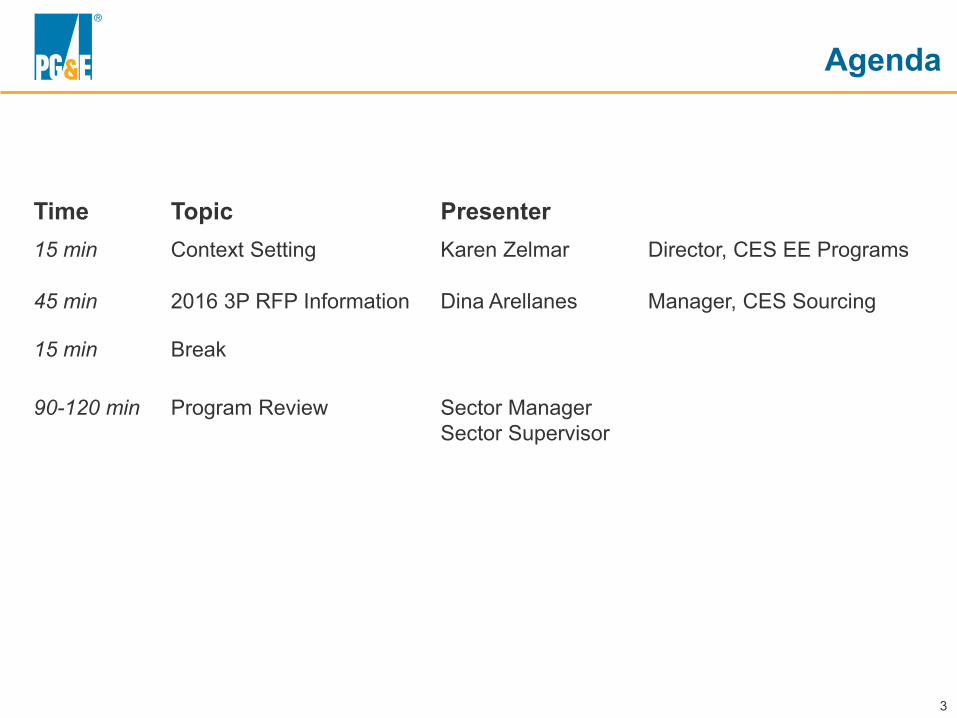
Time 15 min
Topic Context Setting
Presenter Karen Zelmar Director, CES EE Programs
45 min 2016 3P RFP Information Dina Arellanes Manager, CES Sourcing
15 min Break
90-120 min Program Review Sector Manager Sector Supervisor
3
Meeting Objective - Why we are here
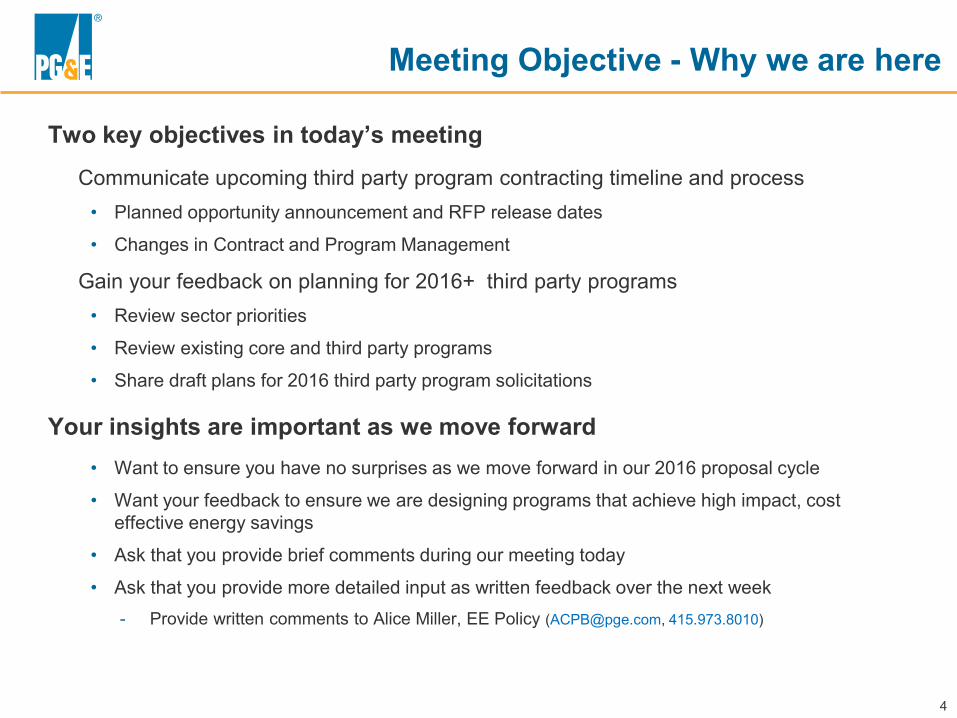
Two key objectives in today’s meeting Communicate upcoming third party program contracting timeline and process
• Planned opportunity announcement and RFP release dates
• Changes in Contract and Program Management
Gain your feedback on planning for 2016+ third party programs • Review sector priorities
• Review existing core and third party programs
• Share draft plans for 2016 third party program solicitations
Your insights are important as we move forward • Want to ensure you have no surprises as we move forward in our 2016 proposal cycle
• Want your feedback to ensure we are designing programs that achieve high impact, cost effective energy savings
• Ask that you provide brief comments during our meeting today
• Ask that you provide more detailed input as written feedback over the next week - Provide written comments to Alice Miller, EE Policy ([email protected], 415.973.8010)
4
Organizational Structure
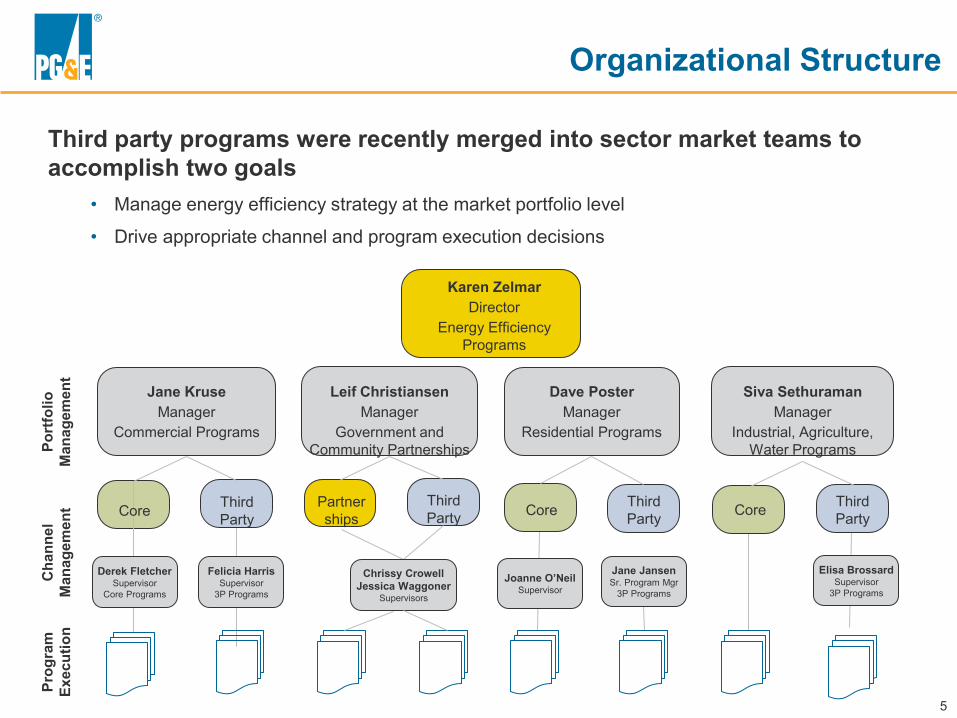
Third party programs were recently merged into sector market teams to accomplish two goals
• Manage energy efficiency strategy at the market portfolio level
• Drive appropriate channel and program execution decisions
Karen Zelmar Director
Energy Efficiency Programs
Core Third Party
Partner ships
Third Party Core Third
Party
Prog
ram
Exec
utio
n Po
rtfo
lio
Man
agem
ent
Cha
nnel
Man
agem
ent
Felicia Harris Supervisor
3P Programs
Chrissy Crowell Jessica Waggoner
Supervisors
Jane Jansen Sr. Program Mgr
3P Programs Joanne O’Neil
Supervisor
Derek Fletcher Supervisor
Core Programs
Jane Kruse Manager
Commercial Programs
Leif Christiansen Manager
Government and Community Partnerships
Dave Poster Manager
Residential Programs
Siva Sethuraman Manager
Industrial, Agriculture, Water Programs
Core Third Party
Elisa Brossard Supervisor
3P Programs
5
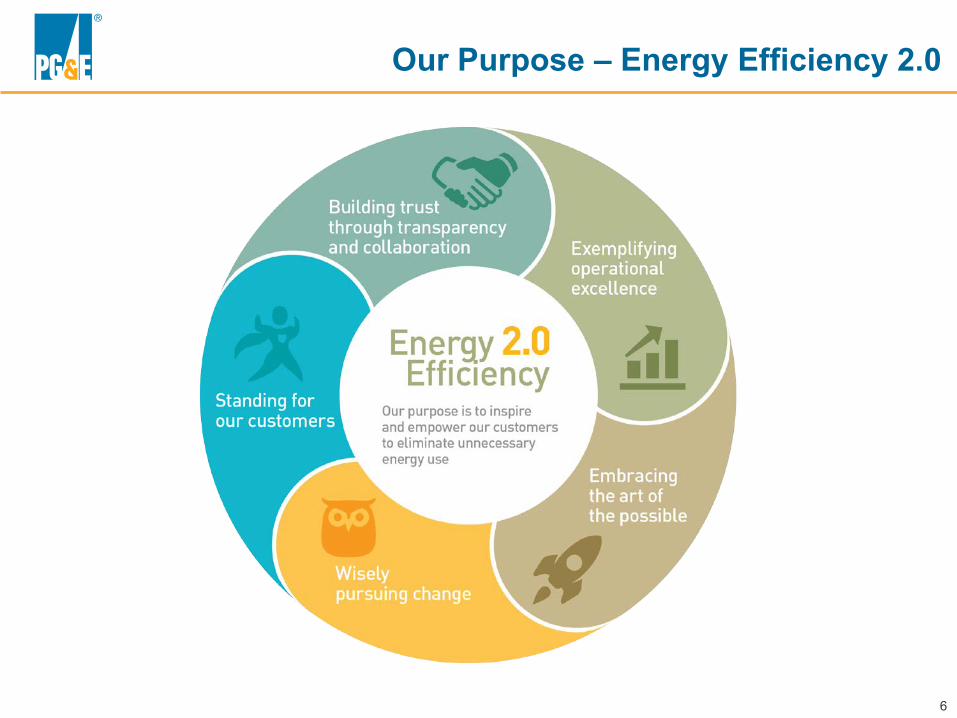
Exemplifyingoperationalexcellence
hi
' Embracing the art of the possible
Wiselypursuing change
Standing for I our customers
Building trust through transparency
„ a n d collaboration
Energy 2.0 Efficiency
Our purpose is to inspire and empower our customers to eliminate unnecessary
energy use
Our Purpose – Energy Efficiency 2.0
6
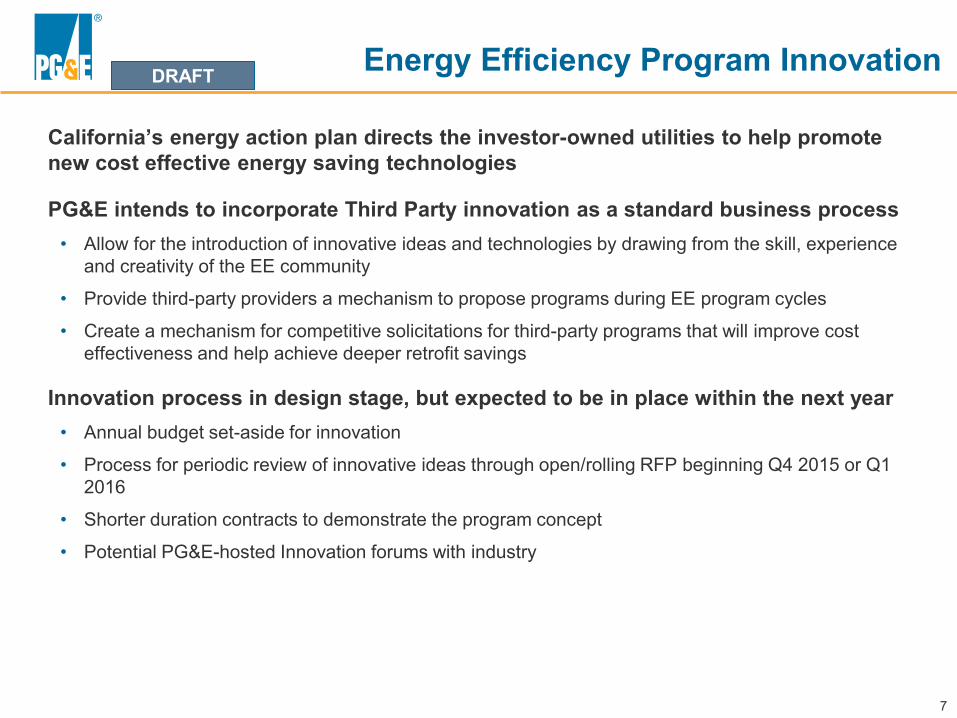
DRAFT Energy Efficiency Program Innovation
California’s energy action plan directs the investor-owned utilities to help promote new cost effective energy saving technologies
PG&E intends to incorporate Third Party innovation as a standard business process • Allow for the introduction of innovative ideas and technologies by drawing from the skill, experience
and creativity of the EE community
• Provide third-party providers a mechanism to propose programs during EE program cycles
• Create a mechanism for competitive solicitations for third-party programs that will improve cost effectiveness and help achieve deeper retrofit savings
Innovation process in design stage, but expected to be in place within the next year • Annual budget set-aside for innovation
• Process for periodic review of innovative ideas through open/rolling RFP beginning Q4 2015 or Q1 2016
• Shorter duration contracts to demonstrate the program concept
• Potential PG&E-hosted Innovation forums with industry
7
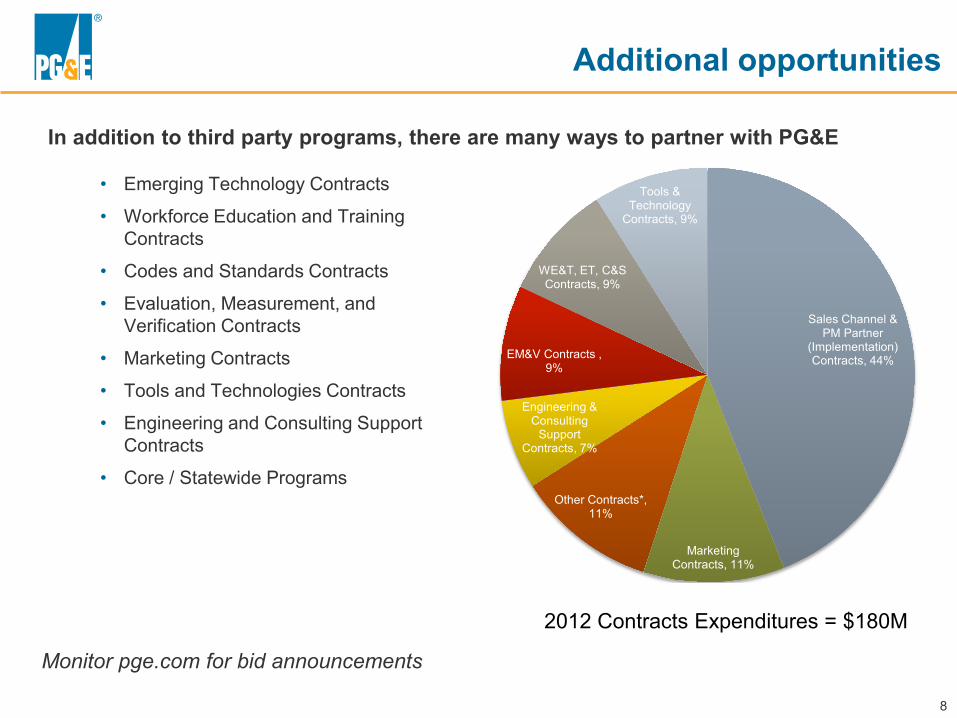
Additional opportunities
In addition to third party programs, there are many ways to partner with PG&E
• Emerging Technology Contracts
• Workforce Education and Training Contracts
• Codes and Standards Contracts
• Evaluation, Measurement, and Verification Contracts
• Marketing Contracts
• Tools and Technologies Contracts
• Engineering and Consulting Support Contracts
• Core / Statewide Programs
Sales Channel & PM Partner
(Implementation) Contracts, 44%
Marketing Contracts, 11%
Other Contracts*, 11%
Engineering & Consulting
Support Contracts,
EM&V Contracts , 9%
WE&T, ET, C&S Contracts, 9%
Tools & Technology
Contracts, 9%
7%
2012 Contracts Expenditures = $180M
Monitor pge.com for bid announcements
8
Other Contracts*, 11%
2016 Third Party RFPs
SOURCING TIMELINE AND INFORMATION
9
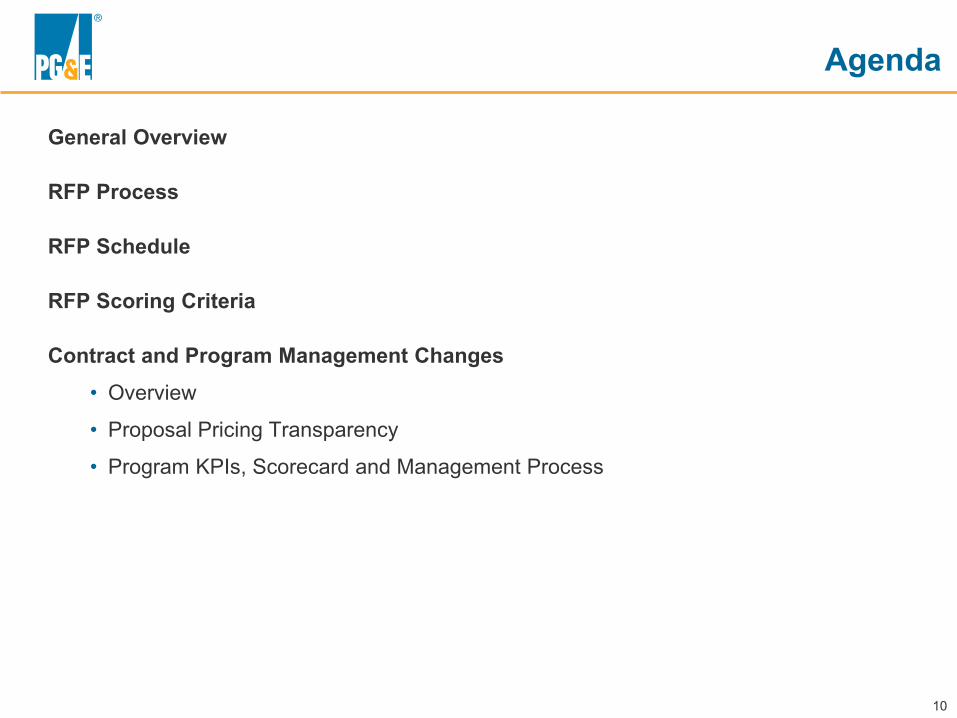
Agenda
General Overview
RFP Process
RFP Schedule
RFP Scoring Criteria
Contract and Program Management Changes • Overview
• Proposal Pricing Transparency
• Program KPIs, Scorecard and Management Process
10
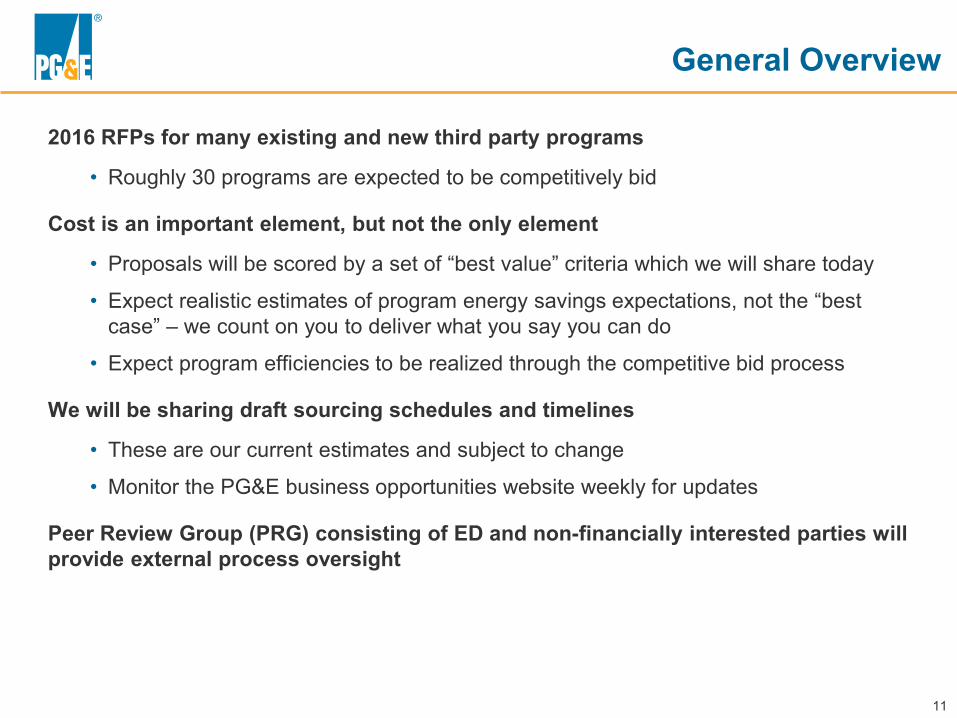
General Overview
2016 RFPs for many existing and new third party programs
• Roughly 30 programs are expected to be competitively bid
Cost is an important element, but not the only element
• Proposals will be scored by a set of “best value” criteria which we will share today
• Expect realistic estimates of program energy savings expectations, not the “best case” – we count on you to deliver what you say you can do
• Expect program efficiencies to be realized through the competitive bid process
We will be sharing draft sourcing schedules and timelines
• These are our current estimates and subject to change
• Monitor the PG&E business opportunities website weekly for updates
Peer Review Group (PRG) consisting of ED and non-financially interested parties will provide external process oversight
11
RFP Process
12
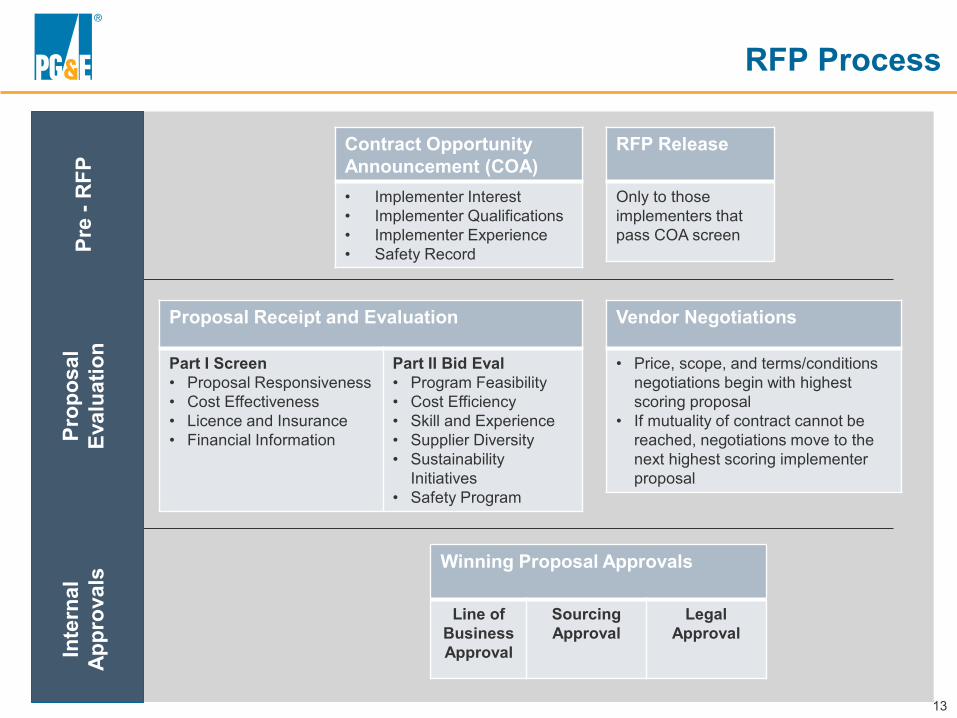
RFP Process
Contract Opportunity Announcement (COA) • Implementer Interest • Implementer Qualifications • Implementer Experience • Safety Record
RFP Release
Only to those implementers that pass COA screen
Proposal Receipt and Evaluation
Part I Screen • Proposal Responsiveness • Cost Effectiveness • Licence and Insurance • Financial Information
Part II Bid Eval • Program Feasibility • Cost Efficiency • Skill and Experience • Supplier Diversity • Sustainability
Initiatives • Safety Program
Winning Proposal Approvals
Line of Business Approval
Sourcing Approval
Legal Approval
Vendor Negotiations
• Price, scope, and terms/conditions negotiations begin with highest scoring proposal
• If mutuality of contract cannot be reached, negotiations move to the next highest scoring implementer proposal
Pre
-RFP
Prop
osal
Eval
uatio
n In
tern
al
Appr
oval
s
13
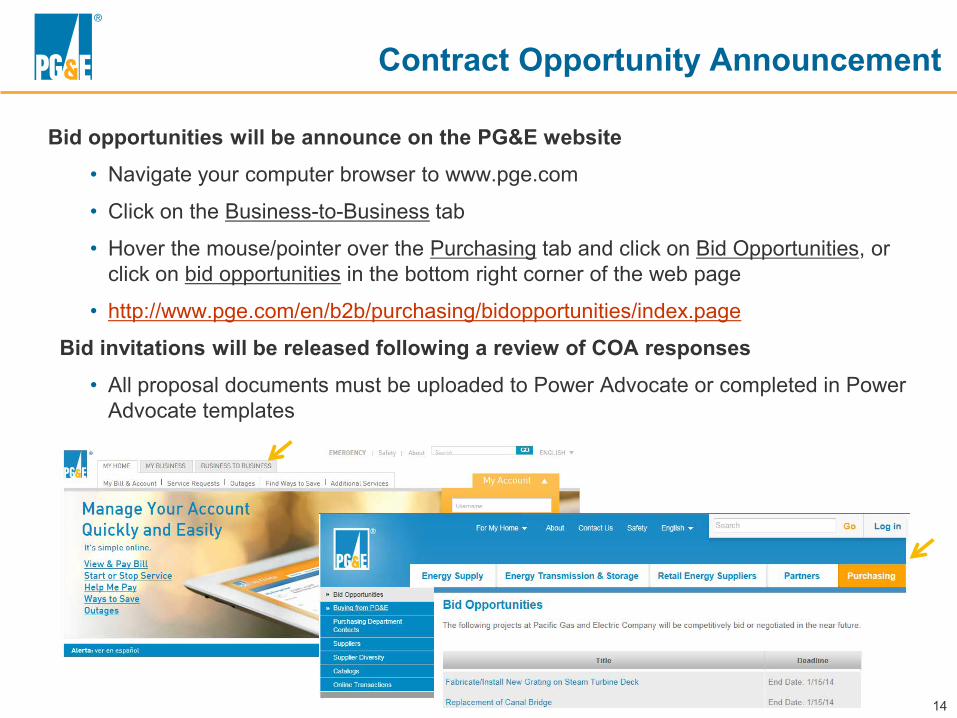
Contract Opportunity Announcement
Bid opportunities will be announce on the PG&E website • Navigate your computer browser to www.pge.com
• Click on the Business-to-Business tab
• Hover the mouse/pointer over the Purchasing tab and click on Bid Opportunities, or click on bid opportunities in the bottom right corner of the web page
• http://www.pge.com/en/b2b/purchasing/bidopportunities/index.page
Bid invitations will be released following a review of COA responses • All proposal documents must be uploaded to Power Advocate or completed in Power
Advocate templates
14
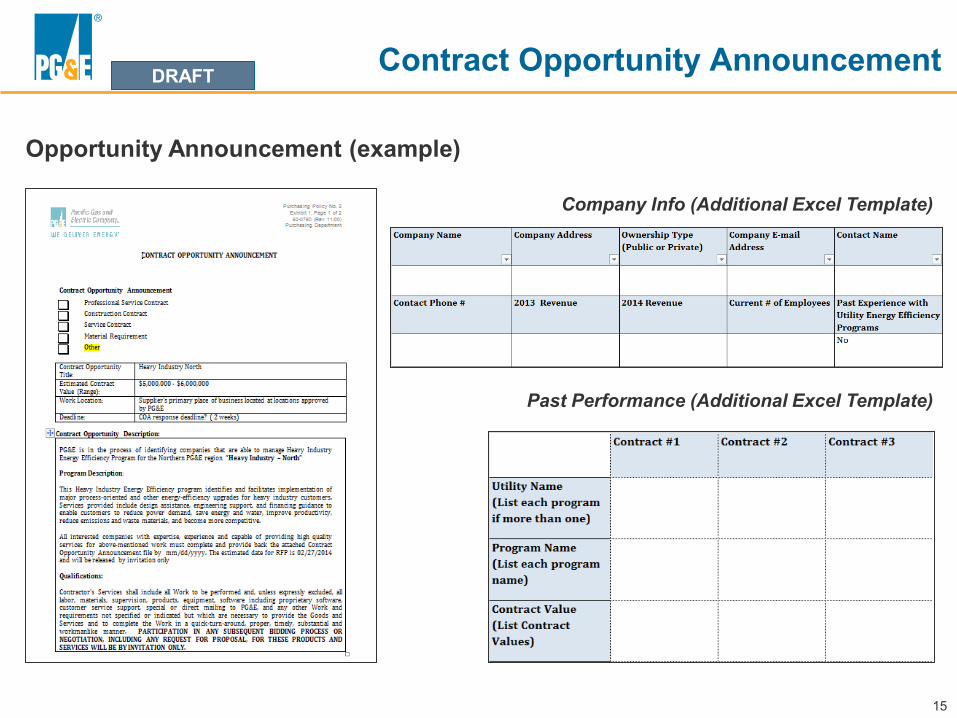
DRAFT Contract Opportunity Announcement
Opportunity Announcement (example)
Company Info (Additional Excel Template)
Past Performance (Additional Excel Template)
15
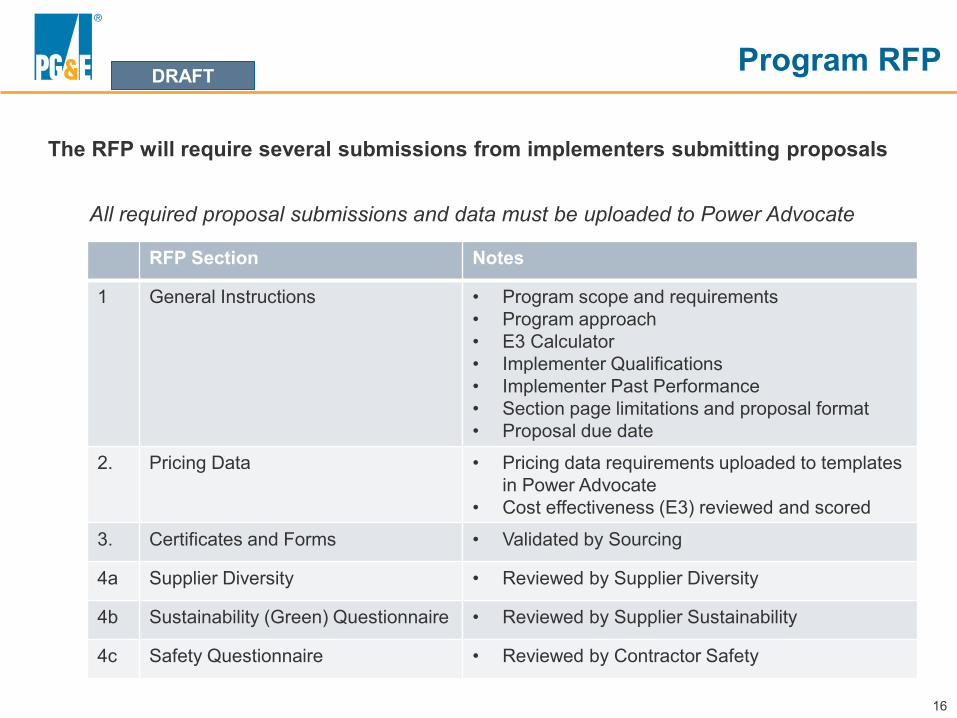
DRAFT Program RFP
The RFP will require several submissions from implementers submitting proposals
All required proposal submissions and data must be uploaded to Power Advocate
RFP Section Notes
1 General Instructions • Program scope and requirements • Program approach • E3 Calculator • Implementer Qualifications • Implementer Past Performance • Section page limitations and proposal format • Proposal due date
2. Pricing Data • Pricing data requirements uploaded to templates in Power Advocate
• Cost effectiveness (E3) reviewed and scored
3. Certificates and Forms • Validated by Sourcing
4a Supplier Diversity • Reviewed by Supplier Diversity
4b Sustainability (Green) Questionnaire • Reviewed by Supplier Sustainability
4c Safety Questionnaire • Reviewed by Contractor Safety
16
RFP Schedule
17
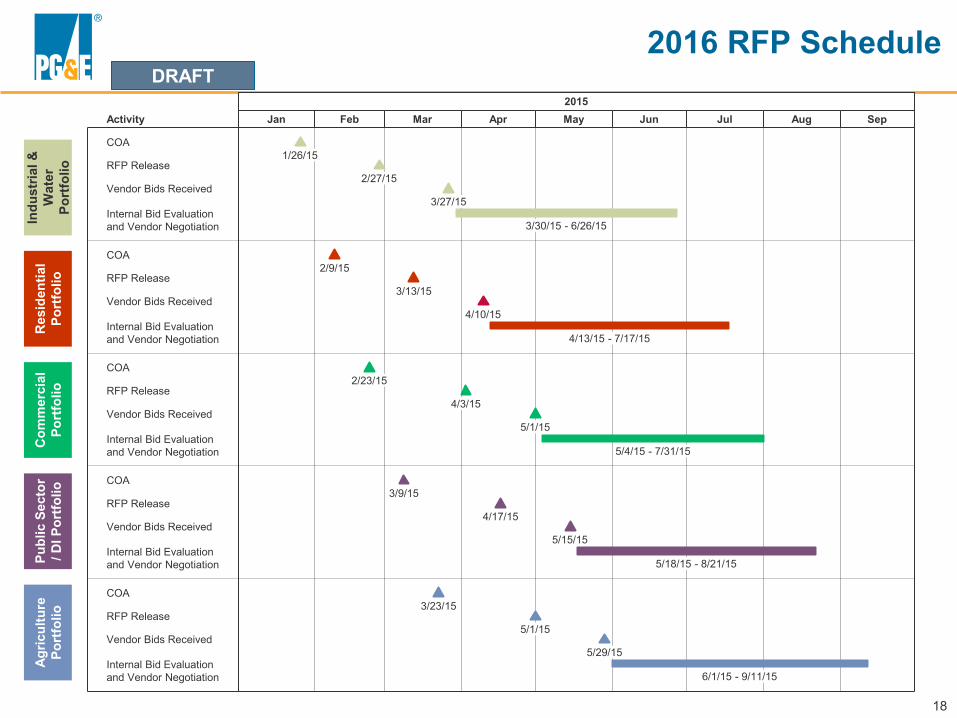
DRAFT
2016 RFP Schedule R
esid
entia
lPo
rtfo
lio
Com
mer
cial
Port
folio
Pu
blic
Sec
tor
/ DI P
ortfo
lio
Agric
ultu
rePo
rtfo
lio
Indu
stria
l &
Wat
erPo
rtfo
lio
Activity
COA
RFP Release
Vendor Bids Received
Internal Bid Evaluation and Vendor Negotiation
COA
RFP Release
Vendor Bids Received
Internal Bid Evaluation and Vendor Negotiation
COA
RFP Release
Vendor Bids Received
Internal Bid Evaluation and Vendor Negotiation
COA
RFP Release
Vendor Bids Received
Internal Bid Evaluation and Vendor Negotiation
COA
RFP Release
Vendor Bids Received
Internal Bid Evaluation and Vendor Negotiation
2015 Jan Feb Mar Apr May Jun Jul Aug Sep
1/26/15
2/27/15
3/27/15
3/30/15 - 6/26/15
2/9/15
3/13/15
4/10/15
4/13/15 - 7/17/15
2/23/15
4/3/15
5/1/15
5/4/15 - 7/31/15
3/9/15
4/17/15
5/15/15
5/18/15 - 8/21/15
3/23/15
5/1/15
5/29/15
6/1/15 - 9/11/15
18
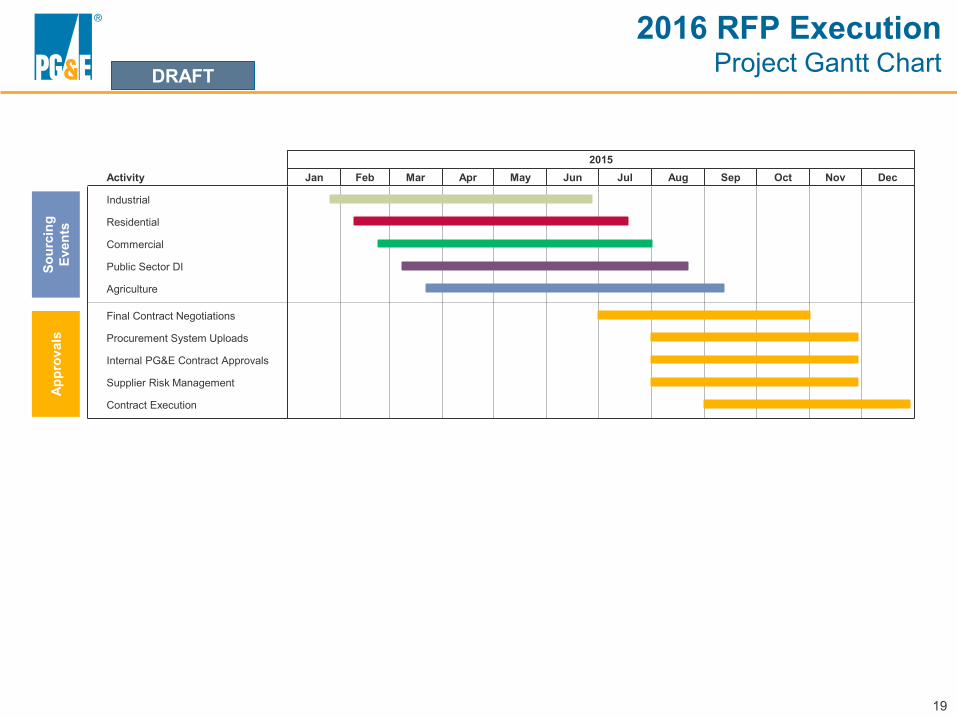
DRAFT
2016 RFP Execution Project Gantt Chart
2015 Jan Feb Mar Apr May Jun Jul Aug Sep Oct Nov Dec Activity
Public Sector DI
Commercial
Procurement System Uploads
Industrial
Supplier Risk Management
Internal PG&E Contract Approvals
Final Contract Negotiations
Contract Execution
Residential
Agriculture
Appr
oval
s So
urci
ngEv
ents
19
RFP Scoring Criteria
20
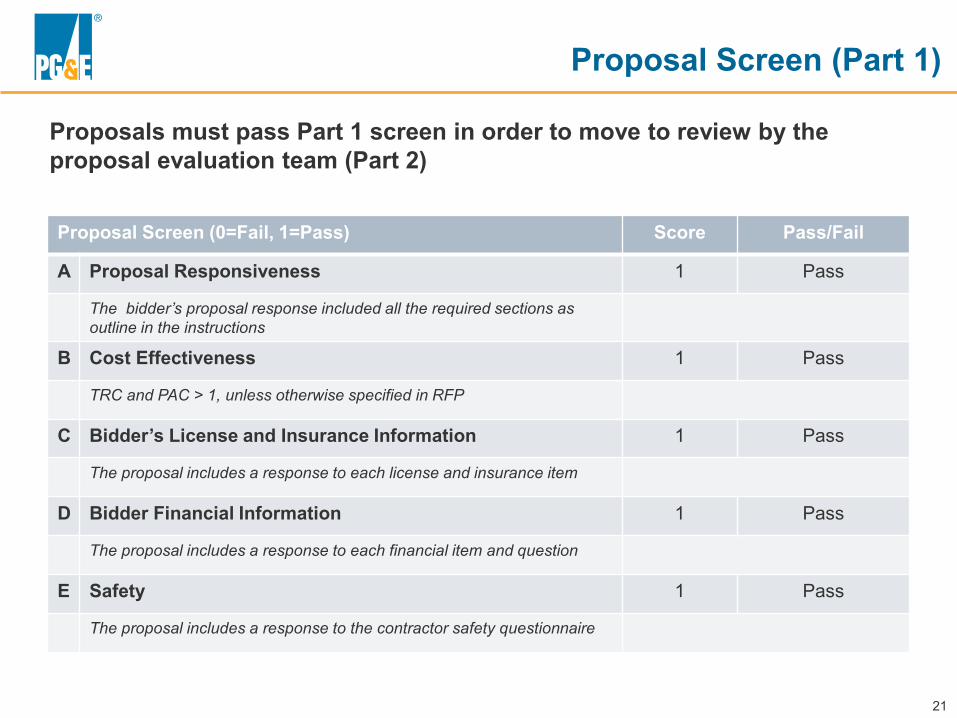
Proposal Screen (Part 1)
Proposals must pass Part 1 screen in order to move to review by the proposal evaluation team (Part 2)
Proposal Screen (0=Fail, 1=Pass) Score Pass/Fail
A
B
Proposal Responsiveness
The bidder’s proposal response included all the required sections as outline in the instructions
Cost Effectiveness
1
1
Pass
Pass
TRC and PAC > 1, unless otherwise specified in RFP
C Bidder’s License and Insurance Information 1 Pass
The proposal includes a response to each license and insurance item
D Bidder Financial Information 1 Pass
The proposal includes a response to each financial item and question
E Safety
The proposal includes a response to the contractor safety questionnaire
1 Pass
21
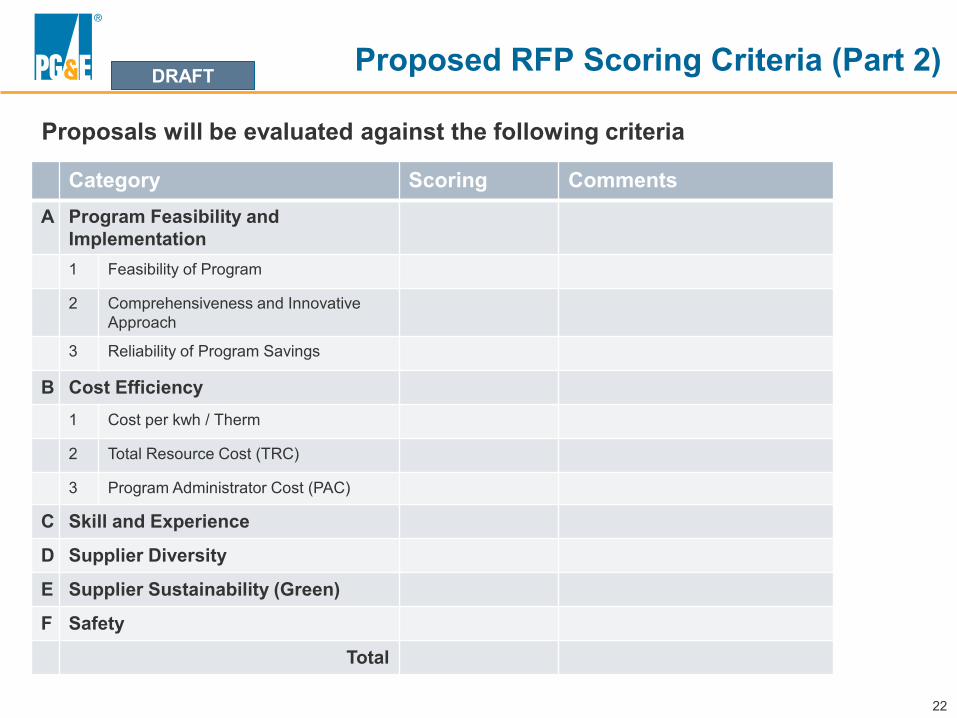
DRAFT Proposed RFP Scoring Criteria (Part 2)
Proposals will be evaluated against the following criteria
Category Scoring Comments A Program Feasibility and
Implementation 1 Feasibility of Program
2 Comprehensiveness and Innovative Approach
3 Reliability of Program Savings
B Cost Efficiency 1 Cost per kwh / Therm
2 Total Resource Cost (TRC)
3 Program Administrator Cost (PAC)
C Skill and Experience
D Supplier Diversity
E Supplier Sustainability (Green)
F Safety
Total
22
Contract and Program Management Changes
23
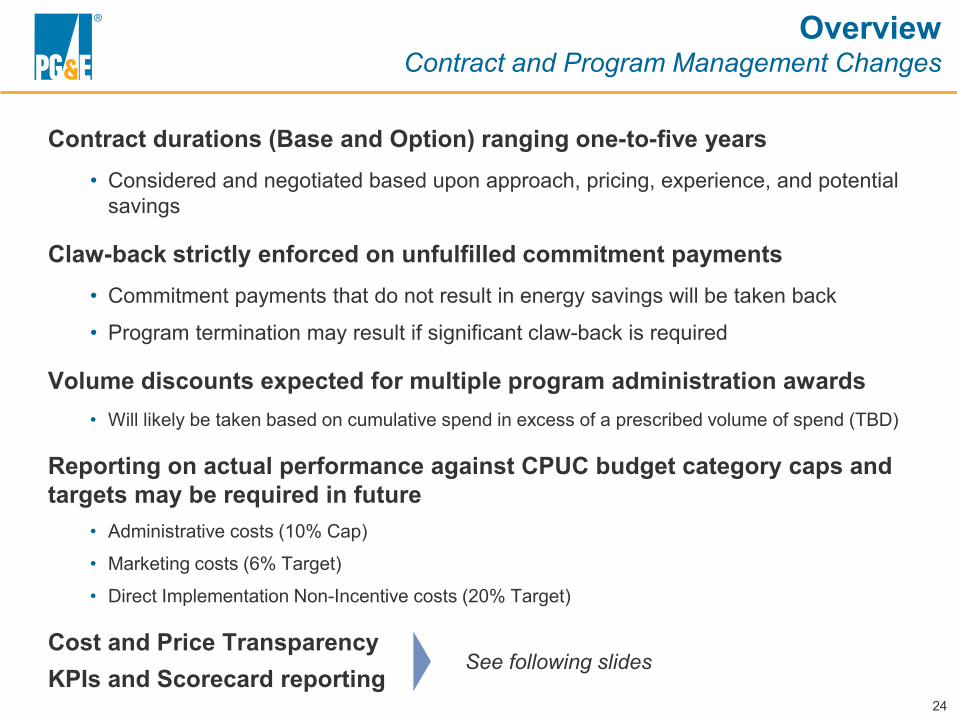
Overview Contract and Program Management Changes
Contract durations (Base and Option) ranging one-to-five years • Considered and negotiated based upon approach, pricing, experience, and potential
savings
Claw-back strictly enforced on unfulfilled commitment payments • Commitment payments that do not result in energy savings will be taken back
• Program termination may result if significant claw-back is required
Volume discounts expected for multiple program administration awards • Will likely be taken based on cumulative spend in excess of a prescribed volume of spend (TBD)
Reporting on actual performance against CPUC budget category caps and targets may be required in future
• Administrative costs (10% Cap)
• Marketing costs (6% Target)
• Direct Implementation Non-Incentive costs (20% Target)
Cost and Price Transparency See following slides
KPIs and Scorecard reporting 24
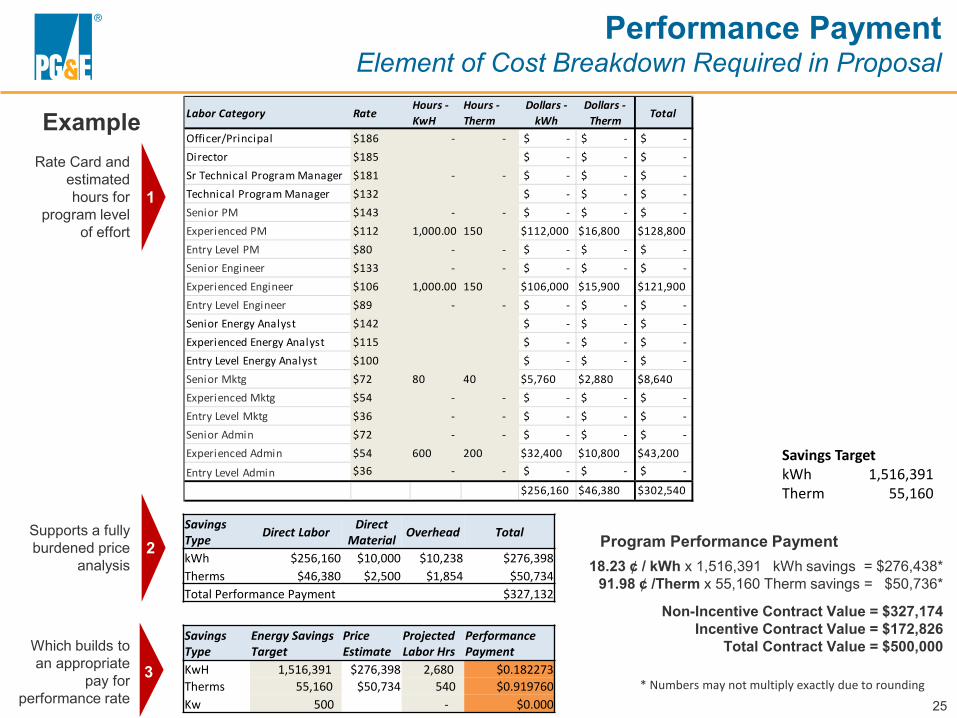
Performance Payment Element of Cost Breakdown Required in Proposal
Example Rate Card and
estimated hours for
program level of effort
1
2
3
Supports a fully burdened price
analysis
Which builds to an appropriate
pay for performance rate
Labor Category Rate Hours -KwH
Hours -Therm
Dollars -kWh
Dollars -Therm Total
Officer/Principal $186 - - $ - $ - $ -Director $185 $ - $ - $ -Sr Technical Program Manager $181 - - $ - $ - $ -Technical Program Manager $132 $ - $ - $ -Senior PM $143 - - $ - $ - $ -Experienced PM $112 1,000.00 150 $112,000 $16,800 $128,800 Entry Level PM $80 - - $ - $ - $ -Senior Engineer $133 - - $ - $ - $ -Experienced Engineer $106 1,000.00 150 $106,000 $15,900 $121,900 Entry Level Engineer $89 - - $ - $ - $ -Senior Energy Analyst $142 $ - $ - $ -Experienced Energy Analyst $115 $ - $ - $ -Entry Level Energy Analyst $100 $ - $ - $ -Senior Mktg $72 80 40 $5,760 $2,880 $8,640 Experienced Mktg $54 - - $ - $ - $ -Entry Level Mktg $36 - - $ - $ - $ -Senior Admin $72 - - $ - $ - $ -Experienced Admin $54 600 200 $32,400 $10,800 $43,200
Entry Level Admin $36 - - $ - $ - $ -
$256,160 $46,380 $302,540
Savings Target kWh 1,516,391 Therm 55,160
Savings Type Direct Labor Direct
Material Overhead Total
kWh $256,160 $10,000 $10,238 $276,398 Therms $46,380 $2,500 $1,854 $50,734 Total Performance Payment $327,132
Savings Energy Savings Price Projected Performance Type Target Estimate Labor Hrs Payment KwH Therms Kw
1,516,391 55,160
500
$276,398 2,680 $50,734 540
-
$0.182273 $0.919760
$0.000
Program Performance Payment 18.23 ¢ / kWh x 1,516,391 kWh savings = $276,438*
91.98 ¢ /Therm x 55,160 Therm savings = $50,736*
Non-Incentive Contract Value = $327,174 Incentive Contract Value = $172,826
Total Contract Value = $500,000
* Numbers may not multiply exactly due to rounding
25
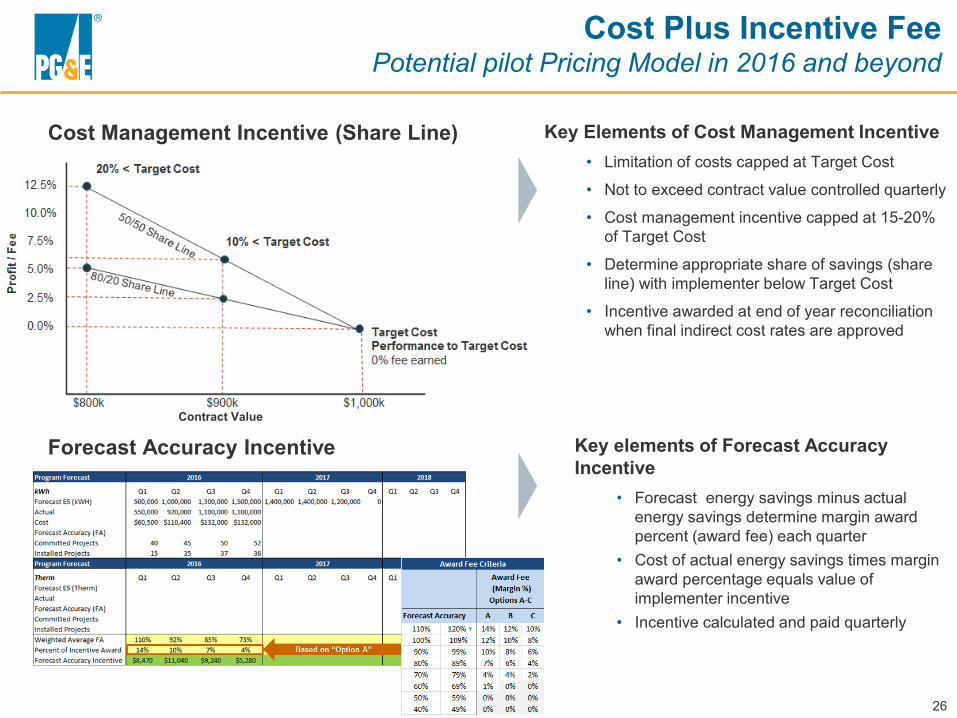
Cost Plus Incentive Fee Potential pilot Pricing Model in 2016 and beyond
Cost Management Incentive (Share Line)
Contract Value
Forecast Accuracy Incentive
Key Elements of Cost Management Incentive • Limitation of costs capped at Target Cost
• Not to exceed contract value controlled quarterly
• Cost management incentive capped at 15-20% of Target Cost
• Determine appropriate share of savings (share line) with implementer below Target Cost
• Incentive awarded at end of year reconciliation when final indirect cost rates are approved
Key elements of Forecast Accuracy Incentive
• Forecast energy savings minus actual energy savings determine margin award percent (award fee) each quarter
• Cost of actual energy savings times margin award percentage equals value of implementer incentive
• Incentive calculated and paid quarterly
26
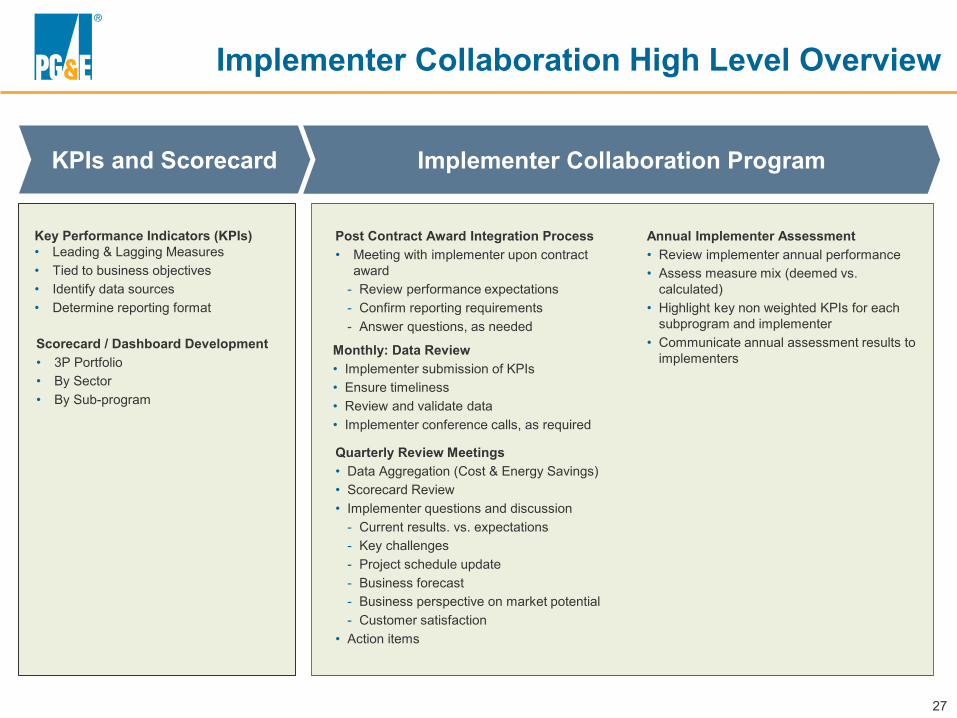
Implementer Collaboration High Level Overview
KPIs and Scorecard Implementer Collaboration Program
Key Performance Indicators (KPIs) • Leading & Lagging Measures • Tied to business objectives • Identify data sources • Determine reporting format
Scorecard / Dashboard Development • 3P Portfolio • By Sector • By Sub-program
Post Contract Award Integration Process • Meeting with implementer upon contract
award - Review performance expectations - Confirm reporting requirements - Answer questions, as needed
Monthly: Data Review • Implementer submission of KPIs • Ensure timeliness • Review and validate data • Implementer conference calls, as required
Quarterly Review Meetings • Data Aggregation (Cost & Energy Savings) • Scorecard Review • Implementer questions and discussion
- Current results. vs. expectations - Key challenges - Project schedule update - Business forecast - Business perspective on market potential - Customer satisfaction
• Action items
Annual Implementer Assessment • Review implementer annual performance • Assess measure mix (deemed vs.
calculated) • Highlight key non weighted KPIs for each
subprogram and implementer • Communicate annual assessment results to
implementers
27
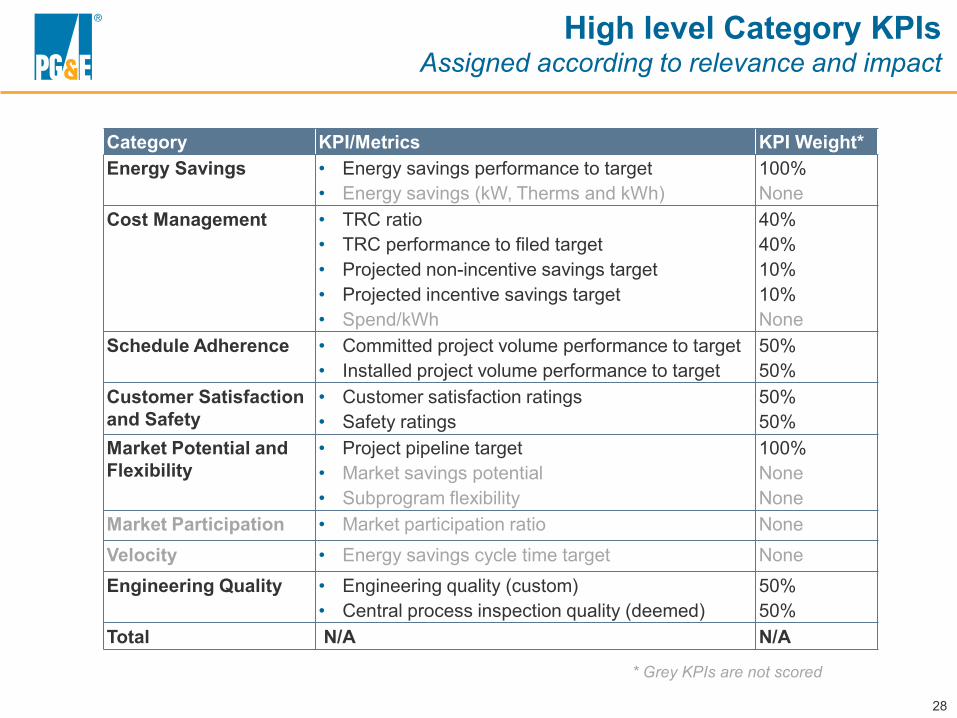
High level Category KPIs Assigned according to relevance and impact
Category KPI/Metrics KPI Weight* Energy Savings • Energy savings performance to target
• Energy savings (kW, Therms and kWh) 100% None
Cost Management • TRC ratio • TRC performance to filed target • Projected non-incentive savings target • Projected incentive savings target
40% 40% 10% 10% None
Schedule Adherence • Committed project volume performance to target • Installed project volume performance to target
50% 50%
Customer Satisfaction and Safety
• Customer satisfaction ratings • Safety ratings
50% 50%
Market Potential and Flexibility
• Project pipeline target • Market savings potential • Subprogram flexibility
100% None None
Market Participation • Market participation ratio None Velocity • Energy savings cycle time target None Engineering Quality • Engineering quality (custom)
• Central process inspection quality (deemed) 50% 50%
Total N/A N/A
* Grey KPIs are not scored
28
• Spend/kWh
1
Commercial Program:Stakeholder Engagement
Presentation OVERVIEW
Jane Kruse Felicia Harris
2
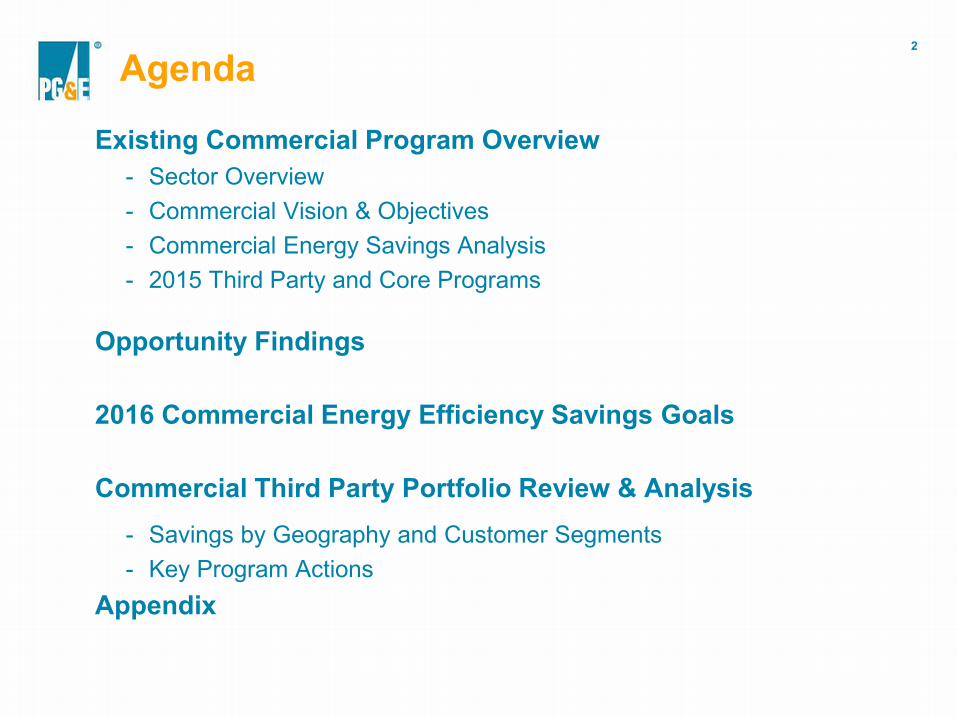
Agenda
Existing Commercial Program Overview - Sector Overview - Commercial Vision & Objectives - Commercial Energy Savings Analysis - 2015 Third Party and Core Programs
Opportunity Findings
2016 Commercial Energy Efficiency Savings Goals
Commercial Third Party Portfolio Review & Analysis - Savings by Geography and Customer Segments - Key Program Actions
Appendix
3
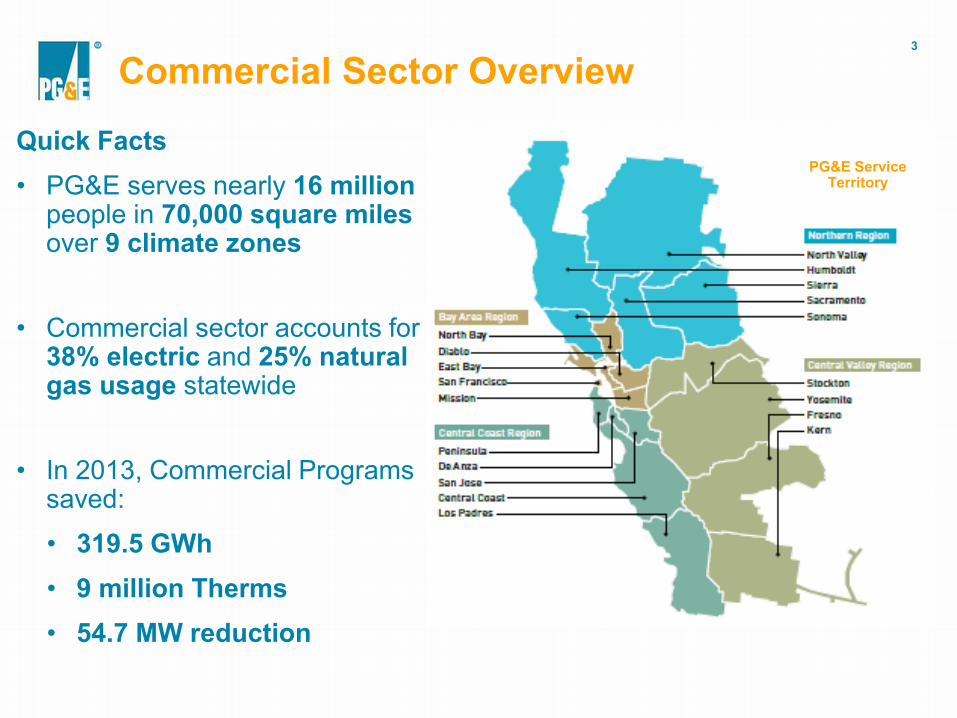
Commercial Sector Overview
Quick Facts PG&E Service
• PG&E serves nearly 16 million Territory
people in 70,000 square miles over 9 climate zones
• Commercial sector accounts for 38% electric and 25% natural gas usage statewide
• In 2013, Commercial Programssaved: • 319.5 GWh • 9 million Therms • 54.7 MW reduction
4
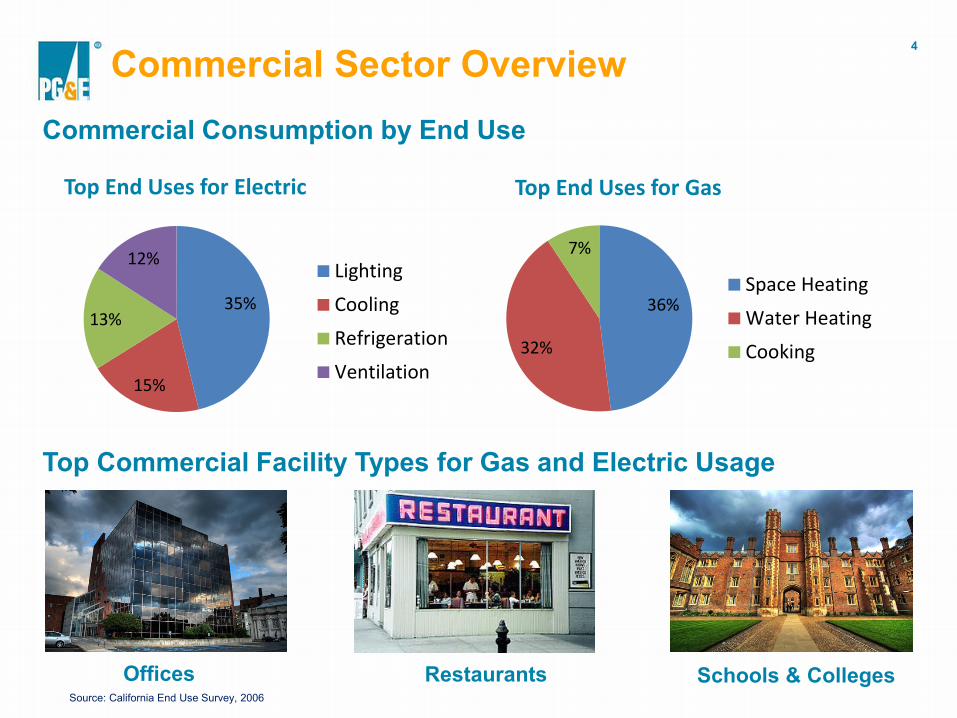
Commercial Sector Overview Commercial Consumption by End Use
Top End Uses for Electric Top End Uses for Gas
35%
15%
13%
12% Lighting 36%
32%
7%
Space Heating Cooling
Water Heating Refrigeration
Cooking Ventilation
Top Commercial Facility Types for Gas and Electric Usage
Offices Restaurants Schools & Colleges Source: California End Use Survey, 2006
5
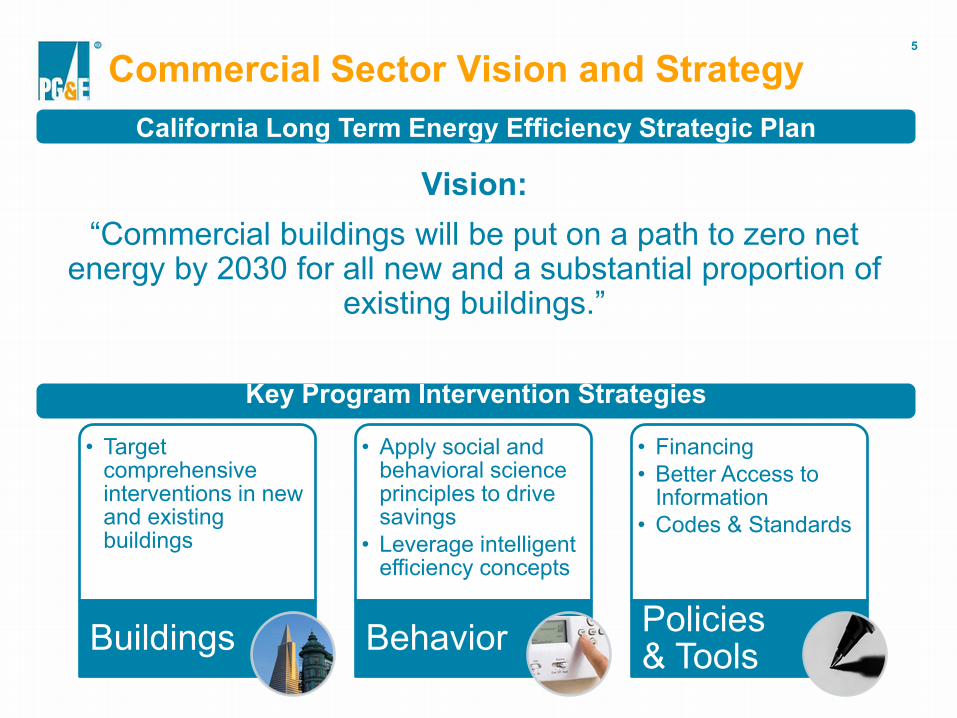
Commercial Sector Vision and Strategy California Long Term Energy Efficiency Strategic Plan
Vision: “Commercial buildings will be put on a path to zero net
energy by 2030 for all new and a substantial proportion of existing buildings.”
Key Program Intervention Strategies
• Targetcomprehensive interventions in new and existing buildings
Buildings
• Apply social and behavioral science principles to drive savings
• Leverage intelligentefficiency concepts
Behavior
• Financing • Better Access to
Information • Codes & Standards
Policies & Tools
6
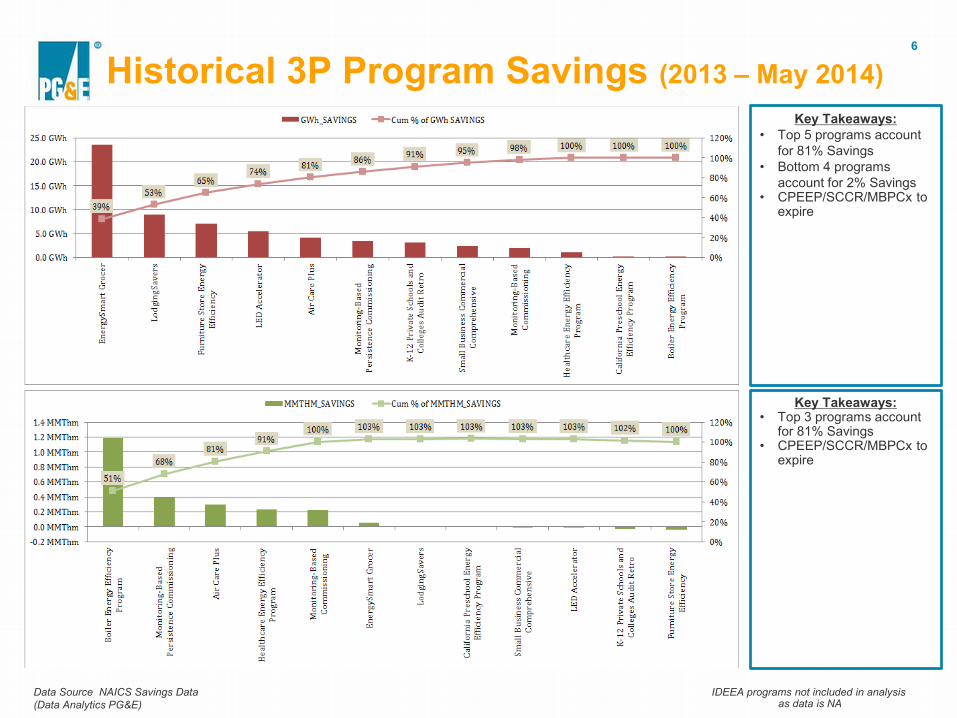
Historical 3P Program Savings (2013 – May 2014) Key Takeaways:
• Top 5 programs account for 81% Savings
• Bottom 4 programs account for 2% Savings
• CPEEP/SCCR/MBPCx to expire
Key Takeaways: • Top 3 programs account
for 81% Savings • CPEEP/SCCR/MBPCx to
expire
Data Source NAICS Savings Data IDEEA programs not included in analysis(Data Analytics PG&E) as data is NA
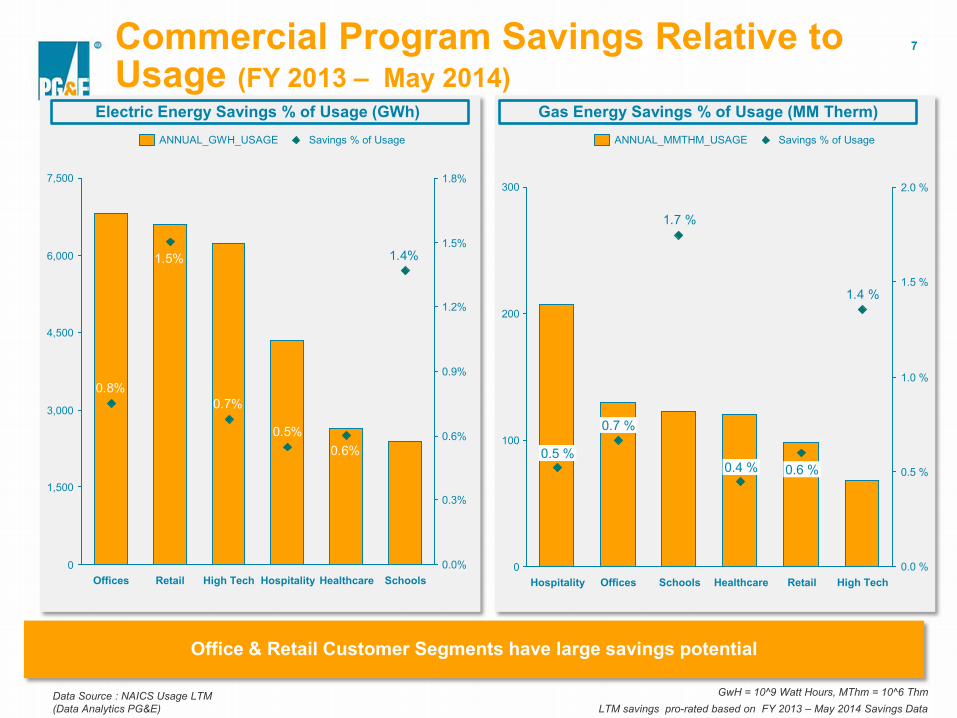
Commercial Program Savings Relative toUsage (FY 2013 – May 2014)
7
Electric Energy Savings % of Usage (GWh) Gas Energy Savings % of Usage (MM Therm)
0.6% 0.5%
0.7%
1.5%
0.8%
1.4%
0.0%
0.3%
0.6%
0.9%
1.2%
1.5%
1.8% 7,500
6,000
4,500
3,000
1,500
0 Schools Healthcare Hospitality High Tech Retail Offices
Savings % of Usage ANNUAL_GWH_USAGE
1.4 %
1.7 %
0.0 %
0.5 %
1.0 %
1.5 %
2.0 % 300
200
100
0 High Tech Retail
0.6 %
Healthcare
0.4 %
Schools Offices
0.7 %
Hospitality
0.5 %
Savings % of Usage ANNUAL_MMTHM_USAGE
Office & Retail Customer Segments have large savings potential
GwH = 10^9 Watt Hours, MThm = 10^6 Thm Data Source : NAICS Usage LTM (Data Analytics PG&E) LTM savings pro-rated based on FY 2013 – May 2014 Savings Data
8
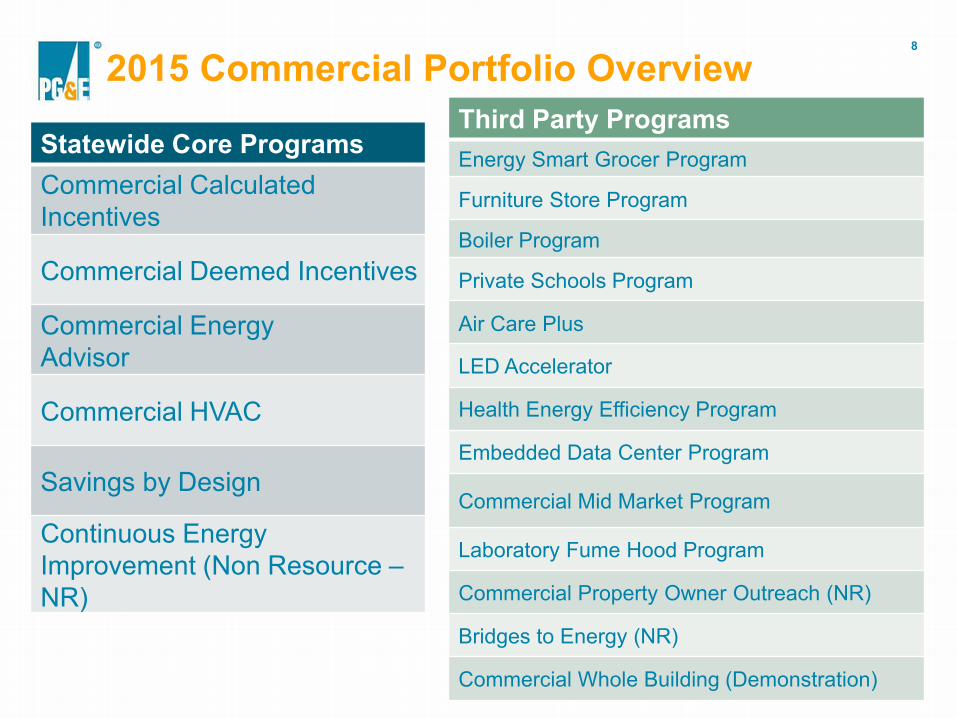
2015 Commercial Portfolio Overview
Statewide Core Programs Commercial Calculated Incentives
Commercial Deemed Incentives
Commercial Energy Advisor
Commercial HVAC
Savings by Design
Continuous Energy Improvement (Non Resource – NR)
Third Party Programs Energy Smart Grocer Program
Furniture Store Program
Boiler Program
Private Schools Program
Air Care Plus
LED Accelerator
Health Energy Efficiency Program
Embedded Data Center Program
Commercial Mid Market Program
Laboratory Fume Hood Program
Commercial Property Owner Outreach (NR)
Bridges to Energy (NR)
Commercial Whole Building (Demonstration)
9
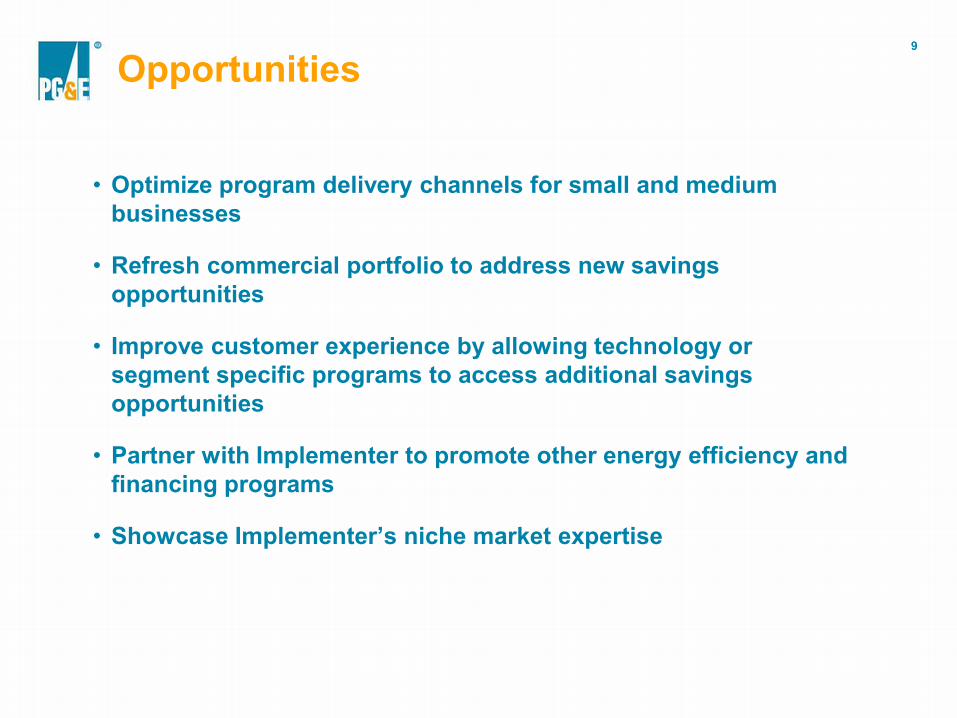
Opportunities
• Optimize program delivery channels for small and medium businesses
• Refresh commercial portfolio to address new savings opportunities
• Improve customer experience by allowing technology or segment specific programs to access additional savings opportunities
• Partner with Implementer to promote other energy efficiency and financing programs
• Showcase Implementer’s niche market expertise
10
1
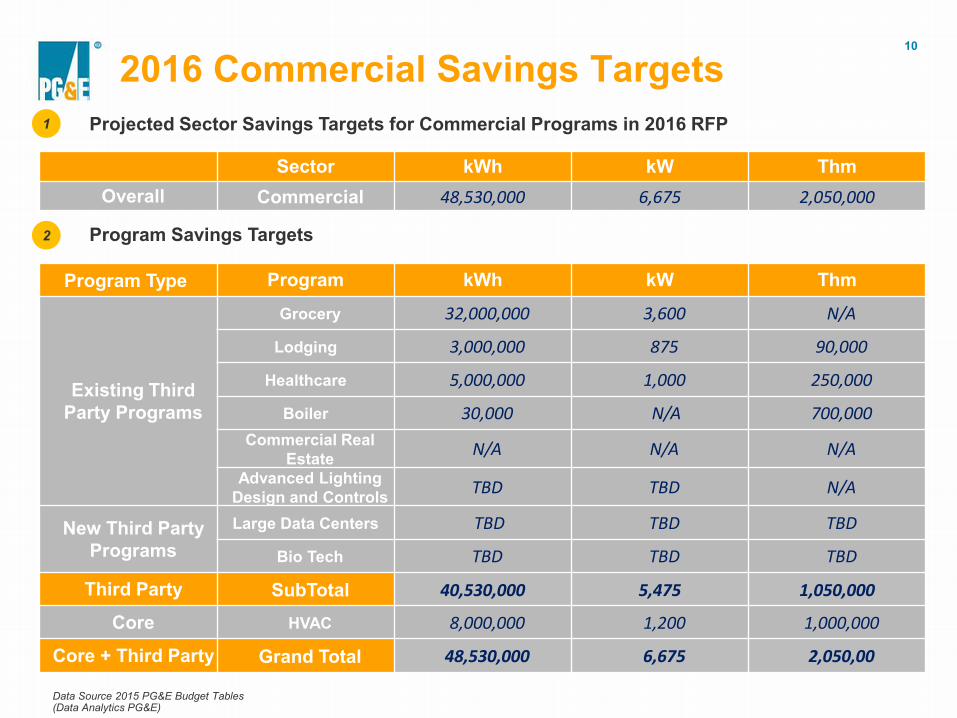
2016 Commercial Savings Targets Projected Sector Savings Targets for Commercial Programs in 2016 RFP
Sector kWh kW Thm Overall Commercial 48,530,000 6,675 2,050,000
2 Program Savings Targets
Program Type Program kWh kW Thm
Existing Third Party Programs
Grocery 32,000,000 3,600 N/A
Lodging 3,000,000 875 90,000
Healthcare 5,000,000 1,000 250,000
Boiler 30,000 N/A 700,000 Commercial Real
Estate N/A N/A N/A Advanced Lighting
Design and Controls TBD TBD N/A
New Third Party Programs
Large Data Centers TBD TBD TBD
Bio Tech TBD TBD TBD
Third Party SubTotal 40,530,000 5,475 1,050,000
Core HVAC 8,000,000 1,200 1,000,000
Core + Third Party Grand Total 48,530,000 6,675 2,050,00
Data Source 2015 PG&E Budget Tables(Data Analytics PG&E)
11
Commercial Third Party Portfolio Review & Analysis
12
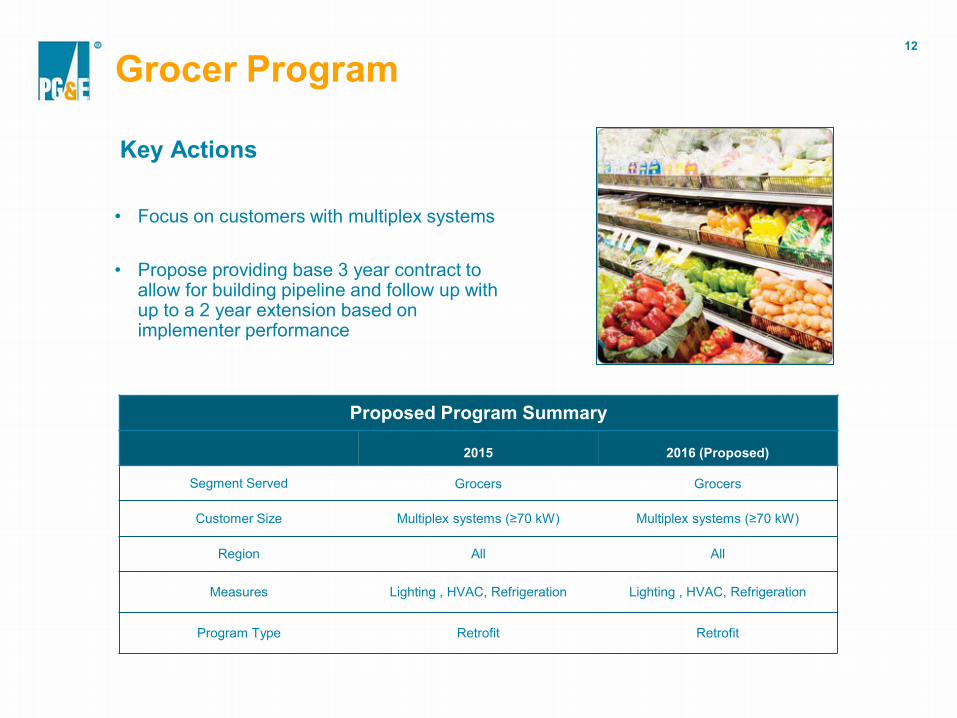
Grocer Program
Key Actions
• Focus on customers with multiplex systems
• Propose providing base 3 year contract toallow for building pipeline and follow up withup to a 2 year extension based onimplementer performance
Proposed Program Summary
2015 2016 (Proposed)
Segment Served Grocers Grocers
Customer Size Multiplex systems (≥70 kW) Multiplex systems (≥70 kW)
Region All All
Measures Lighting , HVAC, Refrigeration Lighting , HVAC, Refrigeration
Program Type Retrofit Retrofit
13
Lodging Program
Key Actions
• Focus on large customers (≥ 200 kW)
• Propose providing base 3 year contract to allow for building pipeline and follow up with up to a 2 year extension based on implementer performance
Proposed Program Summary 2015 2016 (Proposed)
Segment Served Lodging Lodging
Customer Size All ≥200 KW
Region All All
Measures Lighting, HVAC, Pool Pumps,
Refrigeration, Controls, Retrocommissioning
Lighting, HVAC, Pool Pumps, Refrigeration, Controls,
Retrocommissioning
Program Type Retrofit and Retrocommissioning Retrofit and Retrocommissioning
14
Healthcare Program
Key Actions
• Focus on healthcare facilities
• Propose providing base 3 year contractto allow for building pipeline and followup with up to a 2 year extension based on implementer performance
Proposed Program Summary
2015 2016 (Proposed)
Segment Served Healthcare Healthcare
Customer Size All All
Region All All
Measures Lighting, Commercial Process, HVAC and Retrocommissioning
Lighting, Commercial Process, HVAC and Retrocommissioning
Program Type Retrofit and Retrocommissioning Retrofit and Retrocommissioning
15
Boiler Program
Key Actions
• Propose providing base 2 year contracts to build pipeline and follow up with 1 year extension based on implementer performance
Proposed Program Summary
2015 2016 (Proposed)
Segment Served Multiple Multiple
Customer Size All All
Region All All
Measures
Process Boiler, High Efficiency Boilers, Pipe/Tank Insulation, Control Adjustments, Heat Recovery, Some
Repair Measures
Process Boiler, High Efficiency Boilers, Pipe/Tank Insulation, Control Adjustments, Heat Recovery, Some
Repair Measures
Program Type Retrofit and Retrocommissioning Retrofit and Retrocommissioning
Data Source: Measure_TRC_SProgram (PG&E Product)
16
Commercial Real Estate Outreach
Key Actions
• Expanding program in 2016
• Propose providing base contract for 1 year and extend for additional year based on market potential and implementer performance
Proposed Program Summary
2015 2016 (Proposed)
Segment Served Commercial Real Estate Building Portfolio
Commercial Real Estate Building Portfolio
Customer Size All All
Region All All
Measures N/A N/A
Program Type Non-Resource Non-Resource
Data Source : NAICS Usage LTM (Data Analytics PG&E)
17
Advanced Lighting Design & Controls Program
Key Actions
• Propose providing base contract for 2 years and consider extensions for additional year based on market potential and implementer performance
Proposed Program Summary
2015 2016 (Proposed)
Segment Served Targeted Retail, Banks & Medical office Buildings All
Customer Size Large All
Region All All
Measures Lighting Advanced Lighting
Program Type Retrofit Retrofit and New Construction
18
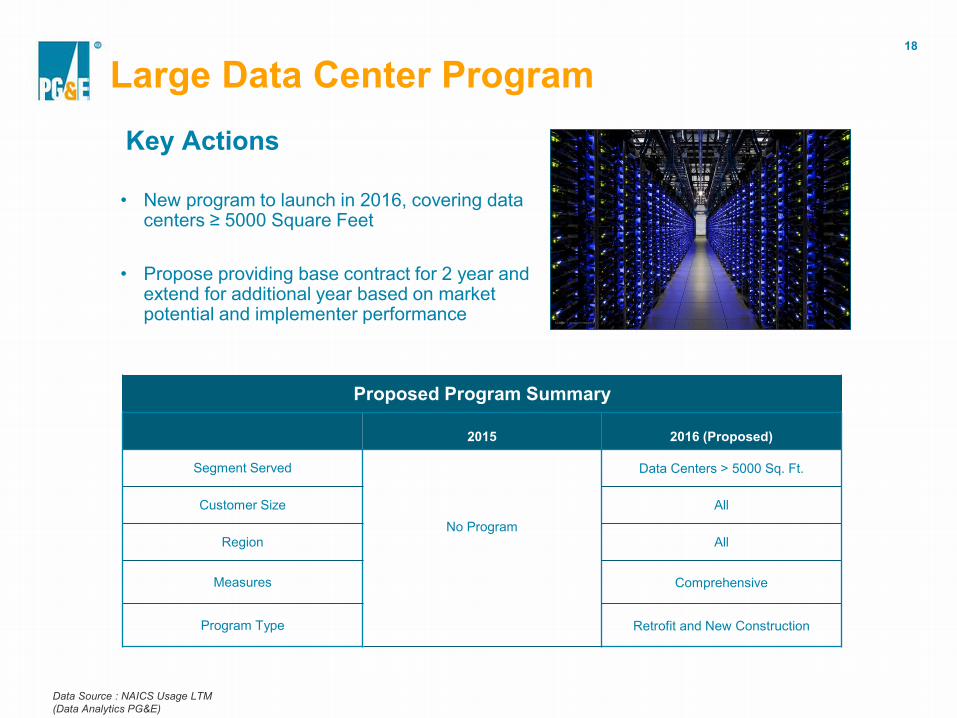
Large Data Center Program
Key Actions
• New program to launch in 2016, covering datacenters ≥ 5000 Square Feet
• Propose providing base contract for 2 year andextend for additional year based on marketpotential and implementer performance
Proposed Program Summary
2015 2016 (Proposed)
Segment Served
No Program
Data Centers > 5000 Sq. Ft.
Customer Size All
Region All
Measures Comprehensive
Program Type Retrofit and New Construction
Data Source : NAICS Usage LTM (Data Analytics PG&E)
19
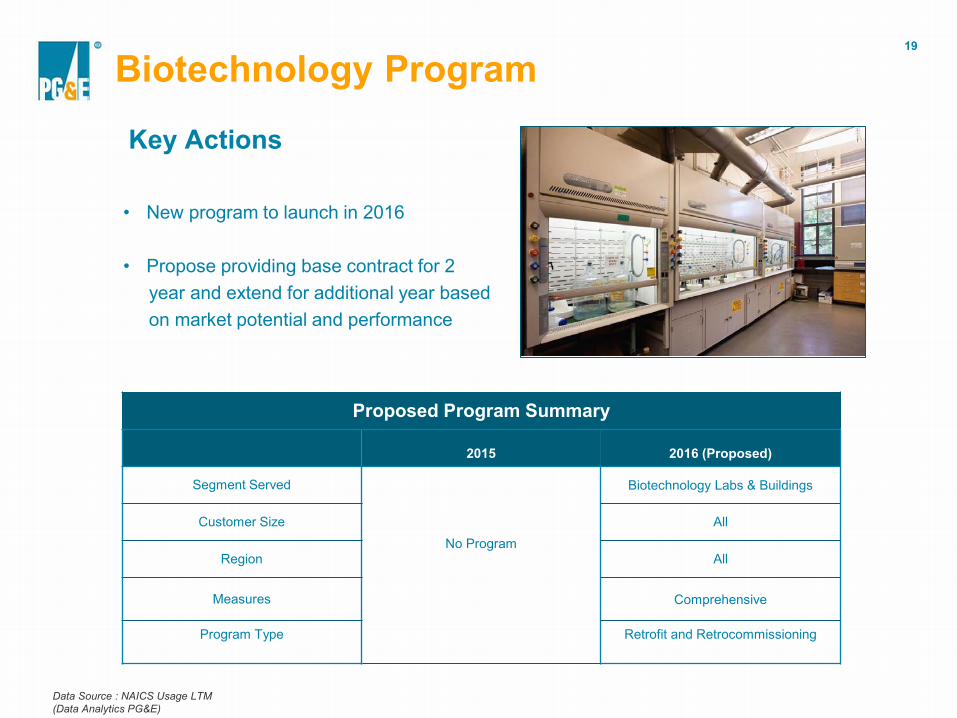
Biotechnology Program
Key Actions
• New program to launch in 2016
• Propose providing base contract for 2 year and extend for additional year based on market potential and performance
Proposed Program Summary
2015 2016 (Proposed)
Segment Served
No Program
Biotechnology Labs & Buildings
Customer Size All
Region All
Measures Comprehensive
Program Type Retrofit and Retrocommissioning
Data Source : NAICS Usage LTM (Data Analytics PG&E)
20
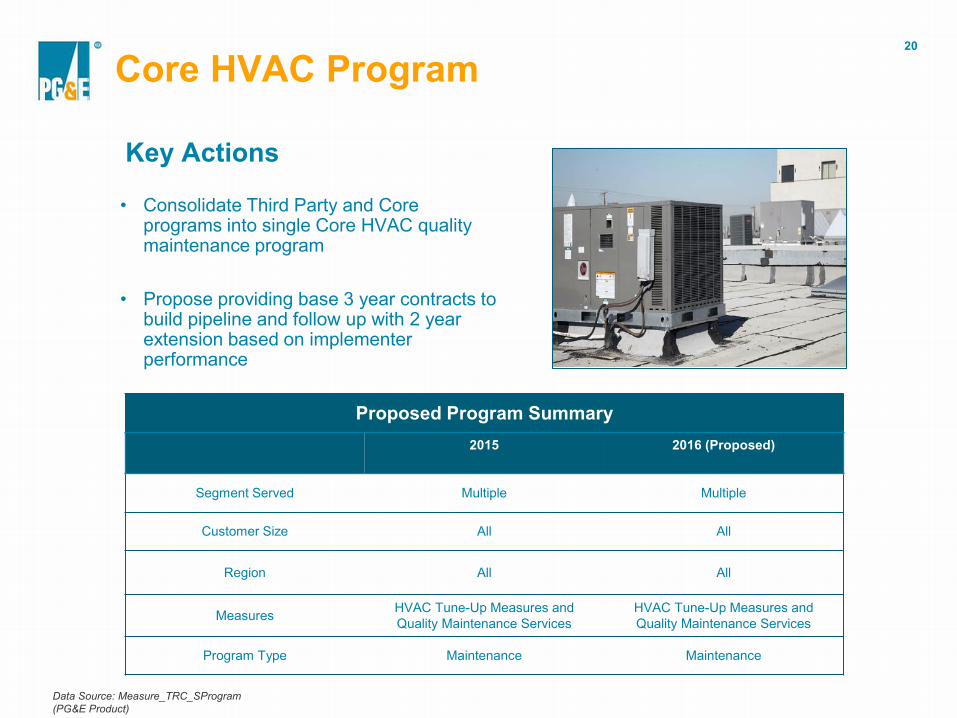
Core HVAC Program
Key Actions
• Consolidate Third Party and Core programs into single Core HVAC quality maintenance program
• Propose providing base 3 year contracts tobuild pipeline and follow up with 2 yearextension based on implementerperformance
Proposed Program Summary 2015 2016 (Proposed)
Segment Served Multiple Multiple
Customer Size All All
Region All All
Measures HVAC Tune-Up Measures and Quality Maintenance Services
HVAC Tune-Up Measures and Quality Maintenance Services
Program Type Maintenance Maintenance
Data Source: Measure_TRC_SProgram (PG&E Product)
21
Appendix
22
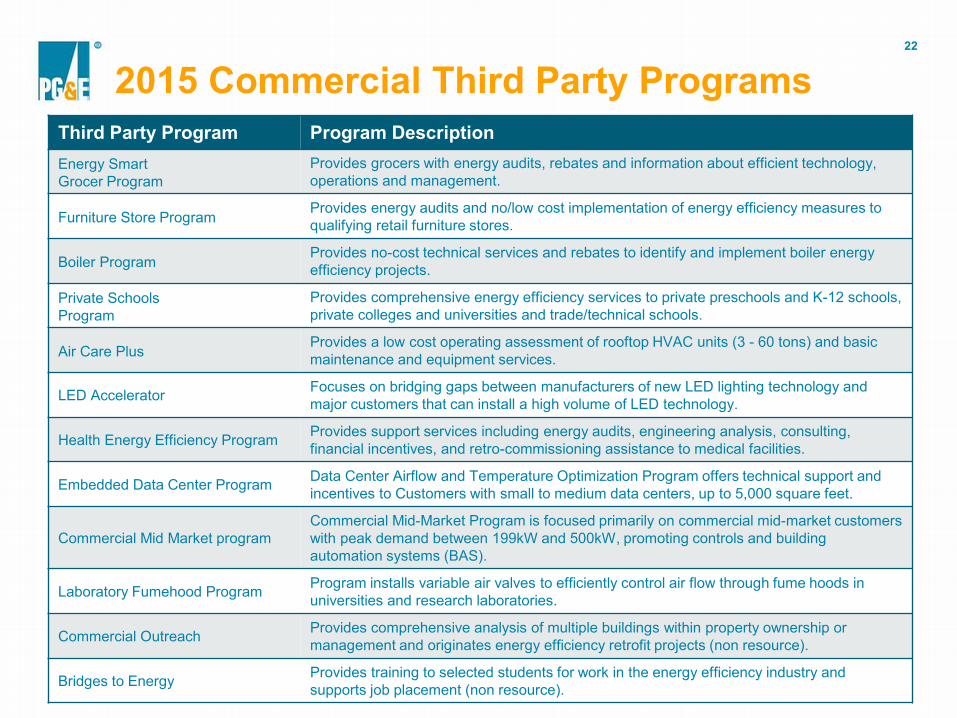
2015 Commercial Third Party Programs Third Party Program Program Description Energy Smart Grocer Program
Provides grocers with energy audits, rebates and information about efficient technology, operations and management.
Furniture Store Program Provides energy audits and no/low cost implementation of energy efficiency measures to qualifying retail furniture stores.
Boiler Program Provides no-cost technical services and rebates to identify and implement boiler energy efficiency projects.
Private Schools Program
Provides comprehensive energy efficiency services to private preschools and K-12 schools, private colleges and universities and trade/technical schools.
Air Care Plus Provides a low cost operating assessment of rooftop HVAC units (3 - 60 tons) and basic maintenance and equipment services.
LED Accelerator Focuses on bridging gaps between manufacturers of new LED lighting technology and major customers that can install a high volume of LED technology.
Health Energy Efficiency Program Provides support services including energy audits, engineering analysis, consulting, financial incentives, and retro-commissioning assistance to medical facilities.
Embedded Data Center Program Data Center Airflow and Temperature Optimization Program offers technical support and incentives to Customers with small to medium data centers, up to 5,000 square feet.
Commercial Mid Market program Commercial Mid-Market Program is focused primarily on commercial mid-market customers with peak demand between 199kW and 500kW, promoting controls and building automation systems (BAS).
Laboratory Fumehood Program Program installs variable air valves to efficiently control air flow through fume hoods in universities and research laboratories.
Commercial Outreach Provides comprehensive analysis of multiple buildings within property ownership or management and originates energy efficiency retrofit projects (non resource).
Bridges to Energy Provides training to selected students for work in the energy efficiency industry and supports job placement (non resource).
23
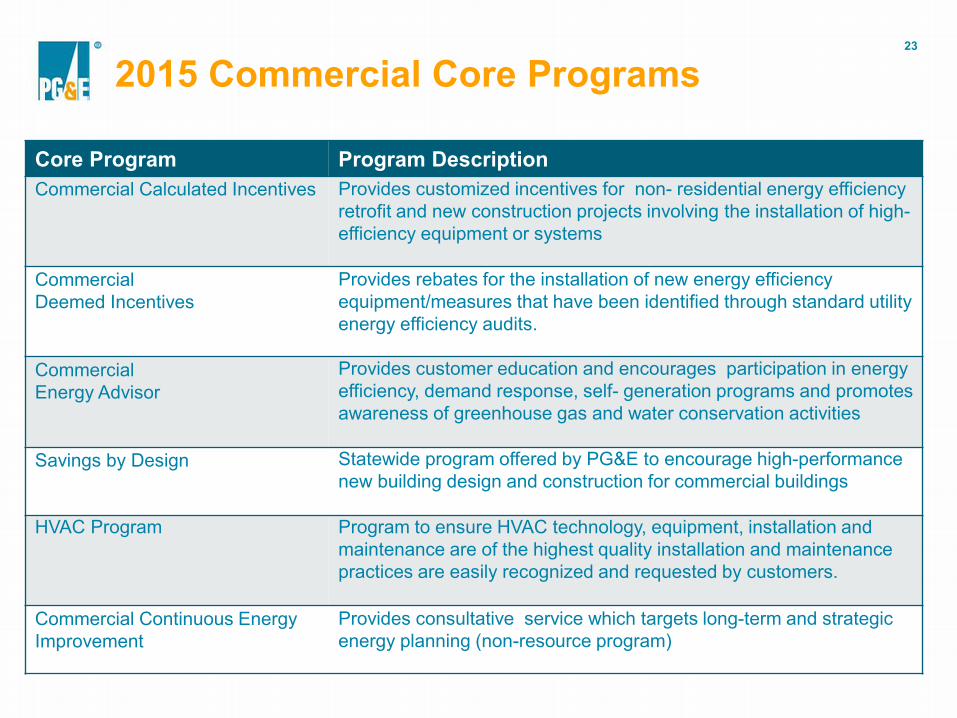
2015 Commercial Core Programs
Core Program Program Description Commercial Calculated Incentives Provides customized incentives for non- residential energy efficiency
retrofit and new construction projects involving the installation of high-efficiency equipment or systems
Commercial Deemed Incentives
Provides rebates for the installation of new energy efficiency equipment/measures that have been identified through standard utility energy efficiency audits.
Commercial Energy Advisor
Provides customer education and encourages participation in energy efficiency, demand response, self- generation programs and promotes awareness of greenhouse gas and water conservation activities
Savings by Design Statewide program offered by PG&E to encourage high-performance new building design and construction for commercial buildings
HVAC Program Program to ensure HVAC technology, equipment, installation and maintenance are of the highest quality installation and maintenance practices are easily recognized and requested by customers.
Commercial Continuous Energy Improvement
Provides consultative service which targets long-term and strategic energy planning (non-resource program)
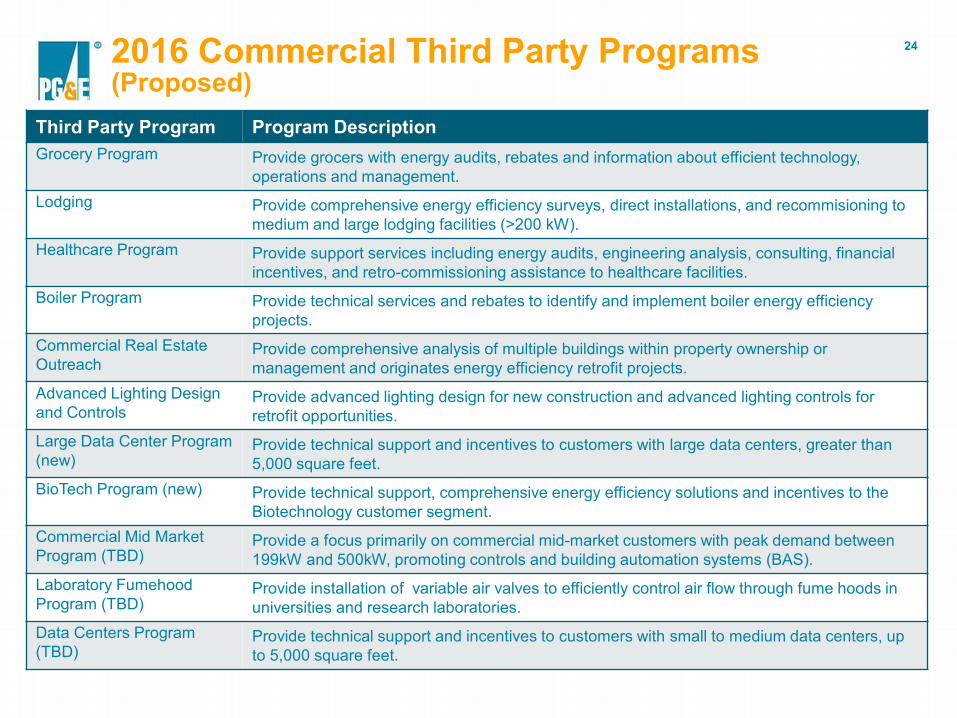
2016 Commercial Third Party Programs (Proposed)
24
Third Party Program Program Description Grocery Program Provide grocers with energy audits, rebates and information about efficient technology,
operations and management. Lodging Provide comprehensive energy efficiency surveys, direct installations, and recommisioning to
medium and large lodging facilities (>200 kW). Healthcare Program Provide support services including energy audits, engineering analysis, consulting, financial
incentives, and retro-commissioning assistance to healthcare facilities. Boiler Program Provide technical services and rebates to identify and implement boiler energy efficiency
projects. Commercial Real Estate Outreach
Provide comprehensive analysis of multiple buildings within property ownership or management and originates energy efficiency retrofit projects.
Advanced Lighting Design and Controls
Provide advanced lighting design for new construction and advanced lighting controls for retrofit opportunities.
Large Data Center Program (new)
Provide technical support and incentives to customers with large data centers, greater than 5,000 square feet.
BioTech Program (new) Provide technical support, comprehensive energy efficiency solutions and incentives to the Biotechnology customer segment.
Commercial Mid Market Program (TBD)
Provide a focus primarily on commercial mid-market customers with peak demand between 199kW and 500kW, promoting controls and building automation systems (BAS).
Laboratory Fumehood Program (TBD)
Provide installation of variable air valves to efficiently control air flow through fume hoods in universities and research laboratories.
Data Centers Program (TBD)
Provide technical support and incentives to customers with small to medium data centers, up to 5,000 square feet.
25
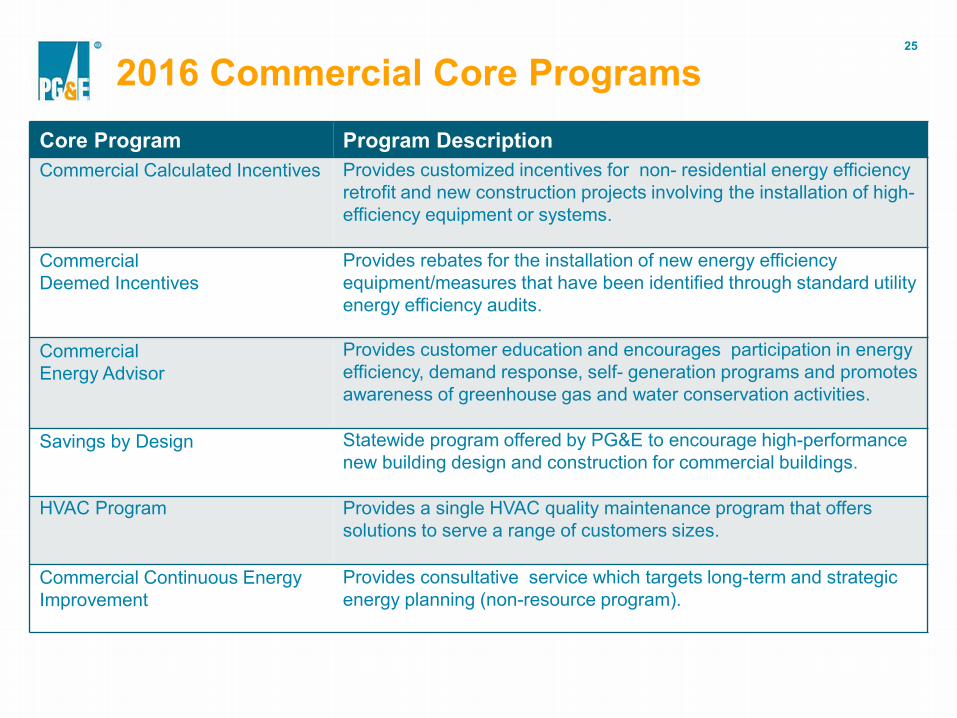
2016 Commercial Core Programs
Core Program Program Description Commercial Calculated Incentives Provides customized incentives for non- residential energy efficiency
retrofit and new construction projects involving the installation of high-efficiency equipment or systems.
Commercial Deemed Incentives
Provides rebates for the installation of new energy efficiency equipment/measures that have been identified through standard utility energy efficiency audits.
Commercial Energy Advisor
Provides customer education and encourages participation in energy efficiency, demand response, self- generation programs and promotes awareness of greenhouse gas and water conservation activities.
Savings by Design Statewide program offered by PG&E to encourage high-performance new building design and construction for commercial buildings.
HVAC Program Provides a single HVAC quality maintenance program that offers solutions to serve a range of customers sizes.
Commercial Continuous Energy Improvement
Provides consultative service which targets long-term and strategic energy planning (non-resource program).
NAICS l _INDUSTRY _GROUP kWh Savings% kWh Savings% of Usage - of Usage - 3P
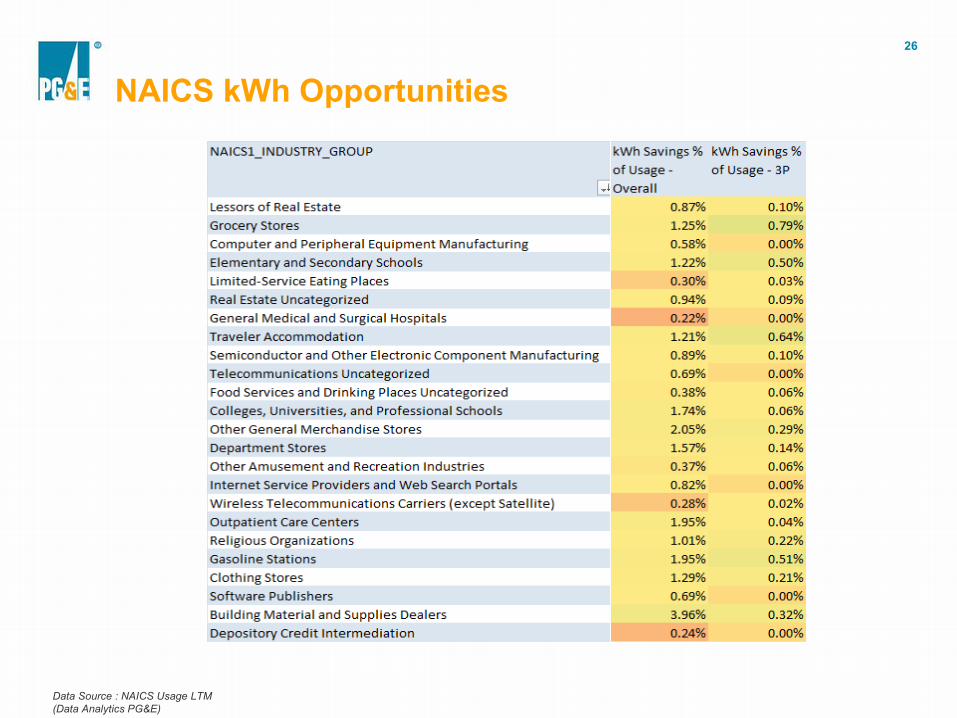
Q overall Lessors of Real Estate Grocery Stores Computer and Per ipheral Equipment M anufactur ing Elementary and Secondary Schools Limited-Service Eating Places Real Estat e Uncategorized General Medical and Surgical Hospitals Trave ler Accommodation Sem iconductor and Other Electronic Component M anufacturing Telecommunications Uncategor ized Food Services and Dr inking Places Uncategorized Colleges, Universities, and Professional Schools Other General M erchandise Stores Department Stores Other Amusement and Recreation Indust r ies Int ernet Service Providers and Web Search Portals W ireless Telecommunications carriers (except Sat ellite) Outpatient Care Centers Religious Organ izations Gasol ine Stat ions Clothin.11 Stores Software Pub lishers Building Mater ial and Supplies Dealers Depository Credit Int ermediation
0.87% 1.25% 0.58% 1.22% 0.30% 0.94% 0.22% 1.21% 0.89% 0.69% 0.38% 1.74% 2.05% 1.57% 0.37% 0.82% 0.28% 1.95% 1.01% 1.95% 1.29% 0.69% 3.96% 0.24%
0.10% 0.79% 0.00% 0.50% 0.03% 0.09% 0.00% 0.64% 0.10% 0.00% 0.06% 0.06% 0.29% 0.14% 0.06% 0.00% 0.02% 0.04% 0.22% 0.51% 0.21% 0.00% 0.32% 0.00%
26
NAICS kWh Opportunities
Data Source : NAICS Usage LTM (Data Analytics PG&E)
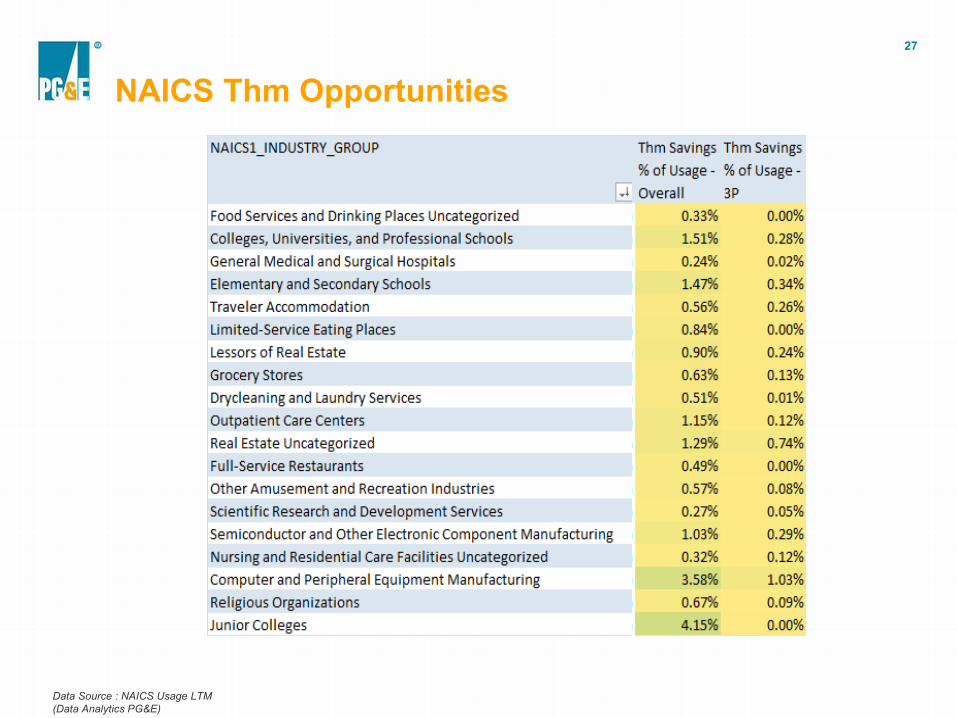
NAICSl _INDUSTRY _GROUP
Food Services and Drinking Places Uncategorized Colleges, Universities, and Professional Schools Genera l Medical and Surgica l Hospitals Elementary and Secondary Schools Traveler Accommodation Limited-Service Eating Places Lessors of Real Estate Grocery Stores Drycleaning and Laundry Services Outpatient Care Centers Real Estate Uncategorized Full-Service Restaurants Other Amusement and Recreation Industries Scientific Research and Development Services Semiconductor and Other Electronic Component Manufacturing Nursing and Residential Care Facilities Uncategorized Computer and Peripheral Equipment Manufacturing Re ligious Organizations Junior Co lleges
Thm Savings Thm Savings % of Usage - % of Usage -
Q: Overall 3P 0.33% 0.00% 1.51% 0.28% 0.24% 0.02% 1.47% 0.34% 0.56% 0.26% 0.84% 0.00% 0.90% 0.24% 0.63% 0.13% 0.51% 0.01% 1.15% 0.12% 1.29% 0.74% 0.49% 0.00% 0.57% 0.08% 0.27% 0.05% 1.03% 0.29% 0.32% 0.12% 3.58% 1.03% 0.67% 0.09% 4.15% 0.00%
27
NAICS Thm Opportunities
Data Source : NAICS Usage LTM (Data Analytics PG&E)
1
PG&E Government and Community Partnerships Leif Christiansen Manager
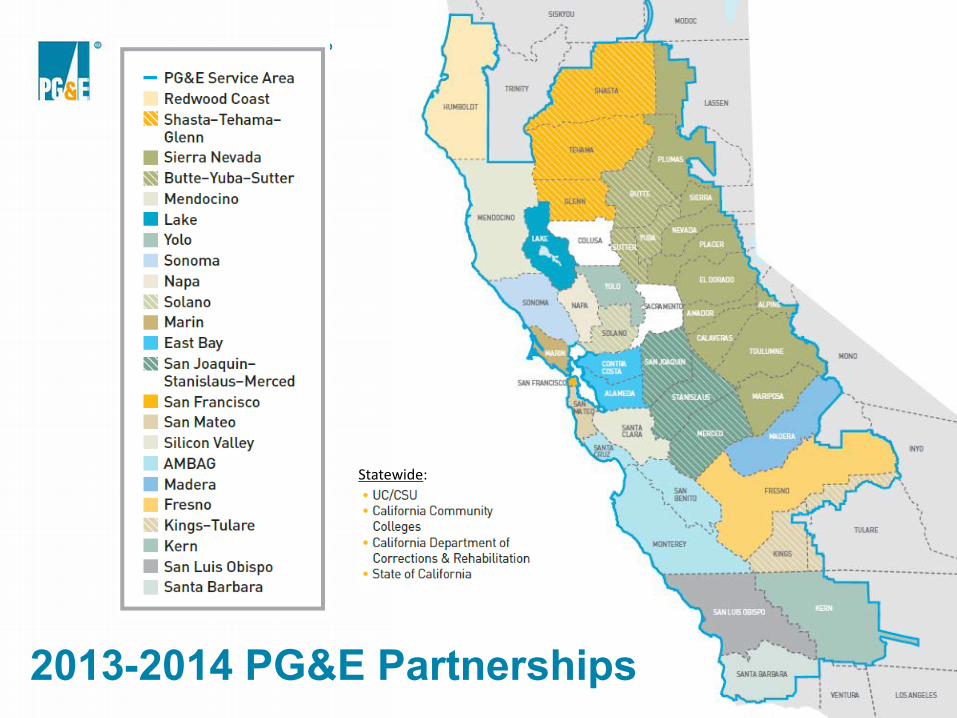
UC/CSUCalifornia CommunityCollegesCalifornia Department ofCorrections & RehabilitationState of California
.
.
.
.
.
any nstall & Scho
2 Pacific Gas and Electric Comp 2016 RFP for Regional Direct I ols Programs (DRAFT)
2013-2014 PG&E Partnerships
Statewide:
Pacific Gas and Electric Company 2016 RFP for Regional Direct Install & Schools Programs (DR
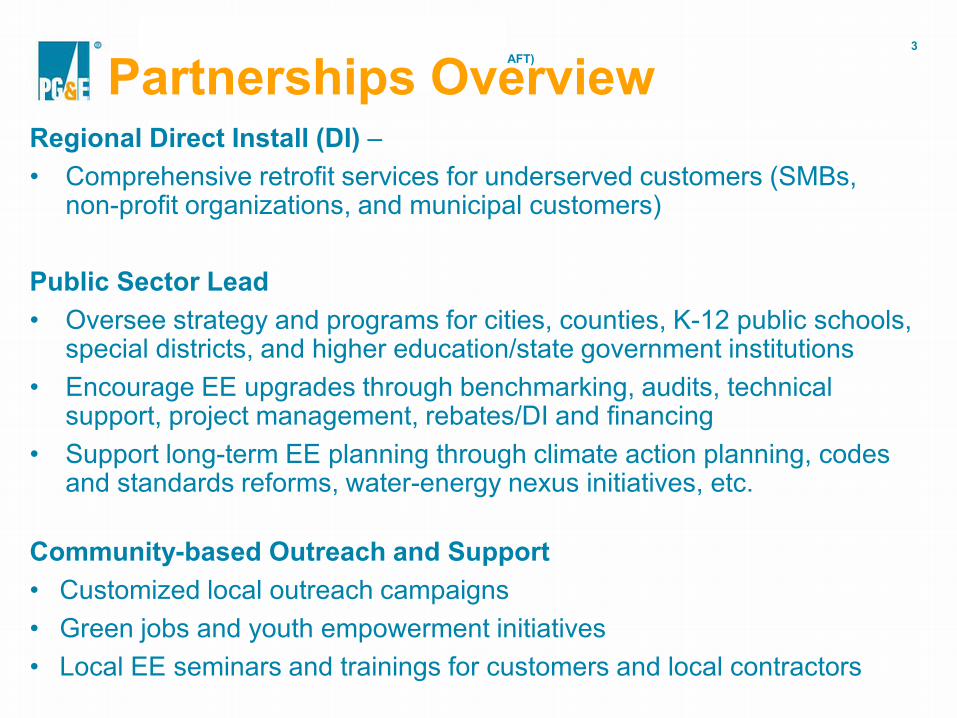
3 AFT) Partnerships Overview
Regional Direct Install (DI) – • Comprehensive retrofit services for underserved customers (SMBs,
non-profit organizations, and municipal customers)
Public Sector Lead • Oversee strategy and programs for cities, counties, K-12 public schools,
special districts, and higher education/state government institutions • Encourage EE upgrades through benchmarking, audits, technical
support, project management, rebates/DI and financing • Support long-term EE planning through climate action planning, codes
and standards reforms, water-energy nexus initiatives, etc.
Community-based Outreach and Support • Customized local outreach campaigns • Green jobs and youth empowerment initiatives • Local EE seminars and trainings for customers and local contractors
4
Regional Direct InstallStakeholder Presentation Moses Gastelum
January 13, 2015
5 Pacific Gas and Electric Company 2016 RFP for Regional Direct Install & Schools Programs (DRAFT)
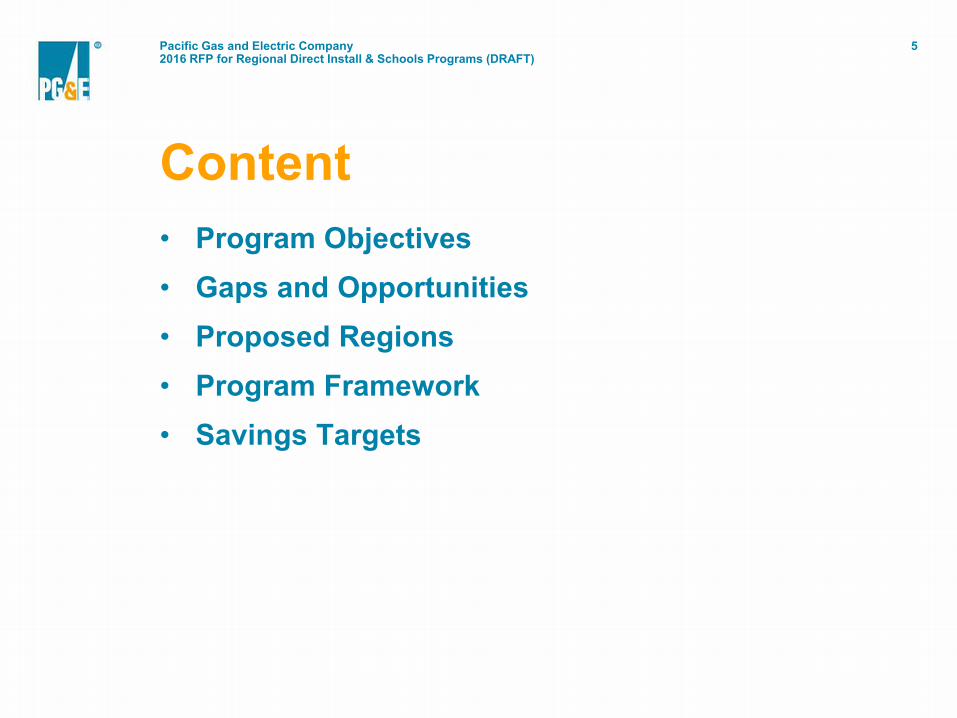
Content • Program Objectives • Gaps and Opportunities • Proposed Regions • Program Framework • Savings Targets
6 Pacific Gas and Electric Company 2016 RFP for Regional Direct Install & Schools Programs (DRAFT)
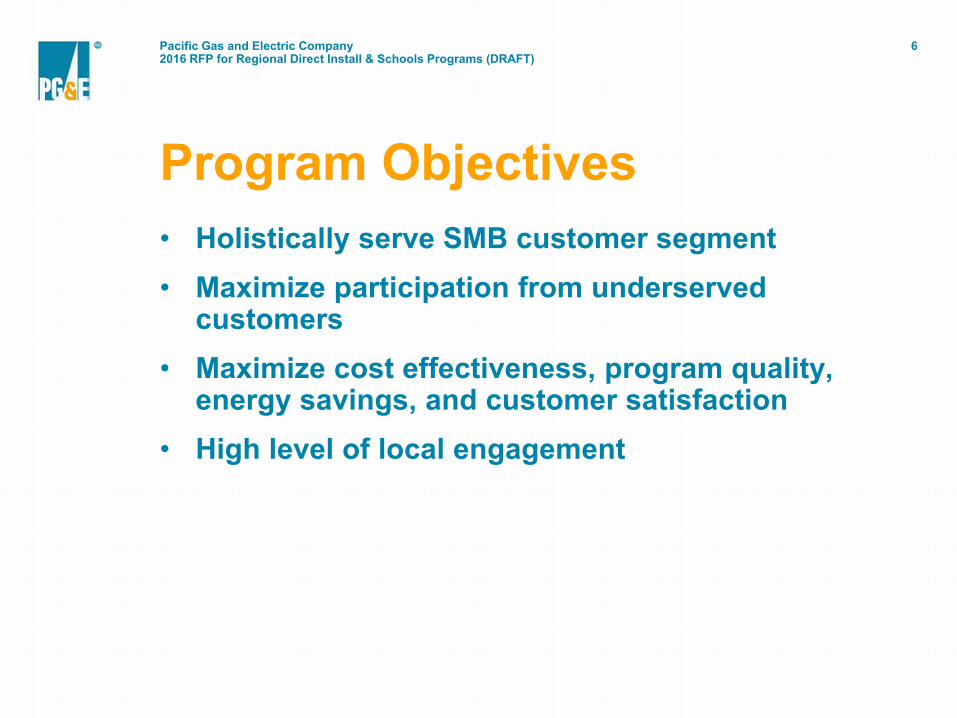
Program Objectives • Holistically serve SMB customer segment • Maximize participation from underserved
customers • Maximize cost effectiveness, program quality,
energy savings, and customer satisfaction • High level of local engagement
7 Pacific Gas and Electric Company 2016 RFP for Regional Direct Install & Schools Programs (DRAFT)
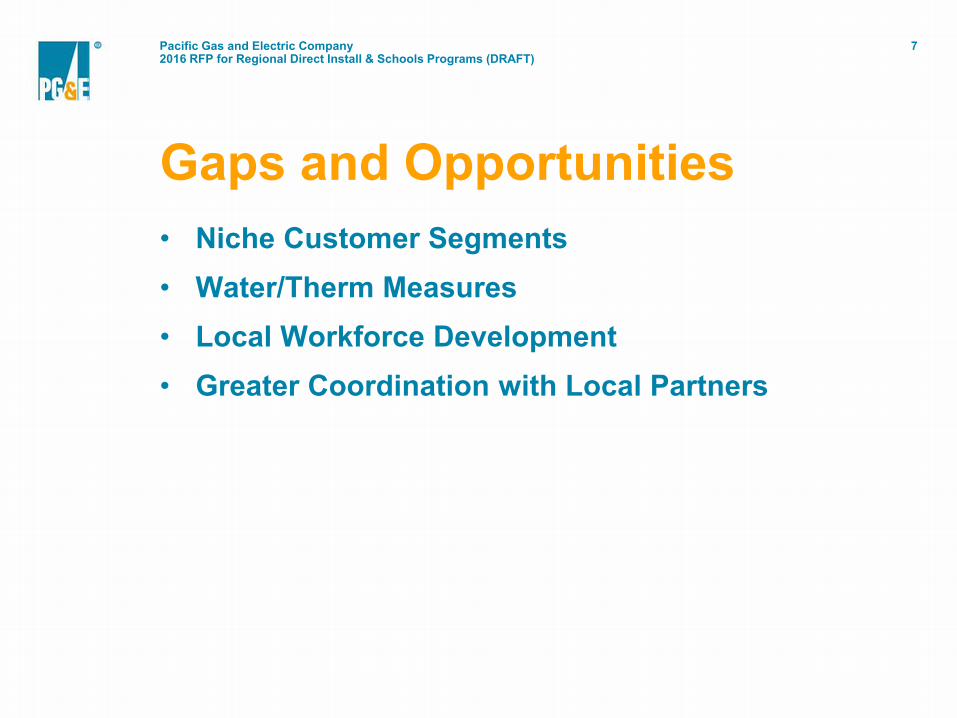
Gaps and Opportunities • Niche Customer Segments • Water/Therm Measures • Local Workforce Development • Greater Coordination with Local Partners
8 Pacific Gas and Electric Company 2016 RFP for Regional Direct Install & Schools Programs (DRAFT)
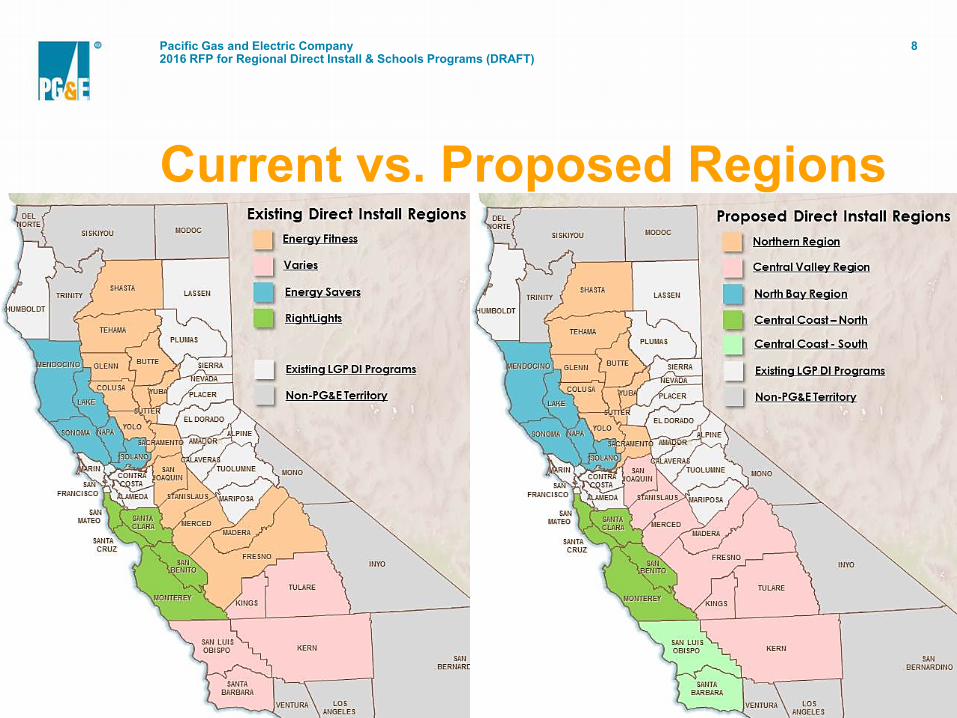
Current vs. Proposed Regions
9 Pacific Gas and Electric Company 2016 RFP for Regional Direct Install & Schools Programs (DRAFT)
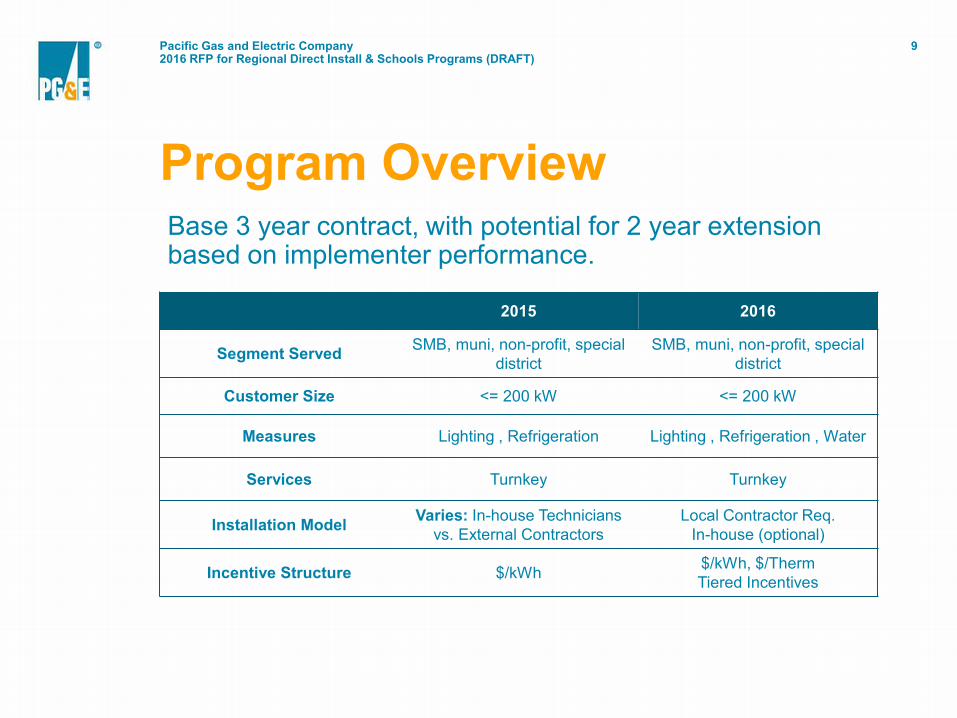
Program Overview Base 3 year contract, with potential for 2 year extension based on implementer performance.
2015 2016
Segment Served SMB, muni, non-profit, special district
SMB, muni, non-profit, special district
Customer Size <= 200 kW <= 200 kW
Measures Lighting , Refrigeration Lighting , Refrigeration , Water
Services Turnkey Turnkey
Installation Model Varies: In-house Technicians vs. External Contractors
Local Contractor Req. In-house (optional)
Incentive Structure $/kWh $/kWh, $/Therm Tiered Incentives
10 Pacific Gas and Electric Company 2016 RFP for Regional Direct Install & Schools Programs (DRAFT)
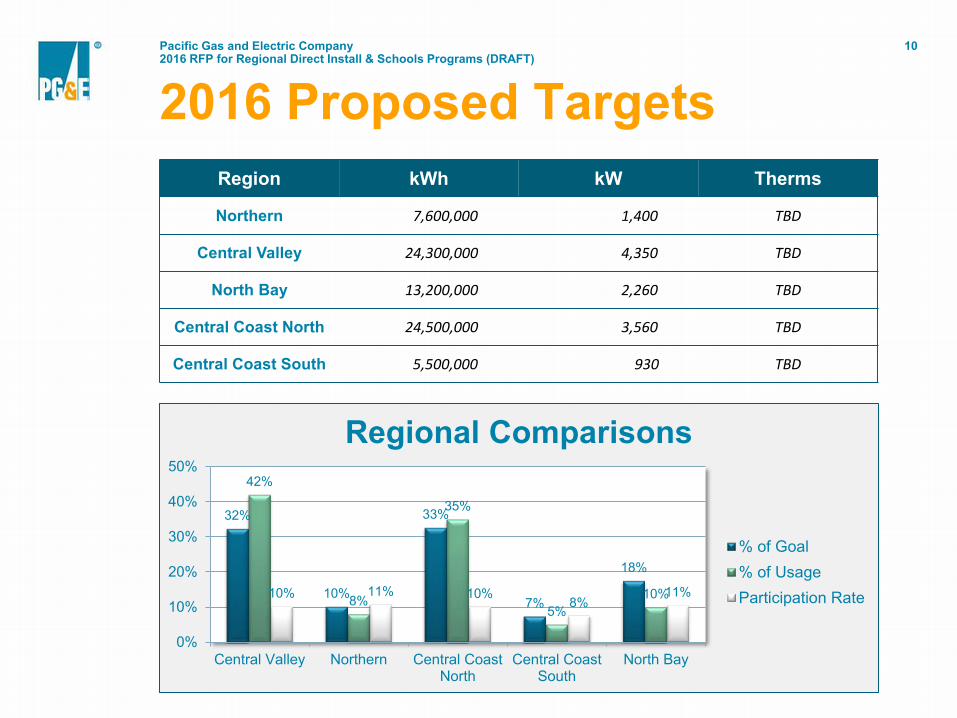
2016 Proposed Targets Region kWh kW Therms
Northern 7,600,000 1,400 TBD
Central Valley 24,300,000 4,350 TBD
North Bay 13,200,000 2,260 TBD
Central Coast North 24,500,000 3,560 TBD
Central Coast South 5,500,000 930 TBD
Regional Comparisons 50%
40%
30%
20%
10%
0%
32%
42%
10% 10%8%11%
33%35%
10% 7% 5% 8%
18%
10%11%
% of Goal % of Usage Participation Rate
Central Valley Northern Central Coast Central Coast North Bay North South
11
Schools ProgramStakeholder Presentation Jillian Rich
January 13, 2015
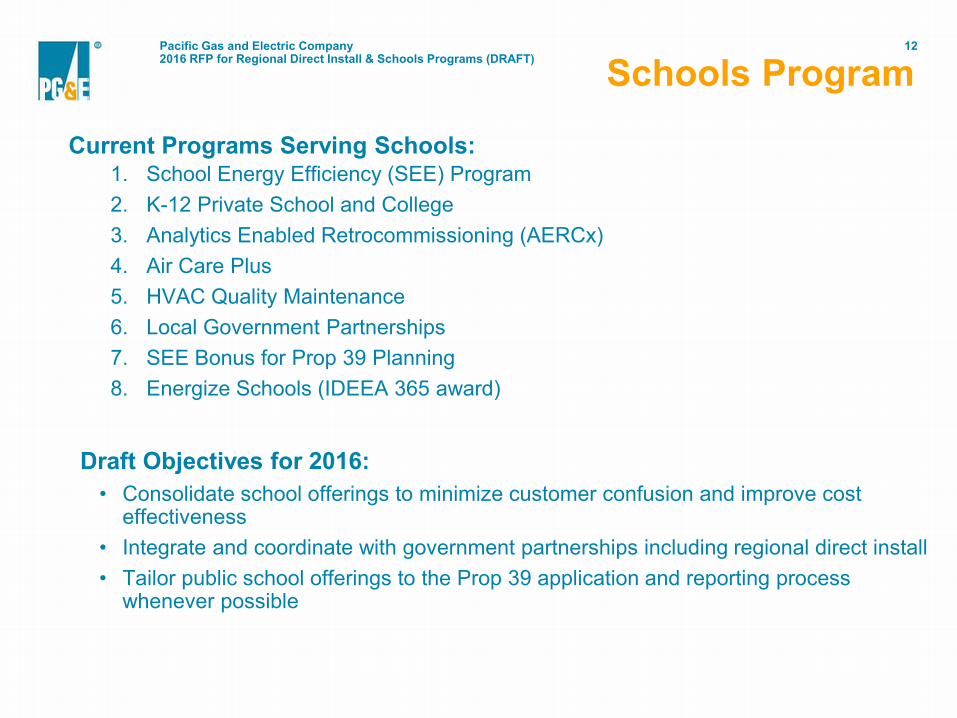
12 Pacific Gas and Electric Company 2016 RFP for Regional Direct Install & Schools Programs (DRAFT) Schools Program
Current Programs Serving Schools: 1. School Energy Efficiency (SEE) Program 2. K-12 Private School and College 3. Analytics Enabled Retrocommissioning (AERCx) 4. Air Care Plus 5. HVAC Quality Maintenance 6. Local Government Partnerships 7. SEE Bonus for Prop 39 Planning 8. Energize Schools (IDEEA 365 award)
Draft Objectives for 2016: • Consolidate school offerings to minimize customer confusion and improve cost
effectiveness • Integrate and coordinate with government partnerships including regional direct install • Tailor public school offerings to the Prop 39 application and reporting process
whenever possible
13 Pacific Gas and Electric Company
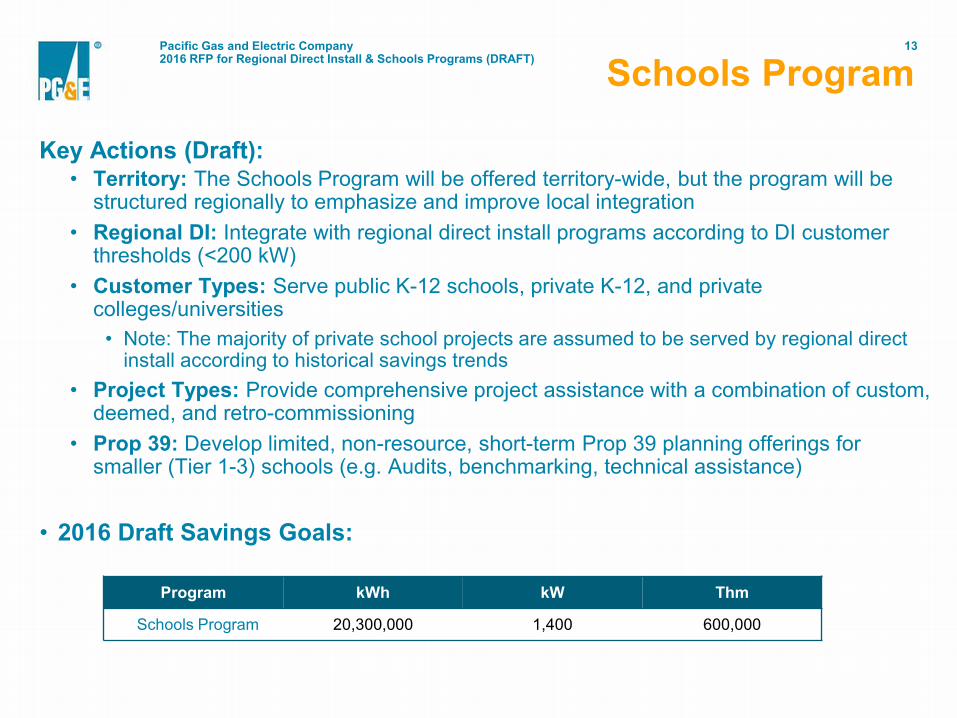
2016 RFP for Regional Direct Install & Schools Programs (DRAFT) Schools Program
Key Actions (Draft): • Territory: The Schools Program will be offered territory-wide, but the program will be
structured regionally to emphasize and improve local integration • Regional DI: Integrate with regional direct install programs according to DI customer
thresholds (<200 kW) • Customer Types: Serve public K-12 schools, private K-12, and private
colleges/universities • Note: The majority of private school projects are assumed to be served by regional direct
install according to historical savings trends • Project Types: Provide comprehensive project assistance with a combination of custom,
deemed, and retro-commissioning • Prop 39: Develop limited, non-resource, short-term Prop 39 planning offerings for
smaller (Tier 1-3) schools (e.g. Audits, benchmarking, technical assistance)
• 2016 Draft Savings Goals:
Program kWh kW Thm
Schools Program 20,300,000 1,400 600,000
14 Pacific Gas and Electric Company
2016 RFP for Regional Direct Install & Schools Programs (DRAFT)
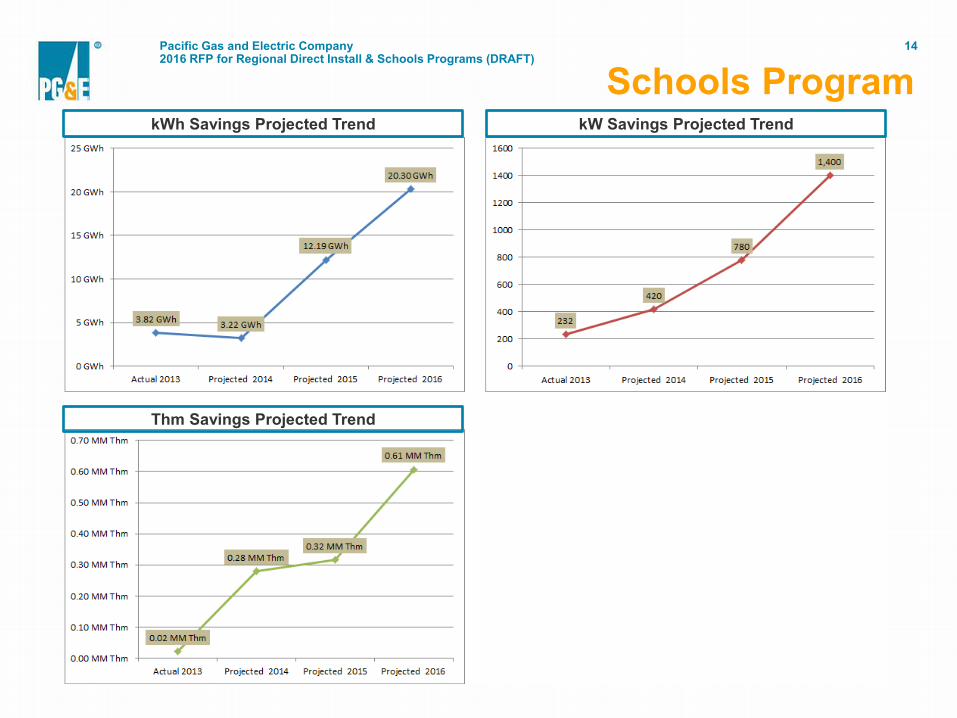
Schools Program
Thm Savings Projected Trend
kWh Savings Projected Trend kW Savings Projected Trend
15
Thank You


![[Company Name] Request for Proposal (RFP) for 3rd Party ... · RFP for 3rd Party Audit Services for [Company Name] Classification: Restricted 11 of 25 Any major non-conformances shall](https://img.pdfslide.us/doc/110x75/5f092e3e7e708231d4259c72/company-name-request-for-proposal-rfp-for-3rd-party-rfp-for-3rd-party-audit.jpg)