Embed Size (px)
Citation preview

2016: The way ahead
In co-operation with
kpmg.com/it
Solid performance for theItalian Private Equity Market

© 2017 KPMG Advisory S.p.A. è una società per azioni di diritto italiano e fa parte del network KPMG di entità indipendenti affiliate a KPMG International Cooperative (“KPMG International”), entità di diritto svizzero. Tutti i diritti riservati.

KPMG is a global Network of professional firms providing Audit, Tax and Advisory services. KPMG Network is present in 152 countries with over 189,000 respected professionals. In Italy, KPMG provides its services thanks to 3,500 professionals based in 26 offices within National borders. KPMG Corporate Finance is specialized in providing independent consulting services over M&A transactions and in advising clients on financial and strategic options, value assessments, privatizations, project and structured finance, financing for acquisitions, equity and debt capital raising, LBOs, MBOs and Initial Public Offerings. KPMG provides an integrated assistance for the entire M&A process and, thanks to specific industry knowledge, it is able to guarantee a full insight on sector dynamics and developing trends in the main sectors.
The ‘Private Equity Group’ involves a team of national professionals who, in coordination with the international Network, provide an independent advisory activity supporting Private Equity operators. Maximilian P. Fiani headed the team that prepared this paper, assisted by Matteo Landriscina.
KPMG è uno dei principali Network di servizi professionali alle imprese, leader nella revisione e organizzazione contabile, nella consulenza manageriale e nei servizi fiscali, legali e amministrativi. Il Network KPMG è attivo in 152 paesi del mondo con oltre 189 mila professionisti. In Italia, KPMG conta circa 3.500 professionisti e 26 sedi sull’intero territorio nazionale. KPMG Corporate Finance è la divisione specializzata nella consulenza indipendente nell’ambito di operazioni di finanza straordinaria: fusioni, acquisizioni e vendite, consulenza strategico-finanziaria, perizie e valutazioni, privatizzazioni, project finance, finanziamenti per acquisizioni, re-financing, consulenza finanziaria sul passivo, Leveraged and Management Buy-out, quotazioni e offerte pubbliche. KPMG offre un servizio completo e integrato per tutte le diverse fasi dell’attività M&A e, grazie alle specifiche competenze di industry, garantisce la piena comprensione delle dinamiche industriali e dei trend di sviluppo dei principali settori produttivi.
Il ‘Private Equity Group’ comprende un team nazionale di specialisti che, in coordinamento con il Network internazionale, svolge attività indipendente di advisory a supporto degli operatori di Private Equity. Il responsabile del presente lavoro è Maximilian P. Fiani, coadiuvato da Matteo Landriscina.
AIFI AIFI, Associazione Italiana del Private Equity, Venture Capital e Private Debt, è stata istituita nel maggio 1986 ed è internazionalmente riconosciuta per la sua attività di rappresentanza istituzionale e di promozione dell’attività di private equity, venture capital e private debt in Italia. AIFI associa e rappresenta istituzioni finanziarie che, stabilmente e professionalmente, effettuano investimenti in imprese, con un attivo coinvolgimento nello sviluppo delle medesime, oltre a radunare un importante network di istituzioni, investitori istituzionali e professionisti che supportano tale attività.
Per ulteriori informazioni: www.aifi.it
AIFI – Italian Private Equity, Venture Capital and Private Debt Association was founded in May 1986 and is internationally recognized for its activity of institutionally representing and promoting the private equity, venture capital and private debt activity in Italy. AIFI associates and represents financial institutions that professionally invest in companies, helping them to develop, and has an important network of institutions, investors and professionals that support these industries.
For further information: www.aifi.it
KPMG Corporate Finance
© 2017 KPMG Advisory S.p.A. è una società per azioni di diritto italiano e fa parte del network KPMG di entità indipendenti affiliate a KPMG International Cooperative (“KPMG International”), entità di diritto svizzero. Tutti i diritti riservati.

© 2017 KPMG Advisory S.p.A. è una società per azioni di diritto italiano e fa parte del network KPMG di entità indipendenti affiliate a KPMG International Cooperative (“KPMG International”), entità di diritto svizzero. Tutti i diritti riservati.

IndiceIntroduzioneFinalità del rapporto e informazioni utilizzate
Definizioni e glossario
Nota metodologica
Contesto macroeconomico italiano
La performance del mercato italiano del Private Equity e Venture Capital nel 2016Cosa è successo nel 2016?
L’impatto dei Write-Off sulla performance 2016
Analisi della performance per tipologia di operatore
Le performance a 1, 3, 5 e 10 anni
Appendice
English Version
66
7
8
9
11
12
16
18
19
22
23
© 2017 KPMG Advisory S.p.A. è una società per azioni di diritto italiano e fa parte del network KPMG di entità indipendenti affiliate a KPMG International Cooperative (“KPMG International”), entità di diritto svizzero. Tutti i diritti riservati.

6 2016: The way ahead
Introduzione
Finalità del rapporto e informazioni utilizzateDal 1996 KPMG Corporate Finance e l’Associazione Italiana del Private Equity, Venture Capital e Private Debt (AIFI) conducono annualmente un’indagine finalizzata a monitorare le performance registrate dalle operazioni di Private Equity e Venture Capital che coinvolgono i principali operatori attivi in Italia.
Tale ricerca ha consentito, negli anni, di delineare un quadro di sintesi che, a livello aggregato, descrive la performance (in termini di Tasso Interno di Rendimento) registrata dal mercato italiano del Private Equity e Venture Capital nell’orizzonte di analisi considerato.
Il presente lavoro, mediante l’analisi dei dati trasmessi dagli operatori nel corso delle varie edizioni, partendo dai dati di rendimento, intende verificare empiricamente lo ‘stato dell’arte’ del settore del Private Equity e Venture Capital in Italia, evidenziandone le principali tendenze in atto, nonché le possibili dinamiche evolutive.
In particolare, il documento fornisce un’overview dettagliata delle performance di mercato registrate nell’anno 2016 proponendo, ove opportuno, eventuali integrazioni e raffronti con i dati storici.
© 2017 KPMG Advisory S.p.A. è una società per azioni di diritto italiano e fa parte del network KPMG di entità indipendenti affiliate a KPMG International Cooperative (“KPMG International”), entità di diritto svizzero. Tutti i diritti riservati.

2016: The way ahead 7
Definizioni e glossario•AIFI – Associazione Italiana del Private Equity, Venture Capital e Private
Debt.
•Attività di Private Equity e Venture Capital – settore degli investimenti nel capitale di rischio realizzati da investitori professionali.
•Banca – impresa che svolge i compiti di fornire alla clientela mezzi di pagamento e di intermediazione tra offerta e domanda di capitali; nel presente documento, si fa particolare riferimento a banche che svolgono, direttamente o tramite strutture dedicate, anche attività di investimento in capitale di rischio.
•CAGR – tasso di crescita medio annuo composto (Compound Annual Growth Rate).
•Cash In – totale incassato dal fondo nella singola operazione (sommatoria dei flussi di cassa in entrata per ciascun investimento effettuato dal fondo (distribuzione di dividendi, disinvestimenti parziali, disinvestimenti totali)) registrati lungo la vita dell’investimento, fino alla data di osservazione.
•Cash Out – totale investito dal fondo nella singola operazione (sommatoria dei flussi di cassa in uscita per ciascun investimento effettuato dal fondo (investimento iniziale, investimenti successivi, eventuali aumenti di capitale)) registrati lungo la vita dell’investimento, fino alla data di osservazione.
•Country Fund – operatore specificatamente rivolto al mercato italiano.
•Development – tipologia di investimento in capitale di rischio effettuato nella fase di sviluppo dell’impresa, finalizzato all’espansione di un’attività già esistente.
•Early Stage – tipologia di investimento effettuato nelle prime fasi del ciclo di vita di un’impresa.
• IRR (Internal Rate of Return) – rendimento annuo composto di un’attività di investimento, calcolato sulla base dei relativi flussi in entrata e in uscita.
•MBO/MBI (Management Buy Out/Management Buy In) – operazione di acquisizione di un’impresa risultante in una struttura proprietaria che vede al suo interno un gruppo di manager; a seconda che il management sia interno o esterno alla società stessa, si parla, rispettivamente, di Buy Out o di Buy In.
•Pan-European Private Equity firm – società operante, attraverso un network di advisor, nella raccolta e nella gestione di ingenti capitali sui principali mercati europei.
•Replacement – tipologia di investimento in capitale di rischio effettuato essenzialmente allo scopo di sostituire azionisti di minoranza.
•SGR – acronimo indicante una Società di Gestione del Risparmio, la quale svolge, in via pressoché esclusiva, l’attività di istituzione e di gestione di fondi (chiusi) di investimento.
© 2017 KPMG Advisory S.p.A. è una società per azioni di diritto italiano e fa parte del network KPMG di entità indipendenti affiliate a KPMG International Cooperative (“KPMG International”), entità di diritto svizzero. Tutti i diritti riservati.

8 2016: The way ahead
Nota metodologicaLe analisi illustrate nel presente documento, nonché le informazioni e i dati utilizzati ai fini del calcolo della performance di mercato, sono stati comunicati ad AIFI e a KPMG Corporate Finance in forma riservata e confidenziale; ove opportuno, i dati trasmessi dagli operatori sono stati integrati con informazioni desunte da fonti pubbliche. Tutte le informazioni qui presentate fanno riferimento a dati aggregati e/o analizzati per macro-categorie.
I dati di performance presentati sono espressi in termini di IRR Lordo Aggregato, calcolato sulla base di flussi mensili (sia in entrata che in uscita) degli investimenti in capitale di rischio. Si segnala come tale dato rappresenti la media ponderata dei rendimenti della totalità degli investimenti realizzati dagli operatori e non la media dei rendimenti dei singoli operatori. In termini generali, si considera il mercato italiano come un unico fondo di Private Equity, il cui rendimento complessivo è calcolato sul totale dei flussi in entrata e in uscita, considerati su base mensile, derivanti dall’insieme delle operazioni monitorate.
È opportuno evidenziare che le analisi illustrate nel seguito considerano esclusivamente le operazioni per le quali sono stati resi disponibili, in forma completa, tutti i dati necessari alla stima dell’IRR; di conseguenza, eventuali operazioni caratterizzate da dati parziali e/o incompleti sono state escluse dalle analisi.
© 2017 KPMG Advisory S.p.A. è una società per azioni di diritto italiano e fa parte del network KPMG di entità indipendenti affiliate a KPMG International Cooperative (“KPMG International”), entità di diritto svizzero. Tutti i diritti riservati.
2016: The way ahead 9
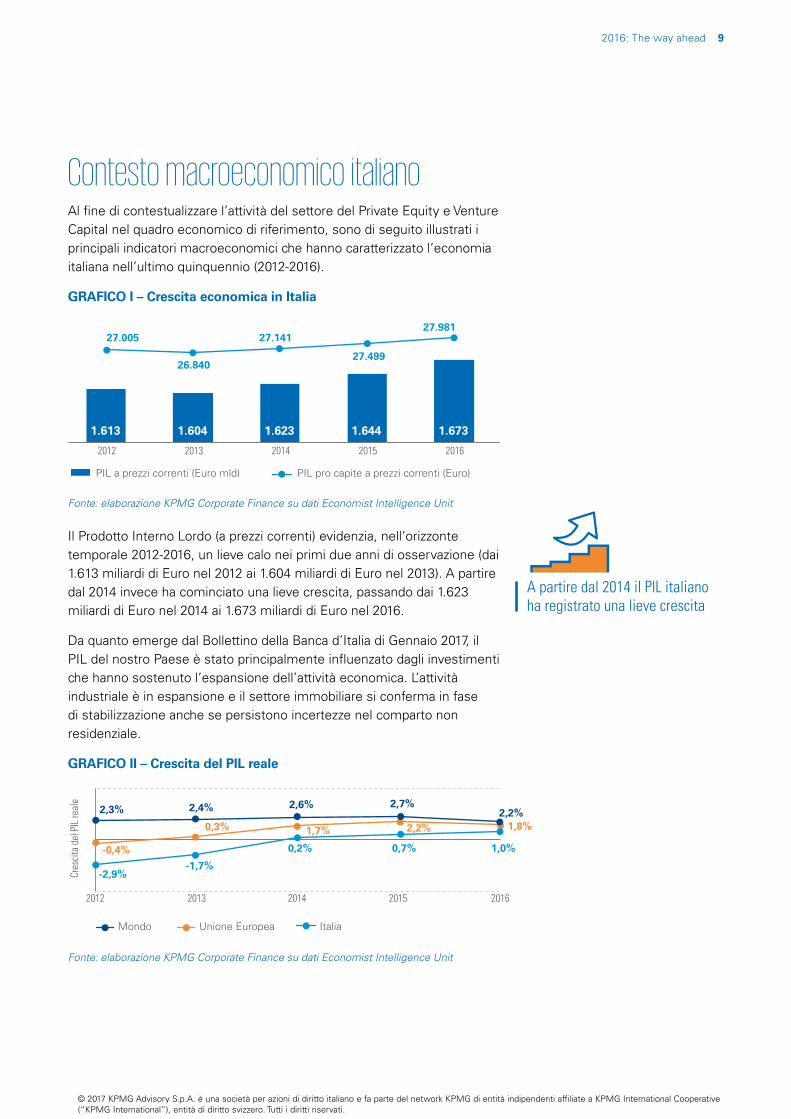
Contesto macroeconomico italianoAl fine di contestualizzare l’attività del settore del Private Equity e Venture Capital nel quadro economico di riferimento, sono di seguito illustrati i principali indicatori macroeconomici che hanno caratterizzato l’economia italiana nell’ultimo quinquennio (2012-2016).
GRAFICO I – Crescita economica in Italia
1.613
27.005
26.840
27.141
27.499
27.981
1.604 1.623 1.644 1.673
2012 2013 2014 2015 2016
PIL a prezzi correnti (Euro mld) PIL pro capite a prezzi correnti (Euro)
Fonte: elaborazione KPMG Corporate Finance su dati Economist Intelligence Unit
Il Prodotto Interno Lordo (a prezzi correnti) evidenzia, nell’orizzonte temporale 2012-2016, un lieve calo nei primi due anni di osservazione (dai 1.613 miliardi di Euro nel 2012 ai 1.604 miliardi di Euro nel 2013). A partire dal 2014 invece ha cominciato una lieve crescita, passando dai 1.623 miliardi di Euro nel 2014 ai 1.673 miliardi di Euro nel 2016.
Da quanto emerge dal Bollettino della Banca d’Italia di Gennaio 2017, il PIL del nostro Paese è stato principalmente influenzato dagli investimenti che hanno sostenuto l’espansione dell’attività economica. L’attività industriale è in espansione e il settore immobiliare si conferma in fase di stabilizzazione anche se persistono incertezze nel comparto non residenziale.
GRAFICO II – Crescita del PIL reale
Cres
cita
del P
IL re
ale
2,3% 2,4% 2,6% 2,7%2,2%
-0,4%
0,3% 1,7% 2,2% 1,8%
-2,9%-1,7%
0,2% 0,7% 1,0%
2012 2013 2014 2015 2016
Mondo Unione Europea Italia
Fonte: elaborazione KPMG Corporate Finance su dati Economist Intelligence Unit
A partire dal 2014 il PIL italiano ha registrato una lieve crescita
© 2017 KPMG Advisory S.p.A. è una società per azioni di diritto italiano e fa parte del network KPMG di entità indipendenti affiliate a KPMG International Cooperative (“KPMG International”), entità di diritto svizzero. Tutti i diritti riservati.

10 2016: The way ahead
L’analisi del tasso di crescita del PIL reale evidenzia andamenti differenti a seconda delle diverse aree geografiche analizzate: nell’orizzonte temporale di riferimento si osserva infatti come l’Italia abbia cominciato il suo percorso di crescita in ritardo rispetto al resto dell’economia europea e al resto del mondo. A livello globale, il tasso di crescita del PIL mostra un rallentamento (+2,2% nel 2016 vs +2,7% nel 2015) e anche in Europa l’andamento è stato simile (+1,8% nel 2016 vs +2,2 nel 2015). La crescita del PIL italiano ha confermato il trend positivo iniziato nel 2014 riuscendo a raggiungere una crescita positiva dell’1,0% nel 2016.
GRAFICO III – Tasso di disoccupazione in Italia
Tass
o di
diso
ccup
azio
ne
2012 2013 2014 2015 2016
10,7%
12,1%12,6%
11,9%11,7%
Fonte: elaborazione KPMG Corporate Finance su dati Economist Intelligence Unit
Le condizioni del mercato del lavoro in Italia permangono critiche. I dati relativi agli ultimi mesi del 2016 evidenziano una diminuzione del tasso di disoccupazione totale (11,7% nel 2016 vs 11,9% nel 2015). Non si è registrata una crescita del costo del lavoro.
GRAFICO IV – Tasso di inflazione in Italia
2012 2013 2014 2015 2016
3,3%
1,2%
0,3% 0,1%-0,1%
Fonte: elaborazione KPMG Corporate Finance su dati Economist Intelligence Unit
Nel 2016 si è registrata una riduzione del livello generale dei prezzi (-0,1%). L’inflazione è tornata positiva già tra la fine del 2016 e i primi mesi del 2017, anche se con valori molto contenuti.
Nel 2016 si è registrata una diminuzione del tasso di
disoccupazione totale
© 2017 KPMG Advisory S.p.A. è una società per azioni di diritto italiano e fa parte del network KPMG di entità indipendenti affiliate a KPMG International Cooperative (“KPMG International”), entità di diritto svizzero. Tutti i diritti riservati.

2016: The way ahead 11
La performance del mercato italiano del Private Equity e Venture Capital nel 2016Le analisi illustrate nel seguito riguardano esclusivamente le performance (espresse in termini di IRR Lordo Aggregato) relative ad investimenti effettuati, da parte degli operatori di Private Equity e Venture Capital, durante il 2016.
Nello specifico, le analisi considerano due tipologie principali di indicatori di performance:
•IRR Lordo Aggregato ‘From Inception’ (definito anche, nella terminologia internazionale, ‘Gross Pooled IRR on Realised Investments’), che esprime le performance relative ai disinvestimenti realizzati nel corso dell’anno di riferimento, indipendentemente dal periodo in cui è stato effettuato l’investimento iniziale;
•IRR Lordo Aggregato ‘By Horizon’ (definito anche, nella terminologia internazionale, ‘Gross Pooled IRR on All Investments’), che indica le performance relative agli investimenti realizzati nell’orizzonte temporale di riferimento (1, 3, 5 e 10 anni), indipendentemente dal fatto che essi siano stati successivamente disinvestiti o risultino ancora in portafoglio; in quest’ultimo caso, ai fini del calcolo della performance, si prende a riferimento la valorizzazione della partecipazione a fine periodo (fornita dagli operatori).
© 2017 KPMG Advisory S.p.A. è una società per azioni di diritto italiano e fa parte del network KPMG di entità indipendenti affiliate a KPMG International Cooperative (“KPMG International”), entità di diritto svizzero. Tutti i diritti riservati.

12 2016: The way ahead
Cosa è successo nel 2016?
IRR Lordo Aggregato ‘From Inception’Le elaborazioni illustrate nel seguito esprimono la performance misurata considerando tutti i flussi di cassa, in uscita (Cash Out) e in entrata (Cash In), relativi ai disinvestimenti realizzati nell’anno di riferimento; in caso di dismissione parziale, i flussi relativi sono considerati ‘pro-quota’.
Tale metodo di indagine, focalizzandosi esclusivamente sui disinvestimenti realizzati nel 2016 ed escludendo eventuali riferimenti alle performance implicite delle partecipazioni ancora in portafoglio, favorisce l’oggettività della rappresentazione e dei risultati desunti.
TAB. 1 – Il campione ‘From Inception’
2012 2013 2014 2015 2016
Operatori inclusi nella ricerca 95 95 91 80 75
Operatori che presentano operazioni realizzate 36 55 41 43 40
Numero transazioni dismesse 82 102 95 74 64
Dimensione media dell'investimento (Euro mln) 10,2 20,7 17,7 18,7 23,6
Cash Out complessivo (Euro mln) 840 2.115 1.681 1.382 1.511
Cash In complessivo (Euro mln) 1.112 4.809 3.489 3.333 3.364
Cash multiple medio 1,3x 2,3x 2,1x 2,4x 2,2x
La performance generale (in termini di IRR aggregato lordo) rimane stabile su valori positivi, in linea con i due anni precedenti.
Il numero dei disinvestimenti effettuati da parte degli operatori del campione oggetto di analisi risulta diminuito da 74 nel 2015 a 64 nel 2016. Il numero di operatori di Private Equity e Venture Capital che hanno realizzato delle dismissioni è leggermente diminuito (da 43 nel 2015 a 40 nel 2016). Nonostante la riduzione del numero di disinvestimenti, il Cash In totale rimane allineato al livello dell’anno precedente a 3.364 milioni di Euro (dai 3.333 milioni di Euro del 2015).
Il Cash Out totale è aumentato da 1.382 milioni di Euro nel 2015 a 1.511 milioni di Euro nel 2016.
La dimensione media degli investimenti realizzati è cresciuta da 18,7 milioni di Euro nel 2015 a 23,6 milioni di Euro nel 2016 e può essere considerato come un effetto dell’incremento del Cash Out e della riduzione del numero di investimenti realizzati.
La performance generale, in termini di IRR aggregato lordo,
rimane stabile su valori positivi, in linea con i due anni precedenti
© 2017 KPMG Advisory S.p.A. è una società per azioni di diritto italiano e fa parte del network KPMG di entità indipendenti affiliate a KPMG International Cooperative (“KPMG International”), entità di diritto svizzero. Tutti i diritti riservati.

2016: The way ahead 13
Il multiplo medio di uscita implicito (cosiddetto ‘cash multiple’) rimane fondamentalmente stabile su valori elevati (2,2x nel 2016 vs 2,4x nel 2015) a riprova della positività dell’anno 2016.
In aggiunta, l’incidenza delle partecipazioni soggette a Write-Off è diminuita sia per ammontare investito (Cash Out) sia per numero.
TAB. 2 – La performance ‘From Inception’
2014 2015 2016
IRR Lordo Aggregato 19,7% 17,8% 14,5%
Quartile superiore per performance 53,5% 61,2% 36,6%
Quartile superiore per ammontare investito 22,5% 17,4% 15,1%
Nel complesso, la performance delle operazioni disinvestite nel 2016 si attesta a 14,5% (17,8% nel 2015). E’ opportuno precisare che, nel corso del 2016, sono state chiuse delle operazioni di dimensioni particolarmente rilevanti che prevedevano l’investimento nelle target anche attraverso l’utilizzo di strumenti diversi dall’equity. Ai fini di questa analisi, coerentemente con quanto effettuato negli anni precedenti, si è tenuto conto solo del rendimento ottenuto attraverso l’investimento in equity, e non anche di quello ottenuto attraverso i diversi strumenti di investimento.
L’analisi della performance per quartile conferma come l’IRR del mercato sia influenzato dai rendimenti delle operazioni di maggiori dimensioni. Se il quartile superiore in termini di performance (il cluster costituito dal 25% dei disinvestimenti con i rendimenti maggiori) ha ottenuto un rendimento del 36,6%, il quartile superiore per ammontare investito (il cluster che raggruppa il 25% delle operazioni caratterizzate dai maggiori controvalori investiti) ha evidenziato un rendimento del 15,1%.
TAB. 3 – Breakdown per classe di IRR realizzato
Cash Out Cash In No transazioni
2014 2015 2016 2014 2015 2016 2014 2015 2016
Write-Off 10,9% 7,5% 3,1% 0,8% 0,3% 0,0% 24 16 11
Negativo 8,1% 8,3% 1,6% 1,4% 1,1% 0,2% 14 2 8
0% - 10% 12,6% 7,5% 31,7% 7,2% 4,2% 17,9% 23 18 21
10% - 20% 5,8% 20,8% 26,3% 5,5% 14,2% 20,2% 11 11 7
20% - 30% 1,1% 15,1% 17,7% 1,2% 23,1% 22,3% 4 7 9
30% - 40% 24,8% 4,5% 3,4% 20,5% 6,1% 4,8% 6 11 3
40% - 50% 0,4% 0,0% 2,7% 0,9% 0,0% 6,8% 1 0 1
50% - 100% 26,0% 33,8% 12,5% 51,4% 25,4% 25,4% 6 7 3
100% - 500% 10,3% 2,7% 1,0% 11,0% 13,1% 2,3% 6 2 1
Totale (Euro mln) 1.681 1.382 1.511 3.489 3.333 3.364 95 74 64
Performance delle operazioni disinvestite nel 2016
14,5%
© 2017 KPMG Advisory S.p.A. è una società per azioni di diritto italiano e fa parte del network KPMG di entità indipendenti affiliate a KPMG International Cooperative (“KPMG International”), entità di diritto svizzero. Tutti i diritti riservati.
14 2016: The way ahead
Il breakdown per classe di IRR realizzato illustra con maggior dettaglio la distribuzione dei rendimenti nell’anno.
Le operazioni con rendimenti negativi aumentano di numero (8 nel 2016 vs 2 nel 2015), ma si riducono sensibilmente per ammontare investito (1,6% nel 2016 vs 8,3% nel 2015).
Le operazioni con rendimenti bassi (IRR compreso fra lo 0% e il 10%) hanno avuto un leggero aumento in termini numerici (21 nel 2016 vs 18 nel 2015) e una crescita decisamente più elevata in termini di ammontare investito (31,7% nel 2016 vs 7,5% nel 2015).
La classe di rendimento caratterizzata da un IRR compreso fra il 10% e il 20% include 7 operazioni (quattro meno dell’anno precedente). Il Cash Out è aumentato (26,3% nel 2016 vs 20,8% nel 2015).
La classe di rendimento con IRR tra il 20% e il 30% registra una crescita sia in termini numerici (9 nel 2016 vs 7 nel 2015) che di incidenza per Cash Out (17,7% nel 2016 vs 15,1% nel 2015).
Le transazioni con livelli di rendimento elevati (IRR superiore al 30%) si sono sensibilmente ridotte per numero (8 nel 2016 vs 20 nel 2015) e per valore (19,6% nel 2016 vs 40,9% nel 2015). In particolare, il cluster con IRR compresi tra 100% e 500% è stato interessato da una importante riduzione dell’ammontare investito (1,0% nel 2016 vs 2,7% nel 2015). Quest’anno si è registrata una operazione (vs 2 nel 2015) con IRR superiore al 100%.
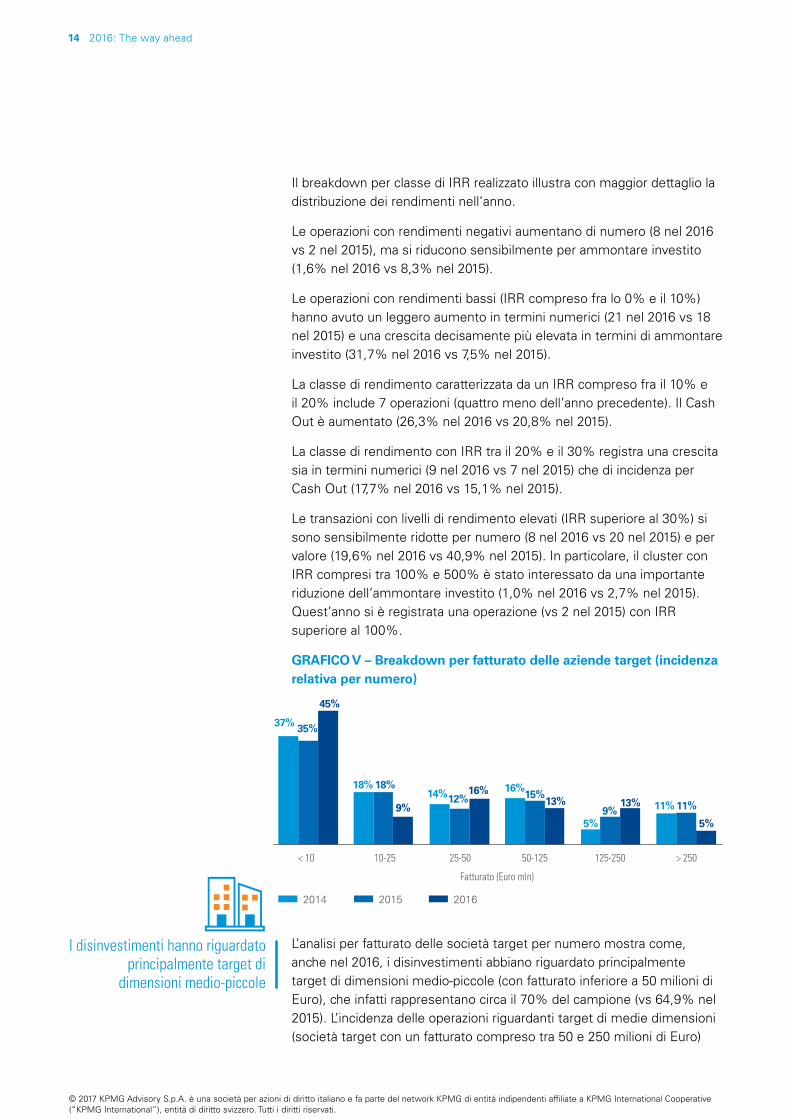
GRAFICO V – Breakdown per fatturato delle aziende target (incidenza relativa per numero)
< 10 10-25 25-50 50-125 125-250 > 250
35%
18%12% 15%
9% 11%
37%
18%14% 16%
5%
11%
201620152014
45%
9%
16%13% 13%
5%
Fatturato (Euro mln)
L’analisi per fatturato delle società target per numero mostra come, anche nel 2016, i disinvestimenti abbiano riguardato principalmente target di dimensioni medio-piccole (con fatturato inferiore a 50 milioni di Euro), che infatti rappresentano circa il 70% del campione (vs 64,9% nel 2015). L’incidenza delle operazioni riguardanti target di medie dimensioni (società target con un fatturato compreso tra 50 e 250 milioni di Euro)
I disinvestimenti hanno riguardato principalmente target di
dimensioni medio-piccole
© 2017 KPMG Advisory S.p.A. è una società per azioni di diritto italiano e fa parte del network KPMG di entità indipendenti affiliate a KPMG International Cooperative (“KPMG International”), entità di diritto svizzero. Tutti i diritti riservati.

2016: The way ahead 15
si mostra stabile rispetto allo scorso anno (25,0% nel 2016 vs 24,3% nel 2015), mentre le operazioni relative a imprese di grandi dimensioni (società target con fatturato superiore a 250 milioni di Euro) subiscono una flessione (4,7% nel 2016 vs 10,8% nel 2015).
TAB. 4 – Breakdown per fatturato delle aziende target (IRR Lordo Aggregato)
Fatturato (Euro mln) 2015 2016
No IRR No IRR
<50 48 22,0% 45 11,3%
50 - 250 18 13,4% 16 12,5%
>250 8 20,8% 3 17,9%
L’analisi delle performance del breakdown per fatturato delle aziende target mostra come quest’anno i rendimenti siano stati positivi seppur inferiori rispetto a quelli dell’anno precedente. Per le operazioni che hanno avuto come target aziende di piccole dimensioni i rendimenti sono passati dal 22,0% del 2015 all’11,3% del 2016, mentre per le operazioni che hanno coinvolto target di grandi dimensioni i rendimenti sono scesi dal 20,8% al 17,9%.
GRAFICO VI – Breakdown per fase del ciclo di vita delle aziende target (incidenza relativa per numero)
Fase del ciclo di vita
Early Stage Development Replacement MBO / MBI
2014 2015 2016
22% 23%
4%
51%
21%
35%
13%
32%33% 34%
3%
30%
Rispetto all’anno scorso, l’interesse degli operatori verso le operazioni riguardanti MBO/MBI risulta diminuito; esse sono infatti passate dal 51,4% del totale dei disinvestimenti (per numero) nel 2015 al 29,7% nel 2016. Le operazioni di Development hanno registrato un aumento (34,4% nel 2016 vs 23,0% nel 2015), mentre le transazioni di Replacement si sono sostanzialmente mantenute stabili (3,1% nel 2016 vs 4,1% nel 2015). Le operazioni di investimento Early Stage sono aumentate fino alla quota del 33% circa. È possibile osservare come il campione nel 2016 risulti sostanzialmente distribuito in maniera omogena tra i cluster Early Stage, Development e MBO/MBI.
I disinvestimenti si distribuiscono in modo omogeneo tra Early Stage, Development e MBO/MBI
© 2017 KPMG Advisory S.p.A. è una società per azioni di diritto italiano e fa parte del network KPMG di entità indipendenti affiliate a KPMG International Cooperative (“KPMG International”), entità di diritto svizzero. Tutti i diritti riservati.

16 2016: The way ahead
TAB. 5 – Breakdown per fase del ciclo di vita delle aziende target (IRR Lordo Aggregato)
Early Stage Development Replacement MBO/MBI
2015 2016 2015 2016 2015 2016 2015 2016
N° transazioni 16 21 17 22 3 2 38 19
IRR Lordo Aggregato -17,6% 4,1% 10,3% 14,3% 51,7% 19,9% 18,0% 14,2%
In termini di rendimenti, le operazioni di MBO/MBI registrano nell’anno 2016 un IRR pari a 14,2% (vs 18,0% nel 2015). La riduzione della performance è accompagnata anche dal calo nel numero di operazioni che passano da 38 a 19. Il cluster Replacement è rappresentato da sole 2 operazioni (vs 3 nel 2015) e ha ottenuto un IRR pari a 19,9% (vs 51,7% nel 2015). Le operazioni di Development registrano un aumento del numero di transazioni (22 nel 2016 vs 17 nel 2015) e dei rendimenti (14,3% nel 2016 vs 10,3% nel 2015). La performance delle operazioni Early Stage, storicamente contraddistinte da un’elevata variabilità, si è attestata a un rendimento del 4,1%, positivo per la prima volta dopo sette anni.
L’impatto dei Write-Off sulla performance 2016L’analisi che segue cerca di delineare un quadro più dettagliato dei Write-Off registrati nel corso del 2016 al fine di comprenderne l’evoluzione e l’incidenza, in termini di numero e di volumi di investimento, sui vari cluster esaminati nell’ambito dell’analisi ‘From Inception’.
E’ opportuno sottolineare che, come indicato precedentemente, ai fini dell’analisi ‘From Inception’, sono stati considerati sia i Write-Off totali (svalutazione del 100% del valore dell’investimento), sia i Write-Off parziali; ai fini della presente indagine, per Write-Off parziali si intendono quelli la cui svalutazione, benché non totale, risulti comunque particolarmente rilevante (pari ad almeno l’80% del valore complessivo dell’investimento).
GRAFICO VII – Write-Off (per Cash Out e per numero) nel 2016
Totalecampione
Disinvestimenti Cash Out (Euro mln)
64 1.511
Write-Off Totalecampione
Write-Off
11
47
La performance delle operazioni Early Stage si è attestata su
rendimenti positivi, per la prima volta dopo sette anni
© 2017 KPMG Advisory S.p.A. è una società per azioni di diritto italiano e fa parte del network KPMG di entità indipendenti affiliate a KPMG International Cooperative (“KPMG International”), entità di diritto svizzero. Tutti i diritti riservati.

2016: The way ahead 17
Delle 64 operazioni monitorate nel 2016, 11 sono relative a Write-Off di cui dieci totali e uno parziale, in forte calo rispetto al 2015, quando i Write-Off erano stati 24, di cui 16 totali e 8 parziali.
L’incidenza dei Write-Off nel corrente anno di analisi risulta del 17,2% per numero (vs 21,6% nel 2015) e del 3,1% per ammontare investito (vs 7,5% nel 2015).
GRAFICO VIII – Incidenza (per numero e per Cash Out) dei Write-Off nel triennio 2014-2016
2014 2015 2016
Incidenza per numero Incidenza per Cash Out
22%
7%
3%
17%
11%
25%
Nel periodo 2014-2016 vi è stata una riduzione dell’incidenza dei Write-Off sia per numero (differenza dell’8% dal 2014) che per Cash Out (differenza dell’8% rispetto al 2014).
La riduzione dell’incidenza dei Write-Off ha esercitato un impatto positivo sulla performance generale del mercato.
GRAFICO IX – Write-Off 2016: breakdown per fatturato delle aziende target (incidenza relativa per numero e per Cash Out)
<10 25-50
Incidenza per numero Incidenza per Cash Out
82%
Fatturato (Euro mln)
18%
82%
18%
I Write-Off del campione 2016 si sono concentrati in due categorie di fatturato. Nel cluster delle piccole aziende (con fatturato inferiore ai 10 milioni di Euro) si è registrato il 18% del totale Cash Out e l’82% del numero totale di Write-Off. Nel cluster delle medie imprese (con fatturato compreso tra 25 e 50 milioni di Euro) si è registrato l’82% del totale Cash Out e il 18% del numero totale di Write-Off.
Nel periodo 2014-2016 l’incidenza dei Write-Off si è ridotta sia per numero sia per Cash Out
© 2017 KPMG Advisory S.p.A. è una società per azioni di diritto italiano e fa parte del network KPMG di entità indipendenti affiliate a KPMG International Cooperative (“KPMG International”), entità di diritto svizzero. Tutti i diritti riservati.

18 2016: The way ahead
GRAFICO X – Write-Off 2016: breakdown per fase del ciclo di vita delle aziende target (incidenza relativa per numero e per Cash Out)
Early Stage MBO/MBI
Incidenza per numero Incidenza per Cash Out
Fase del ciclo di vita
9%
25%
75%
91%
L’analisi per fase del ciclo di vita delle aziende target evidenzia la concentrazione dei Write-Off in due categorie. Il segmento Early Stage conferma la più alta incidenza in termini di numero di operazioni, raggiungendo quest’anno quota 91%, mentre in termini di incidenza per Cash Out le MBO/MBI rappresentano circa il 75% del totale dei Write-Off.
Per riassumere, quest’anno i Write-Off non hanno avuto grande impatto sulle performance del campione. Il maggior numero di Write-Off si è verificato su aziende di piccole dimensioni nei loro primi anni di attività, ma queste operazioni hanno influito in misura inferiore rispetto ai Write-Off di operazioni di MBO/MBI che hanno coinvolto un minor numero di aziende target, ma di dimensioni relativamente più grandi.
Analisi della performance per tipologia di operatoreIn linea con le precedenti edizioni, si propone una specifica analisi della performance per tipologia di operatore. In sostanza, tale focus di analisi mira a segmentare il panel di riferimento in tre sotto-campioni (Country Fund/SGR, Banche e Pan-European Private Equity firm), al fine di analizzarne le relative dinamiche in termini sia di volumi di investimento, sia di IRR Lordo Aggregato ‘From Inception’.
Nel 2016 i Write-Off non hanno avuto grande impatto sulle performance del campione
© 2017 KPMG Advisory S.p.A. è una società per azioni di diritto italiano e fa parte del network KPMG di entità indipendenti affiliate a KPMG International Cooperative (“KPMG International”), entità di diritto svizzero. Tutti i diritti riservati.
2016: The way ahead 19
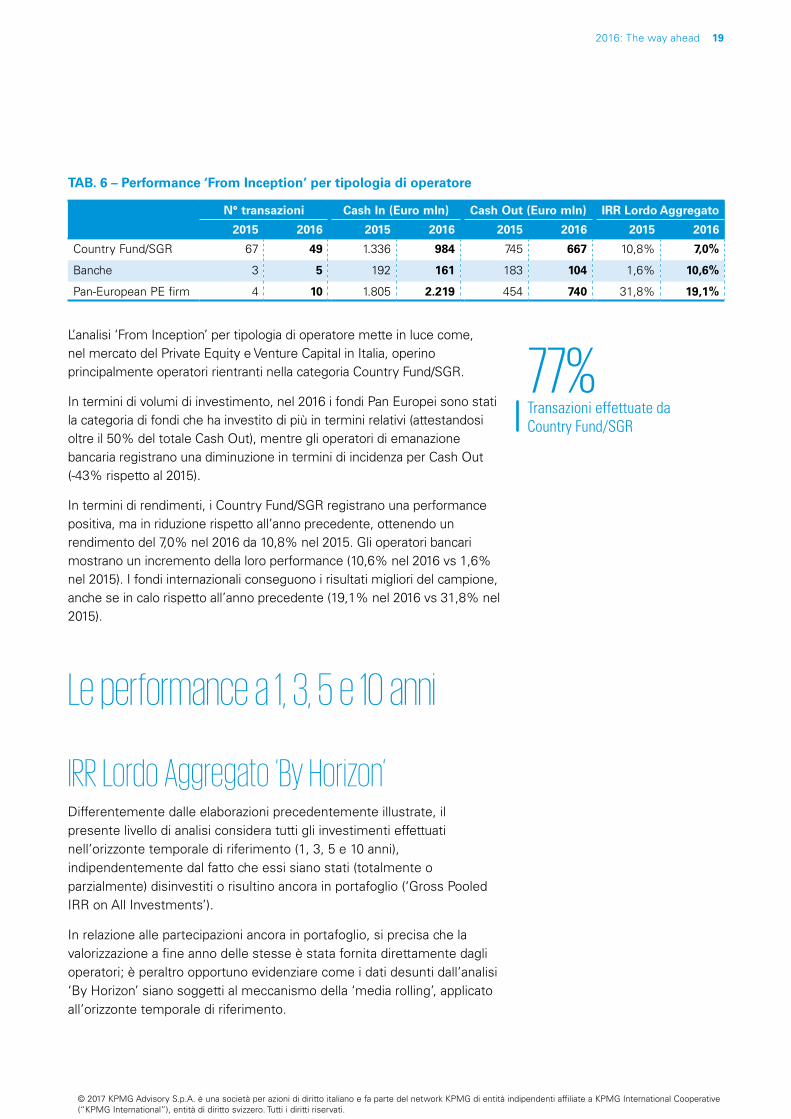
TAB. 6 – Performance ‘From Inception’ per tipologia di operatore
N° transazioni Cash In (Euro mln) Cash Out (Euro mln) IRR Lordo Aggregato
2015 2016 2015 2016 2015 2016 2015 2016
Country Fund/SGR 67 49 1.336 984 745 667 10,8% 7,0%
Banche 3 5 192 161 183 104 1,6% 10,6%
Pan-European PE firm 4 10 1.805 2.219 454 740 31,8% 19,1%
L’analisi ‘From Inception’ per tipologia di operatore mette in luce come, nel mercato del Private Equity e Venture Capital in Italia, operino principalmente operatori rientranti nella categoria Country Fund/SGR.
In termini di volumi di investimento, nel 2016 i fondi Pan Europei sono stati la categoria di fondi che ha investito di più in termini relativi (attestandosi oltre il 50% del totale Cash Out), mentre gli operatori di emanazione bancaria registrano una diminuzione in termini di incidenza per Cash Out (-43% rispetto al 2015).
In termini di rendimenti, i Country Fund/SGR registrano una performance positiva, ma in riduzione rispetto all’anno precedente, ottenendo un rendimento del 7,0% nel 2016 da 10,8% nel 2015. Gli operatori bancari mostrano un incremento della loro performance (10,6% nel 2016 vs 1,6% nel 2015). I fondi internazionali conseguono i risultati migliori del campione, anche se in calo rispetto all’anno precedente (19,1% nel 2016 vs 31,8% nel 2015).
Le performance a 1, 3, 5 e 10 anni
IRR Lordo Aggregato ‘By Horizon’ Differentemente dalle elaborazioni precedentemente illustrate, il presente livello di analisi considera tutti gli investimenti effettuati nell’orizzonte temporale di riferimento (1, 3, 5 e 10 anni), indipendentemente dal fatto che essi siano stati (totalmente o parzialmente) disinvestiti o risultino ancora in portafoglio (‘Gross Pooled IRR on All Investments’).
In relazione alle partecipazioni ancora in portafoglio, si precisa che la valorizzazione a fine anno delle stesse è stata fornita direttamente dagli operatori; è peraltro opportuno evidenziare come i dati desunti dall’analisi ‘By Horizon’ siano soggetti al meccanismo della ‘media rolling’, applicato all’orizzonte temporale di riferimento.
Transazioni effettuate da Country Fund/SGR
77%
© 2017 KPMG Advisory S.p.A. è una società per azioni di diritto italiano e fa parte del network KPMG di entità indipendenti affiliate a KPMG International Cooperative (“KPMG International”), entità di diritto svizzero. Tutti i diritti riservati.
20 2016: The way ahead
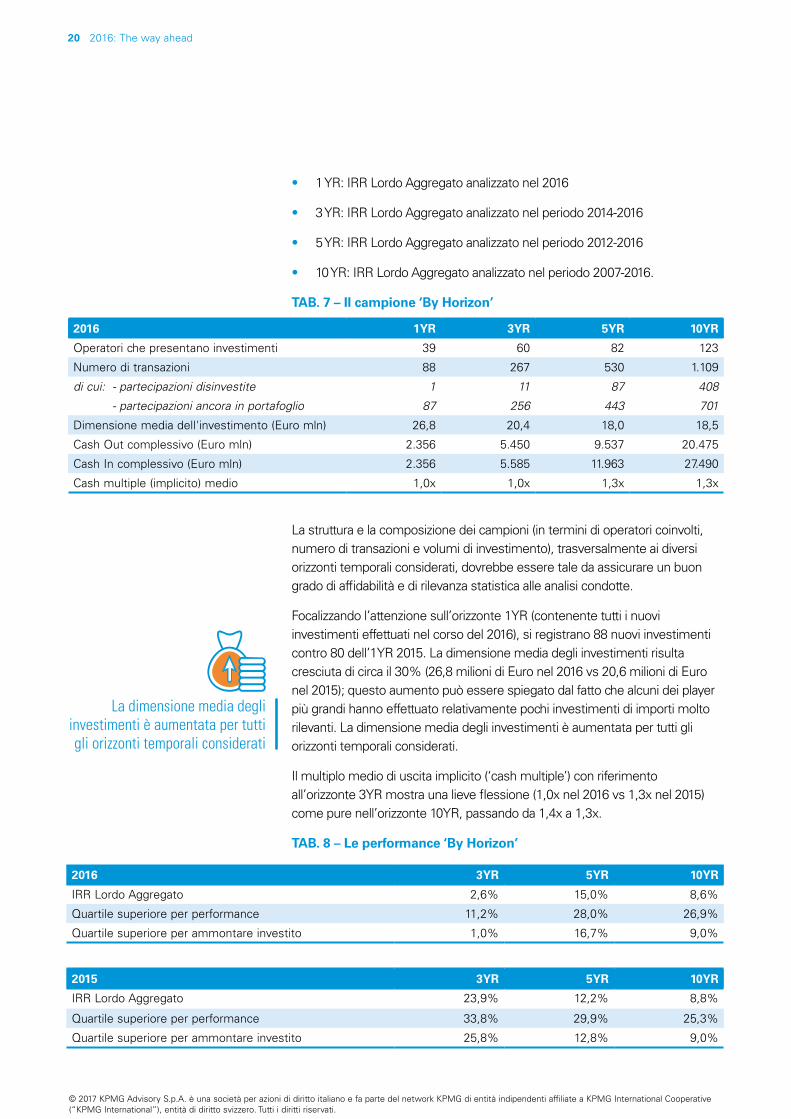
• 1 YR: IRR Lordo Aggregato analizzato nel 2016
• 3 YR: IRR Lordo Aggregato analizzato nel periodo 2014-2016
• 5 YR: IRR Lordo Aggregato analizzato nel periodo 2012-2016
• 10 YR: IRR Lordo Aggregato analizzato nel periodo 2007-2016.
TAB. 7 – Il campione ‘By Horizon’
2016 1YR 3YR 5YR 10YR
Operatori che presentano investimenti 39 60 82 123
Numero di transazioni 88 267 530 1.109
di cui: - partecipazioni disinvestite 1 11 87 408
- partecipazioni ancora in portafoglio 87 256 443 701
Dimensione media dell'investimento (Euro mln) 26,8 20,4 18,0 18,5
Cash Out complessivo (Euro mln) 2.356 5.450 9.537 20.475
Cash In complessivo (Euro mln) 2.356 5.585 11.963 27.490
Cash multiple (implicito) medio 1,0x 1,0x 1,3x 1,3x
La struttura e la composizione dei campioni (in termini di operatori coinvolti, numero di transazioni e volumi di investimento), trasversalmente ai diversi orizzonti temporali considerati, dovrebbe essere tale da assicurare un buon grado di affidabilità e di rilevanza statistica alle analisi condotte.
Focalizzando l’attenzione sull’orizzonte 1YR (contenente tutti i nuovi investimenti effettuati nel corso del 2016), si registrano 88 nuovi investimenti contro 80 dell’1YR 2015. La dimensione media degli investimenti risulta cresciuta di circa il 30% (26,8 milioni di Euro nel 2016 vs 20,6 milioni di Euro nel 2015); questo aumento può essere spiegato dal fatto che alcuni dei player più grandi hanno effettuato relativamente pochi investimenti di importi molto rilevanti. La dimensione media degli investimenti è aumentata per tutti gli orizzonti temporali considerati.
Il multiplo medio di uscita implicito (‘cash multiple’) con riferimento all’orizzonte 3YR mostra una lieve flessione (1,0x nel 2016 vs 1,3x nel 2015) come pure nell’orizzonte 10YR, passando da 1,4x a 1,3x.
TAB. 8 – Le performance ‘By Horizon’
2016 3YR 5YR 10YR
IRR Lordo Aggregato 2,6% 15,0% 8,6%
Quartile superiore per performance 11,2% 28,0% 26,9%
Quartile superiore per ammontare investito 1,0% 16,7% 9,0%
2015 3YR 5YR 10YR
IRR Lordo Aggregato 23,9% 12,2% 8,8%
Quartile superiore per performance 33,8% 29,9% 25,3%
Quartile superiore per ammontare investito 25,8% 12,8% 9,0%
La dimensione media degli investimenti è aumentata per tutti gli orizzonti temporali considerati
© 2017 KPMG Advisory S.p.A. è una società per azioni di diritto italiano e fa parte del network KPMG di entità indipendenti affiliate a KPMG International Cooperative (“KPMG International”), entità di diritto svizzero. Tutti i diritti riservati.

2016: The way ahead 21
I prospetti relativi alle performance del biennio 2015-2016 evidenziano trend differenti. Focalizzando l’attenzione sull’orizzonte 10YR (il più significativo dal punto di vista statistico), possiamo osservare un leggero calo in termini di IRR (8,6% nel 2016 vs 8,8% nel 2015).
Il quartile superiore per performance mostra un miglioramento (26,9% nel 2016 vs 25,3% nel 2015) e si conferma, invece, al 9,0% per ammontare investito (in linea con il dato 2015).
Concentrando l’attenzione sull’orizzonte 5YR si può notare un importante aumento della performance generale: 15,0% nel 2016 vs 12,2% nel 2015.
TAB. 9 – Valorizzazione delle partecipazioni in portafoglio (incidenza relativa per numero e per Cash Out)
10YR N° transazioni Cash Out
2014 2015 2016 2014 2015 2016
Partecipazioni valutate al 'valore di carico' 58,8% 51,8% 53,4% 34,8% 30,7% 45,2%
Partecipazioni rivalutate 24,9% 28,6% 29,1% 45,0% 42,8% 36,5%
Partecipazioni svalutate 16,3% 19,6% 17,5% 20,1% 26,6% 18,3%
Investimenti ancora in portafoglio (N° e Euro mln) 687 685 701 10.013 10.339 11.420
Analizzando le partecipazioni ancora in portafoglio, con particolare attenzione all’orizzonte temporale più ampio e significativo (10YR), si conferma la consolidata prassi degli operatori di valorizzare le partecipazioni detenute al loro valore di carico. Tale fenomeno risulta in lieve aumento rispetto all’anno precedente sia considerando l’incidenza sul totale delle partecipazioni detenute (53,4% nel 2016 vs 51,8% nel 2015) sia considerando i volumi d’investimento (45,2% nel 2016 vs 30,7% nel 2015).
Le partecipazioni rivalutate mostrano invece un aumento in termini numerici (29,1% nel 2016 vs 28,6% nel 2015) e una riduzione in termini di Cash Out (36,5% nel 2016 vs 42,8% nel 2015).
Le partecipazioni svalutate sono diminuite in termini numerici (17,5% nel 2016 vs 19,6% nel 2015) e soprattutto in termini di Cash Out (18,3% nel 2016 vs 26,6% nel 2015). È opportuno ricordare che il cluster ‘partecipazioni svalutate’ non include, ai fini dell’analisi in oggetto, i Write-Off, in quanto questi ultimi sono considerati come disinvestimenti.
Sull’orizzonte 10YR, il più significativo dal punto di vista statistico, si osserva un leggero calo dell’IRR
© 2017 KPMG Advisory S.p.A. è una società per azioni di diritto italiano e fa parte del network KPMG di entità indipendenti affiliate a KPMG International Cooperative (“KPMG International”), entità di diritto svizzero. Tutti i diritti riservati.

22 2016: The way ahead
AppendiceSi riportano nel seguito alcuni prospetti che sintetizzano ulteriori analisi di dettaglio sviluppate sul campione ‘From Inception’.
TAB. 10 – Breakdown IRR ‘From Inception’ per modalità di way out
Trade Sale
2015 2016
N° transazioni 56 53
IRR Lordo Aggregato 20,3% 15,0%
Nota: la tabella mostra il rendimento realizzato dal campione negli anni 2015 e 2016 senza tenere in considerazione i Write-Off.
TAB. 11 – Breakdown IRR 2016 ‘From Inception’ per time gap compreso tra il primo investimento e la dismissione
2016 < 2 2-3 3-4 4-5 5-7 > 7
N° transazioni 3 5 11 8 16 21
IRR Lordo Aggregato 125,4% 16,6% 27,7% 27,4% 16,5% 1,2%
TAB. 12 – Breakdown IRR 2016 ‘From Inception’ per settore delle aziende target
Settore N° transazioni IRR Lordo Aggregato Cash In (Euro mln) Cash Out (Euro mln)
Agroalimentare 2 18,2% 66 35
Produzioni industriali e collegate 13 33,7% 987 284
Chimico-Energetico 5 9,8% 220 168
ICT 11 17,5% 722 331
Produzione beni di consumo 6 7,5% 542 283
Biotecnologie 3 Negativo 1 3
Finanziario 4 17,4% 98 44
Farmaceutico-Sanitario 5 22,2% 395 145
Trasporti-Infrastrutture 1 14,9% 35 18
Altro 14 5,3% 299 202
TAB. 13 – Breakdown IRR 2016 ‘From Inception’ per quota di capitale
Quota detenuta N° transazioni IRR Lordo Aggregato Cash In (Euro mln) Cash Out (Euro mln)
<5% 2 Negativo 1 7
5% - 10% 6 1,6% 22 19
10% - 25% 23 8,1% 456 250
25% - 50% 19 13,2% 1.259 533
>50% 14 23,1% 1.626 703
© 2017 KPMG Advisory S.p.A. è una società per azioni di diritto italiano e fa parte del network KPMG di entità indipendenti affiliate a KPMG International Cooperative (“KPMG International”), entità di diritto svizzero. Tutti i diritti riservati.

2016: The way ahead 23
English Version
© 2017 KPMG Advisory S.p.A., an Italian limited liability share capital company and a member firm of the KPMG network of independent member firms affiliated with KPMG International Cooperative (“KPMG International”), a Swiss entity. All rights reserved.

© 2017 KPMG Advisory S.p.A., an Italian limited liability share capital company and a member firm of the KPMG network of independent member firms affiliated with KPMG International Cooperative (“KPMG International”), a Swiss entity. All rights reserved.

ContentsBackgroundAim of the report and information used
Definitions and glossary
Methodology
The Italian macroeconomic framework
Italian Private Equity and Venture Capital market performance in 2016How did 2016 perform?
The impact of Write-Offs on 2016 performance
Analysis of performance by Private Equity House category
1, 3, 5 and 10 year performance
Appendix
2626
27
28
29
3131
36
38
39
42
© 2017 KPMG Advisory S.p.A., an Italian limited liability share capital company and a member firm of the KPMG network of independent member firms affiliated with KPMG International Cooperative (“KPMG International”), a Swiss entity. All rights reserved.

26 2016: The way ahead
Background
Aim of the report and information usedSince 1996, on an annual basis, KPMG Corporate Finance and the Italian Private Equity, Venture Capital and Private Debt Association (AIFI) have analysed the performance of Private Equity and Venture Capital transactions undertaken by Private Equity Houses operating in Italy over the period analysed.
This survey shows, on an aggregate level, the performance of the Italian Private Equity and Venture Capital market in terms of Internal Rate of Return (IRR) over the years.
It is an empirical study of the current status of the Private Equity and Venture Capital sector. The analysis is based on the information provided by the Private Equity Houses.
This paper provides an in depth snapshot of the market performance in 2016, with references and comparisons to historical data where appropriate.
© 2017 KPMG Advisory S.p.A., an Italian limited liability share capital company and a member firm of the KPMG network of independent member firms affiliated with KPMG International Cooperative (“KPMG International”), a Swiss entity. All rights reserved.

2016: The way ahead 27
Definitions and glossary•AIFI – Italian Private Equity, Venture Capital and Private Debt
Association.
•Bank – institution where one can deposit and borrow money and take care of financial affairs; in this document, there is a particular focus on banks which make investments in equity.
•CAGR – Compound Annual Growth Rate.
•Cash In – total cash inflows since the beginning of the investment (e.g. dividends, partial and total divestments).
•Cash Out – total cash outflows since the beginning of the investment (e.g. initial investment, further investments, potential capital increases).
•Country Fund – an international player mainly focused on the Italian market.
•Development – type of investment in Venture Capital made during a company’s development stage, intended to expand an existing business.
•Early Stage – type of investment made during the early life of a company.
•IRR (Internal Rate of Return) – the annual compound return on an investment calculated on the basis of cash inflows and outflows.
•MBO/MBI (Management Buy Out/Management Buy In) – acquisitions resulting in a shareholding structure which includes a group of managers. The terms Buy Out or Buy In depend on whether the group of managers is internal or external to the target company.
•Pan-European Private Equity firm – players that manage or advise, through a network of advisors, a significant amount of money, mainly raised from European or worldwide mega funds, often without any specific geographical allocation.
•Private Equity and Venture Capital activities – sector of investments in equity made by professional investors.
•Replacement – type of investment in risk capital mainly made in order to replace minority shareholders.
•SGR – a management company authorised by Italian Law to solely manage closed-end funds.
© 2017 KPMG Advisory S.p.A., an Italian limited liability share capital company and a member firm of the KPMG network of independent member firms affiliated with KPMG International Cooperative (“KPMG International”), a Swiss entity. All rights reserved.

28 2016: The way ahead
MethodologyThe analyses presented in this document and all the information and data used to calculate the market performance were provided to AIFI and KPMG Corporate Finance on a confidential basis; the data provided by Private Equity Houses have been integrated with publicly available information. All the information presented in this paper refers to aggregated data and/or data analysed by macro category.
Performance data are expressed in terms of Gross Pooled IRR, calculated using monthly flows regarding equity investments only. In particular, this return represents the weighted average performance of the total transactions carried out by Private Equity Houses and not an average of the performance of each Private Equity House. In practice, the Italian market is considered as a combined Private Equity House, where total return is given by the total amount of inflows and outflows, considered on a monthly basis, related to the monitored transactions.
It is worth noting that the following analyses consider solely the transactions for which all the details required for estimating the performance were available; consequently, transactions with just partial and/or incomplete data available were not considered.
© 2017 KPMG Advisory S.p.A., an Italian limited liability share capital company and a member firm of the KPMG network of independent member firms affiliated with KPMG International Cooperative (“KPMG International”), a Swiss entity. All rights reserved.
2016: The way ahead 29
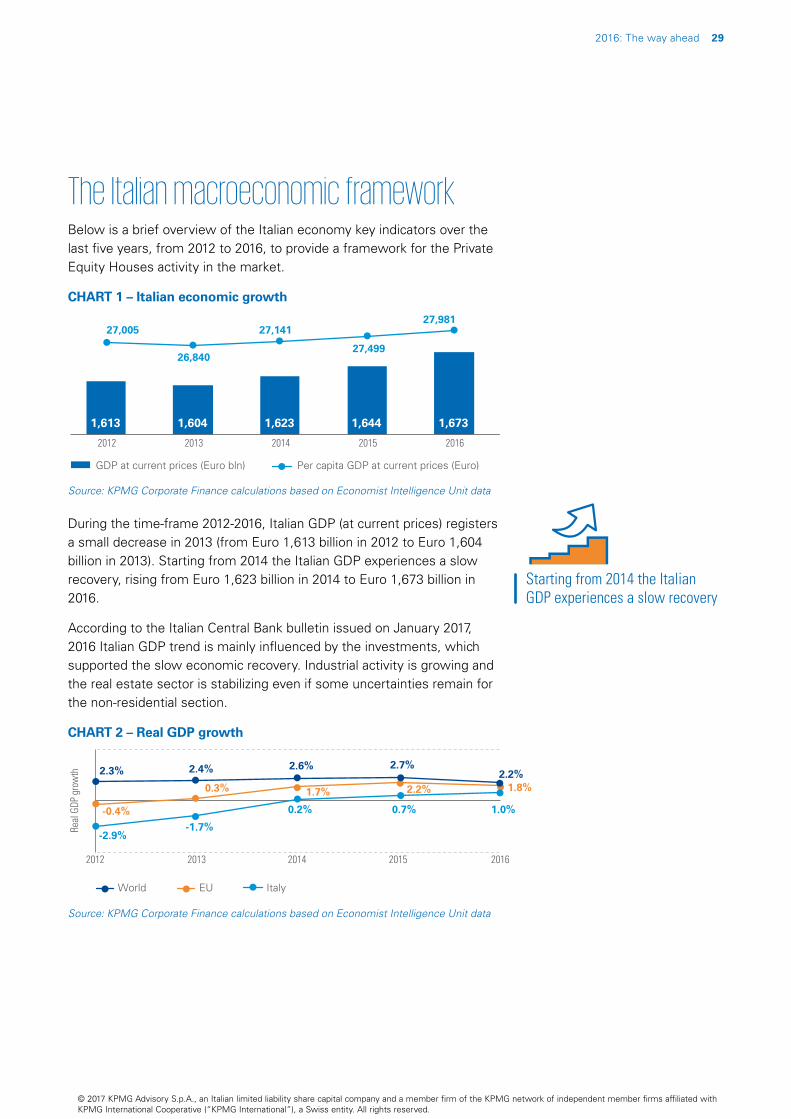
The Italian macroeconomic frameworkBelow is a brief overview of the Italian economy key indicators over the last five years, from 2012 to 2016, to provide a framework for the Private Equity Houses activity in the market.
CHART 1 – Italian economic growth
1,613
27,005
26,840
27,141
27,499
27,981
1,604 1,623 1,644 1,673
2012 2013 2014 2015 2016
GDP at current prices (Euro bln) Per capita GDP at current prices (Euro)
Source: KPMG Corporate Finance calculations based on Economist Intelligence Unit data
During the time-frame 2012-2016, Italian GDP (at current prices) registers a small decrease in 2013 (from Euro 1,613 billion in 2012 to Euro 1,604 billion in 2013). Starting from 2014 the Italian GDP experiences a slow recovery, rising from Euro 1,623 billion in 2014 to Euro 1,673 billion in 2016.
According to the Italian Central Bank bulletin issued on January 2017, 2016 Italian GDP trend is mainly influenced by the investments, which supported the slow economic recovery. Industrial activity is growing and the real estate sector is stabilizing even if some uncertainties remain for the non-residential section.
CHART 2 – Real GDP growth
Real
GDP
gro
wth 2.3% 2.4% 2.6% 2.7%
2.2%
-0.4%
0.3% 1.7% 2.2% 1.8%
-2.9%-1.7%
0.2% 0.7% 1.0%
2012 2013 2014 2015 2016
World EU Italy
Source: KPMG Corporate Finance calculations based on Economist Intelligence Unit data
Starting from 2014 the Italian GDP experiences a slow recovery
© 2017 KPMG Advisory S.p.A., an Italian limited liability share capital company and a member firm of the KPMG network of independent member firms affiliated with KPMG International Cooperative (“KPMG International”), a Swiss entity. All rights reserved.
30 2016: The way ahead
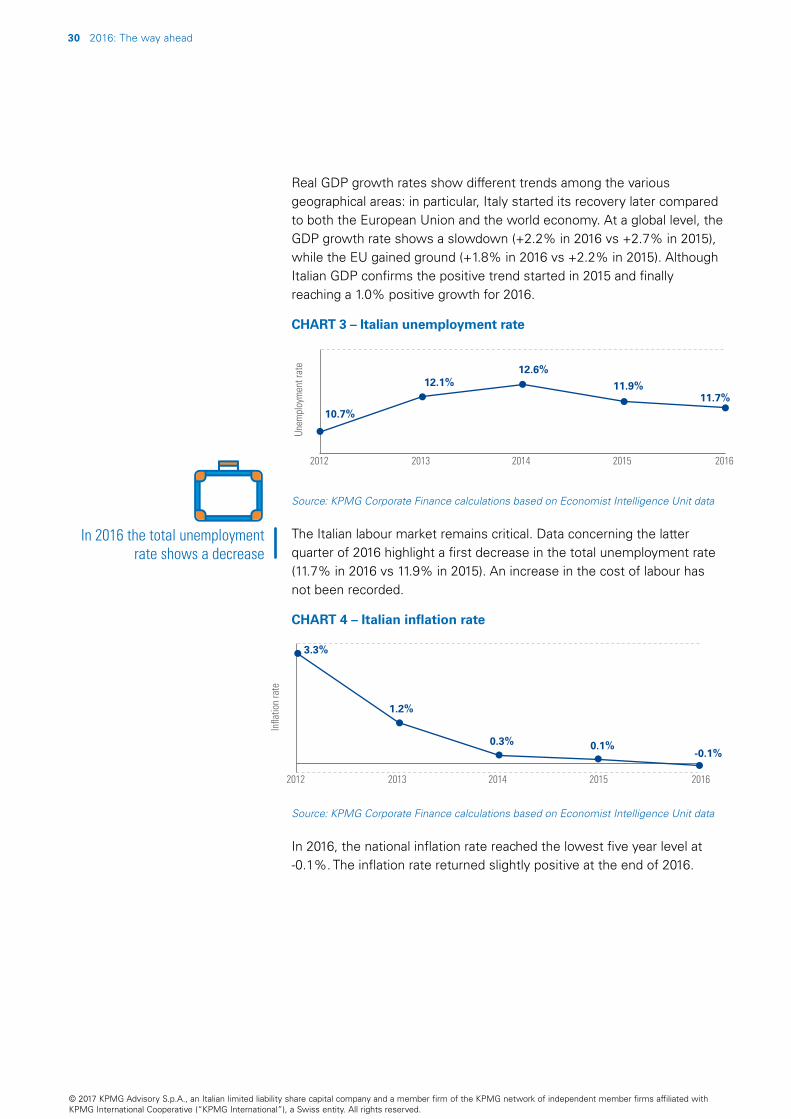
Real GDP growth rates show different trends among the various geographical areas: in particular, Italy started its recovery later compared to both the European Union and the world economy. At a global level, the GDP growth rate shows a slowdown (+2.2% in 2016 vs +2.7% in 2015), while the EU gained ground (+1.8% in 2016 vs +2.2% in 2015). Although Italian GDP confirms the positive trend started in 2015 and finally reaching a 1.0% positive growth for 2016.
CHART 3 – Italian unemployment rate
Unem
ploy
men
t rat
e
2012 2013 2014 2015 2016
10.7%
12.1%12.6%
11.9%11.7%
Source: KPMG Corporate Finance calculations based on Economist Intelligence Unit data
The Italian labour market remains critical. Data concerning the latter quarter of 2016 highlight a first decrease in the total unemployment rate (11.7% in 2016 vs 11.9% in 2015). An increase in the cost of labour has not been recorded.
CHART 4 – Italian inflation rate
2012 2013 2014 2015 2016
3.3%
1.2%
0.3% 0.1%-0.1%
Source: KPMG Corporate Finance calculations based on Economist Intelligence Unit data
In 2016, the national inflation rate reached the lowest five year level at -0.1%. The inflation rate returned slightly positive at the end of 2016.
In 2016 the total unemployment rate shows a decrease
© 2017 KPMG Advisory S.p.A., an Italian limited liability share capital company and a member firm of the KPMG network of independent member firms affiliated with KPMG International Cooperative (“KPMG International”), a Swiss entity. All rights reserved.

2016: The way ahead 31
Italian Private Equity and Venture Capital performance in 2016The following analyses cover only the performance (in terms of Gross Pooled IRR) of the investments made by Private Equity Houses during the year 2016.
Specifically, the analyses include two main performance indicators:
•‘From Inception’ Gross Pooled IRR (also defined, according to international standards, as ‘Gross Pooled IRR on Realised Investments’), showing the performance of divestments realised in the year, regardless of when the initial investment was made;
•‘By Horizon’ Gross Pooled IRR (also defined, according to international standards, as ‘Gross Pooled IRR on All Investments’), showing the performances of investments made during the analysed periods (1, 3, 5 and 10 years), regardless of whether they were divested or they are still in portfolio; for the investments still in the portfolios, operators’ year-end valuations are used.
How did 2016 perform?
‘From Inception’ Gross Pooled IRRWe measured the performance using all cash outflows (Cash Out) and inflows (Cash In) related to divestments realised during 2016; flows are considered on a pro quota basis for partial divestments.
This analysis, which focuses only on divestments realised during the year and excludes any valuation of investments still in portfolio, provides clear and objective results.
© 2017 KPMG Advisory S.p.A., an Italian limited liability share capital company and a member firm of the KPMG network of independent member firms affiliated with KPMG International Cooperative (“KPMG International”), a Swiss entity. All rights reserved.

32 2016: The way ahead
TAB. 1 – ‘From Inception’ main sample
2012 2013 2014 2015 2016
No. of PE included in the research panel 95 95 91 80 75
No. of PE presenting realised investments 36 55 41 43 40
No. of realised investments 'From Inception' 82 102 95 74 64
Average investment size (Euro mln) 10.2 20.7 17.7 18.7 23.6
Total Cash Out (Euro mln) 840 2,115 1,681 1,382 1,511
Total Cash In (Euro mln) 1,112 4,809 3,489 3,333 3,364
Average cash multiple 1.3x 2.3x 2.1x 2.4x 2.2x
The overall performance (in terms of Gross Pooled IRR) remains very positive, in line with the last three years results.
The number of recorded realised investments slightly decreases from 74 in 2015 to 64 in 2016. The number of Private Equity and Venture Capital Houses in the panel, also, decreases (from 43 in 2015 to 40 in 2016). Despite the reduction in the number of divestments, Total Cash In remains in line with the level of 2015 from Euro 3,333 million to Euro 3,364 million in 2016.
Total Cash Out increases from Euro 1,382 million in 2015 to Euro 1,511 million in 2016.
The average investment size grows from Euro 18.7 million in 2015 to Euro 23.6 million in 2016 and it can be considered as a positive result given the diminished number of recorded realized investments.
The average cash multiple (2.2x in 2016 vs 2.4x in 2015) remains stable at high levels, an additional evidence of the positivity of 2016 results.
Moreover, the Write-Offs’ incidence decreases both in terms of Cash Out and by volume.
TAB. 2 – ‘From Inception’ performance
2014 2015 2016
Yearly Pooled IRR 19.7% 17.8% 14.5%
Upper quarter (by performance) 53.5% 61.2% 36.6%
Upper quarter (by investment size) 22.5% 17.4% 15.1%
The Yearly Pooled IRR realized on divestments made in 2016 is 14.5% (17.8% in 2015). It is important to note that, during 2016, some larger deals included forms of investment different from pure equity. For the purpose of these analyses, coherently with previous years, it has been considered appropriate to take into consideration only the return obtained on the equity investment and not also returns from different investment instruments.
The overall performance, in terms of Gross Pooled IRR, remains very positive, in line with the last three
years results
The Yearly Pooled IRR realized on divestments made in 2016
14.5%
© 2017 KPMG Advisory S.p.A., an Italian limited liability share capital company and a member firm of the KPMG network of independent member firms affiliated with KPMG International Cooperative (“KPMG International”), a Swiss entity. All rights reserved.

2016: The way ahead 33
The analyses by upper quartile confirm that the whole market trend is influenced by the returns on larger deals. In particular, if returns in the upper quartile by performance (the cluster which includes the top 25% of transactions with the highest returns) show an IRR of 36.6%, the top quartile performance by investment size (the cluster which includes the top 25% of transactions with the highest investment amount) reflects an IRR of 15.1%.
TAB. 3 – Performance distribution by IRR class
Cash Out Cash In No. of transactions
2014 2015 2016 2014 2015 2016 2014 2015 2016
Write-Off 10.9% 7.5% 3.1% 0.8% 0.3% 0.0% 24 16 11
Negative 8.1% 8.3% 1.6% 1.4% 1.1% 0.2% 14 2 8
0% - 10% 12.6% 7.5% 31.7% 7.2% 4.2% 17.9% 23 18 21
10% - 20% 5.8% 20.8% 26.3% 5.5% 14.2% 20.2% 11 11 7
20% - 30% 1.1% 15.1% 17.7% 1.2% 23.1% 22.3% 4 7 9
30% - 40% 24.8% 4.5% 3.4% 20.5% 6.1% 4.8% 6 11 3
40% - 50% 0.4% 0.0% 2.7% 0.9% 0.0% 6.8% 1 0 1
50% - 100% 26.0% 33.8% 12.5% 51.4% 25.4% 25.4% 6 7 3
100% - 500% 10.3% 2.7% 1.0% 11.0% 13.1% 2.3% 6 2 1
Total (Euro mln) 1,681 1,382 1,511 3,489 3,333 3,364 95 74 64
The performance distribution by IRR classes (see Table 3) better explains the 2016 performance.
Negative transactions significantly rise by number (8 in 2016 vs 2 in 2015) but fall in terms of Cash Out (1.6% in 2016 vs 8.3% in 2015).
Low performance divestments (0%-10% IRR) register an increase by number (21 in 2016 vs 18 in 2015) and also by Cash Out incidence (31.7% in 2016 vs 7.5% in 2015).
The 10%-20% IRR cluster included 7 transactions, four less than the previous year. Cash Out incidence experiences a growth (26.3% in 2016 vs 20.8% in 2015).
Divestments with performances ranging from 20% to 30% rise both by number of transactions (9 in 2016 vs 7 in 2015) and by investment volumes (17.7% in 2016 vs 15.1% in 2015).
Divestments with IRR higher than 30% in 2016 decrease both by number (8 in 2016 vs 20 in 2015) and by Cash Out (19.6% in 2016 vs 40.9% in 2015).
© 2017 KPMG Advisory S.p.A., an Italian limited liability share capital company and a member firm of the KPMG network of independent member firms affiliated with KPMG International Cooperative (“KPMG International”), a Swiss entity. All rights reserved.

34 2016: The way ahead
In particular, the cluster ranging between 100-500% IRR shows a reduction in the amount invested (1.0% in 2016 vs 2.7 in 2015).
There is only 1 outstanding transaction (with IRR >100%) in 2016 sample (vs 2 in 2015).
CHART 5 – Breakdown by target turnover (incidence by number)
< 10 10-25 25-50 50-125 125-250 > 250
35%
18%12% 15%
9% 11%
37%
18%14% 16%
5%
11%
201620152014
45%
9%
16%13% 13%
5%
Turnover (Euro mln)
The breakdown by target turnover shows a prevailing incidence of divestments related to small-medium companies (with turnover of less than Euro 50 million), which represent 70% of the total sample (vs 64.9% in 2015). The incidence of transactions related to medium targets (with turnover ranging between Euro 50 million and Euro 250 million) remains stable compared to the previous year (25.0% in 2016 vs 24.3% in 2015), while the incidence of transactions related to larger companies (with a turnover higher than Euro 250 million) decreases (4.7% in 2016 vs 10.8% in 2015).
TAB. 4 – Transaction breakdown by target turnover (Yearly Pooled IRR)
Turnover (Euro mln) 2015 2016
No. IRR No. IRR
<50 48 22.0% 45 11.3%
50 - 250 18 13.4% 16 12.5%
>250 8 20.8% 3 17.9%
The breakdown by target turnover in terms of IRR highlights that the returns are positive even if lower compared to the previous analyses. Small companies obtain an IRR of 11.3% (vs 22.0% in 2015) while deals involving larger companies decrease from 20.8% to 17.9%.
Divestments mainly involved small-medium companies
© 2017 KPMG Advisory S.p.A., an Italian limited liability share capital company and a member firm of the KPMG network of independent member firms affiliated with KPMG International Cooperative (“KPMG International”), a Swiss entity. All rights reserved.

2016: The way ahead 35
CHART 6 – Transaction breakdown by financing stage (incidence by number)
Financing Stage
Early Stage Development Replacement MBO / MBI
2014 2015 2016
22% 23%
4%
51%
21%
35%
13%
32%33% 34%
3%
30%
Compared to last year’s results, operators’ interest in MBO/MBI transactions decreases. This cluster reduces (by number) from 51.4% of total divestments to 29.7%. Development transactions record an increase (34.4% in 2016 vs 23.0% in 2015) while Replacement transactions remain stable (3.1% in 2016 vs 4.1% in 2015). Deals related to Early Stage increase to 33%. It’s possible to observe that this year sample is substantially homogeneously distributed between Early Stage, Development and MBO/MBI transactions.
TAB. 5 – Transaction breakdown by financing stage (Yearly Pooled IRR)
Early Stage Development Replacement MBO/MBI
2015 2016 2015 2016 2015 2016 2015 2016
No. of transactions 16 21 17 22 3 2 38 19
Yearly Pooled IRR -17.6% 4.1% 10.3% 14.3% 51.7% 19.9% 18.0% 14.2%
IRR analyses by financing stage, as represented in Table 5, highlight that MBO/MBIs perform at 14.2% (vs 18.0% in 2015). The performance reduction is accompanied by the reduction in the number of deals that goes from 38 to 19. Replacement transactions are represented by only 2 deals (vs 3 in 2015) and obtain an IRR of 19.9% (vs 51.7 in 2015). The Development cluster registers an increase in the number of transactions (22 in 2016 vs 17 2015) and return (14.3% in 2016 vs 10.3% in 2015). Performances realized by Early Stage deals, historically characterized by high volatility, show a 4.1% IRR. It is a very positive result, after seven years of negative returns.
Divestments are substantially homogeneously distributed between Early Stage, Development and MBO/MBI transactions
Performances realized by Early Stage deals show a positive result, after seven years of negative returns
© 2017 KPMG Advisory S.p.A., an Italian limited liability share capital company and a member firm of the KPMG network of independent member firms affiliated with KPMG International Cooperative (“KPMG International”), a Swiss entity. All rights reserved.

36 2016: The way ahead
The impact of Write-Offs on 2016 performanceThis section provides a more detailed outline of Write-Offs recorded in 2016, in order to better understand their evolution and their incidence – by number and by investment size – across the various clusters analysed in the ‘From Inception’ analyses.
As already noted, both total Write-Offs (depreciation of 100% of the investment value) and partial Write-Offs are considered in the ‘From Inception’ analysis; for the purposes of this survey, partial Write-Offs refer to those transactions that are significantly written down (by more than 80% of the investment value).
CHART 7 – Write-Offs (by Cash Out and by number) in 2016
Totalsample
Divestments (No.) Cash Out (Euro mln)
64 1,511
Write-Offs Totalsample
Write-Offs
11
47
Among the 64 monitored deals in 2016, 11 can be classified as Write-Offs, of which 10 are total Write-Offs and 1 is a partial one, reflecting a sharp reduction with respect to 2015 when 24 Write-Offs (16 total and 8 partial) were recorded. The overall incidence of Write-Offs in the 2016 sample stands at about 27.2% by number (vs 21.6% in 2015) and at about 3.1% in terms of Cash Out (vs 7.5% in 2015).
CHART 8 – Incidence of Write-Offs in 2014-2016 (by number and by Cash Out)
2014 2015 2016
Incidence by number Incidence by Cash Out
22%
7%
3%
17%
11%
25%
© 2017 KPMG Advisory S.p.A., an Italian limited liability share capital company and a member firm of the KPMG network of independent member firms affiliated with KPMG International Cooperative (“KPMG International”), a Swiss entity. All rights reserved.

2016: The way ahead 37
During the time-frame 2014-2016 there is a reduction in the incidence of Write-Offs both by number (8% less than 2014) and by Cash Out (8% less than 2014).
The reduction in Write-Offs has a positive influence on the overall performance of the market.
CHART 9 – 2016 Write-Offs: breakdown by target size (incidence by number and by Cash Out)
<10 25-50
Incidence by number Incidence by Cash Out
82%
Sales (Euro mln)
18%
82%
18%
In 2016 Write-Offs are concentrated in two segments. The Small Companies cluster (turnover < Euro 10 million) accounts for 18% of total Cash Out and 82% of total Write-Offs by number. The Medium Companies cluster (turnover between Euro 125-250 million) accounts for 82% of Cash Out and 18% of Total Write-Offs in terms of number.
CHART 10 – 2016 Write-Offs: breakdown by financing stage (incidence by number and by Cash Out)
Early Stage MBO/MBI
Incidence by number Incidence by Cash Out
Financing stage
9%
25%
75%
91%
The Write-Off analyses based on the financing stage highlights a scenario where Write-Offs are concentrated in two clusters. The Early Stage cluster confirms the highest incidence in terms of number of deals reaching a 91%, while, in terms of Cash Out, MBO/MBI represents 75% of total Write-Offs.
During the time-frame 2014-2016 there is a reduction in the incidence of Write-Offs both by number and by Cash Out
© 2017 KPMG Advisory S.p.A., an Italian limited liability share capital company and a member firm of the KPMG network of independent member firms affiliated with KPMG International Cooperative (“KPMG International”), a Swiss entity. All rights reserved.

38 2016: The way ahead
To summarise, this year Write-Offs have a low impact on the overall sample market performance. The highest number of Write-Offs occurs among small companies, in their first years of activity. On the other hand, these kind of Write-Offs have a lower influence than MBO/MBI Write-Offs that involve a lower number of companies but have a greater impact on the performance because of the larger deal size.
Analysis of performance by Private Equity House categoryIn line with the previous years, specific analyses on performance by Fund category are provided. Such analyses provide a breakdown into three categories (Country Funds/SGR, Banks and Pan-European Private Equity), in order to analyse their specific investment volumes and performances in terms of Gross Pooled IRR ‘From Inception’.
TAB. 6 – ‘From Inception’ performance by fund category
No. of transactions Cash In (Euro mln) Cash Out (Euro mln) Yearly Pooled IRR
2015 2016 2015 2016 2015 2016 2015 2016
Country Funds/SGR 67 49 1,336 984 745 667 10.8% 7.0%
Banks 3 5 192 161 183 104 1.6% 10.6%
Pan-European PE firms 4 10 1,805 2,219 454 740 31.8% 19.1%
The ‘From Inception’ analyses by Fund category highlight that, in the Italian Private Equity and Venture Capital market, Country Fund/SGR account for approximately 77% of all transactions.
In terms of investment volume, Pan-European PE Firms are the category that invest the most (more than 50% of total Cash Out), while Banks firms register a decrease of 40% in terms of Cash Out with respect to the previous year.
In terms of returns, Country Funds/SGR records a positive performance even if lower compared to 2015 returns (7.0% in 2016 vs 10.8% in 2015). Banks category registered an increase in their performance (10.6% in 2016 vs 1.6% in 2015). International funds achieve the highest returns in the sample, while experiencing a decrease with respect to 2015 (19.1% in 2016 vs 31.8% in 2015).
In 2016 Write-Offs have a low impact on the overall sample
market performance
Transactions carried out by Country Fund/SGR
77%
© 2017 KPMG Advisory S.p.A., an Italian limited liability share capital company and a member firm of the KPMG network of independent member firms affiliated with KPMG International Cooperative (“KPMG International”), a Swiss entity. All rights reserved.

2016: The way ahead 39
1, 3, 5 and 10 year performance
‘By Horizon’ Gross Pooled IRR These analyses consider all the investments made in the reference time-frames (1, 3, 5 and 10 years), regardless of whether these investments have been (partially or totally) divested or if they are still in PE’s portfolios (‘Gross Pooled IRR on All Investments’).
Concerning investments still in portfolio, it is worth noting that the year-end valuation has been provided directly by the Private Equity Houses; furthermore it should be pointed out that the ‘By Horizon’ figures are subject to the ‘average rolling’ method relating to the specific time-frames.
• 1 YR: Gross Pooled IRR analysed in 2016
• 3 YR: Gross Pooled IRR analysed in the period from 2014 to 2016
• 5 YR: Gross Pooled IRR analysed in the period from 2012 to 2016
• 10 YR: Gross Pooled IRR analysed in the period from 2007 to 2016.
TAB. 7 – ‘By Horizon’ main sample
2016 1YR 3YR 5YR 10YR
Active PE houses 39 60 82 123
No. of transactions 88 267 530 1,109
of which: - realised investments 1 11 87 408
- investments still in portfolio 87 256 443 701
Average investment size (Euro mln) 26.8 20.4 18.0 18.5
Total Cash Out (Euro mln) 2,356 5,450 9,537 20,475
Total Cash In (Euro mln) 2,356 5,585 11,963 27,490
Average (implied) cash multiple 1.0x 1.0x 1.3x 1.3x
The structure and composition of the samples (in terms of number of active Private Equity Houses involved, number of transactions and investment volumes), across the different time-frames taken into consideration, should ensure reliable and statistically significant analyses.
Focusing on the 1YR horizon (which includes the investments made during 2016), it is possible to observe 88 new investments in 2016 vs 80 in 2015. The related investment size increases by about 30% (Euro 26.8 million in 2016 vs Euro 20.6 million in 2015); the general increase can possibly be explained by the presence of some large deals made by a small number of larger players in the market. The average investment size for all the horizons considered increases.
The average investment size for all the horizons considered increases
© 2017 KPMG Advisory S.p.A., an Italian limited liability share capital company and a member firm of the KPMG network of independent member firms affiliated with KPMG International Cooperative (“KPMG International”), a Swiss entity. All rights reserved.
40 2016: The way ahead
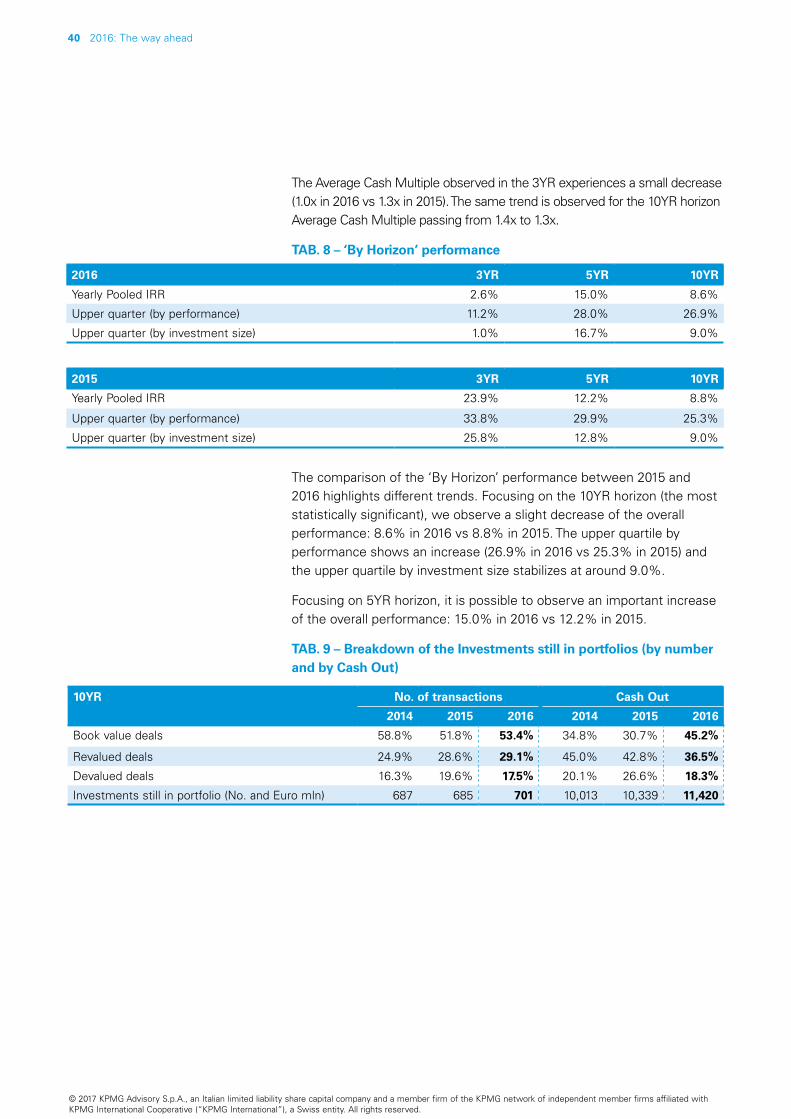
The Average Cash Multiple observed in the 3YR experiences a small decrease (1.0x in 2016 vs 1.3x in 2015). The same trend is observed for the 10YR horizon Average Cash Multiple passing from 1.4x to 1.3x.
TAB. 8 – ‘By Horizon’ performance
2016 3YR 5YR 10YR
Yearly Pooled IRR 2.6% 15.0% 8.6%
Upper quarter (by performance) 11.2% 28.0% 26.9%
Upper quarter (by investment size) 1.0% 16.7% 9.0%
2015 3YR 5YR 10YR
Yearly Pooled IRR 23.9% 12.2% 8.8%
Upper quarter (by performance) 33.8% 29.9% 25.3%
Upper quarter (by investment size) 25.8% 12.8% 9.0%
The comparison of the ‘By Horizon’ performance between 2015 and 2016 highlights different trends. Focusing on the 10YR horizon (the most statistically significant), we observe a slight decrease of the overall performance: 8.6% in 2016 vs 8.8% in 2015. The upper quartile by performance shows an increase (26.9% in 2016 vs 25.3% in 2015) and the upper quartile by investment size stabilizes at around 9.0%.
Focusing on 5YR horizon, it is possible to observe an important increase of the overall performance: 15.0% in 2016 vs 12.2% in 2015.
TAB. 9 – Breakdown of the Investments still in portfolios (by number and by Cash Out)
10YR No. of transactions Cash Out
2014 2015 2016 2014 2015 2016
Book value deals 58.8% 51.8% 53.4% 34.8% 30.7% 45.2%
Revalued deals 24.9% 28.6% 29.1% 45.0% 42.8% 36.5%
Devalued deals 16.3% 19.6% 17.5% 20.1% 26.6% 18.3%
Investments still in portfolio (No. and Euro mln) 687 685 701 10,013 10,339 11,420
© 2017 KPMG Advisory S.p.A., an Italian limited liability share capital company and a member firm of the KPMG network of independent member firms affiliated with KPMG International Cooperative (“KPMG International”), a Swiss entity. All rights reserved.

2016: The way ahead 41
Focusing on the longest and most statistically significant time-frame (10YR), the analyses on the investments still in portfolios confirm the consolidated practice followed by many Private Equity Houses of valuing their investments still in portfolio at cost: indeed we observe a slight increase both in terms of number and Cash Out incidence (respectively 53.4% in 2016 vs 51.8% in 2015 and 45.2% in 2016 vs 30.7% in 2015).
The revalued deals show an increase by number (29.1% in 2016 vs 28.6% in 2015) and a reduction by Cash Out (36.5% in 2016 vs 42.8% in 2015).
Depreciated deals decrease by number (17.5% in 2016 vs 19.6% in 2015) and most decisively in terms of Cash Out (18.3% in 2016 vs 26.6% in 2015). It should be pointed out that the depreciated deals cluster does not include Write-Offs (neither partial, nor total), as they are considered, for the purpose of these analyses, within realised investments.
Focusing on the 10YR horizon, the most statistically significant, we observe a slight decrease of the overall performance
© 2017 KPMG Advisory S.p.A., an Italian limited liability share capital company and a member firm of the KPMG network of independent member firms affiliated with KPMG International Cooperative (“KPMG International”), a Swiss entity. All rights reserved.

42 2016: The way ahead
AppendixThe following tables provide further analysis on the ‘From Inception’ sample.
TAB. 10 – IRR ‘From Inception’ distribution by way out
Trade Sale
2015 2016
No. of transactions 56 53
Yearly Pooled IRR 20.3% 15.0%
Note: the table shows the returns obtained by 2015 and 2016 divestments without taking into consideration the impact of Write-Offs.
TAB. 11 – 2016 IRR ‘From Inception’ distribution by time gap between first investment and divestment
2016 < 2 2-3 3-4 4-5 5-7 > 7
No. of transactions 3 5 11 8 16 21
Yearly Pooled IRR 125.4% 16.6% 27.7% 27.4% 16.5% 1.2%
TAB. 12 – 2016 IRR ‘From Inception’ distribution by target industry
Industry No. of transactions Yearly Pooled IRR Cash In (Euro mln) Cash Out (Euro mln)
Food&Beverage 2 18.2% 66 35
Industrial manufacturing and similar 13 33.7% 987 284
Energy and Chemicals 5 9.8% 220 168
ICT 11 17.5% 722 331
Consumer goods 6 7.5% 542 283
Biotechnology 3 Negative 1 3
Financial Institutions 4 17.4% 98 44
Pharma-Healthcare 5 22.2% 395 145
Transportation-Infrastructures 1 14.9% 35 18
Other 14 5.3% 299 202
TAB. 13 – 2015 IRR ‘From Inception’ distribution by stake held
Stake held No. of transactions Yearly Pooled IRR Cash In (Euro mln) Cash Out (Euro mln)
<5% 2 Negative 1 7
5% - 10% 6 1.6% 22 19
10% - 25% 23 8.1% 456 250
25% - 50% 19 13.2% 1,259 533
>50% 14 23.1% 1,626 703
© 2017 KPMG Advisory S.p.A., an Italian limited liability share capital company and a member firm of the KPMG network of independent member firms affiliated with KPMG International Cooperative (“KPMG International”), a Swiss entity. All rights reserved.

© 2017 KPMG Advisory S.p.A., an Italian limited liability share capital company and a member firm of the KPMG network of independent member firms affiliated with KPMG International Cooperative (“KPMG International”), a Swiss entity. All rights reserved.

Le informazioni contenute in questo rapporto sono tratte da fonti pubblicamente disponibili. KPMG Advisory S.p.A. non attesta né garantisce in nessun modo l’accuratezza, la completezza e la correttezza delle informazioni ivi contenute. Tali informazioni vengono analizzate e presentate unicamente allo scopo di descrivere alcune dinamiche del mercato italiano del private equity e venture capital. KPMG Advisory S.p.A. non si assume alcuna responsabilità per la perdita o i danni che potrebbero derivare dall’uso improprio di questo rapporto o delle informazioni ivi contenute.
The information contained in this report comes from publicly available sources. KPMG Advisory S.p.A. does not in any way guarantee the accuracy, completeness and correctness of the information contained herein. This information is analysed and provided solely for the purposes of describing certain of the dynamics of the Italian private equity market. This report is not a sales offer nor a solicitation for purchases of any type. KPMG Advisory S.p.A. will not accept any responsibility for loss and damage deriving from the improper use of this report or the information contained herein.
© 2017 KPMG Advisory S.p.A. è una società per azioni di diritto italiano e fa parte del network KPMG di entità indipendenti affiliate a KPMG International Cooperative (“KPMG International”), entità di diritto svizzero. Tutti i diritti riservati.Denominazione e logo KPMG sono marchi e segni distintivi di KPMG International.
Stampato in ItaliaData di pubblicazione: luglio 2017
© 2017 KPMG Advisory S.p.A., an Italian limited liability share capital company and a member firm of the KPMG network of independent member firms affiliated with KPMG International Cooperative (“KPMG International”), a Swiss entity. All rights reserved.The KPMG name, logo are registered trademarks or trademarks of KPMG International.
Printed in ItalyPublication date: July 2017
Grafica: New! srl - www.newadv.com
kpmg.com/it kpmg.com/app
Maximilian P. FianiPartnerKPMG Corporate FinanceTel. +39 02 6764 3647Email: [email protected]
Paolo MascarettiPartnerHead of KPMG Private Equity Line of BusinessTel. +39 02 6764 3776Email: [email protected]
Matteo LandriscinaExecutiveKPMG Corporate FinanceTel: +39 02 676431Email: [email protected]
Contacts