Embed Size (px)
Citation preview

Medtech AnalysisExecutive Insights
2016 Strategic Hospital Priorities StudyThe 2016 Strategic Hospital Priorities Study examines the current direction of the industry and, in particular, how Medtech companies can capitalize on the many needs of hospital administrators.
2016 Strategic Hospital Priorities Study was conducted by Jonas Funk and Lucas Pain, Managing Directors in L.E.K. Consulting’s Medtech practice. Jonas and Lucas are based in Chicago.
For more information, contact: [email protected].

Medtech AnalysisExecutive Insights
While the healthcare market has steadily evolved since L.E.K. Consulting issued its first hospital study in 2010, many of the same trends remain in place, among them consolidation, non-acute care integration, accountability, technology enhancements and novel pricing schemes.
Hospital consolidation continued its steady pace over the past year, fueled by sustained competition, pressure on reimbursements, as well as the ongoing need to achieve scale. Roughly 100 deals took place during 2015, in line with 2014 M&A activity.
US hospital industry in 2016: Capitalizing on current trends
2016 Strategic Hospital Priorities Study
What are administrators’ chief priorities? t
Source: AHA, CMS National Health Expenditure Projections, Irving Levin and Associates, L.E.K. interviews and analysis
100100
88
107
90
72
0
20
40
60
80
100
120
140
Hospital mergers and acquisitions (2010-15E)
Num
ber
of d
eals
2010 15E14131211
80
60
40
20
0
100
Top 100systems
Othersystems
Total hospital spend by top 100 systems vs. other systems(2008-20F)
Perc
ent
2020F20122008
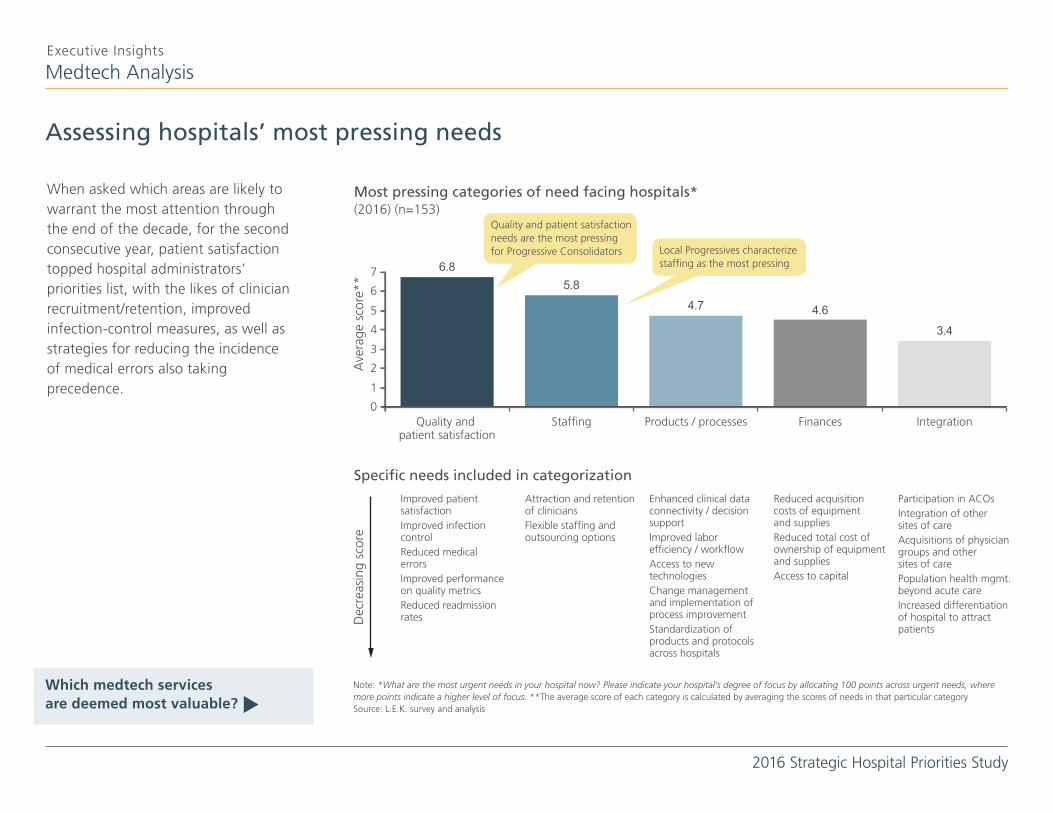
When asked which areas are likely to warrant the most attention through the end of the decade, for the second consecutive year, patient satisfaction topped hospital administrators’ priorities list, with the likes of clinician recruitment/retention, improved infection-control measures, as well as strategies for reducing the incidence of medical errors also taking precedence.
Assessing hospitals’ most pressing needs
Medtech AnalysisExecutive Insights
2016 Strategic Hospital Priorities Study
Which medtech services are deemed most valuable? t
Note: *What are the most urgent needs in your hospital now? Please indicate your hospital’s degree of focus by allocating 100 points across urgent needs, where more points indicate a higher level of focus. **The average score of each category is calculated by averaging the scores of needs in that particular category Source: L.E.K. survey and analysis
Quality and patient satisfaction
Staffing Products / processes
Local Progressives characterize staffing as the most pressing
Most pressing categories of need facing hospitals* (2016)�(n=153)
Specific needs included in categorization
Ave
rage
sco
re**
Dec
reas
ing
scor
e
3.4
4.64.7
5.86.87
6
5
4
3
2
1
0Finances Integration
Improved patient satisfactionImproved infection controlReduced medical errorsImproved performance on quality metricsReduced readmission rates
Attraction and retention of cliniciansFlexible staffing and outsourcing options
Reduced acquisition costs of equipment and suppliesReduced total cost of ownership of equipment and suppliesAccess to capital
Enhanced clinical data connectivity / decision supportImproved labor efficiency / workflowAccess to new technologiesChange management and implementation of process improvementStandardization of products and protocols across hospitals
Participation in ACOsIntegration of other sites of careAcquisitions of physician groups and other sites of carePopulation health mgmt. beyond acute careIncreased differentiation of hospital to attract patients
Quality and patient satisfaction needs are the most pressing for Progressive Consolidators

Over the past several years, hospital administrators have been increasingly interested in an expanded range of services that medtech firms provide. Among the offerings that continue to gain traction are equipment service/support, education/training and financial/capital services, as well as product acquisition and supply chain management.
Finding value in medtech services
Note: *How valuable are each of the following services that medtech companies could provide in addition to their products? Please rate each service on a scale of 1 to 7 in which”1” means “not at all valuable” and “7” means “very valuable.” **Respondents who selected “Don’t know” were excluded. 2014: n=146; 2016: n=153. Source: L.E.K. survey
Medtech AnalysisExecutive Insights
2016 Strategic Hospital Priorities Study
Is IT still in? t
Equipmentservice,support
and managedservices
Education,training
andcompliance
Productacquisitionand supply
chainmgmt.
ClinicalIT and
analytics
Operationsmgmt.
andefficiency
improvement
Financialand
capitalservices
Non-clinicalanalytics,servicesand IT
Diseasemgmt.services
Hospitalmgmt.,growthstrategy
and serviceoptimization
Outsourcednon-clinicalfunctions
Marketing,branding
andawareness
Outsourcedclinical /medicalservices
2014 mean 2016 mean
Hospital perceived value of potential medtech services*
Ave
rage
sco
re
Outsourced clinical and non-clinical functions also appear to be increasingly valuable to providers
Financial and capital services are increasingly valuable to providers
2
3
4
5
6

Hospital administrators continue to view IT as an investment priority, emphasizing in particular the need for efficient data collection/transfer in order to improve both clinical and non-clinical decision-making. Spending on facilities and labor/human resources has also been robust, and has increased across other categories as well relative to past years.
Continuous focus on IT spend
Medtech AnalysisExecutive Insights
2016 Strategic Hospital Priorities Study
Which hospital systems are taking the lead? t
Note: *Please discuss your hospital’s spending priorities in the following categories. We would like to hear your views on 2016. Please rate the priority of each of the following areas on a scale from 1 to 7 in which “1” means “will definitely reduce total spending,” “4” means “will keep spending unchanged” and ”7” means “will definitely increase total spending.” Respondents who answered “Do not know” were excluded from the analysis. n=13 Source: L.E.K. interviews, survey and analysis
Informationtechnology
Facilities Labor /human
resources
High-risktherapeutic
devices
Drugs /pharma-ceuticals
Medicalcapital
equipment
Low-risktherapeutic
devices
Medicaland surgicaldisposables
Diagnosticconsumables
Definitely reduce spendingDefinitely increase spending 2016 mean
Spending priorities (2016)*
Perc
ent
of r
espo
nden
ts
60
80
40
20
0
20
40
60

To help gauge the viability of hospital system participants, L.E.K. uses a segmentation scheme consisting of four main groups —”local progressives,” “progressive consolidators,” “local traditionalists” and “hospital aggregators” — taking into account factors such as level of integration, accountability and M&A activity, as well as degree of consolidation and benefits of scale.
Gauging hospital system growth: Progressives leading the way…
Medtech AnalysisExecutive Insights
2016 Strategic Hospital Priorities Study
How is consolidation impacting non-progressives? t
Limited consolidation and smaller in system scale, but have generally accepted greater accountability of care and active integration with non-acute
Includes large academic medical centers (ACMs) and represents 35% of hospital spending but only 13% of hospitals
Systems with limited consolidation and integration; largely includes stand-alone hospitals
Represents 41% of hospitals but only 26% of total spending
More centralized supply chain functions across large systems and taking steps to be more
accountable
Includes large systems that are not limited to a local catchment area and represents 35% of
spending (vs. 33% of hospitals)
Aggregated hospitals to gain scale / leverage with payers and suppliers, but still have some
way to go in integrating with non-acute
Includes large for-profit systems and represents 5% of hospital spending
Highly integrated hospital systems
with high degree of accountability
Less integrated hospital systems with low degree
of accountability
Larger hospital systems / highly
consolidated
Smaller hospital systems with limited
consolidation
“Local Progressives”
“Local Traditionalists”
“Progressive Consolidators”
“Hospital Aggregators”
Inte
gra
tio
n
Acc
ou
nta
bili
ty
Consolidation & Supply Chain
Source: L.E.K. research and analysis

We see progressives maintaining their strong growth trajectory in the years ahead, with progressive consolidators making this shift and benefiting from advanced market-share gains through 2020. Some hospital aggregators will begin taking on more accountability and integration and look more like progressive consolidators in the process; meanwhile, many local traditionalists will continue to be targeted for acquisition, particularly by progressive consolidators.
…and are gaining overall share
Medtech AnalysisExecutive Insights
2016 Strategic Hospital Priorities Study
Which are increasing in revenue and spending? t
Source: L.E.K. interviews and analysis
High
Low
Larger / more consolidated
Smaller / less consolidated
Inte
gra
tio
n
Acc
ou
nta
bili
tyConsolidation & Supply Chain
High
Low
Larger / more consolidated
Smaller / less consolidated
Inte
gra
tio
n
Acc
ou
nta
bili
ty
Consolidation & Supply Chain
Hospital landscape in 2016
Hospital landscape in 2020
Local traditionalists
Hospital aggregators
Hospital aggregators
Local traditionalists
Progressive consolidators
Local progressives
Local progressives
Progressive consolidators

Additionally, this year’s study found that more than two-thirds of local progressives, as well as some 60% of progressive consolidators, reported strong year-over-year revenue gains; by comparison, less than 40% of local traditionalists and hospital aggregators registered significant revenue growth during the past 12 months.
Progressives are seeing faster revenue growth. However, spending among progressives is also increasing at a disproportionately higher rate than their non-progressive counterparts.
Progressive revenues on the rise
Medtech AnalysisExecutive Insights
2016 Strategic Hospital Priorities Study
Why are progressives more likely to outsource? t
Note:*How did your hospital’s total revenue in FY2015 compare with FY2014? **Includes participants who indicated their revenues experienced significant or moderate increases in the past year. ^How did your total spending (operational and capital expenditures) in 2015 compare with the prior year?; n=153. ^^Includes participants who indicated their revenues experienced significant or moderate increases in the past year. n=153 Source: L.E.K. survey and analysis
Hospitals with significant revenue increases over past year*(2016)
Hospitals with significant spending increases over past year^ (2016)
Perc
ent
of r
espo
nden
ts**
Perc
ent
of r
espo
nden
ts^
^
Progressive consolidator Hospital aggregatorLocal progressive Local traditionalist
37
60
38
67
0
10
20
30
40
50
60
70
4
39
21
36
0
10
20
30
40
50
60
70

Given the increased focus on integration and accountability, it’s perhaps no surprise that a growing number of progressive health systems appear willing to take advantage of third-party services in order to help address their most pressing needs. This is particularly relevant for medtechs looking to broaden their base of business, as it allows them to properly identify players that are more likely to become longer-term partners (as opposed to those more focused on transactional relationships and relative pricing).
Forging progressive partnerships
Medtech AnalysisExecutive Insights
2016 Strategic Hospital Priorities Study
Is outcome-based pricing taking off? t
Note: *How are you addressing the most pressing needs that you identified for your hospital? Respondents who selected “Do not know” or “No change needed” were excluded from the analysis. n=153. Source: L.E.K. survey and analysis
Local progressive Progressive consolidator Hospital aggregator Local traditionalist
Likelihood of working with outside service providers to address hospital needs*(2016)
Perc
ent
of r
espo
nden
ts
20
30
40
50

Increased awareness of/interest in novel pricing models among hospital administrators represents yet another emerging trend. Our 2016 study noted growing interest in outcome-based pricing across most of the medtech product spectrum, and in particular around higher-cost items such as medical capital equipment, high-risk therapeutic apparatus as well as medical/surgical disposables. That said, many medtechs have indicated that hospitals cannot always accommodate or accept these models when they are offered.
Alternative pricing continues to gain interest
Medtech AnalysisExecutive Insights
2016 Strategic Hospital Priorities Study
Which players are purchasing direct? t
Note: *To what extent do you desire outcome-based pricing models with suppliers for the following medtech product categories? What are the key barriers to more outcome-based pricing models that medtech suppliers can impact? Respondents who answered “Do not know” or “Do not desire outcome-based pricing” were excluded from the analysis. 2015: n=153; 2016: n=153. Source: L.E.K. survey and analysis.
Informationtechnology
Low-risktherapeutic
medical devices
Diagnosticconsumables
Medical andsurgical
disposables
High-risktherapeutic
devices
Medical capitalequipment
Desired outcome-based pricing in hospitals*
Perc
ent
of r
espo
nden
ts
No interestExtremely interested 2015 mean2016 mean
60
80
40
20
0
20
40

Medtech AnalysisExecutive Insights
2016 Strategic Hospital Priorities Study
Additionally, the L.E.K. survey revealed a growing number of hospital administrators continuing to embrace the idea of purchasing direct from manufacturers, rather than going through traditional GPO channels. Once again progressives are taking the lead, with the largest progressive systems engaging in the highest level of direct activity, using novel pricing models beyond traditional GPOs.
Hospital purchasing: The direct effect
What’s the outlook for outsourcing? t
Note: *For any individual product category in which you currently use GPOs, how receptive would your organization be to bypassing GPOs in favor of working directly with a manufacturer to secure competitive pricing? **Respondents who do not purchase products from GPOs or do not know are excluded from the analysis. ^Includes participants who rated receptivity as 6 or 7. n=153. Source: L.E.K. survey and analysis
Receptivity to bypassing GPO and purchasing directly from manufacturers*(2016) (n=153)**
Perc
ent
of r
espo
nden
ts
Non-Progressive
Progressive
Percent of respondents highly receptive to bypassing GPO^
16%
32%
10%
25%
8%
23%
10%
24%
16%
25%
12%
32%
Progressive hospital systems appear more receptive to bypassing GPOs
Medicaland surgicaldisposables
OtherDiagnosticconsumables
Low-risktherapeutic
devices
High-risktherapeutic
devices
Medicalcapital
equipment
No interestExtremely interested
80
60
40
20
0
20
40
60

Rounding out the top-trend list is the rise in outsourcing activity during the period 2015-16, covering the vast majority of hospital functions (and including longer-term outsourcing of non-core activities).
This mirrors the points above about a growing percentage of hospital administrators who are more receptive to working with external partners. Significantly, a number of those already using external partners indicated possibly increasing outsourced workflows by some five to six times current levels in the years ahead.
Outsourcing on the increase
Medtech AnalysisExecutive Insights
2016 Strategic Hospital Priorities Study
Next steps for medtechs? t
Note: *For the following services, please indicate what your current status for outsourcing is and how you expect this to change or stay the same in the next five years; Respondents who answered “Do not know” were excluded from the analysis. 2015: n=153; 2016: n=153. Source: L.E.K. survey and analysis
Outsourcing status and expectations*
Perc
ent
of r
espo
nden
ts
As compared to non-Progressive hospitals, a greater percentage of Progressives currently outsource and plan to continue outsourcing
Patie
nt b
illin
g /
colle
ctio
n se
rvic
e
IT m
aint
enan
ce
Clin
ical
eng
inee
ring
Reve
nue
cycl
em
anag
emen
t
Lab
serv
ices
Acc
ount
ing
/ba
ck-o
ffic
e se
rvic
es
Supp
ly c
hain
man
agem
ent
Phar
mac
y se
rvic
es
Radi
olog
y st
affin
g
Inve
ntor
ym
anag
emen
t
Hos
pita
list
staf
fing
Emer
genc
yde
part
men
t st
affin
g
Cor
e m
easu
rere
port
ing
Infe
ctio
nm
anag
emen
t
Dia
gnos
tic im
agin
g
Clin
ical
dep
artm
ent
man
agem
ent
Nur
ses
/ sur
gica
lsc
rub
staf
fing
Would consider outsourcing in next five years
Already outsource and plan to continue to outsource for next five years
2015 respondents who outsourced and planned to continue outsourcing for the next five years
0
20
40
60

We see substantial outsourced opportunity ahead for independent providers of data, technology and other value-add hospital services. This bodes well for medtech firms, many of which have begun to expand their breadth of services in order to provide key players with a broader base of connected solutions.
To capitalize on these prospects, medtech leaders should consider a number of focal points, including ways to target emerging customer segments, and gain insight into the various provider segments (with special emphasis on the needs of larger, progressive health systems), while also considering M&A to access potentially high-growth areas, among other strategies.
For medtechs, continued change is required
Medtech AnalysisExecutive Insights
2016 Strategic Hospital Priorities Study
About the authors tMedtech company focus areas
Provider landscape evolution Customer segmentation and needs
Optimized commercial models
How is provider evolution (e.g., consolidating, integrating, taking on accountability, supply chain centralization) impacting medtechs?
What customer segments are emerging and which will “win” in the future?
What are their needs and which can be addressed by medtechs?
How should Medtechs transform commercial models? Increase participation in alternate sites? Engage with distributors and GPOs?
What capabilities and resources are needed to align with the changes in decision-making?
Value articulation and outcome-based pricing
Service / solution expansion opportunities
M&A opportunities
How can Medtechs define / quantify the value that they bring to customers?
What tools can be used to communicate the benefits?
How to develop, offer, manage and track gain-sharing programs
How to transform from “products” to solutions that better address customers’ needs?
Where / how can data connectivity increase the value of devices?
How to define and monetize new services and solutions?
In which areas should Medtechs expand via acquisition?
What portfolio additions provide the best fit for providing meaningful solutions?
Which specific targets offer the best fit and promise for profitable growth?

Medtech AnalysisExecutive Insights
About L.E.K. Consulting
L.E.K. Consulting is a global management consulting firm that uses deep industry expertise and rigorous analysis to help business leaders achieve practical results with real impact. We are uncompromising in our approach to helping clients consistently make better decisions, deliver improved business performance and create greater shareholder returns. The firm advises and supports global companies that are leaders in their industries — including the largest private and public sector organizations, private equity firms and emerging entrepreneurial businesses. Founded more than 30 years ago, L.E.K. employs more than 1,200 professionals across the Americas, Asia-Pacific and Europe. For more information, go to www.lek.com.
L.E.K. Consulting is a registered trademark of L.E.K. Consulting LLC. All other products and brands mentioned in this document are properties of their respective owners. © 2016 L.E.K. Consulting LLC
About the AuthorsLucas Pain is a Managing Director and Partner in L.E.K. Consulting’s Chicago office. He has more than 16 years of experience directing consulting engagements focused on growth strategy across a broad range of industries, including energy & environment, medtech, building and construction, healthcare services, and private equity.
Jonas Funk is a Managing Director and Partner in L.E.K. Consulting’s Chicago office. He has more than 17 years of experience at L.E.K. and has directed hundreds of consulting engagements, primarily focused on growth strategy and mergers and acquisitions support in the medtech and life sciences industries.