Embed Size (px)
Citation preview

2016 Stock Market Outlook
Investing in an era of biflation
Strategist Hak-kyun Kim+822-768-4164 [email protected]

[Summary]
I. Corporate earnings
II. Era of biflation
III. Restructuring overview
IV. Shareholder return policies to provide support
V. KOSPI target and top picks
…………………………………………… 3
…………………………………… 5
……………………………………… 9
………………………………… 22
……… 32
…………………………… 36
CONTENTS

2016 Stock Market Outlook 3
[Summary] DM-driven bull market
DM stock markets have outperformed their EM counterparts since 2011
Note: Based on the MSCI series Source: Bloomberg, KDB Daewoo Securities Research
-110
-60
-10
40
90
140
88 89 90 91 92 93 94 95 96 97 98 99 00 01 02 03 04 05 06 07 08 09 10 11 12 13 14 15
(p) DM era DM eraEM era EM era(2011-)(2002-11)(1995-2001)(1988-94)
S&L crisis Mexicanpesocrisis
Asianfinancial
crisis
Russian moratorium
China joinsWTO
LehmanBrothers
bankruptcy
Chinesegrowth
rate peaks
China's CNY4tr program
US housingprice peaks
US shale oilrevolution

2016 Stock Market Outlook 4
[Summary] KOSPI range-bound since 2011
Longest period of range-bound movement in history
Source: KDB Daewoo Securities Research
0
500
1,000
1,500
2,000
2,500
3,000
85 90 95 00 05 10 15
(p)
1st bull market 1st bear market 2nd bull market 2nd bear market3rd bullmarket
4th bull market
3rd bearmarket
4th bear market10/01-4/027 months
KOSPI: +100%(468→937p)
5th bull market
5th bear market
5/85-3/8947 months
KOSPI: +666%(131→1,007p)
4/89-8/9229 months
KOSPI: -54%(1,007→549p)
9/92-10/9426 months
KOSPI:+148%
(459→1,138p)
11/94-6/9844 months
KOSPI: -758%(1,138→280p)
11/94-6/9844 monthsKOSPI: -758%(1,138→280p)
1/00-9/0121 months
KOSPI:-55%(1,059→468p)
5/02-3/0311 months
KOSPI: -45%(937→515p)
4/03-10/0755 months
KOSPI: +300%(515→2,064p)
11/07-10/0812 months
KOSPI: -54%(2,064→938p)
6th bull market
11/08-5/1130 months
KOSPI: +137%(938→2,228p)
Longest period of range-bound
movement
6/11-53 months

2016 Stock Market Outlook 5
Corporate earnings expected to reach a historic high
• KOSPI has been range-bound for over four years, failing time and again to surpass the historic high of 2,228p recorded in May 2011
• However, the annual average KOSPI level has reached a historic high of 2,016p (as of end-October), exceeding the 2,000p mark for the first time
• This is attributable to corporate earnings growth
• Listed firms’ net profit in 2015, despite likely earnings shocks in 4Q, is projected to be close to the 2010level of KRW91tr
• YTD net profit as of 3Q15 is estimated at KRW77tr (including KEPCO’s property disposal gains of KRW8tr)
I. Corporate earnings
Average KOSPI level to mark a historic high
91.3 97.9
106.5
1,983 2,016
0
200
400
600
800
1,000
1,200
1,400
1,600
1,800
2,000
2,200
-40
-20
0
20
40
60
80
100
120
140
80 81 82 83 84 85 86 87 88 89 90 91 92 93 94 95 96 97 98 99 00 01 02 03 04 05 06 07 08 09 10 11 12 13 14 15 16
Net profit of listed companies (L)
Annual KOSPI avg. (R)
(KRWtr) (p)
Note: 2015 and 2016 earnings forecasts are based on the market consensus Source: WISEfn, KDB Daewoo Securities Research

2016 Stock Market Outlook 6
Note: 2015 earnings forecasts are based on the market consensusSource: WISEfn, KDB Daewoo Securities Research
Net profit growth by sector (2015 vs. 2010)
• IT and auto earnings have grown sharply relative to 2010 levels
• Transportation/warehousing chemicals, steel, and shipbuilding sectors have suffered steep declines
I. Corporate earnings
IT and auto pushed up overall corporate earnings; China-oriented sectors suffered
11.7
6.7
2.6
-1.2 -3.2
-4.9
-11.7 -15
-10
-5
0
5
10
15
Utilities
Electronics
Auto
Distribution
Financials
Construction
Non-ferrous
Insurance
Service
Securities
Medical equip.
Pharmaceutical
Telco
Paper/lumber
Textiles/apparel
Machinery
F&B
Transport/storage
Chem
icals
Metal
Shipbuilding
(KRWtr)
Including KEPCO'sreal estate sale
China-oriented industries'massive profit deterioration
IT and autos toserve as pillars

2016 Stock Market Outlook 7
Source: WISEfn, KDB Daewoo Securities Research
Major sectors’ P/Bs (as of end-October) Changes in major sectors’ KOSPI weights
Note: Based on 2015F earnings Source: WISEfn, KDB Daewoo Securities Research
• Composition of the KOSPI (i.e., sector weights) has sharply changed since May 2011; weights of materials and industrial materials have declined markedly, but weight of IT has increased
• Weights of new growth industries, including healthcare, leisure/entertainment, and cosmetics (consumer staples), have also expanded
• As of end-October 2015, the weight of materials/industrial materials (15.9%) is similar to the level of new growth industries (16.7%)
I. Corporate earnings
Materials/industrial materials and new growth industries have similar KOSPI weights
32.2
21.3
14.4 13.1
4.7
1.1 0.9
15.9
29.6
13.7
9.5 9.9
4.6 2.2
0
5
10
15
20
25
30
35
Industrials/materials
IT Financials
Auto
Consum
er staples
Healthcare
Leisure
5/11 10/15
(%)
New growth industries (cosmetics is included in
consumer staples)
0.71 0.71 0.86
1.11
2.43
2.90
3.54
0
1
2
3
4
Financials
Auto
Industrials/materials
IT Consum
er staples
Leisure
Healthcare
(x)

2016 Stock Market Outlook 8
Source: WISEfn, KDB Daewoo Securities Research
Discrepancy between materials/industrial materials earnings forecasts and actual results2016 net profit growth outlook by sector
Note: Gap between forecasts made at the end of preceding year and actual results (January-October estimates for 2015 data)Source: WISEfn, KDB Daewoo Securities Research
• In 2016, listed firms’ net profit is projected to increase 8.8% (market consensus)
• Materials and industrial materials sectors are expected to turn around; shipbuilding, steel, construction, energy, chemicals, and transportation are anticipated to account for 75% of net profit growth in 2016
• However, since 4Q12, these sectors been characterized by earnings shocks followed by too-hasty optimism
• End of earnings shocks vs. structural slowdown
I. Corporate earnings
2016 earnings growth will require turnaround by materials/industrial materials
-0.4
0.5
0.7
1.0
1.5
1.6
2.5
3.2
3.9
6.6
8.6
9.7
10.0
12.4
37.7
-10 0 10 20 30 40 50
Securities (-2)
Retail (3)
Leisure (10)
Media (3)
Healthcare (24)
Insurance (5)
Consumer staples (8)
Banks (5)
IT (2)
Transport (350)
Energy/chemicals (18)
Auto (9)
Construction (241)
Steel (90)
Shipbuilding (TTB)
(%)
Net profit is expected toswing to black in 2016
Shipbuilding's contribution to increase the most in 2016
-548
-55 -73
32
-73
-207
-31-52
-71 -81-53
-32
-97
-46
-173
-36 -39 -25 -41
-151
-600
-500
-400
-300
-200
-100
0
1002015 2014 2013 2012(%)

2016 Stock Market Outlook 9
Source: BOK, KDB Daewoo Securities Research
KTB yield and inflationKOSPI and inflation
Source: Bloomberg, KDB Daewoo Securities Research
• Gradual inflation is favorable for the stock market, as it indicates improvement in the economy
• Historically, bull markets have often been accompanied by inflation (except in the mid-2000s, when China’s integration with global markets took off)
• Meanwhile, inflation has a negative impact on the bond market
Ⅱ. Era of biflation
Gradual inflation is favorable for thestock market
0
5
10
15
20
25
30
35
0
500
1,000
1,500
2,000
2,500
80 85 90 95 00 05 10 15
KOSPI (L)
Korea CPI growth (R)
(p) (%, YoY)
0
2
4
6
8
10
120
2
4
6
8
10
12
14
16
1888 90 92 94 96 98 00 02 04 06 08 10 12 14 16
3Y KTB (L) Korea CPI growth (R)(%) (%, YoY)
(Exception)
2016 Stock Market Outlook 10
Source: BOK, KDB Daewoo Securities Research
US CPI growth has been slowing since 3Q11Korea’s CPI growth has slowed since 3Q11
Source: Bloomberg, KDB Daewoo Securities Research
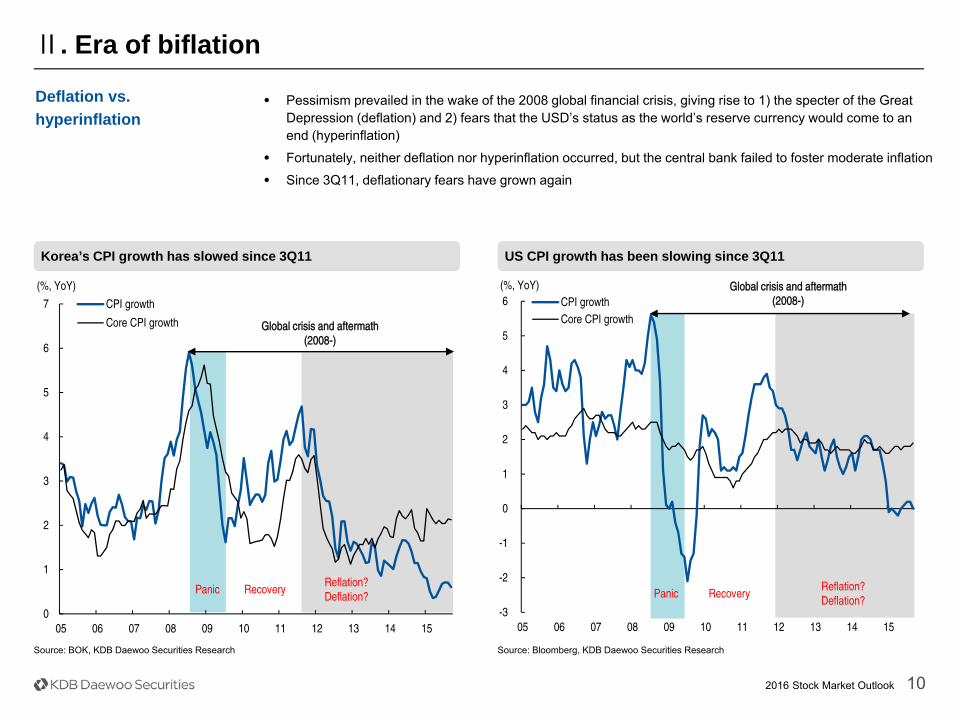
• Pessimism prevailed in the wake of the 2008 global financial crisis, giving rise to 1) the specter of the Great Depression (deflation) and 2) fears that the USD’s status as the world’s reserve currency would come to anend (hyperinflation)
• Fortunately, neither deflation nor hyperinflation occurred, but the central bank failed to foster moderate inflation
• Since 3Q11, deflationary fears have grown again
Ⅱ. Era of biflation
Deflation vs. hyperinflation
0
1
2
3
4
5
6
7
05 06 07 08 09 10 11 12 13 14 15
CPI growth
Core CPI growth
(%, YoY)
Global crisis and aftermath(2008-)
Panic RecoveryReflation?Deflation?
-3
-2
-1
0
1
2
3
4
5
6
05 06 07 08 09 10 11 12 13 14 15
CPI growthCore CPI growth
(%, YoY) Global crisis and aftermath(2008-)
Panic RecoveryReflation?Deflation?
2016 Stock Market Outlook 11
Breakdown of Korea’s CPI growth (since August 2011)
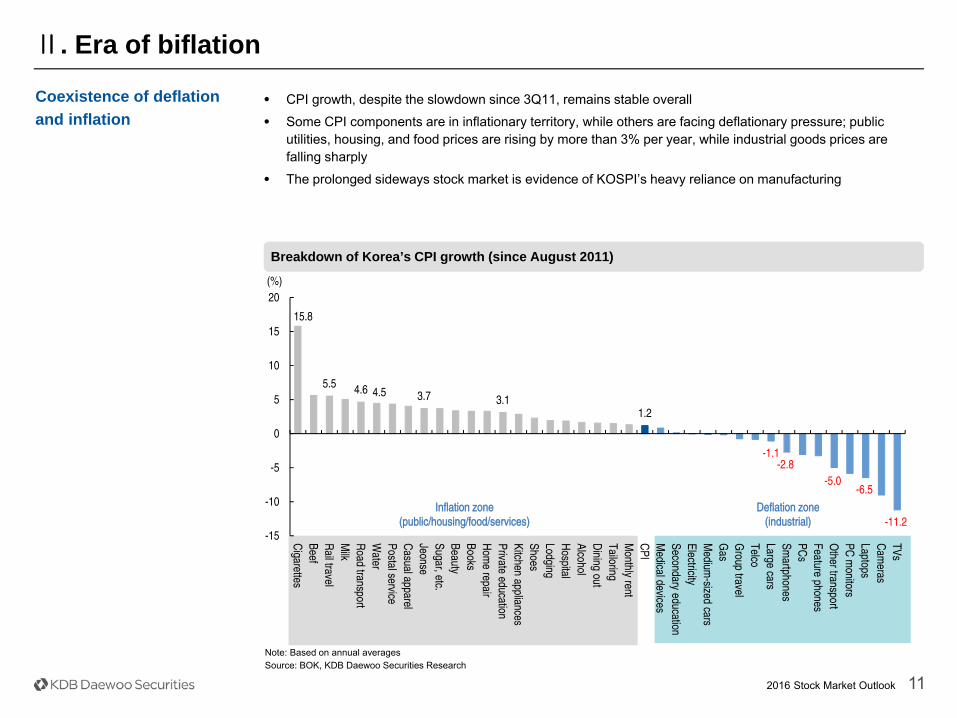
• CPI growth, despite the slowdown since 3Q11, remains stable overall
• Some CPI components are in inflationary territory, while others are facing deflationary pressure; public utilities, housing, and food prices are rising by more than 3% per year, while industrial goods prices are falling sharply
• The prolonged sideways stock market is evidence of KOSPI’s heavy reliance on manufacturing
Ⅱ. Era of biflation
Coexistence of deflation and inflation
15.8
5.5 4.6 4.5 3.7 3.1 1.2
-1.1 -2.8
-5.0 -6.5
-11.2 -15
-10
-5
0
5
10
15
20
Cigarettes
BeefR
ail travelM
ilkR
oad transportW
aterPostal serviceC
asual apparelJeonseSugar, etc.BeautyBooksH
ome repair
Private educationKitchen appliancesShoesLodgingH
ospitalAlcoholD
ining outTailoringM
onthly rentC
PIM
edical devicesSecondary educationElectricityM
edium-sized cars
Gas
Group travel
TelcoLarge carsSm
artphonesPC
sFeature phonesO
ther transportPC
monitors
LaptopsC
ameras
TVs
(%)
Inflation zone(public/housing/food/services)
Deflation zone(industrial)
Note: Based on annual averagesSource: BOK, KDB Daewoo Securities Research

2016 Stock Market Outlook 12
Based on annual averagesSource: BOK, KDB Daewoo Securities Research
Korea’s PPI growth by component (since August 2011)
• Producer prices are also showing similar patterns
• Industrial goods are leading the PPI downtrend
• Meanwhile, services price growth remains in positive territory
Ⅱ. Era of biflation
Industrial goods already facing deflationary pressure
1.8 1.2
-1.6
-4.2
-14
-12
-10
-8
-6
-4
-2
0
2
4
6
Sanitation/recycling
Education
Mining
Real estate
Food/lodging
Utilities
F&B
Transport equipment
Media
Culture/entertainm
ent
Business services
Textiles/leather
Services
Transport
General m
achinery
Precision instruments
Com
munications
Non-ferrous
Metal
Paper/lumber
Agriculture/fisheries
Financials/insurance
PPI
Electronics
Industrials
Chem
icals
Primary m
etal product
Coal/oil
(%)

2016 Stock Market Outlook 13
Note: Based on annual averagesSource: Bloomberg, KDB Daewoo Securities Research
US PPI growth (since 3Q11)US CPI growth (since 3Q11)
Note: Based on annual averagesSource: Bloomberg, KDB Daewoo Securities Research
• In the US, services prices are rising while manufacturing prices are falling
• CPI may not have climbed without the contribution from the housing sector (42.1% weight in the US CPI)
• Transportation (including the automotive sector) is experiencing heavy deflationary pressure
Ⅱ. Era of biflation
US also experiencing biflation
2.7
2.1 1.9
1.2 1.2
0.6 0.6
-2.2
-3
-2
-1
0
1
2
3
Medicalcare
Housing F&B Education CPI Leisure Apparel Transport
(%)
2.4
1.4 1.4 1.1 0.8 0.7
-0.6
-7.2 -8
-6
-4
-2
0
2
4(%)

2016 Stock Market Outlook 14
Source: Bloomberg, KDB Daewoo Securities Research
Margins of Korean listed manufacturers have weakened since 2010 Korea: Widening spread between CPI and PPI
Note: On a four-quarter cumulative basis Source: WISEfn, KDB Daewoo Securities Research
• Fall in commodity prices should hinder inflation
• Falling commodity prices could boost margins of Korean firms; lower commodity prices have a greater impact on PPI growth (corporate costs) than CPI growth (sales prices)
• However, margins of Korean listed manufacturers are forecast to show structural contraction sign of deflation caused by weak demand
Ⅱ. Era of biflation
A sign of deflation? Margins of manufacturers to deteriorate
-10
-5
0
5
10
15
00 01 02 03 04 05 06 07 08 09 10 11 12 13 14 15
Spread (CPI-PPI)CPIPPI
(% %p)
Manufacturing sector OP marginManufacturing sector net profit

2016 Stock Market Outlook 15
Note: Based on 2015F earnings; as of end-October Source: WISEfn, KDB Daewoo Securities Research
ROE of Korean listed firms: Profitability to weaken structurally Market value < book value for some key Korean sectors
Source: WISEfn, KDB Daewoo Securities Research
• Market values of Korea’s major stocks are mostly below book values; stocks trading below 1x P/B represent 27.9% of overall market cap
• Manufacturers’ profitability likely to weaken in the long term; excluding SEC and HMG, manufacturers’ ROE was just 3.8% in 2014
Ⅱ. Era of biflation
Deflation has already been reflected in valuations of financial and manufacturing shares
3.9
3.1
2.6
1.6
1.3 1.2 1.1 1.0 1.0 1.0 0.9 0.8 0.8 0.8
0.6 0.6 0.5
0.0
0.5
1.0
1.5
2.0
2.5
3.0
3.5
4.0
4.5
Healthcare
Leisure
Consum
er staples
Transport
Media/telco
IT Semicon.
Insurance
KOSPI
Energy/chemicals
Construction
Retail
Auto
Securities
Shipbuilding
Steel
Banks
(x)
Potential deflation is reflectedin manufacturing valuations (ex-IT)
KOSPI ROE ex-SEC and HMC
Manufacturing sector ROE ex-SEC and HMC
KOSPI ROE

2016 Stock Market Outlook 16
Source: Bloomberg, KDB Daewoo Securities Research
% of investments in Chinese GDP; Chinese slowdown has driven global demand contraction
• Major central banks (e.g., Fed, ECB, and BOJ) are encouraging inflation
• Despite ample liquidity, insufficient real demand has kept inflation from rising
• Global CPI growth started slowing in 2H11, when Chinese growth (which had been driven by fixed asset investments) slowed full swing
Ⅱ. Era of biflation
Concerns over deflationare mostly being fueled by Chinese slowdown
20
25
30
35
40
45
50
-4
0
4
8
12
16
20
75 80 85 90 95 00 05 10
Chinese GDP growth (L)
Chinese investment relative to GDP (R)
(%, YoY) (%)
CNY4tr stimulusprogram (2009-10)
2016 Stock Market Outlook 17
Source: Bloomberg, KDB Daewoo Securities Research
MSCI DM and EM indices and international commodity prices
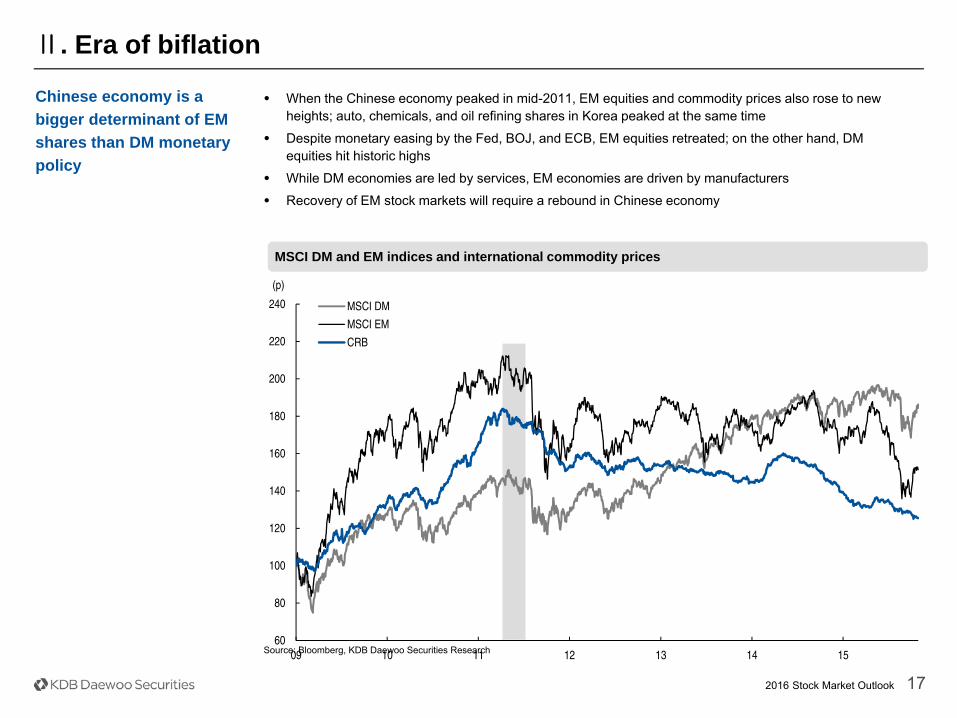
• When the Chinese economy peaked in mid-2011, EM equities and commodity prices also rose to new heights; auto, chemicals, and oil refining shares in Korea peaked at the same time
• Despite monetary easing by the Fed, BOJ, and ECB, EM equities retreated; on the other hand, DM equities hit historic highs
• While DM economies are led by services, EM economies are driven by manufacturers
• Recovery of EM stock markets will require a rebound in Chinese economy
Ⅱ. Era of biflation
Chinese economy is a bigger determinant of EM shares than DM monetary policy
60
80
100
120
140
160
180
200
220
240
09 10 11 12 13 14 15
MSCI DM
MSCI EM
CRB
(p)

2016 Stock Market Outlook 18
Source: Bloomberg, KDB Daewoo Securities Research
M2 growth, which leads industrial output, has recently rebounded, suggesting an imminent economic recovery Current decline in Chinese manufacturing PMI is the longest in history
Source: Bloomberg, KDB Daewoo Securities Research
• Chinese economy will likely start to display a cyclical upturn in late 2015 or early 2016
• Chinese manufacturing PMI, which has been experiencing its longest slump in history, is likely to pick up soon
• China’s M2 growth, which leads the country’s industrial output by one quarter, has recently rebounded, suggesting that an economic recovery is imminent
Ⅱ. Era of biflation
Chinese economy to start to see a cyclical upturn inlate 2015 or early 2016
0
5
10
15
20
25
30
35
0
5
10
15
20
25
30
05 06 07 08 09 10 11 12 13 14 15
Chinese industrial output growth (L)M2 growth rate (R)
(%, YoY) (%, YoY)
35
40
45
50
55
60
65
05 06 07 08 09 10 11 12 13 14 15
(p)
7M 12M 15M7M

2016 Stock Market Outlook 19
Source: Bloomberg, KDB Daewoo Securities Research
KOSPI and China Citi Economic Surprise Index
• Chinese economy has been mired in a structural slowdown since mid-2011
• Nonetheless, a cyclical economic recovery could occur
• Cyclical upturns in the Chinese economy have been largely responsible for Korean stock market pickups since 2011
• Since 2011, KOSPI rallies have coincided with Chinese economic rebounds (with no exceptions)
Ⅱ. Era of biflation
KOSPI rallies coincide with Chinese cyclical upturns
1,600
1,700
1,800
1,900
2,000
2,100
2,200
2,300
-200
-150
-100
-50
0
50
100
11 12 13 14 15
China Citi Economic Surprise Index (L)
KOSPI (R)
(p) (KRWbn)

2016 Stock Market Outlook 20
Source: Bloomberg, KDB Daewoo Securities Research
China’s growth by industry (3Q15)Tertiary industry makes a bigger contribution to China’s GDP than secondary industry
Source: Bloomberg, KDB Daewoo Securities Research
• Chinese economy has recently been characterized by the rapid growth of the services (tertiary) industry and a slowdown in the manufacturing (secondary) industry
• Size of the tertiary industry has exceeded that of the secondary industry since 2013
• Chinese economic growth is currently being driven by the services industry, including restaurants, lodging, real estate, transportation, and warehousing
• Manufacturing growth has been slowing rapidly; solid construction investments have prevented secondary industry growth from plunging
Ⅱ. Era of biflation
China: Services > manufacturing
9.1
41.1
49.8
0
10
20
30
40
50
60
93 96 99 02 05 08 11 14
Primary industrySecondary industryTertiary industry
(%, relative to GDP)
1.5
5.6
6.9 7.7 7.9
9.0
12.6
0
2
4
6
8
10
12
14(%, YoY)
(Secondary industry) (Tertiary industry)

2016 Stock Market Outlook 21
Source: Bloomberg, KDB Daewoo Securities Research
Korea’s exports to China move in line with the country’ssecondary industryChinese PMI: Solid for services but weak for manufacturing
Source: Bloomberg, KDB Daewoo Securities Research
• Chinese PMI, a major leading economic indicator, is solid for services but weak for manufacturing
• But the robust performance of the Chinese services industry yields only modest benefits for other countries
• Indeed, Korea’s exports to China move in line with the secondary industry, rather than the tertiary industry
Ⅱ. Era of biflation
Korea’s exports to China move in line with the country’s secondary industry
45
50
55
60
10 11 12 13 14 15
Manufacturing PMI
Services PMI
(p)
-30
-20
-10
0
10
20
30
40
50
05 06 07 08 09 10 11 12 13 14 15
Chinese secondary industry growthChinese tertiary industry growthGrowth of Korean exports to China
(%, YoY)

2016 Stock Market Outlook 22
Source: BOK, KDB Daewoo Securities Research
Korean exports have declined for 10 straight monthsProtracted GDP growth slowdown in Korea
Source: Korea Customs Service, KDB Daewoo Securities Research
Supply needs to be cut if demand cannot recover
• Korea is displaying historic-low growth
• In the past, we saw v-shaped recoveries after sharp downturns caused by one-off negatives
• There have been no devastating slumps recently, but the protracted slowdown has weighed on the economy (since 2H11)
• Some companies may not survive the prolonged downturn
Ⅲ. Restructuring overview: Historic-low growth
-10
-5
0
5
10
15
20
60 65 70 75 80 85 90 95 00 05 10 15
(%, YoY)
Second oil shock
Asian financial crisis
Global financial crisis
Historically low growth ofaround 3% for anextended period
-50
-30
-10
10
30
50
70
89 92 95 98 01 04 07 10 13
(% YoY)
7M(Asian crisis)
13M(IT bubble collapse) 12M
(Global financial crisis)
11M

2016 Stock Market Outlook 23
Source: WISEfn, KDB Daewoo Securities Research
Proportion of high-risk firms among listed firmsTurnover (receivables + inventory) of listed manufacturing firms
Note; Interest coverage ratio below one and borrowings at least five times higher than EBITDASource: WISEfn, KDB Daewoo Securities Research
SME restructuring to be led by banks
• Many SMEs could be driven out of business amid Korea’s longest slowdown in history
• Receivables and inventory turnover have weakened
• 27.5% of all manufacturers (16% of total market cap) have interest coverage ratios below one and borrowingsat least five times higher than EBITDA (high-risk firms)
• Restructuring of SMEs is anticipated to be led by banks
Ⅲ. Restructuring overview: SMEs
1,000
1,200
1,400
1,600
1,800
2,000
00 01 02 03 04 05 06 07 08 09 10 11 12 13 14
(%)
1816.5
14.2513
15.216.4
22
24.323.2
24.4
27.5
0
5
10
15
20
25
30
05 06 07 08 09 10 11 12 13 14 15
(%)

2016 Stock Market Outlook 24
Source: WISEfn, KDB Daewoo Securities Research
Debt-to-equity ratio has risenSteel/shipbuilding/shipping firms showing secular ROE declines
Source: WISEfn, KDB Daewoo Securities Research
Restructuring target: Steel/shipbuilding/shipping companies (China plays)
• Restructuring of large corporations should once again be led by the government (as in the 1980s and 1990s), with the government providing financial support to large companies
• Initial restructuring targets are expected to be steel/shipbuilding/shipping companies: M&As (with financial authorities providing guidelines)
Ⅲ. Restructuring overview: Steel/shipbuilding/shipping
0
50
100
150
200
250
300
350
400
Construction Shipbuilding Shipping
12/10
6/15
(%)
-100
-80
-60
-40
-20
0
20
40
60
80
90 92 94 96 98 00 02 04 06 08 10 12 14
MetalShipbuildingShipping
(%)
2016 Stock Market Outlook 25
Source: BOK, KDB Daewoo Securities Research
Industry restructuring in 1980sCapex growth in Korea (excessive investments in the 1970s)
Source: KDB Daewoo Securities Research
Korean government led industry restructuring in 1980s
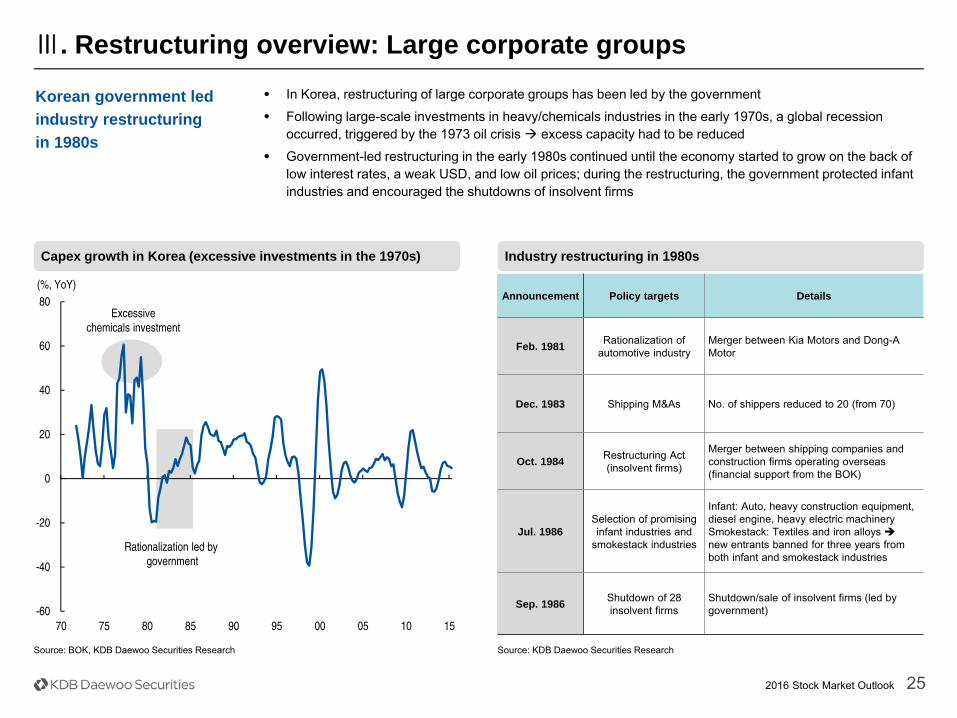
• In Korea, restructuring of large corporate groups has been led by the government
• Following large-scale investments in heavy/chemicals industries in the early 1970s, a global recession occurred, triggered by the 1973 oil crisis excess capacity had to be reduced
• Government-led restructuring in the early 1980s continued until the economy started to grow on the back of low interest rates, a weak USD, and low oil prices; during the restructuring, the government protected infant industries and encouraged the shutdowns of insolvent firms
Announcement Policy targets Details
Feb. 1981 Rationalization of automotive industry
Merger between Kia Motors and Dong-A Motor
Dec. 1983 Shipping M&As No. of shippers reduced to 20 (from 70)
Oct. 1984 Restructuring Act (insolvent firms)
Merger between shipping companies and construction firms operating overseas (financial support from the BOK)
Jul. 1986Selection of promising infant industries and
smokestack industries
Infant: Auto, heavy construction equipment, diesel engine, heavy electric machinerySmokestack: Textiles and iron alloys new entrants banned for three years from both infant and smokestack industries
Sep. 1986 Shutdown of 28 insolvent firms
Shutdown/sale of insolvent firms (led by government)
Ⅲ. Restructuring overview: Large corporate groups
-60
-40
-20
0
20
40
60
80
70 75 80 85 90 95 00 05 10 15
(%, YoY)
Excessivechemicals investment
Rationalization led by government

2016 Stock Market Outlook 26
Source: WISEfn, KDB Daewoo Securities Research
Government-led economic reforms Debt ratio of Korean listed firms: Excessive leverage shortly before the Asian financial crisis erupted
Source: KDB Daewoo Securities Research
Shortly after the Asian financial crisis broke out, Korean government led massive reforms
• Korean government carried out massive economic reforms shortly after the Asian financial crisis broke out
• Key was restructuring of conglomerates (led by the government)
• Restructuring of conglomerates changed the Korean economic structure
Sector Details
Semiconductor Hyundai Semiconductor acquired LG Semiconductor
Petrochemicals Daelim Industrial acquired Hanwha Petrochemical
Oil refining Hyundai Oilbank acquired Hanwha Energy
Ship engines Hankook Heavy Industries acquired the power plant division of Hyundai Heavy Industries
Railway Hyundai, Daewoo, and Hanjin established an integrated entity
Airlines Hyundai, Daewoo, and Samsung established an integrated entity
Ⅲ. Restructuring overview: Large corporate groups
373
0
50
100
150
200
250
300
350
400
90 91 92 93 94 95 96 97 98 99 00 01 02 03 04 05 06 07 08 09 10 11 12 13 14 15
(%)

2016 Stock Market Outlook 27
Source: Bloomberg, KDB Daewoo Securities Research
Chinese steel exports and domestic retail price Global crude steel output and Chinese proportion
Source: Bloomberg, KDB Daewoo Securities Research
• If oversupply eases with restructuring, share prices should receive a boost
• The culprit behind global oversupply is China
• Chinese government identified nine sectors (e.g., steel, cement, and shipbuilding) as facing oversupply; however, pace of restructuring is slow
• Rather, China’s efforts to ease domestic oversupply by boosting exports are posing a burden to other countries (steel); as for IT (including LCD and semiconductor), Chinese firms’ expansion are raising concerns over intense competition
• Intensity of Chinese industrial restructuring will be reflected in progress of SOE restructuring
Ⅲ. Restructuring overview: China is the culprit behind oversupply
Global oversupply to ease only after China carries out restructuring
0
1,000
2,000
3,000
4,000
5,000
6,000
0
1
2
3
4
5
6
7
8
09 10 11 12 13 14 15
Chinese iron/steel exports (L)
Chinese HRC steel retail price (R)
(USDbn) (CNY/tonne)
0
10
20
30
40
50
60
0
100
200
300
400
500
600
700
800
900
00 01 02 03 04 05 06 07 08 09 10 11 12 13 14 15
China crude steel output (L)
Chinese proportion of global output (R)
('000 tonnes) (%)

2016 Stock Market Outlook 28
Source: Wind, KDB Daewoo Securities Research
Chinese SOE reform plans (August 24, 2015)Earnings of private firms and SOEs (1H15)
Source: State Council of the People’s Republic of China
Details
Issue Dividing SOEs into public-interest companies and commercial firms
Ownership structure Partial or full disposal of SOEs to private firms; partial stake sales in strategically important industries such as utilities, energy, and telco
M&A deals Improving global competitiveness by pursuing M&A deals between major strategically important industries
Corporate culture Grant BOD right to elect management; introduction of merit-based compensation
Monitoring Establishment of a watchdog agency
Ⅲ. Restructuring overview: China is the culprit behind oversupply
Ownership structure reform holds the key
• Restructuring of SOEs to be key component of Chinese reforms; out of the 500 largest companies in China, 293 firms are owned by the state
• Most SOEs engage in large-scale operations, causing global oversupply
• Under the Chinese SOE restructuring program, employee ownership is preferred over full privatization,influenced by voices of modern leftists who are cautious about excessive capitalism
• Even if government-led reforms are carried out, major changes are unlikely to be seen unless ownershipstructure reform takes place
-10
-5
0
5
10
15
20
25
30
35
Revenue Net profit Fixed asset investment
Private enterpriseSOE
(%, YoY)

2016 Stock Market Outlook 29
Notes: Companies that remained in the black for straight ten years (2006-1H15); market cap is as of end-October 2015; financial data are as of end-June; dividend is as of 2014 Source: Bloomberg, KDB Daewoo Securities Research
Companies with substantial cash reserves
Focus on companieswith ample cash reserves
• With ongoing deflationary pressure on tangible assets, importance of conventional assets is diminishing
• Cash reserves will likely draw attention: amid deflationary pressures, holding cash could be advantageous even during industry restructuring
• Companies listed in the table below hold ample cash reserves and boast stable financial ratios
Stock Ticker SectorMarket
cap (KRWbn)
Cash reserves
(KRWbn)
Cash reserves/
market cap
Current ratio (%)
Debt ratio (%)
P/B (x)Dividend
yield estimate (%)
Seoyon 007860 KS Auto parts 275 316 1.15 110 146 0.29 1.2
CKH Food & Health
900120 KQ Supplements 356 378 1.06 997 17 0.66 0.0
Samil Enterprise 002290 KQ Construction 32 31 0.98 610 19 0.63 1.0
S&C Engine 900080 KQ Auto parts 156 146 0.94 671 9 0.44 0.0
China Great Star 900040 KQ Textiles/apparel 280 260 0.93 378 32 0.64 0.0
Daewon Sanup 005710 KQ Auto parts 121 100 0.82 163 95 0.66 1.9
Bukook Steel 026940 KS Metal/minerals 59 45 0.77 492 21 0.55 2.5
CS Holdings 000590 KS Metal/minerals 92 66 0.71 572 17 0.39 0.0
Hyundai E&C 000720 KS Construction 3,853 2,364 0.61 171 171 0.54 1.4
Dong-Ah Geological Engineering Company
028100 KS Construction 92 55 0.60 169 89 0.67 2.2
SJM Holdings 025530 KS Auto parts 80 41 0.51 544 24 0.37 3.7
Wooshin Systems
017370 KS Auto parts 62 31 0.51 124 125 0.60 0.5
Incheon City Gas
034590 KS Utilities 152 74 0.49 185 91 0.99 3.6
Ⅲ. Restructuring overview: Cash reserves gaining traction

2016 Stock Market Outlook 30
Source: Bloomberg, KDB Daewoo Securities Research
F/X reserves in EM nations trending down for the first time since the 2008 global crisis
F/X reserves are contracting in EM economies
• F/X reserves have recently been contracting in EM economies
• Payment-driven reserve contraction is being seen for the first time since the 2008 global crisis
• Reserves in EM economies have recently declined 8.5% from the historic-high level seen in 2014(USD9.5tr USD8.6tr)
• Reserves in China, resource-rich nations (e.g., Middle East, Latin America), and Southeast Asian countries are quickly shrinking
Ⅲ. Restructuring overview: Shrinking F/X reserves in EM economies
-
1,000
2,000
3,000
4,000
5,000
6,000
7,000
8,000
9,000
10,000
03 04 05 06 07 08 09 10 11 12 13 14 15
EM
EM ex-China
(USDbn)
Globalfinancial
crisis
Recent

2016 Stock Market Outlook 31
Source: Bloomberg, KDB Daewoo Securities Research
Korean F/X reserves Changes in F/X reserves in major EM economies (USDbn)
Source: CEIC, KDB Daewoo Securities Research
• F/X reserves were more than 10% below historic-high levels as of September 2015
• Reserves in Southeast Asian countries (e.g., Thailand, Malaysia) are quickly shrinking
• Reserves in emerging economies expanded; however, it should be noted that the 2008 currency crisis was triggered by a quick short-term contraction of reserves
• Greater exposure to the global economy is one of risks
F/X reserves are quickly decreasing in EM economies
Country Historic-high September 2015 Change
China 3,993 3,514 -11.9%
Resource-richcountries
Saudi Arabia 731 656 -10.2%
Russia 496 322 -35.0%
Algeria 193 157 -18.6%
Mexico 196 176 -7.6%
Libya 119 78 -33.8%
SoutheastAsia
Singapore 277 251 -9.4%
Thailand 182 148 -18.7%
Malaysia 136 89 -34.6%
Indonesia 124 101 -15.4%
Korea 374 368 -1.7%
Ⅲ. Restructuring overview: Shrinking F/X reserves in EM economies
-
50
100
150
200
250
300
350
400
96 98 00 02 04 06 08 10 12 14
(USDbn)
-24.1%

2016 Stock Market Outlook 32
Source: Thomson Reuters, KDB Daewoo Securities Research
Korea has lowest dividend yield among major countriesKorea discount is on the rise
Note: As of October 2015Source: Thomson Reuters, KDB Daewoo Securities Research
Lack of shareholder-friendly policies Korea discount
• Korean stocks’ valuation discount has recently expanded
• Although EM stocks are discounted overall, the Korean stock market is particularly discounted
• Low dividend yields are one of the major drivers
Ⅳ. Shareholder return policies to provide support
-40
-20
0
20
40
60
80
100
0
5
10
15
20
25
30
00 01 02 03 04 05 06 07 08 09 10 11 12 13 14 15
Korea discount (R)MSCI Korea P/E (R)MSCI ACWI P/E (L)
(%) (%)
Korea discount
5.6 5.3
4.7
4.3 4.1
3.8 3.6 3.5 3.4 3.3
2.8
2.2 2.1
1.7
0
1
2
3
4
5
6
Russia
Australia
Brazil
UK
Taiwan
Italy
France
Thailand
Germ
any
China
Global avg.
US
Japan
Korea
(%)

2016 Stock Market Outlook 33
Note: As of April 1, 2015Source: FTC, KDB Daewoo Securities Research
Dividend payout trends of large conglomeratesStakes held by major shareholders and related parties
Note: Top four chaebols are Samsung, HMG, SK, and LGSource: WISEfn, KDB Daewoo Securities Research
Large conglomerates are expected to shift to shareholder-friendly policies
• In Korea, conglomerates are notorious for low dividend payouts
• Low payout ratios are attributable to the fact that major shareholders hold relatively low stakes; in order to maximize profits, it has traditionally more effective for major shareholders to pursue related-party transactions with affiliated firms in which they hold large stakes
• However, large conglomerates will likely increase shareholder returns, given 1) regulations on related-party transactions, 2) the introduction of an excess cash reserve tax, 3) rising market calls for dividend payout growth, and 4) close monitoring of ownership succession efforts
Ⅳ. Shareholder return policies to provide support
12.9 7.5
5.0
3.8
3.8
3.6
3.2
2.8
2.6
2.4
2.4
1.9
1.3
1.1
0.4
0 2 4 6 8 10 12 14
GS
CJ
LS
LG
Shinsegae
Kumho Asiana
HMG
Hanjin
Daelim
Lotte
Doosan
Hanhwa
Samsung
HHI
SK
(%)
Chaebol big 4 (ex-SEC)
Ex-chaebol big 4
Chaebol big 4
2016 Stock Market Outlook 34
Notes: 2015 share buyback amount (excluding SEC’s buyback) is cumulative figure as of end-October; 2015 cash dividend is a forecastSource: WISEfn, KDB Daewoo Securities Research
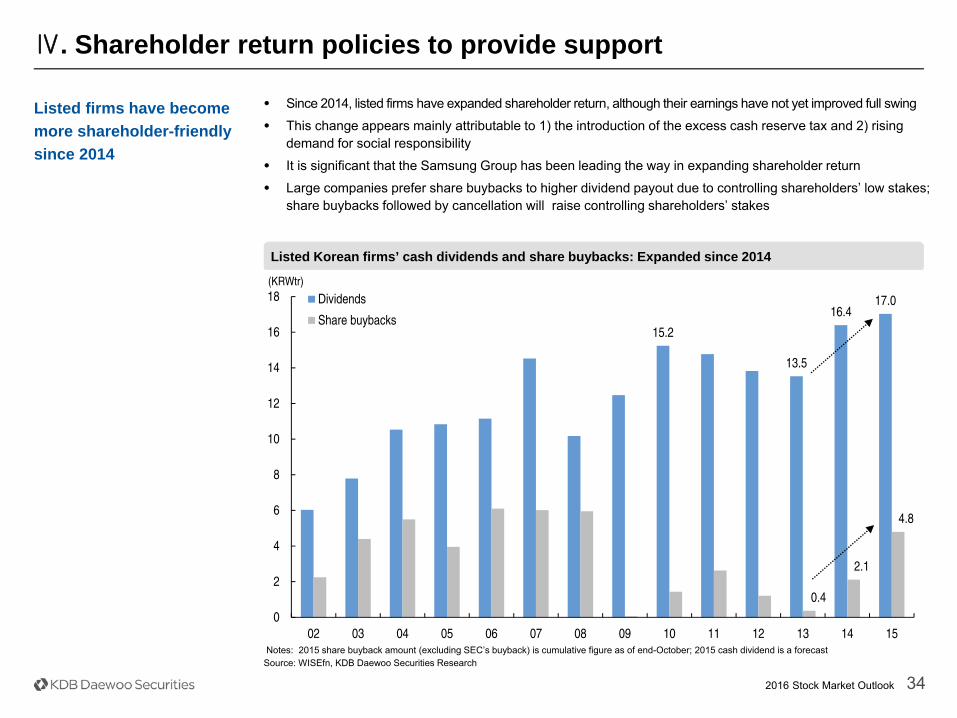
Listed Korean firms’ cash dividends and share buybacks: Expanded since 2014
Listed firms have become more shareholder-friendly since 2014
• Since 2014, listed firms have expanded shareholder return, although their earnings have not yet improved full swing
• This change appears mainly attributable to 1) the introduction of the excess cash reserve tax and 2) rising demand for social responsibility
• It is significant that the Samsung Group has been leading the way in expanding shareholder return
• Large companies prefer share buybacks to higher dividend payout due to controlling shareholders’ low stakes; share buybacks followed by cancellation will raise controlling shareholders’ stakes
Ⅳ. Shareholder return policies to provide support
15.2
13.5
16.4 17.0
0.4
2.1
4.8
0
2
4
6
8
10
12
14
16
18
02 03 04 05 06 07 08 09 10 11 12 13 14 15
Dividends
Share buybacks
(KRWtr)

2016 Stock Market Outlook 35
Samsung F&M
Samsung Group affiliates’ share buybacks downside support to stocks
Cheil WorldwideSamsung Electronics
Samsung Life
Source: WISEfn, KDB Daewoo Securities Research
Ⅳ. Shareholder return policies to provide support
0
2
4
6
8
10
12
14
16
60
70
80
90
100
110
120
130
10 11 12 13 14 15
Stock price (L)Buyback proportion (R)
(%)(KRW'000)
0
2
4
6
8
10
12
14
16
0
200
400
600
800
1,000
1,200
1,400
1,600
1,800
00 01 02 03 04 05 06 07 08 09 10 11 12 13 14 15
Stock price (L)Buyback proportion (R)
(%)(KRW'000)
0
2
4
6
8
10
12
14
16
18
0
5
10
15
20
25
30
00 01 02 03 04 05 06 07 08 09 10 11 12 13 14 15
Stock price (L)Buyback proportion (R)
(%)(KRW'000)
0
2
4
6
8
10
12
14
16
100
150
200
250
300
350
10 11 12 13 14 15
Stock price (L)Buyback proportion (R)
(KRW'000) (%)

2016 Stock Market Outlook 36
Source: WISEfn, KDB Daewoo Securities Research
KOSPI P/E and yield gap
• As of end-October, KOSPI yield gap stood at 7.5%p (12MF P/E: 10.92x, 3Y KTB yield: 1.65%; KOSPI: 2,030p )
• Average KOSPI yield gap since 2003 is also 7.5%p
• KOSPI of 2,050p appears to be equilibrium level
• Upper end of our 2016 KOSPI target range is 2,150p; key factors: 1) potential re-rating arising fromexpansion of shareholder returns and 2) the index’s range-bound movements over the past four years(when there have been no fundamental macro changes)
Upper end of 2016 KOSPI target range:2,150p
Ⅴ. KOSPI target and top picks
12MF P/E 3Y KTBYield gap

2016 Stock Market Outlook 37
Source: KDB Daewoo Securities Research
KOSPI trailing P/B has fallen below 1x whenever systemic risks have arisen
Lower end of 2016 KOSPI target range:1,700p
• KOSPI P/B of 1x offers good buying opportunity for long-term investors; historically, however, the KOSPI has fallen below book value whenever systemic risks have arisen (as of end-June 2015, the KOSPI P/B of 1x was equivalent to 1,842p)
• Concerns over potential systemic risks to continue in 2016; ongoing Chinese economic slowdown, possible EM financial crisis (Southeast Asia, Russia, Brazil, etc.), and Korea’s restructuring risk
• The lower bound of our 2016 KOSPI target range is 1,700p
Ⅴ. KOSPI target and top picks
0.76
0.43
0.66 0.74
0.80
0.0
0.5
1.0
1.5
2.0
2.5
91 92 93 94 95 96 97 98 99 00 01 02 03 04 05 06 07 08 09 10 11 12 13 14
(x)
12-month trailing P/B
Asianfinancialcrisis
Corporatebankruptcy ratehits record high
9/11 Hyundai/Daewoo
liquidity crisis
Card bubblecollapse
Globalfinancial crisis

2016 Stock Market Outlook 38Source: KDB Daewoo Securities Research
Revenue(KRWbn)
OP(KRWbn)
NP(KRWbn)
ROE (%)
P/E (x)
P/B (x) Dividend
yield (2015F, %)
Notes15F 16F 15F 16F 15F 16F 15F 16F 15F 16F 15F 16F
SEC(005930 KS)
200,937(-2.5)
211,987(+5.4)
27,188(+8.6)
27,785(+2.1)
20,764(-10.4)
21,872(+5.3)
12.2 11.7 11.1 10.5 1.2 1.1 1.8 Share buyback; stable business portfolio
AmorePacific (090430 KS)
4,774(+23.2)
6,271(+31.3)
781(+38.4)
1,051(+34.5)
608(+60.4)
767(+26.1)
19.4 20.4 45.2 35.9 8.0 6.7 0.3Diversified business portfolio via overseas expansion; solid earnings growth to continue
NAVER(035420 KS)
3,247(+17.7)
3,616(+11.3)
801(+5.6)
964(+20.3)
548(+20.7)
690(+25.9)
26.6 26.0 37.2 29.5 6.3 5.2 0.2Mobile revenue growth to accelerate; expenses related to new businesses to decrease
KT&G(033780 KS)
4,354(+5.8)
4,456(+2.3)
1,367(+16.6)
1,300(-4.9)
1,053(+27.4)
954(-9.4)
17.7 14.7 15.1 16.7 2.3 2.2 3.1Domestic sales and exports of tobacco and red ginseng to grow; high dividend yield
LG Corp.(003550 KS)
10,156(+2.9)
10,440(+2.7)
1,293(+23.0)
1,423(+10.0)
1,037(+22.7)
1,113(+7.3)
8.3 8.3 11.8 10.9 0.9 0.8 1.4High growth potential of the EV business; profitability at the electronics unit to improve
Dongbu Insurance
(005830 KS)
10,570(+6.2)
11,175(+5.7)
685(+34.8)
746(+8.9)
468(+17.0)
490(+4.7)
13.1 12.3 9.0 8.6 1.1 0.9 2.7 Stable net asset growth; ROE to remain high
Hyundai E&C (000720 KS)
18,858(+8.4)
20,580(+9.1)
1,030(+7.4)
1,190(+15.5)
446(+6.1)
542(+21.5)
7.9 9.0 8.8 7.2 0.7 0.7 1.7 Earnings to grow; undervalued
Cheil Industries (030000 KS)
2,846(+6.7)
3,051(+7.2)
138(+8.6)
158(+14.4)
107(+4.9)
121(+13.1)
12.6 13.8 22.2 19.7 2.1 2.0 - Expansion into the Chinese market
Dong-A ST(170900)
575(+1.2)
623(+8.3)
58(+20.8)
69(+19.0)
42(+23.5)
51(+21.4)
8.4 9.5 23.7 19.6 1.9 1.8 0.8 Earnings improvement; revaluation of new drug candidates
Ⅴ. KOSPI target and top picks

2016 Stock Market Outlook 39
Compliance NoticeImportant Disclosures & Disclaimers Disclosures As of the publication date, Daewoo Securities Co., Ltd and/or its affiliates do not have any special interest with the subject company and do not own 1% or more of the subject company's shares outstanding. Analyst Certification The research analysts who prepared this report (the “Analysts”) are registered with the Korea Financial Investment Association and are subject to Korean securities regulations. They are neither registered as research analysts in any other jurisdiction nor subject to the laws and regulations thereof. Opinions expressed in this publication about the subject securities and companies accurately reflect the personal views of the Analysts primarily responsible for this report. Daewoo Securities Co., Ltd. policy prohibits its Analysts and members of their households from owning securities of any company in the Analyst’s area of coverage, and the Analysts do not serve as an officer, director or advisory board member of the subject companies. Except as otherwise specified herein, the Analysts have not received any compensation or any other benefits from the subject companies in the past 12 months and have not been promised the same in connection with this report. No part of the compensation of the Analysts was, is, or will be directly or indirectly related to the specific recommendations or views contained in this report but, like all employees of Daewoo Securities, the Analysts receive compensation that is impacted by overall firm profitability, which includes revenues from, among other business units, the institutional equities, investment banking, proprietary trading and private client division. At the time of publication of this report, the Analysts do not know or have reason to know of any actual, material conflict of interest of the Analyst or Daewoo Securities Co., Ltd. except as otherwise stated herein. Disclaimers This report is published by Daewoo Securities Co., Ltd. (“Daewoo”), a broker-dealer registered in the Republic of Korea and a member of the Korea Exchange. Information and opinions contained herein have been compiled from sources believed to be reliable and in good faith, but such information has not been independently verified and Daewoo makes no guarantee, representation or warranty, express or implied, as to the fairness, accuracy, completeness or correctness of the information and opinions contained herein or of any translation into English from the Korean language. If this report is an English translation of a report prepared in the Korean language, the original Korean language report may have been made available to investors in advance of this report. Daewoo, its affiliates and their directors, officers, employees and agents do not accept any liability for any loss arising from the use hereof. This report is for general information purposes only and it is not and should not be construed as an offer or a solicitation of an offer to effect transactions in any securities or other financial instruments. The intended recipients of this report are sophisticated institutional investors who have substantial knowledge of the local business environment, its common practices, laws and accounting principles and no person whose receipt or use of this report would violate any laws and regulations or subject Daewoo and its affiliates to registration or licensing requirements in any jurisdiction should receive or make any use hereof. Information and opinions contained herein are subject to change without notice and no part of this document may be copied or reproduced in any manner or form or redistributed or published, in whole or in part, without the prior written consent of Daewoo. Daewoo, its affiliates and their directors, officers, employees and agents may have long or short positions in any of the subject securities at any time and may make a purchase or sale, or offer to make a purchase or sale, of any such securities or other financial instruments from time to time in the open market or otherwise, in each case either as principals or agents. Daewoo and its affiliates may have had, or may be expecting to enter into, business relationships with the subject companies to provide investment banking, market-making orother financial services as are permitted under applicable laws and regulations. The price and value of the investments referred to in this report and the income from them may go down as well as up, and investors may realize losses on any investments. Past performance is not a guide to future performance. Future returns are not guaranteed, and a loss of original capital may occur. Distribution United Kingdom: This report is being distributed by Daewoo Securities (Europe) Ltd. in the United Kingdom only to (i) investment professionals falling within Article 19(5) of the Financial Services and Markets Act 2000 (Financial Promotion) Order 2005 (the “Order”), and (ii) high net worth companies and other persons to whom it may lawfully be communicated, falling within Article 49(2)(A) to (E) of the Order (all such persons together being referred to as “Relevant Persons”). This report is directed only at Relevant Persons. Any person who is not a Relevant Person should not act or rely on this report or any of its contents. United States: This report is distributed in the U.S. by Daewoo Securities (America) Inc., a member of FINRA/SIPC, and is only intended for major institutional investors as defined in Rule 15a-6(b)(4) under the U.S. Securities Exchange Act of 1934. All U.S. persons that receive this document by their acceptance thereof represent and warrant that they are a major institutional investor and have not received this report under any express or implied understanding that they will direct commission income to Daewoo or its affiliates. Any U.S. recipient of this document wishing to effect a transaction in any securities discussed herein should contact and place orders with Daewoo Securities (America) Inc., which accepts responsibility for the contents of this report in the U.S. The securities described in this report may not have been registered under the U.S. Securities Act of 1933, as amended, and, in such case, may not be offered or sold in the U.S. or to U.S. persons absent registration or an applicable exemption from the registration requirements. Hong Kong: This document has been approved for distribution in Hong Kong by Daewoo Securities (Hong Kong) Ltd., which is regulated by the Hong Kong Securities and Futures Commission. The contents of this report have not been reviewed by any regulatory authority in Hong Kong. This report is for distribution only to professional investors within the meaning of Part I of Schedule 1 to the Securities and Futures Ordinance of Hong Kong (Cap. 571, Laws of Hong Kong) and any rules made thereunder and may not be redistributed in whole or in part in Hong Kong to any person. All Other Jurisdictions: Customers in all other countries who wish to effect a transaction in any securities referenced in this report should contact Daewoo or its affiliates only if distribution to or use by such customer of this report would not violate applicable laws and regulations and not subject Daewoo and its affiliates to any registration or licensing requirement within such jurisdiction.

2016 Stock Market Outlook 40
KDB Daewoo Securities International Network
KDB Daewoo Securities International Network
Daewoo Securities Co. Ltd. (Seoul) Daewoo Securities (Hong Kong) Ltd. Daewoo Securities (America) Inc. Head Office 34-3 Yeouido-dong, Yeongdeungpo-gu Seoul 150-716 Korea
Two International Finance Centre Suites 2005-2012 8 Finance Street, Central Hong Kong, China
320 Park Avenue 31st Floor New York, NY 10022 United States
Tel: 82-2-768-3026 Tel: 85-2-2845-6332 Tel: 1-212-407-1000
Daewoo Securities (Europe) Ltd. Daewoo Securities (Singapore) Pte. Ltd. Tokyo Branch 41st Floor, Tower 42 25 Old Broad St. London EC2N 1HQ United Kingdom
Six Battery Road #11-01 Singapore, 049909
7th Floor, Yusen Building 2-3-2 Marunouchi, Chiyoda-ku Tokyo 100-0005 Japan
Tel: 44-20-7982-8000 Tel: 65-6671-9845 Tel: 81-3- 3211-5511
Beijing Representative Office Shanghai Representative Office Ho Chi Minh Representative Office 2401A, 24th Floor, East Tower, Twin Towers B-12 Jianguomenwai Avenue Chaoyang District, Beijing 100022 China
Room 38T31, 38F SWFC 100 Century Avenue Pudong New Area, Shanghai 200120 China
Suite 2103, Saigon Trade Center 37 Ton Duc Thang St, Dist. 1, Ho Chi Minh City, Vietnam
Tel: 86-10-6567-9299 Tel: 86-21-5013-6392 Tel: 84-8-3910-6000
Daewoo Investment Advisory (Beijing) Co., Ltd. Daewoo Securities (Mongolia) LLC PT. Daewoo Securities Indonesia
2401B, 24th Floor, East Tower, Twin Towers B-12 Jianguomenwai Avenue, Chaoyang District, Beijing 100022 China
#406, Blue Sky Tower, Peace Avenue 17 1 Khoroo, Sukhbaatar District Ulaanbaatar 14240 Mongolia
Equity Tower Building Lt.50 Sudirman Central Business District Jl. Jendral Sudirman Kav. 52-53, Jakarta Selatan Indonesia 12190
Tel: 86-10-6567-9699 Tel: 976-7011-0807 Tel: 62-21-515-1140