Embed Size (px)
Citation preview

2016 SSPEED CENTER ANNUAL REPORT
November 2016
Philip B. Bedient, Director
James B. Blackburn, Co-Director
Lawrence G. Dunbar, Project Manager
Houston-Galveston Area Protection System (H-GAPS)

SSPEED Center 2016 Annual
1
Table of Contents
Executive Summary ............................................................................................................................3
I. Introduction ...............................................................................................................................8
I.1. Review of Findings from First Year (2014-2015) of SSPEED Center’s Phase 3 Study ...................... 9
I.2. Efforts / Findings from Second Year (2015-2016) of SSPEED Center’s Phase 3 Study .................. 12
I.2.1. Development of H-GAPS Plan ............................................................................................ 12
I.2.2. Coordination with Other Entities Re: Surge Reduction in the Houston-Galveston Area ... 16
1.2.3 Phasing of H-GAPS Plan ...................................................................................................... 23
II. Overview of Research on H-GAPS during Second Year (2015-2016) of Phase 3 Study .................. 27
II.2. Assessing Storm Surge Frequency in Galveston Bay .................................................................... 27
Developing Probable Maximum Storm Surge (PMSS) for Houston-Galveston Region ............... 27
II.3. Analyses using Synthetic FEMA Storms ....................................................................................... 31
Analyzing Surge Potential Based on a Hurricane’s Kinetic Energy .............................................. 32
Analyzing Surge Dynamics in Galveston Bay using Synthetic Storms ......................................... 33
II.4. Improving the Residential Damage Estimates for Baseline Scenario Conditions ........................ 36
II.5. Refining Industrial Damage Estimates: HSC’s Storage Tank Vulnerability Assessment and Influence of Design Details .................................................................................................................. 37
II.6. Environmental Modeling of Potential Spills from HSC Facilities Due to Surge ............................ 40
II.7. Biggerts-Waters Act and Federal Flood Insurance Policies and Costs ......................................... 43
III. Discussion of Key Environmental Issues ..................................................................................... 45
IV. Texas Coastal Exchange ............................................................................................................ 48
V. Meetings and Public Outreach .................................................................................................. 56
Media Outreach .................................................................................................................................. 56
Notable Events .................................................................................................................................... 56
Notable Meetings ................................................................................................................................ 56
e-Database Outreach .......................................................................................................................... 57
Online Outreach .................................................................................................................................. 57
VI. Future Work ............................................................................................................................. 58
V.1. Year 3 of Phase III of Current Funding ......................................................................................... 58
V.2. Future Needs ................................................................................................................................ 58
References ....................................................................................................................................... 60
SSPEED Center 2016 Annual
2
Appendices .................................................................................................................................... 622
Appendix A: Assessing Storm Surge Frequency in Galveston Bay
Appendix B: Probable Maximum Storm Surge (PMSS) for Houston-Galveston Region
Appendix C: Review of Wind Speed and Wind Drag
Appendix D: Integrated Kinetic Energy (IKE) Calculation
Appendix E: Addressing Uncertainty in Residential Damage Estimates from Tropical Cyclone Storm Surge, with a Focus on Variability in Structure Elevations
Appendix F: Impact of HFIAA on Residential NFIP Premiums
Appendix G: The Eastern Scheldt Survey: Sources of interest on the barrier and its effects
Appendix H: Texas Coastal Exchange

SSPEED Center 2016 Annual
3
Executive Summary
This is the second annual report to the Houston Endowment to present the status on the SSPEED Center’s efforts to date during its current three-year (2014-2017) study of hurricane surge protection in the Galveston Bay region.
The SSPEED Center has been studying hurricane issues in the Houston-Galveston area for the last few years on behalf of the Houston Endowment, ever since Hurricane Ike hit Galveston in 2008. Through generous funding from the Houston Endowment, the SSPEED Center is currently engaged in a three-year study to investigate and develop a potential regional surge protection system for the Houston-Galveston area, known as H-GAPS (Houston-Galveston Area Protection System). The idea behind this current effort is to provide the research necessary for devising a plan for reducing the flood damages in the area that would result from a hurricane.
Others have also been working on hurricane surge protection measures in the Galveston Bay area, such as Texas A&M Galveston (TAMUG), the 6-county surge district (GCCPRD), the Texas General Land Office (GLO) and the U.S. Army Corps of Engineers (USACE). These groups have their own research/study teams that are involved in numerous aspects of hurricane surge protection efforts. The SSPEED Center is collaborating with these other study groups so as not to duplicate research efforts, but rather to share the workload and compare study results with the goal of collectively developing a single surge protection system for the region.
During the first year of its three-year study, the SSPEED Center’s surge modeling team performed extensive computer modeling of a variety of hurricanes that could potentially hit the Houston-Galveston area, by using past hurricanes that have occurred somewhere in the Gulf of Mexico and realigning them so that they would hit Galveston. The results of this surge modeling work allowed the SSPEED Center team to better understand the characteristics of a hurricane and how they might influence the resulting surge flooding not only along the Galveston coastline, but also within Galveston Bay and up along the Houston Ship Channel in Houston (HSC). In addition, various surge reduction scenarios, including both structural and non-structural measures, were preliminarily investigated to determine how effective they might be in reducing surge flooding in various parts of the Galveston Bay area.
As a result of this initial evaluation of surge reduction scenarios, the SSPEED Center identified three regional strategies for further evaluation. These three strategies were referred to as the Upper-, Middle- and Lower-Bay Gate Strategies. The purpose in evaluating these three gate strategies was to determine where one should place such a large gate, so as to provide the most benefit for the least cost in terms of surge flood damage reduction in the region. The SSPEED Center had previously investigated placing a large surge protection gate across the HSC near the Hartman Bridge (previously known as the “Centennial Gate”) to protect the industrial facilities up along the HSC in Houston, while the TAMUG study group had been investigating placing such a gate across the opening between Galveston Island and the Bolivar Peninsula (known as “Bolivar Roads”), as a component of the “Ike Dike”, to protect more

SSPEED Center 2016 Annual
4
of the Galveston Bay area. Both of these gate locations have advantages and disadvantages, and so they were incorporated into the regional gate strategies investigated by the SSPEED Center, along with a possible third gate location being across the HSC in the middle of the bay. This in-bay gate strategy shares some of the same advantages and disadvantages as the other two potential gate locations.
Preliminary results of the evaluation of these three regional gate strategies showed significant benefit-to-cost ratios for these three strategies; however, much more work was needed to further develop and evaluate these three regional gate strategies, and to coordinate the components and results of these strategies with those being investigated by the other study teams, to allow for a better evaluation and comparison of their advantages and disadvantages, not only economically, but also socially and environmentally. This was the work that was done in the second year of this study.
During this second year of the study, the SSPEED Center team further evaluated its three regional gate strategies, using up to 20 synthetic storms at 4 different landfall locations. These synthetic storm simulations showed how vulnerable a coastal barrier system at the height of the existing Seawall (i.e. 17 feet) would be for large hurricanes (e.g. Category 3 or greater), as shown in Figures 16 and 17 in the main report. These large hurricanes would overtop such a barrier system and still present a high probability of tank failure along the HSC, as shown in Figure 18 of the main report. The SSPEED Center analyzed how such a failure would allow for a spill of chemicals or petroleum products to enter into the HSC, and move through the HSC on its way into Galveston Bay, as shown on Figures 21 and 22 in the main report. As a result of this work, the SSPEED team concluded that no single strategy would provide the level and scope of surge protection needed for this Houston-Galveston region. As a result, the team decided that it made much more sense to develop a strategy involving “multiple lines of defense”, a concept being followed in the Netherlands (see Figure 4 below from the main report).
Figure 4. “Multiple Lines of Defense” Schematic
Further evaluation of these strategies led to the development of the H-GAPS Plan, as shown in Figure 5 below from the main report.

SSPEED Center 2016 Annual
5
Figure 5. H-GAPS Plan

SSPEED Center 2016 Annual
6
The H-GAPS Plan includes a combination of both the Mid-Bay and Lower-Bay Gate Strategies, and thus combines a coastal spine-type barrier system (similar to the “Ike Dike” concept) with an in-bay barrier system. The coastal barrier system includes a land barrier (e.g. elevated roadways) along both Galveston Island and Bolivar Peninsula, as well as a gated water barrier across Bolivar Roads encompassing both a large navigation gate and a number of small environmental gates. This coastal barrier system would provide overall surge protection for the majority of the Houston-Galveston region for small to medium-sized hurricanes. However, for larger hurricanes, there is residual surge within the bay that can still cause significant flood damages; thus the need for an additional “line of defense” or layer of protection in or around the bay. The in-bay barrier system can provide this additional layer of protection for certain critical areas. For example, such an in-bay barrier system includes earthen berms, along with one large navigation gate and some small craft gates, that would provide more localized and additional surge protection to the communities along the west side of the bay and up into the HSC, primarily for the large to very large hurricanes. This additional protection is extremely important for the critical infrastructure located along the HSC, such as the industrial complex, to ensure that the potential for a catastrophic event is minimized to the extent reasonably practicable. Also, there is proposed a levee system around the City of Galveston, tied in with the existing Galveston Seawall, to provide that city with the additional protection from in-bay surge flooding during these large hurricanes.
A Phasing plan has also been developed by the SSPEED Center, at the request of the City of Houston, in order to identify components of the H-GAPS Plan that can potentially be implemented quickly and with local funds. Phase I of the Plan includes the Mid-Bay strategy, as shown in Figure 9 of the main report, while Phase II includes the Lower-Bay Gate system and the raising of the Texas City levee, as shown in Figure 10 of the main report.
During this second year of the study, the SSPEED Center has also continued its work on the Texas Coastal Exchange (TCX). This study effort involves evaluating non-structural hurricane surge damage reduction concepts, such as oyster reefs, coastal wetlands, coastal prairies and bottomland hardwoods, as well as the benefits they provide towards the coastal ecosystem.
The 6-county surge district (GCCPRD) has recently completed its initial study for this region and has also recommended a coastal barrier system similar to that of the H-GAPS Plan. However, the GCCPRD has also recognized the residual surge problems within the bay associated with larger hurricanes, and thus has also recommended a levee around the City of Galveston to provide it with the additional protection needed for that part of the bay. They have also realized the need for additional surge protection on the west side of the bay and have recommended a gated structure across the entrance to Clear Lake to address this issue. However, they are still unsure about the need for additional protection along the HSC, although they have acknowledged that the SSPEED Center has proposed an in-bay system to provide the additional protection needed to the west side of the bay and has stated that such a plan “warrants further investigation.”
Thus, the H-GAPS Plan is a viable and comprehensive plan that provides an appropriate level of regional surge protection to the Houston-Galveston area. However, further study is needed to investigate the potential environmental impacts of such a plan, especially as it relates to the ecology and health of

SSPEED Center 2016 Annual
7
Galveston Bay. The GCCPRD is looking to the SSPEED Center to assist them in such an evaluation, especially as it relates to the in-bay system, as they enter into their next phase of work for the Texas GLO. Further, the USACE is also starting their Feasibility Study for this region and has looked to the SSPEED Center to provide them with information and analyses regarding the H-GAPS study efforts, both as to the alternative analyses as well as any future environmental analyses.
SSPEED Center 2016 Annual
8
I. Introduction
This 2016 Annual Report is to summarize the work of the SSPEED Center during its second year of its 3-year Phase 3 study on behalf of the Houston Endowment on investigating hurricane surge flooding in the Houston-Galveston area (see Figure 1. Area Map). This study involves evaluating both structural and non-structural means of reducing the adverse impacts from such surge flooding.
During this second year of this Phase 3 study, the SSPEED Center has been further evaluating and refining various strategies for reducing the surge flooding throughout the Galveston Bay area that were developed and initially evaluated during the first year of this study. This most recent work has been coordinated with others who are also studying this surge reduction issue, such as Texas A&M – Galveston (TAMUG), the 6-County Surge District (GCCPRD), and the Corps of Engineers. As a result of this effort, and the efforts of others, a regional surge protection system, that includes both coastal and in-bay components, has evolved.
In particular, the SSPEED Center has developed a regional surge protection plan (the H-GAPS Plan) that includes not only a coastal spine, similar to TAMUG’s Ike Dike, but also an in-bay barrier and gate system. While the coastal spine provides an overall level of protection from surge flooding across the Galveston Bay area, there is some residual surge flooding problems that would still remain; these problems are therefore being addressed by the in-bay system. Furthermore, this in-bay system also provides an additional level of protection (as a “multiple line of defense”) to the west side of the bay and the Houston Ship Channel (HSC) area beyond what the coastal spine can provide, such as would be needed as a result of larger storms that overtop the coastal spine, or as a result of a failure of a portion of the coastal spine. In addition, there are some differences in the various components between the SSPEED Center’s regional plan and that presented by others, which will be discussed in this report. Finally, the SSPEED Center has suggested a Phasing Program for its H-GAPS Plan in order to provide some level of protection in the near future, such as by using local funding, while the remaining components are implemented as large-scale funding becomes available.
The SSPEED Center has also been working on some non-structural alternatives for its H-GAPS Plan, such as evaluating the ecological benefits of various ecosystems found along the upper Texas coast, such as marshlands and oyster reefs. The focus of this work has been to evaluate how these ecosystems might provide benefits not only as to storm surge reduction, but also as an economic benefit to the landowners who might be willing to maintain, create or enhance such ecosystems.

SSPEED Center 2016 Annual
9
Figure 1. Area Map
I.1. Review of Findings from First Year (2014-2015) of SSPEED Center’s Phase 3 Study
During the first year of its Phase 3 study of surge reduction in the Houston-Galveston area, the SSPEED Center developed and initially evaluated a variety of surge reduction scenarios, both along the coast as well as within Galveston Bay. These scenarios included berms, levees, gates, elevated roadways and other structural concepts. In addition, non-structural concepts were also studied, such as enhancing or creating marshlands and oyster reefs. As a result of this work, the SSPEED Center identified three regional surge protection strategies for further evaluation: an Upper-Bay, a Mid-Bay and a Lower-Bay Strategy. The only

SSPEED Center 2016 Annual
10
difference between these strategies is the location of the gate structure. (see Figure 2. H-GAPS Gate
Strategies).
Figure 2. H-GAPS Gate Strategies
The SSPEED Center initially evaluated these three regional surge protection strategies by identifying a “Baseline Conditions” that involved establishing approximate 100-year surge flood levels throughout the Galveston Bay area using the state-of-the-art surge model (SWAN+ADCIRC). These surge levels were computed from the modeling of a 100-year proxy storm, based on Hurricane Ike’s wind field with a 15% increase in the winds (Ike+15). This enhanced Hurricane Ike was then modeled so as to make landfall at

SSPEED Center 2016 Annual
11
a point approximately 30 miles southwest of the actual landfall location (which was where the opening to Galveston Bay from the Gulf of Mexico is located, known as “Bolivar Roads”). This modeled landfall location, known as Point p7, provides the most damaging path for a major hurricane and would produce the highest surge flooding levels throughout most of the Galveston Bay area, including the west side and the HSC areas (see Figure 3. Maximum Water Surface Elevation for Baseline Conditions (Ike15p7)).
Figure 3. Maximum Water Surface Elevation for Baseline Conditions (Ike15p7)
In addition, the SSPEED Center evaluated the “Ike Dike” concept as proposed by TAMUG, and found that while such a coastal barrier would provide widespread surge reduction throughout the Galveston Bay area, there would still be residual surge flooding caused by the high winds pushing the water that would already be in the bay towards the western sides of the bay. This was part of the reason for the SSPEED Center’s investigating other in-bay protection measures that led to the three regional surge protection strategies that all include in-bay components.
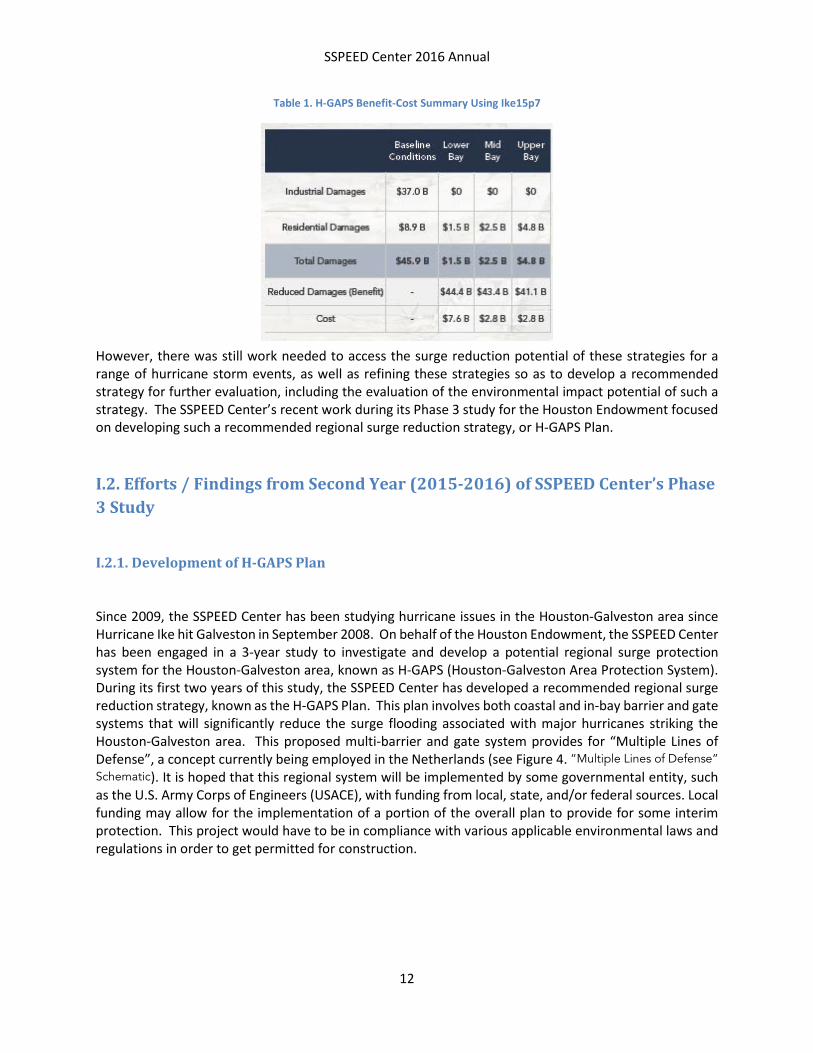
Residential, industrial and infrastructure damages were investigated for the Baseline Conditions, as well as the reduction in damages due to the three regional strategies. In addition, preliminary costs based on these three regional strategies were estimated. A comparison was then made between the reduction in damages (benefits) and the costs associated with these three strategies (see Table 1. H-GAPS Benefit-Cost Summary Using Ike15p7). The results showed that there were considerable benefits derived from the implementation of any of the three strategies, primarily due to the large reduction in industrial damages along the HSC, while the costs were considerably larger for the Lower-Bay Gate Strategy (Coastal Spine) than the other two strategies (Upper-Bay and Mid-Bay).
SSPEED Center 2016 Annual
12
Table 1. H-GAPS Benefit-Cost Summary Using Ike15p7
However, there was still work needed to access the surge reduction potential of these strategies for a range of hurricane storm events, as well as refining these strategies so as to develop a recommended strategy for further evaluation, including the evaluation of the environmental impact potential of such a strategy. The SSPEED Center’s recent work during its Phase 3 study for the Houston Endowment focused on developing such a recommended regional surge reduction strategy, or H-GAPS Plan.
I.2. Efforts / Findings from Second Year (2015-2016) of SSPEED Center’s Phase 3 Study
I.2.1. Development of H-GAPS Plan
Since 2009, the SSPEED Center has been studying hurricane issues in the Houston-Galveston area since Hurricane Ike hit Galveston in September 2008. On behalf of the Houston Endowment, the SSPEED Center has been engaged in a 3-year study to investigate and develop a potential regional surge protection system for the Houston-Galveston area, known as H-GAPS (Houston-Galveston Area Protection System). During its first two years of this study, the SSPEED Center has developed a recommended regional surge reduction strategy, known as the H-GAPS Plan. This plan involves both coastal and in-bay barrier and gate systems that will significantly reduce the surge flooding associated with major hurricanes striking the Houston-Galveston area. This proposed multi-barrier and gate system provides for “Multiple Lines of Defense”, a concept currently being employed in the Netherlands (see Figure 4. “Multiple Lines of Defense” Schematic). It is hoped that this regional system will be implemented by some governmental entity, such as the U.S. Army Corps of Engineers (USACE), with funding from local, state, and/or federal sources. Local funding may allow for the implementation of a portion of the overall plan to provide for some interim protection. This project would have to be in compliance with various applicable environmental laws and regulations in order to get permitted for construction.

SSPEED Center 2016 Annual
13
Figure 4. “Multiple Lines of Defense” Schematic
Goals of the H-GAPS Plan
The goals of the H-GAPS Plan is to develop a regional surge reduction system for protecting the population in the Galveston Bay area, the industrial complex along the HSC and the preservation of the barrier islands, including Galveston Island and Bolivar Peninsula, from surge flooding during a major hurricane. In addition, the ultimate plan should include a regional storm surge reduction strategy with “Multiple Lines of Defense,” including a coastal barrier and in-bay surge controls. Finally, the Plan should be developed in such a way such that portions of it can be implemented quickly in order to provide some interim protection while work proceeds on the implementation of the entire plan.
Components of the H-GAPS Plan
Following further evaluation of the three regional surge reduction strategies that evolved out of the SSPEED Center’s previous work for the Houston Endowment, a comprehensive regional surge protection strategy was developed, known as the H-GAPS Plan. This Plan meets the goals as outlined above, and is being recommended by the SSPEED Center for further evaluation and analysis. The components of the H-GAPS Plan are presented below, and shown in Figure 5. H-GAPS Plan), and further described in Table 2. Description of H-GAPS Plan Components.

SSPEED Center 2016 Annual
14
Figure 5. H-GAPS Plan
SSPEED Center 2016 Annual
15
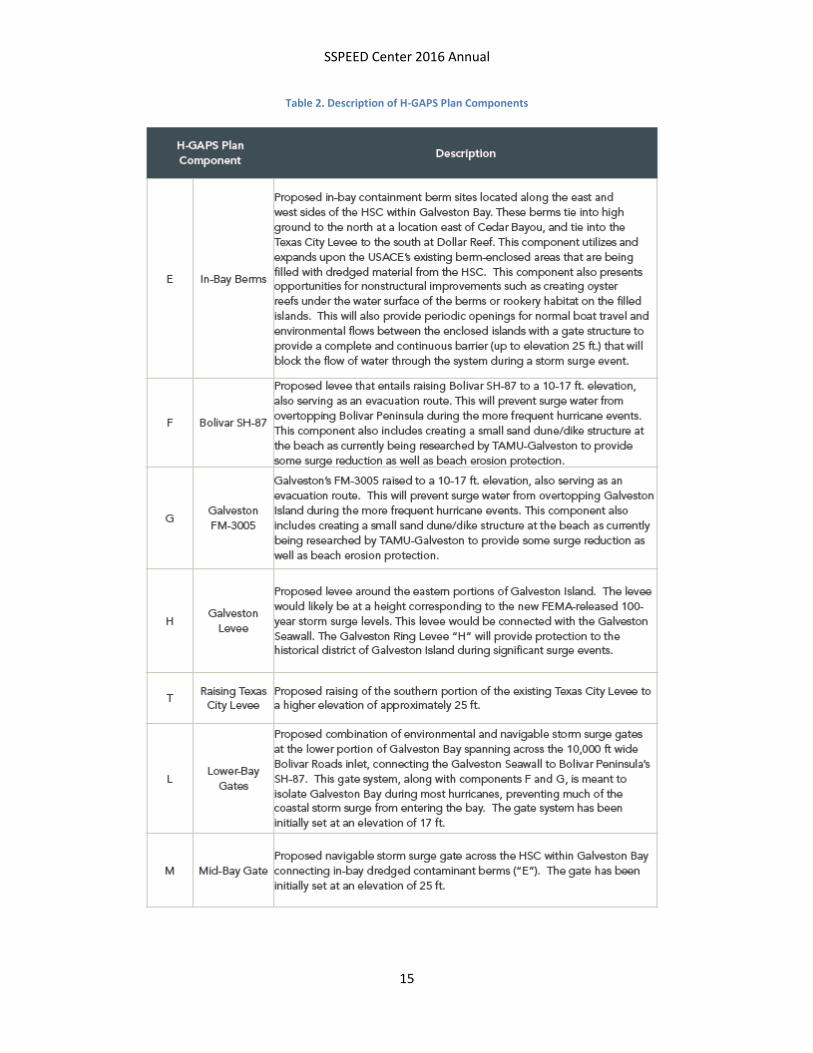
Table 2. Description of H-GAPS Plan Components
SSPEED Center 2016 Annual
16
Performance of the H-GAPS Plan
The purpose of the H-GAPS Plan is to provide surge reduction throughout the Houston-Galveston area, for both minor and major hurricanes, especially in the most heavily populated areas, such as the west side of the bay and the City of Galveston, as well as in the industrial complex along the HSC. The SSPEED Center’s work during this year has shown that the Coastal Spine can provide considerable surge reduction throughout the Galveston Bay area, but that there remains some residual surge on the western sides of the bay and in the HSC during large hurricanes. This residual surge can be significantly reduced with an in-bay barrier and gate system, known as the Mid-Bay Gate strategy. This strategy does not provide any surge reduction outside of its barriers; therefore, some coastal protection system is still needed to address this issue. This is why the SSPEED Center has recommended its H-GAPS Plan that includes both a coastal spine component and an in-bay barrier component.
TAMUG has been promoting the “Ike Dike” as its coastal spine concept, but has recently recognized that there is a residual surge issue on the western sides of the bay and in the HSC that is not addressed by the “Ike Dike”. TAMUG had requested that the SSPEED Center pursue its investigations into in-bay systems as necessary components of any regional surge protection system, to be added to any coastal barrier system.
The GCCPRD has also been studying surge reduction for all of the six coastal counties in this area, including Harris, Galveston and Chambers counties. Recently, the GCCPRD issued its final report in June 2016 that recommended its coastal spine for protecting the Houston-Galveston area, similar to the “Ike Dike” concept. However, the GCCPRD also recognized that there are residual surge issues with a coastal spine system, and therefore also recommended additional surge protection components, such as a levee around the City of Galveston and a surge gate at Clear Lake. Yet their work did not recognize any residual surge issues in the HSC; however, they were only analyzing surge events up to their 100-year hurricane storm event (for which they may be under-estimating). However, in their final report, the GCCPRD did acknowledge that the SSPEED Center’s H-GAPS Plan, especially its in-bay system components, warranted further investigation.
I.2.2. Coordination with Other Entities Re: Surge Reduction in the Houston-Galveston Area
The SSPEED Center has been coordinating its research efforts with other entities during this second year of this Phase 3 study. There are a number of entities that have been studying or are interested in surge reduction efforts in the Houston-Galveston area. The following entities are some of the ones with which the SSPEED Center has been coordinating its efforts during this current year:

SSPEED Center 2016 Annual
17
Texas A&M – Galveston (TAMUG)
TAMUG has been promoting the “Ike Dike” as its coastal spine concept, consisting of a 17-foot high continuous barrier along the shoreline, extending from about San Luis Pass to about High Island (see Figure 6. Coastal Spine System (TAMUG’s “Ike Dike”)). The concept of TAMUG is to build a sand-dune type barrier along the existing beachfront, connecting with the existing Galveston Seawall, while expanding the beach towards the ocean. In addition, this concept would include a large, 800-foot wide navigation gate system across the HSC as it passes through the Bolivar Roads opening between Galveston Island and Bolivar Peninsula. It also includes a 9,000-foot wide environmental gate system that would have to extend across the remainder of the Bolivar Roads opening to provide a continuous coastal barrier.
TAMUG has recently recognized, as has the SSPEED Center and others, that there are residual surge issues on the western sides of the bay and in the HSC that are not addressed by the “Ike Dike” during large hurricanes. These residual surge issues occur even when the surge is prevented from entering the bay due to the coastal barrier, as the strong hurricane-force winds move across the water that is already in the bay, pushing it up and onto the western shoreline and into the HSC. This residual surge is even greater for the large hurricanes that can overtop the coastal spine, as it is only being designed to be at an elevation of 17 feet, the height of an approximated 100-year surge event, as estimated by TAMUG. This estimate does not account for sea level rise, nor does it consider historic surge level data at the Galveston Pier 21 station maintained by NOAA.
As a result, TAMUG had requested that the SSPEED Center pursue its investigations into in-bay systems as necessary components of any regional surge protection system, to be added to any coastal barrier system. The SSPEED Center has presented its H-GAPS Plan to TAMUG, and has received comments from them, primarily involving constructability issues and potential environmental concerns with any permanent structures in the bay. The SSPEED Center is planning to address these issues in its future work.

SSPEED Center 2016 Annual
18
Figure 6. Coastal Spine System (TAMUG’s “Ike Dike”)
GCCPRD / GLO
The 6-county surge district (GCCPRD) has also been studying surge reduction and recovery issues for all of the 6 coastal counties in this area, including Harris, Galveston and Chambers counties, with funding from the General Land Office (GLO). This study effort focused on evaluating two types of surge reduction systems: a coastal system with surge gates, and one that was primarily land-based, such as with levees, for each of the three regions that encompassed the 6 counties. The design storm event for this study effort was that which produced a 100-year surge level, as estimated by the GCCPRD, based on the FEMA Flood Insurance Rate Maps (FIRMs).
For the Houston-Galveston area (the Central Region), the GCCPRD identified two alternatives for further evaluation in its draft report issued in February 2016. The first alternative, labeled as CR#1, involved an 18-foot high coastal spine, similar to the Ike Dike, but with its barrier system being a levee system located behind the main roadways running along Galveston Island (FM3005) and Bolivar Peninsula (Hwy 87), and a 22-foot high navigation and environmental gate system across Bolivar Roads. The second alternative, labeled as CR#2, involved a levee system around the City of Galveston and another levee system extending from the existing Texas City Levee system further to the west and to the north, generally along or near
SSPEED Center 2016 Annual
19
Hwy 146, with gates across Clear Lake and other waterways that cross under this highway. This alternative would provide no surge reduction for the HSC or areas to the east of this levee system that are located along the west side of the bay.
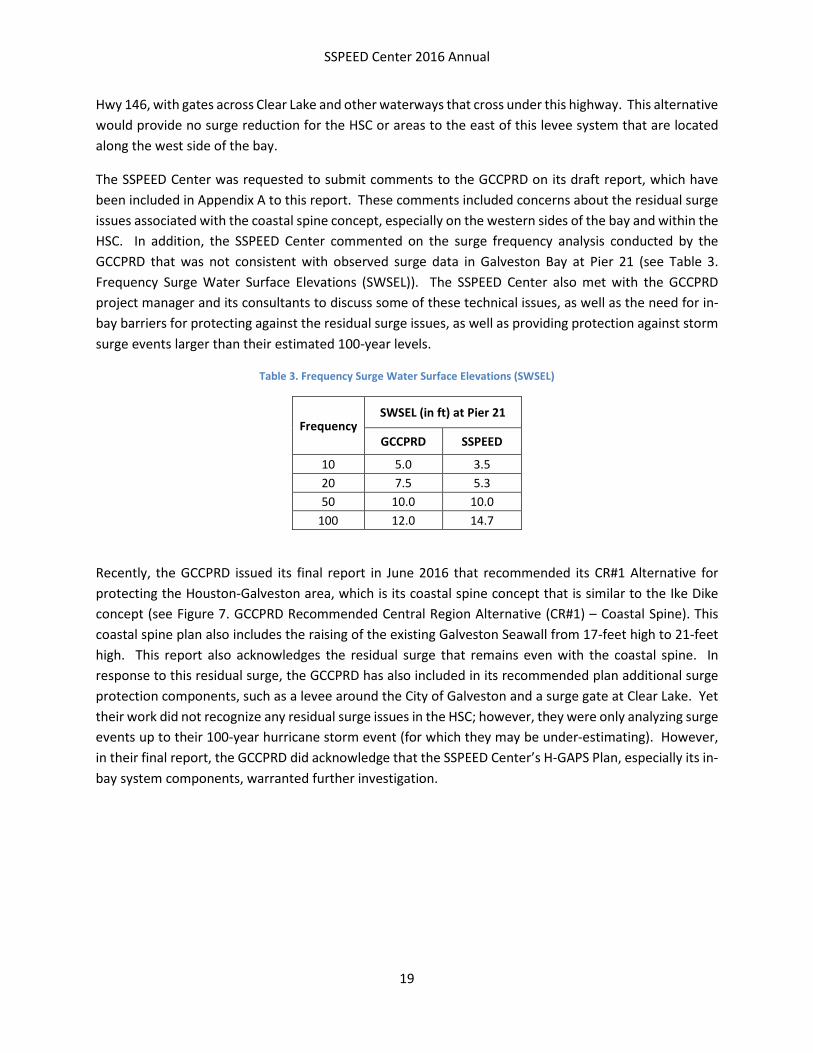
The SSPEED Center was requested to submit comments to the GCCPRD on its draft report, which have been included in Appendix A to this report. These comments included concerns about the residual surge issues associated with the coastal spine concept, especially on the western sides of the bay and within the HSC. In addition, the SSPEED Center commented on the surge frequency analysis conducted by the GCCPRD that was not consistent with observed surge data in Galveston Bay at Pier 21 (see Table 3. Frequency Surge Water Surface Elevations (SWSEL)). The SSPEED Center also met with the GCCPRD project manager and its consultants to discuss some of these technical issues, as well as the need for in-bay barriers for protecting against the residual surge issues, as well as providing protection against storm surge events larger than their estimated 100-year levels.
Table 3. Frequency Surge Water Surface Elevations (SWSEL)
Frequency SWSEL (in ft) at Pier 21
GCCPRD SSPEED
10 5.0 3.5 20 7.5 5.3 50 10.0 10.0
100 12.0 14.7
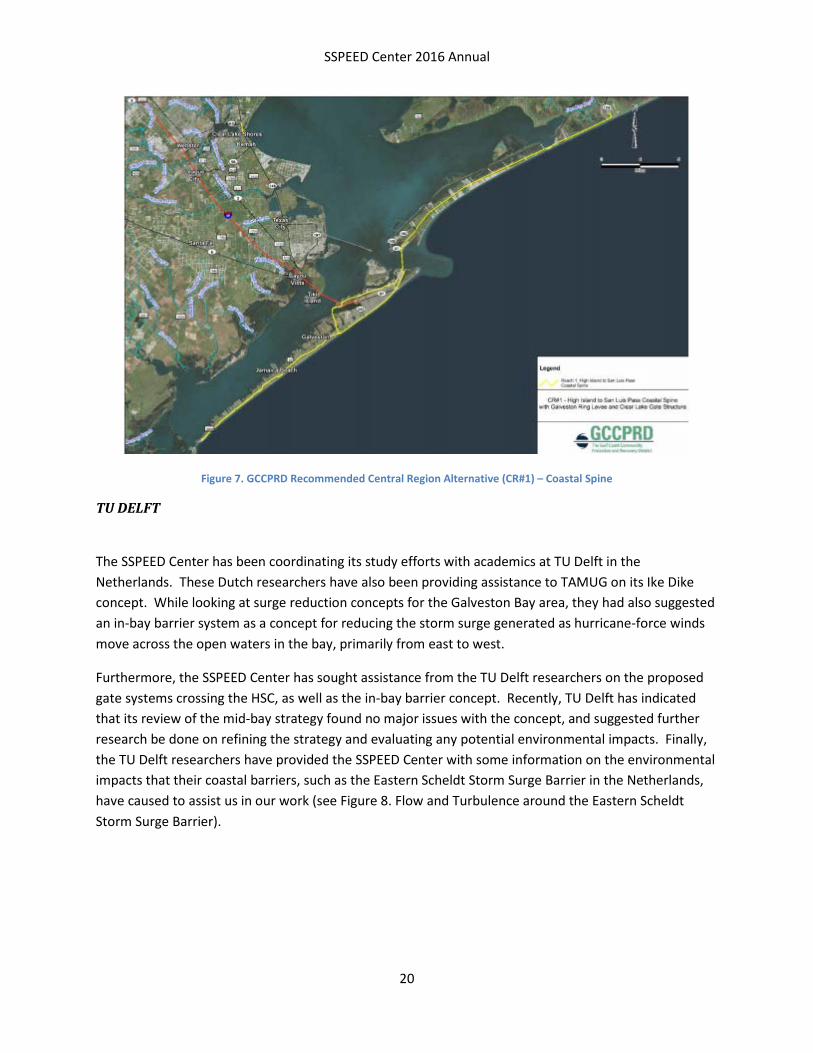
Recently, the GCCPRD issued its final report in June 2016 that recommended its CR#1 Alternative for protecting the Houston-Galveston area, which is its coastal spine concept that is similar to the Ike Dike concept (see Figure 7. GCCPRD Recommended Central Region Alternative (CR#1) – Coastal Spine). This coastal spine plan also includes the raising of the existing Galveston Seawall from 17-feet high to 21-feet high. This report also acknowledges the residual surge that remains even with the coastal spine. In response to this residual surge, the GCCPRD has also included in its recommended plan additional surge protection components, such as a levee around the City of Galveston and a surge gate at Clear Lake. Yet their work did not recognize any residual surge issues in the HSC; however, they were only analyzing surge events up to their 100-year hurricane storm event (for which they may be under-estimating). However, in their final report, the GCCPRD did acknowledge that the SSPEED Center’s H-GAPS Plan, especially its in-bay system components, warranted further investigation.
SSPEED Center 2016 Annual
20
Figure 7. GCCPRD Recommended Central Region Alternative (CR#1) – Coastal Spine
TU DELFT
The SSPEED Center has been coordinating its study efforts with academics at TU Delft in the Netherlands. These Dutch researchers have also been providing assistance to TAMUG on its Ike Dike concept. While looking at surge reduction concepts for the Galveston Bay area, they had also suggested an in-bay barrier system as a concept for reducing the storm surge generated as hurricane-force winds move across the open waters in the bay, primarily from east to west.
Furthermore, the SSPEED Center has sought assistance from the TU Delft researchers on the proposed gate systems crossing the HSC, as well as the in-bay barrier concept. Recently, TU Delft has indicated that its review of the mid-bay strategy found no major issues with the concept, and suggested further research be done on refining the strategy and evaluating any potential environmental impacts. Finally, the TU Delft researchers have provided the SSPEED Center with some information on the environmental impacts that their coastal barriers, such as the Eastern Scheldt Storm Surge Barrier in the Netherlands, have caused to assist us in our work (see Figure 8. Flow and Turbulence around the Eastern Scheldt Storm Surge Barrier).

SSPEED Center 2016 Annual
21
Figure 8. Flow and Turbulence around the Eastern Scheldt Storm Surge Barrier
USACE
The U.S. Army Corps of Engineers (USACE) in Galveston have been working on evaluating the federal interest in surge reduction projects for the Houston-Galveston area. Earlier this year, after their initial study found there was a federal interest, the USACE obtained permission to proceed with a Feasibility Study for the entire Texas coast, including the Houston-Galveston area. This study is on-going, with the GLO serving as the local sponsor. It is anticipated by the USACE that this study will be completed by the year 2021, at which time a federal surge reduction plan will be identified for possible federal funding. It is our understanding that the USACE will be using as much of the information and analyses that they can from those who have been working on this issue, such as the SSPEED Center, TAMUG and GCCPRD.
AECOM / GLO
The GLO also has issued a contract to the engineering firm AECOM to conduct a resiliency study for the Texas coast. The SSPEED Center has met with AECOM representatives who are working on this study to

SSPEED Center 2016 Annual
22
help coordinate these efforts. AECOM has reviewed the SSPEED Center’s H-GAPS Plan and believes it to be a reasonable, sound and doable project.
Texas Joint Legislative Committee
The SSPEED Center was invited to speak before the Texas Joint Legislative Committee this past spring and presented the status of our work and study efforts. During this presentation, the SSPEED Center presented its preliminary findings to date, including its recommended H-GAPS Plan, which was warmly received by the Committee members. TAMUG and the GCCPRD were also invited to speak and they presented their plans, but both acknowledged that there would be residual surge if only a coastal spine were to protect the Houston-Galveston area. Senator Larry Taylor, one of the chairmen to this committee, later noted the importance of providing a complete surge protection system that should include in-bay components (shown below).
Bill, I hope you, as well as others, heard me concur with what you have stated in this letter at our hearing on Monday. The coastal spine is now an agreed to primary protector. However, we need a "system" to complete the protection of our area. If the engineering is proven out, to me the mid bay barriers are more politically feasible and less problematic than the extension of the levee up 146. If we can get agreement from all of our partners on this combined approach we will have attained a singular plan, with buy-in from all, that we can all work together to get through Congress. My ask is that the upcoming report be as inclusive of this "system" and as detailed as possible. I understand that it came in later, but I also understand that the folks from SSPEED have done quite a bit of the engineering on this portion of the project. Hopefully, much of that can be included in the report. Thank you to all of our partners for their efforts in protecting our area from future cataclysmic events. Sincerely, Larry Taylor
City of Houston
Recently, the SSPEED Center was requested to present its plan to a few members of the Houston City Council, as well as the Houston “Flood Czar” (Mr. Steve Costello). Following this presentation, these members expressed interest in the H-GAPS Plan and how it might be implemented quickly, especially for those components that protect the citizens in the Houston area as well as the industrial complex along the HSC. Possible funding mechanisms, including local means, were discussed to help move this surge reduction effort forward to eventual implementation in the near future.
SSPEED Center 2016 Annual
23
1.2.3 Phasing of H-GAPS Plan
Phasing of the H-GAPS Plan
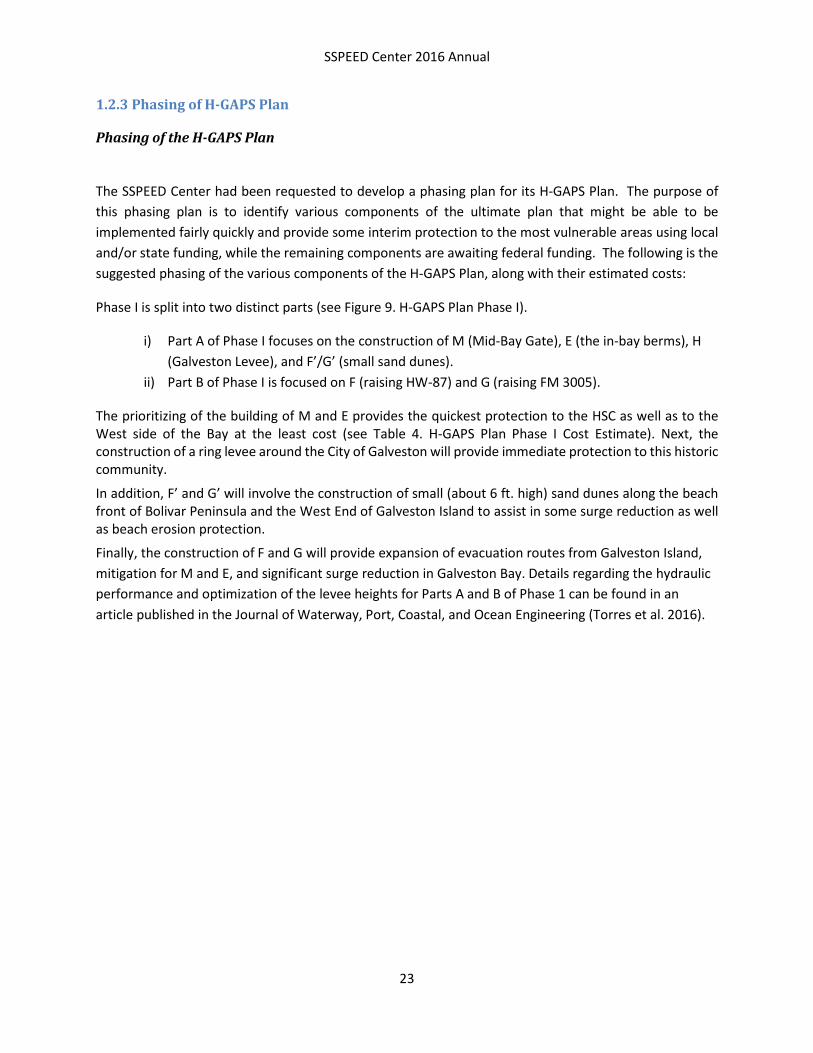
The SSPEED Center had been requested to develop a phasing plan for its H-GAPS Plan. The purpose of this phasing plan is to identify various components of the ultimate plan that might be able to be implemented fairly quickly and provide some interim protection to the most vulnerable areas using local and/or state funding, while the remaining components are awaiting federal funding. The following is the suggested phasing of the various components of the H-GAPS Plan, along with their estimated costs:
Phase I is split into two distinct parts (see Figure 9. H-GAPS Plan Phase I).
i) Part A of Phase I focuses on the construction of M (Mid-Bay Gate), E (the in-bay berms), H (Galveston Levee), and F’/G’ (small sand dunes).
ii) Part B of Phase I is focused on F (raising HW-87) and G (raising FM 3005).
The prioritizing of the building of M and E provides the quickest protection to the HSC as well as to the West side of the Bay at the least cost (see Table 4. H-GAPS Plan Phase I Cost Estimate). Next, the construction of a ring levee around the City of Galveston will provide immediate protection to this historic community.
In addition, F’ and G’ will involve the construction of small (about 6 ft. high) sand dunes along the beach front of Bolivar Peninsula and the West End of Galveston Island to assist in some surge reduction as well as beach erosion protection.
Finally, the construction of F and G will provide expansion of evacuation routes from Galveston Island, mitigation for M and E, and significant surge reduction in Galveston Bay. Details regarding the hydraulic performance and optimization of the levee heights for Parts A and B of Phase 1 can be found in an article published in the Journal of Waterway, Port, Coastal, and Ocean Engineering (Torres et al. 2016).
SSPEED Center 2016 Annual
24
Figure 9. H-GAPS Plan Phase I

SSPEED Center 2016 Annual
25
Table 4. H-GAPS Plan Phase I Cost Estimate
Phase II is split into two distinct parts (see Figure 10. H-GAPS Plan Phase II).
i) Part A of Phase II focuses on the construction of L, the Lower-Bay Gates. It is preferable to begin constructing the navigational gate portion of the Lower-Bay Gates before the environmental gate portion.
ii) Part B of Phase II prioritizes the raising of a portion of the existing Texas City Levee.
Prioritizing the building of the navigational portion of the Lower-Bay Gate is preferred as it has the least cost and the least amount of environmental impact of the two Lower-Bay Gate components (see Table 5. H-GAPS Plan Phase II Cost Estimate). As referenced in Table 5. H-GAPS Plan Phase II Cost Estimate, the total cost of the Lower-Bay gate system is $4.5B, $4B of which is attributed to the construction of the environmental gate, and $0.5B of the cost attributed to the construction of the navigation gate.
Lastly, raising a portion of the existing Texas City Levee (T) is the remaining component of the H-GAPS Plan and serves a key role in completing the in-bay barrier and protecting the area behind the existing levee system.

SSPEED Center 2016 Annual
26
Figure 10. H-GAPS Plan Phase II
Table 5. H-GAPS Plan Phase II Cost Estimate

SSPEED Center 2016 Annual
27
II. Overview of Research on H-GAPS during Second Year (2015-2016) of Phase 3 Study
II.2. Assessing Storm Surge Frequency in Galveston Bay
Establishing the frequency of occurrence (or return period) of storm surge occurring in the Galveston Bay area is necessary for a variety of purposes, including the design and evaluation (e.g. cost-benefit analysis) of proposed storm surge reduction strategies for Galveston Bay. Over the past year, much discussion has surrounded the evaluation of return period surge levels. A summary of the work to date by the SSPEED Center is provided below, which includes developing storm surge frequency information for the Galveston Bay area and comparing the resulting water levels with other available sources of information, including estimates by others. Results from this work were used by the SSPEED Center for selecting reasonable 100-year and 500-year proxy storms based on the developed return frequency information and modeling methods outlined in this report.
The only long-term surge data available in the Galveston Bay area for conducting a frequency analysis is at Galveston Pier 21, located on the back side of the City of Galveston. While the long period-of-record data set available at Galveston Pier 21 (over 100 years) is more than sufficient to establish a reliable estimate of the frequency of occurrence for surge events up to and including the 10-year return period at that location, estimates become less reliable for less frequent events. SSPEED’s H-GAPS study effort this past year involved considering storm surges and potential levels of protection that may easily exceed the 100-year return period, maybe even getting as high as the 10,000-year return period, as is the design level sometimes used by the Dutch for their flood protection structures. As a result, the SSPEED Center investigated what would be the most probable maximum surge level that could be expected in Galveston Bay, to assist us in better understanding the frequency of storm surge across a broad range of probabilities of occurrence (say from the 2-year event up to the 10,000 year event).
Developing Probable Maximum Storm Surge (PMSS) for Houston-Galveston Region
The Probable Maximum Storm Surge (PMSS) is defined as the worst possible surge that can impact a given region. The PMSS was determined for the Houston-Galveston region for use both as a worst-case proxy storm, and to determine an asymptotic upper-limit for surge frequency estimates. The SSPEED Center determined the PMSS for the Houston-Galveston area using data and guidelines provided by Resio et al. (2012), where the PMSS was determined for various nuclear sites along the U.S. coast in a document titled “The estimation of very-low probability hurricane storm surges for design and licensing of nuclear power plants in coastal areas.” That report also noted that such PMSS values can be used for the design of any

SSPEED Center 2016 Annual
28
critical infrastructure facility. One could consider the industrial complex along the HSC as critical infrastructure.
The highest intensity wind speeds selected for this PMSS analysis were 160 mph, based on physical limitations to the minimum pressure a hurricane can develop in the Gulf of Mexico. Various authors have found that hurricanes are limited to developing a minimum pressure of 880 mb in the Gulf of Mexico or roughly 900 mb at landfall based on present-day sea surface temperatures (Emanuel, Resio, etc.). Since pressure and wind speed are directly correlated, a maximum wind speed of 160 mph corresponds to the lowest minimum pressure considered possible at landfall (900 mb). Once the highest wind speed was selected, a lower- and upper-range for the radius to maximum winds of the storms were then selected as being associated with the 160 mph wind intensity. These range of values were selected based on the range of values evaluated for the PMSS at Matagorda Bay (Resio et al. 2012), which were based on the conditional probability between storm size and intensity as described in the IPET study for the Gulf of Mexico (2009).
Since there is significant uncertainty regarding the physical limit a hurricane’s storm size can reach for the 160-mph storm intensity evaluated, this study utilized the surge produced from the storms identified as the lower- and upper-bounds of the PMSS. The maximum surge response of these storms is shown in Table 6. Characteristics of Storms at Pier 21 used for PMSS Analysis) and was used in the surge frequency plot developed at Pier 21. It is worth noting that these lower- and upper-bound estimates of the worst-possible surge do not include tidal effects or sea-level rise. Furthermore, these surge values could increase slightly with faster or slower moving storms. (Find complete report on developing the PMSS for Galveston Bay in Appendix B).
Table 6. Characteristics of Storms at Pier 21 used for PMSS Analysis
Storm ID
Max Wind Speed at Landfall (mph)
Radius to Maximum Winds at Landfall (miles)
Minimum Pressure
at Landfall (mb)
6-hr Forward
Speed (mph)
Angle of Approach (from Due
North)
Radius to Tropical Storm Winds (miles)
Radius to Hurricane
winds (miles)
Max Surge at Coast (ft)
Pier 21 (ft)
Lower-Bound PMSS
160 25.5 900 15 -41 427 174 28.0 24.8
Upper-Bound PMSS
160 38.5 900 15 -41 421 191 32.4 28.7
The results of the PMSS analysis provide a maximum surge level across the Galveston Bay area as shown in Figure 11. Upper-Bound PMSS Results of Maximum Surge). Notice the significant increase in

SSPEED Center 2016 Annual
29
surge level that occurs at the coast as compared to the levels occurring in the north west portions of the bay, including up into the HSC.
Figure 11. Upper-Bound PMSS Results of Maximum Surge
The results of this PMSS analysis provided the upper-limits of the surge frequency curve for the expected storm surge at Pier 21, as shown in Figure 12. Estimated Range of Frequency of Pier 21 based on Historic data and PMSS). (See the report on the development of the surge frequency curve in Appendix A).

SSPEED Center 2016 Annual
30
Figure 12. Estimated Range of Frequency of Pier 21 based on Historic data and PMSS
Given the SSPEED Center’s latest estimate of the storm surge frequency for the Galveston Bay area (i.e. Pier 21), we then compared our estimate to that of others, as shown in Figure 13. Comparison of Return Frequency Curves from SSPEED, FEMA and JSU for Pier 21). As can be seen, the other frequency estimates of storm surge levels in Galveston Bay are much different than the observed surge level data. For example, for the more frequent storm events (say the 10-year surge event), the other estimates are much higher than the observed data shown at Pier 21, while their estimates are much lower for the less frequent event (say the 100-year surge event).

SSPEED Center 2016 Annual
31
Figure 13. Comparison of Return Frequency Curves from SSPEED, FEMA and JSU for Pier 21
II.3. Analyses using Synthetic FEMA Storms
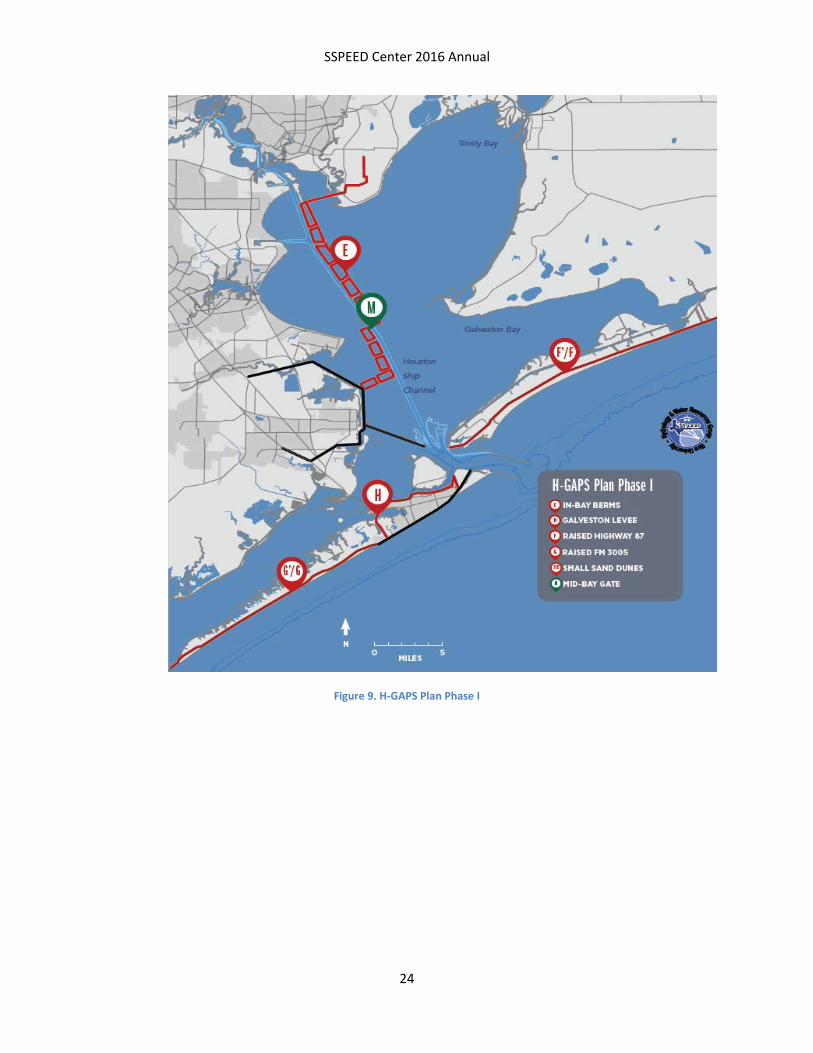
The SSPEED Center had been using a number of hurricanes, both actual and synthetic, in its work in previous years, such as Hurricane Ike and Ike+15. More recently, we have begun to also use some of the synthetic FEMA storms that were being used in the studies by TAMUG and the GCCPRD. For example, SSPEED has used some of the FEMA synthetic storms, such as Storm 033 and 036, which TAMUG and GCCPRD have used as their proxy storms to represent their 100-year and 500-year return period storm events, respectively. SSPEED had been utilizing the wind fields from actual hurricanes such as Hurricane Ike and Hurricane Katrina and moving these hurricanes to landfall at different locations near Galveston (e.g. at the original Ike landfall location p0 and at the originally forecasted location at p7, about 30 miles southwest of the actual landfall). An example of the surge modeling results is shown in Figure 14 for storms 033 and 036, with storm surge protection measures. This shows the need for additional measures beyond just a coastal barrier due to the residual surge in the HSC.
SSPEED Center 2016 Annual
32
Figure 14. Max Water Levels with Surge Protection Measures
Also, when using these FEMA synthetic storms, such as 033 and 036, it was discovered that our surge level results were different than those being obtained by TAMUG and GCCPRD, even though we were all using the state-of-the-art ADCIRC model for computing storm surge. After some investigation into this matter, it became apparent that this difference in surge results was due to the differing wind drag coefficient methods being employed by our ADCIRC modeling work as compared to the ADCIRC modeling studies by others. The SSPEED Center is utilizing the Powell method, the state-of-the-art approach to determining the impact that the hurricane’s winds have on producing storm surge as the winds drag across the water. The other studies used a variation of the older Garratt method, developed in the 1970s, in their ADCIRC modeling work. The results from using these two different methods are not very significant for small and medium sized storms, but for larger storms, the Powell method produces surge levels of about 2-3 feet higher than the Garratt method. This may partly explain why our surge frequency results are higher than those from the GCCPRD and TAMUG for the more intense storms. (see Appendix C).
Analyzing Surge Potential Based on a Hurricane’s Kinetic Energy
To evaluate the appropriateness of using these storms, the SSPEED Center has calculated their potential energy, known as Integrated Kinetic Energy (IKE), to determine if these synthetic storms are reasonable and probable. Powell and Reinhold (2007) proposed the Integrated Kinetic Energy factor (referred to as “the IKE”) to better represent a storm’s size and intensity and capture the destructive potential of a hurricane’s wind and storm surge impacts, rather than the more traditional Saffir-Simpson scale (referring to a hurricane’s strength in terms of Category 1-5).

SSPEED Center 2016 Annual
33
After the devastating hurricane season of 2005, shortcomings with the Saffir-Simpson Hurricane Scale’s (SSHS) ability to characterize a hurricane’s potential to generate storm surge became widely apparent. As a result, several alternative surge indices were proposed to replace the SSHS, including Powell and Reinhold’s Integrated Kinetic Energy (IKE) factor, Kantha’s Hurricane Surge Index (HSI), and Irish and Resio’s Surge Scale (SS). Of these, the IKE factor is the only surge index to date that truly captures a hurricane’s integrated intensity, size, and wind field distribution. However, since the IKE factor was only recently proposed in 2007, the SSPEED Center conducted a quantitative evaluation of the IKE factor’s ability to serve as a predictor of a hurricane’s potential surge impacts as compared to the other alternative surge indices. Using the tightly coupled ARDCIRC+SWAN models, the surge and wave responses of Hurricane Ike (2008) and 78 synthetic hurricanes were evaluated against the SSHS, IKE, HSI and SS approaches. Results of this evaluation along the upper Texas coast of the Gulf of Mexico demonstrate that the IKE approach in accounting for winds greater than tropical storm intensity (IKETS) provides the most accurate estimate of a hurricane’s regional surge impacts. Detailed results from this study can be found in an article in the Journal of Natural Hazards (Bass et al. 2016) (Also see Appendix D).
Analyzing Surge Dynamics in Galveston Bay using Synthetic Storms
Once the SSPEED Center obtained the various FEMA synthetic storms that were used for the preliminary flood insurance mapping work along the Texas and Louisiana coasts, we were able to develop a suite of synthetic storms to use in better understanding the Baseline Conditions in and around Galveston Bay. Detailed figures and discussion from this work can be found in an article currently under-review at the Journal of Coastal Engineering (Bass et al. 2016b); here, a summary of the results is provided.
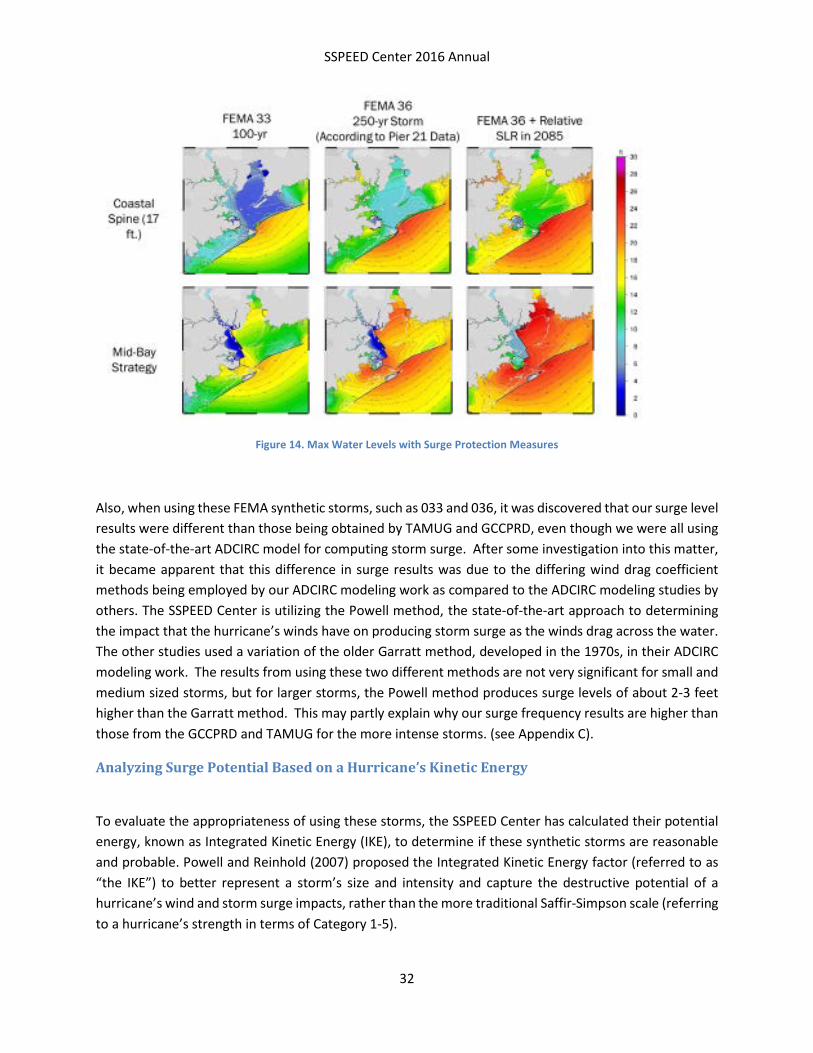
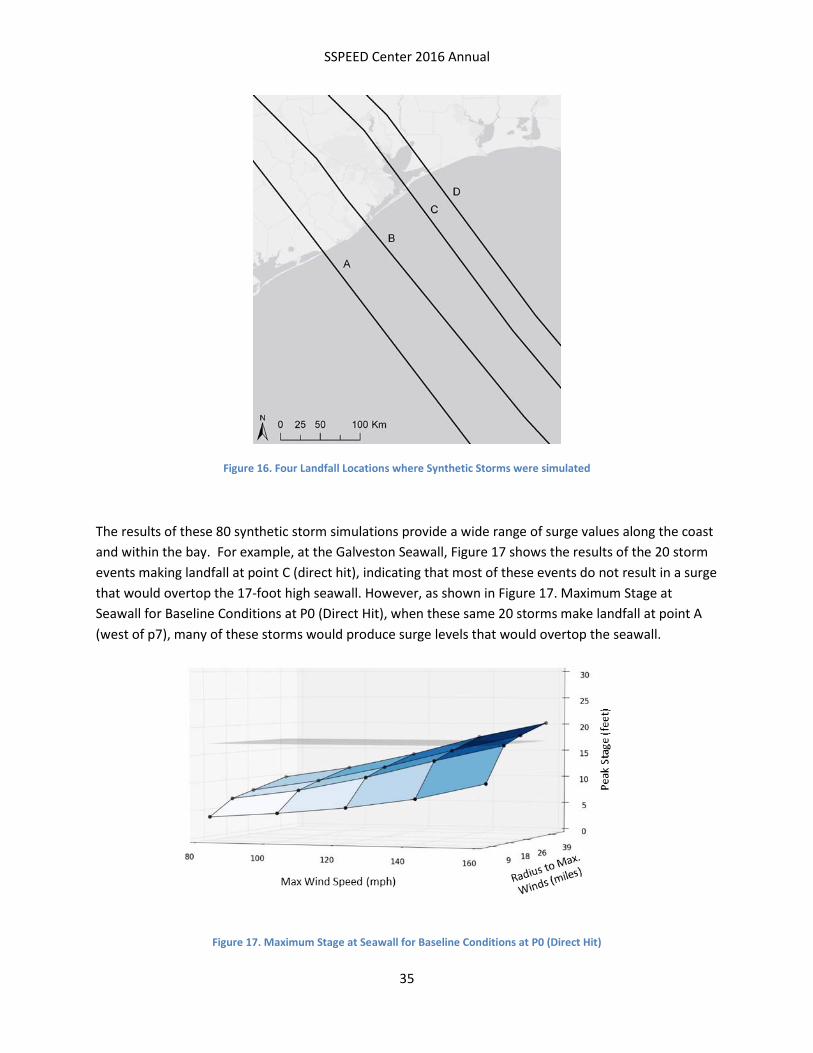
A bay’s coastline is typically made up of various tidal inlets and barrier islands that separate it from the ocean. While estimates of diurnal tidal exchange are generally well-characterized, studies to date have not provided a comprehensive analysis of the volume of surge that can flow across bay coastlines during hurricane events. Such information is important for guiding surge mitigation design, forecasting surge impacts of a given hurricane event, and informing urban development practices in coastal environments. In this second year of our Phase 3 study, a suite of 20 synthetic storms was simulated to characterize the volume of surge that flows across Galveston Bay’s 60-mile coastline, located on the Upper Texas Gulf Coast (see Figure 15. Combination of Storm Intensities and Sizes Simulated for Baseline Conditions as Compared to Historical Storms). These 20 synthetic storms were each simulated to make landfall at 4 different locations near Galveston, as shown in Figure 16. Four Landfall Locations where Synthetic Storms were simulated). This suite of 80 storms, spanning the wide variety of tropical storm intensity (Vmax) and size (Rmax), as well as landfall location, has a greater influence on a storm’s volumetric surge response entering Galveston Bay, compared to just wind intensity (Vmax). This approach potentially has important implications for understanding the regional surge impacts of a given tropical storm event. Additionally, we found non-linear trends in the relative importance of flow across different coastline sections, including the increasing influence of flow across barrier islands, compared to tidal inlets, as storm size and intensity increase and at different landfall locations. Finally, in addition to quantifying the amount of coastal surge that enters Galveston Bay, our study evaluated various levels of localized, wind-driven surge that can
SSPEED Center 2016 Annual
34
develop within the bay itself, highlighting the potential need for a “multiple lines of defense” approach for surge mitigation in the region.
This research represents one of the first analyses of non-linear surge dynamics across tidal inlets and barrier islands of a complex bay coastline, and will help further the scientific community’s current understanding of storm surge interactions across and within bay environments. The methodology and findings of this work can help guide surge mitigation designs for bay environments, forecast regional surge impacts of a given hurricane, and inform urban development practices along coastal environments.
Highlights of this work include the following:
• A suite of 80 storms, spanning the wide variety of tropical storm intensity (Vmax) and size (Rmax) combinations at different landfall locations that are possible for the Upper Texas Coast study region, were simulated using the ADCIRC+SWAN Model;
• Storm size (Rmax) has a great influence on a tropical storm’s volumetric surge response entering Galveston Bay, as compared to just wind intensity (Vmax) alone, which will have important implications for understanding the regional surge impacts of a given tropical storm;
• Demonstrates the non-linear, increasing influence of storm surge flow across barrier islands, as compared to tidal inlets, as storm size and intensity increase; and
• Highlights the levels of localized, wind-driven surge that can develop within a bay itself, suggesting the potential need for a “multiple lines of defense” approach for surge mitigation in such environments.
Figure 15. Combination of Storm Intensities and Sizes Simulated for Baseline Conditions as Compared to Historical Storms
SSPEED Center 2016 Annual
35
Figure 16. Four Landfall Locations where Synthetic Storms were simulated
The results of these 80 synthetic storm simulations provide a wide range of surge values along the coast and within the bay. For example, at the Galveston Seawall, Figure 17 shows the results of the 20 storm events making landfall at point C (direct hit), indicating that most of these events do not result in a surge that would overtop the 17-foot high seawall. However, as shown in Figure 17. Maximum Stage at Seawall for Baseline Conditions at P0 (Direct Hit), when these same 20 storms make landfall at point A (west of p7), many of these storms would produce surge levels that would overtop the seawall.
Figure 17. Maximum Stage at Seawall for Baseline Conditions at P0 (Direct Hit)

SSPEED Center 2016 Annual
36
For a direct hit, only the most intense and largest storms result in over-topping of the Seawall.
Figure 18. Maximum Stage at Seawall for Baseline Conditions a Few Miles West of P7
Thus it was found that various storm size and intensity combinations (i.e. all 120 mph storms with an Rmax greater than 18 miles) begin to result in over-topping of the Seawall for this landfall location. This is one of the reasons for investigating the need for additional protections within the bay.
Future work in characterizing surge impacts to Galveston Bay should account for details in the erosion and breaches that can occur across barrier islands during tropical storms. Furthermore, long-term changes to barrier islands due to sea-level rise, wave action, and accretion should be incorporated in further studies in order to evaluate changes in coastline-bay surge dynamics for future conditions. Finally, this recent work evaluated general trends in coastal storm surge dynamics across Galveston Bay’s complex coastline based on variations in tropical storm size, intensity, and landfall; however, future work should evaluate how the observed trends vary for different tropical storm forward speeds and angles. (Detailed discussion of this work can be found in a paper that will be published in the Journal of Coastal Engineering - Bass et al. 2016b, under-review)
II.4. Improving the Residential Damage Estimates for Baseline Scenario Conditions
In its earlier work, the SSPEED Center had developed an initial estimate of the residential damages for both Baseline Conditions and for the three regional surge reduction strategies or scenarios that had been recommended for further evaluation. During this past year, SSPEED has been working on improving these damage estimates, especially as to the residential damages.
A residential storm surge damage model was developed for Galveston County. The model was used to investigate uncertainty in residential damage estimates under varying initial assumptions of structural

SSPEED Center 2016 Annual
37
elevations. Preliminary results indicated that the model was highly sensitive to such assumptions, and discrepancies between damage estimates approached $2 billion for some scenarios. A survey of home elevations within the county was conducted to correct the initial assumptions. After correction, variability between the estimates decreased significantly, and the results suggested commonly employed elevation assumptions may be prone to damage over-estimation. Additional aspects of uncertainty were then incorporated into the model and an uncertainty analysis (UA) was performed with respect to assumptions of the spatial independence between uncertain model parameters. The UA results showed a large degree of variability between independence assumptions. Finally, a global sensitivity analysis of the model was performed with inconclusive results, as they varied by independence assumption.
This work identified that there may be significant over-estimation of residential damage estimates due to the assumptions of minimum slab elevations or first floor elevations solely based on FEMA compliance information. A method of looking at actual residences via Google Earth and calculating the first floor elevation was developed, which gave a much better estimate than could be obtained by using FEMA compliance information. While actual surveyed slab elevations would be the best information that could be obtained for estimating residential damages, the vastness of this task prevented pursuing it. However, some Elevation Certificates were obtained from Galveston County in order to verify the methodology described above for calculating first floor elevations. (See the full report in Appendix E).
II.5. Refining Industrial Damage Estimates: HSC’s Storage Tank Vulnerability Assessment and Influence of Design Details
The Houston Ship Channel (HSC) has over 4,000 above ground storage tanks (ASTs) that store hazardous substances. Past work has highlighted the vulnerability of these ASTs to storm surge; Figure 19 shows the failure probability of ASTs due to flotation in the Houston Ship Channel for a 25-foot storm surge scenario, wherein a large number of tanks have high failure probabilities for this scenario. Considering the vulnerability of ASTs and the consequences of their failure, recent efforts have primarily focused on improving the safety of ASTs in the Ship Channel region. Furthermore, vulnerability of ASTs to other failure modes such as storm surge buckling is also being assessed.
The SSPEED Center’s past work has highlighted the importance and vulnerability of these ASTs, and the need for protecting them, as well as the population that resides and works along the HSC. In the past year, SSPEED has been investigating measures that might be implemented locally for each AST to reduce its vulnerability and potential failure. Such efforts to improve on the design of ASTs to reduce their failure potential do not replace the need for a more extensive surge protection system for these ASTs; however, there can be enhancements to the current designs of these ASTs that can reduce their vulnerability to failure, both in the short-term as well as for the long-term, as a multiple line of defense.
For example, in order to reduce the failure probability of ASTs, the use of anchor bolts has been investigated. Anchor bolts tie the tanks to their foundation and prevent flotation failures by providing

SSPEED Center 2016 Annual
38
additional resistance against buoyancy forces that uplift tanks. Figure 20. Case Study of AST fragility curves: (a) no anchors; (b) with anchors; and (c) with anchors and a stiffener ring. shows the fragility of a case study tank which is 33-feet (10m) high and has a diameter of 50 feet (15m), representative of tanks in the HSC, in un-anchored and anchored states. The un-anchored tank becomes vulnerable to flotation failure at very low inundation levels; the same tank is relatively less vulnerable to buckling failure. Consequently, the overall failure probability, shown as system failure, is dominated by flotation failure. Comparison of the flotation fragility from Figure 20. Case Study of AST fragility curves: (a) no anchors; (b) with anchors; and (c) with anchors and a stiffener ring. clearly shows that installing anchors reduces the failure probability significantly, although not entirely. However, reduction in flotation fragility does not eliminate the tank’s vulnerability to buckling failure, and correspondingly the system failure of the tank becomes dominated by buckling failure. This observation indicates that anchoring alone may not be sufficient to improve the storm surge safety of the tank as buckling may lead to tank failure. Therefore, in order to improve storm surge buckling performance of ASTs, the use of an additional stiffening ring has been investigated. The extra ring would provide additional stiffness to tanks which improves the buckling performance of ASTs. A methodology has been investigated to design the additional ring which optimizes the section properties and the location of the ring for maximum effect on the buckling performance of ASTs. Using the proposed design method, an additional ring has been designed for the case study tank and Figure 20. Case Study of AST fragility curves: (a) no anchors; (b) with anchors; and (c) with anchors and a stiffener ring.shows the fragility of the anchored tank with the additional stiffening ring. Due to the decrease in buckling fragility, flotation and buckling failure contribute equivalently to the overall failure, which may suggest that the stiffener design is efficient. Overall, installation of the additional ring significantly reduces the system fragility of the tank, as observed from Figure 20. Case Study of AST fragility curves: (a) no anchors; (b) with anchors; and (c) with anchors and a stiffener ring. The results of this investigation suggest that installing anchor bolts and providing an additional stiffening ring can lead to significant improvement in the safety of ASTs that may be exposed to hurricane storm surge inundations, although there is still significant probability of failure for these ASTs from surge inundation.
Although this report presents results for a case study tank, parameterized fragility functions have been developed for flotation and buckling fragility of anchored and un-anchored tanks that can facilitate rapid fragility assessment of the entire portfolio of ASTs in the Houston Ship Channel. Furthermore, a parameterized design equation has been developed for the additional ring which can improve the surge buckling response of ASTs. Future work should focus on assessing resilience metrics of ASTs subjected to storm surges, i.e. their damage levels, repair actions, repair and replacement costs, and expected downtime of ASTs. Also other complex phenomenon should be investigated such as the potential effects of wave action on tank performance.

SSPEED Center 2016 Annual
39
Figure 19. Failure Probability of tanks in HSC under 25 ft. Storm Surge
Figure 20. Case Study of AST fragility curves: (a) no anchors; (b) with anchors; and (c) with anchors and a stiffener ring.
(a) (b) (c)

SSPEED Center 2016 Annual
40
II.6. Environmental Modeling of Potential Spills from HSC Facilities Due to Surge
The effort over the past year was focused on modeling the potential environmental impacts from spills in the Houston Ship Channel (HSC) that would result from storm surge causing damage to one of the above ground storage tanks at an industrial facility. Prior work in previous years had focused on tank surveys, predicting inundation of facilities under different storm and surge scenarios and on relating and assessing damages within the facilities due to storm surge. A GeoDatabase, developed as part of the project, contains detailed information on industrial facilities, their characteristics and tanks and unit processes, in addition to other information on the greater Houston area, the Houston Ship Channel and Galveston Bay. Prior work had developed a regional damage estimation model, known as FEDERAP (Burleson et al., 2015 a & b). Results from FEDERAP for damages related to tank spills were compared to estimates obtained using data from Rice University that estimated tank failure probabilities based on their structural characteristics. The schematic of the FEDERAP Industrial Damage Loss model is found in Figure 20. Schematic of FEDERAP Industrial Damage Loss Model).
Figure 20. Schematic of FEDERAP Industrial Damage Loss Model
The effort summarized in this report describes the development of an EFDC water quality model for the Houston Ship Channel under surge, referred to as EFDC-SS (the original EFDC model for the Houston Ship Channel was developed at U of H by Howell (2013); the original EFDC does not simulate a surge boundary condition). The EFDC-SS model is connected to the ADCIRC model and extracts from ADCIRC model scenarios the surge hydrograph for its grid.
SSPEED Center 2016 Annual
41
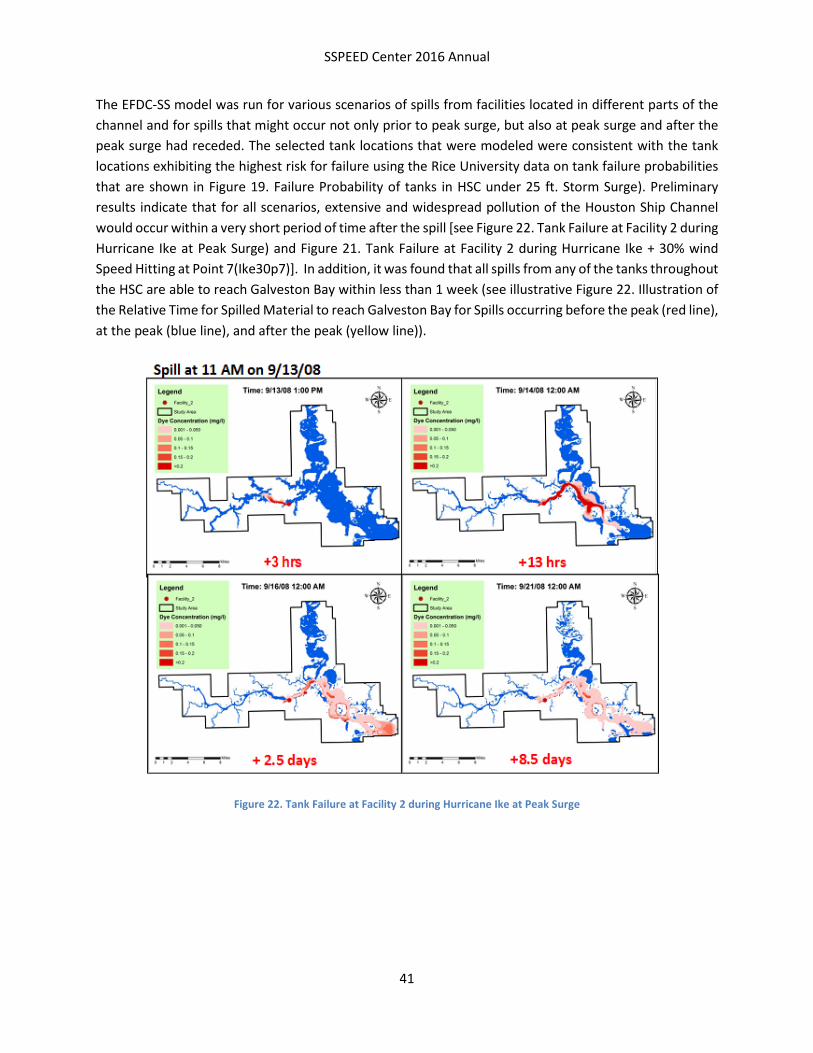
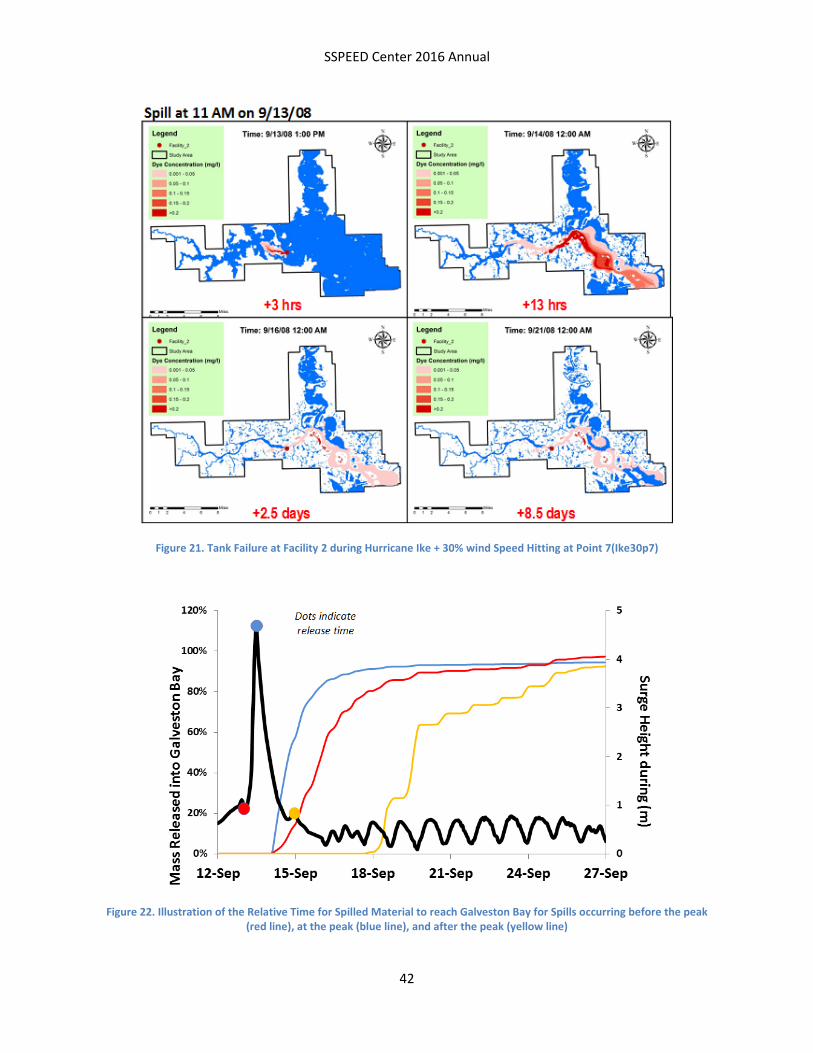
The EFDC-SS model was run for various scenarios of spills from facilities located in different parts of the channel and for spills that might occur not only prior to peak surge, but also at peak surge and after the peak surge had receded. The selected tank locations that were modeled were consistent with the tank locations exhibiting the highest risk for failure using the Rice University data on tank failure probabilities that are shown in Figure 19. Failure Probability of tanks in HSC under 25 ft. Storm Surge). Preliminary results indicate that for all scenarios, extensive and widespread pollution of the Houston Ship Channel would occur within a very short period of time after the spill [see Figure 22. Tank Failure at Facility 2 during Hurricane Ike at Peak Surge) and Figure 21. Tank Failure at Facility 2 during Hurricane Ike + 30% wind Speed Hitting at Point 7(Ike30p7)]. In addition, it was found that all spills from any of the tanks throughout the HSC are able to reach Galveston Bay within less than 1 week (see illustrative Figure 22. Illustration of the Relative Time for Spilled Material to reach Galveston Bay for Spills occurring before the peak (red line), at the peak (blue line), and after the peak (yellow line)).
Figure 22. Tank Failure at Facility 2 during Hurricane Ike at Peak Surge
SSPEED Center 2016 Annual
42
Figure 21. Tank Failure at Facility 2 during Hurricane Ike + 30% wind Speed Hitting at Point 7(Ike30p7)
Figure 22. Illustration of the Relative Time for Spilled Material to reach Galveston Bay for Spills occurring before the peak (red line), at the peak (blue line), and after the peak (yellow line)

SSPEED Center 2016 Annual
43
Future work will analyze how these spills would migrate into Galveston Bay and how the H-GAPS Plan might positively impact the spreading of such a spill, and instead be contained within the in-bay barrier system.
II.7. Biggerts-Waters Act and Federal Flood Insurance Policies and Costs
As part of our Phase 3 study, the SSPEED Center is investigating the impacts of the Biggerts-Waters Act, a recently passed federal law that involved increasing flood insurance premiums along coastal communities to eventually reach a full-risk rate rather than the current federally subsidized rate. In addition, SSPEED is evaluating other options to this Act in order to provide appropriate insurance protection while not adversely impacting existing and future policy holders.
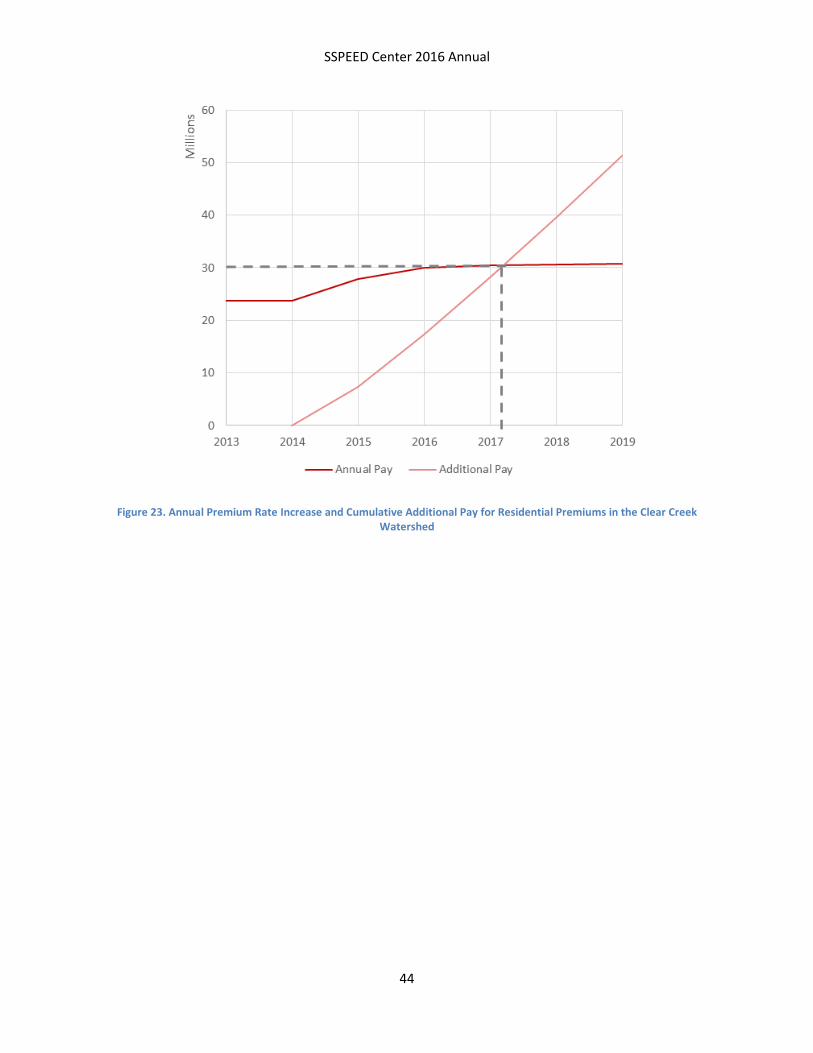
In the past year, the SSPEED Center has been evaluating how insurance premium amounts might increase under this new federal law by using the Clear Creek area as a test case. For example, an effort was undertaken to calculate the new HFIAA premium amounts for each policy that was active during 2013. In 2013, the Clear Creek watershed contained 49,086 NFIP premiums that have either a manual rate method or a preferred risk rate. Residential NFIP premiums for the Clear Creek watershed will increase by a total of $7.3 million or roughly an average increase of $149 per policy. Currently, the Clear Creek watershed residential policies pay a combined annual rate of $23.7 million in NFIP premiums or approximately $483 per policy. This rate will increase by no more than 25% annually (18% for most policies) until the policies reach their full-risk rate. The new, HFIAA adjusted, combined annual rate for the Clear Creek Watershed will be approximately $31 million (or $632 per policy) which will be reached by 2017 (see Figure 23. Annual Premium Rate Increase and Cumulative Additional Pay for Residential Premiums in the Clear Creek Watershed). In Figure 23. Annual Premium Rate Increase and Cumulative Additional Pay for Residential Premiums in the Clear Creek Watershed two lines are plotted: the darker red is the annual combined rate and the lighter red is the cumulative additional amount paid. By 2017, the cumulative additional amount paid in NFIP premiums will equal the total amount paid in 2013 (see Summary Report in Appendix F).
SSPEED Center 2016 Annual
44
Figure 23. Annual Premium Rate Increase and Cumulative Additional Pay for Residential Premiums in the Clear Creek Watershed
SSPEED Center 2016 Annual
45
III. Discussion of Key Environmental Issues
There are several key types of environmental impacts that may be generated by the various surge reduction alternatives under discussion. There are estuarine impacts to the placement of various gate and/or structures within Galveston Bay and/or Bolivar Roads. There are beach and island impacts from constructing levees on both Galveston Island and the Bolivar Peninsula. And there are impacts within the City of Galveston for construction of the back-side levee. A major concern exists concerning the impacts of these various structural alternatives to the Galveston Bay system and to the fish and wildlife resources of the bay. In order to construct the lower bay (coastal spine/Ike Dike) alternative, a navigation structure will need to be placed across the Houston Ship Channel portion and an “environmental” gate of some type will need to be constructed across the remaining 9,000 feet of Bolivar Roads. A key design issue here is the percentage of the existing opening within Bolivar Roads that will be permanently closed or blocked off with the “environmental” gate. Several issues arise here. First, what will the impact of this structure be upon bay tides and circulation. Second, what will the impact of this structure be upon bay salinity and sedimentation patterns. Third, what will the impact of this structure be on various fish and shellfish that utilize Bolivar Roads as part of their life cycle, including the movement of planktonic life-forms from the Gulf to the bay en-route to the marshes and other nursery areas that make Galveston Bay so productive. Additionally, the endangered Kemp’s ridley sea turtle moves between the Gulf and the bay through the pass as do marine mammals which have their own statute intended to protect them. All of these bay circulation and fish and shellfish life cycle impacts must be evaluated through computer modeling and expert consultation with agency and university professionals.
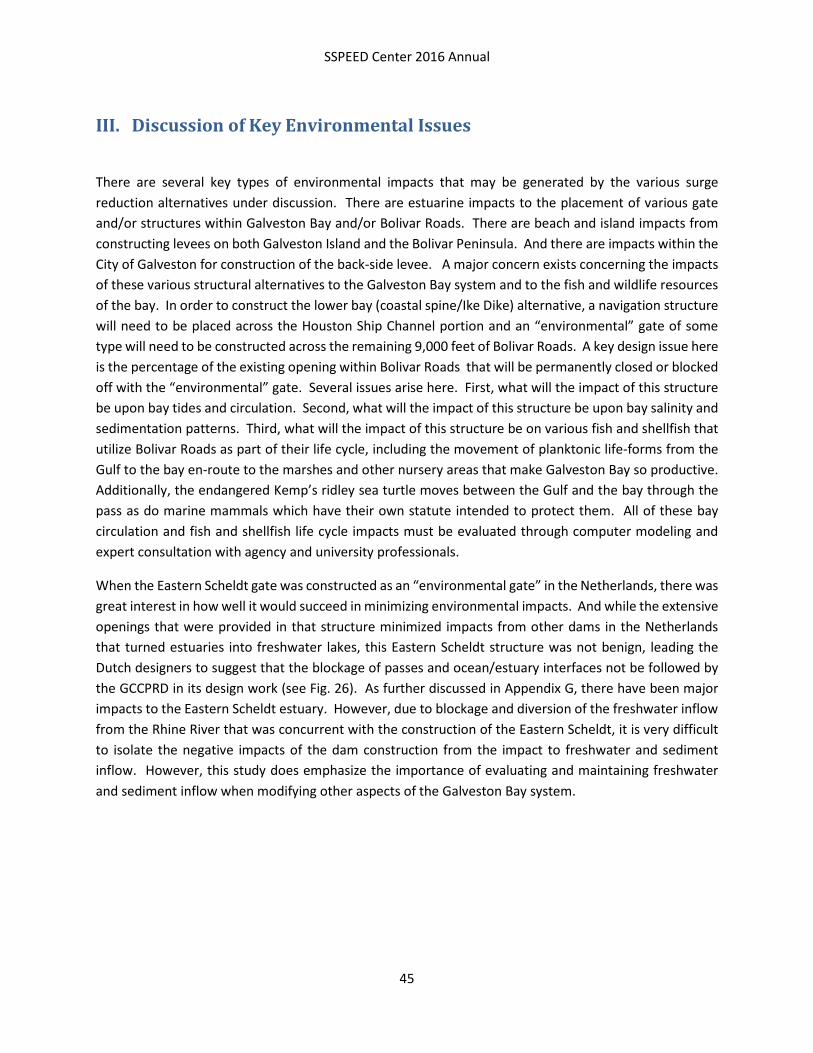
When the Eastern Scheldt gate was constructed as an “environmental gate” in the Netherlands, there was great interest in how well it would succeed in minimizing environmental impacts. And while the extensive openings that were provided in that structure minimized impacts from other dams in the Netherlands that turned estuaries into freshwater lakes, this Eastern Scheldt structure was not benign, leading the Dutch designers to suggest that the blockage of passes and ocean/estuary interfaces not be followed by the GCCPRD in its design work (see Fig. 26). As further discussed in Appendix G, there have been major impacts to the Eastern Scheldt estuary. However, due to blockage and diversion of the freshwater inflow from the Rhine River that was concurrent with the construction of the Eastern Scheldt, it is very difficult to isolate the negative impacts of the dam construction from the impact to freshwater and sediment inflow. However, this study does emphasize the importance of evaluating and maintaining freshwater and sediment inflow when modifying other aspects of the Galveston Bay system.
SSPEED Center 2016 Annual
46
Figure 24. The Semi-permeable Eastern Scheldt Barrier is part of the Delta Works, a series of construction projects that protect the Dutch Southwestern Delta from storm surge. The Eastern Scheldt estuary, which was partly closed off in 1986, has a surface of about 350 km2 with a mean tidal range at the mouth of 2.5 meters. Images courtesy of Lodewijk de Vet.
With regard to the Mid-Bay alternative, there are issues concerning potential impacts of the proposed 25-foot in-bay barrier that is associated with dredge material disposal and wetland construction on existing oyster reefs. These reefs proliferate in the mid-bay region of the Galveston Bay system as well as along the edges of the Houston Ship Channel. These impacts and avoidance, minimization and mitigation design solutions need to be fully evaluated along with any circulation and navigation impacts that may arise from these in-bay barriers.
Construction of the coastal spine barrier system on the West end of Galveston Island and on Bolivar Peninsula raises a number of issues depending upon where these barriers are located. At least three different locations for these barriers have been proposed, including TAMUG’s beachfront sand-dune/levee, SSPEED Center’s elevated FM 3005 and Hwy 87 roadways, and the GCCPRD’s proposed levees located north of those roadways. Each of these concepts and locations have very distinct and different impacts.
In order to construct the sand-dune/beach levee to an elevation of 17 feet in front of the existing front row of houses, much if not all of the existing beach will be lost to the project and a new beach is proposed to be developed, depending on the location, availability and cost of significant amounts of sand. Here, the major issue will be impacts to the nesting endangered Kemp’s ridley sea turtle, the impacts to the endangered piping plover as well as the impact to high bird usage areas in and around San Luis Pass. Under the Endangered Species Act, critical habitat has been officially designated at Bolivar Flats, East Beach Lagoon and San Luis Pass. Additionally, there are major bird sanctuaries at Bolivar Flats, East Lagoon, San Luis Pass and High Island. All of these impacts must be evaluated and disclosed.
Elevation of the roadways will involve fewer natural impacts, but may impact adjacent homes and businesses, depending upon the design. Finally, construction of the levee system north of the roadways will likely encounter wetland issues, again depending upon specific location. All of this needs to be evaluated in detail.
Another major issue with levee construction is the need to fully understand the impacts upon private property rights. Under recent Texas Supreme Court and 5th Circuit case law, private property rights extend beyond the dune system to the wet beach line, a major change of prior law that had established a public

SSPEED Center 2016 Annual
47
easement to the vegetation line. Any beach front levee will need to be evaluated with regard to impacts on private property. With regard to a levee north of the roadways, there is existing right-of-way that should lessen although not eliminate the need to obtain private property. And no right of way exists at this time north of FM 3005. In all three cases, these levees will be disruptive. That is why public participation and buy-in is so important.
Finally, with regard to levee systems, there is some support for beach nourishment and sand dune construction to about six or seven feet on the beach side and a road system elevated to about 12 feet rather than 17 feet. These are the types of solutions that may emerge from public discussion and involvement in the process as per NEPA as well as the Endangered Species Act.
SSPEED Center 2016 Annual
48
IV. Texas Coastal Exchange
The Texas Coastal Exchange (TCX) was conceived as a non-structural hurricane surge damage reduction concept that is based upon restoring natural areas and creating a market to pay the land owners for providing ecosystem services through the establishment of a voluntary exchange. Over time, this concept has emerged as a mechanism to address several of the most important issues of the early 21st century, including flood damage mitigation, water quantity and quality enhancement, climate change, and fish and wildlife conservation while assisting in providing economic resilience in the farm and ranch community and the oil and gas industry. In short, by restoring natural systems through the creation of a voluntary private sector market, it may be possible to make significant progress in addressing several key issues of the 21st Century.
The idea for the TCX emerged from two key observations collected from post-Hurricane Ike documentation of impacts and damages on Galveston Island and Bolivar Peninsula. Aerial flyovers that were conducted days after Ike made landfall showed that hurricane surge water continued to pour off of the low-lying coastal plain and wetlands back into Galveston Bay and the Gulf of Mexico. From this aerial view and subsequent computer modeling, it became clear that this low-lying coastal plain stored vast quantities of surge water without incurring massive damages such as occurred elsewhere on the coast. In addition,, the plan prepared for Bolivar Peninsula recovery post-Hurricane Ike indicated that there was an interest in generating additional sources of income from low-lying wetlands and prairies on the bay-side of the peninsula. These two observations led the SSPEED Center team to search for methods to store storm surge water and generate income for landowners, leading to the concept of TCX as well as a companion concept, the Lone Star Coastal National Recreation Area (described in detail in earlier reports to the Endowment).
Over the past two years, the project team has been investigating innovative concepts that would financially support landowners to conserve their low-lying coastal prairie, wetlands, and woodlots on the upper Texas coast to provide critical storage and attenuation of storm surge flooding generated from severe storm events in the region. This investigation led the project team to investigate several different types of natural systems, including oyster reefs, coastal wetlands, coastal prairies and bottomland hardwoods, as well as specialty habitat creation options for their ecosystem services benefits. The initial area of interest for the TCX was the approximate 2 million acres at or below the 20-foot elevation contour adjacent to Galveston Bay and the Gulf of Mexico in Chambers, Galveston, Brazoria and Matagorda Counties as shown in Figure 25. Coastal Lands within 20-ft Contour Line). This 20-foot elevation was chosen because it comprises the reach of the reasonably expected 100-year storm surge along the upper Texas coast, without consideration of sea level rise or increasing storm intensity. This geographic area could provide a significant buffer for the rest of the region if this land can be conserved in its natural form. In order for this land to remain undeveloped, and therefore function as a storm surge buffer, financial opportunities need to be created to incentivize land owners to conserve their land.
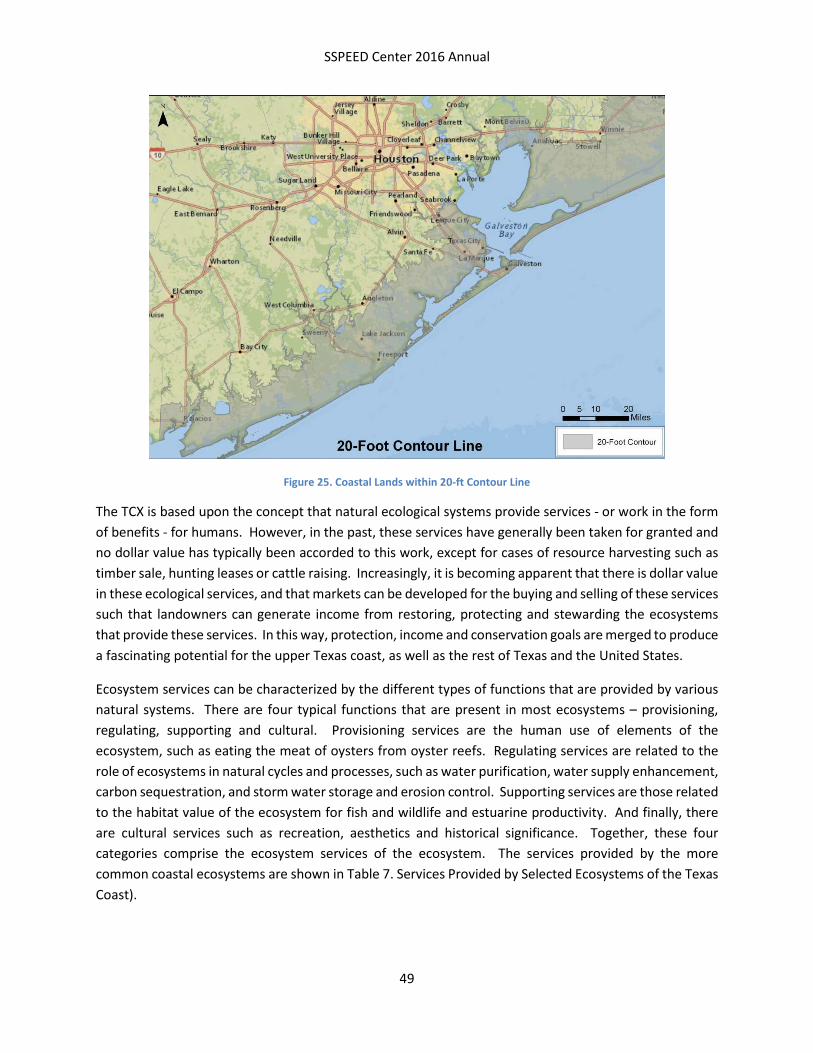
SSPEED Center 2016 Annual
49
Figure 25. Coastal Lands within 20-ft Contour Line
The TCX is based upon the concept that natural ecological systems provide services - or work in the form of benefits - for humans. However, in the past, these services have generally been taken for granted and no dollar value has typically been accorded to this work, except for cases of resource harvesting such as timber sale, hunting leases or cattle raising. Increasingly, it is becoming apparent that there is dollar value in these ecological services, and that markets can be developed for the buying and selling of these services such that landowners can generate income from restoring, protecting and stewarding the ecosystems that provide these services. In this way, protection, income and conservation goals are merged to produce a fascinating potential for the upper Texas coast, as well as the rest of Texas and the United States.
Ecosystem services can be characterized by the different types of functions that are provided by various natural systems. There are four typical functions that are present in most ecosystems – provisioning, regulating, supporting and cultural. Provisioning services are the human use of elements of the ecosystem, such as eating the meat of oysters from oyster reefs. Regulating services are related to the role of ecosystems in natural cycles and processes, such as water purification, water supply enhancement, carbon sequestration, and storm water storage and erosion control. Supporting services are those related to the habitat value of the ecosystem for fish and wildlife and estuarine productivity. And finally, there are cultural services such as recreation, aesthetics and historical significance. Together, these four categories comprise the ecosystem services of the ecosystem. The services provided by the more common coastal ecosystems are shown in Table 7. Services Provided by Selected Ecosystems of the Texas Coast).
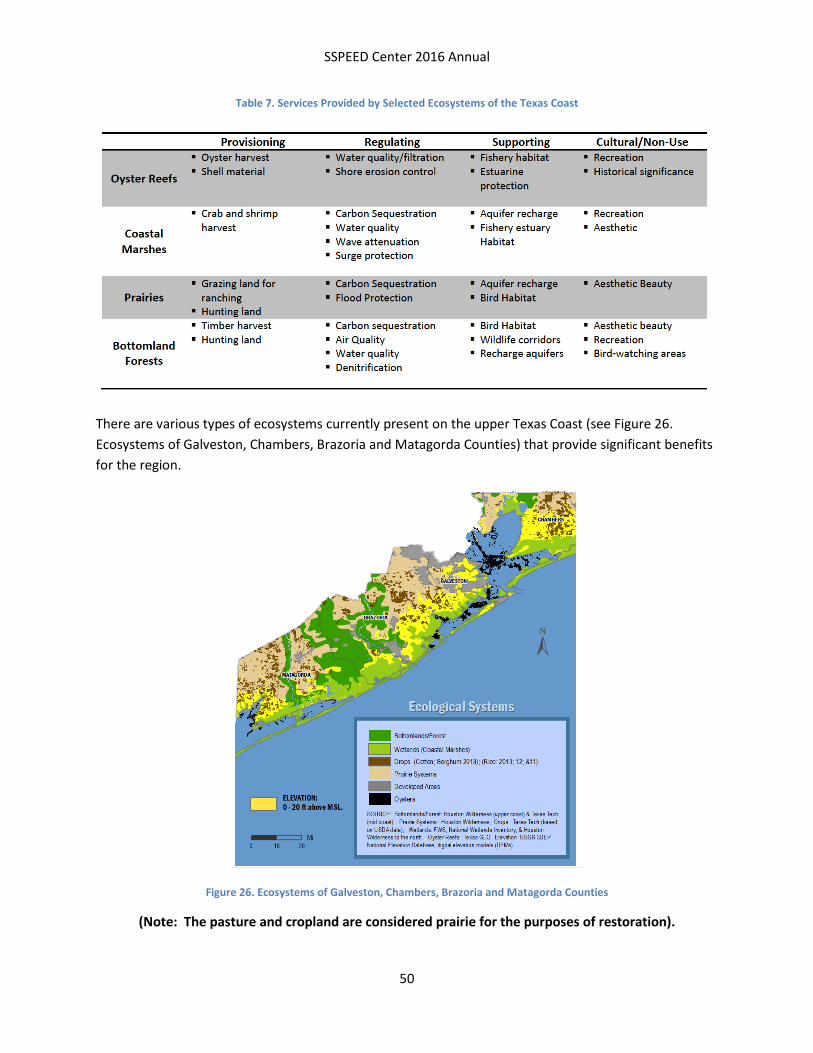
SSPEED Center 2016 Annual
50
Table 7. Services Provided by Selected Ecosystems of the Texas Coast
There are various types of ecosystems currently present on the upper Texas Coast (see Figure 26. Ecosystems of Galveston, Chambers, Brazoria and Matagorda Counties) that provide significant benefits for the region.
Figure 26. Ecosystems of Galveston, Chambers, Brazoria and Matagorda Counties
(Note: The pasture and cropland are considered prairie for the purposes of restoration).
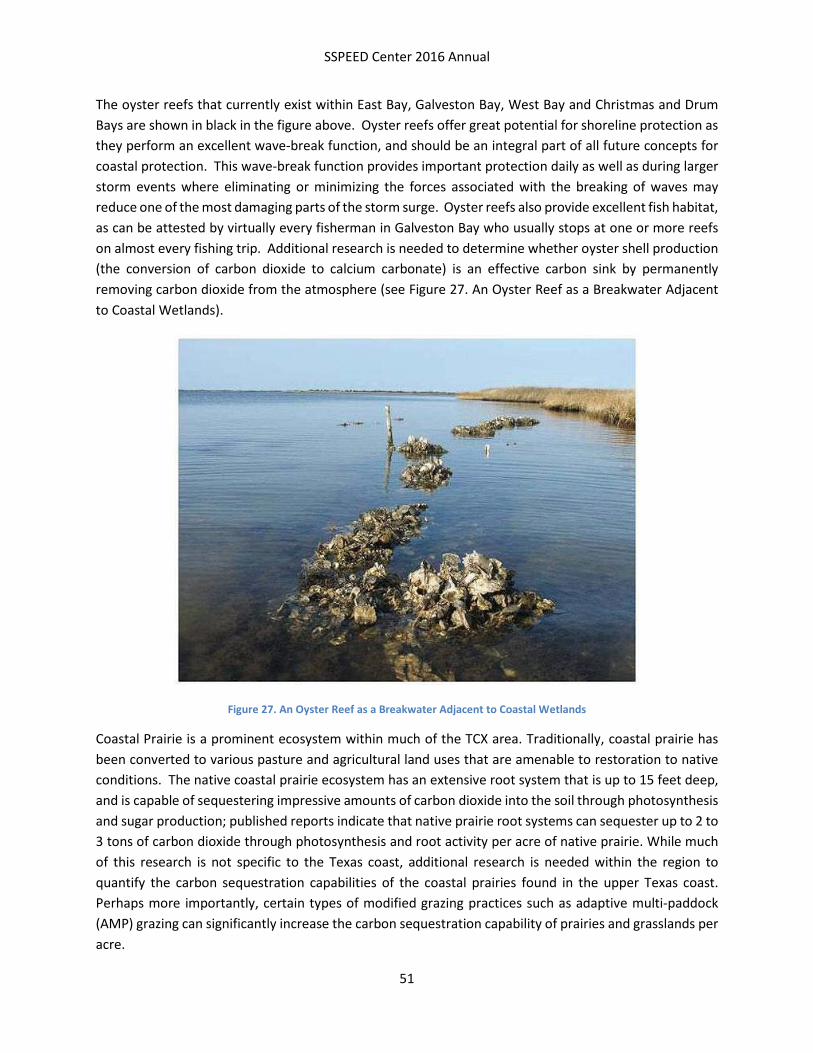
SSPEED Center 2016 Annual
51
The oyster reefs that currently exist within East Bay, Galveston Bay, West Bay and Christmas and Drum Bays are shown in black in the figure above. Oyster reefs offer great potential for shoreline protection as they perform an excellent wave-break function, and should be an integral part of all future concepts for coastal protection. This wave-break function provides important protection daily as well as during larger storm events where eliminating or minimizing the forces associated with the breaking of waves may reduce one of the most damaging parts of the storm surge. Oyster reefs also provide excellent fish habitat, as can be attested by virtually every fisherman in Galveston Bay who usually stops at one or more reefs on almost every fishing trip. Additional research is needed to determine whether oyster shell production (the conversion of carbon dioxide to calcium carbonate) is an effective carbon sink by permanently removing carbon dioxide from the atmosphere (see Figure 27. An Oyster Reef as a Breakwater Adjacent to Coastal Wetlands).
Figure 27. An Oyster Reef as a Breakwater Adjacent to Coastal Wetlands
Coastal Prairie is a prominent ecosystem within much of the TCX area. Traditionally, coastal prairie has been converted to various pasture and agricultural land uses that are amenable to restoration to native conditions. The native coastal prairie ecosystem has an extensive root system that is up to 15 feet deep, and is capable of sequestering impressive amounts of carbon dioxide into the soil through photosynthesis and sugar production; published reports indicate that native prairie root systems can sequester up to 2 to 3 tons of carbon dioxide through photosynthesis and root activity per acre of native prairie. While much of this research is not specific to the Texas coast, additional research is needed within the region to quantify the carbon sequestration capabilities of the coastal prairies found in the upper Texas coast. Perhaps more importantly, certain types of modified grazing practices such as adaptive multi-paddock (AMP) grazing can significantly increase the carbon sequestration capability of prairies and grasslands per acre.

SSPEED Center 2016 Annual
52
With respect to water, the root system of native prairies, as shown in Figure 30. Root System of Selected Prairie Grasses (not all from the Texas Coast). Scale on side is in feet.creates a lattice of pores and pathways that can store significant amounts of water in near-surface soil reservoirs as well as in surface depressions. This system creates a “reservoir” in the soil that has the potential to reduce runoff and peak flows from larger storm events as well as augment seeps and springs through later flow within the soil system. Specific upper Texas coast data on these service functions are not available at this time.
Additionally, a restored native prairie also has the ability to produce native fauna along with the flora, including bees, monarch butterflies, bob white quail and numerous songbirds (although again, metrics from our area are lacking) relating to the supporting and cultural ecosystem services.
Figure 30. Root System of Selected Prairie Grasses (not all from the Texas Coast). Scale on side is in feet.
A third coastal ecosystem found along the upper Texas coast is the coastal salt-water and brackish wetlands. These wetlands form the first landward ecosystem moving in from the bays and the Gulf. These wetlands are salt tolerant, and also have a distinct root system which sequesters carbon into the soil at rates higher than the native prairie, with reported amounts indicating upwards of 3 to 4 tons of carbon dioxide per acre of wetland. Marsh protection is a necessary action to prevent marsh erosion and to keep stored carbon from being oxidized and released as carbon dioxide. Some studies report in excess of 100 tons of carbon dioxide per acre can be attributed to marsh protection. These saline marshes also play an important role in the life-cycle of many marine species. Studies of marsh productivity indicate that about 11,000 white shrimp, 12,000 brown shrimp, and 9000 blue crabs per acre are provided habitat in coastal marshes at various times of the year. These wetlands are also home to numerous fish-eating and other wading birds; waterfowl hunters for centuries have known about the waterfowl usage of these marshes.
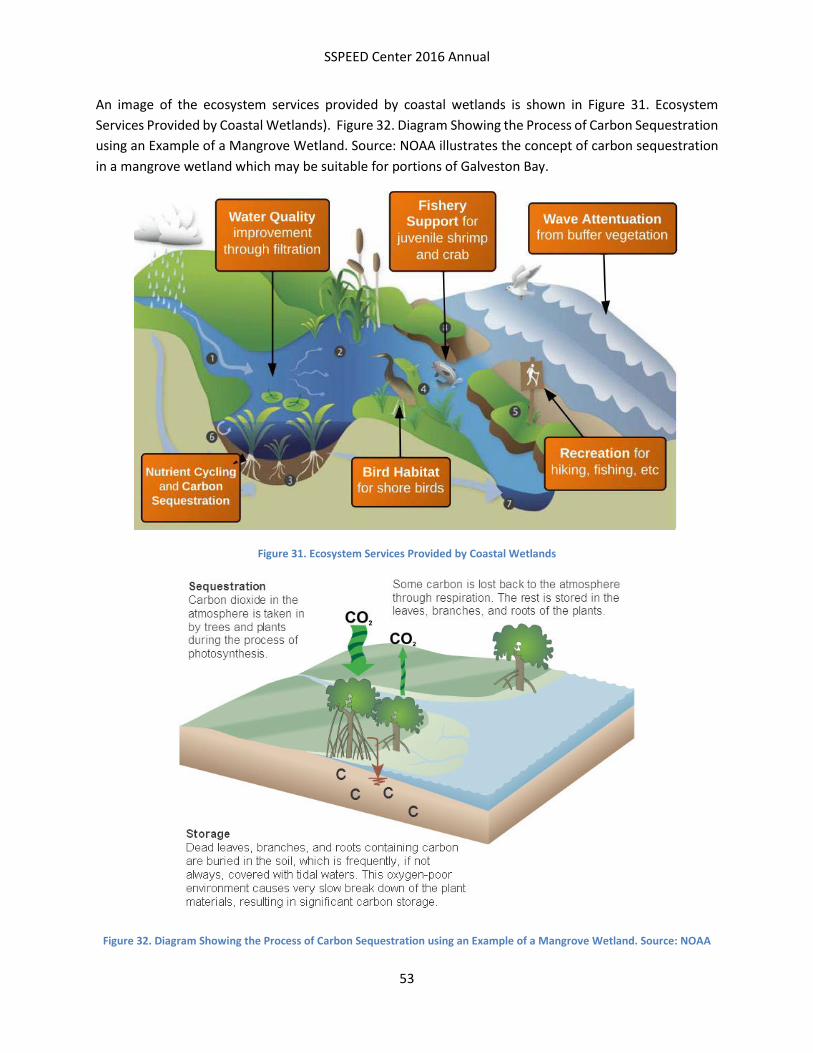
SSPEED Center 2016 Annual
53
An image of the ecosystem services provided by coastal wetlands is shown in Figure 31. Ecosystem Services Provided by Coastal Wetlands). Figure 32. Diagram Showing the Process of Carbon Sequestration using an Example of a Mangrove Wetland. Source: NOAA illustrates the concept of carbon sequestration in a mangrove wetland which may be suitable for portions of Galveston Bay.
Figure 31. Ecosystem Services Provided by Coastal Wetlands
Figure 32. Diagram Showing the Process of Carbon Sequestration using an Example of a Mangrove Wetland. Source: NOAA
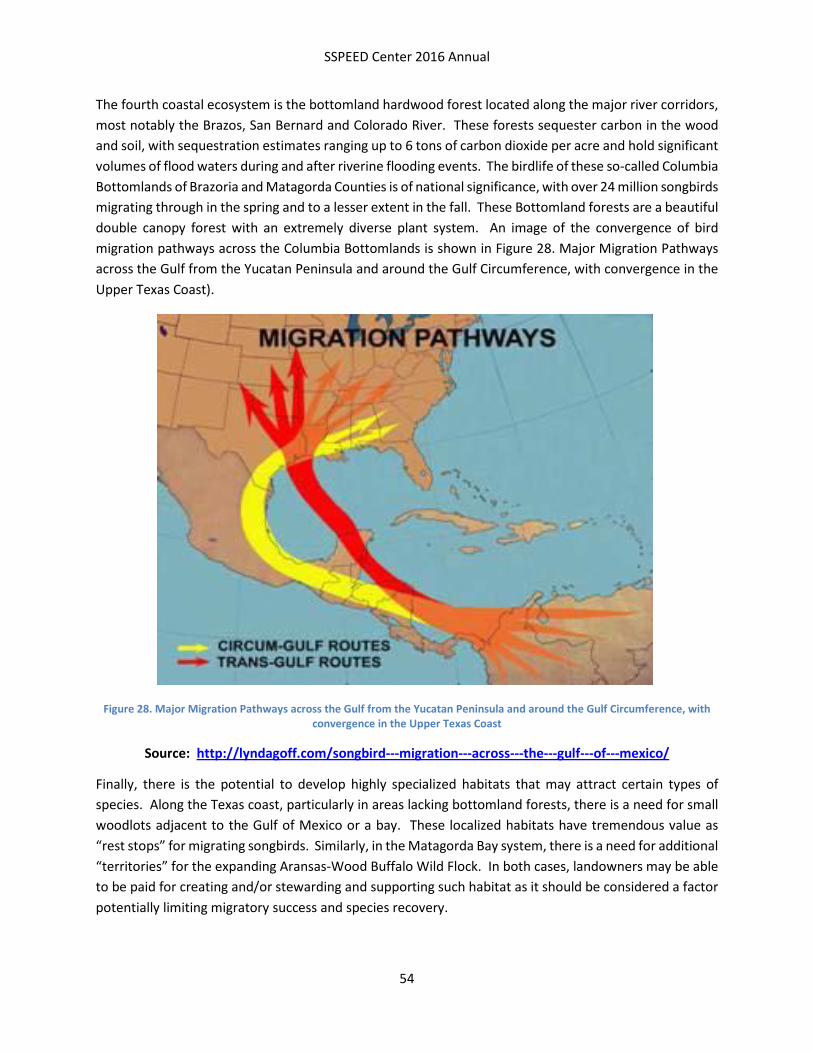
SSPEED Center 2016 Annual
54
The fourth coastal ecosystem is the bottomland hardwood forest located along the major river corridors, most notably the Brazos, San Bernard and Colorado River. These forests sequester carbon in the wood and soil, with sequestration estimates ranging up to 6 tons of carbon dioxide per acre and hold significant volumes of flood waters during and after riverine flooding events. The birdlife of these so-called Columbia Bottomlands of Brazoria and Matagorda Counties is of national significance, with over 24 million songbirds migrating through in the spring and to a lesser extent in the fall. These Bottomland forests are a beautiful double canopy forest with an extremely diverse plant system. An image of the convergence of bird migration pathways across the Columbia Bottomlands is shown in Figure 28. Major Migration Pathways across the Gulf from the Yucatan Peninsula and around the Gulf Circumference, with convergence in the Upper Texas Coast).
Figure 28. Major Migration Pathways across the Gulf from the Yucatan Peninsula and around the Gulf Circumference, with convergence in the Upper Texas Coast
Source: http://lyndagoff.com/songbird---migration---across---the---gulf---of---mexico/
Finally, there is the potential to develop highly specialized habitats that may attract certain types of species. Along the Texas coast, particularly in areas lacking bottomland forests, there is a need for small woodlots adjacent to the Gulf of Mexico or a bay. These localized habitats have tremendous value as “rest stops” for migrating songbirds. Similarly, in the Matagorda Bay system, there is a need for additional “territories” for the expanding Aransas-Wood Buffalo Wild Flock. In both cases, landowners may be able to be paid for creating and/or stewarding and supporting such habitat as it should be considered a factor potentially limiting migratory success and species recovery.
SSPEED Center 2016 Annual
55
There is no doubt that the rich ecological systems of the coastal low-lying areas have a tremendous potential to provide ecological services if protected and/or restored. The more difficult part is to identify and develop the markets by which potential service users will begin to pay for these services. The good news is that such a market is developing, and may be ready for implementation in the not-too-distant future. See Appendix H for more information on TCX and the development of a marketplace for ecological services.

SSPEED Center 2016 Annual
56
V. Meetings and Public Outreach
The SSPEED Center’s public outreach efforts help to build public awareness on the risks of severe storms and hurricanes, as well as mitigation strategies. The Center’s public outreach initiatives include media outreach, notable events and meetings, e-Newsletters and online outreach.
Media Outreach
SSPEED has hit a new record of media hits in 2016 as its team has captured media coverage from more than 1,170 media hits ranging from local to international outlets that include coverage from television, print, radio and online sources.
Notable Events
In April 2016, nearly 150 people attended the two-day SSPEED Conference, "Avoiding Disasters: How to Reduce the Impacts from the Next Big Storm" hosted at Rice University in late April. The attendants ranged from academics, to community leaders, environmentalists, engineers, concerned citizens and members of the media.
Education is a key component to the SSPEED Center and in June 2016, the SSPEED Center partnered with the Young Owls Leadership Program to teach more than 60 inner-city Houstonian high school students about engineering through hands-on projects. The first was building water rockets to learn how water is used as fuel and the second project was to build bridges using K’nex construction sets to see how much weight it could hold.
Notable Meetings
SSPEED Center representatives have had meetings with various stakeholders across the region this past year. Our notable meetings include the Houston Endowment, the Texas General Land Office, City of Houston, Port of Houston Authority, U.S. Army Corps of Engineers and the Houston-Galveston Area Council. The SSPEED Center has also formalized its partnership with TU Delft- The Netherlands through the National Science Foundation (NSF)- Partnerships of International Research & Education (PIRE) grant, which provides students affiliated with the SSPEED Center at Rice the opportunity for site-based research in the Netherlands.

SSPEED Center 2016 Annual
57
e-Database Outreach
SSPEED has also promoted our research milestones and notable events by distributing e-Newsletters to our database of nearly 2,000 contacts from industry, partners, civic organizations and community leaders. Our data shows that our emails usually maintain a higher open and engagement rate compared to our industry average.
Online Outreach
The SSPEED Center website showcases the latest events, proposals and opportunities to engage with the center. Over the past year, the SSPEED website attracted about 340 visits each month and nearly 70 percent are first-time visitors.

SSPEED Center 2016 Annual
58
VI. Future Work
V.1. Year 3 of Phase III of Current Funding
During the final year of our Phase 3 study for the Houston Endowment, the SSPEED Center is planning on conducting some further refinement to its H-GAPS Plan, and the phasing of it. In addition, we plan on completing our analysis of the Biggerts-Waters Act, as well as perform some preliminary work on our evaluation of the environmental impacts due to spills entering into Galveston Bay. Finally, we will begin our evaluation of the environmental impacts on salinity in Galveston Bay due to some of the H-GAPS Plan components. A list of this future work is presented below.
a. Further refinement of the H-GAPS Plan and Phasing b. Biggerts-Waters Analysis c. Preliminary Environmental Spill Results and Impacts d. Preliminary Environmental Analysis of H-GAPS Plan Components
V.2. Future Needs
Following completion of our Phase 3 study for the Houston Endowment, the SSPEED Center has been requested by the City of Houston and others to continue its work on its H-GAPS Plan. For example, the 6-County Surge District (GCCPRD) noted in its Final Report dated June 2016 that it recognized the additional protection provided by the H-GAPS Plan, and stated regarding this plan:
“… To optimize the recommended alignment, additional modeling and technical analysis would need to occur to validate the required elevation of in-bay features, access potential environmental impacts, determine construction and operations and maintenance costs, and economic benefits.”(pg. 26).
In addition, the GCCPRD stated that it expected to continue to coordinate with the SSPEED Center as we continued our research on this H-GAPS Plan. In discussions with them, they have asked that we continue with our research so as to further refine and develop our plan and its various components, especially as to their alignment, elevations, environmental impacts, costs and benefits.
The City of Houston has also expressed interest in our efforts to further develop our H-GAPS Plan, and its phasing, towards possible implementation. Mayor Turner has expressed support for a regional surge protection system having “Multiple Lines of Defense”, which includes a coastal spine. This is consistent with our H-GAPS Plan, and one that the GCCPRD has stated “warrants further evaluation”.
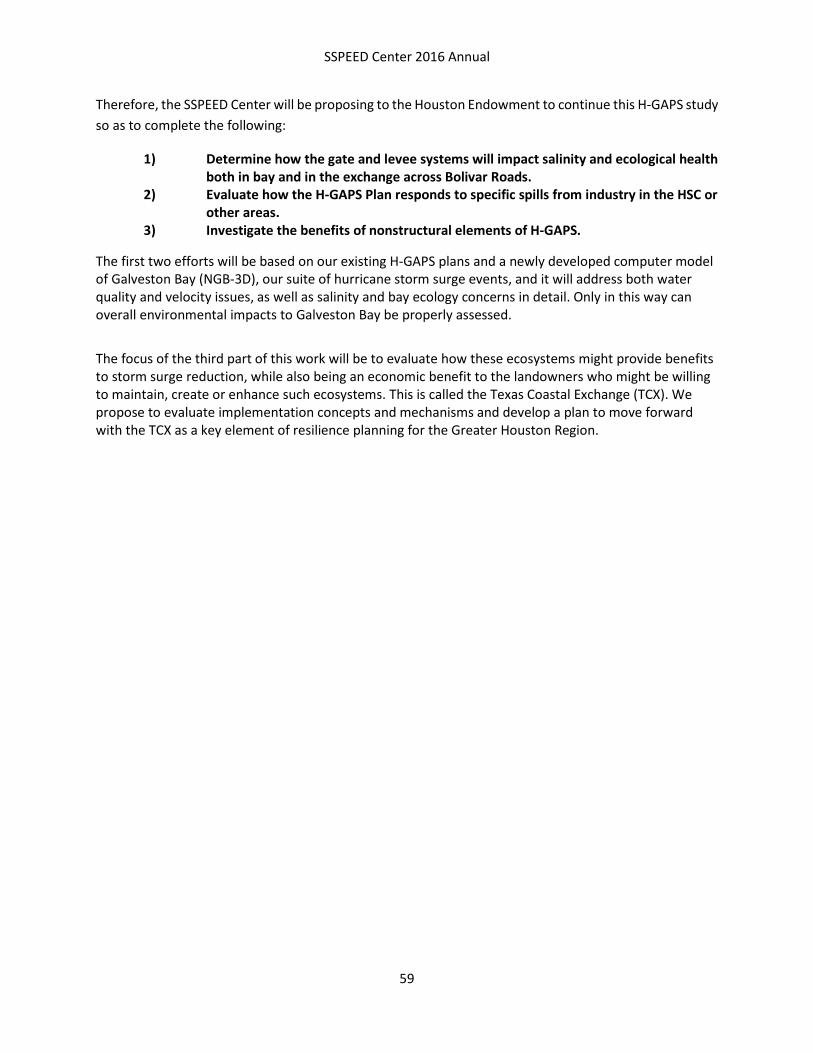
SSPEED Center 2016 Annual
59
Therefore, the SSPEED Center will be proposing to the Houston Endowment to continue this H-GAPS study so as to complete the following:
1) Determine how the gate and levee systems will impact salinity and ecological health both in bay and in the exchange across Bolivar Roads.
2) Evaluate how the H-GAPS Plan responds to specific spills from industry in the HSC or other areas.
3) Investigate the benefits of nonstructural elements of H-GAPS.
The first two efforts will be based on our existing H-GAPS plans and a newly developed computer model of Galveston Bay (NGB-3D), our suite of hurricane storm surge events, and it will address both water quality and velocity issues, as well as salinity and bay ecology concerns in detail. Only in this way can overall environmental impacts to Galveston Bay be properly assessed.
The focus of the third part of this work will be to evaluate how these ecosystems might provide benefits to storm surge reduction, while also being an economic benefit to the landowners who might be willing to maintain, create or enhance such ecosystems. This is called the Texas Coastal Exchange (TCX). We propose to evaluate implementation concepts and mechanisms and develop a plan to move forward with the TCX as a key element of resilience planning for the Greater Houston Region.

SSPEED Center 2016 Annual
60
References Bass, B., Irza, J.N., Proft, J., Bedient, P., and Dawson, C (2016). Fidelity of the Integrated Kinetic Energy Factor as an Indicator of Storm Surge Impacts. Natural Hazards. DOI: 10.1007/s11069-016-2587-3.
Bass, B., Torres, J., Irza, J.N., Proft, J., Sebastian, A., Dawson, C., and Bedient, P. Surge Dynamics across a Complex Bay Coastline, Galveston Bay, TX (2016b, Under-Review). Coastal Engineering.
Black, P. G., D’Asaro, E. A., Sanford, T. B., Drennan, W. M., Zhang, J. A., French, J. R., Niiler, P. P., Terrill, E. J., and Walsh, E. J. (2007). AirSea Exchange in Hurricanes: Synthesis of Observations from the Coupled Boundary Layer AirSea Transfer Experiment. Bulletin of the American Meteorological Society, 88(3):357–374. Blain, C., Westerink, J., Luettich, R., and Scheffner, Norman, W. (1994). Report 4: Hurricane Storm Surge Modeling Using Large Domains. Technical report, US Army Corps of Engineers. Blain, C. A. and Westerink, J. J. (1994). The influence of domain size on the response characterisitcs of a hurricane surge model. Geophysical Research, 99:467–479. Bunya, S., Dietrich, J. C., Westerink, J. J., Ebersole, B. A., Smith, J. M., Atkinson, J. H., Jensen, R., Resio, D. T., Luettich, R. A., Dawson, C., Cardone, V. J., Cox, A. T., Powell, M. D., Westerink, H. J., and Roberts, H. J. (2010). A High-Resolution Coupled Riverine Flow, Tide, Wind, Wind Wave, and Storm Surge Model for Southern Louisiana and Mississippi. Part I: Model Development and Validation. Monthly Weather Review, 138(2):345–377. Dietrich, J. C., Westerink, J. J., Kennedy, a. B., Smith, J. M., Jensen, R. E., Zijlema, M.,Holthuijsen, L. H., Dawson, C., Luettich, R. a., Powell, M. D., Cardone, V. J., Cox, a. T., Stone, G. W., Pourtaheri, H., Hope, M. E., Tanaka, S., Westerink, L. G., Westerink, H. J., and Cobell, Z. (2011). Hurricane Gustav (2008) Waves and Storm Surge: Hindcast, Synoptic Analysis, and Validation in Southern Louisiana. Monthly Weather Review, 139(8):2488–2522. FEMA, 2007. Atlantic Ocean and Gulf of Mexico Coastal Guidelines.
FEMA, 2015. Guidance on Coastal Floodplain Mapping.
FEMA, 2012. Flood Insurance Study: Galveston County, Texas, and incorporated areas.
Garratt, J. R. (1977). Review of Drag Coefficients over Oceans and Continents. Hock, T. F. and Franklin, J. L. (1999). The NCAR GPS Dropwindsonde. Bulletin of the American Meteorological Society, 80(3):407–420. Holthuijsen, L. H., Powell, M. D., and Pietrzak, J. D. (2012). Wind and waves in extreme hurricanes. Journal of Geophysical Research: Oceans, 117(9):1–15. Hope, M. E., Westerink, J. J., Kennedy, a. B., Kerr, P. C., Dietrich, J. C., Dawson, C., Bender, C. J., Smith, J. M., Jensen, R. E., Zijlema, M., Holthuijsen, L. H., Luettich, R. a., Powell, M. D., Cardone, V. J., Cox, a. T., Pourtaheri, H., Roberts, H. J., Atkinson, J. H., Tanaka, S., Westerink, H. J., and Westerink, L. G. (2013).
SSPEED Center 2016 Annual
61
Hindcast and validation of Hurricane Ike (2008) waves, forerunner, and storm surge. Journal of Geophysical Research: Oceans, 118(2008):4424–4460. Irish, J.L., Resio, D.T., Cialone, M. a., 2009. A surge response function approach to coastal hazard
assessment. Part 2: Quantification of spatial attributes of response functions. Nat. Hazards 51, 183–205. doi:10.1007/s11069-009-9381-4
Jarosz, E., Mitchell, D. A., Wang, D. W., and Teague, W. J. (2007). Bottom-up determination of air-sea momentum exchange under a major tropical cyclone. Science (New York, N.Y.), 315(5819):1707–1709. Large, W. G. and Pond, S. (1981). Open Ocean Momentum Flux Measurements in Moderate to Strong Winds. Powell, M. D. (2006). Drag coefficient distribution and wind speed dependence in tropical cyclones. Technical report. Powell, M. D., Vickery, P. J., and Reinhold, T. a. (2003). Reduced drag coefficient for high wind speeds in tropical cyclones. Nature, 422(6929):279–283.
Powell, M.D. and Reinhold, T.A. (2007). Tropical cyclone destructive potential by integrated kinetic energy. Bulletin of the American Meteorological Society, 88(4): 513-526.
Powell, Mark D. (2012). Use cases for IKE from Operational Quantities. http://www.aoml.noaa.gov/hrd/ike/Calculator_AllQuad.php.
Resio, D.T., Irish, J., Cialone, M., 2009. A surge response function approach to coastal hazard assessment – part 1: basic concepts. Nat. Hazards 51, 163–182. doi:10.1007/s11069-009-9379-y
Resio, D.T., Wamsley, M.C., and Massey, T.C. (2012). “The estimation of very-low probability hurricane storm surges for design and licensing of nuclear power plants in coastal areas.” United States Nuclear Regulatory Commission.
Sebastian, A., Proft, J., Dietrich, J.C., Du, W., Bedient, P.B., Dawson, C.N., 2014. Characterizing hurricane
storm surge behavior in Galveston Bay using the SWAN+ADCIRC model. Coast. Eng. 88, 171–181. doi:10.1016/j.coastaleng.2014.03.002
Sebastian, A. et al. (2014). Characterizing hurricane storm surge behavior in galveston bay using the SWAN+ADCIRC model. Coastal Engineering, 88: 171-181.
Torres, J.M., Bass, B., Irza, J.N., Proft, J., Sebastian, A., Dawson, C., and Bedient, P (2016, Accepted, Pending Proof). Modeling the Hydrodynamic Performance of a Conceptual Storm Surge Barrier System for the Galveston Bay Region. Journal of Waterway, Port, Coastal, and Ocean Engineering.
Wright, C. W., Walsh, E. J., Vandemark, D., Krabill, W. B., and Garcia, a. W. (2001).Hurricane Directional Wave Spectrum Spatial Variation in the Open Ocean. J. Phys. Oceanogr, 31(2001):2472–2489. Zachry, B. C., Schroeder, J. L., Kennedy, A. B., Westerink, J. J., Letchford, C. W., and Hope, M. E. (2013). A Case Study of Nearshore Drag Coefficient Behavior during Hurricane Ike (2008). Journal of Applied Meteorology and Climatology, 52(9):2139–2146.

SSPEED Center 2016 Annual
62
Appendices
Appendix A: Assessing Storm Surge Frequency in Galveston Bay
Appendix B: Probable Maximum Storm Surge (PMSS) for Houston-Galveston Region
Appendix C: Review of Wind Speed and Wind Drag
Appendix D: Integrated Kinetic Energy (IKE) Calculation
Appendix E: Addressing Uncertainty in Residential Damage Estimates from Tropical Cyclone Storm Surge, with a Focus on Variability in Structure Elevations
Appendix F: Impact of HFIAA on Residential NFIP Premiums
Appendix G: The Eastern Scheldt Survey: Sources of interest on the barrier and its effects
Appendix H: Texas Coastal Exchange