Embed Size (px)
Citation preview
2016 South Florida Environmental Report Chapter 6
6-49
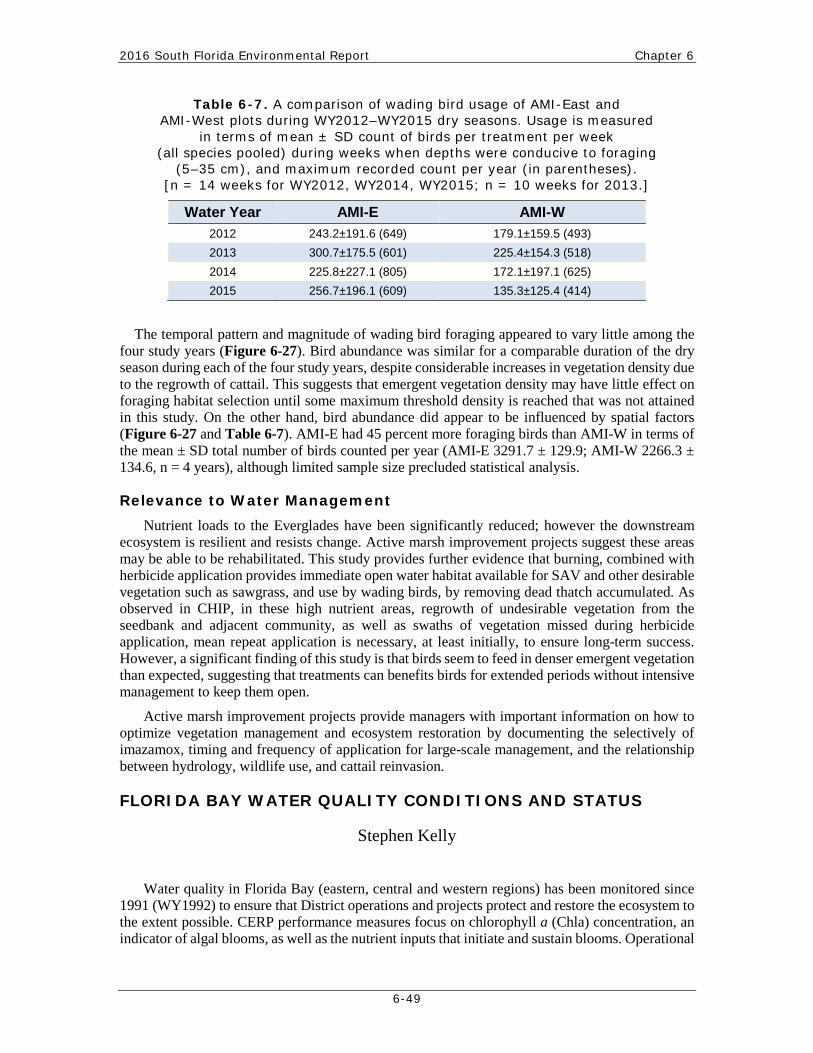
Table 6-7. A comparison of wading bird usage of AMI-East and AMI-West plots during WY2012–WY2015 dry seasons. Usage is measured
in terms of mean ± SD count of birds per treatment per week (all species pooled) during weeks when depths were conducive to foraging
(5–35 cm), and maximum recorded count per year (in parentheses). [n = 14 weeks for WY2012, WY2014, WY2015; n = 10 weeks for 2013.]
Water Year AMI-E AMI-W 2012 243.2±191.6 (649) 179.1±159.5 (493) 2013 300.7±175.5 (601) 225.4±154.3 (518) 2014 225.8±227.1 (805) 172.1±197.1 (625) 2015 256.7±196.1 (609) 135.3±125.4 (414)
The temporal pattern and magnitude of wading bird foraging appeared to vary little among the four study years (Figure 6-27). Bird abundance was similar for a comparable duration of the dry season during each of the four study years, despite considerable increases in vegetation density due to the regrowth of cattail. This suggests that emergent vegetation density may have little effect on foraging habitat selection until some maximum threshold density is reached that was not attained in this study. On the other hand, bird abundance did appear to be influenced by spatial factors (Figure 6-27 and Table 6-7). AMI-E had 45 percent more foraging birds than AMI-W in terms of the mean ± SD total number of birds counted per year (AMI-E 3291.7 ± 129.9; AMI-W 2266.3 ± 134.6, n = 4 years), although limited sample size precluded statistical analysis.
Relevance to Water Management Nutrient loads to the Everglades have been significantly reduced; however the downstream
ecosystem is resilient and resists change. Active marsh improvement projects suggest these areas may be able to be rehabilitated. This study provides further evidence that burning, combined with herbicide application provides immediate open water habitat available for SAV and other desirable vegetation such as sawgrass, and use by wading birds, by removing dead thatch accumulated. As observed in CHIP, in these high nutrient areas, regrowth of undesirable vegetation from the seedbank and adjacent community, as well as swaths of vegetation missed during herbicide application, mean repeat application is necessary, at least initially, to ensure long-term success. However, a significant finding of this study is that birds seem to feed in denser emergent vegetation than expected, suggesting that treatments can benefits birds for extended periods without intensive management to keep them open.
Active marsh improvement projects provide managers with important information on how to optimize vegetation management and ecosystem restoration by documenting the selectively of imazamox, timing and frequency of application for large-scale management, and the relationship between hydrology, wildlife use, and cattail reinvasion.
FLORIDA BAY WATER QUALITY CONDITIONS AND STATUS
Stephen Kelly
Water quality in Florida Bay (eastern, central and western regions) has been monitored since 1991 (WY1992) to ensure that District operations and projects protect and restore the ecosystem to the extent possible. CERP performance measures focus on chlorophyll a (Chla) concentration, an indicator of algal blooms, as well as the nutrient inputs that initiate and sustain blooms. Operational
Chapter 6 Volume I: The South Florida Environment
6-50
changes to the South Dade Conveyance System including implementation of the C-111 South Dade Project, Modified Water Deliveries to ENP (especially Tamiami Trail modifications), and the C-111 Spreader Canal Western Project, which became operational during WY2013, will further change freshwater flow patterns and may alter downstream water quality. As in WY2014, conditions during WY2015 have not changed significantly and presented here is a brief update of ecologically important parameters and how they have changed in WY2015. For a complete description of water quality assessments in Florida Bay, refer to Chapter 6 of the 2015 South Florida Environmental Report (SFER) – Volume I (Sklar and Dreschel, 2015).
Water samples and physical parameters (temperature, salinity, conductivity, pH, and dissolved oxygen) are collected every other month at all sites. Samples are collected at 0.5 m below the surface and processed according to the SFWMD Field Sampling Quality Manual (SFWMD 2015c) following Florida Department of Environmental Protection (FDEP) protocols. Physical parameters are collected with a calibrated multi-parameter water quality sonde following SFWMD protocols. Samples are processed on site, stored on ice, and shipped overnight to the SFWMD Analytical Lab in West Palm Beach for analysis according to the SFWMD Chemistry Laboratory Quality Manual (SFWMD 2015b) and following FDEP protocols. All sample results are quality assured before being uploaded to the District’s corporate environmental database, DBHYDRO.
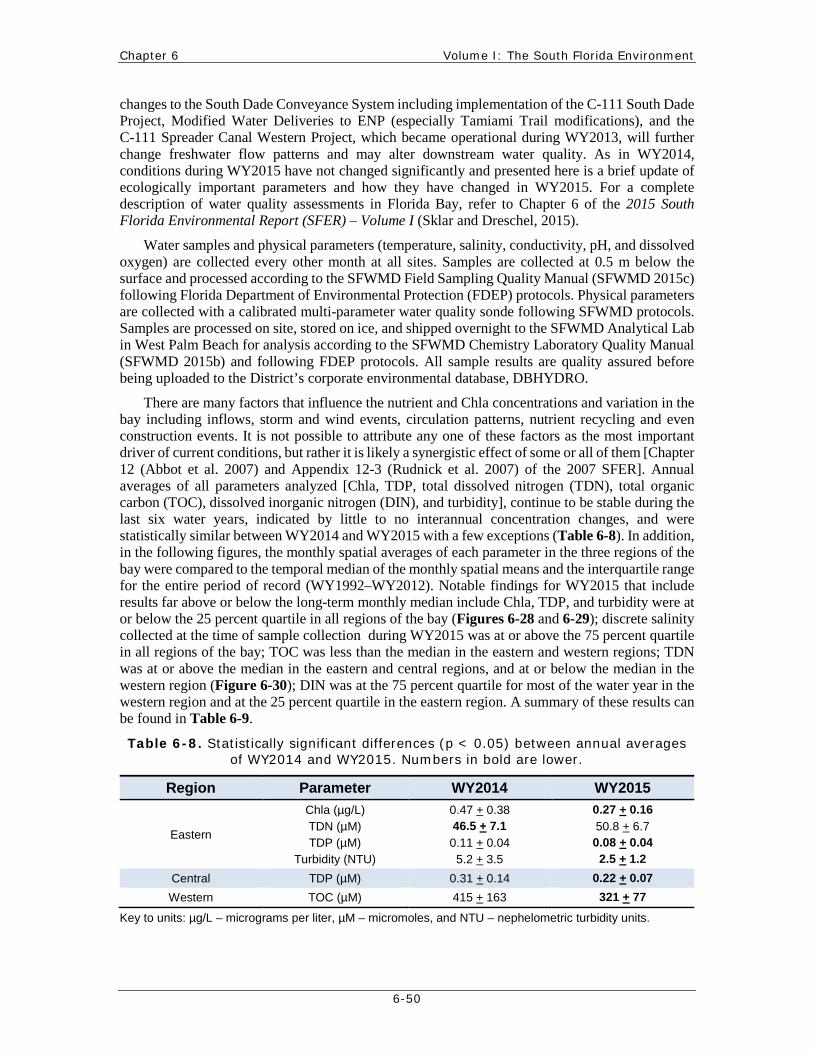
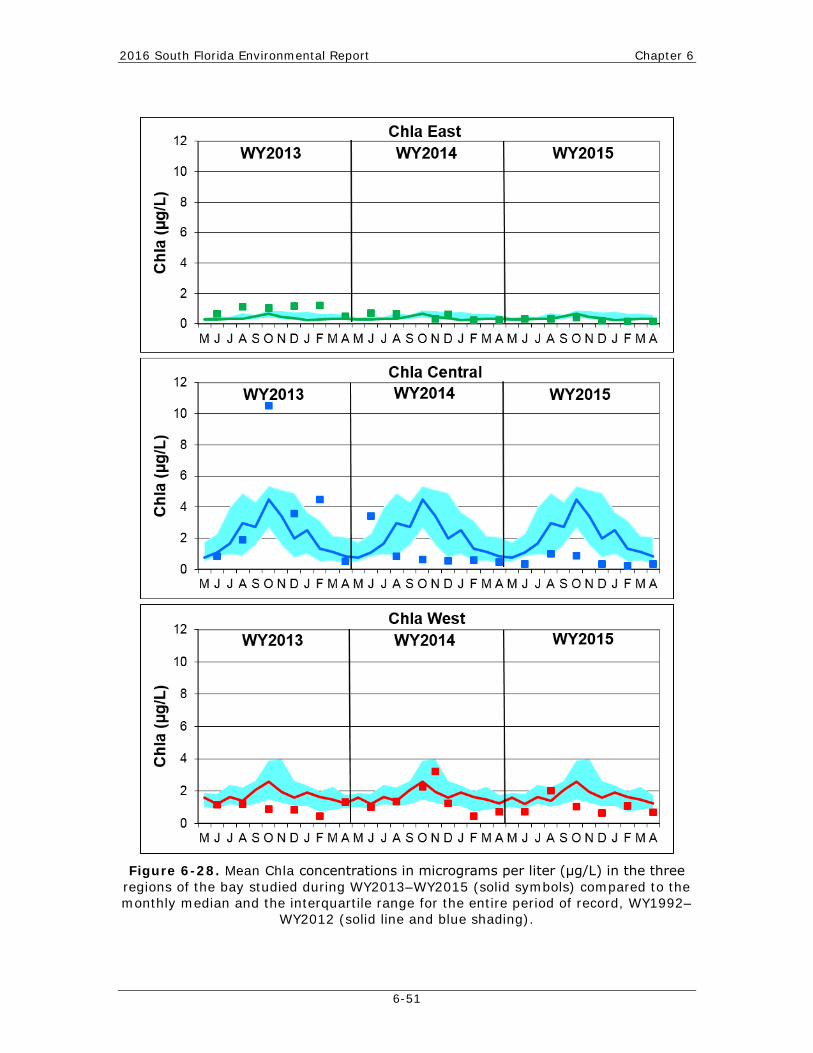
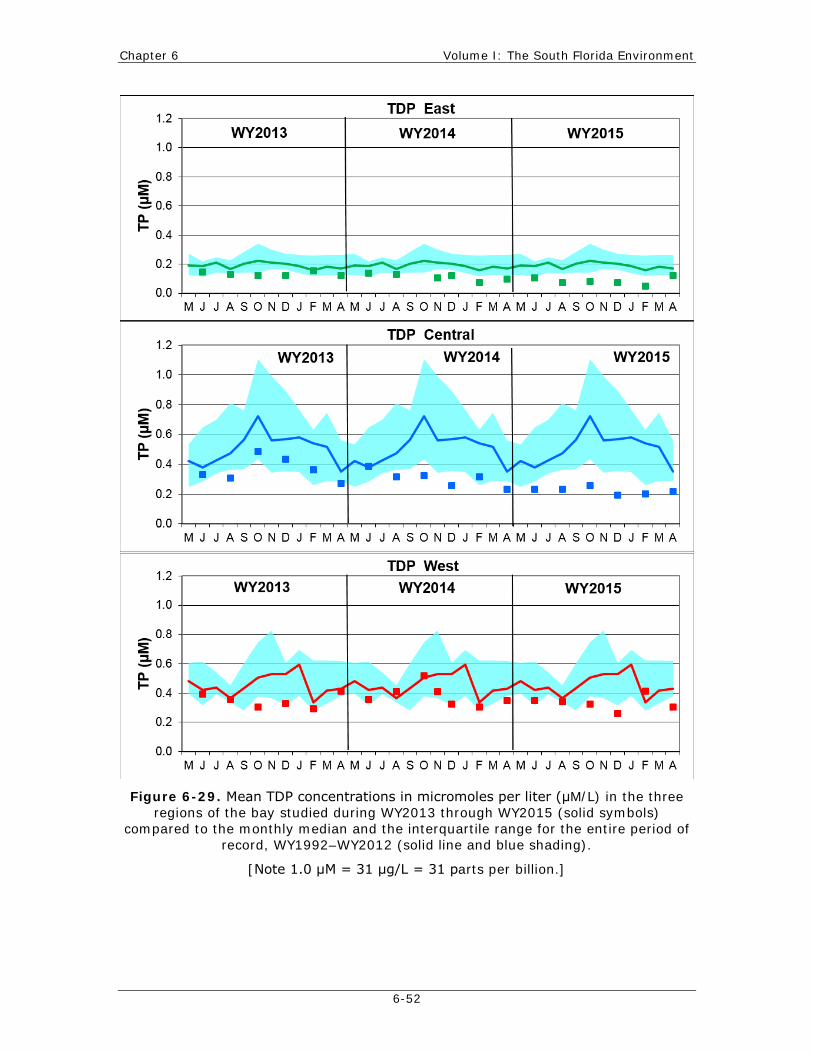
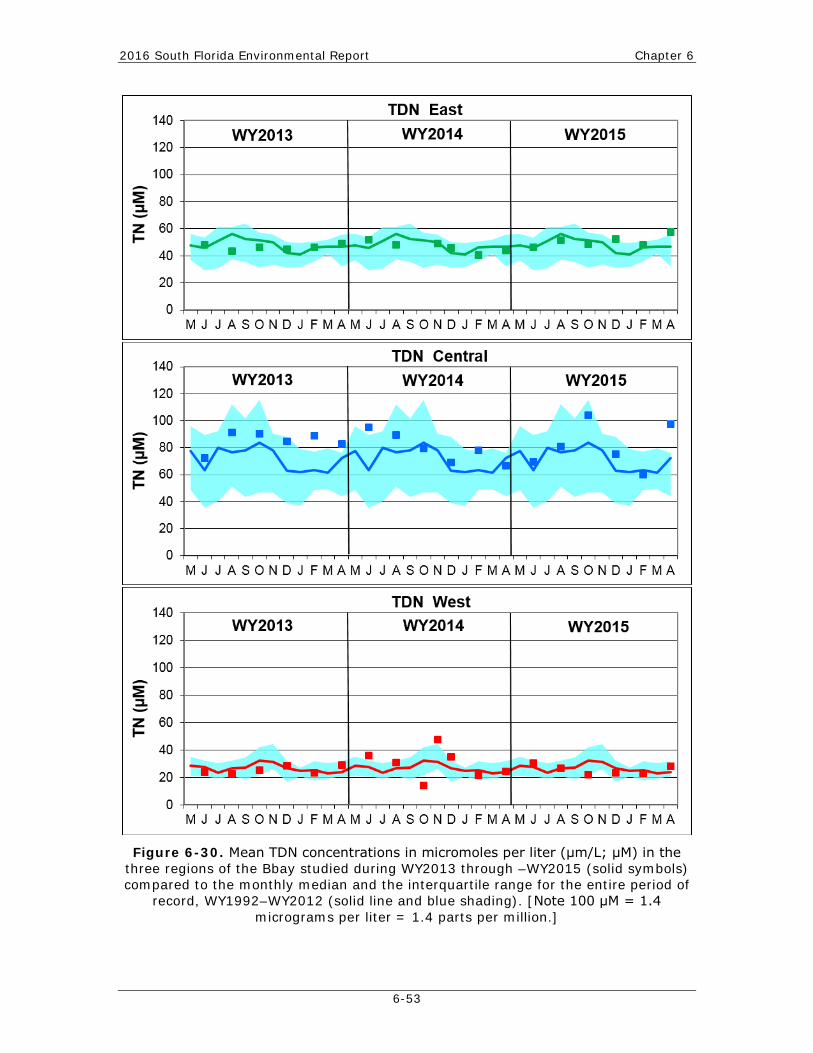
There are many factors that influence the nutrient and Chla concentrations and variation in the bay including inflows, storm and wind events, circulation patterns, nutrient recycling and even construction events. It is not possible to attribute any one of these factors as the most important driver of current conditions, but rather it is likely a synergistic effect of some or all of them [Chapter 12 (Abbot et al. 2007) and Appendix 12-3 (Rudnick et al. 2007) of the 2007 SFER]. Annual averages of all parameters analyzed [Chla, TDP, total dissolved nitrogen (TDN), total organic carbon (TOC), dissolved inorganic nitrogen (DIN), and turbidity], continue to be stable during the last six water years, indicated by little to no interannual concentration changes, and were statistically similar between WY2014 and WY2015 with a few exceptions (Table 6-8). In addition, in the following figures, the monthly spatial averages of each parameter in the three regions of the bay were compared to the temporal median of the monthly spatial means and the interquartile range for the entire period of record (WY1992–WY2012). Notable findings for WY2015 that include results far above or below the long-term monthly median include Chla, TDP, and turbidity were at or below the 25 percent quartile in all regions of the bay (Figures 6-28 and 6-29); discrete salinity collected at the time of sample collection during WY2015 was at or above the 75 percent quartile in all regions of the bay; TOC was less than the median in the eastern and western regions; TDN was at or above the median in the eastern and central regions, and at or below the median in the western region (Figure 6-30); DIN was at the 75 percent quartile for most of the water year in the western region and at the 25 percent quartile in the eastern region. A summary of these results can be found in Table 6-9.
Table 6-8. Statistically significant differences (p < 0.05) between annual averages of WY2014 and WY2015. Numbers in bold are lower.
Region Parameter WY2014 WY2015
Eastern
Chla (µg/L) TDN (µM) TDP (µM)
Turbidity (NTU)
0.47 + 0.38 46.5 + 7.1 0.11 + 0.04 5.2 + 3.5
0.27 + 0.16 50.8 + 6.7 0.08 + 0.04 2.5 + 1.2
Central TDP (µM) 0.31 + 0.14 0.22 + 0.07 Western TOC (µM) 415 + 163 321 + 77
Key to units: µg/L – micrograms per liter, µM – micromoles, and NTU – nephelometric turbidity units.
2016 South Florida Environmental Report Chapter 6
6-51
Figure 6-28. Mean Chla concentrations in micrograms per liter (μg/L) in the three
regions of the bay studied during WY2013–WY2015 (solid symbols) compared to the monthly median and the interquartile range for the entire period of record, WY1992–
WY2012 (solid line and blue shading).
Chapter 6 Volume I: The South Florida Environment
6-52
Figure 6-29. Mean TDP concentrations in micromoles per liter (μM/L) in the three
regions of the bay studied during WY2013 through WY2015 (solid symbols) compared to the monthly median and the interquartile range for the entire period of
record, WY1992–WY2012 (solid line and blue shading).
[Note 1.0 μM = 31 μg/L = 31 parts per billion.]
2016 South Florida Environmental Report Chapter 6
6-53
Figure 6-30. Mean TDN concentrations in micromoles per liter (μm/L; μM) in the
three regions of the Bbay studied during WY2013 through –WY2015 (solid symbols) compared to the monthly median and the interquartile range for the entire period of
record, WY1992–WY2012 (solid line and blue shading). [Note 100 μM = 1.4 micrograms per liter = 1.4 parts per million.]
Chapter 6 Volume I: The South Florida Environment
6-54
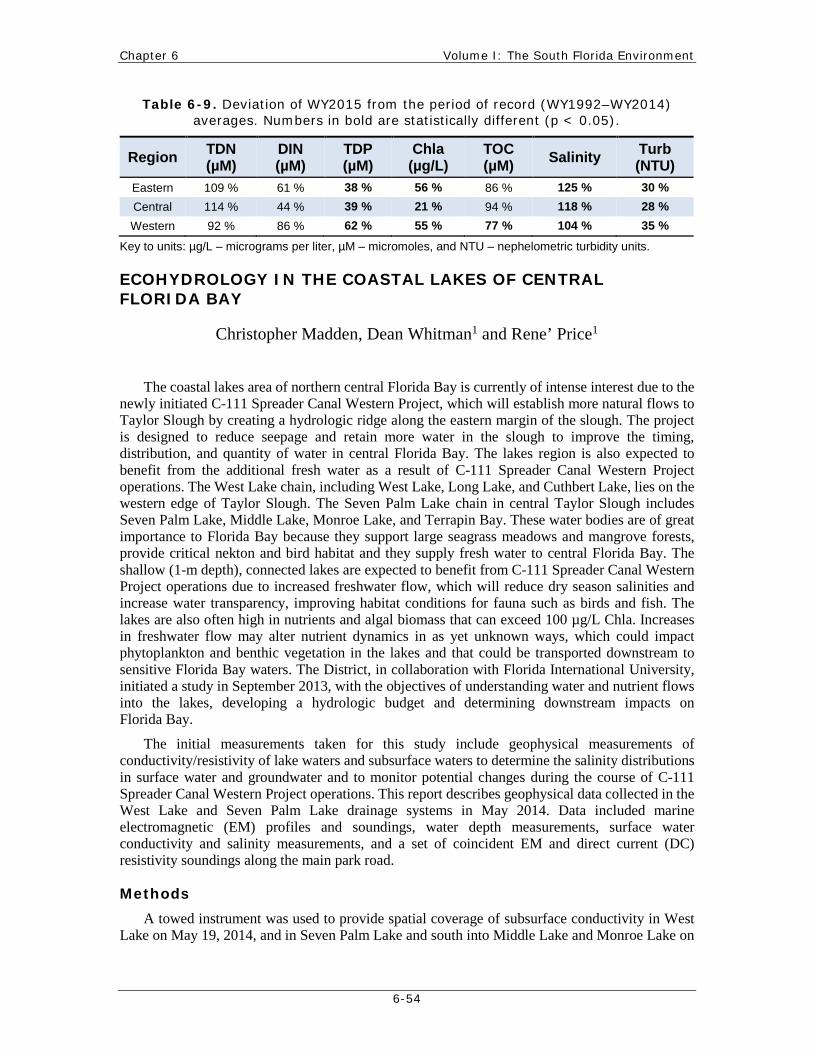
Table 6-9. Deviation of WY2015 from the period of record (WY1992–WY2014) averages. Numbers in bold are statistically different (p < 0.05).
Region TDN (µM)
DIN (µM)
TDP (µM)
Chla (µg/L)
TOC (µM) Salinity Turb
(NTU) Eastern 109 % 61 % 38 % 56 % 86 % 125 % 30 % Central 114 % 44 % 39 % 21 % 94 % 118 % 28 % Western 92 % 86 % 62 % 55 % 77 % 104 % 35 %
Key to units: µg/L – micrograms per liter, µM – micromoles, and NTU – nephelometric turbidity units.
ECOHYDROLOGY IN THE COASTAL LAKES OF CENTRAL FLORIDA BAY
Christopher Madden, Dean Whitman1 and Rene’ Price1
The coastal lakes area of northern central Florida Bay is currently of intense interest due to the newly initiated C-111 Spreader Canal Western Project, which will establish more natural flows to Taylor Slough by creating a hydrologic ridge along the eastern margin of the slough. The project is designed to reduce seepage and retain more water in the slough to improve the timing, distribution, and quantity of water in central Florida Bay. The lakes region is also expected to benefit from the additional fresh water as a result of C-111 Spreader Canal Western Project operations. The West Lake chain, including West Lake, Long Lake, and Cuthbert Lake, lies on the western edge of Taylor Slough. The Seven Palm Lake chain in central Taylor Slough includes Seven Palm Lake, Middle Lake, Monroe Lake, and Terrapin Bay. These water bodies are of great importance to Florida Bay because they support large seagrass meadows and mangrove forests, provide critical nekton and bird habitat and they supply fresh water to central Florida Bay. The shallow (1-m depth), connected lakes are expected to benefit from C-111 Spreader Canal Western Project operations due to increased freshwater flow, which will reduce dry season salinities and increase water transparency, improving habitat conditions for fauna such as birds and fish. The lakes are also often high in nutrients and algal biomass that can exceed 100 µg/L Chla. Increases in freshwater flow may alter nutrient dynamics in as yet unknown ways, which could impact phytoplankton and benthic vegetation in the lakes and that could be transported downstream to sensitive Florida Bay waters. The District, in collaboration with Florida International University, initiated a study in September 2013, with the objectives of understanding water and nutrient flows into the lakes, developing a hydrologic budget and determining downstream impacts on Florida Bay.
The initial measurements taken for this study include geophysical measurements of conductivity/resistivity of lake waters and subsurface waters to determine the salinity distributions in surface water and groundwater and to monitor potential changes during the course of C-111 Spreader Canal Western Project operations. This report describes geophysical data collected in the West Lake and Seven Palm Lake drainage systems in May 2014. Data included marine electromagnetic (EM) profiles and soundings, water depth measurements, surface water conductivity and salinity measurements, and a set of coincident EM and direct current (DC) resistivity soundings along the main park road.
Methods A towed instrument was used to provide spatial coverage of subsurface conductivity in West
Lake on May 19, 2014, and in Seven Palm Lake and south into Middle Lake and Monroe Lake on
2016 South Florida Environmental Report Chapter 6
6-55
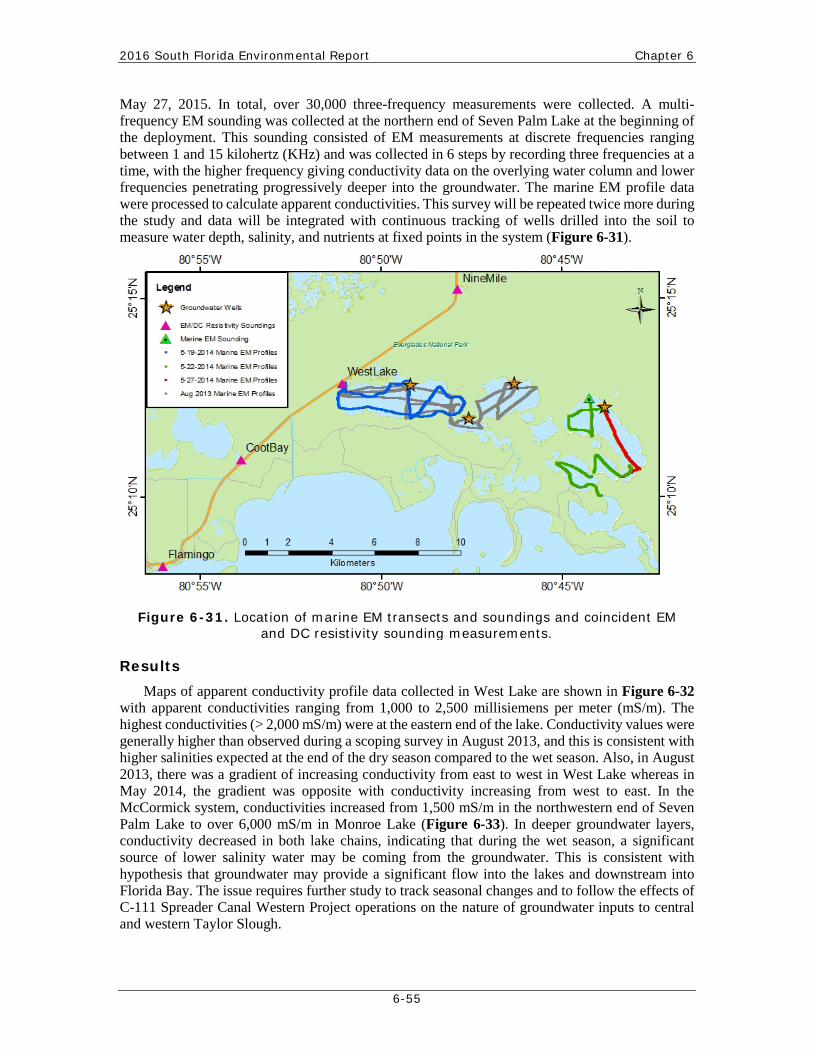
May 27, 2015. In total, over 30,000 three-frequency measurements were collected. A multi-frequency EM sounding was collected at the northern end of Seven Palm Lake at the beginning of the deployment. This sounding consisted of EM measurements at discrete frequencies ranging between 1 and 15 kilohertz (KHz) and was collected in 6 steps by recording three frequencies at a time, with the higher frequency giving conductivity data on the overlying water column and lower frequencies penetrating progressively deeper into the groundwater. The marine EM profile data were processed to calculate apparent conductivities. This survey will be repeated twice more during the study and data will be integrated with continuous tracking of wells drilled into the soil to measure water depth, salinity, and nutrients at fixed points in the system (Figure 6-31).
Figure 6-31. Location of marine EM transects and soundings and coincident EM and DC resistivity sounding measurements.
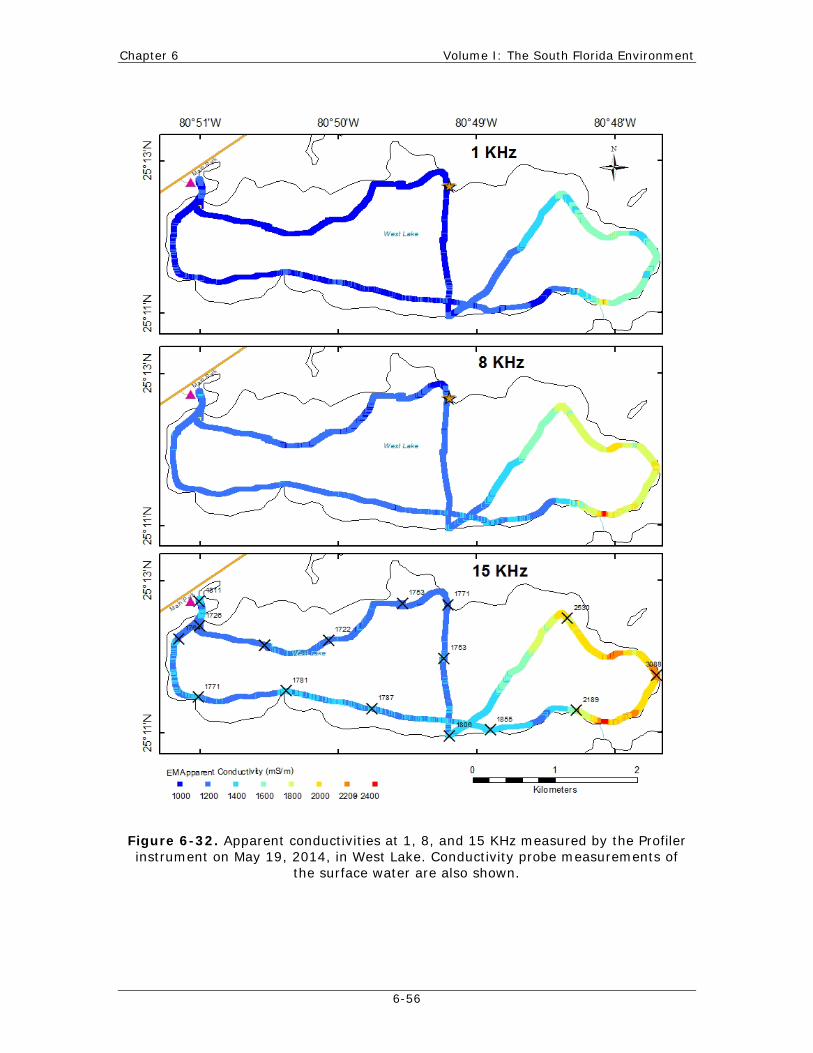
Results Maps of apparent conductivity profile data collected in West Lake are shown in Figure 6-32
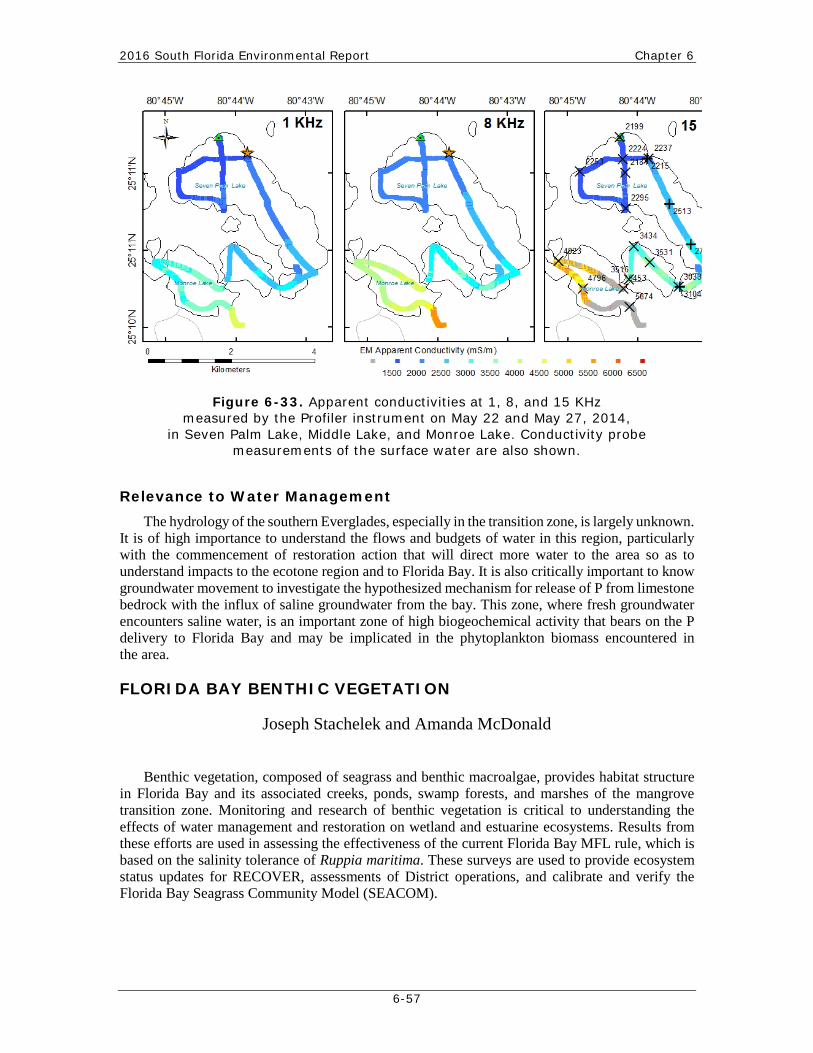
with apparent conductivities ranging from 1,000 to 2,500 millisiemens per meter (mS/m). The highest conductivities (> 2,000 mS/m) were at the eastern end of the lake. Conductivity values were generally higher than observed during a scoping survey in August 2013, and this is consistent with higher salinities expected at the end of the dry season compared to the wet season. Also, in August 2013, there was a gradient of increasing conductivity from east to west in West Lake whereas in May 2014, the gradient was opposite with conductivity increasing from west to east. In the McCormick system, conductivities increased from 1,500 mS/m in the northwestern end of Seven Palm Lake to over 6,000 mS/m in Monroe Lake (Figure 6-33). In deeper groundwater layers, conductivity decreased in both lake chains, indicating that during the wet season, a significant source of lower salinity water may be coming from the groundwater. This is consistent with hypothesis that groundwater may provide a significant flow into the lakes and downstream into Florida Bay. The issue requires further study to track seasonal changes and to follow the effects of C-111 Spreader Canal Western Project operations on the nature of groundwater inputs to central and western Taylor Slough.
Chapter 6 Volume I: The South Florida Environment
6-56
Figure 6-32. Apparent conductivities at 1, 8, and 15 KHz measured by the Profiler instrument on May 19, 2014, in West Lake. Conductivity probe measurements of
the surface water are also shown.
2016 South Florida Environmental Report Chapter 6
6-57
Figure 6-33. Apparent conductivities at 1, 8, and 15 KHz measured by the Profiler instrument on May 22 and May 27, 2014,
in Seven Palm Lake, Middle Lake, and Monroe Lake. Conductivity probe measurements of the surface water are also shown.
Relevance to Water Management The hydrology of the southern Everglades, especially in the transition zone, is largely unknown.
It is of high importance to understand the flows and budgets of water in this region, particularly with the commencement of restoration action that will direct more water to the area so as to understand impacts to the ecotone region and to Florida Bay. It is also critically important to know groundwater movement to investigate the hypothesized mechanism for release of P from limestone bedrock with the influx of saline groundwater from the bay. This zone, where fresh groundwater encounters saline water, is an important zone of high biogeochemical activity that bears on the P delivery to Florida Bay and may be implicated in the phytoplankton biomass encountered in the area.
FLORIDA BAY BENTHIC VEGETATION
Joseph Stachelek and Amanda McDonald
Benthic vegetation, composed of seagrass and benthic macroalgae, provides habitat structure in Florida Bay and its associated creeks, ponds, swamp forests, and marshes of the mangrove transition zone. Monitoring and research of benthic vegetation is critical to understanding the effects of water management and restoration on wetland and estuarine ecosystems. Results from these efforts are used in assessing the effectiveness of the current Florida Bay MFL rule, which is based on the salinity tolerance of Ruppia maritima. These surveys are used to provide ecosystem status updates for RECOVER, assessments of District operations, and calibrate and verify the Florida Bay Seagrass Community Model (SEACOM).
Chapter 6 Volume I: The South Florida Environment
6-58
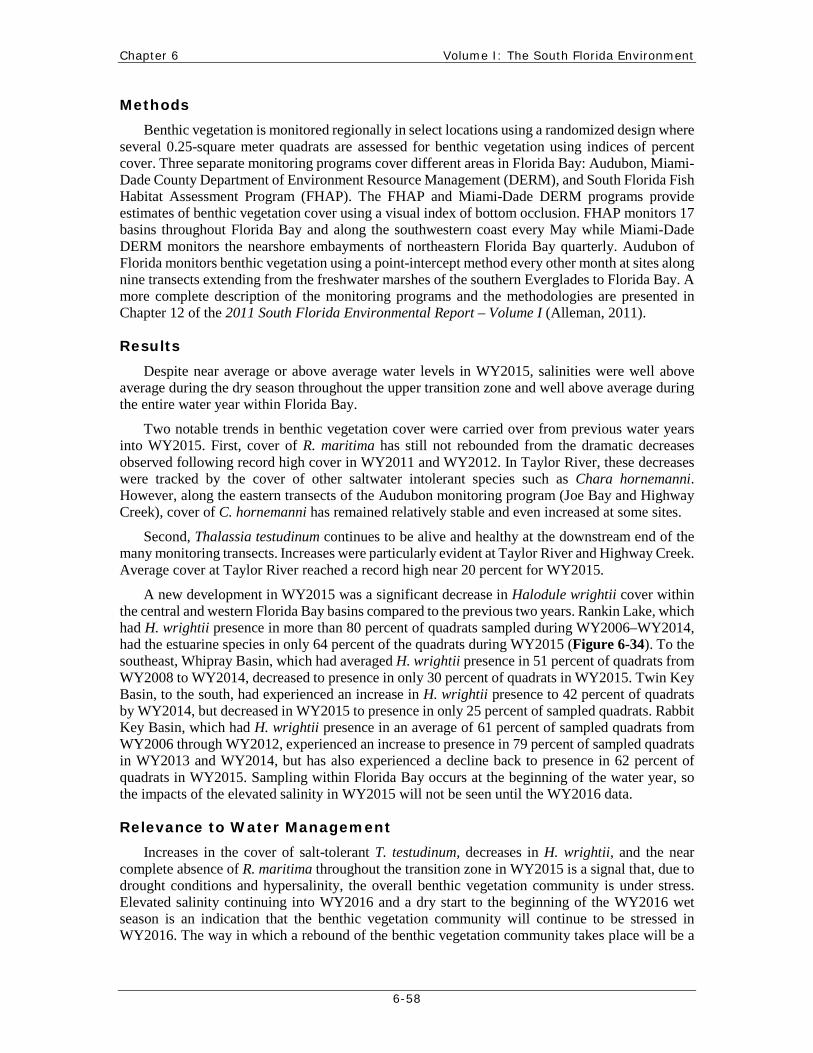
Methods Benthic vegetation is monitored regionally in select locations using a randomized design where
several 0.25-square meter quadrats are assessed for benthic vegetation using indices of percent cover. Three separate monitoring programs cover different areas in Florida Bay: Audubon, Miami-Dade County Department of Environment Resource Management (DERM), and South Florida Fish Habitat Assessment Program (FHAP). The FHAP and Miami-Dade DERM programs provide estimates of benthic vegetation cover using a visual index of bottom occlusion. FHAP monitors 17 basins throughout Florida Bay and along the southwestern coast every May while Miami-Dade DERM monitors the nearshore embayments of northeastern Florida Bay quarterly. Audubon of Florida monitors benthic vegetation using a point-intercept method every other month at sites along nine transects extending from the freshwater marshes of the southern Everglades to Florida Bay. A more complete description of the monitoring programs and the methodologies are presented in Chapter 12 of the 2011 South Florida Environmental Report – Volume I (Alleman, 2011).
Results Despite near average or above average water levels in WY2015, salinities were well above
average during the dry season throughout the upper transition zone and well above average during the entire water year within Florida Bay.
Two notable trends in benthic vegetation cover were carried over from previous water years into WY2015. First, cover of R. maritima has still not rebounded from the dramatic decreases observed following record high cover in WY2011 and WY2012. In Taylor River, these decreases were tracked by the cover of other saltwater intolerant species such as Chara hornemanni. However, along the eastern transects of the Audubon monitoring program (Joe Bay and Highway Creek), cover of C. hornemanni has remained relatively stable and even increased at some sites.
Second, Thalassia testudinum continues to be alive and healthy at the downstream end of the many monitoring transects. Increases were particularly evident at Taylor River and Highway Creek. Average cover at Taylor River reached a record high near 20 percent for WY2015.
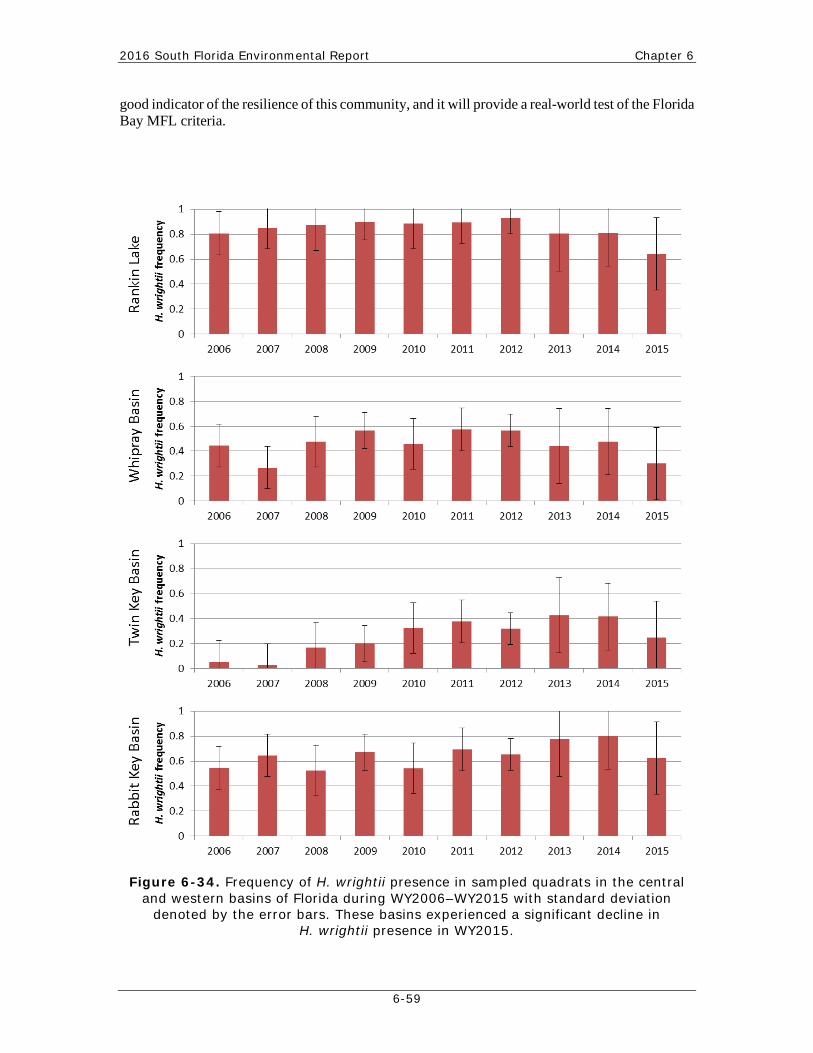
A new development in WY2015 was a significant decrease in Halodule wrightii cover within the central and western Florida Bay basins compared to the previous two years. Rankin Lake, which had H. wrightii presence in more than 80 percent of quadrats sampled during WY2006–WY2014, had the estuarine species in only 64 percent of the quadrats during WY2015 (Figure 6-34). To the southeast, Whipray Basin, which had averaged H. wrightii presence in 51 percent of quadrats from WY2008 to WY2014, decreased to presence in only 30 percent of quadrats in WY2015. Twin Key Basin, to the south, had experienced an increase in H. wrightii presence to 42 percent of quadrats by WY2014, but decreased in WY2015 to presence in only 25 percent of sampled quadrats. Rabbit Key Basin, which had H. wrightii presence in an average of 61 percent of sampled quadrats from WY2006 through WY2012, experienced an increase to presence in 79 percent of sampled quadrats in WY2013 and WY2014, but has also experienced a decline back to presence in 62 percent of quadrats in WY2015. Sampling within Florida Bay occurs at the beginning of the water year, so the impacts of the elevated salinity in WY2015 will not be seen until the WY2016 data.
Relevance to Water Management Increases in the cover of salt-tolerant T. testudinum, decreases in H. wrightii, and the near
complete absence of R. maritima throughout the transition zone in WY2015 is a signal that, due to drought conditions and hypersalinity, the overall benthic vegetation community is under stress. Elevated salinity continuing into WY2016 and a dry start to the beginning of the WY2016 wet season is an indication that the benthic vegetation community will continue to be stressed in WY2016. The way in which a rebound of the benthic vegetation community takes place will be a
2016 South Florida Environmental Report Chapter 6
6-59
good indicator of the resilience of this community, and it will provide a real-world test of the Florida Bay MFL criteria.
Figure 6-34. Frequency of H. wrightii presence in sampled quadrats in the central and western basins of Florida during WY2006–WY2015 with standard deviation
denoted by the error bars. These basins experienced a significant decline in H. wrightii presence in WY2015.
Chapter 6 Volume I: The South Florida Environment
6-60
FLORIDA BAY SYSTEMWIDE INDICATORS FOR SUBMERGED AQUATIC VEGETATION
Christopher Madden and Amanda McDonald
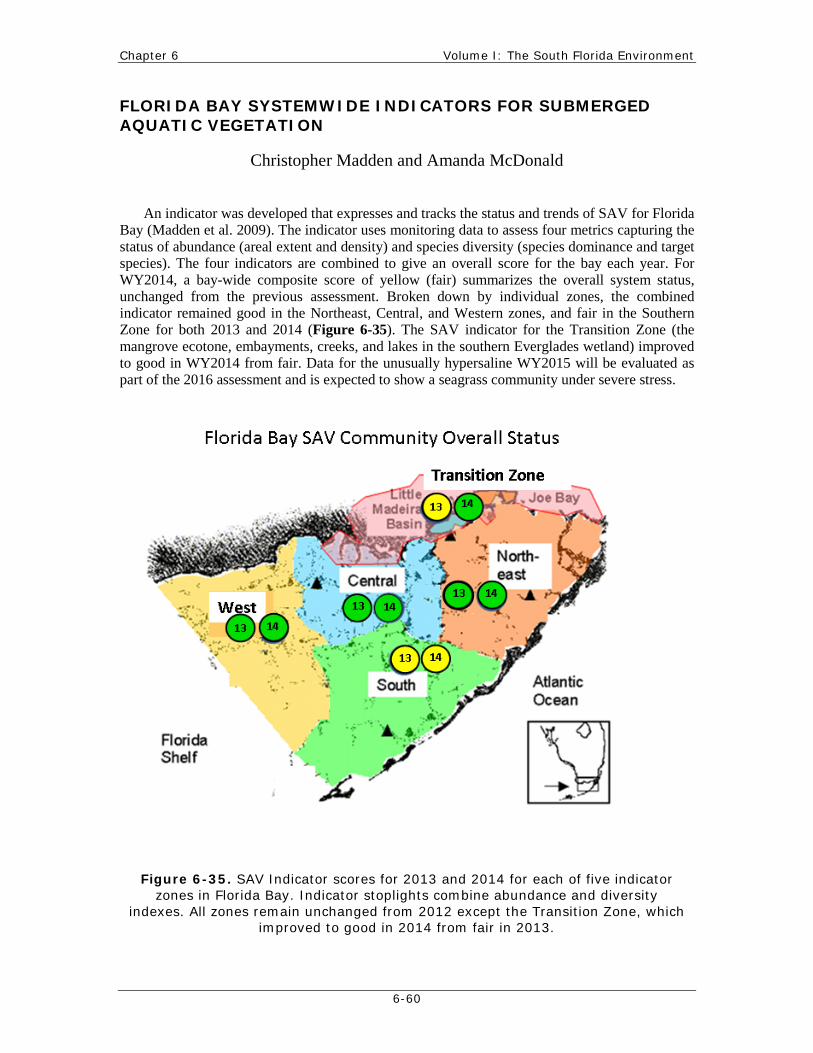
An indicator was developed that expresses and tracks the status and trends of SAV for Florida Bay (Madden et al. 2009). The indicator uses monitoring data to assess four metrics capturing the status of abundance (areal extent and density) and species diversity (species dominance and target species). The four indicators are combined to give an overall score for the bay each year. For WY2014, a bay-wide composite score of yellow (fair) summarizes the overall system status, unchanged from the previous assessment. Broken down by individual zones, the combined indicator remained good in the Northeast, Central, and Western zones, and fair in the Southern Zone for both 2013 and 2014 (Figure 6-35). The SAV indicator for the Transition Zone (the mangrove ecotone, embayments, creeks, and lakes in the southern Everglades wetland) improved to good in WY2014 from fair. Data for the unusually hypersaline WY2015 will be evaluated as part of the 2016 assessment and is expected to show a seagrass community under severe stress.
Figure 6-35. SAV Indicator scores for 2013 and 2014 for each of five indicator zones in Florida Bay. Indicator stoplights combine abundance and diversity
indexes. All zones remain unchanged from 2012 except the Transition Zone, which improved to good in 2014 from fair in 2013.
2016 South Florida Environmental Report Chapter 6
6-61
Methods Based on species composition and monitoring data from Braun-Blanquet assessments of cover,
scores are calculated relative to historical potential for each of five bay zones. The ranges determining system status and the basic methodology for calculating the SAV Indicator are detailed in Madden et al. (2009). A new step in the protocol has been introduced to aggregate SAV scores from all five zones to create a single system status indicator for the entire bay. The minimum score for the five zones is assigned as the bay-wide score.
Results The abundance index showed that SAV cover and density was good in the Northeast Zone, fair
in the Transition, Central, and Western zones, and poor in the Southern Zone. The spatial extent component of the abundance index expresses the proportion of bay bottom area covered by seagrass and reflected good SAV cover for all zones of the bay. No significant die-off events occurred during the assessment period. Despite good areal cover, the abundance index was reduced in some zones due to the second underlying component, density, reflecting sparseness of SAV in several areas. Notably, density remained poor in Madeira Bay, Long Sound, and Joe Bay in the Transition Zone and Twin Key Basin in the Southern Zone, dropped to fair in Rankin in the Central Zone, and remained fair in Rabbit Key Basin in the Western Zone. As a result, the aggregated abundance index was at a good status only in the Northeast Zone, with the others being fair or poor.
The diversity index, which combines indicators for species dominance and presence of desirable target species, showed continued good status in the Northeast, Central, and Western zones. The Transition Zone diversity index improved to good in WY2014, reflecting underlying improvement from poor to fair species dominance and the recovery of SAV habitat leading to R. maritima expansion. The Southern Zone maintained its diversity index status of fair through WY2014, reflecting excessive dominance by Thalassia in the underlying species dominance score of fair. Lack of community diversity in the Southern Zone yielded a continuing fair score for target species.
The SAV status has either remained steady or improved, notably with improvement in the Transition Zone. The bay-wide score for Florida Bay is yellow (fair) for 2014, given that there is at least one yellow in one zone. Trends in the underlying components of the Northeast Zone have been positive, reflecting continued improvement since the mid-2000s when hurricanes and a prolonged algal bloom negatively impacted the SAV community. Although the Western Zone remains in good overall condition, there are declines in some component scores that bear watching and improvement is required in the perennially fair status of the overall score in the Southern Zone.
Relevance to Water Management Data from the indicator analysis are used in a variety of ways: (1) to communicate SAV status
internally within the District and to its Governing Board; (2) to communicate with research collaborators and interagency partners, including the USGS, National Oceanic and Atmospheric Administration, Department of Interior, FDEP, Miami-Dade DERM, ENP, United States Environmental Protection Agency, RECOVER, and others; (3) to provide a visual status report to the United States Congress and to the public via presentations; (4) to formally document and report SAV status in such publications as the South Florida Environmental Report, the System Status Report, the C-111 Ecological Status Report, the C-111 Spreader Canal Western Features Project Monitoring and Assessment Report, the Minimum Flows and Levels for Florida Bay Review and Update report and other published documents. The indicator and components are also used to evaluate progress in and success of restoration activities in the southern Everglades and Florida Bay. The SAV Indicator and components are used to monitor and assess the success of MFL rulemaking and assess how violations of the rule affect the SAV resource that may trigger
Chapter 6 Volume I: The South Florida Environment
6-62
requirement of an MFL recovery strategy (Strasizar et al. 2013). CERP and Central Everglades Planning Project evaluations of restoration strategies use the SAV indicator in evaluating potential management strategies and performance targets.
SOUTHERN EVERGLADES PEAT COLLAPSE
Joseph Stachelek, Stephen Kelly, Carlos Coronado–Molina, Tiffany Troxler1, Laura Bauman1, Fred Sklar, John
Kominoski1, Shelby Servais1, Benjamin Wilson1, Viviana Mazzei1, Evelyn Gaiser1, Christopher Madden and
Stephen Davis5
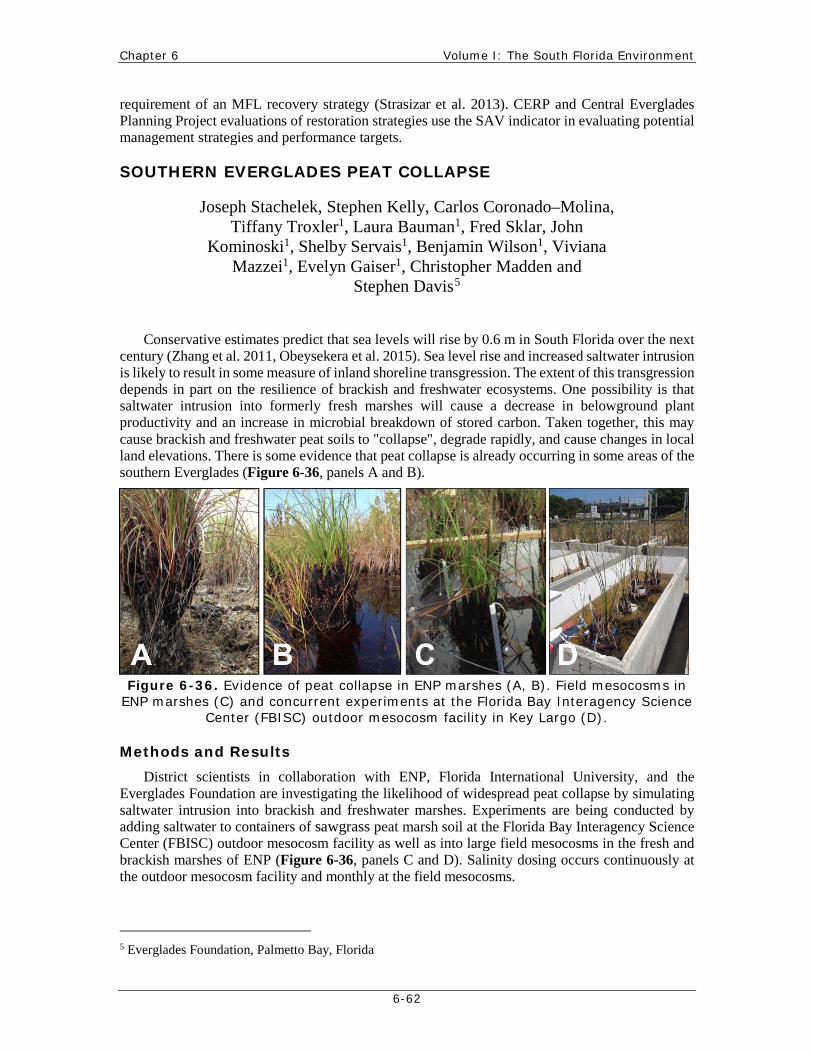
Conservative estimates predict that sea levels will rise by 0.6 m in South Florida over the next century (Zhang et al. 2011, Obeysekera et al. 2015). Sea level rise and increased saltwater intrusion is likely to result in some measure of inland shoreline transgression. The extent of this transgression depends in part on the resilience of brackish and freshwater ecosystems. One possibility is that saltwater intrusion into formerly fresh marshes will cause a decrease in belowground plant productivity and an increase in microbial breakdown of stored carbon. Taken together, this may cause brackish and freshwater peat soils to "collapse", degrade rapidly, and cause changes in local land elevations. There is some evidence that peat collapse is already occurring in some areas of the southern Everglades (Figure 6-36, panels A and B).
Figure 6-36. Evidence of peat collapse in ENP marshes (A, B). Field mesocosms in ENP marshes (C) and concurrent experiments at the Florida Bay Interagency Science
Center (FBISC) outdoor mesocosm facility in Key Largo (D).
Methods and Results District scientists in collaboration with ENP, Florida International University, and the
Everglades Foundation are investigating the likelihood of widespread peat collapse by simulating saltwater intrusion into brackish and freshwater marshes. Experiments are being conducted by adding saltwater to containers of sawgrass peat marsh soil at the Florida Bay Interagency Science Center (FBISC) outdoor mesocosm facility as well as into large field mesocosms in the fresh and brackish marshes of ENP (Figure 6-36, panels C and D). Salinity dosing occurs continuously at the outdoor mesocosm facility and monthly at the field mesocosms.
5 Everglades Foundation, Palmetto Bay, Florida