Embed Size (px)
Citation preview
2016 Second Semi-Annual Progress ReportEpic Savannah North TerminalSavannah, Chatham County, GeorgiaVRP #1440101197
Epic Midstream, LLC
GHD | 3075 Breckinridge Blvd., Suite 470 Duluth Georgia 30096089400 | Report No 3 | November 30 2016
GHD | Epic Midstream, LLC – 2016 2nd Semi-Annual Progress Report | 089400 (3) | i
Table of Contents
1. Introduction ................................................................................................................................... 1
1.1 Background ........................................................................................................................ 1
1.2 Report Overview ................................................................................................................ 2
2. Activities Completed During Reporting Period ............................................................................. 2
2.1 Quarterly LNAPL Monitoring .............................................................................................. 2
2.1.1 September 2016 Gauging Event ...................................................................... 2 2.1.2 November 2016 Gauging Event ....................................................................... 3
2.2 Groundwater Sampling ...................................................................................................... 3
2.3 LNAPL Skimming and Transmissivity Evaluation .............................................................. 3
2.3.1 Short-Duration LNAPL Skimming Studies ........................................................ 4 2.3.2 Longer-Duration LNAPL Skimming Studies ..................................................... 6 2.3.3 LNAPL Transmissivity Evaluation Findings ...................................................... 7
2.4 Vapor Intrusion Screening ................................................................................................. 8
2.5 Conceptual Site Model ....................................................................................................... 8
3. Proposed Remediation Activities ................................................................................................. 8
4. Commitment to Future Requirements ........................................................................................ 10
5. Project Schedule ........................................................................................................................ 10
6. Engineering Fees ....................................................................................................................... 10
Figure Index
Figure 1 Vicinity Map
Figure 2 2016 Aerial Photograph
Figure 3 Site Plan
Figure 4 September 2016 Groundwater Elevation Contour Map
Figure 5 September 2016 LNAPL Isocontour Map
Figure 6 November 2016 Groundwater Elevation Contour Map
Figure 7 November 2016 LNAPL Isocontour Map
GHD | Epic Midstream, LLC – 2016 2nd Semi-Annual Progress Report | 089400 (3) | ii
Table Index
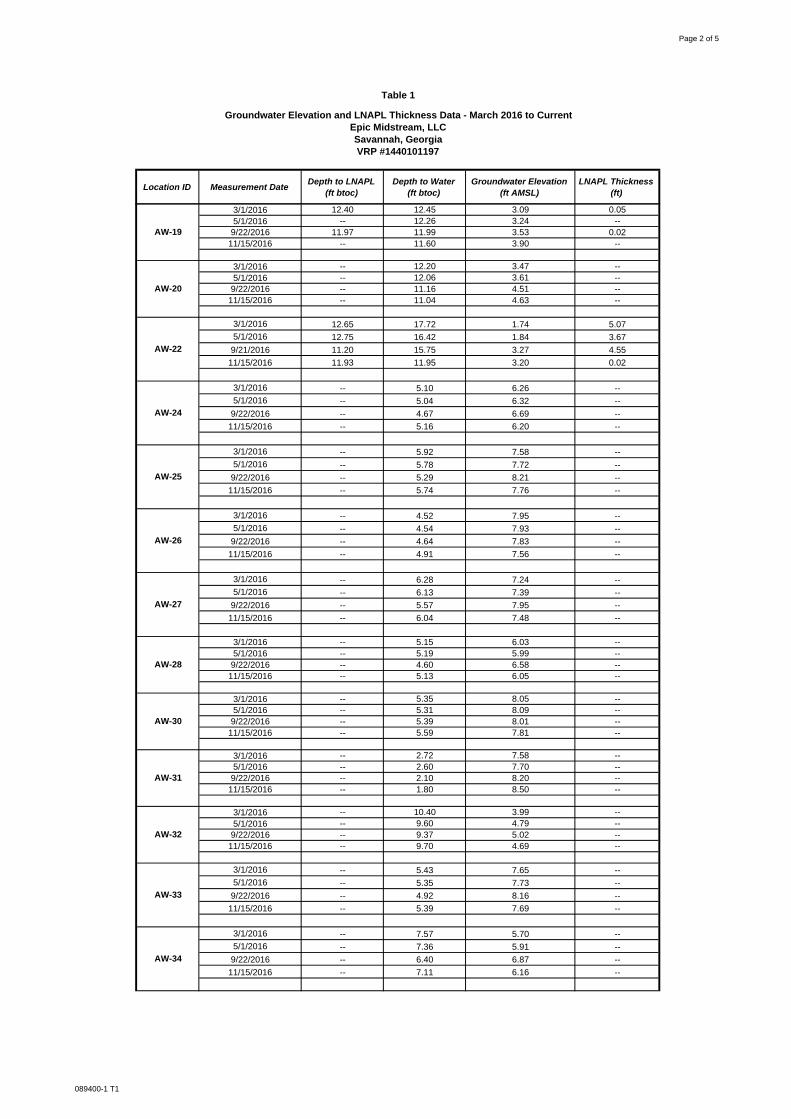
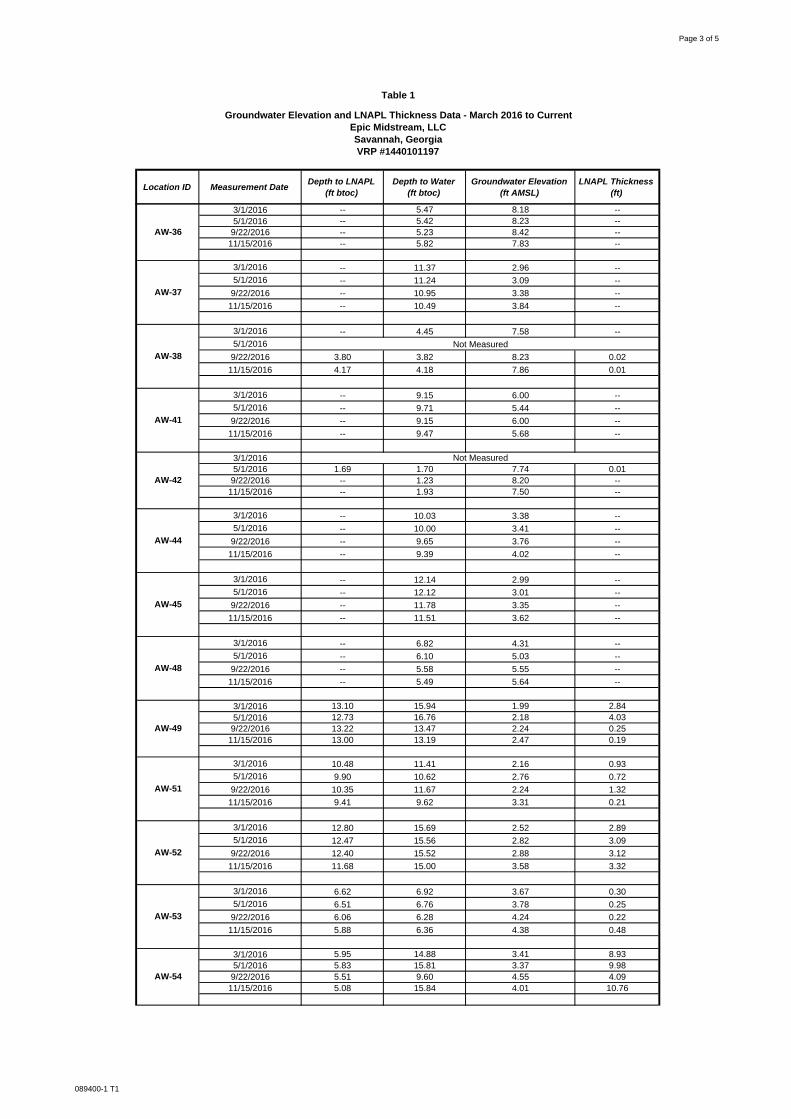
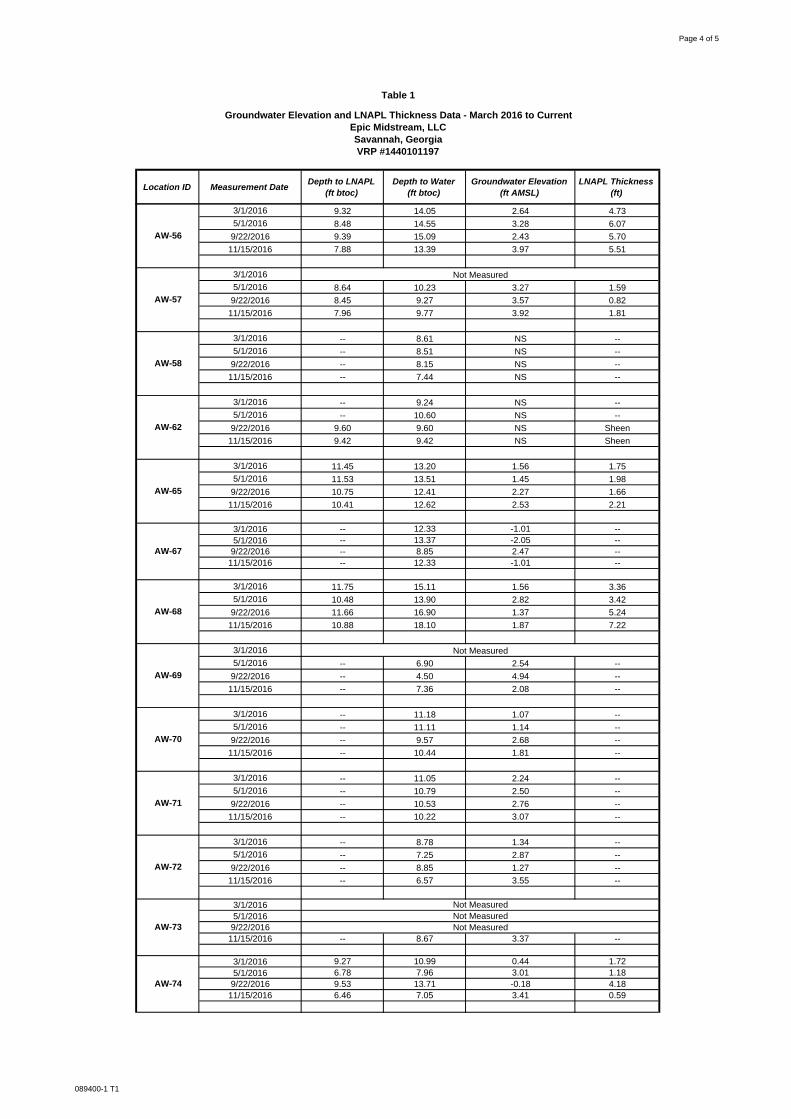
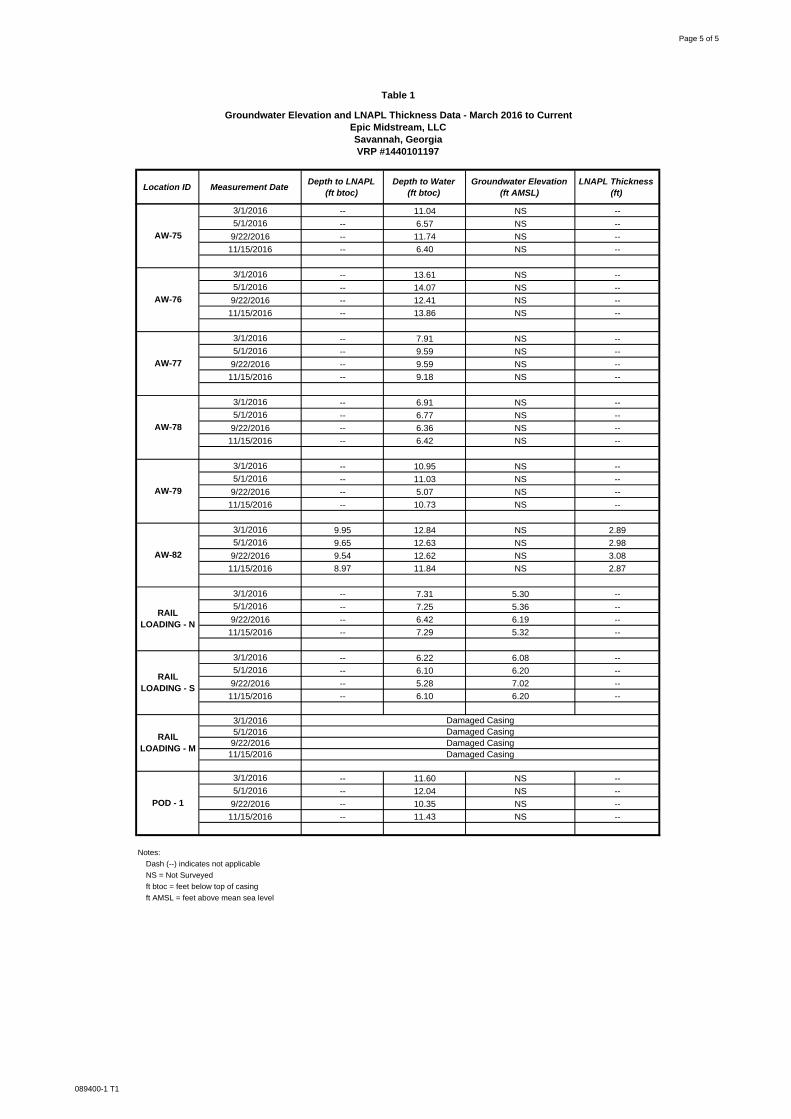
Table 1 Groundwater Elevation and LNAPL Thickness Data – March 2016 to Current
Table 2 LNAPL Removal Summary - Short-Duration Skimming
Table 3 LNAPL Removal Summary - Long-Duration Skimming
Table 4 Milestone Schedule for December 1, 2016 to June 1, 2017 Period
Appendices
Appendix A Low Flow Purging Forms
Appendix B Field Sample Key and Analytical Laboratory Reports
Appendix C LNAPL Transmissivity Evaluation Supporting Information
Appendix D Engineering Fees Summary – May 23, 2016 through November 13, 2016
GHD | Epic Midstream, LLC – 2016 2nd Semi-Annual Progress Report | 089400 (3) | 1
1. Introduction
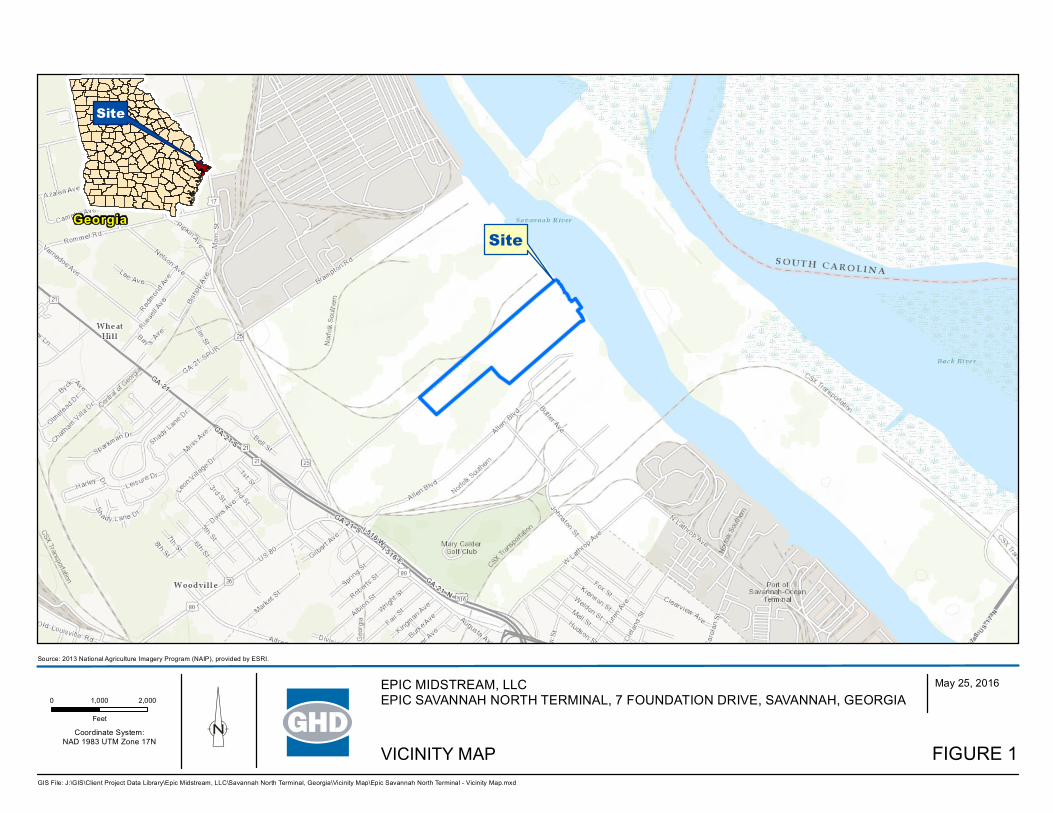
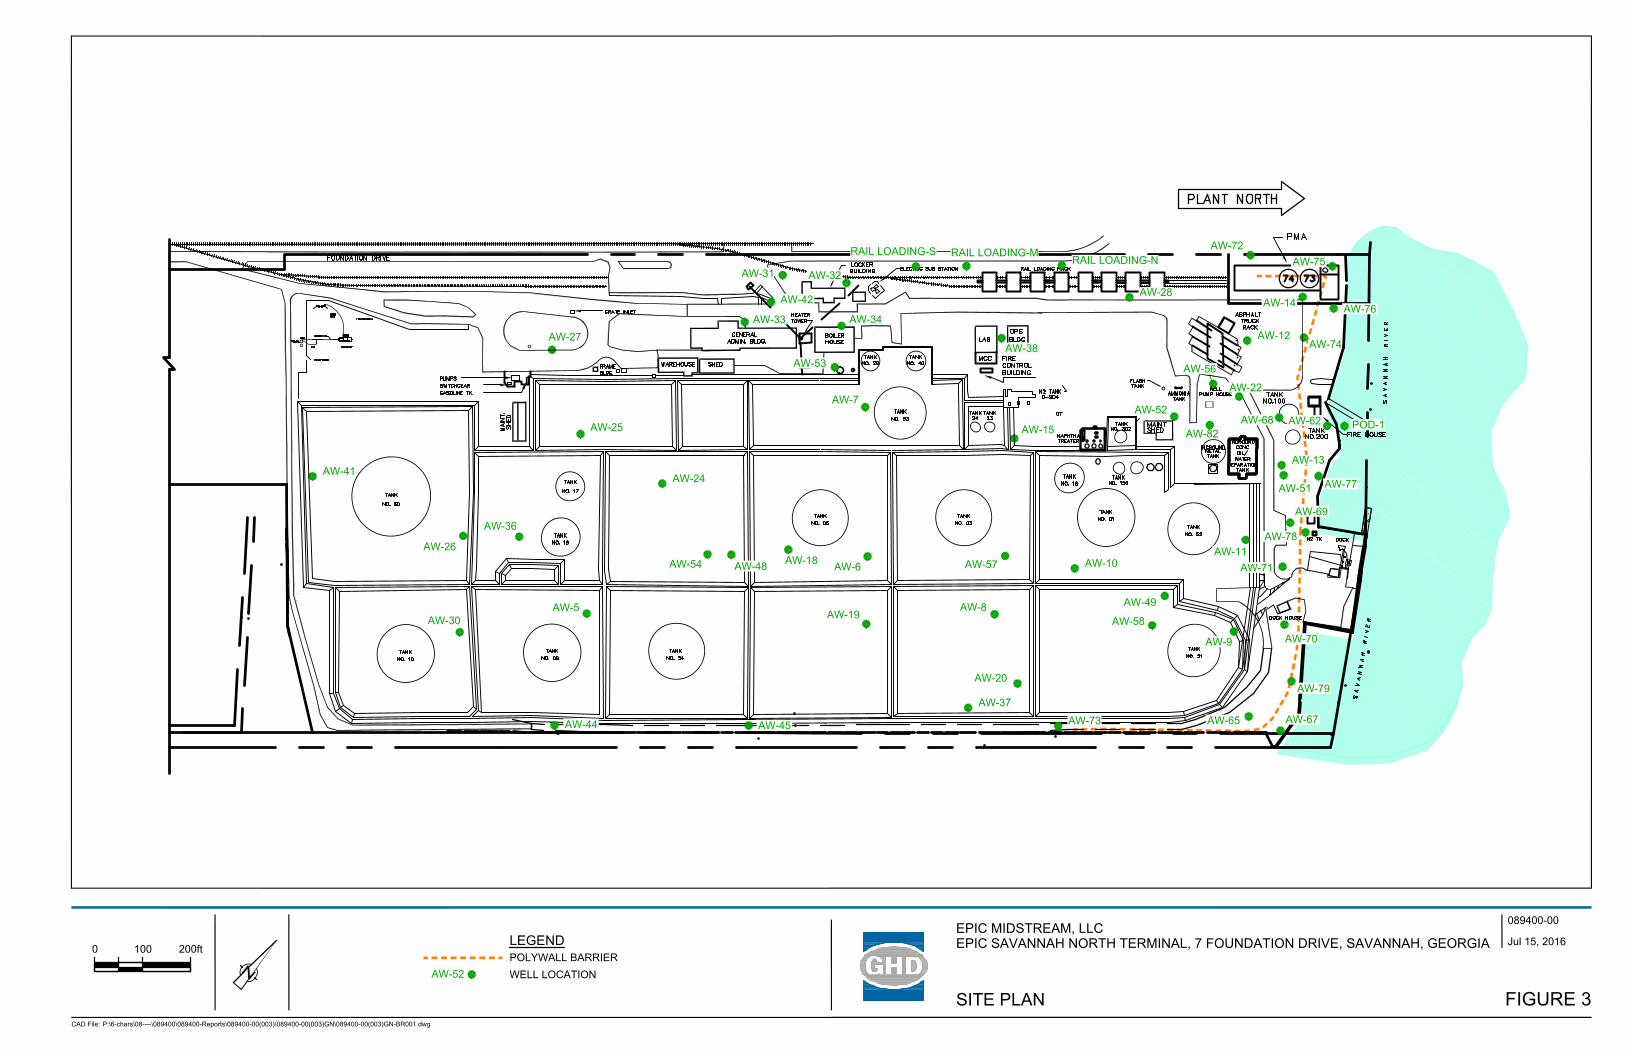
On behalf of Epic Midstream, LLC (Epic), GHD has prepared this semiannual progress report pursuant to the approved Voluntary Remediation Program (VRP) application for the Epic Savannah North Terminal located at 7 Foundation Drive, Savannah, Georgia (Site). A vicinity map for the Site is included as Figure 1. An aerial photograph of the Site obtained in 2016 is included as Figure 2. A layout of the Site in its current configuration is shown on Figure 3.
1.1 Background
The Epic Savannah North Terminal has been utilized for petroleum refining and storage activities since the early 1900s. Mexican Petroleum first developed the property as a petroleum refinery in 1929. The property was later acquired by American Oil Company (and later Amoco), which continued petroleum operations. In 1993, the property was acquired by CITGO Asphalt Refining (CITGO) and began asphalt refining operations until acquisition by NuStar Asphalt Refining, LLC in 2008. Asphalt refining operations were halted in 2012. The property was acquired by Axeon Specialty Products (Axeon) in 2014, which utilized the Site for bulk storage and distribution of petroleum related products. The property was most recently obtained by Epic in December 2015 and is currently used as a bulk storage and distribution facility for petroleum products.
In 1989, light non-aqueous phase liquid (LNAPL) was discovered at the Site and a subsequent investigation by Amoco concluded that detected LNAPL was the result of the “gradual accumulation of residual oil over several decades.” Subsurface investigations and LNAPL recovery operations have been conducted in various capacities since the discovery of the release. Through subsurface investigations, the LNAPL present at the Site has been determined to be petroleum hydrocarbon-based material.
In 1996, Horizontal Subsurface Systems, Inc. installed a 20-foot (ft) deep and approximately 1,500 ft long polyethylene (HDPE) poly wall at the Site along the Savannah River. The poly wall was positioned at the downgradient edge of the Site to prevent the migration of LNAPL to the Savannah River. Portions of the poly wall were excavated by Axeon in June and July of 2015. Upon inspection, the exposed sections of the poly wall did not show any signs of delamination, degradation, or deterioration. The installation of the poly wall has proved to be a success and an effective method of providing containment for the LNAPL plume.
On August 8, 2015, a VRP application and Voluntary Investigation and Remediation Plan (VIRP) was submitted by Axeon to the Georgia Environmental Protection Division (GAEPD) for the Site. Following submittal of the VIRP, Terracon, on behalf of Axeon, performed additional investigation at the Site and the results were summarized in a Site Investigation Summary Report (SISR) submitted to Georgia EPD on September 15, 2015. Additionally, Langan Engineering and Environmental Services (Langan) evaluated the LNAPL at the Site and identified LNAPL recovery approaches for implementation at the Site that were described in a Technical Memorandum to Axeon that was submitted to Georgia EPD on October 29, 2015. The SISR and Langan Technical Memorandum were submitted to supplement the August 2015 VIRP.
In correspondence dated November 24, 2015, the Georgia EPD stated that the Site had been approved for participation in the VRP with comments and was assigned VRP #1440101197.
GHD | Epic Midstream, LLC – 2016 2nd Semi-Annual Progress Report | 089400 (3) | 2
Epic purchased the Site from Axeon on December 22, 2015 and on January 14, 2016 Epic submitted a revised VRP application and checklist to reflect the ownership change.
The existing monitoring well network at the Site as identified by GHD consists of 60 wells installed during previous environmental investigations that are shown on Figure 3. Historically, as many as 27 of these monitoring wells have contained LNAPL, with 23 wells currently containing measurable LNAPL during the reporting period.
1.2 Report Overview
This report summarizes the findings from the following activities that were performed at the Site during the reporting period of May 15 through November 15, 2016:
• Quarterly groundwater monitoring and LNAPL measuring performed in September and November 2016.
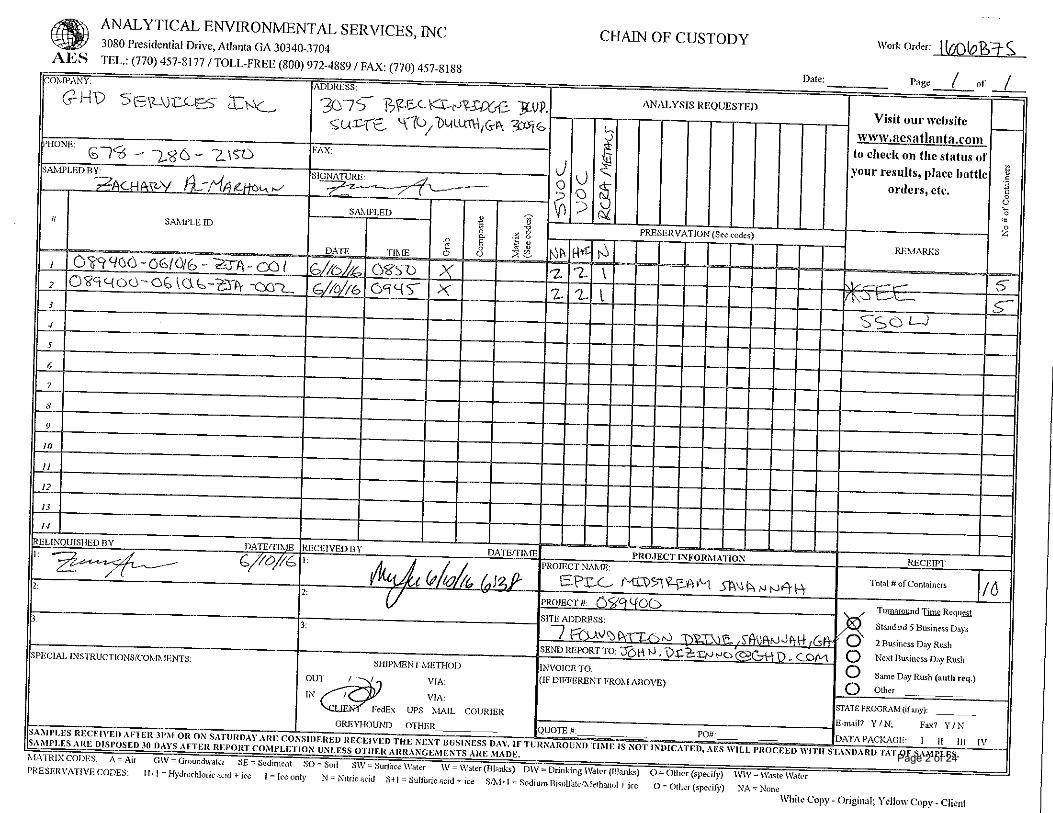
• Sampling of the groundwater from two recently re-installed monitoring wells, AW-62 and POD-1, in June 2016 for volatile organic compounds (VOCs), semi-volatile organic compounds (SVOCs), and RCRA metals.
• Completion of a vapor intrusion screening level assessment for the Site, including the sampling of three wells (AW-27, AW-33, and AW-34) for benzene, toluene, ethylbenzene, xylenes, and naphthalene in October 2016.
• Completion of an LNAPL transmissivity evaluation for 17 wells containing in-well LNAPL thicknesses greater than 0.33 feet of LNAPL.
• Continuation and expansion of LNAPL recovery at the Site and further evaluation of long-term LNAPL transmissivity for select wells.
2. Activities Completed During Reporting Period
2.1 Quarterly LNAPL Monitoring
2.1.1 September 2016 Gauging Event
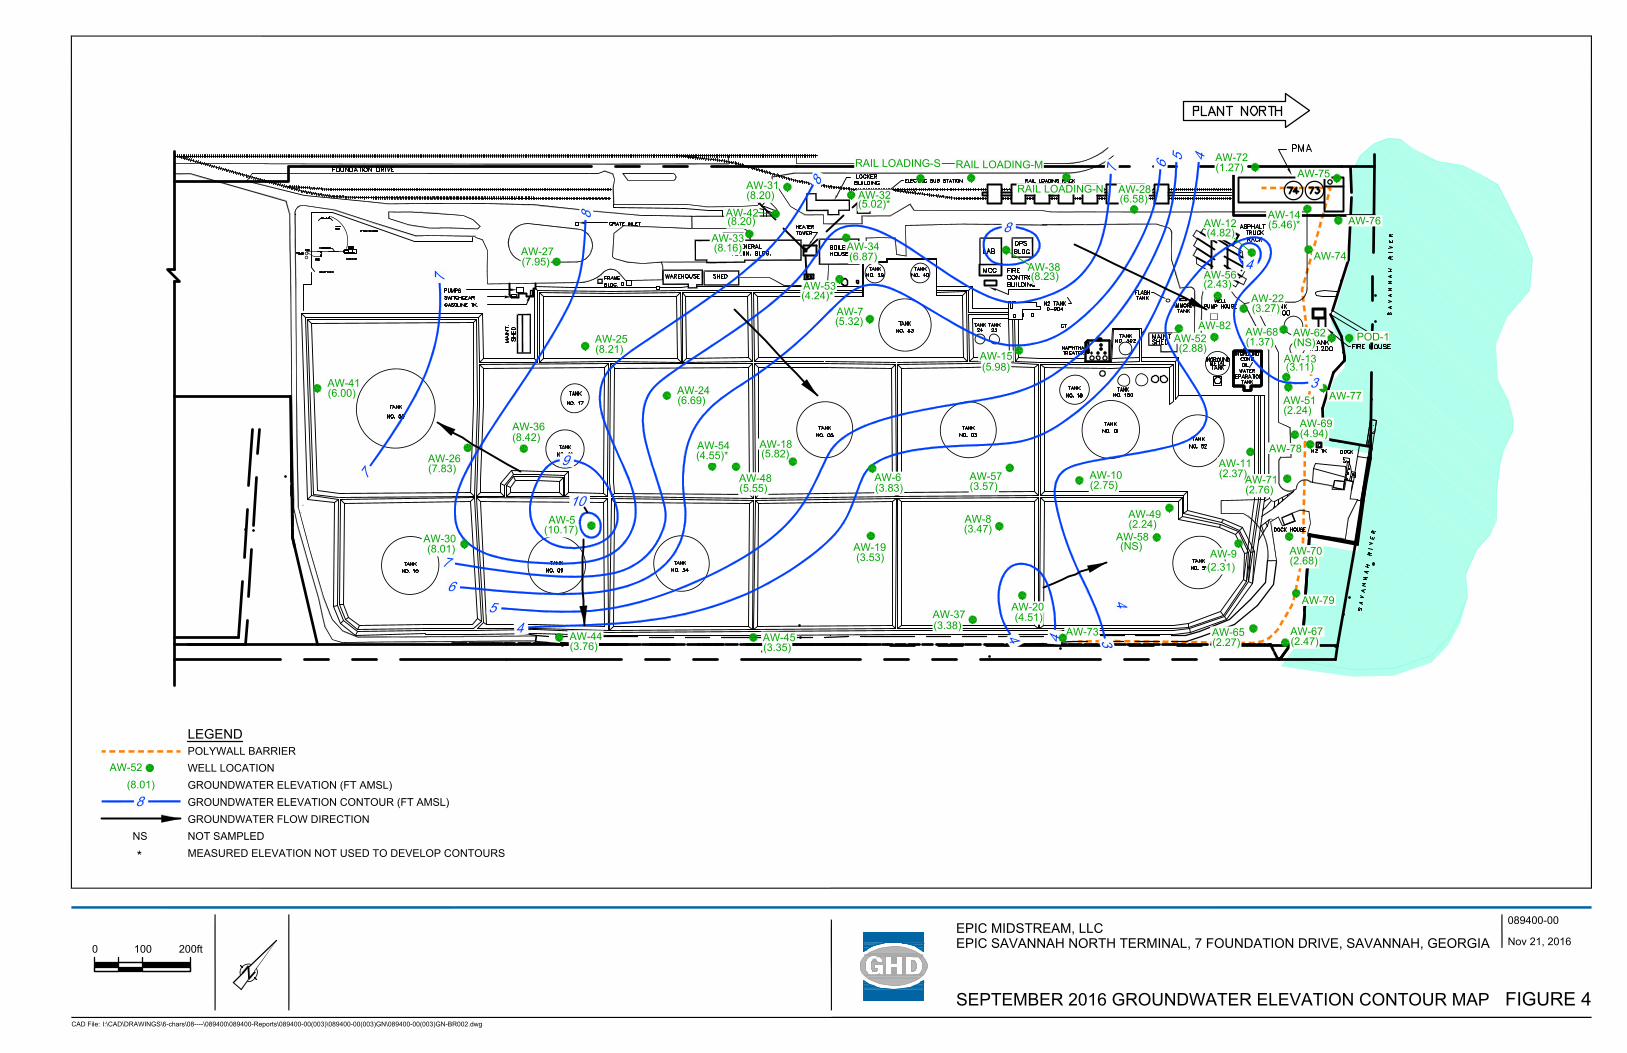
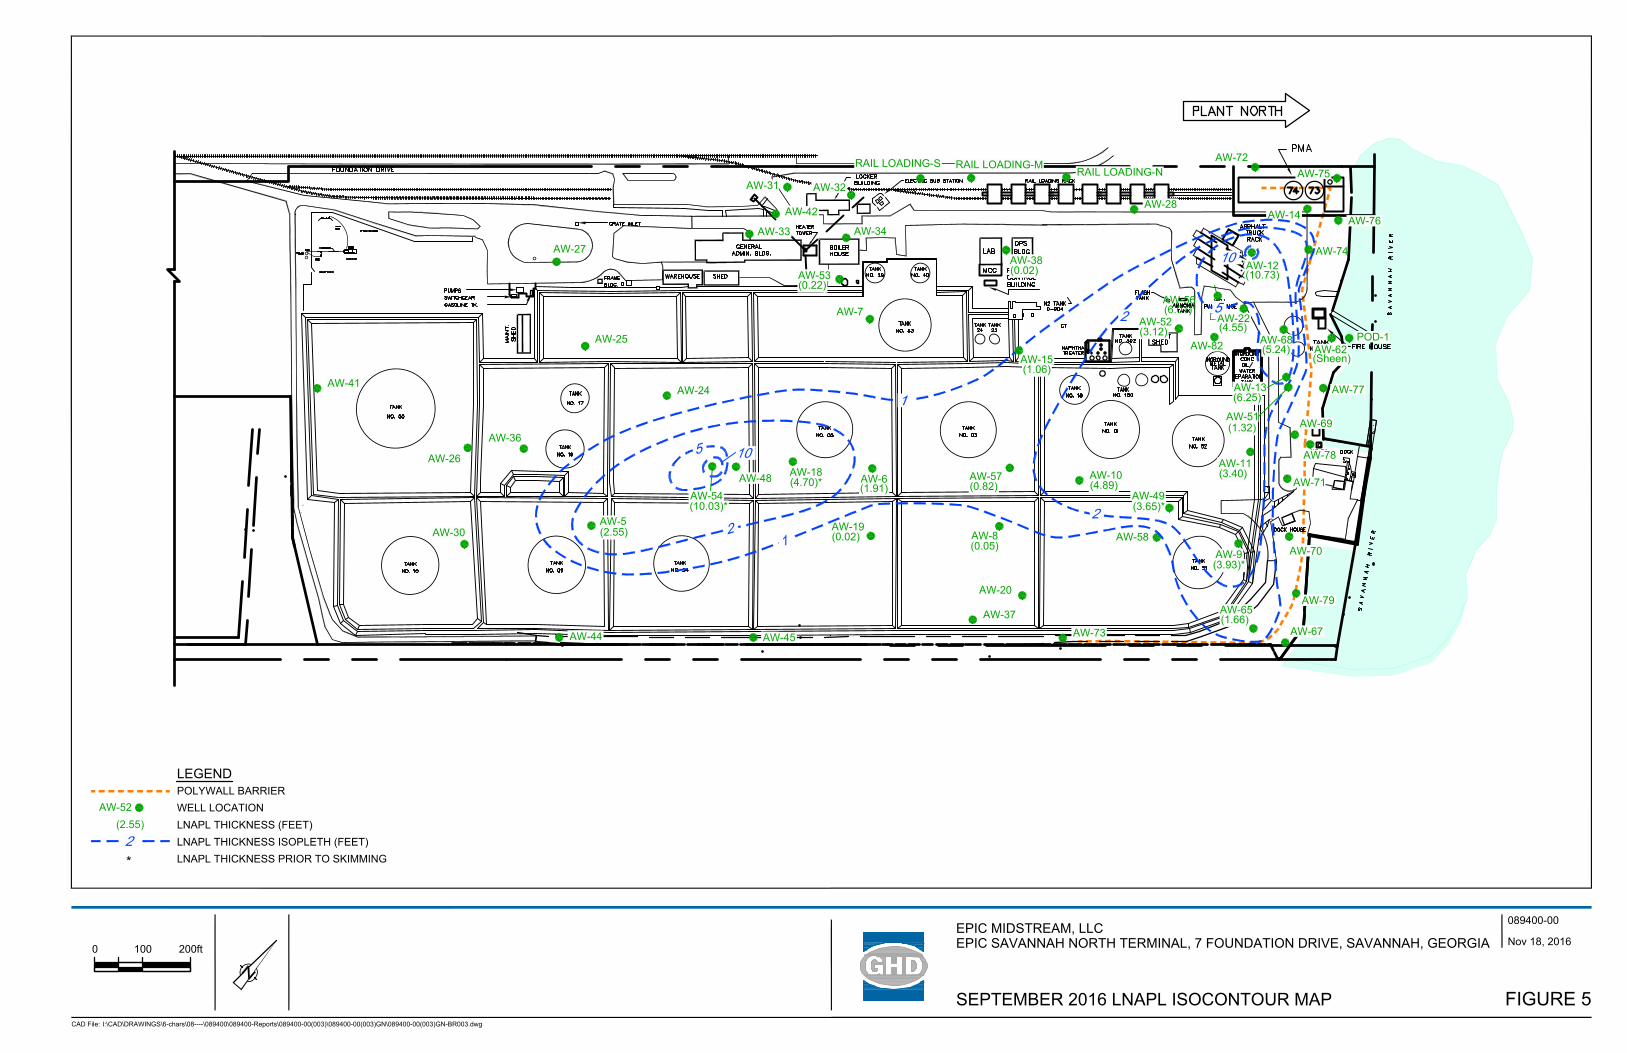
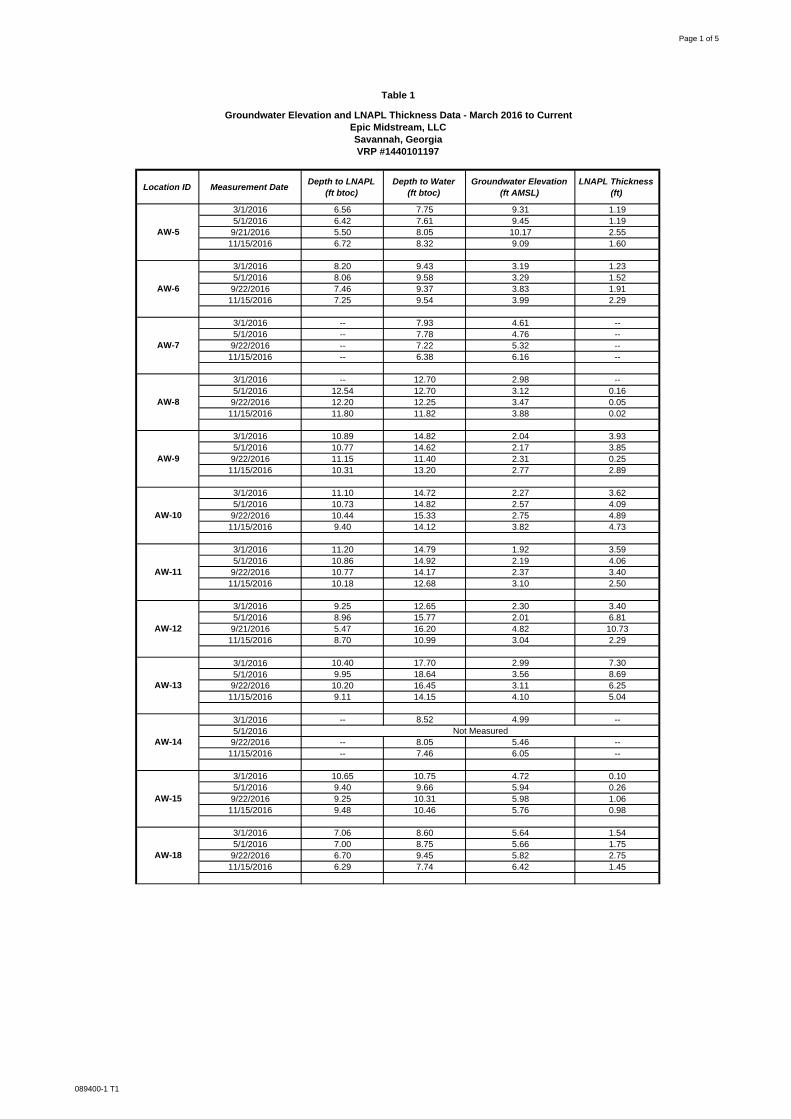
Depth to water measurements were obtained on September 22, 2016 for 60 existing on-Site monitoring wells that were located and accessible during the event. The measurements were obtained using a Solinst oil/water interface probe and are summarized in Table 1. Groundwater elevations were determined based on the depth to groundwater measurements and adjusted for the measured in-well LNAPL thickness, where required. A groundwater potentiometric elevation and contour map based on the September 22, 2016 groundwater elevation data is shown on Figure 4 and indicates that the groundwater flow direction is generally to the east towards the Savannah River and is consistent with historical observations.
LNAPL was measured in 23 of 60 gauged wells during the September 2016 event as summarized in Table 1 with observed thicknesses between a sheen and 10.73 feet. Figure 5 presents isopleths depicting the measured in-well LNAPL thicknesses for this event which are generally consistent with observations from recent events. A sheen of LNAPL was observed on the river side of the polywall, in AW-62; however, no LNAPL was measured in POD-1.
GHD | Epic Midstream, LLC – 2016 2nd Semi-Annual Progress Report | 089400 (3) | 3
2.1.2 November 2016 Gauging Event
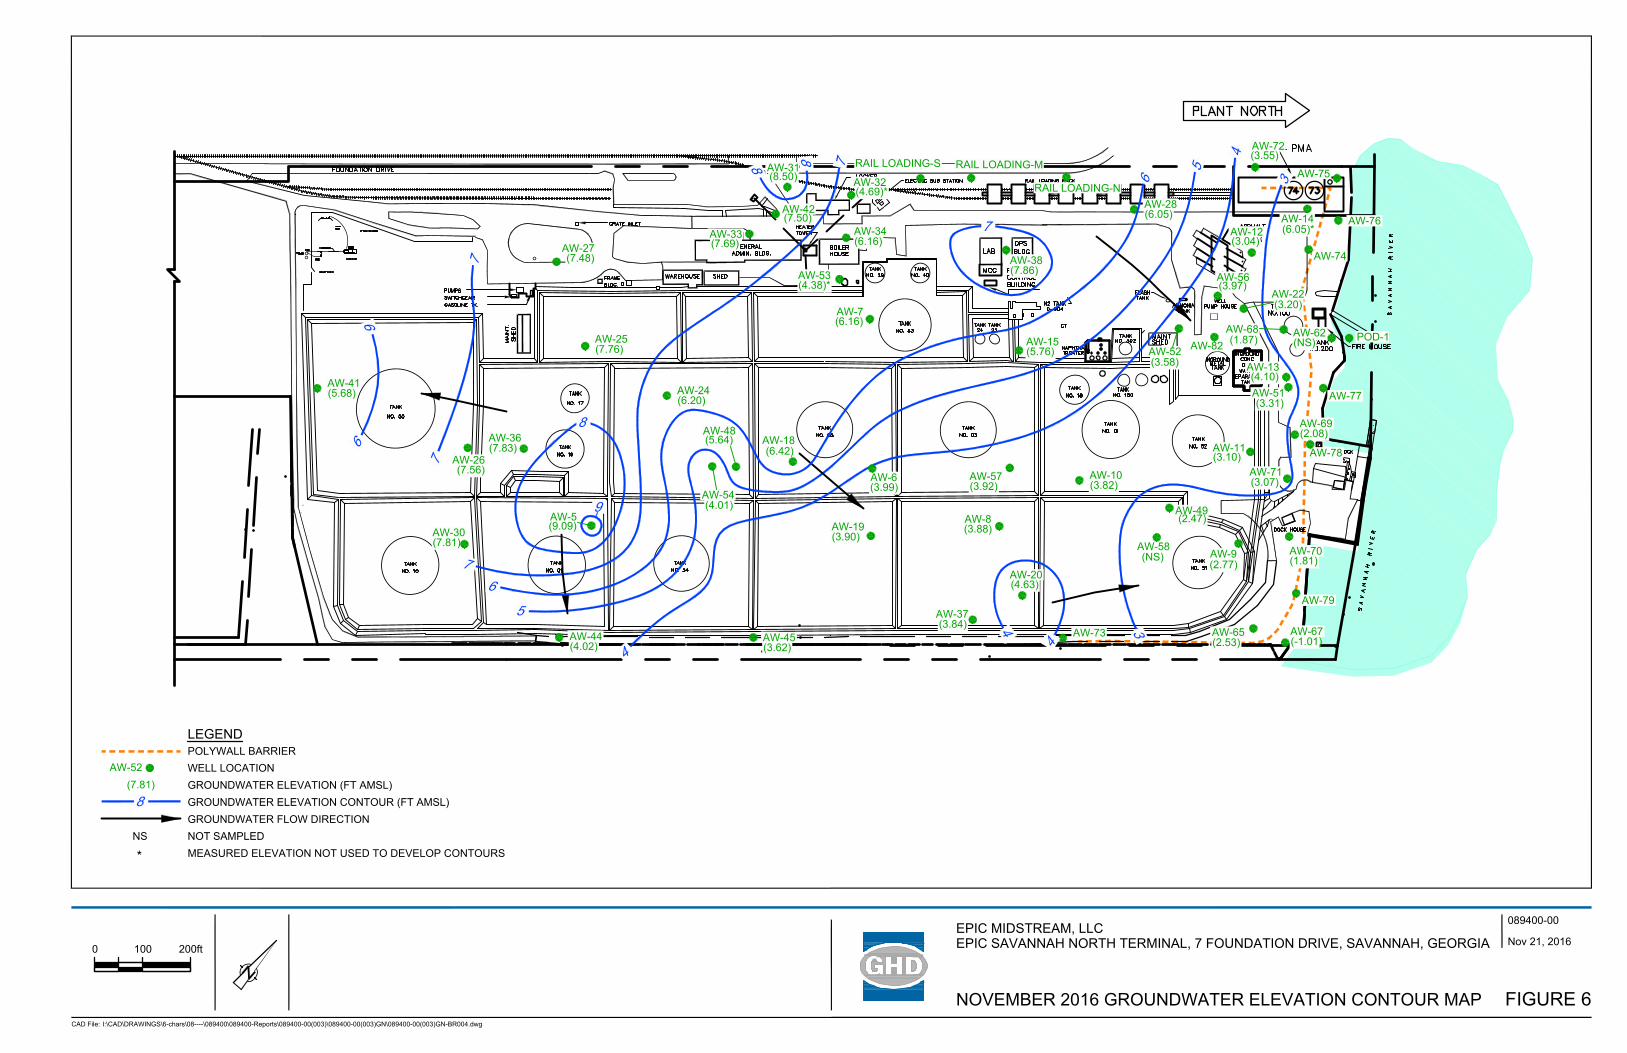
Depth to water measurements were obtained on November 15, 2016 for 61 existing on-Site monitoring wells that were located and accessible during the event. The measurements were obtained using a Solinst oil/water interface probe and are summarized in Table 1. Groundwater elevations were determined as described above (Section 2.2.1). A groundwater potentiometric elevation and contour map based on the November 15, 2016 groundwater elevation data is shown on Figure 6 and indicates that the groundwater flow direction is generally to the east towards the Savannah River and is consistent with historical observations.
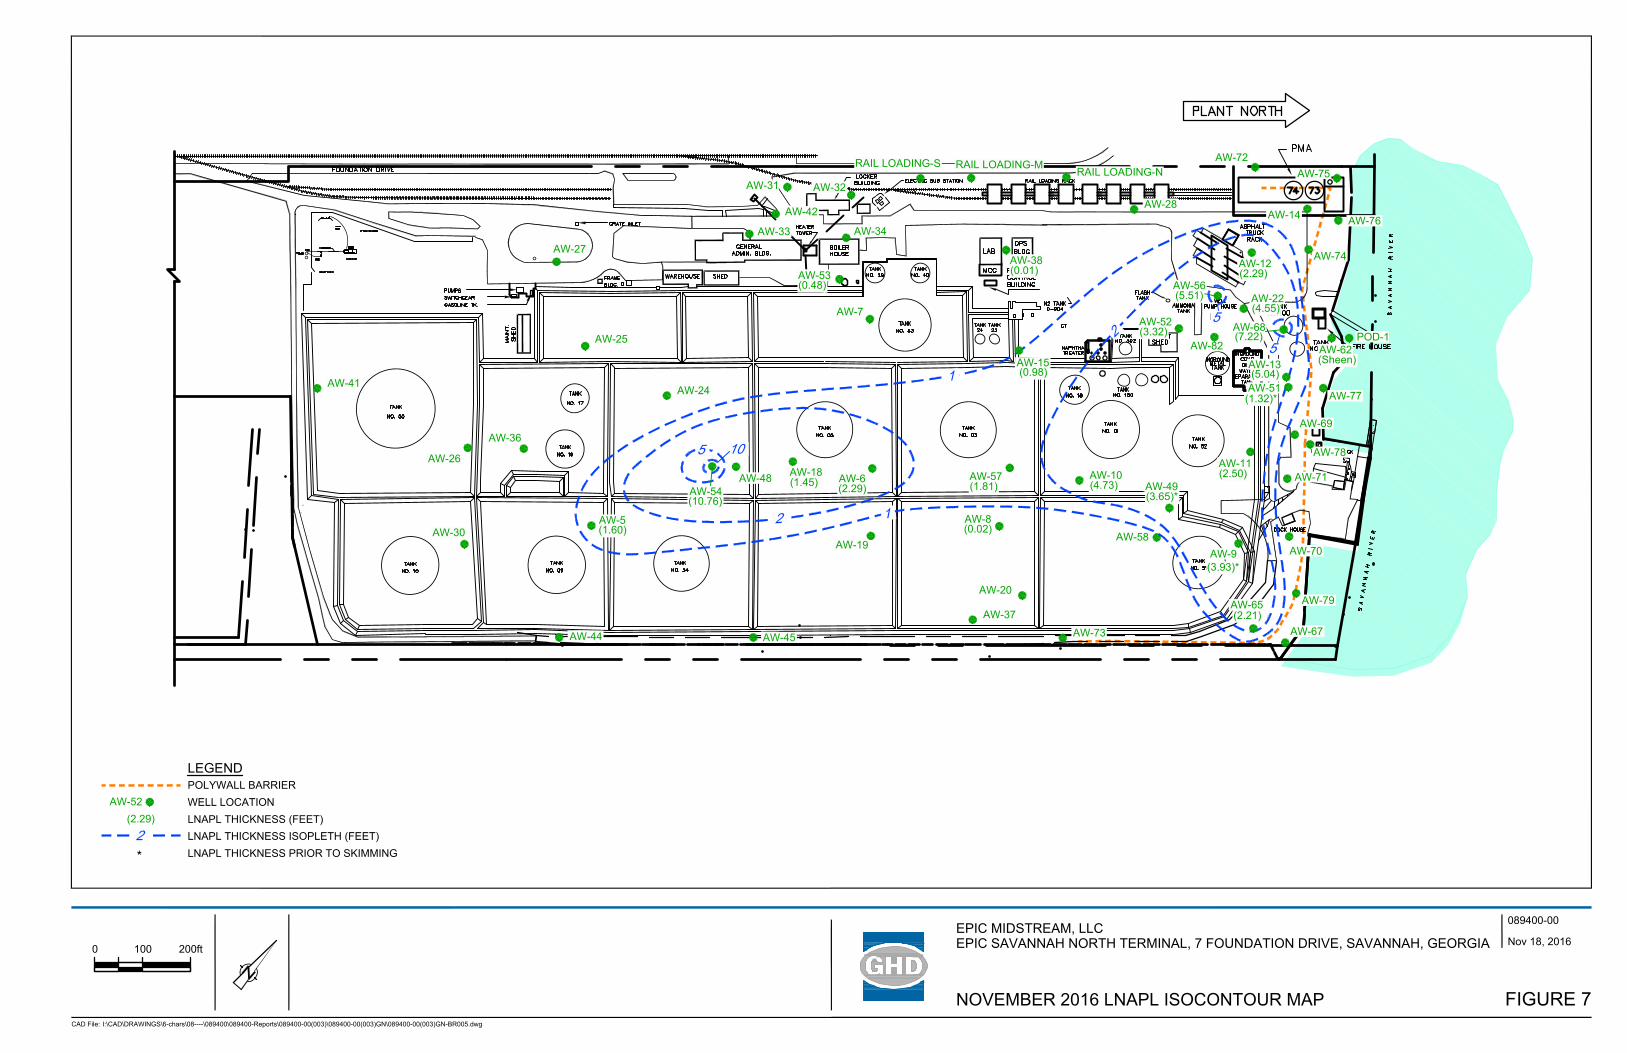
LNAPL was measured in 22 of 61 gauged wells during the November 2016 event as summarized in Table 1 with observed thicknesses between a sheen and 10.76 feet. Figure 7 presents isopleths depicting the measured in-well LNAPL thicknesses for this event which are generally consistent with observations from recent events. A sheen of LNAPL was observed on the river side of the polywall, in AW-62; however, no LNAPL was measured in POD-1.
2.2 Groundwater Sampling
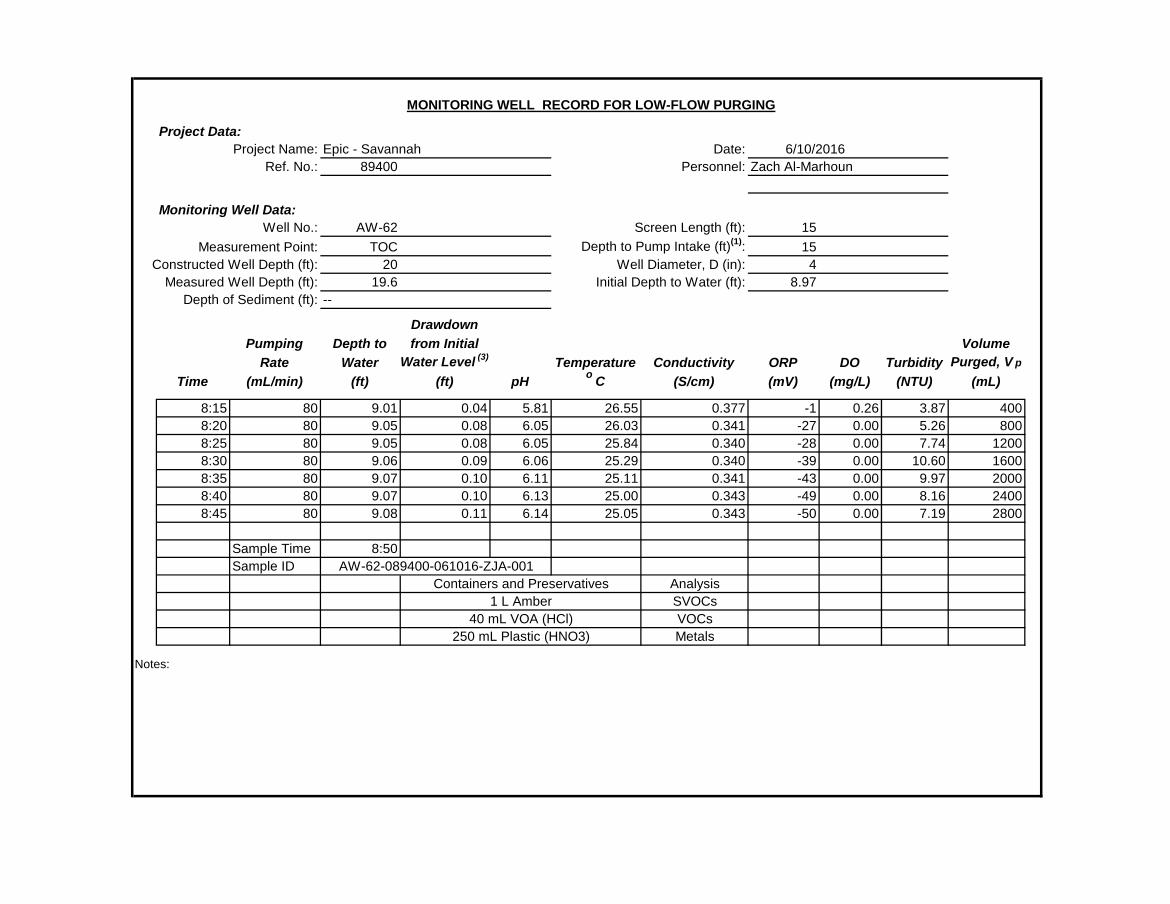
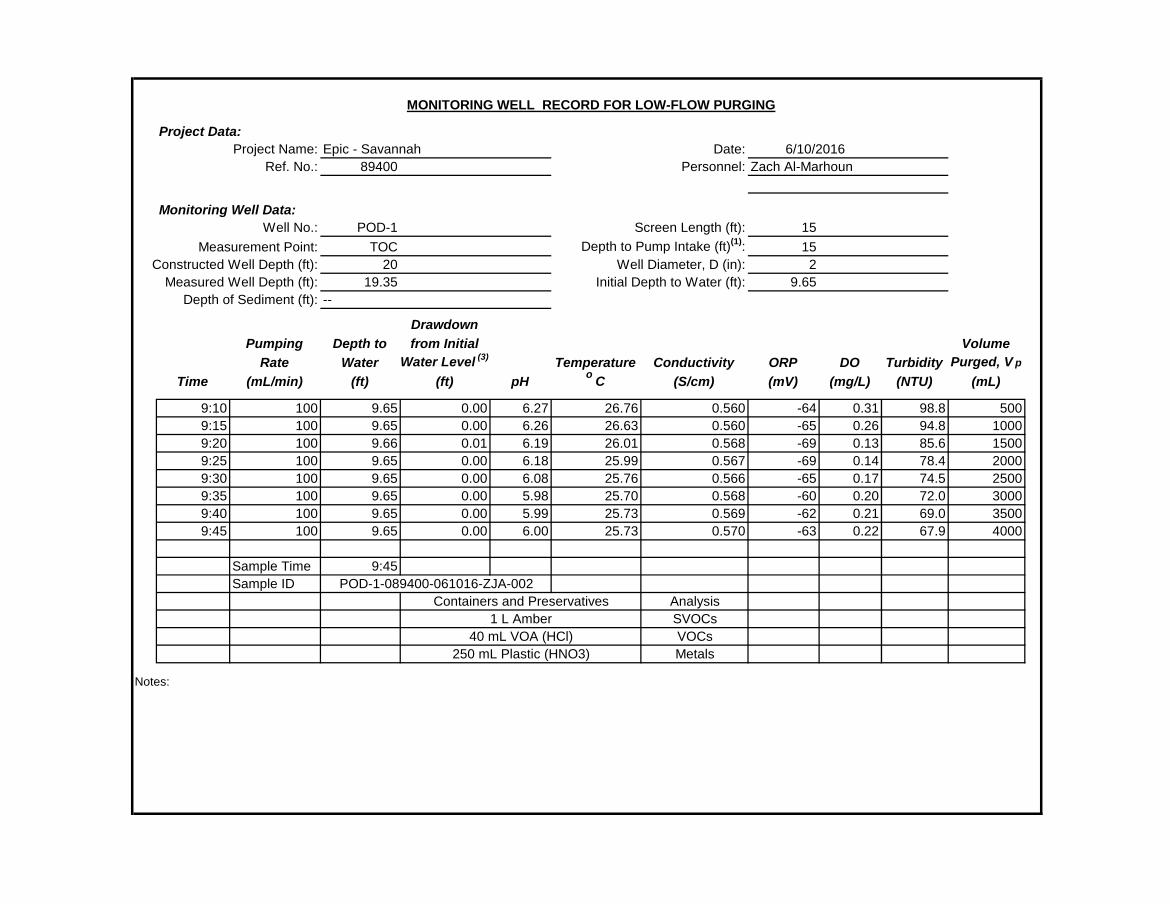
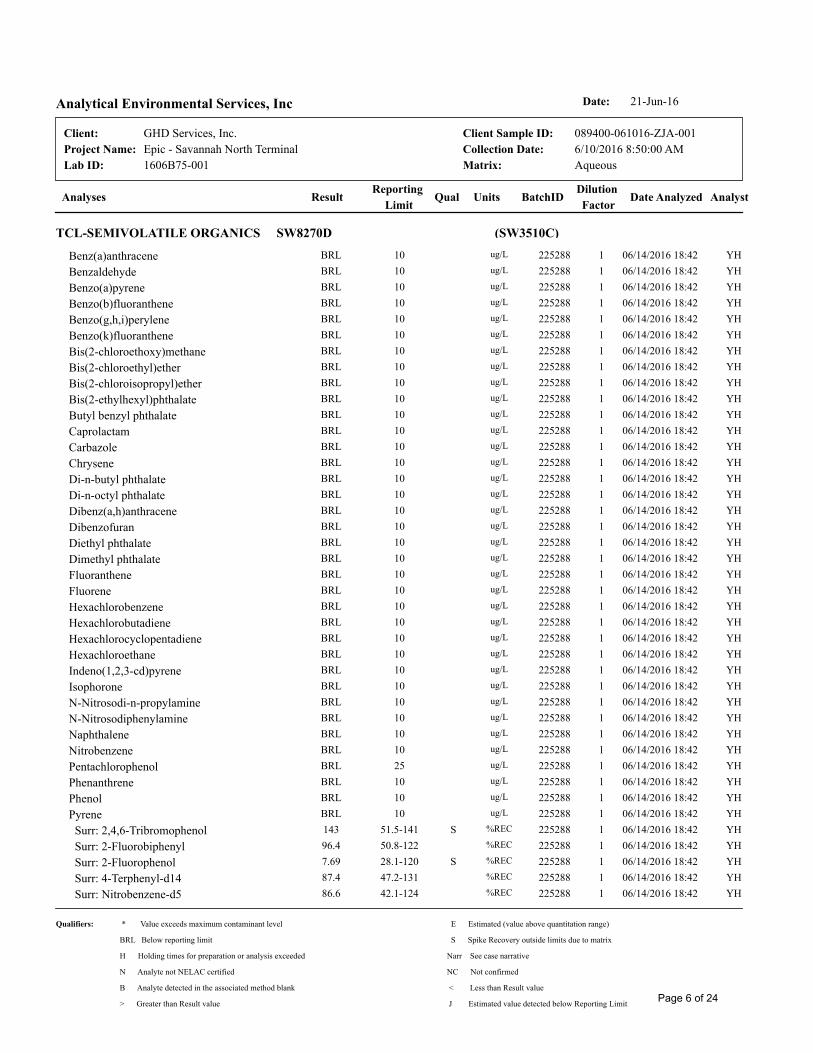
On June 10, 2016, GHD collected a groundwater sample from wells AW-62 and POD-1 that are located on the river-side of the polywall barrier system as shown on Figure 3. The groundwater purging and sampling activities were conducted in general accordance with current guidelines and methodologies as outlined in the U.S. Environmental Protection Agency (EPA) Region 4 Science and Ecosystem Support Division (SESD) Field Branches Quality System and Technical Procedures (FBQSTP). GHD personnel used clean disposable gloves during purging and sampling. Prior to sampling, each monitoring well was purged using low flow purging (LFP) methodologies using a peristaltic pump with new disposable polyethylene tubing dedicated to each well. Field parameters including pH, specific conductivity, turbidity, temperature, dissolved oxygen (DO), and oxidation-reduction potential (ORP) were measured during purging. Upon the stabilization of the field parameters, purging was discontinued and groundwater samples were collected. The field parameter measurements collected during purging and at the time of sampling are included on the LFP forms attached in Appendix A. Each sample was collected in pre-cleaned, laboratory-supplied containers that were labeled and stored on ice pending delivery to Analytical Environmental Services, Inc. (AES) in Atlanta, Georgia.
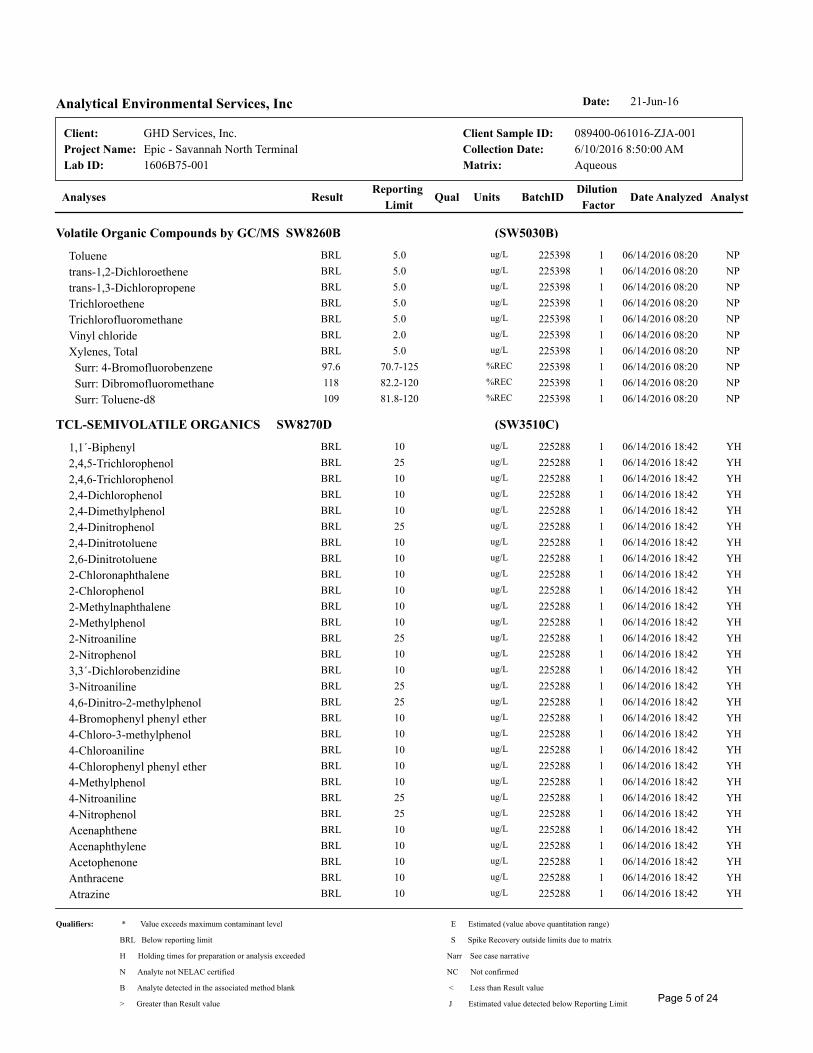
The samples were analyzed for VOCs, SVOCs, and total RCRA metals. The analytical laboratory report for the groundwater samples are included in Appendix B. No analytes were detected in either sample at concentrations above the laboratory reporting limit.
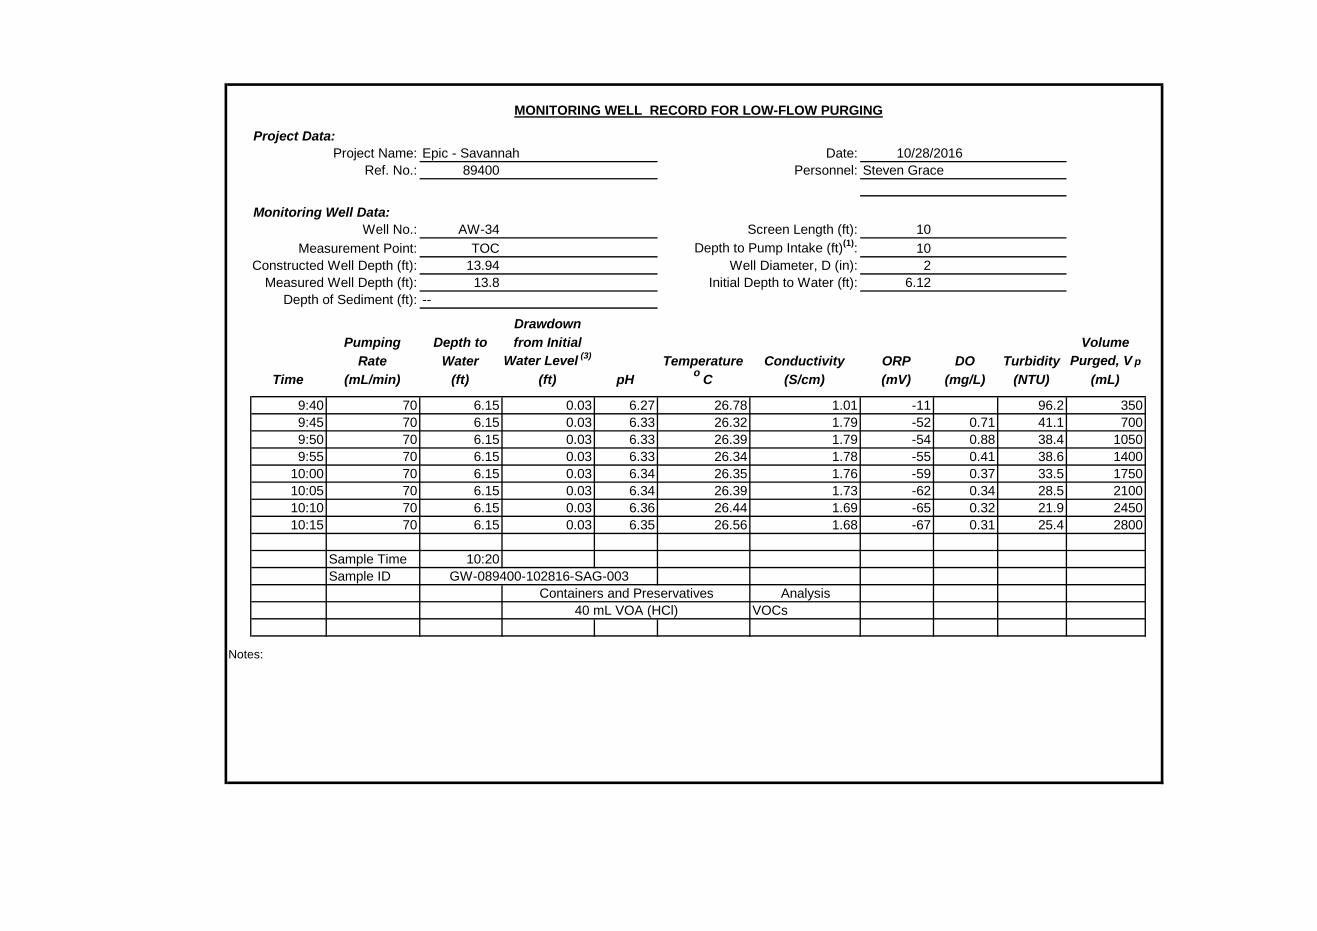
On October 28, 2016, GHD collected groundwater samples from AW-27, AW-33, and AW-34 to support the evaluation of the vapor intrusion exposure pathway. Each well was purged and sampled as described above with the exception that the samples were submitted for analysis of benzene, toluene, ethylbenzene, xylenes, and naphthalene. LFP forms for each well are included in Appendix A and the analytical laboratory report is included in Appendix B. No analytes were detected at concentrations above the laboratory reporting limit.
2.3 LNAPL Skimming and Transmissivity Evaluation
As described in the 2016 First Semi-Annual Progress Report, GHD and Epic proposed to obtain three LNAPL skimmer systems and install them in wells containing greater than 0.33 feet of LNAPL to continue LNAPL recovery and initiate an LNAPL transmissivity evaluation.
GHD | Epic Midstream, LLC – 2016 2nd Semi-Annual Progress Report | 089400 (3) | 4
The Langan Technical Memorandum proposed the implementation of three LNAPL recovery approaches at the Site: skimming; mobile vacuum truck events; and installation of a fixed MPE system. It has been proposed that LNAPL transmissivity and the associated de minimis criteria of 0.1-0.8 ft2/day proposed by the Interstate Technology Regulatory Council (ITRC) be used as the primary metric for LNAPL recovery at the Site. The ITRC de minimis LNAPL transmissivity range represents a magnitude of LNAPL recoverability at which the performance of LNAPL recovery is typically considered to be ineffective and unnecessary. In other words, continued LNAPL recovery is not deemed to be technically feasible at these levels since LNAPL mobility is considered to be negligible and therefore would not be expected to contribute to LNAPL migration. However, the Langan Technical Memorandum proposed LNAPL recovery be performed at numerous Site wells when only four wells appeared to have LNAPL transmissivities high enough that LNAPL recovery might be realistically expected to provide a benefit based on the estimates presented (i.e., most are already at or within the ITRC de minimis range). GHD proposed to implement a scope or work to provide the basis for a more accurate estimation of potential LNAPL recovery rates and LNAPL transmissivity, as well as a more technically appropriate application of the ITRC de minimis criteria.
GHD proposed to complete an LNAPL transmissivity evaluation by implementing LNAPL skimming only at all Site wells exhibiting in-well LNAPL thicknesses greater than 0.33 feet for periods of two to three weeks. This would represent an assumed limit for screening for the presence of potentially mobile/recoverable LNAPL in general and a practical limit for the evaluation of LNAPL transmissivity specifically as per ASTM E2856-13 Standard Guide for Estimation of LNAPL Transmissivity. The LNAPL transmissivity estimates would be developed pursuant to the methodology contained in ASTM E2856-13 for skimming. This would allow a much more accurate evaluation of LNAPL mobility/recoverability (while recovering LNAPL) upon which to base the subsequent LNAPL recovery/management strategy that may or may not include more aggressive techniques such as MPE. Wells exhibiting LNAPL transmissivity values (Tn) that suggest LNAPL is mobile and recoverable will then be evaluated to determine the most appropriate LNAPL recovery approach to be implemented over the long-term.
To complete the LNAPL transmissivity evaluation program, three LNAPL-only skimmer systems were purchased from QED Environmental. The typical installation for each skimmer system consisted of the use of a solar-powered controller, nitrogen cylinders to provide gas to operate the controller and skimmer pump, a 55-gallon drum equipped with a high-level shutoff to store recovered LNAPL, and the skimmer and pump assembly installed such that the LNAPL/groundwater interface was within the travel distance of the skimmer. Each skimmer was operated in attempt to maximize LNAPL recovery while continuously operating throughout the evaluation period. However, due to storage limitations on recovered LNAPL and nitrogen usage rates, the skimmers could not be operated at optimal rates for all of the wells evaluated.
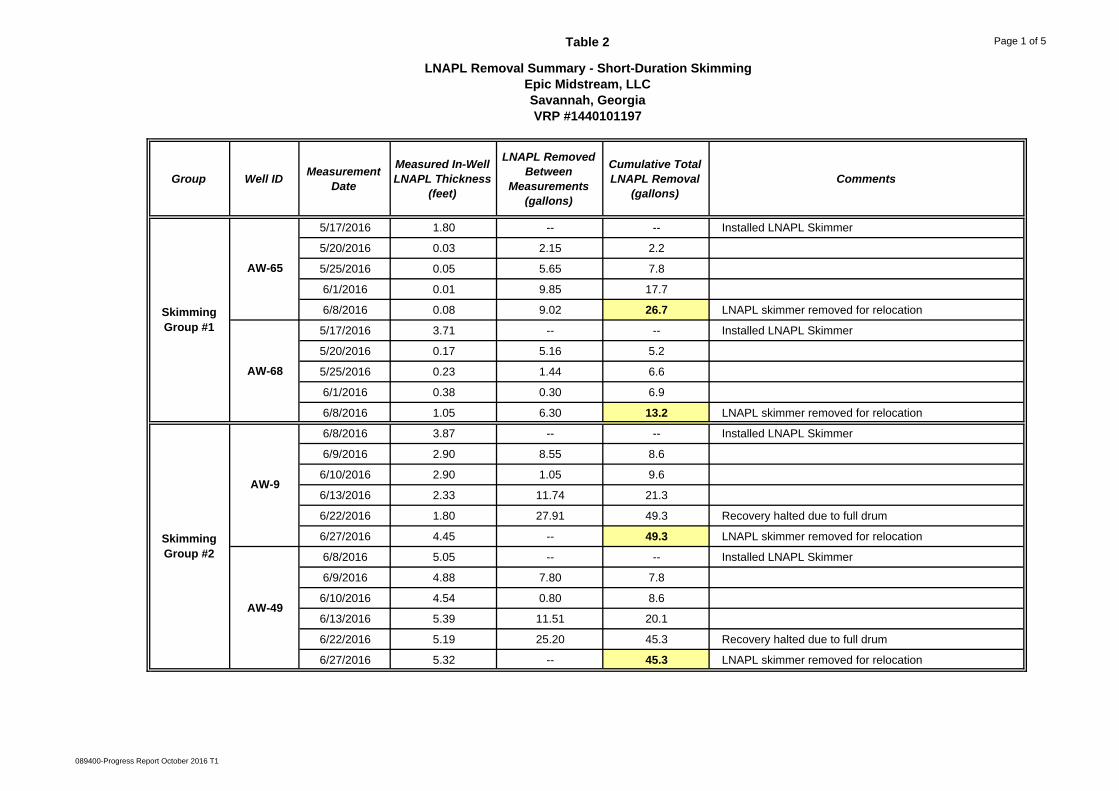
2.3.1 Short-Duration LNAPL Skimming Studies
To complete the LNAPL transmissivity evaluation, GHD operated LNAPL skimmers in up to three wells at a time over a three and four-week duration. During operation, GHD monitored the recovery rate of LNAPL weekly to determine a daily recovery rate used to estimate a preliminary LNAPL Tn for each well.
GHD | Epic Midstream, LLC – 2016 2nd Semi-Annual Progress Report | 089400 (3) | 5
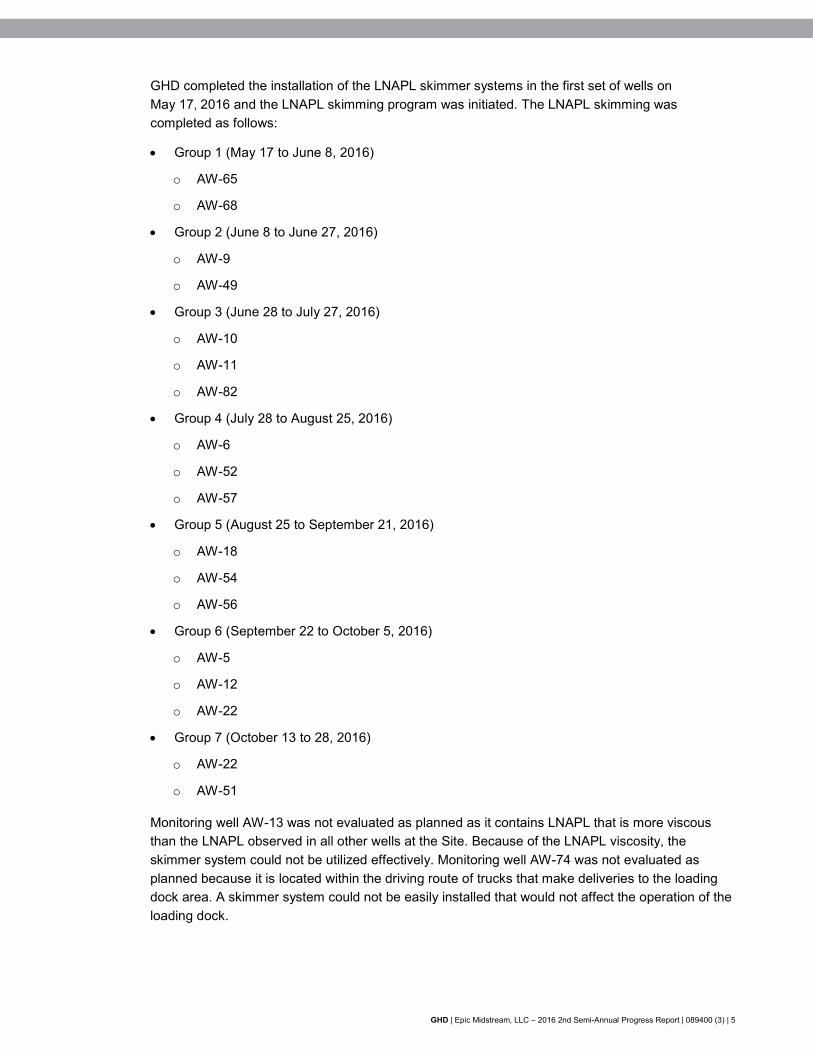
GHD completed the installation of the LNAPL skimmer systems in the first set of wells on May 17, 2016 and the LNAPL skimming program was initiated. The LNAPL skimming was completed as follows:
• Group 1 (May 17 to June 8, 2016)
o AW-65
o AW-68
• Group 2 (June 8 to June 27, 2016)
o AW-9
o AW-49
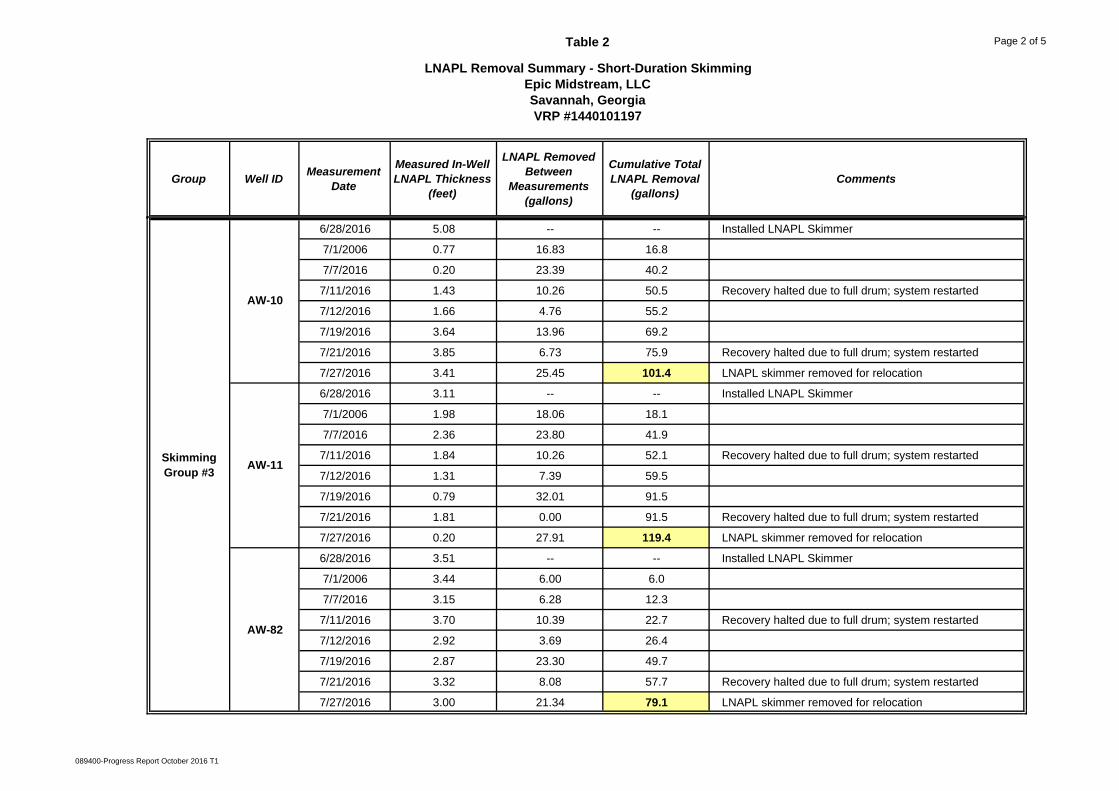
• Group 3 (June 28 to July 27, 2016)
o AW-10
o AW-11
o AW-82
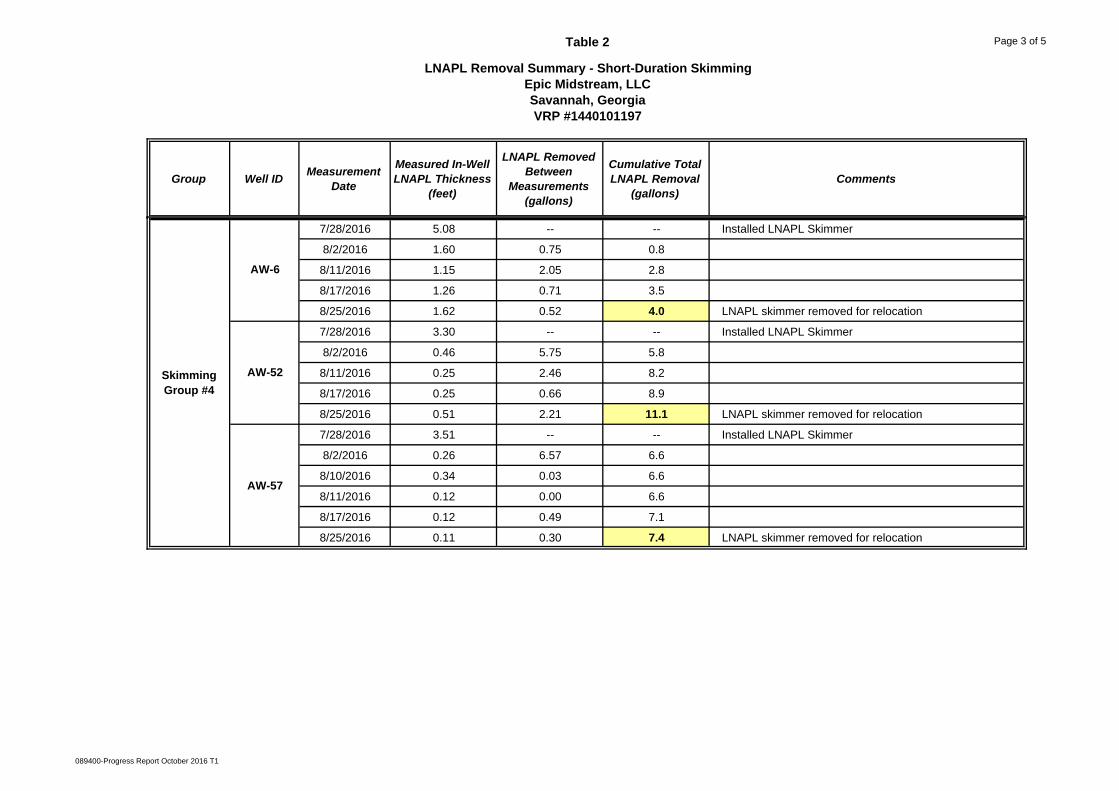
• Group 4 (July 28 to August 25, 2016)
o AW-6
o AW-52
o AW-57
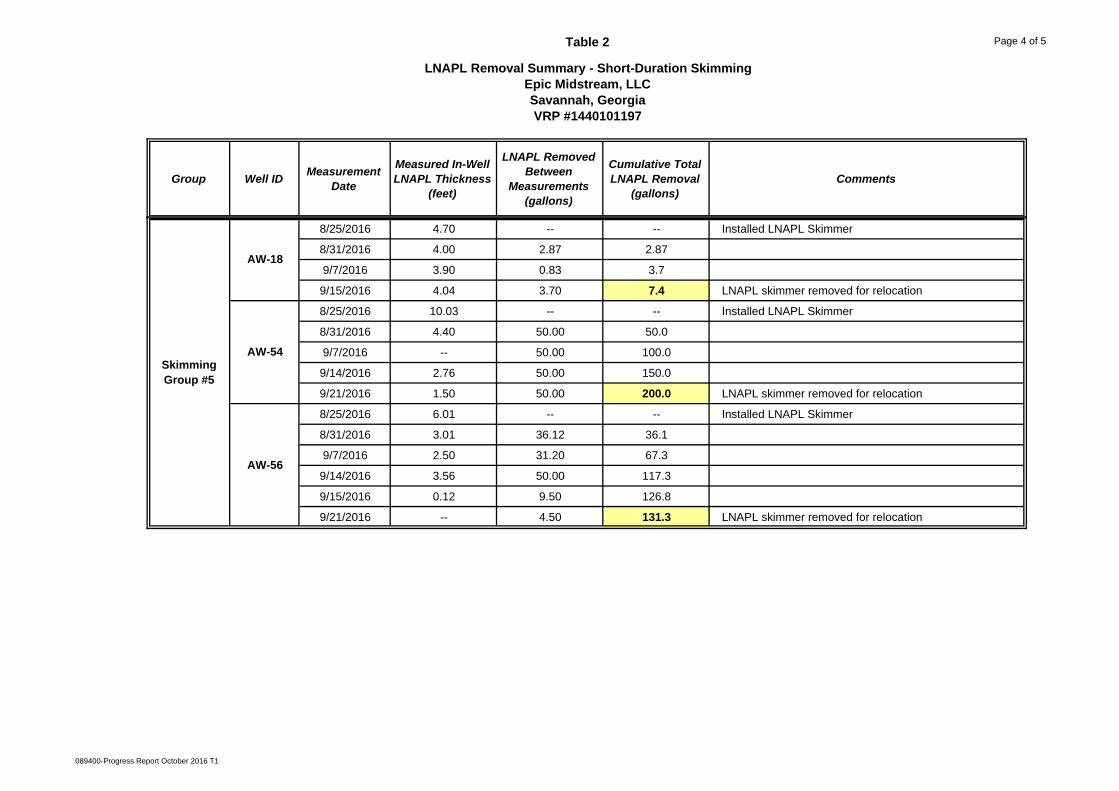
• Group 5 (August 25 to September 21, 2016)
o AW-18
o AW-54
o AW-56
• Group 6 (September 22 to October 5, 2016)
o AW-5
o AW-12
o AW-22
• Group 7 (October 13 to 28, 2016)
o AW-22
o AW-51
Monitoring well AW-13 was not evaluated as planned as it contains LNAPL that is more viscous than the LNAPL observed in all other wells at the Site. Because of the LNAPL viscosity, the skimmer system could not be utilized effectively. Monitoring well AW-74 was not evaluated as planned because it is located within the driving route of trucks that make deliveries to the loading dock area. A skimmer system could not be easily installed that would not affect the operation of the loading dock.
GHD | Epic Midstream, LLC – 2016 2nd Semi-Annual Progress Report | 089400 (3) | 6
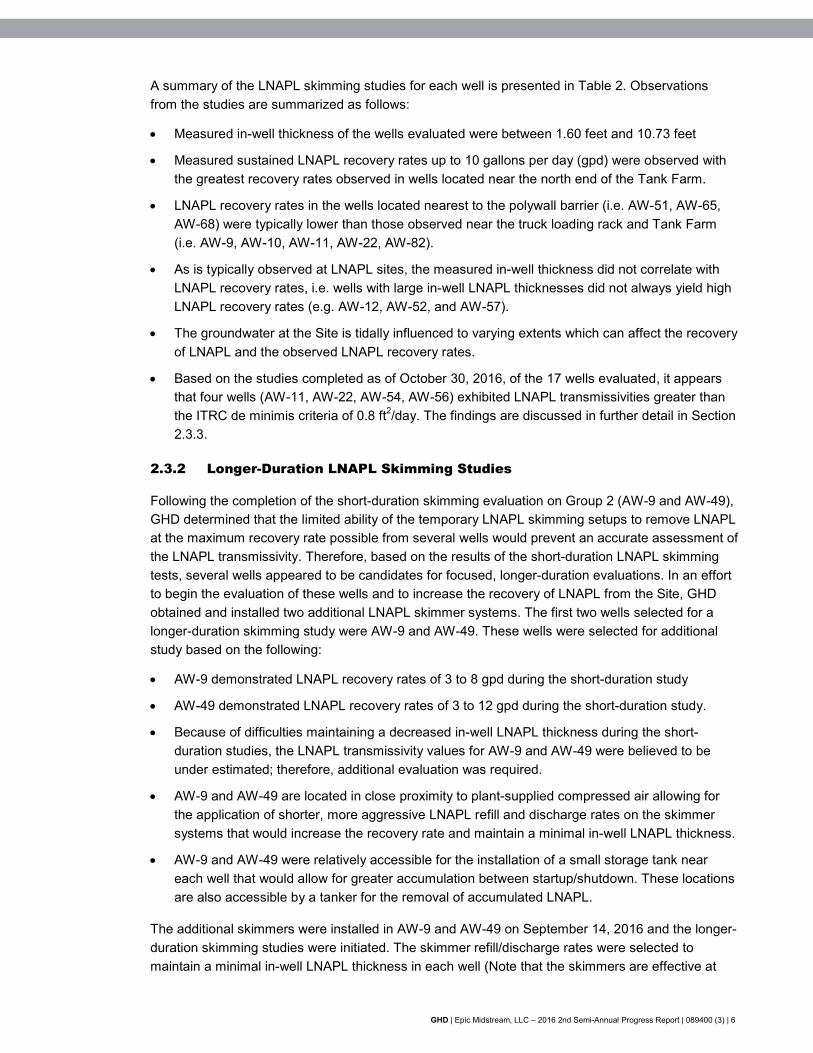
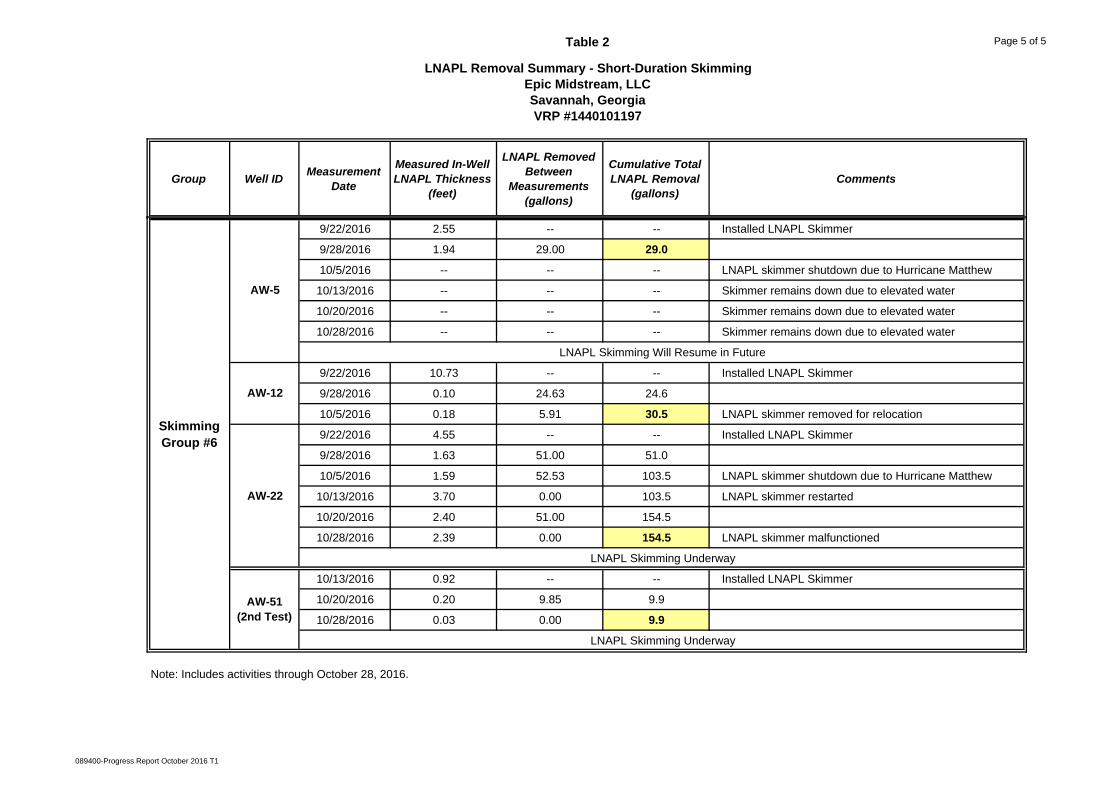
A summary of the LNAPL skimming studies for each well is presented in Table 2. Observations from the studies are summarized as follows:
• Measured in-well thickness of the wells evaluated were between 1.60 feet and 10.73 feet
• Measured sustained LNAPL recovery rates up to 10 gallons per day (gpd) were observed with the greatest recovery rates observed in wells located near the north end of the Tank Farm.
• LNAPL recovery rates in the wells located nearest to the polywall barrier (i.e. AW-51, AW-65, AW-68) were typically lower than those observed near the truck loading rack and Tank Farm (i.e. AW-9, AW-10, AW-11, AW-22, AW-82).
• As is typically observed at LNAPL sites, the measured in-well thickness did not correlate with LNAPL recovery rates, i.e. wells with large in-well LNAPL thicknesses did not always yield high LNAPL recovery rates (e.g. AW-12, AW-52, and AW-57).
• The groundwater at the Site is tidally influenced to varying extents which can affect the recovery of LNAPL and the observed LNAPL recovery rates.
• Based on the studies completed as of October 30, 2016, of the 17 wells evaluated, it appears that four wells (AW-11, AW-22, AW-54, AW-56) exhibited LNAPL transmissivities greater than the ITRC de minimis criteria of 0.8 ft2/day. The findings are discussed in further detail in Section 2.3.3.
2.3.2 Longer-Duration LNAPL Skimming Studies
Following the completion of the short-duration skimming evaluation on Group 2 (AW-9 and AW-49), GHD determined that the limited ability of the temporary LNAPL skimming setups to remove LNAPL at the maximum recovery rate possible from several wells would prevent an accurate assessment of the LNAPL transmissivity. Therefore, based on the results of the short-duration LNAPL skimming tests, several wells appeared to be candidates for focused, longer-duration evaluations. In an effort to begin the evaluation of these wells and to increase the recovery of LNAPL from the Site, GHD obtained and installed two additional LNAPL skimmer systems. The first two wells selected for a longer-duration skimming study were AW-9 and AW-49. These wells were selected for additional study based on the following:
• AW-9 demonstrated LNAPL recovery rates of 3 to 8 gpd during the short-duration study
• AW-49 demonstrated LNAPL recovery rates of 3 to 12 gpd during the short-duration study.
• Because of difficulties maintaining a decreased in-well LNAPL thickness during the short-duration studies, the LNAPL transmissivity values for AW-9 and AW-49 were believed to be under estimated; therefore, additional evaluation was required.
• AW-9 and AW-49 are located in close proximity to plant-supplied compressed air allowing for the application of shorter, more aggressive LNAPL refill and discharge rates on the skimmer systems that would increase the recovery rate and maintain a minimal in-well LNAPL thickness.
• AW-9 and AW-49 were relatively accessible for the installation of a small storage tank near each well that would allow for greater accumulation between startup/shutdown. These locations are also accessible by a tanker for the removal of accumulated LNAPL.
The additional skimmers were installed in AW-9 and AW-49 on September 14, 2016 and the longer-duration skimming studies were initiated. The skimmer refill/discharge rates were selected to maintain a minimal in-well LNAPL thickness in each well (Note that the skimmers are effective at
GHD | Epic Midstream, LLC – 2016 2nd Semi-Annual Progress Report | 089400 (3) | 7
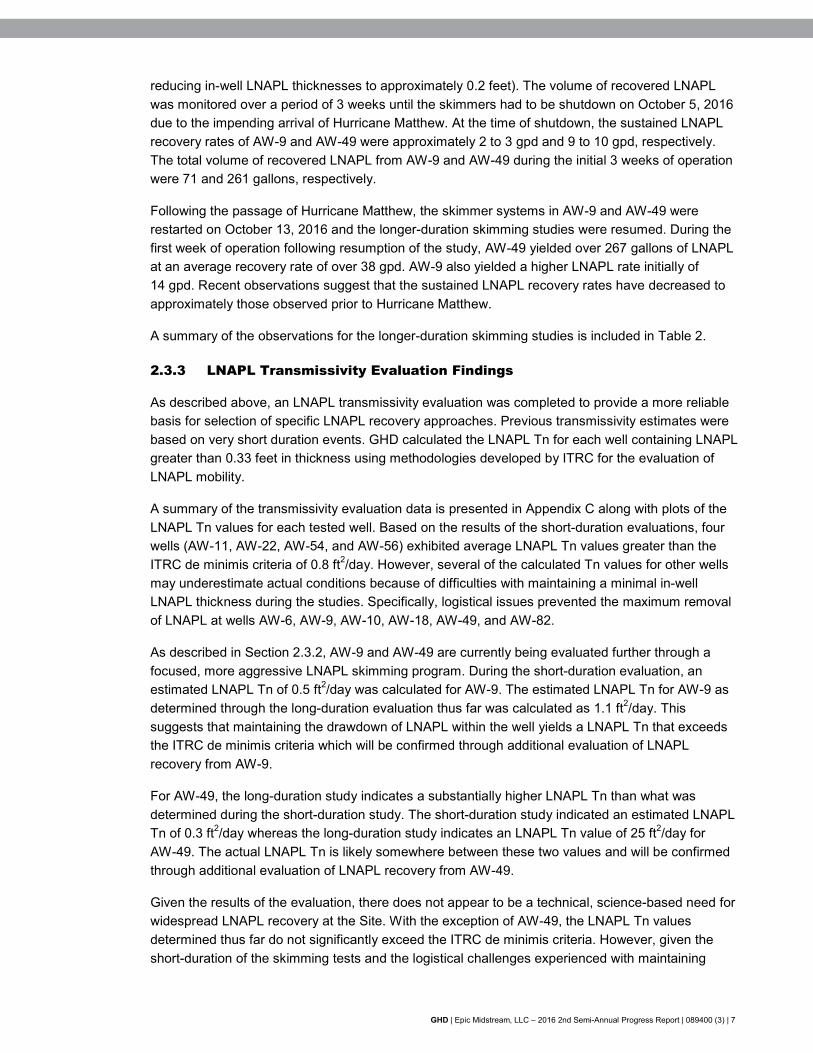
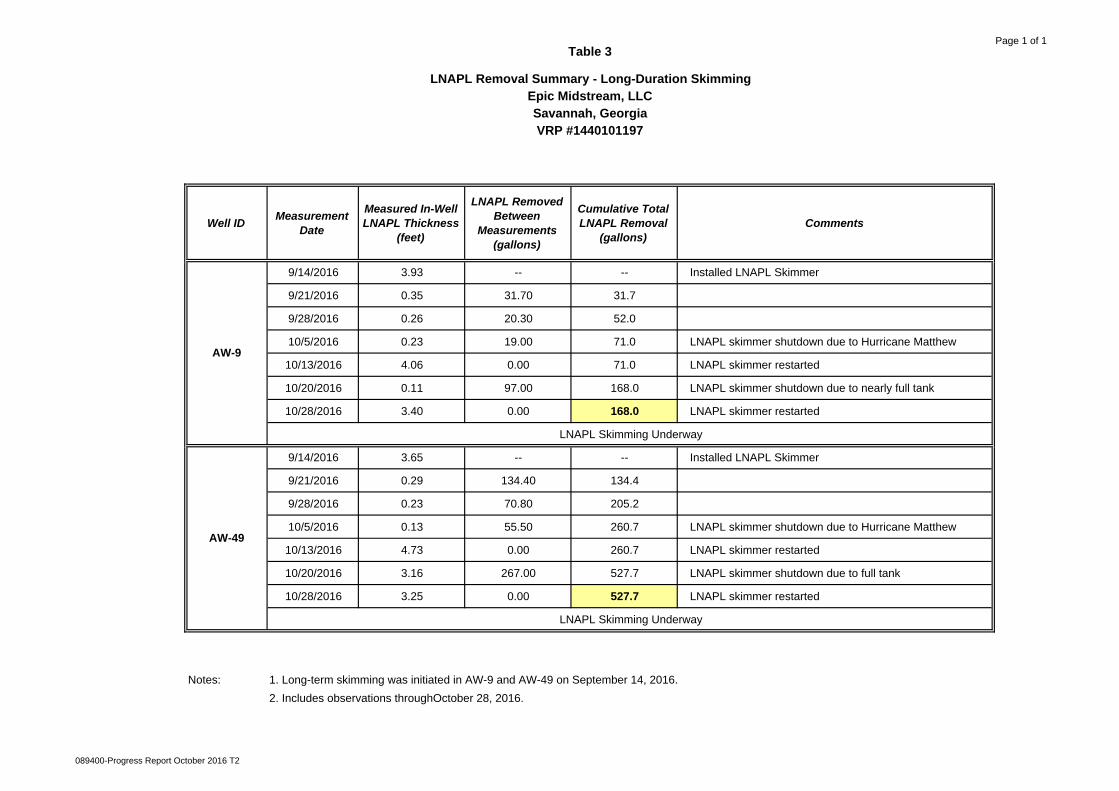
reducing in-well LNAPL thicknesses to approximately 0.2 feet). The volume of recovered LNAPL was monitored over a period of 3 weeks until the skimmers had to be shutdown on October 5, 2016 due to the impending arrival of Hurricane Matthew. At the time of shutdown, the sustained LNAPL recovery rates of AW-9 and AW-49 were approximately 2 to 3 gpd and 9 to 10 gpd, respectively. The total volume of recovered LNAPL from AW-9 and AW-49 during the initial 3 weeks of operation were 71 and 261 gallons, respectively.
Following the passage of Hurricane Matthew, the skimmer systems in AW-9 and AW-49 were restarted on October 13, 2016 and the longer-duration skimming studies were resumed. During the first week of operation following resumption of the study, AW-49 yielded over 267 gallons of LNAPL at an average recovery rate of over 38 gpd. AW-9 also yielded a higher LNAPL rate initially of 14 gpd. Recent observations suggest that the sustained LNAPL recovery rates have decreased to approximately those observed prior to Hurricane Matthew.
A summary of the observations for the longer-duration skimming studies is included in Table 2.
2.3.3 LNAPL Transmissivity Evaluation Findings
As described above, an LNAPL transmissivity evaluation was completed to provide a more reliable basis for selection of specific LNAPL recovery approaches. Previous transmissivity estimates were based on very short duration events. GHD calculated the LNAPL Tn for each well containing LNAPL greater than 0.33 feet in thickness using methodologies developed by ITRC for the evaluation of LNAPL mobility.
A summary of the transmissivity evaluation data is presented in Appendix C along with plots of the LNAPL Tn values for each tested well. Based on the results of the short-duration evaluations, four wells (AW-11, AW-22, AW-54, and AW-56) exhibited average LNAPL Tn values greater than the ITRC de minimis criteria of 0.8 ft2/day. However, several of the calculated Tn values for other wells may underestimate actual conditions because of difficulties with maintaining a minimal in-well LNAPL thickness during the studies. Specifically, logistical issues prevented the maximum removal of LNAPL at wells AW-6, AW-9, AW-10, AW-18, AW-49, and AW-82.
As described in Section 2.3.2, AW-9 and AW-49 are currently being evaluated further through a focused, more aggressive LNAPL skimming program. During the short-duration evaluation, an estimated LNAPL Tn of 0.5 ft2/day was calculated for AW-9. The estimated LNAPL Tn for AW-9 as determined through the long-duration evaluation thus far was calculated as 1.1 ft2/day. This suggests that maintaining the drawdown of LNAPL within the well yields a LNAPL Tn that exceeds the ITRC de minimis criteria which will be confirmed through additional evaluation of LNAPL recovery from AW-9.
For AW-49, the long-duration study indicates a substantially higher LNAPL Tn than what was determined during the short-duration study. The short-duration study indicated an estimated LNAPL Tn of 0.3 ft2/day whereas the long-duration study indicates an LNAPL Tn value of 25 ft2/day for AW-49. The actual LNAPL Tn is likely somewhere between these two values and will be confirmed through additional evaluation of LNAPL recovery from AW-49.
Given the results of the evaluation, there does not appear to be a technical, science-based need for widespread LNAPL recovery at the Site. With the exception of AW-49, the LNAPL Tn values determined thus far do not significantly exceed the ITRC de minimis criteria. However, given the short-duration of the skimming tests and the logistical challenges experienced with maintaining
GHD | Epic Midstream, LLC – 2016 2nd Semi-Annual Progress Report | 089400 (3) | 8
LNAPL drawdown and maximizing the LNAPL recovery rates while managing the usage of air for recovery and managing the storage of recovered LNAPL, several wells may have LNAPL Tn values greater than those reported thus far. Therefore, long-duration LNAPL skimming evaluations will continue at select wells that appear most likely to generate LNAPL at appreciable rates.
For the wells where the calculated LNAPL Tn value was within the range of the ITRC de minimis criteria of 0.1 – 0.8 ft2/day and for which the in-well LNAPL thickness was adequately minimized during the short-duration evaluations, no further LNAPL recovery will be completed. The ITRC criteria is a commonly accepted, science-based endpoint for LNAPL recovery; therefore, upon reaching the criteria, LNAPL recovery will be suspended.
2.4 Vapor Intrusion Screening
During the reporting period, the vapor intrusion exposure pathway was evaluated. A preliminary screening was performed of available groundwater analytical data, the depth to groundwater, and the presence of LNAPL beneath or in the vicinity of occupied structures at the Site. There are several structures at the Site that are routinely occupied by Site personnel and include: administration building, laboratory, operations building, and the guard house/locker building. Currently, only the administration building, laboratory, and operations building are occupied by Site personnel on a routine basis.
As described in Section 2.2, groundwater samples were collected from wells AW-27, AW-33, and AW-34 in October 2016. These wells were sampled to evaluate the vapor intrusion exposure pathway for occupants of the administration building. There were no reported detections of benzene, toluene, ethylbenzene, xylenes, or naphthalene in the groundwater collected from these three wells indicating that there is not a complete vapor intrusion exposure pathway.
LNAPL has been intermittently detected in AW-38 which is located between the laboratory and operations buildings as shown on Figure 3. Because the depth to LNAPL is near 5 feet below the elevation of the building slabs, there is a potential vapor intrusion exposure pathway present for these structures that will be evaluated further during the next reporting period. Additional data collection consisting of sub-slab or deep soil gas sampling will be performed and the resulting data evaluated to determine if soil vapor presents a potential risk to occupants of these structures.
2.5 Conceptual Site Model
A preliminary CSM was submitted as part of the VIRP. The CSM will be updated as additional data are collected during the progress of activities implemented overtime. It is anticipated that the CSM will be updated following the completion of the LNAPL Transmissivity Evaluation.
3. Proposed Remediation Activities
Continued LNAPL Skimming and Refinement of LNAPL Transmissivity Evaluation
During the reporting period, GHD completed three to four-week duration LNAPL skimming events on 17 wells exhibiting in-well LNAPL thicknesses of greater than 0.33 feet. The observations and data generated were used to calculate LNAPL Tn values for each well that have been used to identify specific wells requiring further LNAPL recovery.
GHD | Epic Midstream, LLC – 2016 2nd Semi-Annual Progress Report | 089400 (3) | 9
The LNAPL Tn evaluations suggested that only select wells exhibited LNAPL Tn values greater than the ITRC de minimis criteria. However, as described previously, several wells require additional longer-term evaluation to determine more accurate LNAPL Tn values through the maximization of LNAPL recovery rates. Wells AW-9 and AW-49 will continue to be evaluated to more accurately define the LNAPL Tn values for those wells and to gauge the decreasing LNAPL recovery rate and the effects on the transmissivity of the LNAPL.
GHD will utilize the three remaining LNAPL skimmer systems to perform longer-duration evaluations of AW-6, AW-10, AW-11, AW-18, AW-22, AW-54, AW-56, and AW-82. These wells either exhibited LNAPL Tn values greater than the ITRC de minimis criteria or the in-well LNAPL thickness could not be effectively reduced to allow an accurate LNAPL Tn estimation. The order of evaluation will be determined based on several Site-specific factors, namely proximity to plant-supplied air and the ability to stage and periodically empty an LNAPL storage tank near the well. The duration of the evaluation for each well will be determined based on field observations of the LNAPL recovery rate, reductions in the measured in-well LNAPL thickness, and estimates of the LNAPL Tn. If a well is determined to exhibit an LNAPL Tn of less than the de minimis criteria, then skimming will be halted as general industry guidance suggests that LNAPL with a Tn value less than 0.8 ft2/day is not mobile and/or recoverable.
Based on the LNAPL Tn values calculated thus far, a focused LNAPL skimming approach appears to be an appropriate remedial approach for implementation at the Site. Epic will continue to implement LNAPL skimming at the Site in select wells with a calculated LNAPL Tn value that exceeds the generally accepted, science-based endpoint of 0.8 ft2/day.
Quarterly LNAPL Gauging
GHD will continue to visit the Site on a quarterly basis to complete measurements of groundwater elevations and in-well LNAPL thickness. The measured LNAPL thicknesses will be reviewed and any wells requiring addition to or removal from the LNAPL skimming and transmissivity program will be identified.
AW-62 and POD-1 LNAPL Gauging
GHD will continue to monitor AW-62 and POD-1 which are on the river-side of the poly wall for the presence of LNAPL. In September 2016, a sheen of LNAPL was observed in AW-62; however, no LNAPL has been observed in POD-1 since its installation in 2015. If LNAPL continues to be observed at low thickness, GHD will install an absorbent sock in AW-62 and monitor the accumulation of LNAPL over the next reporting period.
On-Site Horizontal/Vertical Delineation
Epic and GHD will continue to evaluate the need for additional soil and/or groundwater sampling in the interior of the Site. Any sampling performed will be restricted to ensuring there is no on-going source of LNAPL contamination at the Site. The results of the continued LNAPL skimming will also be evaluated continuously to determine if additional LNAPL recovery wells are warranted at the Site.
Refinement of Vapor Intrusion Pathway Evaluation
Epic will complete additional activities required to evaluate the potential for vapor intrusion at the Site. Sub-slab and/or deep soil gas samples will be completed from the vicinity of AW-38, the
GHD | Epic Midstream, LLC – 2016 2nd Semi-Annual Progress Report | 089400 (3) | 10
operations building, and the laboratory. Data will be imported into the USEPA Vapor Intrusion Screening Level calculator or into other screening tools to evaluate potential risk and based on initial results, the data may be evaluated further using commonly accepted tools, if warranted. The vapor intrusion evaluation will be completed during the next reporting period and the results will be included in the next progress report due on June 1, 2017.
4. Commitment to Future Requirements
Epic affirms its commitment to the following future requirements:
• Progress Reports – June 1st and December 1st through 2020
• September 1, 2017 – demonstrate complete horizontal and vertical delineation of off-Site properties
• March 2, 2018 – update the CSM and prepare final remediation plan
• March 31, 2021 – submit CSR upon completion of remedial activities proposed herein
5. Project Schedule
The anticipated milestone schedule for the November 15, 2016 to May 15, 2017 reporting period is provided in Table 4.
6. Engineering Fees
Appendix D includes the summary of engineering fees incurred by this project from May 23 through November 13, 2016.
GHD | Epic Midstream, LLC – 2016 2nd Semi-Annual Progress Report | 089400 (3)
Figures
0 2,0001,000
Feet
FIGURE 1
May 25, 2016
GIS File: J:\GIS\Client Project Data Library\Epic Midstream, LLC\Savannah North Terminal, Georgia\Vicinity Map\Epic Savannah North Terminal - Vicinity Map.mxd
VICINITY MAPCoordinate System:
NAD 1983 UTM Zone 17N
Source: 2013 National Agriculture Imagery Program (NAIP), provided by ESRI.
EPIC MIDSTREAM, LLCEPIC SAVANNAH NORTH TERMINAL, 7 FOUNDATION DRIVE, SAVANNAH, GEORGIA
SiteGeorgia
Site
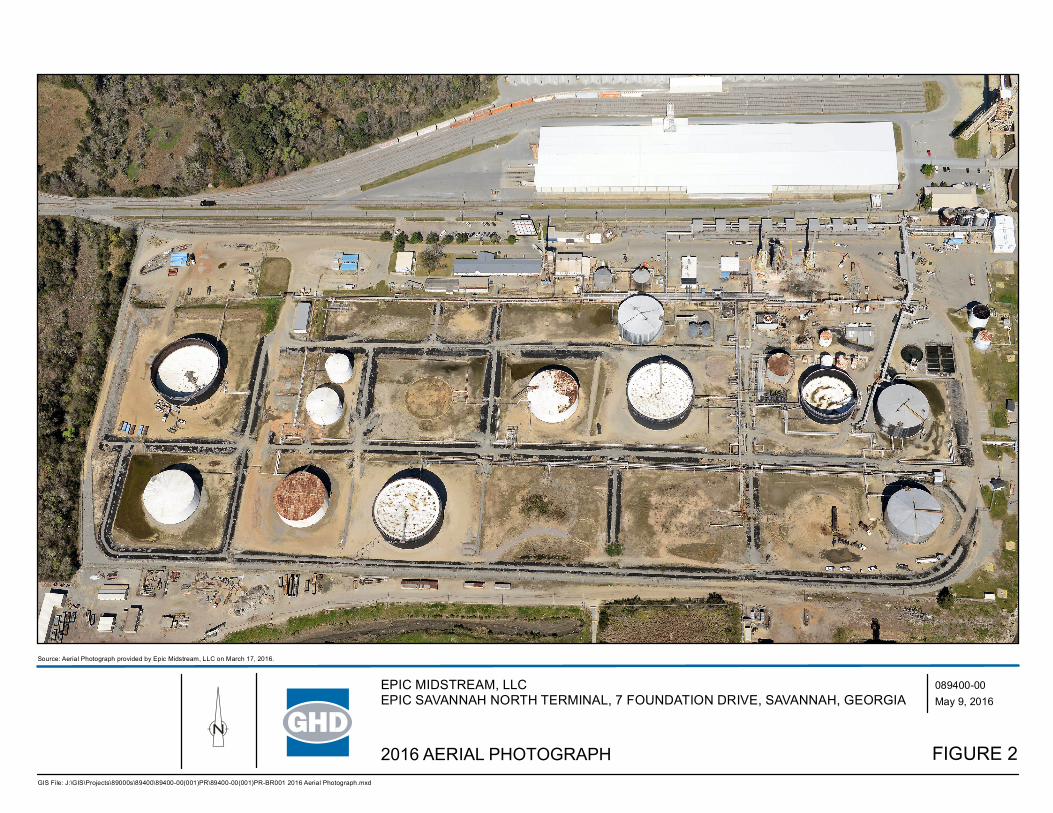
FIGURE 2
089400-00 May 9, 2016
GIS File: J:\GIS\Projects\89000s\89400\89400-00(001)PR\89400-00(001)PR-BR001 2016 Aerial Photograph.mxd
2016 AERIAL PHOTOGRAPH
Source: Aerial Photograph provided by Epic Midstream, LLC on March 17, 2016.
EPIC MIDSTREAM, LLCEPIC SAVANNAH NORTH TERMINAL, 7 FOUNDATION DRIVE, SAVANNAH, GEORGIA
AW-30AW-5
AW-26
AW-41
AW-27
AW-25
AW-24
AW-54 AW-6
AW-19
AW-10
AW-49
AW-15
AW-8
AW-20
AW-37
AW-12
AW-13
AW-74
AW-52
AW-36
AW-57
AW-58
AW-7
AW-70
AW-69
AW-77
AW-76AW-14
AW-22
RAIL LOADING-NRAIL LOADING-MRAIL LOADING-S
AW-31
AW-38
AW-32
AW-73
AW-9
AW-48
AW-78
AW-72
AW-28
AW-68
AW-34AW-33
AW-42
AW-75
POD-1AW-62
AW-56
AW-11AW-71
AW-45AW-44
AW-53
AW-67AW-65
AW-79
AW-51
AW-82
AW-18
0 200ft100LEGEND
WELL LOCATIONAW-52POLYWALL BARRIER
CAD File: P:\6-chars\08----\089400\089400-Reports\089400-00(003)\089400-00(003)GN\089400-00(003)GN-BR001.dwg
Jul 15, 2016
089400-00
FIGURE 3
EPIC MIDSTREAM, LLCEPIC SAVANNAH NORTH TERMINAL, 7 FOUNDATION DRIVE, SAVANNAH, GEORGIA
SITE PLAN
AW-26
AW-41
AW-25
AW-24
AW-10
AW-49AW-8
AW-74
AW-57
AW-58
AW-7
AW-70
AW-69
AW-77
AW-76AW-14
AW-22
RAIL LOADING-MRAIL LOADING-S
AW-31
AW-9
AW-48
AW-78
AW-72
AW-68
AW-75
POD-1AW-62
AW-11AW-71
AW-45AW-44 AW-67AW-65
AW-79
AW-51
(7.83)
(6.00)
(8.21)
(6.69)
(5.55)
(3.35)(3.76)
(3.47)
(3.57) (2.75)
(2.24)
(NS)
(2.27) (2.47)
(2.68)(2.31)
(2.37)(2.76)
(4.94)
(2.24)
(NS)(1.37)
(3.27)(5.32)
(8.20)
(1.27)
(5.46)*
(8.01)AW-30
AW-5(10.17)
AW-36(8.42)
AW-27(7.95)
AW-13(3.11)
AW-56(2.43)
AW-12(4.82)
(6.58)AW-28RAIL LOADING-N
AW-38(8.23)
AW-82AW-52(2.88)
AW-15(5.98)
AW-19(3.53)
AW-6(3.83)
AW-18(5.82)
AW-54
(4.24)*AW-53
(6.87)AW-34
(5.02)*AW-32
AW-33(8.16)
(8.20)AW-42
AW-73
AW-20(4.51)
(3.38)AW-37
(4.55)*
0 200ft100
LEGEND
WELL LOCATIONAW-52POLYWALL BARRIER
CAD File: I:\CAD\DRAWINGS\6-chars\08----\089400\089400-Reports\089400-00(003)\089400-00(003)GN\089400-00(003)GN-BR002.dwg
Nov 21, 2016
089400-00
FIGURE 4
EPIC MIDSTREAM, LLCEPIC SAVANNAH NORTH TERMINAL, 7 FOUNDATION DRIVE, SAVANNAH, GEORGIA
SEPTEMBER 2016 GROUNDWATER ELEVATION CONTOUR MAP
GROUNDWATER ELEVATION (FT AMSL)GROUNDWATER ELEVATION CONTOUR (FT AMSL)GROUNDWATER FLOW DIRECTIONNOT SAMPLEDMEASURED ELEVATION NOT USED TO DEVELOP CONTOURS
(8.01)
NS
*
AW-30
AW-26
AW-41
AW-27
AW-25
AW-24
AW-19
AW-10
AW-20
AW-37
AW-52
AW-36
AW-57
AW-58
AW-7
AW-70
AW-69
AW-76AW-14
RAIL LOADING-NRAIL LOADING-MRAIL LOADING-S
AW-31
AW-38
AW-32
AW-73
AW-48
AW-72
AW-28
AW-34AW-33
AW-42
AW-75
POD-1
AW-56
AW-11
AW-45AW-44
AW-53
AW-67
AW-79
AW-82
AW-18(4.70)*
(0.02)
(0.82) (4.89)(3.40)
(3.12)
(6.01)*
(0.02)(0.22)
AW-12(10.73)
AW-74
(10.03)*AW-54
(1.91)AW-6
(2.55)AW-5
AW-8(0.05)
(1.66)AW-65
(3.93)*AW-9
(3.65)*AW-49
AW-15(1.06)
AW-22(4.55)
(5.24)AW-68
(Sheen)AW-62
AW-13(6.25)
AW-77
(1.32)AW-51
AW-78
AW-71
0 200ft100
LEGEND
WELL LOCATIONAW-52POLYWALL BARRIER
CAD File: I:\CAD\DRAWINGS\6-chars\08----\089400\089400-Reports\089400-00(003)\089400-00(003)GN\089400-00(003)GN-BR003.dwg
Nov 18, 2016
089400-00
FIGURE 5
EPIC MIDSTREAM, LLCEPIC SAVANNAH NORTH TERMINAL, 7 FOUNDATION DRIVE, SAVANNAH, GEORGIA
SEPTEMBER 2016 LNAPL ISOCONTOUR MAP
LNAPL THICKNESS (FEET)LNAPL THICKNESS ISOPLETH (FEET)LNAPL THICKNESS PRIOR TO SKIMMING
(2.55)
*
AW-30
AW-41
AW-25
AW-24
AW-19
AW-10
AW-15
AW-8
AW-74
AW-36
AW-57
AW-58
AW-7
AW-70
AW-69
AW-77
AW-76
RAIL LOADING-MRAIL LOADING-S
AW-38
AW-73
AW-9
AW-28
AW-34
AW-75
POD-1AW-62
AW-45AW-44
AW-53
AW-67AW-65
AW-79
AW-82
(7.81)
(7.83)
(5.68)
(7.76)
(6.20)
(3.90)
(3.62)(4.02)
(3.88)
(3.92) (3.82)
(NS)
(2.53) (-1.01)
(1.81)(2.77)
(2.08)
(NS)(5.76)
(7.86)
(6.16)
(4.38)*
(6.16)
(6.05)
AW-20(4.63)
AW-37(3.84)
AW-49(2.47)
AW-11(3.10)
(3.07)AW-71
AW-78
(3.31)AW-51
AW-13(4.10)
(1.87)AW-68
AW-22(3.20)
(3.97)AW-56
AW-12(3.04)
AW-14(6.05)*
AW-72(3.55)
RAIL LOADING-N
AW-5(9.09)
(4.01)AW-54
(5.64)AW-48
AW-18(6.42)
AW-6(3.99)
AW-26(7.56)
(3.58)AW-52
AW-27(7.48)
AW-42(7.50)
AW-33(7.69)
(4.69)*AW-32(8.50)
AW-31
0 200ft100
LEGEND
WELL LOCATIONAW-52POLYWALL BARRIER
CAD File: I:\CAD\DRAWINGS\6-chars\08----\089400\089400-Reports\089400-00(003)\089400-00(003)GN\089400-00(003)GN-BR004.dwg
Nov 21, 2016
089400-00
FIGURE 6
EPIC MIDSTREAM, LLCEPIC SAVANNAH NORTH TERMINAL, 7 FOUNDATION DRIVE, SAVANNAH, GEORGIA
NOVEMBER 2016 GROUNDWATER ELEVATION CONTOUR MAP
GROUNDWATER ELEVATION (FT AMSL)GROUNDWATER ELEVATION CONTOUR (FT AMSL)GROUNDWATER FLOW DIRECTIONNOT SAMPLEDMEASURED ELEVATION NOT USED TO DEVELOP CONTOURS
(7.81)
NS
*
AW-30
AW-26
AW-41
AW-27
AW-25
AW-24
AW-6 AW-10
AW-8
AW-20
AW-37
AW-74
AW-52
AW-36
AW-57
AW-58
AW-7
AW-70
AW-69
AW-77
AW-76AW-14
AW-22
RAIL LOADING-NRAIL LOADING-MRAIL LOADING-S
AW-31
AW-38
AW-32
AW-73
AW-9
AW-48
AW-72
AW-28
AW-34AW-33
AW-42
AW-75
POD-1
AW-11
AW-45AW-44
AW-53
AW-67
AW-79
AW-82
AW-18(1.45) (2.29)
(0.02)
(1.81) (4.73)
(3.93)*
(2.50)
(3.32)
(4.55)*
(0.01)(0.48)
AW-5(1.60)
(10.76)AW-54
AW-19
(2.21)AW-65
AW-49(3.65)*
AW-71
AW-78
AW-51(1.32)*
AW-13(5.04)
AW-62(Sheen)
(7.22)AW-68
AW-12(2.29)
AW-56(5.51)
AW-15(0.98)
0 200ft100
LEGEND
WELL LOCATIONAW-52POLYWALL BARRIER
CAD File: I:\CAD\DRAWINGS\6-chars\08----\089400\089400-Reports\089400-00(003)\089400-00(003)GN\089400-00(003)GN-BR005.dwg
Nov 18, 2016
089400-00
FIGURE 7
EPIC MIDSTREAM, LLCEPIC SAVANNAH NORTH TERMINAL, 7 FOUNDATION DRIVE, SAVANNAH, GEORGIA
NOVEMBER 2016 LNAPL ISOCONTOUR MAP
LNAPL THICKNESS (FEET)LNAPL THICKNESS ISOPLETH (FEET)LNAPL THICKNESS PRIOR TO SKIMMING
(2.29)
*

GHD | Epic Midstream, LLC – 2016 2nd Semi-Annual Progress Report | 089400 (3)
Tables
Page 1 of 5
Location ID Measurement DateDepth to LNAPL
(ft btoc)Depth to Water
(ft btoc)Groundwater Elevation
(ft AMSL) LNAPL Thickness
(ft)
3/1/2016 6.56 7.75 9.31 1.195/1/2016 6.42 7.61 9.45 1.199/21/2016 5.50 8.05 10.17 2.55
11/15/2016 6.72 8.32 9.09 1.60
3/1/2016 8.20 9.43 3.19 1.235/1/2016 8.06 9.58 3.29 1.529/22/2016 7.46 9.37 3.83 1.91
11/15/2016 7.25 9.54 3.99 2.29
3/1/2016 -- 7.93 4.61 --5/1/2016 -- 7.78 4.76 --9/22/2016 -- 7.22 5.32 --
11/15/2016 -- 6.38 6.16 --
3/1/2016 -- 12.70 2.98 --5/1/2016 12.54 12.70 3.12 0.169/22/2016 12.20 12.25 3.47 0.05
11/15/2016 11.80 11.82 3.88 0.02
3/1/2016 10.89 14.82 2.04 3.935/1/2016 10.77 14.62 2.17 3.859/22/2016 11.15 11.40 2.31 0.25
11/15/2016 10.31 13.20 2.77 2.89
3/1/2016 11.10 14.72 2.27 3.625/1/2016 10.73 14.82 2.57 4.099/22/2016 10.44 15.33 2.75 4.89
11/15/2016 9.40 14.12 3.82 4.73
3/1/2016 11.20 14.79 1.92 3.595/1/2016 10.86 14.92 2.19 4.069/22/2016 10.77 14.17 2.37 3.40
11/15/2016 10.18 12.68 3.10 2.50
3/1/2016 9.25 12.65 2.30 3.405/1/2016 8.96 15.77 2.01 6.819/21/2016 5.47 16.20 4.82 10.73
11/15/2016 8.70 10.99 3.04 2.29
3/1/2016 10.40 17.70 2.99 7.305/1/2016 9.95 18.64 3.56 8.699/22/2016 10.20 16.45 3.11 6.25
11/15/2016 9.11 14.15 4.10 5.04
3/1/2016 -- 8.52 4.99 --5/1/2016 Not Measured9/22/2016 -- 8.05 5.46 --
11/15/2016 -- 7.46 6.05 --
3/1/2016 10.65 10.75 4.72 0.105/1/2016 9.40 9.66 5.94 0.269/22/2016 9.25 10.31 5.98 1.06
11/15/2016 9.48 10.46 5.76 0.98
3/1/2016 7.06 8.60 5.64 1.545/1/2016 7.00 8.75 5.66 1.759/22/2016 6.70 9.45 5.82 2.75
11/15/2016 6.29 7.74 6.42 1.45
Table 1
Groundwater Elevation and LNAPL Thickness Data - March 2016 to CurrentEpic Midstream, LLC
AW-9
AW-5
AW-13
AW-7
Savannah, Georgia
AW-15
AW-11
AW-14
VRP #1440101197
AW-8
AW-18
AW-12
AW-10
AW-6
089400-1 T1
Page 2 of 5
Location ID Measurement DateDepth to LNAPL
(ft btoc)Depth to Water
(ft btoc)Groundwater Elevation
(ft AMSL) LNAPL Thickness
(ft)
Table 1
Groundwater Elevation and LNAPL Thickness Data - March 2016 to CurrentEpic Midstream, LLCSavannah, GeorgiaVRP #1440101197
3/1/2016 12.40 12.45 3.09 0.055/1/2016 -- 12.26 3.24 --9/22/2016 11.97 11.99 3.53 0.02
11/15/2016 -- 11.60 3.90 --
3/1/2016 -- 12.20 3.47 --5/1/2016 -- 12.06 3.61 --9/22/2016 -- 11.16 4.51 --
11/15/2016 -- 11.04 4.63 --
3/1/2016 12.65 17.72 1.74 5.07
5/1/2016 12.75 16.42 1.84 3.67
9/21/2016 11.20 15.75 3.27 4.55
11/15/2016 11.93 11.95 3.20 0.02
3/1/2016 -- 5.10 6.26 --
5/1/2016 -- 5.04 6.32 --
9/22/2016 -- 4.67 6.69 --
11/15/2016 -- 5.16 6.20 --
3/1/2016 -- 5.92 7.58 --
5/1/2016 -- 5.78 7.72 --
9/22/2016 -- 5.29 8.21 --
11/15/2016 -- 5.74 7.76 --
3/1/2016 -- 4.52 7.95 --
5/1/2016 -- 4.54 7.93 --
9/22/2016 -- 4.64 7.83 --
11/15/2016 -- 4.91 7.56 --
3/1/2016 -- 6.28 7.24 --
5/1/2016 -- 6.13 7.39 --
9/22/2016 -- 5.57 7.95 --
11/15/2016 -- 6.04 7.48 --
3/1/2016 -- 5.15 6.03 --5/1/2016 -- 5.19 5.99 --9/22/2016 -- 4.60 6.58 --
11/15/2016 -- 5.13 6.05 --
3/1/2016 -- 5.35 8.05 --5/1/2016 -- 5.31 8.09 --9/22/2016 -- 5.39 8.01 --
11/15/2016 -- 5.59 7.81 --
3/1/2016 -- 2.72 7.58 --5/1/2016 -- 2.60 7.70 --9/22/2016 -- 2.10 8.20 --
11/15/2016 -- 1.80 8.50 --
3/1/2016 -- 10.40 3.99 --5/1/2016 -- 9.60 4.79 --9/22/2016 -- 9.37 5.02 --
11/15/2016 -- 9.70 4.69 --
3/1/2016 -- 5.43 7.65 --
5/1/2016 -- 5.35 7.73 --
9/22/2016 -- 4.92 8.16 --
11/15/2016 -- 5.39 7.69 --
3/1/2016 -- 7.57 5.70 --
5/1/2016 -- 7.36 5.91 --
9/22/2016 -- 6.40 6.87 --
11/15/2016 -- 7.11 6.16 --
AW-33
AW-34
AW-24
AW-25
AW-26
AW-19
AW-27
AW-20
AW-30
AW-31
AW-22
AW-32
AW-28
089400-1 T1
Page 3 of 5
Location ID Measurement DateDepth to LNAPL
(ft btoc)Depth to Water
(ft btoc)Groundwater Elevation
(ft AMSL) LNAPL Thickness
(ft)
Table 1
Groundwater Elevation and LNAPL Thickness Data - March 2016 to CurrentEpic Midstream, LLCSavannah, GeorgiaVRP #1440101197
3/1/2016 -- 5.47 8.18 --5/1/2016 -- 5.42 8.23 --9/22/2016 -- 5.23 8.42 --
11/15/2016 -- 5.82 7.83 --
3/1/2016 -- 11.37 2.96 --
5/1/2016 -- 11.24 3.09 --
9/22/2016 -- 10.95 3.38 --
11/15/2016 -- 10.49 3.84 --
3/1/2016 -- 4.45 7.58 --
5/1/2016 Not Measured
9/22/2016 3.80 3.82 8.23 0.02
11/15/2016 4.17 4.18 7.86 0.01
3/1/2016 -- 9.15 6.00 --
5/1/2016 -- 9.71 5.44 --
9/22/2016 -- 9.15 6.00 --
11/15/2016 -- 9.47 5.68 --
3/1/2016 Not Measured5/1/2016 1.69 1.70 7.74 0.019/22/2016 -- 1.23 8.20 --
11/15/2016 -- 1.93 7.50 --
3/1/2016 -- 10.03 3.38 --
5/1/2016 -- 10.00 3.41 --
9/22/2016 -- 9.65 3.76 --
11/15/2016 -- 9.39 4.02 --
3/1/2016 -- 12.14 2.99 --
5/1/2016 -- 12.12 3.01 --
9/22/2016 -- 11.78 3.35 --
11/15/2016 -- 11.51 3.62 --
3/1/2016 -- 6.82 4.31 --
5/1/2016 -- 6.10 5.03 --
9/22/2016 -- 5.58 5.55 --
11/15/2016 -- 5.49 5.64 --
3/1/2016 13.10 15.94 1.99 2.845/1/2016 12.73 16.76 2.18 4.039/22/2016 13.22 13.47 2.24 0.25
11/15/2016 13.00 13.19 2.47 0.19
3/1/2016 10.48 11.41 2.16 0.93
5/1/2016 9.90 10.62 2.76 0.72
9/22/2016 10.35 11.67 2.24 1.32
11/15/2016 9.41 9.62 3.31 0.21
3/1/2016 12.80 15.69 2.52 2.89
5/1/2016 12.47 15.56 2.82 3.09
9/22/2016 12.40 15.52 2.88 3.12
11/15/2016 11.68 15.00 3.58 3.32
3/1/2016 6.62 6.92 3.67 0.30
5/1/2016 6.51 6.76 3.78 0.25
9/22/2016 6.06 6.28 4.24 0.22
11/15/2016 5.88 6.36 4.38 0.48
3/1/2016 5.95 14.88 3.41 8.935/1/2016 5.83 15.81 3.37 9.989/22/2016 5.51 9.60 4.55 4.09
11/15/2016 5.08 15.84 4.01 10.76
AW-53
AW-44
AW-45
AW-37
AW-41
AW-42
AW-38
AW-54
AW-49
AW-51
AW-52
AW-36
AW-48
089400-1 T1
Page 4 of 5
Location ID Measurement DateDepth to LNAPL
(ft btoc)Depth to Water
(ft btoc)Groundwater Elevation
(ft AMSL) LNAPL Thickness
(ft)
Table 1
Groundwater Elevation and LNAPL Thickness Data - March 2016 to CurrentEpic Midstream, LLCSavannah, GeorgiaVRP #1440101197
3/1/2016 9.32 14.05 2.64 4.73
5/1/2016 8.48 14.55 3.28 6.07
9/22/2016 9.39 15.09 2.43 5.70
11/15/2016 7.88 13.39 3.97 5.51
3/1/2016 Not Measured
5/1/2016 8.64 10.23 3.27 1.59
9/22/2016 8.45 9.27 3.57 0.82
11/15/2016 7.96 9.77 3.92 1.81
3/1/2016 -- 8.61 NS --
5/1/2016 -- 8.51 NS --
9/22/2016 -- 8.15 NS --
11/15/2016 -- 7.44 NS --
3/1/2016 -- 9.24 NS --
5/1/2016 -- 10.60 NS --
9/22/2016 9.60 9.60 NS Sheen
11/15/2016 9.42 9.42 NS Sheen
3/1/2016 11.45 13.20 1.56 1.75
5/1/2016 11.53 13.51 1.45 1.98
9/22/2016 10.75 12.41 2.27 1.66
11/15/2016 10.41 12.62 2.53 2.21
3/1/2016 -- 12.33 -1.01 --5/1/2016 -- 13.37 -2.05 --9/22/2016 -- 8.85 2.47 --
11/15/2016 -- 12.33 -1.01 --
3/1/2016 11.75 15.11 1.56 3.36
5/1/2016 10.48 13.90 2.82 3.42
9/22/2016 11.66 16.90 1.37 5.24
11/15/2016 10.88 18.10 1.87 7.22
3/1/2016 Not Measured
5/1/2016 -- 6.90 2.54 --
9/22/2016 -- 4.50 4.94 --
11/15/2016 -- 7.36 2.08 --
3/1/2016 -- 11.18 1.07 --
5/1/2016 -- 11.11 1.14 --
9/22/2016 -- 9.57 2.68 --
11/15/2016 -- 10.44 1.81 --
3/1/2016 -- 11.05 2.24 --
5/1/2016 -- 10.79 2.50 --
9/22/2016 -- 10.53 2.76 --
11/15/2016 -- 10.22 3.07 --
3/1/2016 -- 8.78 1.34 --
5/1/2016 -- 7.25 2.87 --
9/22/2016 -- 8.85 1.27 --
11/15/2016 -- 6.57 3.55 --
3/1/2016 Not Measured5/1/2016 Not Measured9/22/2016 Not Measured
11/15/2016 -- 8.67 3.37 --
3/1/2016 9.27 10.99 0.44 1.725/1/2016 6.78 7.96 3.01 1.189/22/2016 9.53 13.71 -0.18 4.18
11/15/2016 6.46 7.05 3.41 0.59
AW-72
AW-67
AW-68
AW-73
AW-69
AW-74
AW-70
AW-71
AW-56
AW-57
AW-62
AW-65
AW-58
089400-1 T1
Page 5 of 5
Location ID Measurement DateDepth to LNAPL
(ft btoc)Depth to Water
(ft btoc)Groundwater Elevation
(ft AMSL) LNAPL Thickness
(ft)
Table 1
Groundwater Elevation and LNAPL Thickness Data - March 2016 to CurrentEpic Midstream, LLCSavannah, GeorgiaVRP #1440101197
3/1/2016 -- 11.04 NS --
5/1/2016 -- 6.57 NS --
9/22/2016 -- 11.74 NS --
11/15/2016 -- 6.40 NS --
3/1/2016 -- 13.61 NS --
5/1/2016 -- 14.07 NS --
9/22/2016 -- 12.41 NS --
11/15/2016 -- 13.86 NS --
3/1/2016 -- 7.91 NS --
5/1/2016 -- 9.59 NS --
9/22/2016 -- 9.59 NS --
11/15/2016 -- 9.18 NS --
3/1/2016 -- 6.91 NS --
5/1/2016 -- 6.77 NS --
9/22/2016 -- 6.36 NS --
11/15/2016 -- 6.42 NS --
3/1/2016 -- 10.95 NS --
5/1/2016 -- 11.03 NS --
9/22/2016 -- 5.07 NS --
11/15/2016 -- 10.73 NS --
3/1/2016 9.95 12.84 NS 2.89
5/1/2016 9.65 12.63 NS 2.98
9/22/2016 9.54 12.62 NS 3.08
11/15/2016 8.97 11.84 NS 2.87
3/1/2016 -- 7.31 5.30 --
5/1/2016 -- 7.25 5.36 --
9/22/2016 -- 6.42 6.19 --
11/15/2016 -- 7.29 5.32 --
3/1/2016 -- 6.22 6.08 --
5/1/2016 -- 6.10 6.20 --
9/22/2016 -- 5.28 7.02 --
11/15/2016 -- 6.10 6.20 --
3/1/20165/1/20169/22/2016
11/15/2016
3/1/2016 -- 11.60 NS --
5/1/2016 -- 12.04 NS --
9/22/2016 -- 10.35 NS --
11/15/2016 -- 11.43 NS --
Notes:
Dash (--) indicates not applicable
NS = Not Surveyed
ft btoc = feet below top of casing
ft AMSL = feet above mean sea level
Damaged Casing
Damaged Casing
RAIL LOADING - S
RAIL LOADING - N
Damaged Casing
AW-82
POD - 1
AW-77
AW-78
AW-79
RAIL LOADING - M
Damaged Casing
AW-75
AW-76
089400-1 T1
Page 1 of 5
Group Well IDMeasurement
Date
Measured In-Well LNAPL Thickness
(feet)
LNAPL Removed Between
Measurements(gallons)
Cumulative Total LNAPL Removal
(gallons)Comments
5/17/2016 1.80 -- -- Installed LNAPL Skimmer
5/20/2016 0.03 2.15 2.2
5/25/2016 0.05 5.65 7.8
6/1/2016 0.01 9.85 17.7
6/8/2016 0.08 9.02 26.7 LNAPL skimmer removed for relocation
5/17/2016 3.71 -- -- Installed LNAPL Skimmer
5/20/2016 0.17 5.16 5.2
5/25/2016 0.23 1.44 6.6
6/1/2016 0.38 0.30 6.9
6/8/2016 1.05 6.30 13.2 LNAPL skimmer removed for relocation
6/8/2016 3.87 -- -- Installed LNAPL Skimmer
6/9/2016 2.90 8.55 8.6
6/10/2016 2.90 1.05 9.6
6/13/2016 2.33 11.74 21.3
6/22/2016 1.80 27.91 49.3 Recovery halted due to full drum
6/27/2016 4.45 -- 49.3 LNAPL skimmer removed for relocation
6/8/2016 5.05 -- -- Installed LNAPL Skimmer
6/9/2016 4.88 7.80 7.8
6/10/2016 4.54 0.80 8.6
6/13/2016 5.39 11.51 20.1
6/22/2016 5.19 25.20 45.3 Recovery halted due to full drum
6/27/2016 5.32 -- 45.3 LNAPL skimmer removed for relocation
Table 2
LNAPL Removal Summary - Short-Duration SkimmingEpic Midstream, LLCSavannah, GeorgiaVRP #1440101197
Skimming Group #1
AW-9
AW-49
Skimming Group #2
AW-65
AW-68
089400-Progress Report October 2016 T1
Page 2 of 5
Group Well IDMeasurement
Date
Measured In-Well LNAPL Thickness
(feet)
LNAPL Removed Between
Measurements(gallons)
Cumulative Total LNAPL Removal
(gallons)Comments
Table 2
LNAPL Removal Summary - Short-Duration SkimmingEpic Midstream, LLCSavannah, GeorgiaVRP #1440101197
6/28/2016 5.08 -- -- Installed LNAPL Skimmer
7/1/2006 0.77 16.83 16.8
7/7/2016 0.20 23.39 40.2
7/11/2016 1.43 10.26 50.5 Recovery halted due to full drum; system restarted
7/12/2016 1.66 4.76 55.2
7/19/2016 3.64 13.96 69.2
7/21/2016 3.85 6.73 75.9 Recovery halted due to full drum; system restarted
7/27/2016 3.41 25.45 101.4 LNAPL skimmer removed for relocation
6/28/2016 3.11 -- -- Installed LNAPL Skimmer
7/1/2006 1.98 18.06 18.1
7/7/2016 2.36 23.80 41.9
7/11/2016 1.84 10.26 52.1 Recovery halted due to full drum; system restarted
7/12/2016 1.31 7.39 59.5
7/19/2016 0.79 32.01 91.5
7/21/2016 1.81 0.00 91.5 Recovery halted due to full drum; system restarted
7/27/2016 0.20 27.91 119.4 LNAPL skimmer removed for relocation
6/28/2016 3.51 -- -- Installed LNAPL Skimmer
7/1/2006 3.44 6.00 6.0
7/7/2016 3.15 6.28 12.3
7/11/2016 3.70 10.39 22.7 Recovery halted due to full drum; system restarted
7/12/2016 2.92 3.69 26.4
7/19/2016 2.87 23.30 49.7
7/21/2016 3.32 8.08 57.7 Recovery halted due to full drum; system restarted
7/27/2016 3.00 21.34 79.1 LNAPL skimmer removed for relocation
Skimming Group #3
AW-10
AW-11
AW-82
089400-Progress Report October 2016 T1
Page 3 of 5
Group Well IDMeasurement
Date
Measured In-Well LNAPL Thickness
(feet)
LNAPL Removed Between
Measurements(gallons)
Cumulative Total LNAPL Removal
(gallons)Comments
Table 2
LNAPL Removal Summary - Short-Duration SkimmingEpic Midstream, LLCSavannah, GeorgiaVRP #1440101197
7/28/2016 5.08 -- -- Installed LNAPL Skimmer
8/2/2016 1.60 0.75 0.8
8/11/2016 1.15 2.05 2.8
8/17/2016 1.26 0.71 3.5
8/25/2016 1.62 0.52 4.0 LNAPL skimmer removed for relocation
7/28/2016 3.30 -- -- Installed LNAPL Skimmer
8/2/2016 0.46 5.75 5.8
8/11/2016 0.25 2.46 8.2
8/17/2016 0.25 0.66 8.9
8/25/2016 0.51 2.21 11.1 LNAPL skimmer removed for relocation
7/28/2016 3.51 -- -- Installed LNAPL Skimmer
8/2/2016 0.26 6.57 6.6
8/10/2016 0.34 0.03 6.6
8/11/2016 0.12 0.00 6.6
8/17/2016 0.12 0.49 7.1
8/25/2016 0.11 0.30 7.4 LNAPL skimmer removed for relocation
AW-57
Skimming Group #4
AW-6
AW-52
089400-Progress Report October 2016 T1
Page 4 of 5
Group Well IDMeasurement
Date
Measured In-Well LNAPL Thickness
(feet)
LNAPL Removed Between
Measurements(gallons)
Cumulative Total LNAPL Removal
(gallons)Comments
Table 2
LNAPL Removal Summary - Short-Duration SkimmingEpic Midstream, LLCSavannah, GeorgiaVRP #1440101197
8/25/2016 4.70 -- -- Installed LNAPL Skimmer
8/31/2016 4.00 2.87 2.87
9/7/2016 3.90 0.83 3.7
9/15/2016 4.04 3.70 7.4 LNAPL skimmer removed for relocation
8/25/2016 10.03 -- -- Installed LNAPL Skimmer
8/31/2016 4.40 50.00 50.0
9/7/2016 -- 50.00 100.0
9/14/2016 2.76 50.00 150.0
9/21/2016 1.50 50.00 200.0 LNAPL skimmer removed for relocation
8/25/2016 6.01 -- -- Installed LNAPL Skimmer
8/31/2016 3.01 36.12 36.1
9/7/2016 2.50 31.20 67.3
9/14/2016 3.56 50.00 117.3
9/15/2016 0.12 9.50 126.8
9/21/2016 -- 4.50 131.3 LNAPL skimmer removed for relocation
AW-18
AW-54
AW-56
Skimming Group #5
089400-Progress Report October 2016 T1
Page 5 of 5
Group Well IDMeasurement
Date
Measured In-Well LNAPL Thickness
(feet)
LNAPL Removed Between
Measurements(gallons)
Cumulative Total LNAPL Removal
(gallons)Comments
Table 2
LNAPL Removal Summary - Short-Duration SkimmingEpic Midstream, LLCSavannah, GeorgiaVRP #1440101197
9/22/2016 2.55 -- -- Installed LNAPL Skimmer
9/28/2016 1.94 29.00 29.0
10/5/2016 -- -- -- LNAPL skimmer shutdown due to Hurricane Matthew
10/13/2016 -- -- -- Skimmer remains down due to elevated water
10/20/2016 -- -- -- Skimmer remains down due to elevated water
10/28/2016 -- -- -- Skimmer remains down due to elevated water
LNAPL Skimming Will Resume in Future
9/22/2016 10.73 -- -- Installed LNAPL Skimmer
9/28/2016 0.10 24.63 24.6
10/5/2016 0.18 5.91 30.5 LNAPL skimmer removed for relocation
9/22/2016 4.55 -- -- Installed LNAPL Skimmer
9/28/2016 1.63 51.00 51.0
10/5/2016 1.59 52.53 103.5 LNAPL skimmer shutdown due to Hurricane Matthew
10/13/2016 3.70 0.00 103.5 LNAPL skimmer restarted
10/20/2016 2.40 51.00 154.5
10/28/2016 2.39 0.00 154.5 LNAPL skimmer malfunctioned
LNAPL Skimming Underway
10/13/2016 0.92 -- -- Installed LNAPL Skimmer
10/20/2016 0.20 9.85 9.9
10/28/2016 0.03 0.00 9.9
LNAPL Skimming Underway
Note: Includes activities through October 28, 2016.
AW-22
AW-51(2nd Test)
AW-12
AW-5
Skimming Group #6
089400-Progress Report October 2016 T1
Page 1 of 1
Well IDMeasurement
Date
Measured In-Well LNAPL Thickness
(feet)
LNAPL Removed Between
Measurements(gallons)
Cumulative Total LNAPL Removal
(gallons)Comments
9/14/2016 3.93 -- -- Installed LNAPL Skimmer
9/21/2016 0.35 31.70 31.7
9/28/2016 0.26 20.30 52.0
10/5/2016 0.23 19.00 71.0 LNAPL skimmer shutdown due to Hurricane Matthew
10/13/2016 4.06 0.00 71.0 LNAPL skimmer restarted
10/20/2016 0.11 97.00 168.0 LNAPL skimmer shutdown due to nearly full tank
10/28/2016 3.40 0.00 168.0 LNAPL skimmer restarted
LNAPL Skimming Underway
9/14/2016 3.65 -- -- Installed LNAPL Skimmer
9/21/2016 0.29 134.40 134.4
9/28/2016 0.23 70.80 205.2
10/5/2016 0.13 55.50 260.7 LNAPL skimmer shutdown due to Hurricane Matthew
10/13/2016 4.73 0.00 260.7 LNAPL skimmer restarted
10/20/2016 3.16 267.00 527.7 LNAPL skimmer shutdown due to full tank
10/28/2016 3.25 0.00 527.7 LNAPL skimmer restarted
LNAPL Skimming Underway
Notes: 1. Long-term skimming was initiated in AW-9 and AW-49 on September 14, 2016.
2. Includes observations throughOctober 28, 2016.
AW-49
Table 3
LNAPL Removal Summary - Long-Duration SkimmingEpic Midstream, LLCSavannah, GeorgiaVRP #1440101197
AW-9
089400-Progress Report October 2016 T2
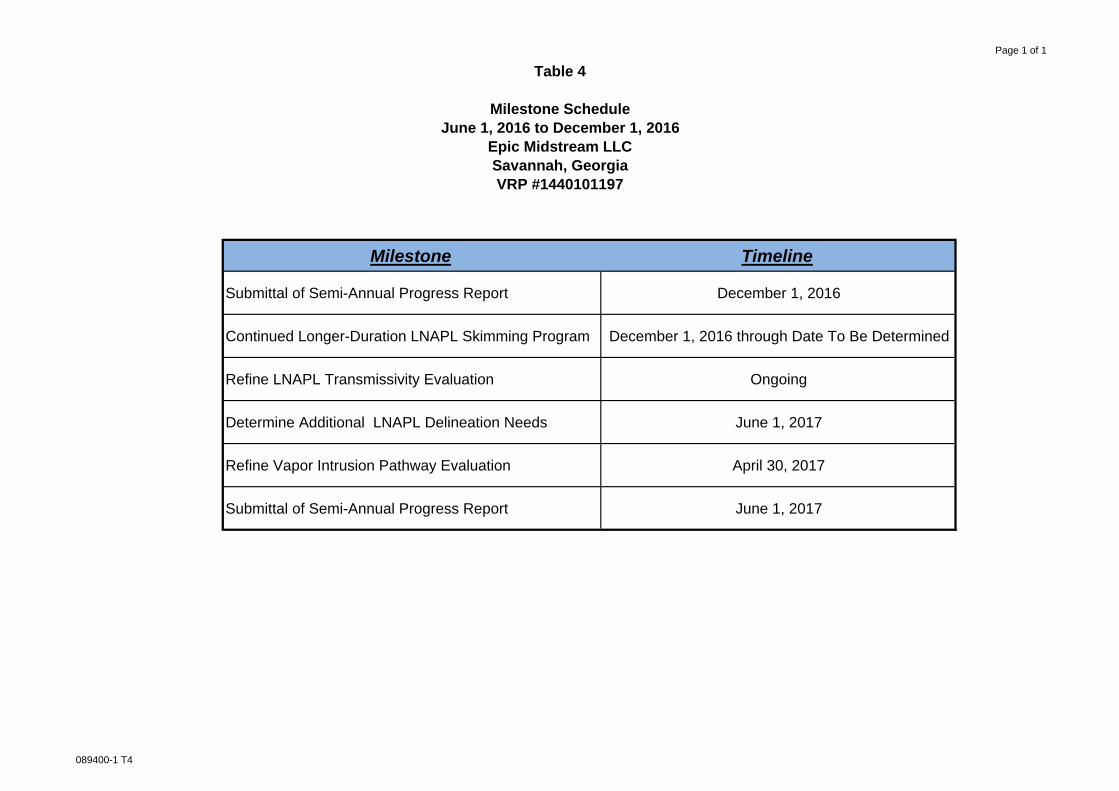
Table 4
Milestone ScheduleJune 1, 2016 to December 1, 2016
Epic Midstream LLCSavannah, GeorgiaVRP #1440101197
Page 1 of 1
Milestone Timeline
Submittal of Semi-Annual Progress Report December 1, 2016
Continued Longer-Duration LNAPL Skimming Program December 1, 2016 through Date To Be Determined
Refine LNAPL Transmissivity Evaluation Ongoing
Determine Additional LNAPL Delineation Needs June 1, 2017
Refine Vapor Intrusion Pathway Evaluation April 30, 2017
Submittal of Semi-Annual Progress Report June 1, 2017
089400-1 T4

GHD | Epic Midstream, LLC – 2016 2nd Semi-Annual Progress Report | 089400 (3)
Appendices
GHD | Epic Midstream, LLC – 2016 2nd Semi-Annual Progress Report | 089400 (3)
Appendix A Low Flow Purging Forms
MONITORING WELL RECORD FOR LOW-FLOW PURGING
Project Data:Project Name: Epic - Savannah Date:
Ref. No.: 89400 Personnel: Zach Al-Marhoun
Monitoring Well Data:Well No.: AW-62 Screen Length (ft): 15
Measurement Point: TOC Depth to Pump Intake (ft)(1): 15Constructed Well Depth (ft): 20 Well Diameter, D (in): 4
Measured Well Depth (ft): 19.6 Initial Depth to Water (ft): 8.97Depth of Sediment (ft): --
DrawdownPumping Depth to from Initial Volume
Rate Water Water Level (3) Temperature Conductivity ORP DO Turbidity Purged, V p
Time (mL/min) (ft) (ft) pH o C (S/cm) (mV) (mg/L) (NTU) (mL)
8:15 80 9.01 0.04 5.81 26.55 0.377 -1 0.26 3.87 4008:20 80 9.05 0.08 6.05 26.03 0.341 -27 0.00 5.26 8008:25 80 9.05 0.08 6.05 25.84 0.340 -28 0.00 7.74 12008:30 80 9.06 0.09 6.06 25.29 0.340 -39 0.00 10.60 16008:35 80 9.07 0.10 6.11 25.11 0.341 -43 0.00 9.97 20008:40 80 9.07 0.10 6.13 25.00 0.343 -49 0.00 8.16 24008:45 80 9.08 0.11 6.14 25.05 0.343 -50 0.00 7.19 2800
Sample Time 8:50Sample ID
AnalysisSVOCsVOCsMetals
Notes:
6/10/2016
Containers and Preservatives
40 mL VOA (HCl)250 mL Plastic (HNO3)
AW-62-089400-061016-ZJA-001
1 L Amber
MONITORING WELL RECORD FOR LOW-FLOW PURGING
Project Data:Project Name: Epic - Savannah Date:
Ref. No.: 89400 Personnel: Zach Al-Marhoun
Monitoring Well Data:Well No.: POD-1 Screen Length (ft): 15
Measurement Point: TOC Depth to Pump Intake (ft)(1): 15Constructed Well Depth (ft): 20 Well Diameter, D (in): 2
Measured Well Depth (ft): 19.35 Initial Depth to Water (ft): 9.65Depth of Sediment (ft): --
DrawdownPumping Depth to from Initial Volume
Rate Water Water Level (3) Temperature Conductivity ORP DO Turbidity Purged, V p
Time (mL/min) (ft) (ft) pH o C (S/cm) (mV) (mg/L) (NTU) (mL)
9:10 100 9.65 0.00 6.27 26.76 0.560 -64 0.31 98.8 5009:15 100 9.65 0.00 6.26 26.63 0.560 -65 0.26 94.8 10009:20 100 9.66 0.01 6.19 26.01 0.568 -69 0.13 85.6 15009:25 100 9.65 0.00 6.18 25.99 0.567 -69 0.14 78.4 20009:30 100 9.65 0.00 6.08 25.76 0.566 -65 0.17 74.5 25009:35 100 9.65 0.00 5.98 25.70 0.568 -60 0.20 72.0 30009:40 100 9.65 0.00 5.99 25.73 0.569 -62 0.21 69.0 35009:45 100 9.65 0.00 6.00 25.73 0.570 -63 0.22 67.9 4000
Sample Time 9:45Sample ID
AnalysisSVOCsVOCsMetals
Notes:
6/10/2016
POD-1-089400-061016-ZJA-002Containers and Preservatives
1 L Amber40 mL VOA (HCl)
250 mL Plastic (HNO3)

MONITORING WELL RECORD FOR LOW-FLOW PURGING
Project Data:Project Name: Epic - Savannah Date:
Ref. No.: 89400 Personnel: Steven Grace
Monitoring Well Data:Well No.: AW-27 Screen Length (ft): 10
Measurement Point: TOC Depth to Pump Intake (ft)(1): 9.5Constructed Well Depth (ft): 15.26 Well Diameter, D (in): 2
Measured Well Depth (ft): 15.2 Initial Depth to Water (ft): 4.79Depth of Sediment (ft): --
DrawdownPumping Depth to from Initial Volume
Rate Water Water Level (3) Temperature Conductivity ORP DO Turbidity Purged, V p
Time (mL/min) (ft) (ft) pH o C (S/cm) (mV) (mg/L) (NTU) (mL)
8:00 70 4.81 0.02 4.08 20.49 0.059 341 3.51 36.8 3508:05 70 4.81 0.02 4.16 20.52 0.077 341 2.67 28.9 7008:10 70 4.81 0.02 4.71 20.85 0.063 344 2.43 24.7 10508:15 70 4.81 0.02 5.81 23.13 0.112 261 2.49 26.8 14008:20 70 4.81 0.02 6.02 23.70 0.097 258 1.65 21.0 17508:25 70 4.81 0.02 6.03 23.75 0.094 258 1.49 19.6 21008:30 70 4.81 0.02 6.05 23.82 0.093 259 1.47 16.3 24508:35 70 4.81 0.02 6.06 23.88 0.092 259 1.44 16.2 2800
Sample Time 8:40Sample ID
AnalysisVOCs
Notes:
10/28/2016
Containers and Preservatives40 mL VOA (HCl)
GW-089400-102816-SAG-001

MONITORING WELL RECORD FOR LOW-FLOW PURGING
Project Data:Project Name: Epic - Savannah Date:
Ref. No.: 89400 Personnel: Steven Grace
Monitoring Well Data:Well No.: AW-33 Screen Length (ft): 10
Measurement Point: TOC Depth to Pump Intake (ft)(1): 9Constructed Well Depth (ft): 13 Well Diameter, D (in): 2
Measured Well Depth (ft): 13 Initial Depth to Water (ft): 5.23Depth of Sediment (ft): --
DrawdownPumping Depth to from Initial Volume
Rate Water Water Level (3) Temperature Conductivity ORP DO Turbidity Purged, V p
Time (mL/min) (ft) (ft) pH o C (S/cm) (mV) (mg/L) (NTU) (mL)
8:50 70 5.23 0.00 6.53 24.61 0.195 244 2.5 16.9 3508:55 70 5.23 0.00 6.72 26 0.217 232 1.95 16.6 7009:00 70 5.23 0.00 6.75 26.17 0.218 229 1.96 14.4 10509:05 70 5.23 0.00 6.73 26.22 0.219 229 1.68 15.7 14009:10 70 5.23 0.00 6.76 26.67 0.219 220 1.75 7.9 17509:15 70 5.23 0.00 6.77 26.73 0.219 219 1.65 8.4 21009:20 70 5.23 0.00 6.76 26.8 0.219 217 1.69 7.5 24509:25 70 5.23 0.00 6.77 26.83 0.219 215 1.72 7.1 2800
Sample Time 9:30Sample ID
AnalysisVOCs
Notes:
GW-089400-102816-SAG-002Containers and Preservatives
40 mL VOA (HCl)
10/28/2016
MONITORING WELL RECORD FOR LOW-FLOW PURGING
Project Data:Project Name: Epic - Savannah Date:
Ref. No.: 89400 Personnel: Steven Grace
Monitoring Well Data:Well No.: AW-34 Screen Length (ft): 10
Measurement Point: TOC Depth to Pump Intake (ft)(1): 10Constructed Well Depth (ft): 13.94 Well Diameter, D (in): 2
Measured Well Depth (ft): 13.8 Initial Depth to Water (ft): 6.12Depth of Sediment (ft): --
DrawdownPumping Depth to from Initial Volume
Rate Water Water Level (3) Temperature Conductivity ORP DO Turbidity Purged, V p
Time (mL/min) (ft) (ft) pH o C (S/cm) (mV) (mg/L) (NTU) (mL)
9:40 70 6.15 0.03 6.27 26.78 1.01 -11 96.2 3509:45 70 6.15 0.03 6.33 26.32 1.79 -52 0.71 41.1 7009:50 70 6.15 0.03 6.33 26.39 1.79 -54 0.88 38.4 10509:55 70 6.15 0.03 6.33 26.34 1.78 -55 0.41 38.6 1400
10:00 70 6.15 0.03 6.34 26.35 1.76 -59 0.37 33.5 175010:05 70 6.15 0.03 6.34 26.39 1.73 -62 0.34 28.5 210010:10 70 6.15 0.03 6.36 26.44 1.69 -65 0.32 21.9 245010:15 70 6.15 0.03 6.35 26.56 1.68 -67 0.31 25.4 2800
Sample Time 10:20Sample ID
AnalysisVOCs
Notes:
GW-089400-102816-SAG-003Containers and Preservatives
40 mL VOA (HCl)
10/28/2016
GHD | Epic Midstream, LLC – 2016 2nd Semi-Annual Progress Report | 089400 (3)
Appendix B Field Sample Key and
Analytical Laboratory Reports
June 21, 2016
Dear Order No:
RE:
Analytical Environmental Services, Inc. received samples on for the analyses presented in following report.
FAX:TEL:
3
No problems were encountered during the analyses. Additionally, all results for the associated
Quality Control samples were within EPA and/or AES established limits. Any discrepancies
associated with the analyses contained herein will be noted and submitted in the form of a
project Case Narrative.
AES’s accreditations are as follows:
-NELAC/Florida State Laboratory ID E87582 for analysis of Non-Potable Water, Solid &
Chemical Materials, and Drinking Water Microbiology, effective 07/01/15-06/30/16.
-NELAC/Louisiana Agency Interest No. 100818 for or analysis of Non-Potable Water and Solid
& Chemical Materials, effective 07/01/15-06/30/16.
-NELAC/Texas Certificate No. T104704509-16-6 for or analysis of Non-Potable Water and
Solid & Chemical Materials, effective 03/01/16-02/28/17.
-AIHA-LAP, LLC Laboratory ID: 100671 for Industrial Hygiene samples (Organics,
Inorganics), Environmental Lead (Paint, Soil, Dust Wipes, Air), and Environmental
Microbiology (Fungal) Direct Examination, effective until 09/01/17.
(513) 942-4750
Project Manager
1606B75
John DizinnoGHD Services, Inc.9033 Meridian WayWest Chester OH 45069
Epic - Savannah North Terminal
Chantelle Kanhai
6/10/2016 6:38:00 PM
John Dizinno:
Page 1 of 24
Page 2 of 24
21-Jun-16Date:Analytical Environmental Services, Inc
Client:
Case NarrativeEpic - Savannah North Terminal
GHD Services, Inc.
Lab ID:
Project:
1606B75
Sample Receiving Nonconformance:
A Trip Blank was provided but was not listed on the Chain of Custody. The Trip Blank was analyzed at no cost to the client.
Page 3 of 24

1606B75-001
21-Jun-16Date:Analytical Environmental Services, Inc
Analyses Date AnalyzedDilution
FactorBatchIDUnitsQual
Reporting
LimitResult
Client:
Aqueous
6/10/2016 8:50:00 AM
089400-061016-ZJA-001
Matrix:
Collection Date:
Client Sample ID:
Epic - Savannah North Terminal
GHD Services, Inc.
Lab ID:
Project Name:
Analyst
(SW5030B)Volatile Organic Compounds by GC/MS SW8260B
1,1,1-Trichloroethane BRL 5.0 ug/L 225398 1 06/14/2016 08:20 NP
1,1,2,2-Tetrachloroethane BRL 5.0 ug/L 225398 1 06/14/2016 08:20 NP
1,1,2-Trichloroethane BRL 5.0 ug/L 225398 1 06/14/2016 08:20 NP
1,1-Dichloroethane BRL 5.0 ug/L 225398 1 06/14/2016 08:20 NP
1,1-Dichloroethene BRL 5.0 ug/L 225398 1 06/14/2016 08:20 NP
1,2,4-Trichlorobenzene BRL 5.0 ug/L 225398 1 06/14/2016 08:20 NP
1,2-Dibromo-3-chloropropane BRL 5.0 ug/L 225398 1 06/14/2016 08:20 NP
1,2-Dibromoethane BRL 5.0 ug/L 225398 1 06/14/2016 08:20 NP
1,2-Dichlorobenzene BRL 5.0 ug/L 225398 1 06/14/2016 08:20 NP
1,2-Dichloroethane BRL 5.0 ug/L 225398 1 06/14/2016 08:20 NP
1,2-Dichloropropane BRL 5.0 ug/L 225398 1 06/14/2016 08:20 NP
1,3-Dichlorobenzene BRL 5.0 ug/L 225398 1 06/14/2016 08:20 NP
1,4-Dichlorobenzene BRL 5.0 ug/L 225398 1 06/14/2016 08:20 NP
2-Butanone BRL 50 ug/L 225398 1 06/14/2016 08:20 NP
2-Hexanone BRL 10 ug/L 225398 1 06/14/2016 08:20 NP
4-Methyl-2-pentanone BRL 10 ug/L 225398 1 06/14/2016 08:20 NP
Acetone BRL 50 ug/L 225398 1 06/14/2016 08:20 NP
Benzene BRL 5.0 ug/L 225398 1 06/14/2016 08:20 NP
Bromodichloromethane BRL 5.0 ug/L 225398 1 06/14/2016 08:20 NP
Bromoform BRL 5.0 ug/L 225398 1 06/14/2016 08:20 NP
Bromomethane BRL 5.0 ug/L 225398 1 06/14/2016 08:20 NP
Carbon disulfide BRL 5.0 ug/L 225398 1 06/14/2016 08:20 NP
Carbon tetrachloride BRL 5.0 ug/L 225398 1 06/14/2016 08:20 NP
Chlorobenzene BRL 5.0 ug/L 225398 1 06/14/2016 08:20 NP
Chloroethane BRL 10 ug/L 225398 1 06/14/2016 08:20 NP
Chloroform BRL 5.0 ug/L 225398 1 06/14/2016 08:20 NP
Chloromethane BRL 10 ug/L 225398 1 06/14/2016 08:20 NP
cis-1,2-Dichloroethene BRL 5.0 ug/L 225398 1 06/14/2016 08:20 NP
cis-1,3-Dichloropropene BRL 5.0 ug/L 225398 1 06/14/2016 08:20 NP
Cyclohexane BRL 5.0 ug/L 225398 1 06/14/2016 08:20 NP
Dibromochloromethane BRL 5.0 ug/L 225398 1 06/14/2016 08:20 NP
Dichlorodifluoromethane BRL 10 ug/L 225398 1 06/14/2016 08:20 NP
Ethylbenzene BRL 5.0 ug/L 225398 1 06/14/2016 08:20 NP
Freon-113 BRL 10 ug/L 225398 1 06/14/2016 08:20 NP
Isopropylbenzene BRL 5.0 ug/L 225398 1 06/14/2016 08:20 NP
Methyl acetate BRL 5.0 ug/L 225398 1 06/14/2016 08:20 NP
Methyl tert-butyl ether BRL 5.0 ug/L 225398 1 06/14/2016 08:20 NP
Methylcyclohexane BRL 5.0 ug/L 225398 1 06/14/2016 08:20 NP
Methylene chloride BRL 5.0 ug/L 225398 1 06/14/2016 08:20 NP
Styrene BRL 5.0 ug/L 225398 1 06/14/2016 08:20 NP
Tetrachloroethene BRL 5.0 ug/L 225398 1 06/14/2016 08:20 NP
Qualifiers: * Value exceeds maximum contaminant level
BRL Below reporting limit
H Holding times for preparation or analysis exceeded
N Analyte not NELAC certified
B Analyte detected in the associated method blank
E Estimated (value above quantitation range)
S Spike Recovery outside limits due to matrix
Narr See case narrative
NC Not confirmed
< Less than Result value
> Greater than Result value J Estimated value detected below Reporting LimitPage 4 of 24
1606B75-001
21-Jun-16Date:Analytical Environmental Services, Inc
Analyses Date AnalyzedDilution
FactorBatchIDUnitsQual
Reporting
LimitResult
Client:
Aqueous
6/10/2016 8:50:00 AM
089400-061016-ZJA-001
Matrix:
Collection Date:
Client Sample ID:
Epic - Savannah North Terminal
GHD Services, Inc.
Lab ID:
Project Name:
Analyst
(SW5030B)Volatile Organic Compounds by GC/MS SW8260B
Toluene BRL 5.0 ug/L 225398 1 06/14/2016 08:20 NP
trans-1,2-Dichloroethene BRL 5.0 ug/L 225398 1 06/14/2016 08:20 NP
trans-1,3-Dichloropropene BRL 5.0 ug/L 225398 1 06/14/2016 08:20 NP
Trichloroethene BRL 5.0 ug/L 225398 1 06/14/2016 08:20 NP
Trichlorofluoromethane BRL 5.0 ug/L 225398 1 06/14/2016 08:20 NP
Vinyl chloride BRL 2.0 ug/L 225398 1 06/14/2016 08:20 NP
Xylenes, Total BRL 5.0 ug/L 225398 1 06/14/2016 08:20 NP
Surr: 4-Bromofluorobenzene 97.6 70.7-125 %REC 225398 1 06/14/2016 08:20 NP
Surr: Dibromofluoromethane 118 82.2-120 %REC 225398 1 06/14/2016 08:20 NP
Surr: Toluene-d8 109 81.8-120 %REC 225398 1 06/14/2016 08:20 NP
(SW3510C)TCL-SEMIVOLATILE ORGANICS SW8270D
1,1´-Biphenyl BRL 10 ug/L 225288 1 06/14/2016 18:42 YH
2,4,5-Trichlorophenol BRL 25 ug/L 225288 1 06/14/2016 18:42 YH
2,4,6-Trichlorophenol BRL 10 ug/L 225288 1 06/14/2016 18:42 YH
2,4-Dichlorophenol BRL 10 ug/L 225288 1 06/14/2016 18:42 YH
2,4-Dimethylphenol BRL 10 ug/L 225288 1 06/14/2016 18:42 YH
2,4-Dinitrophenol BRL 25 ug/L 225288 1 06/14/2016 18:42 YH
2,4-Dinitrotoluene BRL 10 ug/L 225288 1 06/14/2016 18:42 YH
2,6-Dinitrotoluene BRL 10 ug/L 225288 1 06/14/2016 18:42 YH
2-Chloronaphthalene BRL 10 ug/L 225288 1 06/14/2016 18:42 YH
2-Chlorophenol BRL 10 ug/L 225288 1 06/14/2016 18:42 YH
2-Methylnaphthalene BRL 10 ug/L 225288 1 06/14/2016 18:42 YH
2-Methylphenol BRL 10 ug/L 225288 1 06/14/2016 18:42 YH
2-Nitroaniline BRL 25 ug/L 225288 1 06/14/2016 18:42 YH
2-Nitrophenol BRL 10 ug/L 225288 1 06/14/2016 18:42 YH
3,3´-Dichlorobenzidine BRL 10 ug/L 225288 1 06/14/2016 18:42 YH
3-Nitroaniline BRL 25 ug/L 225288 1 06/14/2016 18:42 YH
4,6-Dinitro-2-methylphenol BRL 25 ug/L 225288 1 06/14/2016 18:42 YH
4-Bromophenyl phenyl ether BRL 10 ug/L 225288 1 06/14/2016 18:42 YH
4-Chloro-3-methylphenol BRL 10 ug/L 225288 1 06/14/2016 18:42 YH
4-Chloroaniline BRL 10 ug/L 225288 1 06/14/2016 18:42 YH
4-Chlorophenyl phenyl ether BRL 10 ug/L 225288 1 06/14/2016 18:42 YH
4-Methylphenol BRL 10 ug/L 225288 1 06/14/2016 18:42 YH
4-Nitroaniline BRL 25 ug/L 225288 1 06/14/2016 18:42 YH
4-Nitrophenol BRL 25 ug/L 225288 1 06/14/2016 18:42 YH
Acenaphthene BRL 10 ug/L 225288 1 06/14/2016 18:42 YH
Acenaphthylene BRL 10 ug/L 225288 1 06/14/2016 18:42 YH
Acetophenone BRL 10 ug/L 225288 1 06/14/2016 18:42 YH
Anthracene BRL 10 ug/L 225288 1 06/14/2016 18:42 YH
Atrazine BRL 10 ug/L 225288 1 06/14/2016 18:42 YH
Qualifiers: * Value exceeds maximum contaminant level
BRL Below reporting limit
H Holding times for preparation or analysis exceeded
N Analyte not NELAC certified
B Analyte detected in the associated method blank
E Estimated (value above quantitation range)
S Spike Recovery outside limits due to matrix
Narr See case narrative
NC Not confirmed
< Less than Result value
> Greater than Result value J Estimated value detected below Reporting LimitPage 5 of 24
1606B75-001
21-Jun-16Date:Analytical Environmental Services, Inc
Analyses Date AnalyzedDilution
FactorBatchIDUnitsQual
Reporting
LimitResult
Client:
Aqueous
6/10/2016 8:50:00 AM
089400-061016-ZJA-001
Matrix:
Collection Date:
Client Sample ID:
Epic - Savannah North Terminal
GHD Services, Inc.
Lab ID:
Project Name:
Analyst
(SW3510C)TCL-SEMIVOLATILE ORGANICS SW8270D
Benz(a)anthracene BRL 10 ug/L 225288 1 06/14/2016 18:42 YH
Benzaldehyde BRL 10 ug/L 225288 1 06/14/2016 18:42 YH
Benzo(a)pyrene BRL 10 ug/L 225288 1 06/14/2016 18:42 YH
Benzo(b)fluoranthene BRL 10 ug/L 225288 1 06/14/2016 18:42 YH
Benzo(g,h,i)perylene BRL 10 ug/L 225288 1 06/14/2016 18:42 YH
Benzo(k)fluoranthene BRL 10 ug/L 225288 1 06/14/2016 18:42 YH
Bis(2-chloroethoxy)methane BRL 10 ug/L 225288 1 06/14/2016 18:42 YH
Bis(2-chloroethyl)ether BRL 10 ug/L 225288 1 06/14/2016 18:42 YH
Bis(2-chloroisopropyl)ether BRL 10 ug/L 225288 1 06/14/2016 18:42 YH
Bis(2-ethylhexyl)phthalate BRL 10 ug/L 225288 1 06/14/2016 18:42 YH
Butyl benzyl phthalate BRL 10 ug/L 225288 1 06/14/2016 18:42 YH
Caprolactam BRL 10 ug/L 225288 1 06/14/2016 18:42 YH
Carbazole BRL 10 ug/L 225288 1 06/14/2016 18:42 YH
Chrysene BRL 10 ug/L 225288 1 06/14/2016 18:42 YH
Di-n-butyl phthalate BRL 10 ug/L 225288 1 06/14/2016 18:42 YH
Di-n-octyl phthalate BRL 10 ug/L 225288 1 06/14/2016 18:42 YH
Dibenz(a,h)anthracene BRL 10 ug/L 225288 1 06/14/2016 18:42 YH
Dibenzofuran BRL 10 ug/L 225288 1 06/14/2016 18:42 YH
Diethyl phthalate BRL 10 ug/L 225288 1 06/14/2016 18:42 YH
Dimethyl phthalate BRL 10 ug/L 225288 1 06/14/2016 18:42 YH
Fluoranthene BRL 10 ug/L 225288 1 06/14/2016 18:42 YH
Fluorene BRL 10 ug/L 225288 1 06/14/2016 18:42 YH
Hexachlorobenzene BRL 10 ug/L 225288 1 06/14/2016 18:42 YH
Hexachlorobutadiene BRL 10 ug/L 225288 1 06/14/2016 18:42 YH
Hexachlorocyclopentadiene BRL 10 ug/L 225288 1 06/14/2016 18:42 YH
Hexachloroethane BRL 10 ug/L 225288 1 06/14/2016 18:42 YH
Indeno(1,2,3-cd)pyrene BRL 10 ug/L 225288 1 06/14/2016 18:42 YH
Isophorone BRL 10 ug/L 225288 1 06/14/2016 18:42 YH
N-Nitrosodi-n-propylamine BRL 10 ug/L 225288 1 06/14/2016 18:42 YH
N-Nitrosodiphenylamine BRL 10 ug/L 225288 1 06/14/2016 18:42 YH
Naphthalene BRL 10 ug/L 225288 1 06/14/2016 18:42 YH
Nitrobenzene BRL 10 ug/L 225288 1 06/14/2016 18:42 YH
Pentachlorophenol BRL 25 ug/L 225288 1 06/14/2016 18:42 YH
Phenanthrene BRL 10 ug/L 225288 1 06/14/2016 18:42 YH
Phenol BRL 10 ug/L 225288 1 06/14/2016 18:42 YH
Pyrene BRL 10 ug/L 225288 1 06/14/2016 18:42 YH
Surr: 2,4,6-Tribromophenol 143 51.5-141 S %REC 225288 1 06/14/2016 18:42 YH
Surr: 2-Fluorobiphenyl 96.4 50.8-122 %REC 225288 1 06/14/2016 18:42 YH
Surr: 2-Fluorophenol 7.69 28.1-120 S %REC 225288 1 06/14/2016 18:42 YH
Surr: 4-Terphenyl-d14 87.4 47.2-131 %REC 225288 1 06/14/2016 18:42 YH
Surr: Nitrobenzene-d5 86.6 42.1-124 %REC 225288 1 06/14/2016 18:42 YH
Qualifiers: * Value exceeds maximum contaminant level
BRL Below reporting limit
H Holding times for preparation or analysis exceeded
N Analyte not NELAC certified
B Analyte detected in the associated method blank
E Estimated (value above quantitation range)
S Spike Recovery outside limits due to matrix
Narr See case narrative
NC Not confirmed
< Less than Result value
> Greater than Result value J Estimated value detected below Reporting LimitPage 6 of 24
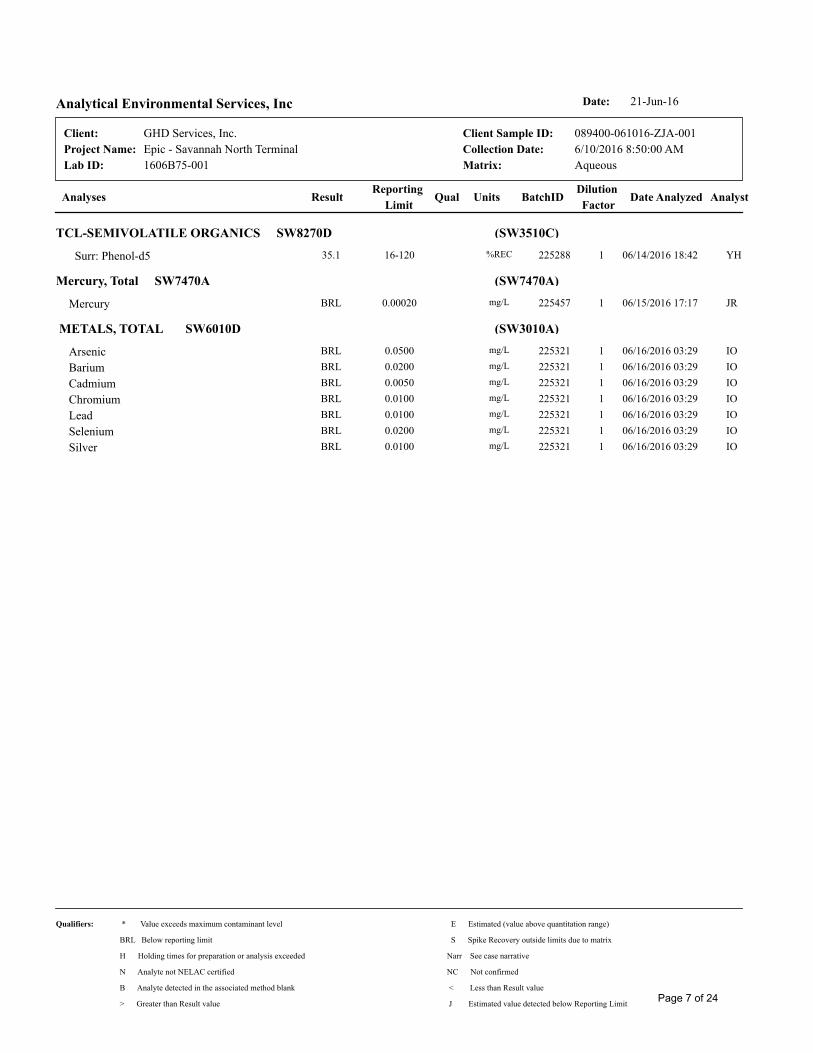
1606B75-001
21-Jun-16Date:Analytical Environmental Services, Inc
Analyses Date AnalyzedDilution
FactorBatchIDUnitsQual
Reporting
LimitResult
Client:
Aqueous
6/10/2016 8:50:00 AM
089400-061016-ZJA-001
Matrix:
Collection Date:
Client Sample ID:
Epic - Savannah North Terminal
GHD Services, Inc.
Lab ID:
Project Name:
Analyst
(SW3510C)TCL-SEMIVOLATILE ORGANICS SW8270D
Surr: Phenol-d5 35.1 16-120 %REC 225288 1 06/14/2016 18:42 YH
(SW7470A)Mercury, Total SW7470A
Mercury BRL 0.00020 mg/L 225457 1 06/15/2016 17:17 JR
(SW3010A) METALS, TOTAL SW6010D
Arsenic BRL 0.0500 mg/L 225321 1 06/16/2016 03:29 IO
Barium BRL 0.0200 mg/L 225321 1 06/16/2016 03:29 IO
Cadmium BRL 0.0050 mg/L 225321 1 06/16/2016 03:29 IO
Chromium BRL 0.0100 mg/L 225321 1 06/16/2016 03:29 IO
Lead BRL 0.0100 mg/L 225321 1 06/16/2016 03:29 IO
Selenium BRL 0.0200 mg/L 225321 1 06/16/2016 03:29 IO
Silver BRL 0.0100 mg/L 225321 1 06/16/2016 03:29 IO
Qualifiers: * Value exceeds maximum contaminant level
BRL Below reporting limit
H Holding times for preparation or analysis exceeded
N Analyte not NELAC certified
B Analyte detected in the associated method blank
E Estimated (value above quantitation range)
S Spike Recovery outside limits due to matrix
Narr See case narrative
NC Not confirmed
< Less than Result value
> Greater than Result value J Estimated value detected below Reporting LimitPage 7 of 24
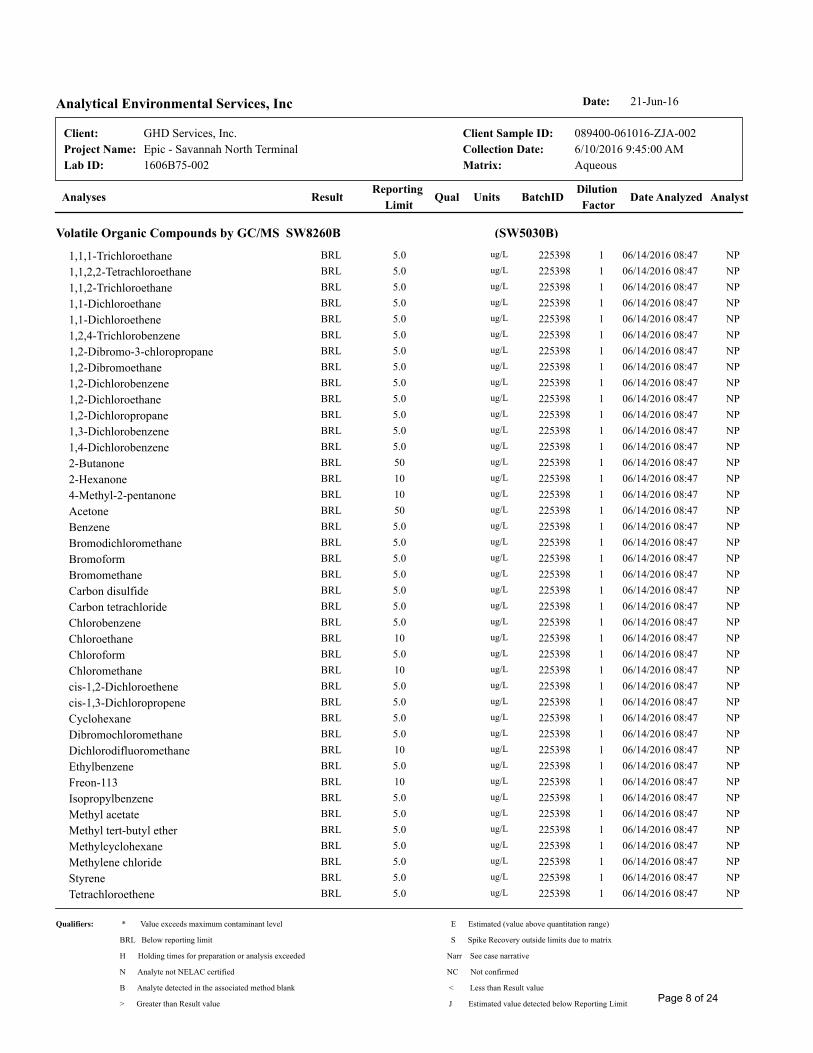
1606B75-002
21-Jun-16Date:Analytical Environmental Services, Inc
Analyses Date AnalyzedDilution
FactorBatchIDUnitsQual
Reporting
LimitResult
Client:
Aqueous
6/10/2016 9:45:00 AM
089400-061016-ZJA-002
Matrix:
Collection Date:
Client Sample ID:
Epic - Savannah North Terminal
GHD Services, Inc.
Lab ID:
Project Name:
Analyst
(SW5030B)Volatile Organic Compounds by GC/MS SW8260B
1,1,1-Trichloroethane BRL 5.0 ug/L 225398 1 06/14/2016 08:47 NP
1,1,2,2-Tetrachloroethane BRL 5.0 ug/L 225398 1 06/14/2016 08:47 NP
1,1,2-Trichloroethane BRL 5.0 ug/L 225398 1 06/14/2016 08:47 NP
1,1-Dichloroethane BRL 5.0 ug/L 225398 1 06/14/2016 08:47 NP
1,1-Dichloroethene BRL 5.0 ug/L 225398 1 06/14/2016 08:47 NP
1,2,4-Trichlorobenzene BRL 5.0 ug/L 225398 1 06/14/2016 08:47 NP
1,2-Dibromo-3-chloropropane BRL 5.0 ug/L 225398 1 06/14/2016 08:47 NP
1,2-Dibromoethane BRL 5.0 ug/L 225398 1 06/14/2016 08:47 NP
1,2-Dichlorobenzene BRL 5.0 ug/L 225398 1 06/14/2016 08:47 NP
1,2-Dichloroethane BRL 5.0 ug/L 225398 1 06/14/2016 08:47 NP
1,2-Dichloropropane BRL 5.0 ug/L 225398 1 06/14/2016 08:47 NP
1,3-Dichlorobenzene BRL 5.0 ug/L 225398 1 06/14/2016 08:47 NP
1,4-Dichlorobenzene BRL 5.0 ug/L 225398 1 06/14/2016 08:47 NP
2-Butanone BRL 50 ug/L 225398 1 06/14/2016 08:47 NP
2-Hexanone BRL 10 ug/L 225398 1 06/14/2016 08:47 NP
4-Methyl-2-pentanone BRL 10 ug/L 225398 1 06/14/2016 08:47 NP
Acetone BRL 50 ug/L 225398 1 06/14/2016 08:47 NP
Benzene BRL 5.0 ug/L 225398 1 06/14/2016 08:47 NP
Bromodichloromethane BRL 5.0 ug/L 225398 1 06/14/2016 08:47 NP
Bromoform BRL 5.0 ug/L 225398 1 06/14/2016 08:47 NP
Bromomethane BRL 5.0 ug/L 225398 1 06/14/2016 08:47 NP
Carbon disulfide BRL 5.0 ug/L 225398 1 06/14/2016 08:47 NP
Carbon tetrachloride BRL 5.0 ug/L 225398 1 06/14/2016 08:47 NP
Chlorobenzene BRL 5.0 ug/L 225398 1 06/14/2016 08:47 NP
Chloroethane BRL 10 ug/L 225398 1 06/14/2016 08:47 NP
Chloroform BRL 5.0 ug/L 225398 1 06/14/2016 08:47 NP
Chloromethane BRL 10 ug/L 225398 1 06/14/2016 08:47 NP
cis-1,2-Dichloroethene BRL 5.0 ug/L 225398 1 06/14/2016 08:47 NP
cis-1,3-Dichloropropene BRL 5.0 ug/L 225398 1 06/14/2016 08:47 NP
Cyclohexane BRL 5.0 ug/L 225398 1 06/14/2016 08:47 NP
Dibromochloromethane BRL 5.0 ug/L 225398 1 06/14/2016 08:47 NP
Dichlorodifluoromethane BRL 10 ug/L 225398 1 06/14/2016 08:47 NP
Ethylbenzene BRL 5.0 ug/L 225398 1 06/14/2016 08:47 NP
Freon-113 BRL 10 ug/L 225398 1 06/14/2016 08:47 NP
Isopropylbenzene BRL 5.0 ug/L 225398 1 06/14/2016 08:47 NP
Methyl acetate BRL 5.0 ug/L 225398 1 06/14/2016 08:47 NP
Methyl tert-butyl ether BRL 5.0 ug/L 225398 1 06/14/2016 08:47 NP
Methylcyclohexane BRL 5.0 ug/L 225398 1 06/14/2016 08:47 NP
Methylene chloride BRL 5.0 ug/L 225398 1 06/14/2016 08:47 NP
Styrene BRL 5.0 ug/L 225398 1 06/14/2016 08:47 NP
Tetrachloroethene BRL 5.0 ug/L 225398 1 06/14/2016 08:47 NP
Qualifiers: * Value exceeds maximum contaminant level
BRL Below reporting limit
H Holding times for preparation or analysis exceeded
N Analyte not NELAC certified
B Analyte detected in the associated method blank
E Estimated (value above quantitation range)
S Spike Recovery outside limits due to matrix
Narr See case narrative
NC Not confirmed
< Less than Result value
> Greater than Result value J Estimated value detected below Reporting LimitPage 8 of 24

1606B75-002
21-Jun-16Date:Analytical Environmental Services, Inc
Analyses Date AnalyzedDilution
FactorBatchIDUnitsQual
Reporting
LimitResult
Client:
Aqueous
6/10/2016 9:45:00 AM
089400-061016-ZJA-002
Matrix:
Collection Date:
Client Sample ID:
Epic - Savannah North Terminal
GHD Services, Inc.
Lab ID:
Project Name:
Analyst
(SW5030B)Volatile Organic Compounds by GC/MS SW8260B
Toluene BRL 5.0 ug/L 225398 1 06/14/2016 08:47 NP
trans-1,2-Dichloroethene BRL 5.0 ug/L 225398 1 06/14/2016 08:47 NP
trans-1,3-Dichloropropene BRL 5.0 ug/L 225398 1 06/14/2016 08:47 NP
Trichloroethene BRL 5.0 ug/L 225398 1 06/14/2016 08:47 NP
Trichlorofluoromethane BRL 5.0 ug/L 225398 1 06/14/2016 08:47 NP
Vinyl chloride BRL 2.0 ug/L 225398 1 06/14/2016 08:47 NP
Xylenes, Total BRL 5.0 ug/L 225398 1 06/14/2016 08:47 NP
Surr: 4-Bromofluorobenzene 96.4 70.7-125 %REC 225398 1 06/14/2016 08:47 NP
Surr: Dibromofluoromethane 116 82.2-120 %REC 225398 1 06/14/2016 08:47 NP
Surr: Toluene-d8 107 81.8-120 %REC 225398 1 06/14/2016 08:47 NP
(SW3510C)TCL-SEMIVOLATILE ORGANICS SW8270D
1,1´-Biphenyl BRL 10 ug/L 225288 1 06/14/2016 19:09 YH
2,4,5-Trichlorophenol BRL 25 ug/L 225288 1 06/14/2016 19:09 YH
2,4,6-Trichlorophenol BRL 10 ug/L 225288 1 06/14/2016 19:09 YH
2,4-Dichlorophenol BRL 10 ug/L 225288 1 06/14/2016 19:09 YH
2,4-Dimethylphenol BRL 10 ug/L 225288 1 06/14/2016 19:09 YH
2,4-Dinitrophenol BRL 25 ug/L 225288 1 06/14/2016 19:09 YH
2,4-Dinitrotoluene BRL 10 ug/L 225288 1 06/14/2016 19:09 YH
2,6-Dinitrotoluene BRL 10 ug/L 225288 1 06/14/2016 19:09 YH
2-Chloronaphthalene BRL 10 ug/L 225288 1 06/14/2016 19:09 YH
2-Chlorophenol BRL 10 ug/L 225288 1 06/14/2016 19:09 YH
2-Methylnaphthalene BRL 10 ug/L 225288 1 06/14/2016 19:09 YH
2-Methylphenol BRL 10 ug/L 225288 1 06/14/2016 19:09 YH
2-Nitroaniline BRL 25 ug/L 225288 1 06/14/2016 19:09 YH
2-Nitrophenol BRL 10 ug/L 225288 1 06/14/2016 19:09 YH
3,3´-Dichlorobenzidine BRL 10 ug/L 225288 1 06/14/2016 19:09 YH
3-Nitroaniline BRL 25 ug/L 225288 1 06/14/2016 19:09 YH
4,6-Dinitro-2-methylphenol BRL 25 ug/L 225288 1 06/14/2016 19:09 YH
4-Bromophenyl phenyl ether BRL 10 ug/L 225288 1 06/14/2016 19:09 YH
4-Chloro-3-methylphenol BRL 10 ug/L 225288 1 06/14/2016 19:09 YH
4-Chloroaniline BRL 10 ug/L 225288 1 06/14/2016 19:09 YH
4-Chlorophenyl phenyl ether BRL 10 ug/L 225288 1 06/14/2016 19:09 YH
4-Methylphenol BRL 10 ug/L 225288 1 06/14/2016 19:09 YH
4-Nitroaniline BRL 25 ug/L 225288 1 06/14/2016 19:09 YH
4-Nitrophenol BRL 25 ug/L 225288 1 06/14/2016 19:09 YH
Acenaphthene BRL 10 ug/L 225288 1 06/14/2016 19:09 YH
Acenaphthylene BRL 10 ug/L 225288 1 06/14/2016 19:09 YH
Acetophenone BRL 10 ug/L 225288 1 06/14/2016 19:09 YH
Anthracene BRL 10 ug/L 225288 1 06/14/2016 19:09 YH
Atrazine BRL 10 ug/L 225288 1 06/14/2016 19:09 YH
Qualifiers: * Value exceeds maximum contaminant level
BRL Below reporting limit
H Holding times for preparation or analysis exceeded
N Analyte not NELAC certified
B Analyte detected in the associated method blank
E Estimated (value above quantitation range)
S Spike Recovery outside limits due to matrix
Narr See case narrative
NC Not confirmed
< Less than Result value
> Greater than Result value J Estimated value detected below Reporting LimitPage 9 of 24
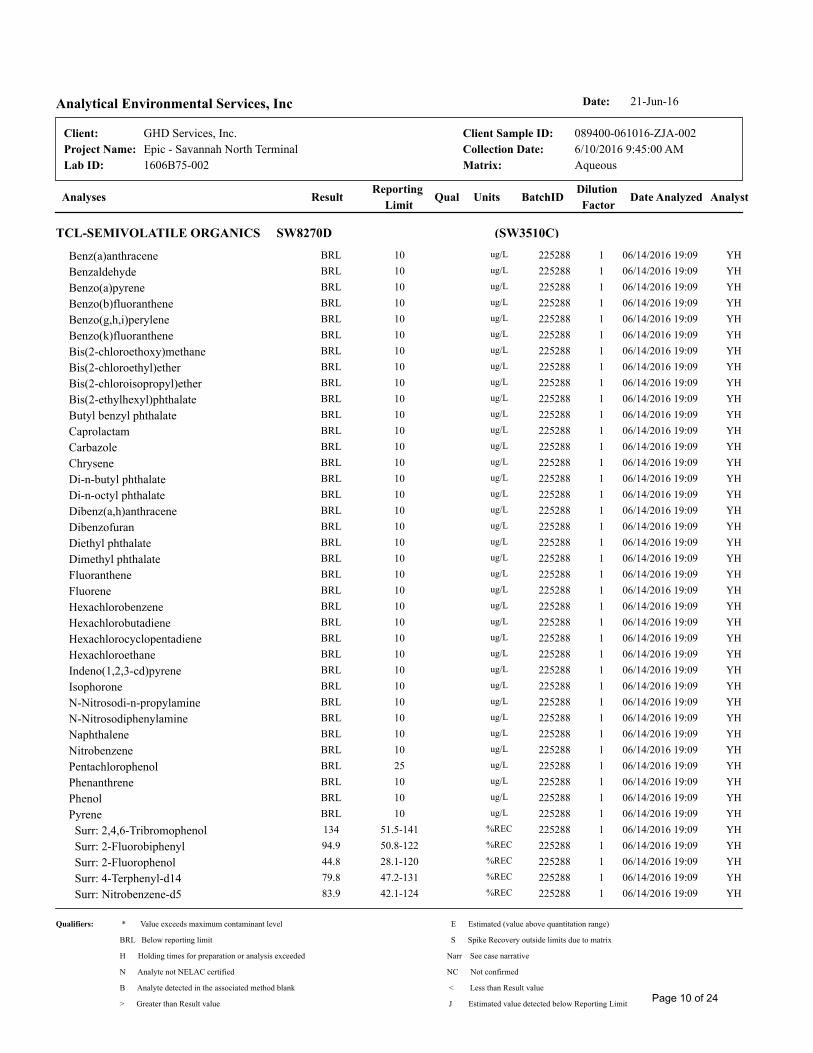
1606B75-002
21-Jun-16Date:Analytical Environmental Services, Inc
Analyses Date AnalyzedDilution
FactorBatchIDUnitsQual
Reporting
LimitResult
Client:
Aqueous
6/10/2016 9:45:00 AM
089400-061016-ZJA-002
Matrix:
Collection Date:
Client Sample ID:
Epic - Savannah North Terminal
GHD Services, Inc.
Lab ID:
Project Name:
Analyst
(SW3510C)TCL-SEMIVOLATILE ORGANICS SW8270D
Benz(a)anthracene BRL 10 ug/L 225288 1 06/14/2016 19:09 YH
Benzaldehyde BRL 10 ug/L 225288 1 06/14/2016 19:09 YH
Benzo(a)pyrene BRL 10 ug/L 225288 1 06/14/2016 19:09 YH
Benzo(b)fluoranthene BRL 10 ug/L 225288 1 06/14/2016 19:09 YH
Benzo(g,h,i)perylene BRL 10 ug/L 225288 1 06/14/2016 19:09 YH
Benzo(k)fluoranthene BRL 10 ug/L 225288 1 06/14/2016 19:09 YH
Bis(2-chloroethoxy)methane BRL 10 ug/L 225288 1 06/14/2016 19:09 YH
Bis(2-chloroethyl)ether BRL 10 ug/L 225288 1 06/14/2016 19:09 YH
Bis(2-chloroisopropyl)ether BRL 10 ug/L 225288 1 06/14/2016 19:09 YH
Bis(2-ethylhexyl)phthalate BRL 10 ug/L 225288 1 06/14/2016 19:09 YH
Butyl benzyl phthalate BRL 10 ug/L 225288 1 06/14/2016 19:09 YH
Caprolactam BRL 10 ug/L 225288 1 06/14/2016 19:09 YH
Carbazole BRL 10 ug/L 225288 1 06/14/2016 19:09 YH
Chrysene BRL 10 ug/L 225288 1 06/14/2016 19:09 YH
Di-n-butyl phthalate BRL 10 ug/L 225288 1 06/14/2016 19:09 YH
Di-n-octyl phthalate BRL 10 ug/L 225288 1 06/14/2016 19:09 YH
Dibenz(a,h)anthracene BRL 10 ug/L 225288 1 06/14/2016 19:09 YH
Dibenzofuran BRL 10 ug/L 225288 1 06/14/2016 19:09 YH
Diethyl phthalate BRL 10 ug/L 225288 1 06/14/2016 19:09 YH
Dimethyl phthalate BRL 10 ug/L 225288 1 06/14/2016 19:09 YH
Fluoranthene BRL 10 ug/L 225288 1 06/14/2016 19:09 YH
Fluorene BRL 10 ug/L 225288 1 06/14/2016 19:09 YH
Hexachlorobenzene BRL 10 ug/L 225288 1 06/14/2016 19:09 YH
Hexachlorobutadiene BRL 10 ug/L 225288 1 06/14/2016 19:09 YH
Hexachlorocyclopentadiene BRL 10 ug/L 225288 1 06/14/2016 19:09 YH
Hexachloroethane BRL 10 ug/L 225288 1 06/14/2016 19:09 YH
Indeno(1,2,3-cd)pyrene BRL 10 ug/L 225288 1 06/14/2016 19:09 YH
Isophorone BRL 10 ug/L 225288 1 06/14/2016 19:09 YH
N-Nitrosodi-n-propylamine BRL 10 ug/L 225288 1 06/14/2016 19:09 YH
N-Nitrosodiphenylamine BRL 10 ug/L 225288 1 06/14/2016 19:09 YH
Naphthalene BRL 10 ug/L 225288 1 06/14/2016 19:09 YH
Nitrobenzene BRL 10 ug/L 225288 1 06/14/2016 19:09 YH
Pentachlorophenol BRL 25 ug/L 225288 1 06/14/2016 19:09 YH
Phenanthrene BRL 10 ug/L 225288 1 06/14/2016 19:09 YH
Phenol BRL 10 ug/L 225288 1 06/14/2016 19:09 YH
Pyrene BRL 10 ug/L 225288 1 06/14/2016 19:09 YH
Surr: 2,4,6-Tribromophenol 134 51.5-141 %REC 225288 1 06/14/2016 19:09 YH
Surr: 2-Fluorobiphenyl 94.9 50.8-122 %REC 225288 1 06/14/2016 19:09 YH
Surr: 2-Fluorophenol 44.8 28.1-120 %REC 225288 1 06/14/2016 19:09 YH
Surr: 4-Terphenyl-d14 79.8 47.2-131 %REC 225288 1 06/14/2016 19:09 YH
Surr: Nitrobenzene-d5 83.9 42.1-124 %REC 225288 1 06/14/2016 19:09 YH
Qualifiers: * Value exceeds maximum contaminant level
BRL Below reporting limit
H Holding times for preparation or analysis exceeded
N Analyte not NELAC certified
B Analyte detected in the associated method blank
E Estimated (value above quantitation range)
S Spike Recovery outside limits due to matrix
Narr See case narrative
NC Not confirmed
< Less than Result value
> Greater than Result value J Estimated value detected below Reporting LimitPage 10 of 24

1606B75-002
21-Jun-16Date:Analytical Environmental Services, Inc
Analyses Date AnalyzedDilution
FactorBatchIDUnitsQual
Reporting
LimitResult
Client:
Aqueous
6/10/2016 9:45:00 AM
089400-061016-ZJA-002
Matrix:
Collection Date:
Client Sample ID:
Epic - Savannah North Terminal
GHD Services, Inc.
Lab ID:
Project Name:
Analyst
(SW3510C)TCL-SEMIVOLATILE ORGANICS SW8270D
Surr: Phenol-d5 29.4 16-120 %REC 225288 1 06/14/2016 19:09 YH
(SW7470A)Mercury, Total SW7470A
Mercury BRL 0.00020 mg/L 225457 1 06/15/2016 17:19 JR
(SW3010A) METALS, TOTAL SW6010D
Arsenic BRL 0.0500 mg/L 225321 1 06/16/2016 03:33 IO
Barium BRL 0.0200 mg/L 225321 1 06/16/2016 03:33 IO
Cadmium BRL 0.0050 mg/L 225321 1 06/16/2016 03:33 IO
Chromium BRL 0.0100 mg/L 225321 1 06/16/2016 03:33 IO
Lead BRL 0.0100 mg/L 225321 1 06/16/2016 03:33 IO
Selenium BRL 0.0200 mg/L 225321 1 06/16/2016 03:33 IO
Silver BRL 0.0100 mg/L 225321 1 06/16/2016 03:33 IO
Qualifiers: * Value exceeds maximum contaminant level
BRL Below reporting limit
H Holding times for preparation or analysis exceeded
N Analyte not NELAC certified
B Analyte detected in the associated method blank
E Estimated (value above quantitation range)
S Spike Recovery outside limits due to matrix
Narr See case narrative
NC Not confirmed
< Less than Result value
> Greater than Result value J Estimated value detected below Reporting LimitPage 11 of 24
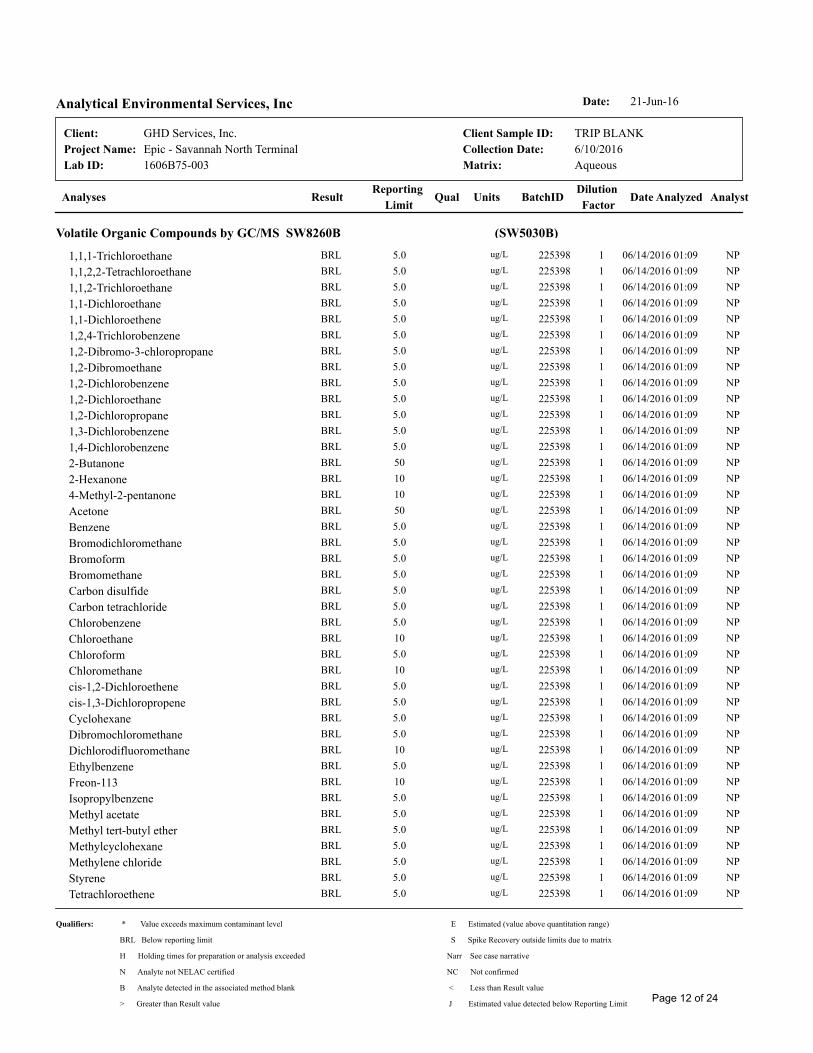
1606B75-003
21-Jun-16Date:Analytical Environmental Services, Inc
Analyses Date AnalyzedDilution
FactorBatchIDUnitsQual
Reporting
LimitResult
Client:
Aqueous
6/10/2016
TRIP BLANK
Matrix:
Collection Date:
Client Sample ID:
Epic - Savannah North Terminal
GHD Services, Inc.
Lab ID:
Project Name:
Analyst
(SW5030B)Volatile Organic Compounds by GC/MS SW8260B
1,1,1-Trichloroethane BRL 5.0 ug/L 225398 1 06/14/2016 01:09 NP
1,1,2,2-Tetrachloroethane BRL 5.0 ug/L 225398 1 06/14/2016 01:09 NP
1,1,2-Trichloroethane BRL 5.0 ug/L 225398 1 06/14/2016 01:09 NP
1,1-Dichloroethane BRL 5.0 ug/L 225398 1 06/14/2016 01:09 NP
1,1-Dichloroethene BRL 5.0 ug/L 225398 1 06/14/2016 01:09 NP
1,2,4-Trichlorobenzene BRL 5.0 ug/L 225398 1 06/14/2016 01:09 NP
1,2-Dibromo-3-chloropropane BRL 5.0 ug/L 225398 1 06/14/2016 01:09 NP
1,2-Dibromoethane BRL 5.0 ug/L 225398 1 06/14/2016 01:09 NP
1,2-Dichlorobenzene BRL 5.0 ug/L 225398 1 06/14/2016 01:09 NP
1,2-Dichloroethane BRL 5.0 ug/L 225398 1 06/14/2016 01:09 NP
1,2-Dichloropropane BRL 5.0 ug/L 225398 1 06/14/2016 01:09 NP
1,3-Dichlorobenzene BRL 5.0 ug/L 225398 1 06/14/2016 01:09 NP
1,4-Dichlorobenzene BRL 5.0 ug/L 225398 1 06/14/2016 01:09 NP
2-Butanone BRL 50 ug/L 225398 1 06/14/2016 01:09 NP
2-Hexanone BRL 10 ug/L 225398 1 06/14/2016 01:09 NP
4-Methyl-2-pentanone BRL 10 ug/L 225398 1 06/14/2016 01:09 NP
Acetone BRL 50 ug/L 225398 1 06/14/2016 01:09 NP
Benzene BRL 5.0 ug/L 225398 1 06/14/2016 01:09 NP
Bromodichloromethane BRL 5.0 ug/L 225398 1 06/14/2016 01:09 NP
Bromoform BRL 5.0 ug/L 225398 1 06/14/2016 01:09 NP
Bromomethane BRL 5.0 ug/L 225398 1 06/14/2016 01:09 NP
Carbon disulfide BRL 5.0 ug/L 225398 1 06/14/2016 01:09 NP
Carbon tetrachloride BRL 5.0 ug/L 225398 1 06/14/2016 01:09 NP
Chlorobenzene BRL 5.0 ug/L 225398 1 06/14/2016 01:09 NP
Chloroethane BRL 10 ug/L 225398 1 06/14/2016 01:09 NP
Chloroform BRL 5.0 ug/L 225398 1 06/14/2016 01:09 NP
Chloromethane BRL 10 ug/L 225398 1 06/14/2016 01:09 NP
cis-1,2-Dichloroethene BRL 5.0 ug/L 225398 1 06/14/2016 01:09 NP
cis-1,3-Dichloropropene BRL 5.0 ug/L 225398 1 06/14/2016 01:09 NP
Cyclohexane BRL 5.0 ug/L 225398 1 06/14/2016 01:09 NP
Dibromochloromethane BRL 5.0 ug/L 225398 1 06/14/2016 01:09 NP
Dichlorodifluoromethane BRL 10 ug/L 225398 1 06/14/2016 01:09 NP
Ethylbenzene BRL 5.0 ug/L 225398 1 06/14/2016 01:09 NP
Freon-113 BRL 10 ug/L 225398 1 06/14/2016 01:09 NP
Isopropylbenzene BRL 5.0 ug/L 225398 1 06/14/2016 01:09 NP
Methyl acetate BRL 5.0 ug/L 225398 1 06/14/2016 01:09 NP
Methyl tert-butyl ether BRL 5.0 ug/L 225398 1 06/14/2016 01:09 NP
Methylcyclohexane BRL 5.0 ug/L 225398 1 06/14/2016 01:09 NP
Methylene chloride BRL 5.0 ug/L 225398 1 06/14/2016 01:09 NP
Styrene BRL 5.0 ug/L 225398 1 06/14/2016 01:09 NP
Tetrachloroethene BRL 5.0 ug/L 225398 1 06/14/2016 01:09 NP
Qualifiers: * Value exceeds maximum contaminant level
BRL Below reporting limit
H Holding times for preparation or analysis exceeded
N Analyte not NELAC certified
B Analyte detected in the associated method blank
E Estimated (value above quantitation range)
S Spike Recovery outside limits due to matrix
Narr See case narrative
NC Not confirmed
< Less than Result value
> Greater than Result value J Estimated value detected below Reporting LimitPage 12 of 24
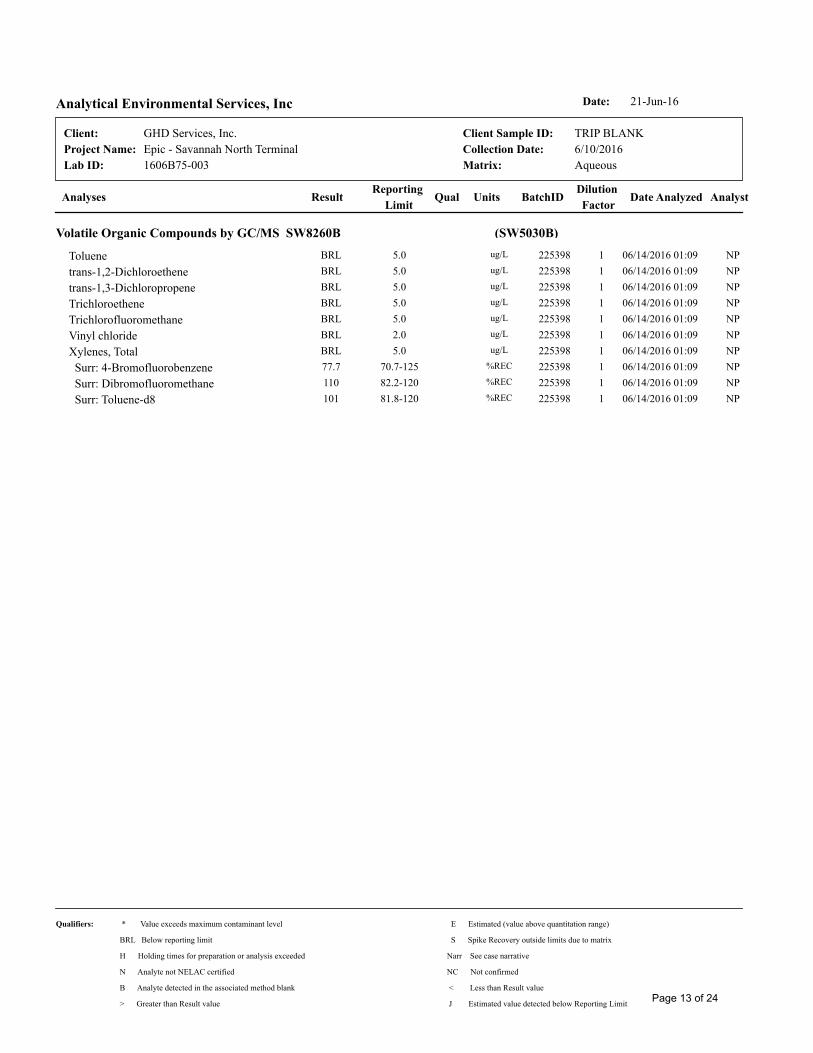
1606B75-003
21-Jun-16Date:Analytical Environmental Services, Inc
Analyses Date AnalyzedDilution
FactorBatchIDUnitsQual
Reporting
LimitResult
Client:
Aqueous
6/10/2016
TRIP BLANK
Matrix:
Collection Date:
Client Sample ID:
Epic - Savannah North Terminal
GHD Services, Inc.
Lab ID:
Project Name:
Analyst
(SW5030B)Volatile Organic Compounds by GC/MS SW8260B
Toluene BRL 5.0 ug/L 225398 1 06/14/2016 01:09 NP
trans-1,2-Dichloroethene BRL 5.0 ug/L 225398 1 06/14/2016 01:09 NP
trans-1,3-Dichloropropene BRL 5.0 ug/L 225398 1 06/14/2016 01:09 NP
Trichloroethene BRL 5.0 ug/L 225398 1 06/14/2016 01:09 NP
Trichlorofluoromethane BRL 5.0 ug/L 225398 1 06/14/2016 01:09 NP
Vinyl chloride BRL 2.0 ug/L 225398 1 06/14/2016 01:09 NP
Xylenes, Total BRL 5.0 ug/L 225398 1 06/14/2016 01:09 NP
Surr: 4-Bromofluorobenzene 77.7 70.7-125 %REC 225398 1 06/14/2016 01:09 NP
Surr: Dibromofluoromethane 110 82.2-120 %REC 225398 1 06/14/2016 01:09 NP
Surr: Toluene-d8 101 81.8-120 %REC 225398 1 06/14/2016 01:09 NP
Qualifiers: * Value exceeds maximum contaminant level
BRL Below reporting limit
H Holding times for preparation or analysis exceeded
N Analyte not NELAC certified
B Analyte detected in the associated method blank
E Estimated (value above quantitation range)
S Spike Recovery outside limits due to matrix
Narr See case narrative
NC Not confirmed
< Less than Result value
> Greater than Result value J Estimated value detected below Reporting LimitPage 13 of 24
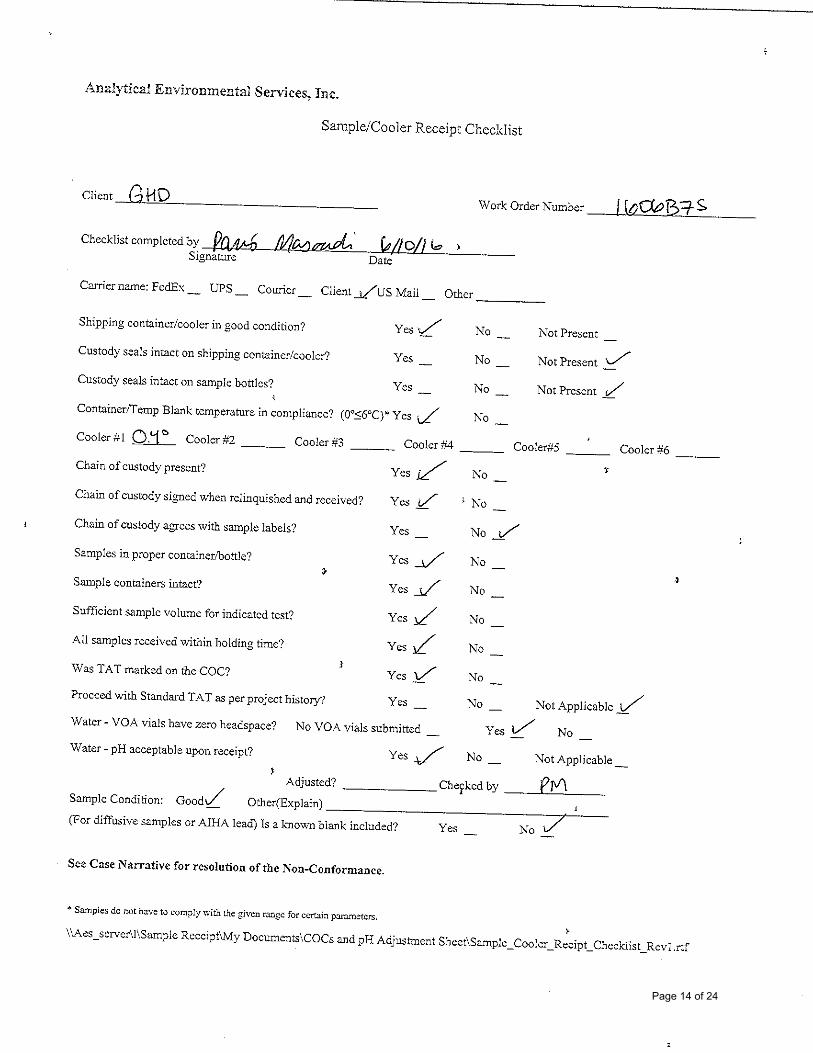
Page 14 of 24
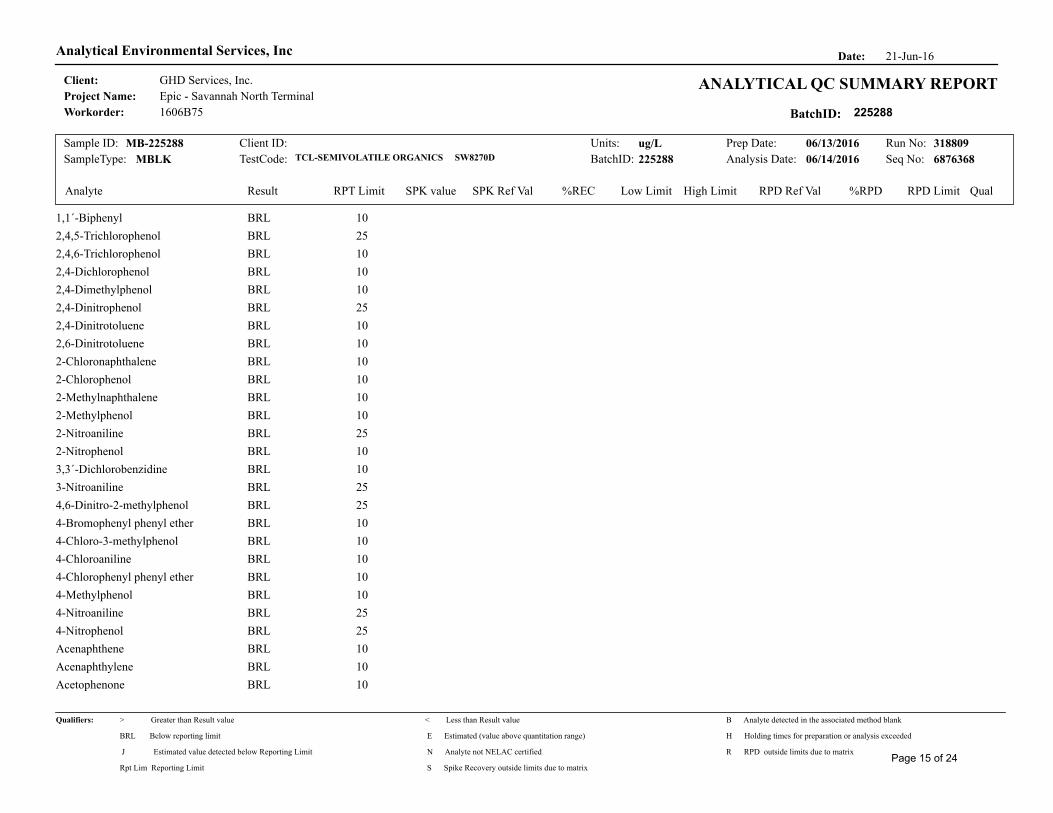
21-Jun-16Date:Analytical Environmental Services, Inc
Client:
BatchID:Workorder:
Project Name:ANALYTICAL QC SUMMARY REPORT
Epic - Savannah North Terminal
1606B75
GHD Services, Inc.
225288
RPT Limit QualAnalyte Result SPK value SPK Ref Val %REC Low Limit High Limit RPD Ref Val %RPD RPD Limit
SampleType: BatchID: Analysis Date: Seq No:TestCode: 225288MBLK 06/14/2016TCL-SEMIVOLATILE ORGANICS SW8270D
Units: Prep Date:Sample ID: Client ID: Run No:ug/L 06/13/2016 318809MB-225288
6876368
1,1´-Biphenyl 10BRL
2,4,5-Trichlorophenol 25BRL
2,4,6-Trichlorophenol 10BRL
2,4-Dichlorophenol 10BRL
2,4-Dimethylphenol 10BRL
2,4-Dinitrophenol 25BRL
2,4-Dinitrotoluene 10BRL
2,6-Dinitrotoluene 10BRL
2-Chloronaphthalene 10BRL
2-Chlorophenol 10BRL
2-Methylnaphthalene 10BRL
2-Methylphenol 10BRL
2-Nitroaniline 25BRL
2-Nitrophenol 10BRL
3,3´-Dichlorobenzidine 10BRL
3-Nitroaniline 25BRL
4,6-Dinitro-2-methylphenol 25BRL
4-Bromophenyl phenyl ether 10BRL
4-Chloro-3-methylphenol 10BRL
4-Chloroaniline 10BRL
4-Chlorophenyl phenyl ether 10BRL
4-Methylphenol 10BRL
4-Nitroaniline 25BRL
4-Nitrophenol 25BRL
Acenaphthene 10BRL
Acenaphthylene 10BRL
Acetophenone 10BRL
Qualifiers:
J Estimated value detected below Reporting Limit
BRL Below reporting limit H Holding times for preparation or analysis exceeded
N Analyte not NELAC certified
B Analyte detected in the associated method blank
E Estimated (value above quantitation range)
S Spike Recovery outside limits due to matrix
< Less than Result value> Greater than Result value
R RPD outside limits due to matrix
Rpt Lim Reporting LimitPage 15 of 24
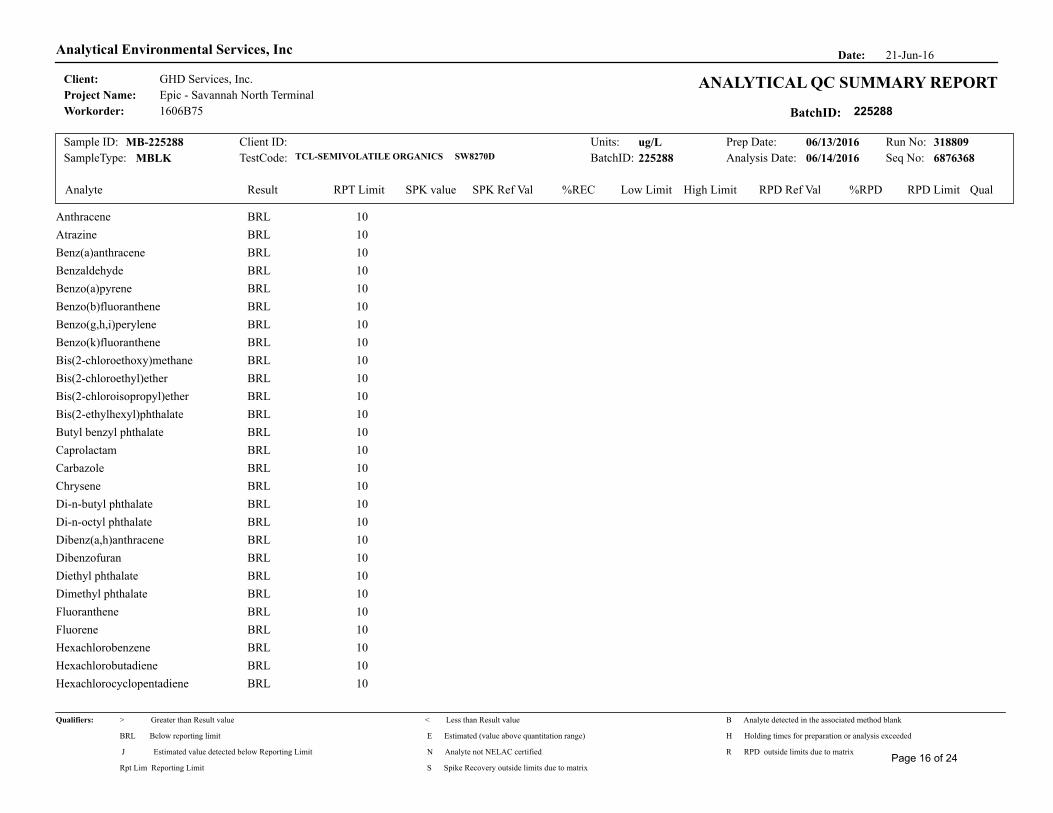
21-Jun-16Date:Analytical Environmental Services, Inc
Client:
BatchID:Workorder:
Project Name:ANALYTICAL QC SUMMARY REPORT
Epic - Savannah North Terminal
1606B75
GHD Services, Inc.
225288
RPT Limit QualAnalyte Result SPK value SPK Ref Val %REC Low Limit High Limit RPD Ref Val %RPD RPD Limit
SampleType: BatchID: Analysis Date: Seq No:TestCode: 225288MBLK 06/14/2016TCL-SEMIVOLATILE ORGANICS SW8270D
Units: Prep Date:Sample ID: Client ID: Run No:ug/L 06/13/2016 318809MB-225288
6876368
Anthracene 10BRL
Atrazine 10BRL
Benz(a)anthracene 10BRL
Benzaldehyde 10BRL
Benzo(a)pyrene 10BRL
Benzo(b)fluoranthene 10BRL
Benzo(g,h,i)perylene 10BRL
Benzo(k)fluoranthene 10BRL
Bis(2-chloroethoxy)methane 10BRL
Bis(2-chloroethyl)ether 10BRL
Bis(2-chloroisopropyl)ether 10BRL
Bis(2-ethylhexyl)phthalate 10BRL
Butyl benzyl phthalate 10BRL
Caprolactam 10BRL
Carbazole 10BRL
Chrysene 10BRL
Di-n-butyl phthalate 10BRL
Di-n-octyl phthalate 10BRL
Dibenz(a,h)anthracene 10BRL
Dibenzofuran 10BRL
Diethyl phthalate 10BRL
Dimethyl phthalate 10BRL
Fluoranthene 10BRL
Fluorene 10BRL
Hexachlorobenzene 10BRL
Hexachlorobutadiene 10BRL
Hexachlorocyclopentadiene 10BRL
Qualifiers:
J Estimated value detected below Reporting Limit
BRL Below reporting limit H Holding times for preparation or analysis exceeded
N Analyte not NELAC certified
B Analyte detected in the associated method blank
E Estimated (value above quantitation range)
S Spike Recovery outside limits due to matrix
< Less than Result value> Greater than Result value
R RPD outside limits due to matrix
Rpt Lim Reporting LimitPage 16 of 24
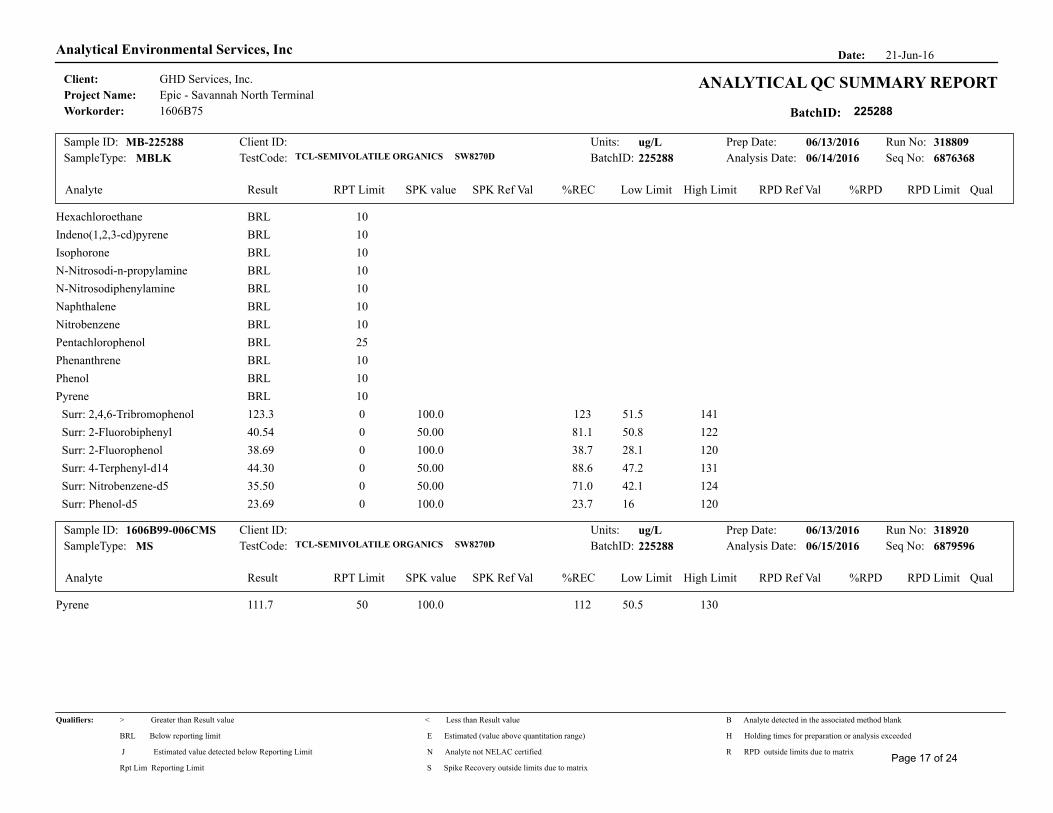
21-Jun-16Date:Analytical Environmental Services, Inc
Client:
BatchID:Workorder:
Project Name:ANALYTICAL QC SUMMARY REPORT
Epic - Savannah North Terminal
1606B75
GHD Services, Inc.
225288
RPT Limit QualAnalyte Result SPK value SPK Ref Val %REC Low Limit High Limit RPD Ref Val %RPD RPD Limit
SampleType: BatchID: Analysis Date: Seq No:TestCode: 225288MBLK 06/14/2016TCL-SEMIVOLATILE ORGANICS SW8270D
Units: Prep Date:Sample ID: Client ID: Run No:ug/L 06/13/2016 318809MB-225288
6876368
Hexachloroethane 10BRL
Indeno(1,2,3-cd)pyrene 10BRL
Isophorone 10BRL
N-Nitrosodi-n-propylamine 10BRL
N-Nitrosodiphenylamine 10BRL
Naphthalene 10BRL
Nitrobenzene 10BRL
Pentachlorophenol 25BRL
Phenanthrene 10BRL
Phenol 10BRL
Pyrene 10BRL
Surr: 2,4,6-Tribromophenol 0123.3 100.0 123 51.5 141
Surr: 2-Fluorobiphenyl 040.54 50.00 81.1 50.8 122
Surr: 2-Fluorophenol 038.69 100.0 38.7 28.1 120
Surr: 4-Terphenyl-d14 044.30 50.00 88.6 47.2 131
Surr: Nitrobenzene-d5 035.50 50.00 71.0 42.1 124
Surr: Phenol-d5 023.69 100.0 23.7 16 120
RPT Limit QualAnalyte Result SPK value SPK Ref Val %REC Low Limit High Limit RPD Ref Val %RPD RPD Limit
SampleType: BatchID: Analysis Date: Seq No:TestCode: 225288MS 06/15/2016TCL-SEMIVOLATILE ORGANICS SW8270D
Units: Prep Date:Sample ID: Client ID: Run No:ug/L 06/13/2016 3189201606B99-006CMS
6879596
Pyrene 50111.7 100.0 112 50.5 130
Qualifiers:
J Estimated value detected below Reporting Limit
BRL Below reporting limit H Holding times for preparation or analysis exceeded
N Analyte not NELAC certified
B Analyte detected in the associated method blank
E Estimated (value above quantitation range)
S Spike Recovery outside limits due to matrix
< Less than Result value> Greater than Result value
R RPD outside limits due to matrix
Rpt Lim Reporting LimitPage 17 of 24
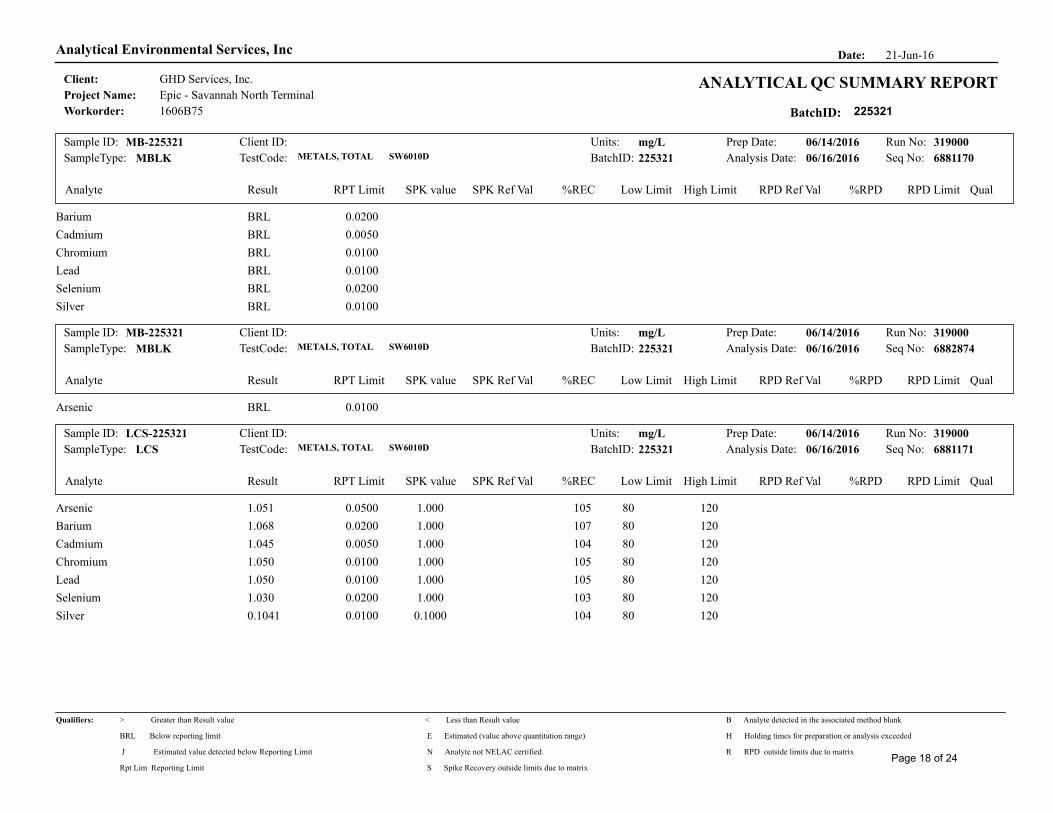
21-Jun-16Date:Analytical Environmental Services, Inc
Client:
BatchID:Workorder:
Project Name:ANALYTICAL QC SUMMARY REPORT
Epic - Savannah North Terminal
1606B75
GHD Services, Inc.
225321
RPT Limit QualAnalyte Result SPK value SPK Ref Val %REC Low Limit High Limit RPD Ref Val %RPD RPD Limit
SampleType: BatchID: Analysis Date: Seq No:TestCode: 225321MBLK 06/16/2016 METALS, TOTAL SW6010D
Units: Prep Date:Sample ID: Client ID: Run No:mg/L 06/14/2016 319000MB-225321
6881170
Barium 0.0200BRL
Cadmium 0.0050BRL
Chromium 0.0100BRL
Lead 0.0100BRL
Selenium 0.0200BRL
Silver 0.0100BRL
RPT Limit QualAnalyte Result SPK value SPK Ref Val %REC Low Limit High Limit RPD Ref Val %RPD RPD Limit
SampleType: BatchID: Analysis Date: Seq No:TestCode: 225321MBLK 06/16/2016 METALS, TOTAL SW6010D
Units: Prep Date:Sample ID: Client ID: Run No:mg/L 06/14/2016 319000MB-225321
6882874
Arsenic 0.0100BRL
RPT Limit QualAnalyte Result SPK value SPK Ref Val %REC Low Limit High Limit RPD Ref Val %RPD RPD Limit
SampleType: BatchID: Analysis Date: Seq No:TestCode: 225321LCS 06/16/2016 METALS, TOTAL SW6010D
Units: Prep Date:Sample ID: Client ID: Run No:mg/L 06/14/2016 319000LCS-225321
6881171
Arsenic 0.05001.051 1.000 105 80 120
Barium 0.02001.068 1.000 107 80 120
Cadmium 0.00501.045 1.000 104 80 120
Chromium 0.01001.050 1.000 105 80 120
Lead 0.01001.050 1.000 105 80 120
Selenium 0.02001.030 1.000 103 80 120
Silver 0.01000.1041 0.1000 104 80 120
Qualifiers:
J Estimated value detected below Reporting Limit
BRL Below reporting limit H Holding times for preparation or analysis exceeded
N Analyte not NELAC certified
B Analyte detected in the associated method blank
E Estimated (value above quantitation range)
S Spike Recovery outside limits due to matrix
< Less than Result value> Greater than Result value
R RPD outside limits due to matrix
Rpt Lim Reporting LimitPage 18 of 24
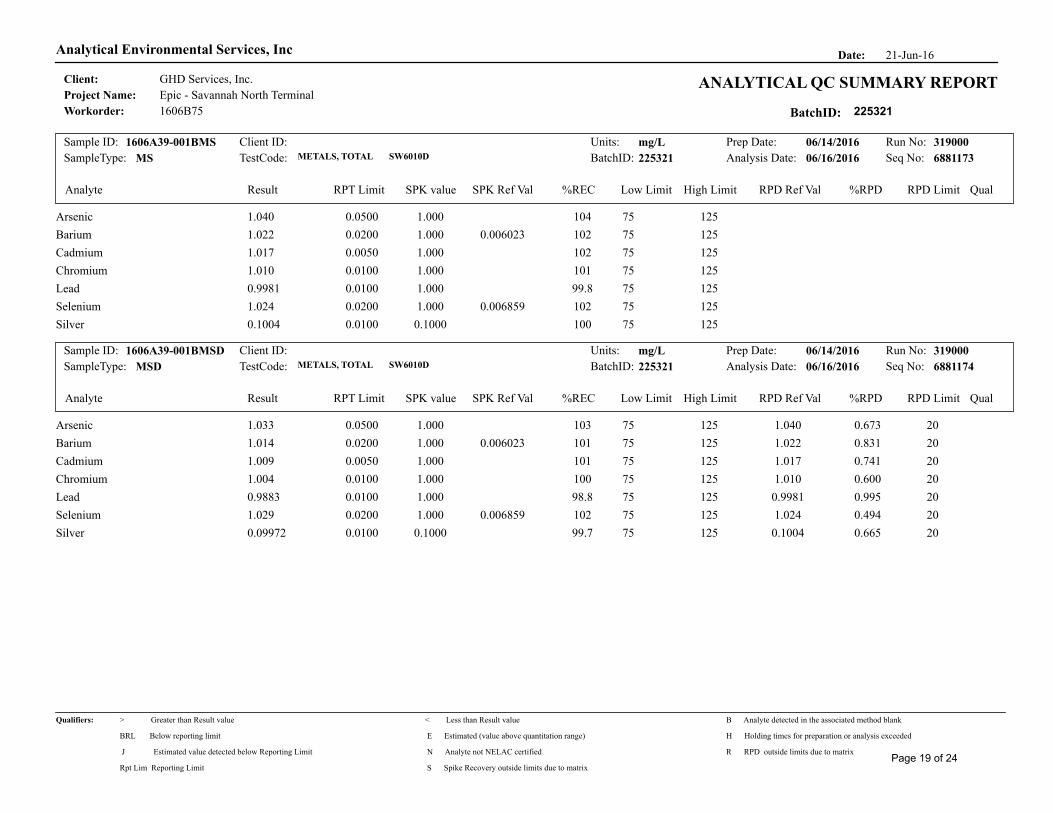
21-Jun-16Date:Analytical Environmental Services, Inc
Client:
BatchID:Workorder:
Project Name:ANALYTICAL QC SUMMARY REPORT
Epic - Savannah North Terminal
1606B75
GHD Services, Inc.
225321
RPT Limit QualAnalyte Result SPK value SPK Ref Val %REC Low Limit High Limit RPD Ref Val %RPD RPD Limit
SampleType: BatchID: Analysis Date: Seq No:TestCode: 225321MS 06/16/2016 METALS, TOTAL SW6010D
Units: Prep Date:Sample ID: Client ID: Run No:mg/L 06/14/2016 3190001606A39-001BMS
6881173
Arsenic 0.05001.040 1.000 104 75 125
Barium 0.02001.022 1.000 0.006023 102 75 125
Cadmium 0.00501.017 1.000 102 75 125
Chromium 0.01001.010 1.000 101 75 125
Lead 0.01000.9981 1.000 99.8 75 125
Selenium 0.02001.024 1.000 0.006859 102 75 125
Silver 0.01000.1004 0.1000 100 75 125
RPT Limit QualAnalyte Result SPK value SPK Ref Val %REC Low Limit High Limit RPD Ref Val %RPD RPD Limit
SampleType: BatchID: Analysis Date: Seq No:TestCode: 225321MSD 06/16/2016 METALS, TOTAL SW6010D
Units: Prep Date:Sample ID: Client ID: Run No:mg/L 06/14/2016 3190001606A39-001BMSD
6881174
Arsenic 0.05001.033 201.000 103 75 125 1.040 0.673
Barium 0.02001.014 201.000 0.006023 101 75 125 1.022 0.831
Cadmium 0.00501.009 201.000 101 75 125 1.017 0.741
Chromium 0.01001.004 201.000 100 75 125 1.010 0.600
Lead 0.01000.9883 201.000 98.8 75 125 0.9981 0.995
Selenium 0.02001.029 201.000 0.006859 102 75 125 1.024 0.494
Silver 0.01000.09972 200.1000 99.7 75 125 0.1004 0.665
Qualifiers:
J Estimated value detected below Reporting Limit
BRL Below reporting limit H Holding times for preparation or analysis exceeded
N Analyte not NELAC certified
B Analyte detected in the associated method blank
E Estimated (value above quantitation range)
S Spike Recovery outside limits due to matrix
< Less than Result value> Greater than Result value
R RPD outside limits due to matrix
Rpt Lim Reporting LimitPage 19 of 24
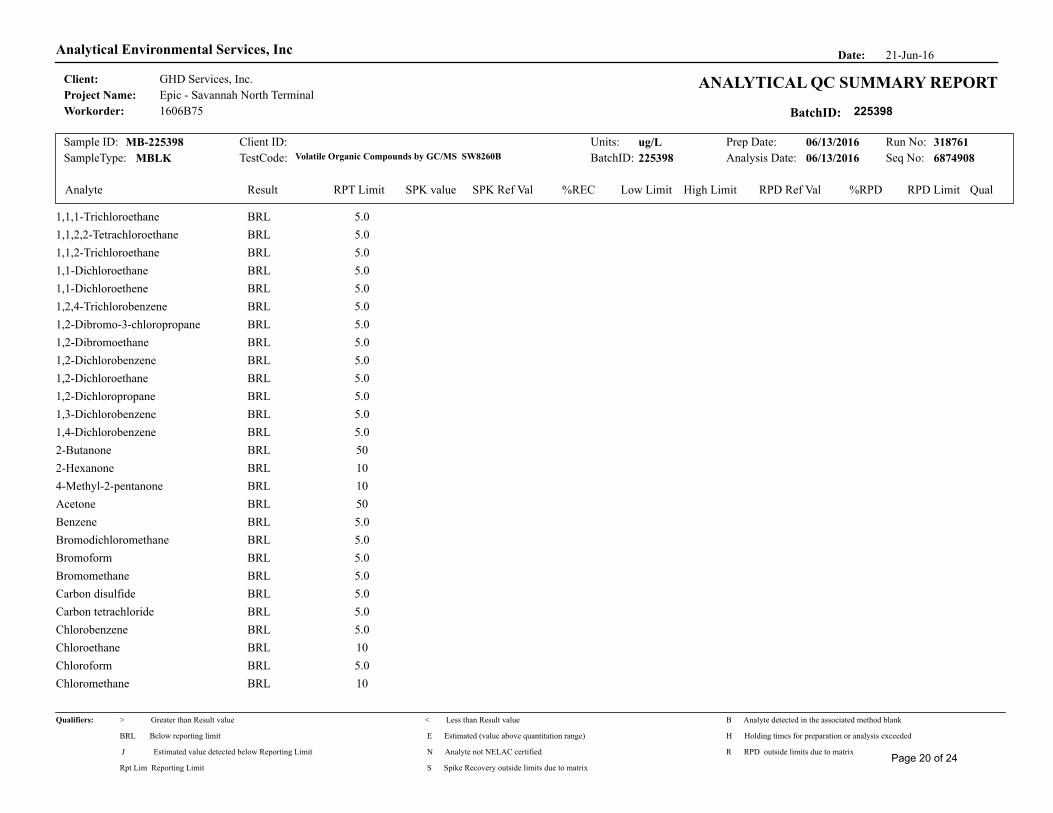
21-Jun-16Date:Analytical Environmental Services, Inc
Client:
BatchID:Workorder:
Project Name:ANALYTICAL QC SUMMARY REPORT
Epic - Savannah North Terminal
1606B75
GHD Services, Inc.
225398
RPT Limit QualAnalyte Result SPK value SPK Ref Val %REC Low Limit High Limit RPD Ref Val %RPD RPD Limit
SampleType: BatchID: Analysis Date: Seq No:TestCode: 225398MBLK 06/13/2016Volatile Organic Compounds by GC/MS SW8260B
Units: Prep Date:Sample ID: Client ID: Run No:ug/L 06/13/2016 318761MB-225398
6874908
1,1,1-Trichloroethane 5.0BRL
1,1,2,2-Tetrachloroethane 5.0BRL
1,1,2-Trichloroethane 5.0BRL
1,1-Dichloroethane 5.0BRL
1,1-Dichloroethene 5.0BRL
1,2,4-Trichlorobenzene 5.0BRL
1,2-Dibromo-3-chloropropane 5.0BRL
1,2-Dibromoethane 5.0BRL
1,2-Dichlorobenzene 5.0BRL
1,2-Dichloroethane 5.0BRL
1,2-Dichloropropane 5.0BRL
1,3-Dichlorobenzene 5.0BRL
1,4-Dichlorobenzene 5.0BRL
2-Butanone 50BRL
2-Hexanone 10BRL
4-Methyl-2-pentanone 10BRL
Acetone 50BRL
Benzene 5.0BRL
Bromodichloromethane 5.0BRL
Bromoform 5.0BRL
Bromomethane 5.0BRL
Carbon disulfide 5.0BRL
Carbon tetrachloride 5.0BRL
Chlorobenzene 5.0BRL
Chloroethane 10BRL
Chloroform 5.0BRL
Chloromethane 10BRL
Qualifiers:
J Estimated value detected below Reporting Limit
BRL Below reporting limit H Holding times for preparation or analysis exceeded
N Analyte not NELAC certified
B Analyte detected in the associated method blank
E Estimated (value above quantitation range)
S Spike Recovery outside limits due to matrix
< Less than Result value> Greater than Result value
R RPD outside limits due to matrix
Rpt Lim Reporting LimitPage 20 of 24
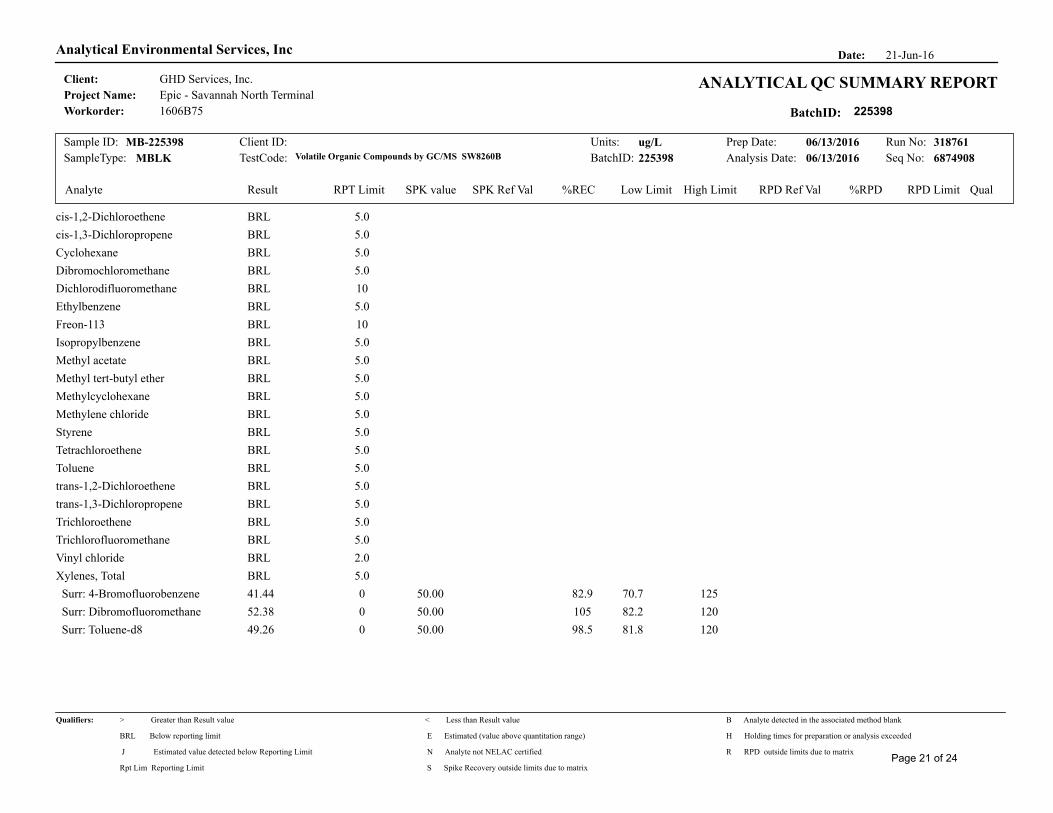
21-Jun-16Date:Analytical Environmental Services, Inc
Client:
BatchID:Workorder:
Project Name:ANALYTICAL QC SUMMARY REPORT
Epic - Savannah North Terminal
1606B75
GHD Services, Inc.
225398
RPT Limit QualAnalyte Result SPK value SPK Ref Val %REC Low Limit High Limit RPD Ref Val %RPD RPD Limit
SampleType: BatchID: Analysis Date: Seq No:TestCode: 225398MBLK 06/13/2016Volatile Organic Compounds by GC/MS SW8260B
Units: Prep Date:Sample ID: Client ID: Run No:ug/L 06/13/2016 318761MB-225398
6874908
cis-1,2-Dichloroethene 5.0BRL
cis-1,3-Dichloropropene 5.0BRL
Cyclohexane 5.0BRL
Dibromochloromethane 5.0BRL
Dichlorodifluoromethane 10BRL
Ethylbenzene 5.0BRL
Freon-113 10BRL
Isopropylbenzene 5.0BRL
Methyl acetate 5.0BRL
Methyl tert-butyl ether 5.0BRL
Methylcyclohexane 5.0BRL
Methylene chloride 5.0BRL
Styrene 5.0BRL
Tetrachloroethene 5.0BRL
Toluene 5.0BRL
trans-1,2-Dichloroethene 5.0BRL
trans-1,3-Dichloropropene 5.0BRL
Trichloroethene 5.0BRL
Trichlorofluoromethane 5.0BRL
Vinyl chloride 2.0BRL
Xylenes, Total 5.0BRL
Surr: 4-Bromofluorobenzene 041.44 50.00 82.9 70.7 125
Surr: Dibromofluoromethane 052.38 50.00 105 82.2 120
Surr: Toluene-d8 049.26 50.00 98.5 81.8 120
Qualifiers:
J Estimated value detected below Reporting Limit
BRL Below reporting limit H Holding times for preparation or analysis exceeded
N Analyte not NELAC certified
B Analyte detected in the associated method blank
E Estimated (value above quantitation range)
S Spike Recovery outside limits due to matrix
< Less than Result value> Greater than Result value
R RPD outside limits due to matrix
Rpt Lim Reporting LimitPage 21 of 24
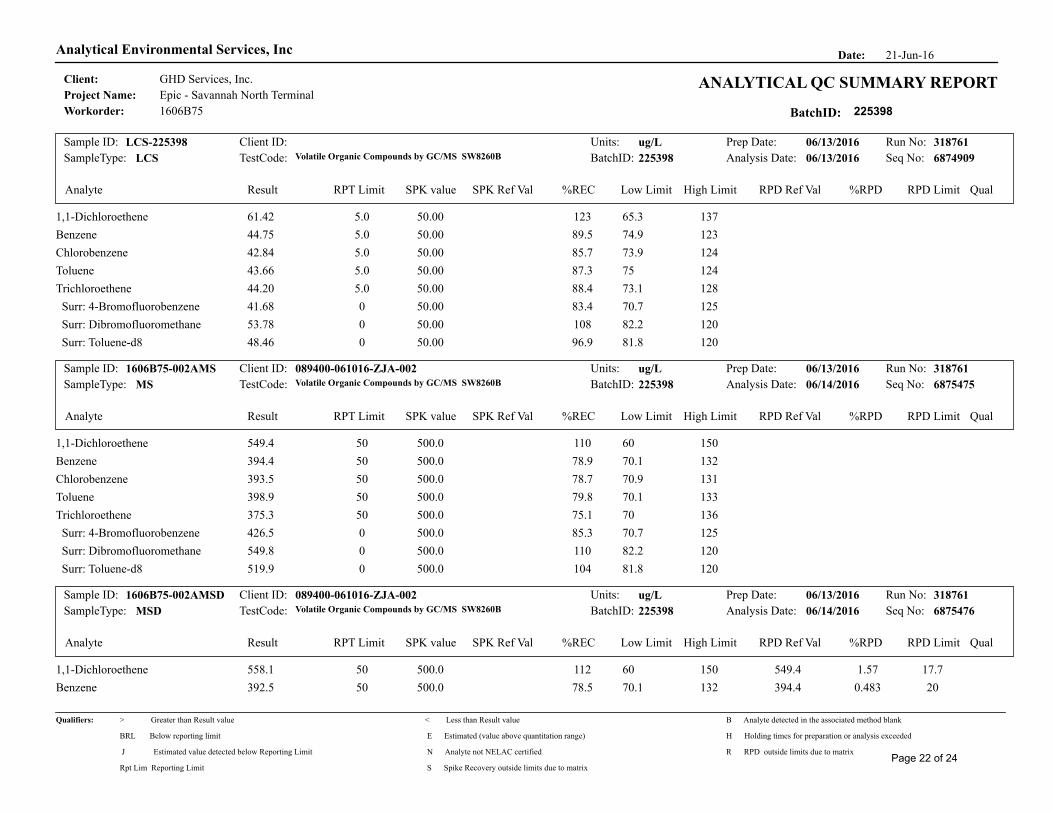
21-Jun-16Date:Analytical Environmental Services, Inc
Client:
BatchID:Workorder:
Project Name:ANALYTICAL QC SUMMARY REPORT
Epic - Savannah North Terminal
1606B75
GHD Services, Inc.
225398
RPT Limit QualAnalyte Result SPK value SPK Ref Val %REC Low Limit High Limit RPD Ref Val %RPD RPD Limit
SampleType: BatchID: Analysis Date: Seq No:TestCode: 225398LCS 06/13/2016Volatile Organic Compounds by GC/MS SW8260B
Units: Prep Date:Sample ID: Client ID: Run No:ug/L 06/13/2016 318761LCS-225398
6874909
1,1-Dichloroethene 5.061.42 50.00 123 65.3 137
Benzene 5.044.75 50.00 89.5 74.9 123
Chlorobenzene 5.042.84 50.00 85.7 73.9 124
Toluene 5.043.66 50.00 87.3 75 124
Trichloroethene 5.044.20 50.00 88.4 73.1 128
Surr: 4-Bromofluorobenzene 041.68 50.00 83.4 70.7 125
Surr: Dibromofluoromethane 053.78 50.00 108 82.2 120
Surr: Toluene-d8 048.46 50.00 96.9 81.8 120
RPT Limit QualAnalyte Result SPK value SPK Ref Val %REC Low Limit High Limit RPD Ref Val %RPD RPD Limit
SampleType: BatchID: Analysis Date: Seq No:TestCode: 225398MS 06/14/2016Volatile Organic Compounds by GC/MS SW8260B
089400-061016-ZJA-002 Units: Prep Date:Sample ID: Client ID: Run No:ug/L 06/13/2016 3187611606B75-002AMS
6875475
1,1-Dichloroethene 50549.4 500.0 110 60 150
Benzene 50394.4 500.0 78.9 70.1 132
Chlorobenzene 50393.5 500.0 78.7 70.9 131
Toluene 50398.9 500.0 79.8 70.1 133
Trichloroethene 50375.3 500.0 75.1 70 136
Surr: 4-Bromofluorobenzene 0426.5 500.0 85.3 70.7 125
Surr: Dibromofluoromethane 0549.8 500.0 110 82.2 120
Surr: Toluene-d8 0519.9 500.0 104 81.8 120
RPT Limit QualAnalyte Result SPK value SPK Ref Val %REC Low Limit High Limit RPD Ref Val %RPD RPD Limit
SampleType: BatchID: Analysis Date: Seq No:TestCode: 225398MSD 06/14/2016Volatile Organic Compounds by GC/MS SW8260B
089400-061016-ZJA-002 Units: Prep Date:Sample ID: Client ID: Run No:ug/L 06/13/2016 3187611606B75-002AMSD
6875476
1,1-Dichloroethene 50558.1 17.7500.0 112 60 150 549.4 1.57
Benzene 50392.5 20500.0 78.5 70.1 132 394.4 0.483
Qualifiers:
J Estimated value detected below Reporting Limit
BRL Below reporting limit H Holding times for preparation or analysis exceeded
N Analyte not NELAC certified
B Analyte detected in the associated method blank
E Estimated (value above quantitation range)
S Spike Recovery outside limits due to matrix
< Less than Result value> Greater than Result value
R RPD outside limits due to matrix
Rpt Lim Reporting LimitPage 22 of 24
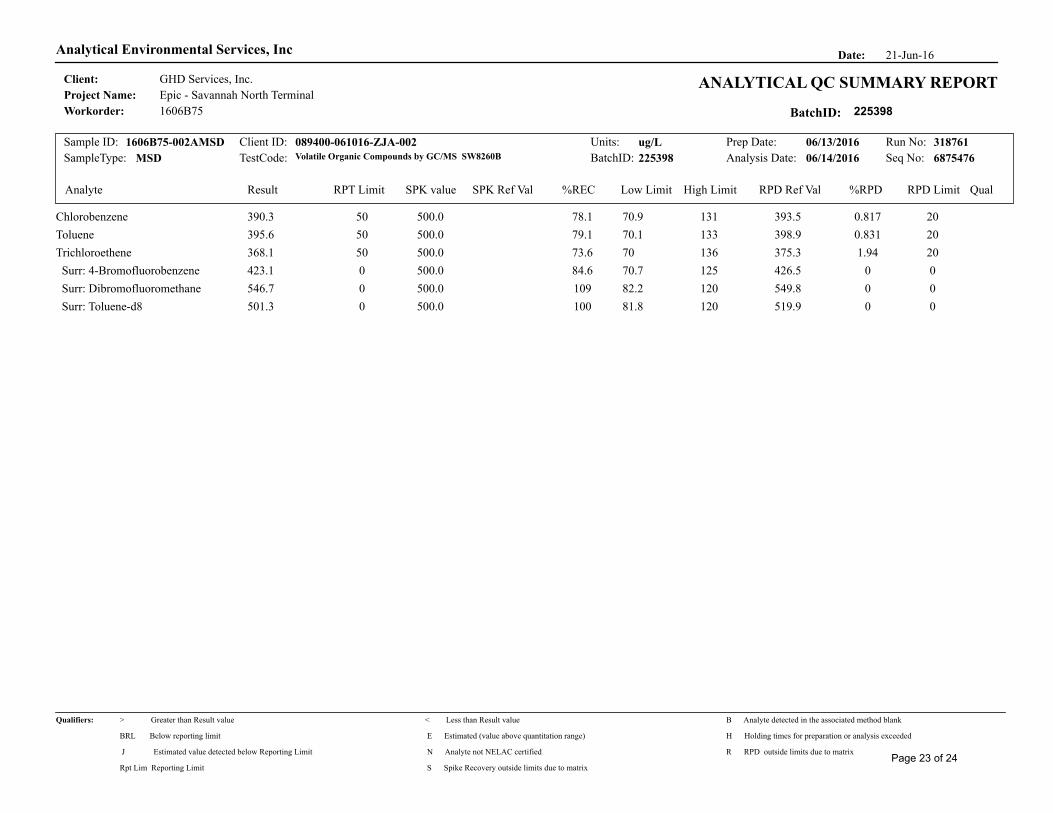
21-Jun-16Date:Analytical Environmental Services, Inc
Client:
BatchID:Workorder:
Project Name:ANALYTICAL QC SUMMARY REPORT
Epic - Savannah North Terminal
1606B75
GHD Services, Inc.
225398
RPT Limit QualAnalyte Result SPK value SPK Ref Val %REC Low Limit High Limit RPD Ref Val %RPD RPD Limit
SampleType: BatchID: Analysis Date: Seq No:TestCode: 225398MSD 06/14/2016Volatile Organic Compounds by GC/MS SW8260B
089400-061016-ZJA-002 Units: Prep Date:Sample ID: Client ID: Run No:ug/L 06/13/2016 3187611606B75-002AMSD
6875476
Chlorobenzene 50390.3 20500.0 78.1 70.9 131 393.5 0.817
Toluene 50395.6 20500.0 79.1 70.1 133 398.9 0.831
Trichloroethene 50368.1 20500.0 73.6 70 136 375.3 1.94
Surr: 4-Bromofluorobenzene 0423.1 0500.0 84.6 70.7 125 426.5 0
Surr: Dibromofluoromethane 0546.7 0500.0 109 82.2 120 549.8 0
Surr: Toluene-d8 0501.3 0500.0 100 81.8 120 519.9 0
Qualifiers:
J Estimated value detected below Reporting Limit
BRL Below reporting limit H Holding times for preparation or analysis exceeded
N Analyte not NELAC certified
B Analyte detected in the associated method blank
E Estimated (value above quantitation range)
S Spike Recovery outside limits due to matrix
< Less than Result value> Greater than Result value
R RPD outside limits due to matrix
Rpt Lim Reporting LimitPage 23 of 24
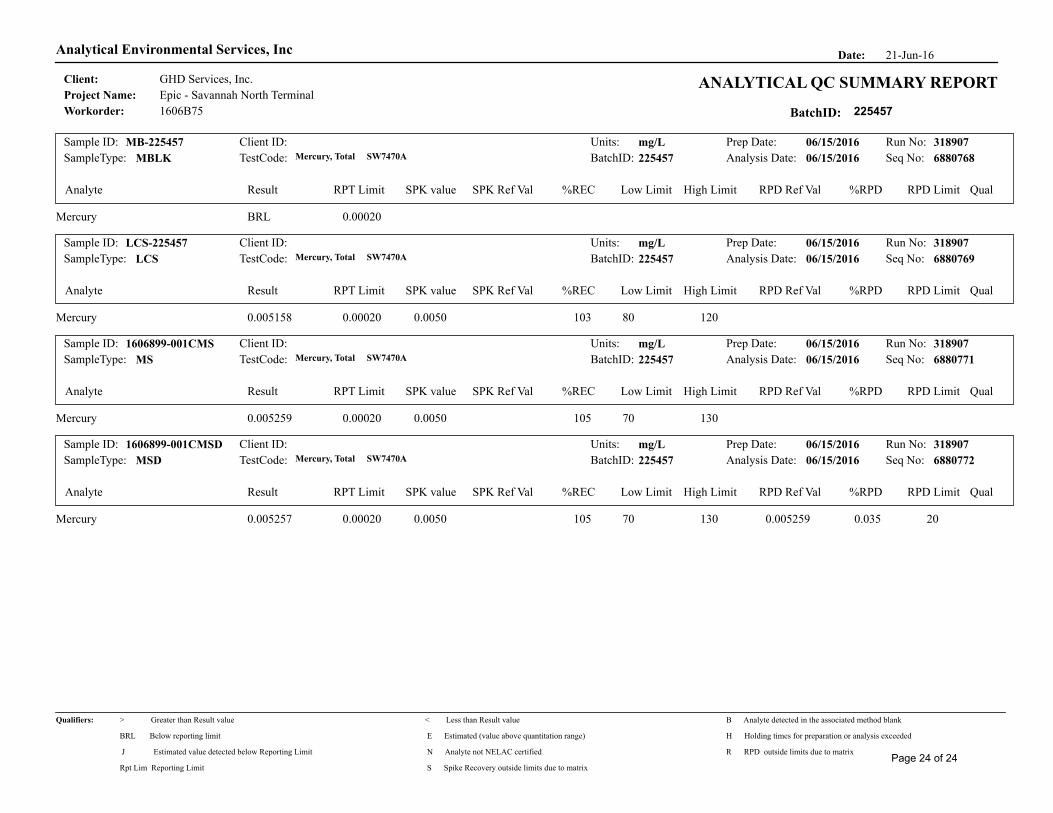
21-Jun-16Date:Analytical Environmental Services, Inc
Client:
BatchID:Workorder:
Project Name:ANALYTICAL QC SUMMARY REPORT
Epic - Savannah North Terminal
1606B75
GHD Services, Inc.
225457
RPT Limit QualAnalyte Result SPK value SPK Ref Val %REC Low Limit High Limit RPD Ref Val %RPD RPD Limit
SampleType: BatchID: Analysis Date: Seq No:TestCode: 225457MBLK 06/15/2016Mercury, Total SW7470A
Units: Prep Date:Sample ID: Client ID: Run No:mg/L 06/15/2016 318907MB-225457
6880768
Mercury 0.00020BRL
RPT Limit QualAnalyte Result SPK value SPK Ref Val %REC Low Limit High Limit RPD Ref Val %RPD RPD Limit
SampleType: BatchID: Analysis Date: Seq No:TestCode: 225457LCS 06/15/2016Mercury, Total SW7470A
Units: Prep Date:Sample ID: Client ID: Run No:mg/L 06/15/2016 318907LCS-225457
6880769
Mercury 0.000200.005158 0.0050 103 80 120
RPT Limit QualAnalyte Result SPK value SPK Ref Val %REC Low Limit High Limit RPD Ref Val %RPD RPD Limit
SampleType: BatchID: Analysis Date: Seq No:TestCode: 225457MS 06/15/2016Mercury, Total SW7470A
Units: Prep Date:Sample ID: Client ID: Run No:mg/L 06/15/2016 3189071606899-001CMS
6880771
Mercury 0.000200.005259 0.0050 105 70 130
RPT Limit QualAnalyte Result SPK value SPK Ref Val %REC Low Limit High Limit RPD Ref Val %RPD RPD Limit
SampleType: BatchID: Analysis Date: Seq No:TestCode: 225457MSD 06/15/2016Mercury, Total SW7470A
Units: Prep Date:Sample ID: Client ID: Run No:mg/L 06/15/2016 3189071606899-001CMSD
6880772
Mercury 0.000200.005257 200.0050 105 70 130 0.005259 0.035
Qualifiers:
J Estimated value detected below Reporting Limit
BRL Below reporting limit H Holding times for preparation or analysis exceeded
N Analyte not NELAC certified
B Analyte detected in the associated method blank
E Estimated (value above quantitation range)
S Spike Recovery outside limits due to matrix
< Less than Result value> Greater than Result value
R RPD outside limits due to matrix
Rpt Lim Reporting LimitPage 24 of 24
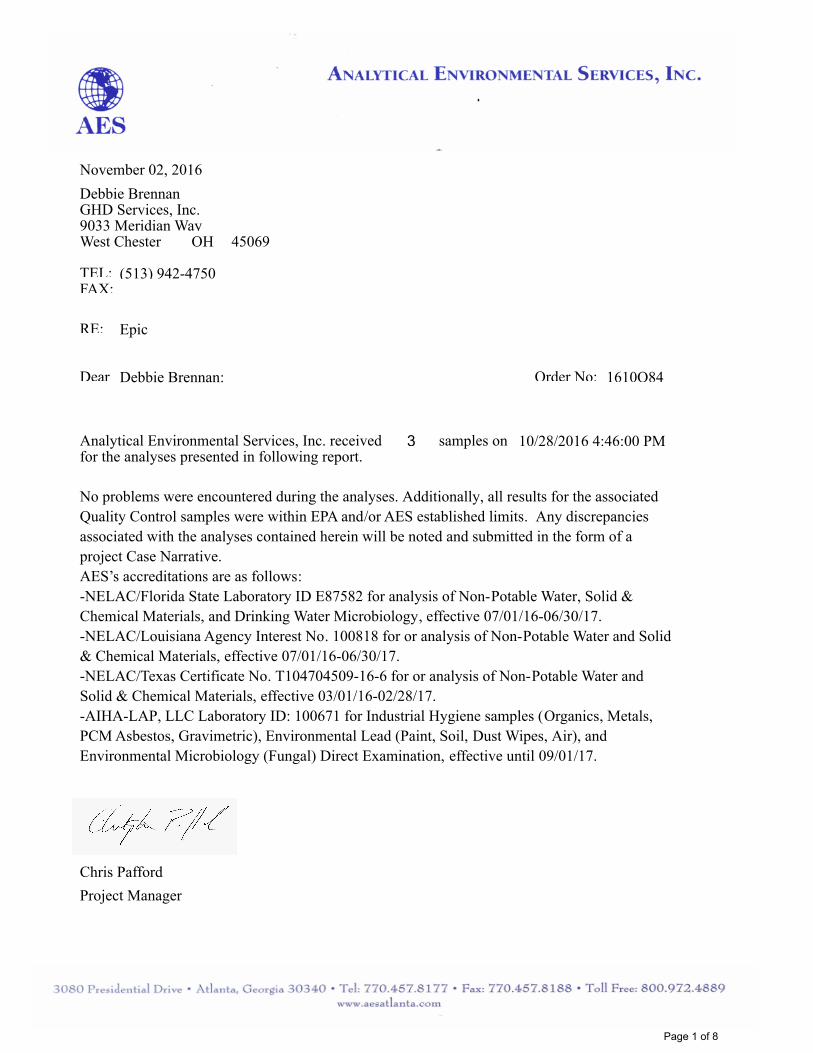
November 02, 2016
Dear Order No:
RE:
Analytical Environmental Services, Inc. received samples on for the analyses presented in following report.
FAX:TEL:
3
No problems were encountered during the analyses. Additionally, all results for the associated
Quality Control samples were within EPA and/or AES established limits. Any discrepancies
associated with the analyses contained herein will be noted and submitted in the form of a
project Case Narrative.
AES’s accreditations are as follows:
-NELAC/Florida State Laboratory ID E87582 for analysis of Non-Potable Water, Solid &
Chemical Materials, and Drinking Water Microbiology, effective 07/01/16-06/30/17.
-NELAC/Louisiana Agency Interest No. 100818 for or analysis of Non-Potable Water and Solid
& Chemical Materials, effective 07/01/16-06/30/17.
-NELAC/Texas Certificate No. T104704509-16-6 for or analysis of Non-Potable Water and
Solid & Chemical Materials, effective 03/01/16-02/28/17.
-AIHA-LAP, LLC Laboratory ID: 100671 for Industrial Hygiene samples (Organics, Metals,
PCM Asbestos, Gravimetric), Environmental Lead (Paint, Soil, Dust Wipes, Air), and
Environmental Microbiology (Fungal) Direct Examination, effective until 09/01/17.
(513) 942-4750
Project Manager
1610O84
Debbie BrennanGHD Services, Inc.9033 Meridian WayWest Chester OH 45069
Epic
Chris Pafford
10/28/2016 4:46:00 PM
Debbie Brennan:
Page 1 of 8
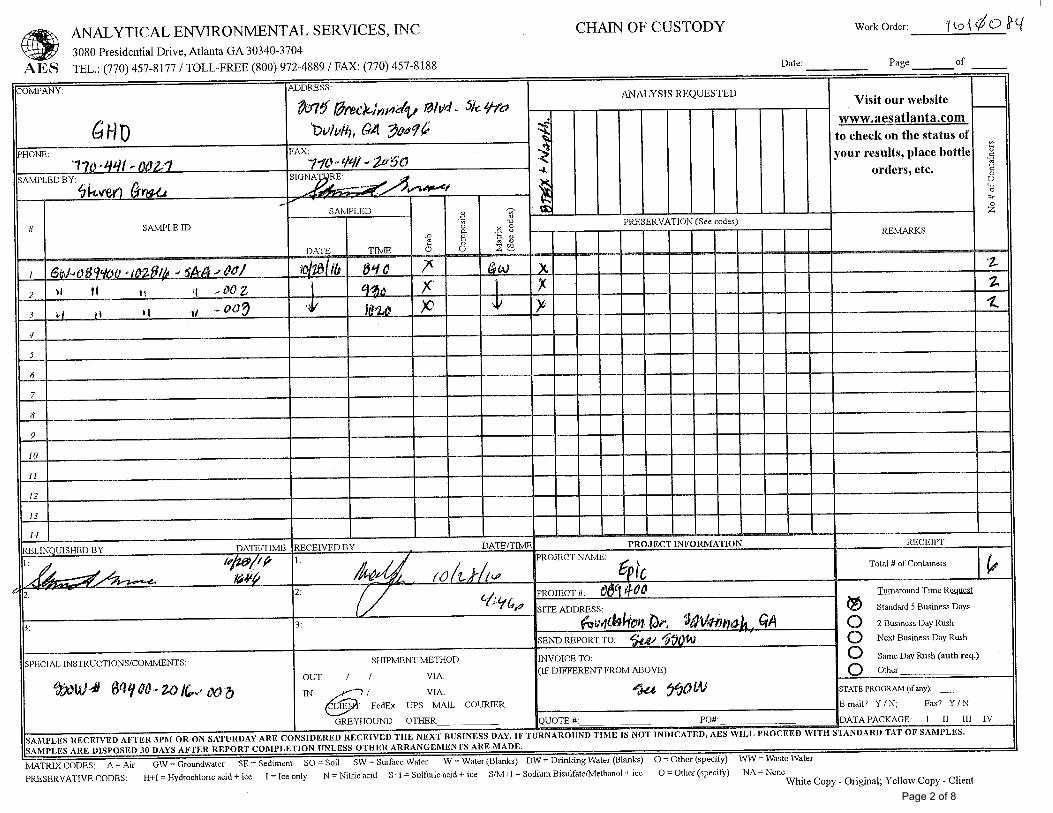
Page 2 of 8
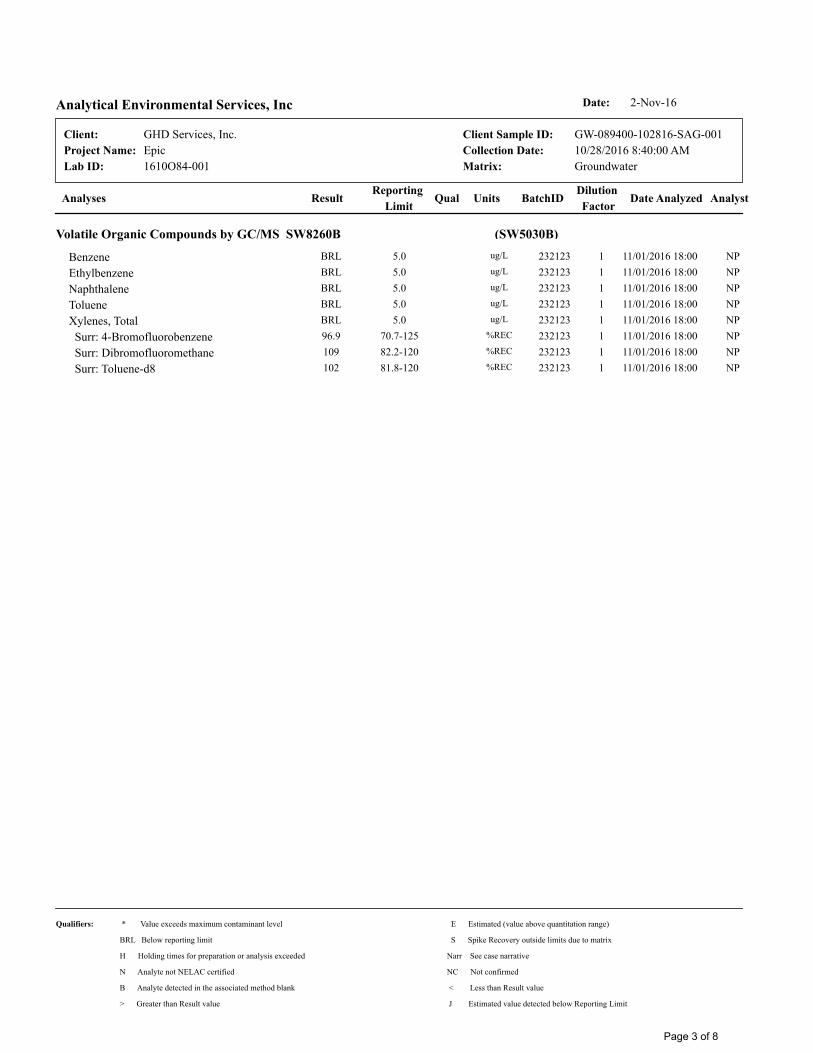
1610O84-001
2-Nov-16Date:Analytical Environmental Services, Inc
Analyses Date AnalyzedDilution
FactorBatchIDUnitsQual
Reporting
LimitResult
Client:
Groundwater
10/28/2016 8:40:00 AM
GW-089400-102816-SAG-001
Matrix:
Collection Date:
Client Sample ID:
Epic
GHD Services, Inc.
Lab ID:
Project Name:
Analyst
(SW5030B)Volatile Organic Compounds by GC/MS SW8260B
Benzene BRL 5.0 ug/L 232123 1 11/01/2016 18:00 NP
Ethylbenzene BRL 5.0 ug/L 232123 1 11/01/2016 18:00 NP
Naphthalene BRL 5.0 ug/L 232123 1 11/01/2016 18:00 NP
Toluene BRL 5.0 ug/L 232123 1 11/01/2016 18:00 NP
Xylenes, Total BRL 5.0 ug/L 232123 1 11/01/2016 18:00 NP
Surr: 4-Bromofluorobenzene 96.9 70.7-125 %REC 232123 1 11/01/2016 18:00 NP
Surr: Dibromofluoromethane 109 82.2-120 %REC 232123 1 11/01/2016 18:00 NP
Surr: Toluene-d8 102 81.8-120 %REC 232123 1 11/01/2016 18:00 NP
Qualifiers: * Value exceeds maximum contaminant level
BRL Below reporting limit
H Holding times for preparation or analysis exceeded
N Analyte not NELAC certified
B Analyte detected in the associated method blank
E Estimated (value above quantitation range)
S Spike Recovery outside limits due to matrix
Narr See case narrative
NC Not confirmed
< Less than Result value
> Greater than Result value J Estimated value detected below Reporting Limit
Page 3 of 8

1610O84-002
2-Nov-16Date:Analytical Environmental Services, Inc
Analyses Date AnalyzedDilution
FactorBatchIDUnitsQual
Reporting
LimitResult
Client:
Groundwater
10/28/2016 9:30:00 AM
GW-089400-102816-SAG-002
Matrix:
Collection Date:
Client Sample ID:
Epic
GHD Services, Inc.
Lab ID:
Project Name:
Analyst
(SW5030B)Volatile Organic Compounds by GC/MS SW8260B
Benzene BRL 5.0 ug/L 232123 1 11/01/2016 18:23 NP
Ethylbenzene BRL 5.0 ug/L 232123 1 11/01/2016 18:23 NP
Naphthalene BRL 5.0 ug/L 232123 1 11/01/2016 18:23 NP
Toluene BRL 5.0 ug/L 232123 1 11/01/2016 18:23 NP
Xylenes, Total BRL 5.0 ug/L 232123 1 11/01/2016 18:23 NP
Surr: 4-Bromofluorobenzene 96.2 70.7-125 %REC 232123 1 11/01/2016 18:23 NP
Surr: Dibromofluoromethane 107 82.2-120 %REC 232123 1 11/01/2016 18:23 NP
Surr: Toluene-d8 103 81.8-120 %REC 232123 1 11/01/2016 18:23 NP
Qualifiers: * Value exceeds maximum contaminant level
BRL Below reporting limit
H Holding times for preparation or analysis exceeded
N Analyte not NELAC certified
B Analyte detected in the associated method blank
E Estimated (value above quantitation range)
S Spike Recovery outside limits due to matrix
Narr See case narrative
NC Not confirmed
< Less than Result value
> Greater than Result value J Estimated value detected below Reporting Limit
Page 4 of 8
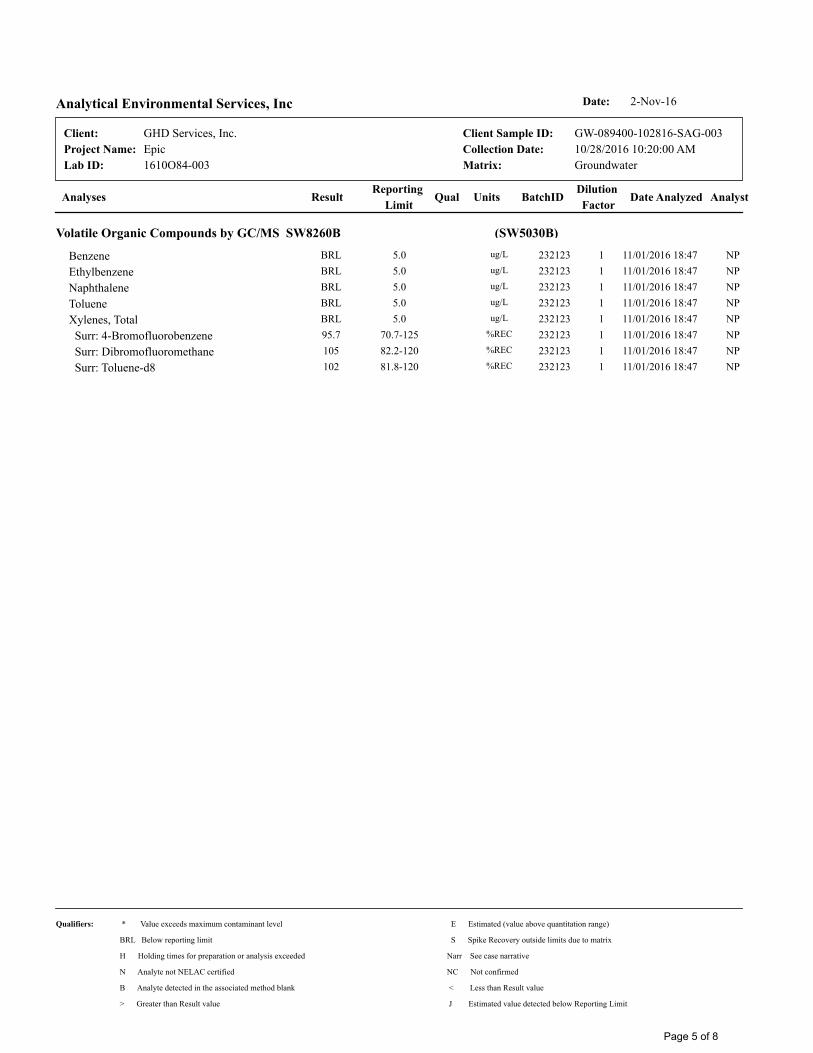
1610O84-003
2-Nov-16Date:Analytical Environmental Services, Inc
Analyses Date AnalyzedDilution
FactorBatchIDUnitsQual
Reporting
LimitResult
Client:
Groundwater
10/28/2016 10:20:00 AM
GW-089400-102816-SAG-003
Matrix:
Collection Date:
Client Sample ID:
Epic
GHD Services, Inc.
Lab ID:
Project Name:
Analyst
(SW5030B)Volatile Organic Compounds by GC/MS SW8260B
Benzene BRL 5.0 ug/L 232123 1 11/01/2016 18:47 NP
Ethylbenzene BRL 5.0 ug/L 232123 1 11/01/2016 18:47 NP
Naphthalene BRL 5.0 ug/L 232123 1 11/01/2016 18:47 NP
Toluene BRL 5.0 ug/L 232123 1 11/01/2016 18:47 NP
Xylenes, Total BRL 5.0 ug/L 232123 1 11/01/2016 18:47 NP
Surr: 4-Bromofluorobenzene 95.7 70.7-125 %REC 232123 1 11/01/2016 18:47 NP
Surr: Dibromofluoromethane 105 82.2-120 %REC 232123 1 11/01/2016 18:47 NP
Surr: Toluene-d8 102 81.8-120 %REC 232123 1 11/01/2016 18:47 NP
Qualifiers: * Value exceeds maximum contaminant level
BRL Below reporting limit
H Holding times for preparation or analysis exceeded
N Analyte not NELAC certified
B Analyte detected in the associated method blank
E Estimated (value above quantitation range)
S Spike Recovery outside limits due to matrix
Narr See case narrative
NC Not confirmed
< Less than Result value
> Greater than Result value J Estimated value detected below Reporting Limit
Page 5 of 8
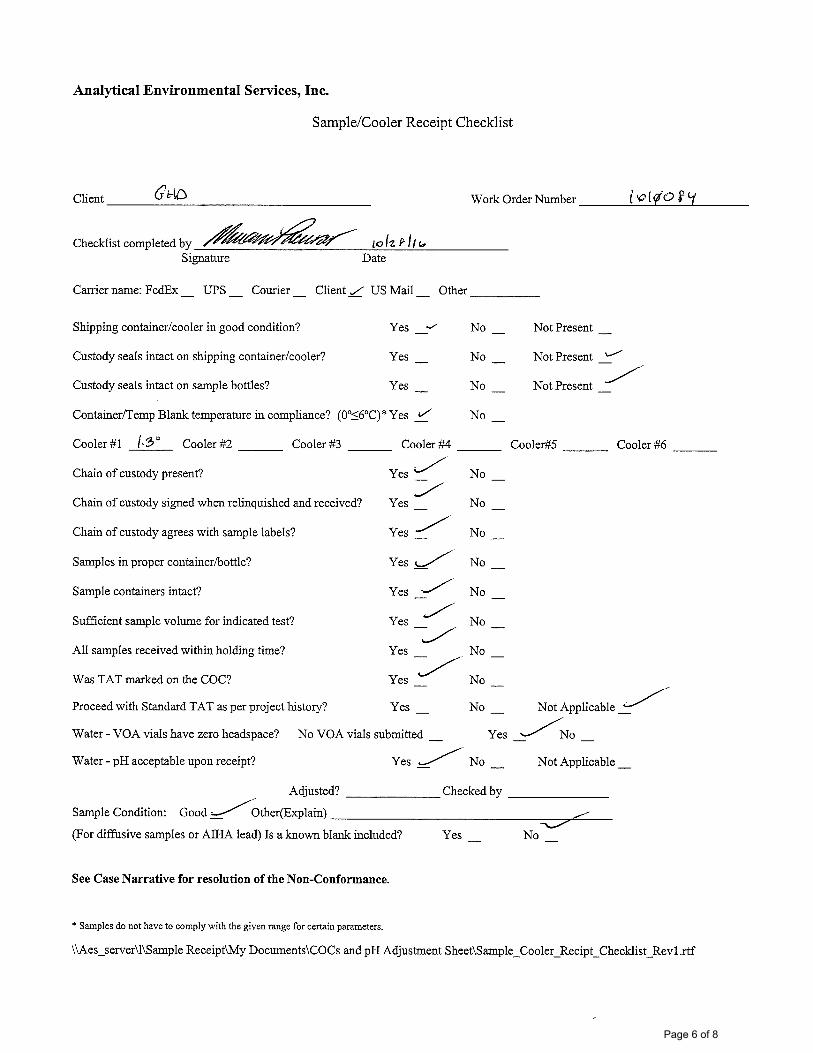
Page 6 of 8
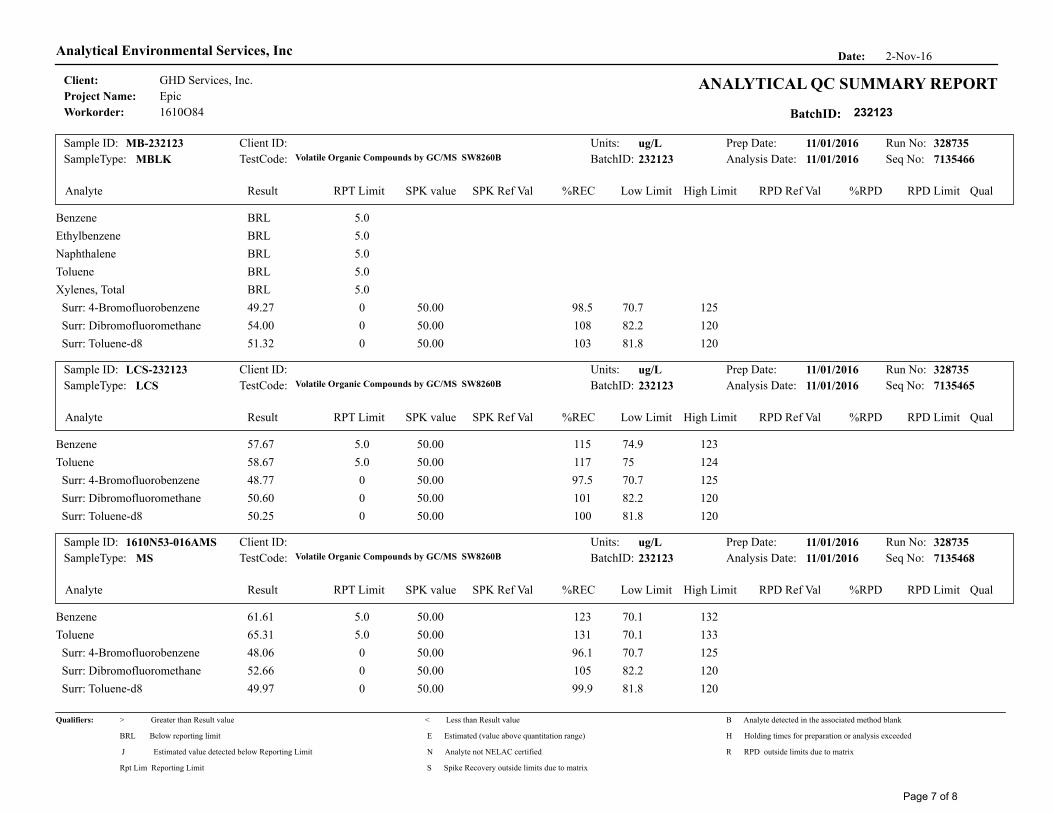
2-Nov-16Date:Analytical Environmental Services, Inc
Client:
BatchID:Workorder:
Project Name:ANALYTICAL QC SUMMARY REPORT
Epic
1610O84
GHD Services, Inc.
232123
RPT Limit QualAnalyte Result SPK value SPK Ref Val %REC Low Limit High Limit RPD Ref Val %RPD RPD Limit
SampleType: BatchID: Analysis Date: Seq No:TestCode: 232123MBLK 11/01/2016Volatile Organic Compounds by GC/MS SW8260B
Units: Prep Date:Sample ID: Client ID: Run No:ug/L 11/01/2016 328735MB-232123
7135466
Benzene 5.0BRL
Ethylbenzene 5.0BRL
Naphthalene 5.0BRL
Toluene 5.0BRL
Xylenes, Total 5.0BRL
Surr: 4-Bromofluorobenzene 049.27 50.00 98.5 70.7 125
Surr: Dibromofluoromethane 054.00 50.00 108 82.2 120
Surr: Toluene-d8 051.32 50.00 103 81.8 120
RPT Limit QualAnalyte Result SPK value SPK Ref Val %REC Low Limit High Limit RPD Ref Val %RPD RPD Limit
SampleType: BatchID: Analysis Date: Seq No:TestCode: 232123LCS 11/01/2016Volatile Organic Compounds by GC/MS SW8260B
Units: Prep Date:Sample ID: Client ID: Run No:ug/L 11/01/2016 328735LCS-232123
7135465
Benzene 5.057.67 50.00 115 74.9 123
Toluene 5.058.67 50.00 117 75 124
Surr: 4-Bromofluorobenzene 048.77 50.00 97.5 70.7 125
Surr: Dibromofluoromethane 050.60 50.00 101 82.2 120
Surr: Toluene-d8 050.25 50.00 100 81.8 120
RPT Limit QualAnalyte Result SPK value SPK Ref Val %REC Low Limit High Limit RPD Ref Val %RPD RPD Limit
SampleType: BatchID: Analysis Date: Seq No:TestCode: 232123MS 11/01/2016Volatile Organic Compounds by GC/MS SW8260B
Units: Prep Date:Sample ID: Client ID: Run No:ug/L 11/01/2016 3287351610N53-016AMS
7135468
Benzene 5.061.61 50.00 123 70.1 132
Toluene 5.065.31 50.00 131 70.1 133
Surr: 4-Bromofluorobenzene 048.06 50.00 96.1 70.7 125
Surr: Dibromofluoromethane 052.66 50.00 105 82.2 120
Surr: Toluene-d8 049.97 50.00 99.9 81.8 120
Qualifiers:
J Estimated value detected below Reporting Limit
BRL Below reporting limit H Holding times for preparation or analysis exceeded
N Analyte not NELAC certified
B Analyte detected in the associated method blank
E Estimated (value above quantitation range)
S Spike Recovery outside limits due to matrix
< Less than Result value> Greater than Result value
R RPD outside limits due to matrix
Rpt Lim Reporting Limit
Page 7 of 8
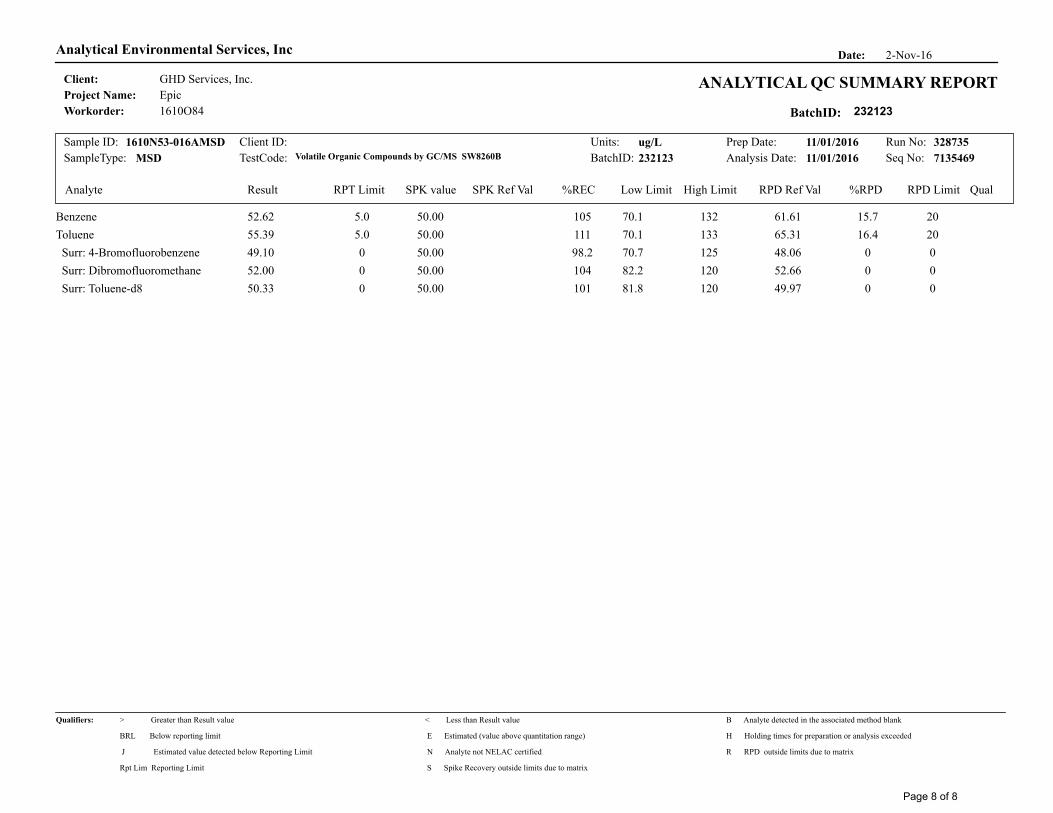
2-Nov-16Date:Analytical Environmental Services, Inc
Client:
BatchID:Workorder:
Project Name:ANALYTICAL QC SUMMARY REPORT
Epic
1610O84
GHD Services, Inc.
232123
RPT Limit QualAnalyte Result SPK value SPK Ref Val %REC Low Limit High Limit RPD Ref Val %RPD RPD Limit
SampleType: BatchID: Analysis Date: Seq No:TestCode: 232123MSD 11/01/2016Volatile Organic Compounds by GC/MS SW8260B
Units: Prep Date:Sample ID: Client ID: Run No:ug/L 11/01/2016 3287351610N53-016AMSD
7135469
Benzene 5.052.62 2050.00 105 70.1 132 61.61 15.7
Toluene 5.055.39 2050.00 111 70.1 133 65.31 16.4
Surr: 4-Bromofluorobenzene 049.10 050.00 98.2 70.7 125 48.06 0
Surr: Dibromofluoromethane 052.00 050.00 104 82.2 120 52.66 0
Surr: Toluene-d8 050.33 050.00 101 81.8 120 49.97 0
Qualifiers:
J Estimated value detected below Reporting Limit
BRL Below reporting limit H Holding times for preparation or analysis exceeded
N Analyte not NELAC certified
B Analyte detected in the associated method blank
E Estimated (value above quantitation range)
S Spike Recovery outside limits due to matrix
< Less than Result value> Greater than Result value
R RPD outside limits due to matrix
Rpt Lim Reporting Limit
Page 8 of 8
GHD | Epic Midstream, LLC – 2016 2nd Semi-Annual Progress Report | 089400 (3)
Appendix C LNAPL Transmissivity
Evaluation Supporting Information
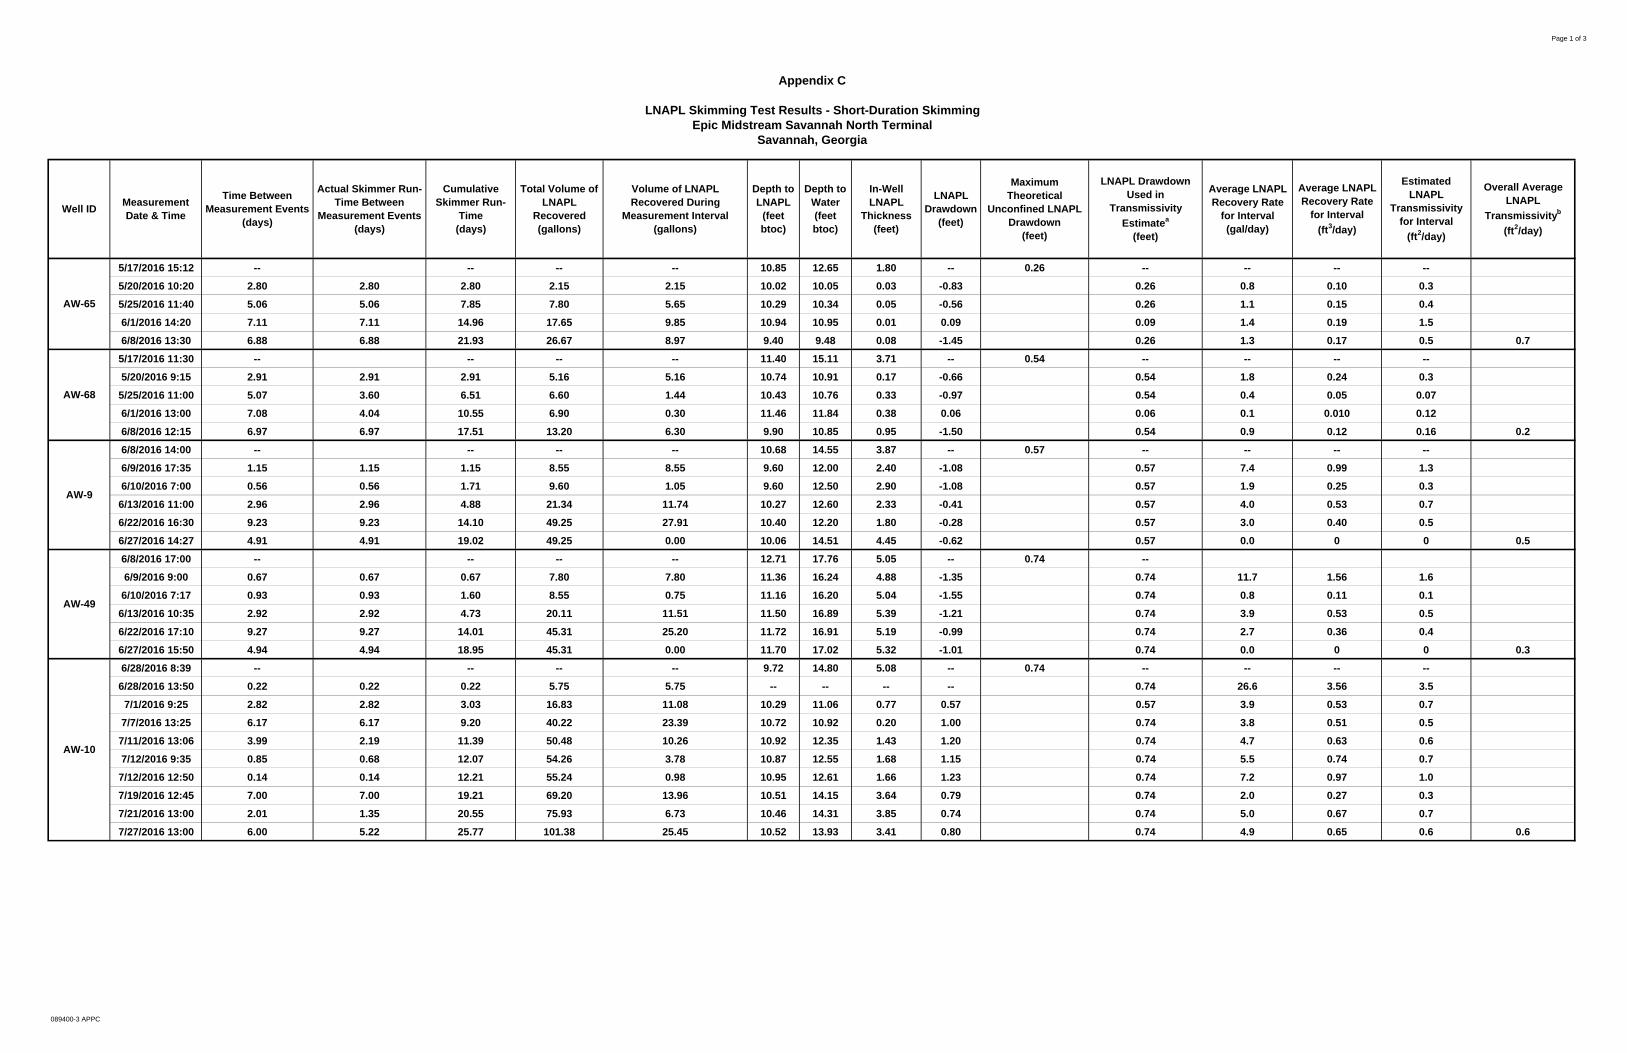
Page 1 of 3
5/17/2016 15:12 -- -- -- -- 10.85 12.65 1.80 -- 0.26 -- -- -- --
5/20/2016 10:20 2.80 2.80 2.80 2.15 2.15 10.02 10.05 0.03 -0.83 0.26 0.8 0.10 0.3
5/25/2016 11:40 5.06 5.06 7.85 7.80 5.65 10.29 10.34 0.05 -0.56 0.26 1.1 0.15 0.4
6/1/2016 14:20 7.11 7.11 14.96 17.65 9.85 10.94 10.95 0.01 0.09 0.09 1.4 0.19 1.5
6/8/2016 13:30 6.88 6.88 21.93 26.67 8.97 9.40 9.48 0.08 -1.45 0.26 1.3 0.17 0.5 0.7
5/17/2016 11:30 -- -- -- -- 11.40 15.11 3.71 -- 0.54 -- -- -- --
5/20/2016 9:15 2.91 2.91 2.91 5.16 5.16 10.74 10.91 0.17 -0.66 0.54 1.8 0.24 0.3
5/25/2016 11:00 5.07 3.60 6.51 6.60 1.44 10.43 10.76 0.33 -0.97 0.54 0.4 0.05 0.07
6/1/2016 13:00 7.08 4.04 10.55 6.90 0.30 11.46 11.84 0.38 0.06 0.06 0.1 0.010 0.12
6/8/2016 12:15 6.97 6.97 17.51 13.20 6.30 9.90 10.85 0.95 -1.50 0.54 0.9 0.12 0.16 0.2
6/8/2016 14:00 -- -- -- -- 10.68 14.55 3.87 -- 0.57 -- -- -- --
6/9/2016 17:35 1.15 1.15 1.15 8.55 8.55 9.60 12.00 2.40 -1.08 0.57 7.4 0.99 1.3
6/10/2016 7:00 0.56 0.56 1.71 9.60 1.05 9.60 12.50 2.90 -1.08 0.57 1.9 0.25 0.3
6/13/2016 11:00 2.96 2.96 4.88 21.34 11.74 10.27 12.60 2.33 -0.41 0.57 4.0 0.53 0.7
6/22/2016 16:30 9.23 9.23 14.10 49.25 27.91 10.40 12.20 1.80 -0.28 0.57 3.0 0.40 0.5
6/27/2016 14:27 4.91 4.91 19.02 49.25 0.00 10.06 14.51 4.45 -0.62 0.57 0.0 0 0 0.5
6/8/2016 17:00 -- -- -- -- 12.71 17.76 5.05 -- 0.74 --
6/9/2016 9:00 0.67 0.67 0.67 7.80 7.80 11.36 16.24 4.88 -1.35 0.74 11.7 1.56 1.6
6/10/2016 7:17 0.93 0.93 1.60 8.55 0.75 11.16 16.20 5.04 -1.55 0.74 0.8 0.11 0.1
6/13/2016 10:35 2.92 2.92 4.73 20.11 11.51 11.50 16.89 5.39 -1.21 0.74 3.9 0.53 0.5
6/22/2016 17:10 9.27 9.27 14.01 45.31 25.20 11.72 16.91 5.19 -0.99 0.74 2.7 0.36 0.4
6/27/2016 15:50 4.94 4.94 18.95 45.31 0.00 11.70 17.02 5.32 -1.01 0.74 0.0 0 0 0.3
6/28/2016 8:39 -- -- -- -- 9.72 14.80 5.08 -- 0.74 -- -- -- --
6/28/2016 13:50 0.22 0.22 0.22 5.75 5.75 -- -- -- -- 0.74 26.6 3.56 3.5
7/1/2016 9:25 2.82 2.82 3.03 16.83 11.08 10.29 11.06 0.77 0.57 0.57 3.9 0.53 0.7
7/7/2016 13:25 6.17 6.17 9.20 40.22 23.39 10.72 10.92 0.20 1.00 0.74 3.8 0.51 0.5
7/11/2016 13:06 3.99 2.19 11.39 50.48 10.26 10.92 12.35 1.43 1.20 0.74 4.7 0.63 0.6
7/12/2016 9:35 0.85 0.68 12.07 54.26 3.78 10.87 12.55 1.68 1.15 0.74 5.5 0.74 0.7
7/12/2016 12:50 0.14 0.14 12.21 55.24 0.98 10.95 12.61 1.66 1.23 0.74 7.2 0.97 1.0
7/19/2016 12:45 7.00 7.00 19.21 69.20 13.96 10.51 14.15 3.64 0.79 0.74 2.0 0.27 0.3
7/21/2016 13:00 2.01 1.35 20.55 75.93 6.73 10.46 14.31 3.85 0.74 0.74 5.0 0.67 0.7
7/27/2016 13:00 6.00 5.22 25.77 101.38 25.45 10.52 13.93 3.41 0.80 0.74 4.9 0.65 0.6 0.6
Appendix C
Actual Skimmer Run-Time Between
Measurement Events(days)
Overall Average LNAPL
Transmissivityb
(ft2/day)
LNAPL Drawdown
(feet)
Savannah, GeorgiaEpic Midstream Savannah North Terminal
LNAPL Skimming Test Results - Short-Duration Skimming
Maximum Theoretical
Unconfined LNAPL Drawdown
(feet)
Estimated LNAPL
Transmissivity for Interval
(ft2/day)
Average LNAPL Recovery Rate
for Interval
(ft3/day)
Average LNAPL Recovery Rate
for Interval(gal/day)
LNAPL Drawdown Used in
Transmissivity
Estimatea
(feet)
In-Well LNAPL
Thickness(feet)
AW-68
AW-10
Depth to Water(feet btoc)
AW-9
AW-49
Depth to LNAPL
(feet btoc)
AW-65
Time Between Measurement Events
(days)Well ID
Measurement Date & Time
Volume of LNAPL Recovered During
Measurement Interval(gallons)
Total Volume of LNAPL
Recovered(gallons)
Cumulative Skimmer Run-
Time(days)
089400-3 APPC
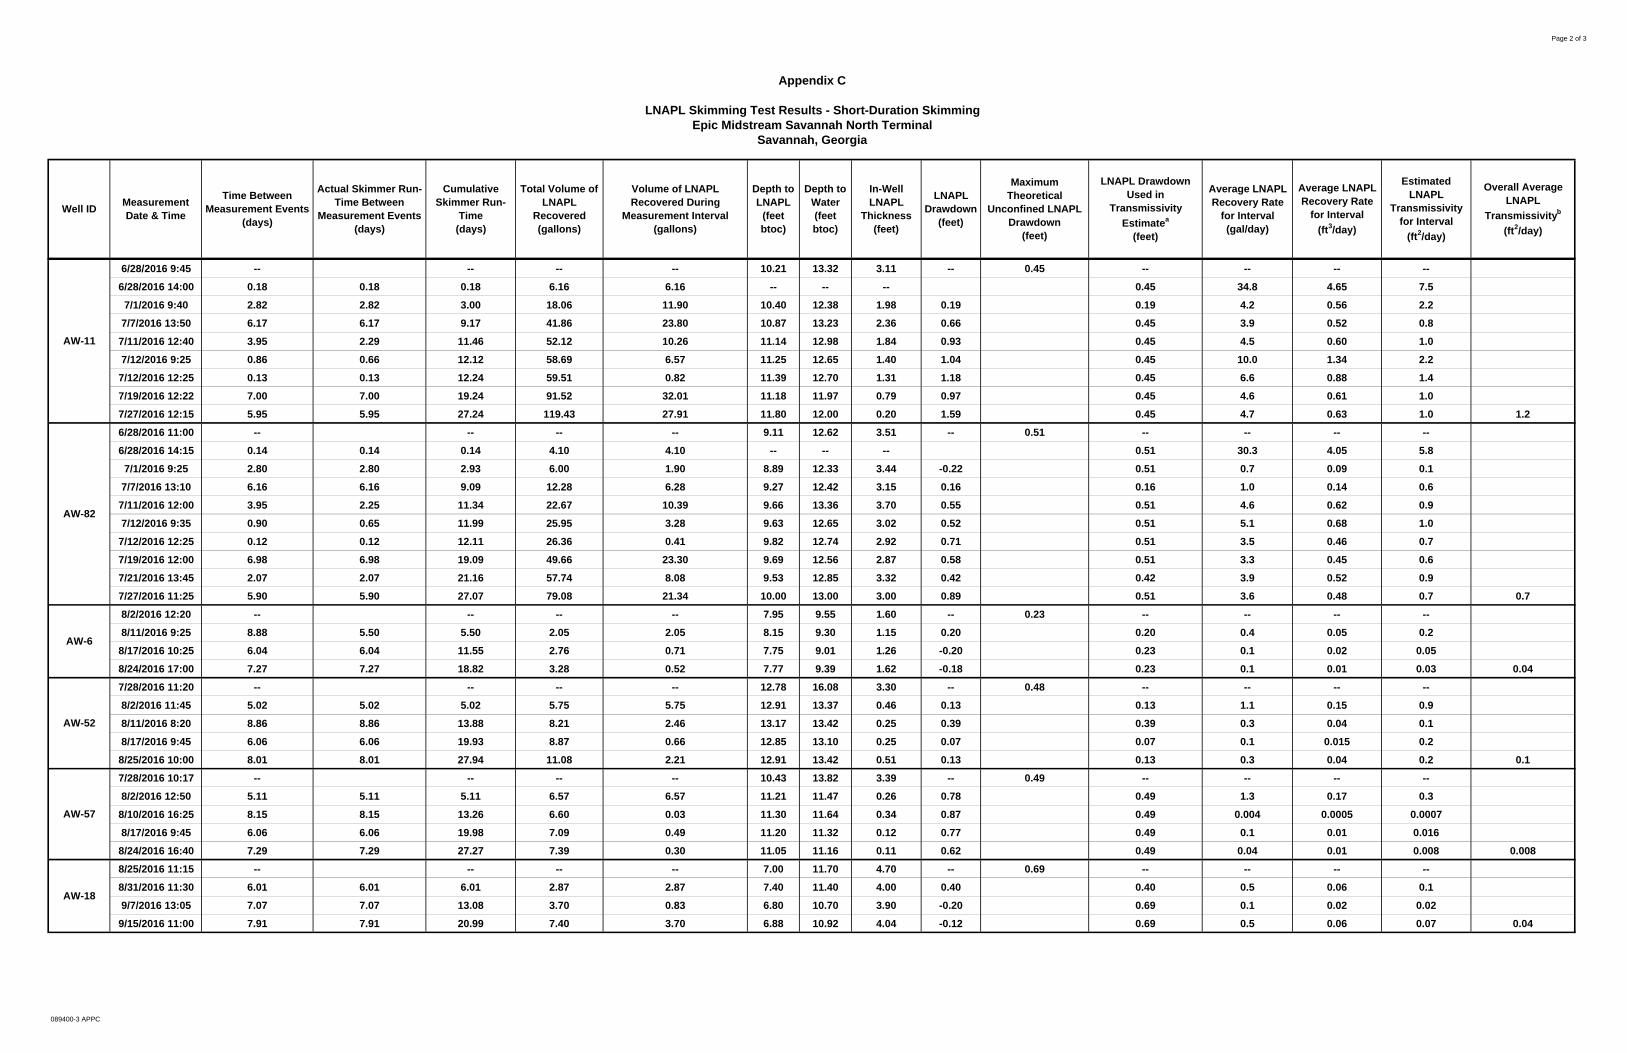
Page 2 of 3
Appendix C
Actual Skimmer Run-Time Between
Measurement Events(days)
Overall Average LNAPL
Transmissivityb
(ft2/day)
LNAPL Drawdown
(feet)
Savannah, GeorgiaEpic Midstream Savannah North Terminal
LNAPL Skimming Test Results - Short-Duration Skimming
Maximum Theoretical
Unconfined LNAPL Drawdown
(feet)
Estimated LNAPL
Transmissivity for Interval
(ft2/day)
Average LNAPL Recovery Rate
for Interval
(ft3/day)
Average LNAPL Recovery Rate
for Interval(gal/day)
LNAPL Drawdown Used in
Transmissivity
Estimatea
(feet)
In-Well LNAPL
Thickness(feet)
Depth to Water(feet btoc)
Depth to LNAPL
(feet btoc)
Time Between Measurement Events
(days)Well ID
Measurement Date & Time
Volume of LNAPL Recovered During
Measurement Interval(gallons)
Total Volume of LNAPL
Recovered(gallons)
Cumulative Skimmer Run-
Time(days)
6/28/2016 9:45 -- -- -- -- 10.21 13.32 3.11 -- 0.45 -- -- -- --
6/28/2016 14:00 0.18 0.18 0.18 6.16 6.16 -- -- -- 0.45 34.8 4.65 7.5
7/1/2016 9:40 2.82 2.82 3.00 18.06 11.90 10.40 12.38 1.98 0.19 0.19 4.2 0.56 2.2
7/7/2016 13:50 6.17 6.17 9.17 41.86 23.80 10.87 13.23 2.36 0.66 0.45 3.9 0.52 0.8
7/11/2016 12:40 3.95 2.29 11.46 52.12 10.26 11.14 12.98 1.84 0.93 0.45 4.5 0.60 1.0
7/12/2016 9:25 0.86 0.66 12.12 58.69 6.57 11.25 12.65 1.40 1.04 0.45 10.0 1.34 2.2
7/12/2016 12:25 0.13 0.13 12.24 59.51 0.82 11.39 12.70 1.31 1.18 0.45 6.6 0.88 1.4
7/19/2016 12:22 7.00 7.00 19.24 91.52 32.01 11.18 11.97 0.79 0.97 0.45 4.6 0.61 1.0
7/27/2016 12:15 5.95 5.95 27.24 119.43 27.91 11.80 12.00 0.20 1.59 0.45 4.7 0.63 1.0 1.2
6/28/2016 11:00 -- -- -- -- 9.11 12.62 3.51 -- 0.51 -- -- -- --
6/28/2016 14:15 0.14 0.14 0.14 4.10 4.10 -- -- -- 0.51 30.3 4.05 5.8
7/1/2016 9:25 2.80 2.80 2.93 6.00 1.90 8.89 12.33 3.44 -0.22 0.51 0.7 0.09 0.1
7/7/2016 13:10 6.16 6.16 9.09 12.28 6.28 9.27 12.42 3.15 0.16 0.16 1.0 0.14 0.6
7/11/2016 12:00 3.95 2.25 11.34 22.67 10.39 9.66 13.36 3.70 0.55 0.51 4.6 0.62 0.9
7/12/2016 9:35 0.90 0.65 11.99 25.95 3.28 9.63 12.65 3.02 0.52 0.51 5.1 0.68 1.0
7/12/2016 12:25 0.12 0.12 12.11 26.36 0.41 9.82 12.74 2.92 0.71 0.51 3.5 0.46 0.7
7/19/2016 12:00 6.98 6.98 19.09 49.66 23.30 9.69 12.56 2.87 0.58 0.51 3.3 0.45 0.6
7/21/2016 13:45 2.07 2.07 21.16 57.74 8.08 9.53 12.85 3.32 0.42 0.42 3.9 0.52 0.9
7/27/2016 11:25 5.90 5.90 27.07 79.08 21.34 10.00 13.00 3.00 0.89 0.51 3.6 0.48 0.7 0.7
8/2/2016 12:20 -- -- -- -- 7.95 9.55 1.60 -- 0.23 -- -- -- --
8/11/2016 9:25 8.88 5.50 5.50 2.05 2.05 8.15 9.30 1.15 0.20 0.20 0.4 0.05 0.2
8/17/2016 10:25 6.04 6.04 11.55 2.76 0.71 7.75 9.01 1.26 -0.20 0.23 0.1 0.02 0.05
8/24/2016 17:00 7.27 7.27 18.82 3.28 0.52 7.77 9.39 1.62 -0.18 0.23 0.1 0.01 0.03 0.04
7/28/2016 11:20 -- -- -- -- 12.78 16.08 3.30 -- 0.48 -- -- -- --
8/2/2016 11:45 5.02 5.02 5.02 5.75 5.75 12.91 13.37 0.46 0.13 0.13 1.1 0.15 0.9
8/11/2016 8:20 8.86 8.86 13.88 8.21 2.46 13.17 13.42 0.25 0.39 0.39 0.3 0.04 0.1
8/17/2016 9:45 6.06 6.06 19.93 8.87 0.66 12.85 13.10 0.25 0.07 0.07 0.1 0.015 0.2
8/25/2016 10:00 8.01 8.01 27.94 11.08 2.21 12.91 13.42 0.51 0.13 0.13 0.3 0.04 0.2 0.1
7/28/2016 10:17 -- -- -- -- 10.43 13.82 3.39 -- 0.49 -- -- -- --
8/2/2016 12:50 5.11 5.11 5.11 6.57 6.57 11.21 11.47 0.26 0.78 0.49 1.3 0.17 0.3
8/10/2016 16:25 8.15 8.15 13.26 6.60 0.03 11.30 11.64 0.34 0.87 0.49 0.004 0.0005 0.0007
8/17/2016 9:45 6.06 6.06 19.98 7.09 0.49 11.20 11.32 0.12 0.77 0.49 0.1 0.01 0.016
8/24/2016 16:40 7.29 7.29 27.27 7.39 0.30 11.05 11.16 0.11 0.62 0.49 0.04 0.01 0.008 0.008
8/25/2016 11:15 -- -- -- -- 7.00 11.70 4.70 -- 0.69 -- -- -- --
8/31/2016 11:30 6.01 6.01 6.01 2.87 2.87 7.40 11.40 4.00 0.40 0.40 0.5 0.06 0.1
9/7/2016 13:05 7.07 7.07 13.08 3.70 0.83 6.80 10.70 3.90 -0.20 0.69 0.1 0.02 0.02
9/15/2016 11:00 7.91 7.91 20.99 7.40 3.70 6.88 10.92 4.04 -0.12 0.69 0.5 0.06 0.07 0.04
AW-52
AW-18
AW-82
AW-11
AW-57
AW-6
089400-3 APPC
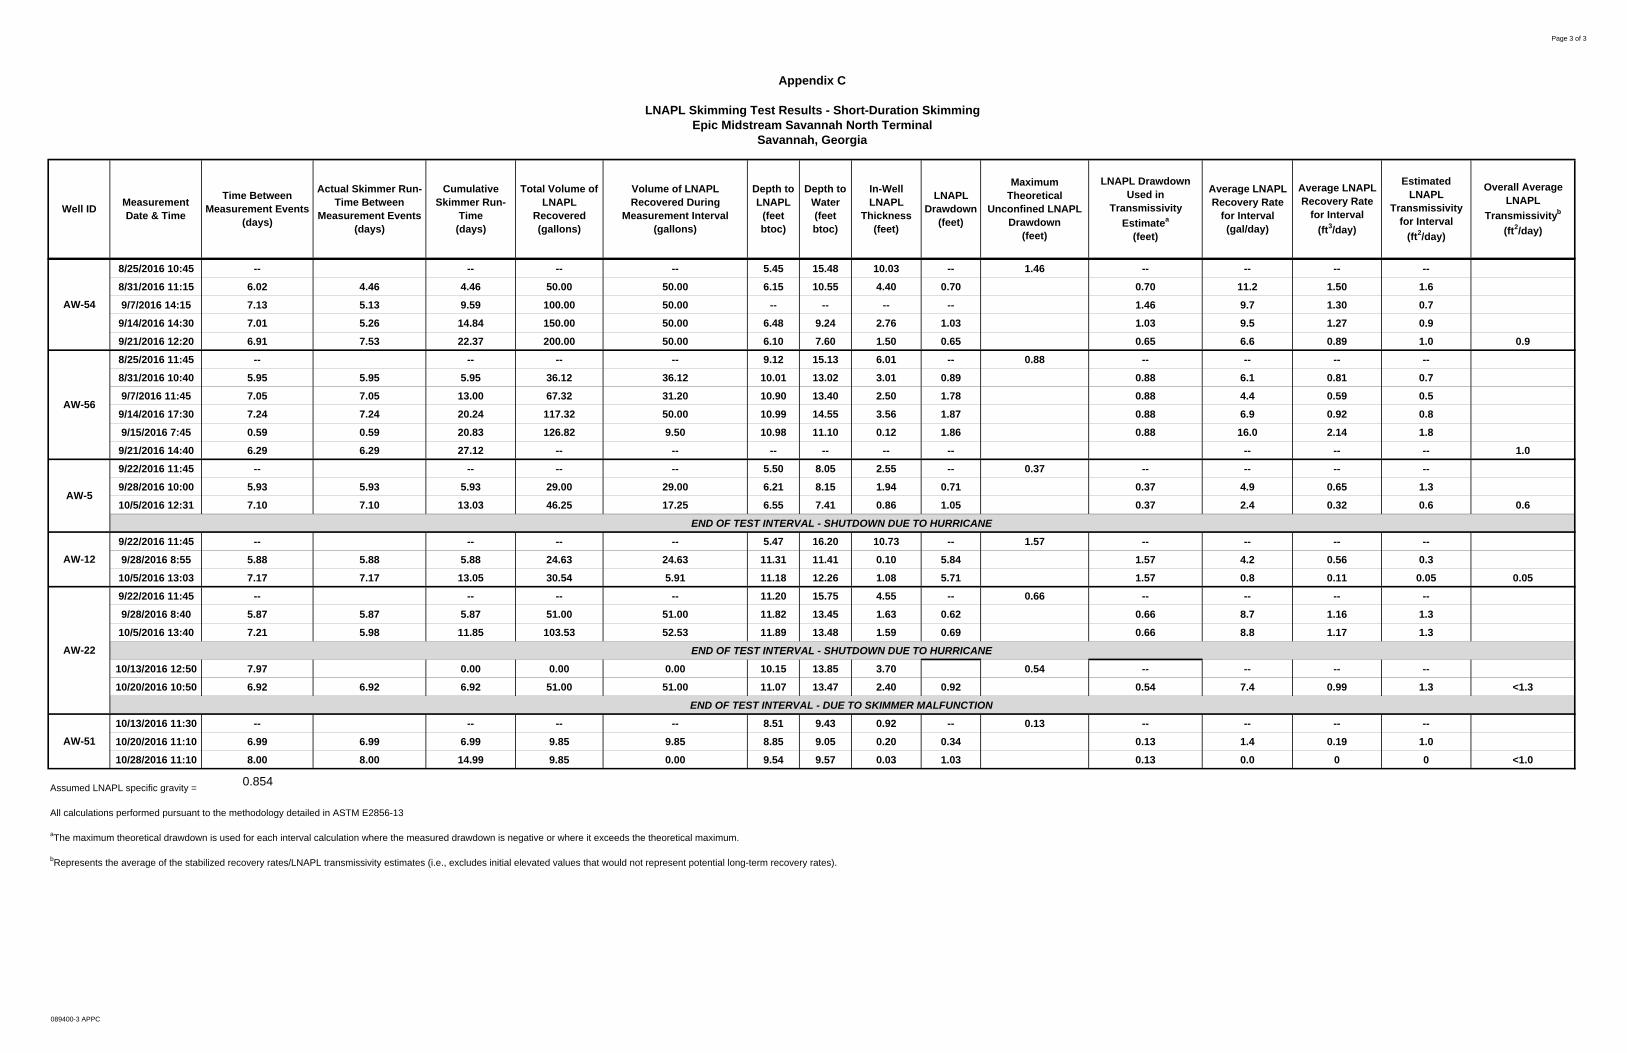
Page 3 of 3
Appendix C
Actual Skimmer Run-Time Between
Measurement Events(days)
Overall Average LNAPL
Transmissivityb
(ft2/day)
LNAPL Drawdown
(feet)
Savannah, GeorgiaEpic Midstream Savannah North Terminal
LNAPL Skimming Test Results - Short-Duration Skimming
Maximum Theoretical
Unconfined LNAPL Drawdown
(feet)
Estimated LNAPL
Transmissivity for Interval
(ft2/day)
Average LNAPL Recovery Rate
for Interval
(ft3/day)
Average LNAPL Recovery Rate
for Interval(gal/day)
LNAPL Drawdown Used in
Transmissivity
Estimatea
(feet)
In-Well LNAPL
Thickness(feet)
Depth to Water(feet btoc)
Depth to LNAPL
(feet btoc)
Time Between Measurement Events
(days)Well ID
Measurement Date & Time
Volume of LNAPL Recovered During
Measurement Interval(gallons)
Total Volume of LNAPL
Recovered(gallons)
Cumulative Skimmer Run-
Time(days)
8/25/2016 10:45 -- -- -- -- 5.45 15.48 10.03 -- 1.46 -- -- -- --
8/31/2016 11:15 6.02 4.46 4.46 50.00 50.00 6.15 10.55 4.40 0.70 0.70 11.2 1.50 1.6
9/7/2016 14:15 7.13 5.13 9.59 100.00 50.00 -- -- -- -- 1.46 9.7 1.30 0.7
9/14/2016 14:30 7.01 5.26 14.84 150.00 50.00 6.48 9.24 2.76 1.03 1.03 9.5 1.27 0.9
9/21/2016 12:20 6.91 7.53 22.37 200.00 50.00 6.10 7.60 1.50 0.65 0.65 6.6 0.89 1.0 0.9
8/25/2016 11:45 -- -- -- -- 9.12 15.13 6.01 -- 0.88 -- -- -- --
8/31/2016 10:40 5.95 5.95 5.95 36.12 36.12 10.01 13.02 3.01 0.89 0.88 6.1 0.81 0.7
9/7/2016 11:45 7.05 7.05 13.00 67.32 31.20 10.90 13.40 2.50 1.78 0.88 4.4 0.59 0.5
9/14/2016 17:30 7.24 7.24 20.24 117.32 50.00 10.99 14.55 3.56 1.87 0.88 6.9 0.92 0.8
9/15/2016 7:45 0.59 0.59 20.83 126.82 9.50 10.98 11.10 0.12 1.86 0.88 16.0 2.14 1.8
9/21/2016 14:40 6.29 6.29 27.12 -- -- -- -- -- -- -- -- -- 1.0
9/22/2016 11:45 -- -- -- -- 5.50 8.05 2.55 -- 0.37 -- -- -- --
9/28/2016 10:00 5.93 5.93 5.93 29.00 29.00 6.21 8.15 1.94 0.71 0.37 4.9 0.65 1.3
10/5/2016 12:31 7.10 7.10 13.03 46.25 17.25 6.55 7.41 0.86 1.05 0.37 2.4 0.32 0.6 0.6
END OF TEST INTERVAL - SHUTDOWN DUE TO HURRICANE
9/22/2016 11:45 -- -- -- -- 5.47 16.20 10.73 -- 1.57 -- -- -- --
9/28/2016 8:55 5.88 5.88 5.88 24.63 24.63 11.31 11.41 0.10 5.84 1.57 4.2 0.56 0.3
10/5/2016 13:03 7.17 7.17 13.05 30.54 5.91 11.18 12.26 1.08 5.71 1.57 0.8 0.11 0.05 0.05
9/22/2016 11:45 -- -- -- -- 11.20 15.75 4.55 -- 0.66 -- -- -- --
9/28/2016 8:40 5.87 5.87 5.87 51.00 51.00 11.82 13.45 1.63 0.62 0.66 8.7 1.16 1.3
10/5/2016 13:40 7.21 5.98 11.85 103.53 52.53 11.89 13.48 1.59 0.69 0.66 8.8 1.17 1.3
END OF TEST INTERVAL - SHUTDOWN DUE TO HURRICANE
10/13/2016 12:50 7.97 0.00 0.00 0.00 10.15 13.85 3.70 0.54 -- -- -- --
10/20/2016 10:50 6.92 6.92 6.92 51.00 51.00 11.07 13.47 2.40 0.92 0.54 7.4 0.99 1.3 <1.3
END OF TEST INTERVAL - DUE TO SKIMMER MALFUNCTION
10/13/2016 11:30 -- -- -- -- 8.51 9.43 0.92 -- 0.13 -- -- -- --
10/20/2016 11:10 6.99 6.99 6.99 9.85 9.85 8.85 9.05 0.20 0.34 0.13 1.4 0.19 1.0
10/28/2016 11:10 8.00 8.00 14.99 9.85 0.00 9.54 9.57 0.03 1.03 0.13 0.0 0 0 <1.0
Assumed LNAPL specific gravity = 0.854
All calculations performed pursuant to the methodology detailed in ASTM E2856-13
aThe maximum theoretical drawdown is used for each interval calculation where the measured drawdown is negative or where it exceeds the theoretical maximum.
bRepresents the average of the stabilized recovery rates/LNAPL transmissivity estimates (i.e., excludes initial elevated values that would not represent potential long-term recovery rates).
AW-51
AW-12
AW-5
AW-54
AW-56
AW-22
089400-3 APPC
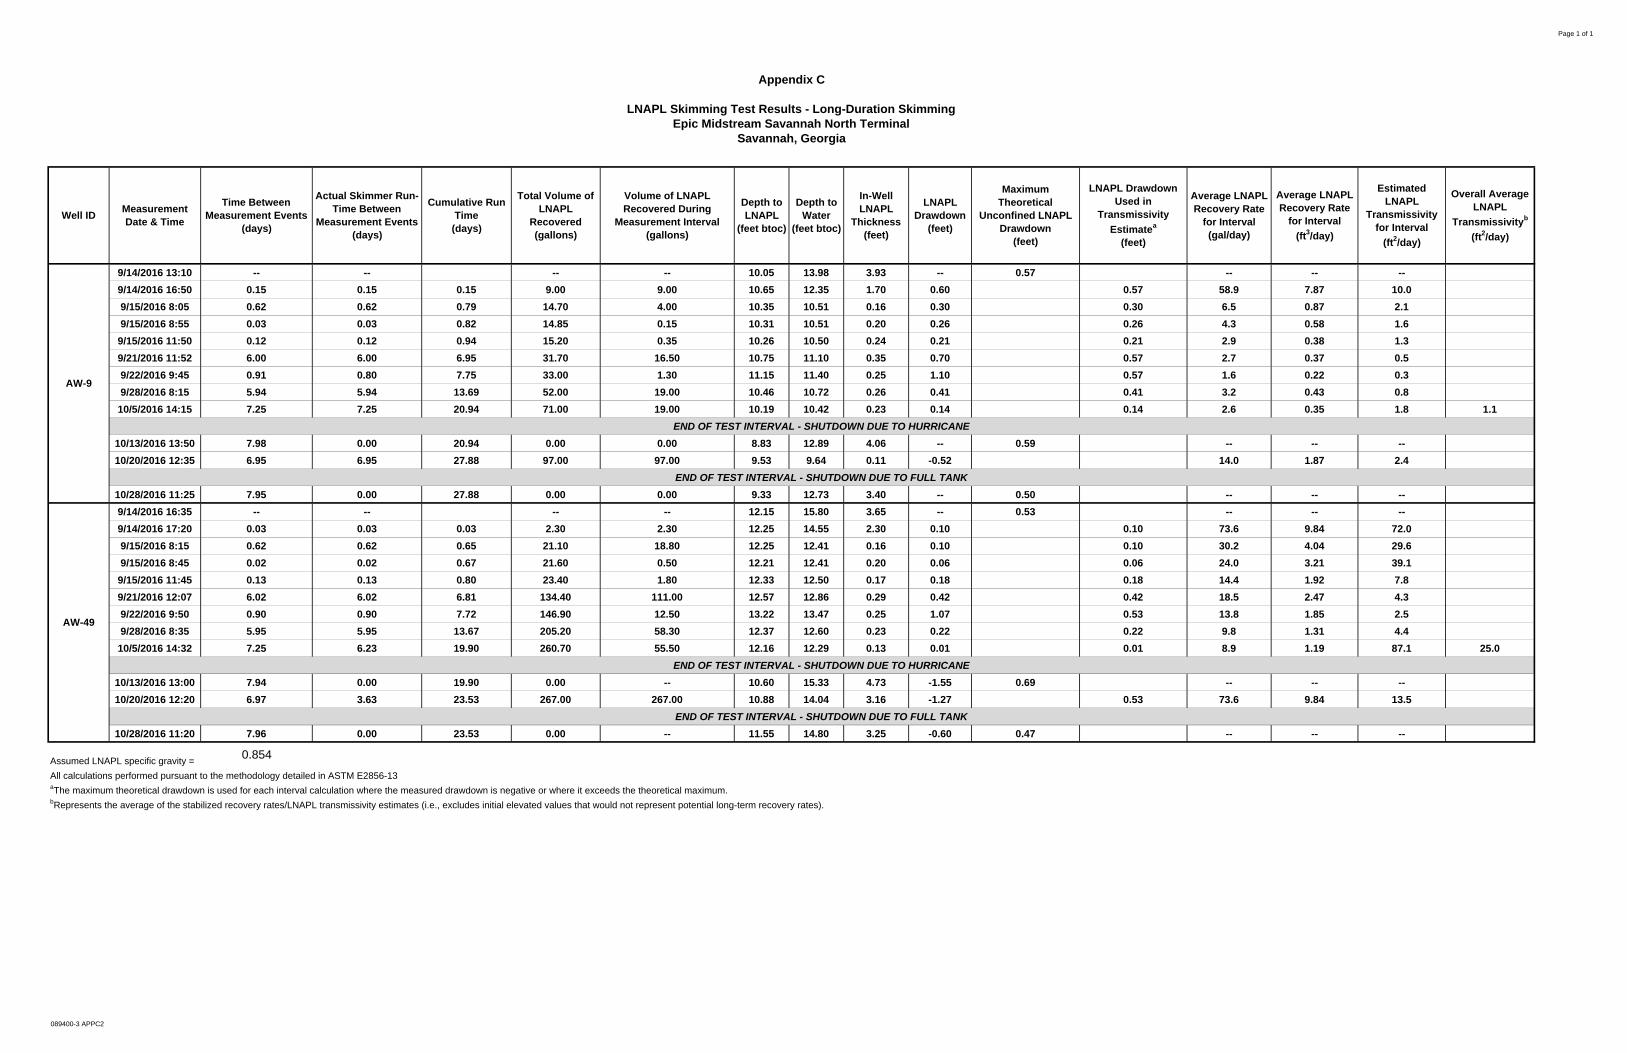
Page 1 of 1
9/14/2016 13:10 -- -- -- -- 10.05 13.98 3.93 -- 0.57 -- -- --
9/14/2016 16:50 0.15 0.15 0.15 9.00 9.00 10.65 12.35 1.70 0.60 0.57 58.9 7.87 10.0
9/15/2016 8:05 0.62 0.62 0.79 14.70 4.00 10.35 10.51 0.16 0.30 0.30 6.5 0.87 2.1
9/15/2016 8:55 0.03 0.03 0.82 14.85 0.15 10.31 10.51 0.20 0.26 0.26 4.3 0.58 1.6
9/15/2016 11:50 0.12 0.12 0.94 15.20 0.35 10.26 10.50 0.24 0.21 0.21 2.9 0.38 1.3
9/21/2016 11:52 6.00 6.00 6.95 31.70 16.50 10.75 11.10 0.35 0.70 0.57 2.7 0.37 0.5
9/22/2016 9:45 0.91 0.80 7.75 33.00 1.30 11.15 11.40 0.25 1.10 0.57 1.6 0.22 0.3
9/28/2016 8:15 5.94 5.94 13.69 52.00 19.00 10.46 10.72 0.26 0.41 0.41 3.2 0.43 0.8
10/5/2016 14:15 7.25 7.25 20.94 71.00 19.00 10.19 10.42 0.23 0.14 0.14 2.6 0.35 1.8 1.1
END OF TEST INTERVAL - SHUTDOWN DUE TO HURRICANE
10/13/2016 13:50 7.98 0.00 20.94 0.00 0.00 8.83 12.89 4.06 -- 0.59 -- -- --
10/20/2016 12:35 6.95 6.95 27.88 97.00 97.00 9.53 9.64 0.11 -0.52 14.0 1.87 2.4
END OF TEST INTERVAL - SHUTDOWN DUE TO FULL TANK
10/28/2016 11:25 7.95 0.00 27.88 0.00 0.00 9.33 12.73 3.40 -- 0.50 -- -- --
9/14/2016 16:35 -- -- -- -- 12.15 15.80 3.65 -- 0.53 -- -- --
9/14/2016 17:20 0.03 0.03 0.03 2.30 2.30 12.25 14.55 2.30 0.10 0.10 73.6 9.84 72.0
9/15/2016 8:15 0.62 0.62 0.65 21.10 18.80 12.25 12.41 0.16 0.10 0.10 30.2 4.04 29.6
9/15/2016 8:45 0.02 0.02 0.67 21.60 0.50 12.21 12.41 0.20 0.06 0.06 24.0 3.21 39.1
9/15/2016 11:45 0.13 0.13 0.80 23.40 1.80 12.33 12.50 0.17 0.18 0.18 14.4 1.92 7.8
9/21/2016 12:07 6.02 6.02 6.81 134.40 111.00 12.57 12.86 0.29 0.42 0.42 18.5 2.47 4.3
9/22/2016 9:50 0.90 0.90 7.72 146.90 12.50 13.22 13.47 0.25 1.07 0.53 13.8 1.85 2.5
9/28/2016 8:35 5.95 5.95 13.67 205.20 58.30 12.37 12.60 0.23 0.22 0.22 9.8 1.31 4.4
10/5/2016 14:32 7.25 6.23 19.90 260.70 55.50 12.16 12.29 0.13 0.01 0.01 8.9 1.19 87.1 25.0
END OF TEST INTERVAL - SHUTDOWN DUE TO HURRICANE
10/13/2016 13:00 7.94 0.00 19.90 0.00 -- 10.60 15.33 4.73 -1.55 0.69 -- -- --
10/20/2016 12:20 6.97 3.63 23.53 267.00 267.00 10.88 14.04 3.16 -1.27 0.53 73.6 9.84 13.5
END OF TEST INTERVAL - SHUTDOWN DUE TO FULL TANK
10/28/2016 11:20 7.96 0.00 23.53 0.00 -- 11.55 14.80 3.25 -0.60 0.47 -- -- --
Assumed LNAPL specific gravity = 0.854
All calculations performed pursuant to the methodology detailed in ASTM E2856-13aThe maximum theoretical drawdown is used for each interval calculation where the measured drawdown is negative or where it exceeds the theoretical maximum. bRepresents the average of the stabilized recovery rates/LNAPL transmissivity estimates (i.e., excludes initial elevated values that would not represent potential long-term recovery rates).
Savannah, GeorgiaEpic Midstream Savannah North Terminal
LNAPL Skimming Test Results - Long-Duration Skimming
Appendix C
Well IDMeasurement Date & Time
Time Between Measurement Events
(days)
Actual Skimmer Run-Time Between
Measurement Events(days)
Total Volume of LNAPL
Recovered(gallons)
Volume of LNAPL Recovered During
Measurement Interval(gallons)
Average LNAPL Recovery Rate
for Interval(gal/day)
Average LNAPL Recovery Rate
for Interval
(ft3/day)
Estimated LNAPL
Transmissivity for Interval
(ft2/day)
LNAPL Drawdown Used in
Transmissivity
Estimatea
(feet)
Overall Average LNAPL
Transmissivityb
(ft2/day)
AW-49
In-Well LNAPL
Thickness(feet)
LNAPL Drawdown
(feet)
Maximum Theoretical
Unconfined LNAPL Drawdown
(feet)
Depth to LNAPL
(feet btoc)
Depth to Water
(feet btoc)
Cumulative Run Time
(days)
AW-9
089400-3 APPC2
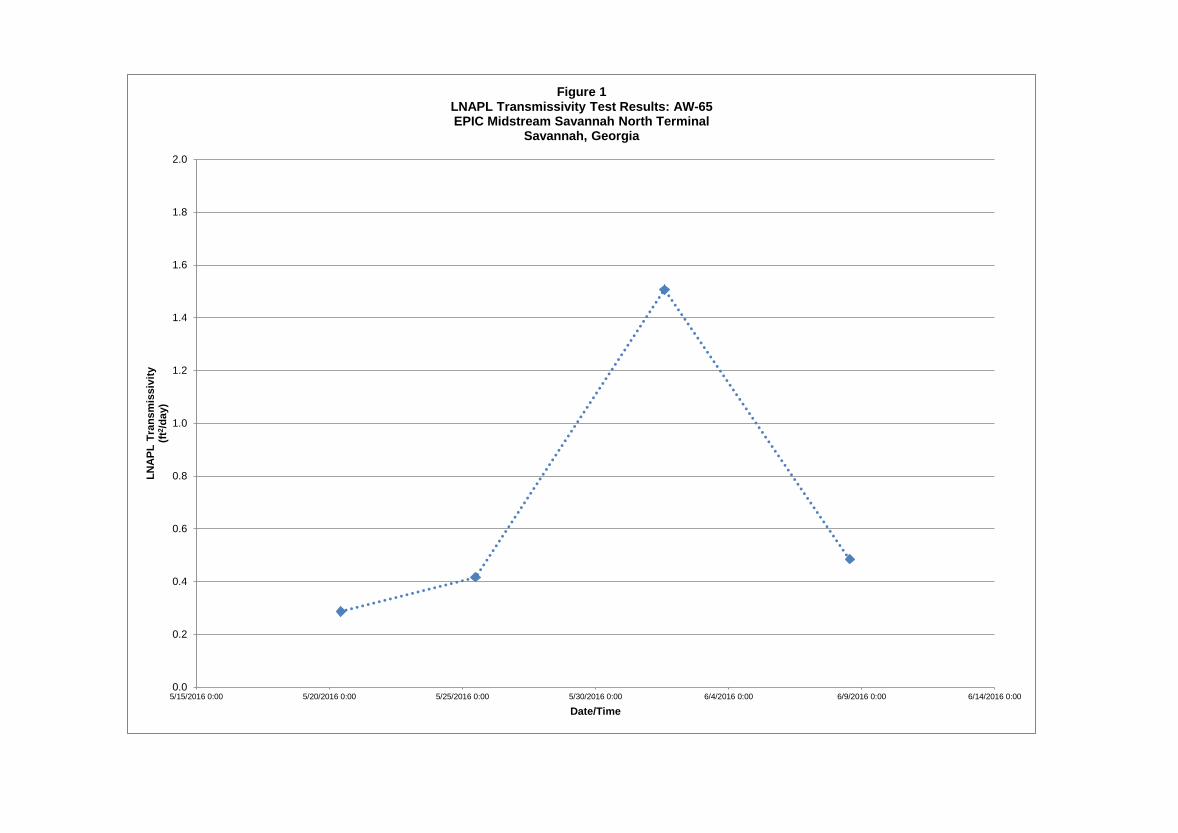
0.0
0.2
0.4
0.6
0.8
1.0
1.2
1.4
1.6
1.8
2.0
5/15/2016 0:00 5/20/2016 0:00 5/25/2016 0:00 5/30/2016 0:00 6/4/2016 0:00 6/9/2016 0:00 6/14/2016 0:00
LN
AP
L T
ran
smis
sivi
ty
(ft2 /
day
)
Date/Time
Figure 1 LNAPL Transmissivity Test Results: AW-65 EPIC Midstream Savannah North Terminal
Savannah, Georgia
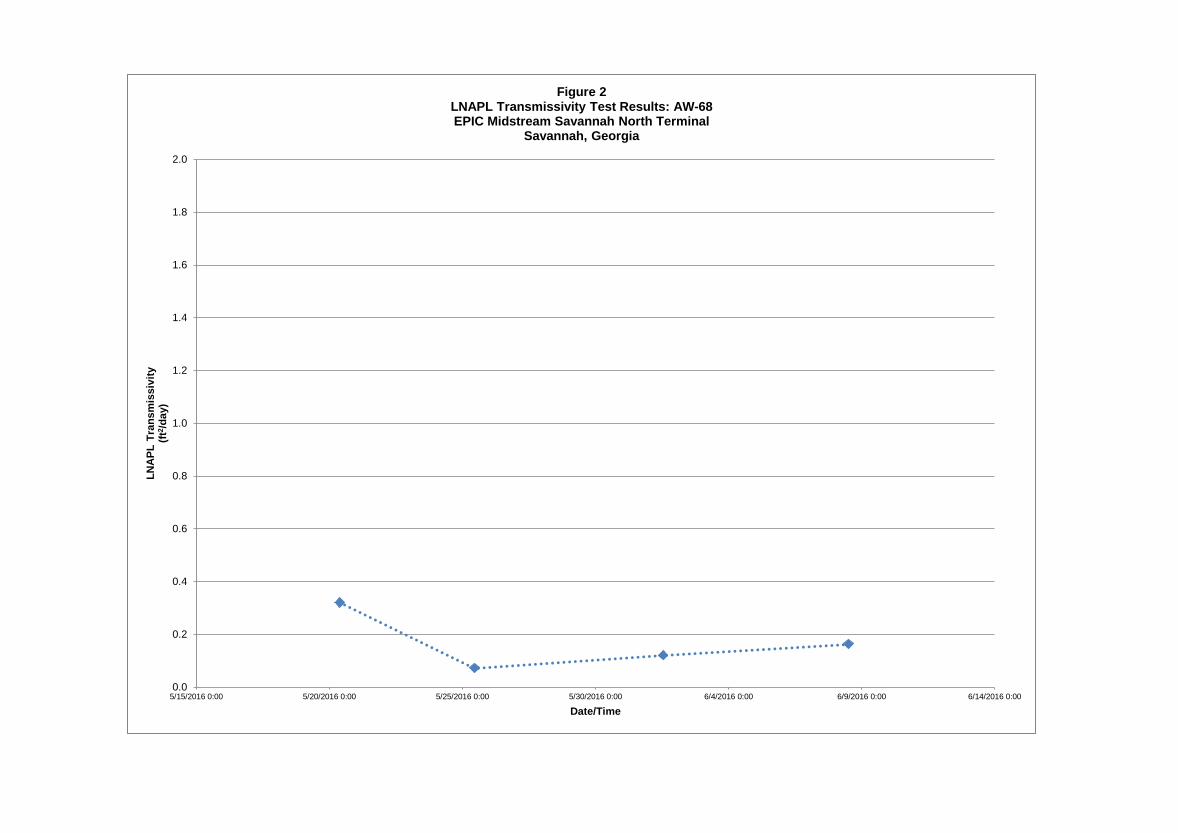
0.0
0.2
0.4
0.6
0.8
1.0
1.2
1.4
1.6
1.8
2.0
5/15/2016 0:00 5/20/2016 0:00 5/25/2016 0:00 5/30/2016 0:00 6/4/2016 0:00 6/9/2016 0:00 6/14/2016 0:00
LN
AP
L T
ran
smis
sivi
ty
(ft2 /
day
)
Date/Time
Figure 2 LNAPL Transmissivity Test Results: AW-68 EPIC Midstream Savannah North Terminal
Savannah, Georgia
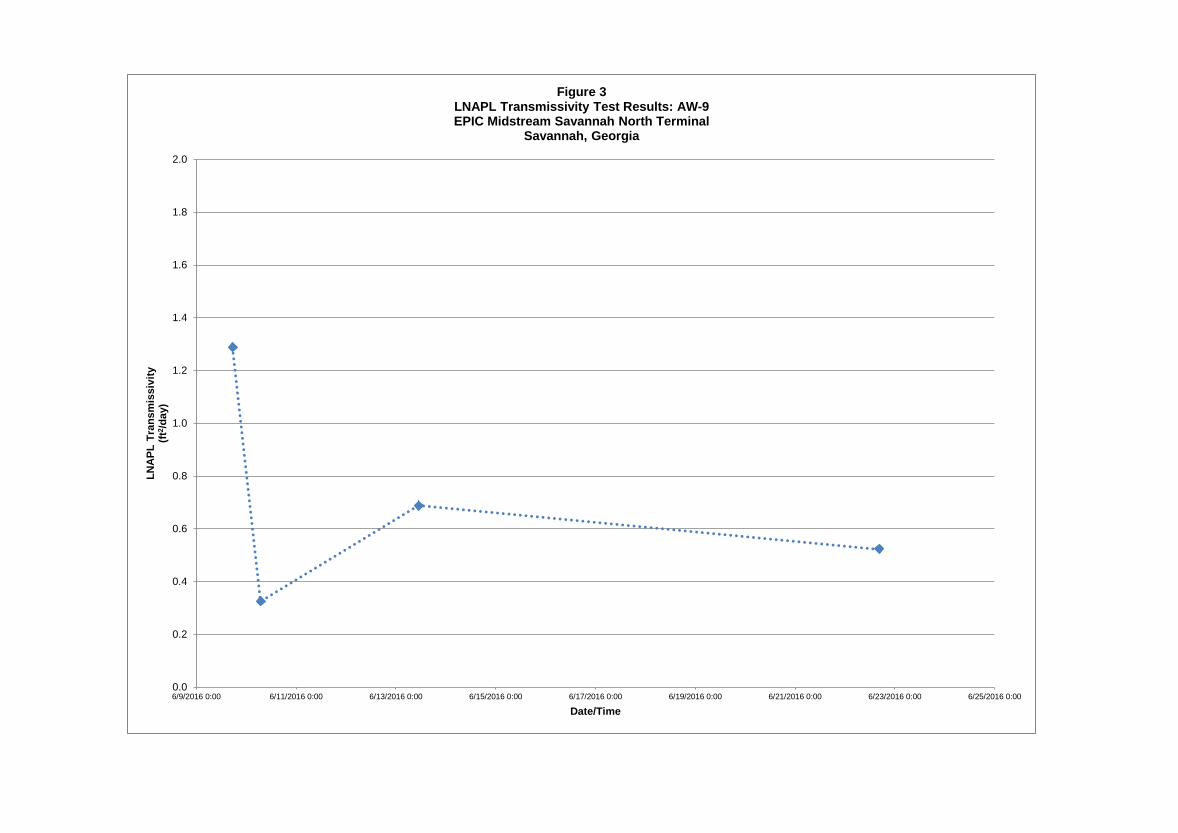
0.0
0.2
0.4
0.6
0.8
1.0
1.2
1.4
1.6
1.8
2.0
6/9/2016 0:00 6/11/2016 0:00 6/13/2016 0:00 6/15/2016 0:00 6/17/2016 0:00 6/19/2016 0:00 6/21/2016 0:00 6/23/2016 0:00 6/25/2016 0:00
LN
AP
L T
ran
smis
sivi
ty
(ft2 /
day
)
Date/Time
Figure 3 LNAPL Transmissivity Test Results: AW-9 EPIC Midstream Savannah North Terminal
Savannah, Georgia
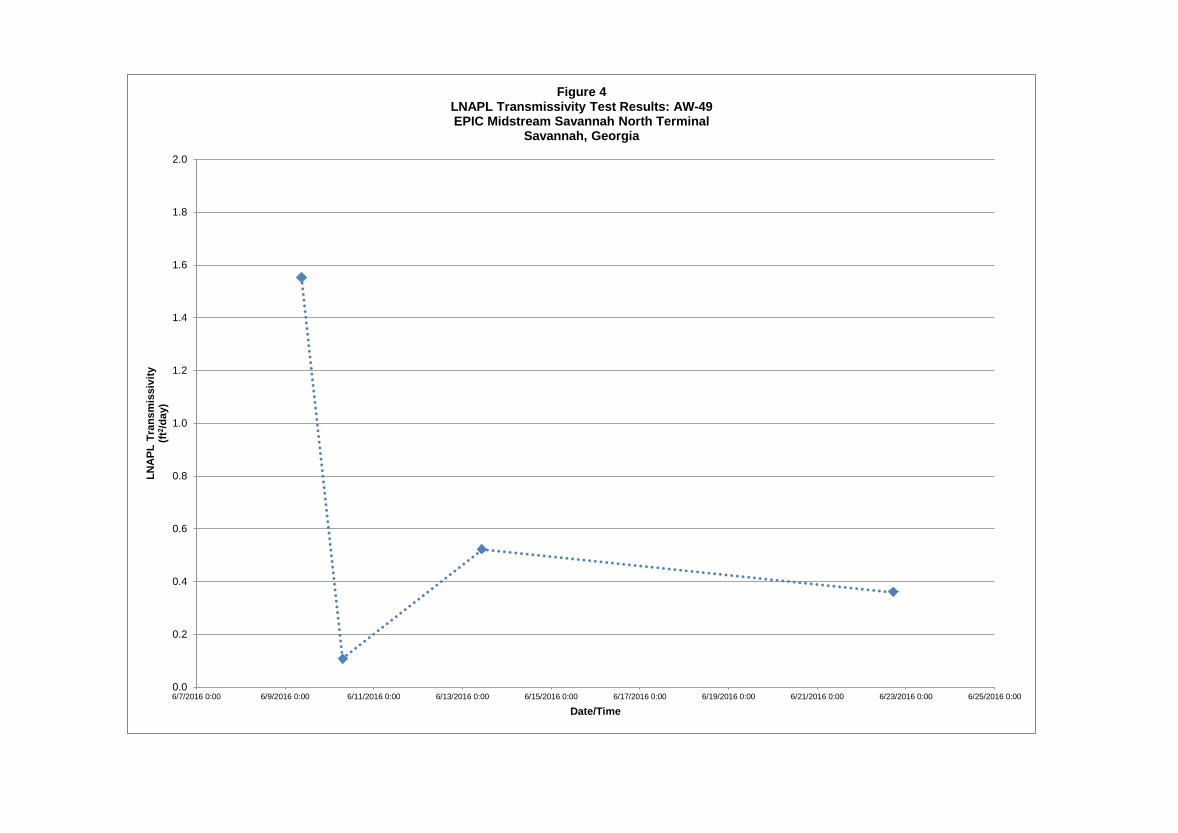
0.0
0.2
0.4
0.6
0.8
1.0
1.2
1.4
1.6
1.8
2.0
6/7/2016 0:00 6/9/2016 0:00 6/11/2016 0:00 6/13/2016 0:00 6/15/2016 0:00 6/17/2016 0:00 6/19/2016 0:00 6/21/2016 0:00 6/23/2016 0:00 6/25/2016 0:00
LN
AP
L T
ran
smis
sivi
ty
(ft2 /
day
)
Date/Time
Figure 4 LNAPL Transmissivity Test Results: AW-49 EPIC Midstream Savannah North Terminal
Savannah, Georgia
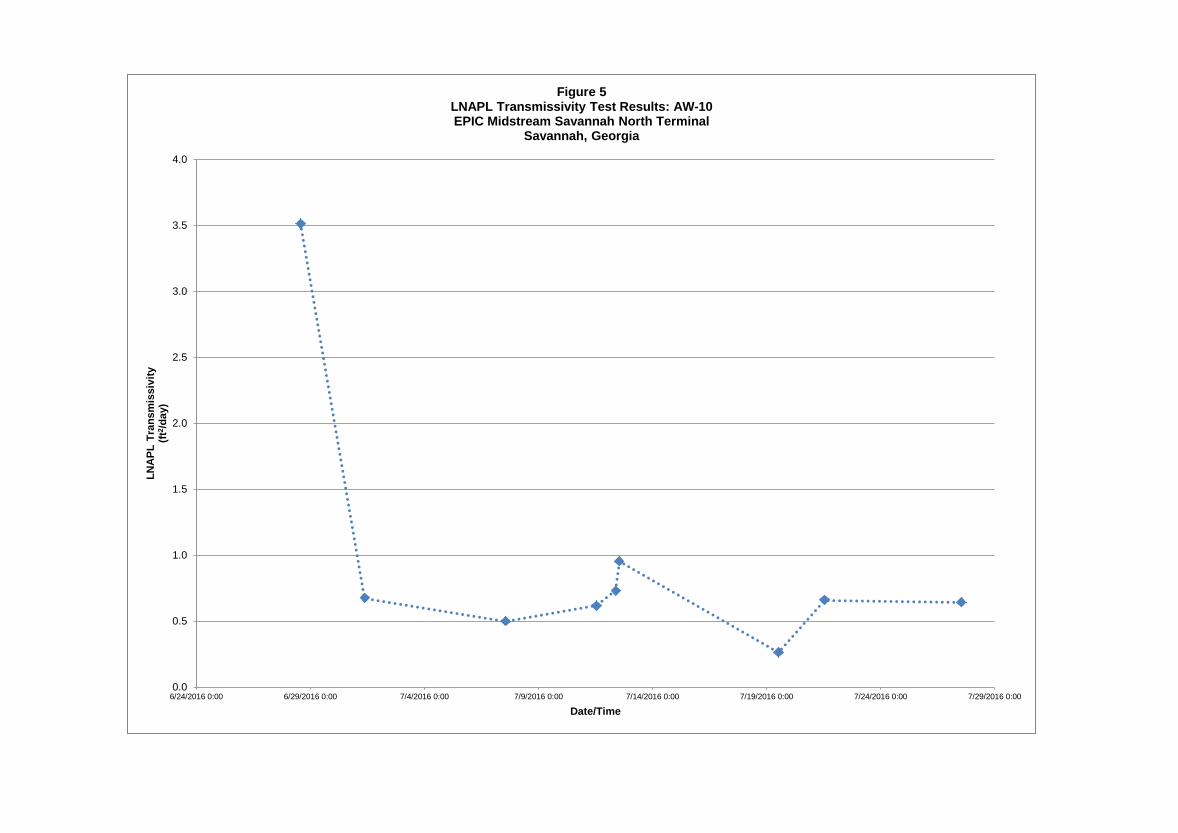
0.0
0.5
1.0
1.5
2.0
2.5
3.0
3.5
4.0
6/24/2016 0:00 6/29/2016 0:00 7/4/2016 0:00 7/9/2016 0:00 7/14/2016 0:00 7/19/2016 0:00 7/24/2016 0:00 7/29/2016 0:00
LN
AP
L T
ran
smis
sivi
ty
(ft2 /
day
)
Date/Time
Figure 5 LNAPL Transmissivity Test Results: AW-10 EPIC Midstream Savannah North Terminal
Savannah, Georgia
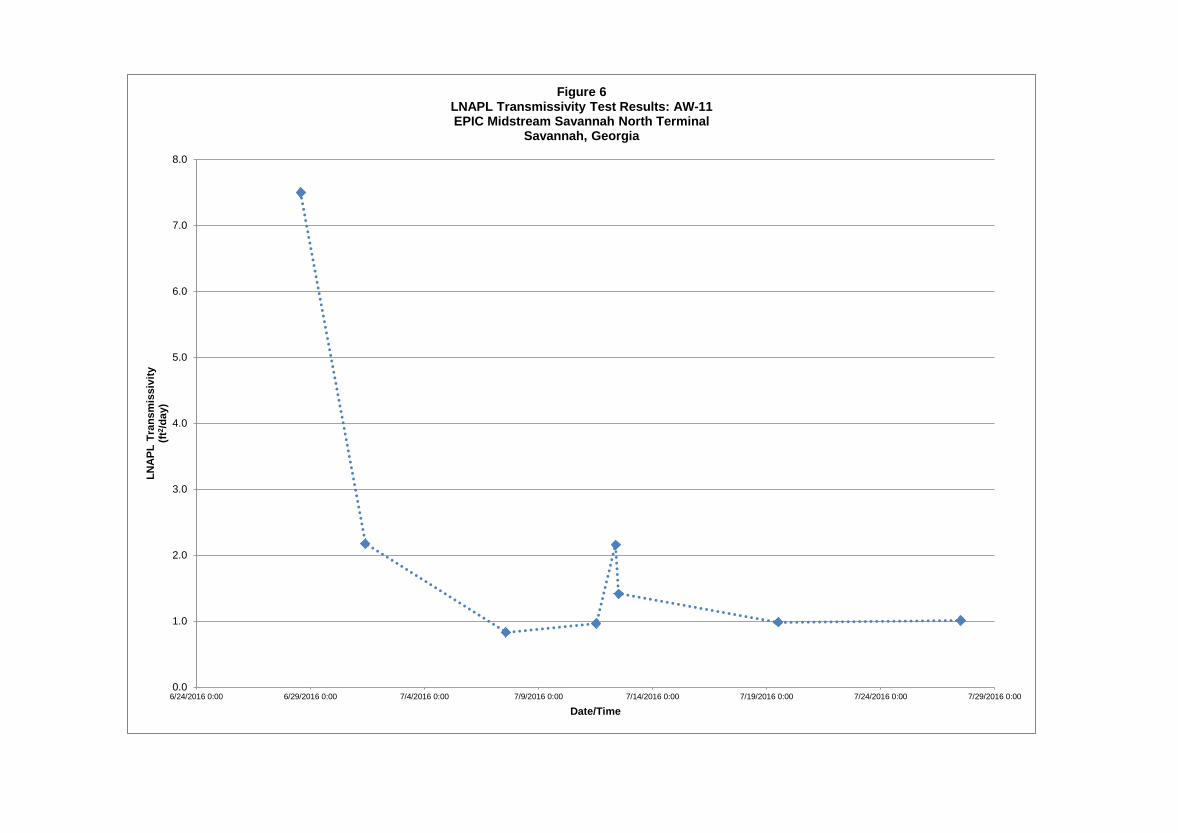
0.0
1.0
2.0
3.0
4.0
5.0
6.0
7.0
8.0
6/24/2016 0:00 6/29/2016 0:00 7/4/2016 0:00 7/9/2016 0:00 7/14/2016 0:00 7/19/2016 0:00 7/24/2016 0:00 7/29/2016 0:00
LN
AP
L T
ran
smis
sivi
ty
(ft2 /
day
)
Date/Time
Figure 6 LNAPL Transmissivity Test Results: AW-11 EPIC Midstream Savannah North Terminal
Savannah, Georgia
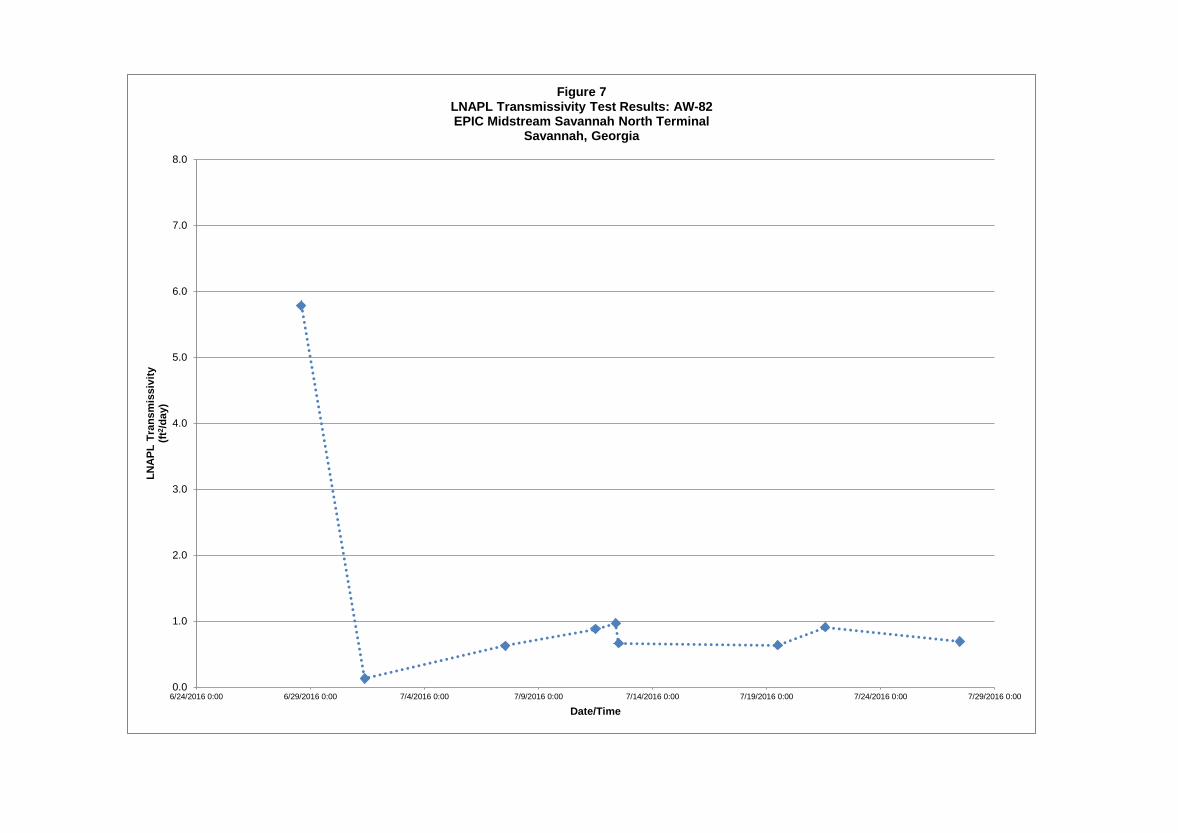
0.0
1.0
2.0
3.0
4.0
5.0
6.0
7.0
8.0
6/24/2016 0:00 6/29/2016 0:00 7/4/2016 0:00 7/9/2016 0:00 7/14/2016 0:00 7/19/2016 0:00 7/24/2016 0:00 7/29/2016 0:00
LN
AP
L T
ran
smis
sivi
ty
(ft2 /
day
)
Date/Time
Figure 7 LNAPL Transmissivity Test Results: AW-82 EPIC Midstream Savannah North Terminal
Savannah, Georgia

0.0
0.1
0.2
0.3
0.4
0.5
0.6
0.7
0.8
0.9
1.0
8/10/2016 0:00 8/12/2016 0:00 8/14/2016 0:00 8/16/2016 0:00 8/18/2016 0:00 8/20/2016 0:00 8/22/2016 0:00 8/24/2016 0:00 8/26/2016 0:00
LN
AP
L T
ran
smis
sivi
ty
(ft2 /
day
)
Date/Time
Figure 8 LNAPL Transmissivity Test Results: AW-6 EPIC Midstream Savannah North Terminal
Savannah, Georgia
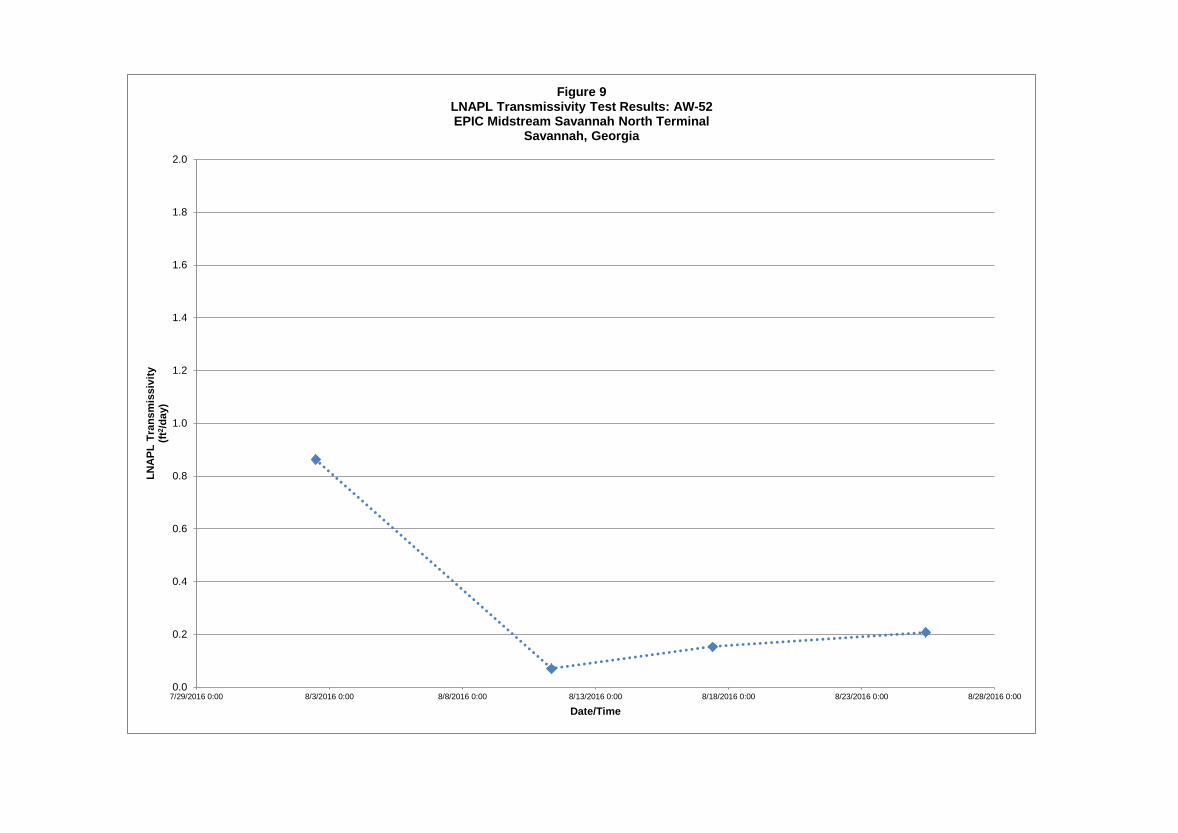
0.0
0.2
0.4
0.6
0.8
1.0
1.2
1.4
1.6
1.8
2.0
7/29/2016 0:00 8/3/2016 0:00 8/8/2016 0:00 8/13/2016 0:00 8/18/2016 0:00 8/23/2016 0:00 8/28/2016 0:00
LN
AP
L T
ran
smis
sivi
ty
(ft2 /
day
)
Date/Time
Figure 9 LNAPL Transmissivity Test Results: AW-52 EPIC Midstream Savannah North Terminal
Savannah, Georgia
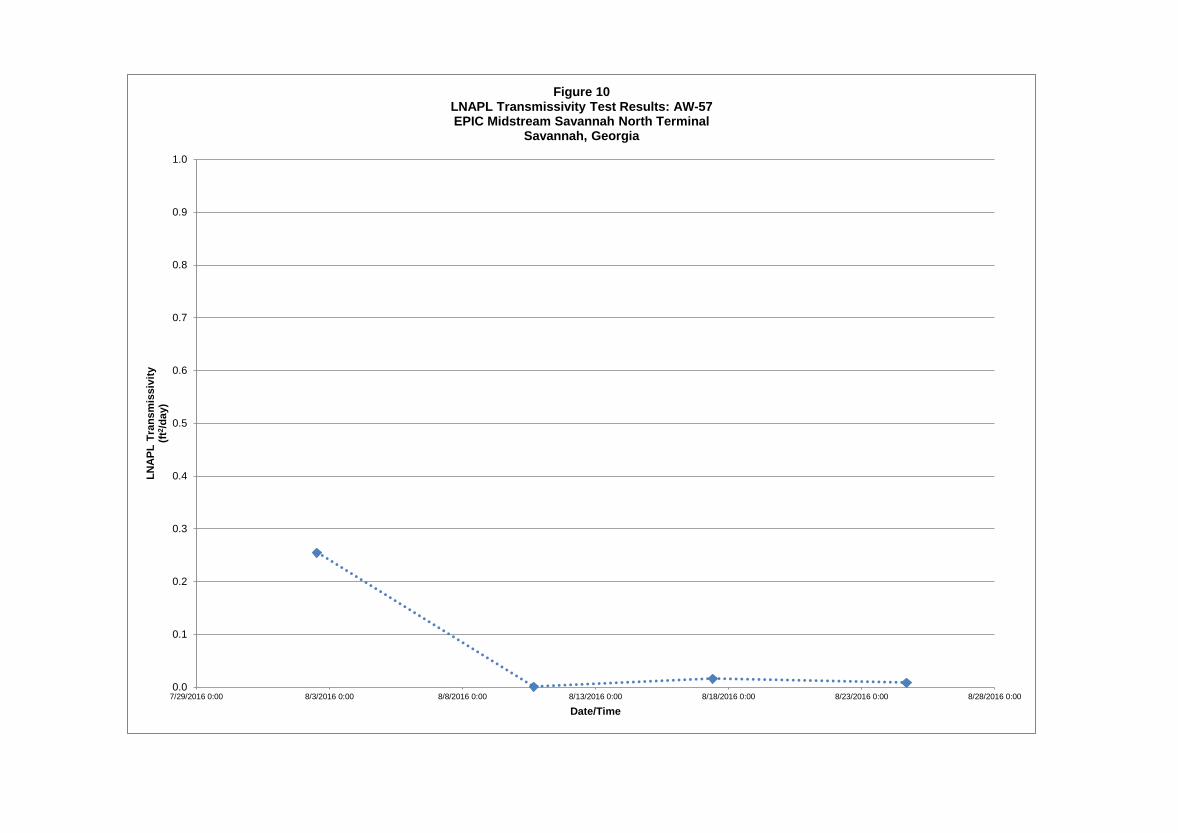
0.0
0.1
0.2
0.3
0.4
0.5
0.6
0.7
0.8
0.9
1.0
7/29/2016 0:00 8/3/2016 0:00 8/8/2016 0:00 8/13/2016 0:00 8/18/2016 0:00 8/23/2016 0:00 8/28/2016 0:00
LN
AP
L T
ran
smis
sivi
ty
(ft2 /
day
)
Date/Time
Figure 10 LNAPL Transmissivity Test Results: AW-57 EPIC Midstream Savannah North Terminal
Savannah, Georgia
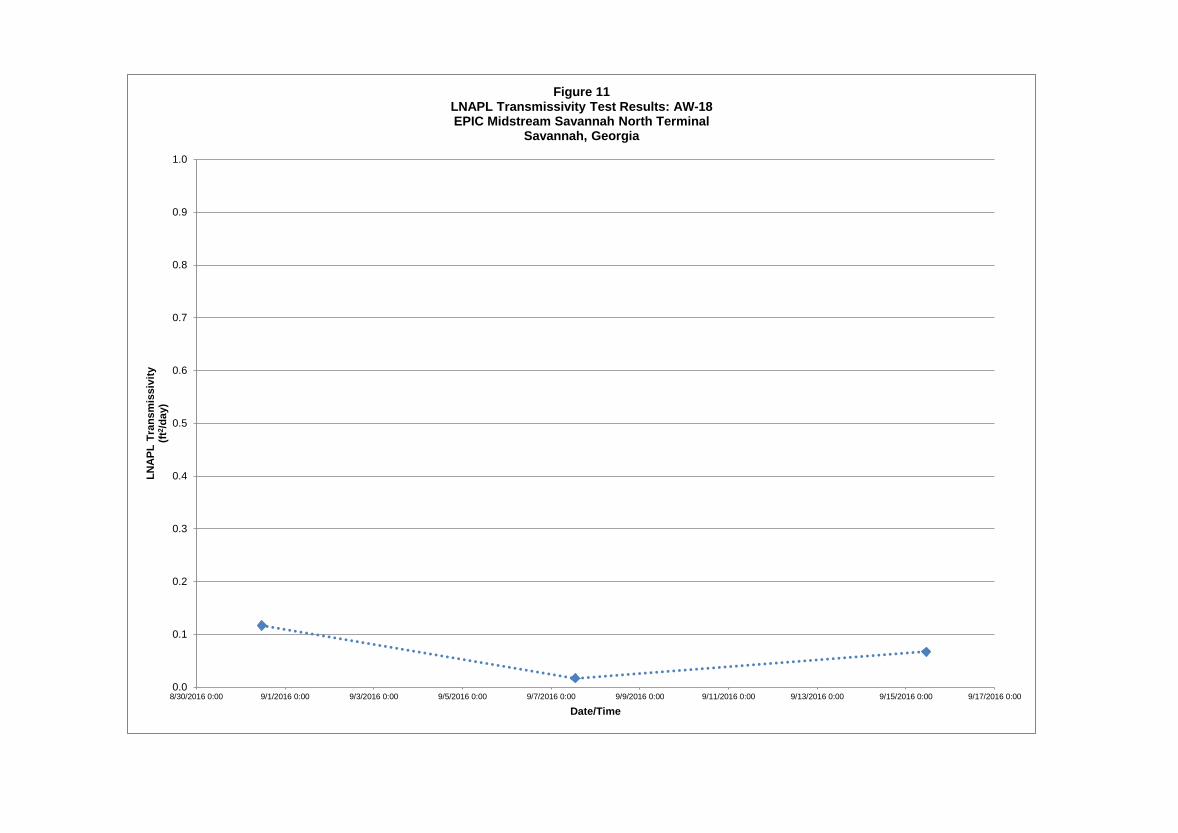
0.0
0.1
0.2
0.3
0.4
0.5
0.6
0.7
0.8
0.9
1.0
8/30/2016 0:00 9/1/2016 0:00 9/3/2016 0:00 9/5/2016 0:00 9/7/2016 0:00 9/9/2016 0:00 9/11/2016 0:00 9/13/2016 0:00 9/15/2016 0:00 9/17/2016 0:00
LN
AP
L T
ran
smis
sivi
ty
(ft2 /
day
)
Date/Time
Figure 11 LNAPL Transmissivity Test Results: AW-18 EPIC Midstream Savannah North Terminal
Savannah, Georgia
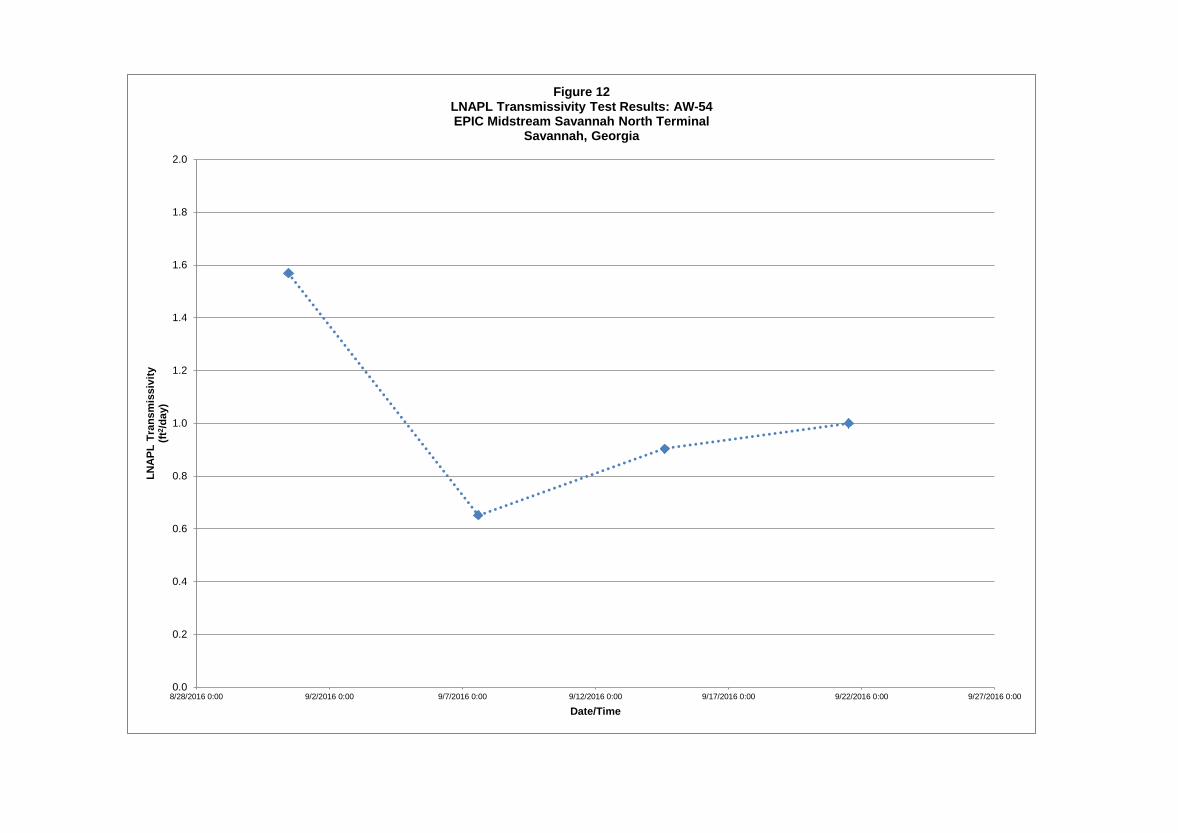
0.0
0.2
0.4
0.6
0.8
1.0
1.2
1.4
1.6
1.8
2.0
8/28/2016 0:00 9/2/2016 0:00 9/7/2016 0:00 9/12/2016 0:00 9/17/2016 0:00 9/22/2016 0:00 9/27/2016 0:00
LN
AP
L T
ran
smis
sivi
ty
(ft2 /
day
)
Date/Time
Figure 12 LNAPL Transmissivity Test Results: AW-54 EPIC Midstream Savannah North Terminal
Savannah, Georgia
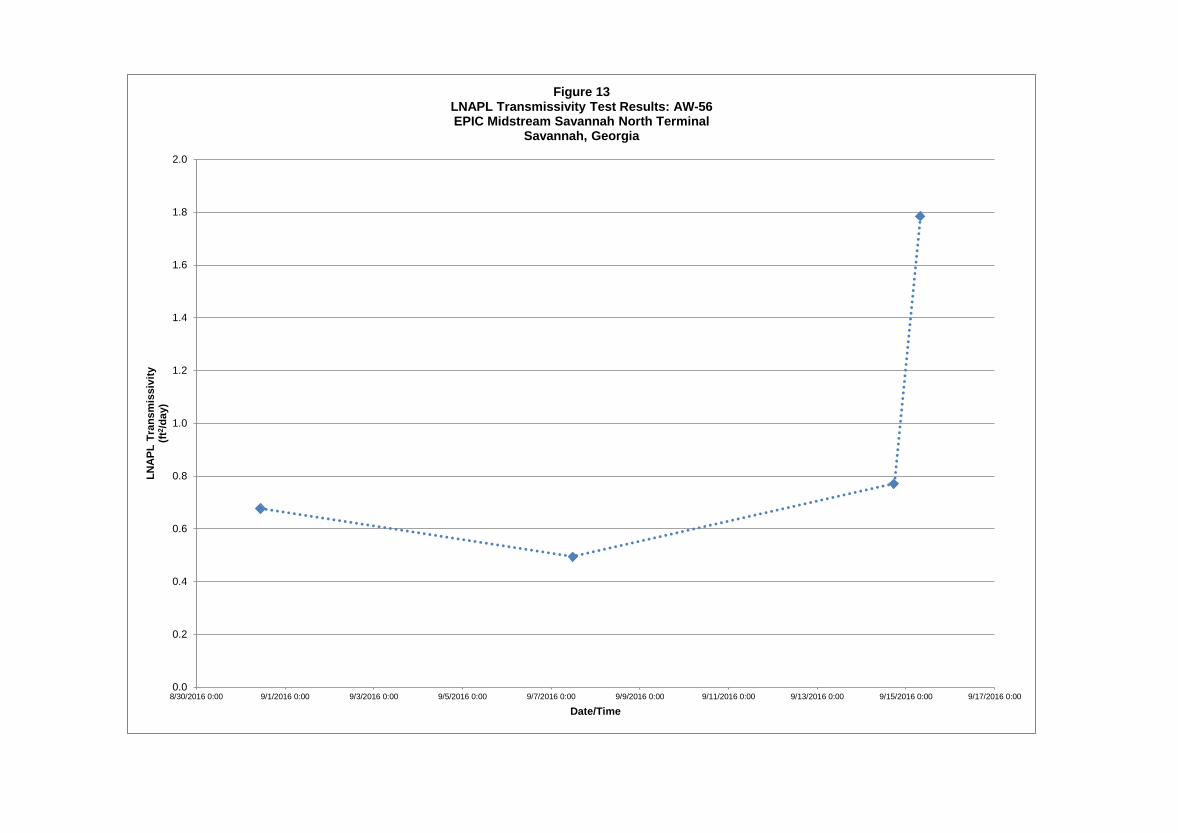
0.0
0.2
0.4
0.6
0.8
1.0
1.2
1.4
1.6
1.8
2.0
8/30/2016 0:00 9/1/2016 0:00 9/3/2016 0:00 9/5/2016 0:00 9/7/2016 0:00 9/9/2016 0:00 9/11/2016 0:00 9/13/2016 0:00 9/15/2016 0:00 9/17/2016 0:00
LN
AP
L T
ran
smis
sivi
ty
(ft2 /
day
)
Date/Time
Figure 13 LNAPL Transmissivity Test Results: AW-56 EPIC Midstream Savannah North Terminal
Savannah, Georgia
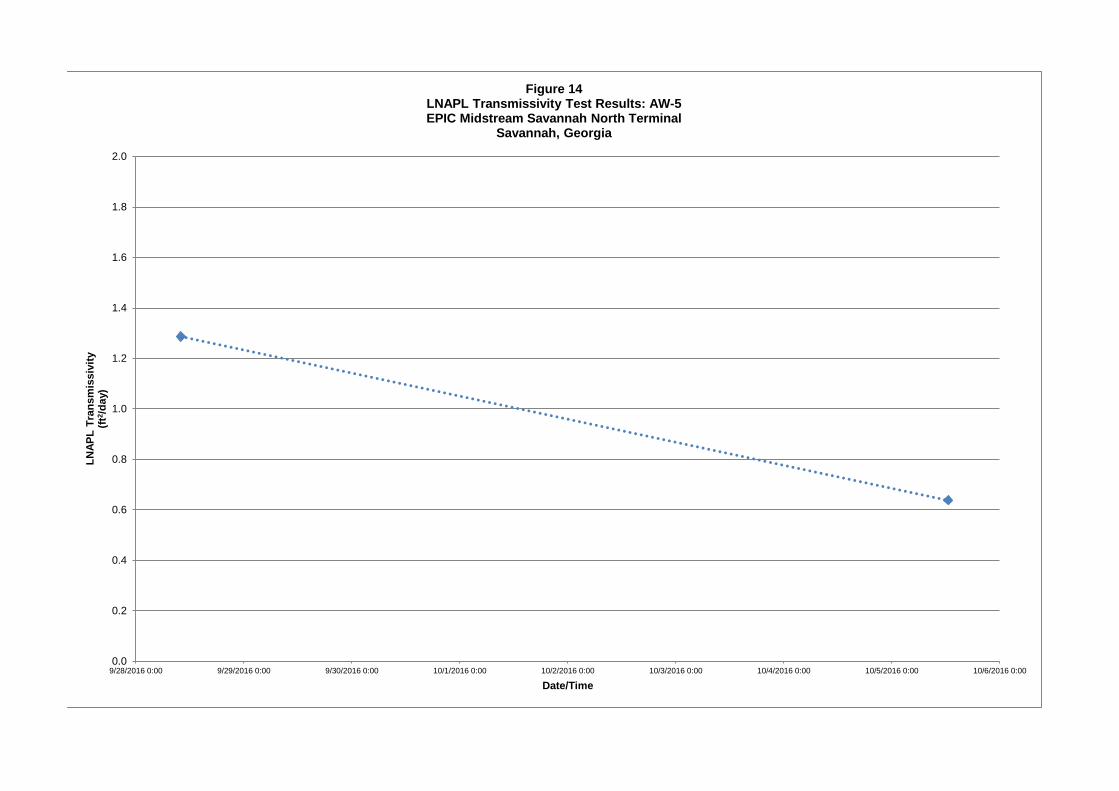
0.0
0.2
0.4
0.6
0.8
1.0
1.2
1.4
1.6
1.8
2.0
9/28/2016 0:00 9/29/2016 0:00 9/30/2016 0:00 10/1/2016 0:00 10/2/2016 0:00 10/3/2016 0:00 10/4/2016 0:00 10/5/2016 0:00 10/6/2016 0:00
LN
AP
L T
ran
smis
sivi
ty
(ft2 /
day
)
Date/Time
Figure 14 LNAPL Transmissivity Test Results: AW-5 EPIC Midstream Savannah North Terminal
Savannah, Georgia
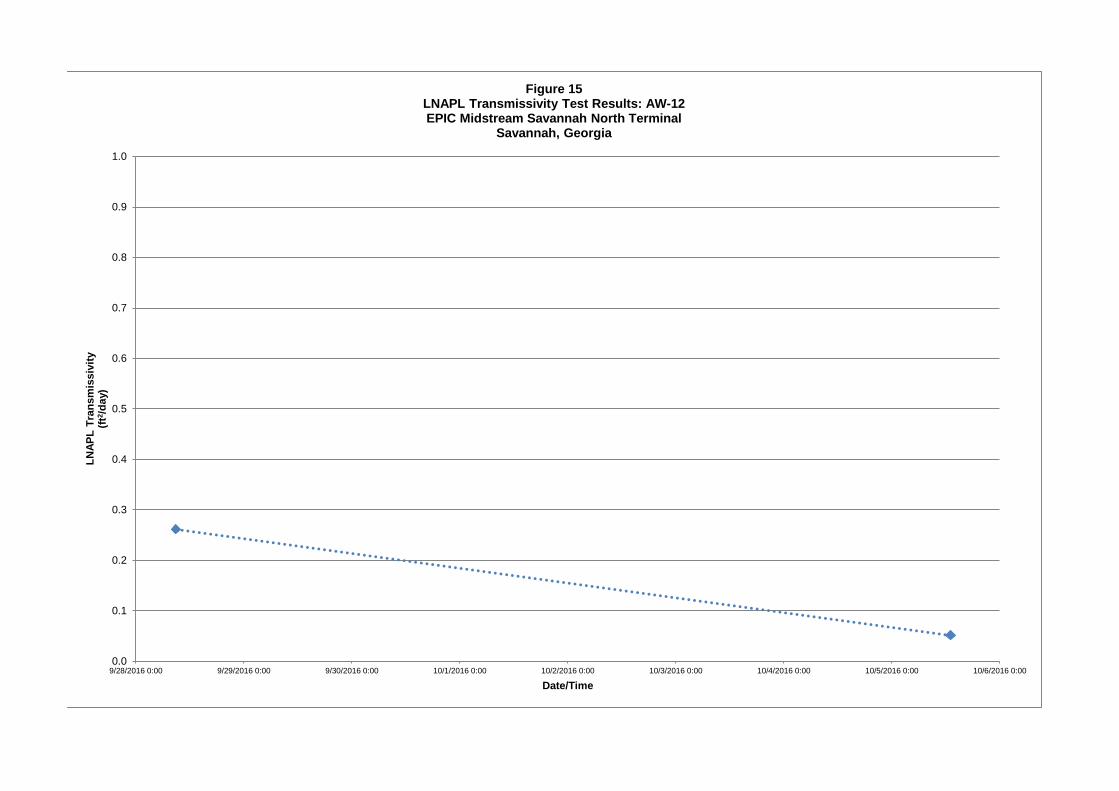
0.0
0.1
0.2
0.3
0.4
0.5
0.6
0.7
0.8
0.9
1.0
9/28/2016 0:00 9/29/2016 0:00 9/30/2016 0:00 10/1/2016 0:00 10/2/2016 0:00 10/3/2016 0:00 10/4/2016 0:00 10/5/2016 0:00 10/6/2016 0:00
LN
AP
L T
ran
smis
sivi
ty
(ft2 /
day
)
Date/Time
Figure 15 LNAPL Transmissivity Test Results: AW-12 EPIC Midstream Savannah North Terminal
Savannah, Georgia
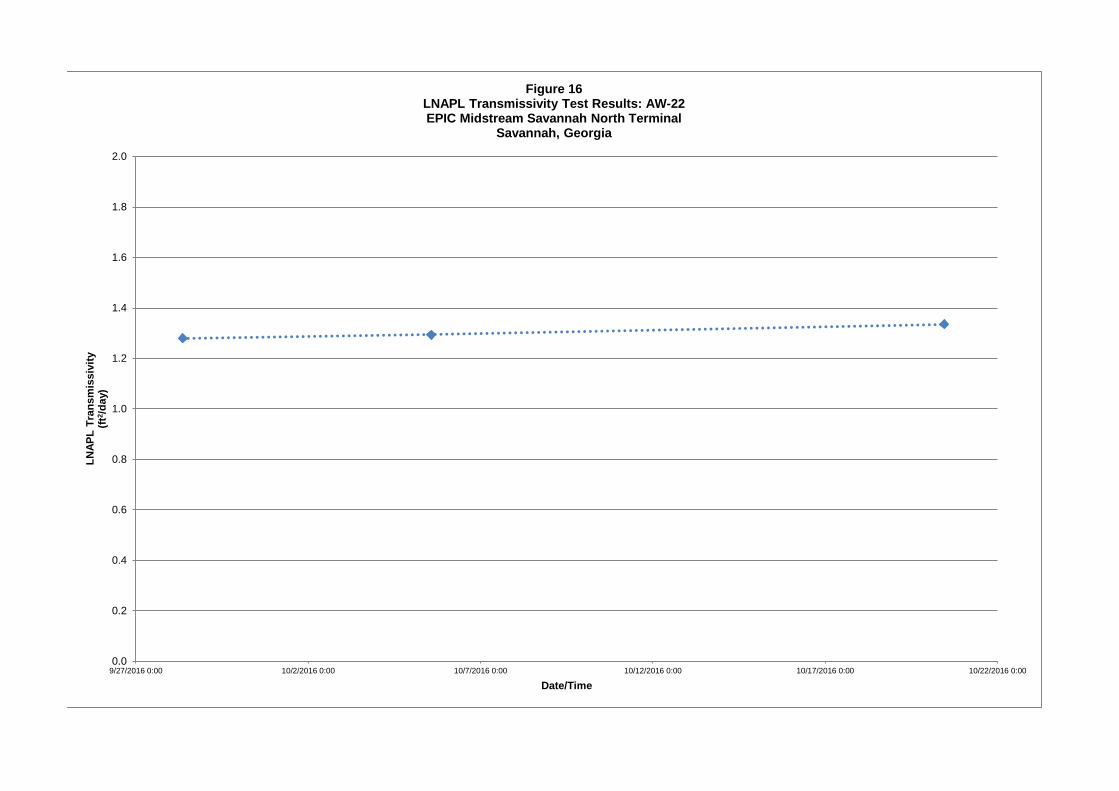
0.0
0.2
0.4
0.6
0.8
1.0
1.2
1.4
1.6
1.8
2.0
9/27/2016 0:00 10/2/2016 0:00 10/7/2016 0:00 10/12/2016 0:00 10/17/2016 0:00 10/22/2016 0:00
LN
AP
L T
ran
smis
sivi
ty
(ft2 /
day
)
Date/Time
Figure 16 LNAPL Transmissivity Test Results: AW-22 EPIC Midstream Savannah North Terminal
Savannah, Georgia
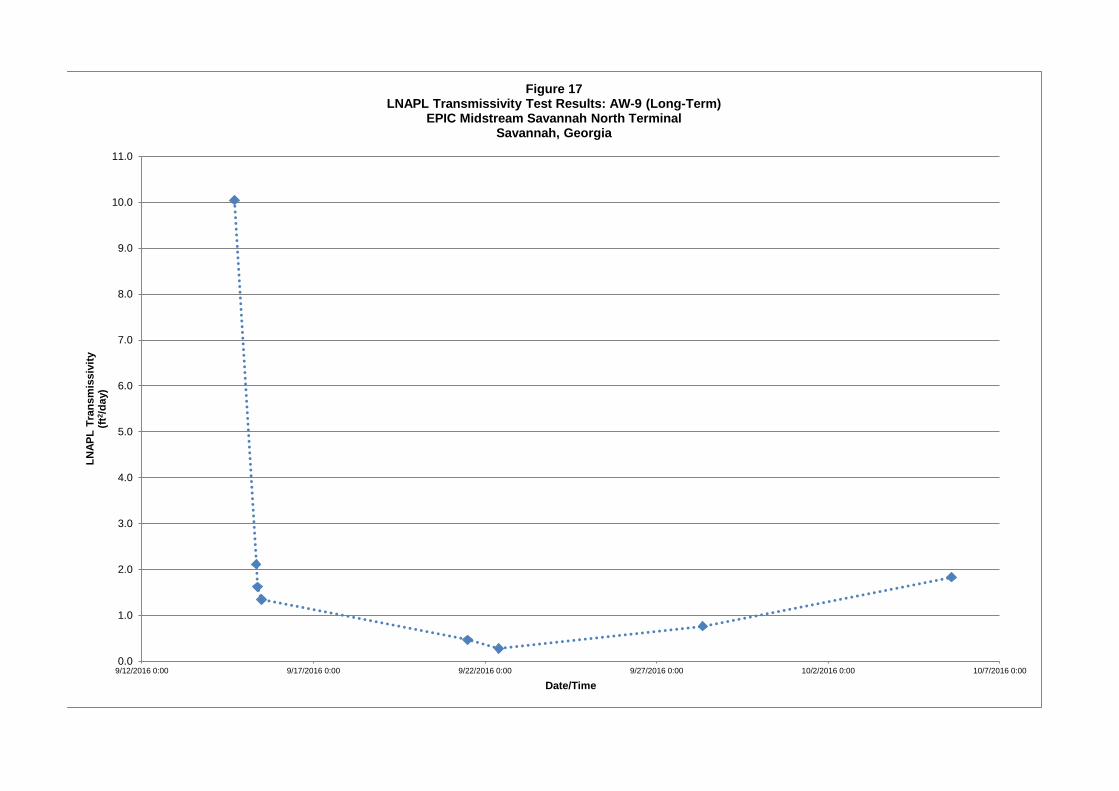
0.0
1.0
2.0
3.0
4.0
5.0
6.0
7.0
8.0
9.0
10.0
11.0
9/12/2016 0:00 9/17/2016 0:00 9/22/2016 0:00 9/27/2016 0:00 10/2/2016 0:00 10/7/2016 0:00
LN
AP
L T
ran
smis
sivi
ty
(ft2 /
day
)
Date/Time
Figure 17 LNAPL Transmissivity Test Results: AW-9 (Long-Term)
EPIC Midstream Savannah North Terminal Savannah, Georgia
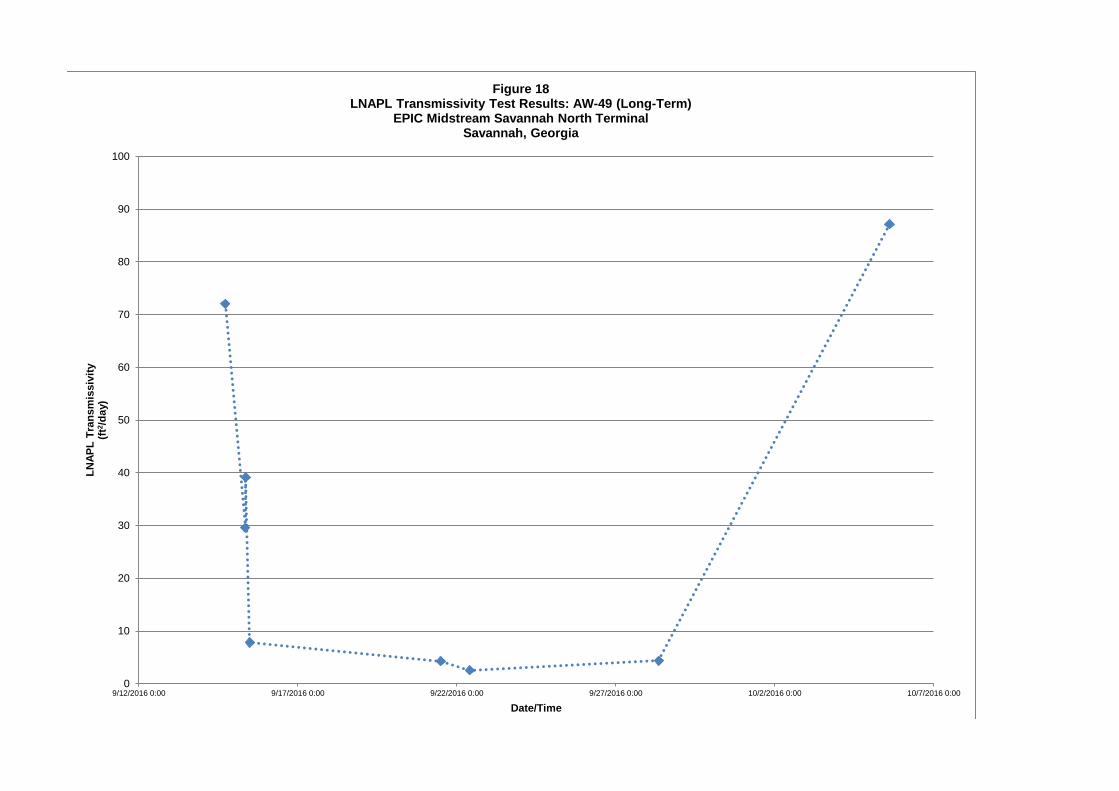
0
10
20
30
40
50
60
70
80
90
100
9/12/2016 0:00 9/17/2016 0:00 9/22/2016 0:00 9/27/2016 0:00 10/2/2016 0:00 10/7/2016 0:00
LN
AP
L T
ran
smis
sivi
ty
(ft2 /
day
)
Date/Time
Figure 18 LNAPL Transmissivity Test Results: AW-49 (Long-Term)
EPIC Midstream Savannah North Terminal Savannah, Georgia
GHD | Epic Midstream, LLC – 2016 2nd Semi-Annual Progress Report | 089400 (3)
Appendix D Engineering Fees Summary
May 23, 2016 through November 13, 2016
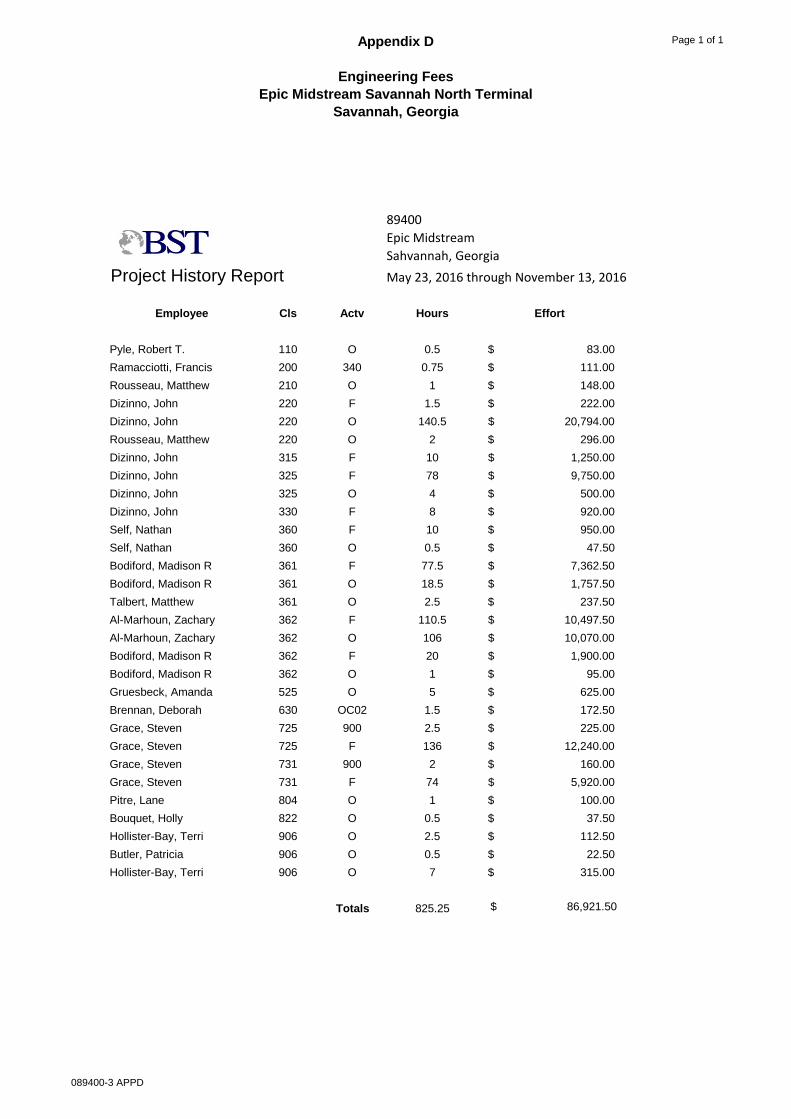
Appendix D
Engineering FeesEpic Midstream Savannah North Terminal
Savannah, Georgia
Page 1 of 1
89400
Epic Midstream
Sahvannah, Georgia
Project History Report May 23, 2016 through November 13, 2016
Employee Cls Actv Hours Effort
Pyle, Robert T. 110 O 0.5 $ 83.00
Ramacciotti, Francis 200 340 0.75 $ 111.00
Rousseau, Matthew 210 O 1 $ 148.00
Dizinno, John 220 F 1.5 $ 222.00
Dizinno, John 220 O 140.5 $ 20,794.00
Rousseau, Matthew 220 O 2 $ 296.00
Dizinno, John 315 F 10 $ 1,250.00
Dizinno, John 325 F 78 $ 9,750.00
Dizinno, John 325 O 4 $ 500.00
Dizinno, John 330 F 8 $ 920.00
Self, Nathan 360 F 10 $ 950.00
Self, Nathan 360 O 0.5 $ 47.50
Bodiford, Madison R 361 F 77.5 $ 7,362.50
Bodiford, Madison R 361 O 18.5 $ 1,757.50
Talbert, Matthew 361 O 2.5 $ 237.50
Al-Marhoun, Zachary 362 F 110.5 $ 10,497.50
Al-Marhoun, Zachary 362 O 106 $ 10,070.00
Bodiford, Madison R 362 F 20 $ 1,900.00
Bodiford, Madison R 362 O 1 $ 95.00
Gruesbeck, Amanda 525 O 5 $ 625.00
Brennan, Deborah 630 OC02 1.5 $ 172.50
Grace, Steven 725 900 2.5 $ 225.00
Grace, Steven 725 F 136 $ 12,240.00
Grace, Steven 731 900 2 $ 160.00
Grace, Steven 731 F 74 $ 5,920.00
Pitre, Lane 804 O 1 $ 100.00
Bouquet, Holly 822 O 0.5 $ 37.50
Hollister-Bay, Terri 906 O 2.5 $ 112.50
Butler, Patricia 906 O 0.5 $ 22.50
Hollister-Bay, Terri 906 O 7 $ 315.00
Totals 825.25 $ 86,921.50
089400-3 APPD