Embed Size (px)
Citation preview
2016-17 School Accountability Report Card for Creekside High School Page 1 of 12
Creekside High School
School Accountability Report Card
Reported Using Data from the 2016-17 School Year
Published During 2017-18
By February 1 of each year, every school in California is required by state law to publish a School Accountability Report Card (SARC). The SARC contains information about the condition and performance of each California public school. Under the Local Control Funding Formula (LCFF) all local educational agencies (LEAs) are required to prepare a Local Control and Accountability Plan (LCAP), which describes how they intend to meet annual school-specific goals for all pupils, with specific activities to address state and local priorities. Additionally, data reported in an LCAP is to be consistent with data reported in the SARC. • For more information about SARC requirements, see the California Department of Education (CDE) SARC Web page at
http://www.cde.ca.gov/ta/ac/sa/. • For more information about the LCFF or LCAP, see the CDE LCFF Web page at http://www.cde.ca.gov/fg/aa/lc/. • For additional information about the school, parents/guardians and community members should contact the school principal or
the district office. DataQuest DataQuest is an online data tool located on the CDE DataQuest Web page at http://dq.cde.ca.gov/dataquest/ that contains additional information about this school and comparisons of the school to the district and the county. Specifically, DataQuest is a dynamic system that provides reports for accountability (e.g., test data, enrollment, high school graduates, dropouts, course enrollments, staffing, and data regarding English learners). Internet Access Internet access is available at public libraries and other locations that are publicly accessible (e.g., the California State Library). Access to the Internet at libraries and public locations is generally provided on a first-come, first-served basis. Other use restrictions may include the hours of operation, the length of time that a workstation may be used (depending on availability), the types of software programs available on a workstation, and the ability to print documents.
About This School Contact Information (School Year 2017-18)
School Contact Information
School Name------- Creekside High School
Street------- 20000 Broadway
City, State, Zip------- Sonoma, CA 95476
Phone Number------- 707-933-4046
Principal------- Sydney Smith
E-mail Address------- [email protected]
Web Site------- www.creeksidehs.org
CDS Code 49-70953-4930152
2016-17 School Accountability Report Card for Creekside High School Page 2 of 12
District Contact Information
District Name------- Sonoma Valley Unified School District
Phone Number------- 707-935-6000
Superintendent-------
Dr. Charles E. Young
E-mail Address------- [email protected]
Web Site------- www.svusdca.org School Description and Mission Statement (School Year 2017-18)
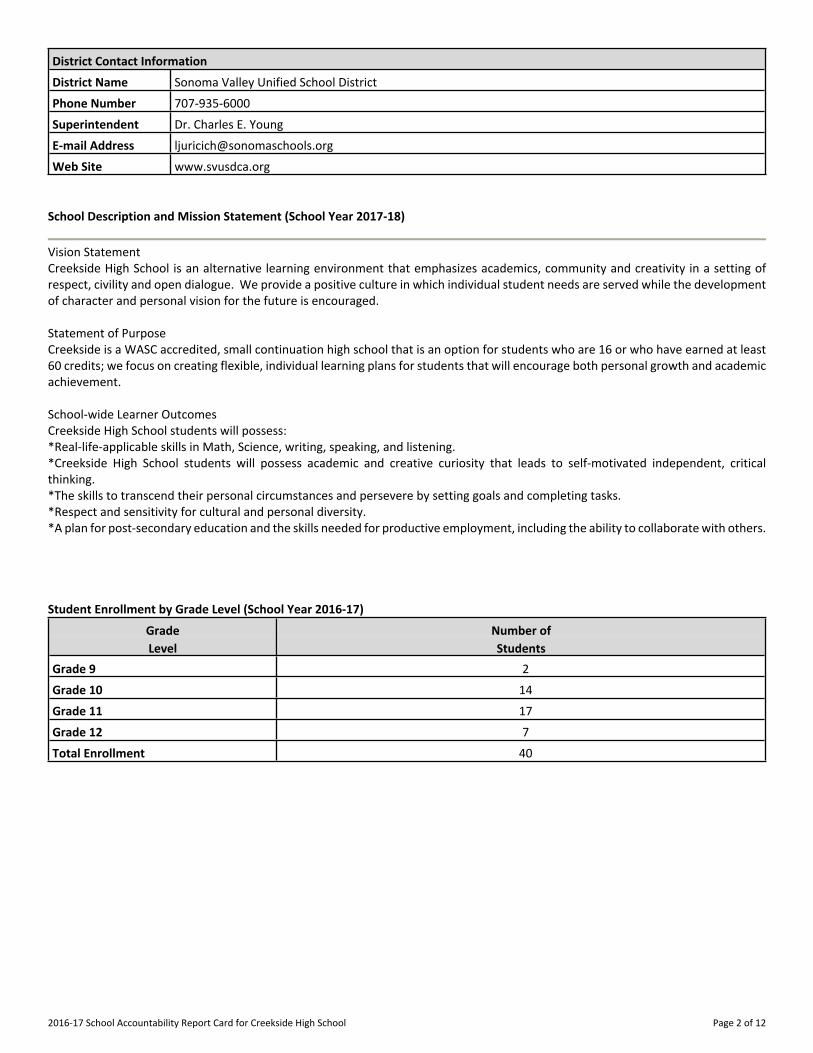
Vision Statement Creekside High School is an alternative learning environment that emphasizes academics, community and creativity in a setting of respect, civility and open dialogue. We provide a positive culture in which individual student needs are served while the development of character and personal vision for the future is encouraged. Statement of Purpose Creekside is a WASC accredited, small continuation high school that is an option for students who are 16 or who have earned at least 60 credits; we focus on creating flexible, individual learning plans for students that will encourage both personal growth and academic achievement. School-wide Learner Outcomes Creekside High School students will possess: *Real-life-applicable skills in Math, Science, writing, speaking, and listening. *Creekside High School students will possess academic and creative curiosity that leads to self-motivated independent, critical thinking. *The skills to transcend their personal circumstances and persevere by setting goals and completing tasks. *Respect and sensitivity for cultural and personal diversity. *A plan for post-secondary education and the skills needed for productive employment, including the ability to collaborate with others. Student Enrollment by Grade Level (School Year 2016-17)
Grade Number of Level Students
Grade 9 2
Grade 10 14
Grade 11 17
Grade 12 7
Total Enrollment 40

2016-17 School Accountability Report Card for Creekside High School Page 3 of 12
Student Enrollment by Group (School Year 2016-17)
Student Percent of Group Total Enrollment
Black or African American 0
American Indian or Alaska Native 0
Asian 0
Filipino 0
Hispanic or Latino 75
Native Hawaiian or Pacific Islander 0
White 25
Two or More Races 0
Socioeconomically Disadvantaged 62.5
English Learners 20
Students with Disabilities 15
Foster Youth 0
A. Conditions of Learning State Priority: Basic The SARC provides the following information relevant to the State priority: Basic (Priority 1): • Degree to which teachers are appropriately assigned and fully credentialed in the subject area and for the pupils they are
teaching; • Pupils have access to standards-aligned instructional materials; and • School facilities are maintained in good repair. Teacher Credentials
School District Teachers
2015-16 2016-17 2017-18 2017-18
With Full Credential 3 3 3
Without Full Credential 0 0 0
Teaching Outside Subject Area of Competence (with full credential) 2 0 3 Teacher Misassignments and Vacant Teacher Positions
Indicator 2015-16 2016-17 2017-18
Misassignments of Teachers of English Learners 0 0 0
Total Teacher Misassignments * 0 0 0
Vacant Teacher Positions 0 0 0 Note: “Misassignments” refers to the number of positions filled by teachers who lack legal authorization to teach that grade level, subject area, student group, etc. * Total Teacher Misassignments includes the number of Misassignments of Teachers of English Learners. Quality, Currency, Availability of Textbooks and Instructional Materials (School Year 2017-18) Year and month in which data were collected: October 2017 The Board of Trustees certified that all Creekside students had sufficient textbooks and instructional materials at their September 2017 meeting.

2016-17 School Accountability Report Card for Creekside High School Page 4 of 12
Subject Textbooks and Instructional Materials/ Year of Adoption
From Most Recent
Adoption?
Percent of Students Lacking Own
Assigned Copy
Reading/Language Arts Literature-based as per approved reading list. Adopted May 2002 Academic Language and Development: Shining Star, Adopted May 2009
Yes 0
Mathematics College Preparatory Math (CPM): Algebra I: Algebra Core Connections, Adopted June 2016 Geometry: Geometry Connections, Adopted June 2010 Algebra II: Algebra 2 Connections, Adopted June 2010 Precalculus (Math 4): Precalculus w/Trigonometry, Adopted June 2010 Advanced Placement Statistics: Pearson, Stats: Modeling the World, Adopted April 2004 Advanced Placement Calculus: Engage Learning, AP Edition, Calculus of Single Variable, 9th Edition, Adopted November 2012
Yes 0
Science Science Technology I and II and Lab Physical Science: Holt Science Spectrum, A Physical Approach, Adopted Feb. 2001 Earth Science: Prentice Hall Earth Science, Adopted May 2011 Biology: Prentice Hall - Biology, Adopted May 2009 Advanced Placement Biology: Biology, 10th Edition, McGraw Hill, Adopted May 2014 Chemistry: Prentice Hall Chemistry (approved 1994. Updated edition 2007 purchased April 2007) Ag. Earth Science: Prentice Hall Earth Science by Tarbuck & Lutgens, Adopted April 2007 Ag. Earth Science: Prentice Hall Earth Science, Tarbuck & Lutgens, Adopted April 2007 Sustainable Agriculture: National Geographic Glencoe Science: Biology, Student Edition, Adopted December 2015 Ag. Power Mechanics: Delmar Publishing Small Engine Technology, Adopted June 2016 Advanced Placement Environmental Science: John Wiley and Sons, Environment, Adopted June 2015
Yes 0

2016-17 School Accountability Report Card for Creekside High School Page 5 of 12
Subject Textbooks and Instructional Materials/ Year of Adoption
From Most Recent
Adoption?
Percent of Students Lacking Own
Assigned Copy
History-Social Science World Geography & Cultures: Glencoe World Geography and Cultures, Adopted June 2011 World History: McDougal Littell Modern World History: Patterns of Interaction (CA Edition), Adopted May 2006 US History: McDougal Littell, The Americans, Adopted June 2003 Civics: Teachers’ Curriculum Institute (TCI) Government Alive!, Adopted May 2011 Economics: Holt, Economics, Adopted June 2003 Advanced Placement US History: Pearson Longman, American Past and Present (9th AP Edition), Adopted June 2010 Advanced Placement World History: Wadsworth Cengage Learning, The Earth and It’s Peoples: A Global History (4th AP Edition), Adopted June 2010 Advanced Placement United States Government and Politics: Magleby, Light & Nemacheck Government by the People, 24th Edition, Adopted May 2016
Yes 0
Foreign Language Spanish: Holt McDougal !Avancemos! Levels 1-4, Adopted June 2011 French: McDougal Littell Discovering French Nouveau!, Levels 1-3 Glencoe McGraw Hill Tresors du temps, Niveau Avance, Level 4. Adopted June 2011
Yes
School Facility Conditions and Planned Improvements (Most Recent Year)
Creekside High School is located in what was previously the social studies wing of the comprehensive high school. There are four classrooms, a counseling office space, a child care facility and a conference room. Large raised garden beds were built on the grounds four years ago, for student learning and enjoyment; students helped construct a pergola and benches two years ago. Due to the passage of bond measure E, our facilities will be renovated in the next couple of years. School Facility Good Repair Status (Most Recent Year) Using the most recently collected FIT data (or equivalent), provide the following:
• Determination of repair status for systems listed • Description of any needed maintenance to ensure good repair • The year and month in which the data were collected • The overall rating
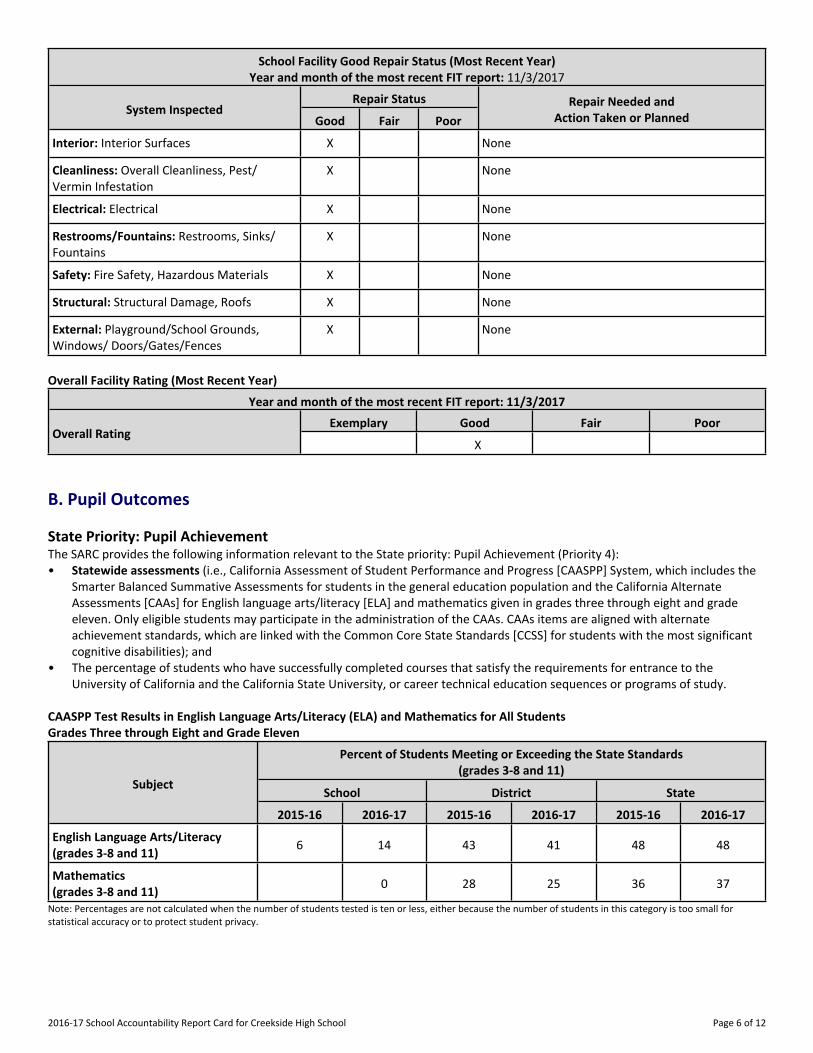
School Facility Good Repair Status (Most Recent Year) Year and month of the most recent FIT report: 11/3/2017
Repair Status System Inspected
Good Fair Poor Repair Needed and
Action Taken or Planned
Systems: Gas Leaks, Mechanical/HVAC, Sewer
X None
2016-17 School Accountability Report Card for Creekside High School Page 6 of 12
School Facility Good Repair Status (Most Recent Year) Year and month of the most recent FIT report: 11/3/2017
Repair Status System Inspected
Good Fair Poor Repair Needed and
Action Taken or Planned
Interior: Interior Surfaces X None
Cleanliness: Overall Cleanliness, Pest/ Vermin Infestation
X None
Electrical: Electrical X None
Restrooms/Fountains: Restrooms, Sinks/ Fountains
X None
Safety: Fire Safety, Hazardous Materials X None
Structural: Structural Damage, Roofs X None
External: Playground/School Grounds, Windows/ Doors/Gates/Fences
X None
Overall Facility Rating (Most Recent Year)
Year and month of the most recent FIT report: 11/3/2017
Exemplary Good Fair Poor Overall Rating
X
B. Pupil Outcomes State Priority: Pupil Achievement The SARC provides the following information relevant to the State priority: Pupil Achievement (Priority 4): • Statewide assessments (i.e., California Assessment of Student Performance and Progress [CAASPP] System, which includes the
Smarter Balanced Summative Assessments for students in the general education population and the California Alternate Assessments [CAAs] for English language arts/literacy [ELA] and mathematics given in grades three through eight and grade eleven. Only eligible students may participate in the administration of the CAAs. CAAs items are aligned with alternate achievement standards, which are linked with the Common Core State Standards [CCSS] for students with the most significant cognitive disabilities); and
• The percentage of students who have successfully completed courses that satisfy the requirements for entrance to the University of California and the California State University, or career technical education sequences or programs of study.
CAASPP Test Results in English Language Arts/Literacy (ELA) and Mathematics for All Students Grades Three through Eight and Grade Eleven
Percent of Students Meeting or Exceeding the State Standards (grades 3-8 and 11)
School District State Subject
2015-16 2016-17 2015-16 2016-17 2015-16 2016-17
English Language Arts/Literacy (grades 3-8 and 11) 6 14 43 41 48 48
Mathematics (grades 3-8 and 11)
0 28 25 36 37
Note: Percentages are not calculated when the number of students tested is ten or less, either because the number of students in this category is too small for statistical accuracy or to protect student privacy.
2016-17 School Accountability Report Card for Creekside High School Page 7 of 12
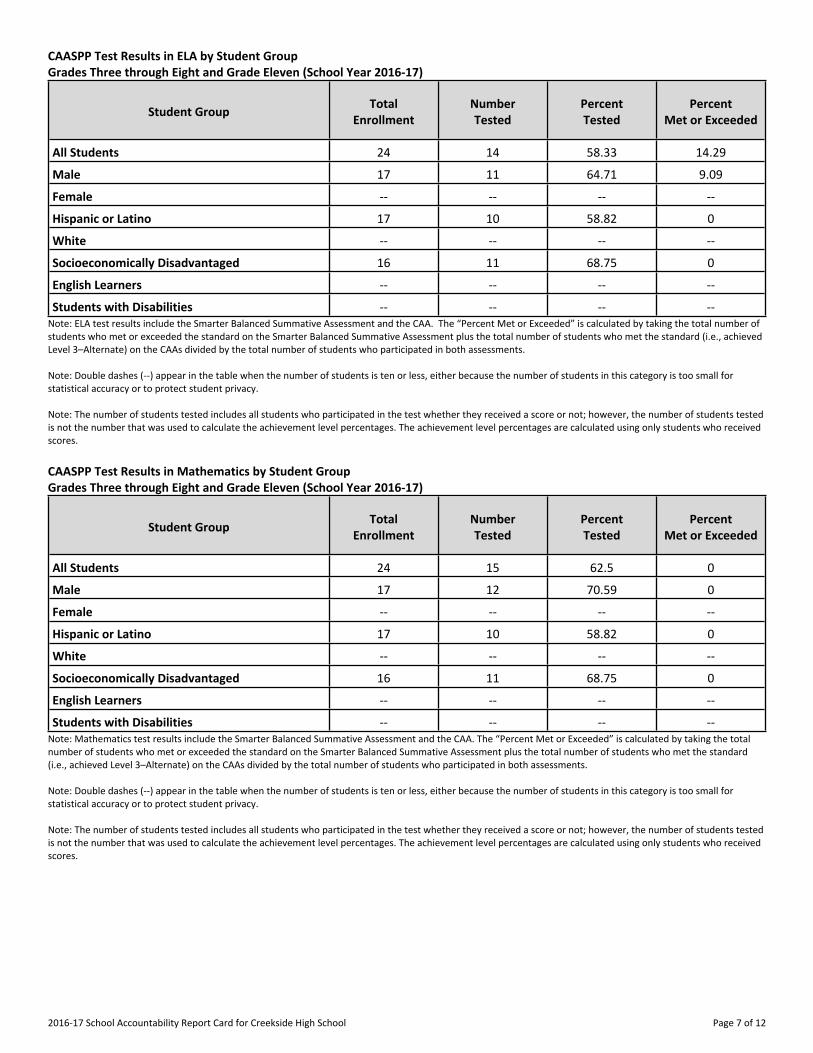
CAASPP Test Results in ELA by Student Group Grades Three through Eight and Grade Eleven (School Year 2016-17)
Student Group Total Enrollment
Number Tested
Percent Tested
Percent Met or Exceeded
All Students 24 14 58.33 14.29
Male 17 11 64.71 9.09
Female -- -- -- --
Hispanic or Latino 17 10 58.82 0
White -- -- -- --
Socioeconomically Disadvantaged 16 11 68.75 0
English Learners -- -- -- --
Students with Disabilities -- -- -- -- Note: ELA test results include the Smarter Balanced Summative Assessment and the CAA. The “Percent Met or Exceeded” is calculated by taking the total number of students who met or exceeded the standard on the Smarter Balanced Summative Assessment plus the total number of students who met the standard (i.e., achieved Level 3–Alternate) on the CAAs divided by the total number of students who participated in both assessments. Note: Double dashes (--) appear in the table when the number of students is ten or less, either because the number of students in this category is too small for statistical accuracy or to protect student privacy. Note: The number of students tested includes all students who participated in the test whether they received a score or not; however, the number of students tested is not the number that was used to calculate the achievement level percentages. The achievement level percentages are calculated using only students who received scores. CAASPP Test Results in Mathematics by Student Group Grades Three through Eight and Grade Eleven (School Year 2016-17)
Student Group Total Enrollment
Number Tested
Percent Tested
Percent Met or Exceeded
All Students 24 15 62.5 0
Male 17 12 70.59 0
Female -- -- -- --
Hispanic or Latino 17 10 58.82 0
White -- -- -- --
Socioeconomically Disadvantaged 16 11 68.75 0
English Learners -- -- -- --
Students with Disabilities -- -- -- -- Note: Mathematics test results include the Smarter Balanced Summative Assessment and the CAA. The “Percent Met or Exceeded” is calculated by taking the total number of students who met or exceeded the standard on the Smarter Balanced Summative Assessment plus the total number of students who met the standard (i.e., achieved Level 3–Alternate) on the CAAs divided by the total number of students who participated in both assessments. Note: Double dashes (--) appear in the table when the number of students is ten or less, either because the number of students in this category is too small for statistical accuracy or to protect student privacy. Note: The number of students tested includes all students who participated in the test whether they received a score or not; however, the number of students tested is not the number that was used to calculate the achievement level percentages. The achievement level percentages are calculated using only students who received scores.
2016-17 School Accountability Report Card for Creekside High School Page 8 of 12
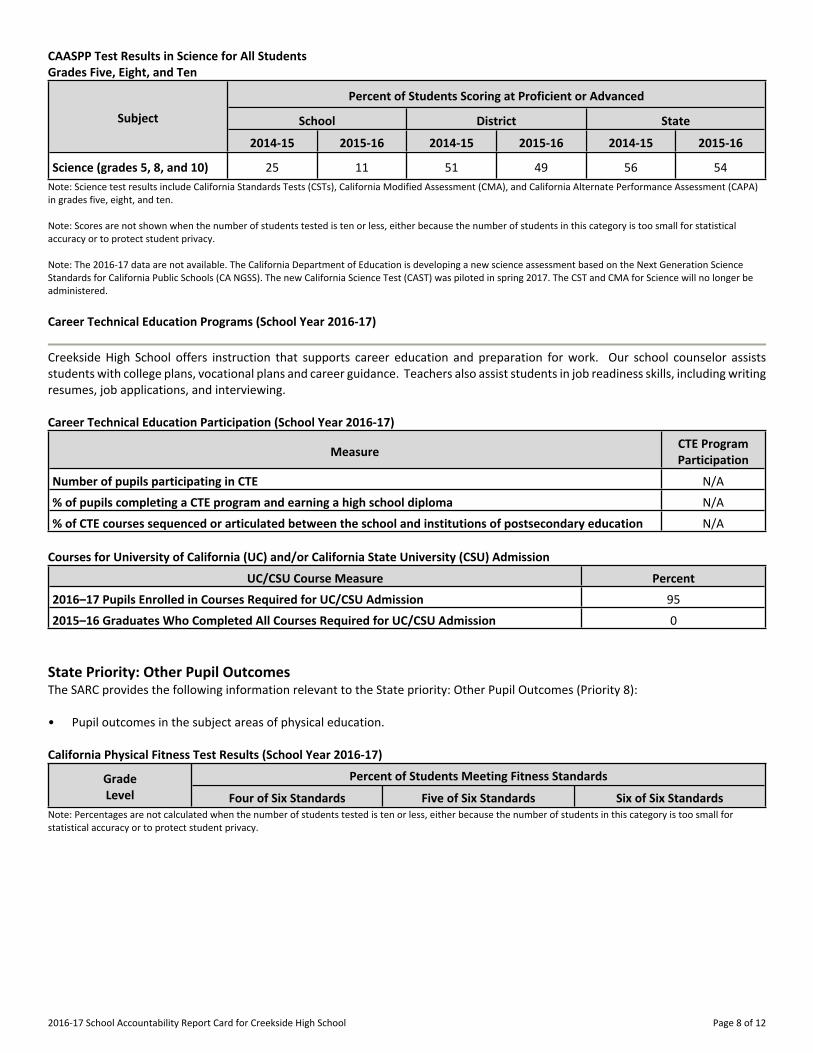
CAASPP Test Results in Science for All Students Grades Five, Eight, and Ten
Percent of Students Scoring at Proficient or Advanced
School District State Subject
2014-15 2015-16 2014-15 2015-16 2014-15 2015-16
Science (grades 5, 8, and 10) 25 11 51 49 56 54 Note: Science test results include California Standards Tests (CSTs), California Modified Assessment (CMA), and California Alternate Performance Assessment (CAPA) in grades five, eight, and ten. Note: Scores are not shown when the number of students tested is ten or less, either because the number of students in this category is too small for statistical accuracy or to protect student privacy. Note: The 2016-17 data are not available. The California Department of Education is developing a new science assessment based on the Next Generation Science Standards for California Public Schools (CA NGSS). The new California Science Test (CAST) was piloted in spring 2017. The CST and CMA for Science will no longer be administered. Career Technical Education Programs (School Year 2016-17)
Creekside High School offers instruction that supports career education and preparation for work. Our school counselor assists students with college plans, vocational plans and career guidance. Teachers also assist students in job readiness skills, including writing resumes, job applications, and interviewing. Career Technical Education Participation (School Year 2016-17)
Measure CTE Program Participation
Number of pupils participating in CTE N/A
% of pupils completing a CTE program and earning a high school diploma N/A
% of CTE courses sequenced or articulated between the school and institutions of postsecondary education N/A Courses for University of California (UC) and/or California State University (CSU) Admission
UC/CSU Course Measure Percent
2016–17 Pupils Enrolled in Courses Required for UC/CSU Admission 95
2015–16 Graduates Who Completed All Courses Required for UC/CSU Admission 0 State Priority: Other Pupil Outcomes The SARC provides the following information relevant to the State priority: Other Pupil Outcomes (Priority 8): • Pupil outcomes in the subject areas of physical education. California Physical Fitness Test Results (School Year 2016-17)
Percent of Students Meeting Fitness Standards Grade Level Four of Six Standards Five of Six Standards Six of Six Standards
Note: Percentages are not calculated when the number of students tested is ten or less, either because the number of students in this category is too small for statistical accuracy or to protect student privacy.
2016-17 School Accountability Report Card for Creekside High School Page 9 of 12
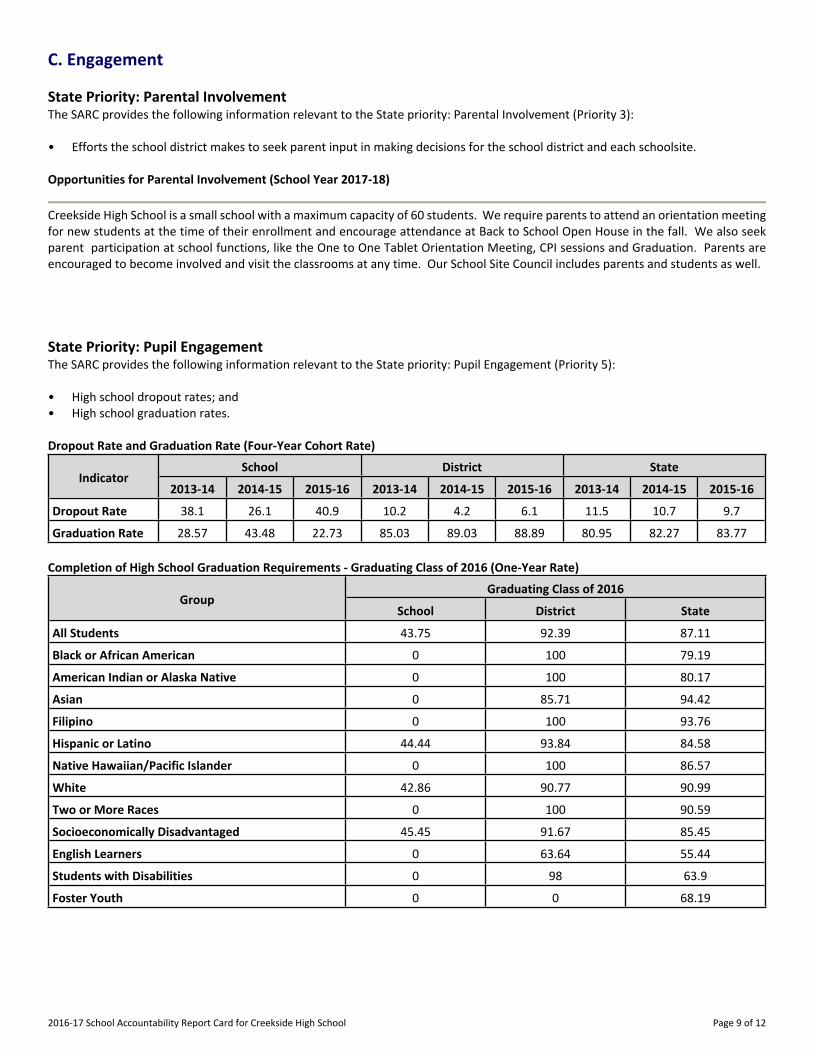
C. Engagement State Priority: Parental Involvement The SARC provides the following information relevant to the State priority: Parental Involvement (Priority 3): • Efforts the school district makes to seek parent input in making decisions for the school district and each schoolsite. Opportunities for Parental Involvement (School Year 2017-18)
Creekside High School is a small school with a maximum capacity of 60 students. We require parents to attend an orientation meeting for new students at the time of their enrollment and encourage attendance at Back to School Open House in the fall. We also seek parent participation at school functions, like the One to One Tablet Orientation Meeting, CPI sessions and Graduation. Parents are encouraged to become involved and visit the classrooms at any time. Our School Site Council includes parents and students as well. State Priority: Pupil Engagement The SARC provides the following information relevant to the State priority: Pupil Engagement (Priority 5): • High school dropout rates; and • High school graduation rates. Dropout Rate and Graduation Rate (Four-Year Cohort Rate)
School District State Indicator
2013-14 2014-15 2015-16 2013-14 2014-15 2015-16 2013-14 2014-15 2015-16
Dropout Rate 38.1 26.1 40.9 10.2 4.2 6.1 11.5 10.7 9.7
Graduation Rate 28.57 43.48 22.73 85.03 89.03 88.89 80.95 82.27 83.77 Completion of High School Graduation Requirements - Graduating Class of 2016 (One-Year Rate)
Graduating Class of 2016 Group
School District State
All Students 43.75 92.39 87.11
Black or African American 0 100 79.19
American Indian or Alaska Native 0 100 80.17
Asian 0 85.71 94.42
Filipino 0 100 93.76
Hispanic or Latino 44.44 93.84 84.58
Native Hawaiian/Pacific Islander 0 100 86.57
White 42.86 90.77 90.99
Two or More Races 0 100 90.59
Socioeconomically Disadvantaged 45.45 91.67 85.45
English Learners 0 63.64 55.44
Students with Disabilities 0 98 63.9
Foster Youth 0 0 68.19
2016-17 School Accountability Report Card for Creekside High School Page 10 of 12
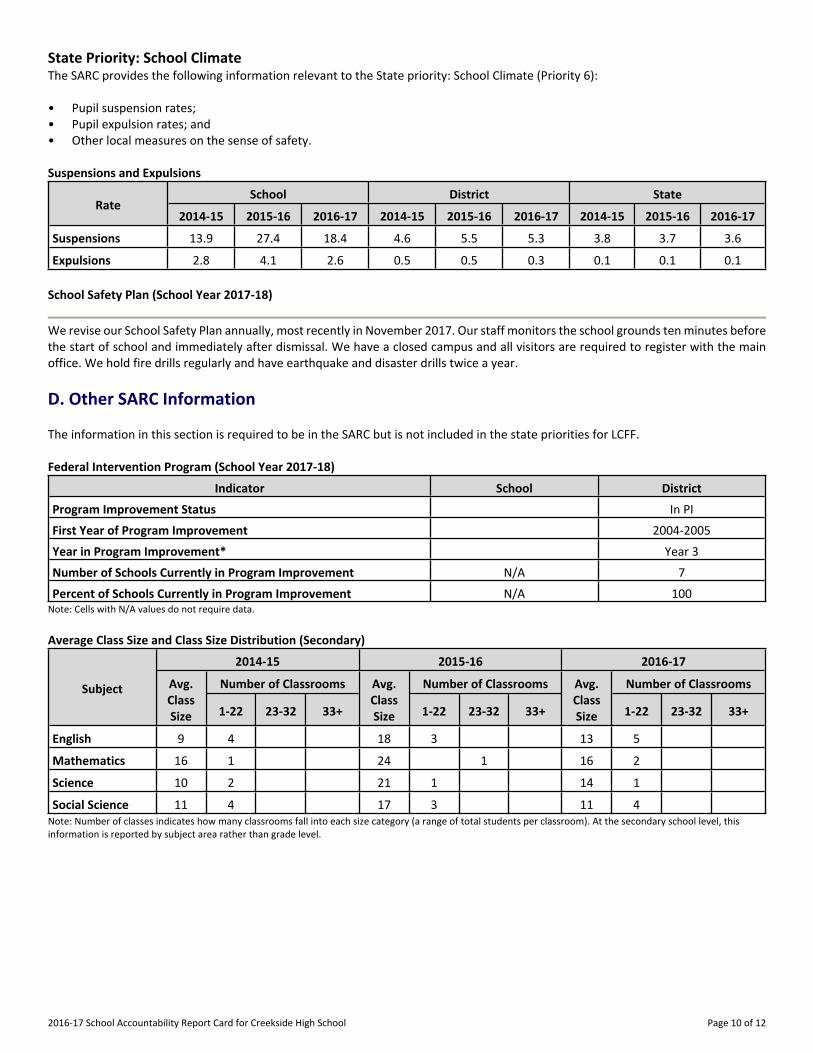
State Priority: School Climate The SARC provides the following information relevant to the State priority: School Climate (Priority 6): • Pupil suspension rates; • Pupil expulsion rates; and • Other local measures on the sense of safety. Suspensions and Expulsions
School District State Rate
2014-15 2015-16 2016-17 2014-15 2015-16 2016-17 2014-15 2015-16 2016-17
Suspensions------- 13.9 27.4 18.4 4.6 5.5 5.3 3.8 3.7 3.6
Expulsions------- 2.8 4.1 2.6 0.5 0.5 0.3 0.1 0.1 0.1 School Safety Plan (School Year 2017-18)
We revise our School Safety Plan annually, most recently in November 2017. Our staff monitors the school grounds ten minutes before the start of school and immediately after dismissal. We have a closed campus and all visitors are required to register with the main office. We hold fire drills regularly and have earthquake and disaster drills twice a year.
D. Other SARC Information The information in this section is required to be in the SARC but is not included in the state priorities for LCFF. Federal Intervention Program (School Year 2017-18)
Indicator School District
Program Improvement Status In PI
First Year of Program Improvement 2004-2005
Year in Program Improvement* Year 3
Number of Schools Currently in Program Improvement N/A 7
Percent of Schools Currently in Program Improvement N/A 100 Note: Cells with N/A values do not require data. Average Class Size and Class Size Distribution (Secondary)
2014-15 2015-16 2016-17
Number of Classrooms Number of Classrooms Number of Classrooms Subject Avg. Class Size 1-22 23-32 33+
Avg. Class Size 1-22 23-32 33+
Avg. Class Size 1-22 23-32 33+
English------- ----------
9 4 18 3 13 5
Mathematics ----------
16 1 24 1 16 2
Science------- ----------
10 2 21 1 14 1
Social Science ----------
11 4 17 3 11 4 Note: Number of classes indicates how many classrooms fall into each size category (a range of total students per classroom). At the secondary school level, this information is reported by subject area rather than grade level.
2016-17 School Accountability Report Card for Creekside High School Page 11 of 12
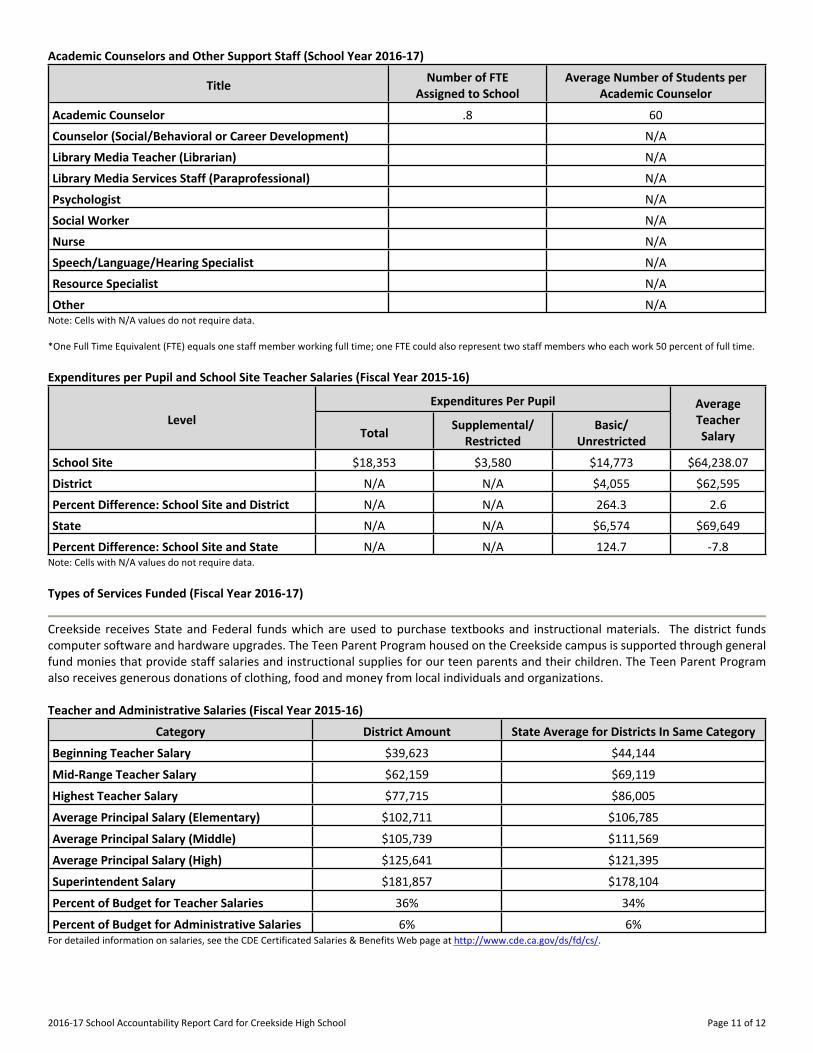
Academic Counselors and Other Support Staff (School Year 2016-17)
Title Number of FTE Assigned to School
Average Number of Students per Academic Counselor
Academic Counselor------- .8 60
Counselor (Social/Behavioral or Career Development) N/A
Library Media Teacher (Librarian) N/A
Library Media Services Staff (Paraprofessional) N/A
Psychologist------- N/A
Social Worker------- N/A
Nurse------- N/A
Speech/Language/Hearing Specialist N/A
Resource Specialist------- N/A
Other------- N/A Note: Cells with N/A values do not require data. *One Full Time Equivalent (FTE) equals one staff member working full time; one FTE could also represent two staff members who each work 50 percent of full time. Expenditures per Pupil and School Site Teacher Salaries (Fiscal Year 2015-16)
Expenditures Per Pupil Level
Total Supplemental/ Restricted
Basic/ Unrestricted
Average Teacher Salary
School Site------- $18,353 $3,580 $14,773 $64,238.07
District------- N/A N/A $4,055 $62,595
Percent Difference: School Site and District N/A N/A 264.3 2.6
State------- N/A N/A $6,574 $69,649
Percent Difference: School Site and State N/A N/A 124.7 -7.8 Note: Cells with N/A values do not require data. Types of Services Funded (Fiscal Year 2016-17)
Creekside receives State and Federal funds which are used to purchase textbooks and instructional materials. The district funds computer software and hardware upgrades. The Teen Parent Program housed on the Creekside campus is supported through general fund monies that provide staff salaries and instructional supplies for our teen parents and their children. The Teen Parent Program also receives generous donations of clothing, food and money from local individuals and organizations. Teacher and Administrative Salaries (Fiscal Year 2015-16)
Category District Amount State Average for Districts In Same Category
Beginning Teacher Salary $39,623 $44,144
Mid-Range Teacher Salary $62,159 $69,119
Highest Teacher Salary $77,715 $86,005
Average Principal Salary (Elementary) $102,711 $106,785
Average Principal Salary (Middle) $105,739 $111,569
Average Principal Salary (High) $125,641 $121,395
Superintendent Salary $181,857 $178,104
Percent of Budget for Teacher Salaries 36% 34%
Percent of Budget for Administrative Salaries 6% 6% For detailed information on salaries, see the CDE Certificated Salaries & Benefits Web page at http://www.cde.ca.gov/ds/fd/cs/.
2016-17 School Accountability Report Card for Creekside High School Page 12 of 12
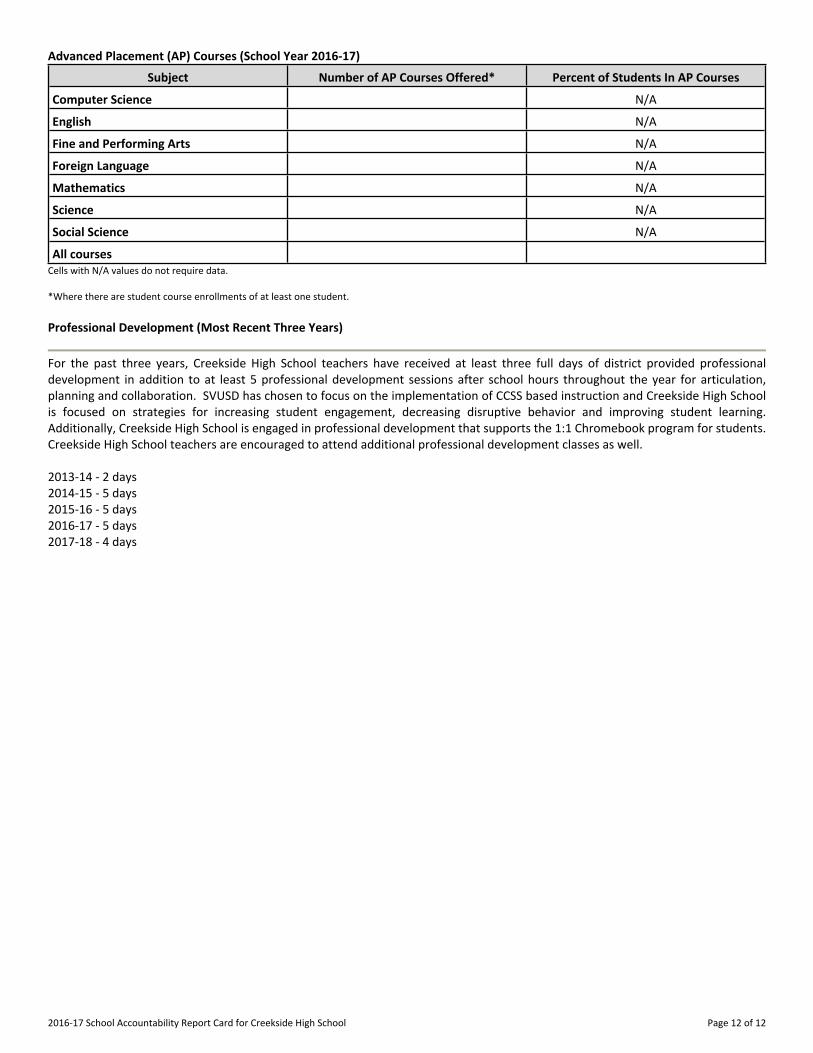
Advanced Placement (AP) Courses (School Year 2016-17)
Subject Number of AP Courses Offered* Percent of Students In AP Courses
Computer Science N/A
English------- N/A
Fine and Performing Arts N/A
Foreign Language N/A
Mathematics N/A
Science------- N/A
Social Science N/A
All courses Cells with N/A values do not require data. *Where there are student course enrollments of at least one student. Professional Development (Most Recent Three Years)
For the past three years, Creekside High School teachers have received at least three full days of district provided professional development in addition to at least 5 professional development sessions after school hours throughout the year for articulation, planning and collaboration. SVUSD has chosen to focus on the implementation of CCSS based instruction and Creekside High School is focused on strategies for increasing student engagement, decreasing disruptive behavior and improving student learning. Additionally, Creekside High School is engaged in professional development that supports the 1:1 Chromebook program for students. Creekside High School teachers are encouraged to attend additional professional development classes as well. 2013-14 - 2 days 2014-15 - 5 days 2015-16 - 5 days 2016-17 - 5 days 2017-18 - 4 days