Embed Size (px)
Citation preview
2016-17 School Accountability Report Card for Center High School Page 1 of 13
Center High School
School Accountability Report Card
Reported Using Data from the 2016-17 School Year
Published During 2017-18
By February 1 of each year, every school in California is required by state law to publish a School Accountability Report Card (SARC). The SARC contains information about the condition and performance of each California public school. Under the Local Control Funding Formula (LCFF) all local educational agencies (LEAs) are required to prepare a Local Control and Accountability Plan (LCAP), which describes how they intend to meet annual school-specific goals for all pupils, with specific activities to address state and local priorities. Additionally, data reported in an LCAP is to be consistent with data reported in the SARC. • For more information about SARC requirements, see the California Department of Education (CDE) SARC Web page at
http://www.cde.ca.gov/ta/ac/sa/. • For more information about the LCFF or LCAP, see the CDE LCFF Web page at http://www.cde.ca.gov/fg/aa/lc/. • For additional information about the school, parents/guardians and community members should contact the school principal or
the district office. DataQuest DataQuest is an online data tool located on the CDE DataQuest Web page at http://dq.cde.ca.gov/dataquest/ that contains additional information about this school and comparisons of the school to the district and the county. Specifically, DataQuest is a dynamic system that provides reports for accountability (e.g., test data, enrollment, high school graduates, dropouts, course enrollments, staffing, and data regarding English learners). Internet Access Internet access is available at public libraries and other locations that are publicly accessible (e.g., the California State Library). Access to the Internet at libraries and public locations is generally provided on a first-come, first-served basis. Other use restrictions may include the hours of operation, the length of time that a workstation may be used (depending on availability), the types of software programs available on a workstation, and the ability to print documents.
About This School Contact Information (School Year 2017-18)
School Contact Information
School Name------- Center High School
Street------- 3111 Center Court Lane
City, State, Zip------- Antelope, Ca. 95843
Phone Number------- 916-338-6420
Principal------- Jerald Ferguson
E-mail Address------- [email protected]
Web Site------- https://centerhigh.edlioschool.com/
CDS Code 34739733430378
2016-17 School Accountability Report Card for Center High School Page 2 of 13
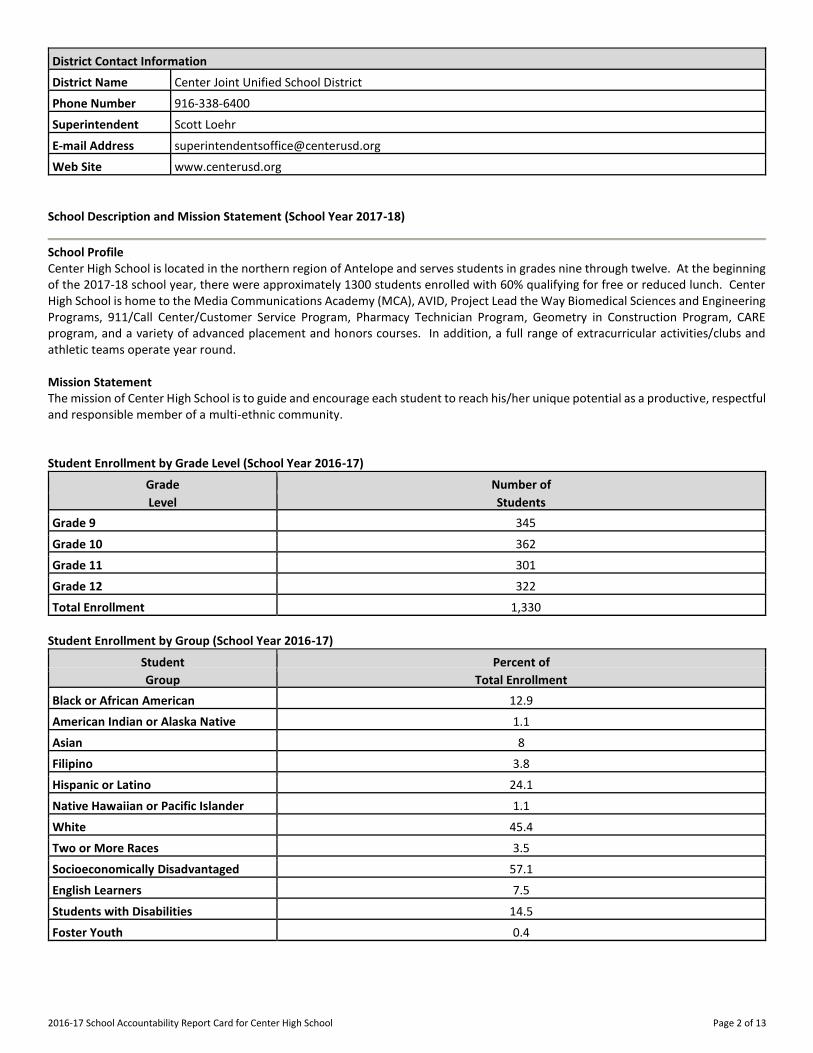
District Contact Information
District Name------- Center Joint Unified School District
Phone Number------- 916-338-6400
Superintendent-------
Scott Loehr
E-mail Address------- [email protected]
Web Site------- www.centerusd.org
School Description and Mission Statement (School Year 2017-18)
School Profile Center High School is located in the northern region of Antelope and serves students in grades nine through twelve. At the beginning of the 2017-18 school year, there were approximately 1300 students enrolled with 60% qualifying for free or reduced lunch. Center High School is home to the Media Communications Academy (MCA), AVID, Project Lead the Way Biomedical Sciences and Engineering Programs, 911/Call Center/Customer Service Program, Pharmacy Technician Program, Geometry in Construction Program, CARE program, and a variety of advanced placement and honors courses. In addition, a full range of extracurricular activities/clubs and athletic teams operate year round. Mission Statement The mission of Center High School is to guide and encourage each student to reach his/her unique potential as a productive, respectful and responsible member of a multi-ethnic community. Student Enrollment by Grade Level (School Year 2016-17)
Grade Number of
Level Students
Grade 9 345
Grade 10 362
Grade 11 301
Grade 12 322
Total Enrollment 1,330
Student Enrollment by Group (School Year 2016-17)
Student Percent of
Group Total Enrollment
Black or African American 12.9
American Indian or Alaska Native 1.1
Asian 8
Filipino 3.8
Hispanic or Latino 24.1
Native Hawaiian or Pacific Islander 1.1
White 45.4
Two or More Races 3.5
Socioeconomically Disadvantaged 57.1
English Learners 7.5
Students with Disabilities 14.5
Foster Youth 0.4
2016-17 School Accountability Report Card for Center High School Page 3 of 13
A. Conditions of Learning
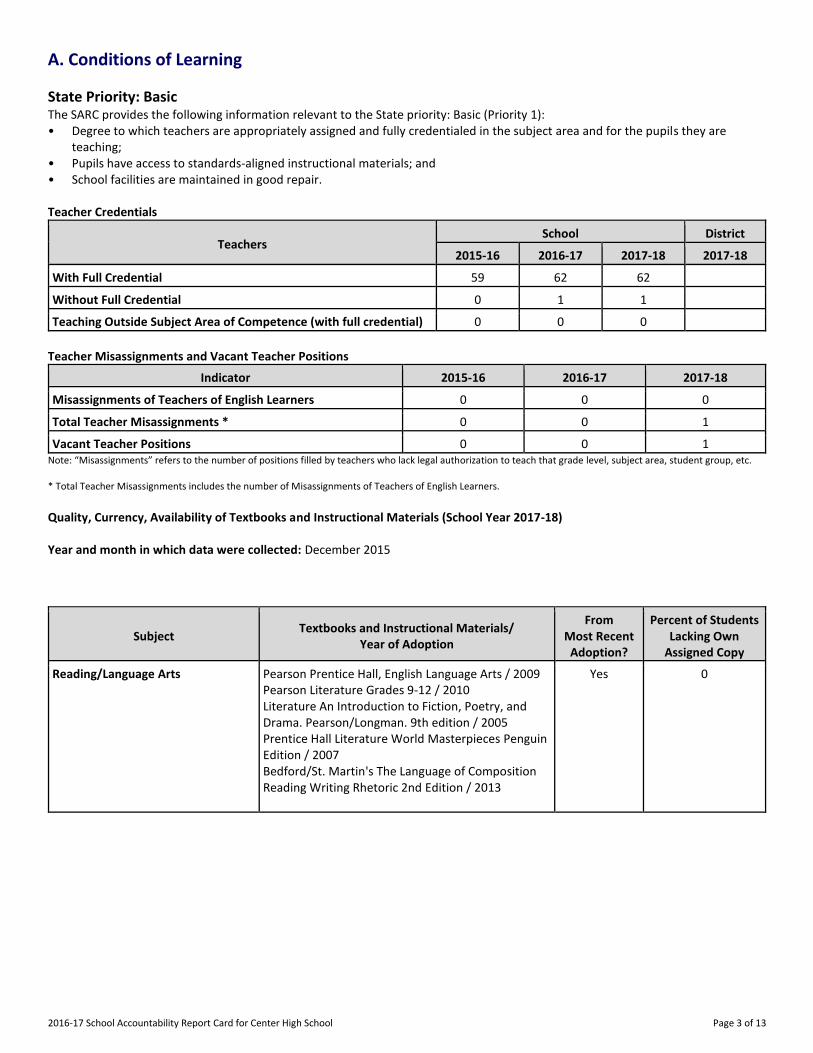
State Priority: Basic The SARC provides the following information relevant to the State priority: Basic (Priority 1): • Degree to which teachers are appropriately assigned and fully credentialed in the subject area and for the pupils they are
teaching; • Pupils have access to standards-aligned instructional materials; and • School facilities are maintained in good repair. Teacher Credentials
Teachers School District
2015-16 2016-17 2017-18 2017-18
With Full Credential 59 62 62
Without Full Credential 0 1 1
Teaching Outside Subject Area of Competence (with full credential) 0 0 0
Teacher Misassignments and Vacant Teacher Positions
Indicator 2015-16 2016-17 2017-18
Misassignments of Teachers of English Learners 0 0 0
Total Teacher Misassignments * 0 0 1
Vacant Teacher Positions 0 0 1 Note: “Misassignments” refers to the number of positions filled by teachers who lack legal authorization to teach that grade level, subject area, student group, etc. * Total Teacher Misassignments includes the number of Misassignments of Teachers of English Learners. Quality, Currency, Availability of Textbooks and Instructional Materials (School Year 2017-18) Year and month in which data were collected: December 2015
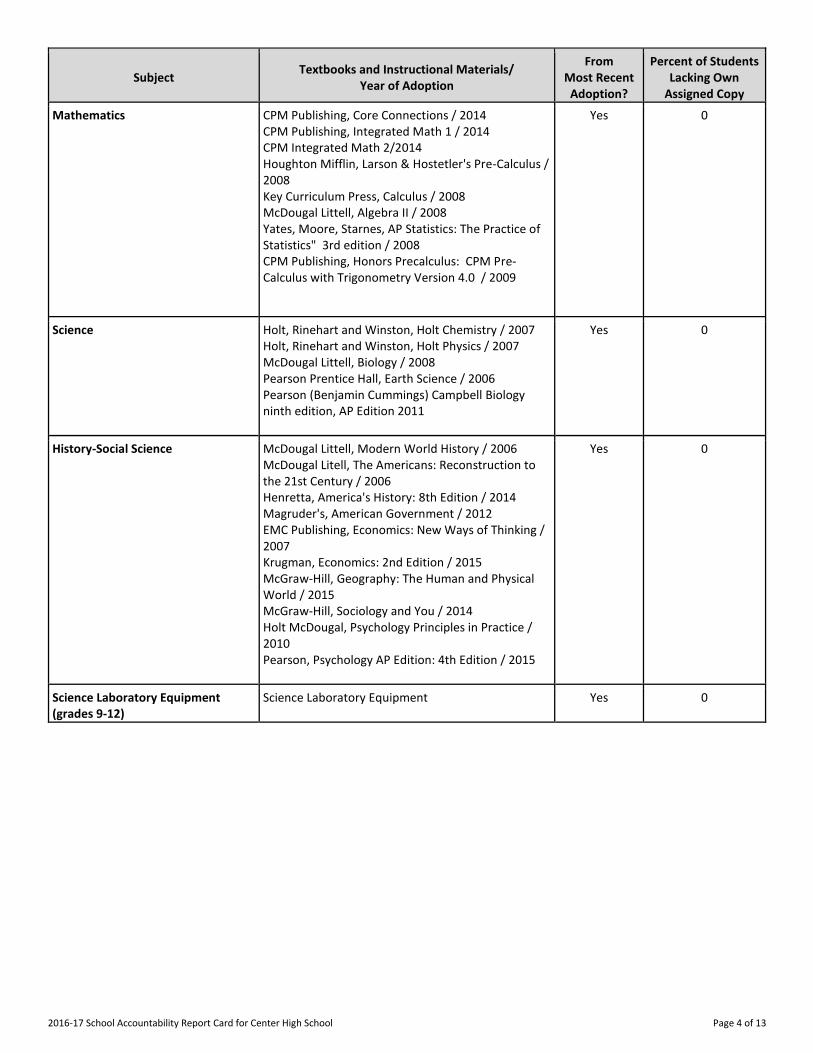
Subject Textbooks and Instructional Materials/
Year of Adoption
From Most Recent
Adoption?
Percent of Students Lacking Own
Assigned Copy
Reading/Language Arts Pearson Prentice Hall, English Language Arts / 2009
Pearson Literature Grades 9-12 / 2010
Literature An Introduction to Fiction, Poetry, and Drama. Pearson/Longman. 9th edition / 2005
Prentice Hall Literature World Masterpieces Penguin Edition / 2007
Bedford/St. Martin's The Language of Composition Reading Writing Rhetoric 2nd Edition / 2013
Yes 0
2016-17 School Accountability Report Card for Center High School Page 4 of 13
Subject Textbooks and Instructional Materials/
Year of Adoption
From Most Recent
Adoption?
Percent of Students Lacking Own
Assigned Copy
Mathematics CPM Publishing, Core Connections / 2014
CPM Publishing, Integrated Math 1 / 2014
CPM Integrated Math 2/2014
Houghton Mifflin, Larson & Hostetler's Pre-Calculus / 2008
Key Curriculum Press, Calculus / 2008
McDougal Littell, Algebra II / 2008
Yates, Moore, Starnes, AP Statistics: The Practice of Statistics" 3rd edition / 2008
CPM Publishing, Honors Precalculus: CPM Pre-Calculus with Trigonometry Version 4.0 / 2009
Yes 0
Science Holt, Rinehart and Winston, Holt Chemistry / 2007
Holt, Rinehart and Winston, Holt Physics / 2007
McDougal Littell, Biology / 2008
Pearson Prentice Hall, Earth Science / 2006
Pearson (Benjamin Cummings) Campbell Biology ninth edition, AP Edition 2011
Yes 0
History-Social Science McDougal Littell, Modern World History / 2006
McDougal Litell, The Americans: Reconstruction to the 21st Century / 2006
Henretta, America's History: 8th Edition / 2014
Magruder's, American Government / 2012
EMC Publishing, Economics: New Ways of Thinking / 2007
Krugman, Economics: 2nd Edition / 2015
McGraw-Hill, Geography: The Human and Physical World / 2015
McGraw-Hill, Sociology and You / 2014
Holt McDougal, Psychology Principles in Practice / 2010
Pearson, Psychology AP Edition: 4th Edition / 2015
Yes 0
Science Laboratory Equipment (grades 9-12)
Science Laboratory Equipment Yes 0
2016-17 School Accountability Report Card for Center High School Page 5 of 13
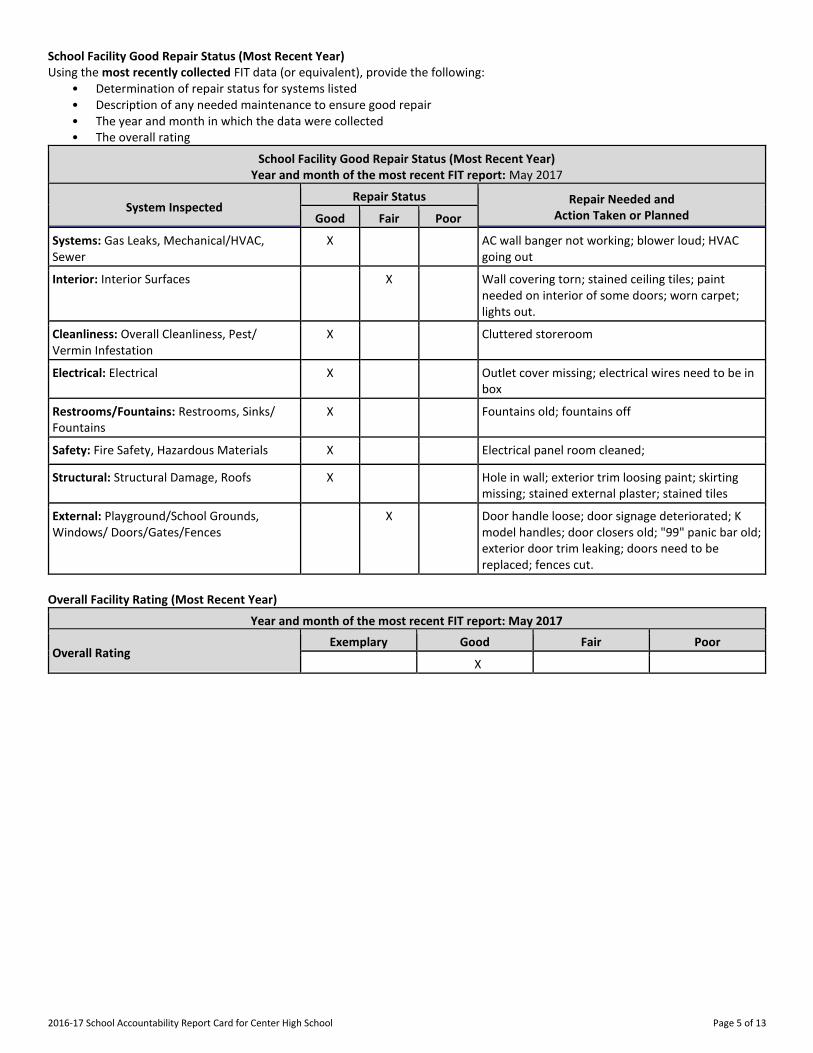
School Facility Good Repair Status (Most Recent Year) Using the most recently collected FIT data (or equivalent), provide the following:
• Determination of repair status for systems listed • Description of any needed maintenance to ensure good repair • The year and month in which the data were collected • The overall rating
School Facility Good Repair Status (Most Recent Year) Year and month of the most recent FIT report: May 2017
System Inspected Repair Status Repair Needed and
Action Taken or Planned Good Fair Poor
Systems: Gas Leaks, Mechanical/HVAC, Sewer
X AC wall banger not working; blower loud; HVAC going out
Interior: Interior Surfaces X Wall covering torn; stained ceiling tiles; paint needed on interior of some doors; worn carpet; lights out.
Cleanliness: Overall Cleanliness, Pest/ Vermin Infestation
X Cluttered storeroom
Electrical: Electrical X Outlet cover missing; electrical wires need to be in box
Restrooms/Fountains: Restrooms, Sinks/ Fountains
X Fountains old; fountains off
Safety: Fire Safety, Hazardous Materials X Electrical panel room cleaned;
Structural: Structural Damage, Roofs X Hole in wall; exterior trim loosing paint; skirting missing; stained external plaster; stained tiles
External: Playground/School Grounds, Windows/ Doors/Gates/Fences
X Door handle loose; door signage deteriorated; K model handles; door closers old; "99" panic bar old; exterior door trim leaking; doors need to be replaced; fences cut.
Overall Facility Rating (Most Recent Year)
Year and month of the most recent FIT report: May 2017
Overall Rating Exemplary Good Fair Poor
X
2016-17 School Accountability Report Card for Center High School Page 6 of 13
B. Pupil Outcomes
State Priority: Pupil Achievement The SARC provides the following information relevant to the State priority: Pupil Achievement (Priority 4): • Statewide assessments (i.e., California Assessment of Student Performance and Progress [CAASPP] System, which includes the
Smarter Balanced Summative Assessments for students in the general education population and the California Alternate Assessments [CAAs] for English language arts/literacy [ELA] and mathematics given in grades three through eight and grade eleven. Only eligible students may participate in the administration of the CAAs. CAAs items are aligned with alternate achievement standards, which are linked with the Common Core State Standards [CCSS] for students with the most significant cognitive disabilities); and
• The percentage of students who have successfully completed courses that satisfy the requirements for entrance to the University of California and the California State University, or career technical education sequences or programs of study.
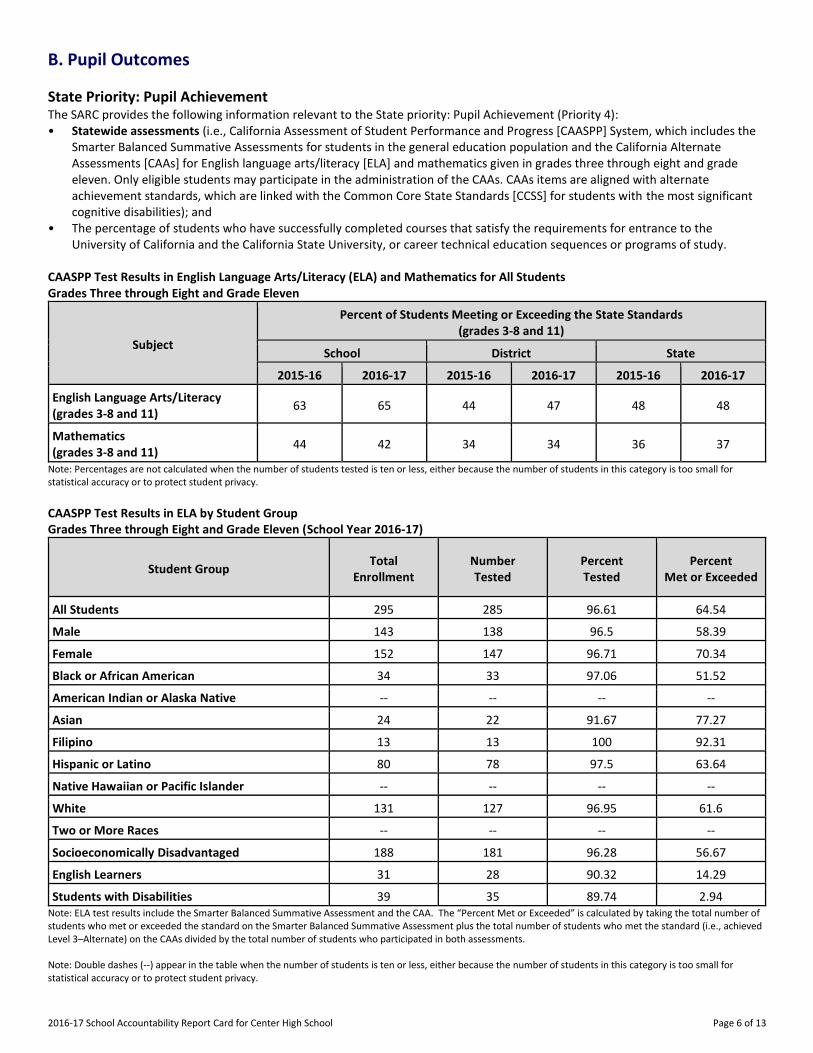
CAASPP Test Results in English Language Arts/Literacy (ELA) and Mathematics for All Students Grades Three through Eight and Grade Eleven
Subject
Percent of Students Meeting or Exceeding the State Standards (grades 3-8 and 11)
School District State
2015-16 2016-17 2015-16 2016-17 2015-16 2016-17
English Language Arts/Literacy (grades 3-8 and 11)
63 65 44 47 48 48
Mathematics (grades 3-8 and 11)
44 42 34 34 36 37
Note: Percentages are not calculated when the number of students tested is ten or less, either because the number of students in this category is too small for statistical accuracy or to protect student privacy.
CAASPP Test Results in ELA by Student Group Grades Three through Eight and Grade Eleven (School Year 2016-17)
Student Group Total
Enrollment Number Tested
Percent Tested
Percent Met or Exceeded
All Students 295 285 96.61 64.54
Male 143 138 96.5 58.39
Female 152 147 96.71 70.34
Black or African American 34 33 97.06 51.52
American Indian or Alaska Native -- -- -- --
Asian 24 22 91.67 77.27
Filipino 13 13 100 92.31
Hispanic or Latino 80 78 97.5 63.64
Native Hawaiian or Pacific Islander -- -- -- --
White 131 127 96.95 61.6
Two or More Races -- -- -- --
Socioeconomically Disadvantaged 188 181 96.28 56.67
English Learners 31 28 90.32 14.29
Students with Disabilities 39 35 89.74 2.94 Note: ELA test results include the Smarter Balanced Summative Assessment and the CAA. The “Percent Met or Exceeded” is calculated by taking the total number of students who met or exceeded the standard on the Smarter Balanced Summative Assessment plus the total number of students who met the standard (i.e., achieved Level 3–Alternate) on the CAAs divided by the total number of students who participated in both assessments. Note: Double dashes (--) appear in the table when the number of students is ten or less, either because the number of students in this category is too small for statistical accuracy or to protect student privacy.
2016-17 School Accountability Report Card for Center High School Page 7 of 13
Note: The number of students tested includes all students who participated in the test whether they received a score or not; however, the number of students tested is not the number that was used to calculate the achievement level percentages. The achievement level percentages are calculated using only students who received scores.
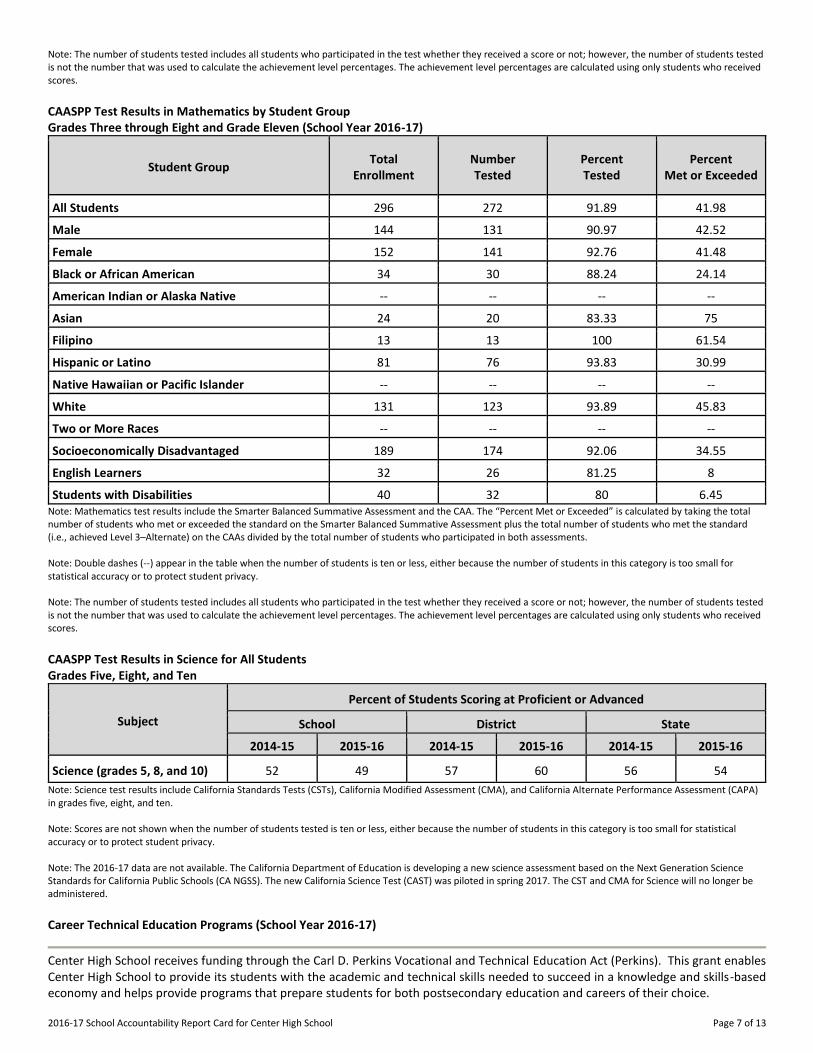
CAASPP Test Results in Mathematics by Student Group Grades Three through Eight and Grade Eleven (School Year 2016-17)
Student Group Total
Enrollment Number Tested
Percent Tested
Percent Met or Exceeded
All Students 296 272 91.89 41.98
Male 144 131 90.97 42.52
Female 152 141 92.76 41.48
Black or African American 34 30 88.24 24.14
American Indian or Alaska Native -- -- -- --
Asian 24 20 83.33 75
Filipino 13 13 100 61.54
Hispanic or Latino 81 76 93.83 30.99
Native Hawaiian or Pacific Islander -- -- -- --
White 131 123 93.89 45.83
Two or More Races -- -- -- --
Socioeconomically Disadvantaged 189 174 92.06 34.55
English Learners 32 26 81.25 8
Students with Disabilities 40 32 80 6.45 Note: Mathematics test results include the Smarter Balanced Summative Assessment and the CAA. The “Percent Met or Exceeded” is calculated by taking the total number of students who met or exceeded the standard on the Smarter Balanced Summative Assessment plus the total number of students who met the standard (i.e., achieved Level 3–Alternate) on the CAAs divided by the total number of students who participated in both assessments. Note: Double dashes (--) appear in the table when the number of students is ten or less, either because the number of students in this category is too small for statistical accuracy or to protect student privacy. Note: The number of students tested includes all students who participated in the test whether they received a score or not; however, the number of students tested is not the number that was used to calculate the achievement level percentages. The achievement level percentages are calculated using only students who received scores.
CAASPP Test Results in Science for All Students Grades Five, Eight, and Ten
Subject
Percent of Students Scoring at Proficient or Advanced
School District State
2014-15 2015-16 2014-15 2015-16 2014-15 2015-16
Science (grades 5, 8, and 10) 52 49 57 60 56 54
Note: Science test results include California Standards Tests (CSTs), California Modified Assessment (CMA), and California Alternate Performance Assessment (CAPA) in grades five, eight, and ten. Note: Scores are not shown when the number of students tested is ten or less, either because the number of students in this category is too small for statistical accuracy or to protect student privacy. Note: The 2016-17 data are not available. The California Department of Education is developing a new science assessment based on the Next Generation Science Standards for California Public Schools (CA NGSS). The new California Science Test (CAST) was piloted in spring 2017. The CST and CMA for Science will no longer be administered.
Career Technical Education Programs (School Year 2016-17)
Center High School receives funding through the Carl D. Perkins Vocational and Technical Education Act (Perkins). This grant enables Center High School to provide its students with the academic and technical skills needed to succeed in a knowledge and skills-based economy and helps provide programs that prepare students for both postsecondary education and careers of their choice.
2016-17 School Accountability Report Card for Center High School Page 8 of 13
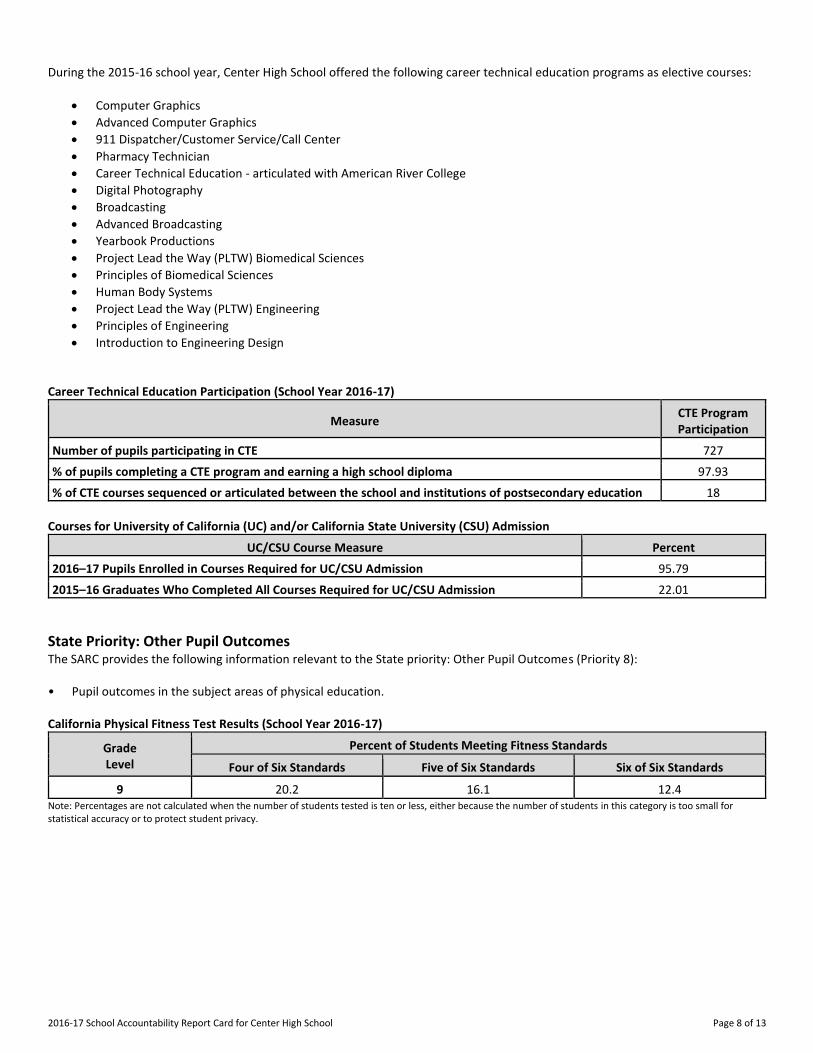
During the 2015-16 school year, Center High School offered the following career technical education programs as elective courses:
• Computer Graphics
• Advanced Computer Graphics
• 911 Dispatcher/Customer Service/Call Center
• Pharmacy Technician
• Career Technical Education - articulated with American River College
• Digital Photography
• Broadcasting
• Advanced Broadcasting
• Yearbook Productions
• Project Lead the Way (PLTW) Biomedical Sciences
• Principles of Biomedical Sciences
• Human Body Systems
• Project Lead the Way (PLTW) Engineering
• Principles of Engineering
• Introduction to Engineering Design Career Technical Education Participation (School Year 2016-17)
Measure CTE Program Participation
Number of pupils participating in CTE 727
% of pupils completing a CTE program and earning a high school diploma 97.93
% of CTE courses sequenced or articulated between the school and institutions of postsecondary education 18
Courses for University of California (UC) and/or California State University (CSU) Admission
UC/CSU Course Measure Percent
2016–17 Pupils Enrolled in Courses Required for UC/CSU Admission 95.79
2015–16 Graduates Who Completed All Courses Required for UC/CSU Admission 22.01
State Priority: Other Pupil Outcomes The SARC provides the following information relevant to the State priority: Other Pupil Outcomes (Priority 8): • Pupil outcomes in the subject areas of physical education. California Physical Fitness Test Results (School Year 2016-17)
Grade Level
Percent of Students Meeting Fitness Standards
Four of Six Standards Five of Six Standards Six of Six Standards
---9--- 20.2 16.1 12.4 Note: Percentages are not calculated when the number of students tested is ten or less, either because the number of students in this category is too small for statistical accuracy or to protect student privacy.
2016-17 School Accountability Report Card for Center High School Page 9 of 13
C. Engagement
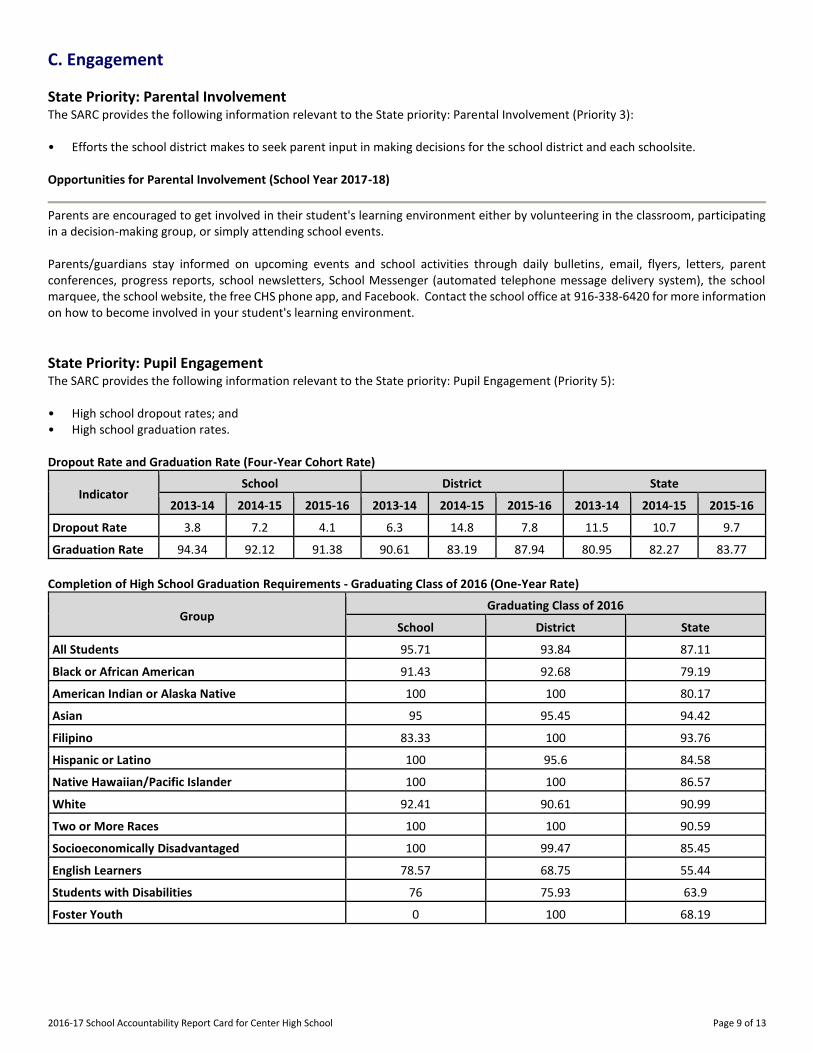
State Priority: Parental Involvement The SARC provides the following information relevant to the State priority: Parental Involvement (Priority 3): • Efforts the school district makes to seek parent input in making decisions for the school district and each schoolsite. Opportunities for Parental Involvement (School Year 2017-18)
Parents are encouraged to get involved in their student's learning environment either by volunteering in the classroom, participating in a decision-making group, or simply attending school events. Parents/guardians stay informed on upcoming events and school activities through daily bulletins, email, flyers, letters, parent conferences, progress reports, school newsletters, School Messenger (automated telephone message delivery system), the school marquee, the school website, the free CHS phone app, and Facebook. Contact the school office at 916-338-6420 for more information on how to become involved in your student's learning environment.
State Priority: Pupil Engagement The SARC provides the following information relevant to the State priority: Pupil Engagement (Priority 5): • High school dropout rates; and • High school graduation rates. Dropout Rate and Graduation Rate (Four-Year Cohort Rate)
Indicator School District State
2013-14 2014-15 2015-16 2013-14 2014-15 2015-16 2013-14 2014-15 2015-16
Dropout Rate 3.8 7.2 4.1 6.3 14.8 7.8 11.5 10.7 9.7
Graduation Rate 94.34 92.12 91.38 90.61 83.19 87.94 80.95 82.27 83.77
Completion of High School Graduation Requirements - Graduating Class of 2016 (One-Year Rate)
Group Graduating Class of 2016
School District State
All Students 95.71 93.84 87.11
Black or African American 91.43 92.68 79.19
American Indian or Alaska Native 100 100 80.17
Asian 95 95.45 94.42
Filipino 83.33 100 93.76
Hispanic or Latino 100 95.6 84.58
Native Hawaiian/Pacific Islander 100 100 86.57
White 92.41 90.61 90.99
Two or More Races 100 100 90.59
Socioeconomically Disadvantaged 100 99.47 85.45
English Learners 78.57 68.75 55.44
Students with Disabilities 76 75.93 63.9
Foster Youth 0 100 68.19
2016-17 School Accountability Report Card for Center High School Page 10 of 13
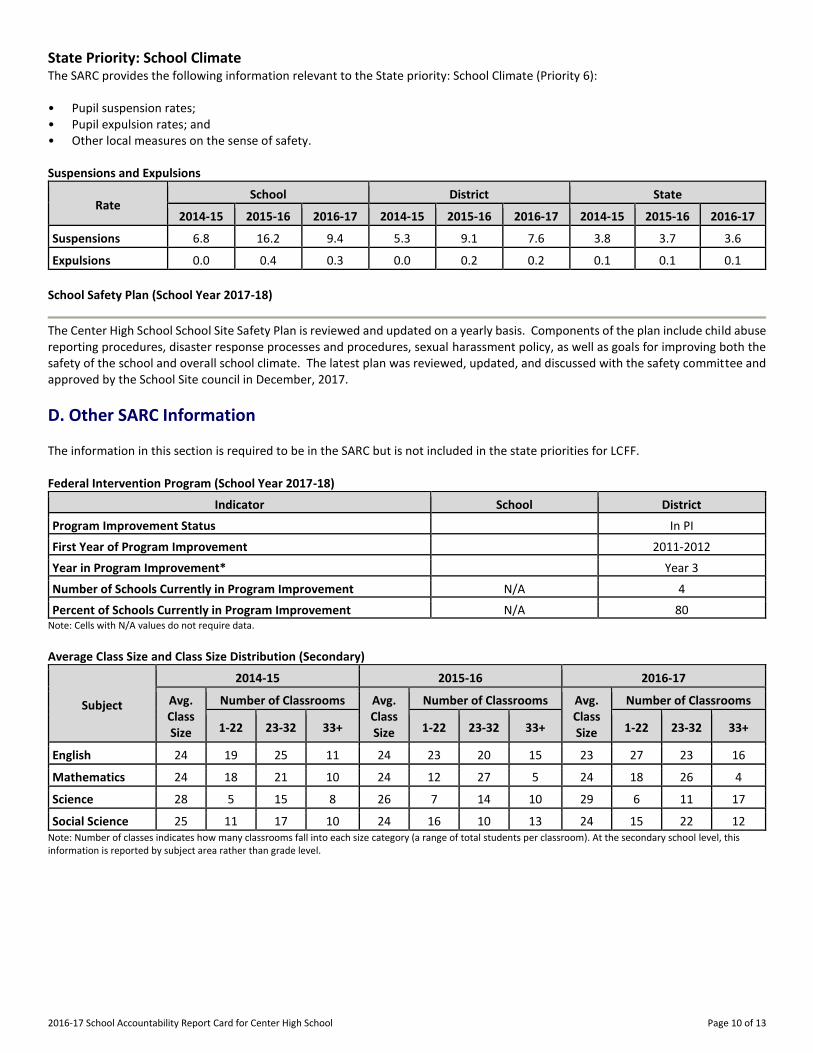
State Priority: School Climate The SARC provides the following information relevant to the State priority: School Climate (Priority 6): • Pupil suspension rates; • Pupil expulsion rates; and • Other local measures on the sense of safety. Suspensions and Expulsions
Rate School District State
2014-15 2015-16 2016-17 2014-15 2015-16 2016-17 2014-15 2015-16 2016-17
Suspensions------- 6.8 16.2 9.4 5.3 9.1 7.6 3.8 3.7 3.6
Expulsions------- 0.0 0.4 0.3 0.0 0.2 0.2 0.1 0.1 0.1
School Safety Plan (School Year 2017-18)
The Center High School School Site Safety Plan is reviewed and updated on a yearly basis. Components of the plan include child abuse reporting procedures, disaster response processes and procedures, sexual harassment policy, as well as goals for improving both the safety of the school and overall school climate. The latest plan was reviewed, updated, and discussed with the safety committee and approved by the School Site council in December, 2017.
D. Other SARC Information
The information in this section is required to be in the SARC but is not included in the state priorities for LCFF. Federal Intervention Program (School Year 2017-18)
Indicator School District
Program Improvement Status In PI
First Year of Program Improvement 2011-2012
Year in Program Improvement* Year 3
Number of Schools Currently in Program Improvement N/A 4
Percent of Schools Currently in Program Improvement N/A 80 Note: Cells with N/A values do not require data.
Average Class Size and Class Size Distribution (Secondary)
Subject
2014-15 2015-16 2016-17
Avg. Class Size
Number of Classrooms Avg. Class Size
Number of Classrooms Avg. Class Size
Number of Classrooms
1-22 23-32 33+ 1-22 23-32 33+ 1-22 23-32 33+
English------- ----------
24 19 25 11 24 23 20 15 23 27 23 16
Mathematics ----------
24 18 21 10 24 12 27 5 24 18 26 4
Science------- ----------
28 5 15 8 26 7 14 10 29 6 11 17
Social Science ----------
25 11 17 10 24 16 10 13 24 15 22 12 Note: Number of classes indicates how many classrooms fall into each size category (a range of total students per classroom). At the secondary school level, this information is reported by subject area rather than grade level.
2016-17 School Accountability Report Card for Center High School Page 11 of 13
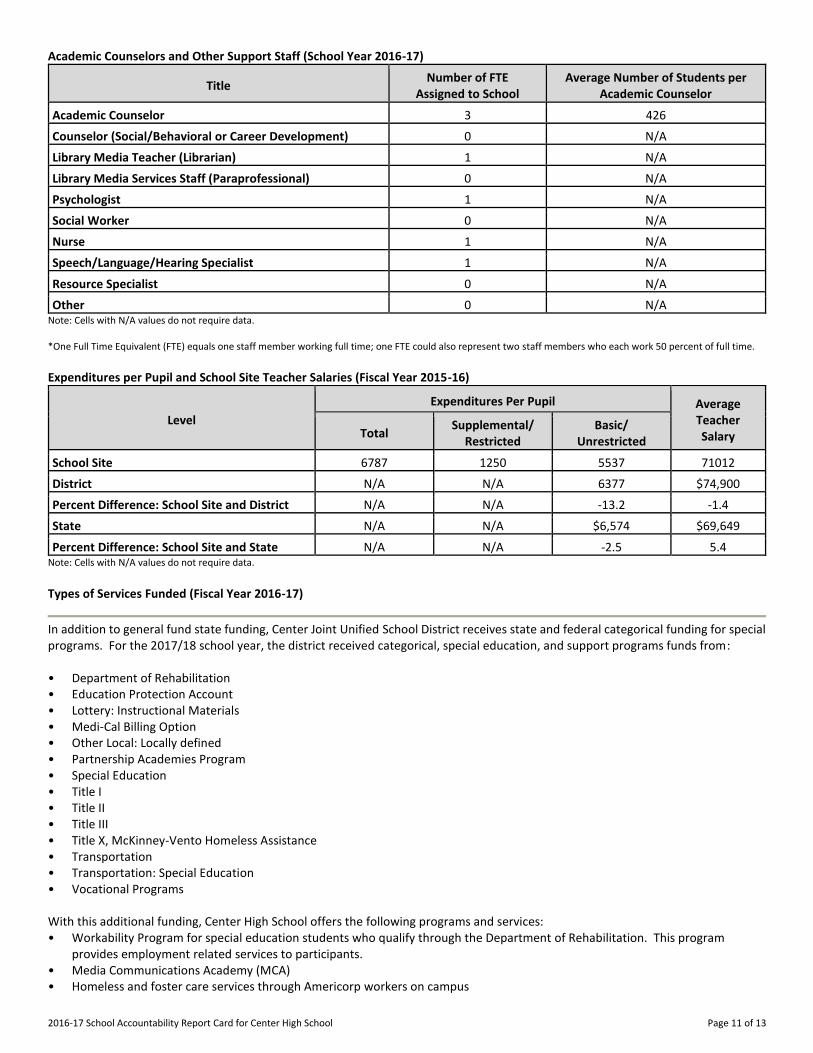
Academic Counselors and Other Support Staff (School Year 2016-17)
Title Number of FTE
Assigned to School Average Number of Students per
Academic Counselor
Academic Counselor------- 3 426
Counselor (Social/Behavioral or Career Development) 0 N/A
Library Media Teacher (Librarian) 1 N/A
Library Media Services Staff (Paraprofessional) 0 N/A
Psychologist------- 1 N/A
Social Worker------- 0 N/A
Nurse------- 1 N/A
Speech/Language/Hearing Specialist 1 N/A
Resource Specialist------- 0 N/A
Other------- 0 N/A Note: Cells with N/A values do not require data. *One Full Time Equivalent (FTE) equals one staff member working full time; one FTE could also represent two staff members who each work 50 percent of full time.
Expenditures per Pupil and School Site Teacher Salaries (Fiscal Year 2015-16)
Level
Expenditures Per Pupil Average Teacher Salary Total
Supplemental/ Restricted
Basic/ Unrestricted
School Site------- 6787 1250 5537 71012
District------- N/A N/A 6377 $74,900
Percent Difference: School Site and District N/A N/A -13.2 -1.4
State------- N/A N/A $6,574 $69,649
Percent Difference: School Site and State N/A N/A -2.5 5.4 Note: Cells with N/A values do not require data.
Types of Services Funded (Fiscal Year 2016-17)
In addition to general fund state funding, Center Joint Unified School District receives state and federal categorical funding for special programs. For the 2017/18 school year, the district received categorical, special education, and support programs funds from: • Department of Rehabilitation • Education Protection Account • Lottery: Instructional Materials • Medi-Cal Billing Option • Other Local: Locally defined • Partnership Academies Program • Special Education • Title I • Title II • Title III • Title X, McKinney-Vento Homeless Assistance • Transportation • Transportation: Special Education • Vocational Programs With this additional funding, Center High School offers the following programs and services: • Workability Program for special education students who qualify through the Department of Rehabilitation. This program
provides employment related services to participants. • Media Communications Academy (MCA) • Homeless and foster care services through Americorp workers on campus
2016-17 School Accountability Report Card for Center High School Page 12 of 13
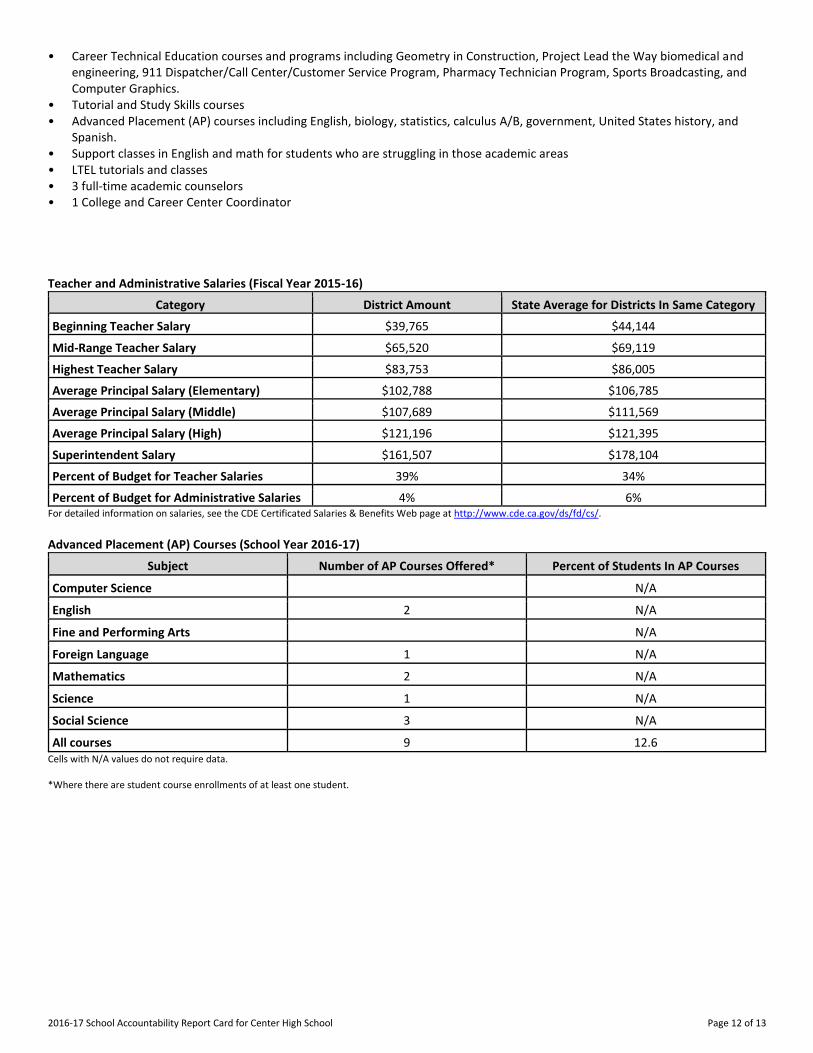
• Career Technical Education courses and programs including Geometry in Construction, Project Lead the Way biomedical and engineering, 911 Dispatcher/Call Center/Customer Service Program, Pharmacy Technician Program, Sports Broadcasting, and Computer Graphics.
• Tutorial and Study Skills courses • Advanced Placement (AP) courses including English, biology, statistics, calculus A/B, government, United States history, and
Spanish. • Support classes in English and math for students who are struggling in those academic areas • LTEL tutorials and classes • 3 full-time academic counselors • 1 College and Career Center Coordinator Teacher and Administrative Salaries (Fiscal Year 2015-16)
Category District Amount State Average for Districts In Same Category
Beginning Teacher Salary $39,765 $44,144
Mid-Range Teacher Salary $65,520 $69,119
Highest Teacher Salary $83,753 $86,005
Average Principal Salary (Elementary) $102,788 $106,785
Average Principal Salary (Middle) $107,689 $111,569
Average Principal Salary (High) $121,196 $121,395
Superintendent Salary $161,507 $178,104
Percent of Budget for Teacher Salaries 39% 34%
Percent of Budget for Administrative Salaries 4% 6% For detailed information on salaries, see the CDE Certificated Salaries & Benefits Web page at http://www.cde.ca.gov/ds/fd/cs/. Advanced Placement (AP) Courses (School Year 2016-17)
Subject Number of AP Courses Offered* Percent of Students In AP Courses
Computer Science N/A
English------- 2 N/A
Fine and Performing Arts N/A
Foreign Language 1 N/A
Mathematics 2 N/A
Science------- 1 N/A
Social Science 3 N/A
All courses 9 12.6 Cells with N/A values do not require data. *Where there are student course enrollments of at least one student.
2016-17 School Accountability Report Card for Center High School Page 13 of 13
Professional Development (Most Recent Three Years)
Staff Development All training and curriculum development activities at Center High School revolve around the California State Content Standards and Frameworks. Decisions concerning selection of staff development activities are performed by the administrative and leadership teams using tools such as teacher input, state assessment results, and data analysis to determine the areas in which additional teacher training may enhance classroom instruction and increase student achievement levels. Center High School supports ongoing professional growth throughout the year on minimum days. Teachers meet in both grade level and department level teams to conduct data analysis to identify areas of need. Teaching staff are provided the opportunity to participate in district-sponsored staff development workshops or training session as 1) a supplement to site-based staff development, 2) for reinforcement of or follow-up on previous training, or 3) follow-up training for newly implemented programs/curricula. Many teachers also participate in professional development opportunities on weekends and during the summer.