Embed Size (px)
Citation preview
Internal market,
industry,
entrepreneurship and SMEs
2016 SBA Fact Sheet
France
Key points
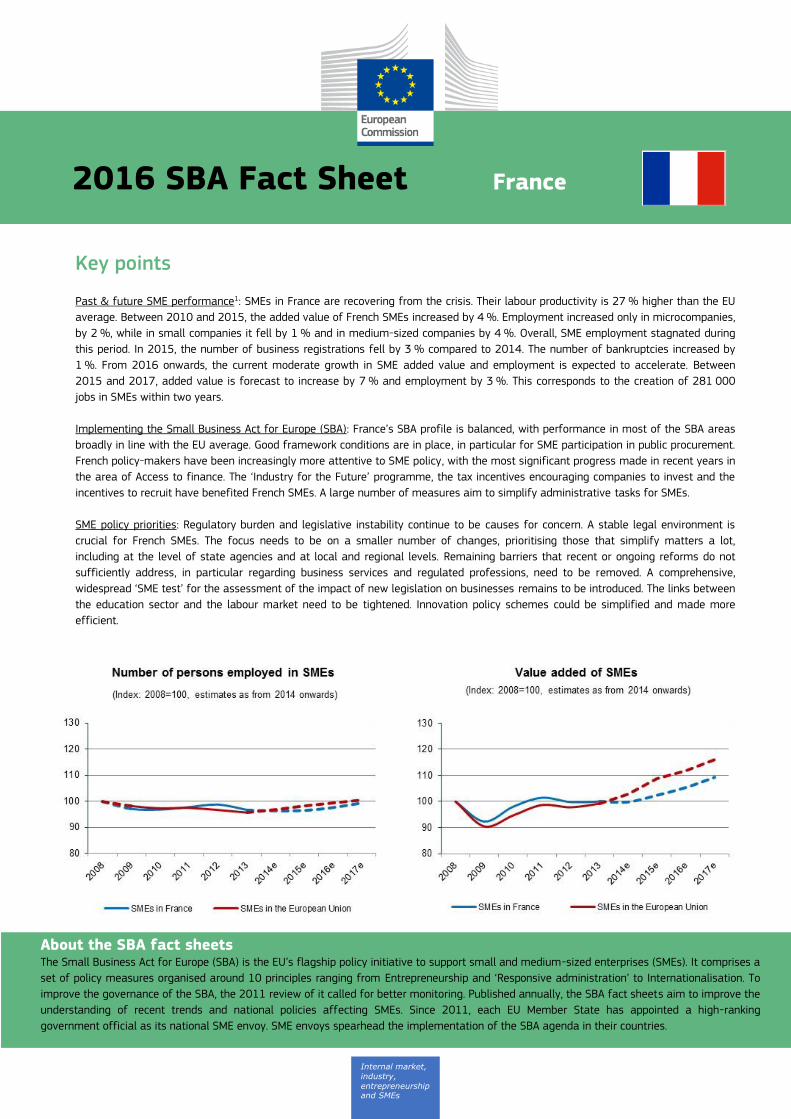
Past & future SME performance1: SMEs in France are recovering from the crisis. Their labour productivity is 27 % higher than the EU
average. Between 2010 and 2015, the added value of French SMEs increased by 4 %. Employment increased only in microcompanies,
by 2 %, while in small companies it fell by 1 % and in medium-sized companies by 4 %. Overall, SME employment stagnated during
this period. In 2015, the number of business registrations fell by 3 % compared to 2014. The number of bankruptcies increased by
1 %. From 2016 onwards, the current moderate growth in SME added value and employment is expected to accelerate. Between
2015 and 2017, added value is forecast to increase by 7 % and employment by 3 %. This corresponds to the creation of 281 000
jobs in SMEs within two years.
Implementing the Small Business Act for Europe (SBA): France’s SBA profile is balanced, with performance in most of the SBA areas
broadly in line with the EU average. Good framework conditions are in place, in particular for SME participation in public procurement.
French policy-makers have been increasingly more attentive to SME policy, with the most significant progress made in recent years in
the area of Access to finance. The ‘Industry for the Future’ programme, the tax incentives encouraging companies to invest and the
incentives to recruit have benefited French SMEs. A large number of measures aim to simplify administrative tasks for SMEs.
SME policy priorities: Regulatory burden and legislative instability continue to be causes for concern. A stable legal environment is
crucial for French SMEs. The focus needs to be on a smaller number of changes, prioritising those that simplify matters a lot,
including at the level of state agencies and at local and regional levels. Remaining barriers that recent or ongoing reforms do not
sufficiently address, in particular regarding business services and regulated professions, need to be removed. A comprehensive,
widespread ‘SME test’ for the assessment of the impact of new legislation on businesses remains to be introduced. The links between
the education sector and the labour market need to be tightened. Innovation policy schemes could be simplified and made more
efficient.
About the SBA fact sheets The Small Business Act for Europe (SBA) is the EU’s flagship policy initiative to support small and medium-sized enterprises (SMEs). It comprises a
set of policy measures organised around 10 principles ranging from Entrepreneurship and ‘Responsive administration’ to Internationalisation. To
improve the governance of the SBA, the 2011 review of it called for better monitoring. Published annually, the SBA fact sheets aim to improve the
understanding of recent trends and national policies affecting SMEs. Since 2011, each EU Member State has appointed a high-ranking
government official as its national SME envoy. SME envoys spearhead the implementation of the SBA agenda in their countries.

2016 SBA Fact Sheet — France 2
Table of Contents Key points ..................................................................................................................................................................................................................................................................... 1
1. SMEs — basic figures ....................................................................................................................................................................................................................................... 2 2. SBA profile ............................................................................................................................................................................................................................................................. 3 3. SBA principles ....................................................................................................................................................................................................................................................... 5
3.0 ‘Think Small First’ ............................................................................................................................................................................................................................................. 5 3.1 Entrepreneurship............................................................................................................................................................................................................................................... 6 3.2 ‘Second chance’ ................................................................................................................................................................................................................................................. 7 3.3 ‘Responsive administration’ ........................................................................................................................................................................................................................ 8 3.4 State aid & public procurement ............................................................................................................................................................................................................... 9 3.5 Access to finance........................................................................................................................................................................................................................................... 10 3.6 Single market .................................................................................................................................................................................................................................................. 11 3.7 Skills & innovation ........................................................................................................................................................................................................................................ 12 3.8 Environment ..................................................................................................................................................................................................................................................... 13 3.9 Internationalisation ...................................................................................................................................................................................................................................... 14
4. Interesting initiative ....................................................................................................................................................................................................................................... 15
1. SMEs — basic figures
Class size Number of enterprises Number of persons employed Value added
France EU-28 France EU-28 France EU-28
Number Share Share Number Share Share Billion € Share Share
Micro 2 858 954 95.1 % 92.8 % 4 477 703 29.5 % 29.5 % 238.3 26.1 % 21.2 %
Small 123 807 4.1 % 6.0 % 2 845 564 18.7 % 20.2 % 151.2 16.6 % 18.0 %
Medium-sized 19 755 0.7 % 1.0 % 2 255 982 14.8 % 17.0 % 138.3 15.1 % 18.2 %
SMEs 3 002 516 99.9 % 99.8 % 9 579 249 63.0 % 66.8 % 527.8 57.8 % 57.4 %
Large 4 457 0.1 % 0.2 % 5 613 950 37.0 % 33.2 % 385.5 42.2 % 42.6 %
Total 3 006 973 100.0 % 100.0 % 15 193 199 100.0 % 100.0 % 913.4 100.0 % 100.0 %
These are estimates for 2015 produced by DIW Econ, based on 2008-2013 figures from the Structural Business Statistics Database (Eurostat). The data cover the ‘non-financial business economy’, which includes industry, construction, trade, and services (NACE Rev. 2 sections B to J, L, M and N), but not enterprises in agriculture, forestry and fisheries and the largely non-market service sectors such as education and health. The advantage of using Eurostat data is that the statistics are harmonised and comparable across countries. The
disadvantage is that for some countries the data may be different from those published by national authorities.2
SMEs play a key role in ensuring jobs and growth in the French
as well as in the overall EU ‘non-financial business economy’.
Their share of added value equals the EU average of 58 % and
they account for 63 % of total employment in France. However,
SME labour productivity, calculated as the ratio of added value
to employment, is 27 % higher than the EU average, amounting
to approximately EUR 55 000 per person in 2015. Wholesale and
retail trade and manufacturing are the most important sectors
for SMEs, as in most Member States. In France, these sectors
account for a combined 40 % of total SME added value and
41 % of SME employment.
Between 2010 and 2015, SME added value increased by 4 %.
This is roughly equivalent to its growth in the ‘non-financial
business economy’ as a whole. Employment increased only in
micro firms however, by 2 %. This was favoured by the
introduction of a new business status in 2009, that of ‘auto-
entrepreneur’. It was widely adopted at first, but since the end of
2014 has fallen out of favour due to registration changes.3,4
Employment in small companies fell by 1 % and in medium-
sized companies by 4 %. Overall, SME employment stagnated.
As in most other Member States, SMEs in the manufacturing
sector in France perform worse than SMEs on average. Between
2010 and 2015, added value increased by 2 % and employment
dropped by 7 %. The automobile sector, consumer electronics
and other industry sectors were contributing factors in this
regard. Among other reasons, this is due to a lack of investment
in research and development and a general lack of funding.5
However, since 2012, government intervention — which includes

2016 SBA Fact Sheet — France 3
state support for low-paid workers and for the manufacturing of
high-value goods — along with the depreciation of the euro and
low energy costs, have all combined to result in improved
growth.6
Between 2010 and 2015, the added value of wholesale and
retail trade SMEs increased by 6 %. At the same time, added
value in large firms dropped by 5 %. Employment in this sector
nearly stagnated both in SMEs and in large firms. The increase in
SME added value is largely due to increased productivity as a
result of greater IT innovation, e.g. online trading, logistics and
network organisation. It is also the result of longer working hours
than in large established companies.7
Between February 2015 and January 2016 there were 529 338
business registrations. This is a fall of 3 % compared to the
previous period.8 The total number of bankruptcies in 2015 was
63 108, a 1 % increase compared to the previous year.9 There
was a marked difference between the number of bankruptcies in
micro-businesses, which rose by 2 %, and bankruptcies in small
and medium companies, which dropped by 6 %.10
The observed business demography dynamics are partly a
consequence of regulatory changes related to the ‘auto-
entrepreneur’ business status. This business-friendly initiative
was widely adopted after its introduction in 2009, but became
less popular when reforms in 2014 made registration more
complicated and introduced other requirements, such as
mandatory training.11 As a result, ‘micro-entrepreneur’
registrations fell by 20 % while other company registrations
increased.12 In 2015, only 42 % of all business registrations
were ‘micro-entrepreneur’ registrations, compared to more than
50 % in previous years.13
From 2016 onwards, the pace of the current moderate increase
in SME added value and SME employment is expected to
accelerate. Between 2015 and 2017, added value is forecast to
increase by 7 % and employment by 3 %. This corresponds to
the creation of 281 000 jobs in SMEs within two years.
2. SBA profile14
France’s SBA profile continues to be balanced, with performance
in most areas broadly in line with the EU average. Solid
framework conditions remain in place, in particular for SME
participation in public procurement. Opportunities provided by
the single market remain unseized however. Overall, progress
has been made in implementing the SBA since 2008.
French policy-makers have been paying more and more
attention to SME policy. Although France does not have a
specific strategy for implementing the SBA, progress has been
made in the implementation of most of the SBA principles. A
number of policy measures to improve the business environment
have been adopted. These include the ‘Bill for growth, activity
and equality of economic opportunities’ (Loi pour la croissance,
l’activité et l’égalité des chances économiques).
In 2015 and the first quarter of 2016, France implemented four
policy measures relating to 3 of the 10 SBA policy areas. There
is a broad consensus that the most significant progress was
made in Access to finance. The ‘Industry for the Future’
programme, the tax incentives to encourage companies to invest
and the incentives to recruit staff have benefited French SMEs.
Many measures aim to simplify administrative tasks for SMEs.
Most of them, adopted as part of the simplification programme,
have already been implemented. While SMEs welcome these
efforts, they also suffer the consequences of a constantly
changing legal environment. They would benefit from a more
stable legal environment, with fewer changes, prioritising those
that result in major simplifications, including at the level of state
agencies and at local and regional levels.
There is still lack of a comprehensive ‘SME test’ to assess the
impact of new legislation on businesses. Although regulatory
impact assessments have been mandatory for legislative texts
since 2008 and for decrees since 2011, they remain very
limited. SME stakeholders also say that they lack information on
the impact and the extent of the use of consultation findings.

2016 SBA Fact Sheet — France 4
The vocational training system does not meet the needs of SMEs
either. Trainees and apprentices are not yet sufficiently prepared
in terms of skills and understanding of the business
environment. The apprenticeship system is regarded as rather
inflexible in terms of the needs of start-ups and SMEs. The
significant administrative burdens attendant upon setting up
apprenticeship contracts continue to make it difficult to set up
new apprenticeships. However, the number of apprenticeship
contracts increased by 4.2 % in 2015 compared to 2014 and the
government recently reaffirmed its goal of reaching the target
of 500 000 apprentices by 2017. French employees can also
choose to train themselves, using their personal training account
(CPF — compte personnel de formation). 200 000 employees
were trained and more than 1 million accounts opened in 2015.
The government plans to integrate the CPF into the personal
activity account (CPA — compte personnel d’activité) to extend
the training programme to self-employed people and public
servants.
A number of administrative services exist to help SMEs expand
across national borders. However, the multiplicity of
administrative services and the general lack of coordination
among these services prevent SMEs from seizing opportunities
the single market and markets beyond the EU provide.
SBA performance of France: state of play and development from 2008 to 201615
2016 SBA Fact Sheet — France 5
3. SBA principles16
3.0 ‘Think Small First’ The ‘Think Small First’ principle is intended as a guiding principle
for all policy- and law-making activities. It requires policy-
makers to take SME interests into account at the early stages of
the policy-making process. The principle also calls for newly
designed legislation, administrative rules and procedures to be
made simple and easy to apply.
The government introduced numerous simplification measures.
The most important ones include the ‘Unique Social Statement’,
‘Remove a Standard Each Time You Create a New Standard’ and
‘Tell Us Once’, but it is too early to fully assess the long-term
effects of these measures. The aim of the ‘Tell Us Once’
measure is to reduce the number of times and the frequency
with which government departments ask businesses for
information. For example, the ‘simplified public tender’ procedure
(marché public simplifié) started in 2014. Thanks to a unique
identifier (SIRET number), introduced under the ‘Tell Us Once’
measure, less paperwork is required nowadays.
Since October 2014, all businesses can file their tax-related
reports online. This makes the process easier but does not
reduce the administrative burden. That could be done by
reducing the number of tax credits, tax rates and kinds of tax
relief. Instead of that, several different VAT rates and new taxes
were recently introduced.
There is still lack of a comprehensive ‘SME test’ to assess the
impact of new legislation on businesses. Although regulatory
impact assessments have been mandatory for legislative texts
since 2008 and for decrees since 2011, they remain very
limited. Given the high number of legislative texts and decrees, a
surprisingly low number of ‘SME panels’ have been conducted so
far. ‘SME panels’ complement impact assessments with more
detailed information on SMEs obtained directly from the SMEs in
question.
There is a feeling among the SME community that greater
consultation and transparency is needed on SME-related bills.
SME stakeholders are mainly consulted at the initial drafting
stage, but they would like to be consulted at the later stages of
the legislative process too, especially on modifications, which are
sometimes very significant. They also lament the lack of
information on the impact and the extent of the use of
consultation findings.
The SME envoy was less visible than during the previous
reporting period because the ‘Assises des PME’ in 2014 and the
preparation of the SME envoy meeting in Paris in 2015
generated more activity than usual. The SME envoy supported
the Commission start-ups consultation by preparing an online
tool for contributions to the consultation. The SME envoy is
directly attached to the relevant minister. This high-level position
helps to incorporate SME concerns into public policies.
SME stakeholders welcome the simplification measures, but they
suffer the consequences of a constantly changing legal
environment. It is crucial for them to have a more stable legal
environment, with fewer changes, prioritising those that result in
major simplifications, including at the level of state agencies and
at local and regional levels.

2016 SBA Fact Sheet — France 6
3.1 Entrepreneurship
France performs broadly in line with the EU average in this area,
although individual indicators vary considerably. For example,
while entrepreneurship education at basic school level is among
the 10 lowest-scoring in the EU, it is among the 10 highest-
scoring performers at post-secondary level. However, it needs to
do more to improve cooperation between educational institutions
and private sector. France is also among the lowest-scoring
performers in the EU on early-stage entrepreneurial activity and
the established business ownership rate (i.e. the proportion of
the population that owns an operating business). On the other
hand, opportunity-driven entrepreneurial activity (as opposed to
not finding another option for work) was the highest in the EU.
Since 2008, a number of policy measures have been
implemented to promote entrepreneurial activity. The status of
‘auto-entrepreneur’ was introduced, simplifying administrative
tasks. The New Programme of Support for Starting or Taking
Over a Company (Nouvel Accompagnement à la Création et à la
Reprise d’Entreprise) was set up, supporting unemployed people
willing to start or take over a company. That status of ‘private
entrepreneur with limited responsibility’ (EIRL - entrepreneur
individuel à responsabilité limitée) was introduced. This allows
individual entrepreneurs to distinguish between their personal
assets and their business assets. Various action plans were also
put in place, such as the female entrepreneurship action plan.
However, the PINEL law, adopted in June 2014, has increased
the administrative and financial burden for those with ‘auto-
entrepreneur’ status. In 2015 compared to 2014, the number of
new ‘auto-entrepreneur’ status registrations decreased by one
fifth. This was the first such decrease since ‘auto-entrepreneur’
status was introduced in 2009. With its draft law on
transparency, the fight against corruption and modernising the
economy, the government intends to address some of the issues
outlined above. The measures are intended to simplify the
obligation of micro-entrepreneurs to have a double bank account
and the mandatory training (depending on the level of
experience) and qualification required (depending on the sector
in question) for some micro-entrepreneurs.
-2.0 -1.5 -1.0 -0.5 0.0 0.5 1.0 1.5 2.0
Entrepreneurship education at post-secondary levels (1-5); 2014; France:2.92; EU avg: 2.78
Entrepreneurship education at basic school (1-5) ; 2014; France: 1.75; EUavg: 2.09
Media attention given to entrepreneurship (%); 2014; France: 38.98; EUavg: 53.3
High status given to successful entrepreneurship (%); 2014; France: 70.43;EU avg: 66.6
Entrepreneurship as a desirable career choice (%); 2014; France: 59.05;EU avg: 56.9
Degree to which school education helped develop an entrepreneurialattitude; 2012; France: 50; EU avg: 50
Entrepreneurial intentions (percentage of adults who intend to start abusiness within 3 years); 2014; France: 14.2; EU avg: 12.1
Opportunity-driven entrepreneurial activity (%); 2014; France: 69.15; EUavg: 47.9
Established business ownership rate (%); 2014; France: 2.94; EU avg: 6.7
Early stage entrepreneurial activity for female population (%); 2014; France:4.03; EU avg: 5.45
Early stage entrepreneurial activity (%); 2014; France: 5.34; EU avg: 7.8
Note: Data bars pointing right show better performance than the EU average and data bars pointing left show weaker performance.
Variation from the EU average (measured in standard deviations, EU average=0)
2016 SBA Fact Sheet — France 7
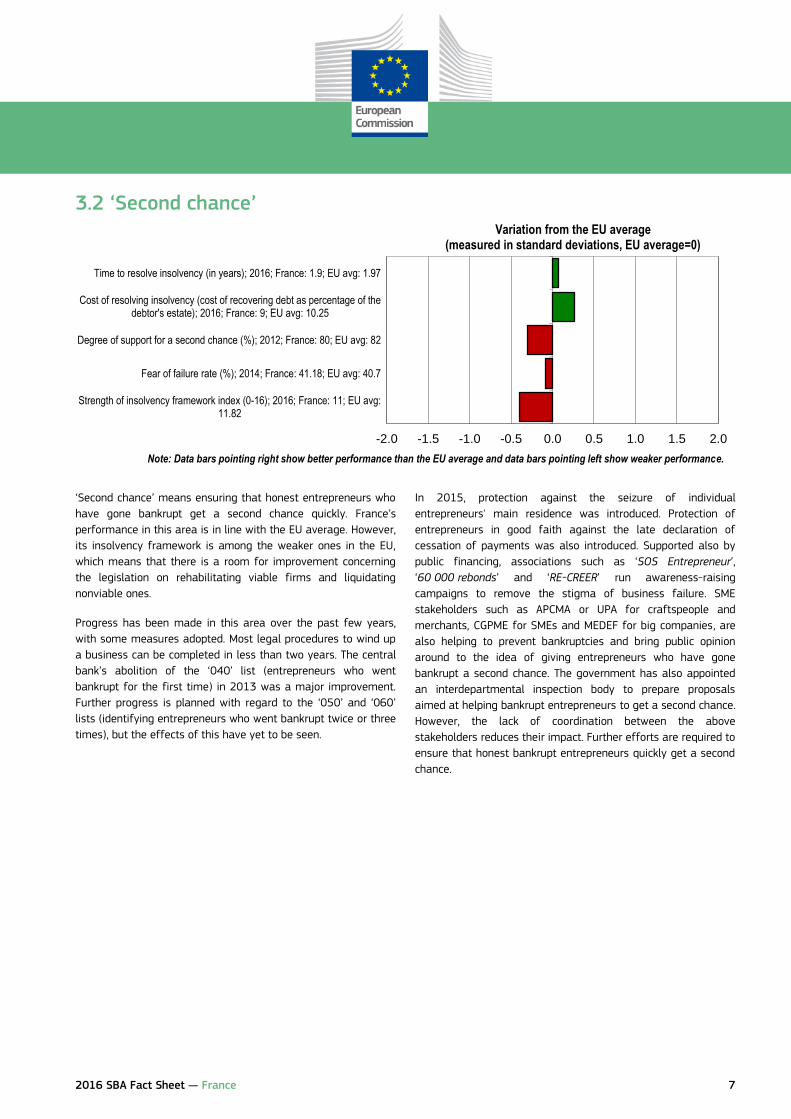
3.2 ‘Second chance’
‘Second chance’ means ensuring that honest entrepreneurs who
have gone bankrupt get a second chance quickly. France’s
performance in this area is in line with the EU average. However,
its insolvency framework is among the weaker ones in the EU,
which means that there is a room for improvement concerning
the legislation on rehabilitating viable firms and liquidating
nonviable ones.
Progress has been made in this area over the past few years,
with some measures adopted. Most legal procedures to wind up
a business can be completed in less than two years. The central
bank’s abolition of the ‘040’ list (entrepreneurs who went
bankrupt for the first time) in 2013 was a major improvement.
Further progress is planned with regard to the ‘050’ and ‘060’
lists (identifying entrepreneurs who went bankrupt twice or three
times), but the effects of this have yet to be seen.
In 2015, protection against the seizure of individual
entrepreneurs' main residence was introduced. Protection of
entrepreneurs in good faith against the late declaration of
cessation of payments was also introduced. Supported also by
public financing, associations such as ‘SOS Entrepreneur’,
‘60 000 rebonds’ and ‘RE-CREER’ run awareness-raising
campaigns to remove the stigma of business failure. SME
stakeholders such as APCMA or UPA for craftspeople and
merchants, CGPME for SMEs and MEDEF for big companies, are
also helping to prevent bankruptcies and bring public opinion
around to the idea of giving entrepreneurs who have gone
bankrupt a second chance. The government has also appointed
an interdepartmental inspection body to prepare proposals
aimed at helping bankrupt entrepreneurs to get a second chance.
However, the lack of coordination between the above
stakeholders reduces their impact. Further efforts are required to
ensure that honest bankrupt entrepreneurs quickly get a second
chance.
-2.0 -1.5 -1.0 -0.5 0.0 0.5 1.0 1.5 2.0
Strength of insolvency framework index (0-16); 2016; France: 11; EU avg:11.82
Fear of failure rate (%); 2014; France: 41.18; EU avg: 40.7
Degree of support for a second chance (%); 2012; France: 80; EU avg: 82
Cost of resolving insolvency (cost of recovering debt as percentage of thedebtor's estate); 2016; France: 9; EU avg: 10.25
Time to resolve insolvency (in years); 2016; France: 1.9; EU avg: 1.97
Note: Data bars pointing right show better performance than the EU average and data bars pointing left show weaker performance.
Variation from the EU average (measured in standard deviations, EU average=0)

2016 SBA Fact Sheet — France 8
3.3 ‘Responsive administration’
‘Responsive administration’ means public administration being
responsive to the needs of SMEs. France continues to be broadly
in line with the EU average in this area. However, fast-changing
legislation and policies made doing business difficult for 89 % of
French respondents in 2015. This figure is the second highest in
the EU and only one percentage point less than in 2013. The
2015 figure for the complexity of administrative procedures
making it hard to do business is also 89 %, 6 percentage points
worse than the 2013 figure of 83 %. The time it takes to
transfer property is more than double the EU average. On the
positive side, the score for the burden of government
regulations, which remains below the EU average, has continued
to improve slowly but steadily since 2008. The people working
for French government agencies are regarded as competent and
effective in supporting new and growing companies. Proof of this
is that France is among the best four performers in the EU on
this indicator.
Overall, a progress has been made in this area since 2008. It has
been made possible to register a business using an online
platform. Among other important measures is the ‘silence is
consent’ principle, being introduced gradually. The government
has also unveiled an ambitious plan to rewrite the labour code.
During 2015 and the first quarter of 2016, about 140 measures
were created to simplify administrative tasks for SMEs. However,
-2.0 -1.5 -1.0 -0.5 0.0 0.5 1.0 1.5 2.0
Competency and effectiveness of government staff in supporting new andgrowing firms (1-5); 2014; France: 3.33; EU avg: 2.7
Burden of government regulations (1=burdensome, 7=not burdensome); 2015;France: 2.92; EU avg: 3.24
Start-up procedures (number); 2016; France: 5; EU avg: 4.93
Licenses and permit systems (1=lowest level of complexity, 26=highest level ofcomplexity); 2011; France: 13; EU avg: 15.77
SMEs interacting online with public authorities (%); 2013; France: 95.57; EUavg: 87.85
The complexity of administrative procedures is a problem for doing business(percentage of respondents who agree); 2015; France: 89; EU avg: 62
Fast-changing legislation and policies are a problem for doing business(percentage of respondents who agree); 2015; France: 89; EU avg: 64
Cost of enforcing contracts (percentage of claim); 2016; France: 17.4; EU avg:21.88
Time it takes to pay taxes (hours per year); 2016; France: 137; EU avg: 185.55
Number of tax payments per year; 2016; France: 8; EU avg: 10.89
Cost required to transfer property (percentage of property value); 2016; France:6.1; EU avg: 4.46
Time required to transfer property (in calendar days); 2016; France: 49; EU avg:23.04
Paid-in minimum capital (percentage of income per capita); 2016; France: 0; EUavg: 10.66
Cost of starting a business (in euros); 2015; France: 84; EU avg: 315.74
Time to start a business (in calendar days); 2015; France: 4; EU avg: 3.35
Note: Data bars pointing right show better performance than the EU average and data bars pointing left show weaker performance.
Variation from the EU average (measured in standard deviations, EU average=0)

2016 SBA Fact Sheet — France 9
despite the simplification programme and the measures
designed to smoothen the impact of the size-related criteria in
regulations that impede companies’ growth, regulatory burden
continues to be an important area of concern for French
companies.
Most of the measures adopted in the context of the
simplification programme have been implemented, but efforts
need to be pursued. Remaining barriers that recent or ongoing
reforms do not sufficiently address, in particular regarding
business services and regulated professions, need to be
removed.
3.4 State aid & public procurement
France’s performance in this area continues to be above the EU
average. It is among the seven best performers in the EU. It has
the second highest percentage of businesses participating in
public tenders, with even greater participation in 2015 (54 %)
than in 2013 (50 %).
Overall, progress has been made in this area since 2008. One of
the most significant policy measures has been the modification
of the rules on procurement, to allow more SMEs, especially
those recently set up, participate in public tenders. Since the
simplified procurement procedure was introduced in 2014, about
20 000 simplified procurement procedures have been carried
out.
Several ombudsmen have been appointed, including one for
subcontractors to improve their relationship with large
companies and spread good practices across public services in
order to increase SME participation in public procurement.
Despite the ombudsmen’s efforts, many companies, in particular
subcontractors, are still paid late.
No significant new policy measures related to public
procurement were implemented or announced during 2015 and
the first quarter of 2016.
-2.0 -1.5 -1.0 -0.5 0.0 0.5 1.0 1.5 2.0
Percentage of businesses submitting proposals in a public electronic tendersystem (e-procurement) (%); 2013; France: 18.61; EU avg: 12.85
Average delay in payments from public authorities (in days); 2015; France:19; EU avg: 12.58
Percentage of businesses participating in public tenders (%); 2015; France:54; EU avg: 37
Percentage SMEs account for in the total value of public contracts awarded(%); 2013; France: 31; EU avg: 29
Note: Data bars pointing right show better performance than the EU average and data bars pointing left show weaker performance.
Variation from the EU average (measured in standard deviations, EU average=0)

2016 SBA Fact Sheet — France 10
3.5 Access to finance
France performs in line with the EU average in this area. Access
to public financial support including guarantees, measured by
the percentage of French respondents that indicated a
deterioration, significantly improved in 2015 compared to 2014.
This happened across the EU however, keeping France below the
EU average on this indicator. The willingness of banks to provide
a loan, measured by the percentage of respondents that
indicated a deterioration, has continued to gradually increase
over the last four years. The situation also improved with regard
to the percentage of rejected loan applications and unacceptable
loan offers, which fell from 13.6 % in 2013 to 10.8 % in 2015.
However, the cost of small loans compared to large loans has
been increasing since 2013, when small loans were 15 % more
expensive than large loans. In 2015 they were nearly 24 % more
expensive than large loans of over EUR 1 million.
Since 2008, a considerable number of funding measures have
been implemented. These include the recovery plan of
2008/2009 and reinforcement of the lending capacity of the
public investment bank ‘Bpifrance’. The creation of a large
national loan of EUR 47 billion, ‘Investment for the Future’, was
an important step towards modernising the French industrial
base and making companies, especially SMEs, more competitive.
The competitiveness and employment tax credit (CICE — Crédit
d’impôt pour la compétitivité et l’emploi), was introduced in
2013, reducing labour costs for SMEs. Ombudsmen help
subcontractors who get into financial difficulties due to late
payments from large companies. However, despite the progress
made, it is still difficult to access finance without the support of
the public investment bank ‘Bpifrance’.
During 2015 and the first quarter of 2016, a number of
additional measures were implemented:
− In April 2015, an exceptional time-limited tax incentive was
introduced to encourage companies to invest during a one-
year period (initially until April 2016, prolonged until April
2017), enabling them to amortise their eligible investments
for up to 140 % of their face value. Prolonging this
measure is a great help for SMEs, since it takes them more
time to initiate larger investments.
− The aim of the ‘Industry for the Future’ policy framework is
to modernise the industrial base and turn traditional
business models into disruptive ones. Under this measure,
adopted in May 2015, targeted loans totalling
EUR 2.2 billion and tax incentives of EUR 5 billion over 6
years are envisaged in order to accelerate the digital
transition of SMEs. The nine industrial solutions address
issues such as green mobility, the internet of things and
future medicine with set objectives and roadmaps.
− In January 2016, the government put in place financial
support, corresponding to the amount of the social charges
the employer pays annually on the minimum wage, for
SMEs recruiting unemployed people. This financial support,
provided as a cash refund on the basis of the employer’s
-2.0 -1.5 -1.0 -0.5 0.0 0.5 1.0 1.5 2.0
Business angels funding for new and growing firms (1-5); 2014; France: 2.75;EU avg: 2.67
Equity funding for new and growing firms (1-5); 2014; France: 2.7; EU avg: 2.73
Willingness of banks to provide a loan (percentage of respondents that indicateda deterioration); 2015; France: 19.86; EU avg: 13.01
Access to public financial support including guarantees (percentage ofrespondents that indicated a deterioration); 2015; France: 21.03; EU avg: 13.76
Rejected loan applications and unacceptable loan offers (percentage of loanapplications by SMEs); 2015; France: 10.82; EU avg: 9.64
Cost of borrowing for small loans relative to large loans (%); 2015; France:23.68; EU avg: 25.22
Bad debt loss (percentage of total turnover); 2015; France: 1.8; EU avg: 3.76
Total amount of time it takes to get paid (days); 2015; France: 48.67; EU avg:34.96
Strength of legal rights index (0-12); 2016; France: 4; EU avg: 5.75
Venture capital investments (percentage of GDP); 2014; France: 0.04; EU avg:0.03
Note: Data bars pointing right show better performance than the EU average and data bars pointing left show weaker performance.
Variation from the EU average (measured in standard deviations, EU average=0)

2016 SBA Fact Sheet — France 11
declaration, is available in 2016, for the two first years of
an employee’s contract. SMEs must apply for this tax credit.
The government also announced that in 2017 it would consider
making the attractive competitiveness and employment tax
credit (whose resulting reduction of labour costs is estimated to
be EUR 13 billion in 2016) permanent. This would make it less
complicated to implement.
3.6 Single market
France’s performance in this area is below the EU average.
Despite significant improvement since 2008, its score is the fifth
lowest in the EU. The number of pending infringement
proceedings is among the four highest in the EU. It has yet to
seize significant single market opportunities, such as in exporting
goods to other EU countries. Namely, the percentage of other
Member States’ SMEs exporting within the EU (17.3 %) was
more than double that of French SMEs (7.8 %).
A number of administrative services exist to help SMEs expand
across national borders. However, the multiplicity of
administrative services and the general lack of coordination
among these services result in suboptimal supporting
environment. The support system is thus complex, which means
that it is harder for SMEs than for large companies to do cross-
border business.
No significant new single market policy measures were
implemented in 2015 and the first quarter of 2016.
-2.0 -1.5 -1.0 -0.5 0.0 0.5 1.0 1.5 2.0
Market access for new and growing firms without being unfairly blocked byestablished firms (1-5); 2014; France: 2.23; EU avg: 2.78
Easy market access for new and growing firms (1-5); 2014; France: 3.32;EU avg: 2.78
Intra-EU online exporters (% of SMEs); 2015; France: 7.94; EU avg: 7.52
SMEs with intra-EU imports of goods (percentage of SMEs in industry);2013; France: 4.67; EU avg: 25.95
SMEs with intra-EU exports of goods (percentage of SMEs in industry);2013; France: 7.81; EU avg: 17.3
Public contracts secured abroad by SMEs (percentage of total value ofpublic contracts); 2013; France: 1; EU avg: 2.6
Number of pending infringement proceedings; 2015; France: 51; EU avg: 27
Average transposition delay for overdue directives (in months); 2015;France: 8.6; EU avg: 7.46
Note: Data bars pointing right show better performance than the EU average and data bars pointing left show weaker performance.
Variation from the EU average (measured in standard deviations, EU average=0)
2016 SBA Fact Sheet — France 12
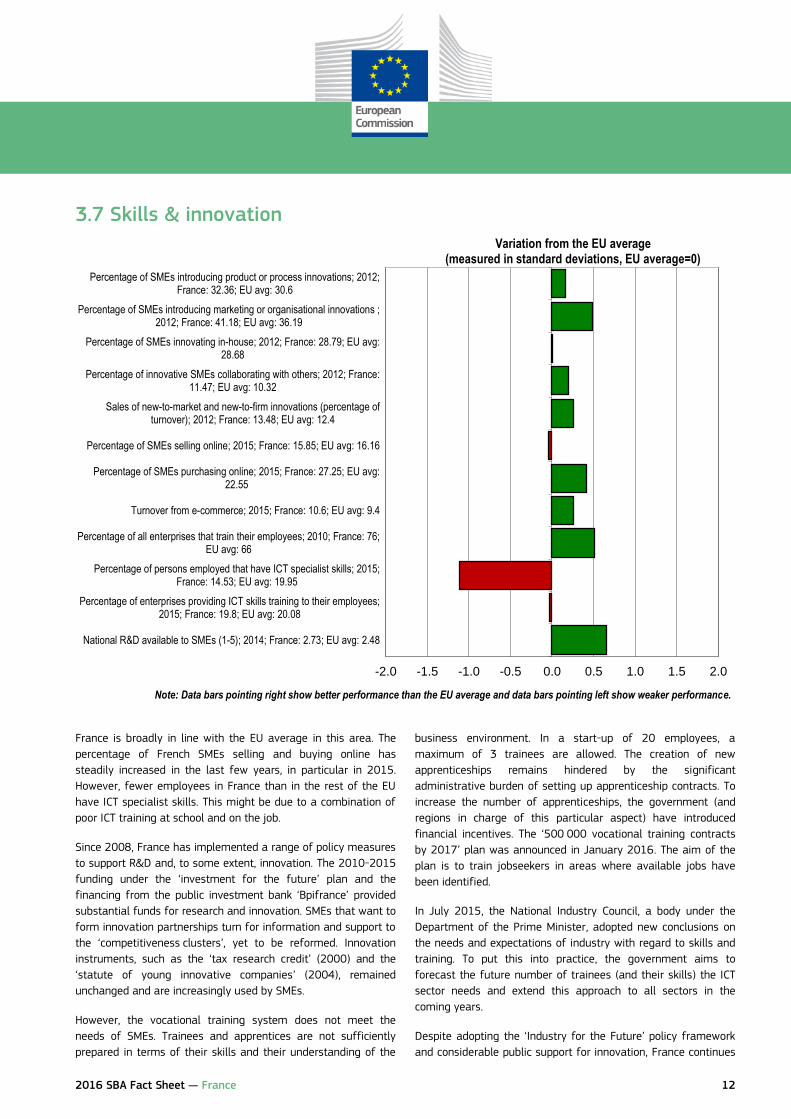
3.7 Skills & innovation
France is broadly in line with the EU average in this area. The
percentage of French SMEs selling and buying online has
steadily increased in the last few years, in particular in 2015.
However, fewer employees in France than in the rest of the EU
have ICT specialist skills. This might be due to a combination of
poor ICT training at school and on the job.
Since 2008, France has implemented a range of policy measures
to support R&D and, to some extent, innovation. The 2010-2015
funding under the ‘investment for the future’ plan and the
financing from the public investment bank ‘Bpifrance’ provided
substantial funds for research and innovation. SMEs that want to
form innovation partnerships turn for information and support to
the ‘competitiveness clusters’, yet to be reformed. Innovation
instruments, such as the ‘tax research credit’ (2000) and the
‘statute of young innovative companies’ (2004), remained
unchanged and are increasingly used by SMEs.
However, the vocational training system does not meet the
needs of SMEs. Trainees and apprentices are not sufficiently
prepared in terms of their skills and their understanding of the
business environment. In a start-up of 20 employees, a
maximum of 3 trainees are allowed. The creation of new
apprenticeships remains hindered by the significant
administrative burden of setting up apprenticeship contracts. To
increase the number of apprenticeships, the government (and
regions in charge of this particular aspect) have introduced
financial incentives. The ‘500 000 vocational training contracts
by 2017’ plan was announced in January 2016. The aim of the
plan is to train jobseekers in areas where available jobs have
been identified.
In July 2015, the National Industry Council, a body under the
Department of the Prime Minister, adopted new conclusions on
the needs and expectations of industry with regard to skills and
training. To put this into practice, the government aims to
forecast the future number of trainees (and their skills) the ICT
sector needs and extend this approach to all sectors in the
coming years.
Despite adopting the ‘Industry for the Future’ policy framework
and considerable public support for innovation, France continues
-2.0 -1.5 -1.0 -0.5 0.0 0.5 1.0 1.5 2.0
National R&D available to SMEs (1-5); 2014; France: 2.73; EU avg: 2.48
Percentage of enterprises providing ICT skills training to their employees;2015; France: 19.8; EU avg: 20.08
Percentage of persons employed that have ICT specialist skills; 2015;France: 14.53; EU avg: 19.95
Percentage of all enterprises that train their employees; 2010; France: 76;EU avg: 66
Turnover from e-commerce; 2015; France: 10.6; EU avg: 9.4
Percentage of SMEs purchasing online; 2015; France: 27.25; EU avg:22.55
Percentage of SMEs selling online; 2015; France: 15.85; EU avg: 16.16
Sales of new-to-market and new-to-firm innovations (percentage ofturnover); 2012; France: 13.48; EU avg: 12.4
Percentage of innovative SMEs collaborating with others; 2012; France:11.47; EU avg: 10.32
Percentage of SMEs innovating in-house; 2012; France: 28.79; EU avg:28.68
Percentage of SMEs introducing marketing or organisational innovations ;2012; France: 41.18; EU avg: 36.19
Percentage of SMEs introducing product or process innovations; 2012;France: 32.36; EU avg: 30.6
Note: Data bars pointing right show better performance than the EU average and data bars pointing left show weaker performance.
Variation from the EU average (measured in standard deviations, EU average=0)
2016 SBA Fact Sheet — France 13
to lag behind the innovation leaders. The proliferation and
instability of innovation policy schemes raise concerns in terms
of their overall coordination, consistency and efficiency. This
particularly affects SMEs.17
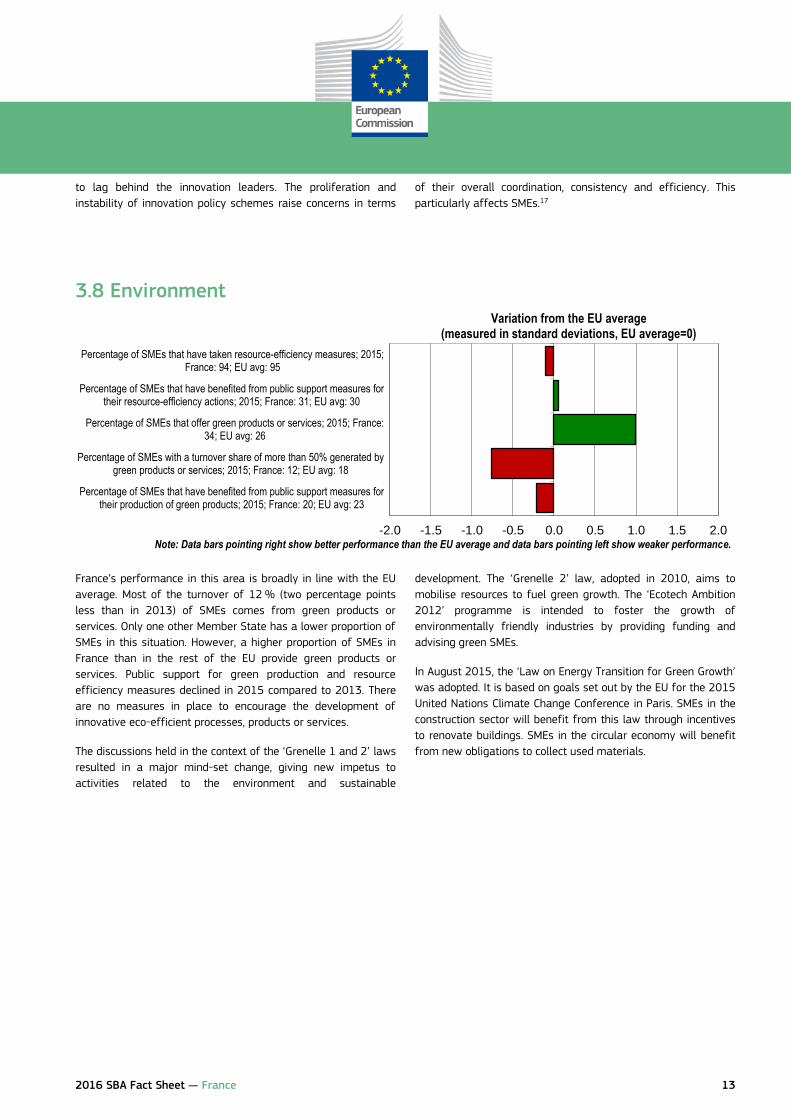
3.8 Environment
France’s performance in this area is broadly in line with the EU
average. Most of the turnover of 12 % (two percentage points
less than in 2013) of SMEs comes from green products or
services. Only one other Member State has a lower proportion of
SMEs in this situation. However, a higher proportion of SMEs in
France than in the rest of the EU provide green products or
services. Public support for green production and resource
efficiency measures declined in 2015 compared to 2013. There
are no measures in place to encourage the development of
innovative eco-efficient processes, products or services.
The discussions held in the context of the ‘Grenelle 1 and 2’ laws
resulted in a major mind-set change, giving new impetus to
activities related to the environment and sustainable
development. The ‘Grenelle 2’ law, adopted in 2010, aims to
mobilise resources to fuel green growth. The ‘Ecotech Ambition
2012’ programme is intended to foster the growth of
environmentally friendly industries by providing funding and
advising green SMEs.
In August 2015, the ‘Law on Energy Transition for Green Growth’
was adopted. It is based on goals set out by the EU for the 2015
United Nations Climate Change Conference in Paris. SMEs in the
construction sector will benefit from this law through incentives
to renovate buildings. SMEs in the circular economy will benefit
from new obligations to collect used materials.
-2.0 -1.5 -1.0 -0.5 0.0 0.5 1.0 1.5 2.0
Percentage of SMEs that have benefited from public support measures fortheir production of green products; 2015; France: 20; EU avg: 23
Percentage of SMEs with a turnover share of more than 50% generated bygreen products or services; 2015; France: 12; EU avg: 18
Percentage of SMEs that offer green products or services; 2015; France:34; EU avg: 26
Percentage of SMEs that have benefited from public support measures fortheir resource-efficiency actions; 2015; France: 31; EU avg: 30
Percentage of SMEs that have taken resource-efficiency measures; 2015;France: 94; EU avg: 95
Note: Data bars pointing right show better performance than the EU average and data bars pointing left show weaker performance.
Variation from the EU average (measured in standard deviations, EU average=0)

2016 SBA Fact Sheet — France 14
3.9 Internationalisation
France’s performance in this area is broadly in line with the EU
average. Since 2008, UBIFRANCE, the main French agency for
export promotion, has been strengthened with additional means
to support 10 000 companies (2009), the merger with similar
services located abroad from the Ministry of the Economy
(2011), and the merger with the French Agency for International
Investment into the ‘Business France’ agency (2015). These
measures helped increase the number of exporting companies
for the fourth consecutive year, with 4 000 additional exporting
companies in 2015.18 However, the overall number of companies
exporting to foreign markets remains relatively low, at 125 000
in 2015.
For years now, SME stakeholders have been voicing their
concerns about the multiplicity of operators helping companies
to expand across national borders. This considerably weakens
the capacity of SMEs to seek support for internationalisation.
The lack of fluency in foreign languages also prevents SMEs
from expanding across national borders.
During 2015 and the first quarter of 2016, no significant new
policy measures were adopted or announced.
-2.0 -1.5 -1.0 -0.5 0.0 0.5 1.0 1.5 2.0
Cost to import for documentary compliance (in USD); 2016; France: 0; EUavg: 6.61
Time to import for documentary compliance (in hours); 2016; France: 1; EUavg: 1.07
Cost to export for documentary compliance (in USD); 2016; France: 0; EUavg: 16.43
Time to export for documentary compliance (in hours); 2016; France: 1; EUavg: 1.39
SMEs with extra-EU imports of goods (percentage of SMEs in industry);2013; France: 7.5; EU avg: 11.08
SMEs with extra-EU exports of goods (percentage of SMEs in industry);2013; France: 8.87; EU avg: 9.95
Note: Data bars pointing right show better performance than the EU average and data bars pointing left show weaker performance.
Variation from the EU average (measured in standard deviations, EU average=0)

2016 SBA Fact Sheet — France 15
4. Interesting initiative
Below is an example of an initiative from France to show what governments can do to support SMEs:
The ‘Industry for the Future’ framework – modernising the French industrial base
The aim of the ‘Industry for the Future’ policy framework is to modernise the industrial base and turn traditional business models into
disruptive ones.
Launched in May 2015, it is a cross-cutting programme that revolves around the corresponding nine industrial solutions. It is based
on the following five principles:
- expanding the French technological offer
- supporting businesses throughout the transformation phase
- providing staff training
- supporting international cooperation on standards
- promoting French ‘Industry for the Future’.
In 2015, over 500 industrial SMEs benefited from individual assessments (1500 in 2016). The nine plans, with set multiannual
roadmaps and objectives, focus on production methods (making them more efficient, using new resources and integrating them into
the circular economy), making cities green, green mobility, future transportation, future medicine, big data, the internet of things, safe
internet use and future food products.
Targeted loans totalling EUR 2.2 billion and tax incentives of EUR 5 billion over 6 years are envisaged to boost the digital transition of
SMEs as part of the drive to modernise the French industrial base.
References:
http://www.economie.gouv.fr/nouvelle-france-industrielle/accueil
http://www.economie.gouv.fr/vous-orienter/industrie/nouvelle-france-industrielle
http://www.economie.gouv.fr/files/files/PDF/industrie-du-futur_dp.pdf
http://www.localtis.info/cs/ContentServer?pagename=Localtis/LOCActu/ArticleActualite&cid=1250270068524
2016 SBA Fact Sheet — France 16
Important remarks
The European Commission Directorate-General for Internal Market, Industry, Entrepreneurship and SMEs (DG GROW) produces the
SBA fact sheets as part of the SME Performance Review (SPR), its main vehicle for economic analysis of SME issues. They
combine the latest available statistical and policy information. Produced annually, the fact sheets help to organise the available
information to facilitate SME policy assessments and monitor SBA implementation. They take stock and record progress. They are
not an assessment of Member State policies. Rather, they should be regarded as an additional source of information to improve
evidence-based policy-making. For example, they cite only policy measures national SME policy experts consider relevant. They do
not and cannot reflect all measures the government has taken over the reference period. There is more policy information on a
database accessible from the SPR website.
SME Performance Review:
http://ec.europa.eu/growth/smes/business-friendly-environment/performance-review/index_en.htm
Small Business Act:
http://ec.europa.eu/growth/smes/business-friendly-environment/small-business-act/index_en.htm
European Small Business Portal:
http://ec.europa.eu/small-business/index_en.htm
Endnotes
1 The two graphs below present the trend over time for the variables. They consist of index values for the years since 2008, with the base year 2008 set at a value of 100. As from 2014, the graphs show estimates of the development over time, produced by DIW Econ on the basis of 2008-2013 figures from Eurostat’s Structural Business Statistics Database. The data cover the ‘non-financial business economy’, which includes industry, construction, trade and services (NACE Rev. 2 sections B to J, L, M and N). They do not cover enterprises in agriculture, forestry and fisheries or largely non-market service sectors such as education and health. A detailed methodology can be consulted at: http://ec.europa.eu/growth/smes/business-friendly-environment/performance-review/index_en.htm
2 These statistics use the Eurostat definition of a company, which focuses on the ‘legal entity’. This differs from France’s definition, which uses the concept of ‘economic groups’. Differences between statistics provided by France’s National Institute for Statistics and Economic Studies (INSEE) and the data above are due to the different concepts.
3 http://www.insee.fr/fr/themes/info-rapide.asp?id=41&date=20160212; last accessed 24.03.2016.
4 Law of 18 June 2014, called the Pinel law; http://www.economie.gouv.fr/chronique-projet-de-loi-artisanat-au-commerce-et-tres-petites-entreprises; last accessed 24.03.2016.
5 http://www.lefigaro.fr/assets/pdf/Rapport-LG.pdf; last accessed 24.03.2016.
6 http://lekiosque.finances.gouv.fr/fichiers/Etudes/Thematiques/A2015.pdf; last accessed 24.03.2016.
7 http://www.insee.fr/fr/ffc/docs_ffc/ENTFRA13.pdf (pp. 29 & 146); last accessed 24.03.2016.
8 http://www.insee.fr/fr/themes/info-rapide.asp?id=41&date=20160212; last accessed 24.03.2016.
9 https://www.banque-france.fr/economie-et-statistiques/stats-info/detail/defaillances-dentreprises.html; last accessed 24.03.2016.
10 https://www.banque-france.fr/economie-et-statistiques/stats-info/detail/defaillances-dentreprises.html; last accessed 24.03.2016.
2016 SBA Fact Sheet — France 17
11 Law of 18 June 2014, called the Pinel law; http://www.economie.gouv.fr/chronique-projet-de-loi-artisanat-au-commerce-et-tres-petites-entreprises; last accessed 24.03.2016.
12 http://www.insee.fr/fr/themes/info-rapide.asp?id=41&date=20160212; last accessed 24.03.2016.
13 http://www.insee.fr/fr/themes/info-rapide.asp?id=41&date=20160212; last accessed 24.03.2016.
14 The 2016 SBA fact sheets benefited substantially from input from the European Commission’s Joint Research Centre (JRC) in Ispra, Italy. The JRC made major improvements to the methodological approach, statistical work on the dataset and the visual presentation of the data.
15 The quadrant chart combines two sets of information. Firstly, it shows current performance based on data for the latest available years. This information is plotted along the X-axis, measured in standard deviations of the simple, non-weighted arithmetical average for the EU-28. Secondly, it shows progress over time, i.e. the average annual growth rates from 2008 to 2016. These are measured against the individual indicators which make up the SBA area averages. This means that the location of a particular SBA area average in any of the four quadrants provides information not only about where the country is located in this SBA area relative to the EU average at a given point in time, but also about the extent of progress made between 2008 and 2016. All SBA principles, with the exception of the ‘Think Small First’ principle, for which there is not enough statistical data available, are calculated as composite indicators following the OECD/JRC Handbook guide. A detailed methodology can be consulted at: http://ec.europa.eu/growth/smes/business-friendly-environment/performance-review/index_en.htm
16 The policy measures presented in this SBA fact sheet are only a selection of the measures the government took in 2015 and the first quarter of 2016. The national SME policy expert that CARSA Spain (DG GROW’s lead contractor for the 2016 SBA fact sheets) contracted made the selection. The experts were asked to select only the measures they considered the most important, i.e. the ones expected to have the highest impact in the SBA area in question. The complete range of measures the experts compiled in producing this year’s fact sheets will be published alongside the fact sheets in a policy database on the DG GROW website.
17 http://ec.europa.eu/europe2020/pdf/csr2016/cr2016_france_en.pdf
18 http://www.ambafrance-de.org/La-France-dans-les-echanges-internationaux-Presentation-des-chiffres-2015-du