Embed Size (px)
Citation preview

Strawberry Cost and Return Study – Central Coast – University of California
University of California Agriculture and Natural Resources Cooperative Extension and Agricultural Issues Center
UC Davis Department of Agricultural and Resource Economics
2016
SAMPLE COSTS TO PRODUCE AND HARVEST STRAWBERRIES
CENTRAL COAST REGION Santa Cruz & Monterey Counties
Mark P. Bolda UC Cooperative Extension Farm Advisor, Santa Cruz, Monterey & San Benito Counties Laura Tourte UC Cooperative Extension Farm Advisor, Santa Cruz, Monterey & San Benito Counties Jeremy Murdock Staff Research Associate, UC ANR – Agricultural Issues Center Daniel A. Sumner Director, UC ANR – Agricultural Issues Center and Professor, Department of Agricultural and Resource Economics, UC Davis

2
Strawberry Cost and Return Study – Central Coast – University of California
University of California Agriculture and Natural Resources Cooperative Extension and Agricultural Issues Center
UC Davis Department of Agricultural and Resource Economics
SAMPLE COSTS TO PRODUCE AND HARVEST STRAWBERRIES Central Coast Region - Santa Cruz & Monterey Counties - 2016
CONTENTS
INTRODUCTION .................................................................................................................................................. 2 ASSUMPTIONS .................................................................................................................................................... 3 Production Cultural Practices and Material Inputs ............................................................................................... 3 Growing Costs ...................................................................................................................................................... 6 Labor, Equipment, and Interest ............................................................................................................................ 6 Cash Overhead ..................................................................................................................................................... 8 Non-Cash Overhead ............................................................................................................................................. 9 REFERENCES ..................................................................................................................................................... 11 Table 1. Costs Per Acre to Produce and Harvest Strawberries ........................................................................... 12 Table 2. Costs and Returns Per Acre to Produce and Harvest Strawberries ....................................................... 14 Table 3. Monthly Cash Costs Per Acre to Produce and Harvest Strawberries .................................................... 16 Table 4. Ranging Analysis .................................................................................................................................. 18 Table 5. Whole Farm Annual Equipment, Investment, and Business Overhead Costs ...................................... 19 Table 6. Hourly Equipment Costs ....................................................................................................................... 20
Acknowledgements. Thank you to the strawberry growers, Pest Control Advisers, supervisors and
various suppliers who provided cultural and cost information.
INTRODUCTION
The sample costs to produce and harvest strawberries in the Central Coast Region – Santa Cruz and Monterey counties – are presented in this study. The study is intended as a guide only, and can be used to make production decisions, determine potential returns, prepare budgets and evaluate production loans. The practices described are based on production procedures considered typical for this crop and area, and will not apply to every farm. Sample costs for labor, materials, equipment and custom services are based on current figures. A blank column, “Your Cost”, is provided to enter your actual costs on Tables 1 and 2.
The hypothetical farm operation, production practices, overhead, and calculations are described under assumptions. For additional information or explanation of calculations in the study call the Department of Agricultural and Resource Economics, University of California, Davis, (530) 752-4651, UC Cooperative Extension Santa Cruz County: Mark Bolda (831) 763-8025 or Laura Tourte (831) 763-8005, or the UC Cooperative Extension office in your county. Sample Cost of Production studies for many commodities are available and can be downloaded from the website http://coststudies.ucdavis.edu. Archived studies are also available on the website.
The University of California is an affirmative action/equal opportunity employer.

3
Strawberry Cost and Return Study – Central Coast – University of California
ASSUMPTIONS The following assumptions refer to Tables 1 to 6 and pertain to sample costs to produce strawberries in the Central Coast Region - Santa Cruz and Monterey counties. The cultural practices described and materials used are considered typical for a well-managed strawberry operation in the region. The costs, materials and practices will not apply to all situations every production year. Cultural practices and costs for the production of strawberries vary by grower and region, and can be significant. The study is intended as a guide only. The use of trade names and cultural practices in this report does not constitute an endorsement or recommendation by the University of California nor is any criticism implied by omission of other similar products or cultural practices.
Farm. This study assumes a farm operation size of 50 contiguous acres of rented land. Strawberries are planted on 45 acres; roads, the irrigation system, and on-farm buildings account for the remaining five acres. The grower rents the land, which is assumed to be fairly flat. Strawberries may also be planted on rolling hills or sloped land in the area. This may necessitate erosion prevention and control measures, as well as practices and equipment that differ from those used in this study; differing practices or equipment are not included here. Stawberries are often grown on land that was planted previously to vegetable crops in a strawberry – vegetable rotation.
Production Cultural Practices and Material Inputs
Land Preparation, Pre-Plant Fertilization, and Pre-Plant Irrigation. Prior to land preparation, and to help determine fertilization practices, two soil samples per 45 acres are taken for analysis. Strawberry ground is then disced a total of six times, subsoiled twice, chiseled twice and then sprinkler irrigated using 0.5 acre-inches of water to slightly moisten the soil for fumigation (please see Fumigation and Alternatives section). After fumigation, the soil is further moistened with an additional 0.5 acre-inches of water, and then beds are listed and shaped. A slow release 18-8-13 fertilizer at 500 pounds per acre or a different complete fertilizer is drilled pre-plant into the beds at the same time as shaping. Drip irrigation tape (two lines per bed) is installed, and beds are covered with a plastic mulch using a mulch laying implement.
Plant Establishment. Prior to planting, a slotting implement is used to open the plastic mulch at appropriate intervals for transplants. Several strawberry varieties such as Albion, Monterey, Cabrillo and a number of proprietary varieties are suitable for production in the region, but no specific variety is assumed in this study. For this study strawberries are planted on 48-inch beds, two rows per bed at 12-inch plant spacing for a total of 21,780 plants per acre. Typically, five percent of the field, or 1,089 plants per acre is replanted in the weeks and months that follow because of poor planting and field conditions; it is included in the establishment costs. Planting takes approximately 50 hours per acre. Some growers use different bed widths and plant spacings; management practices may then also differ to accommodate production and harvest needs. Post-Plant Fertilization. From March to September CAN 17 or another complete fertilizer such as 15-15-15, ammonium sulfate or 6-30-30 is applied through the drip system. Grower fertilizer programs and timing vary widely, but most will use a complete or NPK fertilizer and nitrogen (N) fertilizers, depending upon seasonal nutrient requirements.

4
Strawberry Cost and Return Study – Central Coast – University of California
Post-Plant Irrigation. Immediately after planting strawberries are sprinkler irrigated each day for one week, and as needed on alternate days for another week using a total of 2.5 acre-inches of water. From March to September (seven months), strawberries are drip irrigated two to three times per week through the drip lines using a total of 24 acre-inches. A total of 27.5 acre-inches of water are used for the season. Effective rainfall is not taken into account. Water cost is estimated at $270 per acre-foot or $22.50 per acre-inch. The amount and cost of water can differ substantially from farm to farm in the area depending on climatic conditions, soil type, well depth, and irrigation district. Pest Management. The pesticides and rates mentioned in this cost study are listed in the UC IPM Pest Management Guidelines, Strawberries. For more information on pesticides, pest identification, monitoring, and management visit the UC IPM website at www.ipm.ucdavis.edu, or contact your local UCCE farm advisor. Pesticide use permits and regulatory information are available through your local agricultural commissioner’s office. Pesticides mentioned in this study are used to calculate rates and costs; applications, timing and materials vary according to pest pressure. Adjuvants are recommended for many pesticides for effective control and are not included here. The pesticide program shown in Table A represents a typical program for the region but can vary considerably; effectiveness of practices depends upon field and environmental conditions.
Pest Control Adviser (PCA). To assist with pest management and decisions, the grower contracts with a PCA at an estimated cost of $125 per acre. Pest control advisers write pest management recommendations and monitor the fields for production, nutrition, and pest problems.
Fumigation and Alternatives. In this study, arthropods, soilborne fungi/diseases, nematodes, and weeds are assumed to be controlled with a pre-plant soil fumigation. A custom operator applies chloropicrin using a flat fumigation. The custom operator provides the chloropicrin, tarp (totally impermeable film – TIF), glue, and workers to complete the practice, which includes one tractor driver. Approximately 1.5 to 2 acres can be fumigated per hour; total cost per acre is estimated at $3,600. The grower incurs an additional cost of $25 per acre to obtain a fumigation permit. Cost includes field measuring, field maps and fumigation layout, obtaining permission from nearby residents, and meeting with representatives from the county agricultural commissioner’s office. Some growers use bed-type fumigation practices, however, this may result in increased incidence of disease and lower yields.
A key soil fumigant, methyl bromide, will no longer be used to manage pests beyond 2016. This has prompted growers to research alternative methods of soil fumigation by either using individual materials such a chloropicrin, or integrating them into a larger system of soil pest managment. Several novel fumigants are currently being tested; a number of non-fumigant materials are also being used on small acreage plantings. One example of an alternative management approach is anaerobic soil disinfestation (ASD). ASD begins by adding a carbon source such as rice bran or mustard seed meal to the soil, followed by flooding the soil with water to create an anaerobic environment that is less hospitable to soil pathogens. This approach has been deployed over several hundreds of acres in California; results have been positive with several fields showing very good control of the soil pathogen Verticillium. However, the lack of weed control with ASD is an issue. Another method showing great promise in the control of soil pathogens and weeds is the use of steam for soil disinfestation.
5
Strawberry Cost and Return Study – Central Coast – University of California
Weed and Runner Removal. Fumigation provides some control of weeds in strawberry production. However, additional weed management is required during the season, and, in addition, removal of strawberry plant runners. Hand weeding and runner removal is estimated at 10.2 hours per acre per month for 10 months during the production season. Growers with different planting configurations and/or especially weedy fields may require a higher level of management and therefore higher costs.
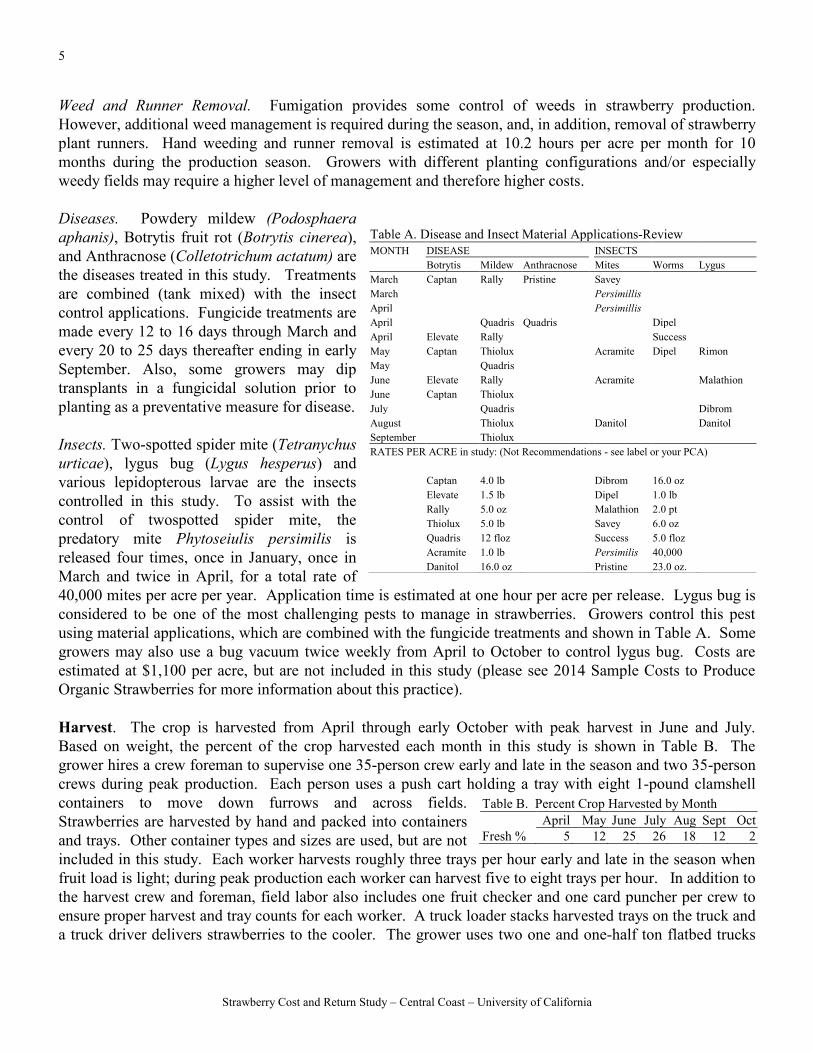
Diseases. Powdery mildew (Podosphaera aphanis), Botrytis fruit rot (Botrytis cinerea), and Anthracnose (Colletotrichum actatum) are the diseases treated in this study. Treatments are combined (tank mixed) with the insect control applications. Fungicide treatments are made every 12 to 16 days through March and every 20 to 25 days thereafter ending in early September. Also, some growers may dip transplants in a fungicidal solution prior to planting as a preventative measure for disease.
Insects. Two-spotted spider mite (Tetranychus urticae), lygus bug (Lygus hesperus) and various lepidopterous larvae are the insects controlled in this study. To assist with the control of twospotted spider mite, the predatory mite Phytoseiulis persimilis is released four times, once in January, once in March and twice in April, for a total rate of 40,000 mites per acre per year. Application time is estimated at one hour per acre per release. Lygus bug is considered to be one of the most challenging pests to manage in strawberries. Growers control this pest using material applications, which are combined with the fungicide treatments and shown in Table A. Some growers may also use a bug vacuum twice weekly from April to October to control lygus bug. Costs are estimated at $1,100 per acre, but are not included in this study (please see 2014 Sample Costs to Produce Organic Strawberries for more information about this practice).
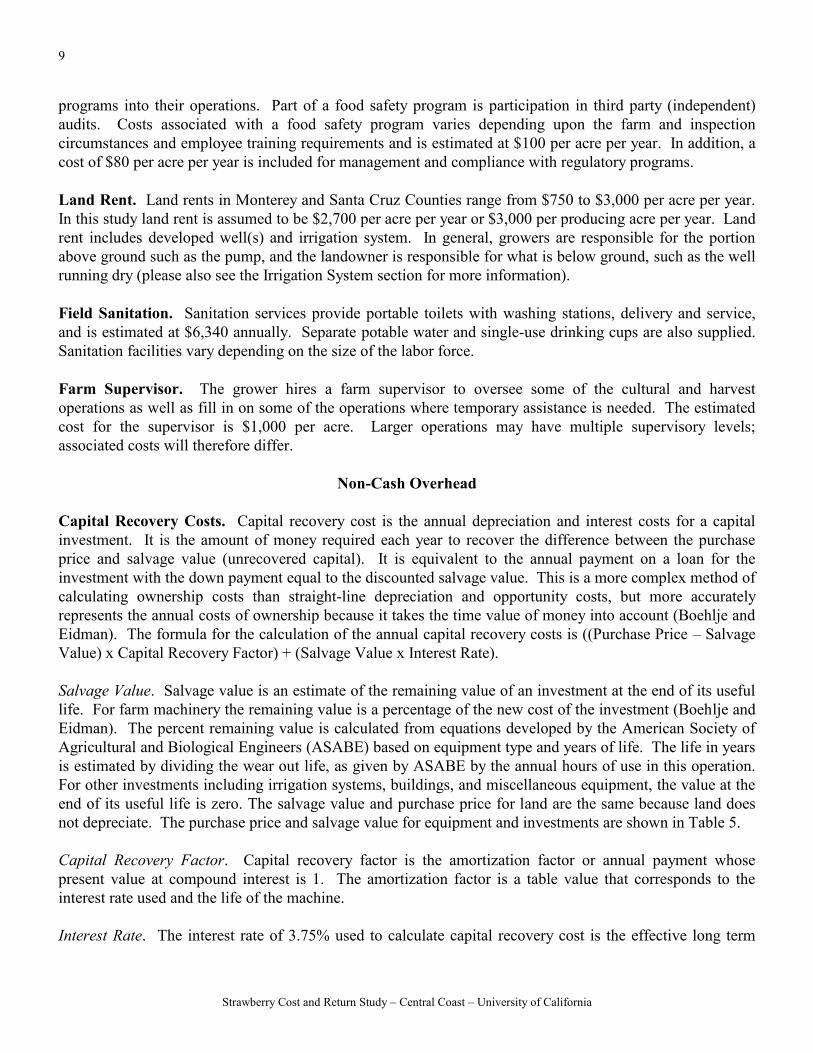
Harvest. The crop is harvested from April through early October with peak harvest in June and July. Based on weight, the percent of the crop harvested each month in this study is shown in Table B. The grower hires a crew foreman to supervise one 35-person crew early and late in the season and two 35-person crews during peak production. Each person uses a push cart holding a tray with eight 1-pound clamshell containers to move down furrows and across fields. Strawberries are harvested by hand and packed into containers and trays. Other container types and sizes are used, but are not included in this study. Each worker harvests roughly three trays per hour early and late in the season when fruit load is light; during peak production each worker can harvest five to eight trays per hour. In addition to the harvest crew and foreman, field labor also includes one fruit checker and one card puncher per crew to ensure proper harvest and tray counts for each worker. A truck loader stacks harvested trays on the truck and a truck driver delivers strawberries to the cooler. The grower uses two one and one-half ton flatbed trucks
Table A. Disease and Insect Material Applications-Review MONTH DISEASE INSECTS Botrytis Mildew Anthracnose Mites Worms Lygus March Captan Rally Pristine Savey March Persimillis April Persimillis April Quadris Quadris Dipel April Elevate Rally Success May Captan Thiolux Acramite Dipel Rimon May Quadris June Elevate Rally Acramite Malathion June Captan Thiolux July Quadris Dibrom August Thiolux Danitol Danitol September Thiolux RATES PER ACRE in study: (Not Recommendations - see label or your PCA) Captan 4.0 lb Dibrom 16.0 oz Elevate 1.5 lb Dipel 1.0 lb Rally 5.0 oz Malathion 2.0 pt Thiolux 5.0 lb Savey 6.0 oz Quadris 12 floz Success 5.0 floz Acramite 1.0 lb Persimilis 40,000 Danitol 16.0 oz Pristine 23.0 oz.
Table B. Percent Crop Harvested by Month April May June July Aug Sept Oct
Fresh % 5 12 25 26 18 12 2

6
Strawberry Cost and Return Study – Central Coast – University of California
holding two to three pallets at 110 trays per pallet or 330 trays per load for delivery to the cooler. Trays per pallet will vary by container type. The truck driver takes about an hour per load to deliver the filled trays. The grower will have at least one tractor, one trailer, and one toilet in the field. (Please see Labor section for additional information related to harvest costs).
Transportation and Cooling. Cost to transport strawberries from the field to the cooler is shown under harvest costs on Tables 1 and 3. Cooling costs vary by cooler and grower volume and are estimated at $0.50 per tray in this study.
Assessments. Growers and shippers pay the California Strawberry Commission (CSC) an assessment per tray (eight 1-pound containers) for research and marketing activities. The current assessment is $0.045 per tray, which is split equally between grower and shipper. Grower cost is therefore estimated at $0.0225 per tray.
Yields. Strawberry yield is measured in trays per acre. Average yield for fresh market fruit ranges from 4,000 to 10,000 trays per acre and can be even higher for some varieties. This study assumes a yield of 7,000 trays containing eight 1-pound clamshells per acre. The weight ranges from 9.5 to 10.0 pounds per tray to account for some variance in fruit weight per tray and including the weight of the clamshells and trays.
Returns. Based on 2012 to 2016 USDA Watsonville-Salinas Shipping Point returns (FOB), the representative return is $10.00 per tray. Strawberry prices range from $7.00 to $14.00 in the area. Estimated net returns to growers are shown in Table 4. Higher prices are seen early and late in the season when the volume of harvested product is low; lower prices are seen when peak season volumes are high.
Sales/Marketing. Selling costs for fresh market fruit are estimated at eight percent of the selling price or $0.80 per tray ($10.00 x 8%), which is shown on Tables 1 to 3.
Post-Harvest Cleanup. After all harvest operations have been completed, strawberry plants are mowed, the plastic mulch and drip tape are removed and disposed of at a landfill or recycling center. In this study a custom operator performs this service; it may also be handled by growers using their own equipment and labor. Growers may also have a crew walk the field to make sure all mulch has been removed from the field. The field is disked twice in preparation for the next crop. The discing operation is incorporated into the land preparation costs.
Growing Cost. Some growers along the Central Coast of California prefer to focus on growing costs and therefore separate total harvest costs from total cash costs, equipment depreciation and replacement costs. For this study, growing costs are noted at the bottom of Table 1, and are calculated by subtracting total harvest costs from total costs. Growing costs depend upon many variables including location and grower.
Labor, Equipment, and Interest
Labor. Labor rates are estimated at $21.70 per hour for machine operators and $16.10 for field labor, which includes overhead of 40 percent. The basic hourly wages are $15.50 for machine operators and $11.50 for field labor. Harvest crews are often paid a base wage plus piecework rate, or straight piecework depending on the time of harvest. In this study, harvest wages are calculated using the field labor rate. The overhead

7
Strawberry Cost and Return Study – Central Coast – University of California
includes the employers’ share of federal and California state payroll taxes, workers' compensation insurance for strawberry crops (code 0079), and a percentage for other possible benefits. Workers’ compensation costs will vary among growers, but for this study the cost is based upon the average industry final rate as of January 1, 2016. Labor for operations involving machinery are 20 percent higher than the operation time given in Table 1 to account for the extra labor involved in equipment set up, moving, maintenance, work breaks, and field repair.
In 2016 new minimum wage and overtime laws were passed in California. It is not yet clear what the overall impact of the laws will be on prevailing agricultural wages, therefore agricultural labor costs are currently in flux and may differ substantially from those shown in this study. With respect to minimum wage, growers may already pay wages that are higher than the state’s legal requirement. Tables C and D show the phase-in schedules for the minimum wage and overtime laws. Table C. Minimum Wage Phase-In Schedule, 2016 to 2022† Table D. Overtime Phase-In Schedule, 2016 to 2022†
† For employers with 26 or more employees. † For employers with 26 or more employees. ‡ Assuming a 60-hour work week and no other adjustments. The new overtime law will gradually decrease the number of hours employees can work on a daily and weekly basis before overtime wages are required. Prior to its passage field workers and equipment operators could work up to 10 hours per day or 60 hours per week without overtime wages; by 2022 the requirement will be lowered to 8 hours per day or 40 hours per week for employers with 26 or more employees. The new overtime law may change wages and scheduling of work in complicated ways as it is phased in. Growers may also choose to use a farm labor contractor or the H-2A guestworker visa program to employ workers. When using either one of these two approaches, base rates, overhead and compliance with housing, meals, transportation, and other requirements will vary. Use of these services may result in labor costs that are higher than those shown in this study but may be necessary in order to assure a reliable supply of labor.
Interest on Operating Capital. Interest on operating capital is based on cash operating costs and is calculated monthly until harvest at a nominal rate of 4.25 percent per year. A nominal interest rate is the typical market cost of borrowed funds. The interest cost of post-harvest operations is discounted back to the last harvest month using a negative interest charge. The rate will vary depending upon various factors, but the rate used in this study is considered a typical lending rate by a farm lending agency as of January 2016.
Year
California Minimum Wage
Minimum Wage Increase (%)
2016 10.00 na 2017 10.50 5.0 2018 11.00 4.8 2019 12.00 9.0 2020 13.00 8.3 2021 14.00 7.7 2022 15.00 7.1
Year
California Overtime Phase-In Hours Per Week
Overtime Hours/Week‡
2016 60 na 2017 60 na 2018 60 na 2019 55 5 2020 50 10 2021 45 15 2022 40 20

8
Strawberry Cost and Return Study – Central Coast – University of California
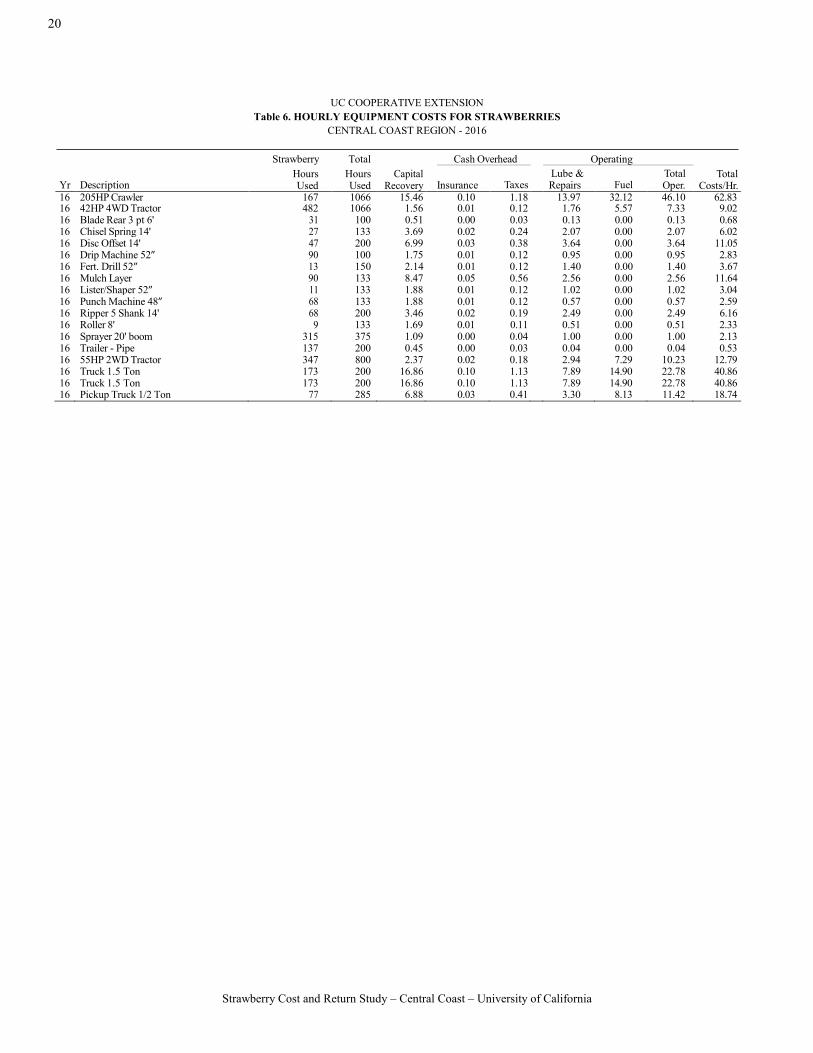
Equipment Operating Costs. Repair costs are based on purchase price, annual hours of use, total hours of life, and repair coefficients formulated by American Society of Agricultural and Biological Engineers (ASABE). Fuel and lubrication costs are also determined by ASABE equations based on maximum power takeoff (PTO) horsepower, and fuel type. Prices for on-farm delivery of red dye diesel and gasoline are $2.70 (excludes excise taxes) and $3.25 per gallon, respectively. The cost includes a 2 percent local sales tax on diesel fuel, and 8 percent sales tax on gasoline. Gasoline costs also include federal and state taxes, which are refundable for on-farm use when filing income taxes. The fuel, lube, and repair cost per acre for each operation in Table 1 is determined by multiplying the total hourly operating cost in Table 6 for each piece of equipment used for the selected operation by the hours per acre. Tractor time is 10 percent higher than implement time for a given operation to account for setup, travel and down time. Risk. The risks associated with producing and marketing fresh market strawberries are considered high. While this study makes every effort to model a production system based on typical, real world practices, it cannot fully represent financial, production, market, legal and human resource risks that ultimately affect the profitability and economic viability of fresh market strawberries. In this area invasive pests pose particular regulatory and management challenges and increase production and marketing risks for growers. In addition, labor availability, scheduling and cost is a noteworthy human resource risk. In recent years labor constraints have meant challenges in securing and retaining a sufficient number of workers to ensure timely and effective farm operations. Some growers report paying higher wages to attract and retain workers; others may pay overtime because of labor constraints. Overall profitability of the crop is negatively impacted in either case.
Cash Overhead
Cash overhead consists of various cash expenses paid out during the year that are assigned to the whole farm and not to a particular operation. Because overhead costs are farm and ranch specific, costs will vary among growers.
Property Taxes. Counties charge a base property tax rate of 1 percent on the assessed value of the property. In some counties special assessment districts exist and charge additional taxes on property including equipment, buildings, and improvements. For this study, county taxes are calculated as 1 percent of the average value of the property. Average value equals new cost plus salvage value divided by two on a per acre basis.
Insurance. Insurance for farm investments varies depending upon the assets included and the amount of coverage. Property insurance provides coverage for property loss and is charged at 0.843 percent of the average value of the assets over their useful life. Liability insurance covers accidents on the farm and other potential farm related liabilities and costs $1,914.
Office Expenses. Annual office and business expenses are estimated at $750 per acre. Costs include, but are not limited to, a variety of administration and office expenses such as office supplies, telephones, bookkeeping, accounting, road maintenance, utilities, and miscellaneous expenses.
Food Safety and Regulatory Programs. To ensure the safety of fresh products, accommodate buyer requests, and comply with regulatory programs (i.e. for water and air quality), growers incorporate various
9
Strawberry Cost and Return Study – Central Coast – University of California
programs into their operations. Part of a food safety program is participation in third party (independent) audits. Costs associated with a food safety program varies depending upon the farm and inspection circumstances and employee training requirements and is estimated at $100 per acre per year. In addition, a cost of $80 per acre per year is included for management and compliance with regulatory programs.
Land Rent. Land rents in Monterey and Santa Cruz Counties range from $750 to $3,000 per acre per year. In this study land rent is assumed to be $2,700 per acre per year or $3,000 per producing acre per year. Land rent includes developed well(s) and irrigation system. In general, growers are responsible for the portion above ground such as the pump, and the landowner is responsible for what is below ground, such as the well running dry (please also see the Irrigation System section for more information).
Field Sanitation. Sanitation services provide portable toilets with washing stations, delivery and service, and is estimated at $6,340 annually. Separate potable water and single-use drinking cups are also supplied. Sanitation facilities vary depending on the size of the labor force.
Farm Supervisor. The grower hires a farm supervisor to oversee some of the cultural and harvest operations as well as fill in on some of the operations where temporary assistance is needed. The estimated cost for the supervisor is $1,000 per acre. Larger operations may have multiple supervisory levels; associated costs will therefore differ.
Non-Cash Overhead
Capital Recovery Costs. Capital recovery cost is the annual depreciation and interest costs for a capital investment. It is the amount of money required each year to recover the difference between the purchase price and salvage value (unrecovered capital). It is equivalent to the annual payment on a loan for the investment with the down payment equal to the discounted salvage value. This is a more complex method of calculating ownership costs than straight-line depreciation and opportunity costs, but more accurately represents the annual costs of ownership because it takes the time value of money into account (Boehlje and Eidman). The formula for the calculation of the annual capital recovery costs is ((Purchase Price – Salvage Value) x Capital Recovery Factor) + (Salvage Value x Interest Rate).
Salvage Value. Salvage value is an estimate of the remaining value of an investment at the end of its useful life. For farm machinery the remaining value is a percentage of the new cost of the investment (Boehlje and Eidman). The percent remaining value is calculated from equations developed by the American Society of Agricultural and Biological Engineers (ASABE) based on equipment type and years of life. The life in years is estimated by dividing the wear out life, as given by ASABE by the annual hours of use in this operation. For other investments including irrigation systems, buildings, and miscellaneous equipment, the value at the end of its useful life is zero. The salvage value and purchase price for land are the same because land does not depreciate. The purchase price and salvage value for equipment and investments are shown in Table 5.
Capital Recovery Factor. Capital recovery factor is the amortization factor or annual payment whose present value at compound interest is 1. The amortization factor is a table value that corresponds to the interest rate used and the life of the machine.
Interest Rate. The interest rate of 3.75% used to calculate capital recovery cost is the effective long term
10
Strawberry Cost and Return Study – Central Coast – University of California
interest rate effective January 1, 2016. The interest rate is provided by a local farm lending agency and will vary according to risk and amount of loan. Building and Tools. Estimated costs for both a metal building and shop and hand tools are included in the study. Fuel Tanks. Two fuel tanks, one for diesel and one for gasoline, are located on the property. The tanks are set up in a cement containment pad that meets federal, state, and county regulations.
Irrigation System. The irrigation system is maintained by the landowner and assumed to be included in the land rental cost; in some cases the grower may be responsible for maintenance. The grower invests in and owns sprinkler pipe and drip system materials sufficient for irrigation needs. The grower also owns a trailer and other equipment needed for moving pipe and other irrigation supplies to and from the field. Irrigation water is pumped from a well and delivered to the field through an underground pipe system. Main lines above ground are connected to the underground system to deliver water for the sprinkler and drip irrigations. In this study water is pumped from a depth of 120 feet in a 300-foot well and the grower pays the pumping costs.
Equipment. Farm equipment is purchased when it is both new or used. This study shows the current purchase price for new equipment, which is adjusted to 60 percent to reflect a mix of new and used equipment. Annual ownership costs for equipment and other investments are shown in Table 5. Equipment costs are composed of three parts: non-cash overhead, cash overhead, and operating costs. Both of the overhead factors have been discussed in previous sections. The operating costs consist of repairs, fuel, and lubrication and are discussed under operating costs.
Table Values. Due to rounding, the totals may be slightly different from the sum of the components.
11
Strawberry Cost and Return Study – Central Coast – University of California
REFERENCES
Agricultural Commissioner. Annual Crop Reports. 2012 – 2015. Monterey County Agricultural Commissioner. Salinas, CA. http://www.co.monterey.ca.us/government/departments-a-h/agricultural-commissioner/forms-publications/crop-reports-economic-contributions#ag. Agricultural Commissioner. Annual Crop Reports. 2012 – 2015. Santa Cruz County Agricultural Commissioner. Watsonville, CA. http://www.agdept.com/AgriculturalCommissioner/ AnnualCropandLivestockReports.aspx American Society of Agricultural and Biological Engineers. (ASABE). July, 2013. American Society of Agricultural Engineers Standards Yearbook. Russell H. Hahn and Evelyn E. Rosentreter (ed.). St. Joseph, MO. 41st edition, ANSI/ASAE S279_17.PDF. [email protected] Boehlje, Michael D., and Vernon R. Eidman. 1984. Farm Management. John Wiley and Sons. New York, New York. Bolda, Mark P., Laura Tourte, Karen M. Klonsky, Richard L. De Moura. 2010. Sample Costs To Produce Strawberries, Central Coast – Santa Cruz & Monterey Counties. University of California Cooperative Extension, Department of Agriculture and Resource Economics, UC Davis, Davis, CA. California Chapter of the American Society of Farm Managers and Rural Appraisers. 2016 Trends in Agricultural Land & Lease Values. American Society of Farm Managers and Rural Appraisers, Woodbridge, CA. www.calasfmra.com California Department of Insurance. 2016. California Workers’ Compensation Rating Data for Selected Agricultural Classifications as of March 2015. California Department of Insurance, Rate Regulation Branch. California State Board of Equalization. Fuel Tax Division Tax Rates. Internet accessed June 2016. http://www.boe.ca.gov/sptaxprog/spftdrates.htm Energy Information Administration. Weekly Retail on Highway Diesel Prices. June 2016. http://www.eia.gov/dnav/pet/pet_pri_gnd_dcus_sca_w.htm University of California Statewide IPM Project. 2016. UC Pest Management Guidelines, Strawberries. University of California, Davis CA. http://ipm.ucanr.edu/PMG/selectnewpest.strawberry.html. United States Department of Agriculture, Fruit and Vegetable Market News. https://www.marketnews.usda.gov/mnp/fv-home. Accessed July 20, 2016.
12
Strawberry Cost and Return Study – Central Coast – University of California
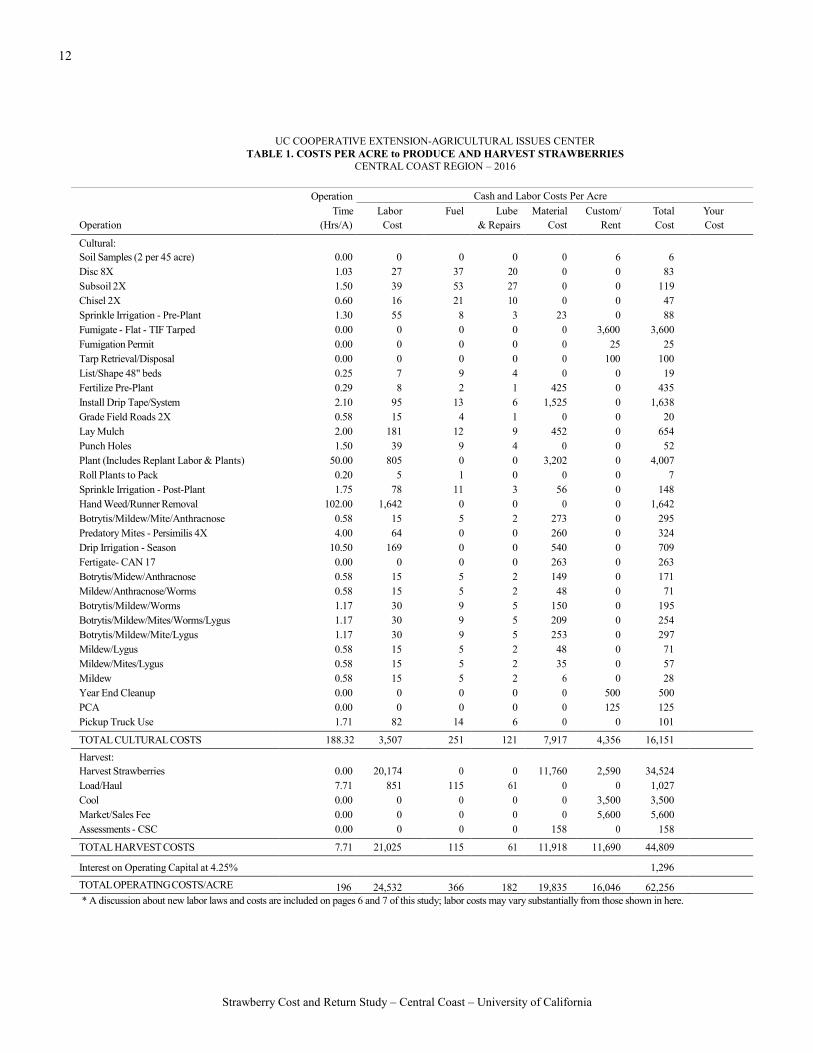
UC COOPERATIVE EXTENSION-AGRICULTURAL ISSUES CENTER TABLE 1. COSTS PER ACRE to PRODUCE AND HARVEST STRAWBERRIES
CENTRAL COAST REGION – 2016
Operation Cash and Labor Costs Per Acre d Labor Co sts per Acre
Time Labor Fuel Lube Material Custom/ Total Your
Operation (Hrs/A) Cost & Repairs Cost Rent Cost Cost
Cultural: Soil Samples (2 per 45 acre) 0.00 0 0 0 0 6 6 Disc 8X 1.03 27 37 20 0 0 83 Subsoil 2X 1.50 39 53 27 0 0 119 Chisel 2X 0.60 16 21 10 0 0 47 Sprinkle Irrigation - Pre-Plant 1.30 55 8 3 23 0 88 Fumigate - Flat - TIF Tarped 0.00 0 0 0 0 3,600 3,600 Fumigation Permit 0.00 0 0 0 0 25 25 Tarp Retrieval/Disposal 0.00 0 0 0 0 100 100 List/Shape 48" beds 0.25 7 9 4 0 0 19 Fertilize Pre-Plant 0.29 8 2 1 425 0 435 Install Drip Tape/System 2.10 95 13 6 1,525 0 1,638 Grade Field Roads 2X 0.58 15 4 1 0 0 20 Lay Mulch 2.00 181 12 9 452 0 654 Punch Holes 1.50 39 9 4 0 0 52 Plant (Includes Replant Labor & Plants) 50.00 805 0 0 3,202 0 4,007 Roll Plants to Pack 0.20 5 1 0 0 0 7 Sprinkle Irrigation - Post-Plant 1.75 78 11 3 56 0 148 Hand Weed/Runner Removal 102.00 1,642 0 0 0 0 1,642 Botrytis/Mildew/Mite/Anthracnose 0.58 15 5 2 273 0 295 Predatory Mites - Persimilis 4X 4.00 64 0 0 260 0 324 Drip Irrigation - Season 10.50 169 0 0 540 0 709 Fertigate- CAN 17 0.00 0 0 0 263 0 263 Botrytis/Midew/Anthracnose 0.58 15 5 2 149 0 171 Mildew/Anthracnose/Worms 0.58 15 5 2 48 0 71 Botrytis/Mildew/Worms 1.17 30 9 5 150 0 195 Botrytis/Mildew/Mites/Worms/Lygus 1.17 30 9 5 209 0 254 Botrytis/Mildew/Mite/Lygus 1.17 30 9 5 253 0 297 Mildew/Lygus 0.58 15 5 2 48 0 71 Mildew/Mites/Lygus 0.58 15 5 2 35 0 57 Mildew 0.58 15 5 2 6 0 28 Year End Cleanup 0.00 0 0 0 0 500 500 PCA 0.00 0 0 0 0 125 125 Pickup Truck Use 1.71 82 14 6 0 0 101 TOTAL CULTURAL COSTS 188.32 3,507 251 121 7,917 4,356 16,151 Harvest: Harvest Strawberries 0.00 20,174 0 0 11,760 2,590 34,524 Load/Haul 7.71 851 115 61 0 0 1,027 Cool 0.00 0 0 0 0 3,500 3,500 Market/Sales Fee 0.00 0 0 0 0 5,600 5,600 Assessments - CSC 0.00 0 0 0 158 0 158 TOTAL HARVEST COSTS 7.71 21,025 115 61 11,918 11,690 44,809 Interest on Operating Capital at 4.25% 1,296 TOTAL OPERATING COSTS/ACRE 196 24,532 366 182 19,835 16,046 62,256
* A discussion about new labor laws and costs are included on pages 6 and 7 of this study; labor costs may vary substantially from those shown in here.

13
Strawberry Cost and Return Study – Central Coast – University of California
UC COOPERATIVE EXTENSION-AGRICULTURAL ISSUES CENTER TABLE 1. CONTINUED
CENTRAL COAST REGION - 2016
Operation Cash and Labor Costs per Acre Time Labor Fuel Lube Material Custom/ Total Your
Operation (Hrs/A) Cost & Repairs Cost Rent Cost Cost
CASH OVERHEAD: Food Safety 100 Land Rent 2,700 Liability Insurance 38 Office Expense 750 Ranch Supervisor 1,000 Field Sanitation 127 Regulatory Programs 80 Property Taxes 38 Property Insurance 3 Investment Repairs 65
TOTAL CASH OVERHEAD COSTS/ACRE 4,901
TOTAL CASH COSTS/ACRE 67,157
NON-CASH OVERHEAD: Per Producing Acre
Annual Cost Capital Recovery
Buildings 983 55 55 Fuel Tanks 220 15 15 Shop/Hand Tools 345 29 29 Harvest Carts 23 5 5 Irrigation System 222 50 50 Sprinkler Pipe 1,465 80 80 Equipment 3,123 283 283
TOTAL NON-CASH OVERHEAD COSTS 6,381 517 517 TOTAL COSTS/ACRE 67,674
TOTAL COST PER ACRE – HARVEST COST PER ACRE = GROWING COST PER ACRE
$67,674 - $44,809 = $22,865

14
Strawberry Cost and Return Study – Central Coast – University of California
UC COOPERATIVE EXTENSION-AGRICULTURAL ISSUES CENTER TABLE 2. COSTS and RETURNS PER ACRE to PRODUCE AND HARVEST STRAWBERRIES
CENTRAL COAST REGION - 2016
Quantity/ Price or Value or Your Acre Unit Cost/Unit Cost/Acre Cost
GROSS RETURNS Strawberry 7,000 tray 10.00 70,000 TOTAL GROSS RETURNS 7,000 tray 70,000 OPERATING COSTS Insecticide: 475
Savey 50 DF 6.00 oz 20.69 124 Dipel DF 2.00 lb 15.65 31 Success 5.00 floz 7.97 40 Acramite 50WS 2.00 lb 93.14 186 Rimon 0.83 EC 11.00 floz 3.07 34 Malathion 8 2.00 pint 7.76 16 Dibrom 8 Emulsive 16.00 floz 0.98 16 Danitol 2.4 EC 16.00 floz 1.80 29
Fungicide: 696 Captan 50W 16.00 lb 6.92 111 Rally 40W 20.00 oz 5.50 110 Pristine 46.00 oz 4.08 188 Quadris 36.00 floz 2.72 98 Elevate 50WDG 3.00 lb 55.31 166 Thiolux 20.00 lb 1.20 24
Miticide: 260 Persimilis (Mite) 40.00 thou 6.50 260
Fertilizer: 688 Scotts 18-8-13 500.00 lb 0.85 425 CAN 17 17-0-0 (N) 350.00 lb N 0.75 263
Custom: 6,821 Soil Analysis 0.04 each 150.00 6 Fumigate - TIF Tarped 1.00 Acre 3600.00 3,600 Fumigation Permit 1.00 acre 25.00 25 Mulch Retrieval/Disposal 1.00 acre 100.00 100 Misc Picking Costs 7,000.00 tray 0.37 2,590 Year End Cleanup 1.00 acre 500.00 500
Materials: 13,737 T-Tape 21,780.00 foot 0.07 1,525 Mulch Pins 4,000.00 each 0.02 60 Mulch 48" 1.25mil 10,890.00 foot 0.04 392 Trays/Clamshells 7,000.00 each 1.68 11,760
Water: 619 Irrigation Water 27.50 acin 22.50 619
Plants: 3,202 Strawberry Plants 22,869.00 each 0.14 3,202
Contract: 9,225 Cooler 7,000.00 tray 0.50 3,500 Market/Sales Fee 7,000.00 tray 0.80 5,600 PCA 1.00 acre 125.00 125
Assessment: 158 Strawberry Commission 7,000.00 tray 0.02 158
Labor 24,533 Equipment Operator Labor 46.42 hrs 21.70 1007 Non-Machine Labor 14,61.23 hrs 16.10 23,526
Machinery 549 Fuel-Gas 39.61 gal 3.25 129 Fuel-Diesel 87.15 gal 2.70 235 Lube 55 Machinery Repair 130
Interest on Operating Capital @ 4.25% 1,296 TOTAL OPERATING COSTS/ACRE 62,256 TOTAL OPERATING COSTS/TRAY 9 NET RETURNS ABOVE OPERATING COSTS 7,744
15
Strawberry Cost and Return Study – Central Coast – University of California
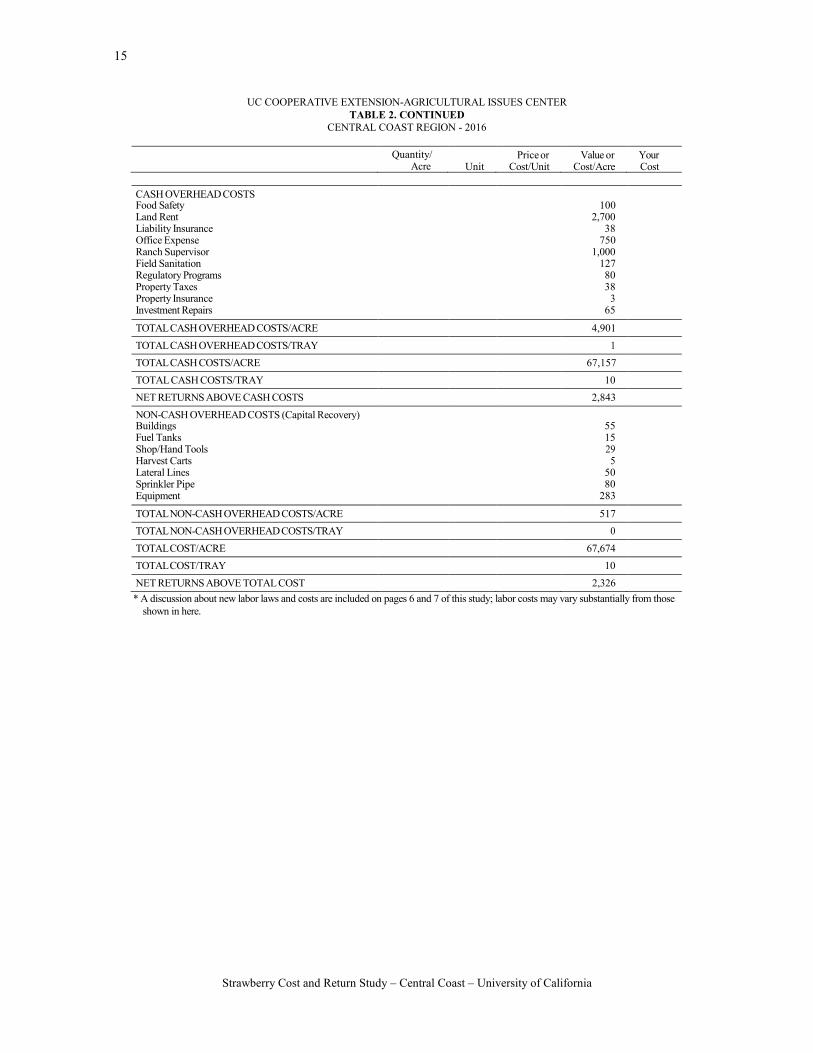
UC COOPERATIVE EXTENSION-AGRICULTURAL ISSUES CENTER TABLE 2. CONTINUED
CENTRAL COAST REGION - 2016
Quantity/ Acre
Unit
Price or Cost/Unit
Value or Cost/Acre
Your Cost
CASH OVERHEAD COSTS Food Safety 100 Land Rent 2,700 Liability Insurance 38 Office Expense 750 Ranch Supervisor 1,000 Field Sanitation 127 Regulatory Programs 80 Property Taxes 38 Property Insurance 3 Investment Repairs 65 TOTAL CASH OVERHEAD COSTS/ACRE 4,901 TOTAL CASH OVERHEAD COSTS/TRAY 1 TOTAL CASH COSTS/ACRE 67,157 TOTAL CASH COSTS/TRAY 10 NET RETURNS ABOVE CASH COSTS 2,843 NON-CASH OVERHEAD COSTS (Capital Recovery) Buildings 55 Fuel Tanks 15 Shop/Hand Tools 29 Harvest Carts 5 Lateral Lines 50 Sprinkler Pipe 80 Equipment 283 TOTAL NON-CASH OVERHEAD COSTS/ACRE 517 TOTAL NON-CASH OVERHEAD COSTS/TRAY 0 TOTAL COST/ACRE 67,674 TOTAL COST/TRAY 10 NET RETURNS ABOVE TOTAL COST 2,326
* A discussion about new labor laws and costs are included on pages 6 and 7 of this study; labor costs may vary substantially from those shown in here.

16
Strawberry Cost and Return Study – Central Coast – University of California
UC COOPERATIVE EXTENSION-AGRICULTURAL ISSUES CENTER TABLE 3. MONTHLY CASH COSTS PER ACRE to PRODUCE AND HARVEST STRAWBERRIES
CENTRAL COAST REGION – 2016
AUG 15
SEP 15
OCT 15
NOV 15
DEC 15
JAN 16
FEB 16
MAR 16
APR 16
MAY 16
JUN 16
JUL 16
AUG 16
SEP 16
OCT 16
Total
Cultural: Soil Samples (2 per 45 acre)
6
6
Disc 8X 83 83 Subsoil 2X 119 119 Chisel 2X 47 47 Sprinkle Irrigation - Pre-Plant 88 88 Fumigate - Flat - TIF Tarped 3,600 3,600 Fumigation Permit 25 25 Tarp Retrieval/Disposal 100 100 List/Shape 48" beds 19 19 Fertilize Pre-Plant 435 435 Install Drip Tape/System 1,638 1,638 Grade Field Roads 2X 10 10 20 Lay Mulch 654 654 Punch Holes 52 52 Plant (Includes Replant Labor & Plants) 4,007 4,007 Roll Plants to Pack 7 7 Sprinkle Irrigation - Post-Plant 148 148 Hand Weed/Runner Removal 164 164 164 164 164 164 164 164 164 164 1,642 Botrytis/Mildew/Mite/Anthracnos 295 295 Predatory Mites - Persimilis 4X 81 81 162 324 Drip Irrigation - Season 92 103 103 103 103 103 103 709 Fertigate- CAN 17 38 38 38 38 38 38 38 263 Botrytis/Midew/Anthracnose 171 171 Mildew/Anthracnose/Worms 71 71 Botrytis/Mildew/Worms 195 195 Botrytis/Mildew/Mites/Worms/Lygus 254 254 Botrytis/Mildew/Mite/Lygus 297 297 Mildew/Lygus 71 71 Mildew/Mites/Lygus 57 57 Mildew 28 28 Year End Cleanup 500 500 PCA 125 125 Pickup Truck Use 7 7 7 7 7 7 7 7 7 7 7 7 7 7 7 101
TOTAL CULTURAL COSTS 96 6,743 4,221 7 171 252 171 858 739 565 609 382 369 340 632 16,151
Harvest: Harvest Strawberries
2,709
4,577
7,833
7,600
6,152
4,577
1,076
34,524
Load/Haul 70 129 234 231 179 129 53 1,027 Cool 175 420 875 910 630 420 70 3,500 Market/Sales Fee 280 672 1,400 1,456 1,008 672 112 5,600 Assessments - CSC 158 158
TOTAL HARVEST COSTS 0 0 0 0 0 0 0 0 3,234 5,799 10,342 10,198 7,969 5,799 1,469 44,809
Interest on Operating Capital @4.25% 0 24 39 39 40 40 41 44 58 81 120 157 187 208 216 1,296
TOTAL OPERATING COSTS/ACRE 96 6,767 4,260 46 211 293 212 902 4,031 6,444 11,070 10,737 8,524 6,347 2,316 62,256

17
Strawberry Cost and Return Study – Central Coast – University of California
UC COOPERATIVE EXTENSION-AGRICULTURAL ISSUES CENTER TABLE 3. CONTINUED
CENTRAL COAST REGION – 2016
AUG 15
SEP 15
OCT 15
NOV 15
DEC 15
JAN 16
FEB 16
MAR 16
APR 16
MAY 16
JUN 16
JUL 16
AUG 16
SEP 16
OCT 16
Total
CASH OVERHEAD Food Safety 100 100 Land Rent 180 180 180 180 180 180 180 180 180 180 180 180 180 180 180 2,700 Liability Insurance 38 38 Office Expense 63 63 63 63 63 63 63 63 63 63 63 63 63 63 63 750 Ranch Supervisor 83 83 83 83 83 83 83 83 83 83 83 83 83 83 83 1,000 Field Sanitation 8 8 8 8 8 8 8 8 8 8 8 8 8 8 8 127 Regulatory Programs 80 80 Property Taxes 19 19 38 Property Insurance 2 2 3 Investment Repairs 4 4 4 4 4 4 4 4 4 4 4 4 4 4 4 65
TOTAL CASH OVERHEAD COSTS 339 339 339 339 339 339 359 339 339 339 339 359 557 339 339 4,901 TOTAL CASH COSTS/ACRE 435 7,106 4,598 385 549 631 571 1,241 4,370 6,783 11,409 11,096 9,081 6,685 2,655 67,157
Strawberry Cost and Return Study – Central Coast – University of California
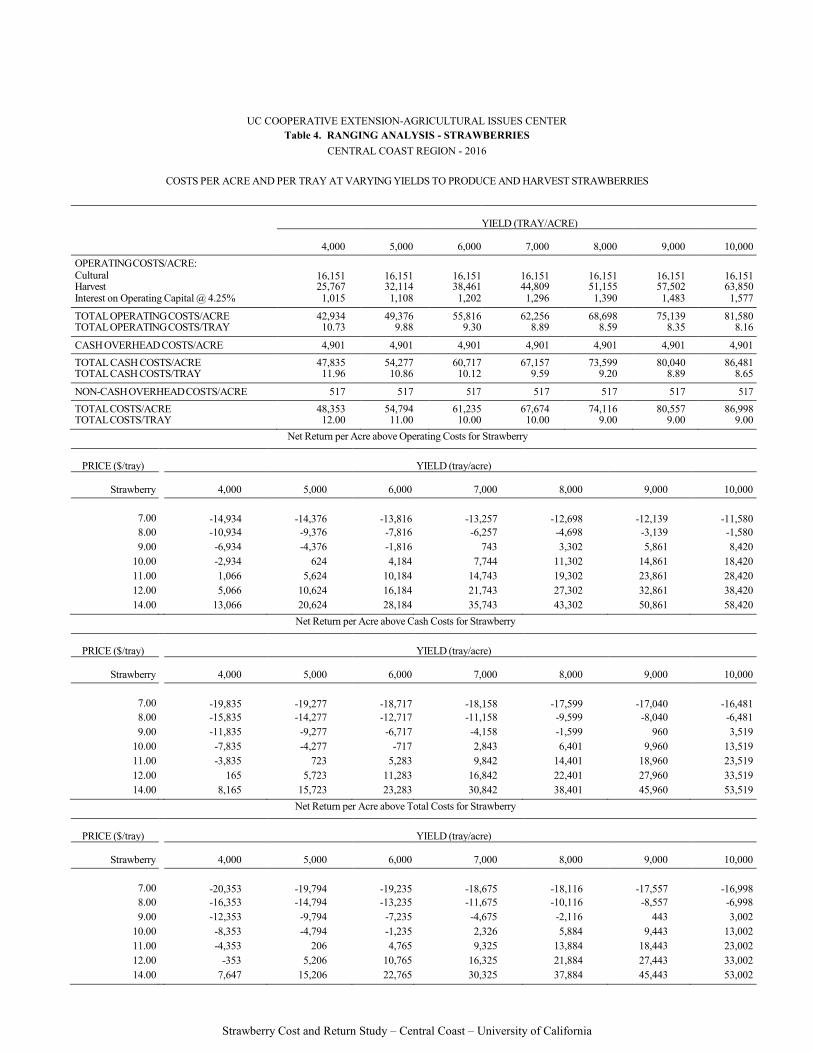
UC COOPERATIVE EXTENSION-AGRICULTURAL ISSUES CENTER Table 4. RANGING ANALYSIS - STRAWBERRIES
CENTRAL COAST REGION - 2016
COSTS PER ACRE AND PER TRAY AT VARYING YIELDS TO PRODUCE AND HARVEST STRAWBERRIES
YIELD (TRAY/ACRE)
4,000
5,000
6,000
7,000
8,000
9,000
10,000
OPERATING COSTS/ACRE: Cultural
16,151
16,151
16,151
16,151
16,151
16,151
16,151
Harvest 25,767 32,114 38,461 44,809 51,155 57,502 63,850 Interest on Operating Capital @ 4.25% 1,015 1,108 1,202 1,296 1,390 1,483 1,577
TOTAL OPERATING COSTS/ACRE 42,934 49,376 55,816 62,256 68,698 75,139 81,580 TOTAL OPERATING COSTS/TRAY 10.73 9.88 9.30 8.89 8.59 8.35 8.16
CASH OVERHEAD COSTS/ACRE 4,901 4,901 4,901 4,901 4,901 4,901 4,901 TOTAL CASH COSTS/ACRE 47,835 54,277 60,717 67,157 73,599 80,040 86,481 TOTAL CASH COSTS/TRAY 11.96 10.86 10.12 9.59 9.20 8.89 8.65
NON-CASH OVERHEAD COSTS/ACRE 517 517 517 517 517 517 517 TOTAL COSTS/ACRE 48,353 54,794 61,235 67,674 74,116 80,557 86,998 TOTAL COSTS/TRAY 12.00 11.00 10.00 10.00 9.00 9.00 9.00
Net Return per Acre above Operating Costs for Strawberry
PRICE ($/tray)
YIELD (tray/acre)
Strawberry
4,000
5,000
6,000
7,000
8,000
9,000
10,000
7.00
-14,934
-14,376
-13,816
-13,257
-12,698
-12,139
-11,580 8.00 -10,934 -9,376 -7,816 -6,257 -4,698 -3,139 -1,580 9.00 -6,934 -4,376 -1,816 743 3,302 5,861 8,420
10.00 -2,934 624 4,184 7,744 11,302 14,861 18,420 11.00 1,066 5,624 10,184 14,743 19,302 23,861 28,420 12.00 5,066 10,624 16,184 21,743 27,302 32,861 38,420 14.00 13,066 20,624 28,184 35,743 43,302 50,861 58,420
Net Return per Acre above Cash Costs for Strawberry
PRICE ($/tray)
YIELD (tray/acre)
Strawberry
4,000
5,000
6,000
7,000
8,000
9,000
10,000
7.00
-19,835
-19,277
-18,717
-18,158
-17,599
-17,040
-16,481 8.00 -15,835 -14,277 -12,717 -11,158 -9,599 -8,040 -6,481 9.00 -11,835 -9,277 -6,717 -4,158 -1,599 960 3,519
10.00 -7,835 -4,277 -717 2,843 6,401 9,960 13,519 11.00 -3,835 723 5,283 9,842 14,401 18,960 23,519 12.00 165 5,723 11,283 16,842 22,401 27,960 33,519 14.00 8,165 15,723 23,283 30,842 38,401 45,960 53,519
Net Return per Acre above Total Costs for Strawberry
PRICE ($/tray)
YIELD (tray/acre)
Strawberry
4,000
5,000
6,000
7,000
8,000
9,000
10,000
7.00
-20,353
-19,794
-19,235
-18,675
-18,116
-17,557
-16,998 8.00 -16,353 -14,794 -13,235 -11,675 -10,116 -8,557 -6,998 9.00 -12,353 -9,794 -7,235 -4,675 -2,116 443 3,002
10.00 -8,353 -4,794 -1,235 2,326 5,884 9,443 13,002 11.00 -4,353 206 4,765 9,325 13,884 18,443 23,002 12.00 -353 5,206 10,765 16,325 21,884 27,443 33,002 14.00 7,647 15,206 22,765 30,325 37,884 45,443 53,002

Strawberry Cost and Return Study – Central Coast – University of California
UC COOPERATIVE EXTENSION-AGRICULTURAL ISSUES CENTER
Table 5. WHOLE FARM ANNUAL EQUIPMENT, INVESTMENT, and BUSINESS OVERHEAD COSTS FOR STRAWBERRIES
CENTRAL COAST REGION - 2016
ANNUAL EQUIPMENT COSTS Cash Overhead
Years Salvage Capital Yr. Description Price Life Value Recovery Insurance Taxes Total 16 205HP Crawler 350,000 15 68,139 27,465 176 2,091 29,732 16 42HP 4WD Tractor 35,400 15 6,892 2,778 18 211 3,007 16 Rear Blade 3 pt 6' 1,012 15 97 84 0 6 91 16 Chisel Spring 14' 9,800 15 941 818 5 54 876 16 Disc Offset 14' 21,800 10 3,855 2,330 11 128 2,469 16 Drip Machine 52" 3,500 15 336 292 2 19 313 16 Fert. Drill 52"' 5,000 10 884 534 2 29 566 16 Mulch Layer 52" 22,500 15 2,160 1,879 10 123 2,012 16 Lister/Shaper 52" 5,000 15 480 417 2 27 447 16 Punch Machine 48" 5,000 15 480 417 2 27 447 16 Ripper 5 Shank 14' 10,800 10 1,910 1,154 5 64 1,223 16 Roller 8' 4,500 15 432 376 2 25 402 16 Sprayer 20' boom 3,630 4 1,336 678 2 25 705 16 Trailer-Pipe 2,150 20 120 151 1 11 163 16 55HP 2WD Tractor 40,225 15 7,831 3,157 20 240 3,417 16 Truck 1.5 Ton 58,000 10 17,132 5,619 32 376 6,026 16 Truck 1.5 Ton 58,000 10 17,132 5,619 32 376 6,026 16 Pickup Truck 1/2 Ton 28,000 7 10,621 3,267 16 193 3,476
TOTAL 664,317 - 140,779 57,035 339 4,025 61,399
60% of New Cost* 398,590 - 84,467 34,221 204 2,415 36,840 *Used to reflect a mix of new and used equipment
ANNUAL INVESTMENT COSTS
Cash Overhead
Yrs Salvage Capital Description Price Life Value Recovery Insurance Taxes Repairs Total INVESTMENT Buildings 49,162 30 0 2,757 21 246 983 4,007 Fuel Tanks 10,975 20 768 763 5 59 220 1,047 Shop/Hand Tools 17,232 15 1,345 1,455 8 93 345 1,900 Harvest Carts 1,042 5 0 232 0 5 21 259 Irrigation System 10,000 5 0 2,231 4 50 200 2,485 Sprinkler Pipe 65,934 20 32,967 3,609 42 495 1,319 5,464 TOTAL INVESTMENT 154,345 - 35,080 11,047 80 947 3,088 15,162
ANNUAL BUSINESS OVERHEAD COSTS
Units/ Price/ Total Description Farm Unit Unit Cost Food Safety 50 acre 100 5,000 Regulatory Programs 50 acre 80 4,000 Land Rent 50 acre 2,700 135,000 Liability Insurance 50 acre 38 1,914 Office Expense 50 acre 750 37,500 Ranch Supervisor 50 acre 1,000 50,000 Field Sanitation 50 acre 127 6,340
20
Strawberry Cost and Return Study – Central Coast – University of California
UC COOPERATIVE EXTENSION Table 6. HOURLY EQUIPMENT COSTS FOR STRAWBERRIES
CENTRAL COAST REGION - 2016
Strawberry Total Cash Overhead Operating
Yr
Description
Hours Used
Hours Used
Capital Recovery
Insurance
Taxes
Lube & Repairs
Fuel
Total Oper.
Total Costs/Hr.
16 205HP Crawler 167 1066 15.46 0.10 1.18 13.97 32.12 46.10 62.83 16 42HP 4WD Tractor 482 1066 1.56 0.01 0.12 1.76 5.57 7.33 9.02 16 Blade Rear 3 pt 6' 31 100 0.51 0.00 0.03 0.13 0.00 0.13 0.68 16 Chisel Spring 14' 27 133 3.69 0.02 0.24 2.07 0.00 2.07 6.02 16 Disc Offset 14' 47 200 6.99 0.03 0.38 3.64 0.00 3.64 11.05 16 Drip Machine 52” 90 100 1.75 0.01 0.12 0.95 0.00 0.95 2.83 16 Fert. Drill 52” 13 150 2.14 0.01 0.12 1.40 0.00 1.40 3.67 16 Mulch Layer 90 133 8.47 0.05 0.56 2.56 0.00 2.56 11.64 16 Lister/Shaper 52” 11 133 1.88 0.01 0.12 1.02 0.00 1.02 3.04 16 Punch Machine 48” 68 133 1.88 0.01 0.12 0.57 0.00 0.57 2.59 16 Ripper 5 Shank 14' 68 200 3.46 0.02 0.19 2.49 0.00 2.49 6.16 16 Roller 8' 9 133 1.69 0.01 0.11 0.51 0.00 0.51 2.33 16 Sprayer 20' boom 315 375 1.09 0.00 0.04 1.00 0.00 1.00 2.13 16 Trailer - Pipe 137 200 0.45 0.00 0.03 0.04 0.00 0.04 0.53 16 55HP 2WD Tractor 347 800 2.37 0.02 0.18 2.94 7.29 10.23 12.79 16 Truck 1.5 Ton 173 200 16.86 0.10 1.13 7.89 14.90 22.78 40.86 16 Truck 1.5 Ton 173 200 16.86 0.10 1.13 7.89 14.90 22.78 40.86 16 Pickup Truck 1/2 Ton 77 285 6.88 0.03 0.41 3.30 8.13 11.42 18.74