Embed Size (px)
DESCRIPTION
Senator Ted Cruz sees his national poll numbers in freefall, while candidate Donald Trump increases his topline support.
Citation preview
© 2016 Ipsos. All rights reserved. Contains Ipsos' Confidential and Proprietary information and may not be disclosed or reproduced without the prior written consent of Ipsos.
04.13.2016
Ipsos Poll Conducted for Reuters
Core Political Data
2
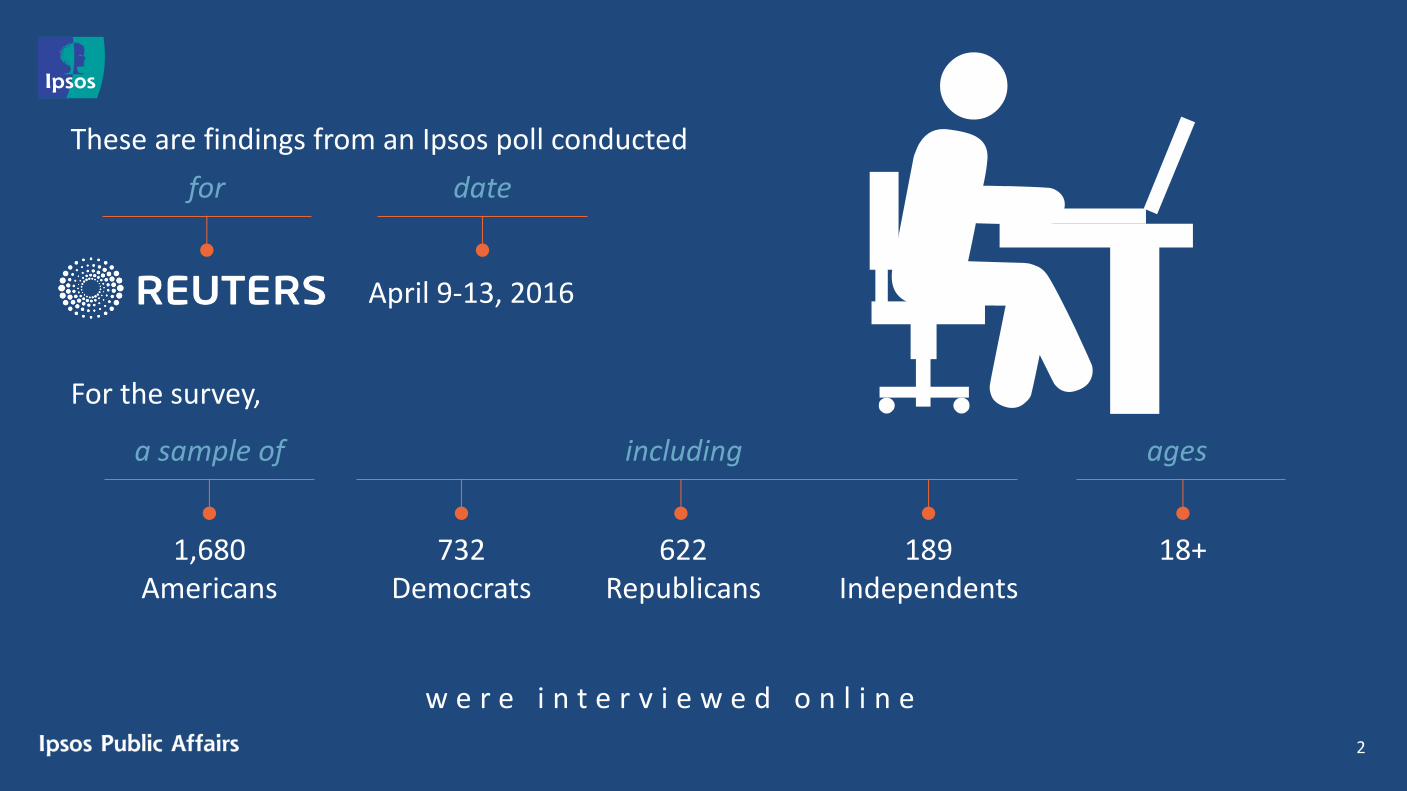
These are findings from an Ipsos poll conducted
for date
April 9-13, 2016
For the survey,
a sample of
1,680 Americans
including
732 Democrats
622 Republicans
189 Independents
18+
ages
w e r e i n t e r v i e w e d o n l i n e
3
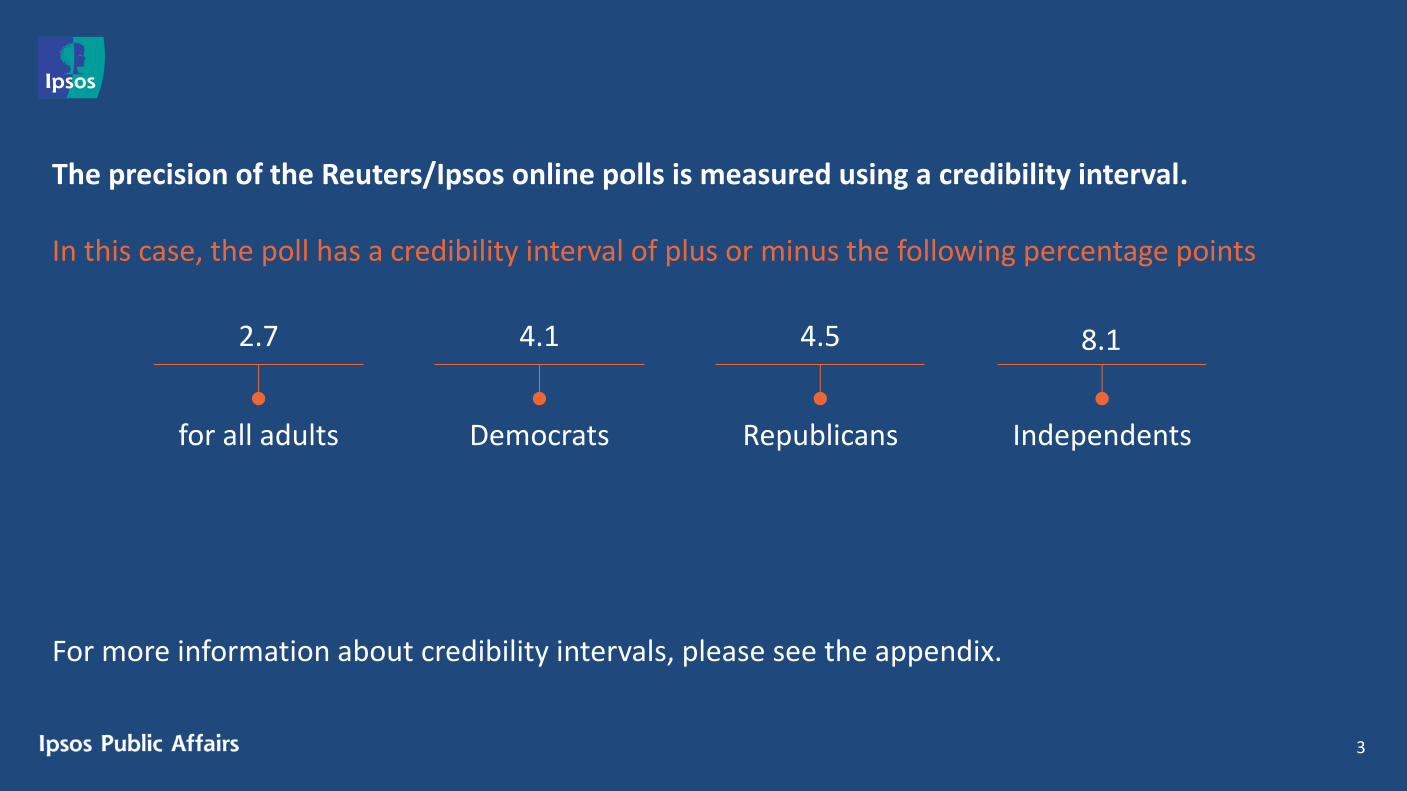
The precision of the Reuters/Ipsos online polls is measured using a credibility interval. In this case, the poll has a credibility interval of plus or minus the following percentage points
For more information about credibility intervals, please see the appendix.
2.7
for all adults
4.1
Democrats
4.5
Republicans
8.1
Independents
4
The data were weighted to the U.S. current population data by:
─ Gender
─ Age
─ Education
─ Ethnicity
Statistical margins of error are not applicable to online polls.
All sample surveys and polls may be subject to other sources of error, including, but not limited to coverage error and measurement error.
Figures marked by an asterisk (*) indicate a percentage value of greater than zero but less than one half of one per cent.
Where figures do not sum to 100, this is due to the effects of rounding.
To see more information on this and other Reuters/Ipsos polls, please visit http://polling.reuters.com/.
5
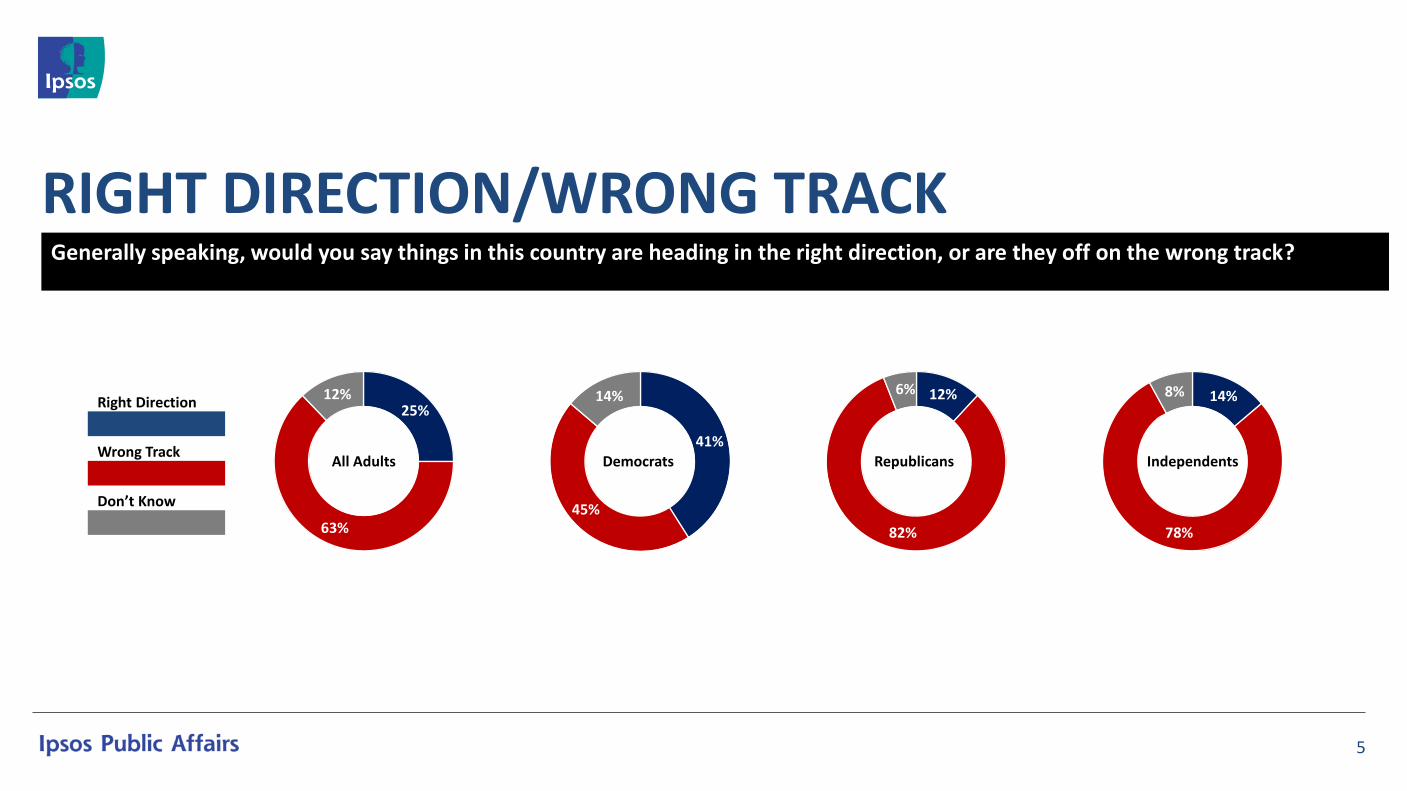
RIGHT DIRECTION/WRONG TRACK Generally speaking, would you say things in this country are heading in the right direction, or are they off on the wrong track?
25%
63%
12%
All Adults
41%
45%
14%
Democrats
12%
82%
6%
Republicans
14%
78%
8%
Independents
Right Direction
Wrong Track
Don’t Know

6
BARACK OBAMA Overall, do you approve or disapprove about the way Barack Obama is handling his job as President? Is that strongly (approve/disapprove) or somewhat (approve/disapprove)? (Asked of those who selected “approve” or “disapprove”) Q2b. If you had to choose, do you lean more towards approve or disapprove? (Asked of those who selected “don’t know”)
Total Democrat Republican Independent
Strongly approve 25% 45% 6% 13%
Somewhat approve 21% 32% 8% 21%
Lean towards approve 3% 3% 1% 2%
Lean towards disapprove 3% 2% 2% 1%
Somewhat disapprove 14% 8% 20% 18%
Strongly disapprove 32% 7% 61% 40%
Not sure 4% 2% 1% 5%
TOTAL APPROVE 48% 81% 15% 36%
TOTAL DISAPPROVE 48% 17% 84% 59%

7
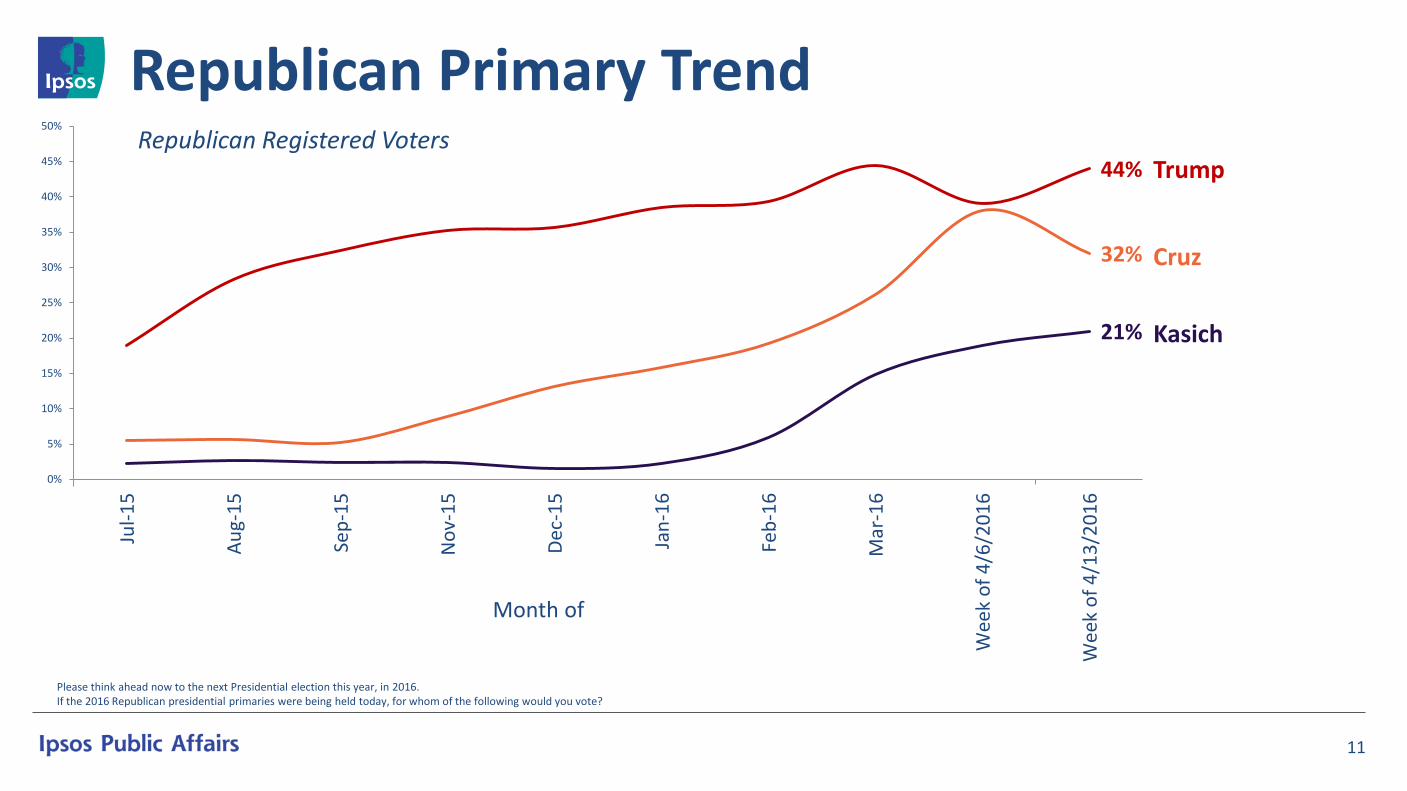
Please think ahead now to the next Presidential election this year, in 2016. If the 2016 Republican presidential primaries were being held today, for whom of the following would you vote? (Asked of registered voters, n=789)
Total (n=789)
Republican (n=575)
Independent (n=147)
Donald Trump 40% 44% 28%
Ted Cruz 29% 32% 23%
John Kasich 19% 21% 17%
Wouldn’t vote 13% 4% 31%
REPUBLICAN PRESIDENTIAL PRIMARIES
8
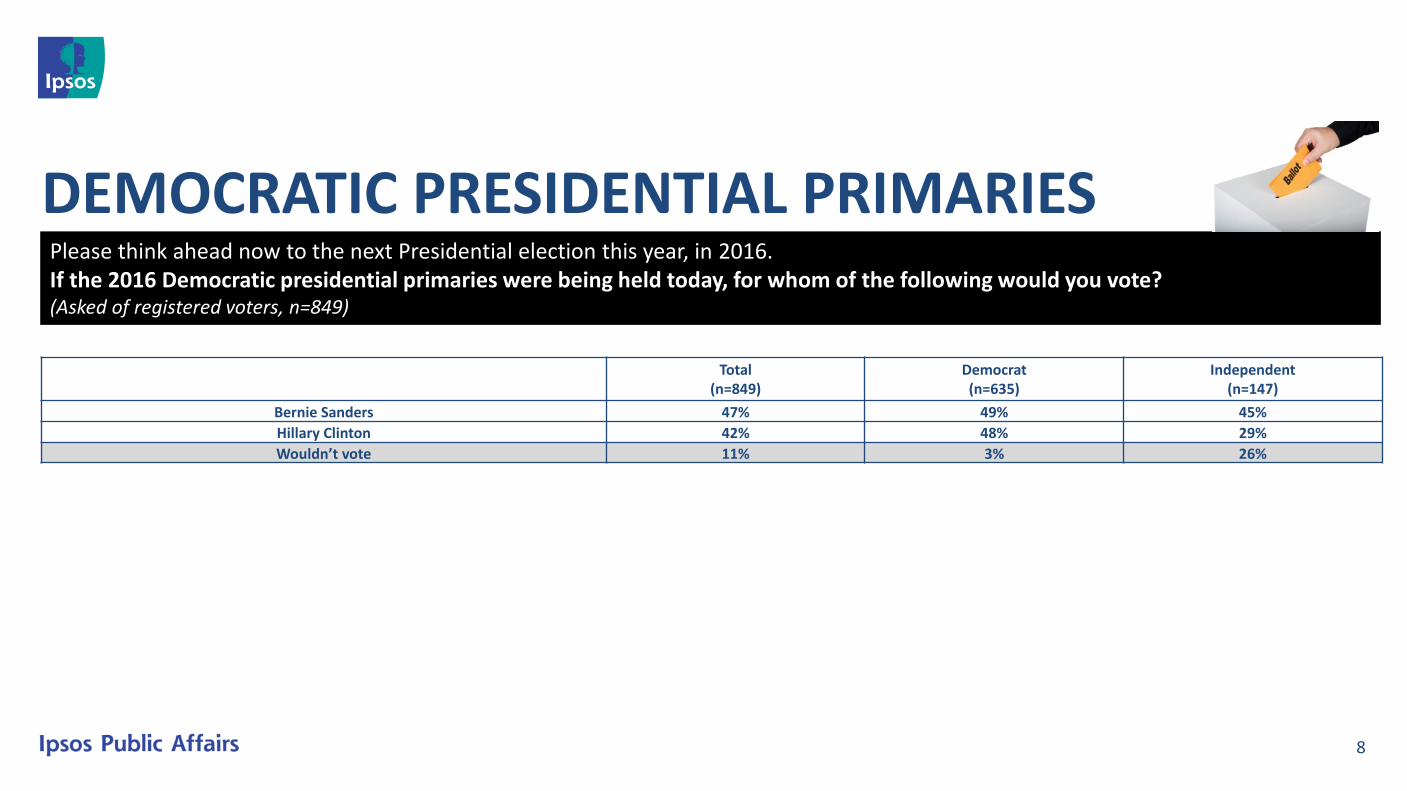
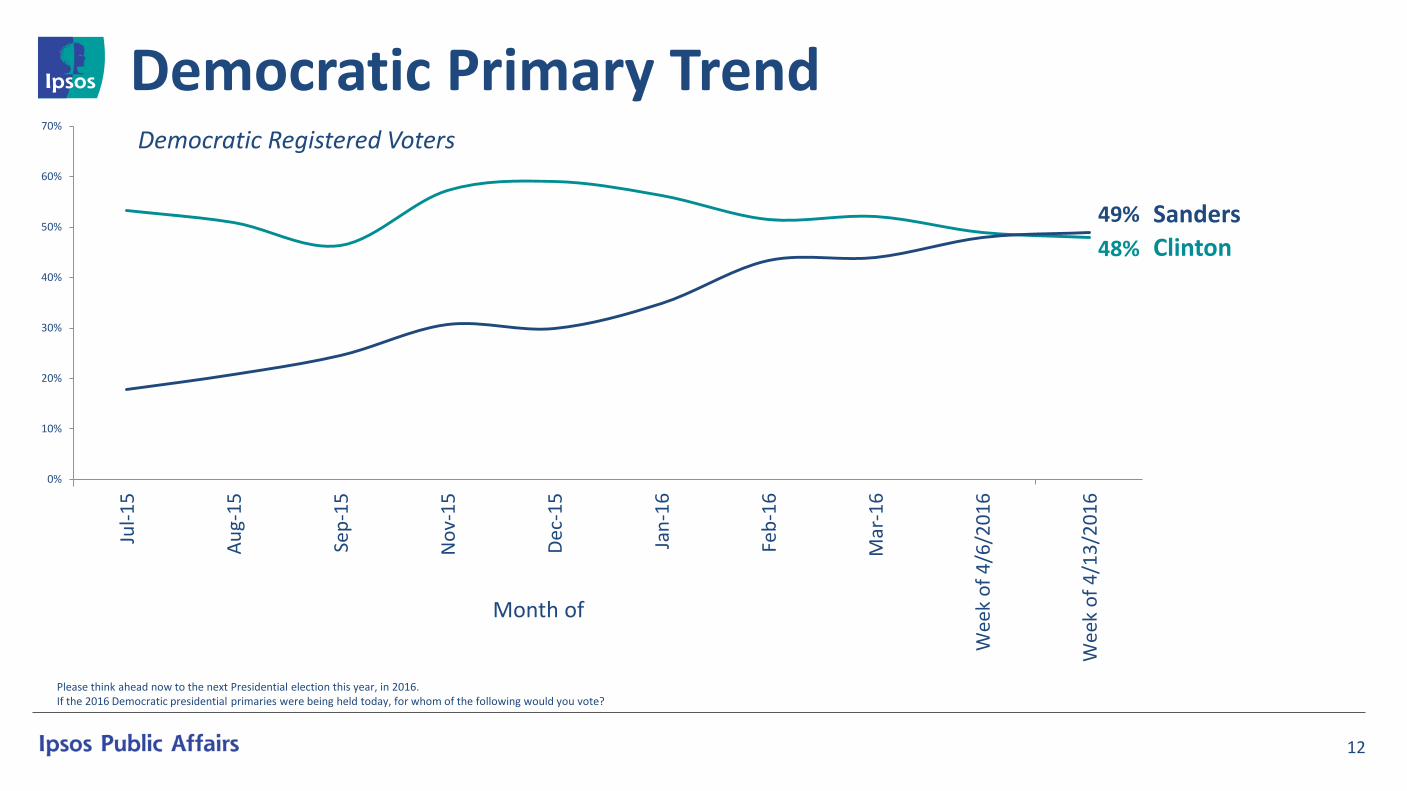
Please think ahead now to the next Presidential election this year, in 2016. If the 2016 Democratic presidential primaries were being held today, for whom of the following would you vote? (Asked of registered voters, n=849)
Total (n=849)
Democrat (n=635)
Independent (n=147)
Bernie Sanders 47% 49% 45%
Hillary Clinton 42% 48% 29%
Wouldn’t vote 11% 3% 26%
DEMOCRATIC PRESIDENTIAL PRIMARIES
9
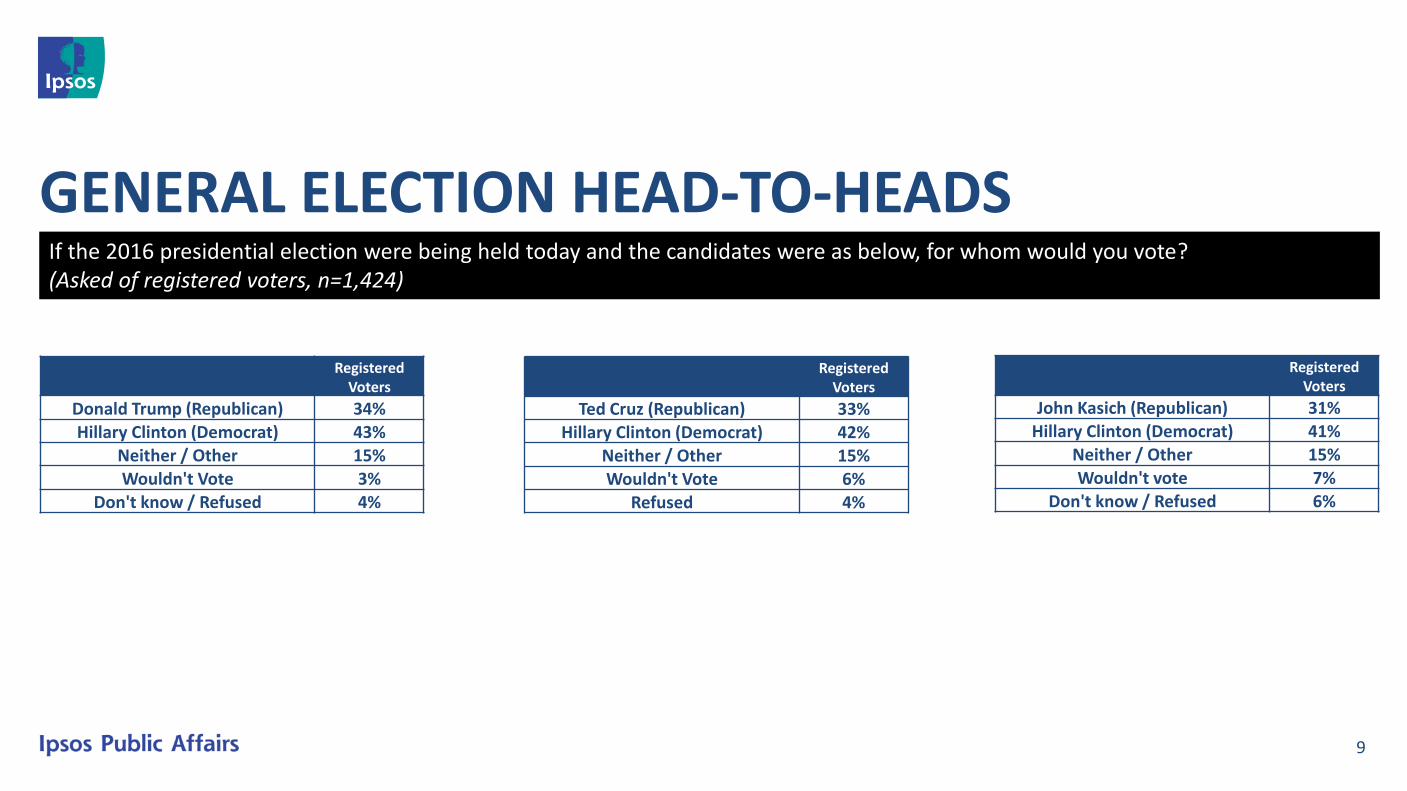
GENERAL ELECTION HEAD-TO-HEADS If the 2016 presidential election were being held today and the candidates were as below, for whom would you vote? (Asked of registered voters, n=1,424)
Registered Voters
Donald Trump (Republican) 34%
Hillary Clinton (Democrat) 43%
Neither / Other 15% Wouldn't Vote 3%
Don't know / Refused 4%
Registered Voters
Ted Cruz (Republican) 33%
Hillary Clinton (Democrat) 42%
Neither / Other 15%
Wouldn't Vote 6%
Refused 4%
Registered Voters
John Kasich (Republican) 31% Hillary Clinton (Democrat) 41%
Neither / Other 15%
Wouldn't vote 7% Don't know / Refused 6%
10
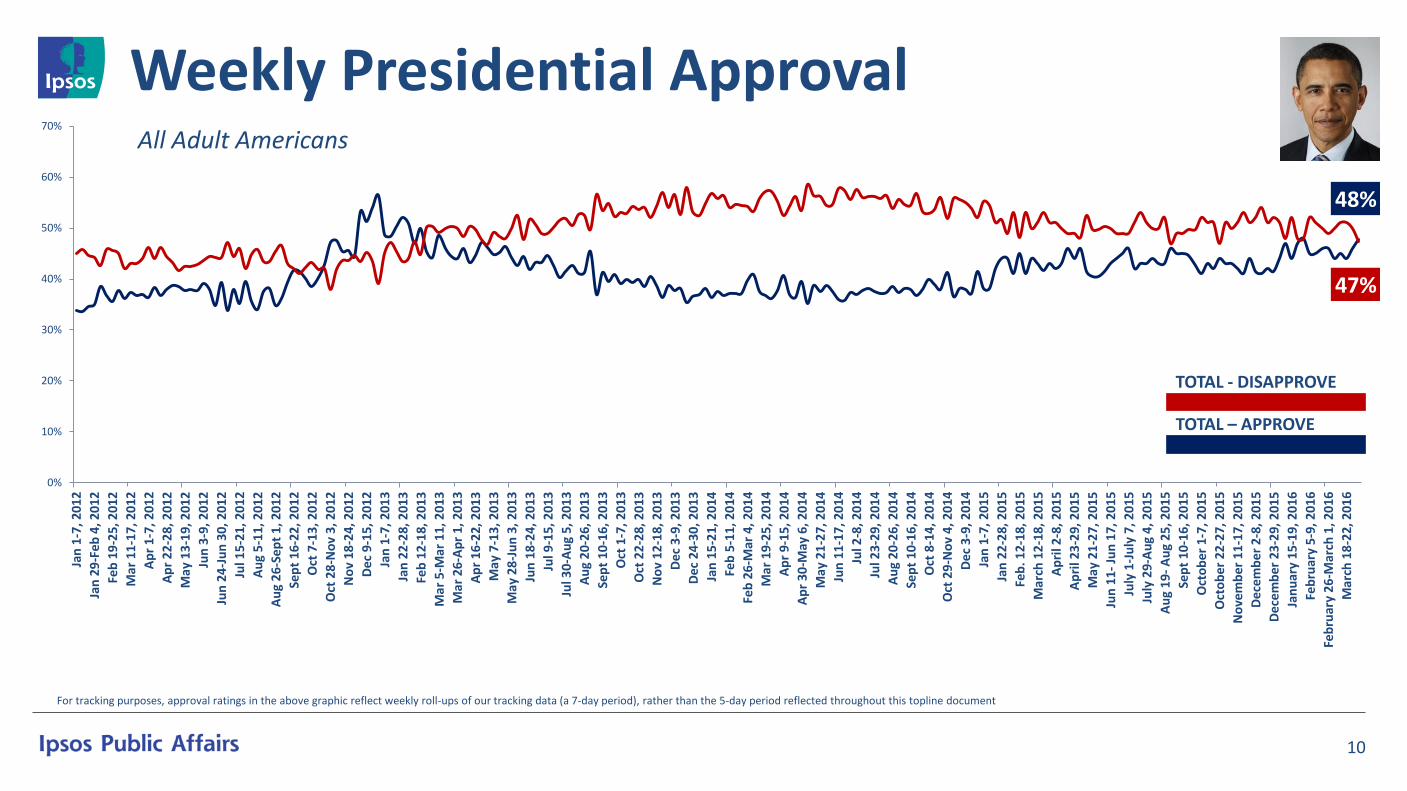
Weekly Presidential Approval
48%
47%
0%
10%
20%
30%
40%
50%
60%
70%
Jan
1-7
, 20
12
Jan
29
-Feb
4, 2
01
2
Feb
19
-25,
201
2
Mar
11
-17
, 20
12
Ap
r 1
-7, 2
01
2
Ap
r 2
2-2
8, 2
012
May
13
-19,
201
2
Jun
3-9
, 201
2
Jun
24-
Jun
30,
201
2
Jul 1
5-2
1, 2
012
Au
g 5
-11
, 20
12
Au
g 2
6-S
ep
t 1
, 20
12
Sep
t 16
-22
, 20
12
Oct
7-1
3, 2
012
Oct
28
-No
v 3
, 20
12
No
v 1
8-2
4, 2
012
Dec
9-1
5, 2
01
2
Jan
1-7
, 20
13
Jan
22
-28,
20
13
Feb
12
-18,
201
3
Mar
5-M
ar 1
1, 2
013
Mar
26-
Ap
r 1,
201
3
Ap
r 1
6-2
2, 2
013
May
7-1
3, 2
01
3
May
28
-Ju
n 3
, 20
13
Jun
18-
24
, 20
13
Jul 9
-15,
201
3
Jul 3
0-A
ug
5, 2
01
3
Au
g 2
0-2
6, 2
013
Sep
t 10
-16
, 20
13
Oct
1-7
, 20
13
Oct
22
-28,
20
13
No
v 1
2-1
8, 2
013
Dec
3-9
, 201
3
Dec
24-
30
, 20
13
Jan
15
-21,
20
14
Feb
5-1
1, 2
014
Feb
26
-Mar
4, 2
014
Mar
19
-25
, 20
14
Ap
r 9
-15
, 20
14
Ap
r 3
0-M
ay 6
, 20
14
May
21
-27,
201
4
Jun
11-
17
, 20
14
Jul 2
-8, 2
014
Jul 2
3-2
9, 2
014
Au
g 2
0-2
6, 2
014
Sep
t 10
-16
, 20
14
Oct
8-1
4, 2
014
Oct
29
-No
v 4
, 20
14
Dec
3-9
, 201
4
Jan
1-7
, 20
15
Jan
22
-28,
20
15
Feb
. 12
-18
, 20
15
Mar
ch 1
2-1
8, 2
015
Ap
ril 2
-8, 2
01
5
Ap
ril 2
3-2
9, 2
015
May
21
-27,
201
5
Jun
11-
Ju
n 1
7, 2
015
July
1-J
uly
7, 2
015
July
29
-Au
g 4
, 20
15
Au
g 1
9-
Au
g 2
5, 2
01
5
Sep
t 10
-16
, 20
15
Oct
ob
er 1
-7, 2
01
5
Oct
ob
er 2
2-2
7, 2
015
No
vem
ber
11
-17,
201
5
Dec
em
ber
2-8
, 201
5
Dec
em
ber
23
-29,
201
5
Jan
uar
y 1
5-1
9, 2
016
Feb
ruar
y 5
-9, 2
01
6
Feb
ruar
y 2
6-M
arch
1, 2
01
6
Mar
ch 1
8-2
2, 2
016
TOTAL - DISAPPROVE
TOTAL – APPROVE
For tracking purposes, approval ratings in the above graphic reflect weekly roll-ups of our tracking data (a 7-day period), rather than the 5-day period reflected throughout this topline document
All Adult Americans
11
Republican Primary Trend
32%
44%
21%
0%
5%
10%
15%
20%
25%
30%
35%
40%
45%
50%Ju
l-1
5
Au
g-1
5
Sep
-15
No
v-1
5
Dec
-15
Jan
-16
Feb
-16
Mar
-16
Wee
k o
f 4
/6/2
01
6
Wee
k o
f 4
/13
/20
16
Please think ahead now to the next Presidential election this year, in 2016. If the 2016 Republican presidential primaries were being held today, for whom of the following would you vote?
Republican Registered Voters
Month of
Trump
Cruz
Kasich
12
Democratic Primary Trend
48%
49%
0%
10%
20%
30%
40%
50%
60%
70%Ju
l-1
5
Au
g-1
5
Sep
-15
No
v-1
5
Dec
-15
Jan
-16
Feb
-16
Mar
-16
Wee
k o
f 4
/6/2
01
6
Wee
k o
f 4
/13
/20
16
Please think ahead now to the next Presidential election this year, in 2016. If the 2016 Democratic presidential primaries were being held today, for whom of the following would you vote?
Democratic Registered Voters
Month of
Clinton
Sanders
13
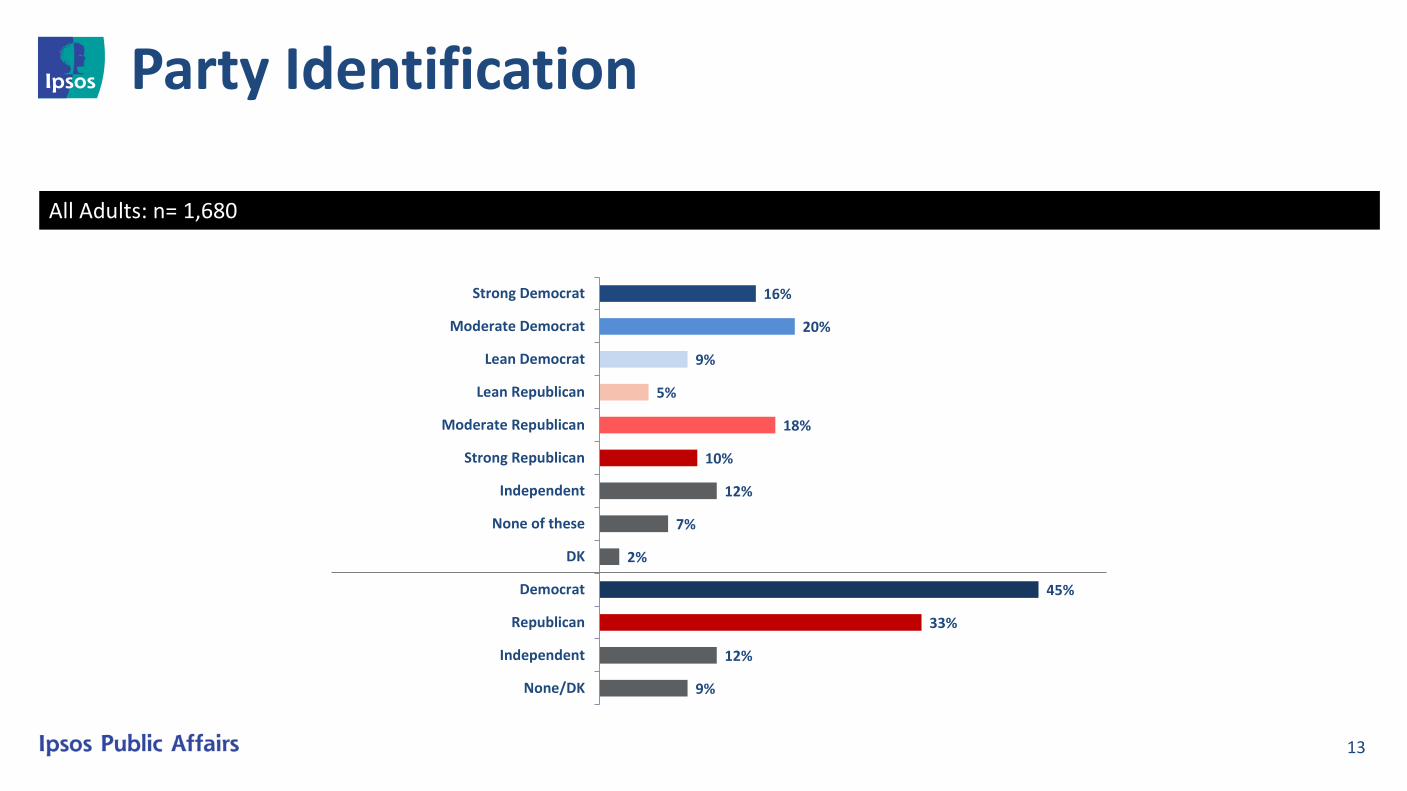
Party Identification
All Adults: n= 1,680
16%
20%
9%
5%
18%
10%
12%
7%
2%
45%
33%
12%
9%
Strong Democrat
Moderate Democrat
Lean Democrat
Lean Republican
Moderate Republican
Strong Republican
Independent
None of these
DK
Democrat
Republican
Independent
None/DK
14
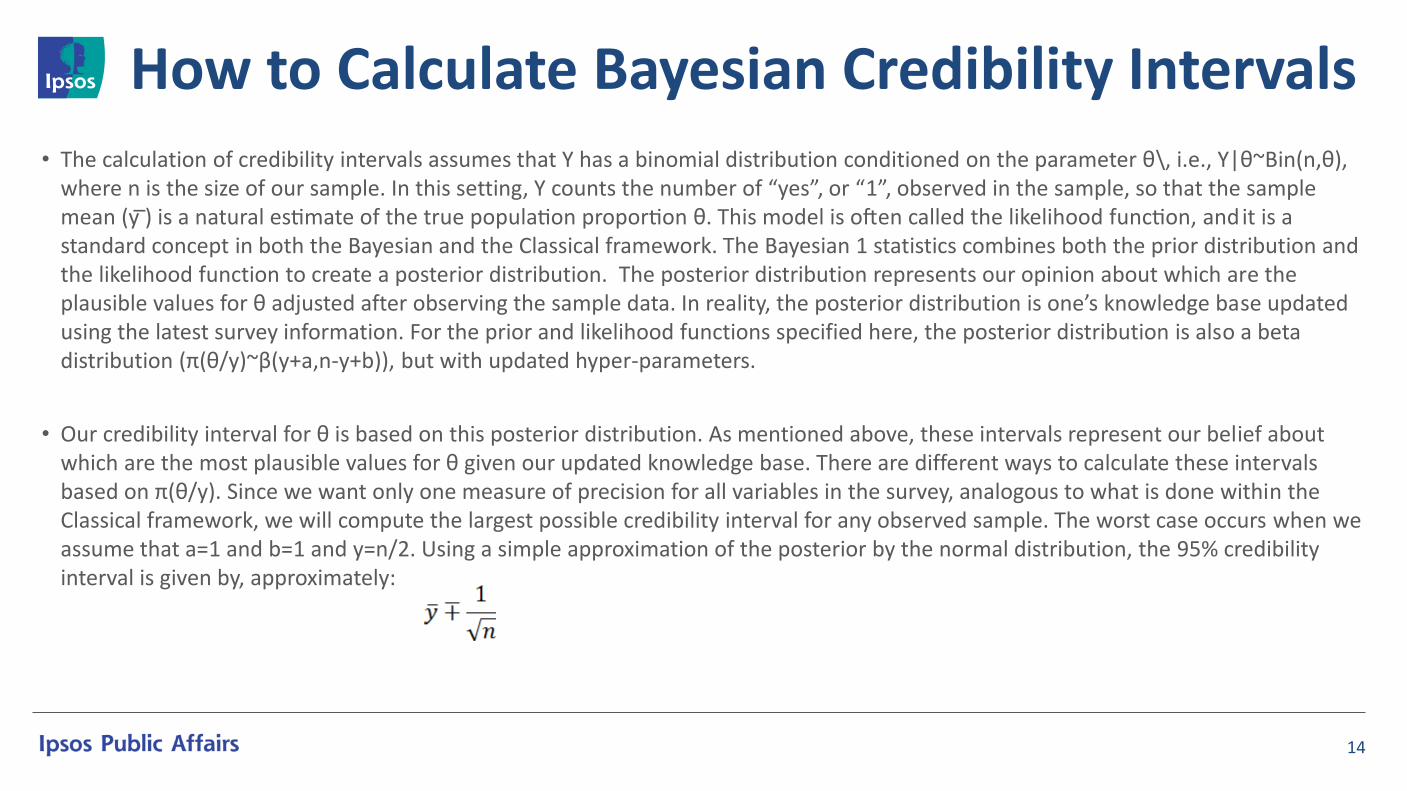
How to Calculate Bayesian Credibility Intervals • The calculation of credibility intervals assumes that Y has a binomial distribution conditioned on the parameter θ\, i.e., Y|θ~Bin(n,θ),
where n is the size of our sample. In this setting, Y counts the number of “yes”, or “1”, observed in the sample, so that the sample mean (y ̅) is a natural estimate of the true population proportion θ. This model is often called the likelihood function, and it is a standard concept in both the Bayesian and the Classical framework. The Bayesian 1 statistics combines both the prior distribution and the likelihood function to create a posterior distribution. The posterior distribution represents our opinion about which are the plausible values for θ adjusted after observing the sample data. In reality, the posterior distribution is one’s knowledge base updated using the latest survey information. For the prior and likelihood functions specified here, the posterior distribution is also a beta distribution (π(θ/y)~β(y+a,n-y+b)), but with updated hyper-parameters.
• Our credibility interval for θ is based on this posterior distribution. As mentioned above, these intervals represent our belief about which are the most plausible values for θ given our updated knowledge base. There are different ways to calculate these intervals based on π(θ/y). Since we want only one measure of precision for all variables in the survey, analogous to what is done within the Classical framework, we will compute the largest possible credibility interval for any observed sample. The worst case occurs when we assume that a=1 and b=1 and y=n/2. Using a simple approximation of the posterior by the normal distribution, the 95% credibility interval is given by, approximately:
15
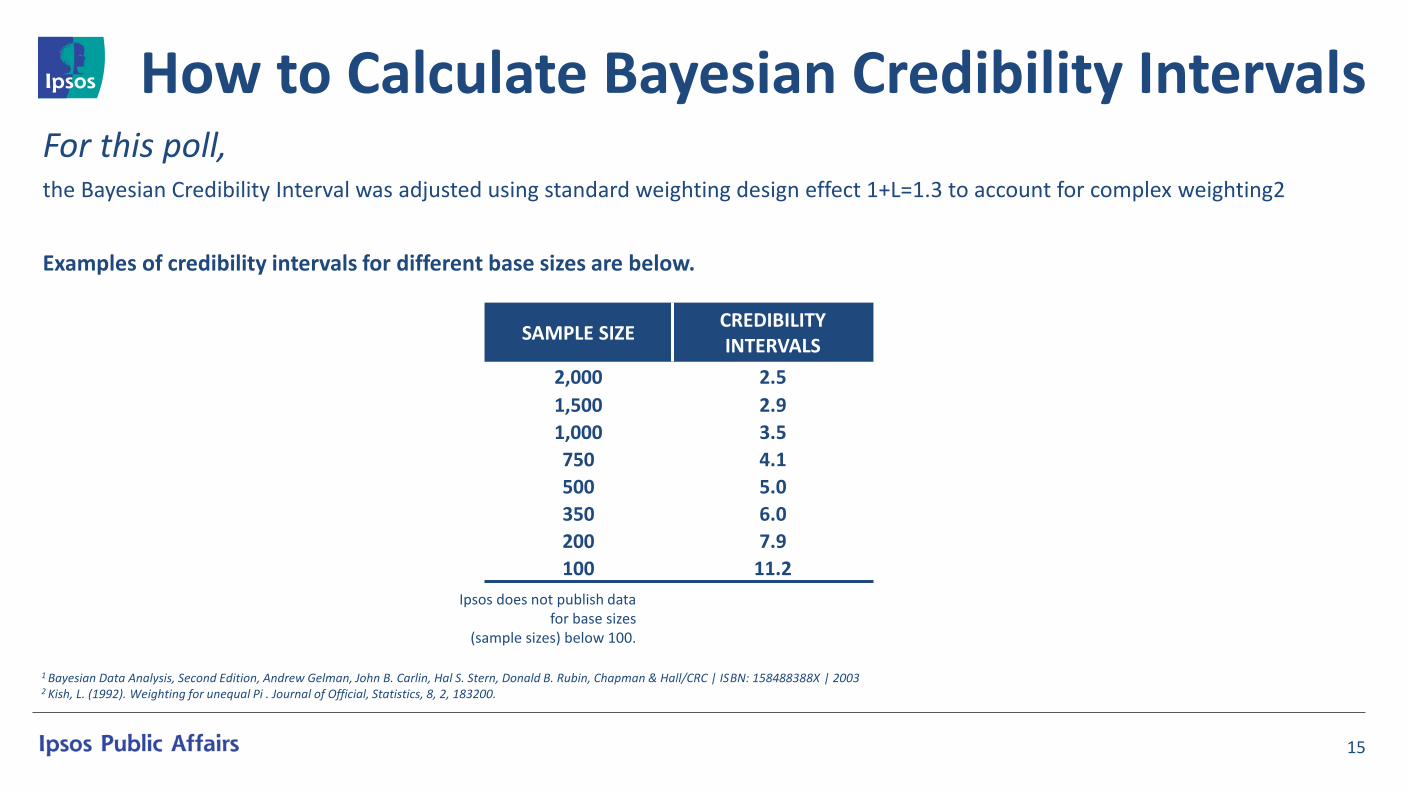
How to Calculate Bayesian Credibility Intervals For this poll, the Bayesian Credibility Interval was adjusted using standard weighting design effect 1+L=1.3 to account for complex weighting2
Examples of credibility intervals for different base sizes are below.
SAMPLE SIZE CREDIBILITY INTERVALS
2,000 2.5
1,500 2.9
1,000 3.5
750 4.1
500 5.0
350 6.0
200 7.9
100 11.2
1 Bayesian Data Analysis, Second Edition, Andrew Gelman, John B. Carlin, Hal S. Stern, Donald B. Rubin, Chapman & Hall/CRC | ISBN: 158488388X | 2003 2 Kish, L. (1992). Weighting for unequal Pi . Journal of Official, Statistics, 8, 2, 183200.
Ipsos does not publish data for base sizes
(sample sizes) below 100.