Embed Size (px)
Citation preview
2016 Q3 Results Presentation (Unaudited results for the nine months ended 30 September)
Stock Code:01070
2016 Q3 Results Page 2 2016 Q3 Results Page 2
Agenda
Financial Highlights 1
2 Business Review
3 Outlook
2016 Q3 Results Page 3
Financial Highlights
2016 Q3 Results Page 4
147
302
2015 Q1-Q3 2016 Q1-Q3
15,237^ 13,459
9,207^ 10,216
2015 Q1-Q3 2016 Q1-Q3
PRC Market Overseas Markets
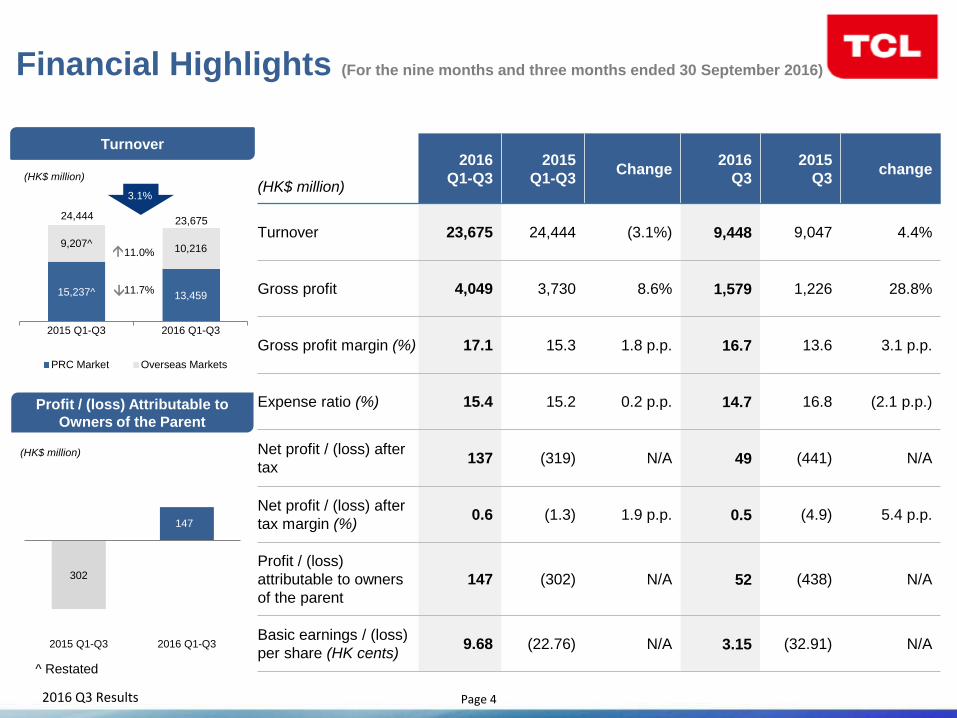
Financial Highlights (For the nine months and three months ended 30 September 2016)
(HK$ million)
24,444 23,675
(HK$ million)
11.0%
11.7%
Turnover
3.1%
Profit / (loss) Attributable to
Owners of the Parent
(HK$ million)
2016
Q1-Q3
2015
Q1-Q3 Change
2016
Q3
2015
Q3 change
Turnover 23,675 24,444 (3.1%) 9,448 9,047 4.4%
Gross profit 4,049 3,730 8.6% 1,579 1,226 28.8%
Gross profit margin (%) 17.1 15.3 1.8 p.p. 16.7 13.6 3.1 p.p.
Expense ratio (%) 15.4 15.2 0.2 p.p. 14.7 16.8 (2.1 p.p.)
Net profit / (loss) after
tax 137 (319) N/A 49 (441) N/A
Net profit / (loss) after
tax margin (%) 0.6 (1.3) 1.9 p.p. 0.5 (4.9) 5.4 p.p.
Profit / (loss)
attributable to owners
of the parent
147 (302) N/A 52 (438) N/A
Basic earnings / (loss)
per share (HK cents) 9.68 (22.76) N/A 3.15 (32.91) N/A
^ Restated
2016 Q3 Results Page 5
1,870 1,782
2,791 3,086
2,606 2,205
2,609 2,937
1,892 1,916 2,498
3,015
2,324 1,768
2,273 2,878
2,401 1,879
2,444
1,349 1,476
1,581 1,592
1,306 1,598
1,761
2,162
1,934 1,815
1,848
1,656
1,840
1,785
2,475
2,000
1,802 2,474
3,501
0
500
1,000
1,500
2,000
2,500
3,000
3,500
4,000
4,500
5,000
2012Q1
2012Q2
2012Q3
2012Q4
2013Q1
2013Q2
2013Q3
2013Q4
2014Q1
2014Q2
2014Q3
2014Q4
2015Q1
2015Q2
2015Q3
2015Q4
2016Q1
2016Q2
2016Q3
PRC Market Overseas Markets
(‘000 sets)
FY2014:
16,574
FY2013:
17,184
FY2012:
15,527
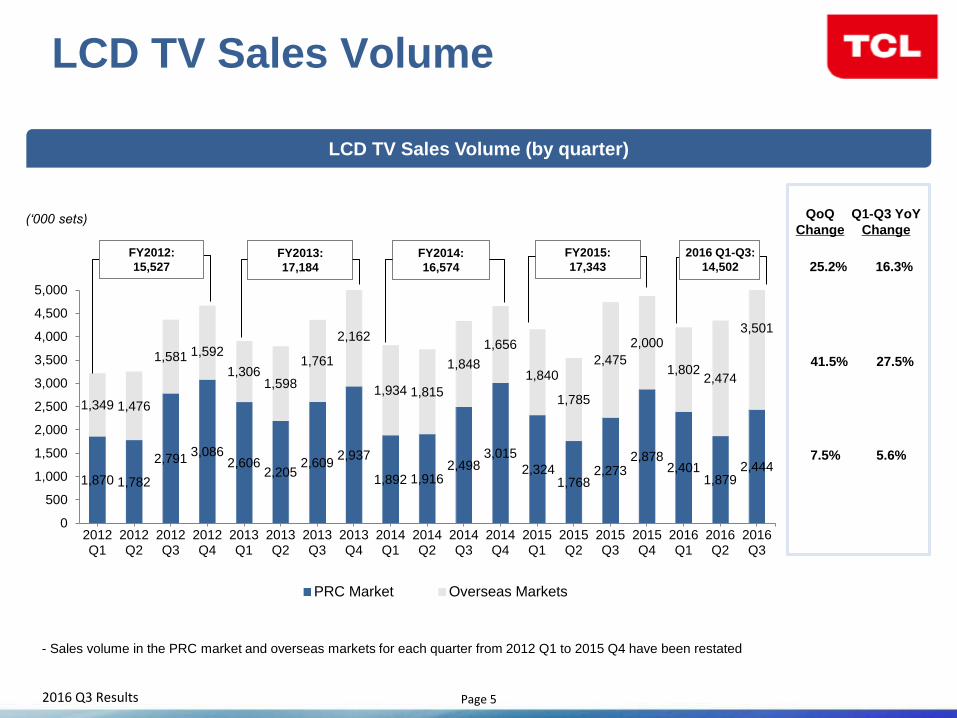
LCD TV Sales Volume
7.5%
41.5%
25.2% FY2015:
17,343
LCD TV Sales Volume (by quarter)
- Sales volume in the PRC market and overseas markets for each quarter from 2012 Q1 to 2015 Q4 have been restated
QoQ
Change
Q1-Q3 YoY
Change
5.6%
27.5%
16.3%
2016 Q1-Q3:
14,502
2016 Q3 Results Page 6
2,154 2,113 2,128
2,356 2,322 2,183 2,098 2,053
1,908 1,935 1,917
2,115 1,982^ 1,983^ 1,897^ 1,952^
1,746 1,563 1,585
2,614 2,513 2,506
2,737 2,636
2,729
2,494 2,534 2,410^ 2,420^
2,273^
2,503^ 2,477^ 2,545
2,342 2,309 2,139
1,978
1,939
1,000
2,000
3,000
4,000
2012Q1
2012Q2
2012Q3
2012Q4
2013Q1
2013Q2
2013Q3
2013Q4
2014Q1
2014Q2
2014Q3
2014Q4
2015Q1
2015Q2
2015Q3
2015Q4
2016Q1
2016Q2
2016Q3
Overall The PRC (excluding ODM business)
FY2013: 2,589
FY2013: 2,154
FY2012: 2,603
FY2012: 2,199
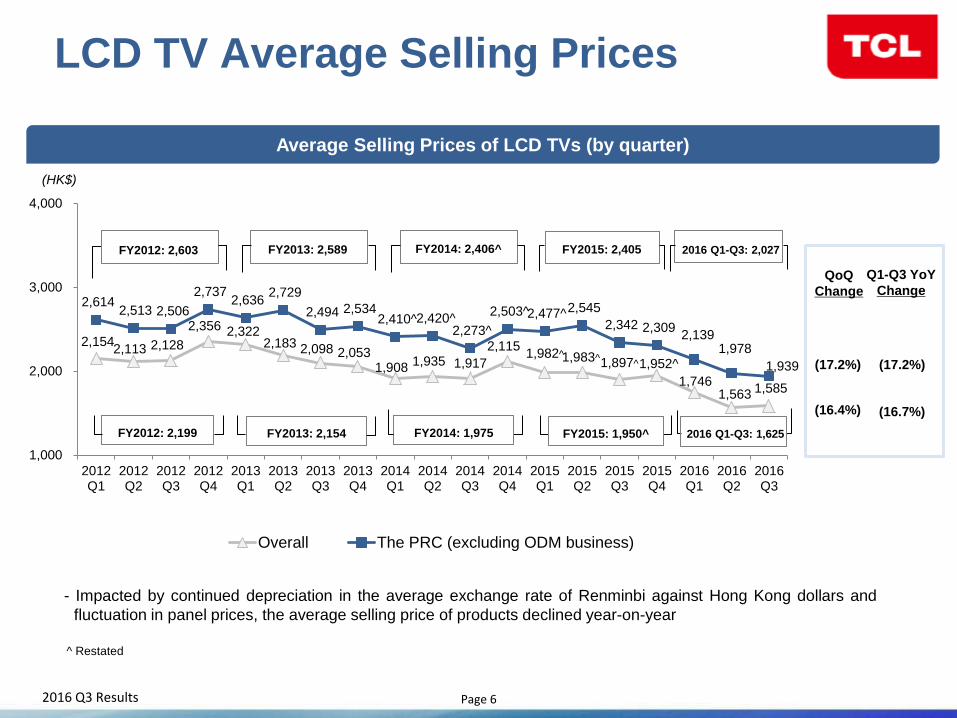
LCD TV Average Selling Prices
^ Restated
Average Selling Prices of LCD TVs (by quarter)
- Impacted by continued depreciation in the average exchange rate of Renminbi against Hong Kong dollars and
fluctuation in panel prices, the average selling price of products declined year-on-year
FY2014: 2,406^ FY2015: 2,405 2016 Q1-Q3: 2,027
(HK$)
(17.2%)
(16.4%)
QoQ
Change
Q1-Q3 YoY
Change
(17.2%)
(16.7%)
FY2014: 1,975 FY2015: 1,950^ 2016 Q1-Q3: 1,625
2016 Q3 Results Page 7
18.8%^
16.6%^ 17.0%^ 16.3%^ 16.5%^
14.9%
12.8% 11.3%
13.0%
18.5% 17.2% 16.9%
14.3%
18.5%^
13.6%
21.1% 18.8%
15.8 16.7%
25.3%
21.2% 20.4% 19.6% 19.8% 18.9%
15.8% 14.1%
16.7% ̂
23.9% ̂
22.1% ̂
19.7% ̂
17.9% ̂
25.1% ̂
15.8% ̂
24.6%
22.2% 22.2%
25.7%
3.7%^ 1.6%^ 1.7%^ 2.3%^ 1.8%^
0.2% -1.5% -1.4%
0.1% 2.1%
0.8% 0.1% 0.5% 1.2%
-4.9%
3.4%
1.0% 0.2% 0.5%
15.7%^ 13.8%^ 14.7%^
13.5%^ 14.3%^ 14.9%
14.1%
13.7%
12.7%
16.7% 15.8% 15.5%
13.1%
15.7% 16.8%
17.4%
16.7% 15.1% 14.7%
-5%
0%
5%
10%
15%
20%
25%
30%
35%
2012Q1
2012Q2
2012Q3
2012Q4
2013Q1
2013Q2
2013Q3
2013Q4
2014Q1
2014Q2
2014Q3
2014Q4
2015Q1
2015Q2
2015Q3
2015Q4
2016Q1
2016Q2
2016Q3
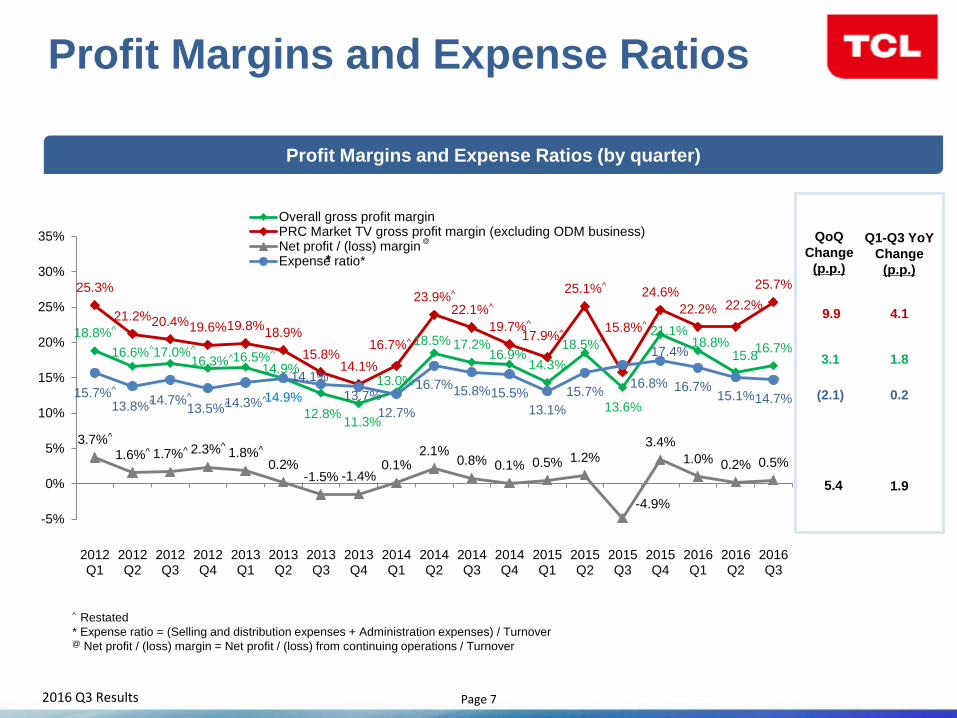
Overall gross profit marginPRC Market TV gross profit margin (excluding ODM business)Net profit / (loss) marginExpense ratio**
@ QoQ
Change
(p.p.)
9.9
3.1
(2.1)
5.4
Profit Margins and Expense Ratios
Profit Margins and Expense Ratios (by quarter)
Q1-Q3 YoY
Change
(p.p.)
4.1
1.8
0.2
1.9
^ Restated
* Expense ratio = (Selling and distribution expenses + Administration expenses) / Turnover @ Net profit / (loss) margin = Net profit / (loss) from continuing operations / Turnover
2016 Q3 Results Page 8
30 Sep 2016 31 Dec 2015 Change
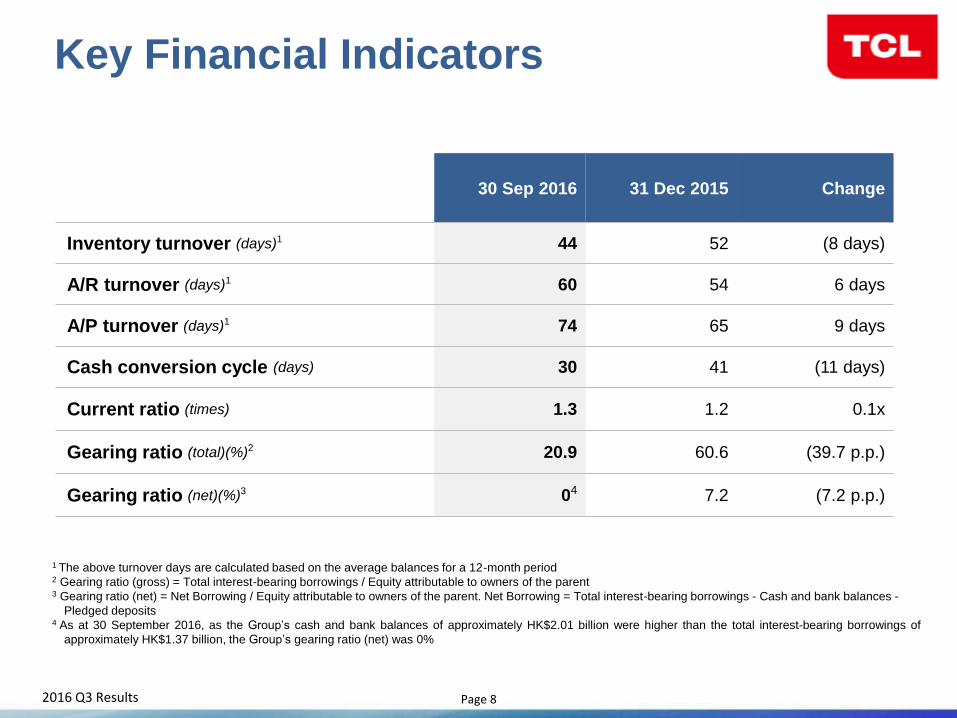
Inventory turnover (days)1 44 52 (8 days)
A/R turnover (days)1 60 54 6 days
A/P turnover (days)1 74 65 9 days
Cash conversion cycle (days) 30 41 (11 days)
Current ratio (times) 1.3 1.2 0.1x
Gearing ratio (total)(%)2 20.9 60.6 (39.7 p.p.)
Gearing ratio (net)(%)3 04 7.2 (7.2 p.p.)
Key Financial Indicators
1 The above turnover days are calculated based on the average balances for a 12-month period 2 Gearing ratio (gross) = Total interest-bearing borrowings / Equity attributable to owners of the parent 3 Gearing ratio (net) = Net Borrowing / Equity attributable to owners of the parent. Net Borrowing = Total interest-bearing borrowings - Cash and bank balances -
Pledged deposits 4 As at 30 September 2016, as the Group’s cash and bank balances of approximately HK$2.01 billion were higher than the total interest-bearing borrowings of
approximately HK$1.37 billion, the Group’s gearing ratio (net) was 0%
2016 Q3 Results Page 9
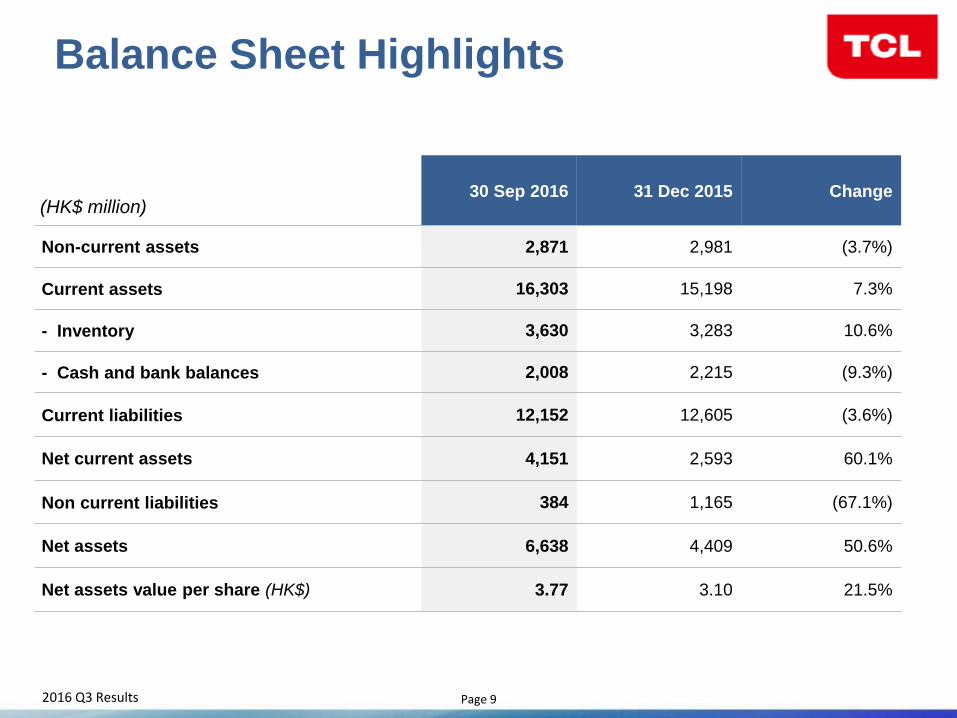
Balance Sheet Highlights
(HK$ million) 30 Sep 2016 31 Dec 2015 Change
Non-current assets 2,871 2,981 (3.7%)
Current assets 16,303 15,198 7.3%
- Inventory 3,630 3,283 10.6%
- Cash and bank balances 2,008 2,215 (9.3%)
Current liabilities 12,152 12,605 (3.6%)
Net current assets 4,151 2,593 60.1%
Non current liabilities 384 1,165 (67.1%)
Net assets 6,638 4,409 50.6%
Net assets value per share (HK$) 3.77 3.10 21.5%
2016 Q3 Results Page 10
Business Review
2016 Q3 Results Page 11
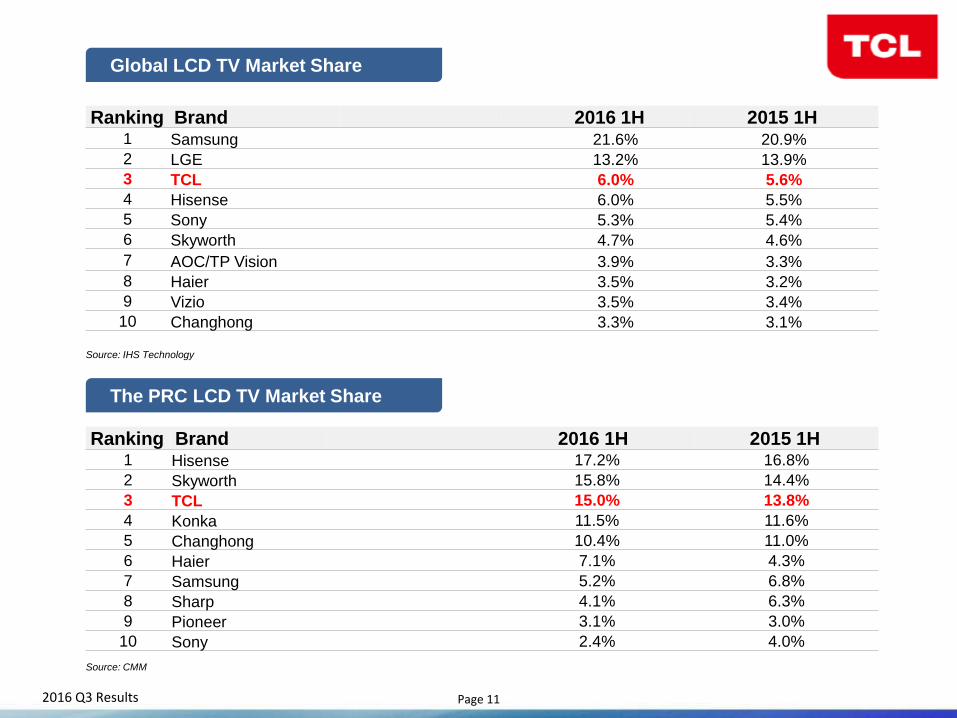
Source: CMM
Source: IHS Technology
Global LCD TV Market Share
The PRC LCD TV Market Share
Ranking Brand 2016 1H 2015 1H 1 Samsung 21.6% 20.9%
2 LGE 13.2% 13.9%
3 TCL 6.0% 5.6%
4 Hisense 6.0% 5.5%
5 Sony 5.3% 5.4%
6 Skyworth 4.7% 4.6%
7 AOC/TP Vision 3.9% 3.3%
8 Haier 3.5% 3.2%
9 Vizio 3.5% 3.4%
10 Changhong 3.3% 3.1%
Ranking Brand 2016 1H 2015 1H 1 Hisense 17.2% 16.8%
2 Skyworth 15.8% 14.4%
3 TCL 15.0% 13.8%
4 Konka 11.5% 11.6%
5 Changhong 10.4% 11.0%
6 Haier 7.1% 4.3%
7 Samsung 5.2% 6.8%
8 Sharp 4.1% 6.3%
9 Pioneer 3.1% 3.0%
10 Sony 2.4% 4.0%
2016 Q3 Results Page 12
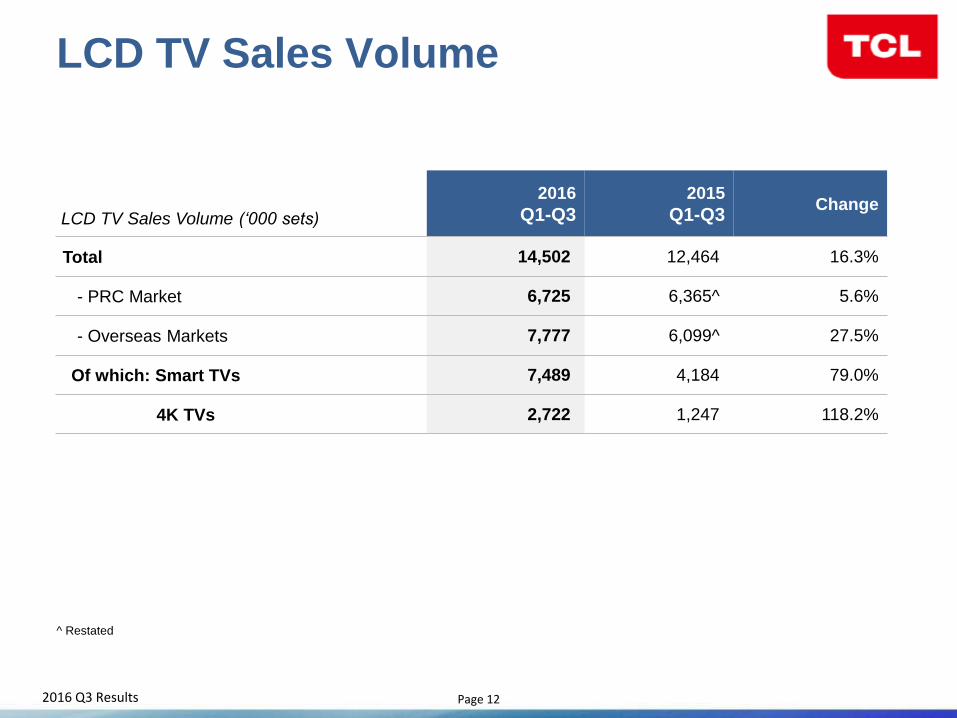
LCD TV Sales Volume
^ Restated
LCD TV Sales Volume (‘000 sets)
2016
Q1-Q3
2015
Q1-Q3 Change
Total 14,502 12,464 16.3%
- PRC Market 6,725 6,365^ 5.6%
- Overseas Markets 7,777 6,099^ 27.5%
Of which: Smart TVs 7,489 4,184 79.0%
4K TVs 2,722 1,247 118.2%
2016 Q3 Results Page 13
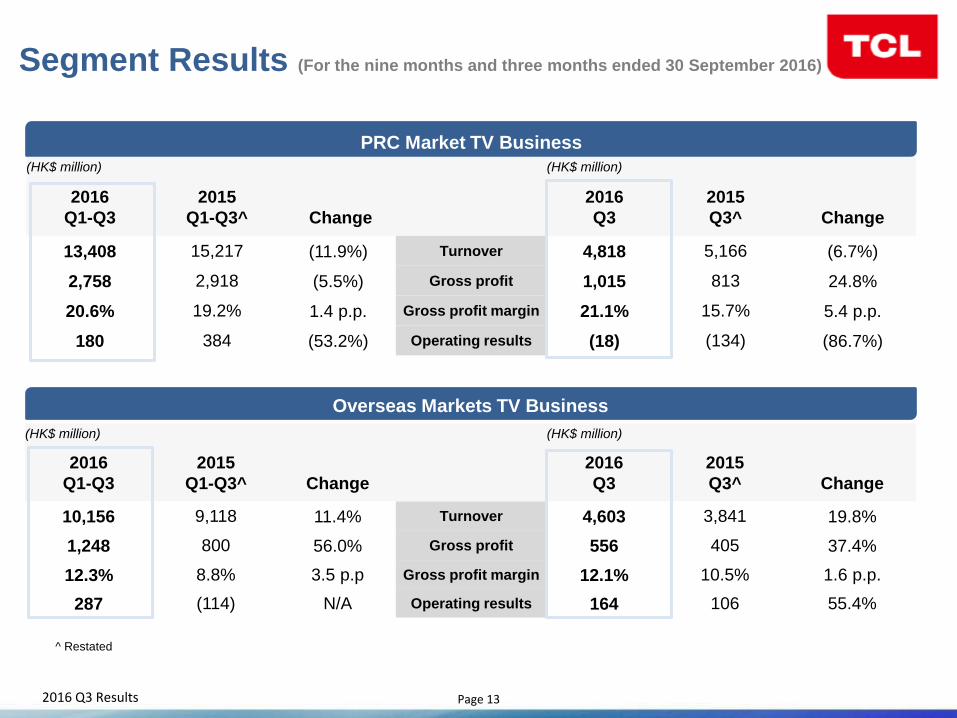
Overseas Markets TV Business
(HK$ million) (HK$ million)
2016
Q1-Q3
2015
Q1-Q3^ Change
2016
Q3
2015
Q3^ Change
10,156 9,118 11.4% Turnover 4,603 3,841 19.8%
1,248 800 56.0% Gross profit 556 405 37.4%
12.3% 8.8% 3.5 p.p Gross profit margin 12.1% 10.5% 1.6 p.p.
287 (114) N/A Operating results 164 106 55.4%
PRC Market TV Business
(HK$ million) (HK$ million)
2016
Q1-Q3
2015
Q1-Q3^ Change
2016
Q3
2015
Q3^ Change
13,408 15,217 (11.9%) Turnover 4,818 5,166 (6.7%)
2,758 2,918 (5.5%) Gross profit 1,015 813 24.8%
20.6% 19.2% 1.4 p.p. Gross profit margin 21.1% 15.7% 5.4 p.p.
180 384 (53.2%) Operating results (18) (134) (86.7%)
Segment Results (For the nine months and three months ended 30 September 2016)
^ Restated
2016 Q3 Results Page 14
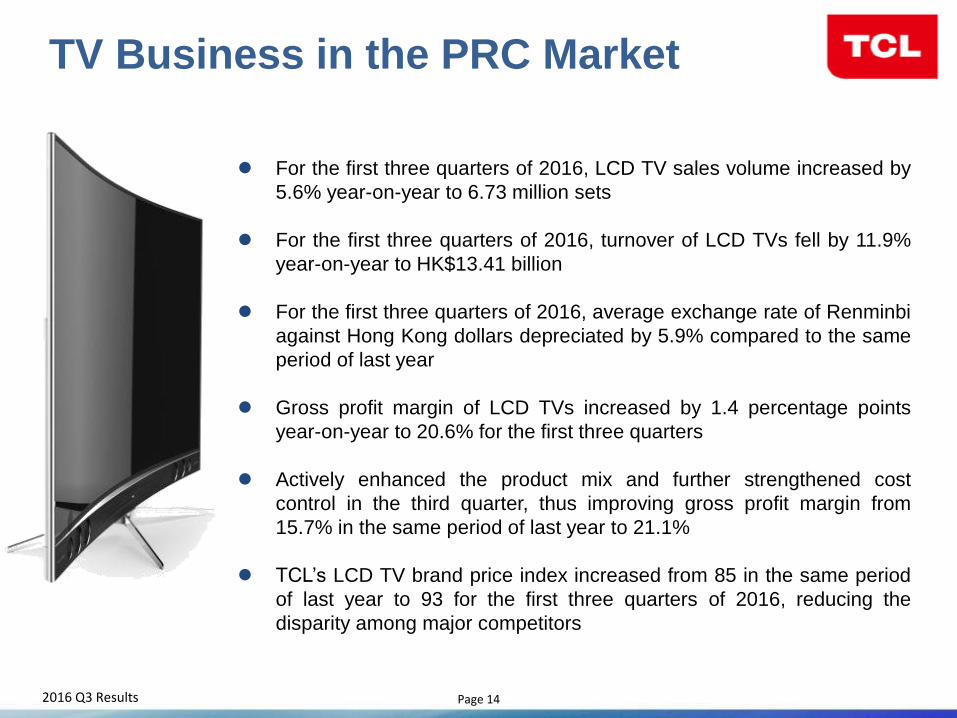
TV Business in the PRC Market
For the first three quarters of 2016, LCD TV sales volume increased by
5.6% year-on-year to 6.73 million sets
For the first three quarters of 2016, turnover of LCD TVs fell by 11.9%
year-on-year to HK$13.41 billion
For the first three quarters of 2016, average exchange rate of Renminbi
against Hong Kong dollars depreciated by 5.9% compared to the same
period of last year
Gross profit margin of LCD TVs increased by 1.4 percentage points
year-on-year to 20.6% for the first three quarters
Actively enhanced the product mix and further strengthened cost
control in the third quarter, thus improving gross profit margin from
15.7% in the same period of last year to 21.1%
TCL’s LCD TV brand price index increased from 85 in the same period
of last year to 93 for the first three quarters of 2016, reducing the
disparity among major competitors
2016 Q3 Results Page 15
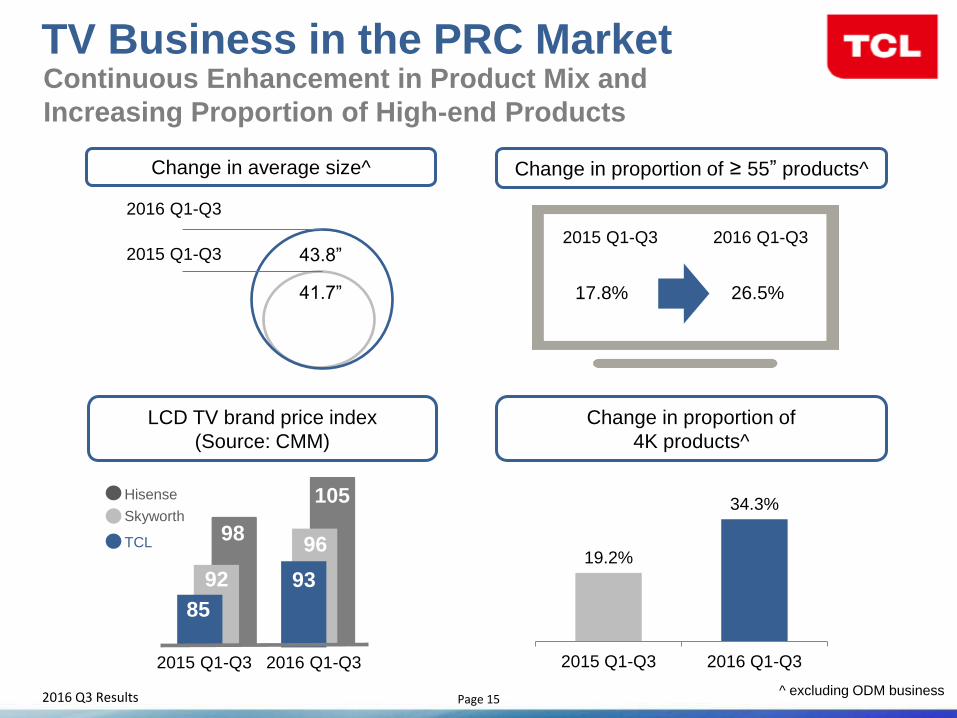
17.8% 26.5%
2016 Q1-Q3 2015 Q1-Q3
Change in proportion of ≥ 55” products^ Change in average size^
2016 Q1-Q3
2015 Q1-Q3
Change in proportion of
4K products^
19.2%
34.3%
2015 Q1-Q3 2016 Q1-Q3
41.7”
43.8”
^ excluding ODM business
TCL
Skyworth
Hisense
93
96
105
85
92
98
2015 Q1-Q3 2016 Q1-Q3
LCD TV brand price index
(Source: CMM)
Continuous Enhancement in Product Mix and
Increasing Proportion of High-end Products
TV Business in the PRC Market
2016 Q3 Results Page 16
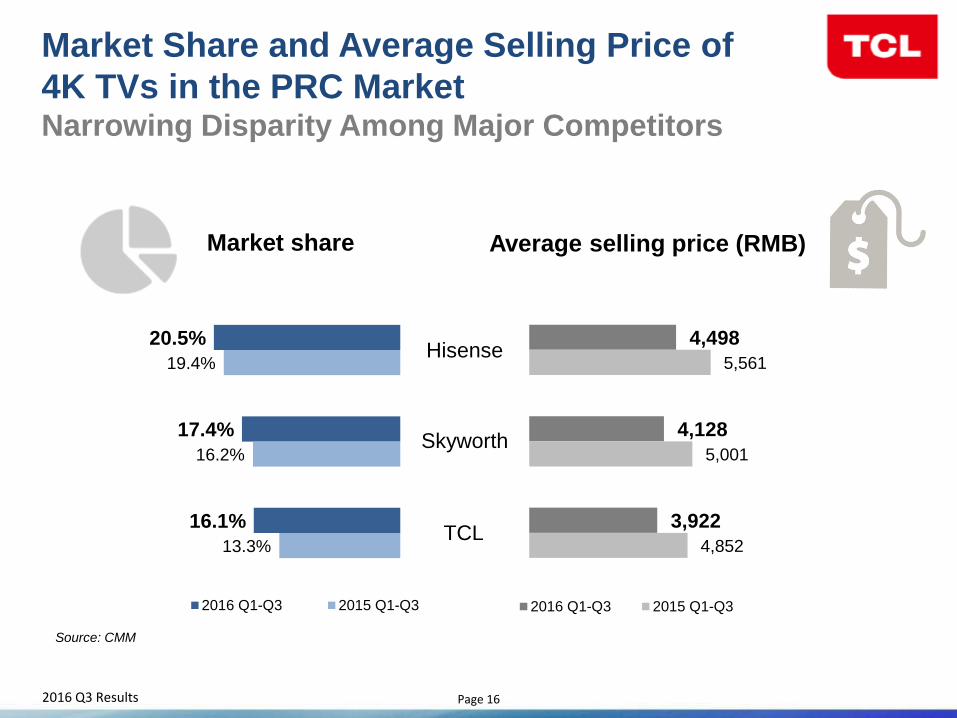
20.5%
17.4%
16.1%
19.4%
16.2%
13.3%
2016 Q1-Q3 2015 Q1-Q3
4,498
4,128
3,922
5,561
5,001
4,852
2016 Q1-Q3 2015 Q1-Q3
Market Share and Average Selling Price of
4K TVs in the PRC Market Narrowing Disparity Among Major Competitors
Market share Average selling price (RMB)
Source: CMM
TCL
Skyworth
Hisense
2016 Q3 Results Page 17
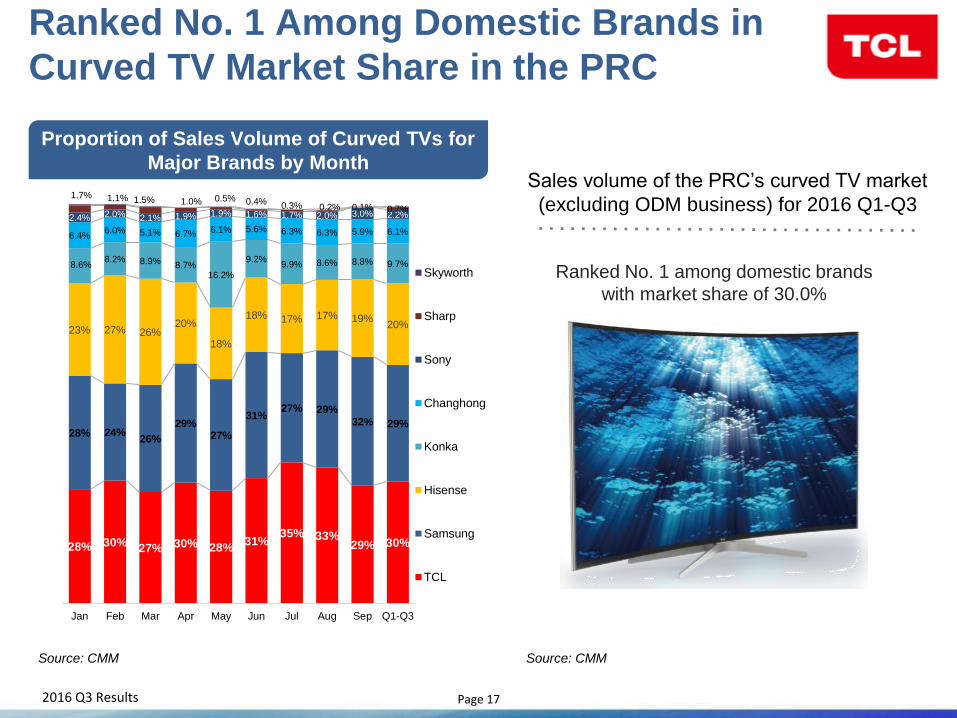
28% 30% 27% 30% 28%
31% 35% 33%
29% 30%
28% 24% 26%
29% 27%
31% 27% 29%
32% 29%
23% 27% 26% 20%
18%
18% 17% 17% 19% 20%
8.6% 8.2% 8.9% 8.7%
16.2%
9.2% 9.9% 8.6% 8.8% 9.7%
6.4% 6.0% 5.1% 6.7% 6.1% 5.6% 6.3% 6.3% 5.9% 6.1%
2.4% 2.0% 2.1% 1.9% 1.9% 1.6% 1.7% 2.0% 3.0% 2.2%
1.7% 1.1% 1.5% 1.0% 0.5% 0.4% 0.3% 0.2% 0.1% 0.7%
Jan Feb Mar Apr May Jun Jul Aug Sep Q1-Q3
Skyworth
Sharp
Sony
Changhong
Konka
Hisense
Samsung
TCL
Ranked No. 1 Among Domestic Brands in
Curved TV Market Share in the PRC
Source: CMM
Proportion of Sales Volume of Curved TVs for
Major Brands by Month
Source: CMM
Sales volume of the PRC’s curved TV market
(excluding ODM business) for 2016 Q1-Q3
Ranked No. 1 among domestic brands
with market share of 30.0%
2016 Q3 Results Page 18
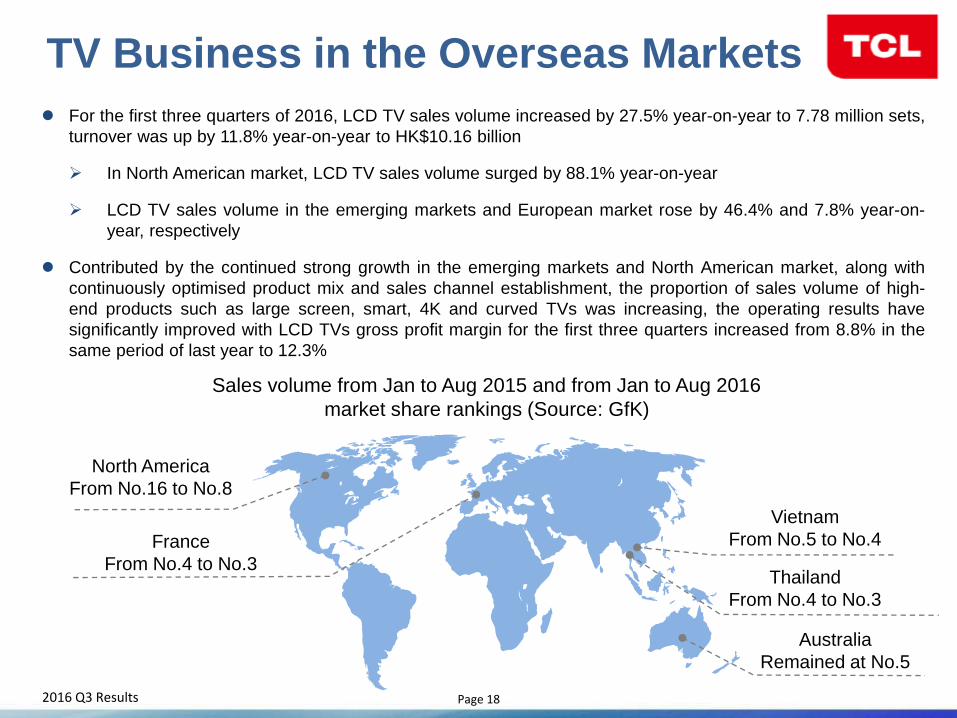
TV Business in the Overseas Markets
For the first three quarters of 2016, LCD TV sales volume increased by 27.5% year-on-year to 7.78 million sets,
turnover was up by 11.8% year-on-year to HK$10.16 billion
In North American market, LCD TV sales volume surged by 88.1% year-on-year
LCD TV sales volume in the emerging markets and European market rose by 46.4% and 7.8% year-on-
year, respectively
Contributed by the continued strong growth in the emerging markets and North American market, along with
continuously optimised product mix and sales channel establishment, the proportion of sales volume of high-
end products such as large screen, smart, 4K and curved TVs was increasing, the operating results have
significantly improved with LCD TVs gross profit margin for the first three quarters increased from 8.8% in the
same period of last year to 12.3%
North America
From No.16 to No.8
Australia
Remained at No.5
Sales volume from Jan to Aug 2015 and from Jan to Aug 2016
market share rankings (Source: GfK)
Thailand
From No.4 to No.3
Vietnam
From No.5 to No.4 France
From No.4 to No.3
2016 Q3 Results Page 19
1,459 1,575 1,613
1,668 1,745 1,813
1,864 1,938
2,001
2,026
2,191 2,269 2,560 2,825 2,900 3,153 3,319 3,440 3,570 3,772 3,965
4,395 4,581 4,801
5,237 5,777
5,762 5,913
6,087 6,245
6,354
6,546 6,735
376 154 169 178 191 164 169 174 194 223 226 256 386
411 226 421 442 429 469 517 544 457 391 484 721 508 345 364 351 344 394 395 398 376 530 699 877 1,068
1,231 1,400 1,575 1,769 1,992
2,218 2,474 2,860
3,271 3,497 3,919
4,361 4,790
5,259 5,777
6,321 6,777
7,168 7,652
8,373 8,881
9,226 9,590
9,941 10,285
10,678 11,074
11,471
4,648
4,802 4,971 5,149 5,340
5,504 5,673 5,847 6,041 6,264
6,490 6,747 7,132 7,544
7,770 8,192 8,634
9,063 9,532
10,050 10,593
11,050 11,441 11,925
12,646
13,155 13,500
13,864 14,214
14,558 14,952
15,347 15,745
-
1,000
2,000
3,000
4,000
5,000
6,000
7,000
8,000
9,000
10,000
11,000
12,000
13,000
14,000
15,000
16,000
17,000
Jan Feb Mar Apr May Jun Jul Aug Sep Oct Nov Dec Jan Feb Mar Apr May Jun Jul Aug Sep Oct Nov Dec Jan Feb Mar Apr May Jun Jul Aug Sep
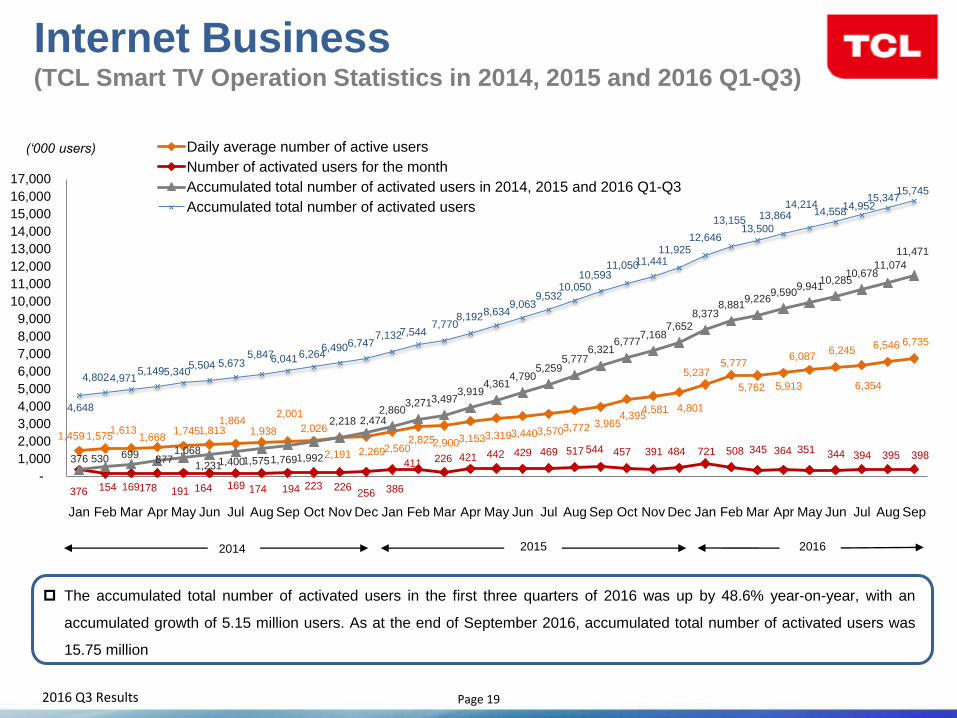
Daily average number of active users
Number of activated users for the month
Accumulated total number of activated users in 2014, 2015 and 2016 Q1-Q3
Accumulated total number of activated users
2014 2015
(‘000 users)
The accumulated total number of activated users in the first three quarters of 2016 was up by 48.6% year-on-year, with an
accumulated growth of 5.15 million users. As at the end of September 2016, accumulated total number of activated users was
15.75 million
Internet Business (TCL Smart TV Operation Statistics in 2014, 2015 and 2016 Q1-Q3)
2016
2016 Q3 Results Page 20
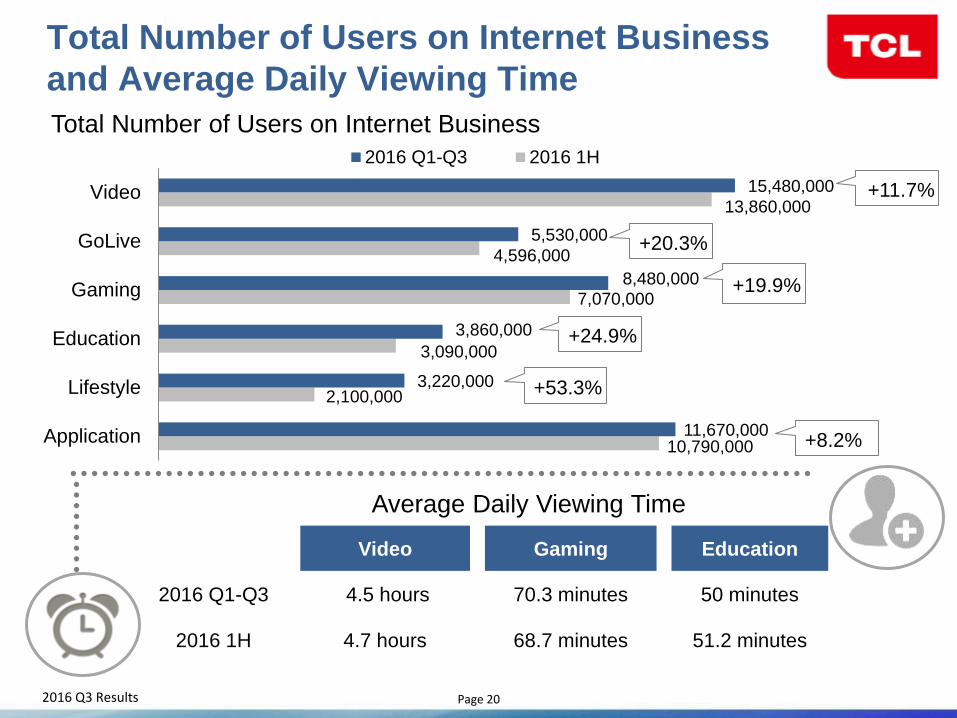
10,790,000
2,100,000
3,090,000
7,070,000
4,596,000
13,860,000
11,670,000
3,220,000
3,860,000
8,480,000
5,530,000
15,480,000
Application
Lifestyle
Education
Gaming
GoLive
Video
2016 Q1-Q3 2016 1H
+19.9%
+20.3%
+8.2%
Total Number of Users on Internet Business
and Average Daily Viewing Time
+24.9%
+11.7%
+53.3%
Average Daily Viewing Time
Video Gaming Education
2016 Q1-Q3 4.5 hours 70.3 minutes 50 minutes
2016 1H 4.7 hours 68.7 minutes 51.2 minutes
Total Number of Users on Internet Business
2016 Q3 Results Page 21
TCL 2016 Autumn New Product Launch Presentation
– TCL•XESS
2016 Q3 Results Page 22
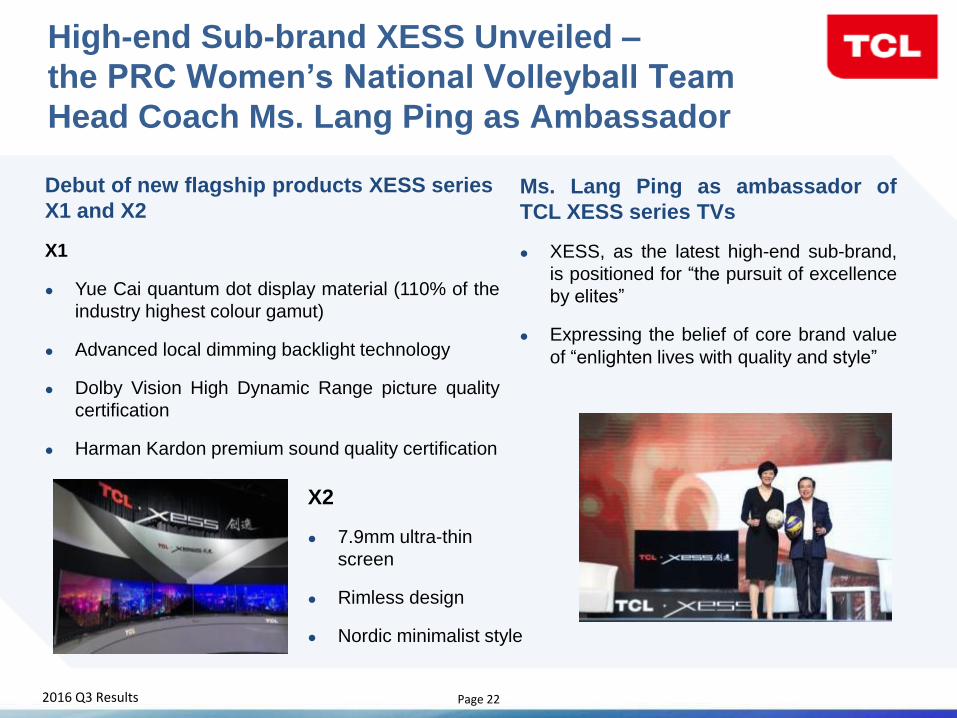
High-end Sub-brand XESS Unveiled –
the PRC Women’s National Volleyball Team
Head Coach Ms. Lang Ping as Ambassador
Ms. Lang Ping as ambassador of
TCL XESS series TVs
XESS, as the latest high-end sub-brand,
is positioned for “the pursuit of excellence
by elites”
Expressing the belief of core brand value
of “enlighten lives with quality and style”
X1
Yue Cai quantum dot display material (110% of the
industry highest colour gamut)
Advanced local dimming backlight technology
Dolby Vision High Dynamic Range picture quality
certification
Harman Kardon premium sound quality certification
Debut of new flagship products XESS series
X1 and X2
X2
7.9mm ultra-thin
screen
Rimless design
Nordic minimalist style

2016 Q3 Results Page 23
Outlook
2016 Q3 Results Page 24
0
10,000
20,000
30,000
40,000
50,000
60,000
70,000
Japan NorthAmerica
WesternEurope
EasternEurope
The PRC Asia Pacific LatinAmerica
Middle Eastand Africa
2014 Actual 2015 Actual 2016 2017 2018 2019
3.2%
5.7%
-5.2%
-0.7%
3.4%
1.6%
-1.6%
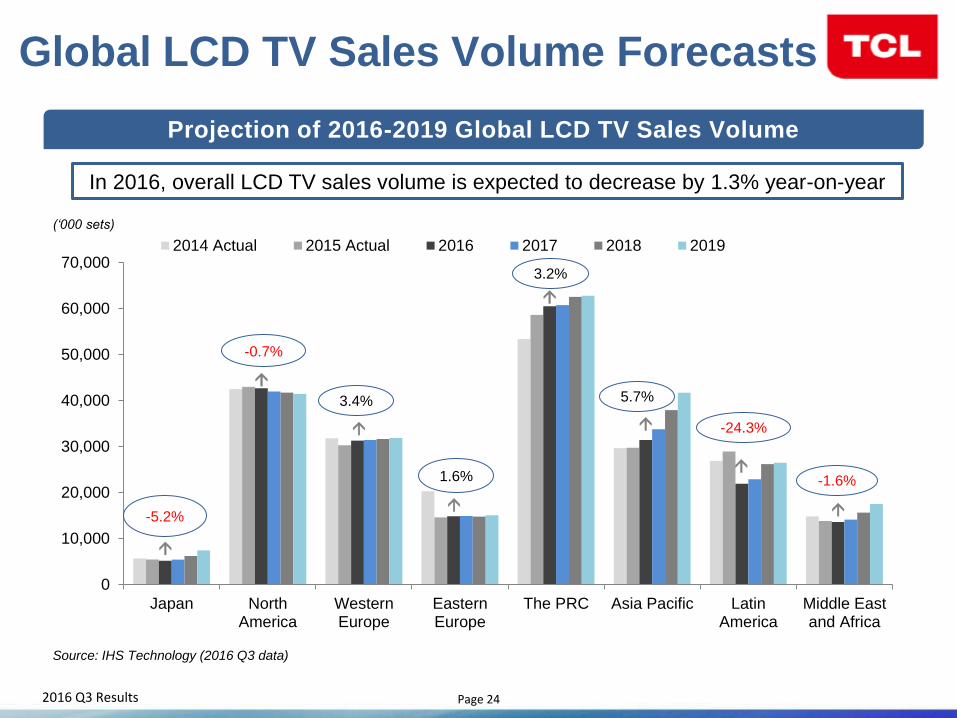
Global LCD TV Sales Volume Forecasts
Projection of 2016-2019 Global LCD TV Sales Volume
-24.3%
In 2016, overall LCD TV sales volume is expected to decrease by 1.3% year-on-year
Source: IHS Technology (2016 Q3 data)
(‘000 sets)
2016 Q3 Results Page 25
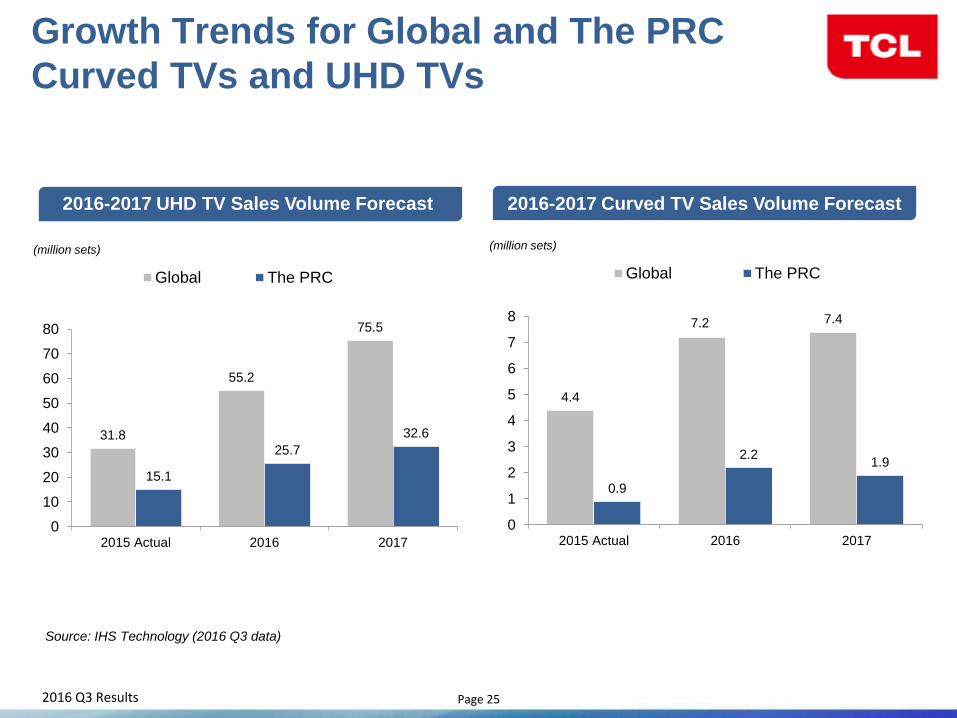
31.8
55.2
75.5
15.1
25.7
32.6
0
10
20
30
40
50
60
70
80
2015 Actual 2016 2017
Global The PRC
4.4
7.2 7.4
0.9
2.2 1.9
0
1
2
3
4
5
6
7
8
2015 Actual 2016 2017
Global The PRC
Growth Trends for Global and The PRC
Curved TVs and UHD TVs
2016-2017 Curved TV Sales Volume Forecast
2016-2017 UHD TV Sales Volume Forecast
(million sets) (million sets)
Source: IHS Technology (2016 Q3 data)
2016 Q3 Results Page 26
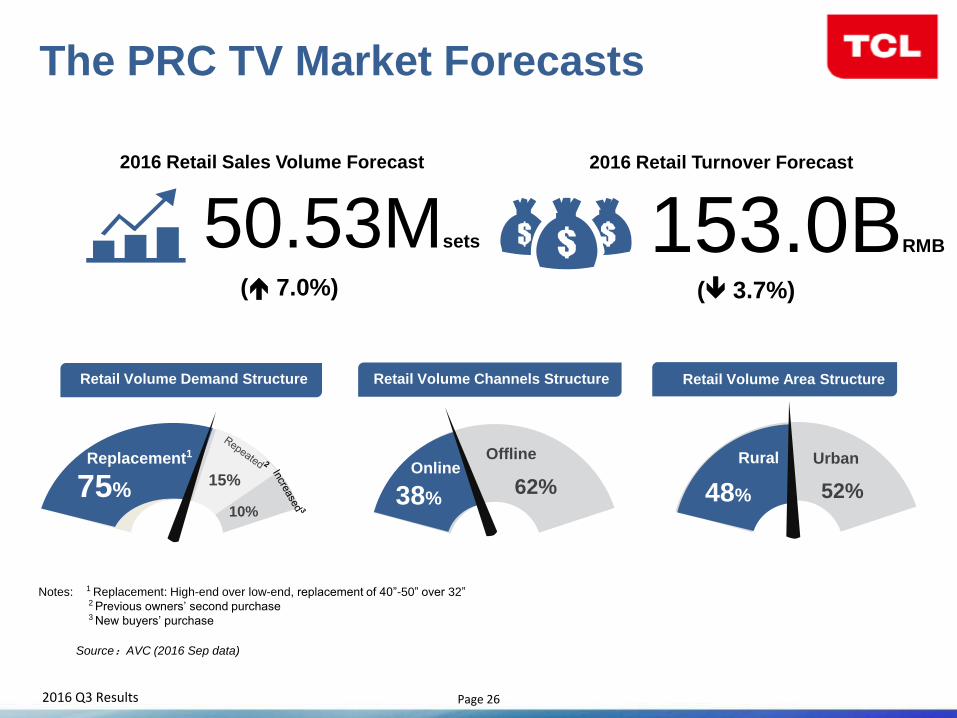
The PRC TV Market Forecasts
153.0BRMB
( 3.7%)
50.53Msets
( 7.0%)
2016 Retail Sales Volume Forecast 2016 Retail Turnover Forecast
Retail Volume Demand Structure Retail Volume Channels Structure Retail Volume Area Structure
10%
75% 15%
Offline
62% 38%
Urban
52% 48%
Replacement1
Online Rural
Notes: 1 Replacement: High-end over low-end, replacement of 40”-50” over 32” 2 Previous owners’ second purchase 3 New buyers’ purchase
Source:AVC (2016 Sep data)
2016 Q3 Results Page 27
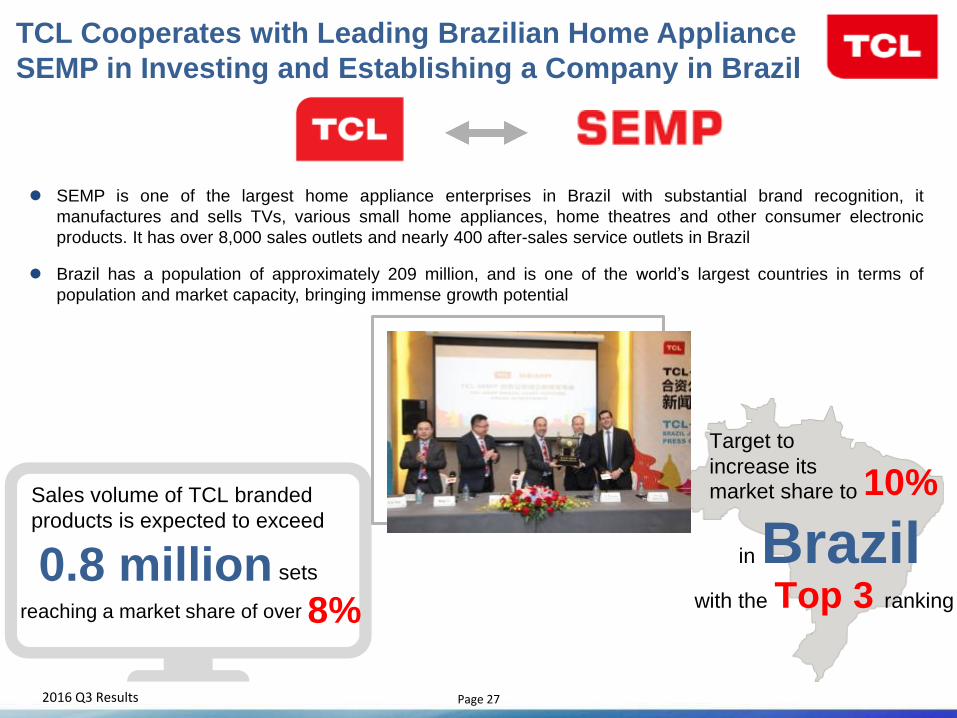
SEMP is one of the largest home appliance enterprises in Brazil with substantial brand recognition, it
manufactures and sells TVs, various small home appliances, home theatres and other consumer electronic
products. It has over 8,000 sales outlets and nearly 400 after-sales service outlets in Brazil
Brazil has a population of approximately 209 million, and is one of the world’s largest countries in terms of
population and market capacity, bringing immense growth potential
Sales volume of TCL branded
products is expected to exceed
0.8 million reaching a market share of over
sets
Target to
increase its
market share to 10%
TCL Cooperates with Leading Brazilian Home Appliance
SEMP in Investing and Establishing a Company in Brazil
in Brazil with the Top 3 ranking 8%
2016 Q3 Results Page 28
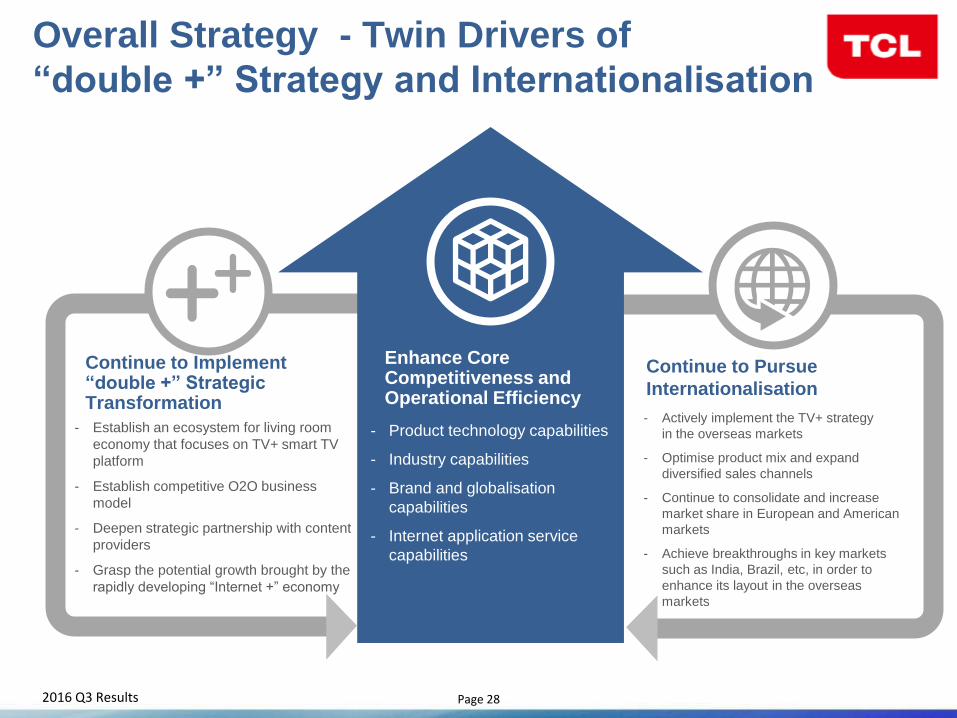
Overall Strategy - Twin Drivers of
“double +” Strategy and Internationalisation
Continue to Implement “double +” Strategic Transformation
Continue to Pursue
Internationalisation
- Establish an ecosystem for living room
economy that focuses on TV+ smart TV
platform
- Establish competitive O2O business
model
- Deepen strategic partnership with content
providers
- Grasp the potential growth brought by the
rapidly developing “Internet +” economy
- Product technology capabilities
- Industry capabilities
- Brand and globalisation
capabilities
- Internet application service
capabilities
- Actively implement the TV+ strategy
in the overseas markets
- Optimise product mix and expand
diversified sales channels
- Continue to consolidate and increase
market share in European and American
markets
- Achieve breakthroughs in key markets
such as India, Brazil, etc, in order to
enhance its layout in the overseas
markets
Enhance Core Competitiveness and Operational Efficiency
2016 Q3 Results Page 29
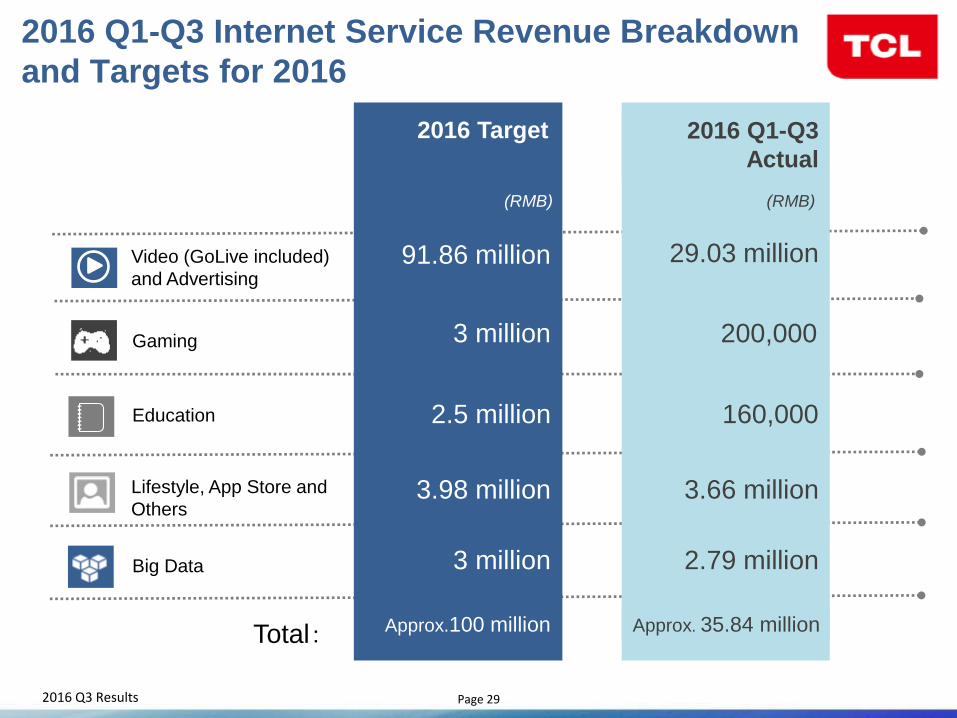
2016 Q1-Q3 Internet Service Revenue Breakdown
and Targets for 2016
29.03 million
200,000
160,000
(RMB)
3.66 million
2016 Q1-Q3
Actual
Approx. 35.84 million
Video (GoLive included)
and Advertising
Gaming
Education
Lifestyle, App Store and
Others
Big Data
Total:
2.79 million
91.86 million
3 million
2.5 million
(RMB)
3 million
2016 Target
Approx.100 million
3.98 million
2016 Q3 Results Page 30
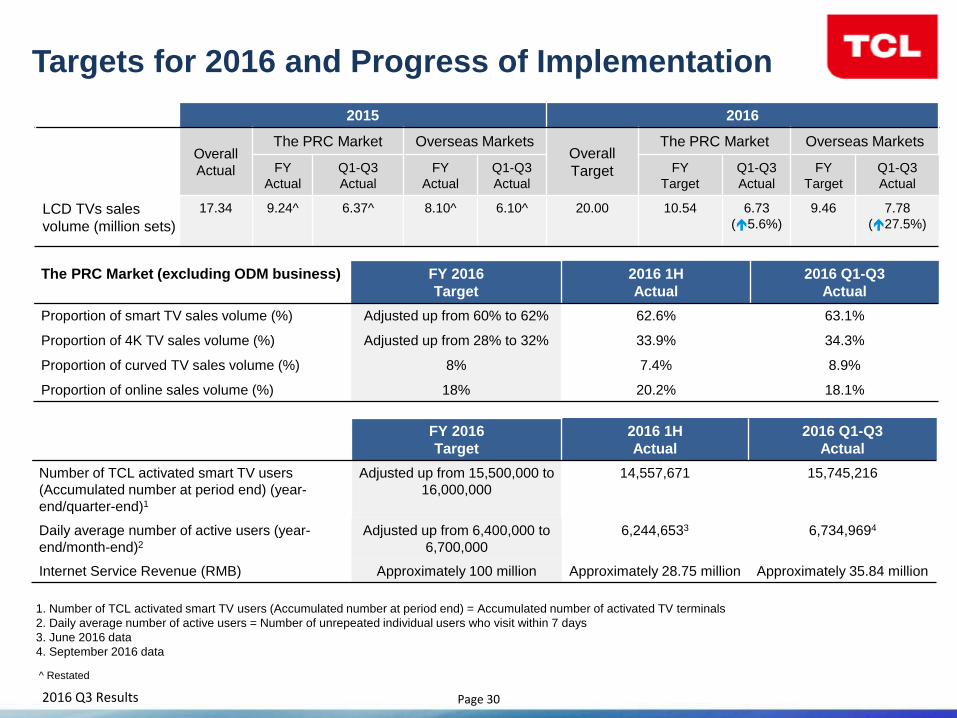
1. Number of TCL activated smart TV users (Accumulated number at period end) = Accumulated number of activated TV terminals
2. Daily average number of active users = Number of unrepeated individual users who visit within 7 days
3. June 2016 data
4. September 2016 data
The PRC Market (excluding ODM business) FY 2016
Target
2016 1H
Actual
2016 Q1-Q3
Actual
Proportion of smart TV sales volume (%)
Proportion of 4K TV sales volume (%)
Proportion of curved TV sales volume (%)
Proportion of online sales volume (%)
Adjusted up from 60% to 62%
Adjusted up from 28% to 32%
8%
18%
62.6%
33.9%
7.4%
20.2%
63.1%
34.3%
8.9%
18.1%
Targets for 2016 and Progress of Implementation
2015 2016
Overall
Actual
The PRC Market Overseas Markets Overall
Target
The PRC Market Overseas Markets
FY
Actual
Q1-Q3
Actual
FY
Actual
Q1-Q3
Actual
FY
Target
Q1-Q3
Actual
FY
Target
Q1-Q3
Actual
LCD TVs sales
volume (million sets)
17.34 9.24^ 6.37^ 8.10^
6.10^ 20.00 10.54 6.73
(5.6%)
9.46 7.78
(27.5%)
^ Restated
FY 2016
Target
2016 1H
Actual
2016 Q1-Q3
Actual
Number of TCL activated smart TV users
(Accumulated number at period end) (year-
end/quarter-end)1
Adjusted up from 15,500,000 to
16,000,000
14,557,671 15,745,216
Daily average number of active users (year-
end/month-end)2
Adjusted up from 6,400,000 to
6,700,000
6,244,6533 6,734,9694
Internet Service Revenue (RMB) Approximately 100 million Approximately 28.75 million Approximately 35.84 million
2016 Q3 Results Page 31
The information contained herein should not be utilised for any legal purposes with regards to any
investor's investment decision or results. In particular, this document does not constitute any
recommendation or invitation for subscribing for or sale and purchase of any securities in TCL
Multimedia Technology Holdings Limited (the “Company”). The Company hereby expressly
disclaims any liability for any loss or damage resulting from or in connection with any reliance by
any investor on the information contained herein.
A number of forward-looking statements may be made from this presentation. Forward-looking
statements are statements that are not historical facts. These forward-looking statements are
based on the current expectations of the Company and there can be no assurance that such
expectations will prove to be correct. Because forward-looking statements involve risks and
uncertainties, the Company’s actual results could differ materially from these statements.
Disclaimer
2016 Q3 Results Page 32
Q&A
Stock Code:01070