Embed Size (px)
Citation preview
8/16/2019 2016 Q1 Commercial Real Estate Market Survey
http://slidepdf.com/reader/full/2016-q1-commercial-real-estate-market-survey 1/14
COMMERCIAL REAL ESTATEMARKET TRENDS: Q1.2016
National Association of REALTORS®
8/16/2019 2016 Q1 Commercial Real Estate Market Survey
http://slidepdf.com/reader/full/2016-q1-commercial-real-estate-market-survey 2/14
2
Commercial Real Estate Market Trends: Q1.2016
Download: www.realtor.org/research-and-statistics/commercial-real-estate-market-survey
©2016 | NATIONAL ASSOCIATION OF REALTORS®
All Rights Reserved.
Reproduction, reprinting or retransmission in any form is prohibited without written permission. Although the information presented in this survey has been obtained from reliable sources, NARdoes not guarantee its accuracy, and such information may be incomplete. This report is forinformation purposes only.
8/16/2019 2016 Q1 Commercial Real Estate Market Survey
http://slidepdf.com/reader/full/2016-q1-commercial-real-estate-market-survey 3/14
MAY 2016
COMMERCIAL REAL ESTATE MARKET TRENDS | Q1.2016
3ATIONAL ASSOCIATION of REALTORS® | RESEARCH DIVISION | www.realtors.org/research-and-statistics
ATIONAL ASSOCIATION OF REALTORS ®
16 OFFICERS
residentom Salomone
resident-Electll Brown
rst Vice Presidentizabeth Mendenhall, GRI, ABR, ABRM,PS, CRB, PMN
easurer
ichael McGrew, CRB, CRS
mmediate Past-Presidenthris Polychron, CIPS, CRS, GRI
ce Presidentichael Labout, GRI
ce President
herri Meadows, GRI, CIPS, CRB, PMN
hief Executive Officerale Stinton, CAE, CPA, CMA, RCE
8/16/2019 2016 Q1 Commercial Real Estate Market Survey
http://slidepdf.com/reader/full/2016-q1-commercial-real-estate-market-survey 4/14
MAY 2016
COMMERCIAL REAL ESTATE MARKET TRENDS | Q1.2016
4ATIONAL ASSOCIATION of REALTORS® | RESEARCH DIVISION | www.realtors.org/research-and-statistics
CONTENTS
1 | Introduction……………………………………………………………………………………………
2 | Survey Highlights..…………………………………………………………………………………..
3 | Investment Sales ………..…………..………………………………………………………………
4 | Leasing Fundamentals …………………………………………………………………………..
5 | Comments……………………………………………………………………………………………….
5
6
7
9
11
8/16/2019 2016 Q1 Commercial Real Estate Market Survey
http://slidepdf.com/reader/full/2016-q1-commercial-real-estate-market-survey 5/145
MAY 2016
COMMERCIAL REAL ESTATE MARKET TRENDS | Q1.2016
ATIONAL ASSOCIATION of REALTORS® | RESEARCH DIVISION | www.realtors.org/research-and-statistics
troduction
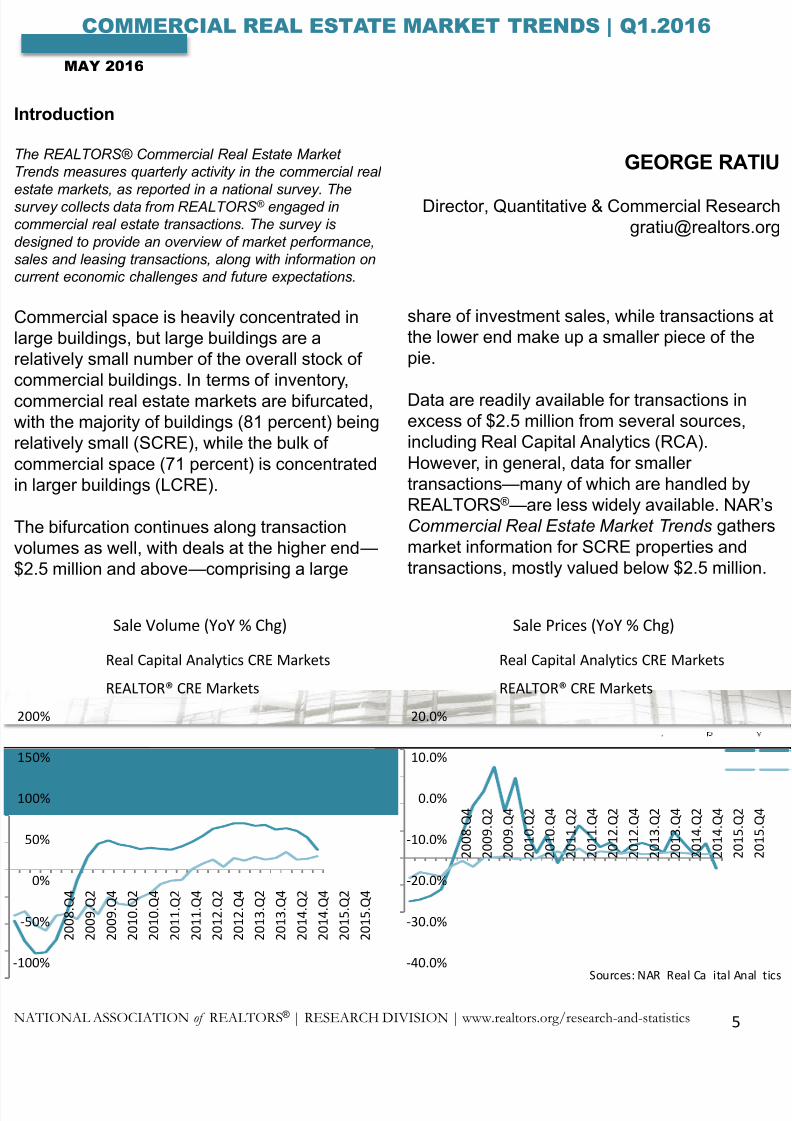
e REALTORS® Commercial Real Estate Marketends measures quarterly activity in the commercial real
ate markets, as reported in a national survey. Thervey collects data from REALTORS® engaged inmmercial real estate transactions. The survey issigned to provide an overview of market performance,es and leasing transactions, along with information onrrent economic challenges and future expectations.
ommercial space is heavily concentrated inge buildings, but large buildings are aatively small number of the overall stock ofmmercial buildings. In terms of inventory,mmercial real estate markets are bifurcated,th the majority of buildings (81 percent) beingatively small (SCRE), while the bulk ofmmercial space (71 percent) is concentratedlarger buildings (LCRE).
e bifurcation continues along transactionlumes as well, with deals at the higher end—
.5 million and above—comprising a large
share of investment sales, while transactions athe lower end make up a smaller piece of thepie.
Data are readily available for transactions inexcess of $2.5 million from several sources,including Real Capital Analytics (RCA).However, in general, data for smallertransactions—many of which are handled byREALTORS®—are less widely available. NAR’
Commercial Real Estate Market Trends gathermarket information for SCRE properties andtransactions, mostly valued below $2.5 million
GEORGE RATI
Director, Quantitative & Commercial [email protected]
0%
0%
0%
0%
0%
0%
0%
2 0 0 8 . Q 4
2 0 0 9 . Q 2
2 0 0 9 . Q 4
2 0 1 0 . Q 2
2 0 1 0 . Q 4
2 0 1 1 . Q 2
2 0 1 1 . Q 4
2 0 1 2 . Q 2
2 0 1 2 . Q 4
2 0 1 3 . Q 2
2 0 1 3 . Q 4
2 0 1 4 . Q 2
2 0 1 4 . Q 4
2 0 1 5 . Q 2
2 0 1 5 . Q 4
Sale Volume (YoY % Chg)
Real Capital Analytics CRE Markets
REALTOR® CRE Markets
-40.0%
-30.0%
-20.0%
-10.0%
0.0%
10.0%
20.0%
2 0 0 8 . Q 4
2 0 0 9 . Q 2
2 0 0 9 . Q 4
2 0 1 0 . Q 2
2 0 1 0 . Q 4
2 0 1 1 . Q 2
2 0 1 1 . Q 4
2 0 1 2 . Q 2
2 0 1 2 . Q 4
2 0 1 3 . Q 2
2 0 1 3 . Q 4
2 0 1 4 . Q 2
2 0 1 4 . Q 4
2 0 1 5 . Q 2
2 0 1 5 . Q 4
Sale Prices (YoY % Chg)
Real Capital Analytics CRE Markets
REALTOR® CRE Markets
Sources: NAR Real Ca ital Anal t
8/16/2019 2016 Q1 Commercial Real Estate Market Survey
http://slidepdf.com/reader/full/2016-q1-commercial-real-estate-market-survey 6/146
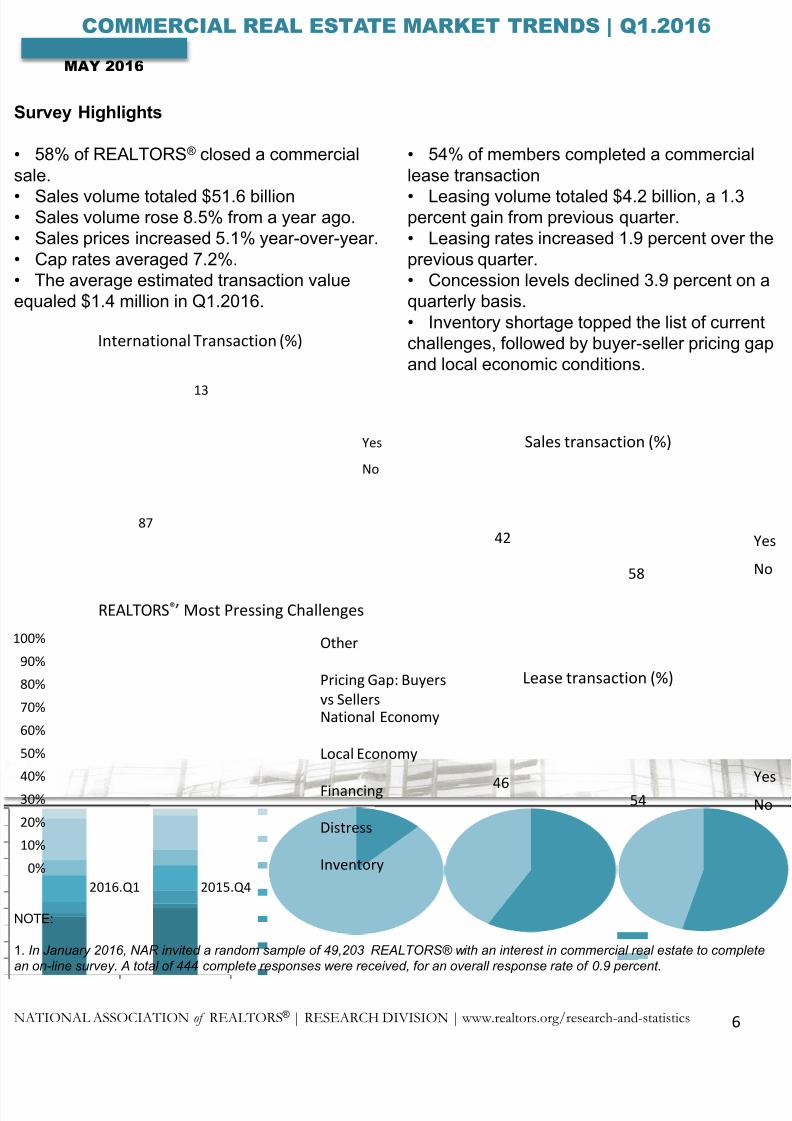
urvey Highlights
58% of REALTORS® closed a commercialle.
Sales volume totaled $51.6 billionSales volume rose 8.5% from a year ago.Sales prices increased 5.1% year-over-year.Cap rates averaged 7.2%.The average estimated transaction valueualed $1.4 million in Q1.2016.
TE:
n January 2016, NAR invited a random sample of 49,203 REALTORS® with an interest in commercial real estate to completeon-line survey. A total of 444 complete responses were received, for an overall response rate of 0.9 percent.
MAY 2016
COMMERCIAL REAL ESTATE MARKET TRENDS | Q1.2016
ATIONAL ASSOCIATION of REALTORS® | RESEARCH DIVISION | www.realtors.org/research-and-statistics
• 54% of members completed a commerciallease transaction
• Leasing volume totaled $4.2 billion, a 1.3percent gain from previous quarter.• Leasing rates increased 1.9 percent over thprevious quarter.• Concession levels declined 3.9 percent on aquarterly basis.• Inventory shortage topped the list of currentchallenges, followed by buyer-seller pricing gaand local economic conditions.
5446
Lease transaction (%)
Ye
N
58
42
Sales transaction (%)
Ye
N
0%
0%
0%
0%
0%
0%
0%
0%
0%
0%
0%
2016.Q1 2015.Q4
REALTORS®’ Most Pressing Challenges
Other
Pricing Gap: Buyers
vs SellersNational Economy
Local Economy
Financing
Distress
Inventory
13
87
International Transaction (%)
Yes
No
8/16/2019 2016 Q1 Commercial Real Estate Market Survey
http://slidepdf.com/reader/full/2016-q1-commercial-real-estate-market-survey 7/14
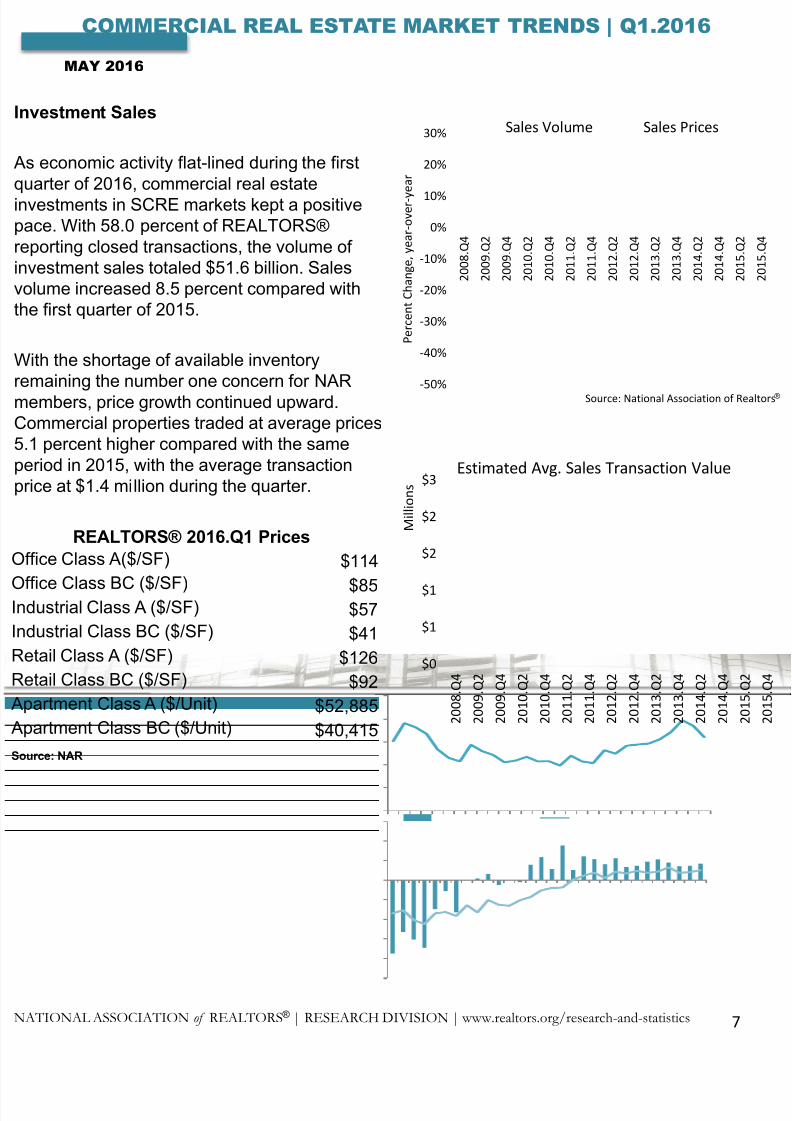
vestment Sales
economic activity flat-lined during the firstarter of 2016, commercial real estate
vestments in SCRE markets kept a positivece. With 58.0 percent of REALTORS®porting closed transactions, the volume ofvestment sales totaled $51.6 billion. Saleslume increased 8.5 percent compared withe first quarter of 2015.
th the shortage of available inventorymaining the number one concern for NARembers, price growth continued upward.ommercial properties traded at average prices1 percent higher compared with the sameriod in 2015, with the average transactionce at $1.4 million during the quarter.
7
MAY 2016
COMMERCIAL REAL ESTATE MARKET TRENDS | Q1.2016
ATIONAL ASSOCIATION of REALTORS® | RESEARCH DIVISION | www.realtors.org/research-and-statistics
REALTORS® 2016.Q1 Prices
fice Class A($/SF) $114
fice Class BC ($/SF) $85dustrial Class A ($/SF) $57
dustrial Class BC ($/SF) $41
tail Class A ($/SF) $126
tail Class BC ($/SF) $92
artment Class A ($/Unit) $52,885
artment Class BC ($/Unit) $40,415
rce: NAR
-50%
-40%
-30%
-20%
-10%
0%
10%
20%
30%
2 0 0 8 . Q 4
2 0 0 9 . Q 2
2 0 0 9 . Q 4
2 0 1 0 . Q 2
2 0 1 0 . Q 4
2 0 1 1 . Q 2
2 0 1 1 . Q 4
2 0 1 2 . Q 2
2 0 1 2 . Q 4
2 0 1 3 . Q 2
2 0 1 3 . Q 4
2 0 1 4 . Q 2
2 0 1 4 . Q 4
2 0 1 5 . Q 2
2 0 1 5 Q 4
P e r c e n t C h a n g e , y e a r - o v e r - y
e a r
Sales Volume Sales Prices
Source: National Association of Realto
$0
$1
$1
$2
$2
$3
2 0 0 8 . Q 4
2 0 0 9 . Q 2
2 0 0 9 . Q 4
2 0 1 0 . Q 2
2 0 1 0 . Q 4
2 0 1 1 . Q 2
2 0 1 1 . Q 4
2 0 1 2 . Q 2
2 0 1 2 . Q 4
2 0 1 3 . Q 2
2 0 1 3 . Q 4
2 0 1 4 . Q 2
2 0 1 4 . Q 4
2 0 1 5 . Q 2
2 0 1 5 Q 4
M i l l i o n s
Estimated Avg. Sales Transaction Value
8/16/2019 2016 Q1 Commercial Real Estate Market Survey
http://slidepdf.com/reader/full/2016-q1-commercial-real-estate-market-survey 8/14
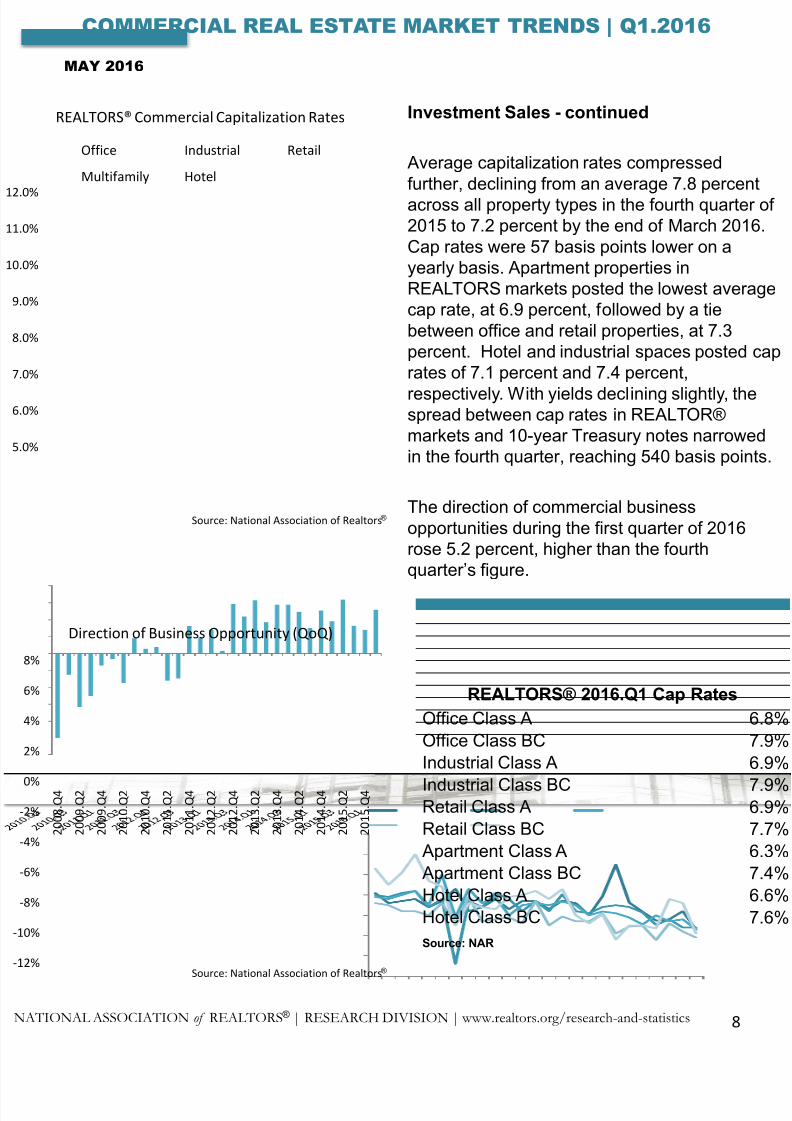
Investment Sales - continued
Average capitalization rates compressedfurther, declining from an average 7.8 percentacross all property types in the fourth quarter o2015 to 7.2 percent by the end of March 2016.Cap rates were 57 basis points lower on ayearly basis. Apartment properties inREALTORS markets posted the lowest averagcap rate, at 6.9 percent, followed by a tiebetween office and retail properties, at 7.3percent. Hotel and industrial spaces posted carates of 7.1 percent and 7.4 percent,
respectively. With yields declining slightly, thespread between cap rates in REALTOR®markets and 10-year Treasury notes narrowedin the fourth quarter, reaching 540 basis points
The direction of commercial businessopportunities during the first quarter of 2016rose 5.2 percent, higher than the fourthquarter’s figure.
8
MAY 2016
COMMERCIAL REAL ESTATE MARKET TRENDS | Q1.2016
ATIONAL ASSOCIATION of REALTORS® | RESEARCH DIVISION | www.realtors.org/research-and-statistics
REALTORS® 2016.Q1 Cap Rates
Office Class A 6.
Office Class BC 7.
Industrial Class A 6.
Industrial Class BC 7.Retail Class A 6.
Retail Class BC 7.
Apartment Class A 6.
Apartment Class BC 7.
Hotel Class A 6.
Hotel Class BC 7.
Source: NAR
%
%
%
%
%
%
%
%
REALTORS® Commercial Capitalization Rates
Office Industrial Retail
Multifamily Hotel
Source: National Association of Realtors®
%
%
%
%
%
%
%
%
%
%
%
2 0 0 8 . Q 4
2 0 0 9 . Q 2
2 0 0 9 . Q 4
2 0 1 0 . Q 2
2 0 1 0 . Q 4
2 0 1 1 . Q 2
2 0 1 1 . Q 4
2 0 1 2 . Q 2
2 0 1 2 . Q 4
2 0 1 3 . Q 2
2 0 1 3 . Q 4
2 0 1 4 . Q 2
2 0 1 4 . Q 4
2 0 1 5 . Q 2
2 0 1 5 . Q 4
Direction of Business Opportunity (QoQ)
Source: National Association of Realtors®
8/16/2019 2016 Q1 Commercial Real Estate Market Survey
http://slidepdf.com/reader/full/2016-q1-commercial-real-estate-market-survey 9/149
MAY 2016
COMMERCIAL REAL ESTATE MARKET TRENDS | Q1.2016
ATIONAL ASSOCIATION of REALTORS® | RESEARCH DIVISION | www.realtors.org/research-and-statistics
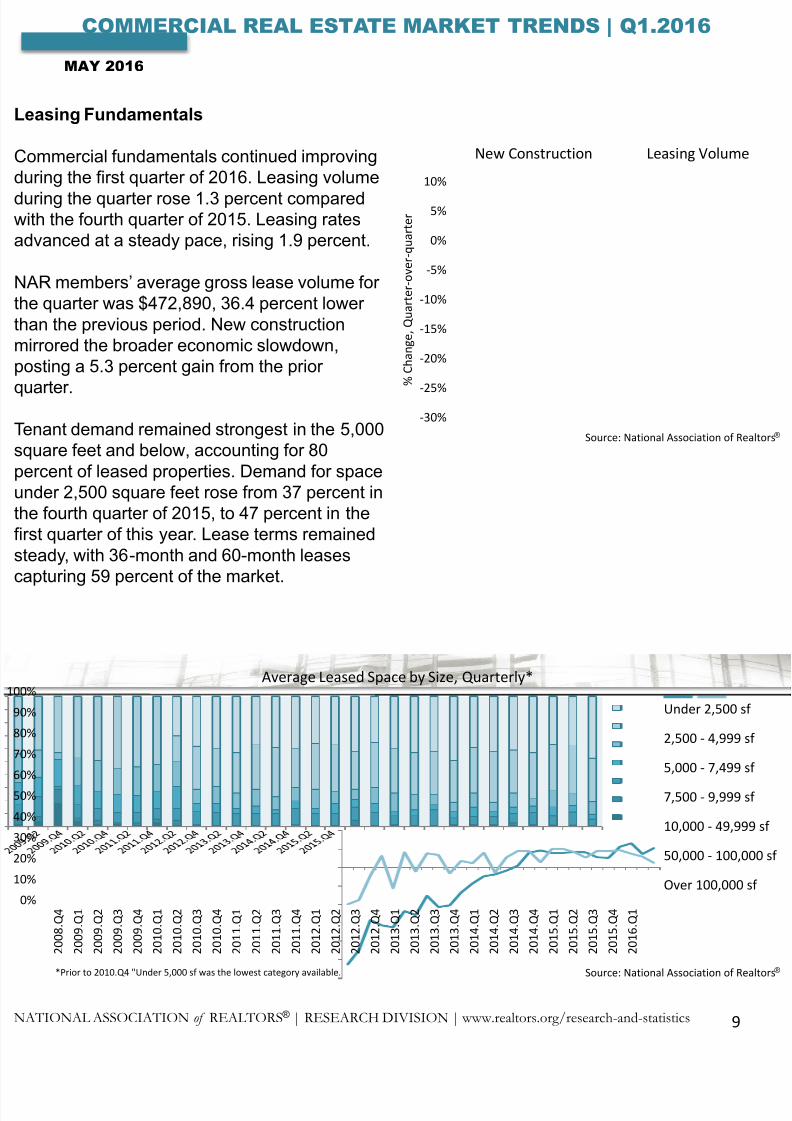
asing Fundamentals
ommercial fundamentals continued improvingring the first quarter of 2016. Leasing volume
ring the quarter rose 1.3 percent comparedth the fourth quarter of 2015. Leasing ratesvanced at a steady pace, rising 1.9 percent.
AR members’ average gross lease volume for
e quarter was $472,890, 36.4 percent loweran the previous period. New constructionrrored the broader economic slowdown,sting a 5.3 percent gain from the prior
arter.
nant demand remained strongest in the 5,000uare feet and below, accounting for 80rcent of leased properties. Demand for spaceder 2,500 square feet rose from 37 percent in
e fourth quarter of 2015, to 47 percent in thest quarter of this year. Lease terms remainedeady, with 36-month and 60-month leasespturing 59 percent of the market.
-30%
-25%
-20%
-15%
-10%
-5%
0%
5%
10%
% C h a n g e , Q u a r t e r - o v e r - q u a r t e r
New Construction Leasing Volume
Source: National Association of Realto
%
%
%
%
%
%
%
%
%
%
%
2 0 0 8 . Q 4
2 0 0 9 . Q 1
2 0 0 9 . Q 2
2 0 0 9 . Q 3
2 0 0 9 . Q 4
2 0 1 0 . Q 1
2 0 1 0 . Q 2
2 0 1 0 . Q 3
2 0 1 0 . Q 4
2 0 1 1 . Q 1
2 0 1 1 . Q 2
2 0 1 1 . Q 3
2 0 1 1 . Q 4
2 0 1 2 . Q 1
2 0 1 2 . Q 2
2 0 1 2 . Q 3
2 0 1 2 . Q 4
2 0 1 3 . Q 1
2 0 1 3 . Q 2
2 0 1 3 . Q 3
2 0 1 3 . Q 4
2 0 1 4 . Q 1
2 0 1 4 . Q 2
2 0 1 4 . Q 3
2 0 1 4 . Q 4
2 0 1 5 . Q 1
2 0 1 5 . Q 2
2 0 1 5 . Q 3
2 0 1 5 . Q 4
2 0 1 6 . Q 1
Average Leased Space by Size, Quarterly*
Under 2,500 sf
2,500 - 4,999 sf
5,000 - 7,499 sf
7,500 - 9,999 sf
10,000 - 49,999 s
50,000 - 100,000
Over 100,000 sf
Source: National Association of Realto*Prior to 2010.Q4 "Under 5,000 sf was the lowest category available.
8/16/2019 2016 Q1 Commercial Real Estate Market Survey
http://slidepdf.com/reader/full/2016-q1-commercial-real-estate-market-survey 10/1410
MAY 2016
COMMERCIAL REAL ESTATE MARKET TRENDS | Q1.2016
ATIONAL ASSOCIATION of REALTORS® | RESEARCH DIVISION | www.realtors.org/research-and-statistics
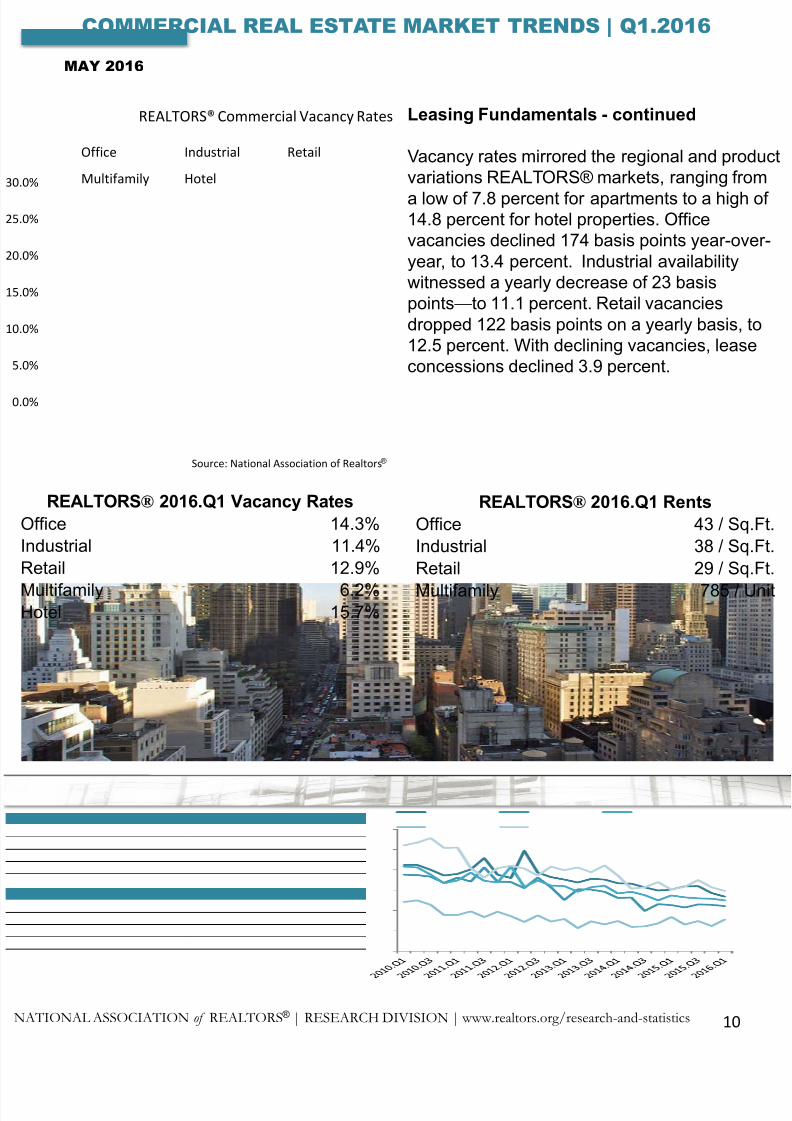
Leasing Fundamentals - continued
Vacancy rates mirrored the regional and produvariations REALTORS® markets, ranging from
a low of 7.8 percent for apartments to a high o14.8 percent for hotel properties. Officevacancies declined 174 basis points year-overyear, to 13.4 percent. Industrial availabilitywitnessed a yearly decrease of 23 basispoints—to 11.1 percent. Retail vacanciesdropped 122 basis points on a yearly basis, to12.5 percent. With declining vacancies, leaseconcessions declined 3.9 percent.
REALTORS® 2016.Q1 Vacancy Rates
ffice 14.3%
dustrial 11.4%
etail 12.9%
ultifamily 6.2%otel 15.7%
REALTORS® 2016.Q1 Rents
Office 43 / Sq.F
Industrial 38 / Sq.F
Retail 29 / Sq.F
Multifamily 785 / Un
%
%
%
%
%
%
%
REALTORS® Commercial Vacancy Rates
Office Industrial Retail
Multifamily Hotel
Source: National Association of Realtors®

8/16/2019 2016 Q1 Commercial Real Estate Market Survey
http://slidepdf.com/reader/full/2016-q1-commercial-real-estate-market-survey 11/1411
MAY 2016
COMMERCIAL REAL ESTATE MARKET TRENDS | Q1.2016
ATIONAL ASSOCIATION of REALTORS® | RESEARCH DIVISION | www.realtors.org/research-and-statistics
omments
e REALTORS® Commercial Real Estateuarterly Market Survey asks participants to
mment on current conditions in their markets.elow are selected remarks about the latestarket environment.
million s.f. of non-speculative will be delivered byar end which will cause vacancy rates to increase.
ittle slower in leasing the third generation space
ommercial activity is increasing. The quality of thenant seems to be a challenge. We need jobs tod that sweet spot.
ommercial market is still soft, but the industrialarket is steady with the smaller industrialsoperties increasing in value.
ue to the Clean Air Act and Dodd-Frank legislation,r markets in Southwest Virginia are severelympered with job loss, Norfolk Southern leaving
oanoke, and the smaller banks are not able tompete.
ontinue to be amazed at the amount of space inproduct types that remains vacant due toerpricing, as compared by allowing lower entryces for a tenant in the effort to mature the lease tostronger rate over several years. The trade-offtween future income at a higher level and more-rrent income at a lower level is way out of balance
d creates a higher vacancy and collection lossvel in the market.
wrote 3 contracts in the first quarter which will notse until later in the year. A very good start to16 for a land sales broker.
creased demand for medical facilities due toowing retirement population, potential to becomesecondary industrial distribution center, growing
ernational air traffic.
Interest rates, workers comp insurance, and veryhigh property tax rates continue to plague ourmarket place.
Internet sales are beginning to affect demand forbrick and mortar retail shops coupled with pooreconomy. We receive very few inquiries from startbusiness ventures.
It has been hardest to get funding for my clients anbuyers of my transaction.
It seemed like 2014 had a large amount ofdistressed properties, with 2015 having aconsiderably smaller amount, with 2016 only havina few. Also, the rental/leasing market has seemed
to slow down considerably from the 4th quarter of2015, into the 1st quarter of 2016, with thoselooking, having unrealistic expectations of rent.
Not only does the State of CT need to improve itsdealings with businesses but towns and cities haveto streamline their processes to get items throughtheir P&Z organizations. […] Taxes are causingcompanies and population to leave the state. ThePension problems are getting worse and the credit
ratings continue to deteriorate.
The economy around the Atlantic City casinos is snot good.
The lack of a budget for the State of Illinois hascreated a maelstrom effect on the leasing ofcommercial office space.
8/16/2019 2016 Q1 Commercial Real Estate Market Survey
http://slidepdf.com/reader/full/2016-q1-commercial-real-estate-market-survey 12/1412
MAY 2016
COMMERCIAL REAL ESTATE MARKET TRENDS | Q1.2016
ATIONAL ASSOCIATION of REALTORS® | RESEARCH DIVISION | www.realtors.org/research-and-statistics
e Atlanta in-town market is experiencingmendous growth. Existing inventory forndominium product is practically non-existent andyers have been competing for available inventory.the same time, the multi-family apartment marketbeginning to feel the stress from oversupply.proximately 7,000 rental units will deliver this yearan already crowded market. Rising vacancy rates,asing concessions (base rent and incentives) haveused concern among lenders and developers. Asesult, many projects that are still undernstruction are being considered for conversion
m apartments to condominiums. The next quarterl be very interesting to watch in the Midtown andckhead submarkets of Atlanta.
e last 2 years have been excellent for commercialokers. Not many REO properties remain andces are slowly rebounding. We're concernedout the talk of a national recession in mid 2017 &pe it doesn't hit real estate again.
e new banking regulations for 2016- the bankse more critical, underwriters still are having issuesh interpretations, buyers are getting frustratedd I truly believe that closings are taking too longd this will affect my company as well as the realtate business.
e office segment of the market is still lagging,ail and industrial appear to be moving forward at
more rapid pace.
e have more buyers / tenants than we haveoperty. at a recent event another brokermmented "I could sell multi-unit housing all day if Id it."
omments – continued
8/16/2019 2016 Q1 Commercial Real Estate Market Survey
http://slidepdf.com/reader/full/2016-q1-commercial-real-estate-market-survey 13/14
The National Association of REALTORS®, “The Voice for Real Estate,” is America’slargest trade association, representing over 1 million members, including NAR’sinstitutes, societies and councils, involved in all aspects of the real estate industry. NARmembership includes brokers, salespeople, property managers, appraisers, counselorand others engaged in both residential and commercial real estate. The termREALTOR® is a registered collective membership mark that identifies a real estateprofessional who is a member of the National Association of REALTORS® andsubscribes to its strict Code of Ethics. Working for America's property owners, theNational Association provides a facility for professional development, research andexchange of information among its members and to the public and government for thepurpose of preserving the free enterprise system and the right to own real property.
NATIONAL ASSOCIATION OF REALTORS®
RESEARCH DIVISION
The Mission of the National Association of REALTORS® Research Division is to collecand disseminate timely, accurate and comprehensive real estate data and to conducteconomic analysis in order to inform and engage members, consumers, and policy
makers and the media in a professional and accessible manner.
To find out about other products from NAR’s Research Division, visitwww.REALTOR.org/research-and-statistics
NATIONAL ASSOCIATION OF REALTORS®RESEARCH DIVISION
500 New Jersey Avenue, NW
Washington, DC 20001
202.383.1000
8/16/2019 2016 Q1 Commercial Real Estate Market Survey
http://slidepdf.com/reader/full/2016-q1-commercial-real-estate-market-survey 14/14
500 New Jersey Avenue, NW • Washington, DC 20001 – 2020
800.874.6500 • www.REALTOR.org
COMMERCIAL REAL ESTATE MARKET TRENDS: Q1.2016