Embed Size (px)
Citation preview
2016 POST-CLICK IT OR
TICKET DIRECT OBSERVATION SURVEY OF SAFETY BELT AND
HAND-HELD DEVICE USE
Prepared for: Michigan Office of Highway Safety Planning
Lansing, MI
Prepared by: Michigan State University
East Lansing, MI
Date: August 2016

2016 POST-CLICK IT OR TICKET DIRECT OBSERVATION SURVEY OF SAFETY BELT USE AND HAND-HELD DEVICE
USE
Prepared for: Michigan Office of Highway Safety Planning
Lansing, MI
Prepared by: Michigan State University
East Lansing, MI
Date: August 3, 2016 The opinions, findings, and conclusions expressed in this publication are those of the author(s) and not necessarily those of the Michigan Office of Highway Safety Planning, the U.S. Department of Transportation, or the National Highway Traffic Safety Administration. This report was prepared in cooperation with the Michigan Office of Highway Safety Planning and the U.S. Department of Transportation, and the National Highway Traffic Safety Administration.

Technical Report Documentation Page
1. Report No.
2. Government Accession No. 3. Recipient’s Catalog No.
4. Title and Subtitle 2016 Post-Click It or Ticket Direct Observation Survey of Safety Belt and Hand-Held Device Use
5. Report Date: August 3, 2016
6. Performing Organization Code:
7. Author(s) Timothy J. Gates, Peter T. Savolainen, Brendan J. Russo, and Steven Stapleton
8. Performing Organization Report No.
9. Performing Organization Name and Address: Michigan State University 428 S. Shaw Lane Department of Civil and Environmental Engineering East Lansing, MI 48824
10. Work Unit No. (TRAIS)
11. Contract or Grant No.
12. Sponsoring Agency Name and Address: Office of Highway Safety Planning 7150 Harris Drive Dimondale, MI 48821
13. Type of Report and Period Covered: Final Report
14. Sponsoring Agency Code:
15. Supplementary Notes:
16. Abstract: This report documents the results of the 2016 Post-Click It or Ticket Direct Observation Survey of Safety Belt and Hand-Held Device Use in the State of Michigan. Safety belt use by drivers and front seat passengers was monitored at a total of 200 intersection/interchange sites throughout the state during June 2016. In addition to belt use, data were collected for vehicle type and use, as well as the gender, age, and race for each observed occupant, and hand-held device use for each observed driver. The results of this survey show the safety belt usage rate in the state of Michigan is 94.5 percent. This represents an overall increase from the 92.8 percent use rate in 2015. Males and younger occupants, specifically those in pick-up trucks, continue to exhibit lower belt use rates. The observed rate of hand-held device use by all vehicle drivers is 7.5 percent which represents a marginal 0.1 percentage point decrease from the 7.6 percent device use rate observed in 2015.
17. Key Words:
Safety belt use, use rate by vehicle type, hand-held device use rate, gender and demographic characteristics
18. Distribution Statement: Unlimited
19. Security Classification (report): Unclassified
20. Security Classification (Page): Unclassified
21. No of Pages:
47
22. Price:

i
TABLE OF CONTENTS PAGE
1.0 INTRODUCTION ..................................................................................................................................... 1 1.1 Study Purpose and Objectives ......................................................................................................... 2 1.2 Study Area ....................................................................................................................................... 2 2.0 METHODOLOGY .................................................................................................................................... 2 2.1 Design of Study ............................................................................................................................... 3 2.2 Data Collection Process .................................................................................................................. 3 2.3 Alternate Sites and Rescheduling ................................................................................................... 4 2.4 Quality Control Procedures ............................................................................................................. 4 3.0 SELECTION OF OBSERVATION SURVEY LOCATIONS ..................................................................... 5 3.1 Sample Size and Precision ............................................................................................................. 8 3.2 Outline for Data Collection ............................................................................................................ 12 4.0 OBSERVER TRAINING ........................................................................................................................ 13 5.0 QUALITY CONTROL ............................................................................................................................ 15 6.0 DATA ANALYSIS .................................................................................................................................. 15 6.1 Imputation ..................................................................................................................................... 16 6.2 Sampling Weights ......................................................................................................................... 16 6.3 Non-Responding Site Adjustment ................................................................................................. 16 6.4 Estimators ..................................................................................................................................... 16 6.5 Variance Estimation ...................................................................................................................... 17 6.6 Non-Response Rate ..................................................................................................................... 18 7.0 RESULTS AND CONCLUSIONS ......................................................................................................... 19 7.1 Safety Belt Survey Results and Conclusions ................................................................................ 19 7.2 Hand-Held Device Use Results and Conclusions ......................................................................... 30 REFERENCES ............................................................................................................................................ 33 APPENDIX I – Michigan Safety Belt Survey Cover Sheet and Data Collection Form ................................ 34 APPENDIX II – Resume of Timothy J. Gates and Peter T. Savolainen ..................................................... 37 APPENDIX III – List of Observation Locations by County, Stratum, and Road Classification Including Safety Belt Use Observation Data ................................................................................... 42

ii
LIST OF FIGURES PAGE
Figure 1: 33-County Statewide Sample for the Direct Observation Safety Belt Surveys………………….7 Figure 2: Training Syllabus ........................................................................................................................ 14
LIST OF TABLES PAGE
Table 1: Michigan MTFCC Codes Included by Default in the Road Segment File ...................................... 3 Table 2: Safety Belt Use Codes and Definitions .......................................................................................... 4 Table 3: Michigan Average Motor Vehicle Crash-Related Fatalities by County (2005-2009) ..................... 6 Table 4: Roadway Functional Strata by County, Road Segments Population (N), Length of Selected Segments (miles), and Number of Segments Selected (n) .................................................... 10-11 Table 5: Annual Vehicle Miles of Travel by Stratum (in 1,000’s) ............................................................... 17 Table 6: Statewide Weighted Safety Belt Use Rate for Drivers and Front-Seat Passengers ................... 19 Table 7: Statewide Raw/Unweighted Safety Belt Use Summary ............................................................... 19 Table 8: Statewide Safety Belt Use Day and Time Sampling Summary ................................................... 20 Table 9: Statewide Safety Belt Use Rates by Stratum and County ........................................................... 21 Table 10: All Vehicles Statewide Summary ............................................................................................... 22 Table 11: Passenger Cars Statewide Summary ........................................................................................ 23 Table 12: Sport Utility Vehicles Statewide Summary ................................................................................. 24 Table 13: Vans/Minivan Statewide Summary ............................................................................................ 25 Table 14: Pick-Up Trucks Statewide Summary .......................................................................................... 26 Table 15: All Vehicles Statewide Demographic Summary ..................................................................... 28-29 Table 16: Statewide Weighted Hand-Held Device Use Rate for Drivers .................................................... 30 Table 17: Statewide Unweighted Hand-Held Device Use Rates by Use Type ........................................... 30 Table 18: Hand-Held Device Use Statewide Summary ......................................................................... 31-32
1
1.0 INTRODUCTION
The use of safety belts is perhaps the single most effective means of reducing fatal and non-fatal injuries
in motor vehicle crashes. In the first half of 2015, a statistical projection estimated 16,225 passenger
vehicle occupants were killed in traffic crashes in the United States; an increase of 8.1 percent compared
with 2014 [1]. Past research indicates that the use of safety belts reduces the risk of fatal injury to front
seat occupants by approximately 45 percent for passenger vehicles and 60 percent for light trucks.
Moreover, the use of safety belts reduces the risk of moderate to critical injury by 50 percent for
occupants of passenger vehicles and 65 percent for the occupants of light trucks. In 2014 alone, safety
belts saved approximately 12,802 passenger vehicle occupants over the age of 5 [2]. A recent study
conducted by the National Highway Traffic Safety Administration (NHTSA) on the economic and societal
impacts of motor vehicle crashes states “The comprehensive societal benefits from safety belt use are
enormous” [3]. In fact, this study found that from 1975 to 2010, safety belts have prevented $7.6 trillion in
societal harm as measured by comprehensive costs, and are currently preventing $330 billion in societal
harm annually [3]. Additionally, the Centers for Disease Control and Prevention estimate safety belts have
saved approximately 255,000 lives since 1975 [4]. Therefore, even marginal increases in safety belt use
rates have the potential to lead to important societal benefits.
In light of these facts, continuing efforts have been aimed at increasing the use of safety belts across the
United States. According to a 2015 nationwide safety belt survey, 88.5 percent of drivers and right-front
passengers use safety belts, which is a 1.8 percent increase from the 86.7 percent observed in 2014 [5].
The Midwest region as a whole showed an 81.7 percent safety belt use rate in 2015, slightly down from
the 82.6 percent safety belt use rate observed in 2014 [5]. In Michigan, past statewide safety belt use
studies indicate the overall use among front seat occupants increased until 2009, prior to a series of
gradual declines. Despite these declines, the 2015 use rate was 92.8 percent, making Michigan one of
20 states with safety belt use rates higher than 90 percent [6]. It is important to recognize Michigan is
currently one of the thirty-four “primary law” states, which means a motorist can be stopped and cited for
the sole reason of not wearing a safety belt while driving or riding as a front-seat passenger. In
“secondary law” states, motorists must be stopped for another traffic-related offense in order to be
ticketed for not wearing a safety belt [5]. The most recent available national statistics (2015) indicate that
states with primary safety belt laws exhibited an average use rate of 91.2 percent, which is 12.6 percent
higher than the 78.6 percent exhibited by states without primary safety belt laws [5].
As the non-use of safety belts is ultimately a behavioral issue, targeted programs aimed at changing
occupant behavior related to the use of safety belts represent an important tool to increase use rates.
Such programs should be targeted toward those occupants who are most prone to low use rates.
Identification of such occupants is one of the principal goals of the statewide belt use surveys. Statewide
safety belt use data can also be used for the following:

2
To fulfill reporting requirements to NHTSA;
To allocate statewide safety funding to specific program areas;
To provide targeted funding to specific areas within the state where use rates are lower than the
statewide average; and
To provide targeted programs for certain segments of the population.
1.1 Study Purpose and Objectives
The purpose of this study was to perform the Post Click-It or Ticket (CIOT) Direct Observation Survey at
200 roadside locations to determine the percentage of drivers and front-seat passengers who were
utilizing their safety belts correctly.
Additional objectives of this study were as follows:
Develop a revised methodology, compliant with the Uniform Criteria for State Observational
Surveys of Seat Belt Use, for estimating statewide belt use in an economically feasible manner;
Provide training to all staff conducting the observation surveys and conduct quality
assurance/quality control (QA/QC) of the data collection efforts;
Conduct an observational survey of safety belt use for two weeks in the months of May and June;
Summarize and cross-tabulate the observational data in a spreadsheet format indicating overall
safety belt use, safety belt use by strata, safety belt use by time of day and day of week, and
safety belt use by various demographic characteristics; and
Continue to track changes in safety belt use and generate necessary comparative data and
statistical analyses to assess the relevancy of the 2016 data and results to previous observational
results.
1.2 Study Area
The study area for the statewide observational survey included those counties representing at least 85
percent of the passenger vehicle crash-related fatalities according to Fatality Analysis Reporting System
(FARS) data averages for the years 2005 to 2009.
2.0 METHODOLOGY
The National Highway Traffic Safety Administration (NHTSA) issued new Uniform Criteria for State
Observational Surveys of Seat Belt Use in Federal Register Vol. 76, No. 63 (April 1, 2011, Rules and
Regulations, pp. 18042 – 18059). The current survey plan represents Michigan’s response to the
requirement to submit to NHTSA a study and data collection protocol for an annual state survey to
estimate passenger vehicle occupant restraint use. This plan is fully compliant with the Uniform Criteria
and was utilized for the implementation of Michigan’s 2016 safety belt survey.

3
2.1 Design of Study
Michigan is comprised of 83 counties; 40 of which account for about 85 percent of the passenger vehicle
crash-related fatalities according to FARS data averages for the years 2005 to 2009. Therefore,
observation locations from within these 40 counties were eligible to be selected for inclusion in the
survey.
Using 2010 Topologically Integrated Geographic Encoding and Referencing (TIGER) data developed by
the U.S. Census Bureau, a comprehensive list of road segments from within these 33 counties was
created. Each of these road segments has been classified by the U.S. Census Bureau using the
MAF/TIGER Feature Class Code (MTFCC). There are primarily three classifications: 1) Primary Roads,
2) Secondary Roads, and 3) Local Roads (See Table 1 for detailed definitions). In addition, the listings
include segment length as determined by TIGER. This descriptive information allowed for stratification of
road segments. A systematic probability proportional to size (PPS) sample was employed to select the
road segments to be used as observation sites. This process is explained in further detail in Section 3 of
this report.
Table 1. Michigan MTFCC Codes Included by Default in the Road Segment File
Code Name Definition
S1100 Primary Road Primary roads are generally divided, limited-access highways within the interstate highway system or under state management, and are distinguished by the presence of interchanges. These highways are accessible by ramps
and may include some toll highways.
S1200 Secondary Road
Secondary roads are main arteries, usually in the U.S. Highway State Highway or County Highway system. These roads have one or more lanes of traffic in
each direction, may or may not be divided, and usually have at-grade intersections with many other roads and driveways. They often have both a
local name and a route number.
S1400 Local Neighborhood Road, Rural Road, City
Street
These are generally paved non-arterial streets, roads, or byways that usually have a single lane of traffic in each direction. Roads in this feature class may
be privately or publicly maintained. Scenic park roads would be included in this feature class, as would (depending on the region of the country) some
unpaved roads.
2.2 Data Collection Process
All passenger vehicles, including commercial vehicles weighing less than 10,000 pounds, were eligible for
observation. The cover sheet and data collection form are shown in Appendix I. The cover sheet was
designed to allow for documentation of descriptive site information, including: date, site location, site
number, alternate site data, assigned traffic flow, number of lanes available and observed, start and end
times for observations, and weather conditions. This cover sheet was completed by the data collector at
each site before any observations took place.

4
The observation form was used to record safety belt use by drivers and front seat passengers. Additional
data to be collected included occupant age, gender, and ethnicity, as well as vehicle type and use (e.g.
commercial or non-commercial) information. Data regarding the use of hand-held devices was also
collected. This included information on how the device was used as well (e.g. talking, texting, or hands-
free). The forms were labeled from 1 to the total number of forms utilized at each site to assist with data
review and inventorying.
The data collectors were instructed to observe as many lanes of traffic as they could while obtaining data
on 99 percent of eligible vehicles. Only one direction of traffic was observed at any given site. This
direction of observation was pre-determined at each location as explained further in section 3.1.
Observations were made of all drivers and right-front seat occupants. This included children riding in
booster seats. The only right-front seat occupants excluded from this study were child passengers who
were traveling in child seats with harness straps. Table 2 lists all categories of safety belt use that were
observed by the data collectors.
Table 2. Safety Belt Use Codes and Definitions
Code Definition
Belted The shoulder belt is in front of the person's shoulder and used correctly.
Not belted
The shoulder belt is not in front of the person's shoulder or not used at all.
Unknown It cannot reasonably be determined whether the driver or right front
passenger is belted.
2.3 Alternate Sites and Rescheduling
If a site was temporarily unavailable due to a crash, short-term road work or maintenance, inclement
weather, or any event that may hinder exact results, data collection was rescheduled for a similar time of
day and type of day of the week. In the event the site was permanently unavailable, such as being
located within a gated community or closed for long-term construction, then an alternate site selected as
part of the reserve sample was to be used as a permanent replacement.
2.4 Quality Control Procedures
The quality control (QC) monitor made unannounced visits to five percent of all data collection sites over
the duration of the study. The purpose of these visits was to ensure data collectors were following all
survey protocol including: performing observational surveys at the assigned location, in the assigned
direction, during the assigned time period, completing the cover sheet and observation forms correctly,
making accurate observations of safety belt use within an appropriate number of lanes.

5
3.0 SELECTION OF OBSERVATION SURVEY LOCATIONS
This research design conforms to the requirements of the Uniform Criteria and allows for estimates of
restraint use among front seat occupants in passenger vehicles. Michigan intends to update the sample
of data collection sites every five years in order to have survey results that reflect geographic areas with
more than 85 percent of crash-related fatalities. The sample design was provided to the Michigan Office
of Highway Safety Planning under a consultant agreement with Michigan State University (see Appendix
II for the resume of the Principal Investigators, Dr. Timothy Gates and Dr. Peter Savolainen). The design
approach includes a stratified systematic PPS sample of data collection sites as described here:
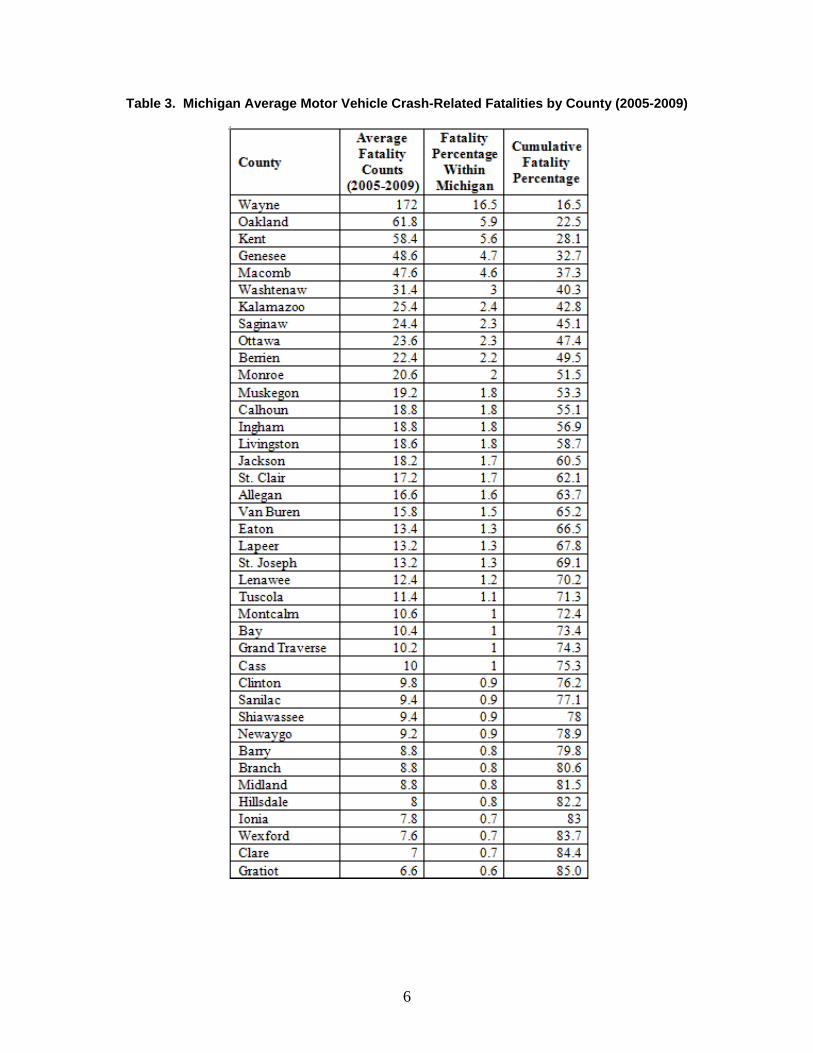
1. All 83 counties in Michigan were listed in descending order of the average number of motor
vehicle crash-related fatalities for the period from 2005 to 2009. FARS data were used to
determine the average number of crash-related fatalities per county. It was determined 40
counties accounted for at least 85 percent of Michigan’s total crash-related fatalities during this
period as shown in Table 3. These counties comprise the sample frame.
2. The counties were stratified according to historical safety belt use rates into four groups. These
strata were constructed such that the annual vehicle miles of travel (VMT) were approximately
balanced within each of the four groups. This represents the first stage of sample selection.
3. At the second stage, road segments were explicitly stratified by MTFCC (see Table 4). This
resulted in a total of 12 strata (4 belt use groups, each with 3 MTFCC classes). The number of
sites within each MTFCC class was determined proportionately based upon historical VMT,
resulting in 30 percent primary roads, 60 percent secondary roads, and 10 percent local roads.
4. Road segments were then implicitly stratified by county and segment length. Specific segments
were selected randomly with PPS from all segments within each stratum. A random, systematic
sample of 50 road segments was selected PPS to road segment length within each belt use
group. This process resulted in the selection of 200 road segments (4 belt use rate groups x 50
sites per belt use rate group, allocated proportionately among MTFCC classes). An additional
200 sites were also selected to use as alternates. Out of the 40 possible counties that comprised
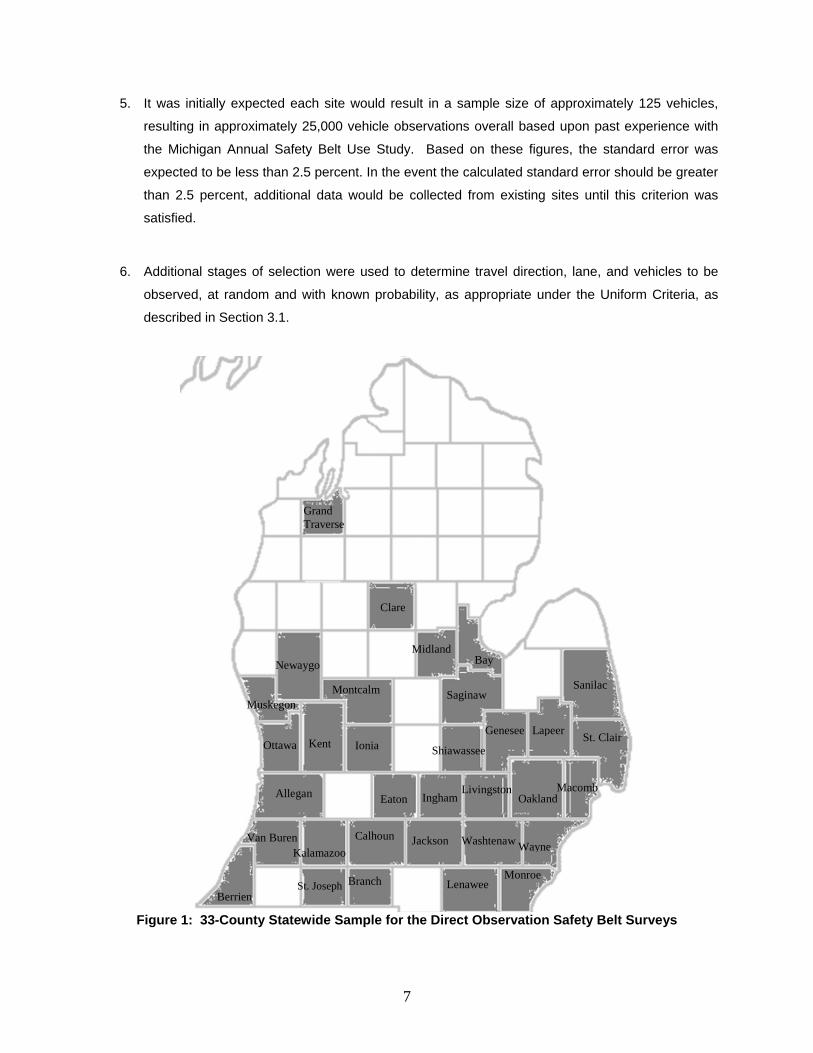
the sample frame, the final list of observation sites contained locations in 33 of the counties.
Figure 1 shows a map displaying the 33-county statewide sample for the direct observation safety
belt survey.
6
Table 3. Michigan Average Motor Vehicle Crash-Related Fatalities by County (2005-2009)
7
5. It was initially expected each site would result in a sample size of approximately 125 vehicles,
resulting in approximately 25,000 vehicle observations overall based upon past experience with
the Michigan Annual Safety Belt Use Study. Based on these figures, the standard error was
expected to be less than 2.5 percent. In the event the calculated standard error should be greater
than 2.5 percent, additional data would be collected from existing sites until this criterion was
satisfied.
6. Additional stages of selection were used to determine travel direction, lane, and vehicles to be
observed, at random and with known probability, as appropriate under the Uniform Criteria, as
described in Section 3.1.
Lenawee Monroe Branch St. Joseph
Berrien
Van Buren Kalamazoo
Calhoun Jackson Washtenaw Wayne
Allegan Eaton Ingham Livingston
OaklandMacomb
Ottawa Kent Ionia
Sanilac
Shiawassee
Genesee LapeerSt. Clair
Muskegon Montcalm Saginaw
Newaygo Midland
Bay
Clare
Grand Traverse
Figure 1: 33-County Statewide Sample for the Direct Observation Safety Belt Surveys

8
3.1 Sample Size and Precision
A standard error of less than 2.5 percent for the safety belt use estimates is required by the Final Rule.
Since 1999, Michigan has conducted the Michigan Annual Safety Belt Use Study, and has historically
obtained standard errors below this threshold (e.g. most recently 0.4 percent in 2015) via observed
sample sizes of approximately 25,000 vehicles. Since the proposed design for the 2016 Post-CIOT
survey was identical to the 2015 survey, it was expected that the sample size for the 2016 Post-CIOT
Survey would be similar to the 2015 Annual Survey and the precision objective was expected to be
achieved. In the event that the precision objective was not met, additional observations would be taken
starting with those sites having the fewest observations. New data would be added to existing data until
the desired precision was achieved.
Within each of these four belt use groups, a total of 50 road segments were selected. Michigan employed
the Census TIGER data for the selection of road segments. Michigan exercised the available exclusion
option and removed rural local roads in counties not within Metropolitan Statistical Areas (MSAs), and
other non-public roads, unnamed roads, unpaved roads, vehicular trails, access ramps, cul-de-sacs,
traffic circles, and service drives from the dataset. The number of road segments selected within each
MTFCC class was determined proportionately based upon total annual VMT within the three classes
(Primary, Secondary, and Local). Thus, the segments selected ultimately included 15 primary roads (20
percent of sample), 30 secondary roads (60 percent of sample), and 5 local roads (10 percent of sample).
Prior to selecting the specific observation locations, all road segments were explicitly stratified by MTFCC
(primary, secondary and local) within each of the four belt use rate groups and implicitly stratified by
county and by segment length to obtain an ordered list. Implicit stratification by county was done to
ensure adequate geographic coverage was obtained as a part of the selection process. Similarly, the
implicit stratification by length ensured representative coverage within each MTFCC class since higher-
class roads tended to be longer than lower-class roads. Specific road segments were then selected with
PPS using segment length as the measure of selection (MOS).
As such, the inclusion probability for a specific road segment is:
,
where is the road segment sample size for MTFCC c in stratum that was allocated, is the length
of road segment h, and
is the total length of all segments in stratum and MTCFF c. If a segment was selected with certainty
(i.e., its MOS was equal to or exceeded ), it was set aside as a certainty selection and the
probabilities of selection were recalculated for the remaining segments in the MTCFF class. This was
repeated and the certainty selections were identified successively until no segment’s MOS was equal to

9
or exceeded the re-calculated . After each certainty segment was removed, the total
segment length of the MTCFF class was then recalculated, as well as the probabilities of selection for the
remaining segments, until no more segments were selected with certainty.
After all certainty segments were identified, a sampling interval (I) was calculated as the total length
across all road segments within each MTFCC group divided by the number of road segments to select
within each group (i.e., 15 primary, 30 secondary, and 5 local). A random start (RS) was selected
between 0 and the calculated I, which determined the first road segment selected. Subsequent road
segments selected were determined by adding multiples of I to the RS until the desired number of road
segments were selected and/or the end of the sorted list was reached.
Table 4 presents summary statistics detailing the number of eligible road segments, the total length
(miles) of these segments, and the number of road segments selected within each of the MTFCC classes
by belt use group and county. Appendix III presents the complete list of the final observation sites
including belt use stratum, county, and road classification.
In the event an original road segment was permanently unavailable, a reserve road segment was to be
used. The reserve road segment sample consisted of one additional road segment per original road
segment selected, resulting in a reserve sample of an additional 200 road segments. These reserve
segments were identified and selected as the road segments immediately following the original road
segment actually selected. Thus, these segments were also explicitly stratified by safety belt use and
MTFCC group, as well as implicitly stratified by segment length and county. Each reserve segment
corresponded to an original road segment actually selected. Thus, these are considered selected with
PPS using road segment length as MOS by the same approach as described previously. As such, for the
purposes of data weighting, the reserve road segment inherited all probabilities of selection and weighting
components up to and including the road segment stage of selection from the original road segment
actually selected. Probabilities and weights for any subsequent stages of selection (e.g., the sampling of
vehicles) would be determined by the reserve road segment itself.

10
Primary Secondary LocalN 37 147 6162 6346
Length 169 417 3111 3697n 3 7 1 11N 46 71 6611 6728
Length 171 284 3433 3888n 4 5 0 9
N 40 172 29104 29316Length 349 556 10287 11192
n 5 13 3 21N 19 76 8183 8278
Length 116 268 3841 4225n 3 5 1 9
N 14 52 4416 4482Length 161 287 3656 4104
n 1 3 1 5N 19 111 3580 3710
Length 253 330 2568 3151n 2 3 0 5N 11 110 4937 5058
Length 156 291 3200 3647n 2 2 1 5N 11 88 3002 3101
Length 182 368 2497 3047n 2 4 0 6N 0 55 5485 5540
Length 0 236 2731 2967n 0 2 0 2N 8 142 5203 5353
Length 108 416 3104 3628n 1 4 1 6N 29 142 15063 15234
Length 285 633 6841 7759n 4 5 1 10N 17 41 7119 7177
Length 101 211 3267 3579n 1 2 0 3N 3 28 3481 3512
Length 1 106 2285 2392n 0 1 1 2N 7 55 3531 3593
Length 145 291 2760 3196n 2 3 0 5N 3 52 7080 7135
Length 4 220 3417 3641n 0 1 0 1
N 1 132 2894 3027Length 0 237 2148 2385
n 0 0 0 0N 37 107 6495 6639
Length 72 390 3121 3583n 3 0 0 3N 6 37 2231 2274
Length 133 184 1844 2160n 1 0 0 1N 2 74 2850 2926
Length 0 213 1844 2057n 0 0 0 0N 10 65 4408 4483
Length 101 193 2532 2826n 2 0 0 2
Cass
Clare
3
Ottawa
2
Barry
Berrien
Branch
Jackson
Kent
Livingston
Midland
Monroe
Allegan
Bay
Calhoun
Eaton
Grand Traverse
Total
Kalamazoo
Oakland
Washtenaw
1
Ingham
Strata CountyMTFCC Strata
Table 4. Roadway Functional Strata by County, Road Segments Population (N), Length of Selected Segments (miles), and Number of Segments Selected (n)

11
Primary Secondary LocalN 28 78 2277 2383
Length 71 185 2494 2750n 0 0 0 0N 18 78 9622 9718
Length 357 409 4674 5440n 2 0 0 2N 3 37 1641 1681
Length 46 147 2205 2398n 0 0 0 0N 0 76 2150 2226
Length 0 346 2196 2541
n 0 0 0 0N 8 78 2376 2462
Length 73 234 2205 2512n 0 0 1 1N 3 31 2883 2917
Length 144 216 3129 3490n 0 1 0 1N 1 104 3398 3503
Length 1 378 2666 3045n 0 3 1 4N 4 73 4095 4172
Length 63 380 4041 4484n 0 4 0 4N 5 44 5660 5709
Length 90 196 3033 3319n 0 1 1 2N 0 104 3441 3545
Length 0 360 3042 3402n 0 4 0 4N 8 149 5252 5409
Length 154 633 4327 5114n 2 5 1 8N 1 88 2208 2297
Length 0 495 2912 3407n 0 5 0 5N 6 32 2276 2314
Length 50 206 2113 2369n 1 1 1 3N 22 121 4189 4332
Length 182 329 2975 3486n 3 3 0 6N 1 66 3147 3214
Length 0 295 2550 2846n 0 3 0 3N 0 88 2061 2149
Length 0 402 2971 3373n 0 0 0 0N 8 27 3512 3547
Length 189 89 2843 3121
n 1 0 0 1N 0 65 3274 3339
Length 0 299 2458 2757n 0 0 0 0
N 14 203 16727 16944Length 67 427 5545 6039
n 4 15 3 22N 50 180 26982 27212
Length 690 982 12387 14059n 11 15 2 28
Wexford
3
Macomb
Wayne
4
Shiawassee
St. Clair
St. Joseph
Tuscola
Van Buren
Montcalm
Muskegon
Newaygo
Saginaw
Sanilac
Gratiot
Hillsdale
Ionia
Lapeer
Lenawee
MTFCC StrataTotal
Clinton
Genesee
Strata County
Table 4 - Roadway Functional Strata by County, Road Segments Population (N), Length of Selected Segments (miles), and Number of Segments Selected (n) (Continued)

12
Road segments were mapped according to the latitude and longitude of their midpoints. The selected
road segment was identified by an intersection or interchange that occurred within or just beyond the
segment. Data collection sites were deterministically selected such that traffic would be moving during
the observation period. Therefore, sites were assigned to locations within the segment that were 50 to
150 feet from any controlled intersections. For limited access roadways, data collection occurred on a
ramp carrying traffic exiting the highway. The observed direction of travel was randomly assigned for
each road segment. The locations of the data collection sites were described on site assignment sheets
and GPS coordinates were determined for the approximate location at which the observer was to stand.
The GPS coordinates also allowed for efficient navigation to each observation site to assist the data
collectors and QC monitors travelling to the assigned locations.
3.2 Outline for Data Collection
For each selected observation site, vehicles were observed for exactly 60 minutes. These observations
were appropriately weighted, as explained in the Data Analysis Section of this report (Section 6.0). The
data collected for the 200 observation sites provided a representative sample for each day of the week
and each hour of the day for the safety belt use characteristics of the state.
The driver of each vehicle and the passenger in the front-right seat of the vehicle were observed for
safety belt use, non-use, and misuse. The driver and passenger belt observation categories included
‘belted correctly’, ‘not belted correctly’, and ‘unknown belt use’ as previously described. An occupant was
recorded as ‘belted correctly’ only if they were observed to be properly using the shoulder belt (i.e.
shoulder belt was across chest; not under arm or behind back). The ‘unknown belt use’ category was
marked if an observer was unable to determine the position of an occupant’s safety belt. These
observations were not included in the final sample but a record was kept to calculate the non-response
rate which is discussed in the data analysis section of this report. In the surveys, both the driver and
front-seat passenger were separately identified based upon their gender, estimated age, and race. The
driver and passenger gender categories consisted of male, female, and unknown. The driver age
categories included 16-29, 30-59, 60 and over, and unknown. The passenger age categories included 0-
15, 16-29, 30-59, 60 and over, and unknown. The driver and passenger races were categorized as
Caucasian, African American, other, or unknown. The vehicles were categorized into four groups:
passenger cars, sport utility vehicles, vans or minivans, and pick-up trucks. The vehicles were also
identified as being commercial or non-commercial vehicles. Furthermore, the driver was also observed for
any indication of hand-held device use. The categories included ‘handheld (talking)’, ‘handheld (typing)’,
‘hands-free (ear piece)’, and hands-free (no ear piece)’. For cases where a driver was observed to be
using a ‘hands-free’ device, observers also recorded whether an earpiece was visible or not.

13
Data collectors also counted every vehicle that passed through the lanes they were observing during the
60-minute observation using a hand counter. This volume count was then utilized during the belt use
weighting procedure. Observations were manually recorded in the field on survey forms and returned
back to the office within 24 hours of the data collection, or as soon as possible after multiple day trips to
outstate locations. The data collected in the field were entered into a spreadsheet by the observer at the
conclusion of the data collection activities for each day and verified for accuracy in the office by office
staff.
4.0 OBSERVER TRAINING
The Principal Investigators from MSU and WSU served as the QC monitors, conducting site audits of the
data collectors. Each data collector was monitored at least once by a QC monitor. The data collectors
were comprised of MSU and WSU staff, many of whom have participated in prior safety restraint use
surveys. All data collectors were able to stand for long periods of time, work outdoors, and successfully
complete the training program. The training program for data collectors was conducted at MSU and was
attended by both MSU and WSU staff. The training program began approximately four weeks prior to the
first data collection period and included both lecture and classroom and field exercises, with repeated
field training in the weeks leading up to the survey. The syllabus for the training program is shown as
Figure 2.
At the conclusion of the classroom training, the data collectors conducted their first field practice at a
location near the MSU campus. QC monitors were available during this period to respond to questions
and offer assistance to data collectors as needed. Reliability and repeatability field data collection
practice continued during the weeks leading up to full-scale survey implementation.
The reliability and repeatability studies were performed at various intersections near the MSU and WSU
campuses, as well as additional locations in mid and southeast Michigan. These intersections
represented various site characteristics that could be challenging for observational data collection. Over
a period of several weeks, observers were randomly divided into groups and assigned to collect safety
belt observational data independently. Also during this period, another exercise paired inexperienced
observers with experienced observers, who noted which individual vehicle the entire group was to
evaluate. This allowed an analysis of the accuracy of the inexperienced data collectors in comparison to
those who have participated in the study previously.

14
Figure 2. Training Syllabus
The data was then summarized and compared among the observers in each group to determine the
accuracy of their observations. Upon completion of the training for the data collection, each member of
the data collection team received a training manual composed of the information detailed during the
training session, the schedule of data collection, and all necessary field supplies.
15
5.0 QUALITY CONTROL
The policies and procedures utilized during the conduct of the direct observation surveys of safety belt
use were based upon the Uniform Criteria for State Observational Surveys of Seat Belt Use from Title 23,
Part 1240.12 of the Code of Federal Regulations. The study design for the Post-CIOT Survey was
consistent with these criteria, which established observations should be conducted on specific dates and
times and in particular directions of travel, all of which were determined randomly in advance of the
studies. Further, the criteria state policies should be in place in the event observations cannot be made
due to unanticipated events, such as road construction. In such situations, data collectors were
instructed to observe at the pre-assigned alternate location. Policies must also be established for the
case where traffic flow is too heavy to observe all vehicles or traffic is moving too quickly for observation.
In most instances, high traffic volumes prohibit data collectors from observing all vehicles. Consequently,
data collectors were instructed to observe as many vehicles as is feasible for observation under such
conditions for the required time period of 60 minutes.
All belt use observations were conducted during weekdays and weekends between 7 a.m. and 7 p.m.
The schedule included rush hour (before 9:30 AM and after 3:30 PM) and non-rush hour observations.
Data collection was conducted for 60 minutes at each site, and approximately five sites were scheduled
each day for each data collector. Start times and days were staggered to ensure all days of the week and
hours of the day (during daylight) were represented in the sample.
Site assignment sheets were provided to the data collectors and QC monitors. These indicated the
observed road name, the crossroad included within the road segment (or nearest crossroad), GPS
coordinates, assigned date, assigned time, and assigned direction of travel. Sites within relatively close
geographic proximity were assigned as data collection clusters. The first site within each cluster was
assigned a random day and time for completion. All other sites within a cluster were assigned to the
same day in order to minimize travel costs. The sites were scheduled by geographic proximity to
minimize travel within the cluster.
During the full-scale data collection activities, independent auditors were sent out to the field to covertly
observe the data collectors. These field audits were conducted to ensure compliance with the data
collection procedures. No major violations of policies or procedure were observed as a part of these
audits. The random checks were conducted at least once for each observer and a total of ten sites were
audited, representing five percent of all observational sites.
6.0 DATA ANALYSIS
The data collected in the field were entered into a spreadsheet by the observer at the conclusion of the
data collection activities for each day and verified for accuracy by office staff. Rates for safety belt and
hand-held device use were determined for each survey stratum, county, location, etc., as well as the
statewide average. A 95-percent confidence interval for each use rate estimate was determined

16
according to the NHTSA guidelines. The following sections outline the methods used to estimate the use
rate and variance for safety belts. A similar procedure was utilized to estimate hand-held device use rate
and variance.
6.1 Imputation
No imputation was done on missing data.
6.2 Sampling Weights
The following is a summary of the notation used in this section.
g – Subscript for belt use group strata h – Subscript for road segment strata i – Subscript for road segment j – Subscript for time segment k – Subscript for road direction l – Subscript for lane m – Subscript for vehicle n – Subscript for front-seat occupant
Under this stratified multistage sample design, the inclusion probability for each observed vehicle was the
product of selection probabilities at all stages: for belt use group (stratum-road class), for road
segment, for time segment, for direction, for lane, and for vehicle. So
the overall vehicle inclusion probability was:
.
The sampling weight (design weight) for vehicle m is:
6.3 Non-Responding Site Adjustment
There were no sites which required ‘non-responding’ adjustment in the 2016 Post-CIOT Direct
Observation Survey of Safety Belt Use.
6.4 Estimators
Noting all front-seat occupants were observed, the driver/passenger safety belt use status was:

17
In order to most accurately estimate the weighted safety belt use rate for the entire state of Michigan, the
estimator used in this analysis was weighted by segment length and stratum-level VMT to determine the
overall statewide belt use rate. This estimation technique is detailed in An Example of a Compliant State
Seat Belt Use Survey Design [7]. Under this estimator, the use rates within each stratum were first
calculated using the road segment length based estimator:
The twelve stratum-specific use rates were then weighted by the proportion of total statewide VMT
(shown in Table 5) within each stratum, which resulted in the road class VMT-based estimator (pVMT):
Table 5. Annual Vehicle Miles of Travel by Stratum (in 1,000s)
Belt Use Stratum
Road Class Total Primary Secondary Local
1 7,576,298 11,371,893 2,217,122 21,165,313
2 7,517,022 11,617,548 1,809,337 20,943,907
3 5,985,436 13,303,119 2,198,301 21,486,856
4 7,604,025 11,167,232 2,343,003 21,114,260
Statewide 28,682,781 47,459,792 8,567,763 84,710,336
The use of the VMT-based estimator (pVMT) reduced the weighting bias towards local road observation
sites by accounting for their relatively short length and low VMT as compared to primary and secondary
roads. VMT data were obtained from the Michigan Highway Performance Monitoring System (HPMS) for
the most recent year available (2013).
6.5 Variance Estimation
The variance (and standard error) for each estimator was determined using the “Delete-1 Jackknife”
variance estimation program in SUDAAN 11 software. Under this methodology, the variance was
calculated by deleting one observation location and adjusting the weights of the remaining PSU’s in the
same stratum to account for the deleted PSU. The procedure was repeated, removing each location
once. For the road class VMT based estimator (pVMT), the “Delete-1 Jackknife” method was used to
estimate the variances within each of the road class/belt use strata:

18
where:
= Estimated variance within each of the road class/belt use strata
= Estimated statewide belt use rate
= Estimated belt use rate at location i in road segment type h in belt use group g
= Estimated belt use rate in road segment type h in belt use group g
= Number of locations of road segment type h in belt use group g
The variance for the statewide use rate was then determined using the following equation:
where:
= Estimated variance of statewide belt use rate
The standard error of the statewide use rate was found by simply taking the square root of the estimated
variance. The 95 percent confidence interval of the statewide belt use was equal to the weighted safety
belt use rate plus/minus 1.96 (for the Z-test at alpha = 0.05) multiplied by the standard error expressed as
a percent.
6.6 Non-Response Rate
According to NHTSA’s guidelines, the non-response rate for the annual safety belt survey cannot exceed
10 percent. A non-response occurs when the observer was not able to determine the safety belt use of a
front seat vehicle occupant. This can occur due to a variety of reasons such as tinted windows, sun
glare, high speeds of the vehicle in question, etc. Observers in the field marked either ‘vehicle not
observable’ or ‘unknown belt use’ to keep a record of the non-response rate. There were a total of 416
non-response observations which represents approximately 1.2 percent of the total number of
observations. This non-response rate was below the allowable maximum of 10 percent established by the
NHTSA.
19
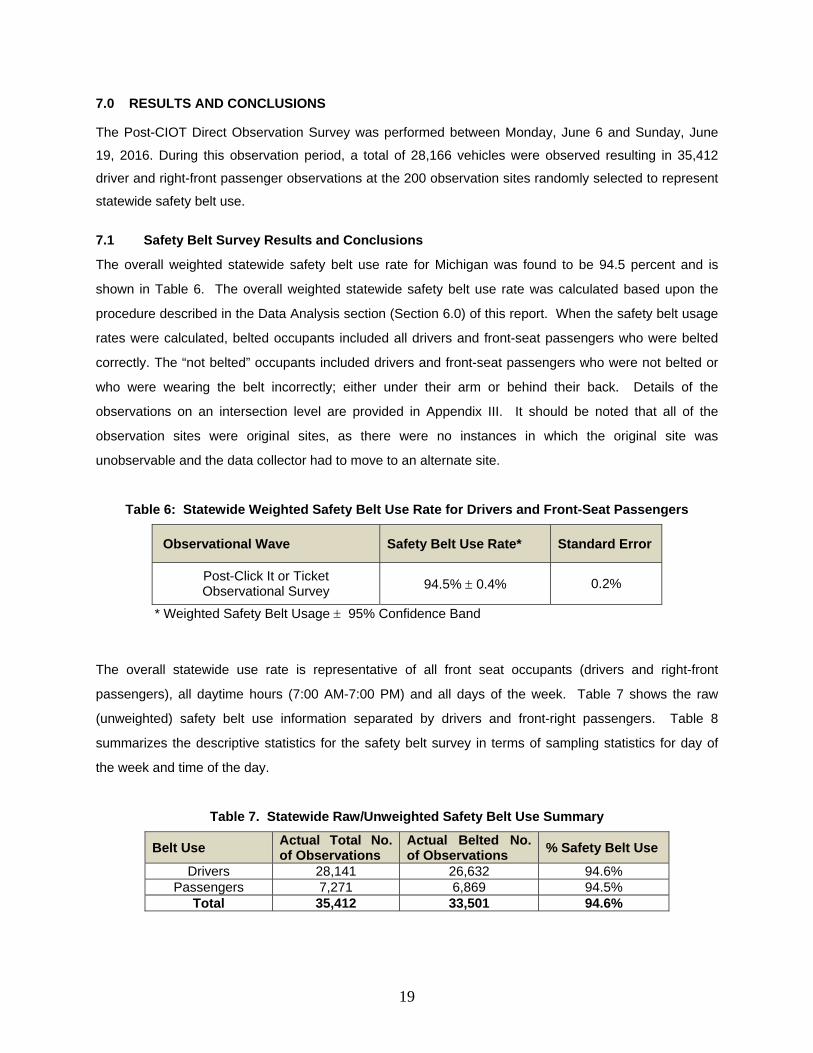
7.0 RESULTS AND CONCLUSIONS
The Post-CIOT Direct Observation Survey was performed between Monday, June 6 and Sunday, June
19, 2016. During this observation period, a total of 28,166 vehicles were observed resulting in 35,412
driver and right-front passenger observations at the 200 observation sites randomly selected to represent
statewide safety belt use.
7.1 Safety Belt Survey Results and Conclusions
The overall weighted statewide safety belt use rate for Michigan was found to be 94.5 percent and is
shown in Table 6. The overall weighted statewide safety belt use rate was calculated based upon the
procedure described in the Data Analysis section (Section 6.0) of this report. When the safety belt usage
rates were calculated, belted occupants included all drivers and front-seat passengers who were belted
correctly. The “not belted” occupants included drivers and front-seat passengers who were not belted or
who were wearing the belt incorrectly; either under their arm or behind their back. Details of the
observations on an intersection level are provided in Appendix III. It should be noted that all of the
observation sites were original sites, as there were no instances in which the original site was
unobservable and the data collector had to move to an alternate site.
Table 6: Statewide Weighted Safety Belt Use Rate for Drivers and Front-Seat Passengers
Observational Wave Safety Belt Use Rate* Standard Error
Post-Click It or Ticket Observational Survey 94.5% 0.4% 0.2%
* Weighted Safety Belt Usage 95% Confidence Band
The overall statewide use rate is representative of all front seat occupants (drivers and right-front
passengers), all daytime hours (7:00 AM-7:00 PM) and all days of the week. Table 7 shows the raw
(unweighted) safety belt use information separated by drivers and front-right passengers. Table 8
summarizes the descriptive statistics for the safety belt survey in terms of sampling statistics for day of
the week and time of the day.
Table 7. Statewide Raw/Unweighted Safety Belt Use Summary
Belt Use Actual Total No. of Observations
Actual Belted No. of Observations
% Safety Belt Use
Drivers 28,141 26,632 94.6% Passengers 7,271 6,869 94.5%
Total 35,412 33,501 94.6%

20
Table 8. Statewide Safety Belt Use Day and Time Sampling Summary
Day of the Week
Post-CIOT Safety Belt Observations
No. of Sites Observed
Percent of Sites in Day of Week
Actual Total No. of Observations (Occupants)
Percent of Observations in Day of Week (Occupants)
Sunday 22 11.0% 4,897 13.8% Monday 25 12.5% 4,571 12.9% Tuesday 25 12.5% 3,670 10.4%
Wednesday 29 14.5% 4,265 12.0% Thursday 36 18.0% 5,885 16.6%
Friday 29 14.5% 5,327 15.0% Saturday 34 17.0% 6,797 19.2%
Total 200 100.0% 35,412 100.0%
Time of the Day
Post-CIOT Safety Belt Observations
No. of Sites Observed
Percent of Sites in Time of Day
Actual Total No. of Observations (Occupants)
Percent of Observations in Day of Week (Occupants)
7 am – 8 am 8 4.0% 1362 3.8% 8 am – 9 am 14 7.0% 2329 6.6%
9 am – 10 am 15 7.5% 2189 6.2% 10 am – 11 am 23 11.5% 4227 11.9% 11 am – 12 pm 20 10.0% 3353 9.5% 12 pm – 1 pm 21 10.5% 3577 10.1% 1 pm – 2 pm 22 11.0% 3788 10.7% 2 pm – 3 pm 19 9.5% 3094 8.7% 3 pm – 4 pm 17 8.5% 3548 10.0% 4 pm – 5 pm 16 8.0% 2993 8.5% 5 pm – 6 pm 16 8.0% 3381 9.5% 6 pm – 7 pm 9 4.5% 1571 4.4%
Total 200 100.0% 35,412 100.0%
The safety belt use rate can be described by the overall use rate, as well as by vehicle type and various
demographics. It should be noted the overall safety belt use rates presented in Table 7 and Tables 9
through 15 represent the raw (un-weighted) safety belt use data. These rates vary from the weighted
statewide use rate presented in Table 6. Table 9 summarizes the statewide driver and front-seat
passenger safety belt use rates by county and belt-use stratum. Because of the relatively low number of
sites and/or observations in many counties, the safety belt use rates listed may not be fully representative
of each county.

21
Table 9. Statewide Safety Belt Use Rates by Stratum and County
STRATUM 1 Actual Total No. of
Observations Actual Belted No. of
Observations % Safety Belt Use Ingham County 1,962 1,845 94.0%
Kalamazoo County 1,905 1,753 92.0% Oakland County 4,356 4,138 95.0%
Washtenaw County 1,741 1,642 94.3% Total 9,964 9,378 94.1%
STRATUM 2 Actual Total No. of
Observations Actual Belted No. of
Observations % Safety Belt Use Allegan County 819 780 95.2%
Bay County 416 402 96.6% Calhoun County 697 657 94.3%
Eaton County 977 943 96.5% Grand Traverse County 599 582 97.2%
Jackson County 1,112 1,069 96.1% Kent County 1,637 1,557 95.1%
Livingston County 433 419 96.8% Midland County 296 277 93.6% Monroe County 799 777 97.2% Ottawa County 471 457 97.0%
Total 8,256 7,920 95.9%
STRATUM 3 Actual Total No. of
Observations. Actual Belted No. of
Observations % Safety Belt Use Berrien County 448 426 95.1% Branch County 181 178 98.3% Clare County 364 349 95.9%
Genesee County 376 336 89.4% Ionia County 52 47 90.4%
Lapeer County 52 50 96.2% Lenawee County 328 307 93.6% Montcalm County 930 839 90.2% Muskegon County 414 393 94.9% Newaygo County 625 580 92.8% Saginaw County 1,233 1,148 93.1% Sanilac County 828 761 91.9%
Shiawassee County 342 322 94.2% St. Clair County 1,164 1,097 94.2%
St. Joseph County 468 442 94.4% Van Buren County 26 25 96.2%
Total 7,831 7,300 93.2%
STRATUM 4 Actual Total No. of
Observations Actual Belted No. of
Observations % Safety Belt Use Macomb County 3,637 3,464 95.2% Wayne County 5,724 5,439 95.0%
Total 9,361 8,903 95.1% Grand Total (Unweighted) 35,412 33,501 94.6%
Stratum 2 displayed the highest safety belt use rate, followed closely by Strata 1 and 4. Consistent with
recent surveys, Stratum 3 displayed the lowest safety belt use rate at 93.2 percent. Tables 10 through 14
summarize occupant safety belt use for drivers and front-seat passengers by vehicle type for each day of
the week, time of the day, gender, age, and race for the Post-CIOT Observation Survey.
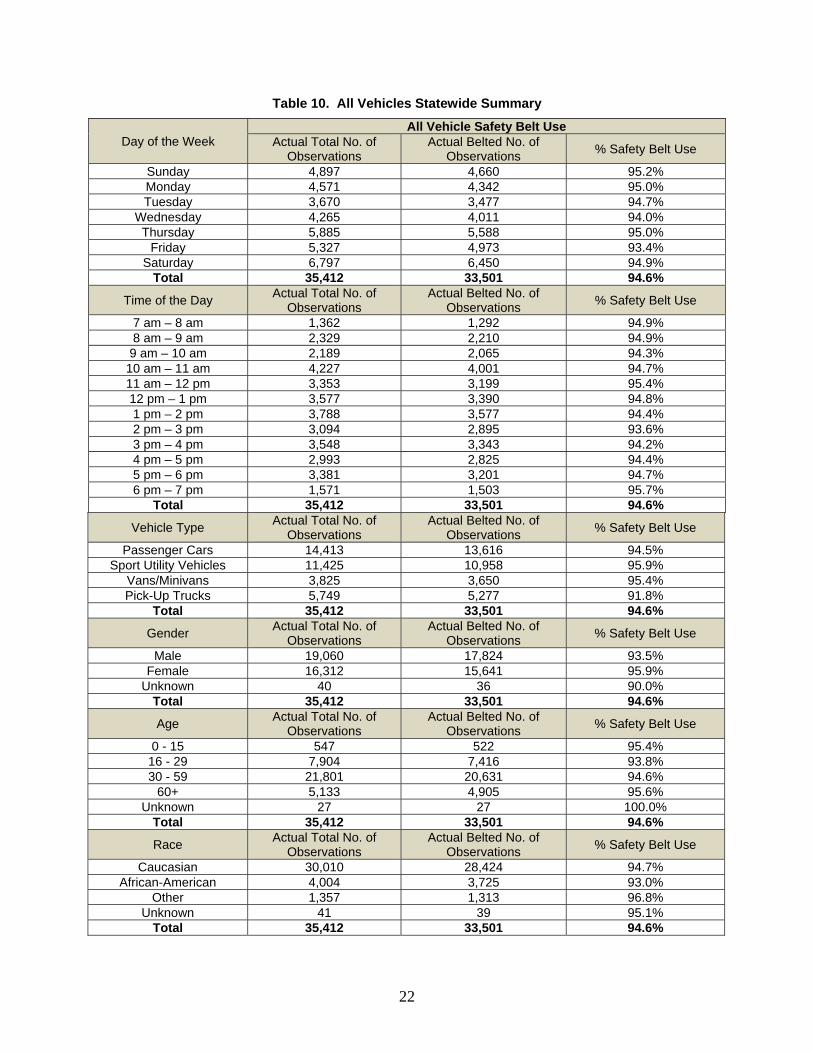
22
Table 10. All Vehicles Statewide Summary
Day of the Week All Vehicle Safety Belt Use
Actual Total No. of Observations
Actual Belted No. of Observations
% Safety Belt Use
Sunday 4,897 4,660 95.2% Monday 4,571 4,342 95.0% Tuesday 3,670 3,477 94.7%
Wednesday 4,265 4,011 94.0% Thursday 5,885 5,588 95.0%
Friday 5,327 4,973 93.4% Saturday 6,797 6,450 94.9%
Total 35,412 33,501 94.6%
Time of the Day Actual Total No. of
Observations Actual Belted No. of
Observations % Safety Belt Use
7 am – 8 am 1,362 1,292 94.9% 8 am – 9 am 2,329 2,210 94.9%
9 am – 10 am 2,189 2,065 94.3% 10 am – 11 am 4,227 4,001 94.7% 11 am – 12 pm 3,353 3,199 95.4% 12 pm – 1 pm 3,577 3,390 94.8% 1 pm – 2 pm 3,788 3,577 94.4% 2 pm – 3 pm 3,094 2,895 93.6% 3 pm – 4 pm 3,548 3,343 94.2% 4 pm – 5 pm 2,993 2,825 94.4% 5 pm – 6 pm 3,381 3,201 94.7% 6 pm – 7 pm 1,571 1,503 95.7%
Total 35,412 33,501 94.6%
Vehicle Type Actual Total No. of
Observations Actual Belted No. of
Observations % Safety Belt Use
Passenger Cars 14,413 13,616 94.5% Sport Utility Vehicles 11,425 10,958 95.9%
Vans/Minivans 3,825 3,650 95.4% Pick-Up Trucks 5,749 5,277 91.8%
Total 35,412 33,501 94.6%
Gender Actual Total No. of
Observations Actual Belted No. of
Observations % Safety Belt Use
Male 19,060 17,824 93.5% Female 16,312 15,641 95.9%
Unknown 40 36 90.0% Total 35,412 33,501 94.6%
Age Actual Total No. of
Observations Actual Belted No. of
Observations % Safety Belt Use
0 - 15 547 522 95.4% 16 - 29 7,904 7,416 93.8% 30 - 59 21,801 20,631 94.6%
60+ 5,133 4,905 95.6% Unknown 27 27 100.0%
Total 35,412 33,501 94.6%
Race Actual Total No. of
Observations Actual Belted No. of
Observations % Safety Belt Use
Caucasian 30,010 28,424 94.7% African-American 4,004 3,725 93.0%
Other 1,357 1,313 96.8% Unknown 41 39 95.1%
Total 35,412 33,501 94.6%

23
Table 11. Passenger Cars Statewide Summary
Passenger Cars Safety Belt Use
Day of the Week Actual Total No. of
Observations Actual Belted No. of
Observations % Safety Belt Use Sunday 2,197 2,075 94.4% Monday 1,963 1,871 95.3% Tuesday 1,610 1,524 94.7%
Wednesday 1,705 1,592 93.4% Thursday 2,145 2,039 95.1%
Friday 1,859 1,732 93.2% Saturday 2,934 2,783 94.9%
Total 14,413 13,616 94.5%
Time of the Day Actual Total No. of
Observations Actual Belted No. of
Observations % Safety Belt Use 7 am – 8 am 606 570 94.1% 8 am – 9 am 909 861 94.7% 9 am – 10 am 846 806 95.3%
10 am – 11 am 1,636 1,544 94.4% 11 am – 12 pm 1,230 1,181 96.0% 12 pm – 1 pm 1,492 1,403 94.0% 1 pm – 2 pm 1,618 1,528 94.4% 2 pm – 3 pm 1,242 1,168 94.0% 3 pm – 4 pm 1,499 1,393 92.9% 4 pm – 5 pm 1,280 1,204 94.1% 5 pm – 6 pm 1,407 1,336 95.0% 6 pm – 7 pm 648 622 96.0%
Total 14,413 13,616 94.5%
Gender Actual Total No. of
Observations Actual Belted No. of
Observations % Safety Belt Use Male 7,337 6,874 93.7%
Female 7,060 6,726 95.3% Unknown 16 16 100.0%
Total 14,413 13,616 94.5%
Age Actual Total No. of
Observations Actual Belted No. of
Observations % Safety Belt Use 0 - 15 173 161 93.1% 16 - 29 4,297 4,036 93.9% 30 – 59 7,949 7,517 94.6%
60+ 1,981 1,889 95.4% Unknown 13 13 100.0%
Total 14,413 13,616 94.5%
Race Actual Total No. of
Observations Actual Belted No. of
Observations % Safety Belt Use Caucasian 11,504 10,884 94.6%
African-American 2,283 2,123 93.0% Other 597 581 97.3%
Unknown 29 28 96.6% Total 14,413 13,616 94.5%

24
Table 12. Sport Utility Vehicles Statewide Summary
Sport Utility Vehicles Safety Belt Use
Day of the Week Actual Total No. of
Observations Actual Belted No. of
Observations % Safety Belt Use Sunday 1,784 1,719 96.4% Monday 1,474 1,411 95.7% Tuesday 1,045 996 95.3%
Wednesday 1,265 1,217 96.2% Thursday 1,958 1,893 96.7%
Friday 1,751 1,667 95.2% Saturday 2,148 2,055 95.7%
Total 11,425 10,958 95.9%
Time of the Day Actual Total No. of
Observations Actual Belted No. of
Observations % Safety Belt Use 7 am – 8 am 441 428 97.1% 8 am – 9 am 719 694 96.5% 9 am – 10 am 687 649 94.5%
10 am – 11 am 1,400 1,338 95.6% 11 am – 12 pm 1,108 1,076 97.1% 12 pm – 1 pm 1,138 1,096 96.3% 1 pm – 2 pm 1,200 1,139 94.9% 2 pm – 3 pm 967 927 95.9% 3 pm – 4 pm 1,169 1,119 95.7% 4 pm – 5 pm 945 908 96.1% 5 pm – 6 pm 1,130 1,080 95.6% 6 pm – 7 pm 521 504 96.7%
Total 11,425 10,958 95.9%
Gender Actual Total No. of
Observations Actual Belted No. of
Observations % Safety Belt Use Male 5,036 4,782 95.0%
Female 6,373 6,163 96.7% Unknown 16 13 81.3%
Total 11,425 10,958 95.9%
Age Actual Total No. of
Observations Actual Belted No. of
Observations % Safety Belt Use 0 - 15 202 197 97.5% 16 - 29 2,246 2,139 95.2% 30 – 59 7,147 6,851 95.9%
60+ 1,824 1,765 96.8% Unknown 6 6 100.0%
Total 11,425 10,958 95.9%
Race Actual Total No. of
Observations Actual Belted No. of
Observations % Safety Belt Use Caucasian 9,848 9,471 96.2%
African-American 1,119 1,042 93.1% Other 454 441 97.1%
Unknown 4 4 100.0% Total 11,425 10,958 95.9%

25
Table 13. Van/Minivan Statewide Summary
Van/Minivans Safety Belt Use
Day of the Week Actual Total No. of
Observations Actual Belted No. of
Observations % Safety Belt Use Sunday 396 384 97.0% Monday 482 461 95.6% Tuesday 449 432 96.2%
Wednesday 514 494 96.1% Thursday 605 576 95.2%
Friday 581 546 94.0% Saturday 798 757 94.9%
Total 3,825 3,650 95.4%
Time of the Day Actual Total No. of
Observations Actual Belted No. of
Observations % Safety Belt Use 7 am – 8 am 119 112 94.1% 8 am – 9 am 342 328 95.9% 9 am – 10 am 269 257 95.5%
10 am – 11 am 465 448 96.3% 11 am – 12 pm 408 390 95.6% 12 pm – 1 pm 411 393 95.6% 1 pm – 2 pm 388 369 95.1% 2 pm – 3 pm 323 299 92.6% 3 pm – 4 pm 342 331 96.8% 4 pm – 5 pm 277 265 95.7% 5 pm – 6 pm 337 319 94.7% 6 pm – 7 pm 144 139 96.5%
Total 3,825 3,650 95.4%
Gender Actual Total No. of
Observations Actual Belted No. of
Observations % Safety Belt Use Male 2,094 1,978 94.5%
Female 1,726 1,668 96.6% Unknown 5 4 80.0%
Total 3,825 3,650 95.4%
Age Actual Total No. of
Observations Actual Belted No. of
Observations % Safety Belt Use 0 - 15 91 89 97.8% 16 - 29 490 466 95.1% 30 – 59 2,685 2,566 95.6%
60+ 554 524 94.6% Unknown 5 5 100.0%
Total 3,825 3,650 95.4%
Race Actual Total No. of
Observations Actual Belted No. of
Observations % Safety Belt Use Caucasian 3,247 3,104 95.6%
African-American 397 374 94.2% Other 175 167 95.4%
Unknown 6 5 83.3% Total 3,825 3,650 95.4%

26
Table 14. Pick-Up Trucks Statewide Summary
Pick-up Truck Safety Belt Use
Day of the Week Actual Total No. of
Observations Actual Belted No. of
Observations % Safety Belt Use Sunday 520 482 92.7% Monday 652 599 91.9% Tuesday 566 525 92.8%
Wednesday 781 708 90.7% Thursday 1,177 1,080 91.8%
Friday 1,136 1,028 90.5% Saturday 917 855 93.2%
Total 5,749 5,277 91.8%
Time of the Day Actual Total No. of
Observations Actual Belted No. of
Observations % Safety Belt Use 7 am – 8 am 196 182 92.9% 8 am – 9 am 359 327 91.1%
9 am – 10 am 387 353 91.2% 10 am – 11 am 726 671 92.4% 11 am – 12 pm 607 552 90.9% 12 pm – 1 pm 536 498 92.9% 1 pm – 2 pm 582 541 93.0% 2 pm – 3 pm 562 501 89.1% 3 pm – 4 pm 538 500 92.9% 4 pm – 5 pm 491 448 91.2% 5 pm – 6 pm 507 466 91.9% 6 pm – 7 pm 258 238 92.2%
Total 5,749 5,277 91.8%
Gender Actual Total No. of
Observations Actual Belted No. of
Observations % Safety Belt Use Male 4,593 4,190 91.2%
Female 1,153 1,084 94.0% Unknown 3 3 100.0%
Total 5,749 5,277 91.8%
Age Actual Total No. of
Observations Actual Belted No. of
Observations % Safety Belt Use 0 - 15 81 75 92.6%
16 - 29 871 775 89.0% 30 – 59 4,020 3,697 92.0%
60+ 774 727 93.9% Unknown 3 3 100.0%
Total 5,749 5,277 91.8%
Race Actual Total No. of
Observations Actual Belted No. of
Observations % Safety Belt Use Caucasian 5,411 4,965 91.8%
African-American 205 186 90.7% Other 131 124 94.7%
Unknown 2 2 100.0% Total 5,749 5,277 91.8%

27
Occupants of sport utility vehicles exhibited the highest safety belt use rate among vehicle types at 95.9
percent, followed closely by occupants of vans or minivans at 95.4 percent. Occupants of passenger cars
exhibited a use rate of 94.5 percent, while occupants of pick-up trucks exhibited the lowest use rate at
91.8 percent; consistent with historical trends. Considering days of the week, Fridays demonstrated the
lowest safety belt usage rate with 93.4 percent. Safety belt use rates were highest on Sundays with a rate
of 95.2 percent. The time period of 2:00 PM to 3:00 PM exhibited a lower usage rate than all other times
of the day (93.6 percent), while occupants were mostly likely to wear their safety belts between the hours
of 6:00 PM to 7:00 PM (95.7 percent).
Female occupants had higher use rates than male occupants by 2.4 percent (95.9 percent use rate for
females vs. 93.5 percent use rate for males). The safety belt usage rate was highest among occupants
aged 60 and older at 95.6 percent and lowest for occupants between the ages of 16 to 29 (93.8 percent).
The safety belt use rate for occupants aged 0 to 15 was found to be 95.4 percent while the use rate was
94.6 percent among occupants between 30 and 59. Considering occupant races, the safety belt use rate
was found to be lowest among African American occupants (93.0 percent) and highest for individuals of
‘other’ races (96.8 percent) which includes individuals of Asian descent and Pacific Islanders. Caucasian
occupants were found to have a safety belt use rate of 94.7 percent.
Table 15 summarizes occupant safety belt use rates by gender, age, and race. Vehicle occupants whose
gender could not be identified were excluded from this demographic comparison (40 total observations).
Young African American males aged 16 to 29, as well as young African American females aged 0 to 15
exhibited the lowest belt use rates of all demographic groups with use rates of 90.2 percent and 76.2
percent, respectively. However it should be noted that the sample sizes for these groups were relatively
small. Caucasian females of all ages generally exhibited the highest safety belt use rates compared with
other demographics. Overall, young male pick-up truck occupants exhibited the lowest safety belt use
rates, consistent with past findings.

28
Table 15. All Vehicles Statewide Demographic Summary
Demographic Data All Vehicles Safety Belt Use
Gender Age Race Actual Total No. of
Observations Actual Belted No. of
Observations % Safety Belt
Use
Male
0 - 15
Caucasian 235 227 96.6% African- American 33 31 93.9%
Other 12 11 91.7% Unknown 1 1 100.0%
Total 281 270 96.1%
16 - 29
Caucasian 2,921 2,694 92.2% African- American 592 534 90.2%
Other 270 259 95.9% Unknown 9 8 88.9%
Total 3,792 3,495 92.2%
30 - 59
Caucasian 10,425 9,767 93.7% African-American 1,336 1,223 91.5%
Other 529 510 96.4% Unknown 8 8 100.0%
Total 12,298 11,508 93.6%
60+
Caucasian 2,605 2,469 94.8% African- American 39 37 94.9%
Other 32 32 100.0% Unknown 1 1 100.0%
Total 2,677 2,539 94.8%
Unknown
Caucasian 11 11 100.0% African- American 0 0 N/A
Other 0 0 N/A Unknown 1 1 100.0%
Total 12 12 100.0%
TOTAL 19,060 17,824 93.5%

29
Table 15. All Vehicles Statewide Demographic Summary (Continued)
Demographic Data All Vehicles Safety Belt Use
Gender Age Race Actual Total No. of
Observations Actual Belted No. of
Observations % Safety Belt
Use
Female
0 - 15
Caucasian 228 221 96.9% African- American 21 16 76.2%
Other 16 14 87.5% Unknown 0 0 N/A
Total 265 251 94.7%
16 - 29
Caucasian 3,312 3,161 95.4% African- American 604 570 94.4%
Other 180 175 97.2% Unknown 7 6 85.7%
Total 4,103 3,912 95.3%
30 - 59
Caucasian 7,883 7,568 96.0% African- American 1,305 1,248 95.6%
Other 289 283 97.9% Unknown 6 6 100.0%
Total 9,483 9,105 96.0%
60+
Caucasian 2,359 2,276 96.5% African- American 68 63 92.6%
Other 25 25 100.0% Unknown 1 1 100.0%
Total 2,453 2,365 96.4%
Unknown
Caucasian 7 7 100.0% African- American 0 0 N/A
Other 1 1 N/A Unknown 0 0 N/A
Total 8 8 100.0% TOTAL 16,312 15,641 95.9%
In comparison to 2015, the 2016 Post-CIOT survey revealed a slight increase in safety belt usage from
92.8 percent to 94.5 percent. In any case, continued public awareness and enforcement efforts are
warranted to increase safety belt use. The careful evaluation of these media and enforcement efforts will
allow for the identification of at-risk vehicle occupants and geographic areas prone to low belt use rates.
As shown in this study, young males and pick-up truck drivers continue to exhibit lower safety belt use
rates. Generally, belt use was also lower for those counties in Stratum 3. These areas should be
emphasized in subsequent program efforts.

30
7.2 Hand-Held Device Use Results and Conclusions
As a part of the 2016 Post-CIOT observational survey of safety belt use, hand-held device use was also
recorded for drivers only (passengers were not observed for hand-held device use). A total of 1,977
drivers were observed using hand-held device in some way and the overall weighted hand-held device
use rate was found to be 7.5 percent. The weighted hand-held device use rate (shown in Table 16) was
calculated using the same procedure as the weighted safety belt rate described in the “Overall Statewide
Safety Belt Calculations” section of the report. This rate represents a 0.1 percent decrease from the 7.6
percent hand-held device use rate observed in Michigan in 2015. Nationally, the overall hand-held device
use rate by drivers was found to be 7.8 percent in 2014 [8], which is the last year for which national data
is available. This indicates Michigan’s hand-held device use rate is close to the national average. In
addition to overall hand-held device use, Table 17 presents driver hand-held device use by device type
and use type.
Table 16. Statewide Weighted Hand-Held Device Use Rate for Drivers
Use by Category Use Rate* Standard Error
Overall Hand-Held Device Use
7.5% ± 0.8% 0.4%
* Weighted Safety Belt Usage 95% Confidence Band
Table 17. Statewide Unweighted Hand-Held Device Use Rates by Use Type
Use by Category Total # of Driver
Observations
Total # of Drivers Observed Using
Hand-Held Device
Percent of Hand-Held Device Use
by Type (Drivers)
Talking – Hand-held Device 28,141 1,226 4.4%
Talking – Hands-free Device (Earpiece Observed)
28,141 99 0.4%
Talking – Hands-free Device (Earpiece Not Observed)
28,141 46 0.2%
Typing – Hand-held 28,141 606 2.2%
Overall Hand-Held Device Use
28,141 1,977 7.0%
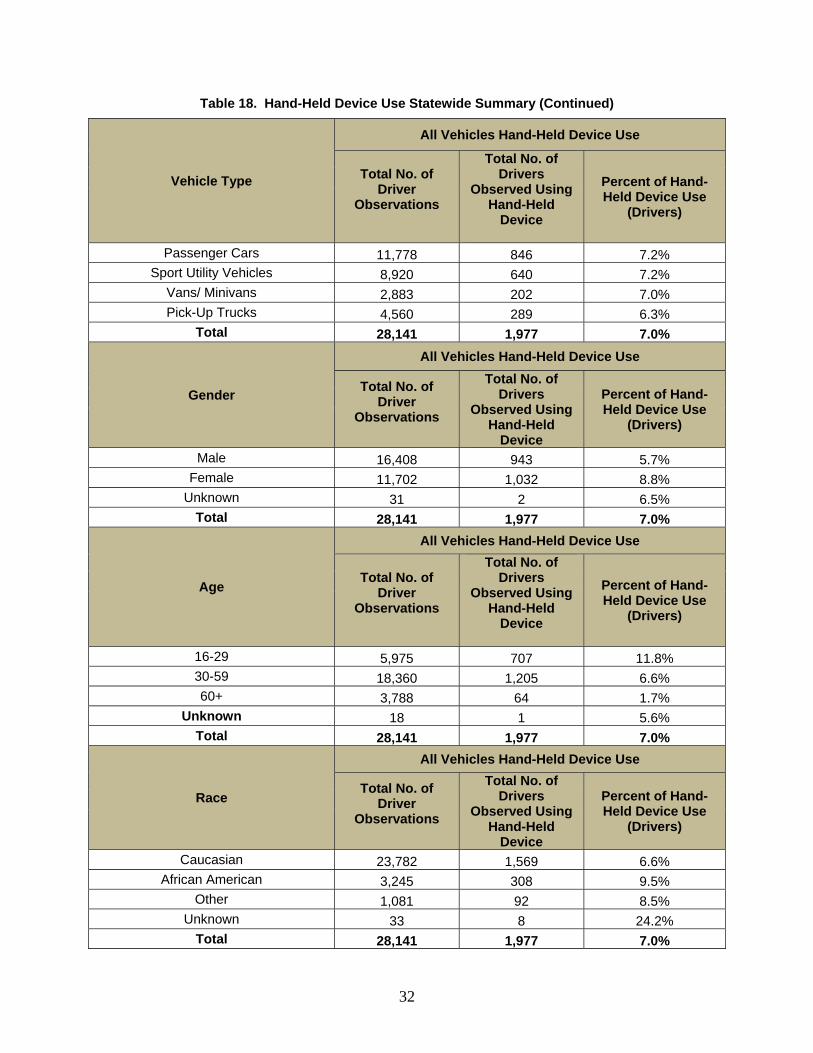
Table 18 summarizes hand-held device use for drivers in terms of day of the week, time of the day,
vehicle type, gender, age and race. Females were found to be more likely to use a hand-held device
while driving than males (8.8 percent and 5.7 percent, respectively). The electronic device use rate was
found to be highest between 4 pm and 5 pm at 8.0 percent, while the hand-held device use rate was
lowest between 10 am and 11 am (6.0 percent). Hand-held device use among drivers less than 30 years
of age was greatest at 11.8 percent, in comparison to 6.6 percent among those between ages 30 and 59

31
and 1.7 percent for drivers age 60 and above. Additionally, African American drivers tended to exhibit
higher hand-held device use rates while driving as compared to other demographics.
Table 18. Hand-Held Device Use Statewide Summary
Day of the Week
All Vehicles Hand-Held Device Use
Total No. of Driver
Observations
Total No. of Drivers
Observed Using Hand-Held
Device
Percent of Hand-Held Device Use
(Drivers)
Sunday 3,621 185 5.1% Monday 3,890 335 8.6% Tuesday 3,110 279 9.0%
Wednesday 3,529 290 8.2% Thursday 4,946 355 7.2%
Friday 4,045 258 6.4% Saturday 5,000 275 5.5%
Total 28,141 1,977 7.0%
Time of the Day
All Vehicles Hand-Held Device Use
Total No. of Driver
Observations
Total No. of Drivers
Observed Using Hand-Held
Device
Percent of Hand-Held Device Use
(Drivers)
7 am - 8 am 1,246 94 7.5% 8 am - 9 am 1,984 134 6.8% 9 am - 10 am 1,796 125 7.0%
10 am - 11 am 3,325 199 6.0% 11 am - 12 pm 2,671 191 7.2% 12 pm - 1 pm 2,769 203 7.3% 1 pm - 2 pm 2,975 214 7.2% 2 pm - 3 pm 2,497 156 6.2% 3 pm - 4 pm 2,817 223 7.9% 4 pm - 5 pm 2,345 187 8.0% 5 pm - 6 pm 2,519 159 6.3% 6 pm - 7 pm 1,197 92 7.7%
Total 28,141 1,977 7.0%
32
Table 18. Hand-Held Device Use Statewide Summary (Continued)
Vehicle Type
All Vehicles Hand-Held Device Use
Total No. of Driver
Observations
Total No. of Drivers
Observed Using Hand-Held
Device
Percent of Hand-Held Device Use
(Drivers)
Passenger Cars 11,778 846 7.2% Sport Utility Vehicles 8,920 640 7.2%
Vans/ Minivans 2,883 202 7.0% Pick-Up Trucks 4,560 289 6.3%
Total 28,141 1,977 7.0%
Gender
All Vehicles Hand-Held Device Use
Total No. of Driver
Observations
Total No. of Drivers
Observed Using Hand-Held
Device
Percent of Hand-Held Device Use
(Drivers)
Male 16,408 943 5.7% Female 11,702 1,032 8.8%
Unknown 31 2 6.5% Total 28,141 1,977 7.0%
Age
All Vehicles Hand-Held Device Use
Total No. of Driver
Observations
Total No. of Drivers
Observed Using Hand-Held
Device
Percent of Hand-Held Device Use
(Drivers)
16-29 5,975 707 11.8% 30-59 18,360 1,205 6.6% 60+ 3,788 64 1.7%
Unknown 18 1 5.6% Total 28,141 1,977 7.0%
Race
All Vehicles Hand-Held Device Use
Total No. of Driver
Observations
Total No. of Drivers
Observed Using Hand-Held
Device
Percent of Hand-Held Device Use
(Drivers)
Caucasian 23,782 1,569 6.6% African American 3,245 308 9.5%
Other 1,081 92 8.5% Unknown 33 8 24.2%
Total 28,141 1,977 7.0%
33
REFERENCES
1. Early Estimate of Motor Vehicle Traffic Fatalities in 2015. Rep. no. DOT HS 812 217. Washington
DC: National Highway Traffic Safety Administration, 2015.
2. NHTSA’s National Center for Statistics and Analysis, “Traffic Safety Facts - 2014 Data –
Occupant Protection”, U.S. Department of Transportation, NHTSA, DOT HS 812 262, 2016.
3. Blincoe, L. J., Miller, T. R., Zaloshnja, E., Lawrence, B. A. The Economic and Societal Impact of
Motor Vehicle Crashes, 2010 (Revised). Washington, DC: National Highway Traffic Safety
Administration, 2015.
4. Policy Impact: Seat Belts. Centers for Disease Control and Prevention. 20 Jan. 2012. Web. 14
June 2016.
5. Seat Belt Use in 2015 – Overall results. (Traffic Safety Facts Research Note. Report No. DOT HS
812 243). Washington, DC: National Highway Traffic Safety Administration, 2016.
6. Seat Belt Use in 2015 - Use Rates in the States and Territories. Rep. no. DOT HS 812 274.
Washington DC: National Highway Traffic Safety Administration, 2016.
7. National Highway Traffic Safety Administration, An Example of a Compliant State Seat Belt Use
Survey Design, DOT HS 811 494, June 2011.
8. Driver Electronic Device Use in 2014. (Traffic Safety Facts Research Note. Report No. DOT HS
812 197). Washington, DC: National Highway Traffic Safety Administration, 2015.

34
APPENDIX I Michigan Safety Belt Survey Cover Sheet and Data Collection Form

35
DIRECT OBSERVATION SURVEY COVER SHEET Date: _______ - _______ - 2016 Observer’s Name:__________________________ Site Identification: Site Location: _________________________________________________________ Site Number: City___________________________County____________________________Stratum_____ Alternate Site Information: Is this an alternate site? No Yes (Circle one) If yes, please provide a reason for using an alternate site from the reserve list: ____________________________________________________________________ Site Description: Observation direction: Northbound Southbound Eastbound Westbound
Number of lanes observed: ____________
Total number of lanes in this direction: ____________
Weather Conditions: Clear Light Fog Light Rain Site Start and End Time: Start time: ______________am/pm End time: _______________am/pm Sample Size
60 Minute Volume Count (for lanes being observed): ___________Vehicles
Number of Observations Recorded in 60 min: ___________Vehicles
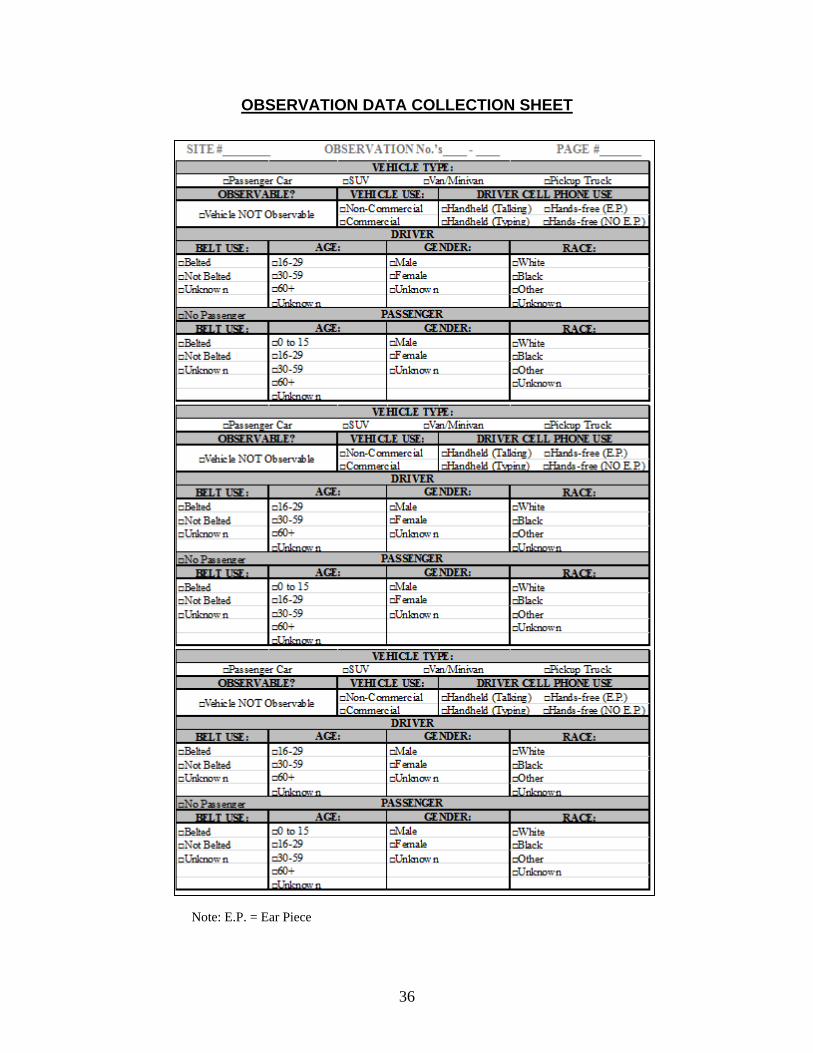
36
OBSERVATION DATA COLLECTION SHEET
Note: E.P. = Ear Piece

37
APPENDIX II Resumes of Timothy J. Gates and Peter T. Savolainen

38
Dr. Timothy J. Gates Summary
Dr. Timothy J. Gates is the current Principal Investigator of the Direct Observation Survey of Safety Belt Use. Dr. Gates is an Associate Professor in the Michigan State University (MSU) Department of Civil and Environmental Engineering. He has more than eight years of experience with direct observation surveys of safety restraint use. This includes a diverse range of experiences in sample design and selection, field data collection methods, observer training, statistical systems development, and optimization techniques. He also has expertise in the areas of survey research methodology, data processing, and statistical quality control.
Education
Ph.D., Civil Engineering, University of Wisconsin, 2007 M.A., Civil Engineering, Michigan State University, 2000 B.S., Civil Engineering, Michigan State University, 2000
Professional Associations
American Society of Civil Engineers Institute of Transportation Engineers
Computer Skills
Operation Systems: Windows, iOs Software: LIMDEP, SAS, SPSS, SUDAAN, Microsoft PowerPoint, Excel and Word
Relevant Project Experience Wayne State University (2007 to Present)
Direct Observation Surveys of Seat Belt Use –PI or co-PI on OHSP-sponsored Michigan safety belt use survey from FY 2012 to present. Participated in proposal development, planning, survey implementation, data collection, quality control, data analysis, and report preparation. Direct Observation Surveys of Commercial Motor Vehicle Seat Belt Use – Co-PI on OHSP-sponsored Michigan seat belt use survey for commercial motor vehicle occupants during FY 2012 and 2015. Direct Observation Surveys of Child Restraint Device Use and Misuse (including Booster Seat Use) – PI or co-PI on OHSP-sponsored child restraint device use/misuse survey, including booster seats in FY 2009, 2011, 2013, and 2015. Direct Observation Surveys of Motorcycle Helmet Use – co-PI on OHSP-sponsored motorcycle helmet use survey in FY 2013.

39
Publications
Savolainen, P., Gates, T., and T. Datta (2009). 2009 Direct Observation Surveys of Booster Seat Use, Report to Michigan OHSP, Lansing, MI.
Gates, T., Savolainen, P., and T. Datta (2009). 2009 Survey of Child Restraint Device Use and Misuse in Michigan, Report to Michigan OHSP, Lansing, MI.
Datta, T., Savolainen, P., Gates, T., and A. Das (2010). Evaluation of the 2010 Click It or Ticket Mobilization, Report to Michigan OHSP, Lansing, MI.
Savolainen, P., Gates, T., and T. Datta (2010). 2010 Direct Observation Surveys of Booster Seat Use, Report to Michigan OHSP, Lansing, MI.
Datta, T., Savolainen, P., Gates, T., and A. Das (2010). 2010 Annual Direct Observation Survey of Safety Belt Use, Report to Michigan OHSP, Lansing, MI.
Savolainen, P., Gates, T., Datta, T., and S. Boileau (2011). Direct Observation Survey of Child Restraint/Booster Seat Use, Report to Michigan OHSP, Lansing, MI.
Datta, T.K., Savolainen, P.T., Gates, T.J., and B.J. Russo (2012), Commercial Motor Vehicle Direct Observation Survey, Report to OHSP, Lansing, MI.
40
Dr. Peter T. Savolainen Summary
Dr. Peter T. Savolainen is an Associate Professor in the Iowa State University Department of Civil, Construction, and Environmental Engineering. Dr. Savolainen serves as the lead statistical advisor for this project. Prior to joining Iowa State University in 2014, he was an Associate Professor of Civil Engineering at Wayne State University. He has more than nine years of experience with direct observation surveys of safety restraint use. This includes a diverse range of experiences in sample design and selection, data weighting, imputation, variance estimation, statistical systems development, and optimization techniques. He also has expertise in the areas of survey research methodology, data processing, and statistical quality control. Dr. Savolainen also teaches graduate level courses on civil engineering research methods and applications, as well as statistics and econometric methods of data analysis. He is a proficient user of various statistical analysis software packages, including LIMDEP, SAS, SPSS, and SUDAAN.
Education
Ph.D., Civil Engineering, Purdue University, 2006 M.A., Civil Engineering, Purdue University, 2004 B.S., Civil Engineering, Michigan Technological University, 2002
Professional Associations
American Society of Civil Engineers American Statistical Association Institute of Transportation Engineers
Computer Skills
Operation Systems: Windows, iOs Software: LIMDEP, SAS, SPSS, SUDAAN, Microsoft PowerPoint, Excel and Word
Relevant Project Experience Wayne State University (2006 to Present)
Direct Observation Surveys of Seat Belt Use –PI or co-PI on OHSP-sponsored Michigan safety belt use survey from FY 2008 to 2010 and FY 2012 to present. Participated in proposal development, planning, survey implementation, data collection, quality control, data analysis, and report preparation. Direct Observation Surveys of Commercial Motor Vehicle Seat Belt Use – Co-PI on OHSP-sponsored Michigan seat belt use survey for commercial motor vehicle occupants during FY 2012. Direct Observation Surveys of Child Restraint Device Use and Misuse (including Booster Seat Use) – PI or co-PI on OHSP-sponsored child restraint device use/misuse survey, including booster seats in FY 2009, 2011, 2013, and 2015. Direct Observation Surveys of Motorcycle Helmet Use – co-PI on OHSP-sponsored motorcycle helmet use survey in FY 2013.

41
Publications
Datta, T. and P. Savolainen (2008). Evaluation of the 2008 May Click It or Ticket Mobilization, Report to Michigan OHSP, Lansing, MI.
Datta, T., Savolainen, P., Vuyyuru, S., and A. Jayadevan (2008). 2008 Annual Direct Observation Survey of Safety Belt Use, Report to Michigan OHSP, Lansing, MI.
Datta, T. and P. Savolainen (2009). Evaluation of the 2009 May Click It or Ticket Mobilization, Report to Michigan OHSP, Lansing, MI.
Savolainen, P., Gates, T., and T. Datta (2009). 2009 Direct Observation Surveys of Booster Seat Use, Report to Michigan OHSP, Lansing, MI.
Gates, T., Savolainen, P., and T. Datta (2009). 2009 Survey of Child Restraint Device Use and Misuse in Michigan, Report to Michigan OHSP, Lansing, MI.
Datta, T. and P. Savolainen (2009). 2009 Annual Direct Observation Survey of Safety Belt Use, Report to Michigan OHSP, Lansing, MI.
Datta, T., Savolainen, P., Gates, T., and A. Das (2010). Evaluation of the 2010 Click It or Ticket Mobilization, Report to Michigan OHSP, Lansing, MI.
Savolainen, P., Gates, T., and T. Datta (2010). 2010 Direct Observation Surveys of Booster Seat Use, Report to Michigan OHSP, Lansing, MI.
Datta, T., Savolainen, P., Gates, T., and A. Das (2010). 2010 Annual Direct Observation Survey of Safety Belt Use, Report to Michigan OHSP, Lansing, MI.
Savolainen, P., Gates, T., Datta, T., and S. Boileau (2011). Direct Observation Survey of Child Restraint/Booster Seat Use, Report to Michigan OHSP, Lansing, MI.
Datta, T.K., Savolainen, P.T., Gates, T.J., and B.J. Russo (2012), Commercial Motor Vehicle Direct Observation Survey, Report to OHSP, Lansing, MI.

42
APPENDIX III
List of Observation Locations by County, Stratum, and Road Classification Including Belt Use
Observation Data

43
Total Belted
1 Ingham I-96 Bus and N Martin Luther King Jr Blvd Original Primary 194 177 82518.6
1 Ingham E Saginaw St and Hagadorn Rd Original Primary 136 134 146803.1
1 Ingham US Hwy 127 and N Cedar St Original Primary 219 207 44481.7
1 Kalamazoo W Kalamazoo Ave and N Rose St Original Primary 230 208 63521.8
1 Kalamazoo E Michigan Ave and N Edwards St Original Primary 279 254 162535.4
1 Kalamazoo I-94 and Portage Rd Original Primary 349 330 75509.7
1 Kalamazoo I-94 and S Kalamazoo St Original Primary 256 240 39428.1
1 Oakland I-96 and 8 Mile Rd Original Primary 288 275 121527.4
1 Oakland I-96 and Milford Rd Original Primary 182 178 31072.4
1 Oakland I-696 and Orchard Lake Rd Original Primary 358 335 127337.5
1 Oakland I-75 and Joslyn Rd Original Primary 331 321 77293.0
1 Washtenaw I-94 and Kalmbach Rd Original Primary 34 32 31429.5
1 Washtenaw US Hwy 12 and S Huron St Original Primary 165 158 107230.1
1 Washtenaw US Hwy 12 and S Huron St Original Primary 209 199 207958.6
1 Washtenaw I-94 Bus and N Maple Rd Original Primary 225 206 152236.0
1 Ingham State Hwy 99 and W Holmes Rd Original Secondary 197 184 95535.0
1 Ingham Lansing Rd and W Mt Hope Hwy Original Secondary 96 89 86752.2
1 Ingham E Saginaw St and N Larch St Original Secondary 214 210 197870.8
1 Ingham State Hwy 43 and Marsh Rd Original Secondary 223 209 121916.7
1 Ingham S Martin Luther King Jr Blvd and W Jolly Rd Original Secondary 187 176 89651.9
1 Ingham Eaton Rapids Rd and Bishop Rd Original Secondary 244 231 96247.3
1 Ingham State Hwy 52 and N Clinton St Original Secondary 211 192 42047.3
1 Kalamazoo State Hwy 43 and Solon St Original Secondary 316 284 172775.3
1 Kalamazoo US Hwy 131 and W Centre Ave Original Secondary 65 59 44561.0
1 Kalamazoo State Hwy 43 and M 40 Original Secondary 153 148 99004.3
1 Kalamazoo E Michigan Ave and 35th St N Original Secondary 199 183 46120.7
1 Kalamazoo E C Ave and 32nd St N Original Secondary 58 47 34163.5
1 Oakland Woodward Ave and W Big Beaver Rd Original Secondary 229 220 378426.1
1 Oakland State Hwy 10 and W 13 Mile Rd Original Secondary 120 116 115426.1
1 Oakland Telegraph Rd and W Long Lake Rd Original Secondary 267 246 70101.7
1 Oakland State Hwy 15 and E Seymour Lake Rd Original Secondary 298 278 91060.7
1 Oakland State Hwy 5 and W 8 Mile Rd Original Secondary 177 167 326830.5
1 Oakland Telegraph Rd and W Maple Rd Original Secondary 174 168 267190.6
1 Oakland Dixie Hwy and Williams Lake Rd Original Secondary 170 159 282401.6
1 Oakland S Main St and E University Dr Original Secondary 185 174 241902.8
1 Oakland State Hwy 150 and E Avon Rd Original Secondary 152 149 249248.9
1 Oakland Lapeer Rd and Dutton Rd Original Secondary 164 159 198831.4
1 Oakland State Hwy 59 and Hickory Ridge Rd Original Secondary 287 271 118685.8
1 Oakland State Hwy 5 and W 13 Mile Rd Original Secondary 343 328 273377.7
1 Oakland Woodward Ave and W 12 Mile Rd Original Secondary 342 325 204358.4
1 Washtenaw US Hwy 23 and Washtenaw Ave Original Secondary 195 186 58134.5
1 Washtenaw W Michigan Ave and N Ann Arbor St Original Secondary 167 160 79938.0
1 Washtenaw Ann Arbor Hill and E Main St Original Secondary 194 181 35485.9
1 Washtenaw W Michigan Ave and Platt Rd Original Secondary 217 204 98521.9
1 Washtenaw State Hwy 52 and E Old US-12 Original Secondary 222 208 144966.4
1 Ingham N Waverly Rd and Columbia Hwy Original Local 41 36 1431232.1
1 Oakland Heslip Dr and W 9 Mile Rd Original Local 72 66 1741933.7
1 Oakland N Glenwood Ave and N Perry Street Original Local 165 154 6255973.6
1 Oakland White Pines Dr and Beck Rd Original Local 52 49 1452279.6
1 Washtenaw E Arkona Rd and Dexter St Original Local 113 108 1470850.9
Sample Weight
Belt Use Stratum
County Site Location Site Type Road TypeActual Observations

44
Total Belted
2 Allegan US Hwy 31 and M 89 Original Primary 70 64 67323.4
2 Bay I-75 and E Pinconning Rd Original Primary 54 53 65893.8
2 Bay US Hwy 10 and W Midland Rd Original Primary 56 53 65293.1
2 Calhoun I-69 and M 60 E Original Primary 64 60 75017.6
2 Calhoun I-194 and E Columbia Ave Original Primary 211 205 94135.4
2 Eaton I-96 and W Saginaw Hwy Original Primary 135 132 107570.2
2 Eaton I-69 and E Clinton Trail Original Primary 80 77 69145.0
2 Jackson I-94 and 28 Mile Rd Original Primary 112 109 66326.5
2 Kent I-96 and E Beltline Ave NE Original Primary 321 303 108873.8
2 Kent I-96 and 28th St SE Original Primary 310 301 106123.6
2 Kent I-96 and Walker Ave NW Original Primary 120 108 200672.0
2 Livingston I-96 and Fowlerville Rd Original Primary 151 149 77762.1
2 Monroe Detroit-Toledo Expy and Luna Pier Rd Original Primary 49 46 68926.4
2 Monroe I-75 and S Otter Creek Rd Original Primary 29 29 62514.6
2 Ottawa I-196 and Adams St Original Primary 132 130 64317.9
2 Allegan Viaduct Rd and Central Ave Original Secondary 232 227 165806.3
2 Allegan M-89/M-40 and N. Cedar St. Original Secondary 293 279 130630.7
2 Allegan US Hwy 131 and W Superior St Original Secondary 224 210 127743.2
2 Bay Bay Glad Rd and W Neuman Rd Original Secondary 5 4 37955.7
2 Bay State Hwy 13 and W Thomas St Original Secondary 283 276 303645.3
2 Bay State Hwy 138 and S Tuscola Rd Original Secondary 18 16 75911.3
2 Calhoun W Dickman Rd and Hill Brady Rd N Original Secondary 191 180 188599.6
2 Calhoun M 66 and E Burr Oak Rd Original Secondary 210 192 102733.3
2 Eaton N Michigan Rd and Holt Hwy Original Secondary 123 120 142646.6
2 Eaton State Hwy 50 and E Lawrence Ave Original Secondary 175 169 104983.7
2 Eaton W Capital Ave and S Main St Original Secondary 238 229 113867.0
2 Eaton M-43 and M-66 Original Secondary 226 216 92664.2
2 Grand Traverse State Hwy 72 and N Division St Original Secondary 314 305 350729.5
2 Grand Traverse US Hwy 31 and M 72 Original Secondary 285 277 246270.5
2 Jackson US Hwy 127 Bus and Washington St Original Secondary 241 231 212069.7
2 Jackson State Hwy 50 and US-127 Original Secondary 264 254 242484.5
2 Jackson S Meridian Rd and Jefferson Rd Original Secondary 304 301 193838.7
2 Jackson N Main St and Chicago St Original Secondary 189 172 171154.1
2 Kent 17 Mile Rd NE and Algoma Ave NE Original Secondary 139 129 101215.1
2 Kent Wilson Ave SW and Burton St SW Original Secondary 176 170 205544.5
2 Kent State Hwy 11 and 3 Mile Rd NW Original Secondary 227 219 117188.1
2 Kent State Hwy 6 and Broadmore Ave SE Original Secondary 200 194 107816.1
2 Livingston Old US Hwy 23 and White Lake Rd Original Secondary 106 101 91264.2
2 Livingston E State Hwy 36 and Chilson Rd Original Secondary 176 169 337135.6
2 Midland Isabella Rd and S Meridian Rd Original Secondary 253 239 400553.4
2 Monroe W Monroe St and Riley St / Main St Original Secondary 332 318 275079.4
2 Monroe US Hwy 23 and Tecumseh St Original Secondary 172 171 246711.8
2 Monroe State Hwy 50 and Ridge Hwy Original Secondary 217 213 186498.2
2 Ottawa State Hwy 45 and W Olive Rd Original Secondary 70 68 87897.3
2 Ottawa Chicago Dr and Balsam Dr Original Secondary 269 259 171895.4
2 Calhoun E Dr N and 9 Mile Rd Original Local 21 20 2441051.4
2 Jackson Springport Rd and Parma Rd Original Local 2 2 4882102.8
2 Kent Whistlevale Dr and 76th St SW Original Local 12 12 2441051.4
2 Kent 5 Mile Rd NE and Lincoln Lake Rd. Original Local 132 121 6730666.0
2 Midland Foster Rd and E Wheeler St Original Local 43 38 2441051.4
Belt Use Stratum
County Site Location Site Type Road TypeActual Observations Sample
Weight

45
Total Belted
3 Berrien I-94 and Sawyer Rd Original Primary 155 153 78177.7
3 Berrien US Hwy 31 and E Napier Ave Original Primary 206 192 424135.6
3 Berrien I-196 and Hagar Shore Rd Original Primary 87 81 77380.0
3 Branch I-69 and Chicago St Original Primary 181 178 132360.6
3 Clare US Hwy 127 and Clare Rd Original Primary 81 79 83332.3
3 Clare US Hwy 127 and E Colonville Rd Original Primary 283 270 113278.0
3 Genesee I-69 and Grand River Rd Original Primary 38 34 80048.3
3 Genesee I-75 and W Pierson Rd Original Primary 338 302 300367.6
3 Saginaw US Hwy 23 and Dixie Hwy Original Primary 76 68 96725.0
3 Saginaw US Hwy 23 and Dixie Hwy Original Primary 275 255 136994.2
3 Shiawassee I-69 and State Hwy 71 Original Primary 91 88 89439.2
3 St. Clair I-94 and Fred W Moore Hwy Original Primary 123 119 82743.0
3 St. Clair I-94 and Gratiot Rd Original Primary 165 157 121673.4
3 St. Clair I-94 and Gratiot Rd Original Primary 213 210 85770.6
3 Van Buren I-196 and 32nd Ave Original Primary 26 25 77380.0
3 Lapeer N Branch Rd & N Van Dyke Original Secondary 52 50 82841.2
3 Lenawee US Hwy 12 and M-52 Original Secondary 125 122 273310.9
3 Lenawee State Hwy 52 and W Monroe Rd Original Secondary 111 104 250969.3
3 Lenawee State Hwy 156 and W Carleton Rd Original Secondary 76 68 174159.3
3 Montcalm N Greenville Rd and W Howard City Edmore Original Secondary 124 113 241898.4
3 Montcalm State Hwy 46 and Holland Rd Original Secondary 209 193 187491.4
3 Montcalm State Hwy 66 and W Stanton Rd Original Secondary 250 222 91532.6
3 Montcalm Greenville Rd and E Vandeinse Rd Original Secondary 347 311 410275.2
3 Muskegon E Apple Ave and S Maple Island Rd Original Secondary 196 181 298202.0
3 Newaygo M-37 (Evergreen Dr) and Wilcox Ave. Original Secondary 206 190 377804.0
3 Newaygo State Hwy 20 and N Evergreen Dr Original Secondary 100 95 181454.9
3 Newaygo State Hwy 82 and Mason Dr Original Secondary 171 152 179036.4
3 Newaygo Evergreen Dr and Curve St Original Secondary 148 143 351908.6
3 Saginaw State Hwy 52 and E 2nd St Original Secondary 117 100 212733.3
3 Saginaw Oakley Rd and W Brady Rd Original Secondary 146 131 214323.0
3 Saginaw N Main St and E Holland Rd Original Secondary 166 160 209571.3
3 Saginaw Vassar Rd and E Washington Rd Original Secondary 134 130 191230.1
3 Saginaw M-81 and W Vassar Rd/M-15 Original Secondary 170 167 199756.8
3 Sanilac State Hwy 53 and W Marlette Rd Original Secondary 229 203 479406.3
3 Sanilac State Hwy 46 and N Van Dyke Rd Original Secondary 121 110 184497.6
3 Sanilac State Hwy 19 and Maple Valley St Original Secondary 252 236 476801.8
3 Sanilac S Elk St and E Sanilac Rd Original Secondary 173 164 112672.9
3 Sanilac State Hwy 46 and S Lakeshore Rd Original Secondary 53 48 170442.0
3 Shiawassee S M 52 and W Lansing Rd Original Secondary 247 230 383964.5
3 St. Clair State Hwy 29 and Bethuy Rd Original Secondary 231 219 445724.5
3 St. Clair Gratiot Blvd and Huron Blvd Original Secondary 286 255 751880.1
3 St. Clair Beard Rd and North Rd Original Secondary 146 137 84748.6
3 St. Joseph US Hwy 12 and M-62 Original Secondary 187 179 247311.0
3 St. Joseph US Hwy 131 N and N Washington St Original Secondary 67 61 79224.7
3 St. Joseph State Hwy 66 and S Centerville Rd Original Secondary 214 202 492319.7
3 Ionia Button Rd and N Whites Bridge Rd Original Local 52 47 9088223.7
3 Lenawee Rodesiler Hwy and Yankee Rd Original Local 16 13 4631194.1
3 Muskegon Shoreline Dr and Terrace St Original Local 218 212 19298458.3
3 Saginaw N Michigan Rd and Tittabawassee Rd Original Local 149 137 9859467.8
3 Shiawassee Lemon Rd and E Newburg Rd Original Local 4 4 8644895.7
Sample Weight
Belt Use Stratum
County Site Location Site Type Road TypeActual Observations

46
Total Belted
4 Macomb Ford Fwy and N River Rd Original Primary 159 152 54142.2
4 Macomb I-696 and Hoover Rd Original Primary 113 106 382522.8
4 Macomb Walter P Reuther Fwy and Gratiot Ave Original Primary 276 260 93937.9
4 Macomb Ford Fwy and Little Mack Ave Original Primary 187 183 36931.2
4 Wayne Detroit Toledo Fwy and West Rd Original Primary 205 191 29039.9
4 Wayne Edsel Ford Fwy and Vernier Rd / M-102 Original Primary 260 251 181010.7
4 Wayne Woodward Ave and 7 Mile Rd Original Primary 158 154 66607.0
4 Wayne I-275 and S Huron Rd Original Primary 179 163 27416.6
4 Wayne I-275 and Ford Rd Original Primary 296 282 107580.9
4 Wayne I-94 and Wayne Rd Original Primary 189 173 31039.1
4 Wayne Detroit Industrial Expy and Belleville Rd Original Primary 188 179 154930.3
4 Wayne I-94 and Middlebelt Rd Original Primary 181 173 83121.5
4 Wayne I-75 and Northline Rd Original Primary 178 175 57823.7
4 Wayne I-75 and Charter St Original Primary 239 232 31526.9
4 Wayne Walter P Chrysler Fwy and Mack Ave Original Primary 154 150 107103.8
4 Macomb State Hwy 53 and 23 Mile Rd Original Secondary 134 127 115579.2
4 Macomb State Hwy 53 Byp and Van Dyke Rd Original Secondary 25 25 31567.9
4 Macomb State Hwy 53 Byp and 32 Mile Rd Original Secondary 142 134 172916.7
4 Macomb State Hwy 53 and S Van Dyke Rd Original Secondary 162 156 260899.4
4 Macomb State Hwy 59 and N Groesbeck Hwy / N. Ave Original Secondary 171 168 168045.7
4 Macomb 20 Mile Rd and Romeo Plank Rd Original Secondary 205 195 192687.2
4 Macomb Hall Rd and Schoenherr Rd Original Secondary 241 232 319900.3
4 Macomb State Hwy 19 and 32 Mile Rd / Division Rd Original Secondary 197 186 130245.2
4 Macomb Van Dyke Ave and 12 Mile Rd Original Secondary 163 158 226597.0
4 Macomb Earl Memorial Hwy and E 14 Mile Rd Original Secondary 166 158 260269.6
4 Macomb Van Dyke Ave and 15 Mile Rd Original Secondary 146 141 290209.4
4 Macomb Metro Pkwy Crossover - EB and Curwood Dr Original Secondary 148 141 103860.8
4 Macomb Gratiot Ave and 14 Mile Rd Original Secondary 269 253 246657.7
4 Macomb S Gratiot Ave and 15 Mile Rd Original Secondary 290 273 128649.1
4 Macomb State Hwy 3 and 10 Mile Rd Original Secondary 265 250 181408.3
4 Wayne US Hwy 24 and Van Horn Rd Original Secondary 185 178 89573.9
4 Wayne Fort St and Van Horn Rd Original Secondary 109 107 273131.0
4 Wayne State Hwy 85 and Sibley Rd Original Secondary 315 301 161697.8
4 Wayne Walter P Chrysler Fwy and Caniff St Original Secondary 222 214 212443.4
4 Wayne State Hwy 10 and 7 Mile Rd Original Secondary 299 273 62336.6
4 Wayne Grand River Ave and Fenkell St Original Secondary 112 94 51837.8
4 Wayne Grand River Ave and Beech-Daly Rd Original Secondary 329 312 169921.0
4 Wayne Michigan Ave and Oakwood Blvd Original Secondary 252 234 79551.1
4 Wayne US Hwy 12 and Venoy Rd Original Secondary 196 186 105713.5
4 Wayne State Hwy 153 and N Wayne Rd Original Secondary 333 313 114520.0
4 Wayne Telegraph Rd and Wick Rd Original Secondary 219 207 288203.2
4 Wayne S Telegraph Rd and Van Born Rd Original Secondary 253 248 130735.7
4 Wayne Michigan Ave and Evergreen Rd Original Secondary 160 155 299602.8
4 Wayne State Hwy 39 and Oakwood Blvd Original Secondary 186 184 81789.6
4 Wayne State Hwy 3 and Grand Blvd W Original Secondary 302 287 99459.6
4 Macomb Hiawatha Dr and Jewell Rd Original Local 52 48 2462422.5
4 Macomb Beacon Square Dr and 21 Mile Rd Original Local 98 94 1223000.6
4 Macomb Pinehurst and Martin Rd Original Local 28 24 1248051.5
4 Wayne Pinewood Ave and Hoover St Original Local 20 18 1205015.3
4 Wayne Prevost St and Grand River Ave Original Local 5 5 2410030.6
Belt Use Stratum
County Site Location Site Type Road TypeActual Observations Sample
Weight