Embed Size (px)
Citation preview

June 2017
2016 PBR Progress Report 2012 – 2016 Performance Based Regulation
2016 Progress Report

EPCOR Water Services Inc. Water and Wastewater Treatment PBR 2012-2016
EPCOR Water Services May 1, 2017 2016 PBR Progress Report
Table of Contents 1 EXECUTIVE SUMMARY ......................................................................................................................................... 1
FINANCIAL PERFORMANCE ................................................................................................................................................ 1 1.1 CAPITAL EXPENDITURES ................................................................................................................................................... 2 1.2 OPERATIONAL PERFORMANCE ........................................................................................................................................... 2 1.3 RATES AND BILL COMPARISONS ......................................................................................................................................... 3 1.4 NON-ROUTINE ADJUSTMENTS ........................................................................................................................................... 4 1.5
2 PBR FRAMEWORK ............................................................................................................................................... 5
ELEMENTS OF PBR .......................................................................................................................................................... 5 2.1 RISKS AND INCENTIVES ..................................................................................................................................................... 5 2.2
3 2016 PBR RESULTS - IN-CITY WATER .................................................................................................................... 7
CONSUMPTION AND CUSTOMER COUNTS - IN-CITY WATER .................................................................................................... 7 3.1 FINANCIAL PERFORMANCE ................................................................................................................................................ 8 3.2
Net Income and Return on Equity - In-City Water ............................................................................................ 8 3.2.1 Revenue - In-City Water ................................................................................................................................... 8 3.2.2 Operating Costs ................................................................................................................................................ 9 3.2.3 Depreciation Expense ..................................................................................................................................... 14 3.2.4 Interest Expense and Cost of Debt .................................................................................................................. 14 3.2.5 Capital Expenditures ....................................................................................................................................... 15 3.2.6 Rate Base and Return on Equity ..................................................................................................................... 18 3.2.7
RATES AND BILL COMPARISONS ....................................................................................................................................... 19 3.3 In-City Water Rates ........................................................................................................................................ 19 3.3.1 Water Rate Structure by Customer Class ....................................................................................................... 20 3.3.2 Water Bill Comparisons to Other Communities .............................................................................................. 20 3.3.3
OPERATIONAL PERFORMANCE MEASURES ......................................................................................................................... 22 3.4 System Reliability Index .................................................................................................................................. 23 3.4.1 Water Quality Index ....................................................................................................................................... 24 3.4.2 Customer Service Index .................................................................................................................................. 25 3.4.3 Environment Index ......................................................................................................................................... 26 3.4.4 Safety Index .................................................................................................................................................... 26 3.4.5
4 2015 PBR RESULTS - WASTEWATER ................................................................................................................... 28
CONSUMPTION AND CUSTOMER COUNT ........................................................................................................................... 28 4.1 FINANCIAL PERFORMANCE .............................................................................................................................................. 28 4.2
Net income and Return on Equity ................................................................................................................... 28 4.2.1 Revenue .......................................................................................................................................................... 29 4.2.2 Operating Costs .............................................................................................................................................. 30 4.2.3 Depreciation Expense ..................................................................................................................................... 33 4.2.4 Interest Expense and Cost of Debt .................................................................................................................. 33 4.2.5 Capital Expenditures ....................................................................................................................................... 34 4.2.6 Rate Base and Return on Equity ..................................................................................................................... 36 4.2.7
RATES AND BILL COMPARISONS ....................................................................................................................................... 38 4.3 Wastewater Treatment Rates ........................................................................................................................ 38 4.3.1 Wastewater Treatment Rate Structure by Customer Class ............................................................................ 38 4.3.2 Wastewater Bill Comparisons to Other Communities .................................................................................... 38 4.3.3
OPERATIONAL PERFORMANCE MEASURES ......................................................................................................................... 40 4.4 System Reliability Index .................................................................................................................................. 40 4.4.1

Water and Wastewater Treatment PBR 2012-2016 EPCOR Water Services Inc.
May 1, 2017 ii
Wastewater Quality Index .............................................................................................................................. 40 4.4.2 Customer Service Index .................................................................................................................................. 41 4.4.3 Environmental Index....................................................................................................................................... 42 4.4.4 Safety Index .................................................................................................................................................... 42 4.4.5
5 FUTURE PLANS AND CHALLENGES ...................................................................................................................... 44
PBR 2017-2021 ......................................................................................................................................................... 44 5.1 Financial Performance .................................................................................................................................... 44 5.1.1 Operational Performance ............................................................................................................................... 44 5.1.2 Environmental Initiatives................................................................................................................................ 45 5.1.3
PROVINCIAL AND FEDERAL GOVERNMENT INITIATIVES .......................................................................................................... 45 5.2 Water ............................................................................................................................................................. 45 5.2.1 Wastewater .................................................................................................................................................... 45 5.2.2
TRANSFER OF DRAINAGE SERVICES TO EPCOR ................................................................................................................... 46 5.3
APPENDIX A: HISTORICAL CONSUMPTION ................................................................................................................. 47
APPENDIX A-1: HISTORICAL CONSUMPTION - IN-CITY WATER ....................................................................................................... 47 APPENDIX A-2: HISTORICAL CONSUMPTION - WASTEWATER ......................................................................................................... 47
APPENDIX B: HISTORICAL SUMMARY OF FINANCIAL PERFORMANCE .......................................................................... 48
APPENDIX B-1: FINANCIAL PERFORMANCE – IN-CITY WATER ........................................................................................................ 48 B-1-1: Net Income and Return on Equity - In-City Water ............................................................................................. 48
B-1-2: Revenue - In-City Water ...................................................................................................................... 48 5.3.1B-1-3: Operating Costs - In-City Water ........................................................................................................................ 49
APPENDIX B-2: FINANCIAL PERFORMANCE - WASTEWATER ........................................................................................................... 50 B-2-1: Net Income and Return on Equity - Wastewater .............................................................................................. 50 B-2-2: Revenue - Wastewater ...................................................................................................................................... 50 B-2-3: Operating Costs - Wastewater .......................................................................................................................... 51
APPENDIX C: AFFILIATE TRANSACTIONS ..................................................................................................................... 52
APPENDIX C-1: AFFILIATE TRANSACTIONS SUMMARY - IN-CITY WATER ........................................................................................... 52 APPENDIX C-2: AFFILIATE TRANSACTIONS SUMMARY - WASTEWATER ............................................................................................. 53
APPENDIX D: WATER AND WASTEWATER TREATMENT RATES ................................................................................... 54
APPENDIX D-1: WATER RATES ................................................................................................................................................. 54 D-1-1: Consumption Rates - Water .............................................................................................................................. 54 D-1-2: Fixed Monthly Service Charges - Water ............................................................................................................ 54
APPENDIX D-2: WASTEWATER TREATMENT RATES ....................................................................................................................... 55 D-2-1 Consumption and Fixed Monthly Service Charges - Wastewater ....................................................................... 55 D-2-2: Overstrength and Additional Overstrength Surcharges .................................................................................... 55
APPENDIX E: OPERATING PERFORMANCE MEASURES ................................................................................................. 56
APPENDIX E-1: WATER SYSTEM SERVICE QUALITY MEASURES ....................................................................................................... 56 APPENDIX E-2: WASTEWATER TREATMENT SERVICE QUALITY MEASURES 15.5 ................................................................................ 57

EPCOR Water Services Inc. Water and Wastewater Treatment PBR 2012-2016
1 May 1, 2017
1 Executive Summary Water services and wastewater treatment services are provided within Edmonton by EPCOR Water Services Inc. (“EWSI”) pursuant to Bylaw 15816, the EPCOR Water Services and Wastewater Treatment Bylaw. This bylaw prescribes Performance Based Regulation (“PBR”) for these services, referred to as “In-City Water” and “Wastewater”, over a five year term from 2012 to 2016.
This report provides an annual update to the City of Edmonton on the operational and financial results for In-City Water and Wastewater for the year ended December 31, 2016, the fifth and final year of the 2012-2016 PBR term.
Financial Performance 1.1EWSI earned higher than forecast returns on In-City Water and Wastewater in 2016 and over the 2012-2016 PBR term (see Table 1.1). These results were achieved despite lower than forecast revenue, as EWSI reacted to steeper than anticipated declines in water consumption by undertaking cost savings initiatives (see Sections 3.2.3 and 4.2.3) to maintain earnings and finance capital expenditures. EWSI also benefitted from lower than forecast interest costs, because of historically low interest rates on debt issued over the 2012-2016 PBR tem.
Table 1.1 In-City Water and Wastewater
Net Income and Return on Equity ($ millions)
A B C F
Actual PBR Forecast
In-City Water Wastewater Combined Combined 1 2016 2 Revenue 180.0 83.7 263.7 277.0 3 Operating costs (94.8) (47.0) (141.8) (155.0) 4 Depreciation (21.6) (13.1) (34.6) (32.4) 5 Interest (25.7) (8.1) (33.8) (38.0) 6 Net Income 37.9 15.6 53.5 51.7 7 Return on Equity - % 10.81% 11.37% 10.96% 10.92% 8 2012-2016 9 Revenue 848.5 363.9 1,212.3 1,255.7
10 Operating costs (454.5) (218.9) (673.4) (725.6) 11 Depreciation (99.0) (51.0) (149.9) (147.6) 12 Interest (111.7) (36.4) (148.1) (168.2) 13 Net Income 183.3 57.6 240.9 214.3 14 Return on Equity - % 12.05% 9.93% 11.46% 10.06%

Water and Wastewater Treatment PBR 2012-2016 EPCOR Water Services Inc.
May 1, 2017 2
Capital Expenditures 1.2In-City Water and Wastewater’s capital expenditures were $129.5 million in 2016, 38.2% greater than forecast, and $618.9 million over 2012-2016, $106.3 million or 20.7% greater than forecast (see Table 1.2).
Table 1.2 Capital Expenditures
($ millions) A B C D
Capital Expenditures 2016 2012-2016
Actual PBR
Forecast Actual PBR
Forecast 1 In-City Water 81.7 77.5 450.0 400.9 2 Wastewater 47.8 16.2 168.9 111.7 3 Total Capital Expenditures 129.5 93.7 618.9 512.6
Over the 2012-2016 PBR term, In-City Water’s capital expenditures exceeded the PBR forecast by $49.0 million (12.2%). This increase is attributable to higher than forecast expenditures to accommodate city growth, to eliminate conflicts with City of Edmonton transportation projects, and to complete the Rossdale Laboratory Building (see Section 3.2.6).
Wastewater’s capital expenditures exceeded the 2012-2016 PBR forecast by $57.2 (51.2%). Early in the 2012-2016 PBR term as EWSI began work on solids handling implementation, a number of major shutdowns of hydraulic channels were required which allowed EWSI the opportunity to inspect the channels. These inspections identified some significant and high priority infrastructure challenges which had not been included in the approved capital program for 2012-2016. Accordingly, EWSI paused much of its capital spending during 2012 and 2013 while it conducted a comprehensive review of the Gold Bar facility to assess asset condition and to identify and prioritize repairs, upgrades and replacements needed to ensure plant reliability. The implementation of the revised capital program resulted in higher than forecast capital expenditures in 2014, 2015 and 2016, offsetting lower than forecast expenditures in 2012 and 2013 (see Section 4.2.6). A review of the proposed capital increase was undertaken with both Administration and Utility Committee prior to any expenditure.
Operational Performance 1.3In-City Water and Wastewater’s operational performance are each measured by the results of five indices prescribed in Schedule 3 of Bylaw 15816 with each index consisting of one or more performance measures. Performance under each index is measured independently on a point basis with 100 base points available if the standards for all five performance measure indices are achieved. Bonus points are available for performance above standards and financial penalties are applied if EWSI does not meet the 100 base point standard. In 2016, both In-City Water (Table 1.3-1) and Wastewater (Table 1.3-2) exceeded PBR operating performance standards, allowing In-City Water to earn 108.4 points and Wastewater to earn 110.0 points. A summary of In-City Water and Wastewater’s performance results for the 2012-2016 PBR term is provided in Appendix E.

EPCOR Water Services Inc. Water and Wastewater Treatment PBR 2012-2016
3 May 1, 2017
Table 1.3-1 2016 Performance Measures
Water System Service Quality Standards A B C D
Performance Measure Index - In-City Water Index
Standard Points
Total Actual Points
Maximum Available
Points
Total Points Earned
1 System Reliability Index 25.0 32.3 28.5 28.5 2 Water Quality Index 25.0 25.0 25.5 25.0 3 Customer Service Index 20.0 22.7 23.0 22.7 4 Environmental Index 15.0 15.7 16.5 15.7 5 Safety Index 15.0 16.5 16.5 16.5 6 Aggregate Points Earned (sum of all indices) 100.0 112.2 110.0 108.4
In 2016, In-City Water exceeded target performance standards on all five performance indices. Section 3.4 provides detailed discussions of the performance measures making up each of the indices and highlights of Water Services’ operational performance.
Table 1.3-2 2016 Performance Measures
Wastewater Treatment Services Quality Standards
In 2016, Wastewater exceeded the performance standards for all five performance measure indices. These indices are similar to those of In-City Water with the individual performance measures making up each index tailored to wastewater treatment. Section 4.4 provides detailed discussions of the performance measures making up each of the indices and highlights of Wastewater’s operational performance.
Rates and Bill Comparisons 1.4Under the PBR framework (see Section 2), annual In-City Water and Wastewater rate increases are limited to inflation, less an efficiency factor, plus special rate adjustments. In 2016, the annual inflation adjustment, net of the efficiency factor was 1.86%, 0.41% less than the PBR forecast rate (see section 3.3.1). Special rate adjustments included a 0.91% increase to water consumption rates for the
A B C D
Performance Measure Index - Wastewater Index
Standard Points
Total Actual Points
Maximum Available
Points
Total Points Earned
1 System Reliability Index 15.0 20.0 16.0 16.0 2 Wastewater Quality Index 40.0 105.1 44.0 44.0 3 Customer Service Index 5.0 5.6 5.0 5.0 4 Environmental Index 20.0 22.0 22.0 22.0 5 Safety Index 20.0 23.0 23.0 23.0 6 Aggregate Points Earned (sum of all indices) 100.0 175.7 110.0 110.0

Water and Wastewater Treatment PBR 2012-2016 EPCOR Water Services Inc.
May 1, 2017 4
Accelerated Water Main Renewal program (see Section 3.3.1) and a 5.87% rebasing adjustment applied to wastewater fixed and variable charges (see Section 4.3.1). In 2016, the average residential customer’s water bill, based on monthly consumption of 16.0 m3, was $34.95, compared to $34.07 in 2015, and the average residential customer’s wastewater treatment bill, based on monthly consumption of 15.2 m3 was $16.22, compared to $15.06 in 2015. EWSI undertakes annual bill comparison surveys with various cities and local communities to ensure that the City’s water and wastewater treatment rates are reasonable and competitive. In 2016, bill comparisons were based on surveys of Calgary, Vancouver and Winnipeg, as well as four local communities in the Edmonton metropolitan area. These comparisons are based on the total cost to the customer and include fixed charges, consumption charges, plus any applicable surcharges. These comparisons (see Sections 3.3.3 and 4.3.3) show that EWSI’s water and wastewater treatment rates are competitive with the rates of other communities included in the survey.
Non-Routine Adjustments 1.5Non-routine adjustments are defined in Bylaw 15816 as “items which are unusual, significant in size or nature, and beyond the scope of control of EWSI”. Bylaw 15816 allows EWSI to request adjustments to In-City Water and Wastewater’s rates for non-routine adjustments from the City. These requests are provided to either the City Manager or City Council, depending on the impact of the non-routine adjustment on In-City Water and Wastewater’s revenue requirements. In review of its 2016 operations, as in its 2012-2016 reviews, EWSI did not identify any non-routine adjustments that met the criteria outlined in Bylaw 15816, Schedule 3, Section 5.0.

EPCOR Water Services Inc. Water and Wastewater Treatment PBR 2012-2016
5 May 1, 2017
2 PBR Framework PBR is a method of calculating and setting utility rates using a formula that adjusts utility rate changes to inflation, less an efficiency factor, plus special rate adjustments. EWSI’s PBR framework encompasses rates, performance measures and return on equity. This framework is designed to ensure that capital and operating cost decisions provide a balance between operational performance, rates and return on equity. The PBR framework encourages EWSI to be more efficient, providing ratepayers with fair, stable and predictable rates, while safeguarding system reliability and service quality.
Elements of PBR 2.1• PBR Rates. Under the PBR framework for 2012-2016, water and wastewater treatment rate
increases are limited to inflation, less a 0.25% efficiency factor, plus special rate adjustments for rebasing and for the Accelerated Water Main Renewal program. Bylaw 15816 defines inflation as a weighted average rate based 65% on a Consumer Price Index component and 35% on a Labour Cost component. The Consumer Price Index component is measured by Statistics Canada’s Annual Growth in All Items CPI for Alberta (CANSIM series V41694625) and the Labour Cost component is measured by Statistics Canada’s Annual Growth in Average Hourly Earnings for Alberta (CANSIM Series V1603533).
EWSI also undertakes annual bill comparison surveys with various cities and local communities to ensure that the City’s water and wastewater treatment rates are reasonable and competitive. EWSI’s customer classes, rate structures and results of bill comparison surveys are shown in Sections 3.3 and 4.3.
• Performance Measures. EWSI’s PBR framework includes performance criteria which provide assurance to customers that water and wastewater treatment system service quality will not be sacrificed to keep rates low. EWSI faces financial penalties if performance measures are not met. EWSI’s performance measures are audited annually by an independent accounting firm. The audited performance measure results, together with EWSI’s commentary on highlights and areas for improvements are shown in Section 3.4 and 4.4.
• Return on Equity. The regulated rates for In-City customers are designed to allow EWSI to recover costs and earn a fair return on its investment.
Risks and Incentives 2.2The PBR framework provides incentives for EWSI to improve operational performance while achieving cost savings through process improvements and other means. Under this framework, EWSI also assumes the risks associated with water consumption, operating costs, financing costs and capital costs, ensuring that customers are provided with stable and predictable rate increases. These risks and EWSI’s strategies to mitigate them include:
• Water Consumption Risk. Under PBR, EWSI bears all of the risks associated with weather-related fluctuations in water consumption and water quality, as well as the longer-term risks associated with declining consumption per customer. While EWSI expects the impacts of short-term weather-related volatility to even out over the five year PBR term, longer term declines are of greater

Water and Wastewater Treatment PBR 2012-2016 EPCOR Water Services Inc.
May 1, 2017 6
concern. In the 2012-2016 PBR term, per customer consumption was significantly lower than forecast, resulting in substantial revenue shortfalls. Accordingly, EWSI revised its consumption forecast methodology for its 2017–2021 PBR forecast to better capture long term trends in water consumption.
• Operating Cost Risk. EWSI actively works to minimize fluctuations in input prices through long-term power contracts, chemical optimization processes, and continuous efforts to implement cost reduction strategies in all areas of its operations.
• Interest Risk. Fluctuations in short-term interest rates, long-term debt issue costs and in the level of capitalized interest have significant impacts on EWSI’s net income and return on equity. EWSI mitigates interest risk through timing of long-term debt issuances and optimizing working capital.
• Capital Cost Risk. In-City Water and Wastewater’s operations are capital intensive. Over the 2012-2016 period, EWSI found that a much higher than forecast level of capital replacements was required at the Gold Bar Wastewater Treatment Plant to maintain plant reliability. EWSI seeks to minimize these risks through comprehensive capital project and asset management programs, ensuring that new projects or changes to existing projects are justified and that there is an appropriate level of management, senior management and executive oversight over capital spending.

EPCOR Water Services Inc. Water and Wastewater Treatment PBR 2012-2016
7 May 1, 2017
3 2016 PBR Results - In-City Water
Consumption and Customer Counts - In-City Water 3.1Total consumption in 2016 was 3.0% less than forecast (see Table 3.1) with 2016’s cool and rainy summer resulting in lower than forecast seasonal water use by both residential customers and commercial water-only customers (e.g. golf courses and commercial lawn-watering services).
Table 3.1 In-City Water
Consumption, Customer Counts and Consumption per Customer A B C D
Customer Class 2016 2012-2016
Actual PBR
Forecast Actual PBR
Forecast 1 Annual Consumption - ML 2 Residential 45,421 47,931 224,156 236,193 3 Multi-Residential 17,987 16,622 87,816 83,541 4 Commercial 28,131 29,851 143,150 146,155 5 Total 91,539 94,404 455,121 465,889 6 Average Monthly Customer Count 7 Residential 248,904 240,325 233,858 232,199 8 Multi-Residential 3,666 3,517 3,528 3,465 9 Commercial 18,692 18,679 18,100 18,224
10 Total 271,262 262,521 255,485 253,888 11 Monthly Consumption per Customer - m3 12 Residential 15.2 16.6 16.0 17.0 13 Multi-Residential 408.9 393.8 414.9 401.8 14 Commercial 125.4 133.2 131.8 133.7
Although short-term variations in water consumption are primarily weather-related, EWSI is experiencing long-term declines in per customer consumption, especially in the residential customer class. These declines reflect both technological changes, primarily related to the increased use of water-efficient appliances, and behavioural changes, as residential customers respond to EPCOR’s inclining rate structures designed to promote water conservation (see section 3.3). As a significant portion of the average water bill is based on volume consumed, this reduction also has an impact on revenues.
Between 2012 and 2016, even with customer growth of 6.9%, total consumption was 2.3% less than forecast, meaning that consumption per customer has declined at higher than forecast rates. EWSI’s analysis shows that higher than forecast declines in consumption per customer are associated both with new residential developments, where new technologies are used to increase water efficiency, and also in older parts of the city, where water efficiency is increasing as older homes are renovated or replaced with infill housing. These trends have been incorporated into the consumption forecasts for the 2017-2021 PBR term (see Section 5.0), and their impacts, (e.g. energy requirements for pumping and water treatment plant operations) incorporated into operating expense and capital expenditures forecasts.

Water and Wastewater Treatment PBR 2012-2016 EPCOR Water Services Inc.
May 1, 2017 8
Financial Performance 3.2In-City Water net income reflects the revenues less operating costs, depreciation and interest expense derived from the provision of water services within Edmonton’s boundaries. Besides these services, EWSI also provides water services to surrounding communities under bulk water supply agreements with regional water service commissions, and fire protection services to the City of Edmonton under a service agreement.
EWSI operates a fully integrated water system where In-City Water, regional water services and fire protection share facilities and services (the “total system”). Therefore, operating costs, interest expense and depreciation, are presented and analyzed on a total system basis. In-City Water’s share of these expenses, calculated in accordance with a cost of service model developed jointly by EWSI, the regional water service commissions and the City of Edmonton, is shown as a separate line item on each applicable table. Capital expenditures and rate base are presented and analyzed on a similar basis.
Net Income and Return on Equity - In-City Water 3.2.1
In 2016, In-City Water’s net income and return on equity were very close to the PBR forecast, as lower revenues resulting from lower consumption were offset by reductions in operating costs and lower interest costs (see Table 3.2.1). For 2012-2016, actual ROE was 1.2% greater than forecast for essentially the same reasons, except that the decrease in revenue was proportionately lower over the 2012-2016 PBR term, as the longer time frame dampened year-over-year variations in water consumption.
Table 3.2.1 In-City Water
Net Income and Return on Equity ($ millions)
A B C D
Net Income and Return on Equity 2016 2012-2016
Actual PBR
Forecast Actual PBR
Forecast 1 Revenue 180.0 190.8 848.5 877.1 2 Operating costs (94.8) (103.9) (454.5) (488.5) 3 Depreciation (21.6) (21.4) (99.0) (98.1) 4 Interest (25.7) (28.2) (111.7) (123.9) 5 Net Income 37.9 37.3 183.3 166.6 6 Return on Equity (%) 10.81% 10.88% 12.05% 10.88%
Revenue - In-City Water 3.2.2
In-City Water’s revenues were $10.8 million (5.7%) lower than forecast in 2016, and $28.7 (3.3%) lower for the 2012-2016 PBR term (see Table 3.2.2). Lower revenues are primarily related to lower than

EPCOR Water Services Inc. Water and Wastewater Treatment PBR 2012-2016
9 May 1, 2017
forecast consumption, with lower than forecast inflation having a secondary impact.1 Although fixed charge revenues are close to forecast, higher than forecast customer growth has been almost offset by lower than forecast rate increases. The third component of In-City Water revenue, miscellaneous revenues, are greater than forecast due to increases in hydrant permits and temporary services, related to higher than forecast residential customer growth.
Table 3.2.2 In-City Water
Revenue by Customer Class ($ millions)
A B C D
Revenue by Customer Class 2016 2012-2016
Actual PBR
Forecast Actual PBR
Forecast 1 Consumption Revenue 2 Residential 88.6 99.2 418.7 454.6 3 Multi-Residential 27.6 26.6 127.9 124.2 4 Commercial 33.2 35.6 160.4 162.1 5 Total Consumption Revenue 149.3 161.4 707.0 740.9 6 Fixed Charge Revenue 7 Residential 22.0 21.8 100.0 99.5 8 Multi-Residential 1.0 0.9 4.5 4.3 9 Commercial 3.1 3.1 14.4 14.4
10 Total Fixed Charge Revenue 26.1 25.8 118.9 118.2 11 Total Rate Revenue 175.5 187.2 825.9 859.1 12 Miscellaneous revenue 4.5 3.6 22.5 18.0 13 Total Revenue - In-City Water 180.0 190.8 848.5 877.1
Operating Costs 3.2.3
Operating Costs by Cost Category 3.2.3.1
Total system operating costs in 2016 were $9.8 million (7.8%) less than the PBR forecast and $36.9 million (6.3%) less for 2012-2016 (see Table 3.2.3.1-1).
1 As noted in Section 3.5.1, annual rate increases are limited to inflation less an efficiency factor, plus special rate adjustments. Therefore, lower than forecast inflation will result in smaller rate increases. The effect of lower than forecast inflation over the 2012-2016 PBR term, has resulted in 2016 rates that are approximately 3% less than had been anticipated in the 2012-216 PBR forecast.

Water and Wastewater Treatment PBR 2012-2016 EPCOR Water Services Inc.
May 1, 2017 10
Table 3.2.3.1-1 Operating Costs by Cost Category
($ millions) A B C D
Cost Category 2016 2012-2016
Actual PBR
Forecast Actual PBR
Forecast 1 Salaries and benefits 43.0 48.6 212.4 227.3 2 Corporate shared services 14.0 22.2 74.9 103.8 3 EWSI shared services 9.8 - 31.5 - 4 Customer billing 8.7 10.0 44.0 46.8 5 Power 10.4 7.6 43.1 36.6 6 Chemicals 7.6 7.7 28.6 36.4 7 Contractors 6.0 6.2 30.3 29.9 8 Materials and supplies 3.3 3.6 15.2 16.3 9 Vehicles 2.2 2.2 10.5 10.7
10 Other (2.9) 2.7 (4.7) 11.5 11 Franchise fees 13.9 15.0 65.3 68.7 12 Total Water Services 116.0 125.8 551.1 588.0 13 In-City Water Share - % 81.7% 82.6% 82.5% 83.1% 14 In-City Water Share - $ 94.8 103.9 454.5 488.5
About one-half of the difference between Water Services’ actual and forecast operating costs relates to an EPCOR-wide corporate reorganization undertaken in 2013. This reorganization provided a permanent decrease in the overall level of Corporate Shared Services costs charged to EWSI and established an EWSI Shared Services business unit to provide financial services, operational support and other administrative functions to Water Services, Wastewater and EWSI’s other non-regulated operating areas. The net cost savings from the corporate reorganization are summarized in Table 3.2.3.1-2:
Table 3.2.3.1-2 Corporate Reorganization Impacts - Cost Category
($ millions) A B Cost Savings from: 2016 2012-2016
1 Reduction in Salaries and benefits (5.1) (16.4) 2 Reduction in Corporate shared services costs (8.2) (28.9) 3 EWSI shared services cost allocation 9.8 31.5 4 Increase (decrease) in other expenses (1.7) (3.6) 5 Net cost savings (5.2) (17.4)
Significant actual to forecast differences for 2016 and for 2012-2016 for the Total System include:
• Salaries and Benefits - $5.6 million less than forecast, $14.9 million less for 2012-2016.
The decrease in salaries and benefits reflects several factors. First, the staff reductions and transfer of staff from Water Services to the EWSI shared services business unit as part of the 2013

EPCOR Water Services Inc. Water and Wastewater Treatment PBR 2012-2016
11 May 1, 2017
corporate reorganization have reduced Water Services salaries and benefits by $5.2 million in 2016 ($16.4 million for 2012-2016). Second, long term disability payments were lower than forecast by $0.4 million in 2016 ($1.7 million for 2012-2016). Third, incentive payments were $0.3 million less than forecast in 2016 ($3.7 million greater for 2012-2016). Fourth, changes to water plant maintenance programs (see Section 3.2.3.3 below) resulted in greater emphasis on capital programs, so that an additional $0.8 million ($1.9 million for 2012-2016) of salaries and benefits costs were capitalized. The remainder of the actual to forecast difference consists of numerous small items, none of which are considered significant.
• Customer Billing - $1.3 million less than forecast, $2.8 million less for 2012-2016.
Lower than forecast Customer Billing expenses are attributable to two factors. First, the cost of service-based regulated rate charged to EWSI by EPCOR Energy Alberta (EEA) was lower than forecast by $0.9 million in 2016 ($1.2 million for 2012-2016), in part due to lower allocations of shared services costs to EEA from EUI. Second, EWSI implemented a process change which significantly reduced the number of off-cycle meter reads, reducing meter reading costs by $0.5 million in 2016 ($2.1 million for 2012-2016). These cost reductions were partially offset by higher than forecast bad debts related to the current economic downturn.
• Power- $2.8 million greater than forecast, $6.5 million greater for 2012-2016.
Higher than forecast power costs reflect price increases of 7.7% in 2016 and 5.9% in 2015, considerably in excess of the 2.3% annual increases included in the PBR forecast based on inflation at CPI. Besides price increases, power consumption also increased to meet demands from the new Rossdale Water Excellence Laboratory Building, as well as new equipment (e.g. the Sodium Hypochlorite generator), with high power demand.
• Chemicals - $0.1 million less than forecast, $7.8 million less for 2012-2016.
Although 2016 chemical costs were only $0.1 million less than forecast, chemical use increased substantially from prior years to address the colour and turbidity challenges arising from increased runoff during the especially damp summer. Increased chemical usage in 2016 was contrary to the remainder of the 2012-2016 PBR term, where EWSI benefitted from process improvements, most notably the increased use of direct filtration, that reduced chemical usage by over $1.0 million annually. Besides the process improvements, lower than forecast chemical costs for 2012-2016 also reflects the use of an incorrect dilution factor for caustic soda and alum in the PBR forecast, which overstated the forecast amount by $0.8 million annually. The resulting overstatement of forecast chemical coasts was reviewed with City Administration in 2014.
• All other expenses - $6.1 million less than forecast, $17.1 million less for 2012-2015.
Three key factors contribute to lower than forecast Other expenses. First, as shown in Table 3.2.3.1-2 above, $1.7 million of cost reductions in 2016 are attributable to the 2013 corporate reorganization ($3.6 million for 2012-2016). Second, in 2013, following an EPCOR-wide review of capital processes, EWSI aligned its capital overhead methodology with that of other EUI subsidiaries, resulting in capitalization of an additional $2.6 million of corporate overhead costs in 2016 ($8.4 million for 2012-2016). The third factor was the change to water treatment plant maintenance programs (see Section 3.2.3.3) which reduced other costs by $1.1 million in 2016
Water and Wastewater Treatment PBR 2012-2016 EPCOR Water Services Inc.
May 1, 2017 12
($4.4 million for 2012-2016). The remaining actual to forecast differences consist of numerous small items, none of which are significant.
• Franchise Fees - $1.1 million less than forecast, $3.4 million less for 2012-2016.
EWSI pays a franchise fee to the City of Edmonton equal to 8% of rate revenue (line 11 from Table 3.2.3.1-1) less the municipal portion of property taxes. Lower than forecast franchise fees are entirely attributable to lower than forecast rate revenue.
In-City Water share of Operating Costs 3.2.3.2
In 2016, 81.7% of operating costs were allocated to In-City Water through the cost of service model, slightly less than the 82.5% share in the PBR forecast. This difference is expected since the cost of service model allocates costs to each customer segment (In-City, Regional and Fire Protection) in proportion to each customer segment’s demands on the water system. Over the 2012-2016 PBR term, actual In-City water consumption increased at a lower rate relative to Regional water consumption. The PBR forecast assumed consumption from In-City and Regional customers would increase at the same rates. Accordingly, a lower proportion of operating costs was distributed to In-City Water in 2016 and over the 2012-2016 PBR term.
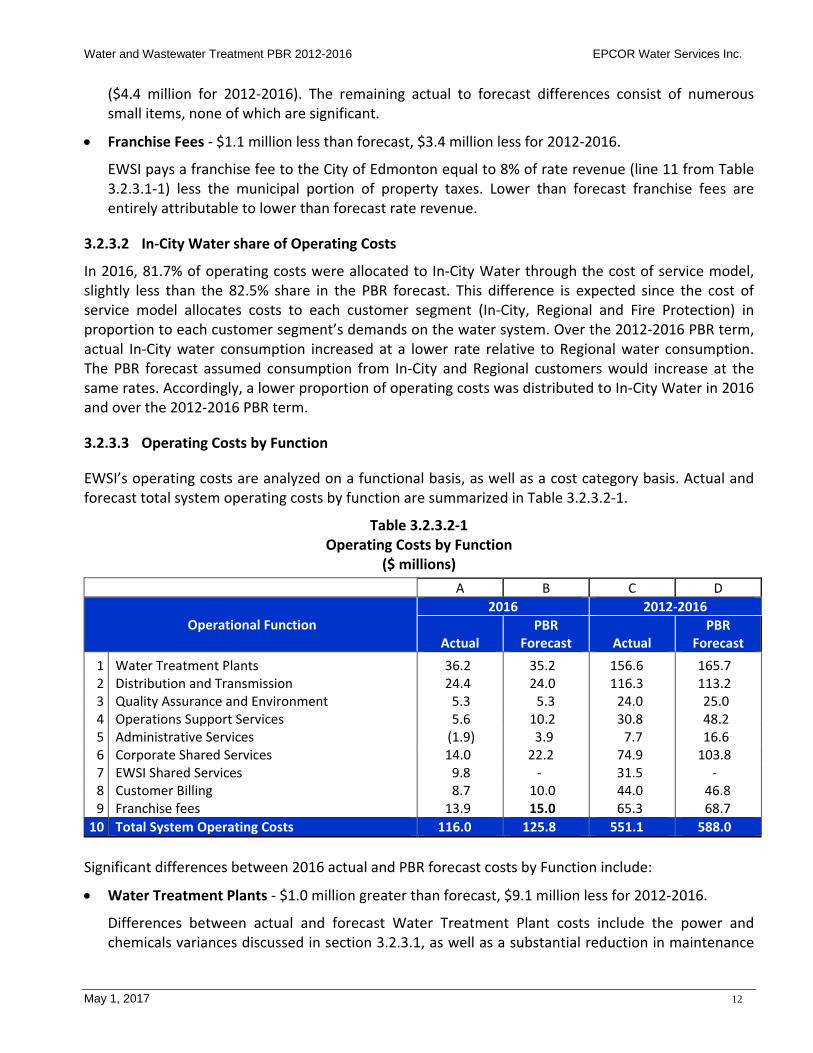
Operating Costs by Function 3.2.3.3
EWSI’s operating costs are analyzed on a functional basis, as well as a cost category basis. Actual and forecast total system operating costs by function are summarized in Table 3.2.3.2-1.
Table 3.2.3.2-1 Operating Costs by Function
($ millions) A B C D
Operational Function 2016 2012-2016
Actual PBR
Forecast Actual PBR
Forecast 1 Water Treatment Plants 36.2 35.2 156.6 165.7 2 Distribution and Transmission 24.4 24.0 116.3 113.2 3 Quality Assurance and Environment 5.3 5.3 24.0 25.0 4 Operations Support Services 5.6 10.2 30.8 48.2 5 Administrative Services (1.9) 3.9 7.7 16.6 6 Corporate Shared Services 14.0 22.2 74.9 103.8 7 EWSI Shared Services 9.8 - 31.5 - 8 Customer Billing 8.7 10.0 44.0 46.8 9 Franchise fees 13.9 15.0 65.3 68.7
10 Total System Operating Costs 116.0 125.8 551.1 588.0 Significant differences between 2016 actual and PBR forecast costs by Function include:
• Water Treatment Plants - $1.0 million greater than forecast, $9.1 million less for 2012-2016.
Differences between actual and forecast Water Treatment Plant costs include the power and chemicals variances discussed in section 3.2.3.1, as well as a substantial reduction in maintenance

EPCOR Water Services Inc. Water and Wastewater Treatment PBR 2012-2016
13 May 1, 2017
costs ($1.9 million in 2016, $6.3 million for 2012-2016), resulting from replacement of on-going maintenance activities with capital maintenance projects that either increased the economic life of existing assets (e.g. rebuilding E.L. Smith clarifiers), or increasing the productive capacity of water treatment plant assets (e.g. rebuilding the Rossdale high lift pumps).
• Distribution and Transmission - $0.4 million greater than forecast, $3.1 million greater for 2012-2016.
Distribution and Transmission is responsible for planning, managing, operating and maintaining EWSI’s distribution infrastructure, relying on both internal labour and external contractors to meet its obligations and address changing demands. Higher than forecast costs in both 2016 and over the 2012 to 2016 PBR term are made up of numerous items, reflecting transfers and reallocation of resources within Distribution and Transmission to address higher than expected growth in outlying subdivisions, higher than forecast contractor prices for hydrovac and similar services, especially between 2012-2014 and lower than forecast numbers of water main breaks.
• Operations Support Services - $4.6 million less than forecast, $17.4 million less for 2012-2015 and Administrative Services - $5.8 million less than forecast, $8.9 million less for 2012-2015.
The 2013 corporate reorganization discussed in section 3.2.3.1 centralized certain Administrative and Operational Support services in the new EWSI Shared Services business unit. These impacts are summarized on Table 3.2.3.2-2 below:
Table 3.2.3.2-2 Corporate Reorganization Impacts - Operational Function
($ millions) A B Cost Savings from: 2016 2012-2016
1 Reduction in Operations Support Services (4.0) (13.9) 2 Reduction in Administrative Services (2.8) (6.1) 3 Reduction in Corporate Shared Services (8.2) (28.9) 4 Increase in EWSI Shared Services 9.8 31.5 5 Net cost savings (5.2) (17.4)
Besides the reorganization differences, lower than forecast Operations Support Services reflect the adjustments to long term disability costs of $0.4 million in 2016 ($1.7 million for 2012-2016) discussed in Salaries and Benefits. The remaining variance consists of numerous small items, none of which are individually significant.
For Administrative Services, lower than forecast costs include the change in Capital Overhead methodology discussed above and the impacts of the 2013 Corporate reorganization discussed above. These savings were offset by lower than forecast incentive costs of $0.3 million in 2016 ($3.7 million greater than forecast for 2012-2016). As with Operations Support Services, the remaining variance consists of numerous small items, none of which are individually significant.
• Variances in Corporate Shared Services, EWSI Shared Services, Customer Billing and Franchise Fees are discussed in Section 3.2.3.1 above.

Water and Wastewater Treatment PBR 2012-2016 EPCOR Water Services Inc.
May 1, 2017 14
Depreciation Expense 3.2.4
In 2016, total system net depreciation expense was $0.7 million greater than forecast, ($4.3 million greater for 2012-2016), reflecting higher than forecast capital additions. Depreciation expense in 2016 was reduced by a $1.4 million gain on disposal of land in Lewis Estates that had been acquired in anticipation of needs for a new reservoir, which EWSI subsequently determined was not required. The proportion of depreciation expense allocated to In-City Water for 2016 and for the 2012-2016 PBR term was slightly less than forecast, reflecting a slight shift in costs to regional water customers because of higher that forecast growth in regional customers’ consumption.
Table 3.2.4-1 Depreciation Expense
($ millions) A B C D
Depreciation Expense 2016 2012-2016
Actual PBR
Forecast Actual PBR
Forecast 1 Gross Depreciation Expense 39.1 35.7 172.2 165.1 2 Less: Amortization of Contributions (9.7) (8.5) (42.5) (39.7) 3 Sub-total 29.3 27.2 129.7 125.4 4 Gains (losses) on disposal (1.4) - (0.6) - 5 Depreciation Expense 27.9 27.2 129.7 125.4 6 In-City Water Share (%) 77.3% 78.6% 76.3% 78.2% 7 In-City Water Share ($) 21.6 21.4 99.0 98.1
Interest Expense and Cost of Debt 3.2.5
Interest expense and cost of debt are summarized on Table 3.2.5 below:
Table 3.2.5 Interest Expense and Cost of Debt
($ millions) A B C D
Interest Expense and Cost of Debt 2016 2012-2016
Actual PBR
Forecast Actual PBR
Forecast 1 Interest expense 32.4 35.7 143.7 158.8 2 Mid-year debt and other non-current liabilities 647.4 630.8 2,853.1 2,817.2 3 Average Cost of Debt 5.00% 5.65% 5.04% 5.64% 4 Regulated Interest Cost 33.6 35.7 144.9 158.8 5 In-City Water Share (%) 79.4% 79.1% 77.7% 78.0% 6 In-City Water Share ($) 25.7 28.2 111.7 123.9
Throughout the 2012-2016 PBR term, EWSI has benefitted from lower than forecast interest rates on new debt issuances. The net effect is that EWSI’s average cost of debt was 0.65% less than forecast for 2016 (0.60% less for 2012-2016). The cost of debt has be aligned to current market as part of the 2017-2021 PBR.

EPCOR Water Services Inc. Water and Wastewater Treatment PBR 2012-2016
15 May 1, 2017
Capital Expenditures 3.2.6
EWSI provides the City with a five year forecast capital program for the total water system at the beginning of the 2012-2016 PBR term. Over the PBR term, EWSI’s actual capital expenditures, both on individual projects and in aggregate, will differ from the forecast program as projects are advanced, delayed, changed, added to, or removed from the capital program to address the challenges of aging infrastructure, to better respond to growth, or to meet City requirements.
Over the 2012-2016 PBR term, as shown on Table 3.2.6, actual capital expenditures exceeded the PBR forecast by $49.1 million (12.2%). Actual and forecast expenditures are summarized in Table 3.2.6 with actual to forecast differences explained in sections 3.2.6.1 and 3.2.6.2.
Table 3.2.6 Capital Expenditures by Project
($ millions) A B E F
Capital Project
2016 2012-2016
Actual PBR
Forecast
Actual PBR
Forecast 1 City-Driven 2 Accelerated Water Main Renewal Program 17.4 20.0 96.7 100.0 3 Reactive Renewal Program 7.8 10.0 53.9 56.0 4 Private Development Transmission Mains 9.7 5.5 34.5 26.1 5 Water Main Relocations 2.4 0.0 18.5 10.0 6 Projects < $10 Million 6.5 2.6 24.1 12.5 7 Sub-total: City-Driven 43.8 38.1 227.7 204.6 8 Other 9 Rossdale Sodium Hypochlorite 0.0 0.0 15.8 17.0
10 Rossdale Laboratory Building 0.0 0.0 27.2 12.3 11 Proactive Renewal Program 3.5 3.0 14.5 13.0 12 Water Main Cathodic Protection 1.9 2.0 9.6 10.0 13 Meter Change Outs 3.8 2.4 13.6 11.7 14 Plant Residuals 0.0 6.6 5.8 12.1 15 Projects < $10 million 28.7 25.4 136.8 120.3 16 Sub-total: Other 37.9 39.4 222.3 196.4 17 Total Capital Expenditures 81.7 77.5 450.0 400.9
Changes to EWSI’s capital program are coordinated through EWSI’s Project Management Office and reviewed and authorized by its Capital Project Steering Committee (and, for significant changes, to EUI’s Financial Review Council, or Board of Directors). Under EWSI’s PBR framework, changes to the 2012-2016 PBR capital programs are not incorporated into In-City water rates until the 2017-2021 PBR term. Accordingly, EWSI’s 2017-2021 PBR application included a comprehensive review of its 2012-2016 PBR capital program, including post-implementation reviews of major projects, as well as the economic and operational justification for project and program expenditures. The City of Edmonton Utility Committee’s review of EWSI’s 2012-2016 capital program concluded that EWSI’s 2012-2016 expenditures had been prudent and, therefore, allowed the impacts of higher than forecast expenditures over the 2012-2016 PBR term to be incorporated into the 2017-2021 special rate adjustment for rebasing (see section 3.3).

Water and Wastewater Treatment PBR 2012-2016 EPCOR Water Services Inc.
May 1, 2017 16
City-Driven Capital Projects 3.2.6.1
Actual to PBR forecast variances for City-driven capital projects in 2016 and for 2012-2016 include:
• Accelerated Water Main Renewal - $2.6 million less than forecast, $3.3 million less for 2012-2016.
This program supports the City’s request for EWSI to replace water mains under roadways that are scheduled to be rehabilitated by the City’s Transportation Services department. The variance resulted from over-estimating the amount of roadway that would be rehabilitated when the original PBR projections were determined.
• Reactive Renewal - $2.2 million less than forecast, $2.1 million less for 2012-2016.
This program involves the rehabilitation or replacement of severely deteriorated water mains based on past break histories and customer service interruptions. Actual to forecast variances in 2016 and total expenditures on this program over the 2012-2016 PBR are lower than forecast as the number of main breaks experienced over the period were less than forecast due to the success of the Reactive Renewal program and the relatively milder winters over the period.
• Private Development Transmission Mains – $4.2 million greater than forecast, $8.4 million greater for 2012-2016.
EWSI and private developers share in the costs of extending EWSI’s distribution and transmission network to new subdivisions. This project represents the reimbursement of the costs incurred by private developers to extend the transmission network to new subdivisions. Commencing in spring 2015 and continuing into 2016, EWSI received numerous applications with higher than forecast reimbursement rebate amounts. As the subdivisions become populated, EWSI will incur additional operating and maintenance costs to support the additions to the network.
• Water Main Relocation Projects - $2.4 million greater than forecast, $8.5 million greater for 2012-2016.
These projects include the costs of water main relocations needed to address the City’s LRT expansion. These costs are generally outside of EWSI’s control as the City determines the final LRT alignments. A larger number of conflicts with the existing transmission mains have resulted in higher than forecast costs to In-City Water relocations over the PBR term.
• City Driven Capital Projects < $10 Million - $3.9 million greater than forecast, $11.60 million greater for 2012-2016.
These City-driven projects consist of three main programs:
— Distribution System Modifications, which includes relocating or modifying existing water mains and appurtenances to eliminate conflicts arising from City of Edmonton projects;
— Water Service Connections for infill developments or redevelopments, as well as replacement of lead services; and
— New Water Meter Purchases and Installations for new In-City Water customers.
Higher than forecast costs for these programs result from several factors. First, the high volume of construction activity associated with growth throughout the 2012-2016 PBR term increased costs for new service lines and water mains. Second, EWSI accelerated its replacement of lead service lines in order to address the associated health risks. Finally, meter costs were higher than forecast,

EPCOR Water Services Inc. Water and Wastewater Treatment PBR 2012-2016
17 May 1, 2017
reflecting both higher than forecast customer growth and the effect of the low Canadian dollar on meters purchased from US suppliers.
Other Capital Projects 3.2.6.2
Significant actual to PBR forecast variances for Other Capital Projects in 2016 and for 2012-2016 include:
• Rossdale Sodium Hypochlorite – completed in 2015, $1.2 million less than forecast for 2012-2016.
This project includes the construction of an on-site sodium hypochlorite generator at the Rossdale water treatment plant that was placed into service in 2015. EWSI was able to complete this project at a lower than forecast cost because of experience gained from similar work performed at E.L. Smith.
• Rossdale Laboratory Building – completed in 2015, $14.9 million greater than forecast for 2012-2016.
The Water Excellence Laboratory building (WELB), as first designed, was intended to be a two year project constructed between 2012 and 2013 to replace aging laboratory facilities. Actual design and construction occurred over the 2012 to 2015 time period, because the discovery of historical artifacts impacted the timely issuance of construction permits. Additional delays and increased construction costs resulted from less than favorable soil conditions. As well, the 2013 corporate reorganization, which had not been forecast, provided EWSI an opportunity to construct additional floor space to accommodate staffing movements, resulting in additional project costs.
The WELB provides office space for EWSI’s Project Management Office; Public and Government Affairs, Knowledge Management, Regulatory and Finance departments, while continuing to provide the laboratory facilities originally envisioned. EWSI also rents a portion of the office space to EPCOR’s Commercial Development group.
• Proactive Renewal - $0.5 million greater than forecast, $1.5 million greater for 2012-2016.
This project is very closely tied to Reactive Renewal and includes replacements or upgrades of water mains in older areas where water mains do not conform to current design standards for water quality, fire protection, and system reliability. In 2015, two projects were identified for immediate completion as one project could be coordinated with other external construction work, thus reducing overall costs, while the second project was identified as a high priority main replacement due to its large number of lead services.
• Plant Residuals – completed in 2013, $6.6 million less than forecast for 2012-2016.
This project was placed into service in 2013 and consisted of alum sludge treatment and de-chlorination of waste streams from the plants. To mitigate the cost impacts of alum sludge treatment EWSI proposed the use of direct filtration to reduce alum residuals to Alberta Environment and Sustainable Resource Development (AESRD) as a more cost effective solution to manage residuals. AEP accepted this proposal allowing EWSI to reduce expenditures on this program by $6.3 million.
• All Other Projects - $1.6 million less than the PBR forecast ($25.6 million greater for 2012-2016).

Water and Wastewater Treatment PBR 2012-2016 EPCOR Water Services Inc.
May 1, 2017 18
This project category includes capital projects and programs with costs less than $10.0 million over the PBR term. The actual to forecast difference in this category represents the net impact of changes to the PBR capital program over the 2012-2016 PBR term. These adjustments resulted from changes to infrastructure priorities that were not foreseen when the 2012-2016 PBR capital program was developed.
Rate Base and Return on Equity 3.2.7
In 2016, total system mid-year net rate base was $40.4 million (3.9%) greater than forecast (see Table 3.2.7-1). This difference reflects both higher than forecast capital expenditures, as explained in section 3.2.6, and lower than forecast depreciation expense, primarily related to placing some projects into services into service later than had been anticipated in the PBR forecast (e.g. the Rossdale Laboratory Building was forecast to be placed into service in 2013, but was not placed into service until 2015). The In-City Water share of the total rate base in 2016 was $13.3 million greater than forecast, reflecting both the larger system rate base and the relatively lower share of rate base allocated to In-City Water, primarily because growth in In-City consumption over the 2012-2016 PBR term was lower than consumption growth for regional water customers.
Table 3.2.7-1 Rate Base – Net of Contributions
($ millions) A B
Mid-Year Rate Base 2016
Actual
PBR Forecast
1 Plant in service, beginning of year 1,404.6 1,371.1 2 Additions 84.5 83.0 3 Retirements/transfers (4.4) (3.6) 4 Plant in service, end of year 1,484.8 1,450.5 5 Accumulated depreciation, beginning of year 350.7 358.1 6 Depreciation expense 29.3 27.2 7 Retirements/transfers (3.9) (3.5) 8 Accumulated depreciation, end of year 376.1 381.8 9 Mid-year Plant in service 1,444.7 1,410.8
10 Mid-year Accumulated depreciation (363.4) (370.0) 11 Mid-Year Net Property 1,081.2 1,040.8 12 Other rate base items 13 Working capital 19.1 15.6 14 Materials and supplies 3.1 1.9 15 Mid-Year Rate Base 1,103.5 1,058.3 16 In-City Water Share (%) 78.44% 80.53% 17 In-City Water Share ($) 865.6 852.3
In 2016, the total return on In-City Water’s rate base was $1.9 million less than in the PBR forecast (see Table 3.2.7-2), primarily because of lower than forecast interest rates on long term debt issued over the 2012-2016 PBR term.

EPCOR Water Services Inc. Water and Wastewater Treatment PBR 2012-2016
19 May 1, 2017
Over the 2012-2016 PBR term, the total return on rate base was $4.5 million greater than forecast, with lower than forecast interest costs, as well as decreases in operations and maintenance expenses, more than offsetting consumption-related decreases in revenue. As a result, In-City returns on equity over the 2012-2016 PBR term averaged 12.06%, 1.19% greater than forecast.
Table 3.2.7-2 Return on In-City Water Share of Mid-Year Rate Base
($ millions) A B C D
Return on Rate Base 2016 2012-2016
Actual
PBR Forecast
Actual
PBR Forecast
1 Mid-year Rate Base Allocated to In-City Water 865.6 852.3 2 Capital Structure 3 Debt (%) 59.48% 60.00% 59.69% 59.58% 4 Equity (%) 40.52% 40.00% 40.31% 40.42% 5 Total 100.00% 100.00% 100.00% 100.00% 6 Cost of Capital 7 Cost of Debt 5.00% 5.65% 5.04% 5.64% 8 Cost of Equity 10.81% 10.875% 12.06% 10.875% 9 Weighted Average Cost of Capital 7.35% 7.74% 7.87% 7.76%
10 Return on Mid-Year Rate Base 11 Return on Rate Base Financed by Debt 25.7 28.2 111.7 123.9 12 Return on Rate Base Financed by Equity 37.9 37.3 183.3 166.6 13 Return on Mid-year Rate Base 63.6 65.5 295.0 290.5
Rates and Bill Comparisons 3.3
In-City Water Rates 3.3.1
In-City Water rates consist of consumption charges and fixed monthly service charges. As described in section 2.1, annual water rate increases are limited to inflation, less an efficiency factor, plus special rate adjustments. The 2016 PBR inflation adjustment (see Table 3.3.1) is calculated as the product of the current year’s forecast inflation, net of the 0.25% efficiency factor, and the prior year actual to forecast inflation adjustment.
In 2016, consumption charges were also increased by a special rate adjustment for Accelerated Water Main Renewal of 0.91%, resulting in a total rate increase for consumption charges of 2.77%. The increase in fixed monthly service charges was limited to inflation (net of the efficiency factor), since there were no special rate adjustments applicable to fixed monthly service charges in 2016.

Water and Wastewater Treatment PBR 2012-2016 EPCOR Water Services Inc.
May 1, 2017 20
Table 3.3.1 Impact of PBR Inflation on 2016 In-City Water Rates
A B C
2016 PBR Inflation Adjustment Weight Actual PBR
Forecast 1 2016 Forecast Inflation 2 Consumer price index 65% 1.60% 1.96% 3 Labour 35% 1.60 3.56 4 Weighted inflation 1.60 2.52 5 Less: Efficiency factor 0.25 0.25 6 Current Year Forecast Inflation 1.35% 2.27% 7 2015 Actual to Forecast inflation Adjustment 0.50 - 8 PBR Inflation Adjustment 1.86% 2.27%
Water Rate Structure by Customer Class 3.3.2
In-City Water has three customer classes. These classes and their rate structure include:
• Residential Customer Class. Residential customers are charged based on an inclining rate structure with three consumption blocks. The inclining rate structure is intended to promote water conservation and provide incentives for residential customers to use water efficiently.
• Multi-Residential Customer Class. Multi-residential customers are charged based on a declining rate structure with three consumption blocks. EWSI has found that the cost of providing water to individual multi-residential customers declines as the size of the multi-residential building increases. As well, there is a wide range of consumption volumes for multi-residential customers. Accordingly, a declining rate structure best reflects the cost characteristics of this customer class.
• Commercial Customer Class. Similar to multi-residential customers, commercial customers are charged based on a declining rate structure, but with five consumption blocks to recognize the wide range of average consumption volumes within this customer class.
Water Bill Comparisons to Other Communities 3.3.3
Water bill comparisons for 2016 are based on the published water rates for Calgary, Vancouver Winnipeg, Regina and Saskatoon as well as four local communities. These bill comparisons represent the total cost to the customer and include fixed charges, consumption charges and any other applicable surcharges.
Residential Water Bills 3.3.3.1
Figure 3.3.3.1 provides a comparison of residential household water bills for residential household consumption of 16.0m3 per month. This level of consumption is equal to the average Residential consumption per customer in Edmonton over the 2012-2016 period (see Section 3.1).

EPCOR Water Services Inc. Water and Wastewater Treatment PBR 2012-2016
21 May 1, 2017
Figure 3.3.3.1 Average Edmonton Monthly Residential Water Bill in 2016
(16.0m3/month)
Figure 3.3.3.1 shows that Edmonton’s residential water bills are competitive with surrounding communities and other major cities in western Canada. Further:
• Edmonton has the challenge of a poor raw water source compared to some other cities and must conduct additional treatment. For example, Vancouver only disinfects water with chlorine which results in lower water treatment costs.
• Different water rate structures also affect bill amounts. For example, EWSI pays an 8% franchise fee to the City of Edmonton, whereas St. Albert has no franchise fees.
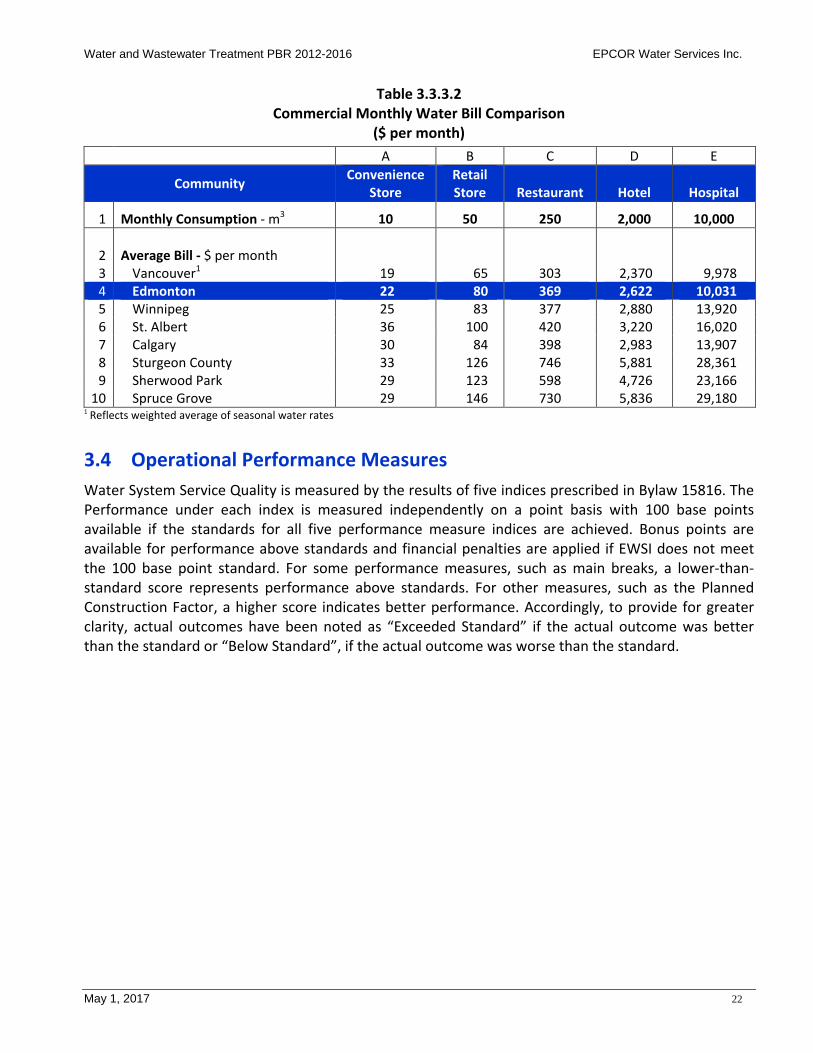
Commercial Water Bills 3.3.3.2
Table 3.3.3.2 provides a comparison of the water bills for typical commercial customers in each of In-City Water’s five consumption blocks. This table shows that water bills for EWSI’s commercial customers are competitive with those of surrounding communities and other major cities in western Canada.
Levy
$0.00
$10.00
$20.00
$30.00
$40.00
$50.00
$60.00
$70.00
Water and Wastewater Treatment PBR 2012-2016 EPCOR Water Services Inc.
May 1, 2017 22
Table 3.3.3.2 Commercial Monthly Water Bill Comparison
($ per month) A B C D E
Community Convenience Store
Retail Store Restaurant Hotel Hospital
1 Monthly Consumption - m3 10 50 250 2,000 10,000
2 Average Bill - $ per month 3 Vancouver1 19 65 303 2,370 9,978 4 Edmonton 22 80 369 2,622 10,031 5 Winnipeg 25 83 377 2,880 13,920 6 St. Albert 36 100 420 3,220 16,020 7 Calgary 30 84 398 2,983 13,907 8 Sturgeon County 33 126 746 5,881 28,361 9 Sherwood Park 29 123 598 4,726 23,166
10 Spruce Grove 29 146 730 5,836 29,180 1 Reflects weighted average of seasonal water rates
Operational Performance Measures 3.4Water System Service Quality is measured by the results of five indices prescribed in Bylaw 15816. The Performance under each index is measured independently on a point basis with 100 base points available if the standards for all five performance measure indices are achieved. Bonus points are available for performance above standards and financial penalties are applied if EWSI does not meet the 100 base point standard. For some performance measures, such as main breaks, a lower-than-standard score represents performance above standards. For other measures, such as the Planned Construction Factor, a higher score indicates better performance. Accordingly, to provide for greater clarity, actual outcomes have been noted as “Exceeded Standard” if the actual outcome was better than the standard or “Below Standard”, if the actual outcome was worse than the standard.
EPCOR Water Services Inc. Water and Wastewater Treatment PBR 2012-2016
23 May 1, 2017
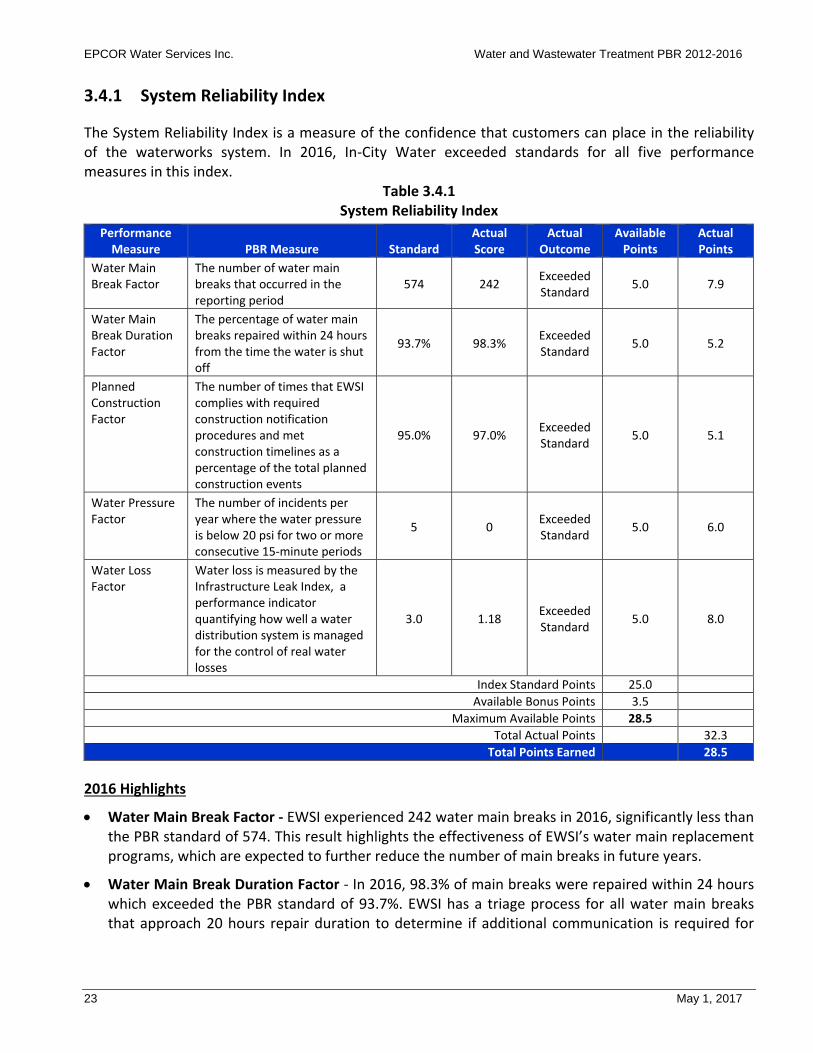
System Reliability Index 3.4.1
The System Reliability Index is a measure of the confidence that customers can place in the reliability of the waterworks system. In 2016, In-City Water exceeded standards for all five performance measures in this index.
Table 3.4.1 System Reliability Index
Performance Measure PBR Measure
Standard
Actual Score
Actual Outcome
Available Points
Actual Points
Water Main Break Factor
The number of water main breaks that occurred in the reporting period
574 242 Exceeded Standard 5.0 7.9
Water Main Break Duration Factor
The percentage of water main breaks repaired within 24 hours from the time the water is shut off
93.7% 98.3% Exceeded Standard 5.0 5.2
Planned Construction Factor
The number of times that EWSI complies with required construction notification procedures and met construction timelines as a percentage of the total planned construction events
95.0% 97.0% Exceeded Standard 5.0 5.1
Water Pressure Factor
The number of incidents per year where the water pressure is below 20 psi for two or more consecutive 15-minute periods
5 0 Exceeded Standard 5.0 6.0
Water Loss Factor
Water loss is measured by the Infrastructure Leak Index, a performance indicator quantifying how well a water distribution system is managed for the control of real water losses
3.0 1.18 Exceeded Standard 5.0 8.0
Index Standard Points 25.0 Available Bonus Points 3.5
Maximum Available Points 28.5 Total Actual Points 32.3
Total Points Earned 28.5 2016 Highlights
• Water Main Break Factor - EWSI experienced 242 water main breaks in 2016, significantly less than the PBR standard of 574. This result highlights the effectiveness of EWSI’s water main replacement programs, which are expected to further reduce the number of main breaks in future years.
• Water Main Break Duration Factor - In 2016, 98.3% of main breaks were repaired within 24 hours which exceeded the PBR standard of 93.7%. EWSI has a triage process for all water main breaks that approach 20 hours repair duration to determine if additional communication is required for

Water and Wastewater Treatment PBR 2012-2016 EPCOR Water Services Inc.
May 1, 2017 24
customers affected. EWSI also aims to provide temporary water supply to customers via water tanks, hose hook ups or delivery of water jugs to support affected customers.
• Planned Construction Factor - EWSI met all requirements for advanced customer notification of planned service interruptions and construction duration for 97 of 100 planned construction projects in 2016.
Water Quality Index 3.4.2
The Water Quality Index is calculated as the percentage of water quality test results that meet or exceed EWSI’s internal water quality standards. At a minimum, these standards are equal to the standards set out in Alberta Environment and Sustainable Resource Development’s Standards and Guidelines for Waterworks Systems, and Schedule 3 of EWSI’s Approval to Operate. In 2016, In-City Water exceeded the standard for this index.
Table 3.4.2 Water Quality Index
Performance
Measure PBR Measure Standard Actual Score
Actual Outcome
Available Points
Actual Points
Water Quality Index
The percentage of Edmonton water quality tests that meet EWSI’s internal standards and regulatory measures
99.6% 99.7 Exceeded Standard 25.0 25.0
Index Standard Points 25.0 Available Bonus Points 0.5
Maximum Available Points 25.5 Total Actual Points 25.0
Total Points Earned 25.0 2016 Highlights
• Water Quality Index - In 2016, EWSI met all the Guidelines for Canadian Drinking Water Quality health-based limits and AEP Approval water quality testing requirements. Only 164 of 61,644 tests on treated water failed to meet EPCOR internal targets. Most (154) of the failed tests involved samples collected in dead end and stagnant zones in the areas of the distribution system network still using cast iron water mains, with the most common failed tests related to high turbidity (68 tests) and low chlorine residual (35 tests). EWSI is assessing opportunities to improve water quality in areas with cast iron piping and low flow due to low water use, including: flushing to remove stagnant water and sediment; installation of bleeder points to increase flow of water; and replacing or lining water mains.
Coliform bacteria tests showed positive results ten times in 2016 compared to fifteen in 2014 and eight in 2015. All failed tests were confirmed to be negative on resampling. Although these results show that a false positive rate of 0.3% of the 3,655 bacteriological samples collected in the distribution system, EWSI is continuing its water sampler training programs to reduce the number of false positive bacteriological results.
EPCOR Water Services Inc. Water and Wastewater Treatment PBR 2012-2016
25 May 1, 2017
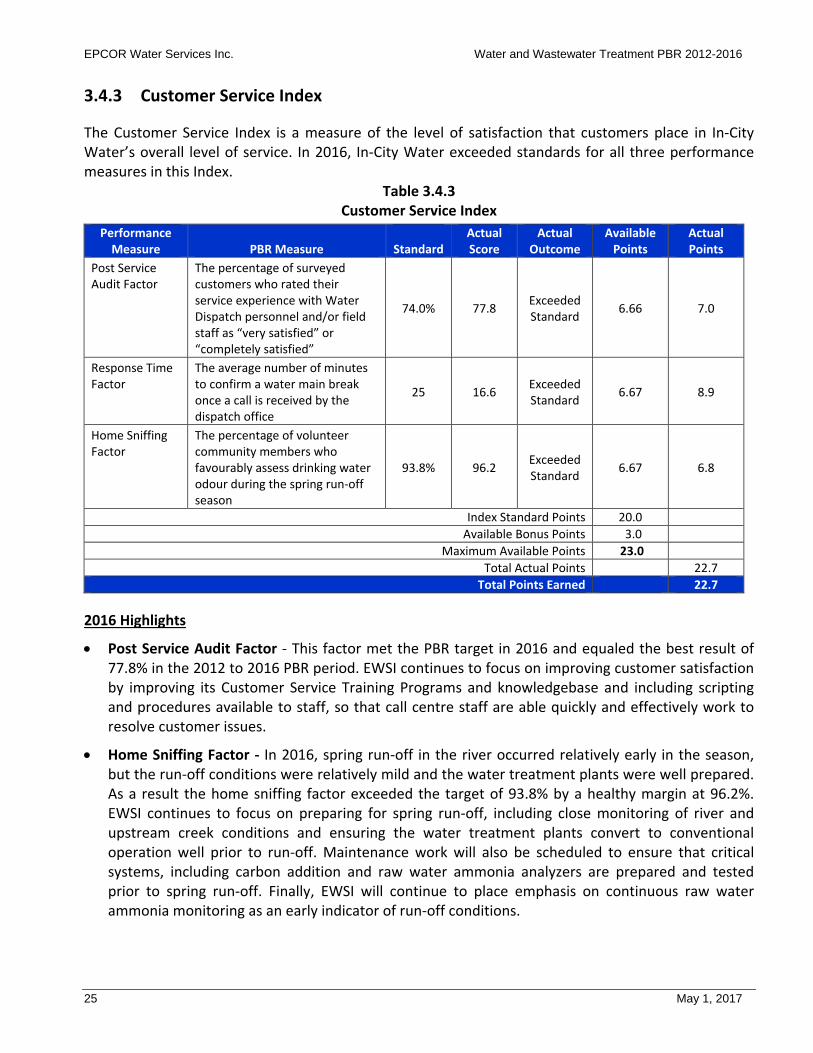
Customer Service Index 3.4.3
The Customer Service Index is a measure of the level of satisfaction that customers place in In-City Water’s overall level of service. In 2016, In-City Water exceeded standards for all three performance measures in this Index.
Table 3.4.3 Customer Service Index
Performance Measure PBR Measure
Standard
Actual Score
Actual Outcome
Available Points
Actual Points
Post Service Audit Factor
The percentage of surveyed customers who rated their service experience with Water Dispatch personnel and/or field staff as “very satisfied” or “completely satisfied”
74.0% 77.8 Exceeded Standard 6.66 7.0
Response Time Factor
The average number of minutes to confirm a water main break once a call is received by the dispatch office
25 16.6 Exceeded Standard 6.67 8.9
Home Sniffing Factor
The percentage of volunteer community members who favourably assess drinking water odour during the spring run-off season
93.8% 96.2 Exceeded Standard 6.67 6.8
Index Standard Points 20.0 Available Bonus Points 3.0
Maximum Available Points 23.0 Total Actual Points 22.7
Total Points Earned 22.7 2016 Highlights
• Post Service Audit Factor - This factor met the PBR target in 2016 and equaled the best result of 77.8% in the 2012 to 2016 PBR period. EWSI continues to focus on improving customer satisfaction by improving its Customer Service Training Programs and knowledgebase and including scripting and procedures available to staff, so that call centre staff are able quickly and effectively work to resolve customer issues.
• Home Sniffing Factor - In 2016, spring run-off in the river occurred relatively early in the season, but the run-off conditions were relatively mild and the water treatment plants were well prepared. As a result the home sniffing factor exceeded the target of 93.8% by a healthy margin at 96.2%. EWSI continues to focus on preparing for spring run-off, including close monitoring of river and upstream creek conditions and ensuring the water treatment plants convert to conventional operation well prior to run-off. Maintenance work will also be scheduled to ensure that critical systems, including carbon addition and raw water ammonia analyzers are prepared and tested prior to spring run-off. Finally, EWSI will continue to place emphasis on continuous raw water ammonia monitoring as an early indicator of run-off conditions.

Water and Wastewater Treatment PBR 2012-2016 EPCOR Water Services Inc.
May 1, 2017 26
Environment Index 3.4.4
The Environmental Index measures In-City Water’s efforts to limit its impact on the environment and contributes to the City’s ten-year strategic goal to “Preserve and Sustain Edmonton’s Environment”. In 2016, In-City Water met or exceeded all of the five standards in this index.
Table 3.4.4 Environmental Index
Performance Measure PBR Measure
Standard
Actual Score
Actual Outcome
Available Points
Actual Points
Emergency Response Training
The number of practice exercises undertaken in the year
4 4 Met Standard
3.75 plus 0.75 Bonus
Points 3.75
Completeness and Timeliness of Reporting
The percentage of incident reports completed 100% 100% Met
Standard 3.75 3.75
Environment Incident Management
The number of reportable and preventable environmental incidents
7 4 Exceeded Standard 3.75 3.75
Water Conservation Factor
The 10 year average monthly water consumption in m3 per Edmonton residential household
19.0 16.9 Exceeded Standard 1.50 1.50
Watershed Program Activity
# of deliverables completed
5 7 Exceeded Standard
2.25 plus 0.75 Bonus
Points 3.00
Index Standard Points 15.00 Available Bonus Points 1.50
Maximum Available Points 16.50 Total Actual Points 15.75
Total Points Earned 15.75
2016 Highlights
• Water Conservation Factor - Standard and actual scores for this performance measure are based on a rolling ten-year average of residential water consumption. The higher than forecast decline in residential consumption discussed in Section 3.1 has resulted in a steady decrease in this factor over the 2012-2016 PBR term.
Safety Index 3.4.5
The Safety Index measures In-City Water’s progress towards its commitment of achieving a zero injury culture and encouraging staff awareness and engagement in safety activities. This index includes both activity-based performance measures (safety meetings, safe work plans, first aid training, and work site inspections) and outcome-based performance measures (lost time frequency, injury frequency and injury severity). In 2016, In-City Water met or exceeded standards for all seven performance measures in this index.

EPCOR Water Services Inc. Water and Wastewater Treatment PBR 2012-2016
27 May 1, 2017
Table 3.4.5 Safety Index
Performance Measure PBR Measure
Standard
Actual Score
Actual Outcome
Available Points
Actual Points
Safety Meetings
Number of safety meetings conducted during the year 36 36 Met
Standard 1.5 1.5
Formal Safe Work Plans (SWP)
Number of Formal Safe Work Plans each calendar year to identify, control and communicate hazards
3,100 17,990 Exceeded Standard 3.75 3.75
First Aid Training
Percentage of permanent employees at year-end who hold a valid Standard First Aid Certificate
33% 60.2% Exceeded Standard 3.0 3.0
Work Site Inspections / Observations
Number of Work Site Inspections / Observations each calendar year to find problems and assess accidents before other losses occur
800 1.017 Exceeded Standard 3.0 3.0
Lost Time Frequency Rate
A measure of the effectiveness of a safety program – the frequency of injury rate per unit of exposure
0.59 0.2 Exceeded Standard
0.75 plus 0.375 Bonus Points 1.125
All Injury Frequency Rate
A measure of the frequency of disabling injuries and medical aid injuries per unit of exposure
2.40 0.65 Exceeded Standard
1.5 plus 0.5625 Bonus Points 2.0625
Injury Severity Rate
A measure of the seriousness of injuries and illnesses – ratio number of disability days to the number of employee exposure hours in a calendar year
8.92 5.61 Exceeded Standard
1.5 plus 0.5625 Bonus Points 2.0625
2.0265Inde61x Standard Points 15.0 Available Bonus Points 1.5
Maximum Available Points 16.5 Total Actual Points 16.5
Total Points Earned 16.5
2016 Highlights
• Safety is a core value at EPCOR. During the 2012 to 2016 PBR term, EWSI developed and implemented a health and safety management system, encompassing safety meetings, safe work plans, work site observations and first aid training, essentially the activity-based PBR performance measures, achieving ISO14001 certification in the process. These efforts have enabled EWSI to surpass the standards for its output-based measures. While EWSI is proud of its accomplishments, EWSI continues to work towards eliminating work place injuries and ensuring a safe work environment.

Water and Wastewater Treatment PBR 2012-2016 EPCOR Water Services Inc.
May 1, 2017 28
4 2015 PBR Results - Wastewater
Consumption and Customer Count 4.1Wastewater customer counts and consumption are similar to those of In-City Water. Differences in actual customer counts between In-City Water and Wastewater relate to “water-only” customers who are not tied into the City’s drainage system. Accordingly, average monthly consumption per customer and total annual consumption are also similar to those of In-City Water. Results for 2016 and 2012-2016 are summarized on Table 4.1, below.
Table 4.1 Wastewater
Consumption, Customer Counts and Average Monthly Consumption per Customer
A B C D
Customer Class 2016 2012-2016
Actual PBR
Forecast Actual PBR
Forecast 1 Annual Consumption - ML 2 Residential 43,470 46,012 213,250 226,499 3 Multi-Residential 17,993 16,622 87,805 83,541 4 Commercial 24,375 25,977 125,142 127,182 5 Total 85,837 88,611 426,197 437,222 6 Average Monthly Customer Count 7 Residential 248,805 240,192 233,718 232,066 8 Multi-Residential 3,666 3,517 3,527 3,465 9 Commercial 16,097 16,065 15,630 15,673
10 Total 268,568 259,774 252,876 251,204 11 Monthly Consumption per Customer - m3 12 Residential 14.6 16.0 15.2 16.3 13 Multi-Residential 409.0 393.8 414.9 401.8 14 Commercial 126.2 134.7 133.4 135.2
Financial Performance 4.2
Net income and Return on Equity 4.2.1
In 2016, despite lower than forecast consumption, Wastewater’s net income and return on equity were both greater than forecast (see Table 4.2.1), as reductions in operating costs and interest expenses more than offset lower than forecast consumption revenue, resulting from an unusually damp summer. For 2012-2016, Wastewater’s net income and ROE were both greater than forecast for essentially the same reasons, with reductions in operating costs and interest expense exceeding lower than forecast consumption revenue over the 2012-2016 PBR term.

EPCOR Water Services Inc. Water and Wastewater Treatment PBR 2012-2016
29 May 1, 2017
Table 4.2.1 Wastewater
Net Income and Return on Equity ($ millions)
A B C D
Net Income and Return on Equity 2016 2012-2016
Actual PBR
Forecast Actual PBR
Forecast 1 Revenue 83.7 86.2 363.9 378.5 2 Operating costs (47.0) (51.0) (218.9) (237.1) 3 Depreciation expense (13.1) (11.0) (51.0) (49.5) 4 Interest expense (8.1) (9.8) (36.4) (44.3) 5 Net Income 15.6 14.4 57.6 47.7 6 Return on Equity (%) 11.37% 10.88% 9.93% 8.00%
Revenue 4.2.2
In 2016, Wastewater’s revenues were $5.2 million less than in the PBR forecast ($16.5 million less for 2012-2016). This difference is primarily attributable to the long-term decline in per customer consumption discussed in Section 3.1, slightly offset by an increase in over-strength revenues (surcharges on high concentrations of constituent components of wastewater) from commercial customers included in the other revenue category on Table 4.2.2 below.
Table 4.2.2 Wastewater
Revenue by Customer Class ($ millions)
A B C D
Revenue by Customer Class 2016 2012-2016
Actual PBR
Forecast Actual PBR
Forecast 1 Consumption Revenue 2 Residential 33.3 37.7 144.5 159.9 3 Multi-Residential 13.8 13.6 59.4 58.9 4 Commercial 17.8 20.0 80.2 84.2 5 Total Consumption Revenue 65.0 71.3 284.1 303.0 6 Fixed Charge Revenue 7 Residential 12.3 12.4 50.6 51.5 8 Multi-Residential 0.2 0.2 0.8 0.8 9 Commercial 0.8 0.8 3.4 3.5
10 Total Fixed Charge Revenue 13.3 13.4 54.7 55.7 11 Total Wastewater Treatment Revenue 78.3 84.7 338.9 358.7 12 Other revenue 5.4 4.2 25.0 21.7 13 Total Revenue 83.7 88.9 363.9 380.4

Water and Wastewater Treatment PBR 2012-2016 EPCOR Water Services Inc.
May 1, 2017 30
Operating Costs 4.2.3
Operating Costs by Cost Category 4.2.3.1
Total operating costs for 2016 were $4.0 million less than forecast ($18.2 million less for 2012-2016). Actual and forecast costs by cost category are summarized in Table 4.2.3.1-1.
Table 4.2.3.1-1 Operating Costs by Cost Category
($ millions) A B C D
Cost Category 2016 2012-2016
Actual PBR
Forecast Actual PBR
Forecast 1 Salaries and benefits 18.3 18.4 84.2 85.7 2 Corporate shared services 4.5 6.3 20.7 29.4 3 Customer billing 5.1 4.6 23.5 22.3 4 Power and other utilities 4.5 5.7 23.6 26.4 5 Contractors and consultants 4.5 3.8 22.4 18.6 6 Materials and supplies 2.9 3.5 12.8 16.0 7 Other 1.3 2.2 5.0 10.1 8 Franchise fees 6.1 6.5 26.6 28.5 9 Total Operating Costs 47.0 51.0 218.9 237.1
As with Water Services, a significant proportion of the actual to forecast difference for Wastewater operating costs relates to the EPCOR’s 2013 corporate reorganization discussed in section 3.2.3. The net cost savings from the corporate reorganization are summarized in Table 4.2.3.1-2:
Table 4.2.3.1-2 Corporate Reorganization Impacts
($ millions) A B Cost Savings from: 2016 2012-2016
1 Reduction in Salaries and benefits (0.3) (0.6) 2 Reduction in Corporate shared services costs (1.8) (8.7) 3 Increase in other costs from EWSI shared services cost allocation 1.3 3.6 4 Net cost savings (0.8) (5.7)
Significant actual to forecast differences for 2016 and for 2012-2016 include:
• Salaries and Benefits - $0.1 million less than forecast ($1.3 million greater for 2012-2016).
Besides the corporate reorganization, Wastewater had additional reductions in net salaries expenses because of higher than forecast capitalization of salaries of staff assigned to capital projects ($0.4 million in 2016 and $3.9 million for 2012-2016). These reductions were largely offset by additional incentive pay ($0.7 million in 2016 and $3.2 million for 2012-2016), reflecting Gold Bar’s strong financial and operational performance. The remainder of the actual to forecast difference consists of numerous small items, none of which are individually significant.

EPCOR Water Services Inc. Water and Wastewater Treatment PBR 2012-2016
31 May 1, 2017
• Contractors and Consultants - $0.7 million greater than forecast ($3.8 million greater for 2012-2016).
Higher than forecast contractor and consultant costs reflect EWSI’s use of contractors and consultants to perform the engineering studies and site assessments needed to support revisions to its capital program (see Section 4.2.6), as well as to perform unforeseen repairs (boiler repairs and recertification, sludge line repairs, asbestos abatement, and other unplanned maintenance and repair activities).
• Corporate Shared Services - $1.8 million less than forecast ($8.7 million less for 2012-2016).
Lower than forecast corporate shared services costs are attributable to the 2013 corporate reorganization.
• Customer Billing - $0.5 million greater than forecast ($1.3 million greater for 2012 – 2016).
Similar to Water Services, EEAI charges EWSI a regulated cost of service-based rate for each bill processed. These charges are allocated between Wastewater and the City’s Drainage department in accordance with the Gold Bar Master Agreement. Actual costs are greater than forecast because of higher than forecast customer counts.
• Power and Other Utilities - $1.2 million less than forecast ($2.8 million less for 2012-2016).
Lower than forecast costs in this category reflect two factors. First, natural gas costs have been much lower than forecast ($0.6 million in 2016 and $2.6 million for 2012-2016). Second, Wastewater entered into a new power contract in 2016, providing energy price reductions of $0.6 million in 2016 ($0.4 million for 2012-2016).
• Material and Supplies - $0.6 million less than forecast ($3.2 million less for 2012-2016).
Lower than forecast materials and supplies costs reflect several factors. First, chemical usage has decreased as a result of process improvements, including chemical optimization and a new combined sewer overflow strategy, providing savings of $0.3 million in 2016 ($1.0 million for 2012-2016). Second, delays in completing the odour control and sludge screening and dewatering projects meant that expenditures on related materials and supplies were not incurred, reducing costs by $0.3 million in 2016 ($1.5 million for 20112-2016). The remainder of the actual to forecast difference consists of numerous small items.
• Other - $0.9 million less than forecast ($5.1 million less for 2012-2016)
Besides the savings from the 2013 corporate reorganization, lower than forecast costs reflect two main factors. First, as with Water Services, in 2013, Wastewater aligned its capital overhead methodology with that of other EUI subsidiaries, resulting in capitalization of an additional $1.3 million of corporate overhead costs in 2016 ($3.2 million for 2012-2016). Second, EWSI sells recycled water produced at its Gold Bar site to an external customer. The costs associated with the production of recycled water ($1.0 million in 2016 and $4.9 million for 2012-2016) have been removed from Wastewater’s operating costs and transferred to EWSI’s non-regulated business.
• Franchise Fees
Lower than forecast franchise fees are attributable to lower than forecast revenues.

Water and Wastewater Treatment PBR 2012-2016 EPCOR Water Services Inc.
May 1, 2017 32
Operating Costs by Operational Function 4.2.3.2
EWSI’s operating costs are analyzed on a functional basis, as well as a cost category basis. Actual and forecast total system operating costs by function are summarized in Table 4.2.3.2.
Table 4.2.3.2 Operating Costs by Operational Function
($ millions)
A B C D
Operational Function 2016 2012-2016
Actual PBR
Forecast Actual PBR
Forecast 1 Wastewater Treatment Plant 20.5 22.3 96.2 103.6 2 Quality Assurance and Environment 3.1 3.0 14.5 14.2 3 Operations Support Services 3.8 4.6 17.9 21.9 4 Administrative Services 3.8 3.7 19.4 17.2 5 Customer billing 5.1 4.6 23.5 22.3 6 Corporate Administration 4.5 6.3 20.7 29.4 7 Franchise fees 6.1 6.5 26.6 28.5 8 Total Wastewater Operating Costs 47.0 51.0 218.9 237.1
Significant differences between 2016 actual and PBR forecast costs by Function include: • Wastewater Treatment Plant - $1.8 million less than forecast ($7.4 million greater for 2012-2016).
Lower than forecast wastewater treatment plant costs include: $1.0 million of cost recoveries from non-utility operations ($4.9 million for 2012-2015); $1.2 million of cost savings ($2.8 million for 2012-2016) for power and natural gas; $0.3 million ($1.0 million for 2012 to 2016) for reductions in chemical usage; and $0.3 million ($1.5 million for 2012-2016) for reductions in material and supplies related to projects completed later than originally forecast. These amounts have been partially offset by an additional $1.0 million in additional contractor costs ($3.6 million for 2012-2016) associated with additional maintenance and repair activities. The remainder of the actual to forecast difference consists of numerous small items, none of which are considered significant.
• Operations Support Services - $0.8 million less than forecast ($4.0 million less for 2017-2021)
Lower than forecast Operational Support Services costs are largely attributable to the 2013 corporate reorganization ($0.5 million in 2016 and $2.0 million for 2012-2016). The remainder of the actual to forecast difference consists of numerous small items, none of which are significant individually or in aggregate.
• Administrative Services - $0.7 million greater than forecast ($2.1 million greater for 2012-2015)
Higher than forecast Administrative Services costs are the product of several different factors. First, the 2013 corporate reorganization increased costs by $1.6 million in 2016 ($5.0 million for 2012-2016); and, second, incentive costs increased cost by $0.7 million in 2016 ($3.2 million for 2012-2016). These increases were offset by a $0.6 million ($2.2 million for 2012-2016) reduction in salary and benefits costs related to long-term disability benefit and supplemental pension plan

EPCOR Water Services Inc. Water and Wastewater Treatment PBR 2012-2016
33 May 1, 2017
adjustments, as well as a $1.3 million ($3.2 million for 2012-2016) reduction in costs resulting from the change in capital overhead methodology. Besides these factors, the remainder of the actual to forecast difference consists of numerous small items, none of which are significant individually or in aggregate.
• Variances in Corporate Administration, Customer Billing and Franchise fees are discussed in section 4.2.3.1 above.
Depreciation Expense 4.2.4
In 2016, Wastewater’s net depreciation expense was $2.1 million greater than the PBR forecast ($1.5 million for 2012-2015), reflecting the higher level of capital expenditures during the 2012-2016 PBR term, as well as delays in placing assets into service (see Section 4.2.6). Actual and forecast depreciation expense are summarized in Table 4.2.4.
Table 4.2.4 Net Depreciation Expense
($ millions) A B C D
Depreciation Expense 2016 2012-2016
Actual PBR
Forecast Actual PBR
Forecast 1 Depreciation expense 13.9 11.9 55.0 54.1 2 Amortization of Contributions (0.9) (0.9) (4.6) (4.5) 3 Sub-total 13.0 11.0 50.4 49.5 4 Cancelled project costs 0.1 - 0.6 - 5 Depreciation Expense, net 13.1 11.0 51.0 49.5
Interest Expense and Cost of Debt 4.2.5
In 2016, Wastewater’s interest expense was $1.7 million less than forecast ($7.9 million less for 2012-2016). This difference is attributable to two factors. First, as with Water Services, the cost of new debt issues was lower than forecast. Second, delay and deferral of capital expenditures in 2012 and 2013 (see 4.2.6 below) meant that Wastewater’s rate base and, therefore, interest on the rate base, was lower than forecast in those years. Finally, increases in capital spending between 2014 and 2016, combined with delays in completion of projects, meant that construction work in process (“CWIP”) balances were significantly higher than expected. The costs of financing higher CWIP balances, referred to as the Allowance for Funds Utilized During Construction (“AFUDC”), were also greater than forecast. The combined impact of these factors, summarized on Table 4.2.5 below, is that the average cost of debt in 2016 is 1.32% lower than forecast (0.94% lower than forecast for 2012-2016). The cost of debt has be realigned to current market in the 2017-2021 PBR.

Water and Wastewater Treatment PBR 2012-2016 EPCOR Water Services Inc.
May 1, 2017 34
Table 4.2.5
Interest Expense and Cost of Debt ($ millions)
A B C D
Interest Expense and Cost of Debt 2016 2012-2016
Actual
PBR Forecast
Actual
PBR Forecast
1 Interest expense 9.7 10.4 42.5 47.3 2 AFUDC (1.7) (0.6) (6.2) (3.0) 3 Interest expense, net of AFUDC 8.1 9.8 36.4 44.3 4 Mid-year debt and other non-current liabilities 218.7 195.6 917.6 900.6 5 Average Cost of Debt 3.69% 5.01% 3.97% 4.91%
Capital Expenditures 4.2.6
Over the 2012-2016 PBR term, Wastewater’s capital expenditures were $57.2 million, or more than 50% greater than forecast. The need for this increase was first identified in 2012 when preliminary engineering analysis showed that the cost of many projects in Wastewater’s capital program would be significantly greater than forecast and that the Gold Bar Wastewater Treatment Plant, required significant structural and mechanical rehabilitation. Accordingly, EWSI delayed or deferred capital spending in 2012 and 2013 while it conducted a comprehensive review of its Gold Bar facility to assess asset condition and identify repairs, upgrades and replacements needed to ensure plant reliability. This review showed that not only were costs higher than forecast for individual capital projects, but that significantly more capital upgrades and replacements were required than had been anticipated in the PBR forecast. Wastewater developed a revised capital program organized into five reliability categories (see Table 4.2.6-1) to address the issues identified in its review economically and efficiently. The majority of the work on the revised capital program was undertaken between 2014 and 2016, resulting in much higher than forecast capital expenditures in each of those years, and over the entire 2012-2016 PBR term. These changes were reviewed with Administration and Utility Committee a number of times over the 2012-2016 PBR term.

EPCOR Water Services Inc. Water and Wastewater Treatment PBR 2012-2016
35 May 1, 2017
Table 4.2.6-1 Capital Expenditures
($ millions) A B C D
Capital Program Category 2016 2012-2016
Actual PBR
Forecast
Actual PBR
Forecast 1 Digester Reliability 1.0 3.5 22.2 22.0 2 Solids Handling Reliability 6.4 8.6 37.7 51.2 3 Clover Bar Reliability 0.4 0.0 18.2 8.9 4 Base Reliability 30.8 4.2 80.0 29.5 5 Sanitary Grit 9.2 0.0 10.8 0.0 6 Total 47.8 16.2 168.9 111.7
Actual to forecast differences by category are as follows:
• Digester Reliability – $2.5 million less than forecast, $0.2 million less for 2012-2016.
This category includes upgrades to the digesters and gas room to improve capacity and reliability. Although the costs to upgrade each digester are higher than forecast, EWSI’s efforts to maximize digester capacity have decreased the number of digesters requiring upgrades.
• Solids Handling Reliability – $2.2 million less than forecast, $13.4 million less for 2012-2016.
This category includes upgrades to grit removal and screening, sludge storage and thickening, head-works flow control, and solids handling processes. EWSI has completed detailed studies and reviewed several design options for handling increased solids to the plant. These changes have led to revised designs and a higher focus on process optimization and therefore lower capital costs for this program.
• Clover Bar Reliability – $0.4 million greater than forecast, $9.3 million greater for 2012-2016.
This project category includes the Ostara Nutrient Recovery Project, which utilizes a new process to recover phosphorus and nitrogen from the Clover Bar biosolids settling lagoons located at the Edmonton Waste Management Centre and transforms these nutrients into an eco-friendly, slow-release fertilizer. The cost of this project in the PBR forecast was based on preliminary cost estimates and the start of this project was delayed to allow EWSI to confirm costs and benefits. This delay resulted in approximately $1 million of the $9.3 million cost increase.
• Base Reliability – $26.6 million greater than forecast, $50.4 million greater for 2012-2016.
This category consists primarily of life-cycle replacements and additional assets needed to maintain or improve reliability and safety of plant operations. Higher than forecast actual and projected costs in this category reflect the results of EWSI’s comprehensive asset condition review and represent the capital costs needed to ensure plant reliability. These results are summarized in Table 4.3-2 below:

Water and Wastewater Treatment PBR 2012-2016 EPCOR Water Services Inc.
May 1, 2017 36
Table 4.2.6-2 Capital Expenditures - Base Reliability Projects
($ millions) A B C D
Base Reliability Sub-Categories 2016 2012-2016
Actual
PBR Forecast
Actual
PBR Forecast
1 Buildings and site 4.0 0.5 11.3 9.6 2 Structural 8.8 1.1 21.3 5.3 3 Mechanical 13.0 1.4 30.8 7.7 4 Electrical 1.6 0.4 7.0 2.1 5 Instrumentation and controls 1.5 0.8 7.1 4.9 6 General plant and process 2.0 - 2.4 - 7 Total 30.8 4.2 80.0 29.5
• Sanitary Grit - $9.2 million greater than forecast, $10.8 million greater for 2012-2016.
This project was not contemplated in the PBR, so there are no forecast expenditures. EWSI has agreed to design, construct, commission, operate, and maintain a sanitary grit facility at the request of City of Edmonton Drainage Services. The project was included in the 2017-2021 PBR for consideration as a EWSI regulated asset and was approved for inclusion.
Rate Base and Return on Equity 4.2.7
In 2016, Wastewater’s mid-year rate base (see Table 4.2.7-1) was $19.0 million (5.8%) greater than forecast, reflecting both higher plant in service resulting from revisions to Wastewater’s capital program, and lower than forecast accumulated depreciation, resulting from delays in placing assets into service.

EPCOR Water Services Inc. Water and Wastewater Treatment PBR 2012-2016
37 May 1, 2017
Table 4.2.7-1 Rate Base – Net of Contributions
($ millions) A B
Mid-Year Rate Base 2016
Actual PBR Forecast 1 Plant in service, beginning of year 427.3 440.8 2 Additions 51.4 19.7 3 Retirements/transfers (6.8) - 4 Plant in service, end of year 471.9 460.5 5 Accumulated depreciation, beginning of year 108.5 123.5 6 Depreciation expense 12.9 11.0 7 Retirements/transfers (6.8) - 8 Accumulated depreciation, end of year 114.6 134.4 9 Mid-Year Property, Plant and Equipment 449.6 450.6
10 Mid-Year Accumulated Depreciation (111.5) (128.9) 11 Mid-Year Net Property 338.0 321.7 12 Other rate base items 13 Working capital 6.8 5.1 14 Materials and supplies 1.8 0.8 15 Mid-Year Rate Base 346.6 327.6
Total returns on Wastewater’s rate base are shown in Table 4.2.7-2. In 2016, the total return on Wastewater’s rate base was $0.5 million less than forecast ($0.8 million less for 2012-2016), with lower than forecast interest costs resulting in a shift in returns from debt to equity.
Table 4.2.7-2
Return on Rate Base - Wastewater ($ millions)
A B
Return on Rate Base 2016 2012-2016
Actual PBR
Forecast Actual PBR
Forecast 1 Mid-year Rate Base 346.6 327.6 2 Capital Structure 3 Debt (%) 60.47% 59.94% 60.24% 59.71% 4 Equity (%) 39.53% 40.06% 39.76% 40.29% 5 Total 100.00% 100.00% 100.00% 100.00% 6 Cost of Capital 7 Cost of Debt 3.85% 4.99% 4.14% 4.98% 8 Cost of Equity 11.37% 10.875% 9.93% 7.96% 9 Weighted Average Cost of Capital 6.82% 7.35% 6.44% 6.18%
10 Return on Mid-Year Rate Base 11 Return on Rate Base Financed by Debt 8.1 9.8 36.4 44.3 12 Return on Rate Base Financed by Equity 15.6 14.3 57.6 47.6 13 Return on Mid-year Rate Base 23.6 24.1 91.0 91.8

Water and Wastewater Treatment PBR 2012-2016 EPCOR Water Services Inc.
May 1, 2017 38
Rates and Bill Comparisons 4.3
Wastewater Treatment Rates 4.3.1
Wastewater treatment rates consist of consumption charges and fixed monthly service charges. As described in section 2.1, annual rate increases are limited to inflation, less an efficiency factor, plus special rate adjustments. In 2016, in addition to the PBR Inflation Adjustment for 1.86% (see Section 3.5.1), wastewater treatment rates were also increased by a special rate adjustment of 5.87%, resulting in a total rate increase of 7.72%.
Wastewater Treatment Rate Structure by Customer Class 4.3.2
Wastewater has two customer classes: Residential and Commercial. Unlike In-City Water, there are no separate rates for multi-residential customers. Instead, customers who would be multi-residential water customers are subject to the same rates as residential wastewater customers. The common rate structure for residential and multi-residential customers recognizes that the costs of wastewater treatment are very similar for residential and multi-residential customers. Accordingly, charges to Residential customers are based on a flat rate structure with a single consumption block. Charges to Commercial customers are based on a declining rate structure with three consumption blocks to recognize that there are economies of scale in wastewater treatment for larger commercial customers. In addition, commercial customers are charged overstrength fees for prescribed materials that exceed the concentrations shown in Section 4 of Schedule 1 to Bylaw 15816.
Wastewater Bill Comparisons to Other Communities 4.3.3
Wastewater bill comparisons for 2016 are based on surveys of Calgary, Vancouver, Winnipeg as well as four local communities. These bill comparisons are based on the total cost to the customer and include fixed charges, consumption charges, plus any surcharges.
Unlike most communities where drainage and wastewater treatment services are combined, EWSI Wastewater is only responsible for wastewater treatment. Drainage services, including the operations and maintenance of the collection system, are provided by the City. Accordingly, wastewater bill comparisons are based on blended EWSI wastewater treatment and City drainage rates.
Residential Wastewater Bills 4.3.3.1
Figure 4.3.3.1 provides a comparison of residential household wastewater bills based on the Edmonton residential household’s 2012-2016 average wastewater consumption of 15.2m3 per month. Edmonton’s residential wastewater bill is based on a blended rate consisting of EWSI Wastewater’s charge of $16.22 per month and the City’s drainage charge of $22.97 per month.

EPCOR Water Services Inc. Water and Wastewater Treatment PBR 2012-2016
39 May 1, 2017
Figure 4.3.3.1 Average Edmonton Monthly Residential Wastewater Bill
(15.2m3/month)
Commercial Wastewater Bills 4.3.3.2
Table 4.3.3.2 provides a comparison of the water bills for commercial customers with differing levels of monthly wastewater consumption. This table shows that water bills for EWSI’s commercial customers are competitive with surrounding communities and with major cities in western Canada. Overall, there is substantial variation in monthly wastewater bills for commercial customers. As with Residential bill comparisons, commercial wastewater bill comparisons are based on blended EWSI wastewater treatment and City drainage rates.
Table 4.3.3.2 Commercial Monthly Wastewater Bill Comparison
A B C D E
Community Convenience Store
Retail Store Restaurant Hotel Hospital
1 Monthly Consumption - m3 10 50 250 2,000 10,000
2 Average Bill ($ per month) 3 Vancouver 22 111 555 4,442 22,210 4 Edmonton 30 98 478 3,892 13,567 5 Winnipeg 23 114 570 4,560 22,800 6 St. Albert 45 177 836 6,608 32,992 7 Calgary 51 107 390 2,860 14,153 8 Sturgeon County 64 224 1,037 8,040 39,960 9 Sherwood Park 36 93 560 2,992 13,950
10 Spruce Grove 21 108 538 4,300 21,500
Drainage
Drainage
Tax Levy
$0.00
$10.00
$20.00
$30.00
$40.00
$50.00
$60.00
SpruceGrove
Vancouver SherwoodPark
Edmonton St. Albert Winnipeg SturgeonCounty
Calgary

Water and Wastewater Treatment PBR 2012-2016 EPCOR Water Services Inc.
May 1, 2017 40
Operational Performance Measures 4.4Wastewater System Service Quality is measured by the results of five indices prescribed in Bylaw 15816. Performance under each index is measured independently on a point basis with 100 base points available if the standards for all five performance measure indices are achieved. Bonus points are available for performance above standards and financial penalties are applied if EWSI does not meet the 100 base point standard. Actual outcomes have been noted as “Exceeded Standard” if the actual outcome was better than the standard or “Below Standard”, if the actual outcome was worse than the standard.
System Reliability Index 4.4.1
The System Reliability Index is a measure of the confidence that customers can place in the reliability of Wastewater Treatment Services. In 2016, Wastewater exceeded the standard for this index.
Table 4.4.1 System Reliability Index
Performance Measure PBR Measure
Standard
Actual Score
Actual Outcome
Available Points
Actual Points
Enhanced Primary Treatment (EPT)
EPT performance, measured in percent, where the EPT facility operated during wet weather events when the influent flow rate exceeded the EPT event threshold
75.0% 100.0% Exceeded Standard
15.0 plus 1.0 Bonus
Point 20.0
Index Standard Points 15.0 Available Bonus Points 1.0
Maximum Available Points 16.0 Total Actual Points 20.0
Total Points Earned 16.0
2016 Highlight
• Enhanced Primary Treatment – Gold Bar exceeded the standard for this performance measure. EPT clarifiers were always available in wet weather events to minimize the amount of untreated overflow entering the North Saskatchewan River. All planned EPT facility maintenance was completed during dry weather periods, ensuring EPT facility availability when needed.
Wastewater Quality Index 4.4.2
The Wastewater Quality Index is a measure of the quality of the Gold Bar wastewater treatment plant’s actual final effluent quality relative to its discharge limits for five parameters. In 2016, Wastewater exceeded the standard in this index.

EPCOR Water Services Inc. Water and Wastewater Treatment PBR 2012-2016
41 May 1, 2017
Table 4.4.2 Wastewater Quality Index
Performance Measure PBR Measure
Standard
Actual Score
Actual Outcome
Available Points
Actual Points
Wastewater Effluent Limit Performance Index (WELPI)
The percentage of the discharge limit for five parameters in the Gold Bar wastewater treatment plant’s final effluent
46.0% 17.5% Exceeded Standard
40.0 plus 4.0 Bonus
Points 105.1
Index Standard Points 40.0 Available Bonus Points 4.0
Maximum Available Points 44.0 Total Actual Points 105.1
Total Points Earned 44.0 2016 Highlight
• Wastewater Effluent Limit Performance Index - Wastewater achieved the best result for this standard for the 2012-2016 PBR term in 2016. This result reflects increased training, focusing on both theory and application to improve operational understanding of the biological nutrient removal process.
Customer Service Index 4.4.3
The Customer Service Index is a measure of the level of satisfaction that customers place in Wastewater’s overall level of customer service. In 2016, Wastewater exceeded the standard in this index.
Table 4.4.3 Customer Service Index
Performance Measure PBR Measure
Standard
Actual Score
Actual Outcome
Available Points
Actual Points
Customer Inquiries Responses
Percentage of customer issues responded to within 24-hours of receipt
90.0% 100.0% Exceeded Standard
5.0 5.6
Index Standard Points 5.0 Maximum Available Points 5.0
Total Actual Points 5.6 Total Points Earned 5.0
2016 Highlights
• Customer Inquiries Responses – In 2016, Wastewater was able to respond to all calls involving customer issues within 24 hours. This result reflects efforts to mitigate odor issues at the plant site, including close monitoring of scrubbers operation, promptly closing external doors to limit fugitive emissions, and regular communication to staff on odor issues and controls.

Water and Wastewater Treatment PBR 2012-2016 EPCOR Water Services Inc.
May 1, 2017 42
Environmental Index 4.4.4
The Environmental Index measures Wastewater’s activities for limiting its impact on the environment. In addition, the Environmental Index contributes to the City’s measure of progress towards its ten-year strategic goal to “Preserve and Sustain Edmonton’s Environment”. In 2016, Wastewater met or exceeded the standards for each of the performance measures making up this index.
Table 4.4.4 Environmental Index
Performance Measure PBR Measure
Standard
Actual Score
Actual Outcome
Available Points
Emergency Response Training
The number of Emergency Response Training exercises with an environmental component conducted in each calendar year
1 2 Exceeded Standard
6.66 plus 2.0 Bonus
Points)
8.66
Completeness and Timeliness of Reporting
Achievement in meeting report submission deadlines and complete report submissions
100% 100% Met Standard
6.67 6.67
Environment Incident Management
The number of reportable and preventable environmental incidents
18 4 Exceeded Standard
6.67 6.67
Index Standard Points 20.00 Available Bonus Points 2.00
Maximum Available Points 22.00 Total Actual Points 22.00
Total Points Earned 22.00 2016 Highlights
• Environment Incident Management - The odour issues and associated complaints that appeared in late 2015 subsided in 2016. Significant progress was made on the development of odour identification and steps to mitigate re-occurrence.
Safety Index 4.4.5
The Safety Index measures Wastewater’s progress towards achieving a zero injury culture and encouraging staff awareness and engagement in safety activities. The Safety Index includes both activity-based performance measures (safety meetings, safe work plans, first aid training, inspections and observations) and outcome-based performance measures (lost time frequency, injury frequency and injury severity). In 2016, Wastewater met or exceeded all standards in this index.

EPCOR Water Services Inc. Water and Wastewater Treatment PBR 2012-2016
43 May 1, 2017
Table 4.4.5 Safety Index
Performance Measure PBR Measure
Standard
Actual Score
Actual Outcome
Available Points
Actual Points
Safety Meetings Number of safety meetings conducted during the year 12 12 Met
Standard 2.0 2.0
Formal Safe Work Plans (SWP)
Number of Formal Safe Work Plans each calendar year to identify, control and communicate hazards
1,100 9,665 Exceeded Standard 5.0 5.0
First Aid Certified
Percentage of permanent employees at year-end who hold a valid Standard First Aid Certificate
33.0% 79.1% Exceeded Standard 4.0 4.0
Work Site Inspections / Observations
Number of Work Site Inspections / Observations each calendar year to find problems and assess accidents before other losses occur
270 1,121 Exceeded Standard 4.0 4.0
Lost Time Frequency Rate
A measure of the effectiveness of a safety program – the frequency of injury rate per unit of exposure
0.81 0.00 Exceeded Standard
1.0 plus 0.6 Bonus
Points 1.6
All Injury Frequency Rate
A measure of the frequency of disabling injuries and medical aid injuries per unit of exposure
2.42 0.71 Exceeded Standard
2.0 plus 1.2 Bonus
Points 3.2
Injury Severity Rate
A measure of the seriousness of injuries and illnesses – ratio number of disability days to the number of employee exposure hours in a calendar year
8.88 0.00 Exceeded Standard
2.0 plus 1.2 Bonus
Points 3.2
Index Standard Points 20.0 Available Bonus Points 3.0
Maximum Available Points 23.0 Total Actual Points 23.0
Total Points Earned 23.0 2016 Highlights
As noted in section 3.4.5, Safety is a core value at EPCOR. Wastewater’s performance on this index reflects its on-going focus on health and safety. EWSI continues to work towards eliminating work place injuries and ensuring a safe work environment.

Water and Wastewater Treatment PBR 2012-2016 EPCOR Water Services Inc.
May 1, 2017 44
5 Future Plans and Challenges
PBR 2017-2021 5.1On October 25, 2016, following its review of EWSI’s Rate Application for Water Services and Wastewater Treatment Services, Edmonton City Council enacted Bylaw 17698, the new EPCOR Water Services and Wastewater Treatment Bylaw, renewing Performance Based Regulation for In-City Water and Wastewater Treatment services for the period of April 1, 2017 to March 31, 2022. Highlights of EWSI’s Rate Application include:
Financial Performance 5.1.1
• Reduced target ROE. EWSI’s target Return on Equity has been reduced from 10.875% in the 2012-2016 PBR term, to 10.175% in the 2017-2021 PBR term.
• Updated depreciation studies. The 2017-2021 PBR revenue requirements incorporate depreciation rates based on updated depreciation studies. The deprecation studies have resulted in reductions in asset lives, especially at the Gold Bar wastewater treatment plant.
• Enhanced capital project justification. EWSI has forecast substantial increases in capital spending over the 2017-2021 PBR term, especially at the Gold Bar wastewater treatment plant, to manage growth and maintain system reliability. EWSI has provided the City Utility Committee with comprehensive business cases for all capital projects greater than $5.0 million and has committed to enhancing capital reporting over the 2017-2021 PBR term to improve transparency and accountability, and provide the Utility Committee with a sound basis for assessing EWSI’s capital expenditures programs.
• Updated consumption forecast model. Over the past two PBR terms, EWSI has experienced higher than forecast declines in consumption per customer. To better manage declining consumption, EWSI developed a new forecasting model for its 2017-2021 PBR Application, stratifying its residential customer class by consumption behaviours and utilizing time series analysis and projections to forecast consumption.
• Updated Water Cost of Service Model (“COSM”). The new COSM developed jointly by EWSI, the City of Edmonton and the Regional Water Customers Group provides EWSI with an agreed-on basis for allocating costs to customer segments and customer classes. EWSI used this model to identify rate rebalancing requirements over the 2017-2021 PBR term. Accordingly, the special rate adjustments for rebasing for In-City Water for 2017-2021 includes a rate rebalancing adjustment to better align revenues with costs of service. This adjustment results in a shift in revenues from the Residential and Multi-Residential customer classes to the Commercial customer class over the 2017-2021 PBR term.
Operational Performance 5.1.2
Operational performance measures for the 2017-2021 PBR term have been updated to:
EPCOR Water Services Inc. Water and Wastewater Treatment PBR 2012-2016
45 May 1, 2017
• Align metrics with the City of Edmonton’s The Way We Green/Grow strategies, including the introduction of energy efficiency, solids residual, biogas utilization and other environmentally-focused metrics;
• Revise scoring, so that below-standard performance for Water Quality and Wastewater Quality cannot be offset with bonus points earned on other measures;
• Eliminate metrics within EPCOR’s control (e.g. safety meetings); and • Update targets to 10 year historic average (with a few exceptions).
Environmental Initiatives 5.1.3
The 2017-2021 PBR includes two significant environmental initiatives for In-City Water:
• River Monitoring Program. This program includes extensive monitoring and sampling to determine upstream and downstream changes in water quality. This program is forecast to have annual costs of $1.0 million starting in 2018.
• Green Power. EWSI intends to replace approximately 10% of Water Services conventional electrical power with green power starting in 2018, at a cost of $1.9 million annually starting in 2018. In the 2017-2021 PBR forecast, green power costs have been modelled as purchased power, but EWSI is currently assessing the feasibility of generating its own green power through the construction of a solar power plant. This change will be presented to Utility Committee for approval prior to proceeding.
In addition to these two projects, EWSI is also investigating the viability of developing a co-generation facility, using biogas to generate electricity at its Gold Bar Wastewater treatment plant. This project is still at a proof-of-concept stage, pending the measurement of available biogas.
Provincial and Federal Government Initiatives 5.2
Water 5.2.1
Health Canada continuously reviews and updates the Guidelines for Canadian Drinking Water Quality. EPCOR keeps track of guidelines under review and proposed review. Significant changes to the guidelines are not expected to occur within the immediate future, although some modification regarding lead is under review.
In 2015 Alberta Environment and Parks proposed changes to the Potable Water Regulation under the Environmental Protection and Enhancement Act. New Water Quality and Drinking Water Quality Standards are expected to come into force in 2017.
Wastewater 5.2.2
Under the approval to operate, emerging contaminants such as organic pollutants, pharmaceutical and personal care products, and endocrine disrupting compounds can be regulated. New regulatory requirements for the release of these compounds are not expected to be published in the immediate future.

Water and Wastewater Treatment PBR 2012-2016 EPCOR Water Services Inc.
May 1, 2017 46
The City of Edmonton’s Combined Sewer Overflow Control Strategy (CSO Strategy) has been in place for 15 years. The eventual expectation is that 86% of wet weather flows will be treated through the treatment plant, decreasing the volume of untreated runoff and sewage entering the North Saskatchewan River. Environment Canada has its own wastewater system effluent regulations with respect to untreated runoff and sewage. New federal regulations that would create a conflict with the CSO Strategy are not expected to occur within the immediate future.
Transfer of Drainage Services to EPCOR 5.3On April 12, 2017, City Council approved the transfer of Drainage Services assets to EPCOR. EPCOR is currently developing integration plans and has committed to cap drainage rate increases at 3% for each of the next five years. As a result of the Drainage Services transfer, EPCOR expects that corporate shared service allocation to Water Services and Wastewater Treatment Services will be reduced by approximately $3.6 million annually. EPCOR has committed to flow these reductions through to In-City water and Wastewater customers through a negative non-routine adjustment.

EPCOR Water Services Inc. Water and Wastewater Treatment PBR 2012-2016
47 May 1, 2017
Appendix A: Historical Consumption
Appendix A-1: Historical Consumption - In-City Water A B C D E
Consumption and Customer Counts - Water 2012 2013 2014 2015 2016
1 Annual Consumption by Customer Class (ML) 2 Residential 43,317 43,622 44,876 46,920 45,421 3 Multi-Residential 16,900 17,162 17,696 18,071 17,987 4 Commercial 28,768 28,662 28,572 29,017 28,131 5 Total 88,985 89,446 91,144 94,008 91,539 6 Average Monthly Customer Count 7 Residential 221,444 226,226 232,194 240,522 248,904 8 Multi-Residential 3,407 3,470 3,522 3,573 3,666 9 Commercial 17,597 17,917 18,014 18,279 18,692
10 Total 242,448 247,613 253,730 262,374 271,262 11 Average Monthly Consumption per Customer (m3) 12 Residential 16.3 16.1 16.1 16.3 15.2 13 Multi-Residential 413.4 412.2 418.7 421.5 408.9 14 Commercial 136.2 133.3 132.2 132.3 125.4
Appendix A-2: Historical Consumption - Wastewater A B C D E
Consumption and Customer Counts - Wastewater 2012 2013 2014 2015 2016 1 Annual Consumption by Customer Class (ML) 2 Residential 41,346 41,924 42,773 43,738 43,470 3 Multi-Residential 16,936 17,107 17,704 18,066 17,993 4 Commercial 25,378 25,331 25,126 24,933 24,375 5 Total 83,660 84,362 85,603 86,737 85,837 6 Average Monthly Customer Count 7 Residential 221,170 226,118 232,086 240,412 248,805 8 Multi-Residential 3,406 3,470 3,522 3,573 3,666 9 Commercial 15,231 15,488 15,573 15,762 16,097
10 Total 239,807 245,076 251,181 259,747 268,568 11 Average Monthly Consumption per Customer (m3) 12 Residential 15.6 15.5 15.4 15.2 14.6 13 Multi-Residential 414.4 410.8 418.9 421.3 409.0 14 Commercial 138.8 136.3 134.5 131.8 126.2

Water and Wastewater Treatment PBR 2012-2016 EPCOR Water Services Inc.
May 1, 2017 48
Appendix B: Historical Summary of Financial Performance
Appendix B-1: Financial Performance – In-City Water
B-1-1: Net Income and Return on Equity - In-City Water
A B C D E Net Income and Return on Equity – Water ($million) 2012 2013 2014 2015 2016 1 Net income 2 Revenue 150.4 161.6 172.8 183.5 180.0 3 Operating Costs (91.1) (87.5) (90.4) (91.8) (94.8) 4 Depreciation (17.6) (19.1) (20.1) (21.2) (21.6) 5 Interest Expense (21.0) (21.6) (22.3) (23.2) (25.7) 6 Net Income 20.7 33.4 40.0 47.3 37.9 7 Rate Base and Return on Equity 8 Mid-Year Rate Base 836.6 894.5 957.6 1,032.2 1,103.5 9 In-City Share of Mid-Year Rate Base 79.3% 78.7% 78.4% 78.5% 78.4%
10 Rate Base (In-City) 663.0 703.8 751.1 810.5 865.6 11 Equity Ratio 40.35% 39.57% 40.30% 40.66% 40.52% 12 In-City Rate Base financed by Equity 267.6 278.5 302.7 329.6 350.8 13 Return on Equity - % 7.8% 12.0% 13.2% 14.4% 10.8%
14 Capital Expenditures 83.9 86.0 99.3 99.0 81.7
B-1-2: Revenue - In-City Water 5.3.1
A B C D E Revenue - In-City Water ($ million) 2012 2013 2014 2015 2016
1 Consumption Revenue 2 Residential 73.9 79.2 85.4 91.6 88.6 3 Multi-Residential 22.4 24.3 26.1 27.5 27.6 4 Commercial 29.3 31.2 32.6 34.1 33.2 5 Total Consumption Revenue 125.6 134.7 144.1 153.2 149.3 6 Fixed Charge Revenue 7 Residential 17.7 19.1 20.1 21.1 22.0 8 Multi-Residential 0.8 0.9 0.9 0.9 1.0 9 Commercial 2.6 2.8 2.9 3.0 3.1
10 Total Fixed Charge Revenue 21.1 22.8 23.9 25.0 26.1 11 Total Consumption and Fixed Charge Revenue 146.7 157.5 168.0 178.2 175.5 12 Other revenue 3.7 4.2 4.8 5.3 4.5 13 Total Revenue 150.4 161.7 172.8 183.5 88.6

EPCOR Water Services Inc. Water and Wastewater Treatment PBR 2012-2016
49 May 1, 2017
B-1-3: Operating Costs - In-City Water
A B C D E Operating Costs ($ millions) 2012 2013 2014 2015 2016
1 Operating Costs by Cost Category 2 Salaries and benefits 45.1 42.9 40.1 41.3 43.1 3 Corporate administration 20.3 14.0 13.1 13.6 14.0 4 EWSI Shared Services - 2.7 9.5 9.4 9.8 5 Customer billing 9.1 8.8 8.8 8.6 8.7 6 Power 7.7 7.2 8.2 9.8 10.4 7 Chemicals 4.6 5.6 5.6 5.3 7.6 8 Contractors 5.8 6.1 6.1 6.4 6.0 9 Materials and supplies 3.0 2.7 3.0 3.2 3.3
10 Vehicles 1.8 1.9 2.2 2.4 2.2 11 Other 0.2 1.3 (0.7) (3.0) (2.9) 12 Franchise fees 11.6 12.4 13.3 14.1 13.9 13 Total Operating Costs by Cost Category 109.2 105.6 109.2 111.1 116.0 14 Operating Costs by Operational Function 15 Water Treatment Plants 28.5 29.8 30.8 31.4 36.2 16 Distribution and Transmission 21.7 22.0 23.9 24.3 24.4 17 Quality Assurance and Environment 4.5 4.7 4.5 5.0 5.3 18 Operations Support Services 8.0 7.1 4.7 5.3 5.6 19 Administrative Services 5.4 3.7 0.6 (0.6) (1.9) 20 EWSI Shared Services - 2.7 9.5 9.4 9.8 21 Customer Billing 9.1 8.8 8.8 8.6 8.7 22 Corporate Administration Costs 20.4 14.4 13.1 13.6 14.0 23 Franchise Fees 11.6 12.4 13.3 14.1 13.9 24 Total Operating Costs by Operational Function 109.2 105.6 109.2 111.1 116.0
25 In-City Water Share of Operating Costs - % 83.5% 82.8% 82.8% 82.6% 81.7% 26 In-City Water Share of Operating Costs - $ 91.1 87.5 90.4 91.8 94.8

Water and Wastewater Treatment PBR 2012-2016 EPCOR Water Services Inc.
May 1, 2017 50
Appendix B-2: Financial Performance - Wastewater
B-2-1: Net Income and Return on Equity - Wastewater
A B C D Net Income and Return on Equity – Wastewater ($ millions) 2012 2013 2014 2015 2016
1 Net income 2 Revenue 61.1 66.5 72.5 80.1 83.7 3 Operating Costs (40.2) (40.2) (44.4) (47.1) (47.0) 4 Depreciation (9.2) (8.7) (9.4) (10.5) (13.1) 5 Interest Expense (7.4) (7.1) (7.0) (7.0) (8.1) 6 Net Income 4.3 10.5 11.7 15.5 15.6 7 Rate Base and Return on Equity 11.37% 8 Mid-Year Rate Base 263.2 266.3 276.6 306.9 346.6 9 Equity Ratio 40.46% 40.50% 39.70% 38.81% 39.53%
10 Mid-Year Rate Base financed by Equity 106.5 107.9 109.8 119.3 137.0 11 Return on Equity - % 4.07% 9.74% 10.65% 13.03% 11.37%
12 Capital Expenditures 11.8 25.1 37.9 46.4 47.8
B-2-2: Revenue - Wastewater
A B C D Revenue – Wastewater ($ millions) 2012 2013 2014 2015 2016
1 Consumption Revenue 2 Residential 24.0 26.3 29.0 31.9 33.3 3 Multi-Residential 9.8 10.7 12.0 13.1 13.8 4 Commercial 13.8 15.1 16.2 17.3 17.8 5 Total Consumption Revenue 47.6 52.1 57.2 62.3 65.0 6 Fixed Charge Revenue 7 Residential 8.1 9.1 10.0 11.1 12.3 8 Multi-Residential 0.1 0.1 0.2 0.2 0.2 9 Commercial 0.6 0.6 0.7 0.7 0.8
10 Total Fixed Charge Revenue 8.8 9.8 10.9 12.0 13.3 11 Total Consumption and Fixed Charge Revenue 56.4 61.9 68.1 74.3 78.3 12 Other revenue 4.7 4.6 4.5 5.8 5.4 13 Total Revenue 61.1 66.5 72.6 80.1 83.7

EPCOR Water Services Inc. Water and Wastewater Treatment PBR 2012-2016
51 May 1, 2017
B-2-3: Operating Costs - Wastewater
A B C D E Operating Costs – Wastewater ($ million) 2012 2013 2014 2015 2016
1 Operating Costs by Cost Category 2 Salaries and Benefits 15.1 15.6 17.7 17.7 18.3 3 Corporate Service Charges 4.4 3.6 4.0 4.3 4.5 4 Customer Billing 4.5 4.5 4.5 5.0 5.1 5 Power Costs and Other Utilities 4.8 4.8 4.6 4.9 4.5 6 Contractors and Consultants 3.7 3.7 4.2 6.4 4.5 7 Materials and Supplies (including chemicals) 2.3 2.5 2.5 2.6 2.9 8 Other 1.0 0.7 1.7 0.3 1.3 9 Franchise Fees 4.4 4.8 5.3 5.9 6.1
10 Total Wastewater Operating Costs 40.2 40.2 44.5 47.1 47.0 11 Operating Costs by Operational Function 12 Wastewater Treatment Plants 17.6 18.6 19.0 20.5 20.5 13 Quality Assurance and Environment 2.5 2.7 3.1 3.1 3.1 14 Operations Support Services 3.2 2.8 3.9 4.1 3.8 15 Administration Services 3.6 3.1 4.7 4.2 3.8 16 Customer Billing 4.5 4.5 4.5 5.0 5.1 17 Franchise Fees 4.4 3.6 4.0 5.9 4.5 18 Corporate Service Charges 4.4 4.8 5.3 4.3 6.1 19 Total Wastewater Operating Costs 40.2 40.2 44.5 47.1 47.0
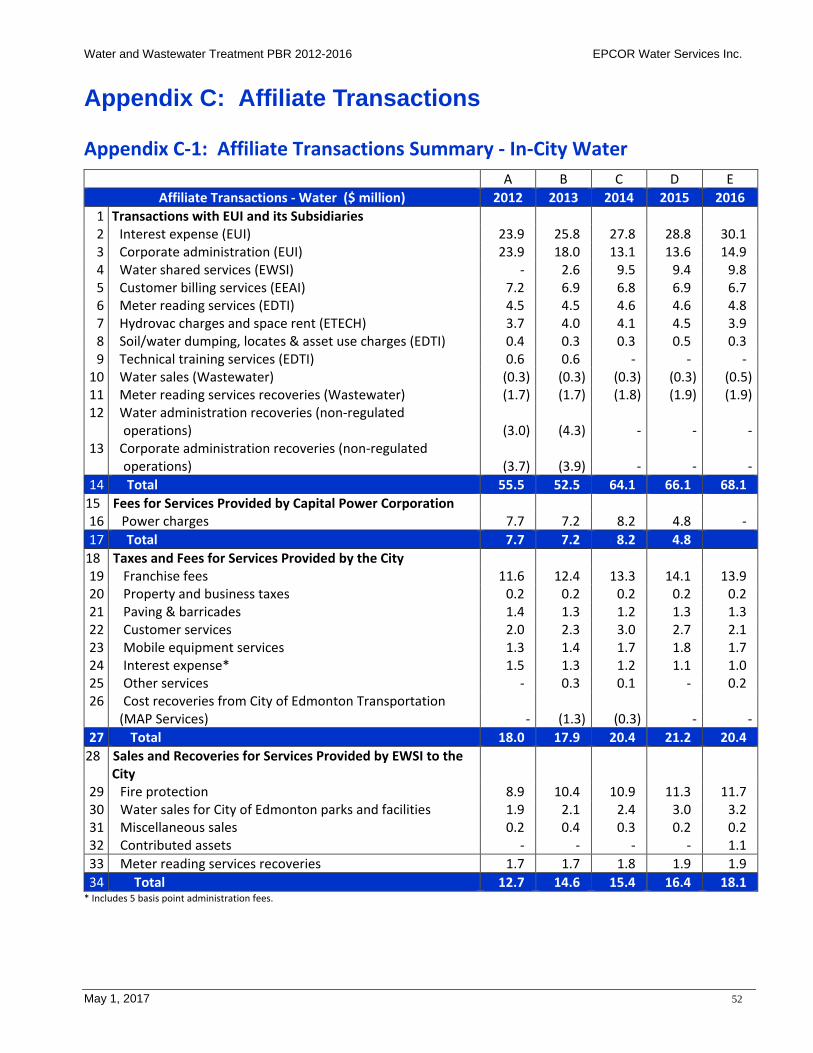
Water and Wastewater Treatment PBR 2012-2016 EPCOR Water Services Inc.
May 1, 2017 52
Appendix C: Affiliate Transactions
Appendix C-1: Affiliate Transactions Summary - In-City Water A B C D E
Affiliate Transactions - Water ($ million) 2012 2013 2014 2015 2016 1 Transactions with EUI and its Subsidiaries
2 Interest expense (EUI) 23.9 25.8 27.8 28.8 30.1 3 Corporate administration (EUI) 23.9 18.0 13.1 13.6 14.9 4 Water shared services (EWSI) - 2.6 9.5 9.4 9.8 5 Customer billing services (EEAI) 7.2 6.9 6.8 6.9 6.7 6 Meter reading services (EDTI) 4.5 4.5 4.6 4.6 4.8 7 Hydrovac charges and space rent (ETECH) 3.7 4.0 4.1 4.5 3.9 8 Soil/water dumping, locates & asset use charges (EDTI) 0.4 0.3 0.3 0.5 0.3 9 Technical training services (EDTI) 0.6 0.6 - - -
10 Water sales (Wastewater) (0.3) (0.3) (0.3) (0.3) (0.5) 11 Meter reading services recoveries (Wastewater) (1.7) (1.7) (1.8) (1.9) (1.9) 12 Water administration recoveries (non-regulated
operations) (3.0) (4.3) - - - 13 Corporate administration recoveries (non-regulated
operations) (3.7) (3.9) - - - 14 Total 55.5 52.5 64.1 66.1 68.1
15 Fees for Services Provided by Capital Power Corporation 16 Power charges 7.7 7.2 8.2 4.8 - 17 Total 7.7 7.2 8.2 4.8
18 Taxes and Fees for Services Provided by the City 19 Franchise fees 11.6 12.4 13.3 14.1 13.9 20 Property and business taxes 0.2 0.2 0.2 0.2 0.2 21 Paving & barricades 1.4 1.3 1.2 1.3 1.3 22 Customer services 2.0 2.3 3.0 2.7 2.1 23 Mobile equipment services 1.3 1.4 1.7 1.8 1.7 24 Interest expense* 1.5 1.3 1.2 1.1 1.0 25 Other services - 0.3 0.1 - 0.2 26 Cost recoveries from City of Edmonton Transportation
(MAP Services) - (1.3) (0.3) - - 27 Total 18.0 17.9 20.4 21.2 20.4
28 Sales and Recoveries for Services Provided by EWSI to the City
29 Fire protection 8.9 10.4 10.9 11.3 11.7 30 Water sales for City of Edmonton parks and facilities 1.9 2.1 2.4 3.0 3.2 31 Miscellaneous sales 0.2 0.4 0.3 0.2 0.2 32 Contributed assets - - - - 1.1 33 Meter reading services recoveries 1.7 1.7 1.8 1.9 1.9 34 Total 12.7 14.6 15.4 16.4 18.1
* Includes 5 basis point administration fees.

EPCOR Water Services Inc. Water and Wastewater Treatment PBR 2012-2016
53 May 1, 2017
Appendix C-2: Affiliate Transactions Summary - Wastewater A B C D E Affiliate Transactions – Wastewater ($ million) 2012 2013 2014 2015 2016 1 Transactions with EUI and its Subsidiaries 2 Corporate administration (EUI) 4.4 3.6 4.0 4.3 4.5 3 Customer billing (EEAI) 2.6 2.5 2.5 2.8 2.8 4 Interest expense (EUI) 1.4 2.0 3.6 4.3 4.9 5 Meter reading services (Water) 1.7 1.7 1.8 1.9 1.9 6 Water purchases (Water) 0.3 0.3 0.3 0.3 0.4 7 Administrative services (Water) 0.7 1.4 2.6 2.7 2.9 8 Other 0.1 0.2 0.1 0.1 - 9 Total 11.2 11.7 14.9 16.4 17.3
10 Fees for Services Provided by Capital Power Corporation
11 Power charges - 1.0 4.0 2.6 - 12 Total - 1.0 4.0 2.6 -
13 Taxes and Fees for Services Provided by the City of Edmonton
14 Franchise fees 4.4 4.8 5.3 5.9 6.1 15 Property and business taxes 0.5 0.4 0.5 0.5 0.5 16 Power charges (recoveries for Drainage Services) 4.1 3.2 - - 0.0 17 Regulatory chargebacks from Drainage Services 0.9 0.9 0.9 0.9 0.8 18 Other 0.2 0.2 0.1 0.2 0.1 19 Interest expense* 4.9 4.6 4.3 4.0 3.7 20 Total 15.0 14.1 11.1 11.5 11.2 21 Sales and Recoveries for Services Provided by
EWSI to the City of Edmonton 22 Wastewater sales 0.5 0.7 0.8 1.0 1.1 23 Miscellaneous sales 0.2 0.2 0.2 0.2 0.3 24 Miscellaneous cost recoveries 0.2 0.1 0.1 1.0 0.0 25 Total 0.9 1.0 1.1 2.2 1.4
* Includes 5 basis point administration fee.

Water and Wastewater Treatment PBR 2012-2016 EPCOR Water Services Inc.
May 1, 2017 54
Appendix D: Water and Wastewater Treatment Rates
Appendix D-1: Water Rates
D-1-1: Consumption Rates - Water
A B C D E
Consumption Block 2012 ($/m3)
2013 ($/m3)
2014 ($/m3)
2015 ($/m3)
2016 ($/m3)
1 Residential 2 0.0 m3 to 10.0 m3 1.6435 1.7469 1.7990 1.8472 1.8983 3 10.1 m3 to 35.0 m3 1.7955 1.9084 1.9653 2.0179 2.0737 4 Over 35.0 m3 2.2691 2.4117 2.4837 2.5502 2.6208 5 Multi-Residential 6 0.0 m3 to 100.0 m3 1.5948 1.6951 1.7457 1.7925 1.8421 7 100.1 m3 to 1,000.0 m3 1.3343 1.4182 1.4605 1.4996 1.5410 8 Over 1,000.0 m3 1.1025 1.1718 1.2067 1.2390 1.2733 9 Commercial
10 0.0 m3 to 25.0 m3 1.2508 1.3296 1.3693 1.4060 1.4449 11 25.1 m3 to 100.0 m3 1.2508 1.3296 1.3693 1.4060 1.4449 12 100.1 m3 to 1,000.0 m3 1.1537 1.2263 1.2629 1.2967 1.3326 13 1,000.1 m3 to 5,000.0 m3 0.9131 0.9706 0.9995 1.0263 1.0547 14 Over 5,000.0 m3 0.7351 0.7813 0.8046 0.8261 0.8489
D-1-2: Fixed Monthly Service Charges - Water
A B C D E Meter Size 2012
($) 2013 ($)
2014 ($)
2015 ($)
2016 ($)
1 15 mm 6.55 6.90 7.03 7.15 7.28 2 20 mm 8.99 9.46 9.64 9.81 9.99 3 25 mm 12.74 13.41 13.67 13.91 14.17 4 40 mm 22.26 23.43 23.88 24.29 24.74 5 50 mm 29.66 31.22 31.83 32.38 32.98 6 75 mm 58.88 61.98 63.18 64.27 65.46 7 100 mm 107.57 113.23 115.43 117.42 119.60 8 150 mm 201.32 211.93 216.04 219.77 223.85 9 200 mm 319.83 336.68 343.21 349.14 355.62
10 250 mm 747.41 786.79 802.04 815.89 831.04 11 300 mm 747.41 786.79 802.04 815.89 831.04 12 400 mm 893.52 940.61 958.84 975.40 - 13 500 mm 962.18 1,012.88 1,032.52 1,050.36 -

EPCOR Water Services Inc. Water and Wastewater Treatment PBR 2012-2016
55 May 1, 2017
Appendix D-2: Wastewater Treatment Rates
D-2-1 Consumption and Fixed Monthly Service Charges - Wastewater
A B C D E Consumption and
Fixed Monthly Service Charges 2012 ($)
2013 ($)
2014 ($)
2015 ($)
2016 ($)
1 Consumption Charge per m3 2 Residential 3 All consumption 0.5955 0.6361 0.6855 0.7374 0.7944 4 Commercial 5 0.0 m3 to 10,000.0 m3 0.5955 0.6361 0.6855 0.7374 0.7944 6 10,000.1 m3 to 100,000.0 m3 0.4607 0.4921 0.5303 0.5705 0.6146 7 Over 100,000.0 m3 0.2403 0.2567 0.2767 0.2977 0.3207 8 Fixed Monthly Service Charge per Meter 9 All Customers 3.12 3.33 3.58 3.85 4.15
D-2-2: Overstrength and Additional Overstrength Surcharges
A B C D E
Surchargeable Matter 2012 ($/kg)
2013 ($/kg)
2014 ($/kg)
2015 ($/kg)
2016 ($/kg)
1 Overstrength Surcharges 2 Biochemical Oxygen Demand (BOD) > 300 mg/L 0.3730 0.3984 0.4294 0.4619 0.4977 3 Chemical Oxygen Demand (COD) > 600 mg/L * 0.3730 0.3984 0.4294 0.4619 0.4977 4 Oil and grease > 100 mg/L 0.3262 0.3484 0.3755 0.4040 0.4352 5 Phosphorous > 10 mg/L 3.1038 3.3152 3.5731 3.8439 4.1412 6 Suspended solids > 300 mg/L 0.3386 0.3617 0.3898 0.4193 0.4517 7 Total Kjeldahl nitrogen (TKN) > 50 mg/L 0.7922 0.8461 0.9119 0.9811 1.0570
8 Additional Overstrength Surcharges 9 Biochemical Oxygen Demand (BOD) > 3,000 mg/L 0.3730 0.3984 0.4294 0.4619 0.4977
10 Chemical Oxygen Demand (COD) > 6,000 mg/L * 0.3730 0.3984 0.4294 0.4619 0.4977 11 Oil and grease > 400 mg/L 0.3262 0.3484 0.3755 0.4040 0.4352 12 Phosphorous > 75 mg/L 3.1038 3.3152 3.5731 3.8439 4.1412 13 Suspended solids > 3,000 mg/L 0.3386 0.3617 0.3898 0.4193 0.4517 14 Total Kjeldahl nitrogen (TKN) > 200 mg/L 0.7922 0.8461 0.9119 0.9811 1.0570

Water and Wastewater Treatment PBR 2012-2016 EPCOR Water Services Inc.
May 1, 2017 56
Appendix E: Operating Performance Measures
Appendix E-1: Water System Service Quality Measures A B C D E F
Index and Performance Measures Standard 2012 2013 2014 2015 2016
1 System Reliability Index 25.0 28.5 28.5 28.5 28.5 28.5 2 Water Main Break (WMB) Factor 574 370 278 392 277 242 3 WMB Repair Duration Factor 93.7% 94.6% 94.9% 91.2% 97.4% 93.3% 4 Planned Interruption Factor 95.0% 95.6% 95.6% 96.4% 95.4% 97.0% 5 Water Pressure Factor 5 1 0 1 1 0 6 Water Loss Factor 3.0 1.46 1.29 1.27 1.46 1.18
7 Water Quality Index 25.0 25.1 25.1 25.1 25.1 25.0 8 Water Quality Index 99.6% 99.8% 99.8% 99.8% 99.8% 99.7%
9 Customer Service Index 20.0 22.5 22.8 21.2 21.3 22.7
10 Post Service Audit Factor 74.0% 72.3% 77.8% 73.6% 77.4% 77.8% 11 Response Time Factor 25 16 16 21 21 16.6 12 Home Sniffing Factor 93.8% 97.0% 94.8% 95.7% 93.9% 96.2% 13 Environmental Index 15.0 16.2 15.8 16.5 14.6 15.8 14 Emergency Response Training 4 5 4 5 4 4 15 Completeness & Timeliness of Reporting 100% 92.1% 100.0% 100.0% 100.0% 100.0% 16 Environment Incident Management 7 5 4 5 10 4 17 Water Conservation Factor 19.0 18.2 17.8 17.5 17.3 16.9 18 Watershed Program Activity 5 7 7 7 7 7 19 Safety Index 15.0 14.1 14.6 16.0 16.5 16.5 20 Safety Meetings 36 36 36 42 36 36 21 Formal Safe Work Plans 3,100 12,863 12,417 14,059 15,741 18,234 22 First Aid Training 33.0% 66.6% 55.5% 55.3% 61.5% 60.2% 23 Work Site Inspections / Observations 800 1,127 998 1,297 1,347 1.186 24 Lost Time Frequency Rate 0.59 0.96 0.46 0.67 0.00 0.22 25 All Injury Frequency Rate 2.40 1.68 0.46 1.57 1.56 0.65 26 Injury Severity Rate 8.92 40.80 41.76 5.17 0.00 5.61 27 Aggregate Points Earned 100.0 106.4 106.8 107.3 106.0 108.5 28 Points Above / (Below) Standard 6.4 6.8 7.3 6.0 8.5

EPCOR Water Services Inc. Water and Wastewater Treatment PBR 2012-2016
57 May 1, 2017
Appendix E-2: Wastewater Treatment Service Quality Measures 15.5 A B C D E F Index and Performance Measures Standard 2012 2013 2014 2015 2016
1 System Reliability Index 15.0 16.0 16.0 16.0 16.0 16.0 2 Enhanced Primary Treatment 75.0% 91.8% 89.2% 84.3% 89.0% 100.0%
3 Wastewater Quality Index 40.0 44.0 44.0 44.0 44.0 44.0 4 Wastewater Effluent Limit Performance
Index (“WELPI”) 46.0% 20.7% 20.7% 22.9% 23.0% 17.5%
5 Customer Service Index 5.0 5.0 5.0 5.0 5.0 5.0 6 Customer Inquiries Response 90.0% 96.4% 96.3% 92.3% 100% 100.0%
7 Environmental Index 20.0 21.3 19.3 22.0 22.0 22.0 8 Emergency Response Training 1 2 1 2 2 2 9 Completeness & Timeliness of Reporting 100% 88.9% 88.9% 100% 100% 100%
10 Environment Incident Management 18 7 8 6 4 4
11 Safety Index 20.0 23.0 23.0 23.0 23.0 23.0 12 Safety Meetings 12 12 12 12 12 12 13 Formal Safe Work Plans 1,100 7,283 8,283 8,758 9,665 11,599 14 First Aid Certified 33.0% 59.4% 71.5% 72.7% 79.1% 80.8% 15 Work Site Inspections / Observations 270 960 685 908 1,121 888 16 Lost Time Frequency Rate 0.81 0.00 0.00 0.00 0.00 0.00 17 All Injury Frequency Rate 2.42 0.94 0.00 0.00 0.71 0.67 18 Injury Severity Rate 8.88 0.00 0.00 0.00 0.00 0.00 19 Aggregate Points Earned 100.0 109.3 107.3 110.0 110.0 110.0
20 Points Above / (Below) Standard 9.3 7.3 10.0 10.0 10.0