Embed Size (px)
Citation preview

~~~ Noble Transcription Services - 714.335.1645 ~~~
MicroStrategy Training for DRGR System Users
September 22, 2016
Tyler Bridges: Welcome to the MicroStrategy Training for Disaster Recovery Grant Reporting
System Users. We're going to go ahead and get started. Thank you all for attending. We hope
that this is going to be beneficial and informational and useful to you. My name is Tyler Bridges.
I'm with U.S. Department of Housing and Urban Development here in Washington, D.C. I'm in
the disaster recovery and special issues division or the system administrator of the DRGR
system. And you can see DRGR popping up right now, actually. I've been working with DRGR
and MicroStrategy for about seven years now. I joined HUD two years ago and I think that's
about it on me.
We have three supports with us today as well; Chantel Key who you'll hear from in a second,
ICF is hosting this for us and then Amy Murray and Erinn Martin here at HUD. Amy's with ICF,
will be helping with questions. So our objective today is basically learn how to fully utilize
MicroStrategy. We're just going to go over some basic functions to help improve that accuracy
and completeness, troubleshoot errors and reduce the amount of time and effort necessary to
comply with reporting requirements. So this webinar will include a live demonstration of
MicroStrategy and these key concepts.
Also, we'll highlight popular reports and just general tips and lessons learned. This training will
not be covering policy and programmatic related issues. So it will be a technical demonstration
only on how to use this reporting system. And if you have questions about policy or
programmatic or anything specific to your situation, you can always contact your CPD
representative or the DRGR Ask A Question, which we'll go over.
Okay. I'm going to turn it over to – oh, and I should say this is also being recorded. It'll be posted
on the web. So you can view these again or share with your colleagues. And now I'll turn it over
to Chantel.
Chantel Key: Thanks, Tyler. So for today, we will have two polls. On the top-right of your
screen, you will see your participants' chat Q&A button. Right along that row you should also
see a button for polling. Please click on that button and it will pop down a polling box and you
will be able to participate in the two polls that we have today for the webinar. Now, for asking
questions, if you have any content related questions, we ask that you submit them through the
Q&A box. And when submitting them, we ask that you submit them to all panelists. So all of the
panelists will be able to see your questions.
Now, for all audio and visual questions, if you're having any troubles with audio and visual, I ask
that you submit your questions through the chat box and submit them directly to me – directly to
Chantel Key. So again, if you are having any content – if you have any content related questions,
please submit them through the Q&A function, which is also found on the top-right corner of
your screen and submit them to all panelists. And for all troubleshooting questions, please submit
through the chat function and send them directly to me, Chantel Key.

MicroStrategy Training for DRGR System Users, 9-22-16
~~~ Noble Transcription Services - 714.335.1645 ~~~ 2
Okay. Now, with that, we're going to move into our first poll, how much experience do you have
with pulling MicroStrategy reports? And the poll is now open and we'll keep it open here for a
few seconds, because some folks are trying to vote. Now, the poll will be closing in about 15
seconds. Now, the results have come in. We have about 47 people that voted less than, 26 people
voted 1 to 2 years and 27 people voted more than 2 years and they are a pro. Right now we're
going to move into our second poll of the webinar, which report category are you most interested
in?
And the polls are now open. And again, they'll stay open for a few seconds to give people time to
vote. And the poll will close in about 15 seconds. The poll is now closed and the results, we have
about 46 people voted financial reports, 28 people are most interested in performance reports and
8 people voted admin user reports. At this time, I'll turn it back to Tyler.
Tyler Bridges: Thanks, Chantel. Okay. So our agenda today, quickly I'll go over what is
MicroStrategy, then we're going to jump into a live demonstration, which will take about an hour
and we're going to cover accessing MicroStrategy and just basic navigation, then we'll look at
some standard report basics, how to customize and save a report, how to export reports and then
finally, subscribing to reports. At the end, we're going to just briefly go into the DRGR public
data portal so you guys can see the information that's available there, we'll cover some resources
and if we have additional time, some final Q&A.
So what is MicroStrategy? MicroStrategy is a powerful analytics platform used to pull an
aggregate data from CPD systems for analysis. So the MicroStrategy is not a place where you
input data, like in DRGR, but it's a place where it will aggregate all of the information that's been
entered into DRGR and kind of spits it out in a usable reported format. So it's used by grantees,
but also by HUD and the HUD OIG. And we send a lot of this data to Congress, to the White
House so that they can see the progress on these CPD-funded programs.
It's also used by multiple HUD systems. So IDIS and DRGR and other systems in CPD use
MicroStrategy. So it's not a build of DRGR, it's a separate program that just pulls the information
from DRGR. It's really a vital and powerful tool to allow users to analyze and troubleshoot data
already entered into DRGR and to determine what's missing, measure progress and monitor for
compliance. I can tell you personally I'm in MicroStrategy every single day for multiple reasons.
It's a really, really excellent tool. It also allows for ad-hoc reporting capabilities to meet data
analysis needs and objectives.
So we, here at the HUD, have the ability to create custom reports based off of thousands of
metrics and attributes that come from DRGR to help us, on the fly, create and pull data as
needed. So now we're going to just get right into the demonstration. Again, we're going to go
through these five sections and all questions will – must be submitted in writing using the Q&A
and each one of these is going to take about 10 minutes and then we'll have a few minutes for
questions. So after we complete each one of these sections, we'll open it up for questions, but
feel free to submit your questions during the presentation.
So here we are, we're in DRGR; right? When you access DRGR and you log in, you enter your
credentials, this is your landing page. And so we all should be familiar with this screen. The way

MicroStrategy Training for DRGR System Users, 9-22-16
~~~ Noble Transcription Services - 714.335.1645 ~~~ 3
to access MicroStrategy is by clicking on this report tab at the top of the DRGR screen. And
you'll see what happens is it's going to launch a new browser or a new window and it's now
separate from DRGR. And so the key thing to remember here is DRGR does have time-out rules
where if you're inactive in DRGR for more than 20 minutes, it'll actually log you out. So when
you're navigating in MicroStrategy, again, because it's a separate piece of software, it's not –
you're not in DRGR.
So if you're in MicroStrategy for 10, 15 minutes, always make sure to go back into DRGR and
click on one of these screens just to refresh it so that your session does not get locked out. So all
I did was, again, click on reports and this screen opened up. Now, when I said earlier that
MicroStrategy is used by multiple CPD systems, if you have access to IDIS or any other system,
then those will show up here. So here I only have access to DRGR. And so I'm going to click on
DRGR and I get basically my home screen.
So on the home screen, you've got four key components and mine does a little bit different.
Everybody has a little bit of a different look based off of their permissions, but the – everything
I'm going to be discussing today should be available to all users. So on your landing page, you've
got four main components here. You've got shared reports, you've got my reports, you've got
your history list and you've got my subscriptions and we're going to go through all four of these
today. On the left, you also have a quick toolbar to access these from any screen.
At the top-left, you have this little circle navigation looking thing, you can click on it and it also,
at any time, will bring you a file menu where you can navigate through MicroStrategy. You can
also always click home, which will bring you back to this landing page. So if we start with
standard reports, standard reports – or excuse me, shared reports. Shared reports is going to be a
folder that contains all of the pre-canned developed reports that HUD has entered into the
MicroStrategy system. So once you click on shared reports, typically you'll see two options,
standard reports and public reports.
Public reports are kind of a relic of before we had the public data portal. And so they're not often
used and we're not going to cover them today, but they're just kind of pre-canned reports, they're
not the typical day-to-day reports that most use. So instead we're going to click on standard
reports; okay? Now, if at any time you want to see where you've been, MicroStrategy does have
this cookie-crumb trail where you can see we clicked on DRGR, then we clicked on shared
reports and now we've clicked on standard reports.
If you're a grantee, you're going to click on grantee user reports. You know, if you're a TA
provider, if you're a field office user, everybody's going to have just one of these folders most
likely associated with what type of user they are. And so if – I'm going to go ahead and just click
on grantee user reports and that brings you to this main screen and this is where all the standard
reports are listed. So again, if I wanted to go back for any reason, I can click on these. You can
also use the back and forward button here and you can also do some fun stuff, like if you want a
list view, then you can have your reports listed down here or you can go back to the default view,
which looks like this.

MicroStrategy Training for DRGR System Users, 9-22-16
~~~ Noble Transcription Services - 714.335.1645 ~~~ 4
And you can actually even go to preferences and change the color and I think font size, things
like that. So when you're in MicroStrategy, never use the back button on your browser itself,
always navigate within the MicroStrategy platform. So that's basically the end of the first little
session. So let's go ahead and pause for questions, if there are any.
Amy Murray: There aren't any questions at this time.
Tyler Bridges: Excellent. Okay. So let's go into standard reports basics. So again, standard
reports are a bunch of canned reports that are already created for you. And to get to your
standard reports, again, from your home screen, you click on shared reports and then standard
reports and then grantee user reports; okay? So you'll have to do that every time and that will
bring you into this main menu where you'll see – I think there's at least 30 reports in here. So
there are three types of reports in MicroStrategy for DRGR. What – and we call them admin
reports, financial reports and performance reports.
So all of your admin reports are going to begin with admin and they're going to cover just
general topics, mainly user accounts, certification status, things of that nature and we'll go
through some popular reports here in just a sec. The second category and the most used quite
often is the financial reports and it gives you a bunch of data, whether it be cumulative data, line
item detail or quarterly data, a bunch of different ways to look at the data. And then the final set
of reports are the performance reports and these are your accomplishments. So your households,
your persons benefitting, your race and ethnicity data.
So all of those performance measures that you're required to enter into DRGR. So some popular
reports, and these are in this PowerPoint presentation, but I just want to highlight a few of them.
You've got admin02b, which it has your activity status with start and end dates. So when you're
going to close out, for example, you can see whether or not your activity is completed or
underway. And then the second one is 03c. So this is your QPR activity progress narrative and
this helps when you're in the system entering all of your QPR data, you can jump into
MicroStrategy and pull this report to see what activity progress narratives you already entered
and what are remaining to be entered.
Another piece of useful information is MicroStrategy updates every night. So it doesn't update
live. So if you are in DRGR and you enter a QPR narrative, for example or anything, you'll have
to wait until the next business day in order to see that information in MicroStrategy. Other
reports, really, really common report is admin report04b. So this is grantee user accounts with
system roles and certification status. This is if you want to know who's the drawdown requester,
who's an approver, who is your administrator, who can submit action plans and QPRs, who
certified you last time, when your certification expires, really a lot of information about your
user accounts.
And this is a really helpful report. And then we have 04f, which is DRGR authorized users by
grant. So if you are a grantee that has multiple grants, then you may have access to one or more
of those grants. So if you want to know who, in your division or department, has access to
particular, different grants, that's just shown here. And the final popular admin report is 05a,
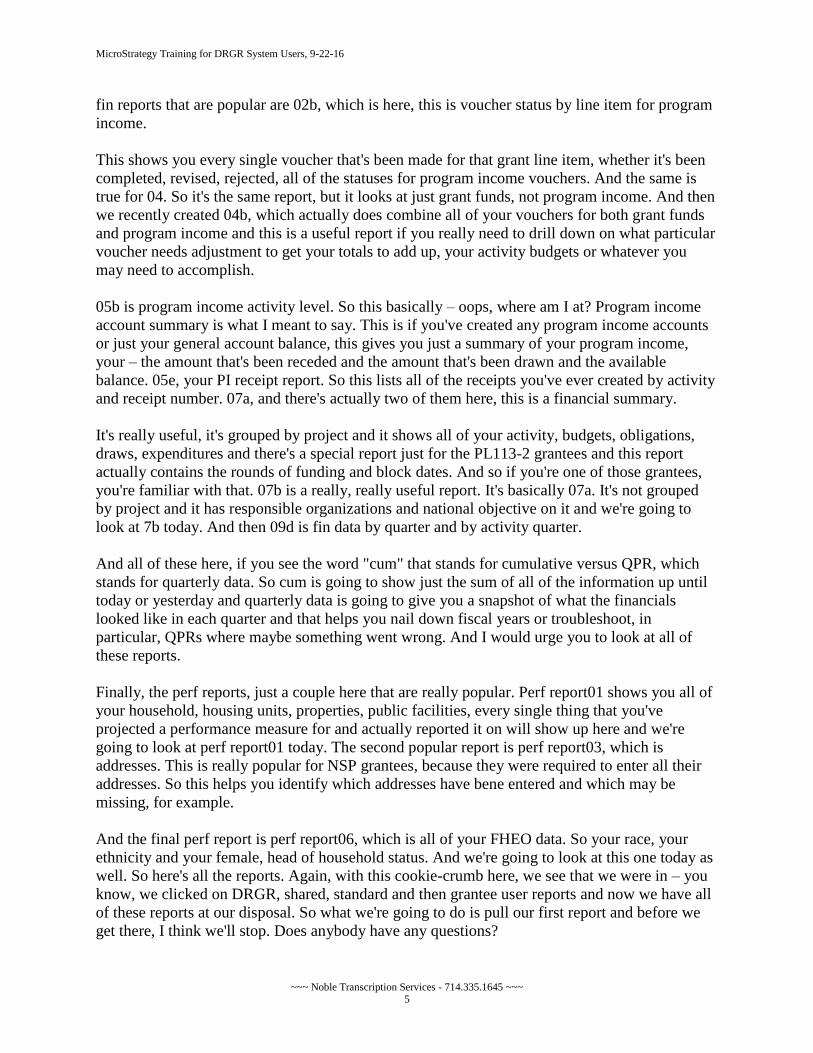
which lists all of the responsible organizations you've ever entered into DRGR. Fin reports, the
MicroStrategy Training for DRGR System Users, 9-22-16
~~~ Noble Transcription Services - 714.335.1645 ~~~ 5
fin reports that are popular are 02b, which is here, this is voucher status by line item for program
income.
This shows you every single voucher that's been made for that grant line item, whether it's been
completed, revised, rejected, all of the statuses for program income vouchers. And the same is
true for 04. So it's the same report, but it looks at just grant funds, not program income. And then
we recently created 04b, which actually does combine all of your vouchers for both grant funds
and program income and this is a useful report if you really need to drill down on what particular
voucher needs adjustment to get your totals to add up, your activity budgets or whatever you
may need to accomplish.
05b is program income activity level. So this basically – oops, where am I at? Program income
account summary is what I meant to say. This is if you've created any program income accounts
or just your general account balance, this gives you just a summary of your program income,
your – the amount that's been receded and the amount that's been drawn and the available
balance. 05e, your PI receipt report. So this lists all of the receipts you've ever created by activity
and receipt number. 07a, and there's actually two of them here, this is a financial summary.
It's really useful, it's grouped by project and it shows all of your activity, budgets, obligations,
draws, expenditures and there's a special report just for the PL113-2 grantees and this report
actually contains the rounds of funding and block dates. And so if you're one of those grantees,
you're familiar with that. 07b is a really, really useful report. It's basically 07a. It's not grouped
by project and it has responsible organizations and national objective on it and we're going to
look at 7b today. And then 09d is fin data by quarter and by activity quarter.
And all of these here, if you see the word "cum" that stands for cumulative versus QPR, which
stands for quarterly data. So cum is going to show just the sum of all of the information up until
today or yesterday and quarterly data is going to give you a snapshot of what the financials
looked like in each quarter and that helps you nail down fiscal years or troubleshoot, in
particular, QPRs where maybe something went wrong. And I would urge you to look at all of
these reports.
Finally, the perf reports, just a couple here that are really popular. Perf report01 shows you all of
your household, housing units, properties, public facilities, every single thing that you've
projected a performance measure for and actually reported it on will show up here and we're
going to look at perf report01 today. The second popular report is perf report03, which is
addresses. This is really popular for NSP grantees, because they were required to enter all their
addresses. So this helps you identify which addresses have bene entered and which may be
missing, for example.
And the final perf report is perf report06, which is all of your FHEO data. So your race, your
ethnicity and your female, head of household status. And we're going to look at this one today as
well. So here's all the reports. Again, with this cookie-crumb here, we see that we were in – you
know, we clicked on DRGR, shared, standard and then grantee user reports and now we have all
of these reports at our disposal. So what we're going to do is pull our first report and before we
get there, I think we'll stop. Does anybody have any questions?

MicroStrategy Training for DRGR System Users, 9-22-16
~~~ Noble Transcription Services - 714.335.1645 ~~~ 6
Amy Murray: Yes. Hi, Tyler. We do have a question about one of the financial reports.
Actually, two of them. Can you go back and take a look and maybe tell us a little bit about the
difference between fin report02b and 04b?
Tyler Bridges: Yes. So 02b is a voucher report that only shows program income vouchers and
then 04 only shows grant fund vouchers. 04b shows both program income and grant fund
vouchers. So that's the big difference. 04b shows that all 02b just program income and 04 just
grant funds.
Amy Murray: Okay. And we had another question about the actual activity ID, if there's a report
that displays the activity ID key, not the activity title or name.
Tyler Bridges: So if by activity ID they mean activity number, most of the reports are labeled by
activity number and not activity title. So I hope that – usually they'll contain both. And if we
look at the first report that we look at, we'll actually see the activity number on there.
Amy Murray: Do you have a favorite report?
Tyler Bridges: My favorite report has been 07d, because it's just such a useful summary of your
financials and then that's why we're going to look at it. It's really helpful.
Amy Murray: Sorry, going back to the question I asked earlier about activity ID, the questioner
wasn't referring to the activity number, the key field.
Tyler Bridges: The key field?
Amy Murray: Yeah. I'm not sure if I'm understanding that correctly.
Tyler Bridges: Yeah. I'm trying to think – well, you know what, let's – we're going to look into it
and then we'll try to come back at the end of the presentation or if there's – I think we're going to
– if there's additional questions, we can follow up after the webinar. So I think we're ready to
move on to the next phase, which is customizing and saving reports. So let's customize a report.
We're actually going to start with the FHEO report. So we're going to go to perf report06. So
again, this is just going to summarize information that's already been entered into DRGR.
So if I am a grantee and I've got several sub-grantees and I want to see progress on the number of
FHEO data in the system and what's missing, I would look at this report. DRGR is giving us a
friendly reminder here that we need to go poke in there and stay refreshed. So clicking yes – I
don't even know if that works, to be honest. I always just play it safe and go into DRGR and
click on something else. So perf report 06, you have a bunch of options here. You can click on
the title itself, which will launch the report and that's almost always the action you're going to
take.
You will be able to subscribe to the report from here, which we're going to show and then you
can also either export it into Excel or PDF straight from this screen. If you have more than one
MicroStrategy Training for DRGR System Users, 9-22-16
~~~ Noble Transcription Services - 714.335.1645 ~~~ 7
grant that you're assigned to, let's say you have your NSP1 and NSP3 grant, for example, if you
click export or PDF straight from this screen, it's going to always just export your earliest grant.
So if you have more than one grant, you typically want to click on the actual heading itself. So
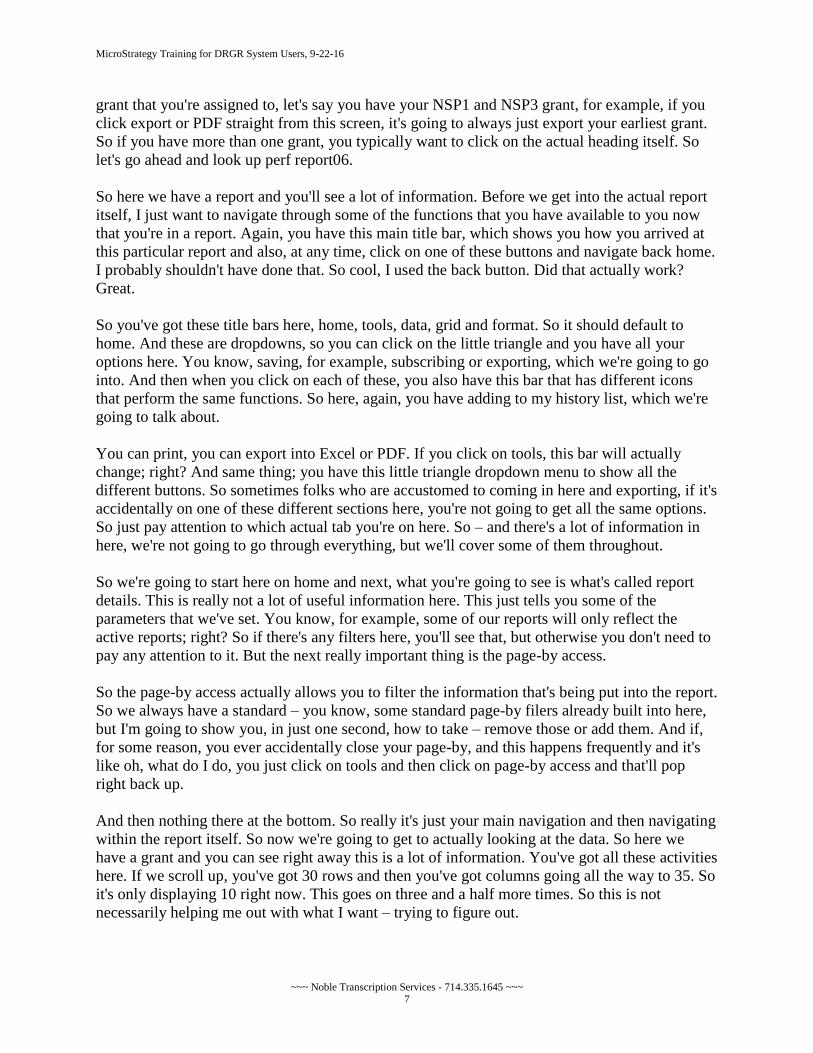
let's go ahead and look up perf report06.
So here we have a report and you'll see a lot of information. Before we get into the actual report
itself, I just want to navigate through some of the functions that you have available to you now
that you're in a report. Again, you have this main title bar, which shows you how you arrived at
this particular report and also, at any time, click on one of these buttons and navigate back home.
I probably shouldn't have done that. So cool, I used the back button. Did that actually work?
Great.
So you've got these title bars here, home, tools, data, grid and format. So it should default to
home. And these are dropdowns, so you can click on the little triangle and you have all your
options here. You know, saving, for example, subscribing or exporting, which we're going to go
into. And then when you click on each of these, you also have this bar that has different icons
that perform the same functions. So here, again, you have adding to my history list, which we're
going to talk about.
You can print, you can export into Excel or PDF. If you click on tools, this bar will actually
change; right? And same thing; you have this little triangle dropdown menu to show all the
different buttons. So sometimes folks who are accustomed to coming in here and exporting, if it's
accidentally on one of these different sections here, you're not going to get all the same options.
So just pay attention to which actual tab you're on here. So – and there's a lot of information in
here, we're not going to go through everything, but we'll cover some of them throughout.
So we're going to start here on home and next, what you're going to see is what's called report
details. This is really not a lot of useful information here. This just tells you some of the
parameters that we've set. You know, for example, some of our reports will only reflect the
active reports; right? So if there's any filters here, you'll see that, but otherwise you don't need to
pay any attention to it. But the next really important thing is the page-by access.
So the page-by access actually allows you to filter the information that's being put into the report.
So we always have a standard – you know, some standard page-by filers already built into here,
but I'm going to show you, in just one second, how to take – remove those or add them. And if,
for some reason, you ever accidentally close your page-by, and this happens frequently and it's
like oh, what do I do, you just click on tools and then click on page-by access and that'll pop
right back up.
And then nothing there at the bottom. So really it's just your main navigation and then navigating
within the report itself. So now we're going to get to actually looking at the data. So here we
have a grant and you can see right away this is a lot of information. You've got all these activities
here. If we scroll up, you've got 30 rows and then you've got columns going all the way to 35. So
it's only displaying 10 right now. This goes on three and a half more times. So this is not
necessarily helping me out with what I want – trying to figure out.

MicroStrategy Training for DRGR System Users, 9-22-16
~~~ Noble Transcription Services - 714.335.1645 ~~~ 8
So I can actually start to filter this report to reduce the amount of information I am seeing. Right
now it's showing everything in my program. So if I wanted to instead look at just my beneficiary
category, I could click on this right here, beneficiary category, and I click and hold it and I drag
it to the page-by access. And that little yellow line there means I've dragged it there. Once I drag
it to the page-by access and I let go, this report is now going to show only these criteria instead
of all of them. So before it was showing all eight or nine of these different criteria.
Now, if I only want to see the total number of households by race category, now I'm only seeing
that information. And so it's a little bit more digestible. I could also look at just particular activity
types or activity numbers. Let's say I was only interested in looking at my housing rehab
portfolio, again, I can just click on the title of the – or the heading of the column and drag it up
into the page-by access and now I can look at – it looks like that kicked in. I can look at just my
rehab reconstruction or my home ownership assistance.
Now, it looks like because I've kind of clicked and dragged while I was trying to demonstrate
that I also pulled in the activity number. So let's say I didn't want to do that, how can I put it
back? Well, there's two ways to do it. One is you can use these undo buttons and they will undo
and redo everything you've done. So I put those into the page-by, I kind of messed it up. So now
I just undo it back to where it was. And so now I can actually put this activity type back into
here. I can also put things that are in the page-by back into the report. So let's say I only want to
look at my housing assistance, but I want all of these beneficiary categories back into my report.
So I can click on it again and this little yellow line is going to show up and I get to kind of pick
where I'm going to put it. So it's asking me, do I want it displayed horizontally or vertically? So
it came horizontally. And again, you're not going to harm anything or ruin your data here by
playing around. If you ever go too far with a report, you can always just go back into grantee
user reports and then come back into this report and it'll be completely refreshed to the normal –
you know, the way it was set up originally.
I'll show you how to save your edits, but right now we haven't saved anything. So I put it back to
the way it was, but that's not quite right, because the beneficiary category was above the race and
ethnicity. So again, I can just click on this and bring it above it and – or let's see if I can drag it
below. And so now it's kind of similar to where it was. Now, I still feel like this is not showing
me the information in the way that I want it. So let's put the activity type back into the report. So
all I did was click on the title and then dragged it into the row where I wanted it.
And now, this time let's say I want my – because this is 35 columns, maybe I can change my
beneficiary category from horizontal to vertical. Let's see if that helps me see this information
more clearly. So I just clicked on beneficiary category and dragged it to that vertical line and
now I can see for this activity, these are the measures that I've already entered race and ethnicity
data into and here is the numbers I've already entered. So these are all zeros. Let's see if we can
actually find some data. So here you've got – so now I know for this activity, I've entered 35 of
this race category and then I can also see there was no Hispanic/Latino –
You know, you can start to troubleshoot the information you're seeing here. You can also come
in here and select race and ethnicity by clicking and dragging it and move it to vertical. And so

MicroStrategy Training for DRGR System Users, 9-22-16
~~~ Noble Transcription Services - 714.335.1645 ~~~ 9
now the report is much more simple; right? So you've got your activity number, activity type.
This should be the responsible organization, I'll have to look into that. But now you can see what
the races were reported for each category and I think that this is a much more meaningful way to
look at the data is you've got the activity number and you can see it's a renter activity, the total
number of households, you've got your female, your Hispanic, your Latino, all of that
information is here.
And now you can actually start to troubleshoot the information and make sure that your local
records match up with the information that you've entered into DRGR. So that really is the page-
by access, how to change a report and change its look. You can also move these columns. So you
can sort them any way you want. You can also right-click on these and you have additional
options here. You cannot delete any columns, unfortunately, but you can manage that in Excel,
which we'll talk about, but this is a way to just move them essentially left or right or you can sort
ascending, descending.
You know, you can do whatever you need to here essentially. So we've spent some time on this
report and we customized it and maybe we like it to be this way; right? So we don't want to have
to, every time we come in and do an analysis on FHEO data, make this report all over again just
to do the analysis. I want to just have this report pulled every time in this exact format. And in
fact, I can actually come into this grid tab here and change what the report looks like. So I can
click on any one of these and it gives kind of like a different look to it. So if you like one
particular format over another, you can play around with these and see if that's the way you want
it displayed.
Just a second. So let me see, let's go back here. So this particular report, I don't think, ever
showed actuals – I mean, proposed. Let me see if it did. This is only displaying actuals. So there
are other reports that show projected versus actuals, like your performance reports, but when it
comes to race data and ethnicity data, you never propose your race and ethnicity, it's only you
just report on the actuals. Sorry, I got a side question. So now that we've customized this report,
and we want to see it this way all the time, what we can do is go to home and then click save-as
and a new window is going to pop up.
And in this window, you should have a thing called my reports. And so this is your own personal
folder only accessible by you. So you can come in here and rename this. So you can call this my
FHEO report, you can insert a description here if you want, like best report ever and click okay.
Now, it's going to give you an option to return to the original report or run the newly saved
report. So if you were to return to the original, for example, it's just pulling the report that's
actually – that you customized. But let's say now when I go into –
If I log in tomorrow and I went to perf report06 again through the standard process by clicking
DRGR shared, standard and grantee user reports, when I scroll down to perf report06, you'll see
it's just the original report, it's untouched; right? So instead if I log in a week from now and I
want to pull that report in that format, I can now, instead of clicking on shared, standard, grantee
user reports, I can just click on my reports and I can come in here and locate my new report here.
So my FHEO report, I can click on it and now it's going to be in the format that I designed it and
it's going to include today's data.

MicroStrategy Training for DRGR System Users, 9-22-16
~~~ Noble Transcription Services - 714.335.1645 ~~~ 10
So it's always going to include the latest data. It's going to pull the latest information that's been
entered into the system in the format exactly how I want it. So that's basically customizing and
saving reports. I want to show you, too, if you want to save this report with the point-in-time
data, so I want this report saved with this information, I don't want it pulling new data later, I can
come up here and click add to history list. And this – most people will not use this feature, but it
is available to you. Typically, you'll export this report if you want to save it, but it puts it in the
history list.
And then you can navigate home and then in your history list, all of your saved reports will be
shown here. I'm just going to go into DRGR and click something. The last thing I want to show
you about saving reports is if you, again, go home and you click on shared reports, standard
reports, grantee user reports, let's say there's four or five reports that you always use and you
don't necessarily want to customize them, you just want to get there more quickly, you can
actually click on any one of these reports and then just save them as-is to your my reports. And
that way, all of your popular reports are really easily accessible right from your landing screen,
from your home screen.
So instead of navigating through that list of reports, you can just come here and pull your five
favorite reports. So that's the end of section three. Do we have any questions?
Amy Murray: Yeah. Hi. We do have a few questions. "Tyler, can you confirm that reports that
we save and create are not available to all other users?"
Tyler Bridges: That is correct. So anything – any report that you create and you save to my
reports is not accessible by anybody else but you.
Amy Murray: Okay. Another question is, "Is there any way to get data based on a specific date
range?"
Tyler Bridges: So there are – yes. So if you're looking at – let me get back into standard reports.
So in here, when you get to the financial reports, for example, there are – let's see, when I
covered cum versus quarterly. So that's one way to do it. Cum is always going to be the latest
data. The quarterly data will show you the actual quarterly information so you can look at it in
that data range. And I know that there are – I think what it's called is a prompted report in here.
Let me see if – there's also a search up here.
So you can use the search – let's see if I can find my prompted. There is a fin report in here. I
wish I had Phyllis [ph] with me. Let's see, so yes, there is a particular report and we'll actually
follow that up in the answer and question. There's a fin report that actually allows you to enter a
start and end data to get that data.
Amy Murray: Okay. And then someone had asked, "So the features that we're reviewing in
MicroStrategy today, although, it's specific to DRGR – or in the context of DRGR also apply to
other programs, like CDBG for other systems that use MicroStrategy?"

MicroStrategy Training for DRGR System Users, 9-22-16
~~~ Noble Transcription Services - 714.335.1645 ~~~ 11
Tyler Bridges: So DRGR, the way we use MicroStrategy is very different than what IDIS does.
IDIS has kind of their pre-canned reports and you may be able to do some of these things. I'm
actually not entirely sure, I haven't been in there in a while, but their reports are less
customizable, if you will. I can definitively say you can do all of these things in DRGR. When it
comes to IDIS MicroStrategy, you would have to just go in there and see or submit a question to
either your CPD rep or the IDIS Ask A Question.
Amy Murray: Okay. I think that's it for now.
Tyler Bridges: Okay. So let's now talk about exporting reports. So we're going to look at fin07b.
So I'm in DRGR shared, standard, grantee user reports and I locate fin7b here, I'm going to click
on it. So here we have fin07b and let's see here, just take a larger grantee here. So again, ton of
information, right, 253 rows? This is my entire program. We've already gone through page-by
and all that stuff. So instead what I want to do is just directly export this report; okay? So there's
two export functions. There is Excel and PDF. So these are in the home tab; okay? So PDF is
really simple.
You know, if we wanted to just pull a report, let's say I want to show – my boss wants to know
how is a particular responsible org doing on all of their programs; right? So I click and drag the
responsible org into the page-by, I pick one of these grantees or sub-grantees and here's their
information, maybe I want to just make it look a little bit nicer. And so I select one of these
templates. So this looks good, I'm going to submit this to my boss. So I would go to home here
and I can click on PDF. A new screen is going to pop up and you have some options here.
One is adjust it to its original size or fit it in on one-by-one or two-by-one, whatever print options
you want here. So if I say fit to one-by-one, then it's going to put this report one sheet of paper.
And of course, I'm going to select landscape, because this is a landscape report. You have other
advanced options here about letter size and all that. And then over here on the right, you also can
edit the header and footer and the report heading. So if I click on this, for example, right now it's
showing some information already kind of just canned into the report and I can insert additional
information from here.
For example, maybe on the bottom-right, I also want to include the date of the report. So I can
click apply. And I think the report header, it just defaults blank. So we don't even know what we
just did, but we think we added page numbers and let's see what happens. So we click export.
And I'll go over this again. So now here's your report; right? So you've got your information, it
looks pretty good, but maybe you don't want all this information up here. So what you can – you
do want your page number and you do want your date. So you can go ahead and just close this,
click export again.
And again, you're really – in most cases, you can just click fit one-to-one and click on landscape
and click export, but if you want to edit this again, you can actually just delete this stuff that gets
automatically put in there. We'll leave page and page number and we'll leave data, click apply
and then export and now you've got a PDF that just has that table and then the date and page
number at the bottom. And so you can send this off. So – and then from here, you can either print

MicroStrategy Training for DRGR System Users, 9-22-16
~~~ Noble Transcription Services - 714.335.1645 ~~~ 12
or save it and you can just save it to wherever you'd like to save it. So that's how you do PDFs
and that's probably the lesser common export.
So we've kind of changed this report. I need to do a much deeper analysis of my financials. And
so I actually want to bring this information into Excel. So what I'm going to do is I could either
use the back button to get it back to default or I can navigate back to the standard reports and just
scroll down and select the report again so that it basically comes as originally designed. So here's
my report and this time I am just going to export it the way it is. So I come over here to home
and I'm going to click on this icon, which is export and this is export to Excel.
So again, here you have some common – you know, you have several options here. Really,
you're going to likely either pick Excel with plain text or Excel with formatting. If you're – if you
have a financial system or other type of software where you can actually export data in CSP
format and hook it up to one of your other systems, you may do that as well, but really I think
that the most common is one of these two. If you select Excel with formatting, which we'll start
with first, you're going to get this prompt, you can click save, and I'll go over all this again, and
then open.
So – and I always get this pop-up message, it's just saying, do you want to open this thing? I say,
yes. So when you do it that way with the formatting, you're going to get a report that has all of
the information formatted and this can be problematic in some cases, if you want to do a data
analysis, because it'll actually have groupings of reports or groupings of information that will
prevent you from being able to sort information really easily. So typically, if you want to do an
analysis on your data, you're going to want to export in plain text and you'll see that over here.
So here I've got my fin07b, I'm going to instead export in plain text and then again, I'll click save
and open.
So now it's in plain text and it doesn't look very pretty. The way to expand all of this is I just
clicked up here and highlighted these columns and then double-click at the end and it'll pop it all
open. Then what I can do is there is this guy here, metrics. Basically, in every MicroStrategy
report, and it's also shown here, everything to the left of the word metrics are attributes. So these
are things like names, numbers, things like that. Everything to the right of the word metrics, this
column, is all of your calculations; okay? So that's why this – you're always going to get this
empty column here. So you can just delete it.
So now what we want to do is take and actually insert a filter on this. So I'm just clicking on one
of my headers and then I'm going to click filter and it's going to add a filter to all of these rows
here. So let's say now I want to – I just need an analysis of budgets and grant funds dispersed,
that's all I'm looking at right now. So I don't want obligations and I can't delete in MicroStrategy,
I don't want program income or expended, I just want – or excuse me, I do want expended. I only
want budget, grant funds and expended. So I'm just highlighting these columns, right-clicking
and deleting them.
So now I've only got these three columns. And I'll just zoom out a little bit. So let's say I want to
only – I'm trying to get an analysis of where I am on my LH-25 requirement. So I can click on
this little triangle here, unselect them all and then I can click on LH-25 and okay. And now I can

MicroStrategy Training for DRGR System Users, 9-22-16
~~~ Noble Transcription Services - 714.335.1645 ~~~ 13
see, real quickly, all of my budgets and my grant funds dispersed and my expended. So I can
click up here, auto sum, and sum this column, and then I can format the column, and then I can
also click and drag this over so that it also sums all of these other columns. So I can see, in this
scenario here, that I'm fully drawn and fully expended for my LH-25 requirement.
Let's see here, so let's see if that's the case for all of my activities; right? So I can come in here
and take off my settings. So let's select all again and if we scroll to the very bottom, it's showing
that we're not fully spent; right? So anyway, this is the way to basically start to look at this data
and narrow it down and this is kind of Excel-based stuff, but this is really helpful if you want to
just see what is just a particular organization, how are they doing. You can filter that information
here. You know, if you want to get particular, snapshots. And this information you can keep
customizing this to whatever your needs may be.
Maybe you want to only see what your home ownership assistance is. So you can see all of your
activities that are doing home ownership assistance and where are they at in terms of
expenditures and draws. You can also do some additional calculations, like maybe you want to
see what the remaining budget is. So before we knew that everybody was – some people hadn't
fully spent. So if we come over here, we can do equals, budget minus disbursements. And so that
one's fully spent and then you can click and drag this all the way down and widen the column
and then you can actually see this one is an example of one where the budget – or the draws have
not caught up to the budget yet; right?
So you've got a remaining balance. So this can help you actually see which ones have remaining
balances left. So that's really it, that's exporting information into Excel. Once you get it into here
and you want to save this report, you can save it on your local drive. It always comes in a web or
UniText format. So you obviously want to save it as a Excel workbook most likely. You can
save it to your desktop and then now you have it. And you can also create charts and graphs and
what have you from here. So do we have any questions on exporting reports?
Amy Murray: We don't have a question on exporting reports, but we have a question about
creating a report. "I know you showed us how to filter exports by activities, but can you create a
report by specific activities?"
Tyler Bridges: Create a report by specific activities. So I guess I would need a little bit more
information. I mean, I can say that as I ramble here, maybe we'll get some more information on
that question. Nobody except for HUD here at headquarters can create a custom report that has
different attributes and metrics in the report. You only – you have what is given to you. When it
comes to a particular activity report, I'm not sure, because this is a report that has every activity.
So do we – did the questioner say any more?
Amy Murray: So what if, for example, you only wanted to see activities associated with a
specific responsible organization or you only wanted to see activities associated with certain
category or activity type?
Tyler Bridges: Okay. So here we're in this report. So this was our Excel and we put this filter on
here. So if I wanted to see only activities that are associated with a particular responsible
MicroStrategy Training for DRGR System Users, 9-22-16
~~~ Noble Transcription Services - 714.335.1645 ~~~ 14
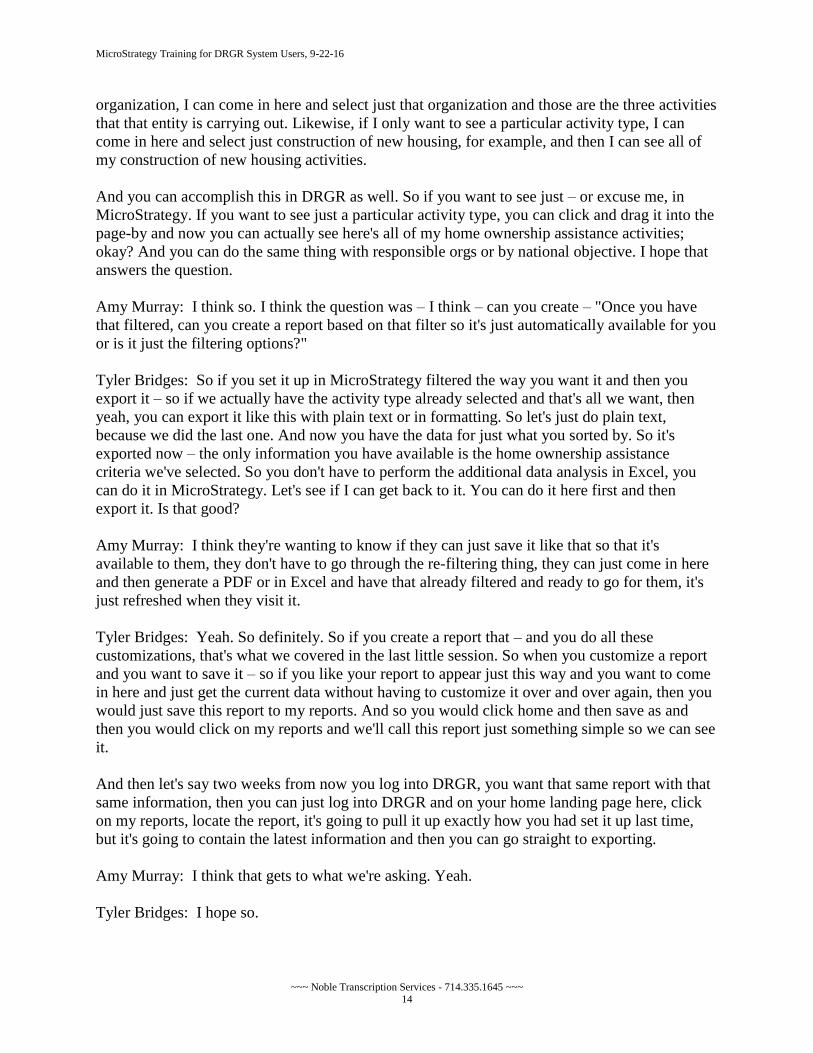
organization, I can come in here and select just that organization and those are the three activities
that that entity is carrying out. Likewise, if I only want to see a particular activity type, I can
come in here and select just construction of new housing, for example, and then I can see all of
my construction of new housing activities.
And you can accomplish this in DRGR as well. So if you want to see just – or excuse me, in
MicroStrategy. If you want to see just a particular activity type, you can click and drag it into the
page-by and now you can actually see here's all of my home ownership assistance activities;
okay? And you can do the same thing with responsible orgs or by national objective. I hope that
answers the question.
Amy Murray: I think so. I think the question was – I think – can you create – "Once you have
that filtered, can you create a report based on that filter so it's just automatically available for you
or is it just the filtering options?"
Tyler Bridges: So if you set it up in MicroStrategy filtered the way you want it and then you
export it – so if we actually have the activity type already selected and that's all we want, then
yeah, you can export it like this with plain text or in formatting. So let's just do plain text,
because we did the last one. And now you have the data for just what you sorted by. So it's
exported now – the only information you have available is the home ownership assistance
criteria we've selected. So you don't have to perform the additional data analysis in Excel, you
can do it in MicroStrategy. Let's see if I can get back to it. You can do it here first and then
export it. Is that good?
Amy Murray: I think they're wanting to know if they can just save it like that so that it's
available to them, they don't have to go through the re-filtering thing, they can just come in here
and then generate a PDF or in Excel and have that already filtered and ready to go for them, it's
just refreshed when they visit it.
Tyler Bridges: Yeah. So definitely. So if you create a report that – and you do all these
customizations, that's what we covered in the last little session. So when you customize a report
and you want to save it – so if you like your report to appear just this way and you want to come
in here and just get the current data without having to customize it over and over again, then you
would just save this report to my reports. And so you would click home and then save as and
then you would click on my reports and we'll call this report just something simple so we can see
it.
And then let's say two weeks from now you log into DRGR, you want that same report with that
same information, then you can just log into DRGR and on your home landing page here, click
on my reports, locate the report, it's going to pull it up exactly how you had set it up last time,
but it's going to contain the latest information and then you can go straight to exporting.
Amy Murray: I think that gets to what we're asking. Yeah.
Tyler Bridges: I hope so.

MicroStrategy Training for DRGR System Users, 9-22-16
~~~ Noble Transcription Services - 714.335.1645 ~~~ 15
Amy Murray: Yeah. Thank you for going through that again.
Tyler Bridges: No problem.
Ryan Flanery: Really quickly, though, Tyler, I just want to – this is Ryan Flanery, by the way. I
just want to add real quick, because I'm seeing the question from Robert and is asking if they can
have a report that only has Northern California cities, for example. We're limited in
MicroStrategy to the attributes and metrics that are in the report. So to get something like that,
you would have to have, for example, your responsible organization broken up by those cities
and then you really would have to handle that in Excel.
One of the features of MicroStrategy, which I really would've loved to see, but we don't quite
have it yet, is that same kind of selecting multiple results in a page-by. So when Tyler drug the
metrics and attributes up to the page-by bar, you can only select one of those, you can't select
multiple. It would be helpful if you could, but that's kind of a limitation of MicroStrategy at the
moment. So I just wanted to clarify that.
Amy Murray: All right. Thank you.
Tyler Bridges: Thanks, Ryan. Do we have any more questions before we go to subscriptions?
Amy Murray: I think that's it for now.
Tyler Bridges: Excellent.
Subscriptions. Let's say that you want to – you are here in the finance office and you need data
pulled at the beginning of each month, you need to prepare financial statements, you need to
reconcile with your local systems. And so you want just a report pulled for you every single
month and it just displays this information.
So you can pick any report you want, it can be one of the canned reports that already exist in
standard reports or it can be your own custom report. And you can actually create what's called a
subscription so that without you having to go into the system, it will automatically pull the report
and save it for you and you can access it at any time.
So the way to initiate a subscription is let's just start from the launch screen again. And so we're
going to click on shared reports, standard reports and grantee user reports. And let's say that I
want – this time I want, I don't know, my PR receipt report or probably – you know, the fin07b
report would probably be helpful as well, but we just went over that one. So anyway, you pick
whichever report you want to see once every month and then you come up to home and
subscribe to and then history list. And I'll show that again.
And then you can name this anything you want. So you can say my PI report and then you can
pick all these different intervals that are already set. So you can say the first of the month, the
end of the month, daily, weekly. You know, you get to pick from these intervals. So let's say the
first of the month we always need this report and then I can also say run it immediately. So it'll

MicroStrategy Training for DRGR System Users, 9-22-16
~~~ Noble Transcription Services - 714.335.1645 ~~~ 16
become immediately available. And then you can also click on these advanced options. And this
is important, the new scheduled report will override the older version. So you may want to
uncheck this, because if you –
Let's say you're having these reports pulled weekly and you're out for – you know, on vacation or
something for two consecutive weeks and you wanted both of those point-in-time data, then you
would unselect this so that the reports are not replacing each other. Every report will stay saved
in MicroStrategy for, I believe, 60 to 90 days. So they're not going to live here forever, but they
will give you that window of opportunity to go and pull this report. So I named the report, I
selected the interval – or I named the subscription, I said I want to run it immediately. I'm going
to say, don't want them overwritten.
I can stop this subscription right here if I want to. I can say, don't do this after a few months and
then I can also have it send me an email every time that the report is created and put into my
history list; okay? So once you set up your subscription, you click okay and it says, your
subscription has been created successfully. So every time when I log into DRGR now, if I want
to view that subscription, then I actually – it's not this one, it's in your history list. So you click
on your history and you'll see here's my PI report and I can actually come in here and it's going
to contain the data on the day that this information was pulled.
So if, over time, I have these set up for every week, then every week a new one would pop up
here and they would begin to disappear after they expire, but then I can come in here and export
the report in PDF format or Excel, whatever it is I want the format to be. And you get that same
window. So again, the way I – and you can also – if you start from home again, let's say you
created one of your custom reports, when I go from home, when I click on my reports and I
locate my custom report, which I think I named in here my FHEO report, when I click it here, it's
using the custom format I designed, but it's pulling the most current data; right?
And so I want to now subscribe to this report. I want it to be given to me every week, let's say.
So I, again, go to home, and then subscribe to history list, and then I can select every Monday
morning, and I want it run immediately, and I don't want them replaced, and I want email
notifications that I'm receiving them. And I click okay and then now every week when I log into
DRGR, if I click on history list, those reports are going to begin to stack up here. I can also
check these boxes to remove them straight – so as you open them and save them, then you can
delete them from here.
And you can also go back home and if you want to manage any of these subscriptions, you do
that here. So you click on my subscriptions and you'll see here's the – I created the one for my
receipts and I also created my FHEO report. And I can go and click on this edit button and it's
going to give me that same screen where I can change the parameters. So let's say we're doing
better on this, I don't need it every morning, I can now change this to monthly, for example. And
let's say I'm sick of getting all those emails, I know it's there, unsubscribe that and you click okay
and then it will update that subscription.
And then you could also, at any time, unsubscribe to these as well from here. So that is
subscriptions. And before I take questions, just to kind of recap here, we talked about shared

MicroStrategy Training for DRGR System Users, 9-22-16
~~~ Noble Transcription Services - 714.335.1645 ~~~ 17
reports, which is where all your standard reports are located and that's where you access the pre-
canned reports. We talked about my reports, which is where you can save either the canned
reports as-is or customized reports for easy access. Then we talked about the history list, which is
where you can save any report at any time with that point-in-time data or you can also subscribe
to reports and they will be stored here for up to 60 or 90 days.
And then finally, my subscriptions, which is where you can edit subscriptions that you've already
created. So do we have any questions on subscriptions or any other topic before we move on to
the other part of this webinar?
Amy Murray: Thanks, Tyler. There are no additional questions at this time.
Tyler Bridges: Excellent. So we've got about 20 minutes. That's it for MicroStrategy. I'm going
to go back now to the PowerPoint. So if I don't mess it up – so the public data portal, if we
navigate to the public data portal and I put that web address in the PowerPoint,
DRGR.HUD.gov/public – oh, are you kidding me? Let's see here – so I think my URL was
incorrect. So here's the DRGR public data portal.
Amy Murray: I don't see it here.
Tyler Bridges: You don't see it?
Amy Murray: No.
Tyler Bridges: Okay. Sorry, I think the screen was delayed. So here we have the DRGR public.
So what this is is we created this to basically make available information about the grants that are
in the DRGR system. So this information does not require a username or password to access.
Anybody anywhere can access this information, including not only yourself and your colleagues,
but also the press, for example or other neighboring cities, things like that. So you come to this
website and you've got basically three different components, data downloads, reports and data
visualizations.
So this was a – you know, this was launched a couple years ago and we're about to begin to
revamp it. Right now data visualizations, we did find a bug in it. So we kind of disabled it, but it
will come back online, I think, in about six months. But for now, data downloads and reports is
working well. So if we click on – basically, the difference between these two is data downloads
are going to come in Excel format and it's going to give you all of that raw information. Reports
is going to be charts and graphs and kind of custom PDFs that we've created for you to visually
display information.
So we're going to look at reports, but first let's look at data downloads. So I just went to the
DRGR public and I come here and you can see here's a bunch of information about NSP
primarily and when they were going to add disaster grants as well. But you can see all of the
performance measure data, some of these files are very large, financial data. NSP is doing a lot
of close-out now. And so we're provide NSP close-out reports here, perf report01, 03, 06,
everything. All of this information is publicly available.
MicroStrategy Training for DRGR System Users, 9-22-16
~~~ Noble Transcription Services - 714.335.1645 ~~~ 18
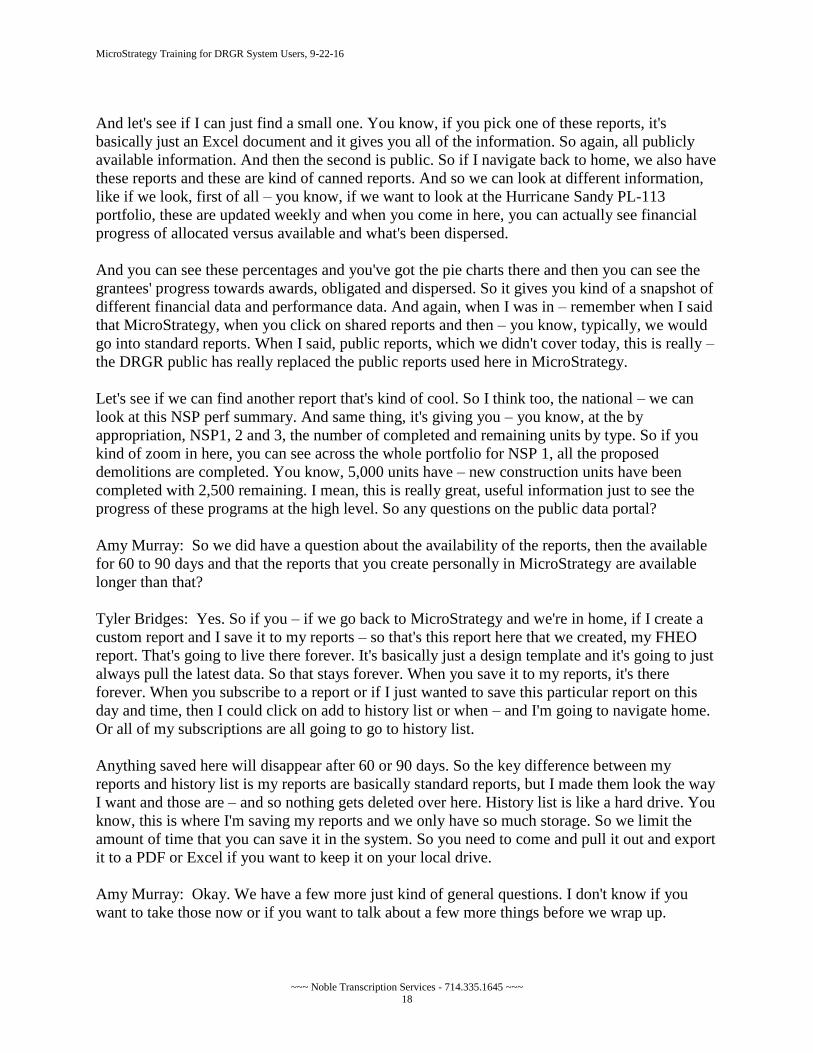
And let's see if I can just find a small one. You know, if you pick one of these reports, it's
basically just an Excel document and it gives you all of the information. So again, all publicly
available information. And then the second is public. So if I navigate back to home, we also have
these reports and these are kind of canned reports. And so we can look at different information,
like if we look, first of all – you know, if we want to look at the Hurricane Sandy PL-113
portfolio, these are updated weekly and when you come in here, you can actually see financial
progress of allocated versus available and what's been dispersed.
And you can see these percentages and you've got the pie charts there and then you can see the
grantees' progress towards awards, obligated and dispersed. So it gives you kind of a snapshot of
different financial data and performance data. And again, when I was in – remember when I said
that MicroStrategy, when you click on shared reports and then – you know, typically, we would
go into standard reports. When I said, public reports, which we didn't cover today, this is really –
the DRGR public has really replaced the public reports used here in MicroStrategy.
Let's see if we can find another report that's kind of cool. So I think too, the national – we can
look at this NSP perf summary. And same thing, it's giving you – you know, at the by
appropriation, NSP1, 2 and 3, the number of completed and remaining units by type. So if you
kind of zoom in here, you can see across the whole portfolio for NSP 1, all the proposed
demolitions are completed. You know, 5,000 units have – new construction units have been
completed with 2,500 remaining. I mean, this is really great, useful information just to see the
progress of these programs at the high level. So any questions on the public data portal?
Amy Murray: So we did have a question about the availability of the reports, then the available
for 60 to 90 days and that the reports that you create personally in MicroStrategy are available
longer than that?
Tyler Bridges: Yes. So if you – if we go back to MicroStrategy and we're in home, if I create a
custom report and I save it to my reports – so that's this report here that we created, my FHEO
report. That's going to live there forever. It's basically just a design template and it's going to just
always pull the latest data. So that stays forever. When you save it to my reports, it's there
forever. When you subscribe to a report or if I just wanted to save this particular report on this
day and time, then I could click on add to history list or when – and I'm going to navigate home.
Or all of my subscriptions are all going to go to history list.
Anything saved here will disappear after 60 or 90 days. So the key difference between my
reports and history list is my reports are basically standard reports, but I made them look the way
I want and those are – and so nothing gets deleted over here. History list is like a hard drive. You
know, this is where I'm saving my reports and we only have so much storage. So we limit the
amount of time that you can save it in the system. So you need to come and pull it out and export
it to a PDF or Excel if you want to keep it on your local drive.
Amy Murray: Okay. We have a few more just kind of general questions. I don't know if you
want to take those now or if you want to talk about a few more things before we wrap up.

MicroStrategy Training for DRGR System Users, 9-22-16
~~~ Noble Transcription Services - 714.335.1645 ~~~ 19
Tyler Bridges: Yeah. I'll go through – I'd be happy to take the questions, we have about 10
minutes. I think we'll just jump back to the PowerPoint here real quick. So these – I said there's a
list of popular reports and those are available here. We went through those in the beginning.
There's also a lot of resources on the website. If you go – I'm going to navigate there, but you
could go to HUD Exchange and you can see a bunch of information on the other release we're
doing. A new release is going to come out at the end of October. No major, new functions, but
we are fixing a lot of different things. There's a DRGR FAQ and then there's our DRGR user
manual, which is a really, really good step-by-step with screenshots on how to navigate and use
DRGR.
There's a whole chapter on there with MicroStrategy and that will show you all of the step-by-
step ways to save a report, export a report, customize a report. All of that information is in
written format with screenshots. And then we have the DRGR Ask A Question, which is really
useful. A team of TA providers can answer any questions related to the technical aspects of
DRGR and MicroStrategy and they'll always defer to your CPD rep on policy-related matters.
And then finally, in DRGR, there's actually a searchable FAQ too.
So I'll just briefly go through these. You know, in DRGR, if I can find it, under – if you click
admin, let's see here, under utilities, there's the FAQ. And so you can type in reports and it'll say
here's information on how do I get reports to run automatically, how do I subscribe to a report?
And you can actually view that information here and there's also – you can click on this PDF and
it will give you hopefully some screenshots. See, so screenshots; right? So use the feature in –
that's a searchable FAQ in DRGR and then if you also go to the HUDexchange.info/DRGR,
when you get to the landing page, you'll see a bunch of DRGR guides, tools and webinars.
So if you click on this link, then here are the DRGR manuals here by default and you can see
Section 7, which was MicroStrategy reports and it's a PDF of all of the things that we covered
today, plus more. So you'll see here navigating, shared, my report, history, subscriptions, how to
change orders, display graphs, export to Excel. You know, it's got all that fun stuff. So – and
again, this one, too, has screenshots and step-by-step instructions. It's just loading a little slow.
So – and then we also have – let me see if this loaded. You know, here is all of these screenshots
and step-by-step instructions, it talks about the public data portal, all that fun stuff.
Let's go back to the HUD Exchange and you've got your fact sheets, webinars, things like that.
This webinar, for example, would be placed here once we're done. And then you can also
navigate back to DRGR. Here's how you can view the FAQ or you can ask a question and then
all sorts of information on all of our various releases and more. So we try to keep this always up
to date. So please use it. And if you ever have a question about DRGR or MicroStrategy, please
submit it to an Ask A Question so that we can – you know, if you're having –
If you not only need help yourself, but if you discover a defect or if something's not working
properly, that's the best way to report it to us. So we have about seven minutes, we can answer
questions.
Amy Murray: Okay. Thanks. Somebody had asked about what happens in MicroStrategy's
reporting when you associate two activities. How does that then translate into your reports?

MicroStrategy Training for DRGR System Users, 9-22-16
~~~ Noble Transcription Services - 714.335.1645 ~~~ 20
Tyler Bridges: That's a great question. Associating activities in DRGR does not – nothing
happens in MicroStrategy. Basically, they're not joined together. If you want to look at reporting
details of associated activities, you can actually click on that information in the DRGR system. I
don't know if I'll be able to show it, but when you – when there's an association established in
DRGR, you can click on buttons on the activity screen so it will actually allow you to view
information in Excel format that shows the relationship, but when it comes to actual
MicroStrategy reports, there is nothing in MicroStrategy that currently displays reports based off
of associations, it's always going to just be activity level data.
Amy Murray: Okay. We had another question asking for any information, and I don't know if
this is within MicroStrategy, if this might be available, but a report or a grid that shows all the
performance measures for each activity type.
Tyler Bridges: Yeah. So that's a great question. If we go to – I mean, is the question the
available performance measures or what you've proposed? Because if the – if it's the available,
there is not a MicroStrategy report that shows everything that's available to select, but if it's – go
ahead.
Amy Murray: They're asking about both.
Tyler Bridges: Okay. So we do not have a report in MicroStrategy that simply shows all of the
available performance measures that are available, but – and I'll talk – and the other one is yes. If
you go into the HUD Exchange website and you go to view DRGR data upload templates, if you
scroll to the very bottom of this, there is what's called the action plan module crosswalk and if
you save this and open it up, you'll see all the activity types that are available and you can also
see all of the performance measures that are available, number of households, renter households
and then also number of refrigerators replaced, all of the information that's available.
Now, this does not mean that every activity type has every available activity beneficiary
information or the accomplishments; right? So linear feet of water and sewer lines are not
available in housing activities, but this is the best I can do in terms of showing you all of this
information, what's available. You can also go into DRGR itself and then just set up an activity
and look at the activity types and see what's available to you. In terms of is there a report that
shows all of the performance measures related to activities that you've already established, the
answer is yes.
And if we go to MicroStrategy, we'll click on shared reports, standard reports, grantee user
reports and then I'm going to scroll down to perf report01. This one's going to take just a second
to load up. So here you have – let's just pick a bigger grantee here. So you have all of your
performance measures and again, this is a lot of information that we're seeing here, 364 data
rows.
So if I want to see just performance measures by a particular activity type, again, I can click on
that and drag it to the page-by access and then here you can actually select rehab/reconstruction

MicroStrategy Training for DRGR System Users, 9-22-16
~~~ Noble Transcription Services - 714.335.1645 ~~~ 21
of residential structures, for example, and you'll see all of your activities that displayed those
performance measures and the number of low, projected and total.
And here we actually talked about earlier about on the FHEO report, how did you get projected
versus actuals and we discussed that that's not an option for FHEO, you only enter actuals. But
when it comes to projections and actuals here, you can actually – let's say I'm just interested in
the actuals, I can click on this and drag it up to the page-by access and then I can select actuals
and now I'm just seeing only my actuals. And we can also start to troubleshoot information,
which says, number of households, number of housing units, number of single family units for
this activity; right?
And it's showing 99 for each of them and that makes sense, that's correct. However, one thing it's
not showing is what is the tenure of this activity's household? So it's only showing – if you look
at the bottom here, this one's set up properly, it's got eight owner households, but the other one is
missing that metric. So that is going to be a key indicator of I've got an activity here that's not set
up properly and I'm not reporting all of the required information. Do we have any other
questions?
Amy Murray: We don't have any more questions in the queue. If you have anything else to ask,
please write them into the Q&A box. No other questions at this time.
Tyler Bridges: Okay. So I think we're ready to wrap up. Ryan, did you want to add anything
before we sign off?
Ryan Flanery: No. Just thank you for a great job today on this. I think it was really helpful.
Hopefully the attendees did as well. And just a big thanks to everybody who attended and took
the time.
Tyler Bridges: Thank you. Yes. I really appreciate everybody joining us today. I love this stuff. I
hope that this does make it easier for you to comply with your requirements and go through NSP
closeout and everything else. And hopefully it makes your job a little bit easier and maybe you'll
be a little bit more excited about DRGR with these useful tools. So again, this is going to be
recorded, we're going to put it on the website and I showed you the available resources.
Thank you so much. You know, have fun and have a good day.
(END)