Embed Size (px)
Citation preview
2016 Medicare Supplement Loss Ratios
September 2017
Ttin AIaac CIabin FUoa LCrtoa MRrra NNsra
N
N4SW2
The NAIC is the efforts ofnformation.
Accounting &nformation aband the proceannual statemcapital calcula
Consumer Inmportant ansauto, home, hbuyer’s guidesnsurance and
Financial RegUseful handboon financial anaudit requirem
Legal Comprehensivregulations anopics; and othand consume
Market ReguRegulatory anrelated issuesrequirements,analysis.
NAIC ActivitiNAIC membestate regulatorecords of NAactivities.
No part of this mechanical, in
NAIC Executive444 North CapiSuite 700 Washington, DC202.471.3990
the authoritf regulators, The NAIC o
& Reporting bout statutoryedures necessments and conations.
nformation swers to commhealth and lifes on annuitiesd Medicare su
gulation ooks, complianalysis, comp
ments and rec
ve collection nd guidelines;her regulatoryr privacy.
lation nd industry gus, including an producer lice
es r directories, ry activities a
AIC national m
© 201
book may be rncluding photoc
e Office tol Street, NW
C 20001
tative sourceinsurers and
offers a wide
y accounting psary for filing nducting risk-b
mon question insurance —s, long-term cupplement pla
ance guides apany licensingceiverships.
of NAIC mod; state laws oy guidance on
uidance on mantifraud, produensing and m
in-depth repoand official hismeetings and
17 National As
eproduced, stocopying, record
N1SK8
e for insurand researcherange of pu
principles financial based
s about — as well as care ans.
and reports g, state
el laws, n insurance n antifraud
arket-uct fi ling
market
orting of storical other
sociation of Ins
ISBN: 97
Printed in the U
ored in a retrievding, or any sto
NAIC Central O1100 Walnut StSuite 1500 Kansas City, M816.842.3600
ce industry irs by providi
ublications in
Special StuStudies, represearch coof insurance
Statistical Valuable anstatistical daincluding au
SupplemenGuidance mresearch on
Capital MaInformationproceduresrequiremen
White PapeRelevant stpositions on
For more publicati http://ww
surance Comm
78-1-59917-99
United States o
val system, or torage or retriev
Office treet
O 64106
information. ding detailed n the followin
udies ports, handboonducted by Ne related topi
Reports nd in-demandata for variouuto, home, he
ntary Producmanuals, handn a wide varie
arkets & Inve regarding po
s for complyinnts.
ers tudies, guidann a variety of
e informatioions, visit u
ww.naic.org/
missioners. All r
97-1
of America
transmitted in aval system, with
N&ON2
Our expert and compre
ng categorie
ooks and reguNAIC membecs.
d insurance inus lines of busealth and life i
cts dbooks, surveety of issues.
stment Analortfolio valuesg with NAIC r
nce and NAICinsurance top
on about NAs at:
//prod_serv_
rights reserved
any form or by hout written pe
NAIC Capital M& Investment AOne New York New York, NY 212.398.9000
solutions suehensive inss:
ulatory rs on a variet
ndustry-wide siness, insurance.
eys and
ysis s and reporting
C policy pics.
AIC
_home.htm
d.
any means, elrmission from t
Markets Analysis Office
Plaza, Suite 4210004
upport surance
ty
ectronic or the NAIC.
210
TABLE OF CONTENTS
2016 MEDICARE SUPPLEMENT LOSS RATIOS INTRODUCTION ................................................................................................................................. 1
Qualifications ........................................................................................................................ 2 MEDICARE SUPPLEMENT INSURANCE EXPERIENCE SUMMARY ......................................................... 3
U.S. and U.S. Territories Summary .......................................................................................... 5 Ten-Year Summary ................................................................................................................ 6 By State Totals ...................................................................................................................... 7 Number of Covered Lives by State Map .................................................................................. 9
INDIVIDUAL POLICIES ISSUED THROUGH 2013 U.S. and U.S. Territories By Direct Premiums Earned .................................................................. 11 U.S. and U.S. Territories By Company Name ......................................................................... 23
INDIVIDUAL POLICIES ISSUED IN 2014, 2015, AND 2016 U.S. and U.S. Territories By Direct Premiums Earned ............................................................ 35 U.S. and U.S. Territories By Company Name ........................................................................ 45
TOTAL INDIVIDUAL POLICIES U.S. and U.S. Territories By Direct Premiums Earned ............................................................ 55 U.S. and U.S. Territories By Company Name ........................................................................ 67
GROUP POLICIES ISSUED THROUGH 2013 U.S. and U.S. Territories By Direct Premiums Earned ............................................................ 79 U.S. and U.S. Territories By Company Name ........................................................................ 85
GROUP POLICIES ISSUED IN 2014, 2015, AND 2016 U.S. and U.S. Territories By Direct Premiums Earned ............................................................ 91 U.S. and U.S. Territories By Company Name ........................................................................ 95
TOTAL GROUP POLICIES U.S. and U.S. Territories By Direct Premiums Earned ............................................................ 99 U.S. and U.S. Territories By Company Name ...................................................................... 105
TOTAL POLICIES (Individual and Group) U.S. and U.S. Territories By Direct Premiums Earned .......................................................... 111 U.S. and U.S. Territories By Company Name ...................................................................... 123
MARKET SHARE BY DIRECT PREMIUMS EARNED ........................................................................... 135 Alabama ............................................................................................................................ 137 Alaska .............................................................................................................................. 138 Arizona ............................................................................................................................. 139 Arkansas ........................................................................................................................... 140 California .......................................................................................................................... 141 Colorado ........................................................................................................................... 142 Connecticut ....................................................................................................................... 143 Delaware ........................................................................................................................... 144 District of Columbia ........................................................................................................... 145 Florida .............................................................................................................................. 146 Georgia ............................................................................................................................. 147 Hawaii .............................................................................................................................. 148 Idaho ................................................................................................................................. 149 Illinois ............................................................................................................................... 150 Indiana .............................................................................................................................. 151 Iowa .................................................................................................................................. 152
© 2017 National Association of Insurance Commissioners
Kansas ............................................................................................................................. 153 Kentucky ........................................................................................................................... 154 Louisiana ........................................................................................................................... 155 Maine ................................................................................................................................ 156 Maryland ........................................................................................................................... 157 Massachusetts .................................................................................................................... 158 Michigan ........................................................................................................................... 159 Minnesota .......................................................................................................................... 160 Mississippi ........................................................................................................................ 161 Missouri ............................................................................................................................ 162 Montana ............................................................................................................................ 163 Nebraska ........................................................................................................................... 164 Nevada .............................................................................................................................. 165 New Hampshire ................................................................................................................. 166 New Jersey ........................................................................................................................ 167 New Mexico ...................................................................................................................... 168 New York ......................................................................................................................... 169 North Carolina ................................................................................................................... 170 North Dakota ..................................................................................................................... 171 Ohio .................................................................................................................................. 172 Oklahoma .......................................................................................................................... 173 Oregon .............................................................................................................................. 174 Pennsylvania ..................................................................................................................... 175 Rhode Island ..................................................................................................................... 176 South Carolina ................................................................................................................... 177 South Dakota ..................................................................................................................... 178 Tennessee .......................................................................................................................... 179 Texas ................................................................................................................................ 180 Utah .................................................................................................................................. 181 Vermont ............................................................................................................................ 182 Virginia ............................................................................................................................. 183 Washington ....................................................................................................................... 184 West Virginia .................................................................................................................... 185 Wisconsin ......................................................................................................................... 186 Wyoming .......................................................................................................................... 187 Guam ................................................................................................................................ 188 N. Mariana Islands ....................................................................................................................... 189 Puerto Rico........................................................................................................................ 190 U.S. Virgin Islands ............................................................................................................. 191
COMPANY INDEX ..................................................................................................................... 193 Sample Medicare Supplement Insurance Exhibit ............................................................................... 207
© 2017 National Association of Insurance Commissioners
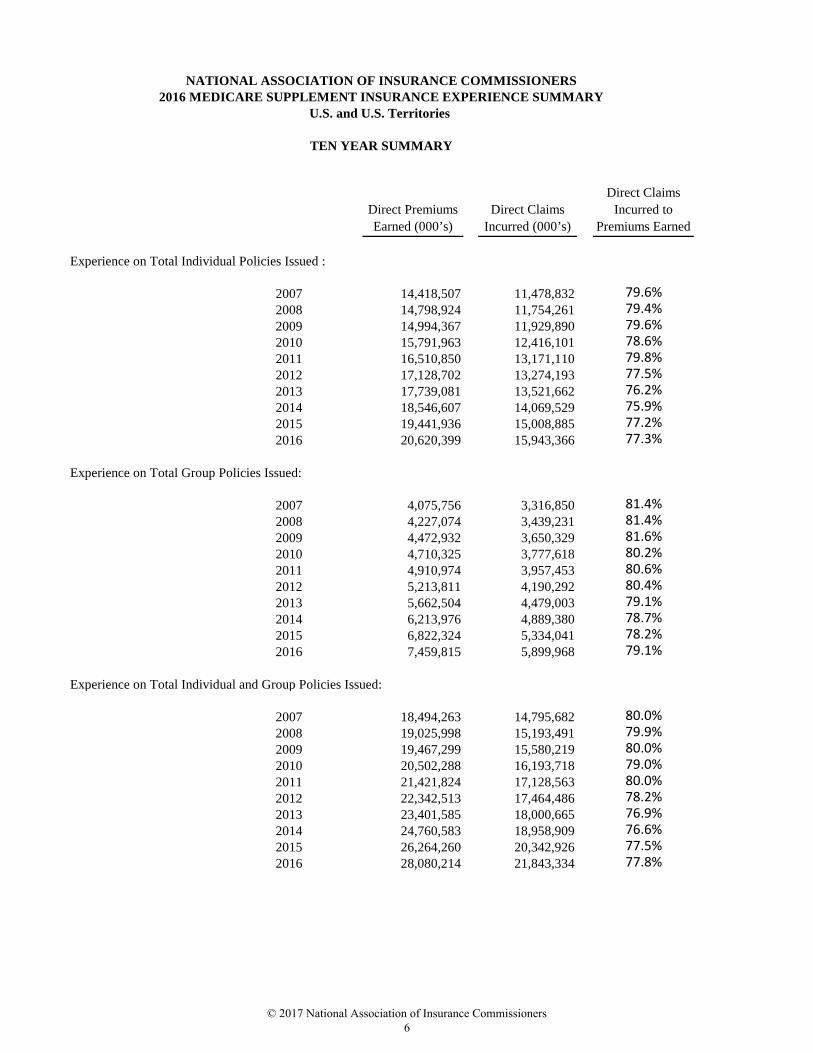
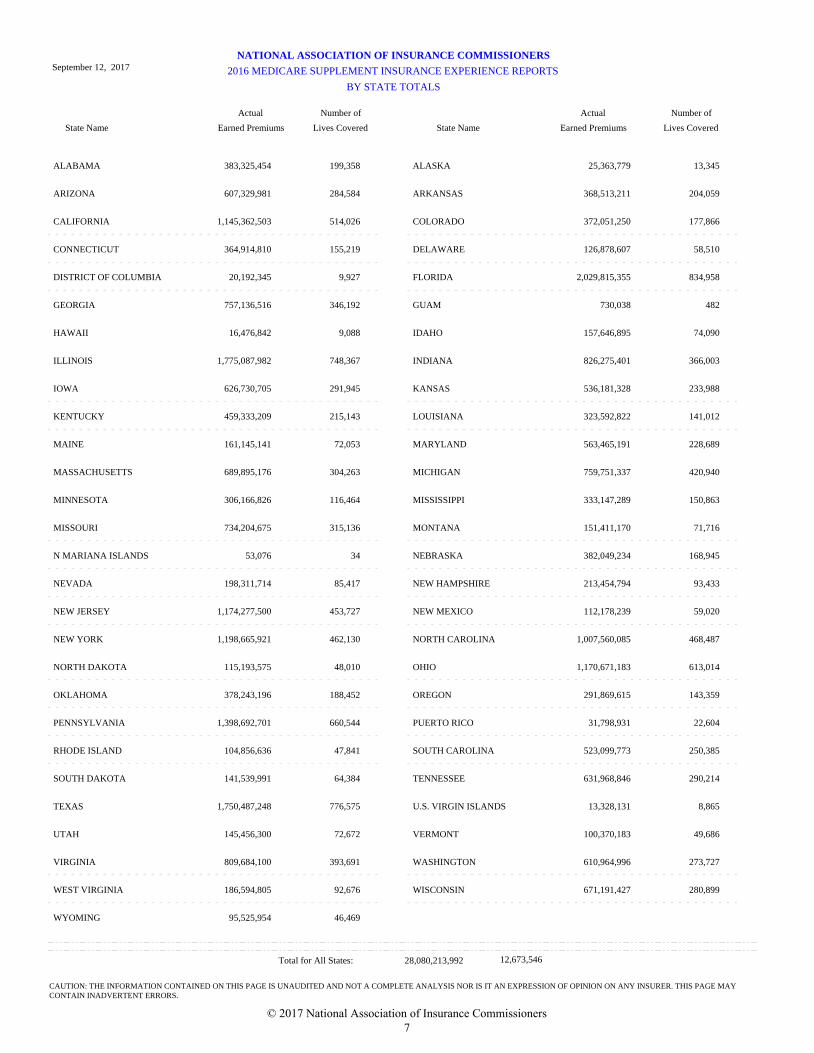
INTRODUCTION Included in this report are the 2016 loss ratios on Medicare supplement business as reported to the National Association of Insurance Commissioners (NAIC). Reporting of these loss ratios, on forms conforming to those developed by the NAIC, is required by the Medicare Catastrophic Coverage Act of 1988, Public Law 100-360. Although major provisions of the Catastrophic Coverage Act were repealed one year later, this reporting requirement was left intact. The data reported are utilized by state insurance departments to help evaluate insurers’ compliance with loss ratio standards for Medicare supplement policies. A copy of the experience exhibit, which is used to collect the data, is included. The filing deadline for the 2016 exhibit was March 1, 2017. This exhibit is submitted by companies filing the life/health, property/casualty, health and fraternal annual statement blanks. This report shows direct premiums earned, market share, direct claims incurred, loss ratios, and number of covered lives on a countrywide basis for 3,960 filings by 305 insurers filing Medicare Supplement Insurance Experience Exhibits with the NAIC. The report lists companies in descending order of direct premiums earned and in alphabetical order by name. The report also shows insurers’ experience separately for: 1) individual policies issued through 2013; 2) individual policies issued in 2014, 2015, and 2016; 3) total individual policies; 4) group policies issued through 2013; 5) group policies issued in 2014, 2015, and 2016; 6) total group policies; and 7) total individual and group policies. Also included at the beginning of the report is a table presenting aggregated data for all companies reporting. Insurers reported total direct premiums earned in 2016 of $28.1 billion, with direct claims incurred of $21.8 billion for all Medicare supplement policies. This resulted in a 77.8% loss ratio. A second table presents a 10-year summary of totals for the years 2007 through 2016. This table reflects the numbers reported in prior-year Medicare Supplement Loss Ratio Reports. Because companies report this data on a year-to-year basis, there might be some differences between the current-year data and historical data. The majority of the Medicare supplement insurance market is written through individual policies. Total direct premiums earned for individual policies were $20.6 billion, with direct claims incurred of $15.9 billion in 2016. This resulted in a 77.3% loss ratio. The loss ratio for individual policies issued through 2013 was slightly lower, at 75.7%. The loss ratio for individual policies issued in 2014, 2015, and 2016 was higher, at 81.0%. Total direct premiums earned for all group policies in 2016 were $7.5 billion, with total direct claims incurred of $5.9 billion, resulting in a 79.1% loss ratio. The loss ratio for group policies issued through 2013 was slightly higher, at 79.2%, whereas the loss ratio for group policies issued in 2014, 2015, and 2016 was slightly lower, at 78.8%. Beginning with the 1994 filings, companies are to report the number of covered lives for each policy form. Total covered lives reported in 2016 for individual and group policies was 12.7 million. In the event that a company has exited this business or was unable to provide the number of covered lives, zeros appear.
© 2017 National Association of Insurance Commissioners 1
A market share report containing the top 10 companies by direct premiums earned doing business in each state is included in this publication. A map and report with number of covered lives by state is included in the Summary section. The Company Index includes all 305 insurers, summary totals for each company’s premiums and number of covered lives for those years prior to 2013, and a summary total for premiums and number of covered lives for the years 2014, 2015, and 2016.
Qualifications The accuracy of the reports included in this publication is dependent on the accuracy of the information contained in the exhibits filed by insurers. Even though the data elements used to prepare the reports are extracted from exhibits filed with the NAIC, the NAIC cannot verify or guarantee their accuracy. While the NAIC exercises a great deal of care in capturing data from these exhibits and producing these reports, as with any statistical project of a significant magnitude, errors can occur. Consequently, the NAIC makes no representations or warranties with respect to the accuracy of the data and statistics in this report.
Please send any questions regarding this report to [email protected]. Links to this report and other NAIC reports can be found on the NAIC website at: NAIC Publications.
© 2017 National Association of Insurance Commissioners 2
MEDICARE SUPPLEMENT INSURANCE EXPERIENCE SUMMARY
© 2017 National Association of Insurance Commissioners 3

© 2017 National Association of Insurance Commissioners 4
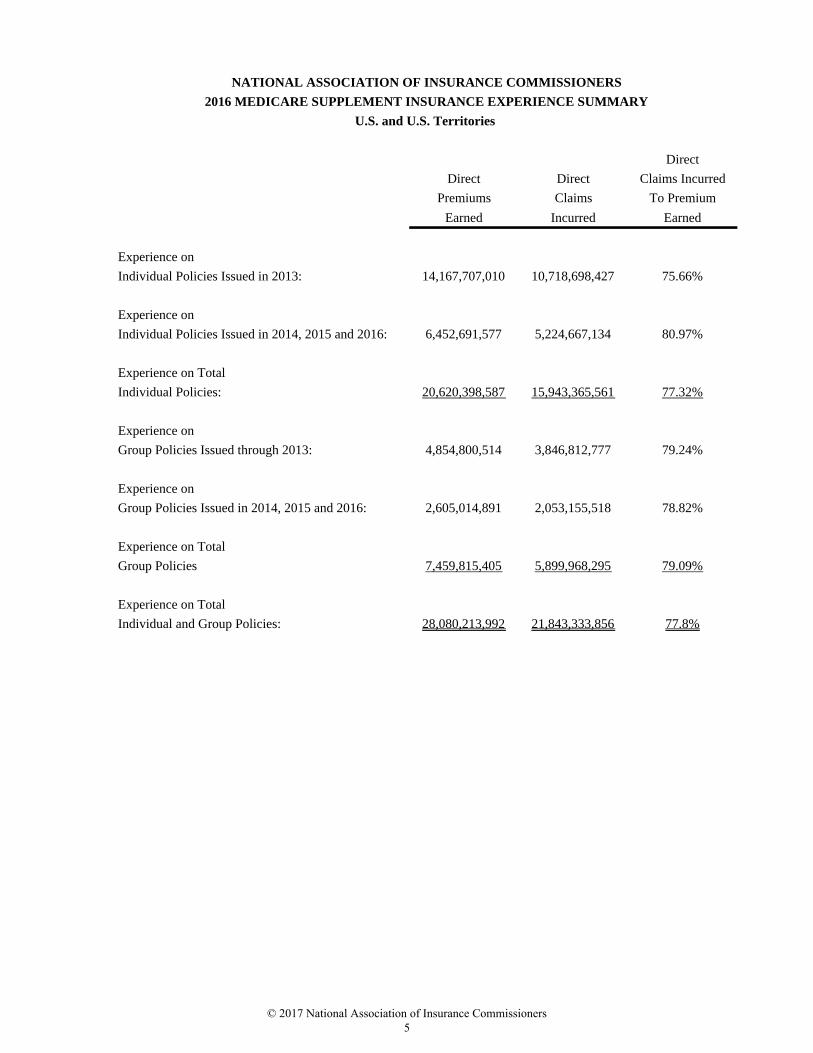
NATIONAL ASSOCIATION OF INSURANCE COMMISSIONERS
2016 MEDICARE SUPPLEMENT INSURANCE EXPERIENCE SUMMARY
U.S. and U.S. Territories
Direct
Direct Direct Claims Incurred
Premiums Claims To Premium
Earned Incurred Earned
Experience on
Individual Policies Issued in 2013: 14,167,707,010 10,718,698,427 75.66%
Experience on
Individual Policies Issued in 2014, 2015 and 2016: 6,452,691,577 5,224,667,134 80.97%
Experience on Total
Individual Policies: 20,620,398,587 15,943,365,561 77.32%
Experience on
Group Policies Issued through 2013: 4,854,800,514 3,846,812,777 79.24%
Experience on
Group Policies Issued in 2014, 2015 and 2016: 2,605,014,891 2,053,155,518 78.82%
Experience on Total
Group Policies 7,459,815,405 5,899,968,295 79.09%
Experience on Total
Individual and Group Policies: 28,080,213,992 21,843,333,856 77.8%
© 2017 National Association of Insurance Commissioners 5
NATIONAL ASSOCIATION OF INSURANCE COMMISSIONERS2016 MEDICARE SUPPLEMENT INSURANCE EXPERIENCE SUMMARY
U.S. and U.S. Territories
TEN YEAR SUMMARY
Direct Premiums Earned (000’s)
Direct Claims Incurred (000’s)
Direct Claims Incurred to
Premiums Earned
Experience on Total Individual Policies Issued :
2007 14,418,507 11,478,832 79.6%2008 14,798,924 11,754,261 79.4%2009 14,994,367 11,929,890 79.6%2010 15,791,963 12,416,101 78.6%2011 16,510,850 13,171,110 79.8%2012 17,128,702 13,274,193 77.5%2013 17,739,081 13,521,662 76.2%2014 18,546,607 14,069,529 75.9%2015 19,441,936 15,008,885 77.2%2016 20,620,399 15,943,366 77.3%
Experience on Total Group Policies Issued:
2007 4,075,756 3,316,850 81.4%2008 4,227,074 3,439,231 81.4%2009 4,472,932 3,650,329 81.6%2010 4,710,325 3,777,618 80.2%2011 4,910,974 3,957,453 80.6%2012 5,213,811 4,190,292 80.4%2013 5,662,504 4,479,003 79.1%2014 6,213,976 4,889,380 78.7%2015 6,822,324 5,334,041 78.2%2016 7,459,815 5,899,968 79.1%
Experience on Total Individual and Group Policies Issued:
2007 18,494,263 14,795,682 80.0%2008 19,025,998 15,193,491 79.9%2009 19,467,299 15,580,219 80.0%2010 20,502,288 16,193,718 79.0%2011 21,421,824 17,128,563 80.0%2012 22,342,513 17,464,486 78.2%2013 23,401,585 18,000,665 76.9%2014 24,760,583 18,958,909 76.6%2015 26,264,260 20,342,926 77.5%2016 28,080,214 21,843,334 77.8%
© 2017 National Association of Insurance Commissioners 6
State Name
NATIONAL ASSOCIATION OF INSURANCE COMMISSIONERS
2016 MEDICARE SUPPLEMENT INSURANCE EXPERIENCE REPORTS
BY STATE TOTALS
Actual
Earned Premiums
Number of
Lives CoveredState Name
Actual
Earned Premiums
Number of
Lives Covered
September 12, 2017
383,325,454 199,358ALABAMA 25,363,779 13,345ALASKA
607,329,981 284,584ARIZONA 368,513,211 204,059ARKANSAS
1,145,362,503 514,026CALIFORNIA 372,051,250 177,866COLORADO
364,914,810 155,219CONNECTICUT 126,878,607 58,510DELAWARE
20,192,345 9,927DISTRICT OF COLUMBIA 2,029,815,355 834,958FLORIDA
757,136,516 346,192GEORGIA 730,038 482GUAM
16,476,842 9,088HAWAII 157,646,895 74,090IDAHO
1,775,087,982 748,367ILLINOIS 826,275,401 366,003INDIANA
626,730,705 291,945IOWA 536,181,328 233,988KANSAS
459,333,209 215,143KENTUCKY 323,592,822 141,012LOUISIANA
161,145,141 72,053MAINE 563,465,191 228,689MARYLAND
689,895,176 304,263MASSACHUSETTS 759,751,337 420,940MICHIGAN
306,166,826 116,464MINNESOTA 333,147,289 150,863MISSISSIPPI
734,204,675 315,136MISSOURI 151,411,170 71,716MONTANA
53,076 34N MARIANA ISLANDS 382,049,234 168,945NEBRASKA
198,311,714 85,417NEVADA 213,454,794 93,433NEW HAMPSHIRE
1,174,277,500 453,727NEW JERSEY 112,178,239 59,020NEW MEXICO
1,198,665,921 462,130NEW YORK 1,007,560,085 468,487NORTH CAROLINA
115,193,575 48,010NORTH DAKOTA 1,170,671,183 613,014OHIO
378,243,196 188,452OKLAHOMA 291,869,615 143,359OREGON
1,398,692,701 660,544PENNSYLVANIA 31,798,931 22,604PUERTO RICO
104,856,636 47,841RHODE ISLAND 523,099,773 250,385SOUTH CAROLINA
141,539,991 64,384SOUTH DAKOTA 631,968,846 290,214TENNESSEE
1,750,487,248 776,575TEXAS 13,328,131 8,865U.S. VIRGIN ISLANDS
145,456,300 72,672UTAH 100,370,183 49,686VERMONT
809,684,100 393,691VIRGINIA 610,964,996 273,727WASHINGTON
186,594,805 92,676WEST VIRGINIA 671,191,427 280,899WISCONSIN
95,525,954 46,469WYOMING
28,080,213,992Total for All States: 12,673,546
CAUTION: THE INFORMATION CONTAINED ON THIS PAGE IS UNAUDITED AND NOT A COMPLETE ANALYSIS NOR IS IT AN EXPRESSION OF OPINION ON ANY INSURER. THIS PAGE MAY
CONTAIN INADVERTENT ERRORS.
© 2017 National Association of Insurance Commissioners 7

© 2017 National Association of Insurance Commissioners 8
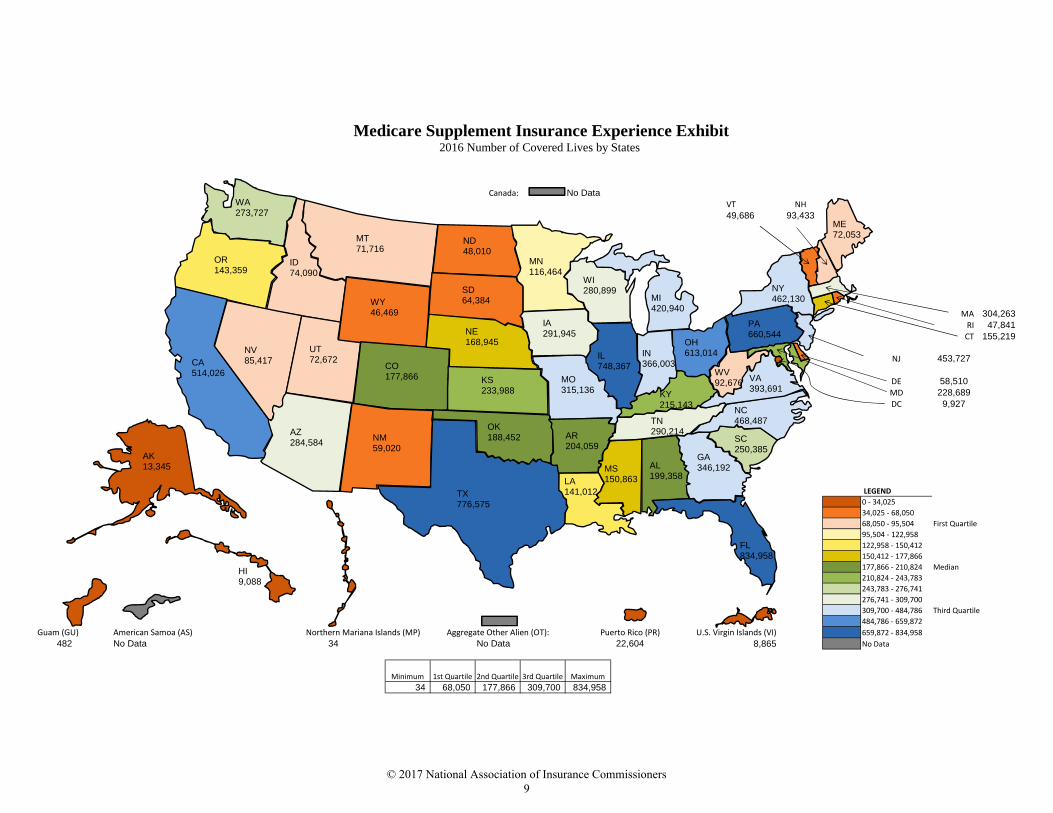
Medicare Supplement Insurance Experience Exhibit2016 Number of Covered Lives by States
Canada: No DataVT NH49,686 93,433
MA 304,263RI 47,841CT 155,219
NJ 453,727
DE 58,510MD 228,689DC 9,927
LEGEND0 ‐ 34,02534,025 ‐ 68,05068,050 ‐ 95,504 First Quartile95,504 ‐ 122,958122,958 ‐ 150,412150,412 ‐ 177,866177,866 ‐ 210,824 Median210,824 ‐ 243,783243,783 ‐ 276,741276,741 ‐ 309,700309,700 ‐ 484,786 Third Quartile484,786 ‐ 659,872
Guam (GU) American Samoa (AS) Northern Mariana Islands (MP) Aggregate Other Alien (OT): Puerto Rico (PR) U.S. Virgin Islands (VI) 659,872 ‐ 834,958482 No Data 34 No Data 22,604 8,865 No Data
Minimum 1st Quartile 2nd Quartile 3rd Quartile Maximum34 68,050 177,866 309,700 834,958
WA273,727
OR143,359
ID74,090
MT71,716
CA514,026
NV85,417
UT72,672
WY46,469
ND48,010
SD64,384
MN116,464
AZ284,584
CO177,866
NM59,020
TX776,575
OK188,452
KS233,988
NE168,945
MO315,136
AR204,059
LA141,012
MS150,863
AL199,358
FL834,958
GA346,192
SC250,385
NC468,487TN
290,214
KY215,143
IL748,367
IA291,945
WI280,899
MI420,940
IN366,003
OH613,014
WV92,676 VA
393,691
PA660,544
ME72,053
NY462,130
HI9,088
AK13,345
© 2017 National Association of Insurance Commissioners 9

© 2017 National Association of Insurance Commissioners 10
INDIVIDUAL POLICIES ISSUED THROUGH 2013
BY DIRECT PREMIUMS EARNED
© 2017 National Association of Insurance Commissioners 11

© 2017 National Association of Insurance Commissioners 12
NATIONAL ASSOCIATION OF INSURANCE COMMISSIONERS
MEDICARE SUPPLEMENT INSURANCE EXPERIENCE REPORTS
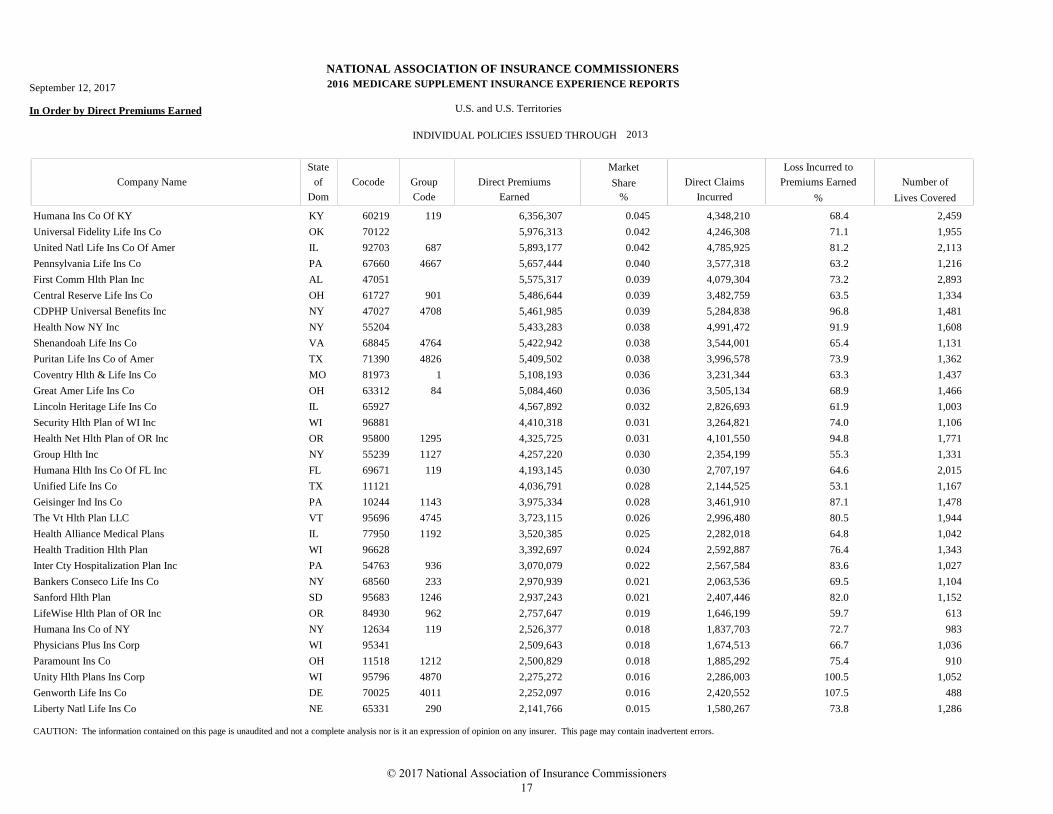
In Order by Direct Premiums Earned U.S. and U.S. Territories
INDIVIDUAL POLICIES ISSUED THROUGH
Market
Direct Claims
Incurred
Loss Incurred to
Premiums Earned Number of
Lives Covered
Direct Premiums
Earned
Company Name
State
Dom
Cocode Group
Code
of Share
% %
September 12, 2017 2016
2013
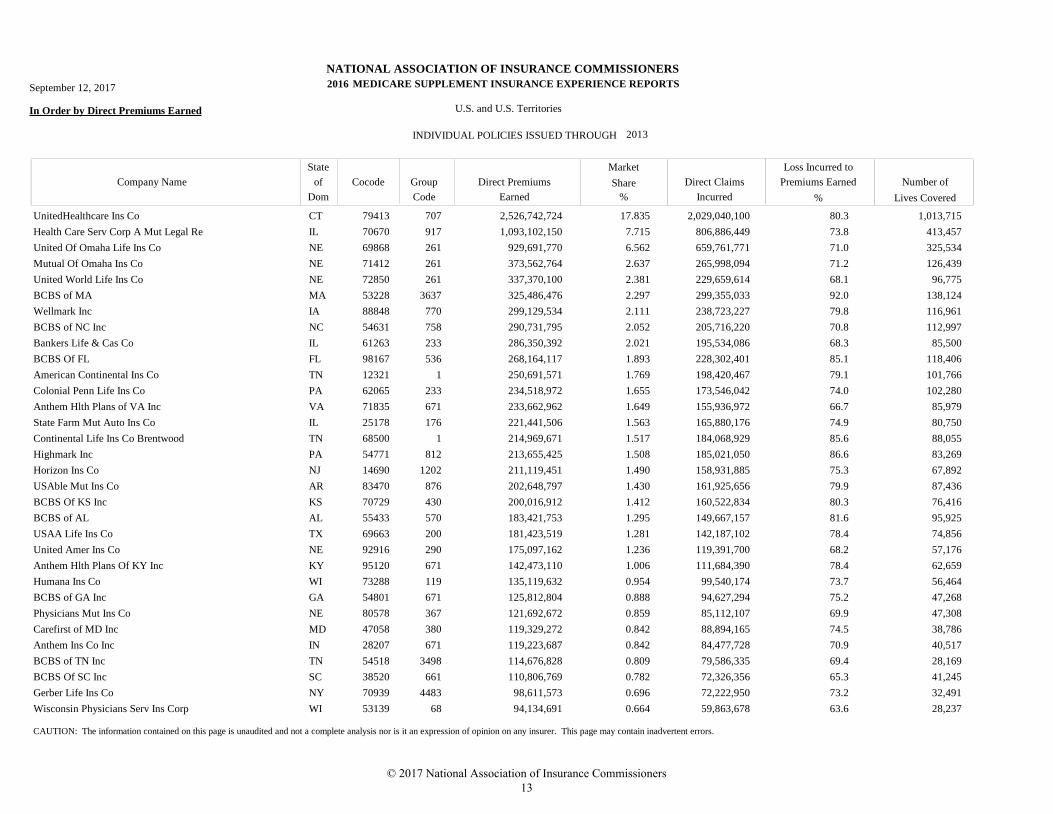
UnitedHealthcare Ins Co CT 79413 707 2,526,742,724 2,029,040,100 1,013,71517.835 80.3
Health Care Serv Corp A Mut Legal Re IL 70670 917 1,093,102,150 806,886,449 413,4577.715 73.8
United Of Omaha Life Ins Co NE 69868 261 929,691,770 659,761,771 325,5346.562 71.0
Mutual Of Omaha Ins Co NE 71412 261 373,562,764 265,998,094 126,4392.637 71.2
United World Life Ins Co NE 72850 261 337,370,100 229,659,614 96,7752.381 68.1
BCBS of MA MA 53228 3637 325,486,476 299,355,033 138,1242.297 92.0
Wellmark Inc IA 88848 770 299,129,534 238,723,227 116,9612.111 79.8
BCBS of NC Inc NC 54631 758 290,731,795 205,716,220 112,9972.052 70.8
Bankers Life & Cas Co IL 61263 233 286,350,392 195,534,086 85,5002.021 68.3
BCBS Of FL FL 98167 536 268,164,117 228,302,401 118,4061.893 85.1
American Continental Ins Co TN 12321 1 250,691,571 198,420,467 101,7661.769 79.1
Colonial Penn Life Ins Co PA 62065 233 234,518,972 173,546,042 102,2801.655 74.0
Anthem Hlth Plans of VA Inc VA 71835 671 233,662,962 155,936,972 85,9791.649 66.7
State Farm Mut Auto Ins Co IL 25178 176 221,441,506 165,880,176 80,7501.563 74.9
Continental Life Ins Co Brentwood TN 68500 1 214,969,671 184,068,929 88,0551.517 85.6
Highmark Inc PA 54771 812 213,655,425 185,021,050 83,2691.508 86.6
Horizon Ins Co NJ 14690 1202 211,119,451 158,931,885 67,8921.490 75.3
USAble Mut Ins Co AR 83470 876 202,648,797 161,925,656 87,4361.430 79.9
BCBS Of KS Inc KS 70729 430 200,016,912 160,522,834 76,4161.412 80.3
BCBS of AL AL 55433 570 183,421,753 149,667,157 95,9251.295 81.6
USAA Life Ins Co TX 69663 200 181,423,519 142,187,102 74,8561.281 78.4
United Amer Ins Co NE 92916 290 175,097,162 119,391,700 57,1761.236 68.2
Anthem Hlth Plans Of KY Inc KY 95120 671 142,473,110 111,684,390 62,6591.006 78.4
Humana Ins Co WI 73288 119 135,119,632 99,540,174 56,4640.954 73.7
BCBS of GA Inc GA 54801 671 125,812,804 94,627,294 47,2680.888 75.2
Physicians Mut Ins Co NE 80578 367 121,692,672 85,112,107 47,3080.859 69.9
Carefirst of MD Inc MD 47058 380 119,329,272 88,894,165 38,7860.842 74.5
Anthem Ins Co Inc IN 28207 671 119,223,687 84,477,728 40,5170.842 70.9
BCBS of TN Inc TN 54518 3498 114,676,828 79,586,335 28,1690.809 69.4
BCBS Of SC Inc SC 38520 661 110,806,769 72,326,356 41,2450.782 65.3
Gerber Life Ins Co NY 70939 4483 98,611,573 72,222,950 32,4910.696 73.2
Wisconsin Physicians Serv Ins Corp WI 53139 68 94,134,691 59,863,678 28,2370.664 63.6
CAUTION: The information contained on this page is unaudited and not a complete analysis nor is it an expression of opinion on any insurer. This page may contain inadvertent errors.
© 2017 National Association of Insurance Commissioners 13
NATIONAL ASSOCIATION OF INSURANCE COMMISSIONERS
MEDICARE SUPPLEMENT INSURANCE EXPERIENCE REPORTS
In Order by Direct Premiums Earned U.S. and U.S. Territories
INDIVIDUAL POLICIES ISSUED THROUGH
Market
Direct Claims
Incurred
Loss Incurred to
Premiums Earned Number of
Lives Covered
Direct Premiums
Earned
Company Name
State
Dom
Cocode Group
Code
of Share
% %
September 12, 2017 2016
2013
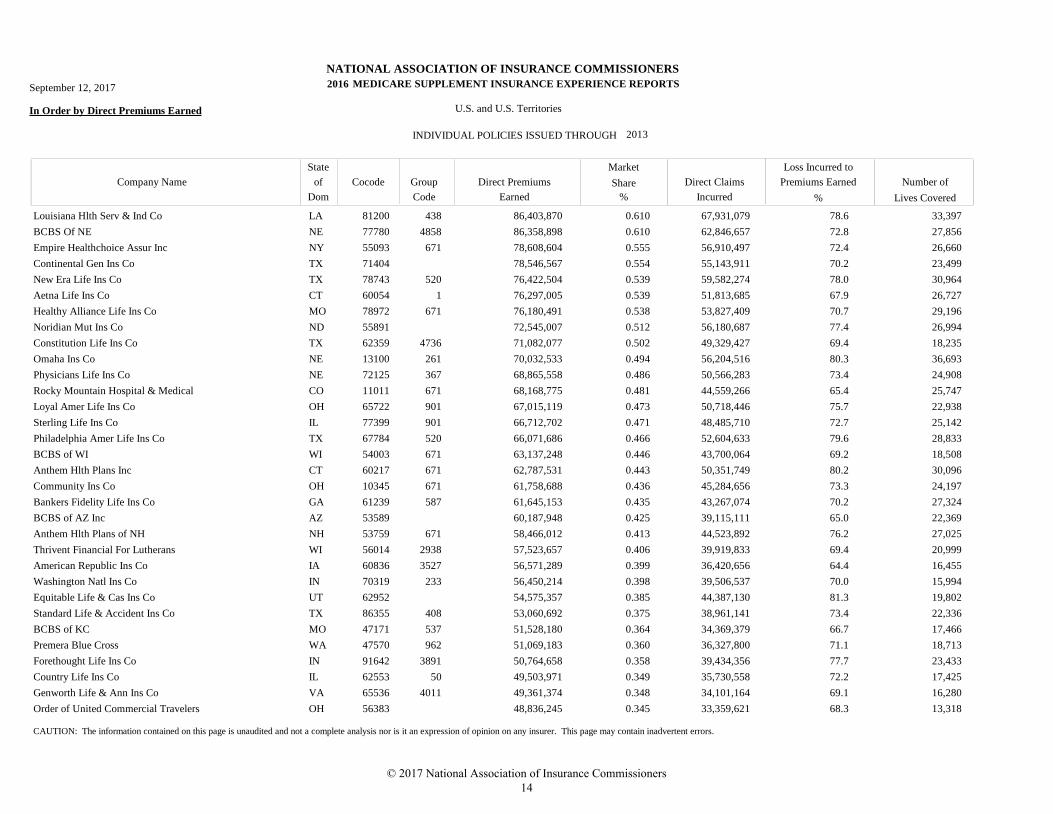
Louisiana Hlth Serv & Ind Co LA 81200 438 86,403,870 67,931,079 33,3970.610 78.6
BCBS Of NE NE 77780 4858 86,358,898 62,846,657 27,8560.610 72.8
Empire Healthchoice Assur Inc NY 55093 671 78,608,604 56,910,497 26,6600.555 72.4
Continental Gen Ins Co TX 71404 78,546,567 55,143,911 23,4990.554 70.2
New Era Life Ins Co TX 78743 520 76,422,504 59,582,274 30,9640.539 78.0
Aetna Life Ins Co CT 60054 1 76,297,005 51,813,685 26,7270.539 67.9
Healthy Alliance Life Ins Co MO 78972 671 76,180,491 53,827,409 29,1960.538 70.7
Noridian Mut Ins Co ND 55891 72,545,007 56,180,687 26,9940.512 77.4
Constitution Life Ins Co TX 62359 4736 71,082,077 49,329,427 18,2350.502 69.4
Omaha Ins Co NE 13100 261 70,032,533 56,204,516 36,6930.494 80.3
Physicians Life Ins Co NE 72125 367 68,865,558 50,566,283 24,9080.486 73.4
Rocky Mountain Hospital & Medical CO 11011 671 68,168,775 44,559,266 25,7470.481 65.4
Loyal Amer Life Ins Co OH 65722 901 67,015,119 50,718,446 22,9380.473 75.7
Sterling Life Ins Co IL 77399 901 66,712,702 48,485,710 25,1420.471 72.7
Philadelphia Amer Life Ins Co TX 67784 520 66,071,686 52,604,633 28,8330.466 79.6
BCBS of WI WI 54003 671 63,137,248 43,700,064 18,5080.446 69.2
Anthem Hlth Plans Inc CT 60217 671 62,787,531 50,351,749 30,0960.443 80.2
Community Ins Co OH 10345 671 61,758,688 45,284,656 24,1970.436 73.3
Bankers Fidelity Life Ins Co GA 61239 587 61,645,153 43,267,074 27,3240.435 70.2
BCBS of AZ Inc AZ 53589 60,187,948 39,115,111 22,3690.425 65.0
Anthem Hlth Plans of NH NH 53759 671 58,466,012 44,523,892 27,0250.413 76.2
Thrivent Financial For Lutherans WI 56014 2938 57,523,657 39,919,833 20,9990.406 69.4
American Republic Ins Co IA 60836 3527 56,571,289 36,420,656 16,4550.399 64.4
Washington Natl Ins Co IN 70319 233 56,450,214 39,506,537 15,9940.398 70.0
Equitable Life & Cas Ins Co UT 62952 54,575,357 44,387,130 19,8020.385 81.3
Standard Life & Accident Ins Co TX 86355 408 53,060,692 38,961,141 22,3360.375 73.4
BCBS of KC MO 47171 537 51,528,180 34,369,379 17,4660.364 66.7
Premera Blue Cross WA 47570 962 51,069,183 36,327,800 18,7130.360 71.1
Forethought Life Ins Co IN 91642 3891 50,764,658 39,434,356 23,4330.358 77.7
Country Life Ins Co IL 62553 50 49,503,971 35,730,558 17,4250.349 72.2
Genworth Life & Ann Ins Co VA 65536 4011 49,361,374 34,101,164 16,2800.348 69.1
Order of United Commercial Travelers OH 56383 48,836,245 33,359,621 13,3180.345 68.3
CAUTION: The information contained on this page is unaudited and not a complete analysis nor is it an expression of opinion on any insurer. This page may contain inadvertent errors.
© 2017 National Association of Insurance Commissioners 14
NATIONAL ASSOCIATION OF INSURANCE COMMISSIONERS
MEDICARE SUPPLEMENT INSURANCE EXPERIENCE REPORTS
In Order by Direct Premiums Earned U.S. and U.S. Territories
INDIVIDUAL POLICIES ISSUED THROUGH
Market
Direct Claims
Incurred
Loss Incurred to
Premiums Earned Number of
Lives Covered
Direct Premiums
Earned
Company Name
State
Dom
Cocode Group
Code
of Share
% %
September 12, 2017 2016
2013
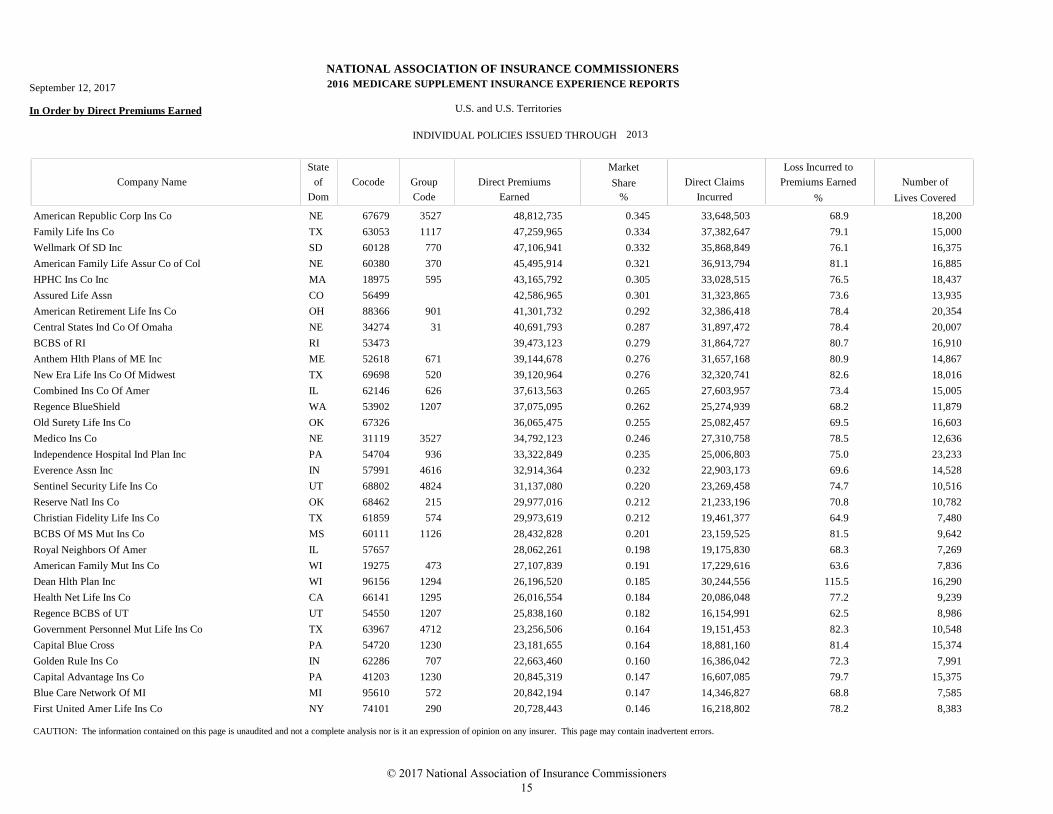
American Republic Corp Ins Co NE 67679 3527 48,812,735 33,648,503 18,2000.345 68.9
Family Life Ins Co TX 63053 1117 47,259,965 37,382,647 15,0000.334 79.1
Wellmark Of SD Inc SD 60128 770 47,106,941 35,868,849 16,3750.332 76.1
American Family Life Assur Co of Col NE 60380 370 45,495,914 36,913,794 16,8850.321 81.1
HPHC Ins Co Inc MA 18975 595 43,165,792 33,028,515 18,4370.305 76.5
Assured Life Assn CO 56499 42,586,965 31,323,865 13,9350.301 73.6
American Retirement Life Ins Co OH 88366 901 41,301,732 32,386,418 20,3540.292 78.4
Central States Ind Co Of Omaha NE 34274 31 40,691,793 31,897,472 20,0070.287 78.4
BCBS of RI RI 53473 39,473,123 31,864,727 16,9100.279 80.7
Anthem Hlth Plans of ME Inc ME 52618 671 39,144,678 31,657,168 14,8670.276 80.9
New Era Life Ins Co Of Midwest TX 69698 520 39,120,964 32,320,741 18,0160.276 82.6
Combined Ins Co Of Amer IL 62146 626 37,613,563 27,603,957 15,0050.265 73.4
Regence BlueShield WA 53902 1207 37,075,095 25,274,939 11,8790.262 68.2
Old Surety Life Ins Co OK 67326 36,065,475 25,082,457 16,6030.255 69.5
Medico Ins Co NE 31119 3527 34,792,123 27,310,758 12,6360.246 78.5
Independence Hospital Ind Plan Inc PA 54704 936 33,322,849 25,006,803 23,2330.235 75.0
Everence Assn Inc IN 57991 4616 32,914,364 22,903,173 14,5280.232 69.6
Sentinel Security Life Ins Co UT 68802 4824 31,137,080 23,269,458 10,5160.220 74.7
Reserve Natl Ins Co OK 68462 215 29,977,016 21,233,196 10,7820.212 70.8
Christian Fidelity Life Ins Co TX 61859 574 29,973,619 19,461,377 7,4800.212 64.9
BCBS Of MS Mut Ins Co MS 60111 1126 28,432,828 23,159,525 9,6420.201 81.5
Royal Neighbors Of Amer IL 57657 28,062,261 19,175,830 7,2690.198 68.3
American Family Mut Ins Co WI 19275 473 27,107,839 17,229,616 7,8360.191 63.6
Dean Hlth Plan Inc WI 96156 1294 26,196,520 30,244,556 16,2900.185 115.5
Health Net Life Ins Co CA 66141 1295 26,016,554 20,086,048 9,2390.184 77.2
Regence BCBS of UT UT 54550 1207 25,838,160 16,154,991 8,9860.182 62.5
Government Personnel Mut Life Ins Co TX 63967 4712 23,256,506 19,151,453 10,5480.164 82.3
Capital Blue Cross PA 54720 1230 23,181,655 18,881,160 15,3740.164 81.4
Golden Rule Ins Co IN 62286 707 22,663,460 16,386,042 7,9910.160 72.3
Capital Advantage Ins Co PA 41203 1230 20,845,319 16,607,085 15,3750.147 79.7
Blue Care Network Of MI MI 95610 572 20,842,194 14,346,827 7,5850.147 68.8
First United Amer Life Ins Co NY 74101 290 20,728,443 16,218,802 8,3830.146 78.2
CAUTION: The information contained on this page is unaudited and not a complete analysis nor is it an expression of opinion on any insurer. This page may contain inadvertent errors.
© 2017 National Association of Insurance Commissioners 15
NATIONAL ASSOCIATION OF INSURANCE COMMISSIONERS
MEDICARE SUPPLEMENT INSURANCE EXPERIENCE REPORTS
In Order by Direct Premiums Earned U.S. and U.S. Territories
INDIVIDUAL POLICIES ISSUED THROUGH
Market
Direct Claims
Incurred
Loss Incurred to
Premiums Earned Number of
Lives Covered
Direct Premiums
Earned
Company Name
State
Dom
Cocode Group
Code
of Share
% %
September 12, 2017 2016
2013
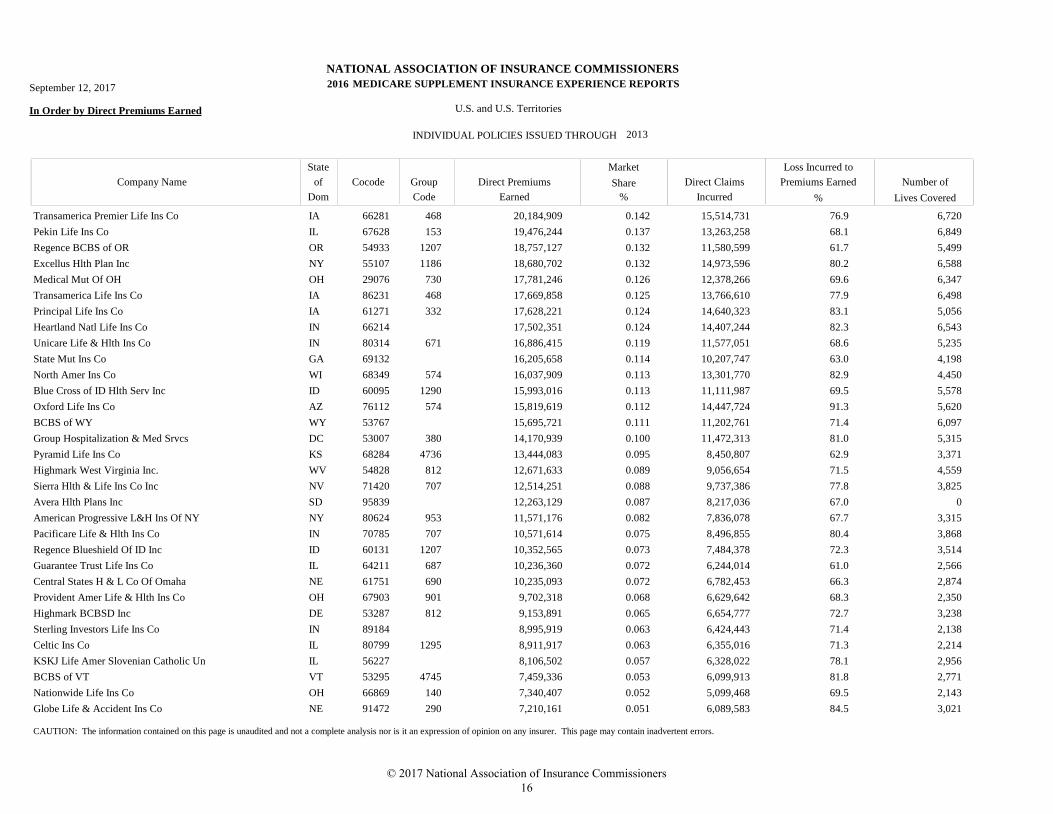
Transamerica Premier Life Ins Co IA 66281 468 20,184,909 15,514,731 6,7200.142 76.9
Pekin Life Ins Co IL 67628 153 19,476,244 13,263,258 6,8490.137 68.1
Regence BCBS of OR OR 54933 1207 18,757,127 11,580,599 5,4990.132 61.7
Excellus Hlth Plan Inc NY 55107 1186 18,680,702 14,973,596 6,5880.132 80.2
Medical Mut Of OH OH 29076 730 17,781,246 12,378,266 6,3470.126 69.6
Transamerica Life Ins Co IA 86231 468 17,669,858 13,766,610 6,4980.125 77.9
Principal Life Ins Co IA 61271 332 17,628,221 14,640,323 5,0560.124 83.1
Heartland Natl Life Ins Co IN 66214 17,502,351 14,407,244 6,5430.124 82.3
Unicare Life & Hlth Ins Co IN 80314 671 16,886,415 11,577,051 5,2350.119 68.6
State Mut Ins Co GA 69132 16,205,658 10,207,747 4,1980.114 63.0
North Amer Ins Co WI 68349 574 16,037,909 13,301,770 4,4500.113 82.9
Blue Cross of ID Hlth Serv Inc ID 60095 1290 15,993,016 11,111,987 5,5780.113 69.5
Oxford Life Ins Co AZ 76112 574 15,819,619 14,447,724 5,6200.112 91.3
BCBS of WY WY 53767 15,695,721 11,202,761 6,0970.111 71.4
Group Hospitalization & Med Srvcs DC 53007 380 14,170,939 11,472,313 5,3150.100 81.0
Pyramid Life Ins Co KS 68284 4736 13,444,083 8,450,807 3,3710.095 62.9
Highmark West Virginia Inc. WV 54828 812 12,671,633 9,056,654 4,5590.089 71.5
Sierra Hlth & Life Ins Co Inc NV 71420 707 12,514,251 9,737,386 3,8250.088 77.8
Avera Hlth Plans Inc SD 95839 12,263,129 8,217,036 00.087 67.0
American Progressive L&H Ins Of NY NY 80624 953 11,571,176 7,836,078 3,3150.082 67.7
Pacificare Life & Hlth Ins Co IN 70785 707 10,571,614 8,496,855 3,8680.075 80.4
Regence Blueshield Of ID Inc ID 60131 1207 10,352,565 7,484,378 3,5140.073 72.3
Guarantee Trust Life Ins Co IL 64211 687 10,236,360 6,244,014 2,5660.072 61.0
Central States H & L Co Of Omaha NE 61751 690 10,235,093 6,782,453 2,8740.072 66.3
Provident Amer Life & Hlth Ins Co OH 67903 901 9,702,318 6,629,642 2,3500.068 68.3
Highmark BCBSD Inc DE 53287 812 9,153,891 6,654,777 3,2380.065 72.7
Sterling Investors Life Ins Co IN 89184 8,995,919 6,424,443 2,1380.063 71.4
Celtic Ins Co IL 80799 1295 8,911,917 6,355,016 2,2140.063 71.3
KSKJ Life Amer Slovenian Catholic Un IL 56227 8,106,502 6,328,022 2,9560.057 78.1
BCBS of VT VT 53295 4745 7,459,336 6,099,913 2,7710.053 81.8
Nationwide Life Ins Co OH 66869 140 7,340,407 5,099,468 2,1430.052 69.5
Globe Life & Accident Ins Co NE 91472 290 7,210,161 6,089,583 3,0210.051 84.5
CAUTION: The information contained on this page is unaudited and not a complete analysis nor is it an expression of opinion on any insurer. This page may contain inadvertent errors.
© 2017 National Association of Insurance Commissioners 16
NATIONAL ASSOCIATION OF INSURANCE COMMISSIONERS
MEDICARE SUPPLEMENT INSURANCE EXPERIENCE REPORTS
In Order by Direct Premiums Earned U.S. and U.S. Territories
INDIVIDUAL POLICIES ISSUED THROUGH
Market
Direct Claims
Incurred
Loss Incurred to
Premiums Earned Number of
Lives Covered
Direct Premiums
Earned
Company Name
State
Dom
Cocode Group
Code
of Share
% %
September 12, 2017 2016
2013
Humana Ins Co Of KY KY 60219 119 6,356,307 4,348,210 2,4590.045 68.4
Universal Fidelity Life Ins Co OK 70122 5,976,313 4,246,308 1,9550.042 71.1
United Natl Life Ins Co Of Amer IL 92703 687 5,893,177 4,785,925 2,1130.042 81.2
Pennsylvania Life Ins Co PA 67660 4667 5,657,444 3,577,318 1,2160.040 63.2
First Comm Hlth Plan Inc AL 47051 5,575,317 4,079,304 2,8930.039 73.2
Central Reserve Life Ins Co OH 61727 901 5,486,644 3,482,759 1,3340.039 63.5
CDPHP Universal Benefits Inc NY 47027 4708 5,461,985 5,284,838 1,4810.039 96.8
Health Now NY Inc NY 55204 5,433,283 4,991,472 1,6080.038 91.9
Shenandoah Life Ins Co VA 68845 4764 5,422,942 3,544,001 1,1310.038 65.4
Puritan Life Ins Co of Amer TX 71390 4826 5,409,502 3,996,578 1,3620.038 73.9
Coventry Hlth & Life Ins Co MO 81973 1 5,108,193 3,231,344 1,4370.036 63.3
Great Amer Life Ins Co OH 63312 84 5,084,460 3,505,134 1,4660.036 68.9
Lincoln Heritage Life Ins Co IL 65927 4,567,892 2,826,693 1,0030.032 61.9
Security Hlth Plan of WI Inc WI 96881 4,410,318 3,264,821 1,1060.031 74.0
Health Net Hlth Plan of OR Inc OR 95800 1295 4,325,725 4,101,550 1,7710.031 94.8
Group Hlth Inc NY 55239 1127 4,257,220 2,354,199 1,3310.030 55.3
Humana Hlth Ins Co Of FL Inc FL 69671 119 4,193,145 2,707,197 2,0150.030 64.6
Unified Life Ins Co TX 11121 4,036,791 2,144,525 1,1670.028 53.1
Geisinger Ind Ins Co PA 10244 1143 3,975,334 3,461,910 1,4780.028 87.1
The Vt Hlth Plan LLC VT 95696 4745 3,723,115 2,996,480 1,9440.026 80.5
Health Alliance Medical Plans IL 77950 1192 3,520,385 2,282,018 1,0420.025 64.8
Health Tradition Hlth Plan WI 96628 3,392,697 2,592,887 1,3430.024 76.4
Inter Cty Hospitalization Plan Inc PA 54763 936 3,070,079 2,567,584 1,0270.022 83.6
Bankers Conseco Life Ins Co NY 68560 233 2,970,939 2,063,536 1,1040.021 69.5
Sanford Hlth Plan SD 95683 1246 2,937,243 2,407,446 1,1520.021 82.0
LifeWise Hlth Plan of OR Inc OR 84930 962 2,757,647 1,646,199 6130.019 59.7
Humana Ins Co of NY NY 12634 119 2,526,377 1,837,703 9830.018 72.7
Physicians Plus Ins Corp WI 95341 2,509,643 1,674,513 1,0360.018 66.7
Paramount Ins Co OH 11518 1212 2,500,829 1,885,292 9100.018 75.4
Unity Hlth Plans Ins Corp WI 95796 4870 2,275,272 2,286,003 1,0520.016 100.5
Genworth Life Ins Co DE 70025 4011 2,252,097 2,420,552 4880.016 107.5
Liberty Natl Life Ins Co NE 65331 290 2,141,766 1,580,267 1,2860.015 73.8
CAUTION: The information contained on this page is unaudited and not a complete analysis nor is it an expression of opinion on any insurer. This page may contain inadvertent errors.
© 2017 National Association of Insurance Commissioners 17
NATIONAL ASSOCIATION OF INSURANCE COMMISSIONERS
MEDICARE SUPPLEMENT INSURANCE EXPERIENCE REPORTS
In Order by Direct Premiums Earned U.S. and U.S. Territories
INDIVIDUAL POLICIES ISSUED THROUGH
Market
Direct Claims
Incurred
Loss Incurred to
Premiums Earned Number of
Lives Covered
Direct Premiums
Earned
Company Name
State
Dom
Cocode Group
Code
of Share
% %
September 12, 2017 2016
2013
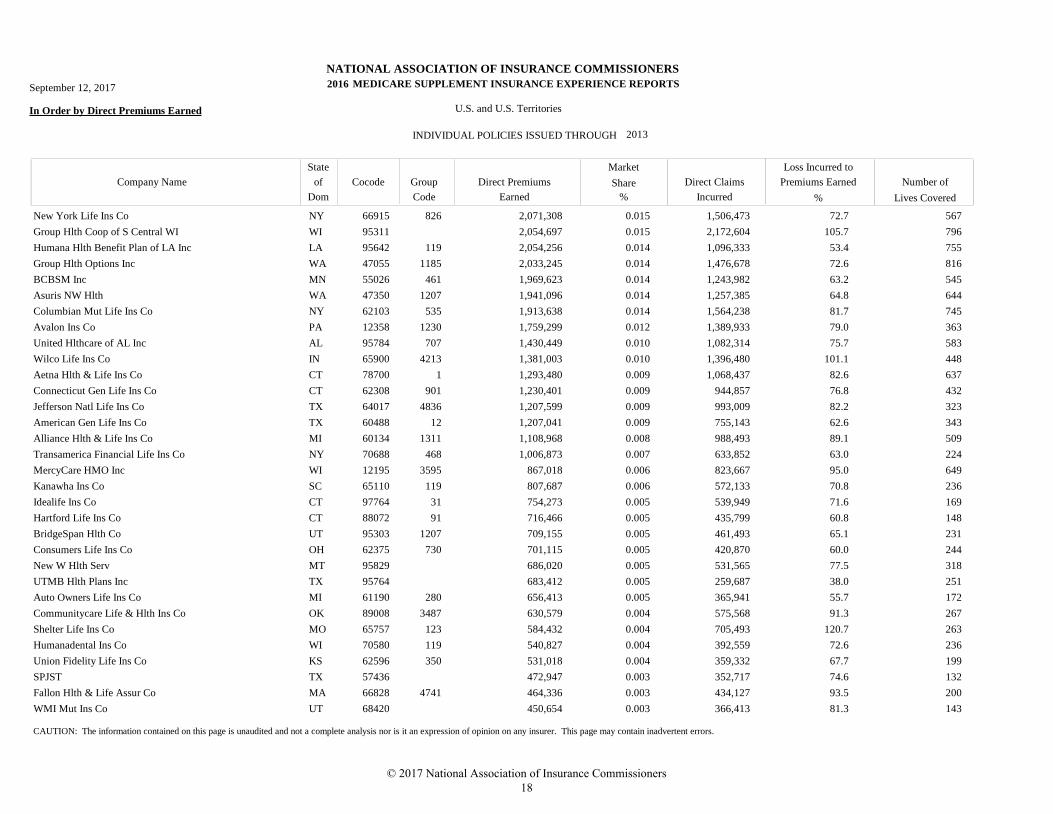
New York Life Ins Co NY 66915 826 2,071,308 1,506,473 5670.015 72.7
Group Hlth Coop of S Central WI WI 95311 2,054,697 2,172,604 7960.015 105.7
Humana Hlth Benefit Plan of LA Inc LA 95642 119 2,054,256 1,096,333 7550.014 53.4
Group Hlth Options Inc WA 47055 1185 2,033,245 1,476,678 8160.014 72.6
BCBSM Inc MN 55026 461 1,969,623 1,243,982 5450.014 63.2
Asuris NW Hlth WA 47350 1207 1,941,096 1,257,385 6440.014 64.8
Columbian Mut Life Ins Co NY 62103 535 1,913,638 1,564,238 7450.014 81.7
Avalon Ins Co PA 12358 1230 1,759,299 1,389,933 3630.012 79.0
United Hlthcare of AL Inc AL 95784 707 1,430,449 1,082,314 5830.010 75.7
Wilco Life Ins Co IN 65900 4213 1,381,003 1,396,480 4480.010 101.1
Aetna Hlth & Life Ins Co CT 78700 1 1,293,480 1,068,437 6370.009 82.6
Connecticut Gen Life Ins Co CT 62308 901 1,230,401 944,857 4320.009 76.8
Jefferson Natl Life Ins Co TX 64017 4836 1,207,599 993,009 3230.009 82.2
American Gen Life Ins Co TX 60488 12 1,207,041 755,143 3430.009 62.6
Alliance Hlth & Life Ins Co MI 60134 1311 1,108,968 988,493 5090.008 89.1
Transamerica Financial Life Ins Co NY 70688 468 1,006,873 633,852 2240.007 63.0
MercyCare HMO Inc WI 12195 3595 867,018 823,667 6490.006 95.0
Kanawha Ins Co SC 65110 119 807,687 572,133 2360.006 70.8
Idealife Ins Co CT 97764 31 754,273 539,949 1690.005 71.6
Hartford Life Ins Co CT 88072 91 716,466 435,799 1480.005 60.8
BridgeSpan Hlth Co UT 95303 1207 709,155 461,493 2310.005 65.1
Consumers Life Ins Co OH 62375 730 701,115 420,870 2440.005 60.0
New W Hlth Serv MT 95829 686,020 531,565 3180.005 77.5
UTMB Hlth Plans Inc TX 95764 683,412 259,687 2510.005 38.0
Auto Owners Life Ins Co MI 61190 280 656,413 365,941 1720.005 55.7
Communitycare Life & Hlth Ins Co OK 89008 3487 630,579 575,568 2670.004 91.3
Shelter Life Ins Co MO 65757 123 584,432 705,493 2630.004 120.7
Humanadental Ins Co WI 70580 119 540,827 392,559 2360.004 72.6
Union Fidelity Life Ins Co KS 62596 350 531,018 359,332 1990.004 67.7
SPJST TX 57436 472,947 352,717 1320.003 74.6
Fallon Hlth & Life Assur Co MA 66828 4741 464,336 434,127 2000.003 93.5
WMI Mut Ins Co UT 68420 450,654 366,413 1430.003 81.3
CAUTION: The information contained on this page is unaudited and not a complete analysis nor is it an expression of opinion on any insurer. This page may contain inadvertent errors.
© 2017 National Association of Insurance Commissioners 18
NATIONAL ASSOCIATION OF INSURANCE COMMISSIONERS
MEDICARE SUPPLEMENT INSURANCE EXPERIENCE REPORTS
In Order by Direct Premiums Earned U.S. and U.S. Territories
INDIVIDUAL POLICIES ISSUED THROUGH
Market
Direct Claims
Incurred
Loss Incurred to
Premiums Earned Number of
Lives Covered
Direct Premiums
Earned
Company Name
State
Dom
Cocode Group
Code
of Share
% %
September 12, 2017 2016
2013
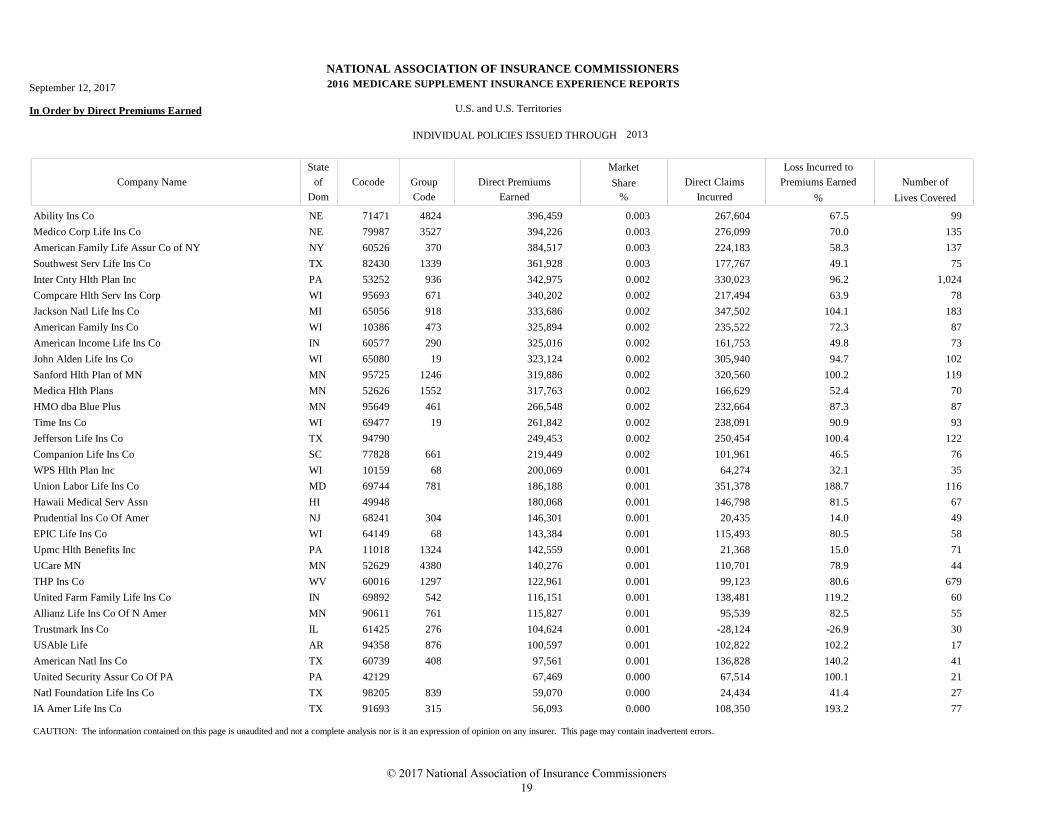
Ability Ins Co NE 71471 4824 396,459 267,604 990.003 67.5
Medico Corp Life Ins Co NE 79987 3527 394,226 276,099 1350.003 70.0
American Family Life Assur Co of NY NY 60526 370 384,517 224,183 1370.003 58.3
Southwest Serv Life Ins Co TX 82430 1339 361,928 177,767 750.003 49.1
Inter Cnty Hlth Plan Inc PA 53252 936 342,975 330,023 1,0240.002 96.2
Compcare Hlth Serv Ins Corp WI 95693 671 340,202 217,494 780.002 63.9
Jackson Natl Life Ins Co MI 65056 918 333,686 347,502 1830.002 104.1
American Family Ins Co WI 10386 473 325,894 235,522 870.002 72.3
American Income Life Ins Co IN 60577 290 325,016 161,753 730.002 49.8
John Alden Life Ins Co WI 65080 19 323,124 305,940 1020.002 94.7
Sanford Hlth Plan of MN MN 95725 1246 319,886 320,560 1190.002 100.2
Medica Hlth Plans MN 52626 1552 317,763 166,629 700.002 52.4
HMO dba Blue Plus MN 95649 461 266,548 232,664 870.002 87.3
Time Ins Co WI 69477 19 261,842 238,091 930.002 90.9
Jefferson Life Ins Co TX 94790 249,453 250,454 1220.002 100.4
Companion Life Ins Co SC 77828 661 219,449 101,961 760.002 46.5
WPS Hlth Plan Inc WI 10159 68 200,069 64,274 350.001 32.1
Union Labor Life Ins Co MD 69744 781 186,188 351,378 1160.001 188.7
Hawaii Medical Serv Assn HI 49948 180,068 146,798 670.001 81.5
Prudential Ins Co Of Amer NJ 68241 304 146,301 20,435 490.001 14.0
EPIC Life Ins Co WI 64149 68 143,384 115,493 580.001 80.5
Upmc Hlth Benefits Inc PA 11018 1324 142,559 21,368 710.001 15.0
UCare MN MN 52629 4380 140,276 110,701 440.001 78.9
THP Ins Co WV 60016 1297 122,961 99,123 6790.001 80.6
United Farm Family Life Ins Co IN 69892 542 116,151 138,481 600.001 119.2
Allianz Life Ins Co Of N Amer MN 90611 761 115,827 95,539 550.001 82.5
Trustmark Ins Co IL 61425 276 104,624 -28,124 300.001 -26.9
USAble Life AR 94358 876 100,597 102,822 170.001 102.2
American Natl Ins Co TX 60739 408 97,561 136,828 410.001 140.2
United Security Assur Co Of PA PA 42129 67,469 67,514 210.000 100.1
Natl Foundation Life Ins Co TX 98205 839 59,070 24,434 270.000 41.4
IA Amer Life Ins Co TX 91693 315 56,093 108,350 770.000 193.2
CAUTION: The information contained on this page is unaudited and not a complete analysis nor is it an expression of opinion on any insurer. This page may contain inadvertent errors.
© 2017 National Association of Insurance Commissioners 19
NATIONAL ASSOCIATION OF INSURANCE COMMISSIONERS
MEDICARE SUPPLEMENT INSURANCE EXPERIENCE REPORTS
In Order by Direct Premiums Earned U.S. and U.S. Territories
INDIVIDUAL POLICIES ISSUED THROUGH
Market
Direct Claims
Incurred
Loss Incurred to
Premiums Earned Number of
Lives Covered
Direct Premiums
Earned
Company Name
State
Dom
Cocode Group
Code
of Share
% %
September 12, 2017 2016
2013
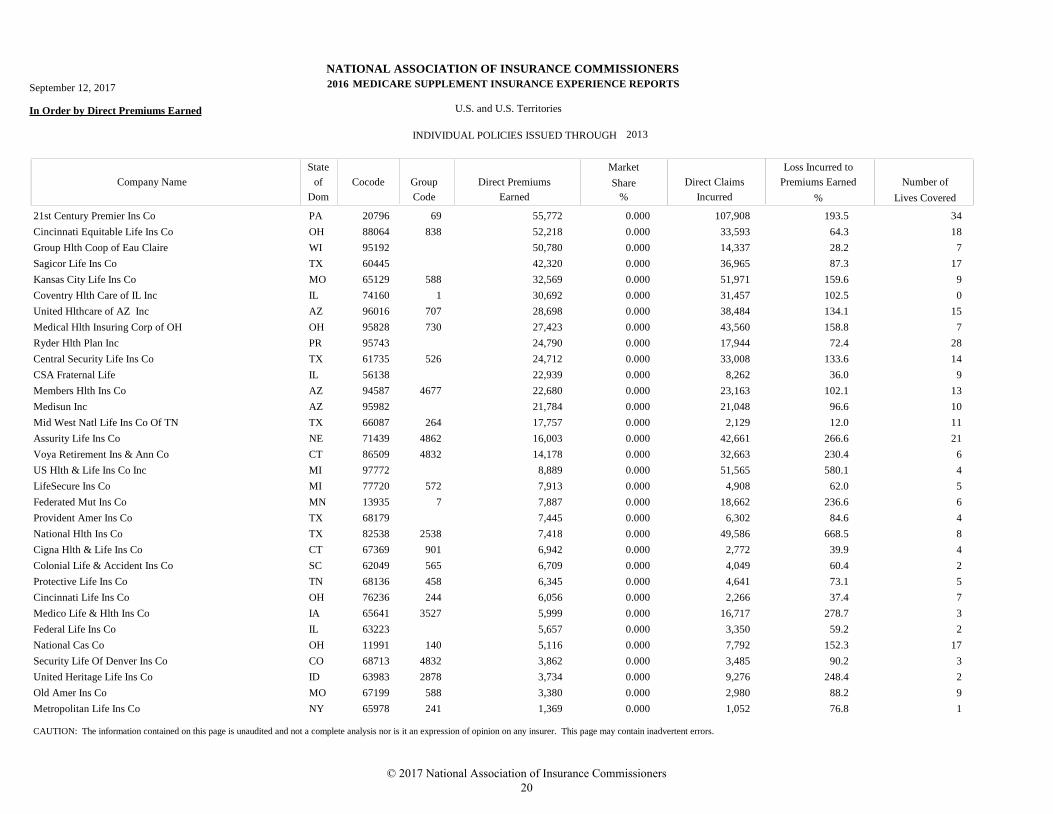
21st Century Premier Ins Co PA 20796 69 55,772 107,908 340.000 193.5
Cincinnati Equitable Life Ins Co OH 88064 838 52,218 33,593 180.000 64.3
Group Hlth Coop of Eau Claire WI 95192 50,780 14,337 70.000 28.2
Sagicor Life Ins Co TX 60445 42,320 36,965 170.000 87.3
Kansas City Life Ins Co MO 65129 588 32,569 51,971 90.000 159.6
Coventry Hlth Care of IL Inc IL 74160 1 30,692 31,457 00.000 102.5
United Hlthcare of AZ Inc AZ 96016 707 28,698 38,484 150.000 134.1
Medical Hlth Insuring Corp of OH OH 95828 730 27,423 43,560 70.000 158.8
Ryder Hlth Plan Inc PR 95743 24,790 17,944 280.000 72.4
Central Security Life Ins Co TX 61735 526 24,712 33,008 140.000 133.6
CSA Fraternal Life IL 56138 22,939 8,262 90.000 36.0
Members Hlth Ins Co AZ 94587 4677 22,680 23,163 130.000 102.1
Medisun Inc AZ 95982 21,784 21,048 100.000 96.6
Mid West Natl Life Ins Co Of TN TX 66087 264 17,757 2,129 110.000 12.0
Assurity Life Ins Co NE 71439 4862 16,003 42,661 210.000 266.6
Voya Retirement Ins & Ann Co CT 86509 4832 14,178 32,663 60.000 230.4
US Hlth & Life Ins Co Inc MI 97772 8,889 51,565 40.000 580.1
LifeSecure Ins Co MI 77720 572 7,913 4,908 50.000 62.0
Federated Mut Ins Co MN 13935 7 7,887 18,662 60.000 236.6
Provident Amer Ins Co TX 68179 7,445 6,302 40.000 84.6
National Hlth Ins Co TX 82538 2538 7,418 49,586 80.000 668.5
Cigna Hlth & Life Ins Co CT 67369 901 6,942 2,772 40.000 39.9
Colonial Life & Accident Ins Co SC 62049 565 6,709 4,049 20.000 60.4
Protective Life Ins Co TN 68136 458 6,345 4,641 50.000 73.1
Cincinnati Life Ins Co OH 76236 244 6,056 2,266 70.000 37.4
Medico Life & Hlth Ins Co IA 65641 3527 5,999 16,717 30.000 278.7
Federal Life Ins Co IL 63223 5,657 3,350 20.000 59.2
National Cas Co OH 11991 140 5,116 7,792 170.000 152.3
Security Life Of Denver Ins Co CO 68713 4832 3,862 3,485 30.000 90.2
United Heritage Life Ins Co ID 63983 2878 3,734 9,276 20.000 248.4
Old Amer Ins Co MO 67199 588 3,380 2,980 90.000 88.2
Metropolitan Life Ins Co NY 65978 241 1,369 1,052 10.000 76.8
CAUTION: The information contained on this page is unaudited and not a complete analysis nor is it an expression of opinion on any insurer. This page may contain inadvertent errors.
© 2017 National Association of Insurance Commissioners 20
NATIONAL ASSOCIATION OF INSURANCE COMMISSIONERS
MEDICARE SUPPLEMENT INSURANCE EXPERIENCE REPORTS
In Order by Direct Premiums Earned U.S. and U.S. Territories
INDIVIDUAL POLICIES ISSUED THROUGH
Market
Direct Claims
Incurred
Loss Incurred to
Premiums Earned Number of
Lives Covered
Direct Premiums
Earned
Company Name
State
Dom
Cocode Group
Code
of Share
% %
September 12, 2017 2016
2013
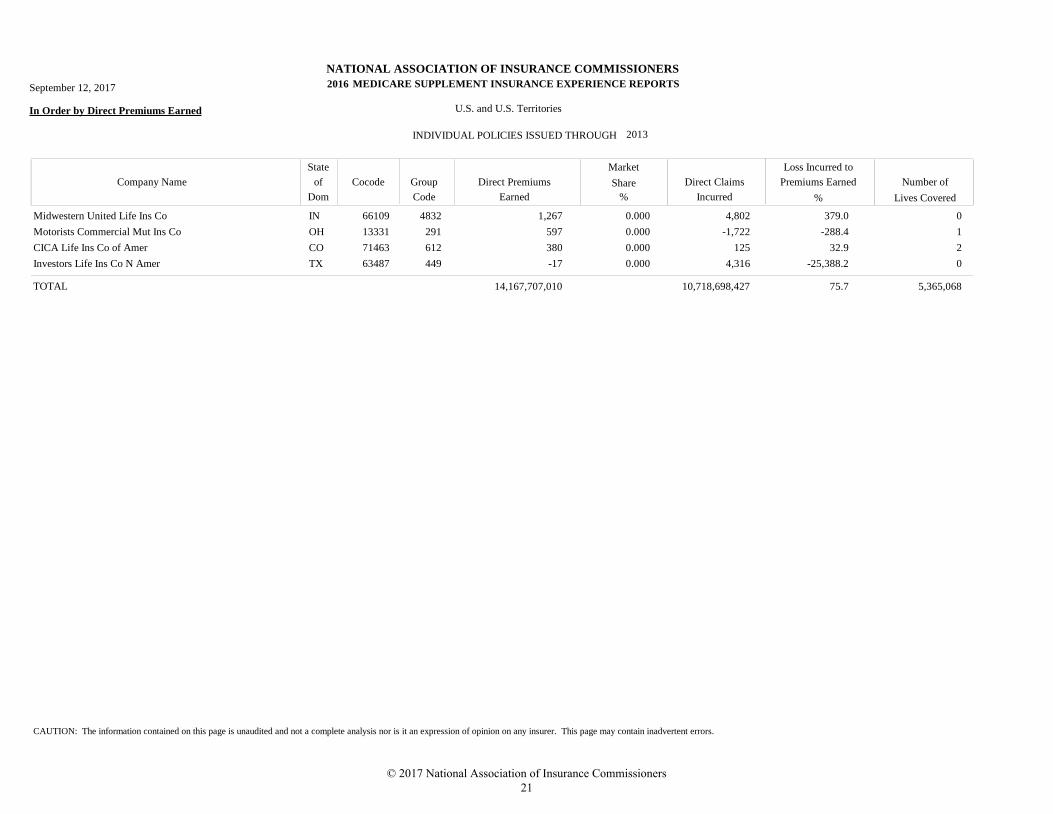
Midwestern United Life Ins Co IN 66109 4832 1,267 4,802 00.000 379.0
Motorists Commercial Mut Ins Co OH 13331 291 597 -1,722 10.000 -288.4
CICA Life Ins Co of Amer CO 71463 612 380 125 20.000 32.9
Investors Life Ins Co N Amer TX 63487 449 -17 4,316 00.000 -25,388.2
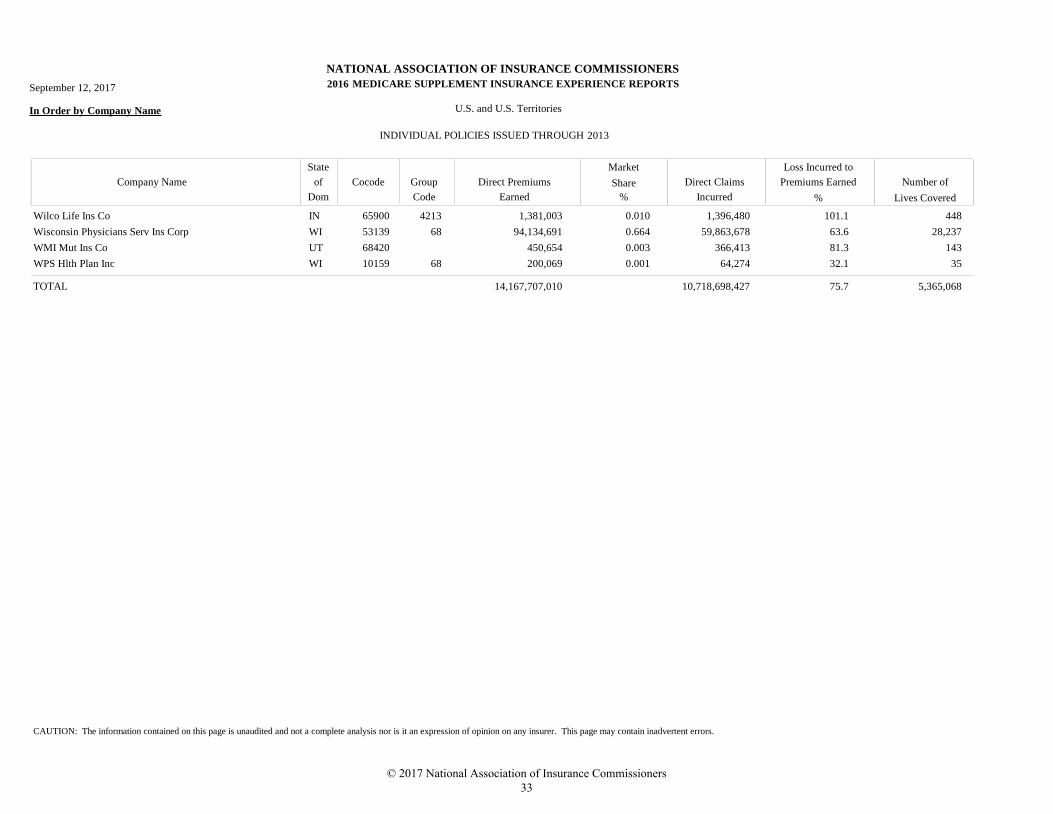
14,167,707,010 10,718,698,427 5,365,068TOTAL 75.7
CAUTION: The information contained on this page is unaudited and not a complete analysis nor is it an expression of opinion on any insurer. This page may contain inadvertent errors.
© 2017 National Association of Insurance Commissioners 21

© 2017 National Association of Insurance Commissioners 22
INDIVIDUAL POLICIES ISSUED THROUGH 2013 BY COMPANY NAME
© 2017 National Association of Insurance Commissioners 23

© 2017 National Association of Insurance Commissioners 24
NATIONAL ASSOCIATION OF INSURANCE COMMISSIONERS
MEDICARE SUPPLEMENT INSURANCE EXPERIENCE REPORTS
In Order by Company Name U.S. and U.S. Territories
INDIVIDUAL POLICIES ISSUED THROUGH
Market
Direct Claims
Incurred
Loss Incurred to
Premiums Earned Number of
Lives Covered
Direct Premiums
Earned
Company Name
State
Dom
Cocode Group
Code
of Share
% %
September 12, 2017 2016
2013
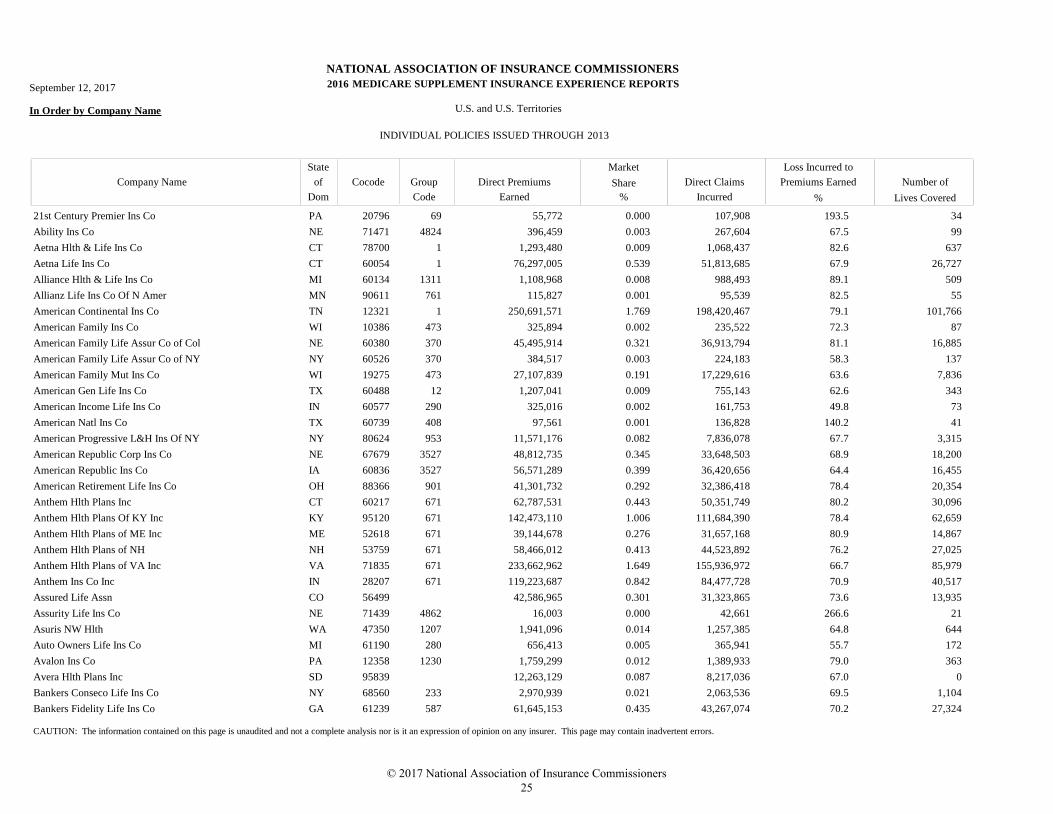
21st Century Premier Ins Co PA 20796 69 55,772 107,908 340.000 193.5
Ability Ins Co NE 71471 4824 396,459 267,604 990.003 67.5
Aetna Hlth & Life Ins Co CT 78700 1 1,293,480 1,068,437 6370.009 82.6
Aetna Life Ins Co CT 60054 1 76,297,005 51,813,685 26,7270.539 67.9
Alliance Hlth & Life Ins Co MI 60134 1311 1,108,968 988,493 5090.008 89.1
Allianz Life Ins Co Of N Amer MN 90611 761 115,827 95,539 550.001 82.5
American Continental Ins Co TN 12321 1 250,691,571 198,420,467 101,7661.769 79.1
American Family Ins Co WI 10386 473 325,894 235,522 870.002 72.3
American Family Life Assur Co of Col NE 60380 370 45,495,914 36,913,794 16,8850.321 81.1
American Family Life Assur Co of NY NY 60526 370 384,517 224,183 1370.003 58.3
American Family Mut Ins Co WI 19275 473 27,107,839 17,229,616 7,8360.191 63.6
American Gen Life Ins Co TX 60488 12 1,207,041 755,143 3430.009 62.6
American Income Life Ins Co IN 60577 290 325,016 161,753 730.002 49.8
American Natl Ins Co TX 60739 408 97,561 136,828 410.001 140.2
American Progressive L&H Ins Of NY NY 80624 953 11,571,176 7,836,078 3,3150.082 67.7
American Republic Corp Ins Co NE 67679 3527 48,812,735 33,648,503 18,2000.345 68.9
American Republic Ins Co IA 60836 3527 56,571,289 36,420,656 16,4550.399 64.4
American Retirement Life Ins Co OH 88366 901 41,301,732 32,386,418 20,3540.292 78.4
Anthem Hlth Plans Inc CT 60217 671 62,787,531 50,351,749 30,0960.443 80.2
Anthem Hlth Plans Of KY Inc KY 95120 671 142,473,110 111,684,390 62,6591.006 78.4
Anthem Hlth Plans of ME Inc ME 52618 671 39,144,678 31,657,168 14,8670.276 80.9
Anthem Hlth Plans of NH NH 53759 671 58,466,012 44,523,892 27,0250.413 76.2
Anthem Hlth Plans of VA Inc VA 71835 671 233,662,962 155,936,972 85,9791.649 66.7
Anthem Ins Co Inc IN 28207 671 119,223,687 84,477,728 40,5170.842 70.9
Assured Life Assn CO 56499 42,586,965 31,323,865 13,9350.301 73.6
Assurity Life Ins Co NE 71439 4862 16,003 42,661 210.000 266.6
Asuris NW Hlth WA 47350 1207 1,941,096 1,257,385 6440.014 64.8
Auto Owners Life Ins Co MI 61190 280 656,413 365,941 1720.005 55.7
Avalon Ins Co PA 12358 1230 1,759,299 1,389,933 3630.012 79.0
Avera Hlth Plans Inc SD 95839 12,263,129 8,217,036 00.087 67.0
Bankers Conseco Life Ins Co NY 68560 233 2,970,939 2,063,536 1,1040.021 69.5
Bankers Fidelity Life Ins Co GA 61239 587 61,645,153 43,267,074 27,3240.435 70.2
CAUTION: The information contained on this page is unaudited and not a complete analysis nor is it an expression of opinion on any insurer. This page may contain inadvertent errors.
© 2017 National Association of Insurance Commissioners 25
NATIONAL ASSOCIATION OF INSURANCE COMMISSIONERS
MEDICARE SUPPLEMENT INSURANCE EXPERIENCE REPORTS
In Order by Company Name U.S. and U.S. Territories
INDIVIDUAL POLICIES ISSUED THROUGH
Market
Direct Claims
Incurred
Loss Incurred to
Premiums Earned Number of
Lives Covered
Direct Premiums
Earned
Company Name
State
Dom
Cocode Group
Code
of Share
% %
September 12, 2017 2016
2013
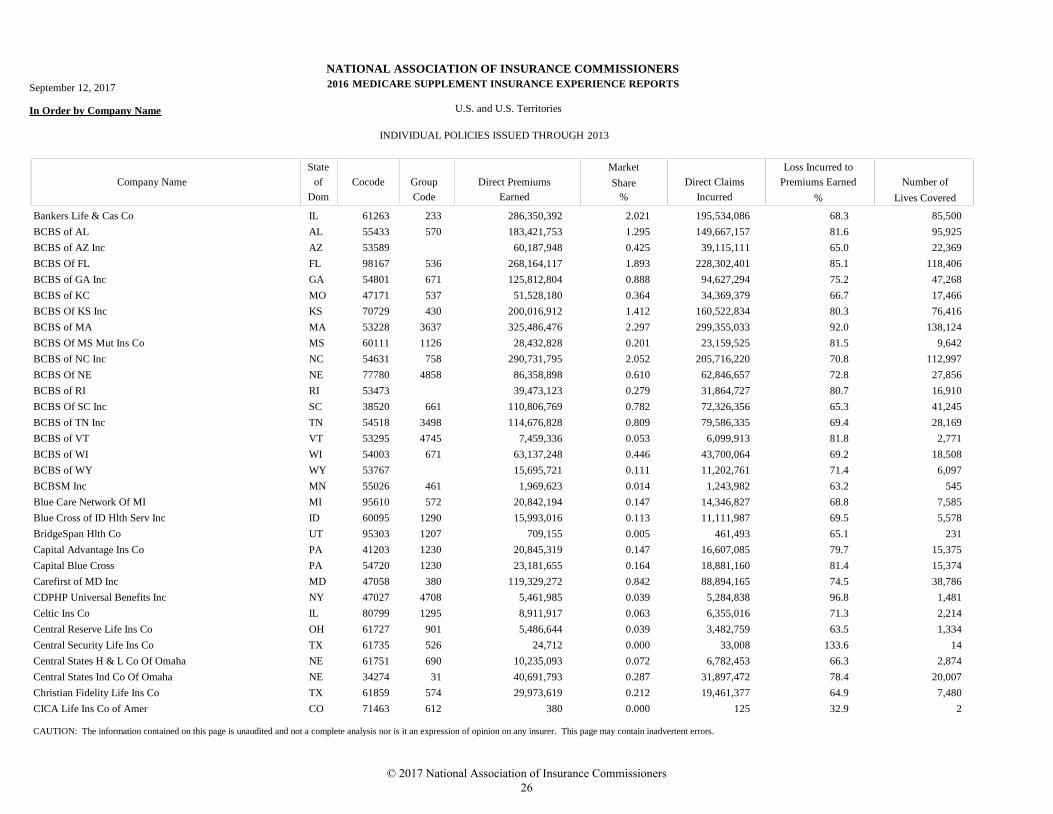
Bankers Life & Cas Co IL 61263 233 286,350,392 195,534,086 85,5002.021 68.3
BCBS of AL AL 55433 570 183,421,753 149,667,157 95,9251.295 81.6
BCBS of AZ Inc AZ 53589 60,187,948 39,115,111 22,3690.425 65.0
BCBS Of FL FL 98167 536 268,164,117 228,302,401 118,4061.893 85.1
BCBS of GA Inc GA 54801 671 125,812,804 94,627,294 47,2680.888 75.2
BCBS of KC MO 47171 537 51,528,180 34,369,379 17,4660.364 66.7
BCBS Of KS Inc KS 70729 430 200,016,912 160,522,834 76,4161.412 80.3
BCBS of MA MA 53228 3637 325,486,476 299,355,033 138,1242.297 92.0
BCBS Of MS Mut Ins Co MS 60111 1126 28,432,828 23,159,525 9,6420.201 81.5
BCBS of NC Inc NC 54631 758 290,731,795 205,716,220 112,9972.052 70.8
BCBS Of NE NE 77780 4858 86,358,898 62,846,657 27,8560.610 72.8
BCBS of RI RI 53473 39,473,123 31,864,727 16,9100.279 80.7
BCBS Of SC Inc SC 38520 661 110,806,769 72,326,356 41,2450.782 65.3
BCBS of TN Inc TN 54518 3498 114,676,828 79,586,335 28,1690.809 69.4
BCBS of VT VT 53295 4745 7,459,336 6,099,913 2,7710.053 81.8
BCBS of WI WI 54003 671 63,137,248 43,700,064 18,5080.446 69.2
BCBS of WY WY 53767 15,695,721 11,202,761 6,0970.111 71.4
BCBSM Inc MN 55026 461 1,969,623 1,243,982 5450.014 63.2
Blue Care Network Of MI MI 95610 572 20,842,194 14,346,827 7,5850.147 68.8
Blue Cross of ID Hlth Serv Inc ID 60095 1290 15,993,016 11,111,987 5,5780.113 69.5
BridgeSpan Hlth Co UT 95303 1207 709,155 461,493 2310.005 65.1
Capital Advantage Ins Co PA 41203 1230 20,845,319 16,607,085 15,3750.147 79.7
Capital Blue Cross PA 54720 1230 23,181,655 18,881,160 15,3740.164 81.4
Carefirst of MD Inc MD 47058 380 119,329,272 88,894,165 38,7860.842 74.5
CDPHP Universal Benefits Inc NY 47027 4708 5,461,985 5,284,838 1,4810.039 96.8
Celtic Ins Co IL 80799 1295 8,911,917 6,355,016 2,2140.063 71.3
Central Reserve Life Ins Co OH 61727 901 5,486,644 3,482,759 1,3340.039 63.5
Central Security Life Ins Co TX 61735 526 24,712 33,008 140.000 133.6
Central States H & L Co Of Omaha NE 61751 690 10,235,093 6,782,453 2,8740.072 66.3
Central States Ind Co Of Omaha NE 34274 31 40,691,793 31,897,472 20,0070.287 78.4
Christian Fidelity Life Ins Co TX 61859 574 29,973,619 19,461,377 7,4800.212 64.9
CICA Life Ins Co of Amer CO 71463 612 380 125 20.000 32.9
CAUTION: The information contained on this page is unaudited and not a complete analysis nor is it an expression of opinion on any insurer. This page may contain inadvertent errors.
© 2017 National Association of Insurance Commissioners 26
NATIONAL ASSOCIATION OF INSURANCE COMMISSIONERS
MEDICARE SUPPLEMENT INSURANCE EXPERIENCE REPORTS
In Order by Company Name U.S. and U.S. Territories
INDIVIDUAL POLICIES ISSUED THROUGH
Market
Direct Claims
Incurred
Loss Incurred to
Premiums Earned Number of
Lives Covered
Direct Premiums
Earned
Company Name
State
Dom
Cocode Group
Code
of Share
% %
September 12, 2017 2016
2013
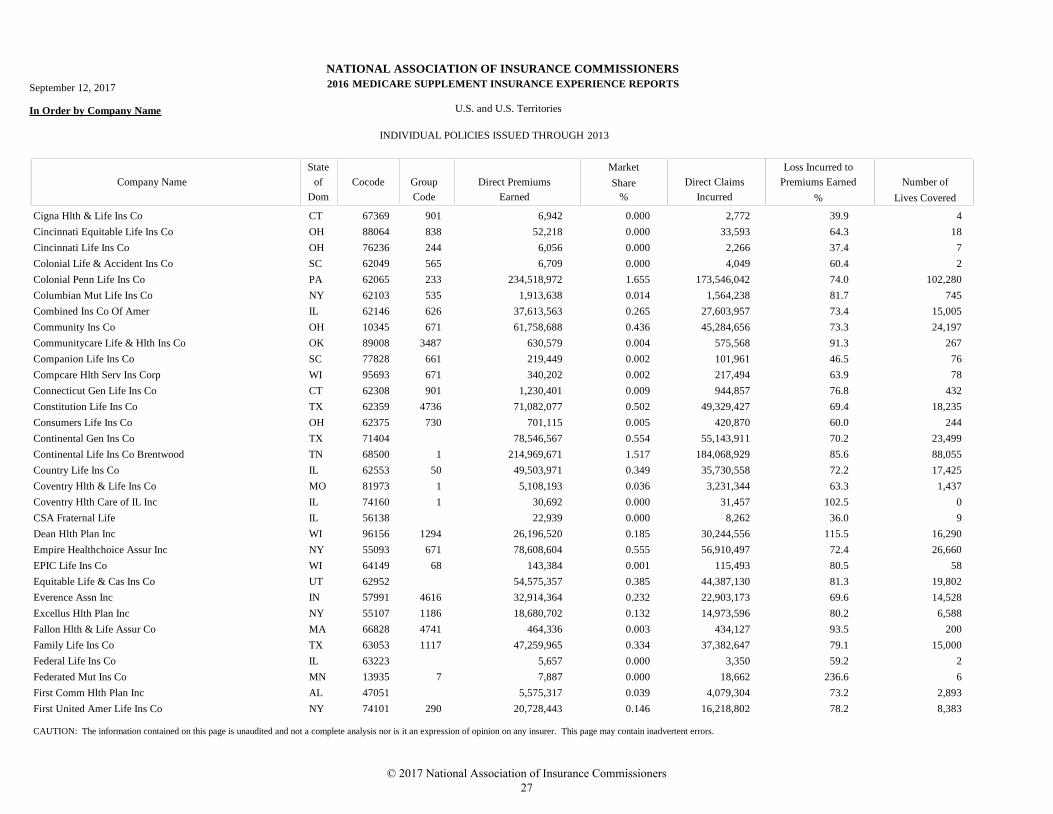
Cigna Hlth & Life Ins Co CT 67369 901 6,942 2,772 40.000 39.9
Cincinnati Equitable Life Ins Co OH 88064 838 52,218 33,593 180.000 64.3
Cincinnati Life Ins Co OH 76236 244 6,056 2,266 70.000 37.4
Colonial Life & Accident Ins Co SC 62049 565 6,709 4,049 20.000 60.4
Colonial Penn Life Ins Co PA 62065 233 234,518,972 173,546,042 102,2801.655 74.0
Columbian Mut Life Ins Co NY 62103 535 1,913,638 1,564,238 7450.014 81.7
Combined Ins Co Of Amer IL 62146 626 37,613,563 27,603,957 15,0050.265 73.4
Community Ins Co OH 10345 671 61,758,688 45,284,656 24,1970.436 73.3
Communitycare Life & Hlth Ins Co OK 89008 3487 630,579 575,568 2670.004 91.3
Companion Life Ins Co SC 77828 661 219,449 101,961 760.002 46.5
Compcare Hlth Serv Ins Corp WI 95693 671 340,202 217,494 780.002 63.9
Connecticut Gen Life Ins Co CT 62308 901 1,230,401 944,857 4320.009 76.8
Constitution Life Ins Co TX 62359 4736 71,082,077 49,329,427 18,2350.502 69.4
Consumers Life Ins Co OH 62375 730 701,115 420,870 2440.005 60.0
Continental Gen Ins Co TX 71404 78,546,567 55,143,911 23,4990.554 70.2
Continental Life Ins Co Brentwood TN 68500 1 214,969,671 184,068,929 88,0551.517 85.6
Country Life Ins Co IL 62553 50 49,503,971 35,730,558 17,4250.349 72.2
Coventry Hlth & Life Ins Co MO 81973 1 5,108,193 3,231,344 1,4370.036 63.3
Coventry Hlth Care of IL Inc IL 74160 1 30,692 31,457 00.000 102.5
CSA Fraternal Life IL 56138 22,939 8,262 90.000 36.0
Dean Hlth Plan Inc WI 96156 1294 26,196,520 30,244,556 16,2900.185 115.5
Empire Healthchoice Assur Inc NY 55093 671 78,608,604 56,910,497 26,6600.555 72.4
EPIC Life Ins Co WI 64149 68 143,384 115,493 580.001 80.5
Equitable Life & Cas Ins Co UT 62952 54,575,357 44,387,130 19,8020.385 81.3
Everence Assn Inc IN 57991 4616 32,914,364 22,903,173 14,5280.232 69.6
Excellus Hlth Plan Inc NY 55107 1186 18,680,702 14,973,596 6,5880.132 80.2
Fallon Hlth & Life Assur Co MA 66828 4741 464,336 434,127 2000.003 93.5
Family Life Ins Co TX 63053 1117 47,259,965 37,382,647 15,0000.334 79.1
Federal Life Ins Co IL 63223 5,657 3,350 20.000 59.2
Federated Mut Ins Co MN 13935 7 7,887 18,662 60.000 236.6
First Comm Hlth Plan Inc AL 47051 5,575,317 4,079,304 2,8930.039 73.2
First United Amer Life Ins Co NY 74101 290 20,728,443 16,218,802 8,3830.146 78.2
CAUTION: The information contained on this page is unaudited and not a complete analysis nor is it an expression of opinion on any insurer. This page may contain inadvertent errors.
© 2017 National Association of Insurance Commissioners 27
NATIONAL ASSOCIATION OF INSURANCE COMMISSIONERS
MEDICARE SUPPLEMENT INSURANCE EXPERIENCE REPORTS
In Order by Company Name U.S. and U.S. Territories
INDIVIDUAL POLICIES ISSUED THROUGH
Market
Direct Claims
Incurred
Loss Incurred to
Premiums Earned Number of
Lives Covered
Direct Premiums
Earned
Company Name
State
Dom
Cocode Group
Code
of Share
% %
September 12, 2017 2016
2013
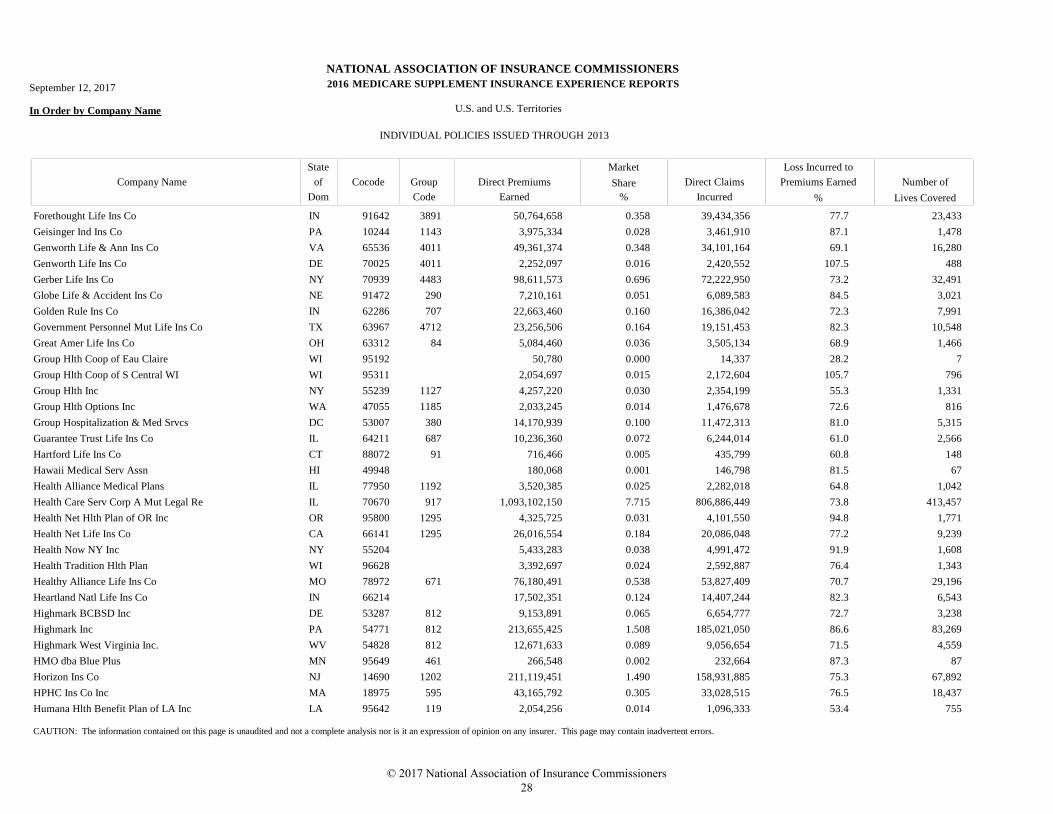
Forethought Life Ins Co IN 91642 3891 50,764,658 39,434,356 23,4330.358 77.7
Geisinger Ind Ins Co PA 10244 1143 3,975,334 3,461,910 1,4780.028 87.1
Genworth Life & Ann Ins Co VA 65536 4011 49,361,374 34,101,164 16,2800.348 69.1
Genworth Life Ins Co DE 70025 4011 2,252,097 2,420,552 4880.016 107.5
Gerber Life Ins Co NY 70939 4483 98,611,573 72,222,950 32,4910.696 73.2
Globe Life & Accident Ins Co NE 91472 290 7,210,161 6,089,583 3,0210.051 84.5
Golden Rule Ins Co IN 62286 707 22,663,460 16,386,042 7,9910.160 72.3
Government Personnel Mut Life Ins Co TX 63967 4712 23,256,506 19,151,453 10,5480.164 82.3
Great Amer Life Ins Co OH 63312 84 5,084,460 3,505,134 1,4660.036 68.9
Group Hlth Coop of Eau Claire WI 95192 50,780 14,337 70.000 28.2
Group Hlth Coop of S Central WI WI 95311 2,054,697 2,172,604 7960.015 105.7
Group Hlth Inc NY 55239 1127 4,257,220 2,354,199 1,3310.030 55.3
Group Hlth Options Inc WA 47055 1185 2,033,245 1,476,678 8160.014 72.6
Group Hospitalization & Med Srvcs DC 53007 380 14,170,939 11,472,313 5,3150.100 81.0
Guarantee Trust Life Ins Co IL 64211 687 10,236,360 6,244,014 2,5660.072 61.0
Hartford Life Ins Co CT 88072 91 716,466 435,799 1480.005 60.8
Hawaii Medical Serv Assn HI 49948 180,068 146,798 670.001 81.5
Health Alliance Medical Plans IL 77950 1192 3,520,385 2,282,018 1,0420.025 64.8
Health Care Serv Corp A Mut Legal Re IL 70670 917 1,093,102,150 806,886,449 413,4577.715 73.8
Health Net Hlth Plan of OR Inc OR 95800 1295 4,325,725 4,101,550 1,7710.031 94.8
Health Net Life Ins Co CA 66141 1295 26,016,554 20,086,048 9,2390.184 77.2
Health Now NY Inc NY 55204 5,433,283 4,991,472 1,6080.038 91.9
Health Tradition Hlth Plan WI 96628 3,392,697 2,592,887 1,3430.024 76.4
Healthy Alliance Life Ins Co MO 78972 671 76,180,491 53,827,409 29,1960.538 70.7
Heartland Natl Life Ins Co IN 66214 17,502,351 14,407,244 6,5430.124 82.3
Highmark BCBSD Inc DE 53287 812 9,153,891 6,654,777 3,2380.065 72.7
Highmark Inc PA 54771 812 213,655,425 185,021,050 83,2691.508 86.6
Highmark West Virginia Inc. WV 54828 812 12,671,633 9,056,654 4,5590.089 71.5
HMO dba Blue Plus MN 95649 461 266,548 232,664 870.002 87.3
Horizon Ins Co NJ 14690 1202 211,119,451 158,931,885 67,8921.490 75.3
HPHC Ins Co Inc MA 18975 595 43,165,792 33,028,515 18,4370.305 76.5
Humana Hlth Benefit Plan of LA Inc LA 95642 119 2,054,256 1,096,333 7550.014 53.4
CAUTION: The information contained on this page is unaudited and not a complete analysis nor is it an expression of opinion on any insurer. This page may contain inadvertent errors.
© 2017 National Association of Insurance Commissioners 28
NATIONAL ASSOCIATION OF INSURANCE COMMISSIONERS
MEDICARE SUPPLEMENT INSURANCE EXPERIENCE REPORTS
In Order by Company Name U.S. and U.S. Territories
INDIVIDUAL POLICIES ISSUED THROUGH
Market
Direct Claims
Incurred
Loss Incurred to
Premiums Earned Number of
Lives Covered
Direct Premiums
Earned
Company Name
State
Dom
Cocode Group
Code
of Share
% %
September 12, 2017 2016
2013
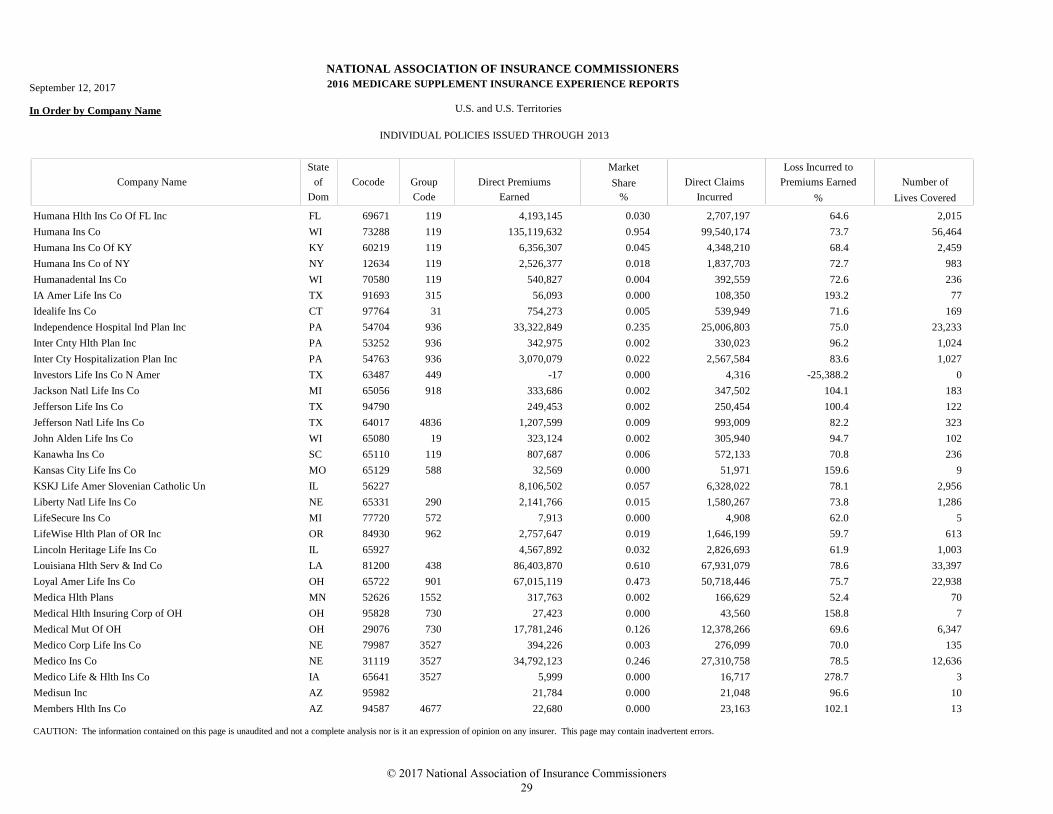
Humana Hlth Ins Co Of FL Inc FL 69671 119 4,193,145 2,707,197 2,0150.030 64.6
Humana Ins Co WI 73288 119 135,119,632 99,540,174 56,4640.954 73.7
Humana Ins Co Of KY KY 60219 119 6,356,307 4,348,210 2,4590.045 68.4
Humana Ins Co of NY NY 12634 119 2,526,377 1,837,703 9830.018 72.7
Humanadental Ins Co WI 70580 119 540,827 392,559 2360.004 72.6
IA Amer Life Ins Co TX 91693 315 56,093 108,350 770.000 193.2
Idealife Ins Co CT 97764 31 754,273 539,949 1690.005 71.6
Independence Hospital Ind Plan Inc PA 54704 936 33,322,849 25,006,803 23,2330.235 75.0
Inter Cnty Hlth Plan Inc PA 53252 936 342,975 330,023 1,0240.002 96.2
Inter Cty Hospitalization Plan Inc PA 54763 936 3,070,079 2,567,584 1,0270.022 83.6
Investors Life Ins Co N Amer TX 63487 449 -17 4,316 00.000 -25,388.2
Jackson Natl Life Ins Co MI 65056 918 333,686 347,502 1830.002 104.1
Jefferson Life Ins Co TX 94790 249,453 250,454 1220.002 100.4
Jefferson Natl Life Ins Co TX 64017 4836 1,207,599 993,009 3230.009 82.2
John Alden Life Ins Co WI 65080 19 323,124 305,940 1020.002 94.7
Kanawha Ins Co SC 65110 119 807,687 572,133 2360.006 70.8
Kansas City Life Ins Co MO 65129 588 32,569 51,971 90.000 159.6
KSKJ Life Amer Slovenian Catholic Un IL 56227 8,106,502 6,328,022 2,9560.057 78.1
Liberty Natl Life Ins Co NE 65331 290 2,141,766 1,580,267 1,2860.015 73.8
LifeSecure Ins Co MI 77720 572 7,913 4,908 50.000 62.0
LifeWise Hlth Plan of OR Inc OR 84930 962 2,757,647 1,646,199 6130.019 59.7
Lincoln Heritage Life Ins Co IL 65927 4,567,892 2,826,693 1,0030.032 61.9
Louisiana Hlth Serv & Ind Co LA 81200 438 86,403,870 67,931,079 33,3970.610 78.6
Loyal Amer Life Ins Co OH 65722 901 67,015,119 50,718,446 22,9380.473 75.7
Medica Hlth Plans MN 52626 1552 317,763 166,629 700.002 52.4
Medical Hlth Insuring Corp of OH OH 95828 730 27,423 43,560 70.000 158.8
Medical Mut Of OH OH 29076 730 17,781,246 12,378,266 6,3470.126 69.6
Medico Corp Life Ins Co NE 79987 3527 394,226 276,099 1350.003 70.0
Medico Ins Co NE 31119 3527 34,792,123 27,310,758 12,6360.246 78.5
Medico Life & Hlth Ins Co IA 65641 3527 5,999 16,717 30.000 278.7
Medisun Inc AZ 95982 21,784 21,048 100.000 96.6
Members Hlth Ins Co AZ 94587 4677 22,680 23,163 130.000 102.1
CAUTION: The information contained on this page is unaudited and not a complete analysis nor is it an expression of opinion on any insurer. This page may contain inadvertent errors.
© 2017 National Association of Insurance Commissioners 29
NATIONAL ASSOCIATION OF INSURANCE COMMISSIONERS
MEDICARE SUPPLEMENT INSURANCE EXPERIENCE REPORTS
In Order by Company Name U.S. and U.S. Territories
INDIVIDUAL POLICIES ISSUED THROUGH
Market
Direct Claims
Incurred
Loss Incurred to
Premiums Earned Number of
Lives Covered
Direct Premiums
Earned
Company Name
State
Dom
Cocode Group
Code
of Share
% %
September 12, 2017 2016
2013
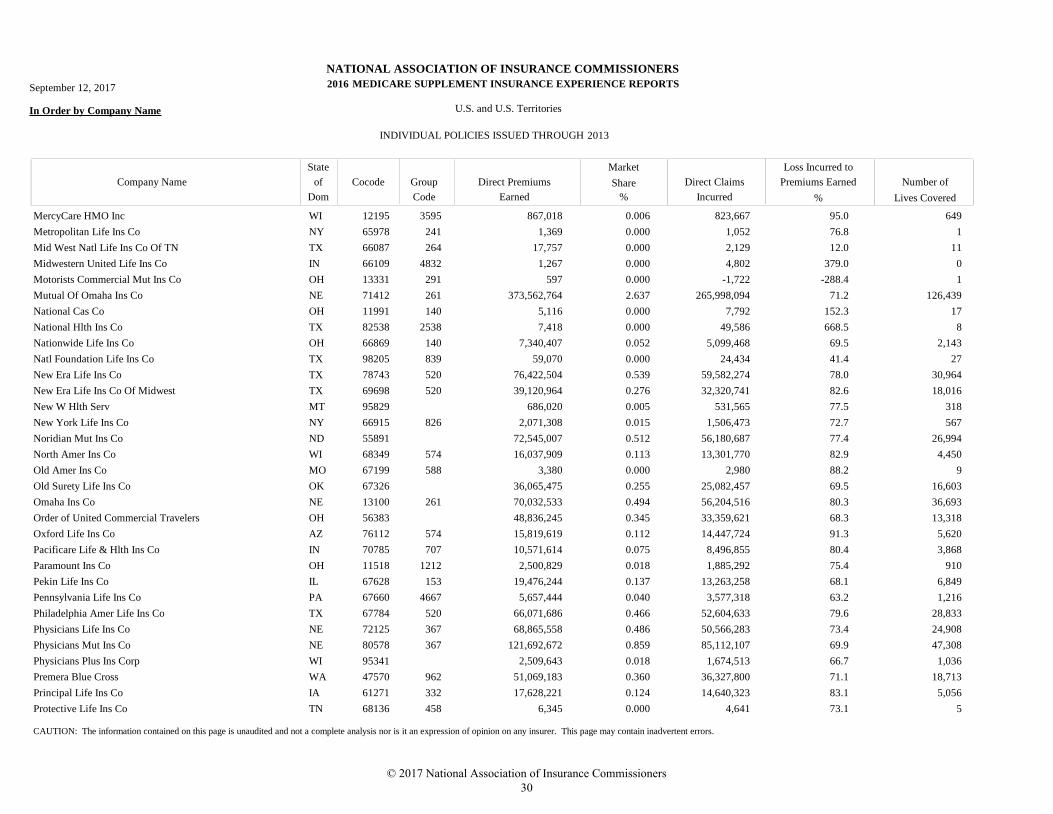
MercyCare HMO Inc WI 12195 3595 867,018 823,667 6490.006 95.0
Metropolitan Life Ins Co NY 65978 241 1,369 1,052 10.000 76.8
Mid West Natl Life Ins Co Of TN TX 66087 264 17,757 2,129 110.000 12.0
Midwestern United Life Ins Co IN 66109 4832 1,267 4,802 00.000 379.0
Motorists Commercial Mut Ins Co OH 13331 291 597 -1,722 10.000 -288.4
Mutual Of Omaha Ins Co NE 71412 261 373,562,764 265,998,094 126,4392.637 71.2
National Cas Co OH 11991 140 5,116 7,792 170.000 152.3
National Hlth Ins Co TX 82538 2538 7,418 49,586 80.000 668.5
Nationwide Life Ins Co OH 66869 140 7,340,407 5,099,468 2,1430.052 69.5
Natl Foundation Life Ins Co TX 98205 839 59,070 24,434 270.000 41.4
New Era Life Ins Co TX 78743 520 76,422,504 59,582,274 30,9640.539 78.0
New Era Life Ins Co Of Midwest TX 69698 520 39,120,964 32,320,741 18,0160.276 82.6
New W Hlth Serv MT 95829 686,020 531,565 3180.005 77.5
New York Life Ins Co NY 66915 826 2,071,308 1,506,473 5670.015 72.7
Noridian Mut Ins Co ND 55891 72,545,007 56,180,687 26,9940.512 77.4
North Amer Ins Co WI 68349 574 16,037,909 13,301,770 4,4500.113 82.9
Old Amer Ins Co MO 67199 588 3,380 2,980 90.000 88.2
Old Surety Life Ins Co OK 67326 36,065,475 25,082,457 16,6030.255 69.5
Omaha Ins Co NE 13100 261 70,032,533 56,204,516 36,6930.494 80.3
Order of United Commercial Travelers OH 56383 48,836,245 33,359,621 13,3180.345 68.3
Oxford Life Ins Co AZ 76112 574 15,819,619 14,447,724 5,6200.112 91.3
Pacificare Life & Hlth Ins Co IN 70785 707 10,571,614 8,496,855 3,8680.075 80.4
Paramount Ins Co OH 11518 1212 2,500,829 1,885,292 9100.018 75.4
Pekin Life Ins Co IL 67628 153 19,476,244 13,263,258 6,8490.137 68.1
Pennsylvania Life Ins Co PA 67660 4667 5,657,444 3,577,318 1,2160.040 63.2
Philadelphia Amer Life Ins Co TX 67784 520 66,071,686 52,604,633 28,8330.466 79.6
Physicians Life Ins Co NE 72125 367 68,865,558 50,566,283 24,9080.486 73.4
Physicians Mut Ins Co NE 80578 367 121,692,672 85,112,107 47,3080.859 69.9
Physicians Plus Ins Corp WI 95341 2,509,643 1,674,513 1,0360.018 66.7
Premera Blue Cross WA 47570 962 51,069,183 36,327,800 18,7130.360 71.1
Principal Life Ins Co IA 61271 332 17,628,221 14,640,323 5,0560.124 83.1
Protective Life Ins Co TN 68136 458 6,345 4,641 50.000 73.1
CAUTION: The information contained on this page is unaudited and not a complete analysis nor is it an expression of opinion on any insurer. This page may contain inadvertent errors.
© 2017 National Association of Insurance Commissioners 30
NATIONAL ASSOCIATION OF INSURANCE COMMISSIONERS
MEDICARE SUPPLEMENT INSURANCE EXPERIENCE REPORTS
In Order by Company Name U.S. and U.S. Territories
INDIVIDUAL POLICIES ISSUED THROUGH
Market
Direct Claims
Incurred
Loss Incurred to
Premiums Earned Number of
Lives Covered
Direct Premiums
Earned
Company Name
State
Dom
Cocode Group
Code
of Share
% %
September 12, 2017 2016
2013
Provident Amer Ins Co TX 68179 7,445 6,302 40.000 84.6
Provident Amer Life & Hlth Ins Co OH 67903 901 9,702,318 6,629,642 2,3500.068 68.3
Prudential Ins Co Of Amer NJ 68241 304 146,301 20,435 490.001 14.0
Puritan Life Ins Co of Amer TX 71390 4826 5,409,502 3,996,578 1,3620.038 73.9
Pyramid Life Ins Co KS 68284 4736 13,444,083 8,450,807 3,3710.095 62.9
Regence BCBS of OR OR 54933 1207 18,757,127 11,580,599 5,4990.132 61.7
Regence BCBS of UT UT 54550 1207 25,838,160 16,154,991 8,9860.182 62.5
Regence BlueShield WA 53902 1207 37,075,095 25,274,939 11,8790.262 68.2
Regence Blueshield Of ID Inc ID 60131 1207 10,352,565 7,484,378 3,5140.073 72.3
Reserve Natl Ins Co OK 68462 215 29,977,016 21,233,196 10,7820.212 70.8
Rocky Mountain Hospital & Medical CO 11011 671 68,168,775 44,559,266 25,7470.481 65.4
Royal Neighbors Of Amer IL 57657 28,062,261 19,175,830 7,2690.198 68.3
Ryder Hlth Plan Inc PR 95743 24,790 17,944 280.000 72.4
Sagicor Life Ins Co TX 60445 42,320 36,965 170.000 87.3
Sanford Hlth Plan SD 95683 1246 2,937,243 2,407,446 1,1520.021 82.0
Sanford Hlth Plan of MN MN 95725 1246 319,886 320,560 1190.002 100.2
Security Hlth Plan of WI Inc WI 96881 4,410,318 3,264,821 1,1060.031 74.0
Security Life Of Denver Ins Co CO 68713 4832 3,862 3,485 30.000 90.2
Sentinel Security Life Ins Co UT 68802 4824 31,137,080 23,269,458 10,5160.220 74.7
Shelter Life Ins Co MO 65757 123 584,432 705,493 2630.004 120.7
Shenandoah Life Ins Co VA 68845 4764 5,422,942 3,544,001 1,1310.038 65.4
Sierra Hlth & Life Ins Co Inc NV 71420 707 12,514,251 9,737,386 3,8250.088 77.8
Southwest Serv Life Ins Co TX 82430 1339 361,928 177,767 750.003 49.1
SPJST TX 57436 472,947 352,717 1320.003 74.6
Standard Life & Accident Ins Co TX 86355 408 53,060,692 38,961,141 22,3360.375 73.4
State Farm Mut Auto Ins Co IL 25178 176 221,441,506 165,880,176 80,7501.563 74.9
State Mut Ins Co GA 69132 16,205,658 10,207,747 4,1980.114 63.0
Sterling Investors Life Ins Co IN 89184 8,995,919 6,424,443 2,1380.063 71.4
Sterling Life Ins Co IL 77399 901 66,712,702 48,485,710 25,1420.471 72.7
The Vt Hlth Plan LLC VT 95696 4745 3,723,115 2,996,480 1,9440.026 80.5
THP Ins Co WV 60016 1297 122,961 99,123 6790.001 80.6
Thrivent Financial For Lutherans WI 56014 2938 57,523,657 39,919,833 20,9990.406 69.4
CAUTION: The information contained on this page is unaudited and not a complete analysis nor is it an expression of opinion on any insurer. This page may contain inadvertent errors.
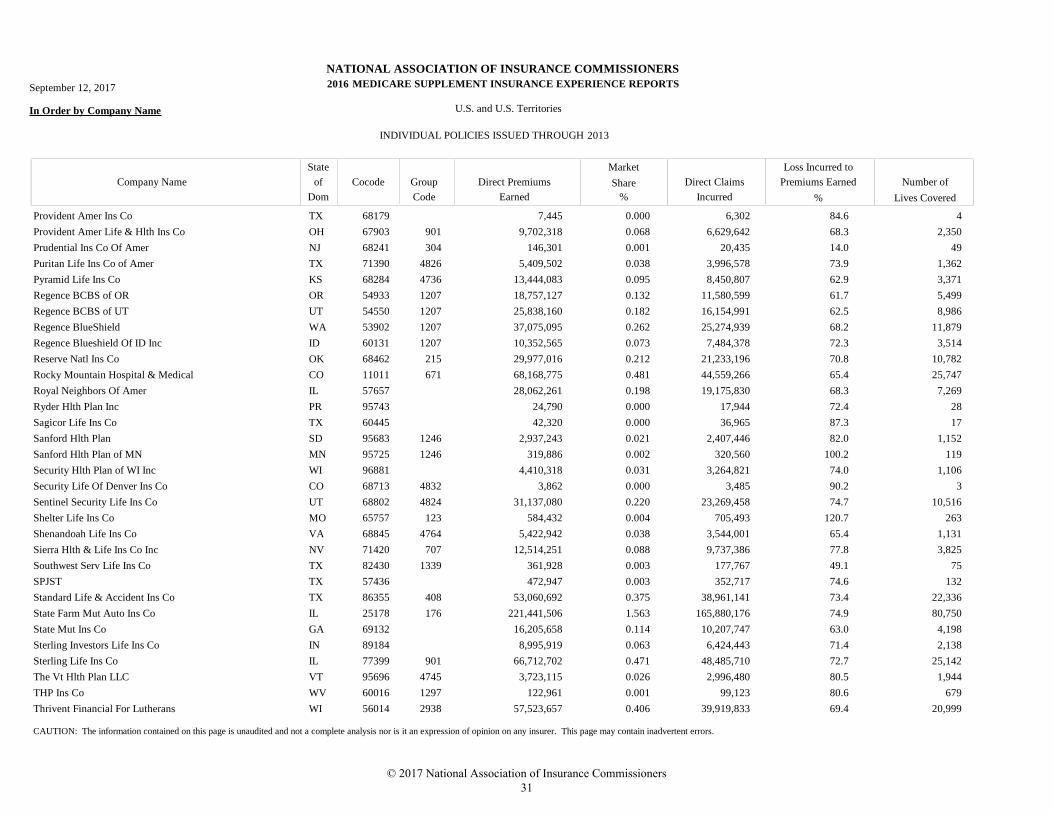
© 2017 National Association of Insurance Commissioners 31
NATIONAL ASSOCIATION OF INSURANCE COMMISSIONERS
MEDICARE SUPPLEMENT INSURANCE EXPERIENCE REPORTS
In Order by Company Name U.S. and U.S. Territories
INDIVIDUAL POLICIES ISSUED THROUGH
Market
Direct Claims
Incurred
Loss Incurred to
Premiums Earned Number of
Lives Covered
Direct Premiums
Earned
Company Name
State
Dom
Cocode Group
Code
of Share
% %
September 12, 2017 2016
2013
Time Ins Co WI 69477 19 261,842 238,091 930.002 90.9
Transamerica Financial Life Ins Co NY 70688 468 1,006,873 633,852 2240.007 63.0
Transamerica Life Ins Co IA 86231 468 17,669,858 13,766,610 6,4980.125 77.9
Transamerica Premier Life Ins Co IA 66281 468 20,184,909 15,514,731 6,7200.142 76.9
Trustmark Ins Co IL 61425 276 104,624 -28,124 300.001 -26.9
UCare MN MN 52629 4380 140,276 110,701 440.001 78.9
Unicare Life & Hlth Ins Co IN 80314 671 16,886,415 11,577,051 5,2350.119 68.6
Unified Life Ins Co TX 11121 4,036,791 2,144,525 1,1670.028 53.1
Union Fidelity Life Ins Co KS 62596 350 531,018 359,332 1990.004 67.7
Union Labor Life Ins Co MD 69744 781 186,188 351,378 1160.001 188.7
United Amer Ins Co NE 92916 290 175,097,162 119,391,700 57,1761.236 68.2
United Farm Family Life Ins Co IN 69892 542 116,151 138,481 600.001 119.2
United Heritage Life Ins Co ID 63983 2878 3,734 9,276 20.000 248.4
United Hlthcare of AL Inc AL 95784 707 1,430,449 1,082,314 5830.010 75.7
United Hlthcare of AZ Inc AZ 96016 707 28,698 38,484 150.000 134.1
United Natl Life Ins Co Of Amer IL 92703 687 5,893,177 4,785,925 2,1130.042 81.2
United Of Omaha Life Ins Co NE 69868 261 929,691,770 659,761,771 325,5346.562 71.0
United Security Assur Co Of PA PA 42129 67,469 67,514 210.000 100.1
United World Life Ins Co NE 72850 261 337,370,100 229,659,614 96,7752.381 68.1
UnitedHealthcare Ins Co CT 79413 707 2,526,742,724 2,029,040,100 1,013,71517.835 80.3
Unity Hlth Plans Ins Corp WI 95796 4870 2,275,272 2,286,003 1,0520.016 100.5
Universal Fidelity Life Ins Co OK 70122 5,976,313 4,246,308 1,9550.042 71.1
Upmc Hlth Benefits Inc PA 11018 1324 142,559 21,368 710.001 15.0
US Hlth & Life Ins Co Inc MI 97772 8,889 51,565 40.000 580.1
USAA Life Ins Co TX 69663 200 181,423,519 142,187,102 74,8561.281 78.4
USAble Life AR 94358 876 100,597 102,822 170.001 102.2
USAble Mut Ins Co AR 83470 876 202,648,797 161,925,656 87,4361.430 79.9
UTMB Hlth Plans Inc TX 95764 683,412 259,687 2510.005 38.0
Voya Retirement Ins & Ann Co CT 86509 4832 14,178 32,663 60.000 230.4
Washington Natl Ins Co IN 70319 233 56,450,214 39,506,537 15,9940.398 70.0
Wellmark Inc IA 88848 770 299,129,534 238,723,227 116,9612.111 79.8
Wellmark Of SD Inc SD 60128 770 47,106,941 35,868,849 16,3750.332 76.1
CAUTION: The information contained on this page is unaudited and not a complete analysis nor is it an expression of opinion on any insurer. This page may contain inadvertent errors.
© 2017 National Association of Insurance Commissioners 32
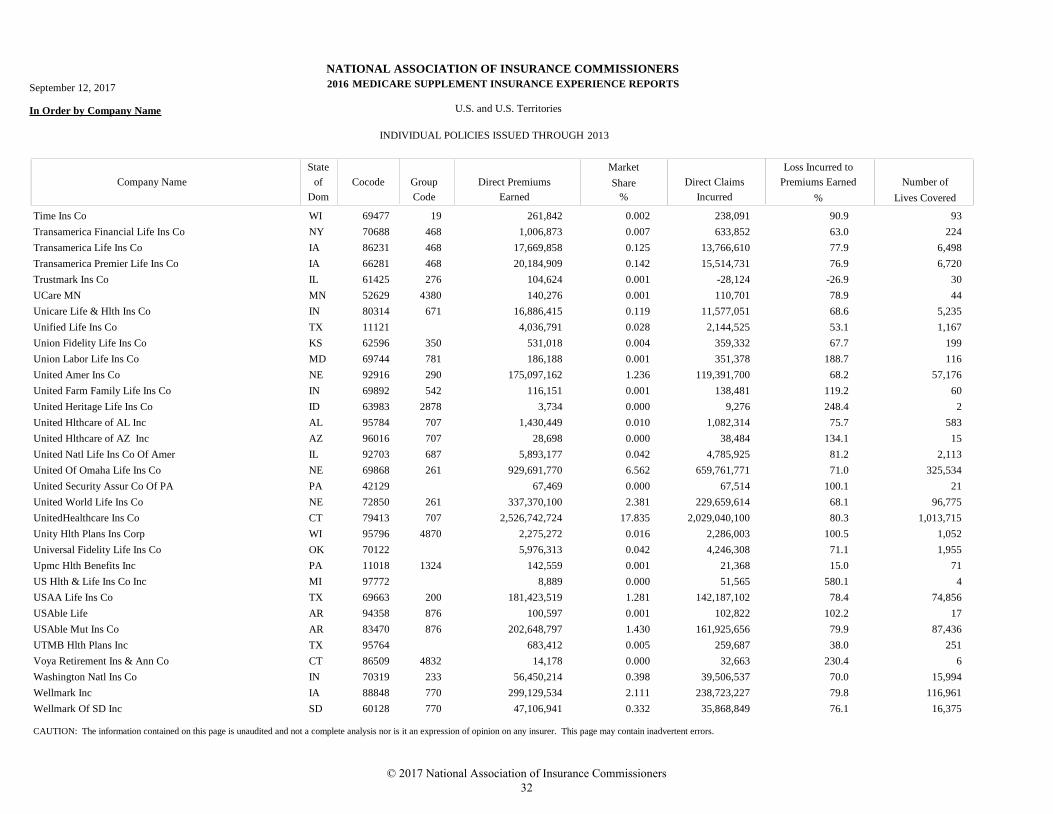
NATIONAL ASSOCIATION OF INSURANCE COMMISSIONERS
MEDICARE SUPPLEMENT INSURANCE EXPERIENCE REPORTS
In Order by Company Name U.S. and U.S. Territories
INDIVIDUAL POLICIES ISSUED THROUGH
Market
Direct Claims
Incurred
Loss Incurred to
Premiums Earned Number of
Lives Covered
Direct Premiums
Earned
Company Name
State
Dom
Cocode Group
Code
of Share
% %
September 12, 2017 2016
2013
Wilco Life Ins Co IN 65900 4213 1,381,003 1,396,480 4480.010 101.1
Wisconsin Physicians Serv Ins Corp WI 53139 68 94,134,691 59,863,678 28,2370.664 63.6
WMI Mut Ins Co UT 68420 450,654 366,413 1430.003 81.3
WPS Hlth Plan Inc WI 10159 68 200,069 64,274 350.001 32.1
14,167,707,010 10,718,698,427 5,365,068TOTAL 75.7
CAUTION: The information contained on this page is unaudited and not a complete analysis nor is it an expression of opinion on any insurer. This page may contain inadvertent errors.
© 2017 National Association of Insurance Commissioners 33

© 2017 National Association of Insurance Commissioners 34
INDIVIDUAL POLICIES ISSUED IN 2014, 2015 AND 2016 BY DIRECT PREMIUMS EARNED
© 2017 National Association of Insurance Commissioners 35

© 2017 National Association of Insurance Commissioners 36
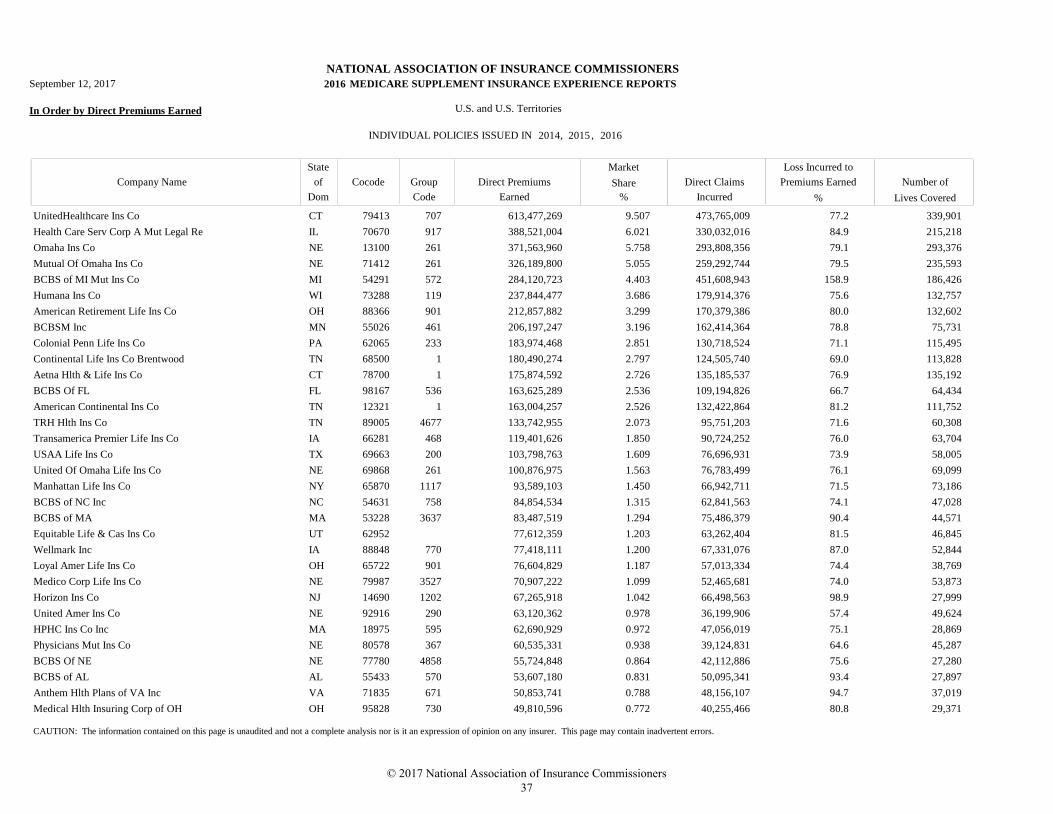
NATIONAL ASSOCIATION OF INSURANCE COMMISSIONERS
MEDICARE SUPPLEMENT INSURANCE EXPERIENCE REPORTS
In Order by Direct Premiums Earned U.S. and U.S. Territories
INDIVIDUAL POLICIES ISSUED IN
Market
Direct Claims
Incurred
Loss Incurred to
Premiums Earned Number of
Lives Covered
Direct Premiums
Earned
Company Name
State
Dom
Cocode Group
Code
of Share
% %
2016
2014 2015 2016, ,
September 12, 2017
UnitedHealthcare Ins Co CT 79413 707 613,477,269 473,765,009 339,9019.507 77.2
Health Care Serv Corp A Mut Legal Re IL 70670 917 388,521,004 330,032,016 215,2186.021 84.9
Omaha Ins Co NE 13100 261 371,563,960 293,808,356 293,3765.758 79.1
Mutual Of Omaha Ins Co NE 71412 261 326,189,800 259,292,744 235,5935.055 79.5
BCBS of MI Mut Ins Co MI 54291 572 284,120,723 451,608,943 186,4264.403 158.9
Humana Ins Co WI 73288 119 237,844,477 179,914,376 132,7573.686 75.6
American Retirement Life Ins Co OH 88366 901 212,857,882 170,379,386 132,6023.299 80.0
BCBSM Inc MN 55026 461 206,197,247 162,414,364 75,7313.196 78.8
Colonial Penn Life Ins Co PA 62065 233 183,974,468 130,718,524 115,4952.851 71.1
Continental Life Ins Co Brentwood TN 68500 1 180,490,274 124,505,740 113,8282.797 69.0
Aetna Hlth & Life Ins Co CT 78700 1 175,874,592 135,185,537 135,1922.726 76.9
BCBS Of FL FL 98167 536 163,625,289 109,194,826 64,4342.536 66.7
American Continental Ins Co TN 12321 1 163,004,257 132,422,864 111,7522.526 81.2
TRH Hlth Ins Co TN 89005 4677 133,742,955 95,751,203 60,3082.073 71.6
Transamerica Premier Life Ins Co IA 66281 468 119,401,626 90,724,252 63,7041.850 76.0
USAA Life Ins Co TX 69663 200 103,798,763 76,696,931 58,0051.609 73.9
United Of Omaha Life Ins Co NE 69868 261 100,876,975 76,783,499 69,0991.563 76.1
Manhattan Life Ins Co NY 65870 1117 93,589,103 66,942,711 73,1861.450 71.5
BCBS of NC Inc NC 54631 758 84,854,534 62,841,563 47,0281.315 74.1
BCBS of MA MA 53228 3637 83,487,519 75,486,379 44,5711.294 90.4
Equitable Life & Cas Ins Co UT 62952 77,612,359 63,262,404 46,8451.203 81.5
Wellmark Inc IA 88848 770 77,418,111 67,331,076 52,8441.200 87.0
Loyal Amer Life Ins Co OH 65722 901 76,604,829 57,013,334 38,7691.187 74.4
Medico Corp Life Ins Co NE 79987 3527 70,907,222 52,465,681 53,8731.099 74.0
Horizon Ins Co NJ 14690 1202 67,265,918 66,498,563 27,9991.042 98.9
United Amer Ins Co NE 92916 290 63,120,362 36,199,906 49,6240.978 57.4
HPHC Ins Co Inc MA 18975 595 62,690,929 47,056,019 28,8690.972 75.1
Physicians Mut Ins Co NE 80578 367 60,535,331 39,124,831 45,2870.938 64.6
BCBS Of NE NE 77780 4858 55,724,848 42,112,886 27,2800.864 75.6
BCBS of AL AL 55433 570 53,607,180 50,095,341 27,8970.831 93.4
Anthem Hlth Plans of VA Inc VA 71835 671 50,853,741 48,156,107 37,0190.788 94.7
Medical Hlth Insuring Corp of OH OH 95828 730 49,810,596 40,255,466 29,3710.772 80.8
CAUTION: The information contained on this page is unaudited and not a complete analysis nor is it an expression of opinion on any insurer. This page may contain inadvertent errors.
© 2017 National Association of Insurance Commissioners 37
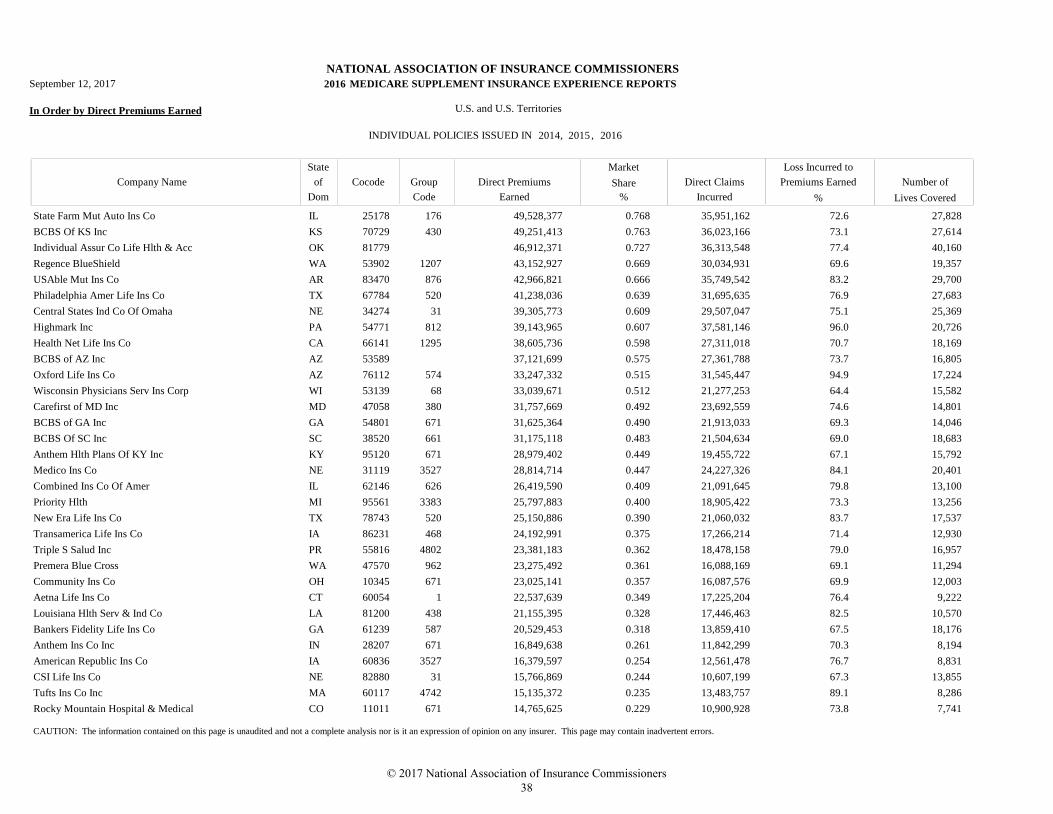
NATIONAL ASSOCIATION OF INSURANCE COMMISSIONERS
MEDICARE SUPPLEMENT INSURANCE EXPERIENCE REPORTS
In Order by Direct Premiums Earned U.S. and U.S. Territories
INDIVIDUAL POLICIES ISSUED IN
Market
Direct Claims
Incurred
Loss Incurred to
Premiums Earned Number of
Lives Covered
Direct Premiums
Earned
Company Name
State
Dom
Cocode Group
Code
of Share
% %
2016
2014 2015 2016, ,
September 12, 2017
State Farm Mut Auto Ins Co IL 25178 176 49,528,377 35,951,162 27,8280.768 72.6
BCBS Of KS Inc KS 70729 430 49,251,413 36,023,166 27,6140.763 73.1
Individual Assur Co Life Hlth & Acc OK 81779 46,912,371 36,313,548 40,1600.727 77.4
Regence BlueShield WA 53902 1207 43,152,927 30,034,931 19,3570.669 69.6
USAble Mut Ins Co AR 83470 876 42,966,821 35,749,542 29,7000.666 83.2
Philadelphia Amer Life Ins Co TX 67784 520 41,238,036 31,695,635 27,6830.639 76.9
Central States Ind Co Of Omaha NE 34274 31 39,305,773 29,507,047 25,3690.609 75.1
Highmark Inc PA 54771 812 39,143,965 37,581,146 20,7260.607 96.0
Health Net Life Ins Co CA 66141 1295 38,605,736 27,311,018 18,1690.598 70.7
BCBS of AZ Inc AZ 53589 37,121,699 27,361,788 16,8050.575 73.7
Oxford Life Ins Co AZ 76112 574 33,247,332 31,545,447 17,2240.515 94.9
Wisconsin Physicians Serv Ins Corp WI 53139 68 33,039,671 21,277,253 15,5820.512 64.4
Carefirst of MD Inc MD 47058 380 31,757,669 23,692,559 14,8010.492 74.6
BCBS of GA Inc GA 54801 671 31,625,364 21,913,033 14,0460.490 69.3
BCBS Of SC Inc SC 38520 661 31,175,118 21,504,634 18,6830.483 69.0
Anthem Hlth Plans Of KY Inc KY 95120 671 28,979,402 19,455,722 15,7920.449 67.1
Medico Ins Co NE 31119 3527 28,814,714 24,227,326 20,4010.447 84.1
Combined Ins Co Of Amer IL 62146 626 26,419,590 21,091,645 13,1000.409 79.8
Priority Hlth MI 95561 3383 25,797,883 18,905,422 13,2560.400 73.3
New Era Life Ins Co TX 78743 520 25,150,886 21,060,032 17,5370.390 83.7
Transamerica Life Ins Co IA 86231 468 24,192,991 17,266,214 12,9300.375 71.4
Triple S Salud Inc PR 55816 4802 23,381,183 18,478,158 16,9570.362 79.0
Premera Blue Cross WA 47570 962 23,275,492 16,088,169 11,2940.361 69.1
Community Ins Co OH 10345 671 23,025,141 16,087,576 12,0030.357 69.9
Aetna Life Ins Co CT 60054 1 22,537,639 17,225,204 9,2220.349 76.4
Louisiana Hlth Serv & Ind Co LA 81200 438 21,155,395 17,446,463 10,5700.328 82.5
Bankers Fidelity Life Ins Co GA 61239 587 20,529,453 13,859,410 18,1760.318 67.5
Anthem Ins Co Inc IN 28207 671 16,849,638 11,842,299 8,1940.261 70.3
American Republic Ins Co IA 60836 3527 16,379,597 12,561,478 8,8310.254 76.7
CSI Life Ins Co NE 82880 31 15,766,869 10,607,199 13,8550.244 67.3
Tufts Ins Co Inc MA 60117 4742 15,135,372 13,483,757 8,2860.235 89.1
Rocky Mountain Hospital & Medical CO 11011 671 14,765,625 10,900,928 7,7410.229 73.8
CAUTION: The information contained on this page is unaudited and not a complete analysis nor is it an expression of opinion on any insurer. This page may contain inadvertent errors.
© 2017 National Association of Insurance Commissioners 38
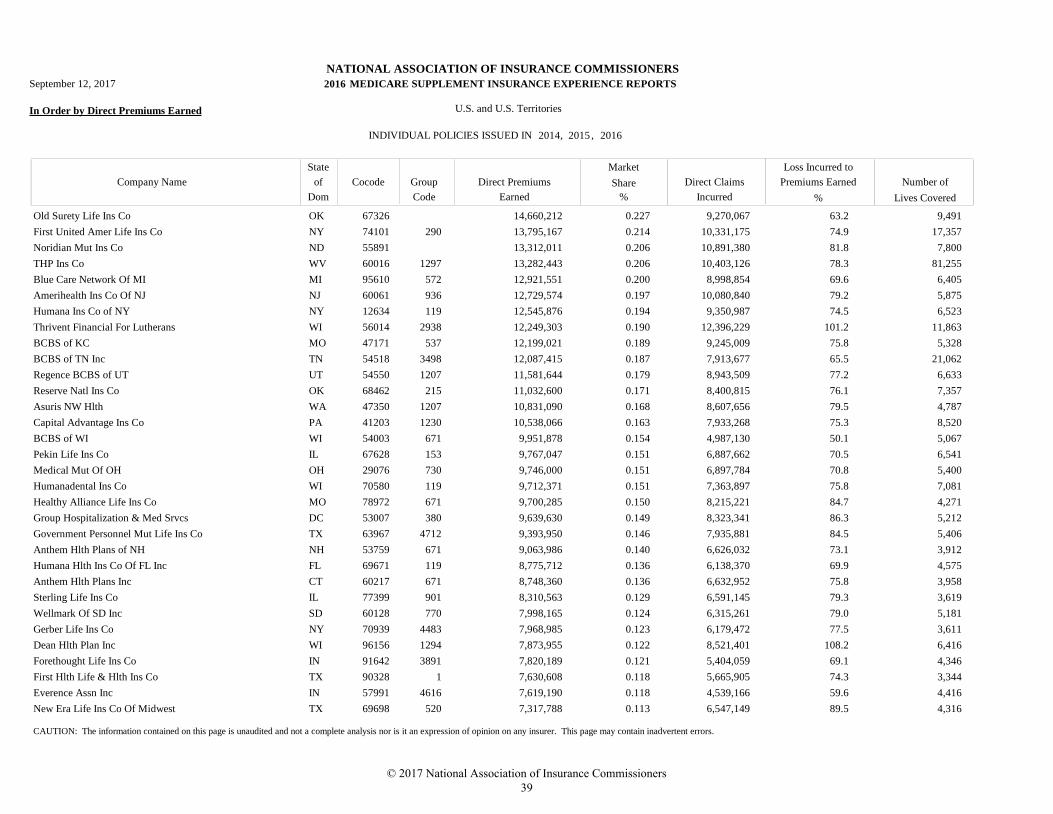
NATIONAL ASSOCIATION OF INSURANCE COMMISSIONERS
MEDICARE SUPPLEMENT INSURANCE EXPERIENCE REPORTS
In Order by Direct Premiums Earned U.S. and U.S. Territories
INDIVIDUAL POLICIES ISSUED IN
Market
Direct Claims
Incurred
Loss Incurred to
Premiums Earned Number of
Lives Covered
Direct Premiums
Earned
Company Name
State
Dom
Cocode Group
Code
of Share
% %
2016
2014 2015 2016, ,
September 12, 2017
Old Surety Life Ins Co OK 67326 14,660,212 9,270,067 9,4910.227 63.2
First United Amer Life Ins Co NY 74101 290 13,795,167 10,331,175 17,3570.214 74.9
Noridian Mut Ins Co ND 55891 13,312,011 10,891,380 7,8000.206 81.8
THP Ins Co WV 60016 1297 13,282,443 10,403,126 81,2550.206 78.3
Blue Care Network Of MI MI 95610 572 12,921,551 8,998,854 6,4050.200 69.6
Amerihealth Ins Co Of NJ NJ 60061 936 12,729,574 10,080,840 5,8750.197 79.2
Humana Ins Co of NY NY 12634 119 12,545,876 9,350,987 6,5230.194 74.5
Thrivent Financial For Lutherans WI 56014 2938 12,249,303 12,396,229 11,8630.190 101.2
BCBS of KC MO 47171 537 12,199,021 9,245,009 5,3280.189 75.8
BCBS of TN Inc TN 54518 3498 12,087,415 7,913,677 21,0620.187 65.5
Regence BCBS of UT UT 54550 1207 11,581,644 8,943,509 6,6330.179 77.2
Reserve Natl Ins Co OK 68462 215 11,032,600 8,400,815 7,3570.171 76.1
Asuris NW Hlth WA 47350 1207 10,831,090 8,607,656 4,7870.168 79.5
Capital Advantage Ins Co PA 41203 1230 10,538,066 7,933,268 8,5200.163 75.3
BCBS of WI WI 54003 671 9,951,878 4,987,130 5,0670.154 50.1
Pekin Life Ins Co IL 67628 153 9,767,047 6,887,662 6,5410.151 70.5
Medical Mut Of OH OH 29076 730 9,746,000 6,897,784 5,4000.151 70.8
Humanadental Ins Co WI 70580 119 9,712,371 7,363,897 7,0810.151 75.8
Healthy Alliance Life Ins Co MO 78972 671 9,700,285 8,215,221 4,2710.150 84.7
Group Hospitalization & Med Srvcs DC 53007 380 9,639,630 8,323,341 5,2120.149 86.3
Government Personnel Mut Life Ins Co TX 63967 4712 9,393,950 7,935,881 5,4060.146 84.5
Anthem Hlth Plans of NH NH 53759 671 9,063,986 6,626,032 3,9120.140 73.1
Humana Hlth Ins Co Of FL Inc FL 69671 119 8,775,712 6,138,370 4,5750.136 69.9
Anthem Hlth Plans Inc CT 60217 671 8,748,360 6,632,952 3,9580.136 75.8
Sterling Life Ins Co IL 77399 901 8,310,563 6,591,145 3,6190.129 79.3
Wellmark Of SD Inc SD 60128 770 7,998,165 6,315,261 5,1810.124 79.0
Gerber Life Ins Co NY 70939 4483 7,968,985 6,179,472 3,6110.123 77.5
Dean Hlth Plan Inc WI 96156 1294 7,873,955 8,521,401 6,4160.122 108.2
Forethought Life Ins Co IN 91642 3891 7,820,189 5,404,059 4,3460.121 69.1
First Hlth Life & Hlth Ins Co TX 90328 1 7,630,608 5,665,905 3,3440.118 74.3
Everence Assn Inc IN 57991 4616 7,619,190 4,539,166 4,4160.118 59.6
New Era Life Ins Co Of Midwest TX 69698 520 7,317,788 6,547,149 4,3160.113 89.5
CAUTION: The information contained on this page is unaudited and not a complete analysis nor is it an expression of opinion on any insurer. This page may contain inadvertent errors.
© 2017 National Association of Insurance Commissioners 39
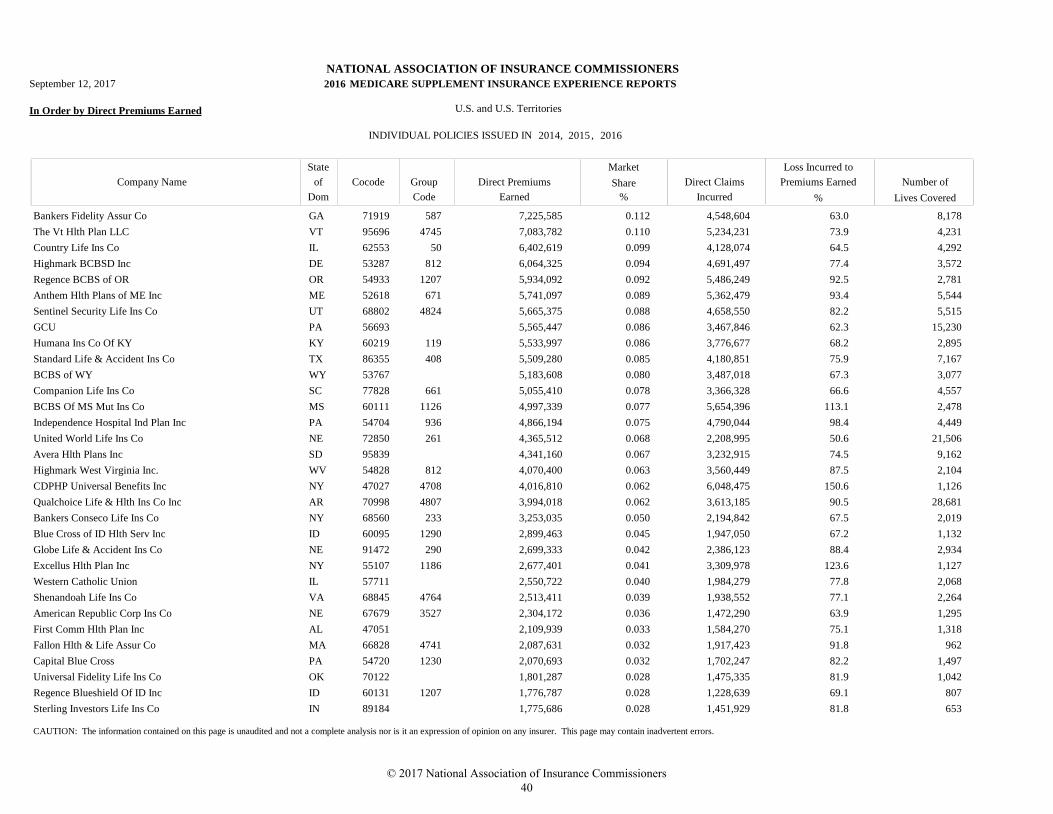
NATIONAL ASSOCIATION OF INSURANCE COMMISSIONERS
MEDICARE SUPPLEMENT INSURANCE EXPERIENCE REPORTS
In Order by Direct Premiums Earned U.S. and U.S. Territories
INDIVIDUAL POLICIES ISSUED IN
Market
Direct Claims
Incurred
Loss Incurred to
Premiums Earned Number of
Lives Covered
Direct Premiums
Earned
Company Name
State
Dom
Cocode Group
Code
of Share
% %
2016
2014 2015 2016, ,
September 12, 2017
Bankers Fidelity Assur Co GA 71919 587 7,225,585 4,548,604 8,1780.112 63.0
The Vt Hlth Plan LLC VT 95696 4745 7,083,782 5,234,231 4,2310.110 73.9
Country Life Ins Co IL 62553 50 6,402,619 4,128,074 4,2920.099 64.5
Highmark BCBSD Inc DE 53287 812 6,064,325 4,691,497 3,5720.094 77.4
Regence BCBS of OR OR 54933 1207 5,934,092 5,486,249 2,7810.092 92.5
Anthem Hlth Plans of ME Inc ME 52618 671 5,741,097 5,362,479 5,5440.089 93.4
Sentinel Security Life Ins Co UT 68802 4824 5,665,375 4,658,550 5,5150.088 82.2
GCU PA 56693 5,565,447 3,467,846 15,2300.086 62.3
Humana Ins Co Of KY KY 60219 119 5,533,997 3,776,677 2,8950.086 68.2
Standard Life & Accident Ins Co TX 86355 408 5,509,280 4,180,851 7,1670.085 75.9
BCBS of WY WY 53767 5,183,608 3,487,018 3,0770.080 67.3
Companion Life Ins Co SC 77828 661 5,055,410 3,366,328 4,5570.078 66.6
BCBS Of MS Mut Ins Co MS 60111 1126 4,997,339 5,654,396 2,4780.077 113.1
Independence Hospital Ind Plan Inc PA 54704 936 4,866,194 4,790,044 4,4490.075 98.4
United World Life Ins Co NE 72850 261 4,365,512 2,208,995 21,5060.068 50.6
Avera Hlth Plans Inc SD 95839 4,341,160 3,232,915 9,1620.067 74.5
Highmark West Virginia Inc. WV 54828 812 4,070,400 3,560,449 2,1040.063 87.5
CDPHP Universal Benefits Inc NY 47027 4708 4,016,810 6,048,475 1,1260.062 150.6
Qualchoice Life & Hlth Ins Co Inc AR 70998 4807 3,994,018 3,613,185 28,6810.062 90.5
Bankers Conseco Life Ins Co NY 68560 233 3,253,035 2,194,842 2,0190.050 67.5
Blue Cross of ID Hlth Serv Inc ID 60095 1290 2,899,463 1,947,050 1,1320.045 67.2
Globe Life & Accident Ins Co NE 91472 290 2,699,333 2,386,123 2,9340.042 88.4
Excellus Hlth Plan Inc NY 55107 1186 2,677,401 3,309,978 1,1270.041 123.6
Western Catholic Union IL 57711 2,550,722 1,984,279 2,0680.040 77.8
Shenandoah Life Ins Co VA 68845 4764 2,513,411 1,938,552 2,2640.039 77.1
American Republic Corp Ins Co NE 67679 3527 2,304,172 1,472,290 1,2950.036 63.9
First Comm Hlth Plan Inc AL 47051 2,109,939 1,584,270 1,3180.033 75.1
Fallon Hlth & Life Assur Co MA 66828 4741 2,087,631 1,917,423 9620.032 91.8
Capital Blue Cross PA 54720 1230 2,070,693 1,702,247 1,4970.032 82.2
Universal Fidelity Life Ins Co OK 70122 1,801,287 1,475,335 1,0420.028 81.9
Regence Blueshield Of ID Inc ID 60131 1207 1,776,787 1,228,639 8070.028 69.1
Sterling Investors Life Ins Co IN 89184 1,775,686 1,451,929 6530.028 81.8
CAUTION: The information contained on this page is unaudited and not a complete analysis nor is it an expression of opinion on any insurer. This page may contain inadvertent errors.
© 2017 National Association of Insurance Commissioners 40
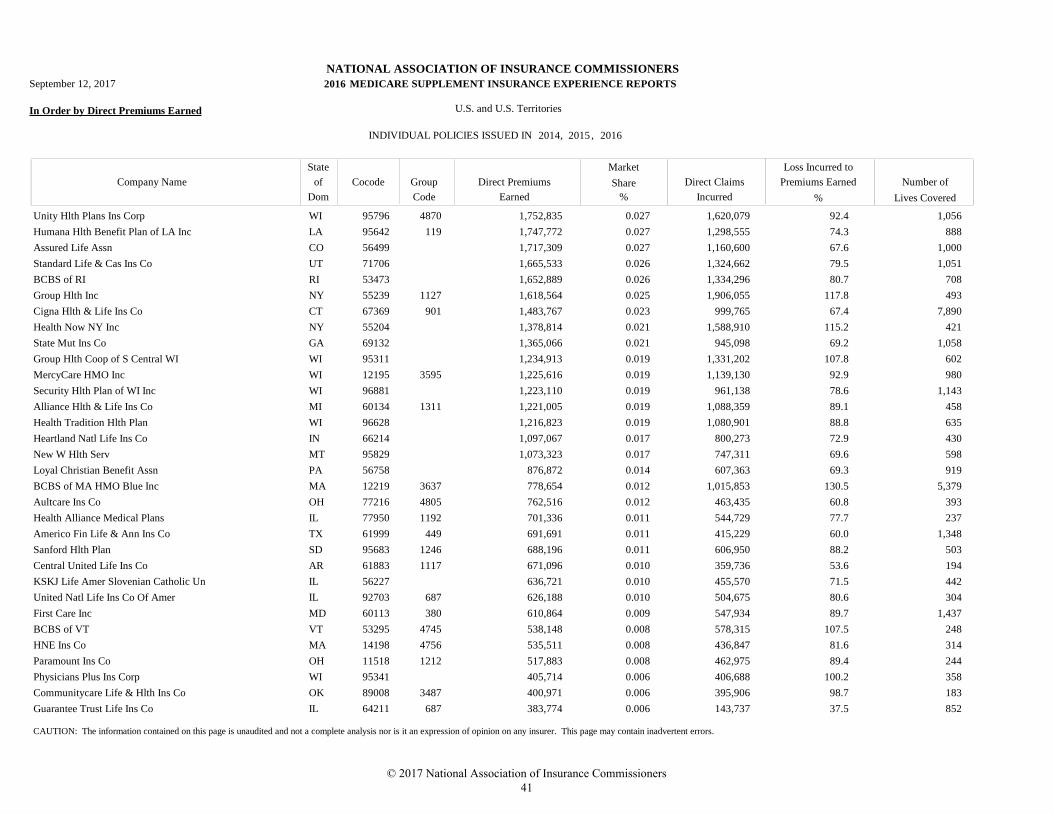
NATIONAL ASSOCIATION OF INSURANCE COMMISSIONERS
MEDICARE SUPPLEMENT INSURANCE EXPERIENCE REPORTS
In Order by Direct Premiums Earned U.S. and U.S. Territories
INDIVIDUAL POLICIES ISSUED IN
Market
Direct Claims
Incurred
Loss Incurred to
Premiums Earned Number of
Lives Covered
Direct Premiums
Earned
Company Name
State
Dom
Cocode Group
Code
of Share
% %
2016
2014 2015 2016, ,
September 12, 2017
Unity Hlth Plans Ins Corp WI 95796 4870 1,752,835 1,620,079 1,0560.027 92.4
Humana Hlth Benefit Plan of LA Inc LA 95642 119 1,747,772 1,298,555 8880.027 74.3
Assured Life Assn CO 56499 1,717,309 1,160,600 1,0000.027 67.6
Standard Life & Cas Ins Co UT 71706 1,665,533 1,324,662 1,0510.026 79.5
BCBS of RI RI 53473 1,652,889 1,334,296 7080.026 80.7
Group Hlth Inc NY 55239 1127 1,618,564 1,906,055 4930.025 117.8
Cigna Hlth & Life Ins Co CT 67369 901 1,483,767 999,765 7,8900.023 67.4
Health Now NY Inc NY 55204 1,378,814 1,588,910 4210.021 115.2
State Mut Ins Co GA 69132 1,365,066 945,098 1,0580.021 69.2
Group Hlth Coop of S Central WI WI 95311 1,234,913 1,331,202 6020.019 107.8
MercyCare HMO Inc WI 12195 3595 1,225,616 1,139,130 9800.019 92.9
Security Hlth Plan of WI Inc WI 96881 1,223,110 961,138 1,1430.019 78.6
Alliance Hlth & Life Ins Co MI 60134 1311 1,221,005 1,088,359 4580.019 89.1
Health Tradition Hlth Plan WI 96628 1,216,823 1,080,901 6350.019 88.8
Heartland Natl Life Ins Co IN 66214 1,097,067 800,273 4300.017 72.9
New W Hlth Serv MT 95829 1,073,323 747,311 5980.017 69.6
Loyal Christian Benefit Assn PA 56758 876,872 607,363 9190.014 69.3
BCBS of MA HMO Blue Inc MA 12219 3637 778,654 1,015,853 5,3790.012 130.5
Aultcare Ins Co OH 77216 4805 762,516 463,435 3930.012 60.8
Health Alliance Medical Plans IL 77950 1192 701,336 544,729 2370.011 77.7
Americo Fin Life & Ann Ins Co TX 61999 449 691,691 415,229 1,3480.011 60.0
Sanford Hlth Plan SD 95683 1246 688,196 606,950 5030.011 88.2
Central United Life Ins Co AR 61883 1117 671,096 359,736 1940.010 53.6
KSKJ Life Amer Slovenian Catholic Un IL 56227 636,721 455,570 4420.010 71.5
United Natl Life Ins Co Of Amer IL 92703 687 626,188 504,675 3040.010 80.6
First Care Inc MD 60113 380 610,864 547,934 1,4370.009 89.7
BCBS of VT VT 53295 4745 538,148 578,315 2480.008 107.5
HNE Ins Co MA 14198 4756 535,511 436,847 3140.008 81.6
Paramount Ins Co OH 11518 1212 517,883 462,975 2440.008 89.4
Physicians Plus Ins Corp WI 95341 405,714 406,688 3580.006 100.2
Communitycare Life & Hlth Ins Co OK 89008 3487 400,971 395,906 1830.006 98.7
Guarantee Trust Life Ins Co IL 64211 687 383,774 143,737 8520.006 37.5
CAUTION: The information contained on this page is unaudited and not a complete analysis nor is it an expression of opinion on any insurer. This page may contain inadvertent errors.
© 2017 National Association of Insurance Commissioners 41
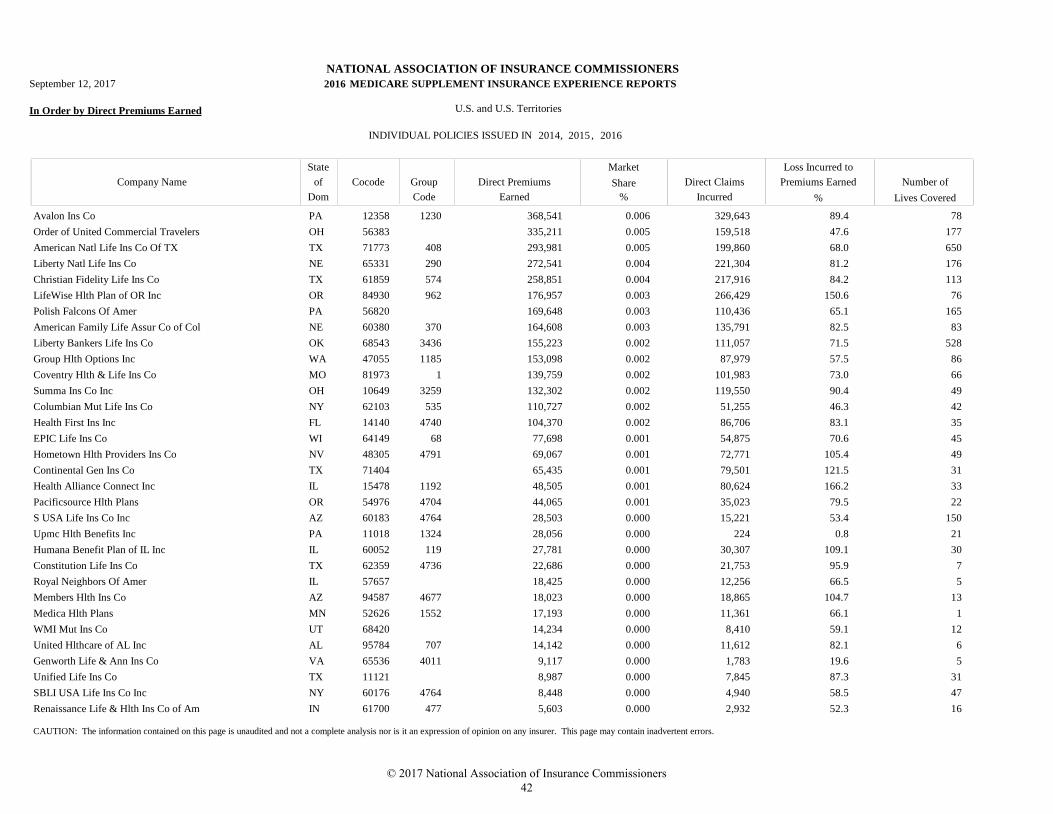
NATIONAL ASSOCIATION OF INSURANCE COMMISSIONERS
MEDICARE SUPPLEMENT INSURANCE EXPERIENCE REPORTS
In Order by Direct Premiums Earned U.S. and U.S. Territories
INDIVIDUAL POLICIES ISSUED IN
Market
Direct Claims
Incurred
Loss Incurred to
Premiums Earned Number of
Lives Covered
Direct Premiums
Earned
Company Name
State
Dom
Cocode Group
Code
of Share
% %
2016
2014 2015 2016, ,
September 12, 2017
Avalon Ins Co PA 12358 1230 368,541 329,643 780.006 89.4
Order of United Commercial Travelers OH 56383 335,211 159,518 1770.005 47.6
American Natl Life Ins Co Of TX TX 71773 408 293,981 199,860 6500.005 68.0
Liberty Natl Life Ins Co NE 65331 290 272,541 221,304 1760.004 81.2
Christian Fidelity Life Ins Co TX 61859 574 258,851 217,916 1130.004 84.2
LifeWise Hlth Plan of OR Inc OR 84930 962 176,957 266,429 760.003 150.6
Polish Falcons Of Amer PA 56820 169,648 110,436 1650.003 65.1
American Family Life Assur Co of Col NE 60380 370 164,608 135,791 830.003 82.5
Liberty Bankers Life Ins Co OK 68543 3436 155,223 111,057 5280.002 71.5
Group Hlth Options Inc WA 47055 1185 153,098 87,979 860.002 57.5
Coventry Hlth & Life Ins Co MO 81973 1 139,759 101,983 660.002 73.0
Summa Ins Co Inc OH 10649 3259 132,302 119,550 490.002 90.4
Columbian Mut Life Ins Co NY 62103 535 110,727 51,255 420.002 46.3
Health First Ins Inc FL 14140 4740 104,370 86,706 350.002 83.1
EPIC Life Ins Co WI 64149 68 77,698 54,875 450.001 70.6
Hometown Hlth Providers Ins Co NV 48305 4791 69,067 72,771 490.001 105.4
Continental Gen Ins Co TX 71404 65,435 79,501 310.001 121.5
Health Alliance Connect Inc IL 15478 1192 48,505 80,624 330.001 166.2
Pacificsource Hlth Plans OR 54976 4704 44,065 35,023 220.001 79.5
S USA Life Ins Co Inc AZ 60183 4764 28,503 15,221 1500.000 53.4
Upmc Hlth Benefits Inc PA 11018 1324 28,056 224 210.000 0.8
Humana Benefit Plan of IL Inc IL 60052 119 27,781 30,307 300.000 109.1
Constitution Life Ins Co TX 62359 4736 22,686 21,753 70.000 95.9
Royal Neighbors Of Amer IL 57657 18,425 12,256 50.000 66.5
Members Hlth Ins Co AZ 94587 4677 18,023 18,865 130.000 104.7
Medica Hlth Plans MN 52626 1552 17,193 11,361 10.000 66.1
WMI Mut Ins Co UT 68420 14,234 8,410 120.000 59.1
United Hlthcare of AL Inc AL 95784 707 14,142 11,612 60.000 82.1
Genworth Life & Ann Ins Co VA 65536 4011 9,117 1,783 50.000 19.6
Unified Life Ins Co TX 11121 8,987 7,845 310.000 87.3
SBLI USA Life Ins Co Inc NY 60176 4764 8,448 4,940 470.000 58.5
Renaissance Life & Hlth Ins Co of Am IN 61700 477 5,603 2,932 160.000 52.3
CAUTION: The information contained on this page is unaudited and not a complete analysis nor is it an expression of opinion on any insurer. This page may contain inadvertent errors.
© 2017 National Association of Insurance Commissioners 42
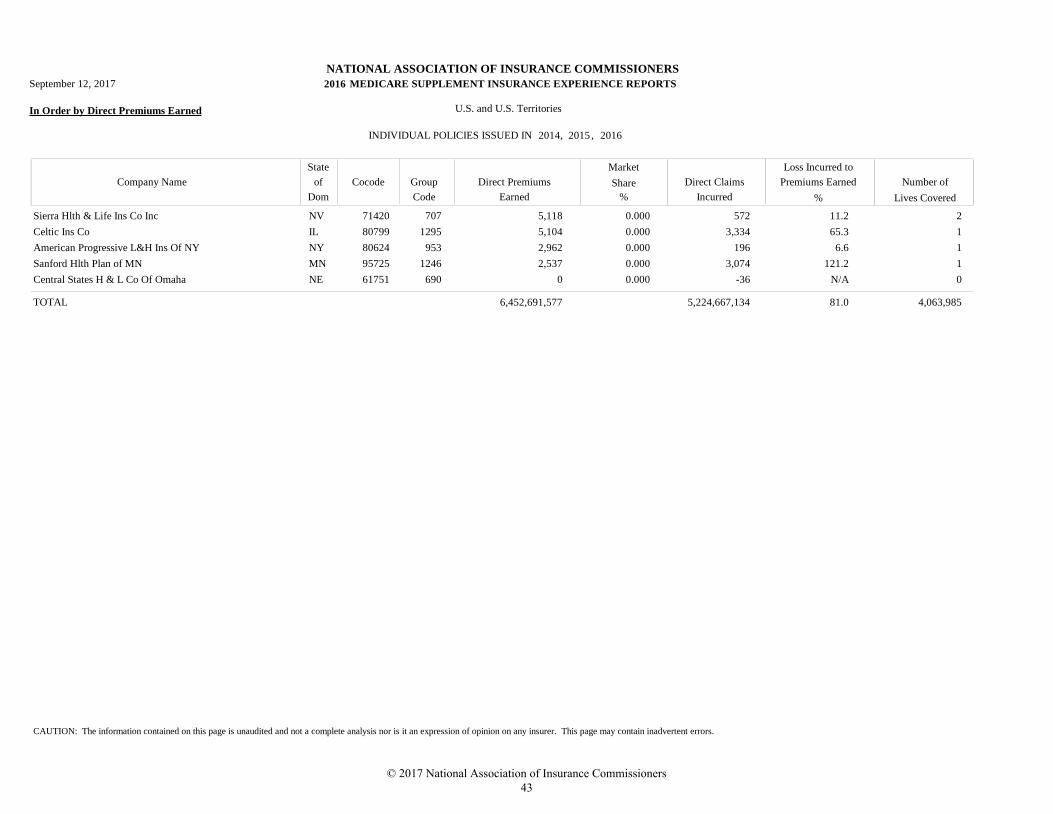
NATIONAL ASSOCIATION OF INSURANCE COMMISSIONERS
MEDICARE SUPPLEMENT INSURANCE EXPERIENCE REPORTS
In Order by Direct Premiums Earned U.S. and U.S. Territories
INDIVIDUAL POLICIES ISSUED IN
Market
Direct Claims
Incurred
Loss Incurred to
Premiums Earned Number of
Lives Covered
Direct Premiums
Earned
Company Name
State
Dom
Cocode Group
Code
of Share
% %
2016
2014 2015 2016, ,
September 12, 2017
Sierra Hlth & Life Ins Co Inc NV 71420 707 5,118 572 20.000 11.2
Celtic Ins Co IL 80799 1295 5,104 3,334 10.000 65.3
American Progressive L&H Ins Of NY NY 80624 953 2,962 196 10.000 6.6
Sanford Hlth Plan of MN MN 95725 1246 2,537 3,074 10.000 121.2
Central States H & L Co Of Omaha NE 61751 690 0 -36 00.000 N/A
6,452,691,577 5,224,667,134 4,063,985TOTAL 81.0
CAUTION: The information contained on this page is unaudited and not a complete analysis nor is it an expression of opinion on any insurer. This page may contain inadvertent errors.
© 2017 National Association of Insurance Commissioners 43

© 2017 National Association of Insurance Commissioners 44
INDIVIDUAL POLICIES ISSUED IN 2014, 2015 AND 2016 BY COMPANY NAME
© 2017 National Association of Insurance Commissioners 45

© 2017 National Association of Insurance Commissioners 46
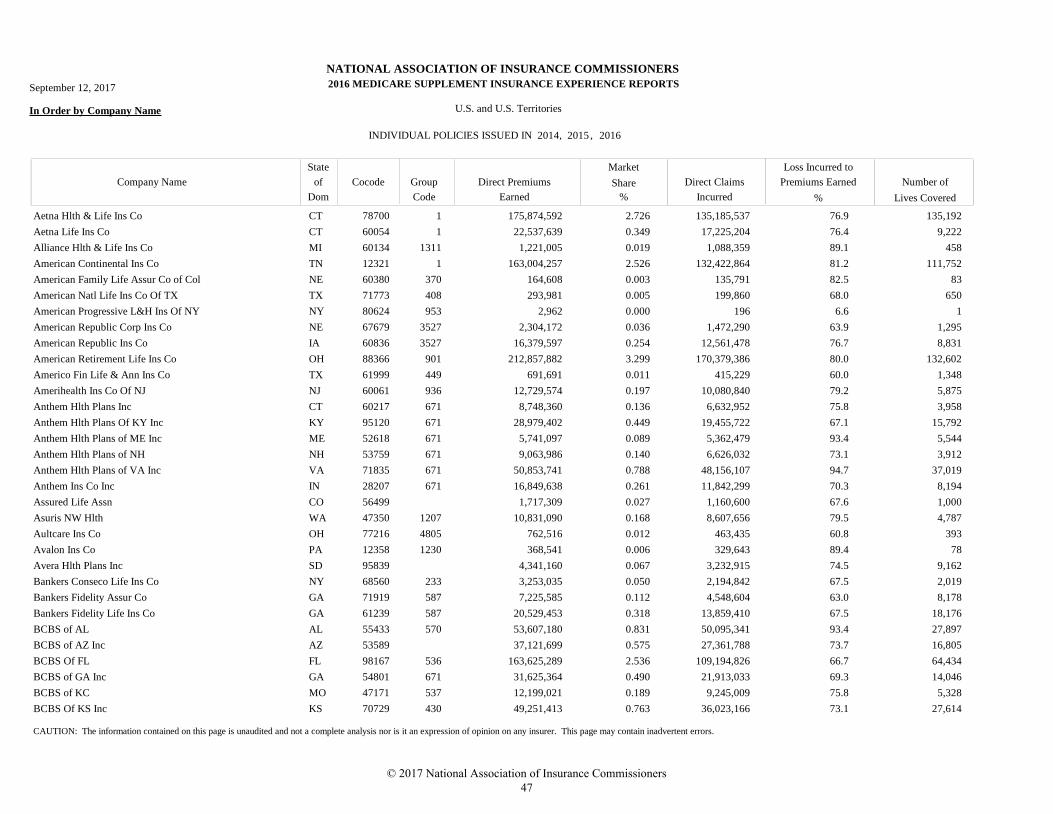
NATIONAL ASSOCIATION OF INSURANCE COMMISSIONERS
MEDICARE SUPPLEMENT INSURANCE EXPERIENCE REPORTS
In Order by Company Name U.S. and U.S. Territories
INDIVIDUAL POLICIES ISSUED IN
Market
Direct Claims
Incurred
Loss Incurred to
Premiums Earned Number of
Lives Covered
Direct Premiums
Earned
Company Name
State
Dom
Cocode Group
Code
of Share
% %
September 12, 2017 2016
2014 2015 2016, ,
Aetna Hlth & Life Ins Co CT 78700 1 175,874,592 135,185,537 135,1922.726 76.9
Aetna Life Ins Co CT 60054 1 22,537,639 17,225,204 9,2220.349 76.4
Alliance Hlth & Life Ins Co MI 60134 1311 1,221,005 1,088,359 4580.019 89.1
American Continental Ins Co TN 12321 1 163,004,257 132,422,864 111,7522.526 81.2
American Family Life Assur Co of Col NE 60380 370 164,608 135,791 830.003 82.5
American Natl Life Ins Co Of TX TX 71773 408 293,981 199,860 6500.005 68.0
American Progressive L&H Ins Of NY NY 80624 953 2,962 196 10.000 6.6
American Republic Corp Ins Co NE 67679 3527 2,304,172 1,472,290 1,2950.036 63.9
American Republic Ins Co IA 60836 3527 16,379,597 12,561,478 8,8310.254 76.7
American Retirement Life Ins Co OH 88366 901 212,857,882 170,379,386 132,6023.299 80.0
Americo Fin Life & Ann Ins Co TX 61999 449 691,691 415,229 1,3480.011 60.0
Amerihealth Ins Co Of NJ NJ 60061 936 12,729,574 10,080,840 5,8750.197 79.2
Anthem Hlth Plans Inc CT 60217 671 8,748,360 6,632,952 3,9580.136 75.8
Anthem Hlth Plans Of KY Inc KY 95120 671 28,979,402 19,455,722 15,7920.449 67.1
Anthem Hlth Plans of ME Inc ME 52618 671 5,741,097 5,362,479 5,5440.089 93.4
Anthem Hlth Plans of NH NH 53759 671 9,063,986 6,626,032 3,9120.140 73.1
Anthem Hlth Plans of VA Inc VA 71835 671 50,853,741 48,156,107 37,0190.788 94.7
Anthem Ins Co Inc IN 28207 671 16,849,638 11,842,299 8,1940.261 70.3
Assured Life Assn CO 56499 1,717,309 1,160,600 1,0000.027 67.6
Asuris NW Hlth WA 47350 1207 10,831,090 8,607,656 4,7870.168 79.5
Aultcare Ins Co OH 77216 4805 762,516 463,435 3930.012 60.8
Avalon Ins Co PA 12358 1230 368,541 329,643 780.006 89.4
Avera Hlth Plans Inc SD 95839 4,341,160 3,232,915 9,1620.067 74.5
Bankers Conseco Life Ins Co NY 68560 233 3,253,035 2,194,842 2,0190.050 67.5
Bankers Fidelity Assur Co GA 71919 587 7,225,585 4,548,604 8,1780.112 63.0
Bankers Fidelity Life Ins Co GA 61239 587 20,529,453 13,859,410 18,1760.318 67.5
BCBS of AL AL 55433 570 53,607,180 50,095,341 27,8970.831 93.4
BCBS of AZ Inc AZ 53589 37,121,699 27,361,788 16,8050.575 73.7
BCBS Of FL FL 98167 536 163,625,289 109,194,826 64,4342.536 66.7
BCBS of GA Inc GA 54801 671 31,625,364 21,913,033 14,0460.490 69.3
BCBS of KC MO 47171 537 12,199,021 9,245,009 5,3280.189 75.8
BCBS Of KS Inc KS 70729 430 49,251,413 36,023,166 27,6140.763 73.1
CAUTION: The information contained on this page is unaudited and not a complete analysis nor is it an expression of opinion on any insurer. This page may contain inadvertent errors.
© 2017 National Association of Insurance Commissioners 47
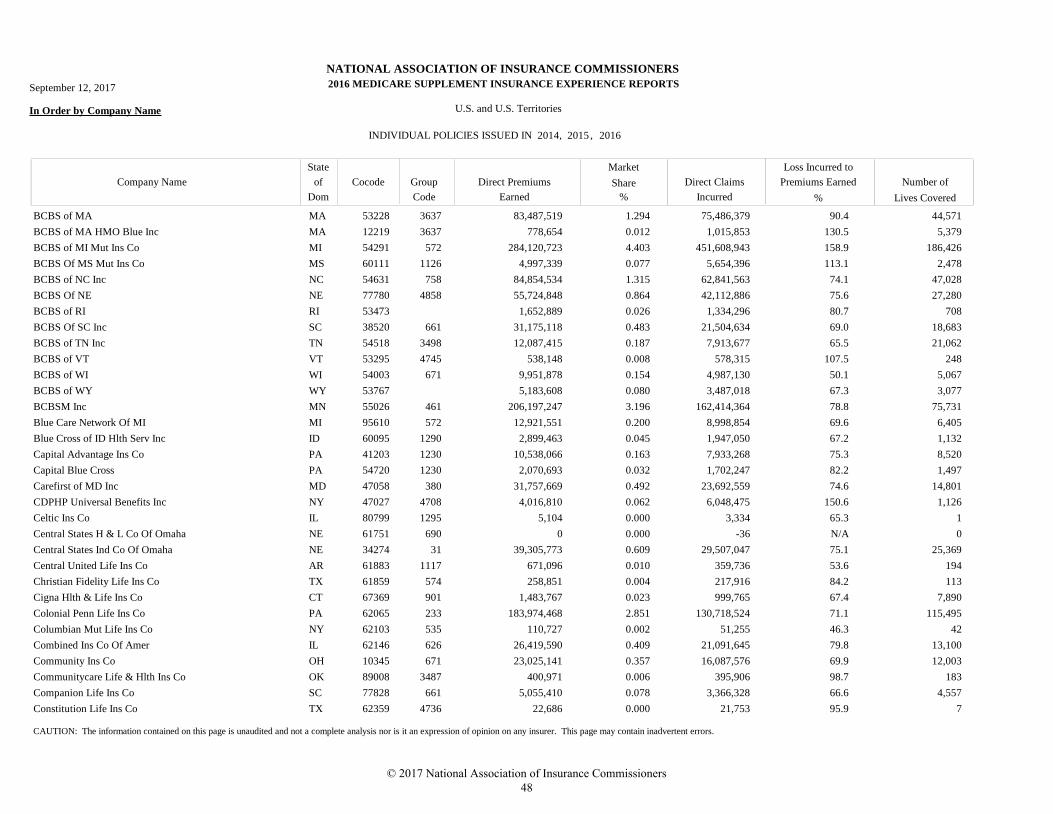
NATIONAL ASSOCIATION OF INSURANCE COMMISSIONERS
MEDICARE SUPPLEMENT INSURANCE EXPERIENCE REPORTS
In Order by Company Name U.S. and U.S. Territories
INDIVIDUAL POLICIES ISSUED IN
Market
Direct Claims
Incurred
Loss Incurred to
Premiums Earned Number of
Lives Covered
Direct Premiums
Earned
Company Name
State
Dom
Cocode Group
Code
of Share
% %
September 12, 2017 2016
2014 2015 2016, ,
BCBS of MA MA 53228 3637 83,487,519 75,486,379 44,5711.294 90.4
BCBS of MA HMO Blue Inc MA 12219 3637 778,654 1,015,853 5,3790.012 130.5
BCBS of MI Mut Ins Co MI 54291 572 284,120,723 451,608,943 186,4264.403 158.9
BCBS Of MS Mut Ins Co MS 60111 1126 4,997,339 5,654,396 2,4780.077 113.1
BCBS of NC Inc NC 54631 758 84,854,534 62,841,563 47,0281.315 74.1
BCBS Of NE NE 77780 4858 55,724,848 42,112,886 27,2800.864 75.6
BCBS of RI RI 53473 1,652,889 1,334,296 7080.026 80.7
BCBS Of SC Inc SC 38520 661 31,175,118 21,504,634 18,6830.483 69.0
BCBS of TN Inc TN 54518 3498 12,087,415 7,913,677 21,0620.187 65.5
BCBS of VT VT 53295 4745 538,148 578,315 2480.008 107.5
BCBS of WI WI 54003 671 9,951,878 4,987,130 5,0670.154 50.1
BCBS of WY WY 53767 5,183,608 3,487,018 3,0770.080 67.3
BCBSM Inc MN 55026 461 206,197,247 162,414,364 75,7313.196 78.8
Blue Care Network Of MI MI 95610 572 12,921,551 8,998,854 6,4050.200 69.6
Blue Cross of ID Hlth Serv Inc ID 60095 1290 2,899,463 1,947,050 1,1320.045 67.2
Capital Advantage Ins Co PA 41203 1230 10,538,066 7,933,268 8,5200.163 75.3
Capital Blue Cross PA 54720 1230 2,070,693 1,702,247 1,4970.032 82.2
Carefirst of MD Inc MD 47058 380 31,757,669 23,692,559 14,8010.492 74.6
CDPHP Universal Benefits Inc NY 47027 4708 4,016,810 6,048,475 1,1260.062 150.6
Celtic Ins Co IL 80799 1295 5,104 3,334 10.000 65.3
Central States H & L Co Of Omaha NE 61751 690 0 -36 00.000 N/A
Central States Ind Co Of Omaha NE 34274 31 39,305,773 29,507,047 25,3690.609 75.1
Central United Life Ins Co AR 61883 1117 671,096 359,736 1940.010 53.6
Christian Fidelity Life Ins Co TX 61859 574 258,851 217,916 1130.004 84.2
Cigna Hlth & Life Ins Co CT 67369 901 1,483,767 999,765 7,8900.023 67.4
Colonial Penn Life Ins Co PA 62065 233 183,974,468 130,718,524 115,4952.851 71.1
Columbian Mut Life Ins Co NY 62103 535 110,727 51,255 420.002 46.3
Combined Ins Co Of Amer IL 62146 626 26,419,590 21,091,645 13,1000.409 79.8
Community Ins Co OH 10345 671 23,025,141 16,087,576 12,0030.357 69.9
Communitycare Life & Hlth Ins Co OK 89008 3487 400,971 395,906 1830.006 98.7
Companion Life Ins Co SC 77828 661 5,055,410 3,366,328 4,5570.078 66.6
Constitution Life Ins Co TX 62359 4736 22,686 21,753 70.000 95.9
CAUTION: The information contained on this page is unaudited and not a complete analysis nor is it an expression of opinion on any insurer. This page may contain inadvertent errors.
© 2017 National Association of Insurance Commissioners 48
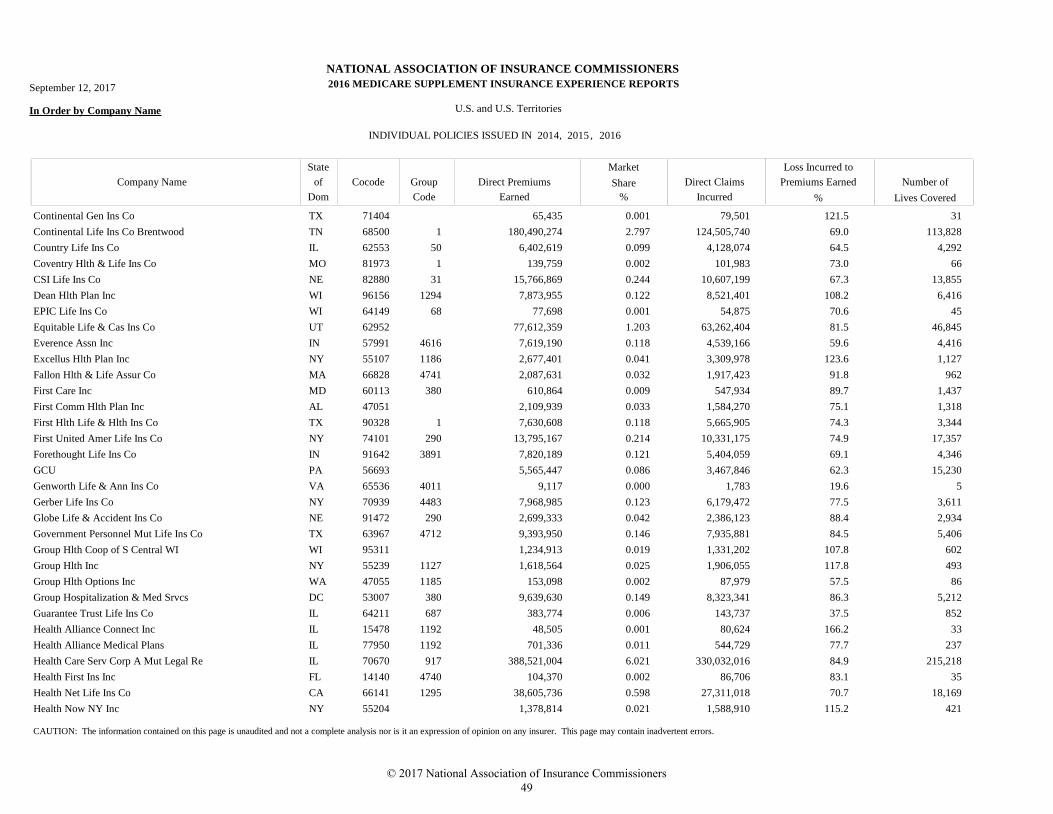
NATIONAL ASSOCIATION OF INSURANCE COMMISSIONERS
MEDICARE SUPPLEMENT INSURANCE EXPERIENCE REPORTS
In Order by Company Name U.S. and U.S. Territories
INDIVIDUAL POLICIES ISSUED IN
Market
Direct Claims
Incurred
Loss Incurred to
Premiums Earned Number of
Lives Covered
Direct Premiums
Earned
Company Name
State
Dom
Cocode Group
Code
of Share
% %
September 12, 2017 2016
2014 2015 2016, ,
Continental Gen Ins Co TX 71404 65,435 79,501 310.001 121.5
Continental Life Ins Co Brentwood TN 68500 1 180,490,274 124,505,740 113,8282.797 69.0
Country Life Ins Co IL 62553 50 6,402,619 4,128,074 4,2920.099 64.5
Coventry Hlth & Life Ins Co MO 81973 1 139,759 101,983 660.002 73.0
CSI Life Ins Co NE 82880 31 15,766,869 10,607,199 13,8550.244 67.3
Dean Hlth Plan Inc WI 96156 1294 7,873,955 8,521,401 6,4160.122 108.2
EPIC Life Ins Co WI 64149 68 77,698 54,875 450.001 70.6
Equitable Life & Cas Ins Co UT 62952 77,612,359 63,262,404 46,8451.203 81.5
Everence Assn Inc IN 57991 4616 7,619,190 4,539,166 4,4160.118 59.6
Excellus Hlth Plan Inc NY 55107 1186 2,677,401 3,309,978 1,1270.041 123.6
Fallon Hlth & Life Assur Co MA 66828 4741 2,087,631 1,917,423 9620.032 91.8
First Care Inc MD 60113 380 610,864 547,934 1,4370.009 89.7
First Comm Hlth Plan Inc AL 47051 2,109,939 1,584,270 1,3180.033 75.1
First Hlth Life & Hlth Ins Co TX 90328 1 7,630,608 5,665,905 3,3440.118 74.3
First United Amer Life Ins Co NY 74101 290 13,795,167 10,331,175 17,3570.214 74.9
Forethought Life Ins Co IN 91642 3891 7,820,189 5,404,059 4,3460.121 69.1
GCU PA 56693 5,565,447 3,467,846 15,2300.086 62.3
Genworth Life & Ann Ins Co VA 65536 4011 9,117 1,783 50.000 19.6
Gerber Life Ins Co NY 70939 4483 7,968,985 6,179,472 3,6110.123 77.5
Globe Life & Accident Ins Co NE 91472 290 2,699,333 2,386,123 2,9340.042 88.4
Government Personnel Mut Life Ins Co TX 63967 4712 9,393,950 7,935,881 5,4060.146 84.5
Group Hlth Coop of S Central WI WI 95311 1,234,913 1,331,202 6020.019 107.8
Group Hlth Inc NY 55239 1127 1,618,564 1,906,055 4930.025 117.8
Group Hlth Options Inc WA 47055 1185 153,098 87,979 860.002 57.5
Group Hospitalization & Med Srvcs DC 53007 380 9,639,630 8,323,341 5,2120.149 86.3
Guarantee Trust Life Ins Co IL 64211 687 383,774 143,737 8520.006 37.5
Health Alliance Connect Inc IL 15478 1192 48,505 80,624 330.001 166.2
Health Alliance Medical Plans IL 77950 1192 701,336 544,729 2370.011 77.7
Health Care Serv Corp A Mut Legal Re IL 70670 917 388,521,004 330,032,016 215,2186.021 84.9
Health First Ins Inc FL 14140 4740 104,370 86,706 350.002 83.1
Health Net Life Ins Co CA 66141 1295 38,605,736 27,311,018 18,1690.598 70.7
Health Now NY Inc NY 55204 1,378,814 1,588,910 4210.021 115.2
CAUTION: The information contained on this page is unaudited and not a complete analysis nor is it an expression of opinion on any insurer. This page may contain inadvertent errors.
© 2017 National Association of Insurance Commissioners 49
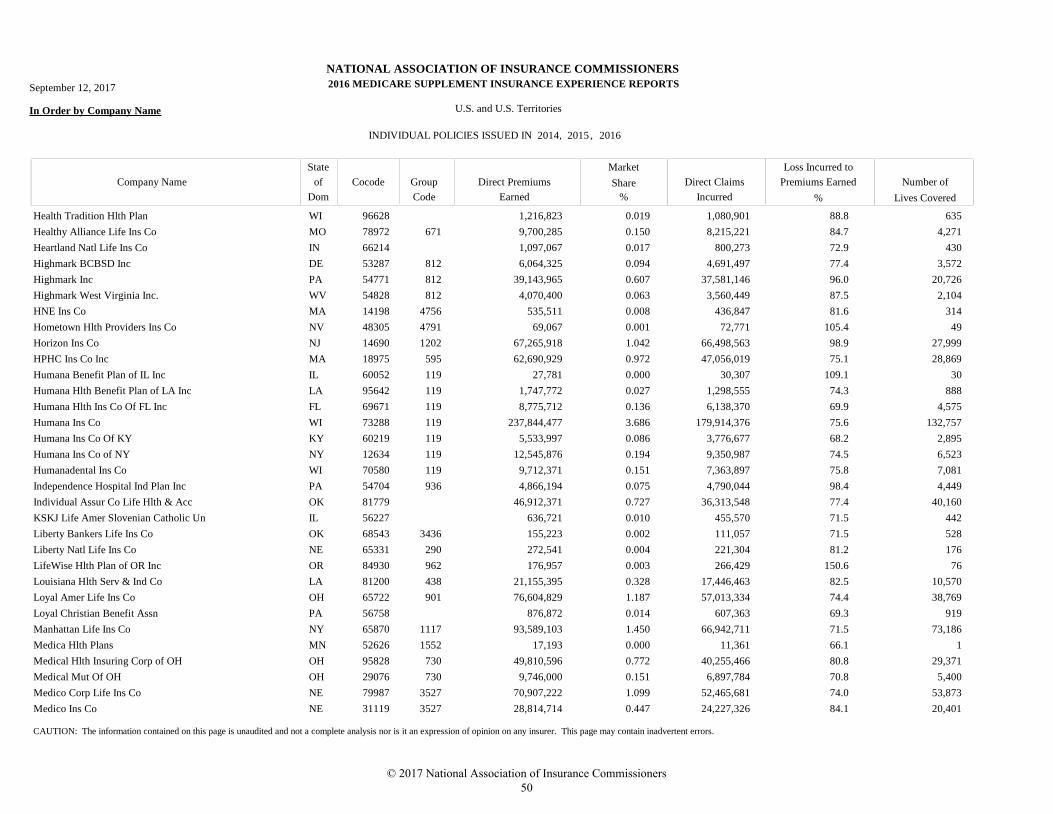
NATIONAL ASSOCIATION OF INSURANCE COMMISSIONERS
MEDICARE SUPPLEMENT INSURANCE EXPERIENCE REPORTS
In Order by Company Name U.S. and U.S. Territories
INDIVIDUAL POLICIES ISSUED IN
Market
Direct Claims
Incurred
Loss Incurred to
Premiums Earned Number of
Lives Covered
Direct Premiums
Earned
Company Name
State
Dom
Cocode Group
Code
of Share
% %
September 12, 2017 2016
2014 2015 2016, ,
Health Tradition Hlth Plan WI 96628 1,216,823 1,080,901 6350.019 88.8
Healthy Alliance Life Ins Co MO 78972 671 9,700,285 8,215,221 4,2710.150 84.7
Heartland Natl Life Ins Co IN 66214 1,097,067 800,273 4300.017 72.9
Highmark BCBSD Inc DE 53287 812 6,064,325 4,691,497 3,5720.094 77.4
Highmark Inc PA 54771 812 39,143,965 37,581,146 20,7260.607 96.0
Highmark West Virginia Inc. WV 54828 812 4,070,400 3,560,449 2,1040.063 87.5
HNE Ins Co MA 14198 4756 535,511 436,847 3140.008 81.6
Hometown Hlth Providers Ins Co NV 48305 4791 69,067 72,771 490.001 105.4
Horizon Ins Co NJ 14690 1202 67,265,918 66,498,563 27,9991.042 98.9
HPHC Ins Co Inc MA 18975 595 62,690,929 47,056,019 28,8690.972 75.1
Humana Benefit Plan of IL Inc IL 60052 119 27,781 30,307 300.000 109.1
Humana Hlth Benefit Plan of LA Inc LA 95642 119 1,747,772 1,298,555 8880.027 74.3
Humana Hlth Ins Co Of FL Inc FL 69671 119 8,775,712 6,138,370 4,5750.136 69.9
Humana Ins Co WI 73288 119 237,844,477 179,914,376 132,7573.686 75.6
Humana Ins Co Of KY KY 60219 119 5,533,997 3,776,677 2,8950.086 68.2
Humana Ins Co of NY NY 12634 119 12,545,876 9,350,987 6,5230.194 74.5
Humanadental Ins Co WI 70580 119 9,712,371 7,363,897 7,0810.151 75.8
Independence Hospital Ind Plan Inc PA 54704 936 4,866,194 4,790,044 4,4490.075 98.4
Individual Assur Co Life Hlth & Acc OK 81779 46,912,371 36,313,548 40,1600.727 77.4
KSKJ Life Amer Slovenian Catholic Un IL 56227 636,721 455,570 4420.010 71.5
Liberty Bankers Life Ins Co OK 68543 3436 155,223 111,057 5280.002 71.5
Liberty Natl Life Ins Co NE 65331 290 272,541 221,304 1760.004 81.2
LifeWise Hlth Plan of OR Inc OR 84930 962 176,957 266,429 760.003 150.6
Louisiana Hlth Serv & Ind Co LA 81200 438 21,155,395 17,446,463 10,5700.328 82.5
Loyal Amer Life Ins Co OH 65722 901 76,604,829 57,013,334 38,7691.187 74.4
Loyal Christian Benefit Assn PA 56758 876,872 607,363 9190.014 69.3
Manhattan Life Ins Co NY 65870 1117 93,589,103 66,942,711 73,1861.450 71.5
Medica Hlth Plans MN 52626 1552 17,193 11,361 10.000 66.1
Medical Hlth Insuring Corp of OH OH 95828 730 49,810,596 40,255,466 29,3710.772 80.8
Medical Mut Of OH OH 29076 730 9,746,000 6,897,784 5,4000.151 70.8
Medico Corp Life Ins Co NE 79987 3527 70,907,222 52,465,681 53,8731.099 74.0
Medico Ins Co NE 31119 3527 28,814,714 24,227,326 20,4010.447 84.1
CAUTION: The information contained on this page is unaudited and not a complete analysis nor is it an expression of opinion on any insurer. This page may contain inadvertent errors.
© 2017 National Association of Insurance Commissioners 50
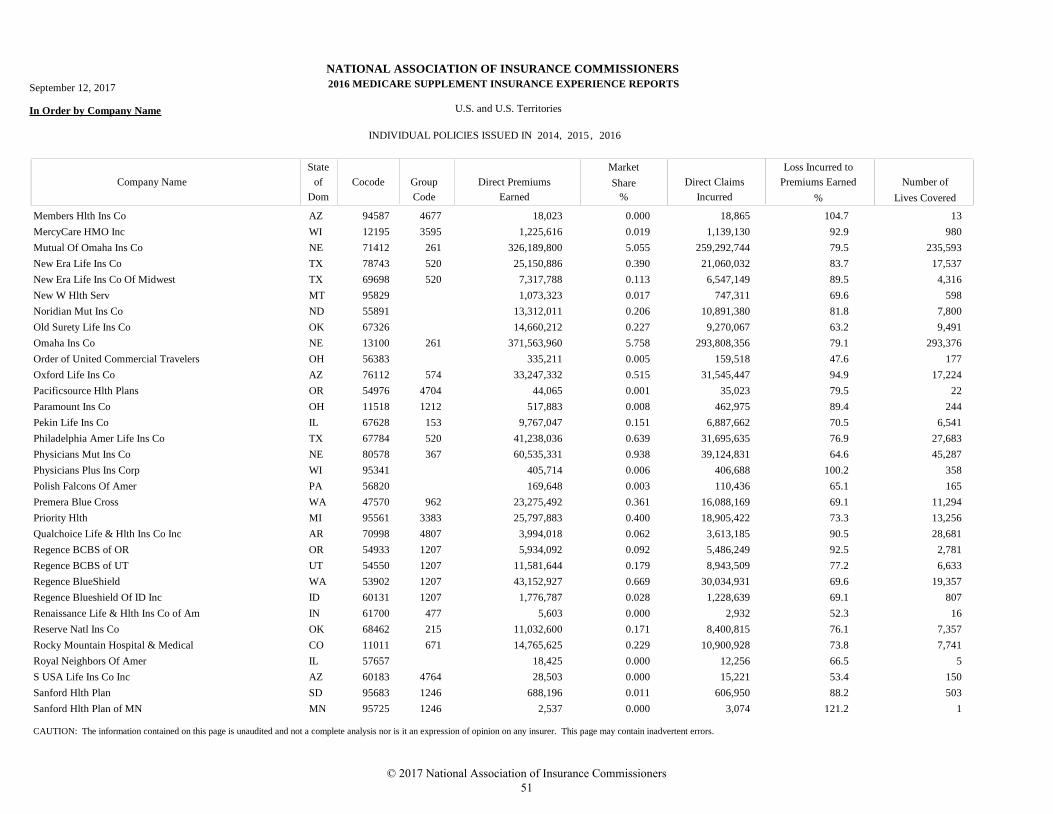
NATIONAL ASSOCIATION OF INSURANCE COMMISSIONERS
MEDICARE SUPPLEMENT INSURANCE EXPERIENCE REPORTS
In Order by Company Name U.S. and U.S. Territories
INDIVIDUAL POLICIES ISSUED IN
Market
Direct Claims
Incurred
Loss Incurred to
Premiums Earned Number of
Lives Covered
Direct Premiums
Earned
Company Name
State
Dom
Cocode Group
Code
of Share
% %
September 12, 2017 2016
2014 2015 2016, ,
Members Hlth Ins Co AZ 94587 4677 18,023 18,865 130.000 104.7
MercyCare HMO Inc WI 12195 3595 1,225,616 1,139,130 9800.019 92.9
Mutual Of Omaha Ins Co NE 71412 261 326,189,800 259,292,744 235,5935.055 79.5
New Era Life Ins Co TX 78743 520 25,150,886 21,060,032 17,5370.390 83.7
New Era Life Ins Co Of Midwest TX 69698 520 7,317,788 6,547,149 4,3160.113 89.5
New W Hlth Serv MT 95829 1,073,323 747,311 5980.017 69.6
Noridian Mut Ins Co ND 55891 13,312,011 10,891,380 7,8000.206 81.8
Old Surety Life Ins Co OK 67326 14,660,212 9,270,067 9,4910.227 63.2
Omaha Ins Co NE 13100 261 371,563,960 293,808,356 293,3765.758 79.1
Order of United Commercial Travelers OH 56383 335,211 159,518 1770.005 47.6
Oxford Life Ins Co AZ 76112 574 33,247,332 31,545,447 17,2240.515 94.9
Pacificsource Hlth Plans OR 54976 4704 44,065 35,023 220.001 79.5
Paramount Ins Co OH 11518 1212 517,883 462,975 2440.008 89.4
Pekin Life Ins Co IL 67628 153 9,767,047 6,887,662 6,5410.151 70.5
Philadelphia Amer Life Ins Co TX 67784 520 41,238,036 31,695,635 27,6830.639 76.9
Physicians Mut Ins Co NE 80578 367 60,535,331 39,124,831 45,2870.938 64.6
Physicians Plus Ins Corp WI 95341 405,714 406,688 3580.006 100.2
Polish Falcons Of Amer PA 56820 169,648 110,436 1650.003 65.1
Premera Blue Cross WA 47570 962 23,275,492 16,088,169 11,2940.361 69.1
Priority Hlth MI 95561 3383 25,797,883 18,905,422 13,2560.400 73.3
Qualchoice Life & Hlth Ins Co Inc AR 70998 4807 3,994,018 3,613,185 28,6810.062 90.5
Regence BCBS of OR OR 54933 1207 5,934,092 5,486,249 2,7810.092 92.5
Regence BCBS of UT UT 54550 1207 11,581,644 8,943,509 6,6330.179 77.2
Regence BlueShield WA 53902 1207 43,152,927 30,034,931 19,3570.669 69.6
Regence Blueshield Of ID Inc ID 60131 1207 1,776,787 1,228,639 8070.028 69.1
Renaissance Life & Hlth Ins Co of Am IN 61700 477 5,603 2,932 160.000 52.3
Reserve Natl Ins Co OK 68462 215 11,032,600 8,400,815 7,3570.171 76.1
Rocky Mountain Hospital & Medical CO 11011 671 14,765,625 10,900,928 7,7410.229 73.8
Royal Neighbors Of Amer IL 57657 18,425 12,256 50.000 66.5
S USA Life Ins Co Inc AZ 60183 4764 28,503 15,221 1500.000 53.4
Sanford Hlth Plan SD 95683 1246 688,196 606,950 5030.011 88.2
Sanford Hlth Plan of MN MN 95725 1246 2,537 3,074 10.000 121.2
CAUTION: The information contained on this page is unaudited and not a complete analysis nor is it an expression of opinion on any insurer. This page may contain inadvertent errors.
© 2017 National Association of Insurance Commissioners 51

NATIONAL ASSOCIATION OF INSURANCE COMMISSIONERS
MEDICARE SUPPLEMENT INSURANCE EXPERIENCE REPORTS
In Order by Company Name U.S. and U.S. Territories
INDIVIDUAL POLICIES ISSUED IN
Market
Direct Claims
Incurred
Loss Incurred to
Premiums Earned Number of
Lives Covered
Direct Premiums
Earned
Company Name
State
Dom
Cocode Group
Code
of Share
% %
September 12, 2017 2016
2014 2015 2016, ,
SBLI USA Life Ins Co Inc NY 60176 4764 8,448 4,940 470.000 58.5
Security Hlth Plan of WI Inc WI 96881 1,223,110 961,138 1,1430.019 78.6
Sentinel Security Life Ins Co UT 68802 4824 5,665,375 4,658,550 5,5150.088 82.2
Shenandoah Life Ins Co VA 68845 4764 2,513,411 1,938,552 2,2640.039 77.1
Sierra Hlth & Life Ins Co Inc NV 71420 707 5,118 572 20.000 11.2
Standard Life & Accident Ins Co TX 86355 408 5,509,280 4,180,851 7,1670.085 75.9
Standard Life & Cas Ins Co UT 71706 1,665,533 1,324,662 1,0510.026 79.5
State Farm Mut Auto Ins Co IL 25178 176 49,528,377 35,951,162 27,8280.768 72.6
State Mut Ins Co GA 69132 1,365,066 945,098 1,0580.021 69.2
Sterling Investors Life Ins Co IN 89184 1,775,686 1,451,929 6530.028 81.8
Sterling Life Ins Co IL 77399 901 8,310,563 6,591,145 3,6190.129 79.3
Summa Ins Co Inc OH 10649 3259 132,302 119,550 490.002 90.4
The Vt Hlth Plan LLC VT 95696 4745 7,083,782 5,234,231 4,2310.110 73.9
THP Ins Co WV 60016 1297 13,282,443 10,403,126 81,2550.206 78.3
Thrivent Financial For Lutherans WI 56014 2938 12,249,303 12,396,229 11,8630.190 101.2
Transamerica Life Ins Co IA 86231 468 24,192,991 17,266,214 12,9300.375 71.4
Transamerica Premier Life Ins Co IA 66281 468 119,401,626 90,724,252 63,7041.850 76.0
TRH Hlth Ins Co TN 89005 4677 133,742,955 95,751,203 60,3082.073 71.6
Triple S Salud Inc PR 55816 4802 23,381,183 18,478,158 16,9570.362 79.0
Tufts Ins Co Inc MA 60117 4742 15,135,372 13,483,757 8,2860.235 89.1
Unified Life Ins Co TX 11121 8,987 7,845 310.000 87.3
United Amer Ins Co NE 92916 290 63,120,362 36,199,906 49,6240.978 57.4
United Hlthcare of AL Inc AL 95784 707 14,142 11,612 60.000 82.1
United Natl Life Ins Co Of Amer IL 92703 687 626,188 504,675 3040.010 80.6
United Of Omaha Life Ins Co NE 69868 261 100,876,975 76,783,499 69,0991.563 76.1
United World Life Ins Co NE 72850 261 4,365,512 2,208,995 21,5060.068 50.6
UnitedHealthcare Ins Co CT 79413 707 613,477,269 473,765,009 339,9019.507 77.2
Unity Hlth Plans Ins Corp WI 95796 4870 1,752,835 1,620,079 1,0560.027 92.4
Universal Fidelity Life Ins Co OK 70122 1,801,287 1,475,335 1,0420.028 81.9
Upmc Hlth Benefits Inc PA 11018 1324 28,056 224 210.000 0.8
USAA Life Ins Co TX 69663 200 103,798,763 76,696,931 58,0051.609 73.9
USAble Mut Ins Co AR 83470 876 42,966,821 35,749,542 29,7000.666 83.2
CAUTION: The information contained on this page is unaudited and not a complete analysis nor is it an expression of opinion on any insurer. This page may contain inadvertent errors.
© 2017 National Association of Insurance Commissioners 52
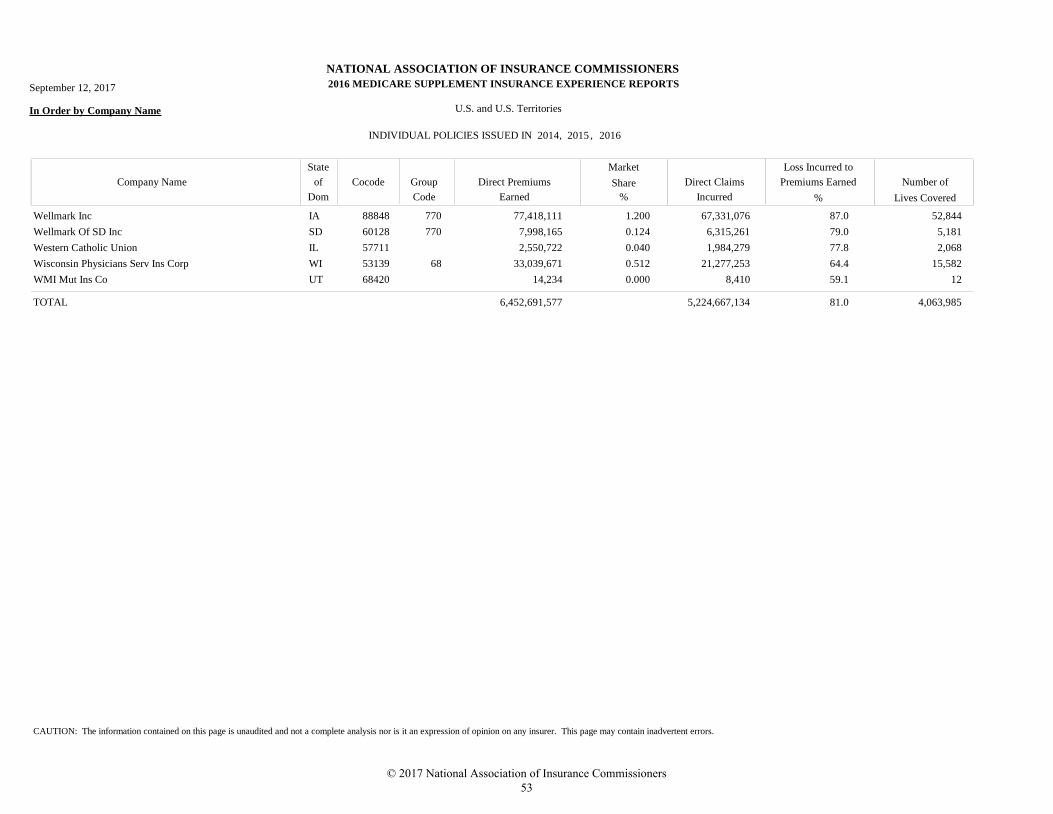
NATIONAL ASSOCIATION OF INSURANCE COMMISSIONERS
MEDICARE SUPPLEMENT INSURANCE EXPERIENCE REPORTS
In Order by Company Name U.S. and U.S. Territories
INDIVIDUAL POLICIES ISSUED IN
Market
Direct Claims
Incurred
Loss Incurred to
Premiums Earned Number of
Lives Covered
Direct Premiums
Earned
Company Name
State
Dom
Cocode Group
Code
of Share
% %
September 12, 2017 2016
2014 2015 2016, ,
Wellmark Inc IA 88848 770 77,418,111 67,331,076 52,8441.200 87.0
Wellmark Of SD Inc SD 60128 770 7,998,165 6,315,261 5,1810.124 79.0
Western Catholic Union IL 57711 2,550,722 1,984,279 2,0680.040 77.8
Wisconsin Physicians Serv Ins Corp WI 53139 68 33,039,671 21,277,253 15,5820.512 64.4
WMI Mut Ins Co UT 68420 14,234 8,410 120.000 59.1
6,452,691,577 5,224,667,134 4,063,985TOTAL 81.0
CAUTION: The information contained on this page is unaudited and not a complete analysis nor is it an expression of opinion on any insurer. This page may contain inadvertent errors.
© 2017 National Association of Insurance Commissioners 53

© 2017 National Association of Insurance Commissioners 54
TOTAL INDIVIDUAL POLICIES BY DIRECT PREMIUMS EARNED
© 2017 National Association of Insurance Commissioners 55

© 2017 National Association of Insurance Commissioners 56
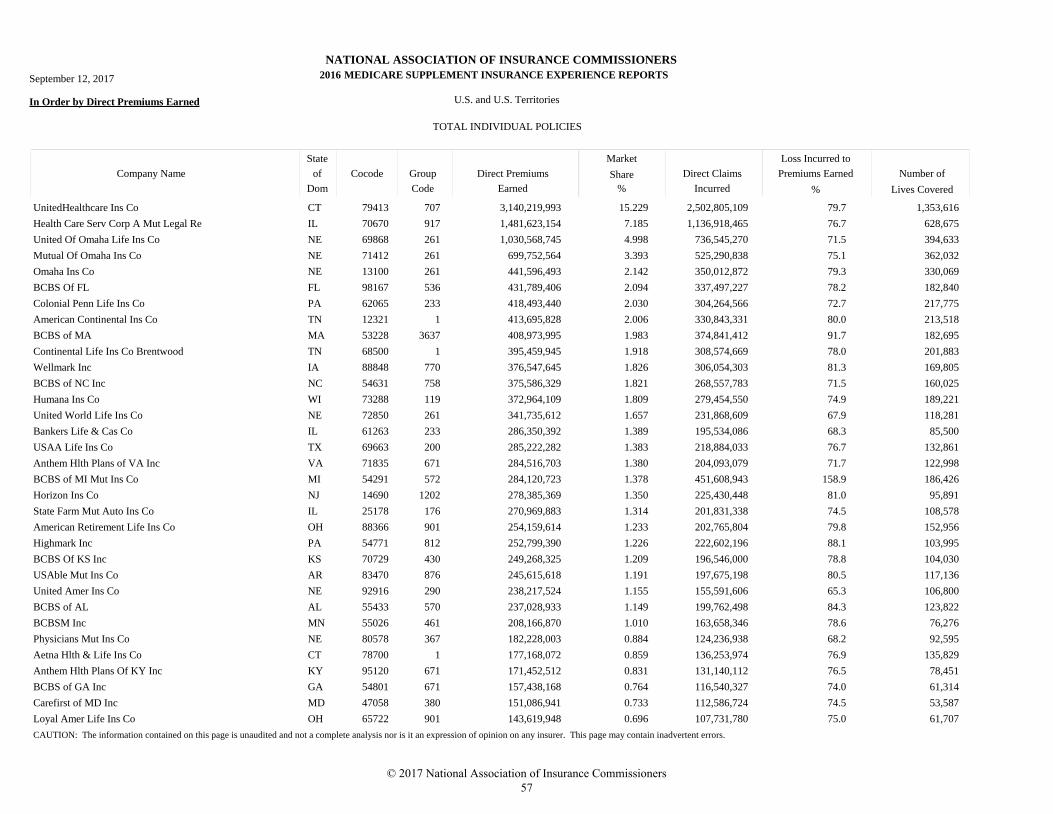
NATIONAL ASSOCIATION OF INSURANCE COMMISSIONERS
MEDICARE SUPPLEMENT INSURANCE EXPERIENCE REPORTS
In Order by Direct Premiums Earned U.S. and U.S. Territories
TOTAL INDIVIDUAL POLICIES
Market
Direct Claims
Incurred
Loss Incurred to
Premiums Earned Number of
Lives Covered
Direct Premiums
Earned
Company Name
State
Dom
Cocode Group
Code
of Share
% %
September 12, 2017 2016
UnitedHealthcare Ins Co CT 79413 707 3,140,219,993 2,502,805,109 1,353,61615.229 79.7
Health Care Serv Corp A Mut Legal Re IL 70670 917 1,481,623,154 1,136,918,465 628,6757.185 76.7
United Of Omaha Life Ins Co NE 69868 261 1,030,568,745 736,545,270 394,6334.998 71.5
Mutual Of Omaha Ins Co NE 71412 261 699,752,564 525,290,838 362,0323.393 75.1
Omaha Ins Co NE 13100 261 441,596,493 350,012,872 330,0692.142 79.3
BCBS Of FL FL 98167 536 431,789,406 337,497,227 182,8402.094 78.2
Colonial Penn Life Ins Co PA 62065 233 418,493,440 304,264,566 217,7752.030 72.7
American Continental Ins Co TN 12321 1 413,695,828 330,843,331 213,5182.006 80.0
BCBS of MA MA 53228 3637 408,973,995 374,841,412 182,6951.983 91.7
Continental Life Ins Co Brentwood TN 68500 1 395,459,945 308,574,669 201,8831.918 78.0
Wellmark Inc IA 88848 770 376,547,645 306,054,303 169,8051.826 81.3
BCBS of NC Inc NC 54631 758 375,586,329 268,557,783 160,0251.821 71.5
Humana Ins Co WI 73288 119 372,964,109 279,454,550 189,2211.809 74.9
United World Life Ins Co NE 72850 261 341,735,612 231,868,609 118,2811.657 67.9
Bankers Life & Cas Co IL 61263 233 286,350,392 195,534,086 85,5001.389 68.3
USAA Life Ins Co TX 69663 200 285,222,282 218,884,033 132,8611.383 76.7
Anthem Hlth Plans of VA Inc VA 71835 671 284,516,703 204,093,079 122,9981.380 71.7
BCBS of MI Mut Ins Co MI 54291 572 284,120,723 451,608,943 186,4261.378 158.9
Horizon Ins Co NJ 14690 1202 278,385,369 225,430,448 95,8911.350 81.0
State Farm Mut Auto Ins Co IL 25178 176 270,969,883 201,831,338 108,5781.314 74.5
American Retirement Life Ins Co OH 88366 901 254,159,614 202,765,804 152,9561.233 79.8
Highmark Inc PA 54771 812 252,799,390 222,602,196 103,9951.226 88.1
BCBS Of KS Inc KS 70729 430 249,268,325 196,546,000 104,0301.209 78.8
USAble Mut Ins Co AR 83470 876 245,615,618 197,675,198 117,1361.191 80.5
United Amer Ins Co NE 92916 290 238,217,524 155,591,606 106,8001.155 65.3
BCBS of AL AL 55433 570 237,028,933 199,762,498 123,8221.149 84.3
BCBSM Inc MN 55026 461 208,166,870 163,658,346 76,2761.010 78.6
Physicians Mut Ins Co NE 80578 367 182,228,003 124,236,938 92,5950.884 68.2
Aetna Hlth & Life Ins Co CT 78700 1 177,168,072 136,253,974 135,8290.859 76.9
Anthem Hlth Plans Of KY Inc KY 95120 671 171,452,512 131,140,112 78,4510.831 76.5
BCBS of GA Inc GA 54801 671 157,438,168 116,540,327 61,3140.764 74.0
Carefirst of MD Inc MD 47058 380 151,086,941 112,586,724 53,5870.733 74.5
Loyal Amer Life Ins Co OH 65722 901 143,619,948 107,731,780 61,7070.696 75.0
CAUTION: The information contained on this page is unaudited and not a complete analysis nor is it an expression of opinion on any insurer. This page may contain inadvertent errors.
© 2017 National Association of Insurance Commissioners 57
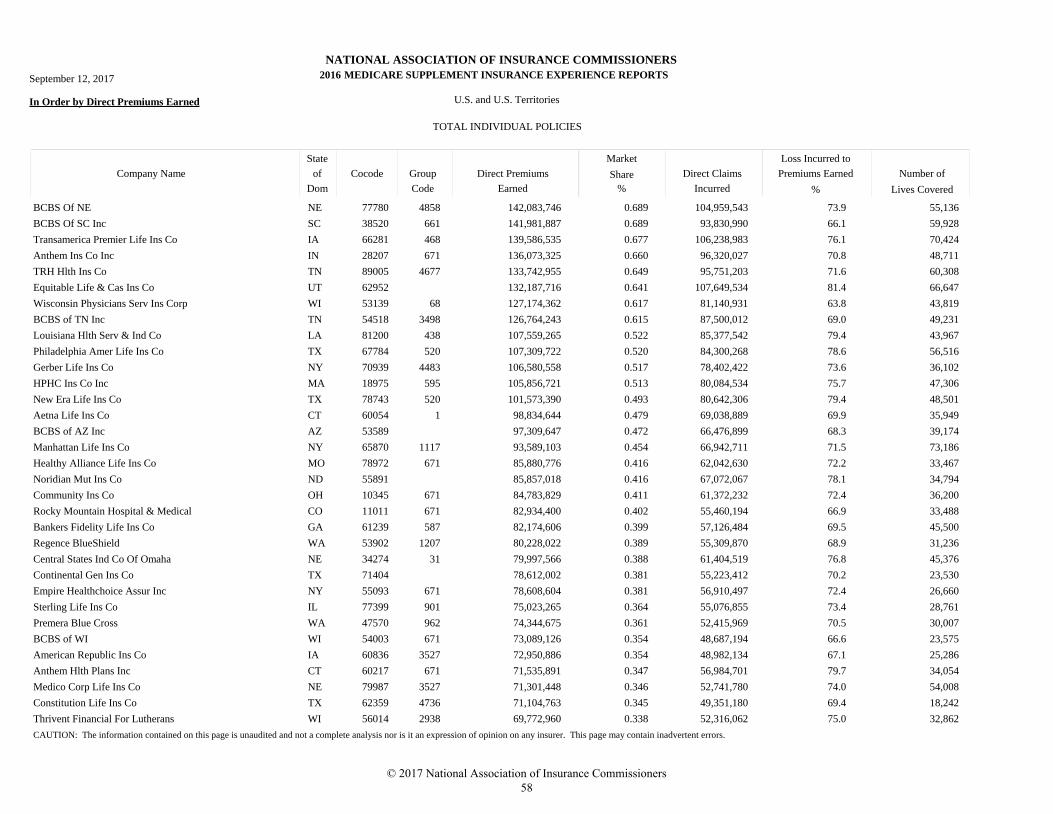
NATIONAL ASSOCIATION OF INSURANCE COMMISSIONERS
MEDICARE SUPPLEMENT INSURANCE EXPERIENCE REPORTS
In Order by Direct Premiums Earned U.S. and U.S. Territories
TOTAL INDIVIDUAL POLICIES
Market
Direct Claims
Incurred
Loss Incurred to
Premiums Earned Number of
Lives Covered
Direct Premiums
Earned
Company Name
State
Dom
Cocode Group
Code
of Share
% %
September 12, 2017 2016
BCBS Of NE NE 77780 4858 142,083,746 104,959,543 55,1360.689 73.9
BCBS Of SC Inc SC 38520 661 141,981,887 93,830,990 59,9280.689 66.1
Transamerica Premier Life Ins Co IA 66281 468 139,586,535 106,238,983 70,4240.677 76.1
Anthem Ins Co Inc IN 28207 671 136,073,325 96,320,027 48,7110.660 70.8
TRH Hlth Ins Co TN 89005 4677 133,742,955 95,751,203 60,3080.649 71.6
Equitable Life & Cas Ins Co UT 62952 132,187,716 107,649,534 66,6470.641 81.4
Wisconsin Physicians Serv Ins Corp WI 53139 68 127,174,362 81,140,931 43,8190.617 63.8
BCBS of TN Inc TN 54518 3498 126,764,243 87,500,012 49,2310.615 69.0
Louisiana Hlth Serv & Ind Co LA 81200 438 107,559,265 85,377,542 43,9670.522 79.4
Philadelphia Amer Life Ins Co TX 67784 520 107,309,722 84,300,268 56,5160.520 78.6
Gerber Life Ins Co NY 70939 4483 106,580,558 78,402,422 36,1020.517 73.6
HPHC Ins Co Inc MA 18975 595 105,856,721 80,084,534 47,3060.513 75.7
New Era Life Ins Co TX 78743 520 101,573,390 80,642,306 48,5010.493 79.4
Aetna Life Ins Co CT 60054 1 98,834,644 69,038,889 35,9490.479 69.9
BCBS of AZ Inc AZ 53589 97,309,647 66,476,899 39,1740.472 68.3
Manhattan Life Ins Co NY 65870 1117 93,589,103 66,942,711 73,1860.454 71.5
Healthy Alliance Life Ins Co MO 78972 671 85,880,776 62,042,630 33,4670.416 72.2
Noridian Mut Ins Co ND 55891 85,857,018 67,072,067 34,7940.416 78.1
Community Ins Co OH 10345 671 84,783,829 61,372,232 36,2000.411 72.4
Rocky Mountain Hospital & Medical CO 11011 671 82,934,400 55,460,194 33,4880.402 66.9
Bankers Fidelity Life Ins Co GA 61239 587 82,174,606 57,126,484 45,5000.399 69.5
Regence BlueShield WA 53902 1207 80,228,022 55,309,870 31,2360.389 68.9
Central States Ind Co Of Omaha NE 34274 31 79,997,566 61,404,519 45,3760.388 76.8
Continental Gen Ins Co TX 71404 78,612,002 55,223,412 23,5300.381 70.2
Empire Healthchoice Assur Inc NY 55093 671 78,608,604 56,910,497 26,6600.381 72.4
Sterling Life Ins Co IL 77399 901 75,023,265 55,076,855 28,7610.364 73.4
Premera Blue Cross WA 47570 962 74,344,675 52,415,969 30,0070.361 70.5
BCBS of WI WI 54003 671 73,089,126 48,687,194 23,5750.354 66.6
American Republic Ins Co IA 60836 3527 72,950,886 48,982,134 25,2860.354 67.1
Anthem Hlth Plans Inc CT 60217 671 71,535,891 56,984,701 34,0540.347 79.7
Medico Corp Life Ins Co NE 79987 3527 71,301,448 52,741,780 54,0080.346 74.0
Constitution Life Ins Co TX 62359 4736 71,104,763 49,351,180 18,2420.345 69.4
Thrivent Financial For Lutherans WI 56014 2938 69,772,960 52,316,062 32,8620.338 75.0
CAUTION: The information contained on this page is unaudited and not a complete analysis nor is it an expression of opinion on any insurer. This page may contain inadvertent errors.
© 2017 National Association of Insurance Commissioners 58
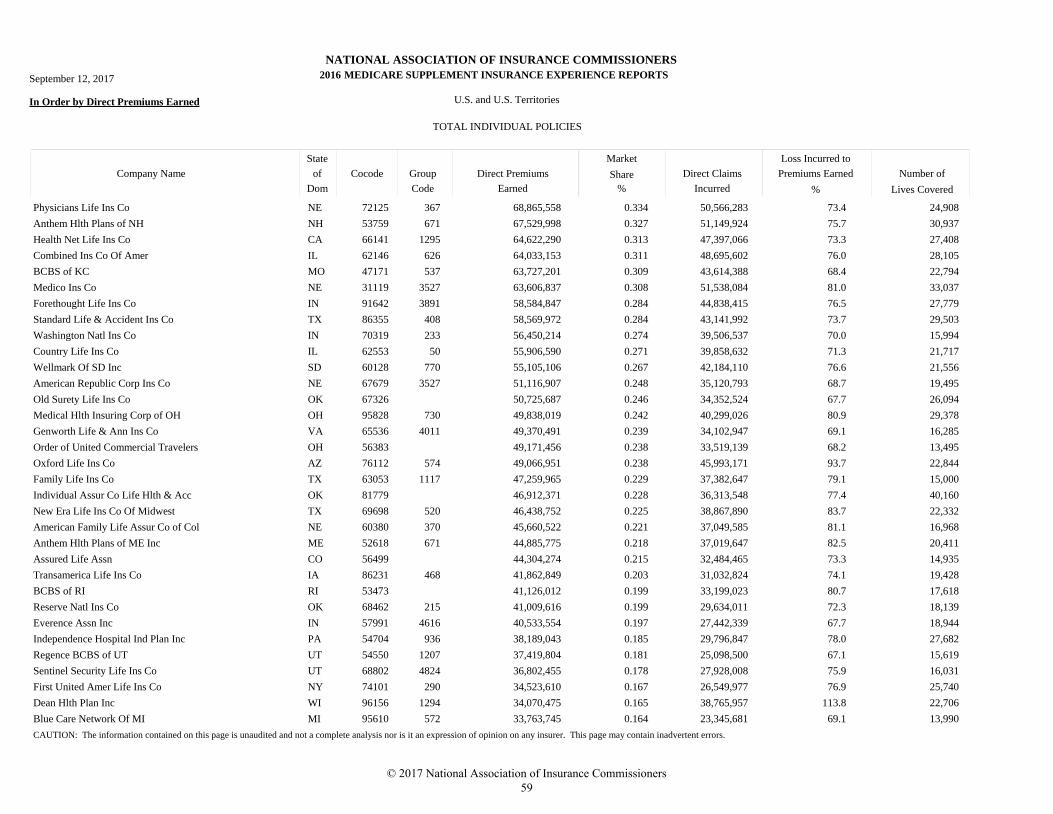
NATIONAL ASSOCIATION OF INSURANCE COMMISSIONERS
MEDICARE SUPPLEMENT INSURANCE EXPERIENCE REPORTS
In Order by Direct Premiums Earned U.S. and U.S. Territories
TOTAL INDIVIDUAL POLICIES
Market
Direct Claims
Incurred
Loss Incurred to
Premiums Earned Number of
Lives Covered
Direct Premiums
Earned
Company Name
State
Dom
Cocode Group
Code
of Share
% %
September 12, 2017 2016
Physicians Life Ins Co NE 72125 367 68,865,558 50,566,283 24,9080.334 73.4
Anthem Hlth Plans of NH NH 53759 671 67,529,998 51,149,924 30,9370.327 75.7
Health Net Life Ins Co CA 66141 1295 64,622,290 47,397,066 27,4080.313 73.3
Combined Ins Co Of Amer IL 62146 626 64,033,153 48,695,602 28,1050.311 76.0
BCBS of KC MO 47171 537 63,727,201 43,614,388 22,7940.309 68.4
Medico Ins Co NE 31119 3527 63,606,837 51,538,084 33,0370.308 81.0
Forethought Life Ins Co IN 91642 3891 58,584,847 44,838,415 27,7790.284 76.5
Standard Life & Accident Ins Co TX 86355 408 58,569,972 43,141,992 29,5030.284 73.7
Washington Natl Ins Co IN 70319 233 56,450,214 39,506,537 15,9940.274 70.0
Country Life Ins Co IL 62553 50 55,906,590 39,858,632 21,7170.271 71.3
Wellmark Of SD Inc SD 60128 770 55,105,106 42,184,110 21,5560.267 76.6
American Republic Corp Ins Co NE 67679 3527 51,116,907 35,120,793 19,4950.248 68.7
Old Surety Life Ins Co OK 67326 50,725,687 34,352,524 26,0940.246 67.7
Medical Hlth Insuring Corp of OH OH 95828 730 49,838,019 40,299,026 29,3780.242 80.9
Genworth Life & Ann Ins Co VA 65536 4011 49,370,491 34,102,947 16,2850.239 69.1
Order of United Commercial Travelers OH 56383 49,171,456 33,519,139 13,4950.238 68.2
Oxford Life Ins Co AZ 76112 574 49,066,951 45,993,171 22,8440.238 93.7
Family Life Ins Co TX 63053 1117 47,259,965 37,382,647 15,0000.229 79.1
Individual Assur Co Life Hlth & Acc OK 81779 46,912,371 36,313,548 40,1600.228 77.4
New Era Life Ins Co Of Midwest TX 69698 520 46,438,752 38,867,890 22,3320.225 83.7
American Family Life Assur Co of Col NE 60380 370 45,660,522 37,049,585 16,9680.221 81.1
Anthem Hlth Plans of ME Inc ME 52618 671 44,885,775 37,019,647 20,4110.218 82.5
Assured Life Assn CO 56499 44,304,274 32,484,465 14,9350.215 73.3
Transamerica Life Ins Co IA 86231 468 41,862,849 31,032,824 19,4280.203 74.1
BCBS of RI RI 53473 41,126,012 33,199,023 17,6180.199 80.7
Reserve Natl Ins Co OK 68462 215 41,009,616 29,634,011 18,1390.199 72.3
Everence Assn Inc IN 57991 4616 40,533,554 27,442,339 18,9440.197 67.7
Independence Hospital Ind Plan Inc PA 54704 936 38,189,043 29,796,847 27,6820.185 78.0
Regence BCBS of UT UT 54550 1207 37,419,804 25,098,500 15,6190.181 67.1
Sentinel Security Life Ins Co UT 68802 4824 36,802,455 27,928,008 16,0310.178 75.9
First United Amer Life Ins Co NY 74101 290 34,523,610 26,549,977 25,7400.167 76.9
Dean Hlth Plan Inc WI 96156 1294 34,070,475 38,765,957 22,7060.165 113.8
Blue Care Network Of MI MI 95610 572 33,763,745 23,345,681 13,9900.164 69.1
CAUTION: The information contained on this page is unaudited and not a complete analysis nor is it an expression of opinion on any insurer. This page may contain inadvertent errors.
© 2017 National Association of Insurance Commissioners 59
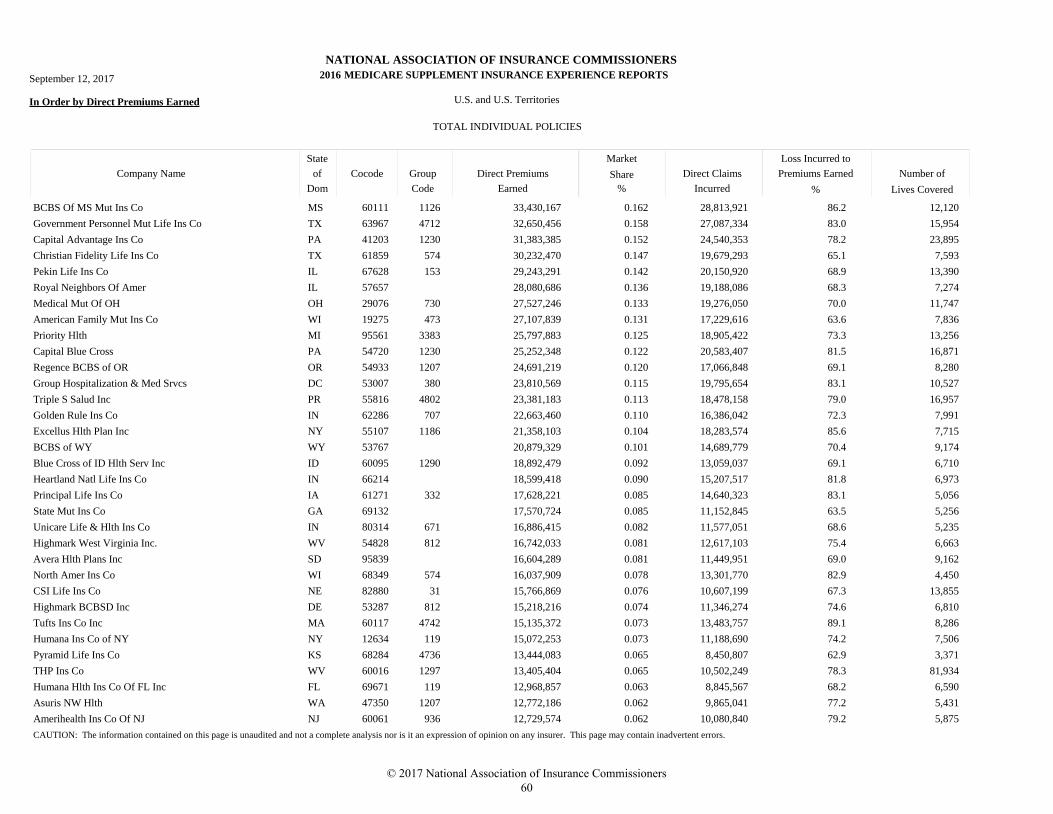
NATIONAL ASSOCIATION OF INSURANCE COMMISSIONERS
MEDICARE SUPPLEMENT INSURANCE EXPERIENCE REPORTS
In Order by Direct Premiums Earned U.S. and U.S. Territories
TOTAL INDIVIDUAL POLICIES
Market
Direct Claims
Incurred
Loss Incurred to
Premiums Earned Number of
Lives Covered
Direct Premiums
Earned
Company Name
State
Dom
Cocode Group
Code
of Share
% %
September 12, 2017 2016
BCBS Of MS Mut Ins Co MS 60111 1126 33,430,167 28,813,921 12,1200.162 86.2
Government Personnel Mut Life Ins Co TX 63967 4712 32,650,456 27,087,334 15,9540.158 83.0
Capital Advantage Ins Co PA 41203 1230 31,383,385 24,540,353 23,8950.152 78.2
Christian Fidelity Life Ins Co TX 61859 574 30,232,470 19,679,293 7,5930.147 65.1
Pekin Life Ins Co IL 67628 153 29,243,291 20,150,920 13,3900.142 68.9
Royal Neighbors Of Amer IL 57657 28,080,686 19,188,086 7,2740.136 68.3
Medical Mut Of OH OH 29076 730 27,527,246 19,276,050 11,7470.133 70.0
American Family Mut Ins Co WI 19275 473 27,107,839 17,229,616 7,8360.131 63.6
Priority Hlth MI 95561 3383 25,797,883 18,905,422 13,2560.125 73.3
Capital Blue Cross PA 54720 1230 25,252,348 20,583,407 16,8710.122 81.5
Regence BCBS of OR OR 54933 1207 24,691,219 17,066,848 8,2800.120 69.1
Group Hospitalization & Med Srvcs DC 53007 380 23,810,569 19,795,654 10,5270.115 83.1
Triple S Salud Inc PR 55816 4802 23,381,183 18,478,158 16,9570.113 79.0
Golden Rule Ins Co IN 62286 707 22,663,460 16,386,042 7,9910.110 72.3
Excellus Hlth Plan Inc NY 55107 1186 21,358,103 18,283,574 7,7150.104 85.6
BCBS of WY WY 53767 20,879,329 14,689,779 9,1740.101 70.4
Blue Cross of ID Hlth Serv Inc ID 60095 1290 18,892,479 13,059,037 6,7100.092 69.1
Heartland Natl Life Ins Co IN 66214 18,599,418 15,207,517 6,9730.090 81.8
Principal Life Ins Co IA 61271 332 17,628,221 14,640,323 5,0560.085 83.1
State Mut Ins Co GA 69132 17,570,724 11,152,845 5,2560.085 63.5
Unicare Life & Hlth Ins Co IN 80314 671 16,886,415 11,577,051 5,2350.082 68.6
Highmark West Virginia Inc. WV 54828 812 16,742,033 12,617,103 6,6630.081 75.4
Avera Hlth Plans Inc SD 95839 16,604,289 11,449,951 9,1620.081 69.0
North Amer Ins Co WI 68349 574 16,037,909 13,301,770 4,4500.078 82.9
CSI Life Ins Co NE 82880 31 15,766,869 10,607,199 13,8550.076 67.3
Highmark BCBSD Inc DE 53287 812 15,218,216 11,346,274 6,8100.074 74.6
Tufts Ins Co Inc MA 60117 4742 15,135,372 13,483,757 8,2860.073 89.1
Humana Ins Co of NY NY 12634 119 15,072,253 11,188,690 7,5060.073 74.2
Pyramid Life Ins Co KS 68284 4736 13,444,083 8,450,807 3,3710.065 62.9
THP Ins Co WV 60016 1297 13,405,404 10,502,249 81,9340.065 78.3
Humana Hlth Ins Co Of FL Inc FL 69671 119 12,968,857 8,845,567 6,5900.063 68.2
Asuris NW Hlth WA 47350 1207 12,772,186 9,865,041 5,4310.062 77.2
Amerihealth Ins Co Of NJ NJ 60061 936 12,729,574 10,080,840 5,8750.062 79.2
CAUTION: The information contained on this page is unaudited and not a complete analysis nor is it an expression of opinion on any insurer. This page may contain inadvertent errors.
© 2017 National Association of Insurance Commissioners 60
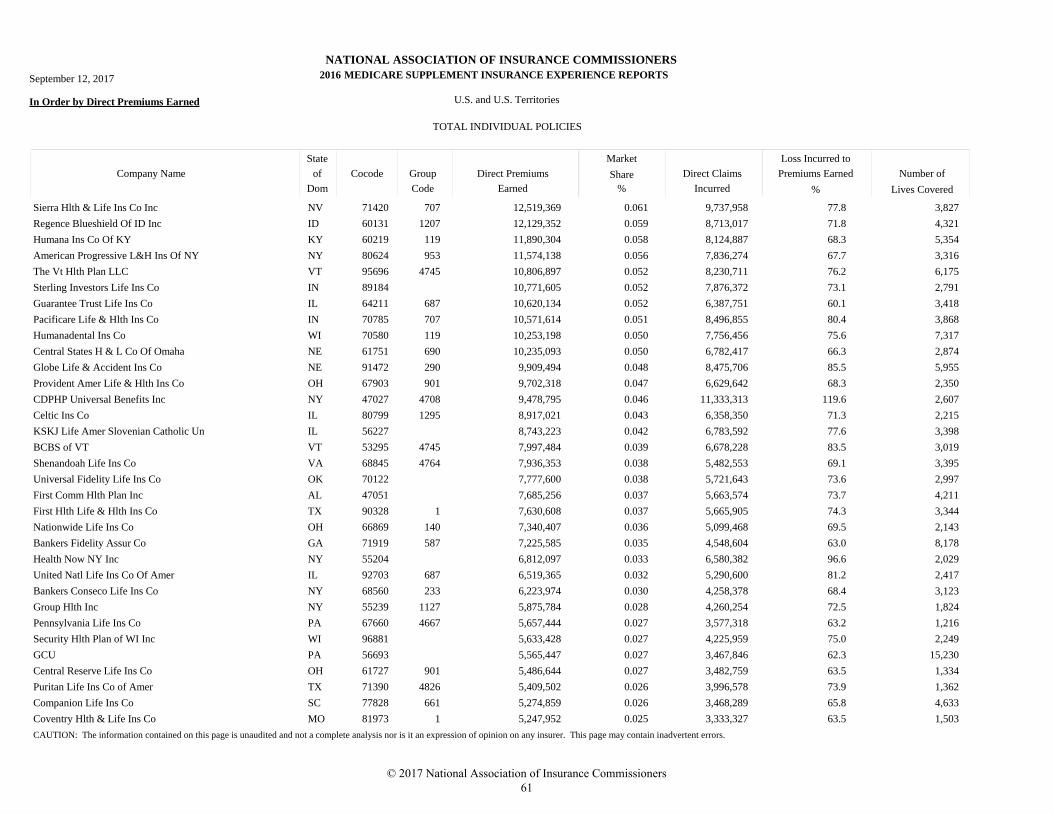
NATIONAL ASSOCIATION OF INSURANCE COMMISSIONERS
MEDICARE SUPPLEMENT INSURANCE EXPERIENCE REPORTS
In Order by Direct Premiums Earned U.S. and U.S. Territories
TOTAL INDIVIDUAL POLICIES
Market
Direct Claims
Incurred
Loss Incurred to
Premiums Earned Number of
Lives Covered
Direct Premiums
Earned
Company Name
State
Dom
Cocode Group
Code
of Share
% %
September 12, 2017 2016
Sierra Hlth & Life Ins Co Inc NV 71420 707 12,519,369 9,737,958 3,8270.061 77.8
Regence Blueshield Of ID Inc ID 60131 1207 12,129,352 8,713,017 4,3210.059 71.8
Humana Ins Co Of KY KY 60219 119 11,890,304 8,124,887 5,3540.058 68.3
American Progressive L&H Ins Of NY NY 80624 953 11,574,138 7,836,274 3,3160.056 67.7
The Vt Hlth Plan LLC VT 95696 4745 10,806,897 8,230,711 6,1750.052 76.2
Sterling Investors Life Ins Co IN 89184 10,771,605 7,876,372 2,7910.052 73.1
Guarantee Trust Life Ins Co IL 64211 687 10,620,134 6,387,751 3,4180.052 60.1
Pacificare Life & Hlth Ins Co IN 70785 707 10,571,614 8,496,855 3,8680.051 80.4
Humanadental Ins Co WI 70580 119 10,253,198 7,756,456 7,3170.050 75.6
Central States H & L Co Of Omaha NE 61751 690 10,235,093 6,782,417 2,8740.050 66.3
Globe Life & Accident Ins Co NE 91472 290 9,909,494 8,475,706 5,9550.048 85.5
Provident Amer Life & Hlth Ins Co OH 67903 901 9,702,318 6,629,642 2,3500.047 68.3
CDPHP Universal Benefits Inc NY 47027 4708 9,478,795 11,333,313 2,6070.046 119.6
Celtic Ins Co IL 80799 1295 8,917,021 6,358,350 2,2150.043 71.3
KSKJ Life Amer Slovenian Catholic Un IL 56227 8,743,223 6,783,592 3,3980.042 77.6
BCBS of VT VT 53295 4745 7,997,484 6,678,228 3,0190.039 83.5
Shenandoah Life Ins Co VA 68845 4764 7,936,353 5,482,553 3,3950.038 69.1
Universal Fidelity Life Ins Co OK 70122 7,777,600 5,721,643 2,9970.038 73.6
First Comm Hlth Plan Inc AL 47051 7,685,256 5,663,574 4,2110.037 73.7
First Hlth Life & Hlth Ins Co TX 90328 1 7,630,608 5,665,905 3,3440.037 74.3
Nationwide Life Ins Co OH 66869 140 7,340,407 5,099,468 2,1430.036 69.5
Bankers Fidelity Assur Co GA 71919 587 7,225,585 4,548,604 8,1780.035 63.0
Health Now NY Inc NY 55204 6,812,097 6,580,382 2,0290.033 96.6
United Natl Life Ins Co Of Amer IL 92703 687 6,519,365 5,290,600 2,4170.032 81.2
Bankers Conseco Life Ins Co NY 68560 233 6,223,974 4,258,378 3,1230.030 68.4
Group Hlth Inc NY 55239 1127 5,875,784 4,260,254 1,8240.028 72.5
Pennsylvania Life Ins Co PA 67660 4667 5,657,444 3,577,318 1,2160.027 63.2
Security Hlth Plan of WI Inc WI 96881 5,633,428 4,225,959 2,2490.027 75.0
GCU PA 56693 5,565,447 3,467,846 15,2300.027 62.3
Central Reserve Life Ins Co OH 61727 901 5,486,644 3,482,759 1,3340.027 63.5
Puritan Life Ins Co of Amer TX 71390 4826 5,409,502 3,996,578 1,3620.026 73.9
Companion Life Ins Co SC 77828 661 5,274,859 3,468,289 4,6330.026 65.8
Coventry Hlth & Life Ins Co MO 81973 1 5,247,952 3,333,327 1,5030.025 63.5
CAUTION: The information contained on this page is unaudited and not a complete analysis nor is it an expression of opinion on any insurer. This page may contain inadvertent errors.
© 2017 National Association of Insurance Commissioners 61
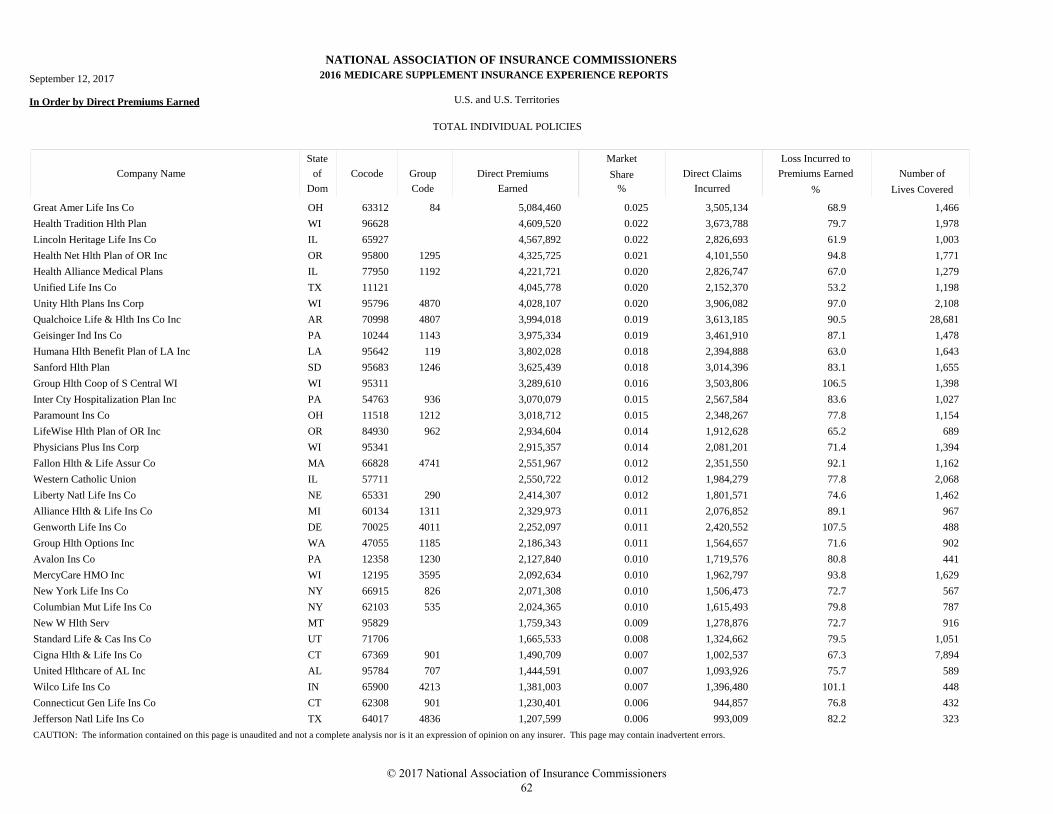
NATIONAL ASSOCIATION OF INSURANCE COMMISSIONERS
MEDICARE SUPPLEMENT INSURANCE EXPERIENCE REPORTS
In Order by Direct Premiums Earned U.S. and U.S. Territories
TOTAL INDIVIDUAL POLICIES
Market
Direct Claims
Incurred
Loss Incurred to
Premiums Earned Number of
Lives Covered
Direct Premiums
Earned
Company Name
State
Dom
Cocode Group
Code
of Share
% %
September 12, 2017 2016
Great Amer Life Ins Co OH 63312 84 5,084,460 3,505,134 1,4660.025 68.9
Health Tradition Hlth Plan WI 96628 4,609,520 3,673,788 1,9780.022 79.7
Lincoln Heritage Life Ins Co IL 65927 4,567,892 2,826,693 1,0030.022 61.9
Health Net Hlth Plan of OR Inc OR 95800 1295 4,325,725 4,101,550 1,7710.021 94.8
Health Alliance Medical Plans IL 77950 1192 4,221,721 2,826,747 1,2790.020 67.0
Unified Life Ins Co TX 11121 4,045,778 2,152,370 1,1980.020 53.2
Unity Hlth Plans Ins Corp WI 95796 4870 4,028,107 3,906,082 2,1080.020 97.0
Qualchoice Life & Hlth Ins Co Inc AR 70998 4807 3,994,018 3,613,185 28,6810.019 90.5
Geisinger Ind Ins Co PA 10244 1143 3,975,334 3,461,910 1,4780.019 87.1
Humana Hlth Benefit Plan of LA Inc LA 95642 119 3,802,028 2,394,888 1,6430.018 63.0
Sanford Hlth Plan SD 95683 1246 3,625,439 3,014,396 1,6550.018 83.1
Group Hlth Coop of S Central WI WI 95311 3,289,610 3,503,806 1,3980.016 106.5
Inter Cty Hospitalization Plan Inc PA 54763 936 3,070,079 2,567,584 1,0270.015 83.6
Paramount Ins Co OH 11518 1212 3,018,712 2,348,267 1,1540.015 77.8
LifeWise Hlth Plan of OR Inc OR 84930 962 2,934,604 1,912,628 6890.014 65.2
Physicians Plus Ins Corp WI 95341 2,915,357 2,081,201 1,3940.014 71.4
Fallon Hlth & Life Assur Co MA 66828 4741 2,551,967 2,351,550 1,1620.012 92.1
Western Catholic Union IL 57711 2,550,722 1,984,279 2,0680.012 77.8
Liberty Natl Life Ins Co NE 65331 290 2,414,307 1,801,571 1,4620.012 74.6
Alliance Hlth & Life Ins Co MI 60134 1311 2,329,973 2,076,852 9670.011 89.1
Genworth Life Ins Co DE 70025 4011 2,252,097 2,420,552 4880.011 107.5
Group Hlth Options Inc WA 47055 1185 2,186,343 1,564,657 9020.011 71.6
Avalon Ins Co PA 12358 1230 2,127,840 1,719,576 4410.010 80.8
MercyCare HMO Inc WI 12195 3595 2,092,634 1,962,797 1,6290.010 93.8
New York Life Ins Co NY 66915 826 2,071,308 1,506,473 5670.010 72.7
Columbian Mut Life Ins Co NY 62103 535 2,024,365 1,615,493 7870.010 79.8
New W Hlth Serv MT 95829 1,759,343 1,278,876 9160.009 72.7
Standard Life & Cas Ins Co UT 71706 1,665,533 1,324,662 1,0510.008 79.5
Cigna Hlth & Life Ins Co CT 67369 901 1,490,709 1,002,537 7,8940.007 67.3
United Hlthcare of AL Inc AL 95784 707 1,444,591 1,093,926 5890.007 75.7
Wilco Life Ins Co IN 65900 4213 1,381,003 1,396,480 4480.007 101.1
Connecticut Gen Life Ins Co CT 62308 901 1,230,401 944,857 4320.006 76.8
Jefferson Natl Life Ins Co TX 64017 4836 1,207,599 993,009 3230.006 82.2
CAUTION: The information contained on this page is unaudited and not a complete analysis nor is it an expression of opinion on any insurer. This page may contain inadvertent errors.
© 2017 National Association of Insurance Commissioners 62
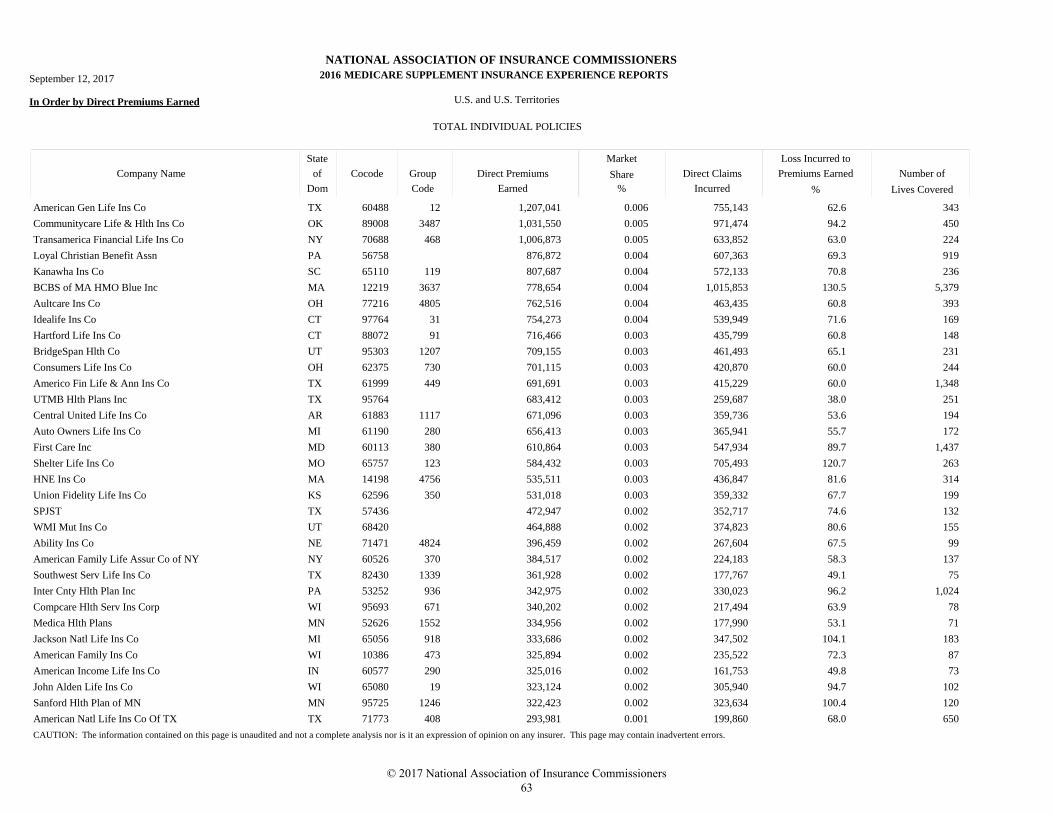
NATIONAL ASSOCIATION OF INSURANCE COMMISSIONERS
MEDICARE SUPPLEMENT INSURANCE EXPERIENCE REPORTS
In Order by Direct Premiums Earned U.S. and U.S. Territories
TOTAL INDIVIDUAL POLICIES
Market
Direct Claims
Incurred
Loss Incurred to
Premiums Earned Number of
Lives Covered
Direct Premiums
Earned
Company Name
State
Dom
Cocode Group
Code
of Share
% %
September 12, 2017 2016
American Gen Life Ins Co TX 60488 12 1,207,041 755,143 3430.006 62.6
Communitycare Life & Hlth Ins Co OK 89008 3487 1,031,550 971,474 4500.005 94.2
Transamerica Financial Life Ins Co NY 70688 468 1,006,873 633,852 2240.005 63.0
Loyal Christian Benefit Assn PA 56758 876,872 607,363 9190.004 69.3
Kanawha Ins Co SC 65110 119 807,687 572,133 2360.004 70.8
BCBS of MA HMO Blue Inc MA 12219 3637 778,654 1,015,853 5,3790.004 130.5
Aultcare Ins Co OH 77216 4805 762,516 463,435 3930.004 60.8
Idealife Ins Co CT 97764 31 754,273 539,949 1690.004 71.6
Hartford Life Ins Co CT 88072 91 716,466 435,799 1480.003 60.8
BridgeSpan Hlth Co UT 95303 1207 709,155 461,493 2310.003 65.1
Consumers Life Ins Co OH 62375 730 701,115 420,870 2440.003 60.0
Americo Fin Life & Ann Ins Co TX 61999 449 691,691 415,229 1,3480.003 60.0
UTMB Hlth Plans Inc TX 95764 683,412 259,687 2510.003 38.0
Central United Life Ins Co AR 61883 1117 671,096 359,736 1940.003 53.6
Auto Owners Life Ins Co MI 61190 280 656,413 365,941 1720.003 55.7
First Care Inc MD 60113 380 610,864 547,934 1,4370.003 89.7
Shelter Life Ins Co MO 65757 123 584,432 705,493 2630.003 120.7
HNE Ins Co MA 14198 4756 535,511 436,847 3140.003 81.6
Union Fidelity Life Ins Co KS 62596 350 531,018 359,332 1990.003 67.7
SPJST TX 57436 472,947 352,717 1320.002 74.6
WMI Mut Ins Co UT 68420 464,888 374,823 1550.002 80.6
Ability Ins Co NE 71471 4824 396,459 267,604 990.002 67.5
American Family Life Assur Co of NY NY 60526 370 384,517 224,183 1370.002 58.3
Southwest Serv Life Ins Co TX 82430 1339 361,928 177,767 750.002 49.1
Inter Cnty Hlth Plan Inc PA 53252 936 342,975 330,023 1,0240.002 96.2
Compcare Hlth Serv Ins Corp WI 95693 671 340,202 217,494 780.002 63.9
Medica Hlth Plans MN 52626 1552 334,956 177,990 710.002 53.1
Jackson Natl Life Ins Co MI 65056 918 333,686 347,502 1830.002 104.1
American Family Ins Co WI 10386 473 325,894 235,522 870.002 72.3
American Income Life Ins Co IN 60577 290 325,016 161,753 730.002 49.8
John Alden Life Ins Co WI 65080 19 323,124 305,940 1020.002 94.7
Sanford Hlth Plan of MN MN 95725 1246 322,423 323,634 1200.002 100.4
American Natl Life Ins Co Of TX TX 71773 408 293,981 199,860 6500.001 68.0
CAUTION: The information contained on this page is unaudited and not a complete analysis nor is it an expression of opinion on any insurer. This page may contain inadvertent errors.
© 2017 National Association of Insurance Commissioners 63
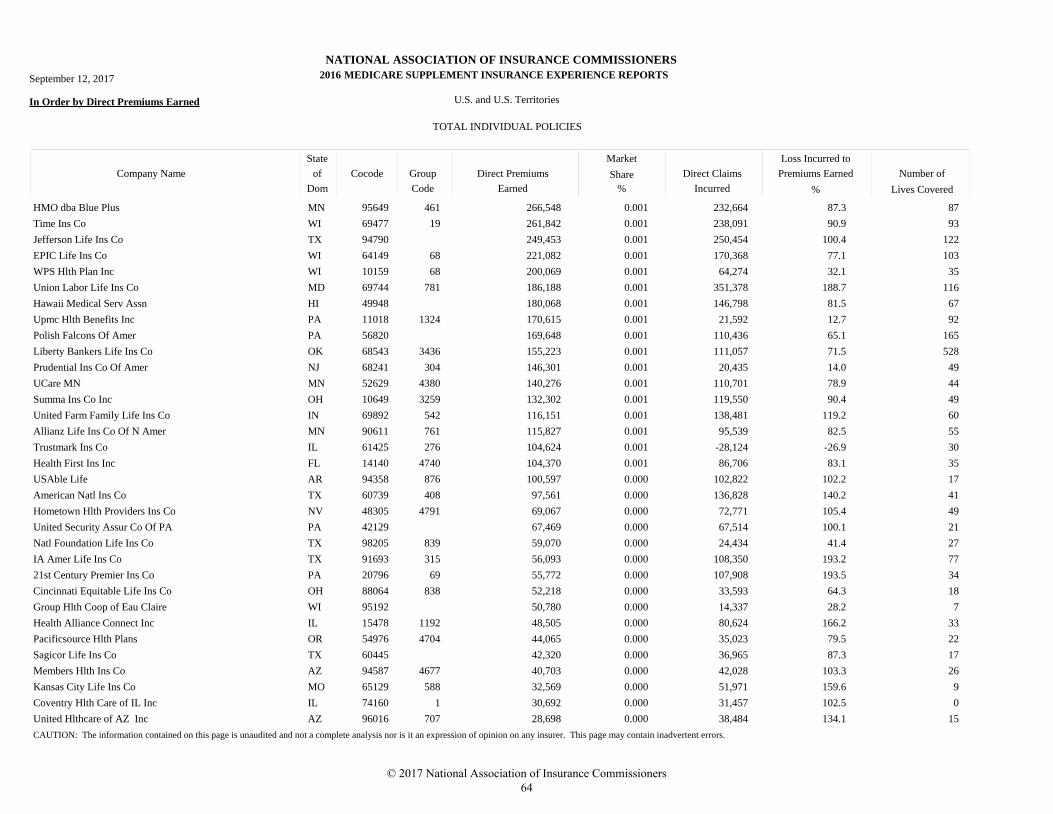
NATIONAL ASSOCIATION OF INSURANCE COMMISSIONERS
MEDICARE SUPPLEMENT INSURANCE EXPERIENCE REPORTS
In Order by Direct Premiums Earned U.S. and U.S. Territories
TOTAL INDIVIDUAL POLICIES
Market
Direct Claims
Incurred
Loss Incurred to
Premiums Earned Number of
Lives Covered
Direct Premiums
Earned
Company Name
State
Dom
Cocode Group
Code
of Share
% %
September 12, 2017 2016
HMO dba Blue Plus MN 95649 461 266,548 232,664 870.001 87.3
Time Ins Co WI 69477 19 261,842 238,091 930.001 90.9
Jefferson Life Ins Co TX 94790 249,453 250,454 1220.001 100.4
EPIC Life Ins Co WI 64149 68 221,082 170,368 1030.001 77.1
WPS Hlth Plan Inc WI 10159 68 200,069 64,274 350.001 32.1
Union Labor Life Ins Co MD 69744 781 186,188 351,378 1160.001 188.7
Hawaii Medical Serv Assn HI 49948 180,068 146,798 670.001 81.5
Upmc Hlth Benefits Inc PA 11018 1324 170,615 21,592 920.001 12.7
Polish Falcons Of Amer PA 56820 169,648 110,436 1650.001 65.1
Liberty Bankers Life Ins Co OK 68543 3436 155,223 111,057 5280.001 71.5
Prudential Ins Co Of Amer NJ 68241 304 146,301 20,435 490.001 14.0
UCare MN MN 52629 4380 140,276 110,701 440.001 78.9
Summa Ins Co Inc OH 10649 3259 132,302 119,550 490.001 90.4
United Farm Family Life Ins Co IN 69892 542 116,151 138,481 600.001 119.2
Allianz Life Ins Co Of N Amer MN 90611 761 115,827 95,539 550.001 82.5
Trustmark Ins Co IL 61425 276 104,624 -28,124 300.001 -26.9
Health First Ins Inc FL 14140 4740 104,370 86,706 350.001 83.1
USAble Life AR 94358 876 100,597 102,822 170.000 102.2
American Natl Ins Co TX 60739 408 97,561 136,828 410.000 140.2
Hometown Hlth Providers Ins Co NV 48305 4791 69,067 72,771 490.000 105.4
United Security Assur Co Of PA PA 42129 67,469 67,514 210.000 100.1
Natl Foundation Life Ins Co TX 98205 839 59,070 24,434 270.000 41.4
IA Amer Life Ins Co TX 91693 315 56,093 108,350 770.000 193.2
21st Century Premier Ins Co PA 20796 69 55,772 107,908 340.000 193.5
Cincinnati Equitable Life Ins Co OH 88064 838 52,218 33,593 180.000 64.3
Group Hlth Coop of Eau Claire WI 95192 50,780 14,337 70.000 28.2
Health Alliance Connect Inc IL 15478 1192 48,505 80,624 330.000 166.2
Pacificsource Hlth Plans OR 54976 4704 44,065 35,023 220.000 79.5
Sagicor Life Ins Co TX 60445 42,320 36,965 170.000 87.3
Members Hlth Ins Co AZ 94587 4677 40,703 42,028 260.000 103.3
Kansas City Life Ins Co MO 65129 588 32,569 51,971 90.000 159.6
Coventry Hlth Care of IL Inc IL 74160 1 30,692 31,457 00.000 102.5
United Hlthcare of AZ Inc AZ 96016 707 28,698 38,484 150.000 134.1
CAUTION: The information contained on this page is unaudited and not a complete analysis nor is it an expression of opinion on any insurer. This page may contain inadvertent errors.
© 2017 National Association of Insurance Commissioners 64
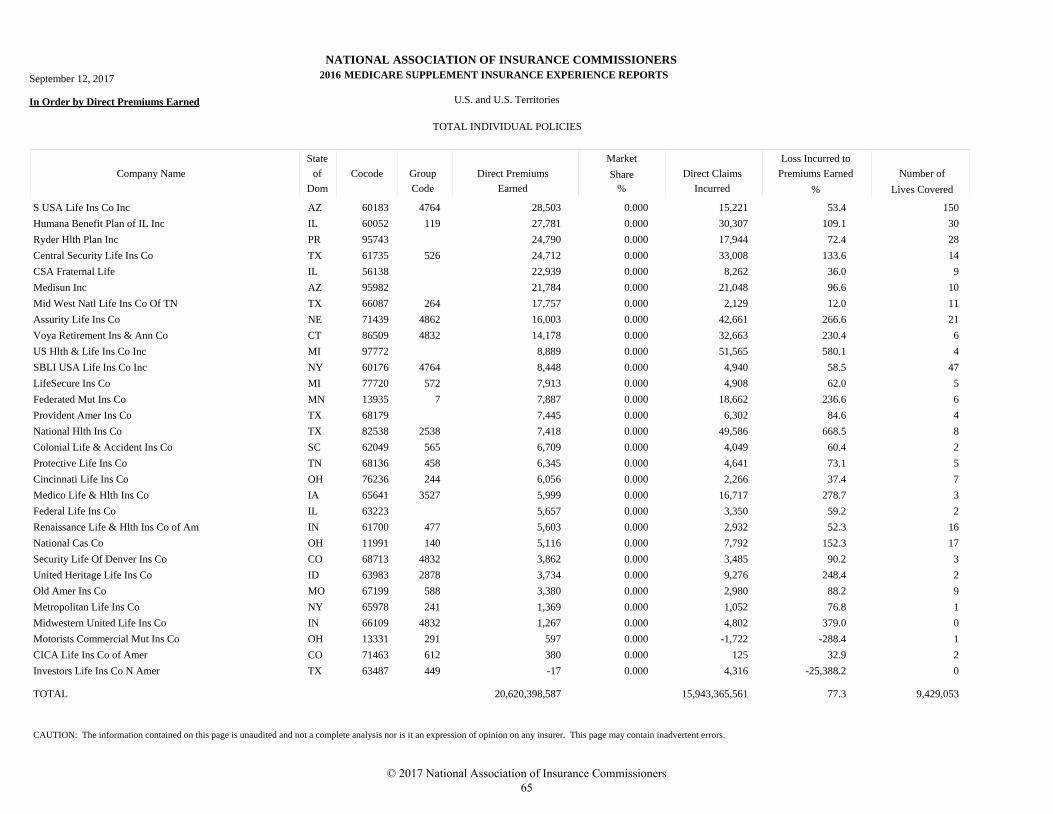
NATIONAL ASSOCIATION OF INSURANCE COMMISSIONERS
MEDICARE SUPPLEMENT INSURANCE EXPERIENCE REPORTS
In Order by Direct Premiums Earned U.S. and U.S. Territories
TOTAL INDIVIDUAL POLICIES
Market
Direct Claims
Incurred
Loss Incurred to
Premiums Earned Number of
Lives Covered
Direct Premiums
Earned
Company Name
State
Dom
Cocode Group
Code
of Share
% %
September 12, 2017 2016
S USA Life Ins Co Inc AZ 60183 4764 28,503 15,221 1500.000 53.4
Humana Benefit Plan of IL Inc IL 60052 119 27,781 30,307 300.000 109.1
Ryder Hlth Plan Inc PR 95743 24,790 17,944 280.000 72.4
Central Security Life Ins Co TX 61735 526 24,712 33,008 140.000 133.6
CSA Fraternal Life IL 56138 22,939 8,262 90.000 36.0
Medisun Inc AZ 95982 21,784 21,048 100.000 96.6
Mid West Natl Life Ins Co Of TN TX 66087 264 17,757 2,129 110.000 12.0
Assurity Life Ins Co NE 71439 4862 16,003 42,661 210.000 266.6
Voya Retirement Ins & Ann Co CT 86509 4832 14,178 32,663 60.000 230.4
US Hlth & Life Ins Co Inc MI 97772 8,889 51,565 40.000 580.1
SBLI USA Life Ins Co Inc NY 60176 4764 8,448 4,940 470.000 58.5
LifeSecure Ins Co MI 77720 572 7,913 4,908 50.000 62.0
Federated Mut Ins Co MN 13935 7 7,887 18,662 60.000 236.6
Provident Amer Ins Co TX 68179 7,445 6,302 40.000 84.6
National Hlth Ins Co TX 82538 2538 7,418 49,586 80.000 668.5
Colonial Life & Accident Ins Co SC 62049 565 6,709 4,049 20.000 60.4
Protective Life Ins Co TN 68136 458 6,345 4,641 50.000 73.1
Cincinnati Life Ins Co OH 76236 244 6,056 2,266 70.000 37.4
Medico Life & Hlth Ins Co IA 65641 3527 5,999 16,717 30.000 278.7
Federal Life Ins Co IL 63223 5,657 3,350 20.000 59.2
Renaissance Life & Hlth Ins Co of Am IN 61700 477 5,603 2,932 160.000 52.3
National Cas Co OH 11991 140 5,116 7,792 170.000 152.3
Security Life Of Denver Ins Co CO 68713 4832 3,862 3,485 30.000 90.2
United Heritage Life Ins Co ID 63983 2878 3,734 9,276 20.000 248.4
Old Amer Ins Co MO 67199 588 3,380 2,980 90.000 88.2
Metropolitan Life Ins Co NY 65978 241 1,369 1,052 10.000 76.8
Midwestern United Life Ins Co IN 66109 4832 1,267 4,802 00.000 379.0
Motorists Commercial Mut Ins Co OH 13331 291 597 -1,722 10.000 -288.4
CICA Life Ins Co of Amer CO 71463 612 380 125 20.000 32.9
Investors Life Ins Co N Amer TX 63487 449 -17 4,316 00.000 -25,388.2
20,620,398,587 15,943,365,561 9,429,053TOTAL 77.3
CAUTION: The information contained on this page is unaudited and not a complete analysis nor is it an expression of opinion on any insurer. This page may contain inadvertent errors.
© 2017 National Association of Insurance Commissioners 65

© 2017 National Association of Insurance Commissioners 66
TOTAL INDIVIDUAL POLICIES BY COMPANY NAME
© 2017 National Association of Insurance Commissioners 67

© 2017 National Association of Insurance Commissioners 68
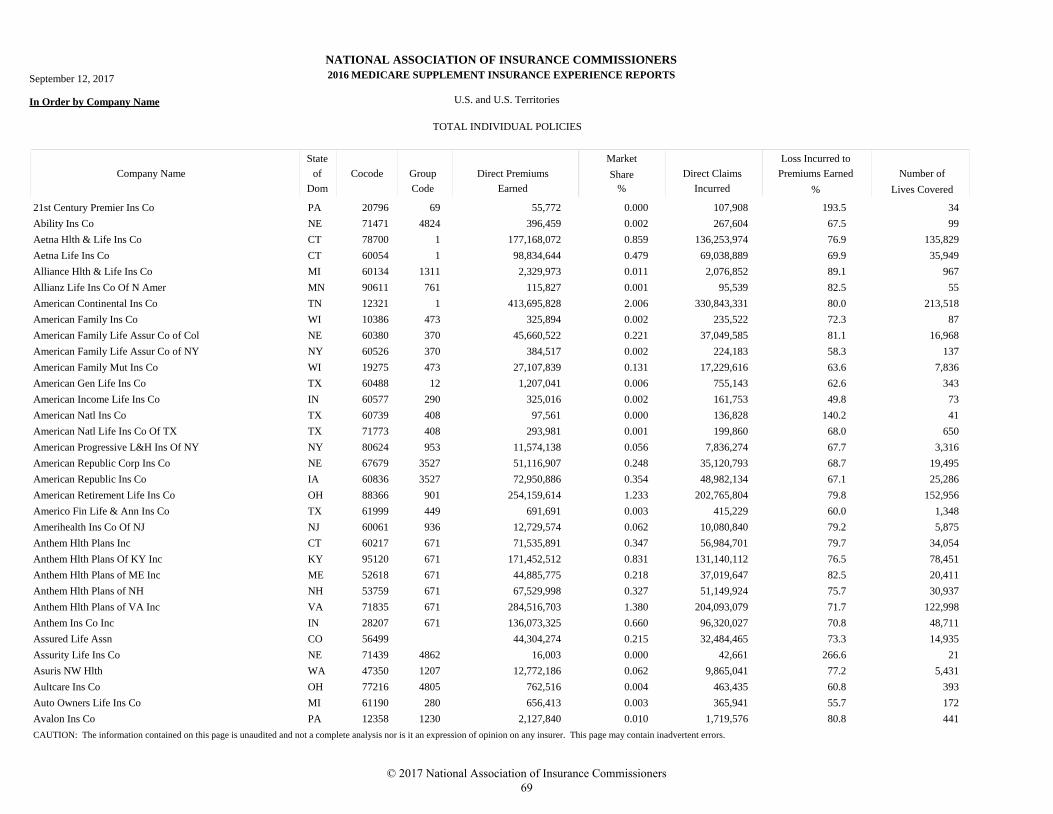
NATIONAL ASSOCIATION OF INSURANCE COMMISSIONERS
MEDICARE SUPPLEMENT INSURANCE EXPERIENCE REPORTS
In Order by Company Name U.S. and U.S. Territories
TOTAL INDIVIDUAL POLICIES
Market
Direct Claims
Incurred
Loss Incurred to
Premiums Earned Number of
Lives Covered
Direct Premiums
Earned
Company Name
State
Dom
Cocode Group
Code
of Share
% %
September 12, 2017 2016
21st Century Premier Ins Co PA 20796 69 55,772 107,908 340.000 193.5
Ability Ins Co NE 71471 4824 396,459 267,604 990.002 67.5
Aetna Hlth & Life Ins Co CT 78700 1 177,168,072 136,253,974 135,8290.859 76.9
Aetna Life Ins Co CT 60054 1 98,834,644 69,038,889 35,9490.479 69.9
Alliance Hlth & Life Ins Co MI 60134 1311 2,329,973 2,076,852 9670.011 89.1
Allianz Life Ins Co Of N Amer MN 90611 761 115,827 95,539 550.001 82.5
American Continental Ins Co TN 12321 1 413,695,828 330,843,331 213,5182.006 80.0
American Family Ins Co WI 10386 473 325,894 235,522 870.002 72.3
American Family Life Assur Co of Col NE 60380 370 45,660,522 37,049,585 16,9680.221 81.1
American Family Life Assur Co of NY NY 60526 370 384,517 224,183 1370.002 58.3
American Family Mut Ins Co WI 19275 473 27,107,839 17,229,616 7,8360.131 63.6
American Gen Life Ins Co TX 60488 12 1,207,041 755,143 3430.006 62.6
American Income Life Ins Co IN 60577 290 325,016 161,753 730.002 49.8
American Natl Ins Co TX 60739 408 97,561 136,828 410.000 140.2
American Natl Life Ins Co Of TX TX 71773 408 293,981 199,860 6500.001 68.0
American Progressive L&H Ins Of NY NY 80624 953 11,574,138 7,836,274 3,3160.056 67.7
American Republic Corp Ins Co NE 67679 3527 51,116,907 35,120,793 19,4950.248 68.7
American Republic Ins Co IA 60836 3527 72,950,886 48,982,134 25,2860.354 67.1
American Retirement Life Ins Co OH 88366 901 254,159,614 202,765,804 152,9561.233 79.8
Americo Fin Life & Ann Ins Co TX 61999 449 691,691 415,229 1,3480.003 60.0
Amerihealth Ins Co Of NJ NJ 60061 936 12,729,574 10,080,840 5,8750.062 79.2
Anthem Hlth Plans Inc CT 60217 671 71,535,891 56,984,701 34,0540.347 79.7
Anthem Hlth Plans Of KY Inc KY 95120 671 171,452,512 131,140,112 78,4510.831 76.5
Anthem Hlth Plans of ME Inc ME 52618 671 44,885,775 37,019,647 20,4110.218 82.5
Anthem Hlth Plans of NH NH 53759 671 67,529,998 51,149,924 30,9370.327 75.7
Anthem Hlth Plans of VA Inc VA 71835 671 284,516,703 204,093,079 122,9981.380 71.7
Anthem Ins Co Inc IN 28207 671 136,073,325 96,320,027 48,7110.660 70.8
Assured Life Assn CO 56499 44,304,274 32,484,465 14,9350.215 73.3
Assurity Life Ins Co NE 71439 4862 16,003 42,661 210.000 266.6
Asuris NW Hlth WA 47350 1207 12,772,186 9,865,041 5,4310.062 77.2
Aultcare Ins Co OH 77216 4805 762,516 463,435 3930.004 60.8
Auto Owners Life Ins Co MI 61190 280 656,413 365,941 1720.003 55.7
Avalon Ins Co PA 12358 1230 2,127,840 1,719,576 4410.010 80.8
CAUTION: The information contained on this page is unaudited and not a complete analysis nor is it an expression of opinion on any insurer. This page may contain inadvertent errors.
© 2017 National Association of Insurance Commissioners 69
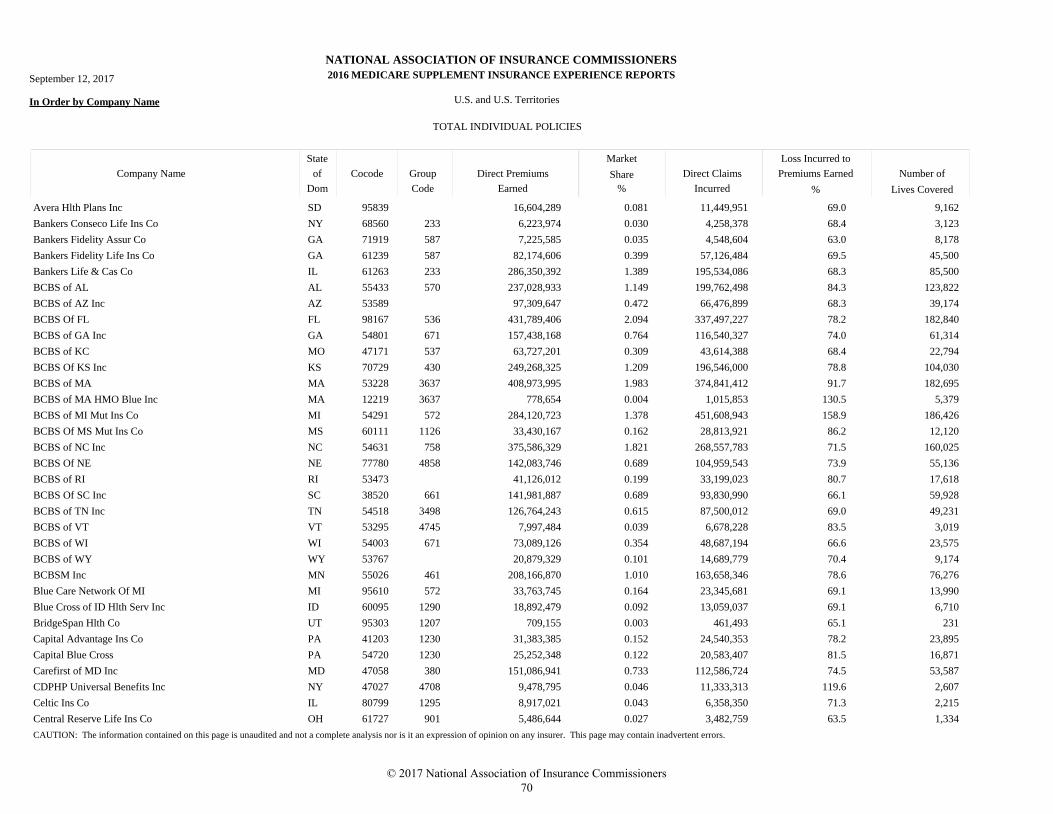
NATIONAL ASSOCIATION OF INSURANCE COMMISSIONERS
MEDICARE SUPPLEMENT INSURANCE EXPERIENCE REPORTS
In Order by Company Name U.S. and U.S. Territories
TOTAL INDIVIDUAL POLICIES
Market
Direct Claims
Incurred
Loss Incurred to
Premiums Earned Number of
Lives Covered
Direct Premiums
Earned
Company Name
State
Dom
Cocode Group
Code
of Share
% %
September 12, 2017 2016
Avera Hlth Plans Inc SD 95839 16,604,289 11,449,951 9,1620.081 69.0
Bankers Conseco Life Ins Co NY 68560 233 6,223,974 4,258,378 3,1230.030 68.4
Bankers Fidelity Assur Co GA 71919 587 7,225,585 4,548,604 8,1780.035 63.0
Bankers Fidelity Life Ins Co GA 61239 587 82,174,606 57,126,484 45,5000.399 69.5
Bankers Life & Cas Co IL 61263 233 286,350,392 195,534,086 85,5001.389 68.3
BCBS of AL AL 55433 570 237,028,933 199,762,498 123,8221.149 84.3
BCBS of AZ Inc AZ 53589 97,309,647 66,476,899 39,1740.472 68.3
BCBS Of FL FL 98167 536 431,789,406 337,497,227 182,8402.094 78.2
BCBS of GA Inc GA 54801 671 157,438,168 116,540,327 61,3140.764 74.0
BCBS of KC MO 47171 537 63,727,201 43,614,388 22,7940.309 68.4
BCBS Of KS Inc KS 70729 430 249,268,325 196,546,000 104,0301.209 78.8
BCBS of MA MA 53228 3637 408,973,995 374,841,412 182,6951.983 91.7
BCBS of MA HMO Blue Inc MA 12219 3637 778,654 1,015,853 5,3790.004 130.5
BCBS of MI Mut Ins Co MI 54291 572 284,120,723 451,608,943 186,4261.378 158.9
BCBS Of MS Mut Ins Co MS 60111 1126 33,430,167 28,813,921 12,1200.162 86.2
BCBS of NC Inc NC 54631 758 375,586,329 268,557,783 160,0251.821 71.5
BCBS Of NE NE 77780 4858 142,083,746 104,959,543 55,1360.689 73.9
BCBS of RI RI 53473 41,126,012 33,199,023 17,6180.199 80.7
BCBS Of SC Inc SC 38520 661 141,981,887 93,830,990 59,9280.689 66.1
BCBS of TN Inc TN 54518 3498 126,764,243 87,500,012 49,2310.615 69.0
BCBS of VT VT 53295 4745 7,997,484 6,678,228 3,0190.039 83.5
BCBS of WI WI 54003 671 73,089,126 48,687,194 23,5750.354 66.6
BCBS of WY WY 53767 20,879,329 14,689,779 9,1740.101 70.4
BCBSM Inc MN 55026 461 208,166,870 163,658,346 76,2761.010 78.6
Blue Care Network Of MI MI 95610 572 33,763,745 23,345,681 13,9900.164 69.1
Blue Cross of ID Hlth Serv Inc ID 60095 1290 18,892,479 13,059,037 6,7100.092 69.1
BridgeSpan Hlth Co UT 95303 1207 709,155 461,493 2310.003 65.1
Capital Advantage Ins Co PA 41203 1230 31,383,385 24,540,353 23,8950.152 78.2
Capital Blue Cross PA 54720 1230 25,252,348 20,583,407 16,8710.122 81.5
Carefirst of MD Inc MD 47058 380 151,086,941 112,586,724 53,5870.733 74.5
CDPHP Universal Benefits Inc NY 47027 4708 9,478,795 11,333,313 2,6070.046 119.6
Celtic Ins Co IL 80799 1295 8,917,021 6,358,350 2,2150.043 71.3
Central Reserve Life Ins Co OH 61727 901 5,486,644 3,482,759 1,3340.027 63.5
CAUTION: The information contained on this page is unaudited and not a complete analysis nor is it an expression of opinion on any insurer. This page may contain inadvertent errors.
© 2017 National Association of Insurance Commissioners 70
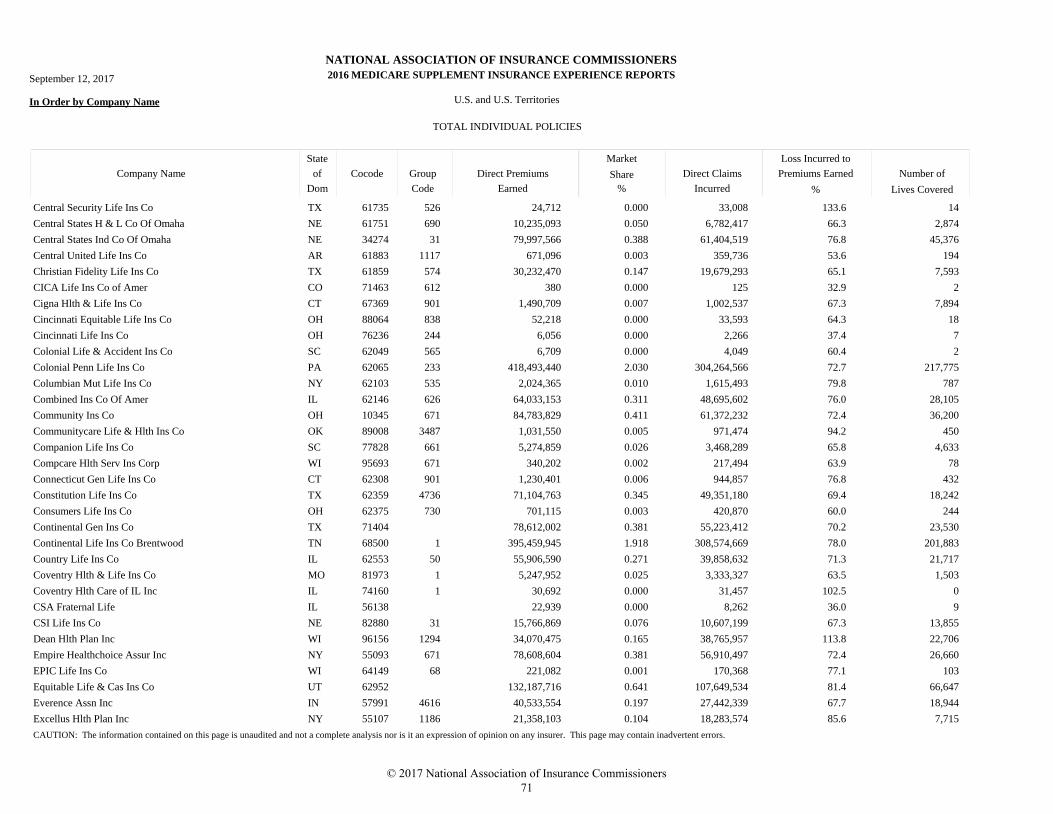
NATIONAL ASSOCIATION OF INSURANCE COMMISSIONERS
MEDICARE SUPPLEMENT INSURANCE EXPERIENCE REPORTS
In Order by Company Name U.S. and U.S. Territories
TOTAL INDIVIDUAL POLICIES
Market
Direct Claims
Incurred
Loss Incurred to
Premiums Earned Number of
Lives Covered
Direct Premiums
Earned
Company Name
State
Dom
Cocode Group
Code
of Share
% %
September 12, 2017 2016
Central Security Life Ins Co TX 61735 526 24,712 33,008 140.000 133.6
Central States H & L Co Of Omaha NE 61751 690 10,235,093 6,782,417 2,8740.050 66.3
Central States Ind Co Of Omaha NE 34274 31 79,997,566 61,404,519 45,3760.388 76.8
Central United Life Ins Co AR 61883 1117 671,096 359,736 1940.003 53.6
Christian Fidelity Life Ins Co TX 61859 574 30,232,470 19,679,293 7,5930.147 65.1
CICA Life Ins Co of Amer CO 71463 612 380 125 20.000 32.9
Cigna Hlth & Life Ins Co CT 67369 901 1,490,709 1,002,537 7,8940.007 67.3
Cincinnati Equitable Life Ins Co OH 88064 838 52,218 33,593 180.000 64.3
Cincinnati Life Ins Co OH 76236 244 6,056 2,266 70.000 37.4
Colonial Life & Accident Ins Co SC 62049 565 6,709 4,049 20.000 60.4
Colonial Penn Life Ins Co PA 62065 233 418,493,440 304,264,566 217,7752.030 72.7
Columbian Mut Life Ins Co NY 62103 535 2,024,365 1,615,493 7870.010 79.8
Combined Ins Co Of Amer IL 62146 626 64,033,153 48,695,602 28,1050.311 76.0
Community Ins Co OH 10345 671 84,783,829 61,372,232 36,2000.411 72.4
Communitycare Life & Hlth Ins Co OK 89008 3487 1,031,550 971,474 4500.005 94.2
Companion Life Ins Co SC 77828 661 5,274,859 3,468,289 4,6330.026 65.8
Compcare Hlth Serv Ins Corp WI 95693 671 340,202 217,494 780.002 63.9
Connecticut Gen Life Ins Co CT 62308 901 1,230,401 944,857 4320.006 76.8
Constitution Life Ins Co TX 62359 4736 71,104,763 49,351,180 18,2420.345 69.4
Consumers Life Ins Co OH 62375 730 701,115 420,870 2440.003 60.0
Continental Gen Ins Co TX 71404 78,612,002 55,223,412 23,5300.381 70.2
Continental Life Ins Co Brentwood TN 68500 1 395,459,945 308,574,669 201,8831.918 78.0
Country Life Ins Co IL 62553 50 55,906,590 39,858,632 21,7170.271 71.3
Coventry Hlth & Life Ins Co MO 81973 1 5,247,952 3,333,327 1,5030.025 63.5
Coventry Hlth Care of IL Inc IL 74160 1 30,692 31,457 00.000 102.5
CSA Fraternal Life IL 56138 22,939 8,262 90.000 36.0
CSI Life Ins Co NE 82880 31 15,766,869 10,607,199 13,8550.076 67.3
Dean Hlth Plan Inc WI 96156 1294 34,070,475 38,765,957 22,7060.165 113.8
Empire Healthchoice Assur Inc NY 55093 671 78,608,604 56,910,497 26,6600.381 72.4
EPIC Life Ins Co WI 64149 68 221,082 170,368 1030.001 77.1
Equitable Life & Cas Ins Co UT 62952 132,187,716 107,649,534 66,6470.641 81.4
Everence Assn Inc IN 57991 4616 40,533,554 27,442,339 18,9440.197 67.7
Excellus Hlth Plan Inc NY 55107 1186 21,358,103 18,283,574 7,7150.104 85.6
CAUTION: The information contained on this page is unaudited and not a complete analysis nor is it an expression of opinion on any insurer. This page may contain inadvertent errors.
© 2017 National Association of Insurance Commissioners 71
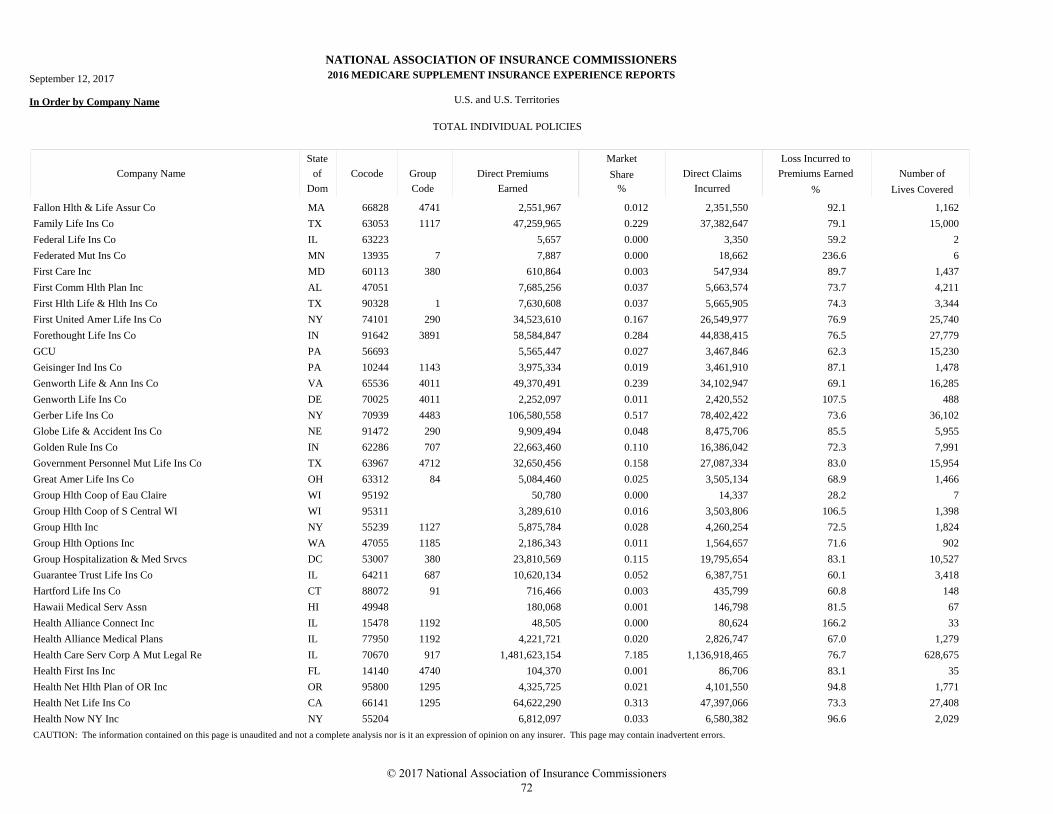
NATIONAL ASSOCIATION OF INSURANCE COMMISSIONERS
MEDICARE SUPPLEMENT INSURANCE EXPERIENCE REPORTS
In Order by Company Name U.S. and U.S. Territories
TOTAL INDIVIDUAL POLICIES
Market
Direct Claims
Incurred
Loss Incurred to
Premiums Earned Number of
Lives Covered
Direct Premiums
Earned
Company Name
State
Dom
Cocode Group
Code
of Share
% %
September 12, 2017 2016
Fallon Hlth & Life Assur Co MA 66828 4741 2,551,967 2,351,550 1,1620.012 92.1
Family Life Ins Co TX 63053 1117 47,259,965 37,382,647 15,0000.229 79.1
Federal Life Ins Co IL 63223 5,657 3,350 20.000 59.2
Federated Mut Ins Co MN 13935 7 7,887 18,662 60.000 236.6
First Care Inc MD 60113 380 610,864 547,934 1,4370.003 89.7
First Comm Hlth Plan Inc AL 47051 7,685,256 5,663,574 4,2110.037 73.7
First Hlth Life & Hlth Ins Co TX 90328 1 7,630,608 5,665,905 3,3440.037 74.3
First United Amer Life Ins Co NY 74101 290 34,523,610 26,549,977 25,7400.167 76.9
Forethought Life Ins Co IN 91642 3891 58,584,847 44,838,415 27,7790.284 76.5
GCU PA 56693 5,565,447 3,467,846 15,2300.027 62.3
Geisinger Ind Ins Co PA 10244 1143 3,975,334 3,461,910 1,4780.019 87.1
Genworth Life & Ann Ins Co VA 65536 4011 49,370,491 34,102,947 16,2850.239 69.1
Genworth Life Ins Co DE 70025 4011 2,252,097 2,420,552 4880.011 107.5
Gerber Life Ins Co NY 70939 4483 106,580,558 78,402,422 36,1020.517 73.6
Globe Life & Accident Ins Co NE 91472 290 9,909,494 8,475,706 5,9550.048 85.5
Golden Rule Ins Co IN 62286 707 22,663,460 16,386,042 7,9910.110 72.3
Government Personnel Mut Life Ins Co TX 63967 4712 32,650,456 27,087,334 15,9540.158 83.0
Great Amer Life Ins Co OH 63312 84 5,084,460 3,505,134 1,4660.025 68.9
Group Hlth Coop of Eau Claire WI 95192 50,780 14,337 70.000 28.2
Group Hlth Coop of S Central WI WI 95311 3,289,610 3,503,806 1,3980.016 106.5
Group Hlth Inc NY 55239 1127 5,875,784 4,260,254 1,8240.028 72.5
Group Hlth Options Inc WA 47055 1185 2,186,343 1,564,657 9020.011 71.6
Group Hospitalization & Med Srvcs DC 53007 380 23,810,569 19,795,654 10,5270.115 83.1
Guarantee Trust Life Ins Co IL 64211 687 10,620,134 6,387,751 3,4180.052 60.1
Hartford Life Ins Co CT 88072 91 716,466 435,799 1480.003 60.8
Hawaii Medical Serv Assn HI 49948 180,068 146,798 670.001 81.5
Health Alliance Connect Inc IL 15478 1192 48,505 80,624 330.000 166.2
Health Alliance Medical Plans IL 77950 1192 4,221,721 2,826,747 1,2790.020 67.0
Health Care Serv Corp A Mut Legal Re IL 70670 917 1,481,623,154 1,136,918,465 628,6757.185 76.7
Health First Ins Inc FL 14140 4740 104,370 86,706 350.001 83.1
Health Net Hlth Plan of OR Inc OR 95800 1295 4,325,725 4,101,550 1,7710.021 94.8
Health Net Life Ins Co CA 66141 1295 64,622,290 47,397,066 27,4080.313 73.3
Health Now NY Inc NY 55204 6,812,097 6,580,382 2,0290.033 96.6
CAUTION: The information contained on this page is unaudited and not a complete analysis nor is it an expression of opinion on any insurer. This page may contain inadvertent errors.
© 2017 National Association of Insurance Commissioners 72
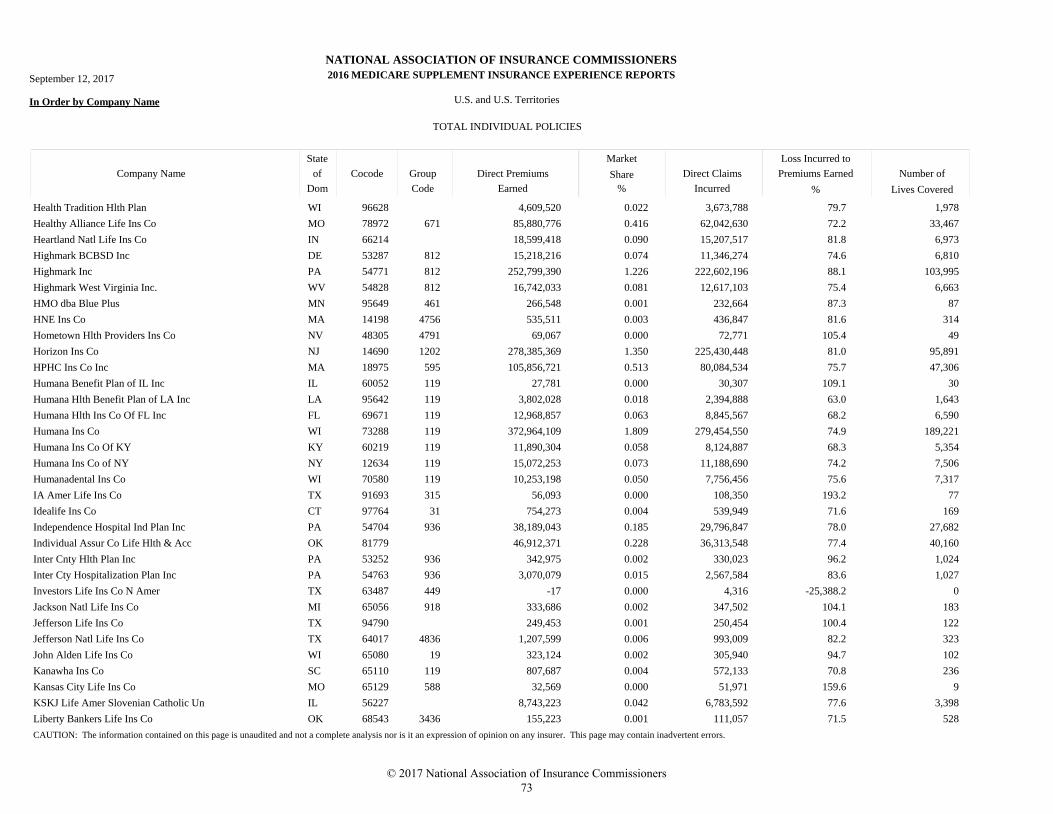
NATIONAL ASSOCIATION OF INSURANCE COMMISSIONERS
MEDICARE SUPPLEMENT INSURANCE EXPERIENCE REPORTS
In Order by Company Name U.S. and U.S. Territories
TOTAL INDIVIDUAL POLICIES
Market
Direct Claims
Incurred
Loss Incurred to
Premiums Earned Number of
Lives Covered
Direct Premiums
Earned
Company Name
State
Dom
Cocode Group
Code
of Share
% %
September 12, 2017 2016
Health Tradition Hlth Plan WI 96628 4,609,520 3,673,788 1,9780.022 79.7
Healthy Alliance Life Ins Co MO 78972 671 85,880,776 62,042,630 33,4670.416 72.2
Heartland Natl Life Ins Co IN 66214 18,599,418 15,207,517 6,9730.090 81.8
Highmark BCBSD Inc DE 53287 812 15,218,216 11,346,274 6,8100.074 74.6
Highmark Inc PA 54771 812 252,799,390 222,602,196 103,9951.226 88.1
Highmark West Virginia Inc. WV 54828 812 16,742,033 12,617,103 6,6630.081 75.4
HMO dba Blue Plus MN 95649 461 266,548 232,664 870.001 87.3
HNE Ins Co MA 14198 4756 535,511 436,847 3140.003 81.6
Hometown Hlth Providers Ins Co NV 48305 4791 69,067 72,771 490.000 105.4
Horizon Ins Co NJ 14690 1202 278,385,369 225,430,448 95,8911.350 81.0
HPHC Ins Co Inc MA 18975 595 105,856,721 80,084,534 47,3060.513 75.7
Humana Benefit Plan of IL Inc IL 60052 119 27,781 30,307 300.000 109.1
Humana Hlth Benefit Plan of LA Inc LA 95642 119 3,802,028 2,394,888 1,6430.018 63.0
Humana Hlth Ins Co Of FL Inc FL 69671 119 12,968,857 8,845,567 6,5900.063 68.2
Humana Ins Co WI 73288 119 372,964,109 279,454,550 189,2211.809 74.9
Humana Ins Co Of KY KY 60219 119 11,890,304 8,124,887 5,3540.058 68.3
Humana Ins Co of NY NY 12634 119 15,072,253 11,188,690 7,5060.073 74.2
Humanadental Ins Co WI 70580 119 10,253,198 7,756,456 7,3170.050 75.6
IA Amer Life Ins Co TX 91693 315 56,093 108,350 770.000 193.2
Idealife Ins Co CT 97764 31 754,273 539,949 1690.004 71.6
Independence Hospital Ind Plan Inc PA 54704 936 38,189,043 29,796,847 27,6820.185 78.0
Individual Assur Co Life Hlth & Acc OK 81779 46,912,371 36,313,548 40,1600.228 77.4
Inter Cnty Hlth Plan Inc PA 53252 936 342,975 330,023 1,0240.002 96.2
Inter Cty Hospitalization Plan Inc PA 54763 936 3,070,079 2,567,584 1,0270.015 83.6
Investors Life Ins Co N Amer TX 63487 449 -17 4,316 00.000 -25,388.2
Jackson Natl Life Ins Co MI 65056 918 333,686 347,502 1830.002 104.1
Jefferson Life Ins Co TX 94790 249,453 250,454 1220.001 100.4
Jefferson Natl Life Ins Co TX 64017 4836 1,207,599 993,009 3230.006 82.2
John Alden Life Ins Co WI 65080 19 323,124 305,940 1020.002 94.7
Kanawha Ins Co SC 65110 119 807,687 572,133 2360.004 70.8
Kansas City Life Ins Co MO 65129 588 32,569 51,971 90.000 159.6
KSKJ Life Amer Slovenian Catholic Un IL 56227 8,743,223 6,783,592 3,3980.042 77.6
Liberty Bankers Life Ins Co OK 68543 3436 155,223 111,057 5280.001 71.5
CAUTION: The information contained on this page is unaudited and not a complete analysis nor is it an expression of opinion on any insurer. This page may contain inadvertent errors.
© 2017 National Association of Insurance Commissioners 73
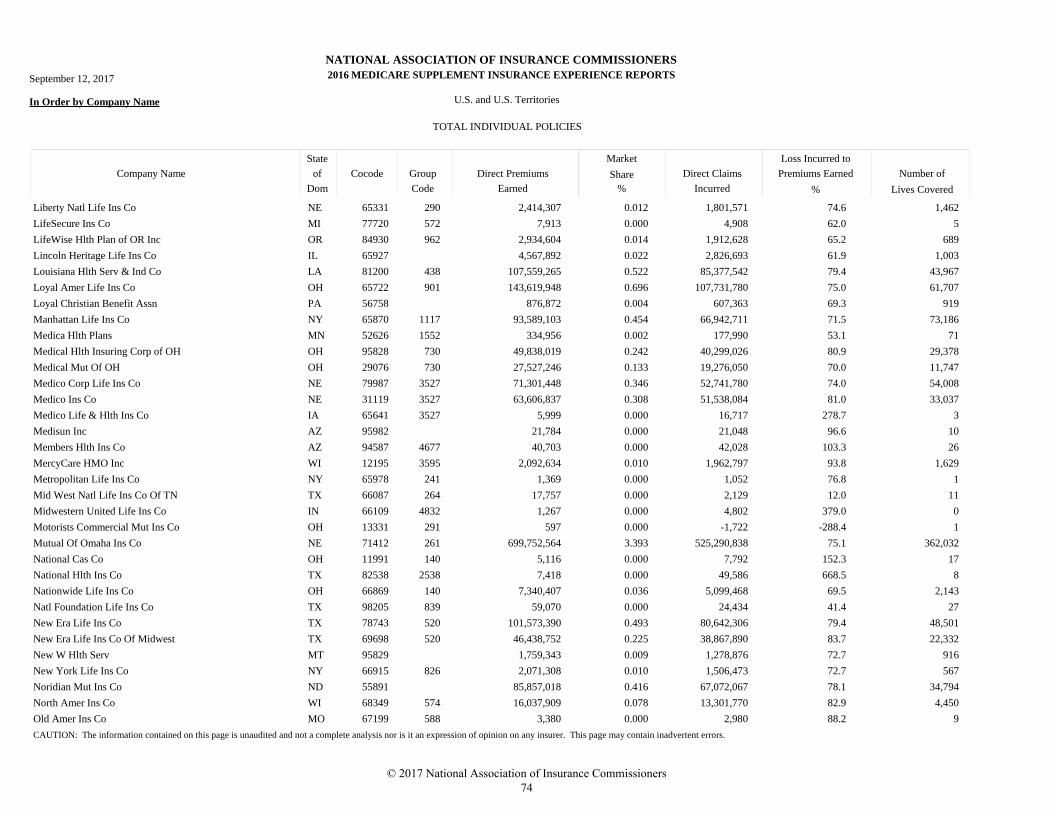
NATIONAL ASSOCIATION OF INSURANCE COMMISSIONERS
MEDICARE SUPPLEMENT INSURANCE EXPERIENCE REPORTS
In Order by Company Name U.S. and U.S. Territories
TOTAL INDIVIDUAL POLICIES
Market
Direct Claims
Incurred
Loss Incurred to
Premiums Earned Number of
Lives Covered
Direct Premiums
Earned
Company Name
State
Dom
Cocode Group
Code
of Share
% %
September 12, 2017 2016
Liberty Natl Life Ins Co NE 65331 290 2,414,307 1,801,571 1,4620.012 74.6
LifeSecure Ins Co MI 77720 572 7,913 4,908 50.000 62.0
LifeWise Hlth Plan of OR Inc OR 84930 962 2,934,604 1,912,628 6890.014 65.2
Lincoln Heritage Life Ins Co IL 65927 4,567,892 2,826,693 1,0030.022 61.9
Louisiana Hlth Serv & Ind Co LA 81200 438 107,559,265 85,377,542 43,9670.522 79.4
Loyal Amer Life Ins Co OH 65722 901 143,619,948 107,731,780 61,7070.696 75.0
Loyal Christian Benefit Assn PA 56758 876,872 607,363 9190.004 69.3
Manhattan Life Ins Co NY 65870 1117 93,589,103 66,942,711 73,1860.454 71.5
Medica Hlth Plans MN 52626 1552 334,956 177,990 710.002 53.1
Medical Hlth Insuring Corp of OH OH 95828 730 49,838,019 40,299,026 29,3780.242 80.9
Medical Mut Of OH OH 29076 730 27,527,246 19,276,050 11,7470.133 70.0
Medico Corp Life Ins Co NE 79987 3527 71,301,448 52,741,780 54,0080.346 74.0
Medico Ins Co NE 31119 3527 63,606,837 51,538,084 33,0370.308 81.0
Medico Life & Hlth Ins Co IA 65641 3527 5,999 16,717 30.000 278.7
Medisun Inc AZ 95982 21,784 21,048 100.000 96.6
Members Hlth Ins Co AZ 94587 4677 40,703 42,028 260.000 103.3
MercyCare HMO Inc WI 12195 3595 2,092,634 1,962,797 1,6290.010 93.8
Metropolitan Life Ins Co NY 65978 241 1,369 1,052 10.000 76.8
Mid West Natl Life Ins Co Of TN TX 66087 264 17,757 2,129 110.000 12.0
Midwestern United Life Ins Co IN 66109 4832 1,267 4,802 00.000 379.0
Motorists Commercial Mut Ins Co OH 13331 291 597 -1,722 10.000 -288.4
Mutual Of Omaha Ins Co NE 71412 261 699,752,564 525,290,838 362,0323.393 75.1
National Cas Co OH 11991 140 5,116 7,792 170.000 152.3
National Hlth Ins Co TX 82538 2538 7,418 49,586 80.000 668.5
Nationwide Life Ins Co OH 66869 140 7,340,407 5,099,468 2,1430.036 69.5
Natl Foundation Life Ins Co TX 98205 839 59,070 24,434 270.000 41.4
New Era Life Ins Co TX 78743 520 101,573,390 80,642,306 48,5010.493 79.4
New Era Life Ins Co Of Midwest TX 69698 520 46,438,752 38,867,890 22,3320.225 83.7
New W Hlth Serv MT 95829 1,759,343 1,278,876 9160.009 72.7
New York Life Ins Co NY 66915 826 2,071,308 1,506,473 5670.010 72.7
Noridian Mut Ins Co ND 55891 85,857,018 67,072,067 34,7940.416 78.1
North Amer Ins Co WI 68349 574 16,037,909 13,301,770 4,4500.078 82.9
Old Amer Ins Co MO 67199 588 3,380 2,980 90.000 88.2
CAUTION: The information contained on this page is unaudited and not a complete analysis nor is it an expression of opinion on any insurer. This page may contain inadvertent errors.
© 2017 National Association of Insurance Commissioners 74
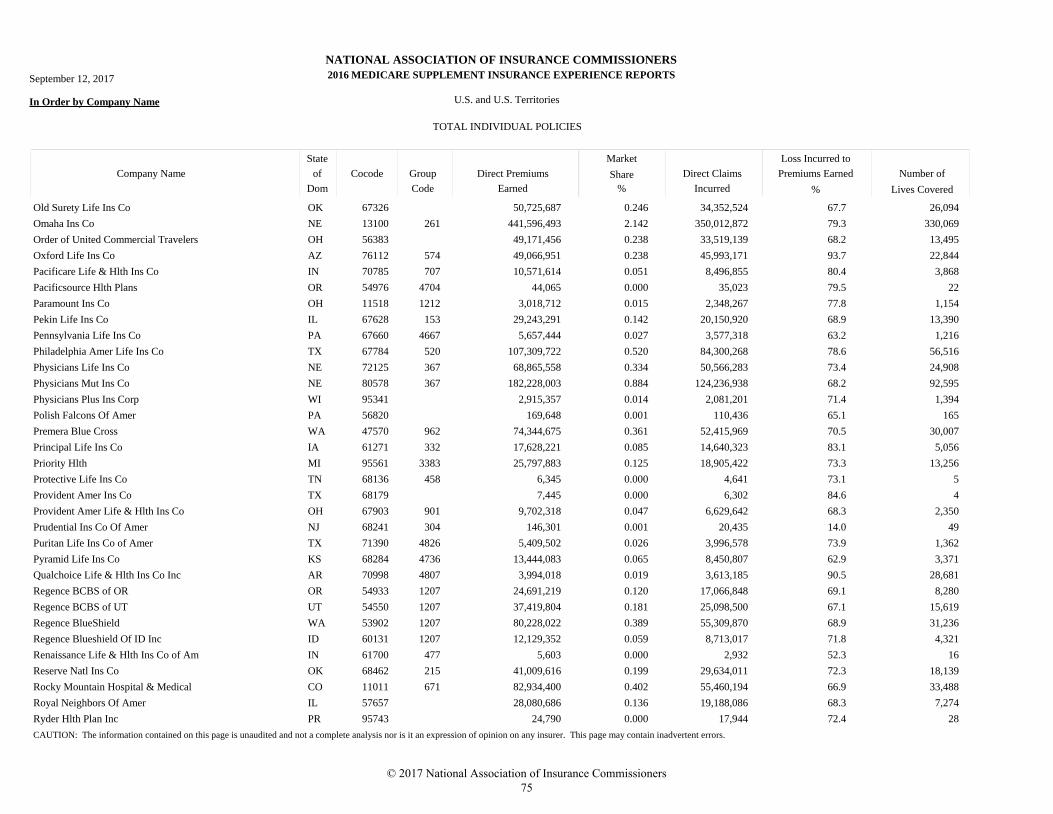
NATIONAL ASSOCIATION OF INSURANCE COMMISSIONERS
MEDICARE SUPPLEMENT INSURANCE EXPERIENCE REPORTS
In Order by Company Name U.S. and U.S. Territories
TOTAL INDIVIDUAL POLICIES
Market
Direct Claims
Incurred
Loss Incurred to
Premiums Earned Number of
Lives Covered
Direct Premiums
Earned
Company Name
State
Dom
Cocode Group
Code
of Share
% %
September 12, 2017 2016
Old Surety Life Ins Co OK 67326 50,725,687 34,352,524 26,0940.246 67.7
Omaha Ins Co NE 13100 261 441,596,493 350,012,872 330,0692.142 79.3
Order of United Commercial Travelers OH 56383 49,171,456 33,519,139 13,4950.238 68.2
Oxford Life Ins Co AZ 76112 574 49,066,951 45,993,171 22,8440.238 93.7
Pacificare Life & Hlth Ins Co IN 70785 707 10,571,614 8,496,855 3,8680.051 80.4
Pacificsource Hlth Plans OR 54976 4704 44,065 35,023 220.000 79.5
Paramount Ins Co OH 11518 1212 3,018,712 2,348,267 1,1540.015 77.8
Pekin Life Ins Co IL 67628 153 29,243,291 20,150,920 13,3900.142 68.9
Pennsylvania Life Ins Co PA 67660 4667 5,657,444 3,577,318 1,2160.027 63.2
Philadelphia Amer Life Ins Co TX 67784 520 107,309,722 84,300,268 56,5160.520 78.6
Physicians Life Ins Co NE 72125 367 68,865,558 50,566,283 24,9080.334 73.4
Physicians Mut Ins Co NE 80578 367 182,228,003 124,236,938 92,5950.884 68.2
Physicians Plus Ins Corp WI 95341 2,915,357 2,081,201 1,3940.014 71.4
Polish Falcons Of Amer PA 56820 169,648 110,436 1650.001 65.1
Premera Blue Cross WA 47570 962 74,344,675 52,415,969 30,0070.361 70.5
Principal Life Ins Co IA 61271 332 17,628,221 14,640,323 5,0560.085 83.1
Priority Hlth MI 95561 3383 25,797,883 18,905,422 13,2560.125 73.3
Protective Life Ins Co TN 68136 458 6,345 4,641 50.000 73.1
Provident Amer Ins Co TX 68179 7,445 6,302 40.000 84.6
Provident Amer Life & Hlth Ins Co OH 67903 901 9,702,318 6,629,642 2,3500.047 68.3
Prudential Ins Co Of Amer NJ 68241 304 146,301 20,435 490.001 14.0
Puritan Life Ins Co of Amer TX 71390 4826 5,409,502 3,996,578 1,3620.026 73.9
Pyramid Life Ins Co KS 68284 4736 13,444,083 8,450,807 3,3710.065 62.9
Qualchoice Life & Hlth Ins Co Inc AR 70998 4807 3,994,018 3,613,185 28,6810.019 90.5
Regence BCBS of OR OR 54933 1207 24,691,219 17,066,848 8,2800.120 69.1
Regence BCBS of UT UT 54550 1207 37,419,804 25,098,500 15,6190.181 67.1
Regence BlueShield WA 53902 1207 80,228,022 55,309,870 31,2360.389 68.9
Regence Blueshield Of ID Inc ID 60131 1207 12,129,352 8,713,017 4,3210.059 71.8
Renaissance Life & Hlth Ins Co of Am IN 61700 477 5,603 2,932 160.000 52.3
Reserve Natl Ins Co OK 68462 215 41,009,616 29,634,011 18,1390.199 72.3
Rocky Mountain Hospital & Medical CO 11011 671 82,934,400 55,460,194 33,4880.402 66.9
Royal Neighbors Of Amer IL 57657 28,080,686 19,188,086 7,2740.136 68.3
Ryder Hlth Plan Inc PR 95743 24,790 17,944 280.000 72.4
CAUTION: The information contained on this page is unaudited and not a complete analysis nor is it an expression of opinion on any insurer. This page may contain inadvertent errors.
© 2017 National Association of Insurance Commissioners 75
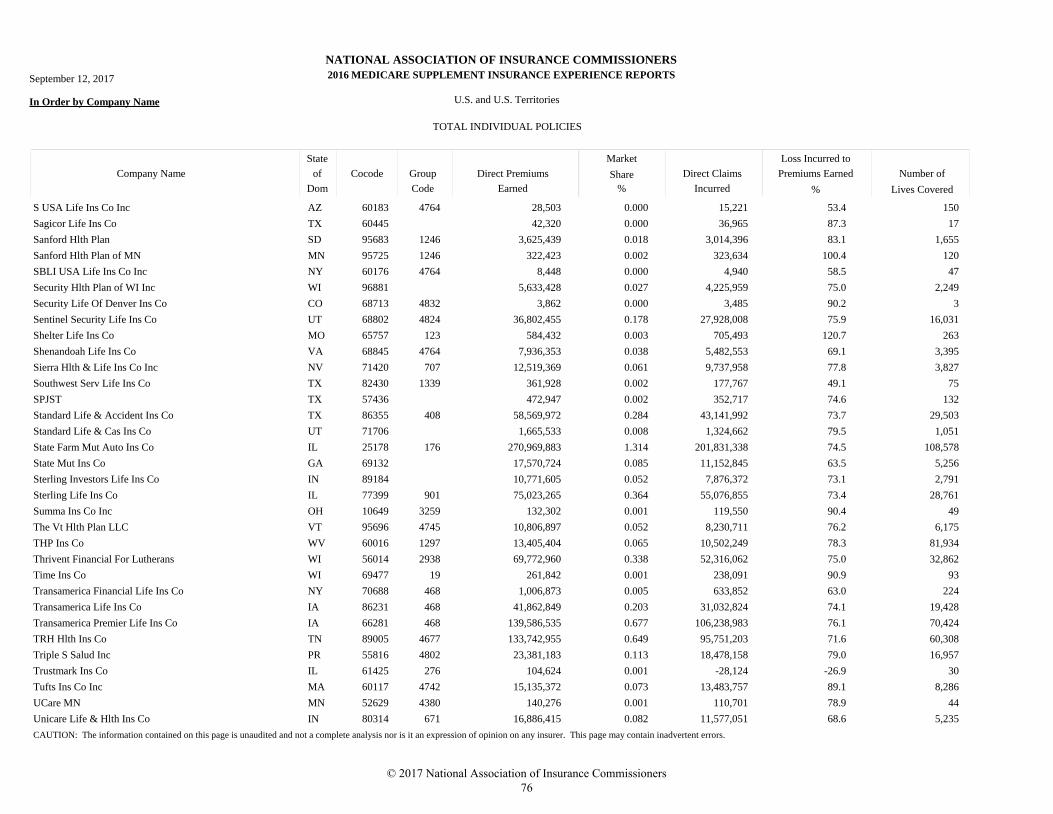
NATIONAL ASSOCIATION OF INSURANCE COMMISSIONERS
MEDICARE SUPPLEMENT INSURANCE EXPERIENCE REPORTS
In Order by Company Name U.S. and U.S. Territories
TOTAL INDIVIDUAL POLICIES
Market
Direct Claims
Incurred
Loss Incurred to
Premiums Earned Number of
Lives Covered
Direct Premiums
Earned
Company Name
State
Dom
Cocode Group
Code
of Share
% %
September 12, 2017 2016
S USA Life Ins Co Inc AZ 60183 4764 28,503 15,221 1500.000 53.4
Sagicor Life Ins Co TX 60445 42,320 36,965 170.000 87.3
Sanford Hlth Plan SD 95683 1246 3,625,439 3,014,396 1,6550.018 83.1
Sanford Hlth Plan of MN MN 95725 1246 322,423 323,634 1200.002 100.4
SBLI USA Life Ins Co Inc NY 60176 4764 8,448 4,940 470.000 58.5
Security Hlth Plan of WI Inc WI 96881 5,633,428 4,225,959 2,2490.027 75.0
Security Life Of Denver Ins Co CO 68713 4832 3,862 3,485 30.000 90.2
Sentinel Security Life Ins Co UT 68802 4824 36,802,455 27,928,008 16,0310.178 75.9
Shelter Life Ins Co MO 65757 123 584,432 705,493 2630.003 120.7
Shenandoah Life Ins Co VA 68845 4764 7,936,353 5,482,553 3,3950.038 69.1
Sierra Hlth & Life Ins Co Inc NV 71420 707 12,519,369 9,737,958 3,8270.061 77.8
Southwest Serv Life Ins Co TX 82430 1339 361,928 177,767 750.002 49.1
SPJST TX 57436 472,947 352,717 1320.002 74.6
Standard Life & Accident Ins Co TX 86355 408 58,569,972 43,141,992 29,5030.284 73.7
Standard Life & Cas Ins Co UT 71706 1,665,533 1,324,662 1,0510.008 79.5
State Farm Mut Auto Ins Co IL 25178 176 270,969,883 201,831,338 108,5781.314 74.5
State Mut Ins Co GA 69132 17,570,724 11,152,845 5,2560.085 63.5
Sterling Investors Life Ins Co IN 89184 10,771,605 7,876,372 2,7910.052 73.1
Sterling Life Ins Co IL 77399 901 75,023,265 55,076,855 28,7610.364 73.4
Summa Ins Co Inc OH 10649 3259 132,302 119,550 490.001 90.4
The Vt Hlth Plan LLC VT 95696 4745 10,806,897 8,230,711 6,1750.052 76.2
THP Ins Co WV 60016 1297 13,405,404 10,502,249 81,9340.065 78.3
Thrivent Financial For Lutherans WI 56014 2938 69,772,960 52,316,062 32,8620.338 75.0
Time Ins Co WI 69477 19 261,842 238,091 930.001 90.9
Transamerica Financial Life Ins Co NY 70688 468 1,006,873 633,852 2240.005 63.0
Transamerica Life Ins Co IA 86231 468 41,862,849 31,032,824 19,4280.203 74.1
Transamerica Premier Life Ins Co IA 66281 468 139,586,535 106,238,983 70,4240.677 76.1
TRH Hlth Ins Co TN 89005 4677 133,742,955 95,751,203 60,3080.649 71.6
Triple S Salud Inc PR 55816 4802 23,381,183 18,478,158 16,9570.113 79.0
Trustmark Ins Co IL 61425 276 104,624 -28,124 300.001 -26.9
Tufts Ins Co Inc MA 60117 4742 15,135,372 13,483,757 8,2860.073 89.1
UCare MN MN 52629 4380 140,276 110,701 440.001 78.9
Unicare Life & Hlth Ins Co IN 80314 671 16,886,415 11,577,051 5,2350.082 68.6
CAUTION: The information contained on this page is unaudited and not a complete analysis nor is it an expression of opinion on any insurer. This page may contain inadvertent errors.
© 2017 National Association of Insurance Commissioners 76
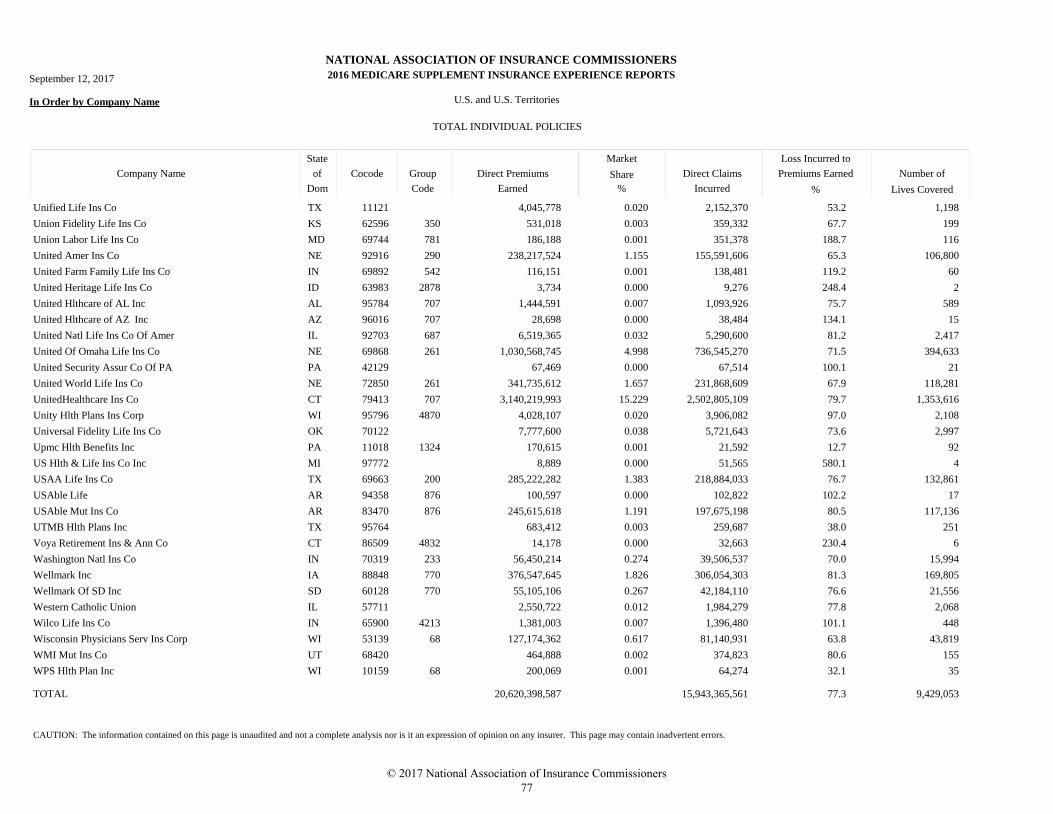
NATIONAL ASSOCIATION OF INSURANCE COMMISSIONERS
MEDICARE SUPPLEMENT INSURANCE EXPERIENCE REPORTS
In Order by Company Name U.S. and U.S. Territories
TOTAL INDIVIDUAL POLICIES
Market
Direct Claims
Incurred
Loss Incurred to
Premiums Earned Number of
Lives Covered
Direct Premiums
Earned
Company Name
State
Dom
Cocode Group
Code
of Share
% %
September 12, 2017 2016
Unified Life Ins Co TX 11121 4,045,778 2,152,370 1,1980.020 53.2
Union Fidelity Life Ins Co KS 62596 350 531,018 359,332 1990.003 67.7
Union Labor Life Ins Co MD 69744 781 186,188 351,378 1160.001 188.7
United Amer Ins Co NE 92916 290 238,217,524 155,591,606 106,8001.155 65.3
United Farm Family Life Ins Co IN 69892 542 116,151 138,481 600.001 119.2
United Heritage Life Ins Co ID 63983 2878 3,734 9,276 20.000 248.4
United Hlthcare of AL Inc AL 95784 707 1,444,591 1,093,926 5890.007 75.7
United Hlthcare of AZ Inc AZ 96016 707 28,698 38,484 150.000 134.1
United Natl Life Ins Co Of Amer IL 92703 687 6,519,365 5,290,600 2,4170.032 81.2
United Of Omaha Life Ins Co NE 69868 261 1,030,568,745 736,545,270 394,6334.998 71.5
United Security Assur Co Of PA PA 42129 67,469 67,514 210.000 100.1
United World Life Ins Co NE 72850 261 341,735,612 231,868,609 118,2811.657 67.9
UnitedHealthcare Ins Co CT 79413 707 3,140,219,993 2,502,805,109 1,353,61615.229 79.7
Unity Hlth Plans Ins Corp WI 95796 4870 4,028,107 3,906,082 2,1080.020 97.0
Universal Fidelity Life Ins Co OK 70122 7,777,600 5,721,643 2,9970.038 73.6
Upmc Hlth Benefits Inc PA 11018 1324 170,615 21,592 920.001 12.7
US Hlth & Life Ins Co Inc MI 97772 8,889 51,565 40.000 580.1
USAA Life Ins Co TX 69663 200 285,222,282 218,884,033 132,8611.383 76.7
USAble Life AR 94358 876 100,597 102,822 170.000 102.2
USAble Mut Ins Co AR 83470 876 245,615,618 197,675,198 117,1361.191 80.5
UTMB Hlth Plans Inc TX 95764 683,412 259,687 2510.003 38.0
Voya Retirement Ins & Ann Co CT 86509 4832 14,178 32,663 60.000 230.4
Washington Natl Ins Co IN 70319 233 56,450,214 39,506,537 15,9940.274 70.0
Wellmark Inc IA 88848 770 376,547,645 306,054,303 169,8051.826 81.3
Wellmark Of SD Inc SD 60128 770 55,105,106 42,184,110 21,5560.267 76.6
Western Catholic Union IL 57711 2,550,722 1,984,279 2,0680.012 77.8
Wilco Life Ins Co IN 65900 4213 1,381,003 1,396,480 4480.007 101.1
Wisconsin Physicians Serv Ins Corp WI 53139 68 127,174,362 81,140,931 43,8190.617 63.8
WMI Mut Ins Co UT 68420 464,888 374,823 1550.002 80.6
WPS Hlth Plan Inc WI 10159 68 200,069 64,274 350.001 32.1
20,620,398,587 15,943,365,561 9,429,053TOTAL 77.3
CAUTION: The information contained on this page is unaudited and not a complete analysis nor is it an expression of opinion on any insurer. This page may contain inadvertent errors.
© 2017 National Association of Insurance Commissioners 77

© 2017 National Association of Insurance Commissioners 78
GROUP POLICIES ISSUED THROUGH 2013 BY DIRECT PREMIUMS EARNED
© 2017 National Association of Insurance Commissioners 79

© 2017 National Association of Insurance Commissioners 80
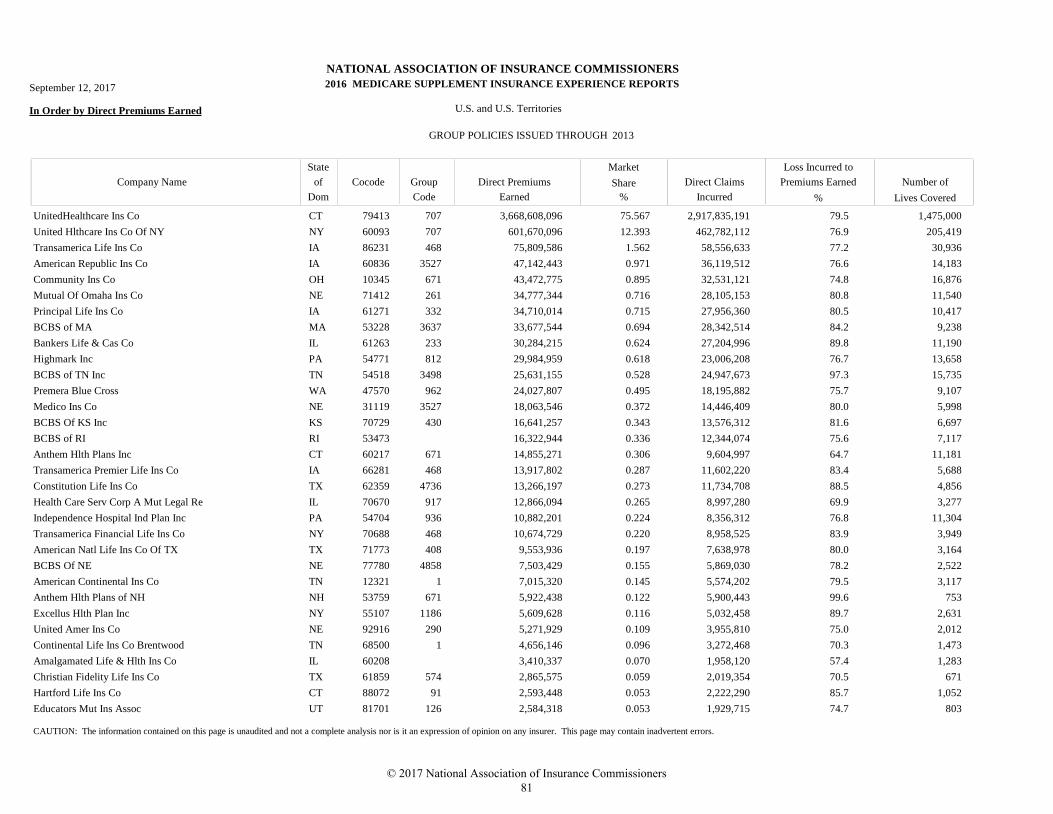
NATIONAL ASSOCIATION OF INSURANCE COMMISSIONERS
MEDICARE SUPPLEMENT INSURANCE EXPERIENCE REPORTS
In Order by Direct Premiums Earned U.S. and U.S. Territories
GROUP POLICIES ISSUED THROUGH
Market
Direct Claims
Incurred
Loss Incurred to
Premiums Earned Number of
Lives Covered
Direct Premiums
Earned
Company Name
State
Dom
Cocode Group
Code
of Share
% %
September 12, 2017 2016
2013
UnitedHealthcare Ins Co CT 79413 707 3,668,608,096 2,917,835,191 1,475,00075.567 79.5
United Hlthcare Ins Co Of NY NY 60093 707 601,670,096 462,782,112 205,41912.393 76.9
Transamerica Life Ins Co IA 86231 468 75,809,586 58,556,633 30,9361.562 77.2
American Republic Ins Co IA 60836 3527 47,142,443 36,119,512 14,1830.971 76.6
Community Ins Co OH 10345 671 43,472,775 32,531,121 16,8760.895 74.8
Mutual Of Omaha Ins Co NE 71412 261 34,777,344 28,105,153 11,5400.716 80.8
Principal Life Ins Co IA 61271 332 34,710,014 27,956,360 10,4170.715 80.5
BCBS of MA MA 53228 3637 33,677,544 28,342,514 9,2380.694 84.2
Bankers Life & Cas Co IL 61263 233 30,284,215 27,204,996 11,1900.624 89.8
Highmark Inc PA 54771 812 29,984,959 23,006,208 13,6580.618 76.7
BCBS of TN Inc TN 54518 3498 25,631,155 24,947,673 15,7350.528 97.3
Premera Blue Cross WA 47570 962 24,027,807 18,195,882 9,1070.495 75.7
Medico Ins Co NE 31119 3527 18,063,546 14,446,409 5,9980.372 80.0
BCBS Of KS Inc KS 70729 430 16,641,257 13,576,312 6,6970.343 81.6
BCBS of RI RI 53473 16,322,944 12,344,074 7,1170.336 75.6
Anthem Hlth Plans Inc CT 60217 671 14,855,271 9,604,997 11,1810.306 64.7
Transamerica Premier Life Ins Co IA 66281 468 13,917,802 11,602,220 5,6880.287 83.4
Constitution Life Ins Co TX 62359 4736 13,266,197 11,734,708 4,8560.273 88.5
Health Care Serv Corp A Mut Legal Re IL 70670 917 12,866,094 8,997,280 3,2770.265 69.9
Independence Hospital Ind Plan Inc PA 54704 936 10,882,201 8,356,312 11,3040.224 76.8
Transamerica Financial Life Ins Co NY 70688 468 10,674,729 8,958,525 3,9490.220 83.9
American Natl Life Ins Co Of TX TX 71773 408 9,553,936 7,638,978 3,1640.197 80.0
BCBS Of NE NE 77780 4858 7,503,429 5,869,030 2,5220.155 78.2
American Continental Ins Co TN 12321 1 7,015,320 5,574,202 3,1170.145 79.5
Anthem Hlth Plans of NH NH 53759 671 5,922,438 5,900,443 7530.122 99.6
Excellus Hlth Plan Inc NY 55107 1186 5,609,628 5,032,458 2,6310.116 89.7
United Amer Ins Co NE 92916 290 5,271,929 3,955,810 2,0120.109 75.0
Continental Life Ins Co Brentwood TN 68500 1 4,656,146 3,272,468 1,4730.096 70.3
Amalgamated Life & Hlth Ins Co IL 60208 3,410,337 1,958,120 1,2830.070 57.4
Christian Fidelity Life Ins Co TX 61859 574 2,865,575 2,019,354 6710.059 70.5
Hartford Life Ins Co CT 88072 91 2,593,448 2,222,290 1,0520.053 85.7
Educators Mut Ins Assoc UT 81701 126 2,584,318 1,929,715 8030.053 74.7
CAUTION: The information contained on this page is unaudited and not a complete analysis nor is it an expression of opinion on any insurer. This page may contain inadvertent errors.
© 2017 National Association of Insurance Commissioners 81
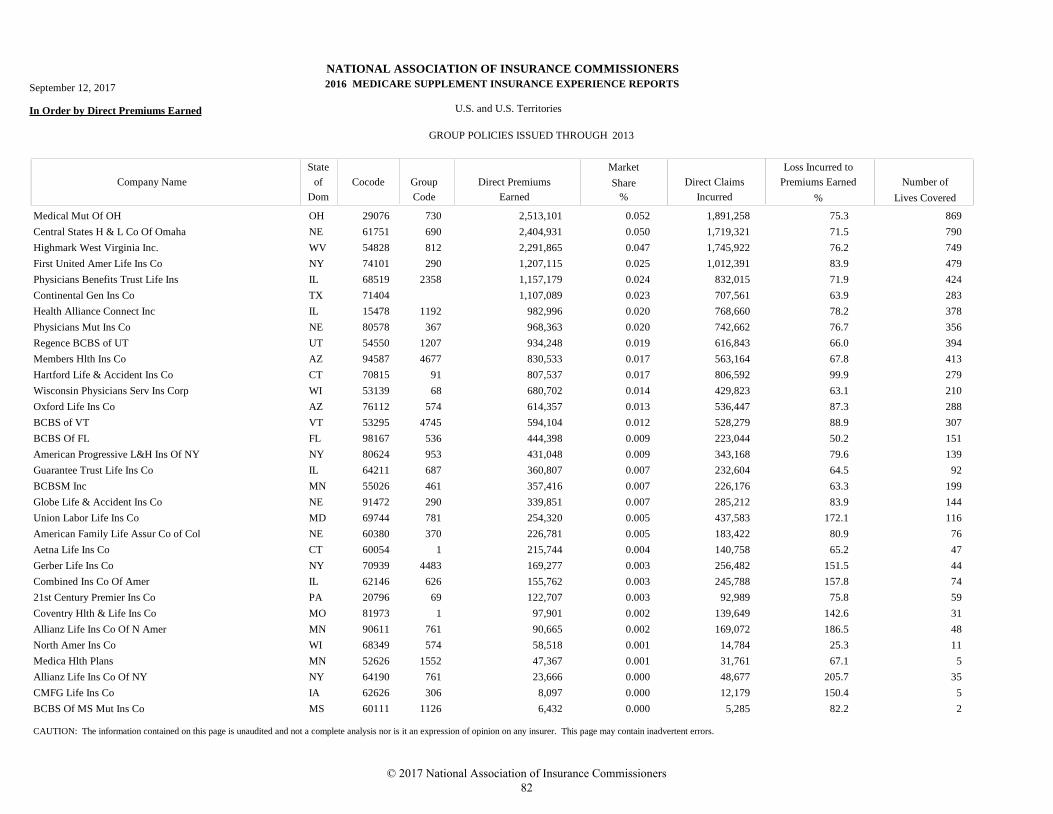
NATIONAL ASSOCIATION OF INSURANCE COMMISSIONERS
MEDICARE SUPPLEMENT INSURANCE EXPERIENCE REPORTS
In Order by Direct Premiums Earned U.S. and U.S. Territories
GROUP POLICIES ISSUED THROUGH
Market
Direct Claims
Incurred
Loss Incurred to
Premiums Earned Number of
Lives Covered
Direct Premiums
Earned
Company Name
State
Dom
Cocode Group
Code
of Share
% %
September 12, 2017 2016
2013
Medical Mut Of OH OH 29076 730 2,513,101 1,891,258 8690.052 75.3
Central States H & L Co Of Omaha NE 61751 690 2,404,931 1,719,321 7900.050 71.5
Highmark West Virginia Inc. WV 54828 812 2,291,865 1,745,922 7490.047 76.2
First United Amer Life Ins Co NY 74101 290 1,207,115 1,012,391 4790.025 83.9
Physicians Benefits Trust Life Ins IL 68519 2358 1,157,179 832,015 4240.024 71.9
Continental Gen Ins Co TX 71404 1,107,089 707,561 2830.023 63.9
Health Alliance Connect Inc IL 15478 1192 982,996 768,660 3780.020 78.2
Physicians Mut Ins Co NE 80578 367 968,363 742,662 3560.020 76.7
Regence BCBS of UT UT 54550 1207 934,248 616,843 3940.019 66.0
Members Hlth Ins Co AZ 94587 4677 830,533 563,164 4130.017 67.8
Hartford Life & Accident Ins Co CT 70815 91 807,537 806,592 2790.017 99.9
Wisconsin Physicians Serv Ins Corp WI 53139 68 680,702 429,823 2100.014 63.1
Oxford Life Ins Co AZ 76112 574 614,357 536,447 2880.013 87.3
BCBS of VT VT 53295 4745 594,104 528,279 3070.012 88.9
BCBS Of FL FL 98167 536 444,398 223,044 1510.009 50.2
American Progressive L&H Ins Of NY NY 80624 953 431,048 343,168 1390.009 79.6
Guarantee Trust Life Ins Co IL 64211 687 360,807 232,604 920.007 64.5
BCBSM Inc MN 55026 461 357,416 226,176 1990.007 63.3
Globe Life & Accident Ins Co NE 91472 290 339,851 285,212 1440.007 83.9
Union Labor Life Ins Co MD 69744 781 254,320 437,583 1160.005 172.1
American Family Life Assur Co of Col NE 60380 370 226,781 183,422 760.005 80.9
Aetna Life Ins Co CT 60054 1 215,744 140,758 470.004 65.2
Gerber Life Ins Co NY 70939 4483 169,277 256,482 440.003 151.5
Combined Ins Co Of Amer IL 62146 626 155,762 245,788 740.003 157.8
21st Century Premier Ins Co PA 20796 69 122,707 92,989 590.003 75.8
Coventry Hlth & Life Ins Co MO 81973 1 97,901 139,649 310.002 142.6
Allianz Life Ins Co Of N Amer MN 90611 761 90,665 169,072 480.002 186.5
North Amer Ins Co WI 68349 574 58,518 14,784 110.001 25.3
Medica Hlth Plans MN 52626 1552 47,367 31,761 50.001 67.1
Allianz Life Ins Co Of NY NY 64190 761 23,666 48,677 350.000 205.7
CMFG Life Ins Co IA 62626 306 8,097 12,179 50.000 150.4
BCBS Of MS Mut Ins Co MS 60111 1126 6,432 5,285 20.000 82.2
CAUTION: The information contained on this page is unaudited and not a complete analysis nor is it an expression of opinion on any insurer. This page may contain inadvertent errors.
© 2017 National Association of Insurance Commissioners 82
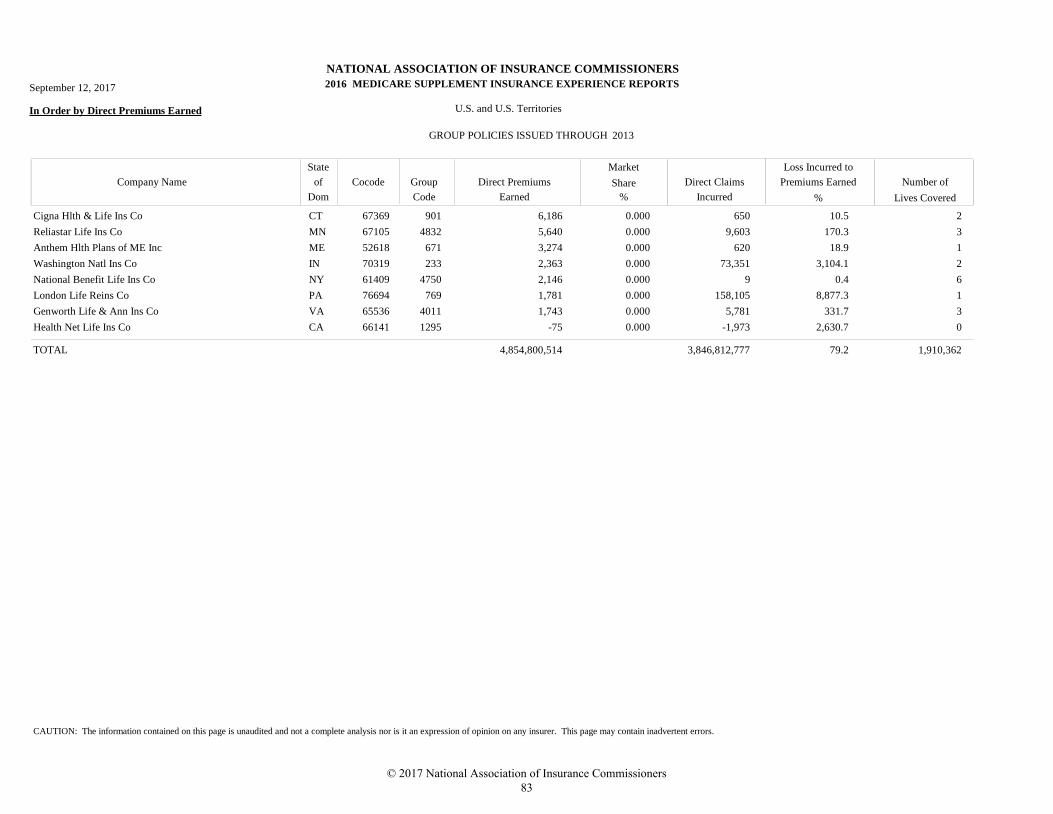
NATIONAL ASSOCIATION OF INSURANCE COMMISSIONERS
MEDICARE SUPPLEMENT INSURANCE EXPERIENCE REPORTS
In Order by Direct Premiums Earned U.S. and U.S. Territories
GROUP POLICIES ISSUED THROUGH
Market
Direct Claims
Incurred
Loss Incurred to
Premiums Earned Number of
Lives Covered
Direct Premiums
Earned
Company Name
State
Dom
Cocode Group
Code
of Share
% %
September 12, 2017 2016
2013
Cigna Hlth & Life Ins Co CT 67369 901 6,186 650 20.000 10.5
Reliastar Life Ins Co MN 67105 4832 5,640 9,603 30.000 170.3
Anthem Hlth Plans of ME Inc ME 52618 671 3,274 620 10.000 18.9
Washington Natl Ins Co IN 70319 233 2,363 73,351 20.000 3,104.1
National Benefit Life Ins Co NY 61409 4750 2,146 9 60.000 0.4
London Life Reins Co PA 76694 769 1,781 158,105 10.000 8,877.3
Genworth Life & Ann Ins Co VA 65536 4011 1,743 5,781 30.000 331.7
Health Net Life Ins Co CA 66141 1295 -75 -1,973 00.000 2,630.7
4,854,800,514 3,846,812,777 1,910,362TOTAL 79.2
CAUTION: The information contained on this page is unaudited and not a complete analysis nor is it an expression of opinion on any insurer. This page may contain inadvertent errors.
© 2017 National Association of Insurance Commissioners 83

© 2017 National Association of Insurance Commissioners 84
GROUP POLICIES ISSUED THROUGH 2013 BY COMPANY NAME
© 2017 National Association of Insurance Commissioners 85

© 2017 National Association of Insurance Commissioners 86
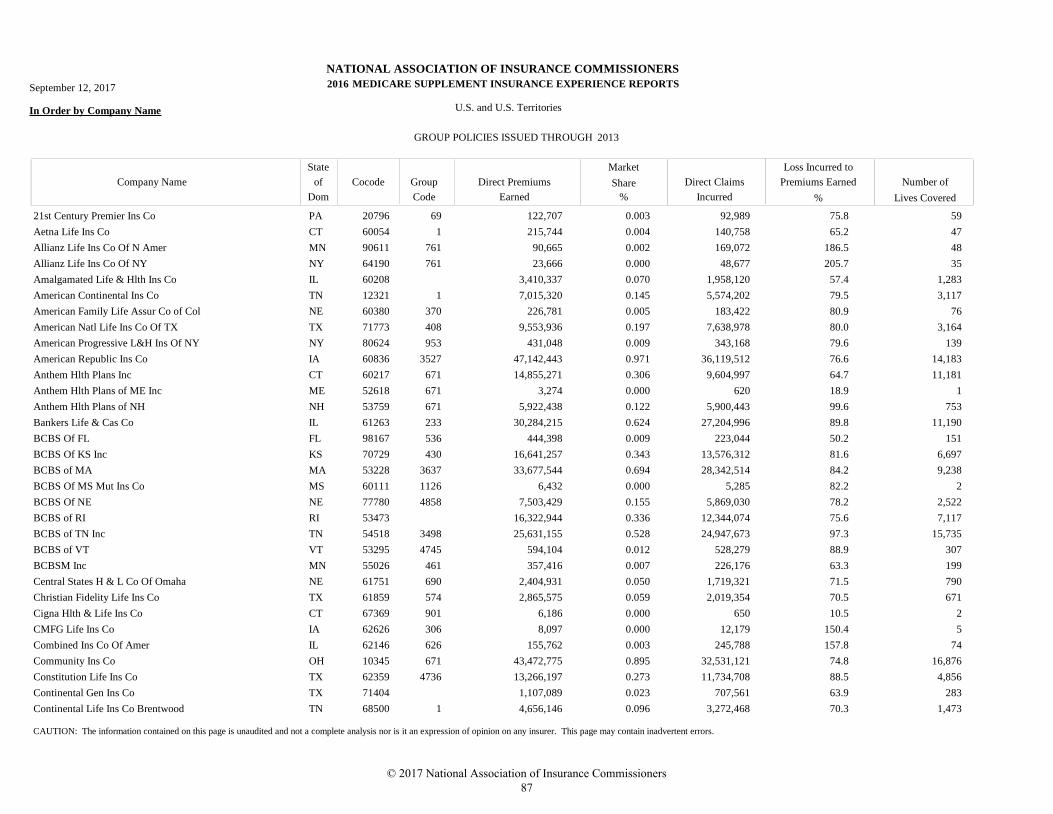
NATIONAL ASSOCIATION OF INSURANCE COMMISSIONERS
MEDICARE SUPPLEMENT INSURANCE EXPERIENCE REPORTS
In Order by Company Name U.S. and U.S. Territories
GROUP POLICIES ISSUED THROUGH
Market
Direct Claims
Incurred
Loss Incurred to
Premiums Earned Number of
Lives Covered
Direct Premiums
Earned
Company Name
State
Dom
Cocode Group
Code
of Share
% %
September 12, 2017 2016
2013
21st Century Premier Ins Co PA 20796 69 122,707 92,989 590.003 75.8
Aetna Life Ins Co CT 60054 1 215,744 140,758 470.004 65.2
Allianz Life Ins Co Of N Amer MN 90611 761 90,665 169,072 480.002 186.5
Allianz Life Ins Co Of NY NY 64190 761 23,666 48,677 350.000 205.7
Amalgamated Life & Hlth Ins Co IL 60208 3,410,337 1,958,120 1,2830.070 57.4
American Continental Ins Co TN 12321 1 7,015,320 5,574,202 3,1170.145 79.5
American Family Life Assur Co of Col NE 60380 370 226,781 183,422 760.005 80.9
American Natl Life Ins Co Of TX TX 71773 408 9,553,936 7,638,978 3,1640.197 80.0
American Progressive L&H Ins Of NY NY 80624 953 431,048 343,168 1390.009 79.6
American Republic Ins Co IA 60836 3527 47,142,443 36,119,512 14,1830.971 76.6
Anthem Hlth Plans Inc CT 60217 671 14,855,271 9,604,997 11,1810.306 64.7
Anthem Hlth Plans of ME Inc ME 52618 671 3,274 620 10.000 18.9
Anthem Hlth Plans of NH NH 53759 671 5,922,438 5,900,443 7530.122 99.6
Bankers Life & Cas Co IL 61263 233 30,284,215 27,204,996 11,1900.624 89.8
BCBS Of FL FL 98167 536 444,398 223,044 1510.009 50.2
BCBS Of KS Inc KS 70729 430 16,641,257 13,576,312 6,6970.343 81.6
BCBS of MA MA 53228 3637 33,677,544 28,342,514 9,2380.694 84.2
BCBS Of MS Mut Ins Co MS 60111 1126 6,432 5,285 20.000 82.2
BCBS Of NE NE 77780 4858 7,503,429 5,869,030 2,5220.155 78.2
BCBS of RI RI 53473 16,322,944 12,344,074 7,1170.336 75.6
BCBS of TN Inc TN 54518 3498 25,631,155 24,947,673 15,7350.528 97.3
BCBS of VT VT 53295 4745 594,104 528,279 3070.012 88.9
BCBSM Inc MN 55026 461 357,416 226,176 1990.007 63.3
Central States H & L Co Of Omaha NE 61751 690 2,404,931 1,719,321 7900.050 71.5
Christian Fidelity Life Ins Co TX 61859 574 2,865,575 2,019,354 6710.059 70.5
Cigna Hlth & Life Ins Co CT 67369 901 6,186 650 20.000 10.5
CMFG Life Ins Co IA 62626 306 8,097 12,179 50.000 150.4
Combined Ins Co Of Amer IL 62146 626 155,762 245,788 740.003 157.8
Community Ins Co OH 10345 671 43,472,775 32,531,121 16,8760.895 74.8
Constitution Life Ins Co TX 62359 4736 13,266,197 11,734,708 4,8560.273 88.5
Continental Gen Ins Co TX 71404 1,107,089 707,561 2830.023 63.9
Continental Life Ins Co Brentwood TN 68500 1 4,656,146 3,272,468 1,4730.096 70.3
CAUTION: The information contained on this page is unaudited and not a complete analysis nor is it an expression of opinion on any insurer. This page may contain inadvertent errors.
© 2017 National Association of Insurance Commissioners 87
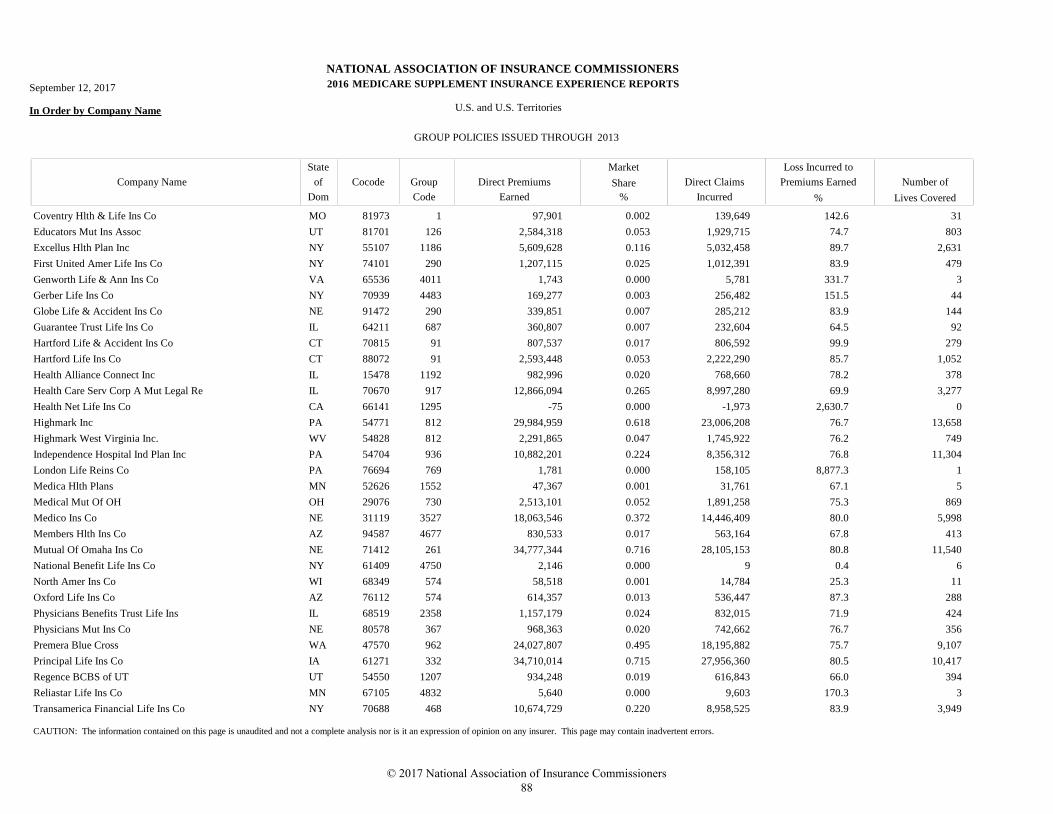
NATIONAL ASSOCIATION OF INSURANCE COMMISSIONERS
MEDICARE SUPPLEMENT INSURANCE EXPERIENCE REPORTS
In Order by Company Name U.S. and U.S. Territories
GROUP POLICIES ISSUED THROUGH
Market
Direct Claims
Incurred
Loss Incurred to
Premiums Earned Number of
Lives Covered
Direct Premiums
Earned
Company Name
State
Dom
Cocode Group
Code
of Share
% %
September 12, 2017 2016
2013
Coventry Hlth & Life Ins Co MO 81973 1 97,901 139,649 310.002 142.6
Educators Mut Ins Assoc UT 81701 126 2,584,318 1,929,715 8030.053 74.7
Excellus Hlth Plan Inc NY 55107 1186 5,609,628 5,032,458 2,6310.116 89.7
First United Amer Life Ins Co NY 74101 290 1,207,115 1,012,391 4790.025 83.9
Genworth Life & Ann Ins Co VA 65536 4011 1,743 5,781 30.000 331.7
Gerber Life Ins Co NY 70939 4483 169,277 256,482 440.003 151.5
Globe Life & Accident Ins Co NE 91472 290 339,851 285,212 1440.007 83.9
Guarantee Trust Life Ins Co IL 64211 687 360,807 232,604 920.007 64.5
Hartford Life & Accident Ins Co CT 70815 91 807,537 806,592 2790.017 99.9
Hartford Life Ins Co CT 88072 91 2,593,448 2,222,290 1,0520.053 85.7
Health Alliance Connect Inc IL 15478 1192 982,996 768,660 3780.020 78.2
Health Care Serv Corp A Mut Legal Re IL 70670 917 12,866,094 8,997,280 3,2770.265 69.9
Health Net Life Ins Co CA 66141 1295 -75 -1,973 00.000 2,630.7
Highmark Inc PA 54771 812 29,984,959 23,006,208 13,6580.618 76.7
Highmark West Virginia Inc. WV 54828 812 2,291,865 1,745,922 7490.047 76.2
Independence Hospital Ind Plan Inc PA 54704 936 10,882,201 8,356,312 11,3040.224 76.8
London Life Reins Co PA 76694 769 1,781 158,105 10.000 8,877.3
Medica Hlth Plans MN 52626 1552 47,367 31,761 50.001 67.1
Medical Mut Of OH OH 29076 730 2,513,101 1,891,258 8690.052 75.3
Medico Ins Co NE 31119 3527 18,063,546 14,446,409 5,9980.372 80.0
Members Hlth Ins Co AZ 94587 4677 830,533 563,164 4130.017 67.8
Mutual Of Omaha Ins Co NE 71412 261 34,777,344 28,105,153 11,5400.716 80.8
National Benefit Life Ins Co NY 61409 4750 2,146 9 60.000 0.4
North Amer Ins Co WI 68349 574 58,518 14,784 110.001 25.3
Oxford Life Ins Co AZ 76112 574 614,357 536,447 2880.013 87.3
Physicians Benefits Trust Life Ins IL 68519 2358 1,157,179 832,015 4240.024 71.9
Physicians Mut Ins Co NE 80578 367 968,363 742,662 3560.020 76.7
Premera Blue Cross WA 47570 962 24,027,807 18,195,882 9,1070.495 75.7
Principal Life Ins Co IA 61271 332 34,710,014 27,956,360 10,4170.715 80.5
Regence BCBS of UT UT 54550 1207 934,248 616,843 3940.019 66.0
Reliastar Life Ins Co MN 67105 4832 5,640 9,603 30.000 170.3
Transamerica Financial Life Ins Co NY 70688 468 10,674,729 8,958,525 3,9490.220 83.9
CAUTION: The information contained on this page is unaudited and not a complete analysis nor is it an expression of opinion on any insurer. This page may contain inadvertent errors.
© 2017 National Association of Insurance Commissioners 88
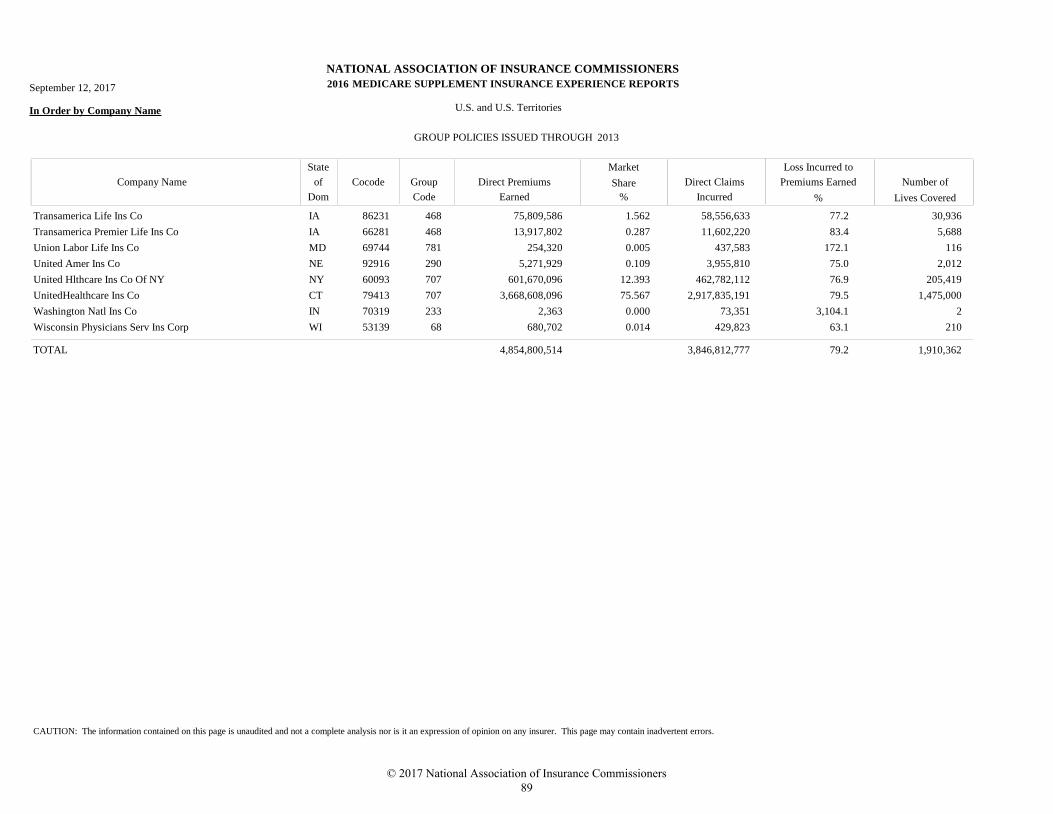
NATIONAL ASSOCIATION OF INSURANCE COMMISSIONERS
MEDICARE SUPPLEMENT INSURANCE EXPERIENCE REPORTS
In Order by Company Name U.S. and U.S. Territories
GROUP POLICIES ISSUED THROUGH
Market
Direct Claims
Incurred
Loss Incurred to
Premiums Earned Number of
Lives Covered
Direct Premiums
Earned
Company Name
State
Dom
Cocode Group
Code
of Share
% %
September 12, 2017 2016
2013
Transamerica Life Ins Co IA 86231 468 75,809,586 58,556,633 30,9361.562 77.2
Transamerica Premier Life Ins Co IA 66281 468 13,917,802 11,602,220 5,6880.287 83.4
Union Labor Life Ins Co MD 69744 781 254,320 437,583 1160.005 172.1
United Amer Ins Co NE 92916 290 5,271,929 3,955,810 2,0120.109 75.0
United Hlthcare Ins Co Of NY NY 60093 707 601,670,096 462,782,112 205,41912.393 76.9
UnitedHealthcare Ins Co CT 79413 707 3,668,608,096 2,917,835,191 1,475,00075.567 79.5
Washington Natl Ins Co IN 70319 233 2,363 73,351 20.000 3,104.1
Wisconsin Physicians Serv Ins Corp WI 53139 68 680,702 429,823 2100.014 63.1
4,854,800,514 3,846,812,777 1,910,362TOTAL 79.2
CAUTION: The information contained on this page is unaudited and not a complete analysis nor is it an expression of opinion on any insurer. This page may contain inadvertent errors.
© 2017 National Association of Insurance Commissioners 89

© 2017 National Association of Insurance Commissioners 90
GROUP POLICIES ISSUED IN 2014, 2015 AND 2016 BY DIRECT PREMIUMS EARNED
© 2017 National Association of Insurance Commissioners 91

© 2017 National Association of Insurance Commissioners 92
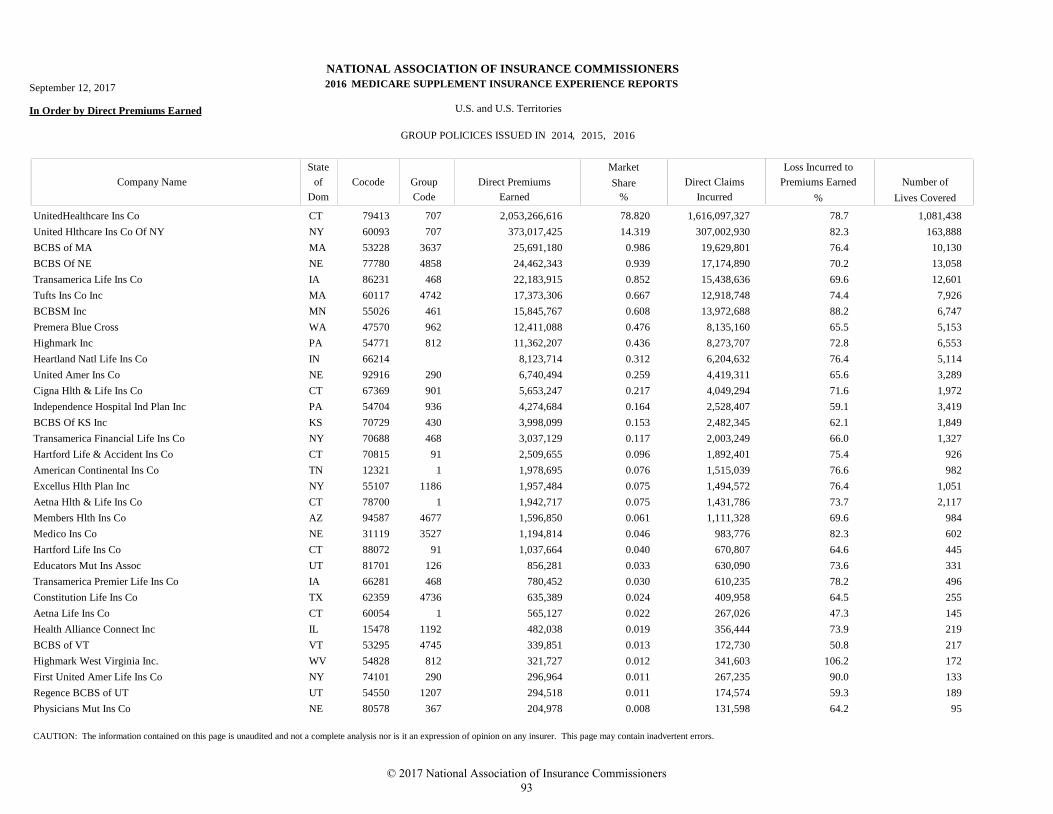
NATIONAL ASSOCIATION OF INSURANCE COMMISSIONERS
MEDICARE SUPPLEMENT INSURANCE EXPERIENCE REPORTS
In Order by Direct Premiums Earned U.S. and U.S. Territories
GROUP POLICICES ISSUED IN
Market
Direct Claims
Incurred
Loss Incurred to
Premiums Earned Number of
Lives Covered
Direct Premiums
Earned
Company Name
State
Dom
Cocode Group
Code
of Share
% %
September 12, 2017 2016
2014 2015 2016, ,
UnitedHealthcare Ins Co CT 79413 707 2,053,266,616 1,616,097,327 1,081,43878.820 78.7
United Hlthcare Ins Co Of NY NY 60093 707 373,017,425 307,002,930 163,88814.319 82.3
BCBS of MA MA 53228 3637 25,691,180 19,629,801 10,1300.986 76.4
BCBS Of NE NE 77780 4858 24,462,343 17,174,890 13,0580.939 70.2
Transamerica Life Ins Co IA 86231 468 22,183,915 15,438,636 12,6010.852 69.6
Tufts Ins Co Inc MA 60117 4742 17,373,306 12,918,748 7,9260.667 74.4
BCBSM Inc MN 55026 461 15,845,767 13,972,688 6,7470.608 88.2
Premera Blue Cross WA 47570 962 12,411,088 8,135,160 5,1530.476 65.5
Highmark Inc PA 54771 812 11,362,207 8,273,707 6,5530.436 72.8
Heartland Natl Life Ins Co IN 66214 8,123,714 6,204,632 5,1140.312 76.4
United Amer Ins Co NE 92916 290 6,740,494 4,419,311 3,2890.259 65.6
Cigna Hlth & Life Ins Co CT 67369 901 5,653,247 4,049,294 1,9720.217 71.6
Independence Hospital Ind Plan Inc PA 54704 936 4,274,684 2,528,407 3,4190.164 59.1
BCBS Of KS Inc KS 70729 430 3,998,099 2,482,345 1,8490.153 62.1
Transamerica Financial Life Ins Co NY 70688 468 3,037,129 2,003,249 1,3270.117 66.0
Hartford Life & Accident Ins Co CT 70815 91 2,509,655 1,892,401 9260.096 75.4
American Continental Ins Co TN 12321 1 1,978,695 1,515,039 9820.076 76.6
Excellus Hlth Plan Inc NY 55107 1186 1,957,484 1,494,572 1,0510.075 76.4
Aetna Hlth & Life Ins Co CT 78700 1 1,942,717 1,431,786 2,1170.075 73.7
Members Hlth Ins Co AZ 94587 4677 1,596,850 1,111,328 9840.061 69.6
Medico Ins Co NE 31119 3527 1,194,814 983,776 6020.046 82.3
Hartford Life Ins Co CT 88072 91 1,037,664 670,807 4450.040 64.6
Educators Mut Ins Assoc UT 81701 126 856,281 630,090 3310.033 73.6
Transamerica Premier Life Ins Co IA 66281 468 780,452 610,235 4960.030 78.2
Constitution Life Ins Co TX 62359 4736 635,389 409,958 2550.024 64.5
Aetna Life Ins Co CT 60054 1 565,127 267,026 1450.022 47.3
Health Alliance Connect Inc IL 15478 1192 482,038 356,444 2190.019 73.9
BCBS of VT VT 53295 4745 339,851 172,730 2170.013 50.8
Highmark West Virginia Inc. WV 54828 812 321,727 341,603 1720.012 106.2
First United Amer Life Ins Co NY 74101 290 296,964 267,235 1330.011 90.0
Regence BCBS of UT UT 54550 1207 294,518 174,574 1890.011 59.3
Physicians Mut Ins Co NE 80578 367 204,978 131,598 950.008 64.2
CAUTION: The information contained on this page is unaudited and not a complete analysis nor is it an expression of opinion on any insurer. This page may contain inadvertent errors.
© 2017 National Association of Insurance Commissioners 93
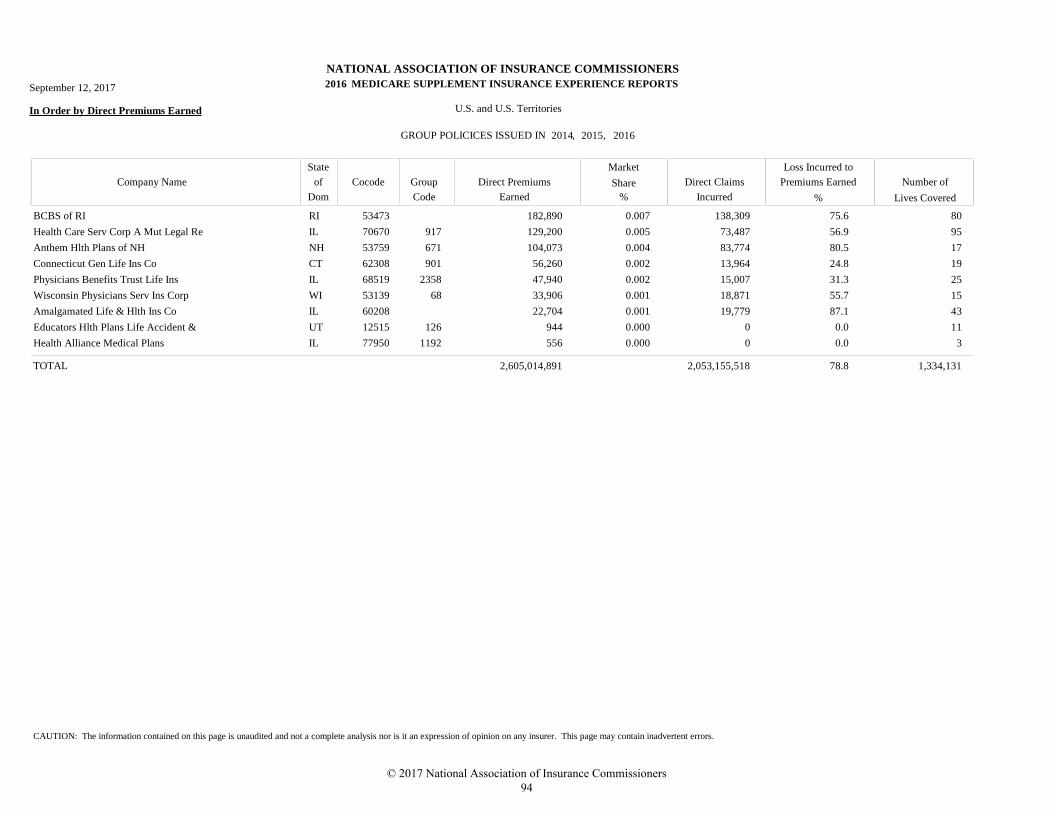
NATIONAL ASSOCIATION OF INSURANCE COMMISSIONERS
MEDICARE SUPPLEMENT INSURANCE EXPERIENCE REPORTS
In Order by Direct Premiums Earned U.S. and U.S. Territories
GROUP POLICICES ISSUED IN
Market
Direct Claims
Incurred
Loss Incurred to
Premiums Earned Number of
Lives Covered
Direct Premiums
Earned
Company Name
State
Dom
Cocode Group
Code
of Share
% %
September 12, 2017 2016
2014 2015 2016, ,
BCBS of RI RI 53473 182,890 138,309 800.007 75.6
Health Care Serv Corp A Mut Legal Re IL 70670 917 129,200 73,487 950.005 56.9
Anthem Hlth Plans of NH NH 53759 671 104,073 83,774 170.004 80.5
Connecticut Gen Life Ins Co CT 62308 901 56,260 13,964 190.002 24.8
Physicians Benefits Trust Life Ins IL 68519 2358 47,940 15,007 250.002 31.3
Wisconsin Physicians Serv Ins Corp WI 53139 68 33,906 18,871 150.001 55.7
Amalgamated Life & Hlth Ins Co IL 60208 22,704 19,779 430.001 87.1
Educators Hlth Plans Life Accident & UT 12515 126 944 0 110.000 0.0
Health Alliance Medical Plans IL 77950 1192 556 0 30.000 0.0
2,605,014,891 2,053,155,518 1,334,131TOTAL 78.8
CAUTION: The information contained on this page is unaudited and not a complete analysis nor is it an expression of opinion on any insurer. This page may contain inadvertent errors.
© 2017 National Association of Insurance Commissioners 94
GROUP POLICIES ISSUED IN 2014, 2015 AND 2016 BY COMPANY NAME
© 2017 National Association of Insurance Commissioners 95

© 2017 National Association of Insurance Commissioners 96
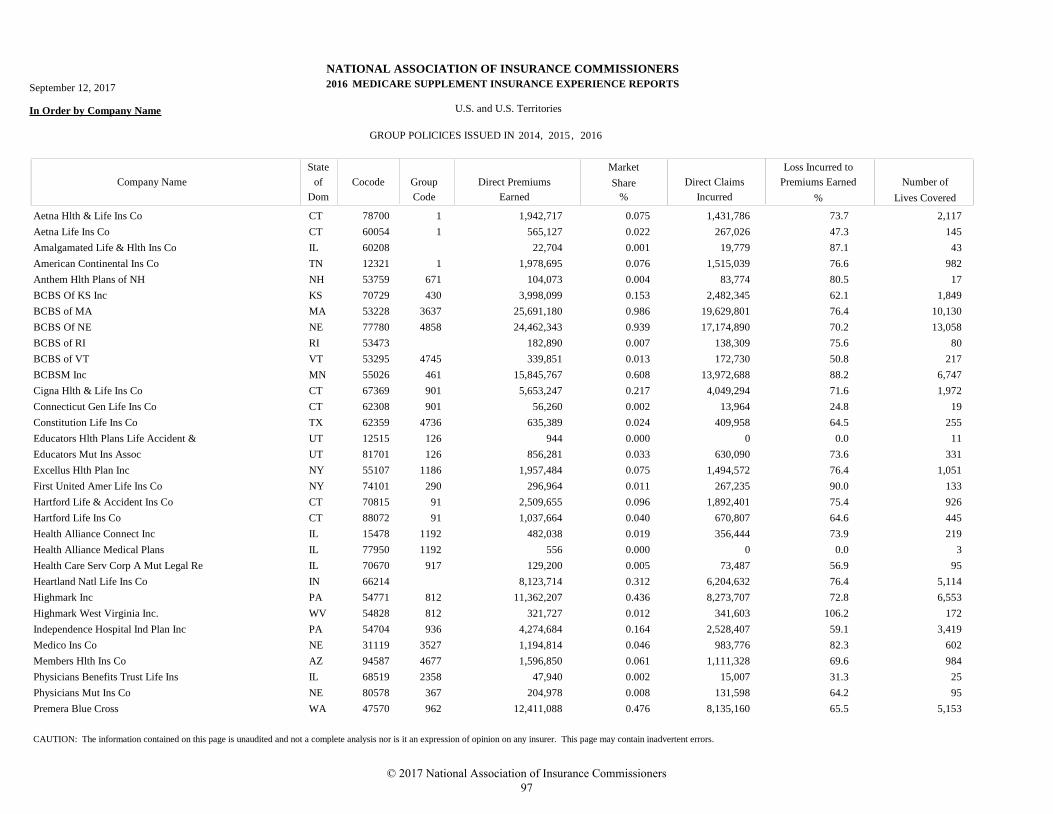
NATIONAL ASSOCIATION OF INSURANCE COMMISSIONERS
MEDICARE SUPPLEMENT INSURANCE EXPERIENCE REPORTS
In Order by Company Name U.S. and U.S. Territories
GROUP POLICICES ISSUED IN
Market
Direct Claims
Incurred
Loss Incurred to
Premiums Earned Number of
Lives Covered
Direct Premiums
Earned
Company Name
State
Dom
Cocode Group
Code
of Share
% %
September 12, 2017
2014 2015 2016, ,
2016
Aetna Hlth & Life Ins Co CT 78700 1 1,942,717 1,431,786 2,1170.075 73.7
Aetna Life Ins Co CT 60054 1 565,127 267,026 1450.022 47.3
Amalgamated Life & Hlth Ins Co IL 60208 22,704 19,779 430.001 87.1
American Continental Ins Co TN 12321 1 1,978,695 1,515,039 9820.076 76.6
Anthem Hlth Plans of NH NH 53759 671 104,073 83,774 170.004 80.5
BCBS Of KS Inc KS 70729 430 3,998,099 2,482,345 1,8490.153 62.1
BCBS of MA MA 53228 3637 25,691,180 19,629,801 10,1300.986 76.4
BCBS Of NE NE 77780 4858 24,462,343 17,174,890 13,0580.939 70.2
BCBS of RI RI 53473 182,890 138,309 800.007 75.6
BCBS of VT VT 53295 4745 339,851 172,730 2170.013 50.8
BCBSM Inc MN 55026 461 15,845,767 13,972,688 6,7470.608 88.2
Cigna Hlth & Life Ins Co CT 67369 901 5,653,247 4,049,294 1,9720.217 71.6
Connecticut Gen Life Ins Co CT 62308 901 56,260 13,964 190.002 24.8
Constitution Life Ins Co TX 62359 4736 635,389 409,958 2550.024 64.5
Educators Hlth Plans Life Accident & UT 12515 126 944 0 110.000 0.0
Educators Mut Ins Assoc UT 81701 126 856,281 630,090 3310.033 73.6
Excellus Hlth Plan Inc NY 55107 1186 1,957,484 1,494,572 1,0510.075 76.4
First United Amer Life Ins Co NY 74101 290 296,964 267,235 1330.011 90.0
Hartford Life & Accident Ins Co CT 70815 91 2,509,655 1,892,401 9260.096 75.4
Hartford Life Ins Co CT 88072 91 1,037,664 670,807 4450.040 64.6
Health Alliance Connect Inc IL 15478 1192 482,038 356,444 2190.019 73.9
Health Alliance Medical Plans IL 77950 1192 556 0 30.000 0.0
Health Care Serv Corp A Mut Legal Re IL 70670 917 129,200 73,487 950.005 56.9
Heartland Natl Life Ins Co IN 66214 8,123,714 6,204,632 5,1140.312 76.4
Highmark Inc PA 54771 812 11,362,207 8,273,707 6,5530.436 72.8
Highmark West Virginia Inc. WV 54828 812 321,727 341,603 1720.012 106.2
Independence Hospital Ind Plan Inc PA 54704 936 4,274,684 2,528,407 3,4190.164 59.1
Medico Ins Co NE 31119 3527 1,194,814 983,776 6020.046 82.3
Members Hlth Ins Co AZ 94587 4677 1,596,850 1,111,328 9840.061 69.6
Physicians Benefits Trust Life Ins IL 68519 2358 47,940 15,007 250.002 31.3
Physicians Mut Ins Co NE 80578 367 204,978 131,598 950.008 64.2
Premera Blue Cross WA 47570 962 12,411,088 8,135,160 5,1530.476 65.5
CAUTION: The information contained on this page is unaudited and not a complete analysis nor is it an expression of opinion on any insurer. This page may contain inadvertent errors.
© 2017 National Association of Insurance Commissioners 97
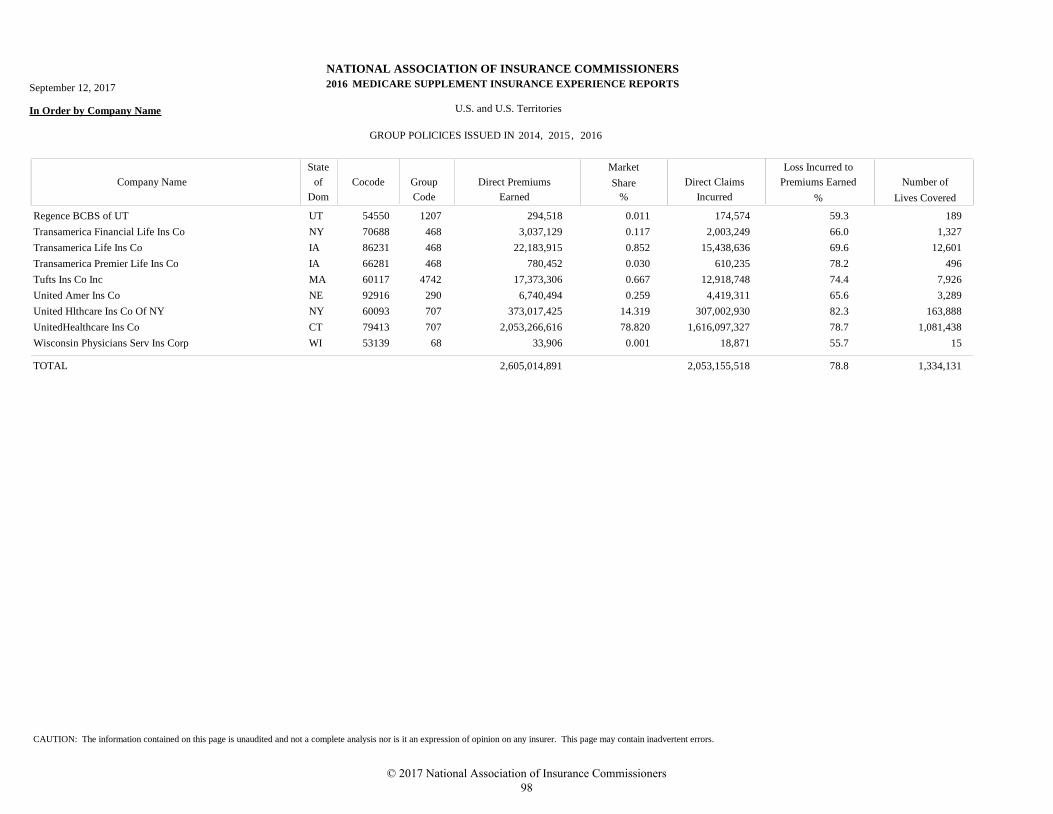
NATIONAL ASSOCIATION OF INSURANCE COMMISSIONERS
MEDICARE SUPPLEMENT INSURANCE EXPERIENCE REPORTS
In Order by Company Name U.S. and U.S. Territories
GROUP POLICICES ISSUED IN
Market
Direct Claims
Incurred
Loss Incurred to
Premiums Earned Number of
Lives Covered
Direct Premiums
Earned
Company Name
State
Dom
Cocode Group
Code
of Share
% %
September 12, 2017
2014 2015 2016, ,
2016
Regence BCBS of UT UT 54550 1207 294,518 174,574 1890.011 59.3
Transamerica Financial Life Ins Co NY 70688 468 3,037,129 2,003,249 1,3270.117 66.0
Transamerica Life Ins Co IA 86231 468 22,183,915 15,438,636 12,6010.852 69.6
Transamerica Premier Life Ins Co IA 66281 468 780,452 610,235 4960.030 78.2
Tufts Ins Co Inc MA 60117 4742 17,373,306 12,918,748 7,9260.667 74.4
United Amer Ins Co NE 92916 290 6,740,494 4,419,311 3,2890.259 65.6
United Hlthcare Ins Co Of NY NY 60093 707 373,017,425 307,002,930 163,88814.319 82.3
UnitedHealthcare Ins Co CT 79413 707 2,053,266,616 1,616,097,327 1,081,43878.820 78.7
Wisconsin Physicians Serv Ins Corp WI 53139 68 33,906 18,871 150.001 55.7
2,605,014,891 2,053,155,518 1,334,131TOTAL 78.8
CAUTION: The information contained on this page is unaudited and not a complete analysis nor is it an expression of opinion on any insurer. This page may contain inadvertent errors.
© 2017 National Association of Insurance Commissioners 98
TOTAL GROUP POLICIES BY DIRECT PREMIUMS EARNED
© 2017 National Association of Insurance Commissioners 99

© 2017 National Association of Insurance Commissioners 100
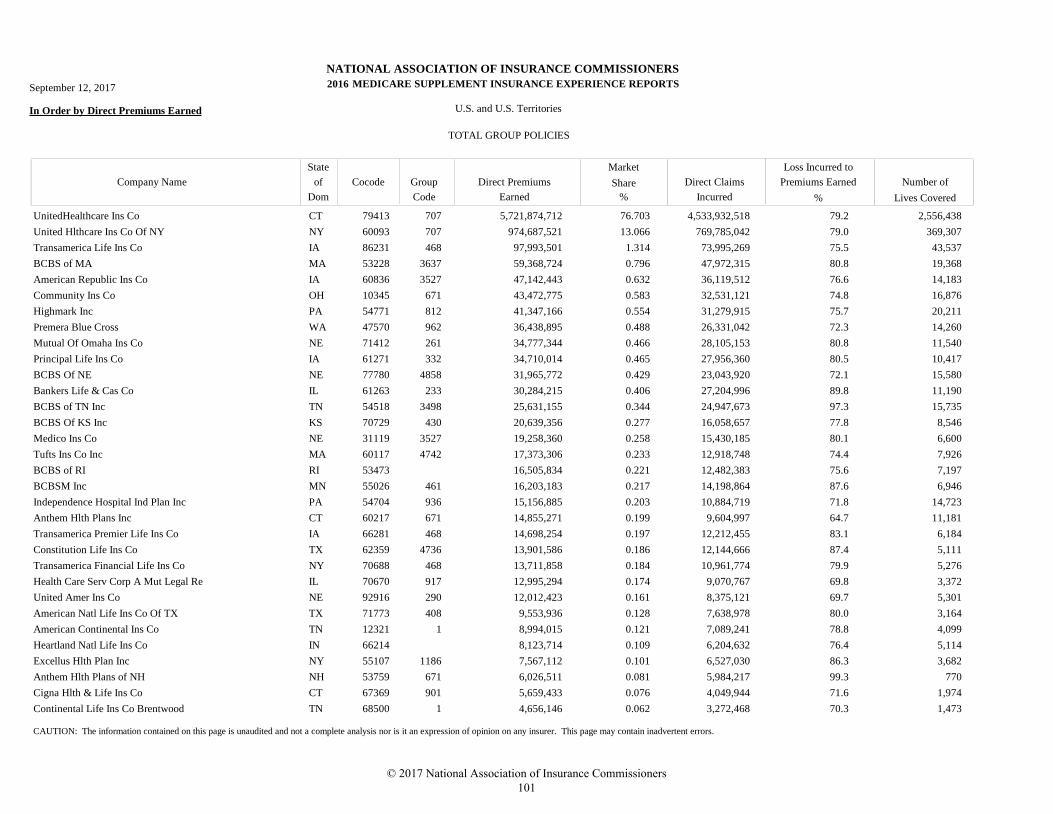
NATIONAL ASSOCIATION OF INSURANCE COMMISSIONERS
MEDICARE SUPPLEMENT INSURANCE EXPERIENCE REPORTS
In Order by Direct Premiums Earned U.S. and U.S. Territories
TOTAL GROUP POLICIES
Market
Direct Claims
Incurred
Loss Incurred to
Premiums Earned Number of
Lives Covered
Direct Premiums
Earned
Company Name
State
Dom
Cocode Group
Code
of Share
% %
September 12, 2017 2016
UnitedHealthcare Ins Co CT 79413 707 5,721,874,712 4,533,932,518 2,556,43876.703 79.2
United Hlthcare Ins Co Of NY NY 60093 707 974,687,521 769,785,042 369,30713.066 79.0
Transamerica Life Ins Co IA 86231 468 97,993,501 73,995,269 43,5371.314 75.5
BCBS of MA MA 53228 3637 59,368,724 47,972,315 19,3680.796 80.8
American Republic Ins Co IA 60836 3527 47,142,443 36,119,512 14,1830.632 76.6
Community Ins Co OH 10345 671 43,472,775 32,531,121 16,8760.583 74.8
Highmark Inc PA 54771 812 41,347,166 31,279,915 20,2110.554 75.7
Premera Blue Cross WA 47570 962 36,438,895 26,331,042 14,2600.488 72.3
Mutual Of Omaha Ins Co NE 71412 261 34,777,344 28,105,153 11,5400.466 80.8
Principal Life Ins Co IA 61271 332 34,710,014 27,956,360 10,4170.465 80.5
BCBS Of NE NE 77780 4858 31,965,772 23,043,920 15,5800.429 72.1
Bankers Life & Cas Co IL 61263 233 30,284,215 27,204,996 11,1900.406 89.8
BCBS of TN Inc TN 54518 3498 25,631,155 24,947,673 15,7350.344 97.3
BCBS Of KS Inc KS 70729 430 20,639,356 16,058,657 8,5460.277 77.8
Medico Ins Co NE 31119 3527 19,258,360 15,430,185 6,6000.258 80.1
Tufts Ins Co Inc MA 60117 4742 17,373,306 12,918,748 7,9260.233 74.4
BCBS of RI RI 53473 16,505,834 12,482,383 7,1970.221 75.6
BCBSM Inc MN 55026 461 16,203,183 14,198,864 6,9460.217 87.6
Independence Hospital Ind Plan Inc PA 54704 936 15,156,885 10,884,719 14,7230.203 71.8
Anthem Hlth Plans Inc CT 60217 671 14,855,271 9,604,997 11,1810.199 64.7
Transamerica Premier Life Ins Co IA 66281 468 14,698,254 12,212,455 6,1840.197 83.1
Constitution Life Ins Co TX 62359 4736 13,901,586 12,144,666 5,1110.186 87.4
Transamerica Financial Life Ins Co NY 70688 468 13,711,858 10,961,774 5,2760.184 79.9
Health Care Serv Corp A Mut Legal Re IL 70670 917 12,995,294 9,070,767 3,3720.174 69.8
United Amer Ins Co NE 92916 290 12,012,423 8,375,121 5,3010.161 69.7
American Natl Life Ins Co Of TX TX 71773 408 9,553,936 7,638,978 3,1640.128 80.0
American Continental Ins Co TN 12321 1 8,994,015 7,089,241 4,0990.121 78.8
Heartland Natl Life Ins Co IN 66214 8,123,714 6,204,632 5,1140.109 76.4
Excellus Hlth Plan Inc NY 55107 1186 7,567,112 6,527,030 3,6820.101 86.3
Anthem Hlth Plans of NH NH 53759 671 6,026,511 5,984,217 7700.081 99.3
Cigna Hlth & Life Ins Co CT 67369 901 5,659,433 4,049,944 1,9740.076 71.6
Continental Life Ins Co Brentwood TN 68500 1 4,656,146 3,272,468 1,4730.062 70.3
CAUTION: The information contained on this page is unaudited and not a complete analysis nor is it an expression of opinion on any insurer. This page may contain inadvertent errors.
© 2017 National Association of Insurance Commissioners 101
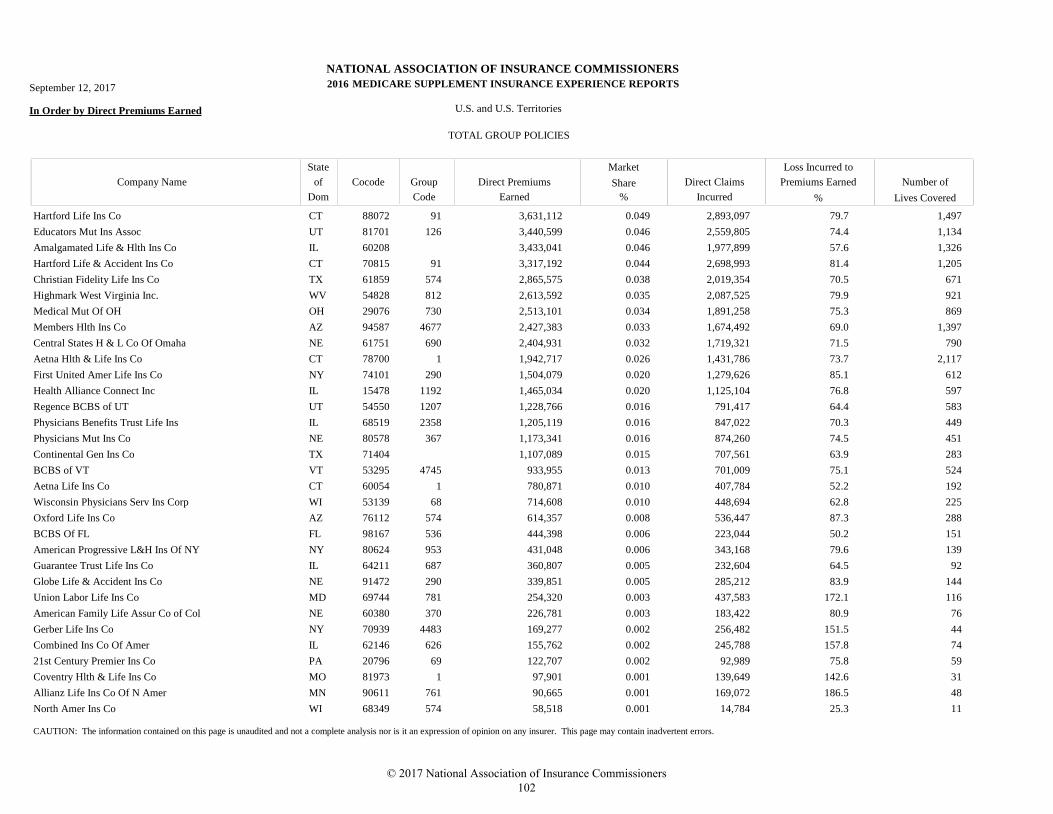
NATIONAL ASSOCIATION OF INSURANCE COMMISSIONERS
MEDICARE SUPPLEMENT INSURANCE EXPERIENCE REPORTS
In Order by Direct Premiums Earned U.S. and U.S. Territories
TOTAL GROUP POLICIES
Market
Direct Claims
Incurred
Loss Incurred to
Premiums Earned Number of
Lives Covered
Direct Premiums
Earned
Company Name
State
Dom
Cocode Group
Code
of Share
% %
September 12, 2017 2016
Hartford Life Ins Co CT 88072 91 3,631,112 2,893,097 1,4970.049 79.7
Educators Mut Ins Assoc UT 81701 126 3,440,599 2,559,805 1,1340.046 74.4
Amalgamated Life & Hlth Ins Co IL 60208 3,433,041 1,977,899 1,3260.046 57.6
Hartford Life & Accident Ins Co CT 70815 91 3,317,192 2,698,993 1,2050.044 81.4
Christian Fidelity Life Ins Co TX 61859 574 2,865,575 2,019,354 6710.038 70.5
Highmark West Virginia Inc. WV 54828 812 2,613,592 2,087,525 9210.035 79.9
Medical Mut Of OH OH 29076 730 2,513,101 1,891,258 8690.034 75.3
Members Hlth Ins Co AZ 94587 4677 2,427,383 1,674,492 1,3970.033 69.0
Central States H & L Co Of Omaha NE 61751 690 2,404,931 1,719,321 7900.032 71.5
Aetna Hlth & Life Ins Co CT 78700 1 1,942,717 1,431,786 2,1170.026 73.7
First United Amer Life Ins Co NY 74101 290 1,504,079 1,279,626 6120.020 85.1
Health Alliance Connect Inc IL 15478 1192 1,465,034 1,125,104 5970.020 76.8
Regence BCBS of UT UT 54550 1207 1,228,766 791,417 5830.016 64.4
Physicians Benefits Trust Life Ins IL 68519 2358 1,205,119 847,022 4490.016 70.3
Physicians Mut Ins Co NE 80578 367 1,173,341 874,260 4510.016 74.5
Continental Gen Ins Co TX 71404 1,107,089 707,561 2830.015 63.9
BCBS of VT VT 53295 4745 933,955 701,009 5240.013 75.1
Aetna Life Ins Co CT 60054 1 780,871 407,784 1920.010 52.2
Wisconsin Physicians Serv Ins Corp WI 53139 68 714,608 448,694 2250.010 62.8
Oxford Life Ins Co AZ 76112 574 614,357 536,447 2880.008 87.3
BCBS Of FL FL 98167 536 444,398 223,044 1510.006 50.2
American Progressive L&H Ins Of NY NY 80624 953 431,048 343,168 1390.006 79.6
Guarantee Trust Life Ins Co IL 64211 687 360,807 232,604 920.005 64.5
Globe Life & Accident Ins Co NE 91472 290 339,851 285,212 1440.005 83.9
Union Labor Life Ins Co MD 69744 781 254,320 437,583 1160.003 172.1
American Family Life Assur Co of Col NE 60380 370 226,781 183,422 760.003 80.9
Gerber Life Ins Co NY 70939 4483 169,277 256,482 440.002 151.5
Combined Ins Co Of Amer IL 62146 626 155,762 245,788 740.002 157.8
21st Century Premier Ins Co PA 20796 69 122,707 92,989 590.002 75.8
Coventry Hlth & Life Ins Co MO 81973 1 97,901 139,649 310.001 142.6
Allianz Life Ins Co Of N Amer MN 90611 761 90,665 169,072 480.001 186.5
North Amer Ins Co WI 68349 574 58,518 14,784 110.001 25.3
CAUTION: The information contained on this page is unaudited and not a complete analysis nor is it an expression of opinion on any insurer. This page may contain inadvertent errors.
© 2017 National Association of Insurance Commissioners 102
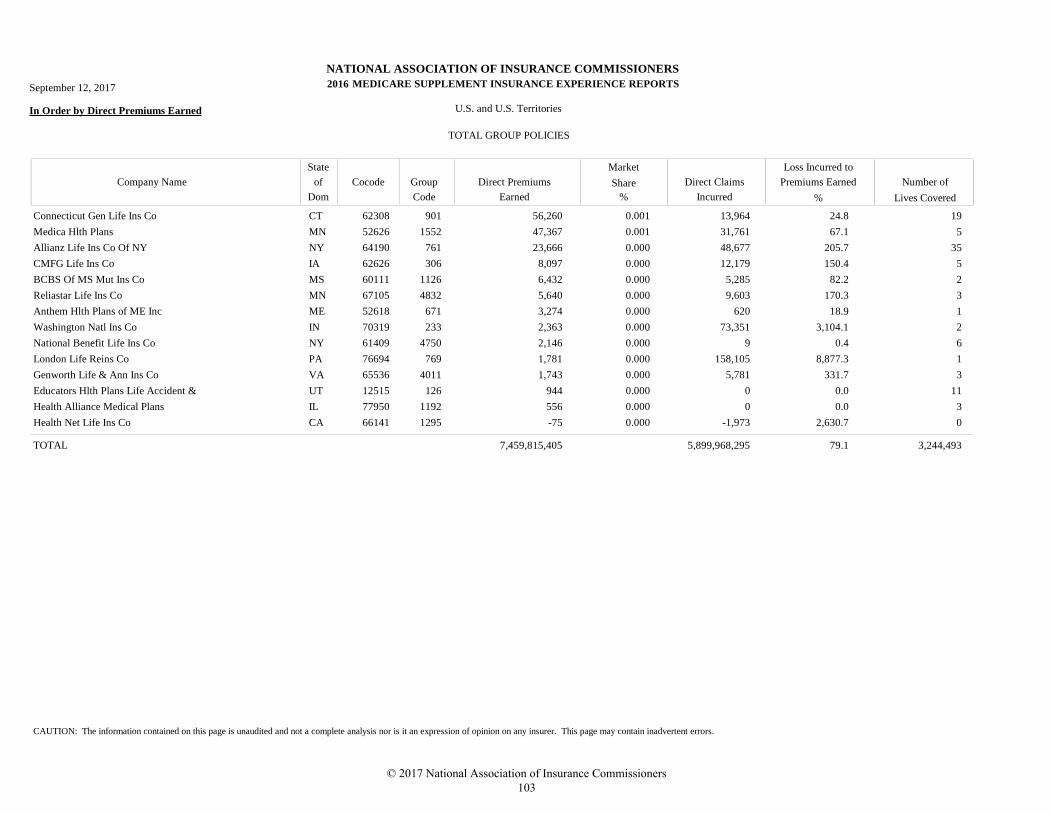
NATIONAL ASSOCIATION OF INSURANCE COMMISSIONERS
MEDICARE SUPPLEMENT INSURANCE EXPERIENCE REPORTS
In Order by Direct Premiums Earned U.S. and U.S. Territories
TOTAL GROUP POLICIES
Market
Direct Claims
Incurred
Loss Incurred to
Premiums Earned Number of
Lives Covered
Direct Premiums
Earned
Company Name
State
Dom
Cocode Group
Code
of Share
% %
September 12, 2017 2016
Connecticut Gen Life Ins Co CT 62308 901 56,260 13,964 190.001 24.8
Medica Hlth Plans MN 52626 1552 47,367 31,761 50.001 67.1
Allianz Life Ins Co Of NY NY 64190 761 23,666 48,677 350.000 205.7
CMFG Life Ins Co IA 62626 306 8,097 12,179 50.000 150.4
BCBS Of MS Mut Ins Co MS 60111 1126 6,432 5,285 20.000 82.2
Reliastar Life Ins Co MN 67105 4832 5,640 9,603 30.000 170.3
Anthem Hlth Plans of ME Inc ME 52618 671 3,274 620 10.000 18.9
Washington Natl Ins Co IN 70319 233 2,363 73,351 20.000 3,104.1
National Benefit Life Ins Co NY 61409 4750 2,146 9 60.000 0.4
London Life Reins Co PA 76694 769 1,781 158,105 10.000 8,877.3
Genworth Life & Ann Ins Co VA 65536 4011 1,743 5,781 30.000 331.7
Educators Hlth Plans Life Accident & UT 12515 126 944 0 110.000 0.0
Health Alliance Medical Plans IL 77950 1192 556 0 30.000 0.0
Health Net Life Ins Co CA 66141 1295 -75 -1,973 00.000 2,630.7
7,459,815,405 5,899,968,295 3,244,493TOTAL 79.1
CAUTION: The information contained on this page is unaudited and not a complete analysis nor is it an expression of opinion on any insurer. This page may contain inadvertent errors.
© 2017 National Association of Insurance Commissioners 103

© 2017 National Association of Insurance Commissioners 104
TOTAL GROUP POLICIES BY COMPANY NAME
© 2017 National Association of Insurance Commissioners 105

© 2017 National Association of Insurance Commissioners 106
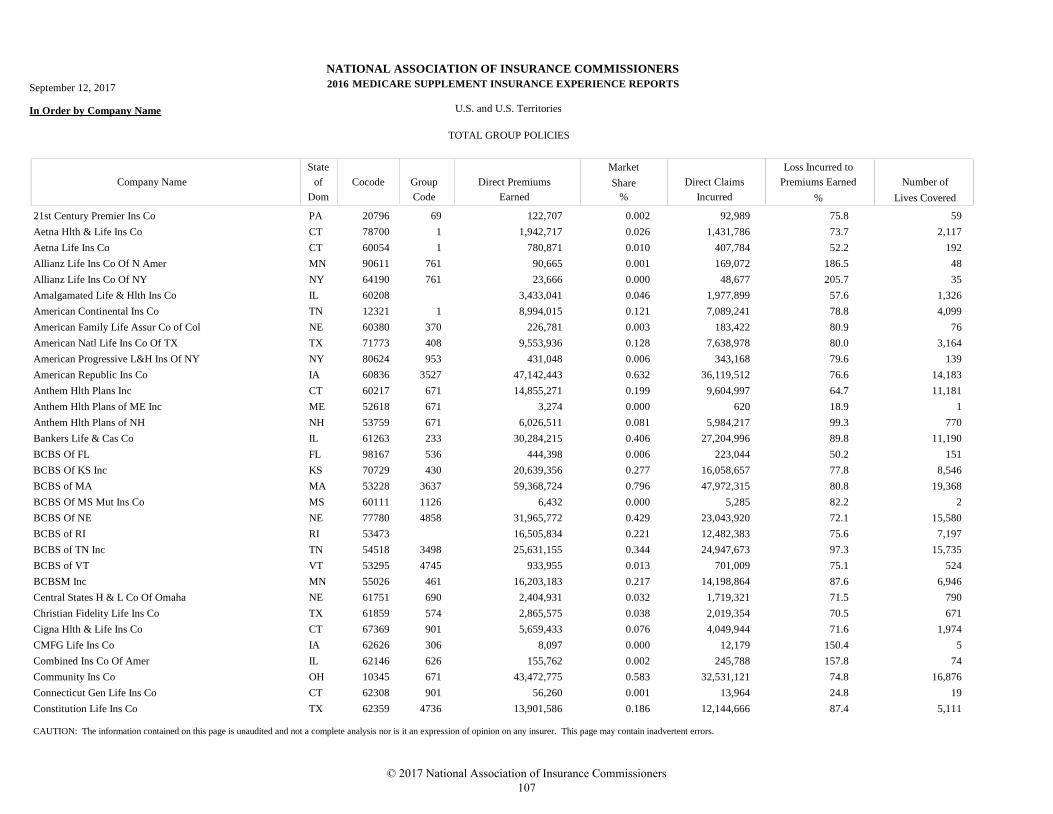
NATIONAL ASSOCIATION OF INSURANCE COMMISSIONERS
MEDICARE SUPPLEMENT INSURANCE EXPERIENCE REPORTS
In Order by Company Name U.S. and U.S. Territories
TOTAL GROUP POLICIES
Market
Direct Claims
Incurred
Loss Incurred to
Premiums Earned Number of
Lives Covered
Direct Premiums
Earned
Company Name
State
Dom
Cocode Group
Code
of Share
% %
September 12, 2017 2016
21st Century Premier Ins Co PA 20796 69 122,707 92,989 590.002 75.8
Aetna Hlth & Life Ins Co CT 78700 1 1,942,717 1,431,786 2,1170.026 73.7
Aetna Life Ins Co CT 60054 1 780,871 407,784 1920.010 52.2
Allianz Life Ins Co Of N Amer MN 90611 761 90,665 169,072 480.001 186.5
Allianz Life Ins Co Of NY NY 64190 761 23,666 48,677 350.000 205.7
Amalgamated Life & Hlth Ins Co IL 60208 3,433,041 1,977,899 1,3260.046 57.6
American Continental Ins Co TN 12321 1 8,994,015 7,089,241 4,0990.121 78.8
American Family Life Assur Co of Col NE 60380 370 226,781 183,422 760.003 80.9
American Natl Life Ins Co Of TX TX 71773 408 9,553,936 7,638,978 3,1640.128 80.0
American Progressive L&H Ins Of NY NY 80624 953 431,048 343,168 1390.006 79.6
American Republic Ins Co IA 60836 3527 47,142,443 36,119,512 14,1830.632 76.6
Anthem Hlth Plans Inc CT 60217 671 14,855,271 9,604,997 11,1810.199 64.7
Anthem Hlth Plans of ME Inc ME 52618 671 3,274 620 10.000 18.9
Anthem Hlth Plans of NH NH 53759 671 6,026,511 5,984,217 7700.081 99.3
Bankers Life & Cas Co IL 61263 233 30,284,215 27,204,996 11,1900.406 89.8
BCBS Of FL FL 98167 536 444,398 223,044 1510.006 50.2
BCBS Of KS Inc KS 70729 430 20,639,356 16,058,657 8,5460.277 77.8
BCBS of MA MA 53228 3637 59,368,724 47,972,315 19,3680.796 80.8
BCBS Of MS Mut Ins Co MS 60111 1126 6,432 5,285 20.000 82.2
BCBS Of NE NE 77780 4858 31,965,772 23,043,920 15,5800.429 72.1
BCBS of RI RI 53473 16,505,834 12,482,383 7,1970.221 75.6
BCBS of TN Inc TN 54518 3498 25,631,155 24,947,673 15,7350.344 97.3
BCBS of VT VT 53295 4745 933,955 701,009 5240.013 75.1
BCBSM Inc MN 55026 461 16,203,183 14,198,864 6,9460.217 87.6
Central States H & L Co Of Omaha NE 61751 690 2,404,931 1,719,321 7900.032 71.5
Christian Fidelity Life Ins Co TX 61859 574 2,865,575 2,019,354 6710.038 70.5
Cigna Hlth & Life Ins Co CT 67369 901 5,659,433 4,049,944 1,9740.076 71.6
CMFG Life Ins Co IA 62626 306 8,097 12,179 50.000 150.4
Combined Ins Co Of Amer IL 62146 626 155,762 245,788 740.002 157.8
Community Ins Co OH 10345 671 43,472,775 32,531,121 16,8760.583 74.8
Connecticut Gen Life Ins Co CT 62308 901 56,260 13,964 190.001 24.8
Constitution Life Ins Co TX 62359 4736 13,901,586 12,144,666 5,1110.186 87.4
CAUTION: The information contained on this page is unaudited and not a complete analysis nor is it an expression of opinion on any insurer. This page may contain inadvertent errors.
© 2017 National Association of Insurance Commissioners 107
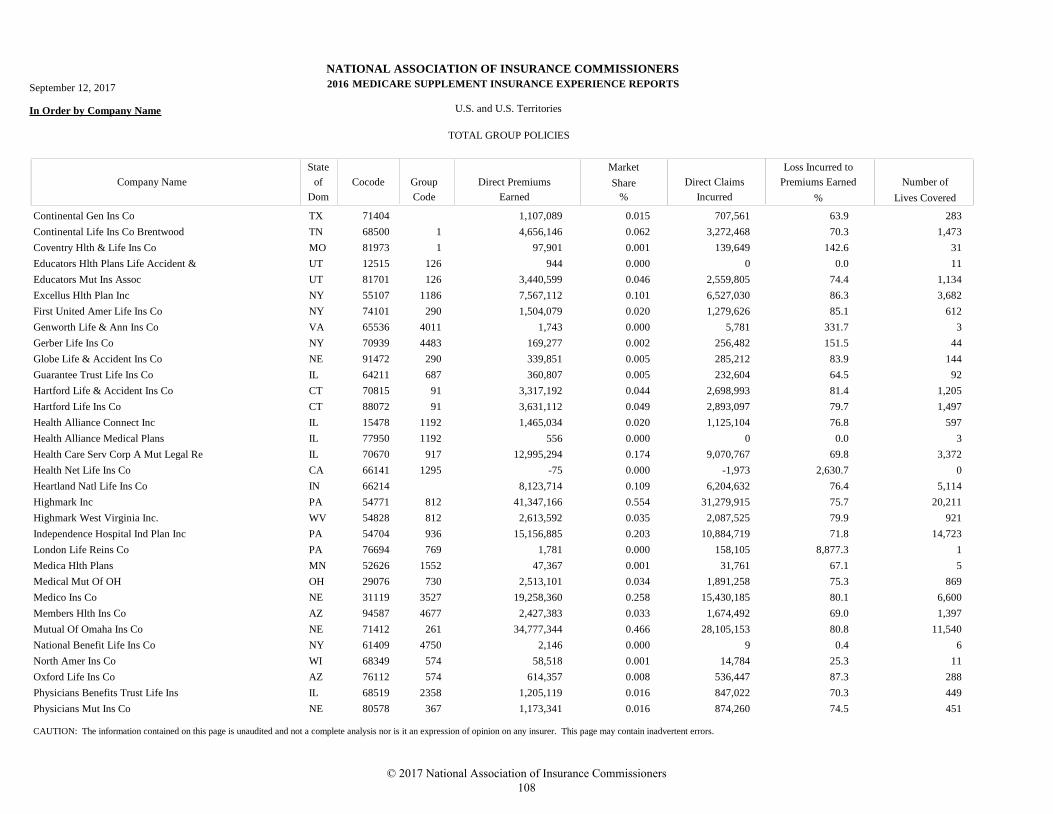
NATIONAL ASSOCIATION OF INSURANCE COMMISSIONERS
MEDICARE SUPPLEMENT INSURANCE EXPERIENCE REPORTS
In Order by Company Name U.S. and U.S. Territories
TOTAL GROUP POLICIES
Market
Direct Claims
Incurred
Loss Incurred to
Premiums Earned Number of
Lives Covered
Direct Premiums
Earned
Company Name
State
Dom
Cocode Group
Code
of Share
% %
September 12, 2017 2016
Continental Gen Ins Co TX 71404 1,107,089 707,561 2830.015 63.9
Continental Life Ins Co Brentwood TN 68500 1 4,656,146 3,272,468 1,4730.062 70.3
Coventry Hlth & Life Ins Co MO 81973 1 97,901 139,649 310.001 142.6
Educators Hlth Plans Life Accident & UT 12515 126 944 0 110.000 0.0
Educators Mut Ins Assoc UT 81701 126 3,440,599 2,559,805 1,1340.046 74.4
Excellus Hlth Plan Inc NY 55107 1186 7,567,112 6,527,030 3,6820.101 86.3
First United Amer Life Ins Co NY 74101 290 1,504,079 1,279,626 6120.020 85.1
Genworth Life & Ann Ins Co VA 65536 4011 1,743 5,781 30.000 331.7
Gerber Life Ins Co NY 70939 4483 169,277 256,482 440.002 151.5
Globe Life & Accident Ins Co NE 91472 290 339,851 285,212 1440.005 83.9
Guarantee Trust Life Ins Co IL 64211 687 360,807 232,604 920.005 64.5
Hartford Life & Accident Ins Co CT 70815 91 3,317,192 2,698,993 1,2050.044 81.4
Hartford Life Ins Co CT 88072 91 3,631,112 2,893,097 1,4970.049 79.7
Health Alliance Connect Inc IL 15478 1192 1,465,034 1,125,104 5970.020 76.8
Health Alliance Medical Plans IL 77950 1192 556 0 30.000 0.0
Health Care Serv Corp A Mut Legal Re IL 70670 917 12,995,294 9,070,767 3,3720.174 69.8
Health Net Life Ins Co CA 66141 1295 -75 -1,973 00.000 2,630.7
Heartland Natl Life Ins Co IN 66214 8,123,714 6,204,632 5,1140.109 76.4
Highmark Inc PA 54771 812 41,347,166 31,279,915 20,2110.554 75.7
Highmark West Virginia Inc. WV 54828 812 2,613,592 2,087,525 9210.035 79.9
Independence Hospital Ind Plan Inc PA 54704 936 15,156,885 10,884,719 14,7230.203 71.8
London Life Reins Co PA 76694 769 1,781 158,105 10.000 8,877.3
Medica Hlth Plans MN 52626 1552 47,367 31,761 50.001 67.1
Medical Mut Of OH OH 29076 730 2,513,101 1,891,258 8690.034 75.3
Medico Ins Co NE 31119 3527 19,258,360 15,430,185 6,6000.258 80.1
Members Hlth Ins Co AZ 94587 4677 2,427,383 1,674,492 1,3970.033 69.0
Mutual Of Omaha Ins Co NE 71412 261 34,777,344 28,105,153 11,5400.466 80.8
National Benefit Life Ins Co NY 61409 4750 2,146 9 60.000 0.4
North Amer Ins Co WI 68349 574 58,518 14,784 110.001 25.3
Oxford Life Ins Co AZ 76112 574 614,357 536,447 2880.008 87.3
Physicians Benefits Trust Life Ins IL 68519 2358 1,205,119 847,022 4490.016 70.3
Physicians Mut Ins Co NE 80578 367 1,173,341 874,260 4510.016 74.5
CAUTION: The information contained on this page is unaudited and not a complete analysis nor is it an expression of opinion on any insurer. This page may contain inadvertent errors.
© 2017 National Association of Insurance Commissioners 108
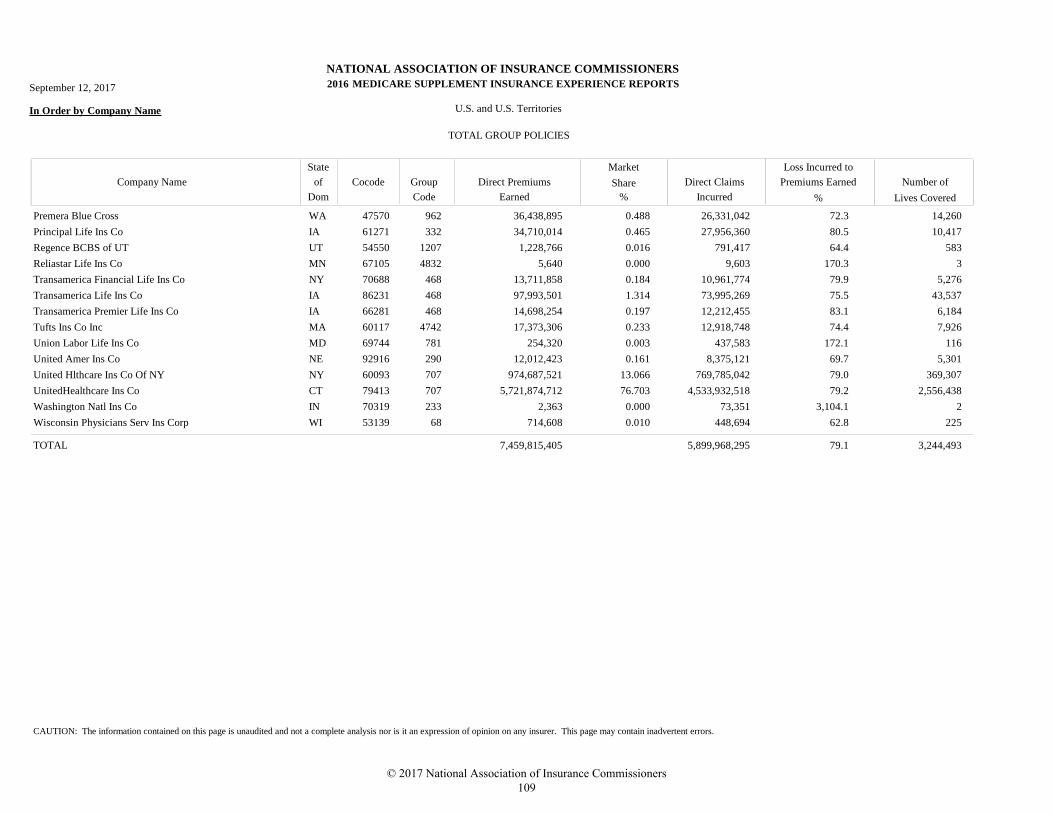
NATIONAL ASSOCIATION OF INSURANCE COMMISSIONERS
MEDICARE SUPPLEMENT INSURANCE EXPERIENCE REPORTS
In Order by Company Name U.S. and U.S. Territories
TOTAL GROUP POLICIES
Market
Direct Claims
Incurred
Loss Incurred to
Premiums Earned Number of
Lives Covered
Direct Premiums
Earned
Company Name
State
Dom
Cocode Group
Code
of Share
% %
September 12, 2017 2016
Premera Blue Cross WA 47570 962 36,438,895 26,331,042 14,2600.488 72.3
Principal Life Ins Co IA 61271 332 34,710,014 27,956,360 10,4170.465 80.5
Regence BCBS of UT UT 54550 1207 1,228,766 791,417 5830.016 64.4
Reliastar Life Ins Co MN 67105 4832 5,640 9,603 30.000 170.3
Transamerica Financial Life Ins Co NY 70688 468 13,711,858 10,961,774 5,2760.184 79.9
Transamerica Life Ins Co IA 86231 468 97,993,501 73,995,269 43,5371.314 75.5
Transamerica Premier Life Ins Co IA 66281 468 14,698,254 12,212,455 6,1840.197 83.1
Tufts Ins Co Inc MA 60117 4742 17,373,306 12,918,748 7,9260.233 74.4
Union Labor Life Ins Co MD 69744 781 254,320 437,583 1160.003 172.1
United Amer Ins Co NE 92916 290 12,012,423 8,375,121 5,3010.161 69.7
United Hlthcare Ins Co Of NY NY 60093 707 974,687,521 769,785,042 369,30713.066 79.0
UnitedHealthcare Ins Co CT 79413 707 5,721,874,712 4,533,932,518 2,556,43876.703 79.2
Washington Natl Ins Co IN 70319 233 2,363 73,351 20.000 3,104.1
Wisconsin Physicians Serv Ins Corp WI 53139 68 714,608 448,694 2250.010 62.8
7,459,815,405 5,899,968,295 3,244,493TOTAL 79.1
CAUTION: The information contained on this page is unaudited and not a complete analysis nor is it an expression of opinion on any insurer. This page may contain inadvertent errors.
© 2017 National Association of Insurance Commissioners 109

© 2017 National Association of Insurance Commissioners 110
TOTAL POLICIES (INDIVIDUAL AND GROUP) BY DIRECT PREMIUMS EARNED
© 2017 National Association of Insurance Commissioners 111

© 2017 National Association of Insurance Commissioners 112
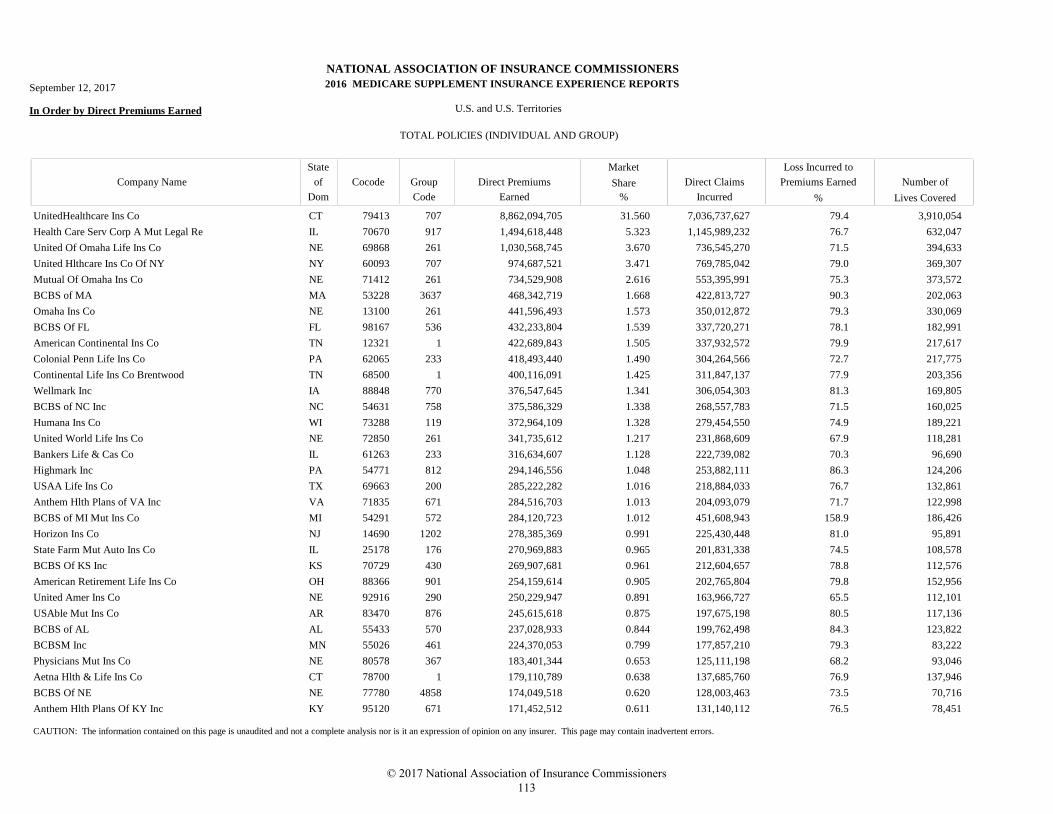
NATIONAL ASSOCIATION OF INSURANCE COMMISSIONERS
MEDICARE SUPPLEMENT INSURANCE EXPERIENCE REPORTS
In Order by Direct Premiums Earned U.S. and U.S. Territories
TOTAL POLICIES (INDIVIDUAL AND GROUP)
Market
Direct Claims
Incurred
Loss Incurred to
Premiums Earned Number of
Lives Covered
Direct Premiums
Earned
Company Name
State
Dom
Cocode Group
Code
of Share
% %
September 12, 2017 2016
UnitedHealthcare Ins Co CT 79413 707 8,862,094,705 7,036,737,627 3,910,05431.560 79.4
Health Care Serv Corp A Mut Legal Re IL 70670 917 1,494,618,448 1,145,989,232 632,0475.323 76.7
United Of Omaha Life Ins Co NE 69868 261 1,030,568,745 736,545,270 394,6333.670 71.5
United Hlthcare Ins Co Of NY NY 60093 707 974,687,521 769,785,042 369,3073.471 79.0
Mutual Of Omaha Ins Co NE 71412 261 734,529,908 553,395,991 373,5722.616 75.3
BCBS of MA MA 53228 3637 468,342,719 422,813,727 202,0631.668 90.3
Omaha Ins Co NE 13100 261 441,596,493 350,012,872 330,0691.573 79.3
BCBS Of FL FL 98167 536 432,233,804 337,720,271 182,9911.539 78.1
American Continental Ins Co TN 12321 1 422,689,843 337,932,572 217,6171.505 79.9
Colonial Penn Life Ins Co PA 62065 233 418,493,440 304,264,566 217,7751.490 72.7
Continental Life Ins Co Brentwood TN 68500 1 400,116,091 311,847,137 203,3561.425 77.9
Wellmark Inc IA 88848 770 376,547,645 306,054,303 169,8051.341 81.3
BCBS of NC Inc NC 54631 758 375,586,329 268,557,783 160,0251.338 71.5
Humana Ins Co WI 73288 119 372,964,109 279,454,550 189,2211.328 74.9
United World Life Ins Co NE 72850 261 341,735,612 231,868,609 118,2811.217 67.9
Bankers Life & Cas Co IL 61263 233 316,634,607 222,739,082 96,6901.128 70.3
Highmark Inc PA 54771 812 294,146,556 253,882,111 124,2061.048 86.3
USAA Life Ins Co TX 69663 200 285,222,282 218,884,033 132,8611.016 76.7
Anthem Hlth Plans of VA Inc VA 71835 671 284,516,703 204,093,079 122,9981.013 71.7
BCBS of MI Mut Ins Co MI 54291 572 284,120,723 451,608,943 186,4261.012 158.9
Horizon Ins Co NJ 14690 1202 278,385,369 225,430,448 95,8910.991 81.0
State Farm Mut Auto Ins Co IL 25178 176 270,969,883 201,831,338 108,5780.965 74.5
BCBS Of KS Inc KS 70729 430 269,907,681 212,604,657 112,5760.961 78.8
American Retirement Life Ins Co OH 88366 901 254,159,614 202,765,804 152,9560.905 79.8
United Amer Ins Co NE 92916 290 250,229,947 163,966,727 112,1010.891 65.5
USAble Mut Ins Co AR 83470 876 245,615,618 197,675,198 117,1360.875 80.5
BCBS of AL AL 55433 570 237,028,933 199,762,498 123,8220.844 84.3
BCBSM Inc MN 55026 461 224,370,053 177,857,210 83,2220.799 79.3
Physicians Mut Ins Co NE 80578 367 183,401,344 125,111,198 93,0460.653 68.2
Aetna Hlth & Life Ins Co CT 78700 1 179,110,789 137,685,760 137,9460.638 76.9
BCBS Of NE NE 77780 4858 174,049,518 128,003,463 70,7160.620 73.5
Anthem Hlth Plans Of KY Inc KY 95120 671 171,452,512 131,140,112 78,4510.611 76.5
CAUTION: The information contained on this page is unaudited and not a complete analysis nor is it an expression of opinion on any insurer. This page may contain inadvertent errors.
© 2017 National Association of Insurance Commissioners 113
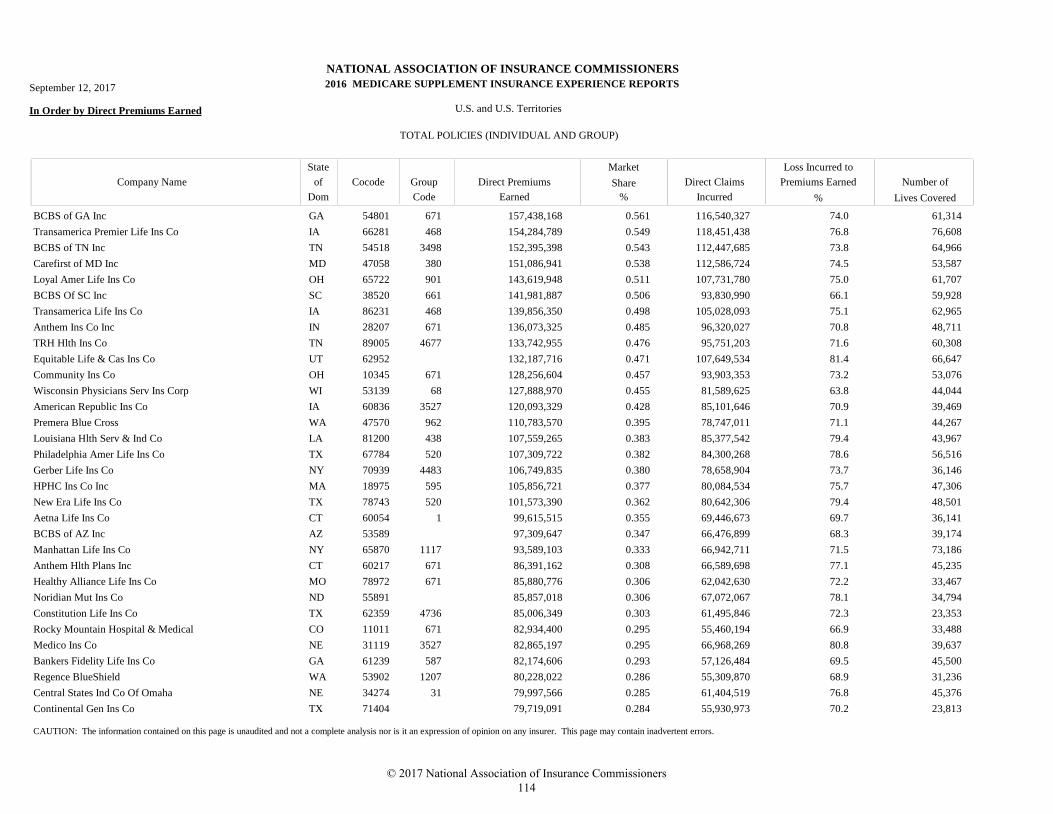
NATIONAL ASSOCIATION OF INSURANCE COMMISSIONERS
MEDICARE SUPPLEMENT INSURANCE EXPERIENCE REPORTS
In Order by Direct Premiums Earned U.S. and U.S. Territories
TOTAL POLICIES (INDIVIDUAL AND GROUP)
Market
Direct Claims
Incurred
Loss Incurred to
Premiums Earned Number of
Lives Covered
Direct Premiums
Earned
Company Name
State
Dom
Cocode Group
Code
of Share
% %
September 12, 2017 2016
BCBS of GA Inc GA 54801 671 157,438,168 116,540,327 61,3140.561 74.0
Transamerica Premier Life Ins Co IA 66281 468 154,284,789 118,451,438 76,6080.549 76.8
BCBS of TN Inc TN 54518 3498 152,395,398 112,447,685 64,9660.543 73.8
Carefirst of MD Inc MD 47058 380 151,086,941 112,586,724 53,5870.538 74.5
Loyal Amer Life Ins Co OH 65722 901 143,619,948 107,731,780 61,7070.511 75.0
BCBS Of SC Inc SC 38520 661 141,981,887 93,830,990 59,9280.506 66.1
Transamerica Life Ins Co IA 86231 468 139,856,350 105,028,093 62,9650.498 75.1
Anthem Ins Co Inc IN 28207 671 136,073,325 96,320,027 48,7110.485 70.8
TRH Hlth Ins Co TN 89005 4677 133,742,955 95,751,203 60,3080.476 71.6
Equitable Life & Cas Ins Co UT 62952 132,187,716 107,649,534 66,6470.471 81.4
Community Ins Co OH 10345 671 128,256,604 93,903,353 53,0760.457 73.2
Wisconsin Physicians Serv Ins Corp WI 53139 68 127,888,970 81,589,625 44,0440.455 63.8
American Republic Ins Co IA 60836 3527 120,093,329 85,101,646 39,4690.428 70.9
Premera Blue Cross WA 47570 962 110,783,570 78,747,011 44,2670.395 71.1
Louisiana Hlth Serv & Ind Co LA 81200 438 107,559,265 85,377,542 43,9670.383 79.4
Philadelphia Amer Life Ins Co TX 67784 520 107,309,722 84,300,268 56,5160.382 78.6
Gerber Life Ins Co NY 70939 4483 106,749,835 78,658,904 36,1460.380 73.7
HPHC Ins Co Inc MA 18975 595 105,856,721 80,084,534 47,3060.377 75.7
New Era Life Ins Co TX 78743 520 101,573,390 80,642,306 48,5010.362 79.4
Aetna Life Ins Co CT 60054 1 99,615,515 69,446,673 36,1410.355 69.7
BCBS of AZ Inc AZ 53589 97,309,647 66,476,899 39,1740.347 68.3
Manhattan Life Ins Co NY 65870 1117 93,589,103 66,942,711 73,1860.333 71.5
Anthem Hlth Plans Inc CT 60217 671 86,391,162 66,589,698 45,2350.308 77.1
Healthy Alliance Life Ins Co MO 78972 671 85,880,776 62,042,630 33,4670.306 72.2
Noridian Mut Ins Co ND 55891 85,857,018 67,072,067 34,7940.306 78.1
Constitution Life Ins Co TX 62359 4736 85,006,349 61,495,846 23,3530.303 72.3
Rocky Mountain Hospital & Medical CO 11011 671 82,934,400 55,460,194 33,4880.295 66.9
Medico Ins Co NE 31119 3527 82,865,197 66,968,269 39,6370.295 80.8
Bankers Fidelity Life Ins Co GA 61239 587 82,174,606 57,126,484 45,5000.293 69.5
Regence BlueShield WA 53902 1207 80,228,022 55,309,870 31,2360.286 68.9
Central States Ind Co Of Omaha NE 34274 31 79,997,566 61,404,519 45,3760.285 76.8
Continental Gen Ins Co TX 71404 79,719,091 55,930,973 23,8130.284 70.2
CAUTION: The information contained on this page is unaudited and not a complete analysis nor is it an expression of opinion on any insurer. This page may contain inadvertent errors.
© 2017 National Association of Insurance Commissioners 114
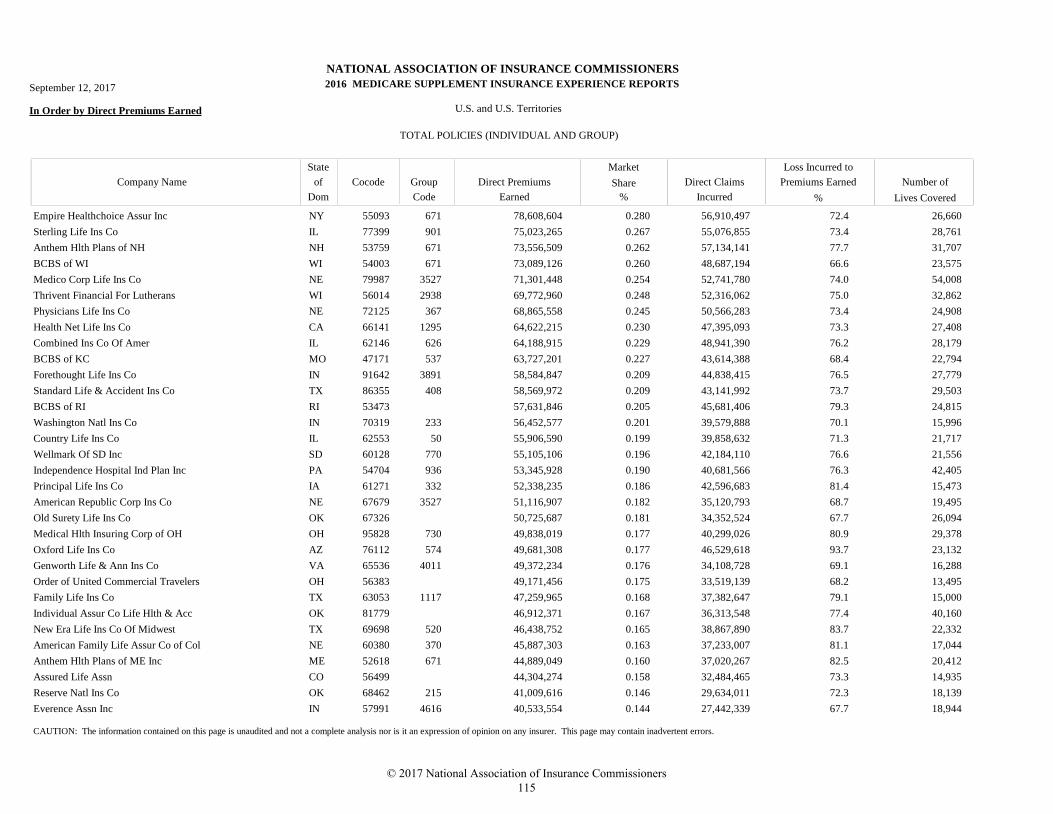
NATIONAL ASSOCIATION OF INSURANCE COMMISSIONERS
MEDICARE SUPPLEMENT INSURANCE EXPERIENCE REPORTS
In Order by Direct Premiums Earned U.S. and U.S. Territories
TOTAL POLICIES (INDIVIDUAL AND GROUP)
Market
Direct Claims
Incurred
Loss Incurred to
Premiums Earned Number of
Lives Covered
Direct Premiums
Earned
Company Name
State
Dom
Cocode Group
Code
of Share
% %
September 12, 2017 2016
Empire Healthchoice Assur Inc NY 55093 671 78,608,604 56,910,497 26,6600.280 72.4
Sterling Life Ins Co IL 77399 901 75,023,265 55,076,855 28,7610.267 73.4
Anthem Hlth Plans of NH NH 53759 671 73,556,509 57,134,141 31,7070.262 77.7
BCBS of WI WI 54003 671 73,089,126 48,687,194 23,5750.260 66.6
Medico Corp Life Ins Co NE 79987 3527 71,301,448 52,741,780 54,0080.254 74.0
Thrivent Financial For Lutherans WI 56014 2938 69,772,960 52,316,062 32,8620.248 75.0
Physicians Life Ins Co NE 72125 367 68,865,558 50,566,283 24,9080.245 73.4
Health Net Life Ins Co CA 66141 1295 64,622,215 47,395,093 27,4080.230 73.3
Combined Ins Co Of Amer IL 62146 626 64,188,915 48,941,390 28,1790.229 76.2
BCBS of KC MO 47171 537 63,727,201 43,614,388 22,7940.227 68.4
Forethought Life Ins Co IN 91642 3891 58,584,847 44,838,415 27,7790.209 76.5
Standard Life & Accident Ins Co TX 86355 408 58,569,972 43,141,992 29,5030.209 73.7
BCBS of RI RI 53473 57,631,846 45,681,406 24,8150.205 79.3
Washington Natl Ins Co IN 70319 233 56,452,577 39,579,888 15,9960.201 70.1
Country Life Ins Co IL 62553 50 55,906,590 39,858,632 21,7170.199 71.3
Wellmark Of SD Inc SD 60128 770 55,105,106 42,184,110 21,5560.196 76.6
Independence Hospital Ind Plan Inc PA 54704 936 53,345,928 40,681,566 42,4050.190 76.3
Principal Life Ins Co IA 61271 332 52,338,235 42,596,683 15,4730.186 81.4
American Republic Corp Ins Co NE 67679 3527 51,116,907 35,120,793 19,4950.182 68.7
Old Surety Life Ins Co OK 67326 50,725,687 34,352,524 26,0940.181 67.7
Medical Hlth Insuring Corp of OH OH 95828 730 49,838,019 40,299,026 29,3780.177 80.9
Oxford Life Ins Co AZ 76112 574 49,681,308 46,529,618 23,1320.177 93.7
Genworth Life & Ann Ins Co VA 65536 4011 49,372,234 34,108,728 16,2880.176 69.1
Order of United Commercial Travelers OH 56383 49,171,456 33,519,139 13,4950.175 68.2
Family Life Ins Co TX 63053 1117 47,259,965 37,382,647 15,0000.168 79.1
Individual Assur Co Life Hlth & Acc OK 81779 46,912,371 36,313,548 40,1600.167 77.4
New Era Life Ins Co Of Midwest TX 69698 520 46,438,752 38,867,890 22,3320.165 83.7
American Family Life Assur Co of Col NE 60380 370 45,887,303 37,233,007 17,0440.163 81.1
Anthem Hlth Plans of ME Inc ME 52618 671 44,889,049 37,020,267 20,4120.160 82.5
Assured Life Assn CO 56499 44,304,274 32,484,465 14,9350.158 73.3
Reserve Natl Ins Co OK 68462 215 41,009,616 29,634,011 18,1390.146 72.3
Everence Assn Inc IN 57991 4616 40,533,554 27,442,339 18,9440.144 67.7
CAUTION: The information contained on this page is unaudited and not a complete analysis nor is it an expression of opinion on any insurer. This page may contain inadvertent errors.
© 2017 National Association of Insurance Commissioners 115
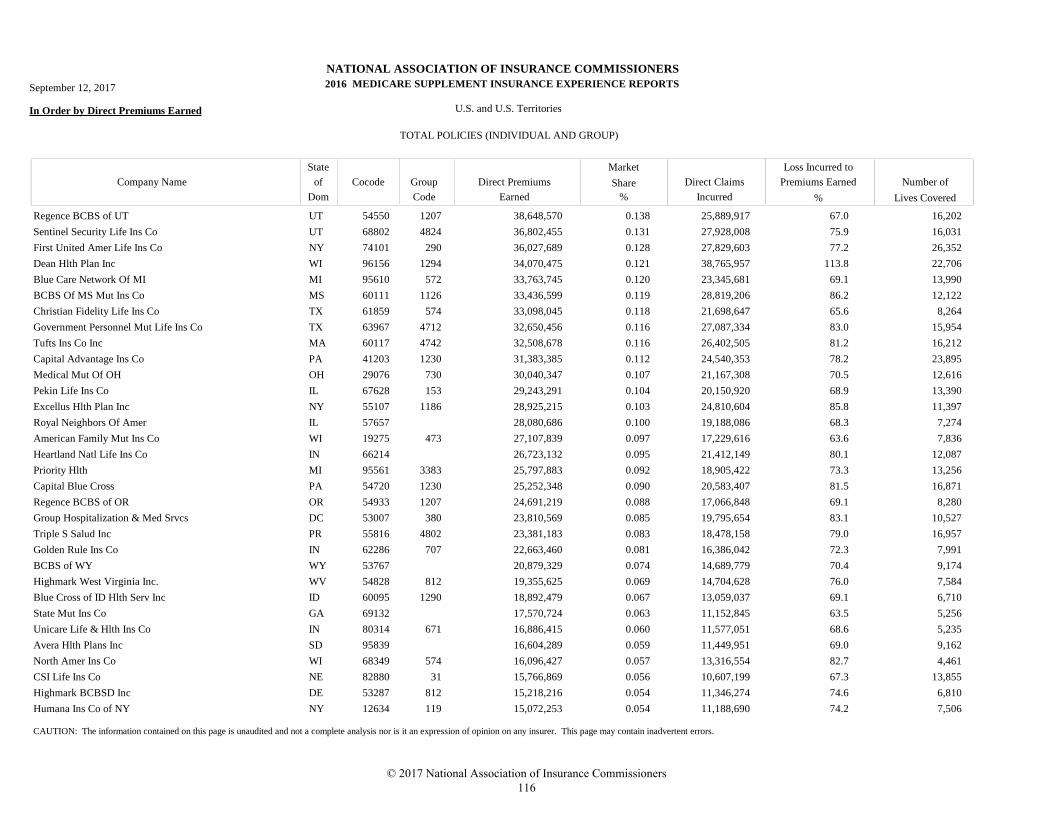
NATIONAL ASSOCIATION OF INSURANCE COMMISSIONERS
MEDICARE SUPPLEMENT INSURANCE EXPERIENCE REPORTS
In Order by Direct Premiums Earned U.S. and U.S. Territories
TOTAL POLICIES (INDIVIDUAL AND GROUP)
Market
Direct Claims
Incurred
Loss Incurred to
Premiums Earned Number of
Lives Covered
Direct Premiums
Earned
Company Name
State
Dom
Cocode Group
Code
of Share
% %
September 12, 2017 2016
Regence BCBS of UT UT 54550 1207 38,648,570 25,889,917 16,2020.138 67.0
Sentinel Security Life Ins Co UT 68802 4824 36,802,455 27,928,008 16,0310.131 75.9
First United Amer Life Ins Co NY 74101 290 36,027,689 27,829,603 26,3520.128 77.2
Dean Hlth Plan Inc WI 96156 1294 34,070,475 38,765,957 22,7060.121 113.8
Blue Care Network Of MI MI 95610 572 33,763,745 23,345,681 13,9900.120 69.1
BCBS Of MS Mut Ins Co MS 60111 1126 33,436,599 28,819,206 12,1220.119 86.2
Christian Fidelity Life Ins Co TX 61859 574 33,098,045 21,698,647 8,2640.118 65.6
Government Personnel Mut Life Ins Co TX 63967 4712 32,650,456 27,087,334 15,9540.116 83.0
Tufts Ins Co Inc MA 60117 4742 32,508,678 26,402,505 16,2120.116 81.2
Capital Advantage Ins Co PA 41203 1230 31,383,385 24,540,353 23,8950.112 78.2
Medical Mut Of OH OH 29076 730 30,040,347 21,167,308 12,6160.107 70.5
Pekin Life Ins Co IL 67628 153 29,243,291 20,150,920 13,3900.104 68.9
Excellus Hlth Plan Inc NY 55107 1186 28,925,215 24,810,604 11,3970.103 85.8
Royal Neighbors Of Amer IL 57657 28,080,686 19,188,086 7,2740.100 68.3
American Family Mut Ins Co WI 19275 473 27,107,839 17,229,616 7,8360.097 63.6
Heartland Natl Life Ins Co IN 66214 26,723,132 21,412,149 12,0870.095 80.1
Priority Hlth MI 95561 3383 25,797,883 18,905,422 13,2560.092 73.3
Capital Blue Cross PA 54720 1230 25,252,348 20,583,407 16,8710.090 81.5
Regence BCBS of OR OR 54933 1207 24,691,219 17,066,848 8,2800.088 69.1
Group Hospitalization & Med Srvcs DC 53007 380 23,810,569 19,795,654 10,5270.085 83.1
Triple S Salud Inc PR 55816 4802 23,381,183 18,478,158 16,9570.083 79.0
Golden Rule Ins Co IN 62286 707 22,663,460 16,386,042 7,9910.081 72.3
BCBS of WY WY 53767 20,879,329 14,689,779 9,1740.074 70.4
Highmark West Virginia Inc. WV 54828 812 19,355,625 14,704,628 7,5840.069 76.0
Blue Cross of ID Hlth Serv Inc ID 60095 1290 18,892,479 13,059,037 6,7100.067 69.1
State Mut Ins Co GA 69132 17,570,724 11,152,845 5,2560.063 63.5
Unicare Life & Hlth Ins Co IN 80314 671 16,886,415 11,577,051 5,2350.060 68.6
Avera Hlth Plans Inc SD 95839 16,604,289 11,449,951 9,1620.059 69.0
North Amer Ins Co WI 68349 574 16,096,427 13,316,554 4,4610.057 82.7
CSI Life Ins Co NE 82880 31 15,766,869 10,607,199 13,8550.056 67.3
Highmark BCBSD Inc DE 53287 812 15,218,216 11,346,274 6,8100.054 74.6
Humana Ins Co of NY NY 12634 119 15,072,253 11,188,690 7,5060.054 74.2
CAUTION: The information contained on this page is unaudited and not a complete analysis nor is it an expression of opinion on any insurer. This page may contain inadvertent errors.
© 2017 National Association of Insurance Commissioners 116
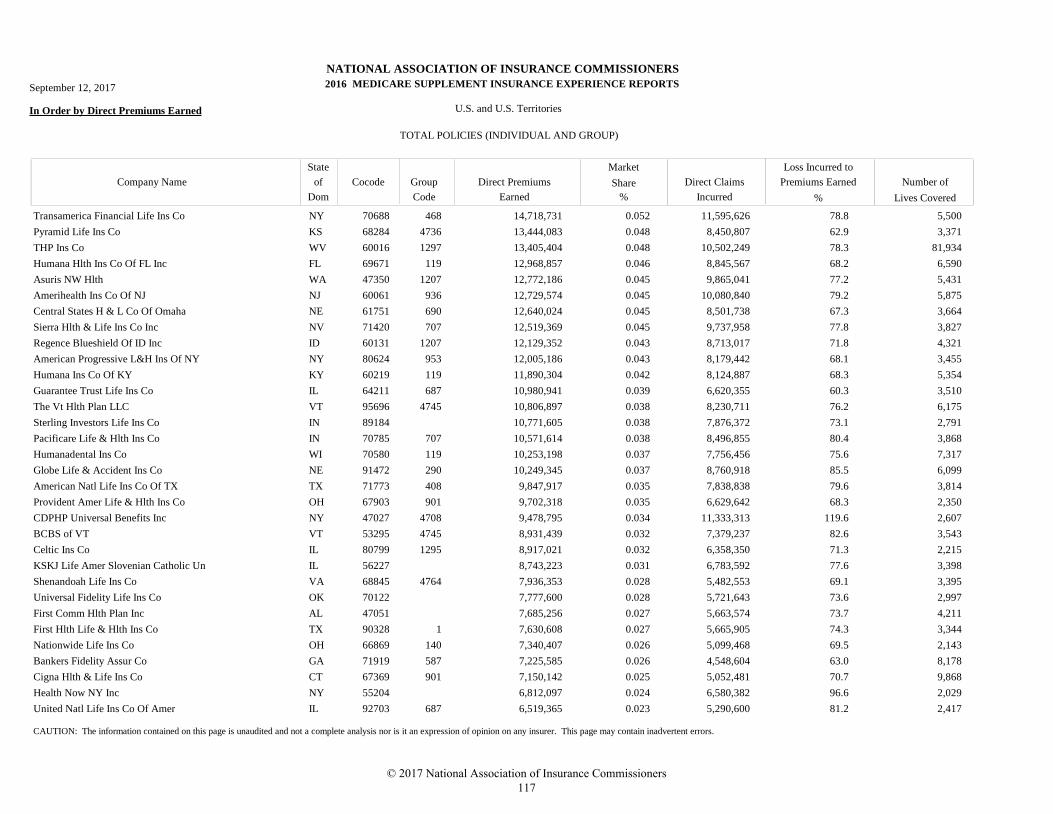
NATIONAL ASSOCIATION OF INSURANCE COMMISSIONERS
MEDICARE SUPPLEMENT INSURANCE EXPERIENCE REPORTS
In Order by Direct Premiums Earned U.S. and U.S. Territories
TOTAL POLICIES (INDIVIDUAL AND GROUP)
Market
Direct Claims
Incurred
Loss Incurred to
Premiums Earned Number of
Lives Covered
Direct Premiums
Earned
Company Name
State
Dom
Cocode Group
Code
of Share
% %
September 12, 2017 2016
Transamerica Financial Life Ins Co NY 70688 468 14,718,731 11,595,626 5,5000.052 78.8
Pyramid Life Ins Co KS 68284 4736 13,444,083 8,450,807 3,3710.048 62.9
THP Ins Co WV 60016 1297 13,405,404 10,502,249 81,9340.048 78.3
Humana Hlth Ins Co Of FL Inc FL 69671 119 12,968,857 8,845,567 6,5900.046 68.2
Asuris NW Hlth WA 47350 1207 12,772,186 9,865,041 5,4310.045 77.2
Amerihealth Ins Co Of NJ NJ 60061 936 12,729,574 10,080,840 5,8750.045 79.2
Central States H & L Co Of Omaha NE 61751 690 12,640,024 8,501,738 3,6640.045 67.3
Sierra Hlth & Life Ins Co Inc NV 71420 707 12,519,369 9,737,958 3,8270.045 77.8
Regence Blueshield Of ID Inc ID 60131 1207 12,129,352 8,713,017 4,3210.043 71.8
American Progressive L&H Ins Of NY NY 80624 953 12,005,186 8,179,442 3,4550.043 68.1
Humana Ins Co Of KY KY 60219 119 11,890,304 8,124,887 5,3540.042 68.3
Guarantee Trust Life Ins Co IL 64211 687 10,980,941 6,620,355 3,5100.039 60.3
The Vt Hlth Plan LLC VT 95696 4745 10,806,897 8,230,711 6,1750.038 76.2
Sterling Investors Life Ins Co IN 89184 10,771,605 7,876,372 2,7910.038 73.1
Pacificare Life & Hlth Ins Co IN 70785 707 10,571,614 8,496,855 3,8680.038 80.4
Humanadental Ins Co WI 70580 119 10,253,198 7,756,456 7,3170.037 75.6
Globe Life & Accident Ins Co NE 91472 290 10,249,345 8,760,918 6,0990.037 85.5
American Natl Life Ins Co Of TX TX 71773 408 9,847,917 7,838,838 3,8140.035 79.6
Provident Amer Life & Hlth Ins Co OH 67903 901 9,702,318 6,629,642 2,3500.035 68.3
CDPHP Universal Benefits Inc NY 47027 4708 9,478,795 11,333,313 2,6070.034 119.6
BCBS of VT VT 53295 4745 8,931,439 7,379,237 3,5430.032 82.6
Celtic Ins Co IL 80799 1295 8,917,021 6,358,350 2,2150.032 71.3
KSKJ Life Amer Slovenian Catholic Un IL 56227 8,743,223 6,783,592 3,3980.031 77.6
Shenandoah Life Ins Co VA 68845 4764 7,936,353 5,482,553 3,3950.028 69.1
Universal Fidelity Life Ins Co OK 70122 7,777,600 5,721,643 2,9970.028 73.6
First Comm Hlth Plan Inc AL 47051 7,685,256 5,663,574 4,2110.027 73.7
First Hlth Life & Hlth Ins Co TX 90328 1 7,630,608 5,665,905 3,3440.027 74.3
Nationwide Life Ins Co OH 66869 140 7,340,407 5,099,468 2,1430.026 69.5
Bankers Fidelity Assur Co GA 71919 587 7,225,585 4,548,604 8,1780.026 63.0
Cigna Hlth & Life Ins Co CT 67369 901 7,150,142 5,052,481 9,8680.025 70.7
Health Now NY Inc NY 55204 6,812,097 6,580,382 2,0290.024 96.6
United Natl Life Ins Co Of Amer IL 92703 687 6,519,365 5,290,600 2,4170.023 81.2
CAUTION: The information contained on this page is unaudited and not a complete analysis nor is it an expression of opinion on any insurer. This page may contain inadvertent errors.
© 2017 National Association of Insurance Commissioners 117
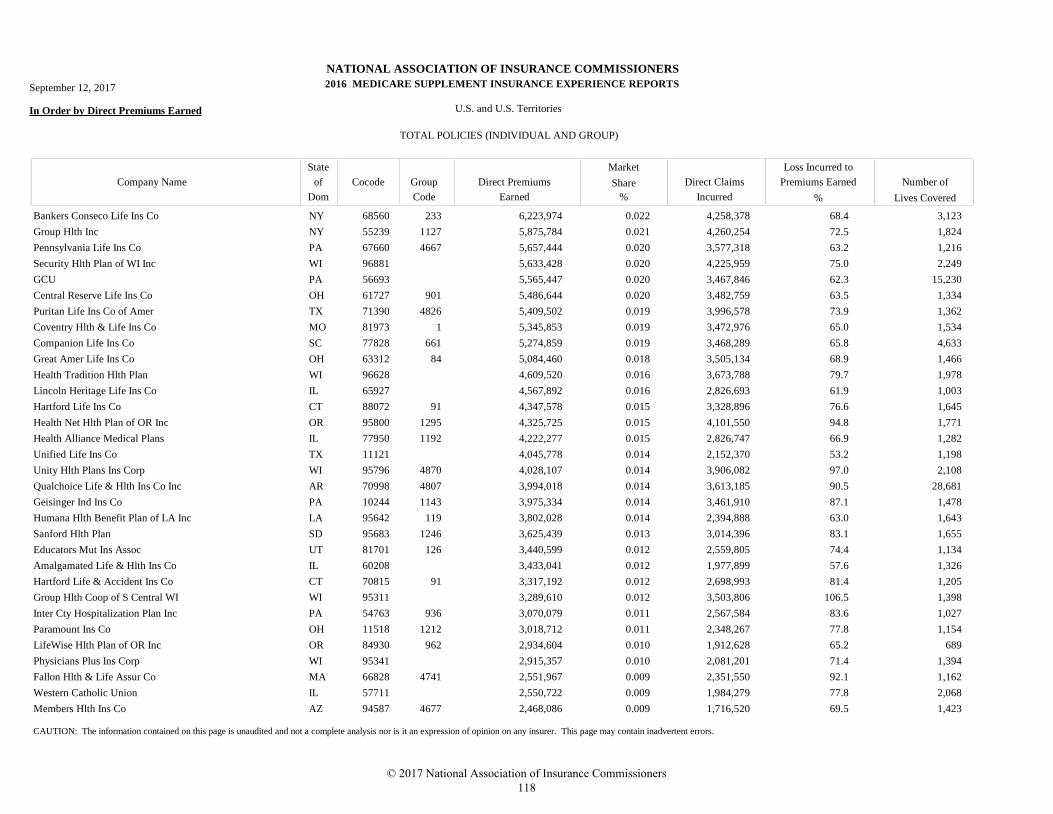
NATIONAL ASSOCIATION OF INSURANCE COMMISSIONERS
MEDICARE SUPPLEMENT INSURANCE EXPERIENCE REPORTS
In Order by Direct Premiums Earned U.S. and U.S. Territories
TOTAL POLICIES (INDIVIDUAL AND GROUP)
Market
Direct Claims
Incurred
Loss Incurred to
Premiums Earned Number of
Lives Covered
Direct Premiums
Earned
Company Name
State
Dom
Cocode Group
Code
of Share
% %
September 12, 2017 2016
Bankers Conseco Life Ins Co NY 68560 233 6,223,974 4,258,378 3,1230.022 68.4
Group Hlth Inc NY 55239 1127 5,875,784 4,260,254 1,8240.021 72.5
Pennsylvania Life Ins Co PA 67660 4667 5,657,444 3,577,318 1,2160.020 63.2
Security Hlth Plan of WI Inc WI 96881 5,633,428 4,225,959 2,2490.020 75.0
GCU PA 56693 5,565,447 3,467,846 15,2300.020 62.3
Central Reserve Life Ins Co OH 61727 901 5,486,644 3,482,759 1,3340.020 63.5
Puritan Life Ins Co of Amer TX 71390 4826 5,409,502 3,996,578 1,3620.019 73.9
Coventry Hlth & Life Ins Co MO 81973 1 5,345,853 3,472,976 1,5340.019 65.0
Companion Life Ins Co SC 77828 661 5,274,859 3,468,289 4,6330.019 65.8
Great Amer Life Ins Co OH 63312 84 5,084,460 3,505,134 1,4660.018 68.9
Health Tradition Hlth Plan WI 96628 4,609,520 3,673,788 1,9780.016 79.7
Lincoln Heritage Life Ins Co IL 65927 4,567,892 2,826,693 1,0030.016 61.9
Hartford Life Ins Co CT 88072 91 4,347,578 3,328,896 1,6450.015 76.6
Health Net Hlth Plan of OR Inc OR 95800 1295 4,325,725 4,101,550 1,7710.015 94.8
Health Alliance Medical Plans IL 77950 1192 4,222,277 2,826,747 1,2820.015 66.9
Unified Life Ins Co TX 11121 4,045,778 2,152,370 1,1980.014 53.2
Unity Hlth Plans Ins Corp WI 95796 4870 4,028,107 3,906,082 2,1080.014 97.0
Qualchoice Life & Hlth Ins Co Inc AR 70998 4807 3,994,018 3,613,185 28,6810.014 90.5
Geisinger Ind Ins Co PA 10244 1143 3,975,334 3,461,910 1,4780.014 87.1
Humana Hlth Benefit Plan of LA Inc LA 95642 119 3,802,028 2,394,888 1,6430.014 63.0
Sanford Hlth Plan SD 95683 1246 3,625,439 3,014,396 1,6550.013 83.1
Educators Mut Ins Assoc UT 81701 126 3,440,599 2,559,805 1,1340.012 74.4
Amalgamated Life & Hlth Ins Co IL 60208 3,433,041 1,977,899 1,3260.012 57.6
Hartford Life & Accident Ins Co CT 70815 91 3,317,192 2,698,993 1,2050.012 81.4
Group Hlth Coop of S Central WI WI 95311 3,289,610 3,503,806 1,3980.012 106.5
Inter Cty Hospitalization Plan Inc PA 54763 936 3,070,079 2,567,584 1,0270.011 83.6
Paramount Ins Co OH 11518 1212 3,018,712 2,348,267 1,1540.011 77.8
LifeWise Hlth Plan of OR Inc OR 84930 962 2,934,604 1,912,628 6890.010 65.2
Physicians Plus Ins Corp WI 95341 2,915,357 2,081,201 1,3940.010 71.4
Fallon Hlth & Life Assur Co MA 66828 4741 2,551,967 2,351,550 1,1620.009 92.1
Western Catholic Union IL 57711 2,550,722 1,984,279 2,0680.009 77.8
Members Hlth Ins Co AZ 94587 4677 2,468,086 1,716,520 1,4230.009 69.5
CAUTION: The information contained on this page is unaudited and not a complete analysis nor is it an expression of opinion on any insurer. This page may contain inadvertent errors.
© 2017 National Association of Insurance Commissioners 118
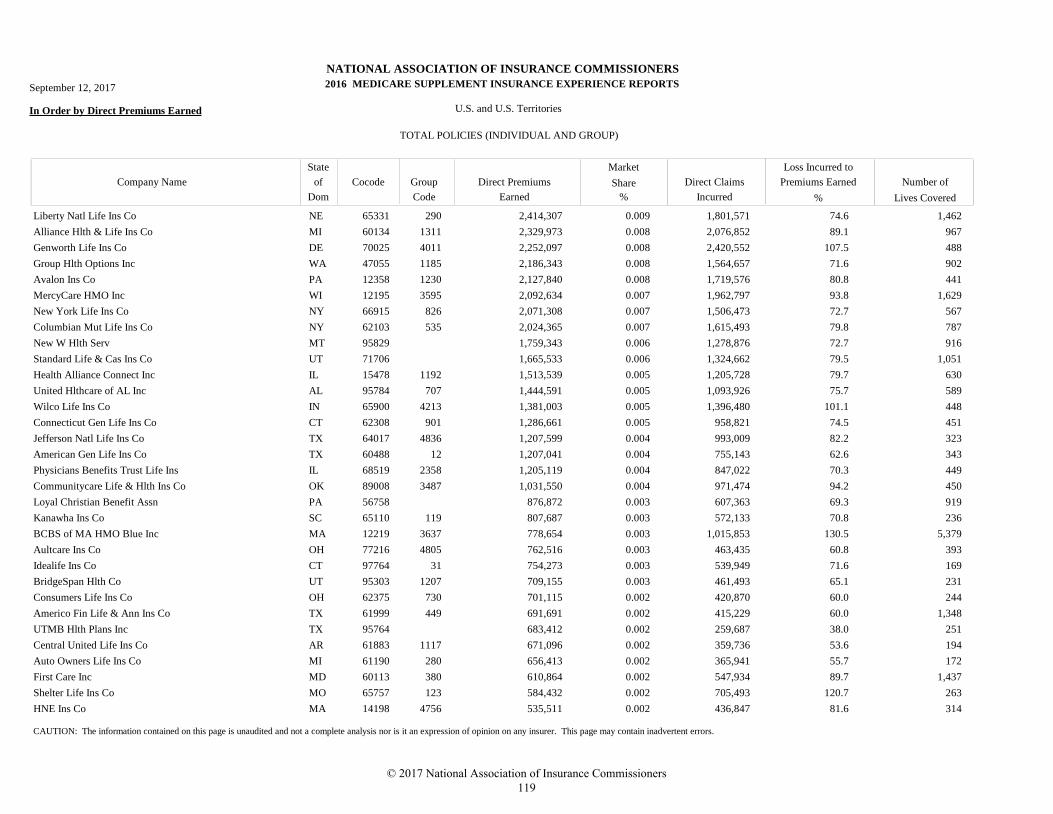
NATIONAL ASSOCIATION OF INSURANCE COMMISSIONERS
MEDICARE SUPPLEMENT INSURANCE EXPERIENCE REPORTS
In Order by Direct Premiums Earned U.S. and U.S. Territories
TOTAL POLICIES (INDIVIDUAL AND GROUP)
Market
Direct Claims
Incurred
Loss Incurred to
Premiums Earned Number of
Lives Covered
Direct Premiums
Earned
Company Name
State
Dom
Cocode Group
Code
of Share
% %
September 12, 2017 2016
Liberty Natl Life Ins Co NE 65331 290 2,414,307 1,801,571 1,4620.009 74.6
Alliance Hlth & Life Ins Co MI 60134 1311 2,329,973 2,076,852 9670.008 89.1
Genworth Life Ins Co DE 70025 4011 2,252,097 2,420,552 4880.008 107.5
Group Hlth Options Inc WA 47055 1185 2,186,343 1,564,657 9020.008 71.6
Avalon Ins Co PA 12358 1230 2,127,840 1,719,576 4410.008 80.8
MercyCare HMO Inc WI 12195 3595 2,092,634 1,962,797 1,6290.007 93.8
New York Life Ins Co NY 66915 826 2,071,308 1,506,473 5670.007 72.7
Columbian Mut Life Ins Co NY 62103 535 2,024,365 1,615,493 7870.007 79.8
New W Hlth Serv MT 95829 1,759,343 1,278,876 9160.006 72.7
Standard Life & Cas Ins Co UT 71706 1,665,533 1,324,662 1,0510.006 79.5
Health Alliance Connect Inc IL 15478 1192 1,513,539 1,205,728 6300.005 79.7
United Hlthcare of AL Inc AL 95784 707 1,444,591 1,093,926 5890.005 75.7
Wilco Life Ins Co IN 65900 4213 1,381,003 1,396,480 4480.005 101.1
Connecticut Gen Life Ins Co CT 62308 901 1,286,661 958,821 4510.005 74.5
Jefferson Natl Life Ins Co TX 64017 4836 1,207,599 993,009 3230.004 82.2
American Gen Life Ins Co TX 60488 12 1,207,041 755,143 3430.004 62.6
Physicians Benefits Trust Life Ins IL 68519 2358 1,205,119 847,022 4490.004 70.3
Communitycare Life & Hlth Ins Co OK 89008 3487 1,031,550 971,474 4500.004 94.2
Loyal Christian Benefit Assn PA 56758 876,872 607,363 9190.003 69.3
Kanawha Ins Co SC 65110 119 807,687 572,133 2360.003 70.8
BCBS of MA HMO Blue Inc MA 12219 3637 778,654 1,015,853 5,3790.003 130.5
Aultcare Ins Co OH 77216 4805 762,516 463,435 3930.003 60.8
Idealife Ins Co CT 97764 31 754,273 539,949 1690.003 71.6
BridgeSpan Hlth Co UT 95303 1207 709,155 461,493 2310.003 65.1
Consumers Life Ins Co OH 62375 730 701,115 420,870 2440.002 60.0
Americo Fin Life & Ann Ins Co TX 61999 449 691,691 415,229 1,3480.002 60.0
UTMB Hlth Plans Inc TX 95764 683,412 259,687 2510.002 38.0
Central United Life Ins Co AR 61883 1117 671,096 359,736 1940.002 53.6
Auto Owners Life Ins Co MI 61190 280 656,413 365,941 1720.002 55.7
First Care Inc MD 60113 380 610,864 547,934 1,4370.002 89.7
Shelter Life Ins Co MO 65757 123 584,432 705,493 2630.002 120.7
HNE Ins Co MA 14198 4756 535,511 436,847 3140.002 81.6
CAUTION: The information contained on this page is unaudited and not a complete analysis nor is it an expression of opinion on any insurer. This page may contain inadvertent errors.
© 2017 National Association of Insurance Commissioners 119
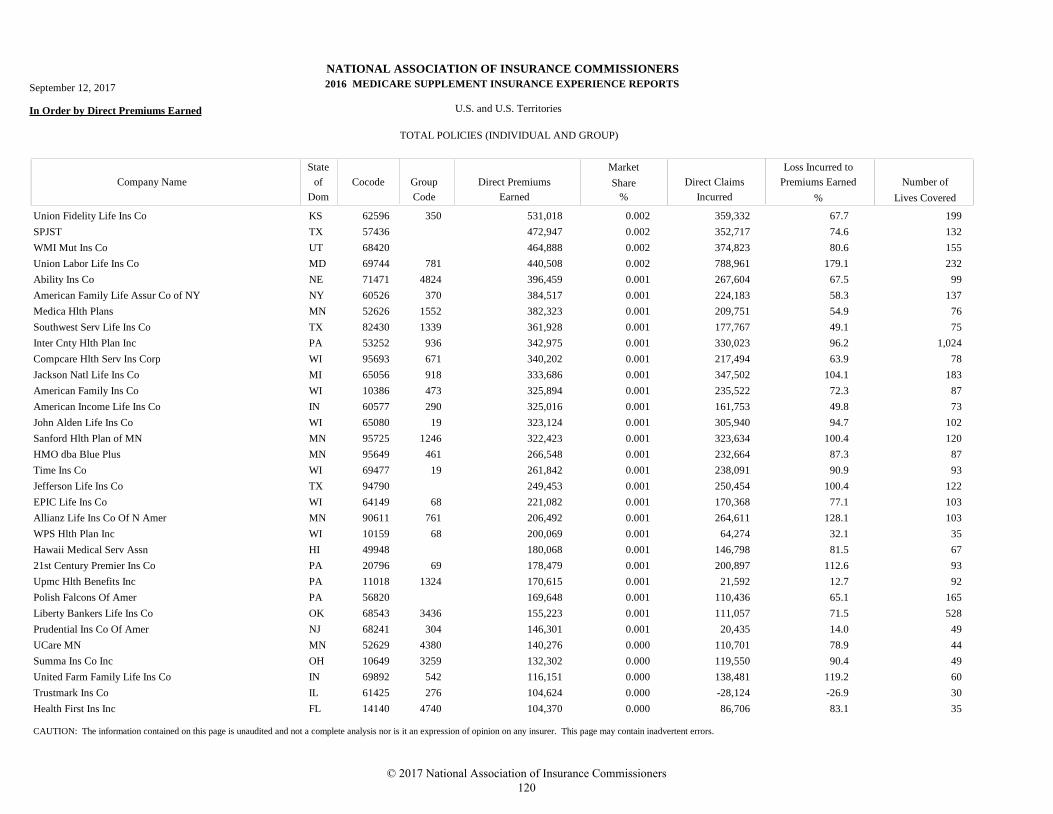
NATIONAL ASSOCIATION OF INSURANCE COMMISSIONERS
MEDICARE SUPPLEMENT INSURANCE EXPERIENCE REPORTS
In Order by Direct Premiums Earned U.S. and U.S. Territories
TOTAL POLICIES (INDIVIDUAL AND GROUP)
Market
Direct Claims
Incurred
Loss Incurred to
Premiums Earned Number of
Lives Covered
Direct Premiums
Earned
Company Name
State
Dom
Cocode Group
Code
of Share
% %
September 12, 2017 2016
Union Fidelity Life Ins Co KS 62596 350 531,018 359,332 1990.002 67.7
SPJST TX 57436 472,947 352,717 1320.002 74.6
WMI Mut Ins Co UT 68420 464,888 374,823 1550.002 80.6
Union Labor Life Ins Co MD 69744 781 440,508 788,961 2320.002 179.1
Ability Ins Co NE 71471 4824 396,459 267,604 990.001 67.5
American Family Life Assur Co of NY NY 60526 370 384,517 224,183 1370.001 58.3
Medica Hlth Plans MN 52626 1552 382,323 209,751 760.001 54.9
Southwest Serv Life Ins Co TX 82430 1339 361,928 177,767 750.001 49.1
Inter Cnty Hlth Plan Inc PA 53252 936 342,975 330,023 1,0240.001 96.2
Compcare Hlth Serv Ins Corp WI 95693 671 340,202 217,494 780.001 63.9
Jackson Natl Life Ins Co MI 65056 918 333,686 347,502 1830.001 104.1
American Family Ins Co WI 10386 473 325,894 235,522 870.001 72.3
American Income Life Ins Co IN 60577 290 325,016 161,753 730.001 49.8
John Alden Life Ins Co WI 65080 19 323,124 305,940 1020.001 94.7
Sanford Hlth Plan of MN MN 95725 1246 322,423 323,634 1200.001 100.4
HMO dba Blue Plus MN 95649 461 266,548 232,664 870.001 87.3
Time Ins Co WI 69477 19 261,842 238,091 930.001 90.9
Jefferson Life Ins Co TX 94790 249,453 250,454 1220.001 100.4
EPIC Life Ins Co WI 64149 68 221,082 170,368 1030.001 77.1
Allianz Life Ins Co Of N Amer MN 90611 761 206,492 264,611 1030.001 128.1
WPS Hlth Plan Inc WI 10159 68 200,069 64,274 350.001 32.1
Hawaii Medical Serv Assn HI 49948 180,068 146,798 670.001 81.5
21st Century Premier Ins Co PA 20796 69 178,479 200,897 930.001 112.6
Upmc Hlth Benefits Inc PA 11018 1324 170,615 21,592 920.001 12.7
Polish Falcons Of Amer PA 56820 169,648 110,436 1650.001 65.1
Liberty Bankers Life Ins Co OK 68543 3436 155,223 111,057 5280.001 71.5
Prudential Ins Co Of Amer NJ 68241 304 146,301 20,435 490.001 14.0
UCare MN MN 52629 4380 140,276 110,701 440.000 78.9
Summa Ins Co Inc OH 10649 3259 132,302 119,550 490.000 90.4
United Farm Family Life Ins Co IN 69892 542 116,151 138,481 600.000 119.2
Trustmark Ins Co IL 61425 276 104,624 -28,124 300.000 -26.9
Health First Ins Inc FL 14140 4740 104,370 86,706 350.000 83.1
CAUTION: The information contained on this page is unaudited and not a complete analysis nor is it an expression of opinion on any insurer. This page may contain inadvertent errors.
© 2017 National Association of Insurance Commissioners 120
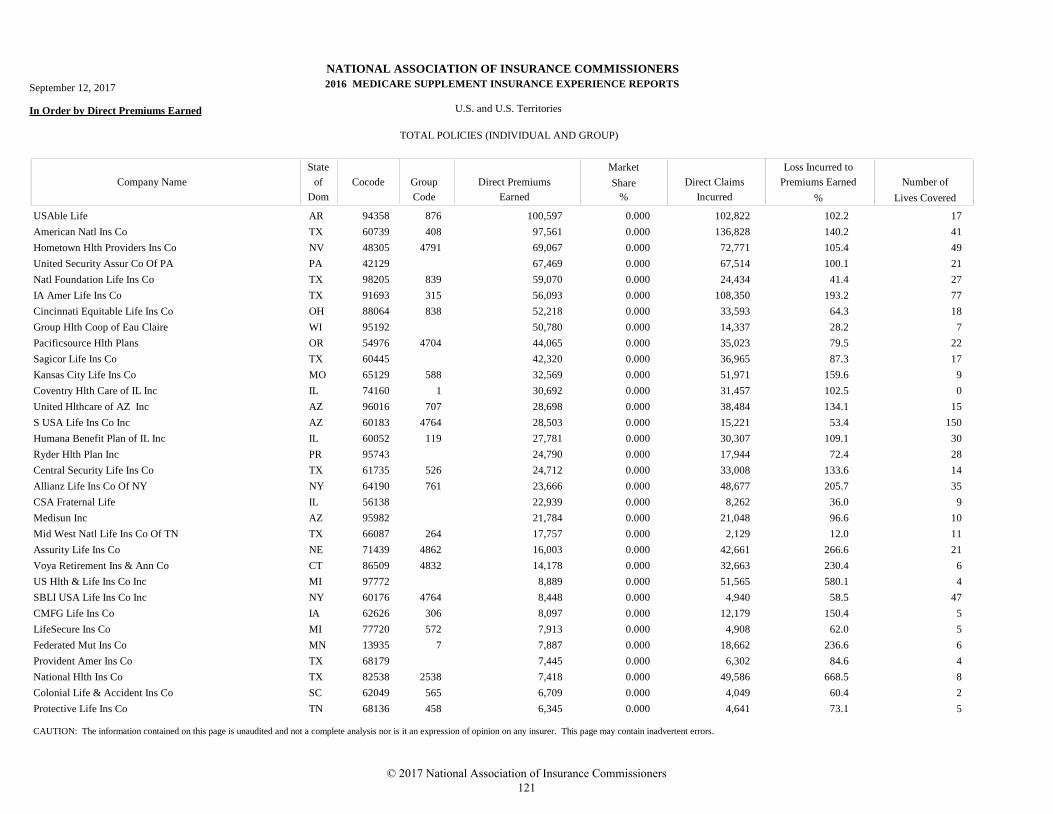
NATIONAL ASSOCIATION OF INSURANCE COMMISSIONERS
MEDICARE SUPPLEMENT INSURANCE EXPERIENCE REPORTS
In Order by Direct Premiums Earned U.S. and U.S. Territories
TOTAL POLICIES (INDIVIDUAL AND GROUP)
Market
Direct Claims
Incurred
Loss Incurred to
Premiums Earned Number of
Lives Covered
Direct Premiums
Earned
Company Name
State
Dom
Cocode Group
Code
of Share
% %
September 12, 2017 2016
USAble Life AR 94358 876 100,597 102,822 170.000 102.2
American Natl Ins Co TX 60739 408 97,561 136,828 410.000 140.2
Hometown Hlth Providers Ins Co NV 48305 4791 69,067 72,771 490.000 105.4
United Security Assur Co Of PA PA 42129 67,469 67,514 210.000 100.1
Natl Foundation Life Ins Co TX 98205 839 59,070 24,434 270.000 41.4
IA Amer Life Ins Co TX 91693 315 56,093 108,350 770.000 193.2
Cincinnati Equitable Life Ins Co OH 88064 838 52,218 33,593 180.000 64.3
Group Hlth Coop of Eau Claire WI 95192 50,780 14,337 70.000 28.2
Pacificsource Hlth Plans OR 54976 4704 44,065 35,023 220.000 79.5
Sagicor Life Ins Co TX 60445 42,320 36,965 170.000 87.3
Kansas City Life Ins Co MO 65129 588 32,569 51,971 90.000 159.6
Coventry Hlth Care of IL Inc IL 74160 1 30,692 31,457 00.000 102.5
United Hlthcare of AZ Inc AZ 96016 707 28,698 38,484 150.000 134.1
S USA Life Ins Co Inc AZ 60183 4764 28,503 15,221 1500.000 53.4
Humana Benefit Plan of IL Inc IL 60052 119 27,781 30,307 300.000 109.1
Ryder Hlth Plan Inc PR 95743 24,790 17,944 280.000 72.4
Central Security Life Ins Co TX 61735 526 24,712 33,008 140.000 133.6
Allianz Life Ins Co Of NY NY 64190 761 23,666 48,677 350.000 205.7
CSA Fraternal Life IL 56138 22,939 8,262 90.000 36.0
Medisun Inc AZ 95982 21,784 21,048 100.000 96.6
Mid West Natl Life Ins Co Of TN TX 66087 264 17,757 2,129 110.000 12.0
Assurity Life Ins Co NE 71439 4862 16,003 42,661 210.000 266.6
Voya Retirement Ins & Ann Co CT 86509 4832 14,178 32,663 60.000 230.4
US Hlth & Life Ins Co Inc MI 97772 8,889 51,565 40.000 580.1
SBLI USA Life Ins Co Inc NY 60176 4764 8,448 4,940 470.000 58.5
CMFG Life Ins Co IA 62626 306 8,097 12,179 50.000 150.4
LifeSecure Ins Co MI 77720 572 7,913 4,908 50.000 62.0
Federated Mut Ins Co MN 13935 7 7,887 18,662 60.000 236.6
Provident Amer Ins Co TX 68179 7,445 6,302 40.000 84.6
National Hlth Ins Co TX 82538 2538 7,418 49,586 80.000 668.5
Colonial Life & Accident Ins Co SC 62049 565 6,709 4,049 20.000 60.4
Protective Life Ins Co TN 68136 458 6,345 4,641 50.000 73.1
CAUTION: The information contained on this page is unaudited and not a complete analysis nor is it an expression of opinion on any insurer. This page may contain inadvertent errors.
© 2017 National Association of Insurance Commissioners 121
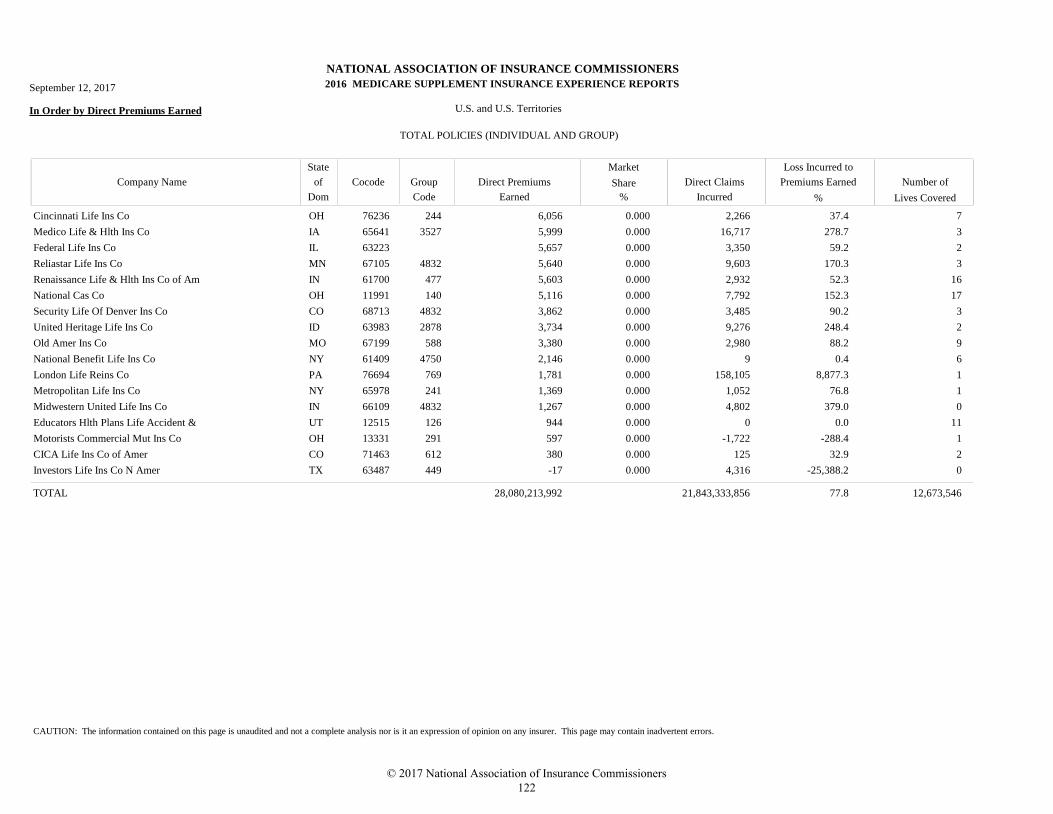
NATIONAL ASSOCIATION OF INSURANCE COMMISSIONERS
MEDICARE SUPPLEMENT INSURANCE EXPERIENCE REPORTS
In Order by Direct Premiums Earned U.S. and U.S. Territories
TOTAL POLICIES (INDIVIDUAL AND GROUP)
Market
Direct Claims
Incurred
Loss Incurred to
Premiums Earned Number of
Lives Covered
Direct Premiums
Earned
Company Name
State
Dom
Cocode Group
Code
of Share
% %
September 12, 2017 2016
Cincinnati Life Ins Co OH 76236 244 6,056 2,266 70.000 37.4
Medico Life & Hlth Ins Co IA 65641 3527 5,999 16,717 30.000 278.7
Federal Life Ins Co IL 63223 5,657 3,350 20.000 59.2
Reliastar Life Ins Co MN 67105 4832 5,640 9,603 30.000 170.3
Renaissance Life & Hlth Ins Co of Am IN 61700 477 5,603 2,932 160.000 52.3
National Cas Co OH 11991 140 5,116 7,792 170.000 152.3
Security Life Of Denver Ins Co CO 68713 4832 3,862 3,485 30.000 90.2
United Heritage Life Ins Co ID 63983 2878 3,734 9,276 20.000 248.4
Old Amer Ins Co MO 67199 588 3,380 2,980 90.000 88.2
National Benefit Life Ins Co NY 61409 4750 2,146 9 60.000 0.4
London Life Reins Co PA 76694 769 1,781 158,105 10.000 8,877.3
Metropolitan Life Ins Co NY 65978 241 1,369 1,052 10.000 76.8
Midwestern United Life Ins Co IN 66109 4832 1,267 4,802 00.000 379.0
Educators Hlth Plans Life Accident & UT 12515 126 944 0 110.000 0.0
Motorists Commercial Mut Ins Co OH 13331 291 597 -1,722 10.000 -288.4
CICA Life Ins Co of Amer CO 71463 612 380 125 20.000 32.9
Investors Life Ins Co N Amer TX 63487 449 -17 4,316 00.000 -25,388.2
28,080,213,992 21,843,333,856 12,673,546TOTAL 77.8
CAUTION: The information contained on this page is unaudited and not a complete analysis nor is it an expression of opinion on any insurer. This page may contain inadvertent errors.
© 2017 National Association of Insurance Commissioners 122
TOTAL POLICIES (INDIVIDUAL AND GROUP) BY COMPANY NAME
© 2017 National Association of Insurance Commissioners 123

© 2017 National Association of Insurance Commissioners 124
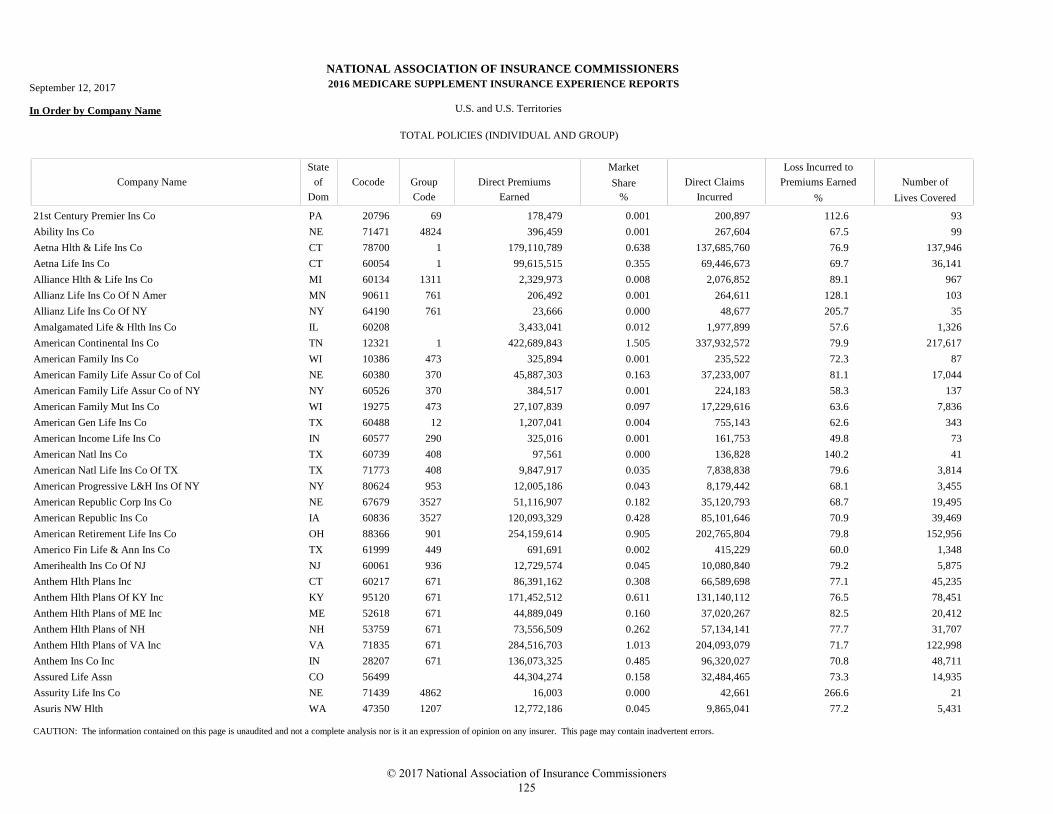
NATIONAL ASSOCIATION OF INSURANCE COMMISSIONERS
MEDICARE SUPPLEMENT INSURANCE EXPERIENCE REPORTS
In Order by Company Name U.S. and U.S. Territories
TOTAL POLICIES (INDIVIDUAL AND GROUP)
Market
Direct Claims
Incurred
Loss Incurred to
Premiums Earned Number of
Lives Covered
Direct Premiums
Earned
Company Name
State
Dom
Cocode Group
Code
of Share
% %
September 12, 2017 2016
21st Century Premier Ins Co PA 20796 69 178,479 200,897 930.001 112.6
Ability Ins Co NE 71471 4824 396,459 267,604 990.001 67.5
Aetna Hlth & Life Ins Co CT 78700 1 179,110,789 137,685,760 137,9460.638 76.9
Aetna Life Ins Co CT 60054 1 99,615,515 69,446,673 36,1410.355 69.7
Alliance Hlth & Life Ins Co MI 60134 1311 2,329,973 2,076,852 9670.008 89.1
Allianz Life Ins Co Of N Amer MN 90611 761 206,492 264,611 1030.001 128.1
Allianz Life Ins Co Of NY NY 64190 761 23,666 48,677 350.000 205.7
Amalgamated Life & Hlth Ins Co IL 60208 3,433,041 1,977,899 1,3260.012 57.6
American Continental Ins Co TN 12321 1 422,689,843 337,932,572 217,6171.505 79.9
American Family Ins Co WI 10386 473 325,894 235,522 870.001 72.3
American Family Life Assur Co of Col NE 60380 370 45,887,303 37,233,007 17,0440.163 81.1
American Family Life Assur Co of NY NY 60526 370 384,517 224,183 1370.001 58.3
American Family Mut Ins Co WI 19275 473 27,107,839 17,229,616 7,8360.097 63.6
American Gen Life Ins Co TX 60488 12 1,207,041 755,143 3430.004 62.6
American Income Life Ins Co IN 60577 290 325,016 161,753 730.001 49.8
American Natl Ins Co TX 60739 408 97,561 136,828 410.000 140.2
American Natl Life Ins Co Of TX TX 71773 408 9,847,917 7,838,838 3,8140.035 79.6
American Progressive L&H Ins Of NY NY 80624 953 12,005,186 8,179,442 3,4550.043 68.1
American Republic Corp Ins Co NE 67679 3527 51,116,907 35,120,793 19,4950.182 68.7
American Republic Ins Co IA 60836 3527 120,093,329 85,101,646 39,4690.428 70.9
American Retirement Life Ins Co OH 88366 901 254,159,614 202,765,804 152,9560.905 79.8
Americo Fin Life & Ann Ins Co TX 61999 449 691,691 415,229 1,3480.002 60.0
Amerihealth Ins Co Of NJ NJ 60061 936 12,729,574 10,080,840 5,8750.045 79.2
Anthem Hlth Plans Inc CT 60217 671 86,391,162 66,589,698 45,2350.308 77.1
Anthem Hlth Plans Of KY Inc KY 95120 671 171,452,512 131,140,112 78,4510.611 76.5
Anthem Hlth Plans of ME Inc ME 52618 671 44,889,049 37,020,267 20,4120.160 82.5
Anthem Hlth Plans of NH NH 53759 671 73,556,509 57,134,141 31,7070.262 77.7
Anthem Hlth Plans of VA Inc VA 71835 671 284,516,703 204,093,079 122,9981.013 71.7
Anthem Ins Co Inc IN 28207 671 136,073,325 96,320,027 48,7110.485 70.8
Assured Life Assn CO 56499 44,304,274 32,484,465 14,9350.158 73.3
Assurity Life Ins Co NE 71439 4862 16,003 42,661 210.000 266.6
Asuris NW Hlth WA 47350 1207 12,772,186 9,865,041 5,4310.045 77.2
CAUTION: The information contained on this page is unaudited and not a complete analysis nor is it an expression of opinion on any insurer. This page may contain inadvertent errors.
© 2017 National Association of Insurance Commissioners 125
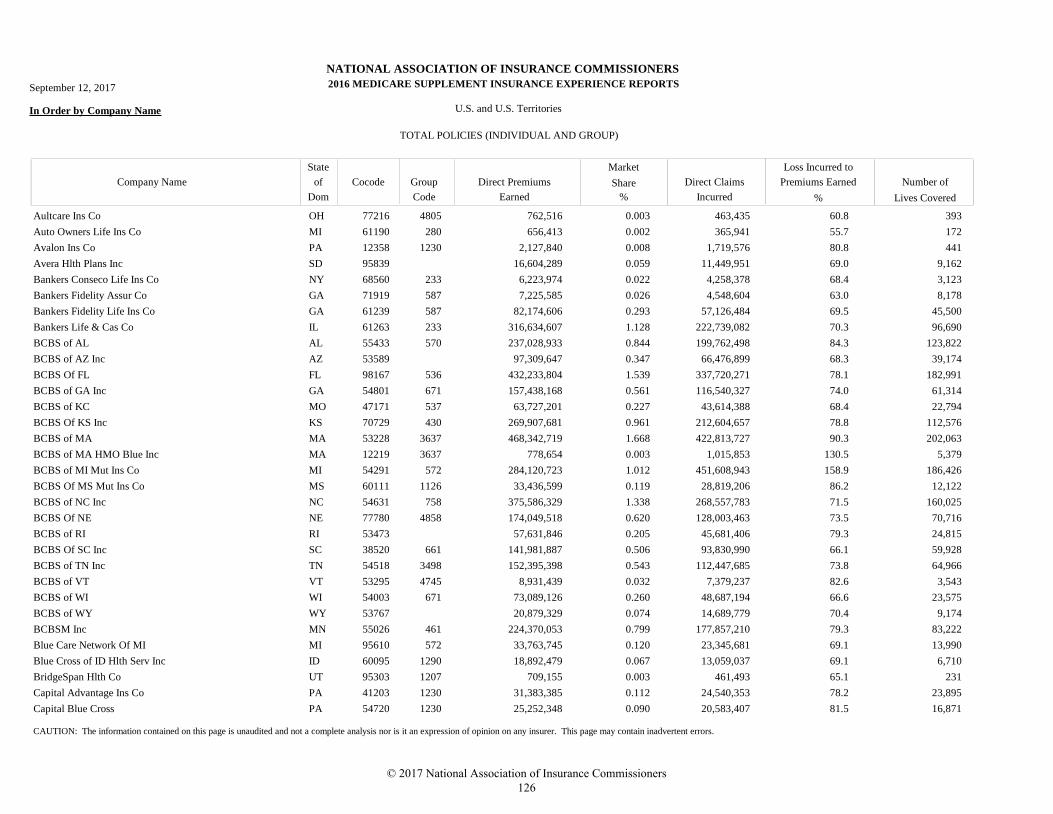
NATIONAL ASSOCIATION OF INSURANCE COMMISSIONERS
MEDICARE SUPPLEMENT INSURANCE EXPERIENCE REPORTS
In Order by Company Name U.S. and U.S. Territories
TOTAL POLICIES (INDIVIDUAL AND GROUP)
Market
Direct Claims
Incurred
Loss Incurred to
Premiums Earned Number of
Lives Covered
Direct Premiums
Earned
Company Name
State
Dom
Cocode Group
Code
of Share
% %
September 12, 2017 2016
Aultcare Ins Co OH 77216 4805 762,516 463,435 3930.003 60.8
Auto Owners Life Ins Co MI 61190 280 656,413 365,941 1720.002 55.7
Avalon Ins Co PA 12358 1230 2,127,840 1,719,576 4410.008 80.8
Avera Hlth Plans Inc SD 95839 16,604,289 11,449,951 9,1620.059 69.0
Bankers Conseco Life Ins Co NY 68560 233 6,223,974 4,258,378 3,1230.022 68.4
Bankers Fidelity Assur Co GA 71919 587 7,225,585 4,548,604 8,1780.026 63.0
Bankers Fidelity Life Ins Co GA 61239 587 82,174,606 57,126,484 45,5000.293 69.5
Bankers Life & Cas Co IL 61263 233 316,634,607 222,739,082 96,6901.128 70.3
BCBS of AL AL 55433 570 237,028,933 199,762,498 123,8220.844 84.3
BCBS of AZ Inc AZ 53589 97,309,647 66,476,899 39,1740.347 68.3
BCBS Of FL FL 98167 536 432,233,804 337,720,271 182,9911.539 78.1
BCBS of GA Inc GA 54801 671 157,438,168 116,540,327 61,3140.561 74.0
BCBS of KC MO 47171 537 63,727,201 43,614,388 22,7940.227 68.4
BCBS Of KS Inc KS 70729 430 269,907,681 212,604,657 112,5760.961 78.8
BCBS of MA MA 53228 3637 468,342,719 422,813,727 202,0631.668 90.3
BCBS of MA HMO Blue Inc MA 12219 3637 778,654 1,015,853 5,3790.003 130.5
BCBS of MI Mut Ins Co MI 54291 572 284,120,723 451,608,943 186,4261.012 158.9
BCBS Of MS Mut Ins Co MS 60111 1126 33,436,599 28,819,206 12,1220.119 86.2
BCBS of NC Inc NC 54631 758 375,586,329 268,557,783 160,0251.338 71.5
BCBS Of NE NE 77780 4858 174,049,518 128,003,463 70,7160.620 73.5
BCBS of RI RI 53473 57,631,846 45,681,406 24,8150.205 79.3
BCBS Of SC Inc SC 38520 661 141,981,887 93,830,990 59,9280.506 66.1
BCBS of TN Inc TN 54518 3498 152,395,398 112,447,685 64,9660.543 73.8
BCBS of VT VT 53295 4745 8,931,439 7,379,237 3,5430.032 82.6
BCBS of WI WI 54003 671 73,089,126 48,687,194 23,5750.260 66.6
BCBS of WY WY 53767 20,879,329 14,689,779 9,1740.074 70.4
BCBSM Inc MN 55026 461 224,370,053 177,857,210 83,2220.799 79.3
Blue Care Network Of MI MI 95610 572 33,763,745 23,345,681 13,9900.120 69.1
Blue Cross of ID Hlth Serv Inc ID 60095 1290 18,892,479 13,059,037 6,7100.067 69.1
BridgeSpan Hlth Co UT 95303 1207 709,155 461,493 2310.003 65.1
Capital Advantage Ins Co PA 41203 1230 31,383,385 24,540,353 23,8950.112 78.2
Capital Blue Cross PA 54720 1230 25,252,348 20,583,407 16,8710.090 81.5
CAUTION: The information contained on this page is unaudited and not a complete analysis nor is it an expression of opinion on any insurer. This page may contain inadvertent errors.
© 2017 National Association of Insurance Commissioners 126
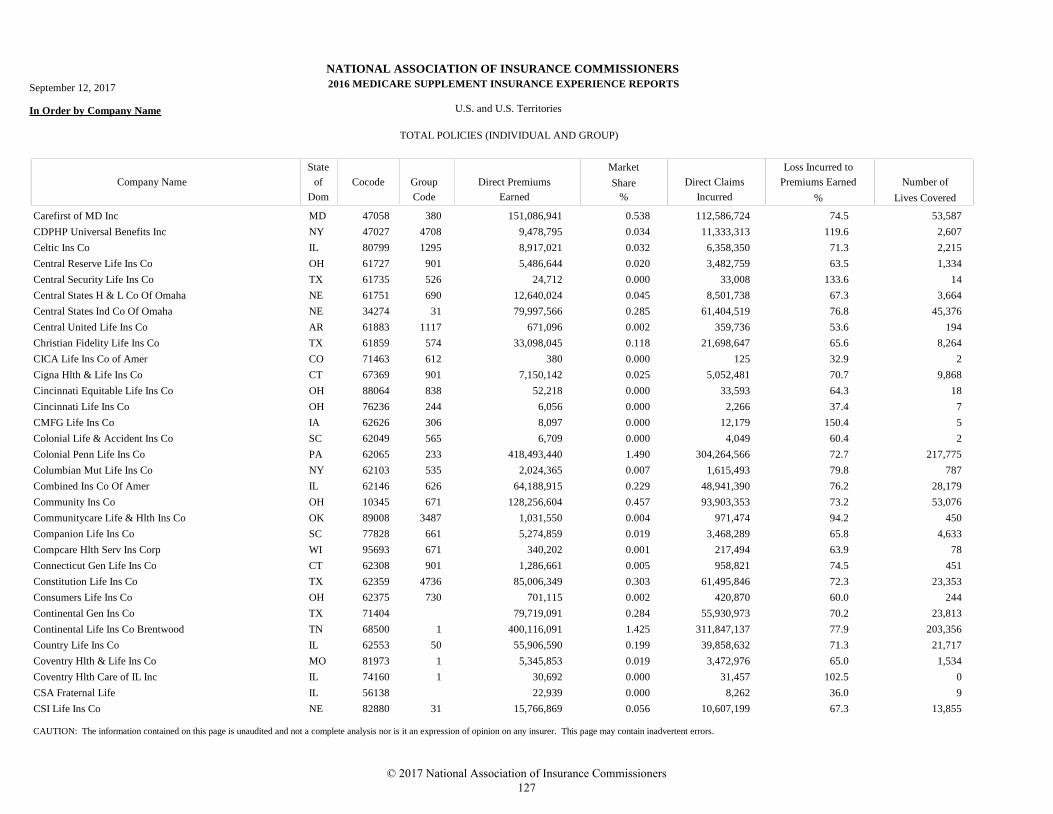
NATIONAL ASSOCIATION OF INSURANCE COMMISSIONERS
MEDICARE SUPPLEMENT INSURANCE EXPERIENCE REPORTS
In Order by Company Name U.S. and U.S. Territories
TOTAL POLICIES (INDIVIDUAL AND GROUP)
Market
Direct Claims
Incurred
Loss Incurred to
Premiums Earned Number of
Lives Covered
Direct Premiums
Earned
Company Name
State
Dom
Cocode Group
Code
of Share
% %
September 12, 2017 2016
Carefirst of MD Inc MD 47058 380 151,086,941 112,586,724 53,5870.538 74.5
CDPHP Universal Benefits Inc NY 47027 4708 9,478,795 11,333,313 2,6070.034 119.6
Celtic Ins Co IL 80799 1295 8,917,021 6,358,350 2,2150.032 71.3
Central Reserve Life Ins Co OH 61727 901 5,486,644 3,482,759 1,3340.020 63.5
Central Security Life Ins Co TX 61735 526 24,712 33,008 140.000 133.6
Central States H & L Co Of Omaha NE 61751 690 12,640,024 8,501,738 3,6640.045 67.3
Central States Ind Co Of Omaha NE 34274 31 79,997,566 61,404,519 45,3760.285 76.8
Central United Life Ins Co AR 61883 1117 671,096 359,736 1940.002 53.6
Christian Fidelity Life Ins Co TX 61859 574 33,098,045 21,698,647 8,2640.118 65.6
CICA Life Ins Co of Amer CO 71463 612 380 125 20.000 32.9
Cigna Hlth & Life Ins Co CT 67369 901 7,150,142 5,052,481 9,8680.025 70.7
Cincinnati Equitable Life Ins Co OH 88064 838 52,218 33,593 180.000 64.3
Cincinnati Life Ins Co OH 76236 244 6,056 2,266 70.000 37.4
CMFG Life Ins Co IA 62626 306 8,097 12,179 50.000 150.4
Colonial Life & Accident Ins Co SC 62049 565 6,709 4,049 20.000 60.4
Colonial Penn Life Ins Co PA 62065 233 418,493,440 304,264,566 217,7751.490 72.7
Columbian Mut Life Ins Co NY 62103 535 2,024,365 1,615,493 7870.007 79.8
Combined Ins Co Of Amer IL 62146 626 64,188,915 48,941,390 28,1790.229 76.2
Community Ins Co OH 10345 671 128,256,604 93,903,353 53,0760.457 73.2
Communitycare Life & Hlth Ins Co OK 89008 3487 1,031,550 971,474 4500.004 94.2
Companion Life Ins Co SC 77828 661 5,274,859 3,468,289 4,6330.019 65.8
Compcare Hlth Serv Ins Corp WI 95693 671 340,202 217,494 780.001 63.9
Connecticut Gen Life Ins Co CT 62308 901 1,286,661 958,821 4510.005 74.5
Constitution Life Ins Co TX 62359 4736 85,006,349 61,495,846 23,3530.303 72.3
Consumers Life Ins Co OH 62375 730 701,115 420,870 2440.002 60.0
Continental Gen Ins Co TX 71404 79,719,091 55,930,973 23,8130.284 70.2
Continental Life Ins Co Brentwood TN 68500 1 400,116,091 311,847,137 203,3561.425 77.9
Country Life Ins Co IL 62553 50 55,906,590 39,858,632 21,7170.199 71.3
Coventry Hlth & Life Ins Co MO 81973 1 5,345,853 3,472,976 1,5340.019 65.0
Coventry Hlth Care of IL Inc IL 74160 1 30,692 31,457 00.000 102.5
CSA Fraternal Life IL 56138 22,939 8,262 90.000 36.0
CSI Life Ins Co NE 82880 31 15,766,869 10,607,199 13,8550.056 67.3
CAUTION: The information contained on this page is unaudited and not a complete analysis nor is it an expression of opinion on any insurer. This page may contain inadvertent errors.
© 2017 National Association of Insurance Commissioners 127
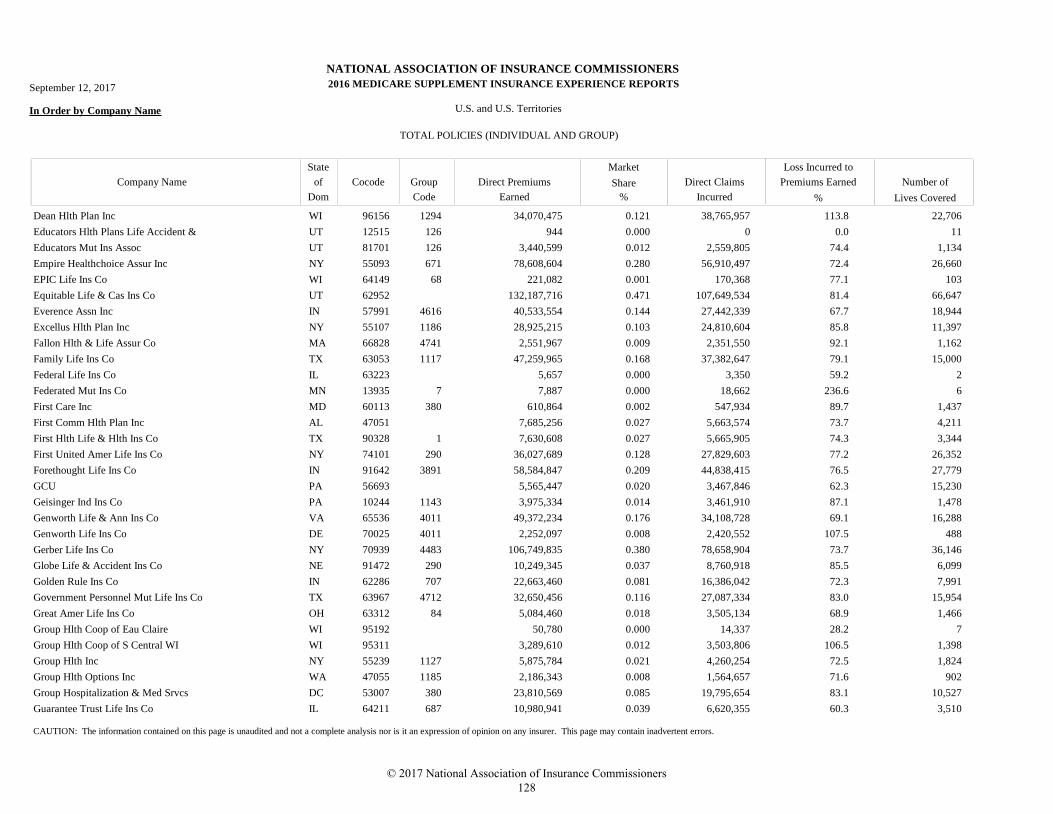
NATIONAL ASSOCIATION OF INSURANCE COMMISSIONERS
MEDICARE SUPPLEMENT INSURANCE EXPERIENCE REPORTS
In Order by Company Name U.S. and U.S. Territories
TOTAL POLICIES (INDIVIDUAL AND GROUP)
Market
Direct Claims
Incurred
Loss Incurred to
Premiums Earned Number of
Lives Covered
Direct Premiums
Earned
Company Name
State
Dom
Cocode Group
Code
of Share
% %
September 12, 2017 2016
Dean Hlth Plan Inc WI 96156 1294 34,070,475 38,765,957 22,7060.121 113.8
Educators Hlth Plans Life Accident & UT 12515 126 944 0 110.000 0.0
Educators Mut Ins Assoc UT 81701 126 3,440,599 2,559,805 1,1340.012 74.4
Empire Healthchoice Assur Inc NY 55093 671 78,608,604 56,910,497 26,6600.280 72.4
EPIC Life Ins Co WI 64149 68 221,082 170,368 1030.001 77.1
Equitable Life & Cas Ins Co UT 62952 132,187,716 107,649,534 66,6470.471 81.4
Everence Assn Inc IN 57991 4616 40,533,554 27,442,339 18,9440.144 67.7
Excellus Hlth Plan Inc NY 55107 1186 28,925,215 24,810,604 11,3970.103 85.8
Fallon Hlth & Life Assur Co MA 66828 4741 2,551,967 2,351,550 1,1620.009 92.1
Family Life Ins Co TX 63053 1117 47,259,965 37,382,647 15,0000.168 79.1
Federal Life Ins Co IL 63223 5,657 3,350 20.000 59.2
Federated Mut Ins Co MN 13935 7 7,887 18,662 60.000 236.6
First Care Inc MD 60113 380 610,864 547,934 1,4370.002 89.7
First Comm Hlth Plan Inc AL 47051 7,685,256 5,663,574 4,2110.027 73.7
First Hlth Life & Hlth Ins Co TX 90328 1 7,630,608 5,665,905 3,3440.027 74.3
First United Amer Life Ins Co NY 74101 290 36,027,689 27,829,603 26,3520.128 77.2
Forethought Life Ins Co IN 91642 3891 58,584,847 44,838,415 27,7790.209 76.5
GCU PA 56693 5,565,447 3,467,846 15,2300.020 62.3
Geisinger Ind Ins Co PA 10244 1143 3,975,334 3,461,910 1,4780.014 87.1
Genworth Life & Ann Ins Co VA 65536 4011 49,372,234 34,108,728 16,2880.176 69.1
Genworth Life Ins Co DE 70025 4011 2,252,097 2,420,552 4880.008 107.5
Gerber Life Ins Co NY 70939 4483 106,749,835 78,658,904 36,1460.380 73.7
Globe Life & Accident Ins Co NE 91472 290 10,249,345 8,760,918 6,0990.037 85.5
Golden Rule Ins Co IN 62286 707 22,663,460 16,386,042 7,9910.081 72.3
Government Personnel Mut Life Ins Co TX 63967 4712 32,650,456 27,087,334 15,9540.116 83.0
Great Amer Life Ins Co OH 63312 84 5,084,460 3,505,134 1,4660.018 68.9
Group Hlth Coop of Eau Claire WI 95192 50,780 14,337 70.000 28.2
Group Hlth Coop of S Central WI WI 95311 3,289,610 3,503,806 1,3980.012 106.5
Group Hlth Inc NY 55239 1127 5,875,784 4,260,254 1,8240.021 72.5
Group Hlth Options Inc WA 47055 1185 2,186,343 1,564,657 9020.008 71.6
Group Hospitalization & Med Srvcs DC 53007 380 23,810,569 19,795,654 10,5270.085 83.1
Guarantee Trust Life Ins Co IL 64211 687 10,980,941 6,620,355 3,5100.039 60.3
CAUTION: The information contained on this page is unaudited and not a complete analysis nor is it an expression of opinion on any insurer. This page may contain inadvertent errors.
© 2017 National Association of Insurance Commissioners 128
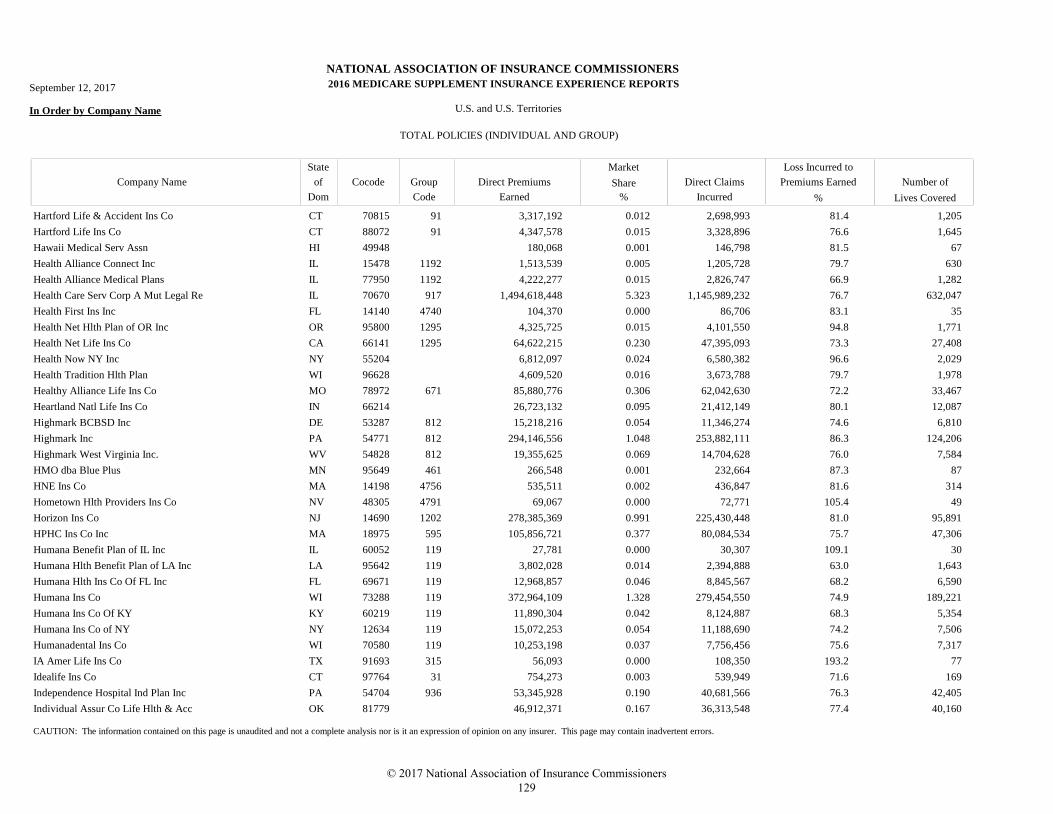
NATIONAL ASSOCIATION OF INSURANCE COMMISSIONERS
MEDICARE SUPPLEMENT INSURANCE EXPERIENCE REPORTS
In Order by Company Name U.S. and U.S. Territories
TOTAL POLICIES (INDIVIDUAL AND GROUP)
Market
Direct Claims
Incurred
Loss Incurred to
Premiums Earned Number of
Lives Covered
Direct Premiums
Earned
Company Name
State
Dom
Cocode Group
Code
of Share
% %
September 12, 2017 2016
Hartford Life & Accident Ins Co CT 70815 91 3,317,192 2,698,993 1,2050.012 81.4
Hartford Life Ins Co CT 88072 91 4,347,578 3,328,896 1,6450.015 76.6
Hawaii Medical Serv Assn HI 49948 180,068 146,798 670.001 81.5
Health Alliance Connect Inc IL 15478 1192 1,513,539 1,205,728 6300.005 79.7
Health Alliance Medical Plans IL 77950 1192 4,222,277 2,826,747 1,2820.015 66.9
Health Care Serv Corp A Mut Legal Re IL 70670 917 1,494,618,448 1,145,989,232 632,0475.323 76.7
Health First Ins Inc FL 14140 4740 104,370 86,706 350.000 83.1
Health Net Hlth Plan of OR Inc OR 95800 1295 4,325,725 4,101,550 1,7710.015 94.8
Health Net Life Ins Co CA 66141 1295 64,622,215 47,395,093 27,4080.230 73.3
Health Now NY Inc NY 55204 6,812,097 6,580,382 2,0290.024 96.6
Health Tradition Hlth Plan WI 96628 4,609,520 3,673,788 1,9780.016 79.7
Healthy Alliance Life Ins Co MO 78972 671 85,880,776 62,042,630 33,4670.306 72.2
Heartland Natl Life Ins Co IN 66214 26,723,132 21,412,149 12,0870.095 80.1
Highmark BCBSD Inc DE 53287 812 15,218,216 11,346,274 6,8100.054 74.6
Highmark Inc PA 54771 812 294,146,556 253,882,111 124,2061.048 86.3
Highmark West Virginia Inc. WV 54828 812 19,355,625 14,704,628 7,5840.069 76.0
HMO dba Blue Plus MN 95649 461 266,548 232,664 870.001 87.3
HNE Ins Co MA 14198 4756 535,511 436,847 3140.002 81.6
Hometown Hlth Providers Ins Co NV 48305 4791 69,067 72,771 490.000 105.4
Horizon Ins Co NJ 14690 1202 278,385,369 225,430,448 95,8910.991 81.0
HPHC Ins Co Inc MA 18975 595 105,856,721 80,084,534 47,3060.377 75.7
Humana Benefit Plan of IL Inc IL 60052 119 27,781 30,307 300.000 109.1
Humana Hlth Benefit Plan of LA Inc LA 95642 119 3,802,028 2,394,888 1,6430.014 63.0
Humana Hlth Ins Co Of FL Inc FL 69671 119 12,968,857 8,845,567 6,5900.046 68.2
Humana Ins Co WI 73288 119 372,964,109 279,454,550 189,2211.328 74.9
Humana Ins Co Of KY KY 60219 119 11,890,304 8,124,887 5,3540.042 68.3
Humana Ins Co of NY NY 12634 119 15,072,253 11,188,690 7,5060.054 74.2
Humanadental Ins Co WI 70580 119 10,253,198 7,756,456 7,3170.037 75.6
IA Amer Life Ins Co TX 91693 315 56,093 108,350 770.000 193.2
Idealife Ins Co CT 97764 31 754,273 539,949 1690.003 71.6
Independence Hospital Ind Plan Inc PA 54704 936 53,345,928 40,681,566 42,4050.190 76.3
Individual Assur Co Life Hlth & Acc OK 81779 46,912,371 36,313,548 40,1600.167 77.4
CAUTION: The information contained on this page is unaudited and not a complete analysis nor is it an expression of opinion on any insurer. This page may contain inadvertent errors.
© 2017 National Association of Insurance Commissioners 129
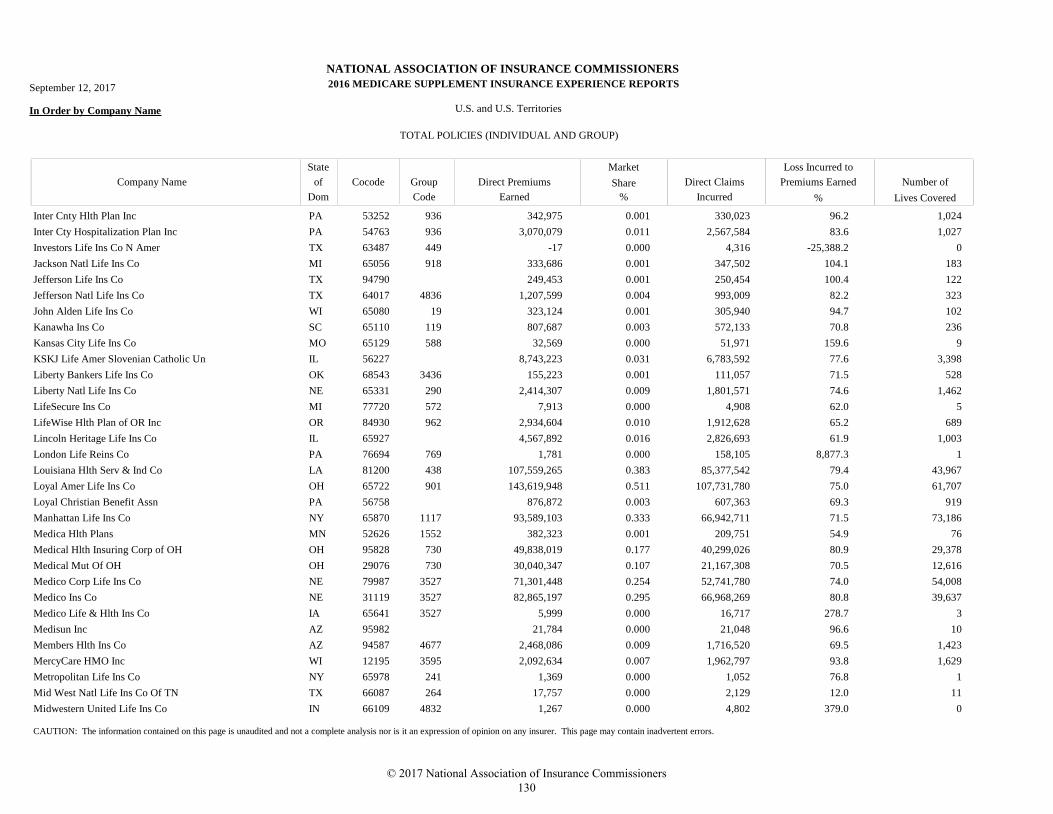
NATIONAL ASSOCIATION OF INSURANCE COMMISSIONERS
MEDICARE SUPPLEMENT INSURANCE EXPERIENCE REPORTS
In Order by Company Name U.S. and U.S. Territories
TOTAL POLICIES (INDIVIDUAL AND GROUP)
Market
Direct Claims
Incurred
Loss Incurred to
Premiums Earned Number of
Lives Covered
Direct Premiums
Earned
Company Name
State
Dom
Cocode Group
Code
of Share
% %
September 12, 2017 2016
Inter Cnty Hlth Plan Inc PA 53252 936 342,975 330,023 1,0240.001 96.2
Inter Cty Hospitalization Plan Inc PA 54763 936 3,070,079 2,567,584 1,0270.011 83.6
Investors Life Ins Co N Amer TX 63487 449 -17 4,316 00.000 -25,388.2
Jackson Natl Life Ins Co MI 65056 918 333,686 347,502 1830.001 104.1
Jefferson Life Ins Co TX 94790 249,453 250,454 1220.001 100.4
Jefferson Natl Life Ins Co TX 64017 4836 1,207,599 993,009 3230.004 82.2
John Alden Life Ins Co WI 65080 19 323,124 305,940 1020.001 94.7
Kanawha Ins Co SC 65110 119 807,687 572,133 2360.003 70.8
Kansas City Life Ins Co MO 65129 588 32,569 51,971 90.000 159.6
KSKJ Life Amer Slovenian Catholic Un IL 56227 8,743,223 6,783,592 3,3980.031 77.6
Liberty Bankers Life Ins Co OK 68543 3436 155,223 111,057 5280.001 71.5
Liberty Natl Life Ins Co NE 65331 290 2,414,307 1,801,571 1,4620.009 74.6
LifeSecure Ins Co MI 77720 572 7,913 4,908 50.000 62.0
LifeWise Hlth Plan of OR Inc OR 84930 962 2,934,604 1,912,628 6890.010 65.2
Lincoln Heritage Life Ins Co IL 65927 4,567,892 2,826,693 1,0030.016 61.9
London Life Reins Co PA 76694 769 1,781 158,105 10.000 8,877.3
Louisiana Hlth Serv & Ind Co LA 81200 438 107,559,265 85,377,542 43,9670.383 79.4
Loyal Amer Life Ins Co OH 65722 901 143,619,948 107,731,780 61,7070.511 75.0
Loyal Christian Benefit Assn PA 56758 876,872 607,363 9190.003 69.3
Manhattan Life Ins Co NY 65870 1117 93,589,103 66,942,711 73,1860.333 71.5
Medica Hlth Plans MN 52626 1552 382,323 209,751 760.001 54.9
Medical Hlth Insuring Corp of OH OH 95828 730 49,838,019 40,299,026 29,3780.177 80.9
Medical Mut Of OH OH 29076 730 30,040,347 21,167,308 12,6160.107 70.5
Medico Corp Life Ins Co NE 79987 3527 71,301,448 52,741,780 54,0080.254 74.0
Medico Ins Co NE 31119 3527 82,865,197 66,968,269 39,6370.295 80.8
Medico Life & Hlth Ins Co IA 65641 3527 5,999 16,717 30.000 278.7
Medisun Inc AZ 95982 21,784 21,048 100.000 96.6
Members Hlth Ins Co AZ 94587 4677 2,468,086 1,716,520 1,4230.009 69.5
MercyCare HMO Inc WI 12195 3595 2,092,634 1,962,797 1,6290.007 93.8
Metropolitan Life Ins Co NY 65978 241 1,369 1,052 10.000 76.8
Mid West Natl Life Ins Co Of TN TX 66087 264 17,757 2,129 110.000 12.0
Midwestern United Life Ins Co IN 66109 4832 1,267 4,802 00.000 379.0
CAUTION: The information contained on this page is unaudited and not a complete analysis nor is it an expression of opinion on any insurer. This page may contain inadvertent errors.
© 2017 National Association of Insurance Commissioners 130
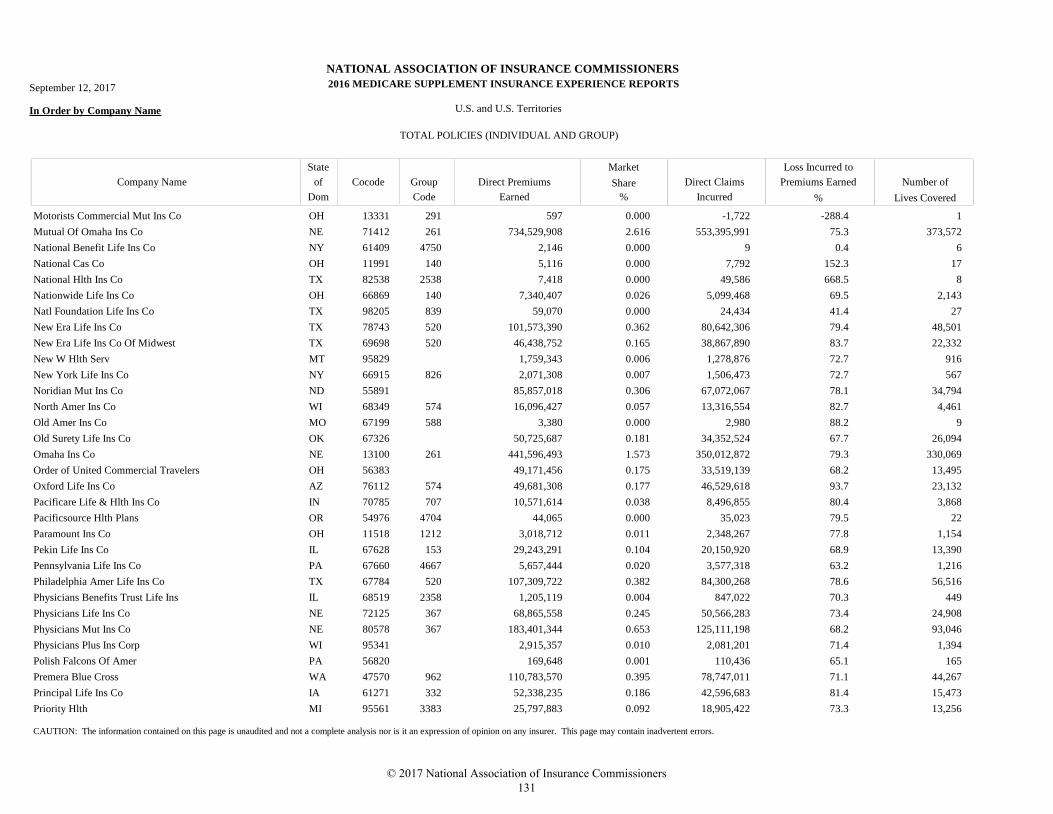
NATIONAL ASSOCIATION OF INSURANCE COMMISSIONERS
MEDICARE SUPPLEMENT INSURANCE EXPERIENCE REPORTS
In Order by Company Name U.S. and U.S. Territories
TOTAL POLICIES (INDIVIDUAL AND GROUP)
Market
Direct Claims
Incurred
Loss Incurred to
Premiums Earned Number of
Lives Covered
Direct Premiums
Earned
Company Name
State
Dom
Cocode Group
Code
of Share
% %
September 12, 2017 2016
Motorists Commercial Mut Ins Co OH 13331 291 597 -1,722 10.000 -288.4
Mutual Of Omaha Ins Co NE 71412 261 734,529,908 553,395,991 373,5722.616 75.3
National Benefit Life Ins Co NY 61409 4750 2,146 9 60.000 0.4
National Cas Co OH 11991 140 5,116 7,792 170.000 152.3
National Hlth Ins Co TX 82538 2538 7,418 49,586 80.000 668.5
Nationwide Life Ins Co OH 66869 140 7,340,407 5,099,468 2,1430.026 69.5
Natl Foundation Life Ins Co TX 98205 839 59,070 24,434 270.000 41.4
New Era Life Ins Co TX 78743 520 101,573,390 80,642,306 48,5010.362 79.4
New Era Life Ins Co Of Midwest TX 69698 520 46,438,752 38,867,890 22,3320.165 83.7
New W Hlth Serv MT 95829 1,759,343 1,278,876 9160.006 72.7
New York Life Ins Co NY 66915 826 2,071,308 1,506,473 5670.007 72.7
Noridian Mut Ins Co ND 55891 85,857,018 67,072,067 34,7940.306 78.1
North Amer Ins Co WI 68349 574 16,096,427 13,316,554 4,4610.057 82.7
Old Amer Ins Co MO 67199 588 3,380 2,980 90.000 88.2
Old Surety Life Ins Co OK 67326 50,725,687 34,352,524 26,0940.181 67.7
Omaha Ins Co NE 13100 261 441,596,493 350,012,872 330,0691.573 79.3
Order of United Commercial Travelers OH 56383 49,171,456 33,519,139 13,4950.175 68.2
Oxford Life Ins Co AZ 76112 574 49,681,308 46,529,618 23,1320.177 93.7
Pacificare Life & Hlth Ins Co IN 70785 707 10,571,614 8,496,855 3,8680.038 80.4
Pacificsource Hlth Plans OR 54976 4704 44,065 35,023 220.000 79.5
Paramount Ins Co OH 11518 1212 3,018,712 2,348,267 1,1540.011 77.8
Pekin Life Ins Co IL 67628 153 29,243,291 20,150,920 13,3900.104 68.9
Pennsylvania Life Ins Co PA 67660 4667 5,657,444 3,577,318 1,2160.020 63.2
Philadelphia Amer Life Ins Co TX 67784 520 107,309,722 84,300,268 56,5160.382 78.6
Physicians Benefits Trust Life Ins IL 68519 2358 1,205,119 847,022 4490.004 70.3
Physicians Life Ins Co NE 72125 367 68,865,558 50,566,283 24,9080.245 73.4
Physicians Mut Ins Co NE 80578 367 183,401,344 125,111,198 93,0460.653 68.2
Physicians Plus Ins Corp WI 95341 2,915,357 2,081,201 1,3940.010 71.4
Polish Falcons Of Amer PA 56820 169,648 110,436 1650.001 65.1
Premera Blue Cross WA 47570 962 110,783,570 78,747,011 44,2670.395 71.1
Principal Life Ins Co IA 61271 332 52,338,235 42,596,683 15,4730.186 81.4
Priority Hlth MI 95561 3383 25,797,883 18,905,422 13,2560.092 73.3
CAUTION: The information contained on this page is unaudited and not a complete analysis nor is it an expression of opinion on any insurer. This page may contain inadvertent errors.
© 2017 National Association of Insurance Commissioners 131
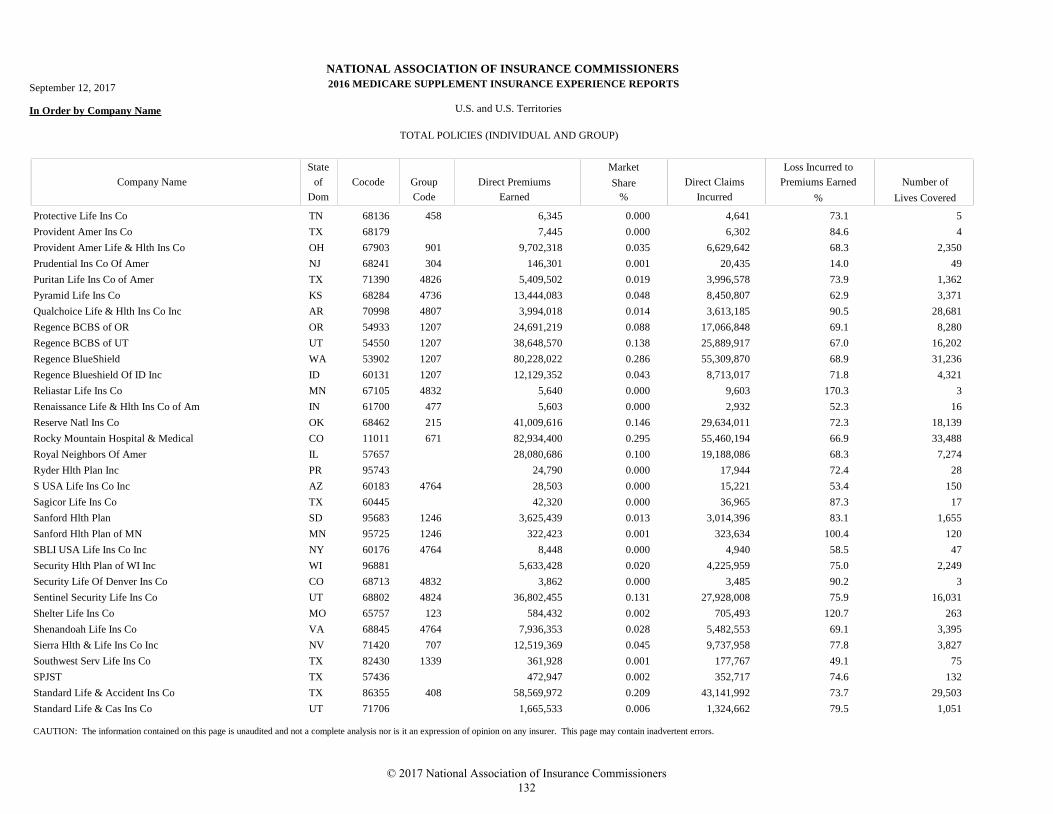
NATIONAL ASSOCIATION OF INSURANCE COMMISSIONERS
MEDICARE SUPPLEMENT INSURANCE EXPERIENCE REPORTS
In Order by Company Name U.S. and U.S. Territories
TOTAL POLICIES (INDIVIDUAL AND GROUP)
Market
Direct Claims
Incurred
Loss Incurred to
Premiums Earned Number of
Lives Covered
Direct Premiums
Earned
Company Name
State
Dom
Cocode Group
Code
of Share
% %
September 12, 2017 2016
Protective Life Ins Co TN 68136 458 6,345 4,641 50.000 73.1
Provident Amer Ins Co TX 68179 7,445 6,302 40.000 84.6
Provident Amer Life & Hlth Ins Co OH 67903 901 9,702,318 6,629,642 2,3500.035 68.3
Prudential Ins Co Of Amer NJ 68241 304 146,301 20,435 490.001 14.0
Puritan Life Ins Co of Amer TX 71390 4826 5,409,502 3,996,578 1,3620.019 73.9
Pyramid Life Ins Co KS 68284 4736 13,444,083 8,450,807 3,3710.048 62.9
Qualchoice Life & Hlth Ins Co Inc AR 70998 4807 3,994,018 3,613,185 28,6810.014 90.5
Regence BCBS of OR OR 54933 1207 24,691,219 17,066,848 8,2800.088 69.1
Regence BCBS of UT UT 54550 1207 38,648,570 25,889,917 16,2020.138 67.0
Regence BlueShield WA 53902 1207 80,228,022 55,309,870 31,2360.286 68.9
Regence Blueshield Of ID Inc ID 60131 1207 12,129,352 8,713,017 4,3210.043 71.8
Reliastar Life Ins Co MN 67105 4832 5,640 9,603 30.000 170.3
Renaissance Life & Hlth Ins Co of Am IN 61700 477 5,603 2,932 160.000 52.3
Reserve Natl Ins Co OK 68462 215 41,009,616 29,634,011 18,1390.146 72.3
Rocky Mountain Hospital & Medical CO 11011 671 82,934,400 55,460,194 33,4880.295 66.9
Royal Neighbors Of Amer IL 57657 28,080,686 19,188,086 7,2740.100 68.3
Ryder Hlth Plan Inc PR 95743 24,790 17,944 280.000 72.4
S USA Life Ins Co Inc AZ 60183 4764 28,503 15,221 1500.000 53.4
Sagicor Life Ins Co TX 60445 42,320 36,965 170.000 87.3
Sanford Hlth Plan SD 95683 1246 3,625,439 3,014,396 1,6550.013 83.1
Sanford Hlth Plan of MN MN 95725 1246 322,423 323,634 1200.001 100.4
SBLI USA Life Ins Co Inc NY 60176 4764 8,448 4,940 470.000 58.5
Security Hlth Plan of WI Inc WI 96881 5,633,428 4,225,959 2,2490.020 75.0
Security Life Of Denver Ins Co CO 68713 4832 3,862 3,485 30.000 90.2
Sentinel Security Life Ins Co UT 68802 4824 36,802,455 27,928,008 16,0310.131 75.9
Shelter Life Ins Co MO 65757 123 584,432 705,493 2630.002 120.7
Shenandoah Life Ins Co VA 68845 4764 7,936,353 5,482,553 3,3950.028 69.1
Sierra Hlth & Life Ins Co Inc NV 71420 707 12,519,369 9,737,958 3,8270.045 77.8
Southwest Serv Life Ins Co TX 82430 1339 361,928 177,767 750.001 49.1
SPJST TX 57436 472,947 352,717 1320.002 74.6
Standard Life & Accident Ins Co TX 86355 408 58,569,972 43,141,992 29,5030.209 73.7
Standard Life & Cas Ins Co UT 71706 1,665,533 1,324,662 1,0510.006 79.5
CAUTION: The information contained on this page is unaudited and not a complete analysis nor is it an expression of opinion on any insurer. This page may contain inadvertent errors.
© 2017 National Association of Insurance Commissioners 132
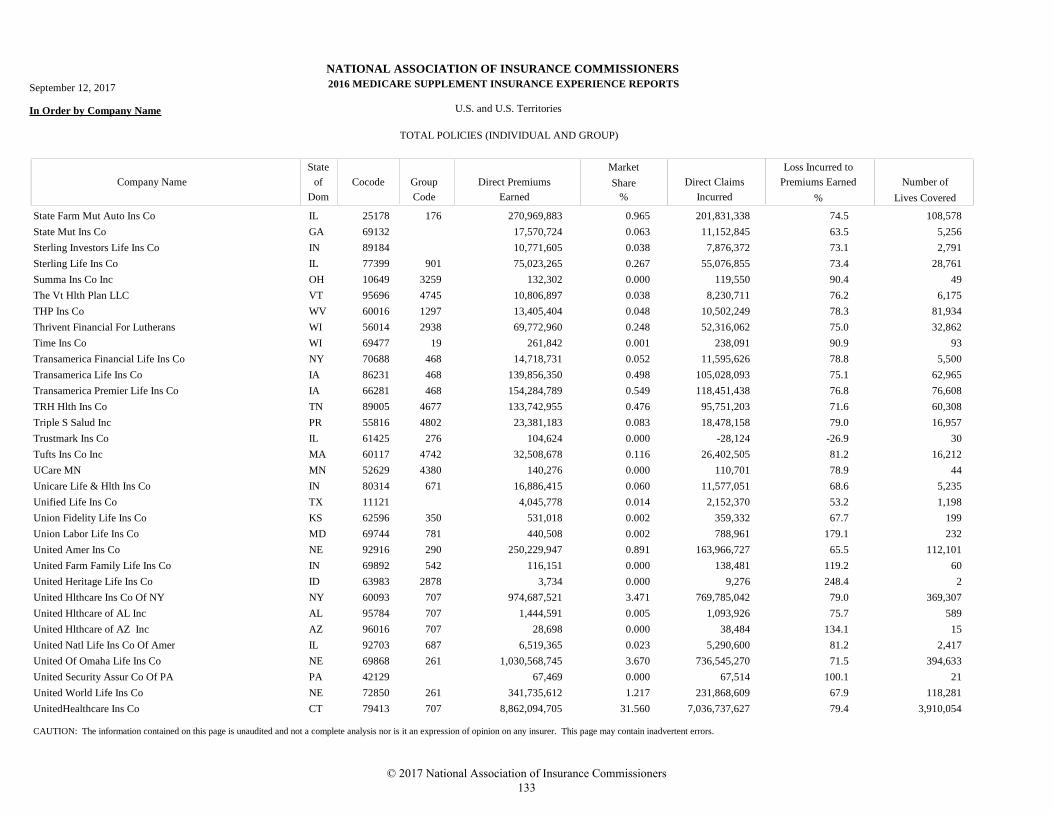
NATIONAL ASSOCIATION OF INSURANCE COMMISSIONERS
MEDICARE SUPPLEMENT INSURANCE EXPERIENCE REPORTS
In Order by Company Name U.S. and U.S. Territories
TOTAL POLICIES (INDIVIDUAL AND GROUP)
Market
Direct Claims
Incurred
Loss Incurred to
Premiums Earned Number of
Lives Covered
Direct Premiums
Earned
Company Name
State
Dom
Cocode Group
Code
of Share
% %
September 12, 2017 2016
State Farm Mut Auto Ins Co IL 25178 176 270,969,883 201,831,338 108,5780.965 74.5
State Mut Ins Co GA 69132 17,570,724 11,152,845 5,2560.063 63.5
Sterling Investors Life Ins Co IN 89184 10,771,605 7,876,372 2,7910.038 73.1
Sterling Life Ins Co IL 77399 901 75,023,265 55,076,855 28,7610.267 73.4
Summa Ins Co Inc OH 10649 3259 132,302 119,550 490.000 90.4
The Vt Hlth Plan LLC VT 95696 4745 10,806,897 8,230,711 6,1750.038 76.2
THP Ins Co WV 60016 1297 13,405,404 10,502,249 81,9340.048 78.3
Thrivent Financial For Lutherans WI 56014 2938 69,772,960 52,316,062 32,8620.248 75.0
Time Ins Co WI 69477 19 261,842 238,091 930.001 90.9
Transamerica Financial Life Ins Co NY 70688 468 14,718,731 11,595,626 5,5000.052 78.8
Transamerica Life Ins Co IA 86231 468 139,856,350 105,028,093 62,9650.498 75.1
Transamerica Premier Life Ins Co IA 66281 468 154,284,789 118,451,438 76,6080.549 76.8
TRH Hlth Ins Co TN 89005 4677 133,742,955 95,751,203 60,3080.476 71.6
Triple S Salud Inc PR 55816 4802 23,381,183 18,478,158 16,9570.083 79.0
Trustmark Ins Co IL 61425 276 104,624 -28,124 300.000 -26.9
Tufts Ins Co Inc MA 60117 4742 32,508,678 26,402,505 16,2120.116 81.2
UCare MN MN 52629 4380 140,276 110,701 440.000 78.9
Unicare Life & Hlth Ins Co IN 80314 671 16,886,415 11,577,051 5,2350.060 68.6
Unified Life Ins Co TX 11121 4,045,778 2,152,370 1,1980.014 53.2
Union Fidelity Life Ins Co KS 62596 350 531,018 359,332 1990.002 67.7
Union Labor Life Ins Co MD 69744 781 440,508 788,961 2320.002 179.1
United Amer Ins Co NE 92916 290 250,229,947 163,966,727 112,1010.891 65.5
United Farm Family Life Ins Co IN 69892 542 116,151 138,481 600.000 119.2
United Heritage Life Ins Co ID 63983 2878 3,734 9,276 20.000 248.4
United Hlthcare Ins Co Of NY NY 60093 707 974,687,521 769,785,042 369,3073.471 79.0
United Hlthcare of AL Inc AL 95784 707 1,444,591 1,093,926 5890.005 75.7
United Hlthcare of AZ Inc AZ 96016 707 28,698 38,484 150.000 134.1
United Natl Life Ins Co Of Amer IL 92703 687 6,519,365 5,290,600 2,4170.023 81.2
United Of Omaha Life Ins Co NE 69868 261 1,030,568,745 736,545,270 394,6333.670 71.5
United Security Assur Co Of PA PA 42129 67,469 67,514 210.000 100.1
United World Life Ins Co NE 72850 261 341,735,612 231,868,609 118,2811.217 67.9
UnitedHealthcare Ins Co CT 79413 707 8,862,094,705 7,036,737,627 3,910,05431.560 79.4
CAUTION: The information contained on this page is unaudited and not a complete analysis nor is it an expression of opinion on any insurer. This page may contain inadvertent errors.
© 2017 National Association of Insurance Commissioners 133
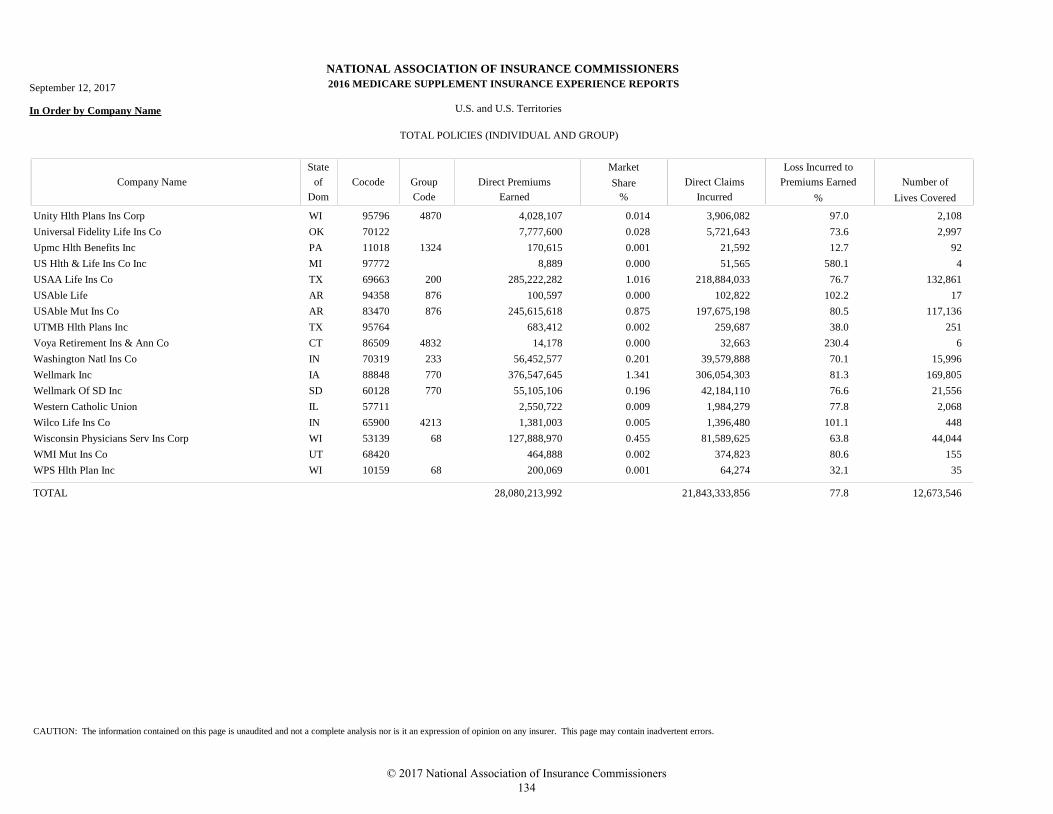
NATIONAL ASSOCIATION OF INSURANCE COMMISSIONERS
MEDICARE SUPPLEMENT INSURANCE EXPERIENCE REPORTS
In Order by Company Name U.S. and U.S. Territories
TOTAL POLICIES (INDIVIDUAL AND GROUP)
Market
Direct Claims
Incurred
Loss Incurred to
Premiums Earned Number of
Lives Covered
Direct Premiums
Earned
Company Name
State
Dom
Cocode Group
Code
of Share
% %
September 12, 2017 2016
Unity Hlth Plans Ins Corp WI 95796 4870 4,028,107 3,906,082 2,1080.014 97.0
Universal Fidelity Life Ins Co OK 70122 7,777,600 5,721,643 2,9970.028 73.6
Upmc Hlth Benefits Inc PA 11018 1324 170,615 21,592 920.001 12.7
US Hlth & Life Ins Co Inc MI 97772 8,889 51,565 40.000 580.1
USAA Life Ins Co TX 69663 200 285,222,282 218,884,033 132,8611.016 76.7
USAble Life AR 94358 876 100,597 102,822 170.000 102.2
USAble Mut Ins Co AR 83470 876 245,615,618 197,675,198 117,1360.875 80.5
UTMB Hlth Plans Inc TX 95764 683,412 259,687 2510.002 38.0
Voya Retirement Ins & Ann Co CT 86509 4832 14,178 32,663 60.000 230.4
Washington Natl Ins Co IN 70319 233 56,452,577 39,579,888 15,9960.201 70.1
Wellmark Inc IA 88848 770 376,547,645 306,054,303 169,8051.341 81.3
Wellmark Of SD Inc SD 60128 770 55,105,106 42,184,110 21,5560.196 76.6
Western Catholic Union IL 57711 2,550,722 1,984,279 2,0680.009 77.8
Wilco Life Ins Co IN 65900 4213 1,381,003 1,396,480 4480.005 101.1
Wisconsin Physicians Serv Ins Corp WI 53139 68 127,888,970 81,589,625 44,0440.455 63.8
WMI Mut Ins Co UT 68420 464,888 374,823 1550.002 80.6
WPS Hlth Plan Inc WI 10159 68 200,069 64,274 350.001 32.1
28,080,213,992 21,843,333,856 12,673,546TOTAL 77.8
CAUTION: The information contained on this page is unaudited and not a complete analysis nor is it an expression of opinion on any insurer. This page may contain inadvertent errors.
© 2017 National Association of Insurance Commissioners 134
MARKET SHARE BY DIRECT PREMIUMS EARNED
© 2017 National Association of Insurance Commissioners 135

© 2017 National Association of Insurance Commissioners 136
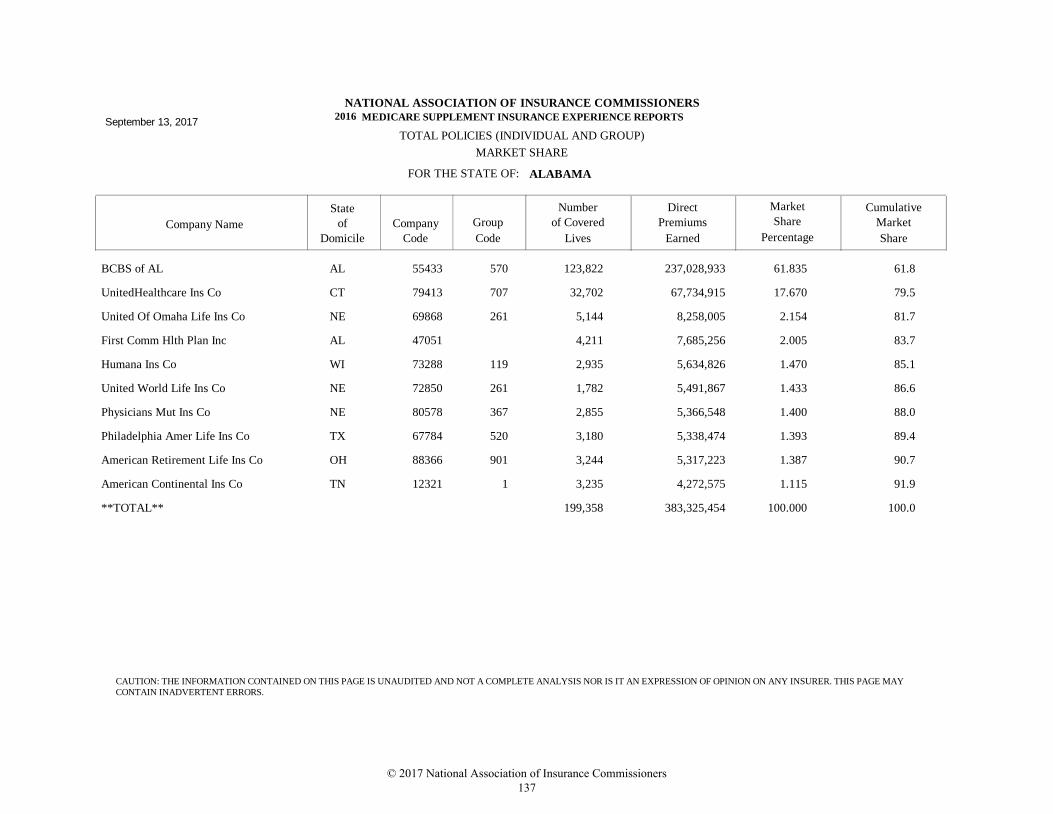
FOR THE STATE OF:
TOTAL POLICIES (INDIVIDUAL AND GROUP)
Company Name
State
Company Group
DirectNumber Market
ALABAMA
MARKET SHARE
NATIONAL ASSOCIATION OF INSURANCE COMMISSIONERS
MEDICARE SUPPLEMENT INSURANCE EXPERIENCE REPORTS
of
Domicile Code Code
Premiums
Earned
Share
Percentage
Cumulative
Market
Share
of Covered
Lives
September 13, 20172016
BCBS of AL 55433 570 237,028,933123,822 61.835 61.8AL
UnitedHealthcare Ins Co 79413 707 67,734,91532,702 17.670 79.5CT
United Of Omaha Life Ins Co 69868 261 8,258,0055,144 2.154 81.7NE
First Comm Hlth Plan Inc 47051 7,685,2564,211 2.005 83.7AL
Humana Ins Co 73288 119 5,634,8262,935 1.470 85.1WI
United World Life Ins Co 72850 261 5,491,8671,782 1.433 86.6NE
Physicians Mut Ins Co 80578 367 5,366,5482,855 1.400 88.0NE
Philadelphia Amer Life Ins Co 67784 520 5,338,4743,180 1.393 89.4TX
American Retirement Life Ins Co 88366 901 5,317,2233,244 1.387 90.7OH
American Continental Ins Co 12321 1 4,272,5753,235 1.115 91.9TN
**TOTAL** 383,325,454199,358 100.000 100.0
CAUTION: THE INFORMATION CONTAINED ON THIS PAGE IS UNAUDITED AND NOT A COMPLETE ANALYSIS NOR IS IT AN EXPRESSION OF OPINION ON ANY INSURER. THIS PAGE MAY
CONTAIN INADVERTENT ERRORS.
© 2017 National Association of Insurance Commissioners 137

FOR THE STATE OF:
TOTAL POLICIES (INDIVIDUAL AND GROUP)
Company Name
State
Company Group
DirectNumber Market
ALASKA
MARKET SHARE
NATIONAL ASSOCIATION OF INSURANCE COMMISSIONERS
MEDICARE SUPPLEMENT INSURANCE EXPERIENCE REPORTS
of
Domicile Code Code
Premiums
Earned
Share
Percentage
Cumulative
Market
Share
of Covered
Lives
September 13, 20172016
UnitedHealthcare Ins Co 79413 707 15,831,3078,451 62.417 62.4CT
Premera Blue Cross 47570 962 3,407,9601,579 13.436 75.9WA
Mutual Of Omaha Ins Co 71412 261 1,978,551817 7.801 83.7NE
Humana Ins Co 73288 119 1,342,645790 5.294 88.9WI
State Farm Mut Auto Ins Co 25178 176 1,065,994666 4.203 93.2IL
USAA Life Ins Co 69663 200 669,974370 2.641 95.8TX
Transamerica Life Ins Co 86231 468 283,857192 1.119 96.9IA
Loyal Amer Life Ins Co 65722 901 214,054197 0.844 97.8OH
Transamerica Premier Life Ins Co 66281 468 122,65594 0.484 98.2IA
United Amer Ins Co 92916 290 85,59946 0.337 98.6NE
**TOTAL** 25,363,77913,345 100.000 100.0
CAUTION: THE INFORMATION CONTAINED ON THIS PAGE IS UNAUDITED AND NOT A COMPLETE ANALYSIS NOR IS IT AN EXPRESSION OF OPINION ON ANY INSURER. THIS PAGE MAY
CONTAIN INADVERTENT ERRORS.
© 2017 National Association of Insurance Commissioners 138

FOR THE STATE OF:
TOTAL POLICIES (INDIVIDUAL AND GROUP)
Company Name
State
Company Group
DirectNumber Market
ARIZONA
MARKET SHARE
NATIONAL ASSOCIATION OF INSURANCE COMMISSIONERS
MEDICARE SUPPLEMENT INSURANCE EXPERIENCE REPORTS
of
Domicile Code Code
Premiums
Earned
Share
Percentage
Cumulative
Market
Share
of Covered
Lives
September 13, 20172016
UnitedHealthcare Ins Co 79413 707 278,104,697128,529 45.791 45.8CT
BCBS of AZ Inc 53589 97,309,64739,174 16.023 61.8AZ
United Of Omaha Life Ins Co 69868 261 55,443,42320,178 9.129 70.9NE
American Continental Ins Co 12321 1 27,088,82717,817 4.460 75.4TN
Physicians Mut Ins Co 80578 367 17,999,52310,907 2.964 78.4NE
USAA Life Ins Co 69663 200 14,108,8977,502 2.323 80.7TX
Omaha Ins Co 13100 261 13,392,32610,699 2.205 82.9NE
Mutual Of Omaha Ins Co 71412 261 9,083,2453,057 1.496 84.4NE
American Republic Ins Co 60836 3527 7,014,6932,276 1.155 85.5IA
Medico Corp Life Ins Co 79987 3527 6,416,7854,471 1.057 86.6NE
**TOTAL** 607,329,981284,584 100.000 100.0
CAUTION: THE INFORMATION CONTAINED ON THIS PAGE IS UNAUDITED AND NOT A COMPLETE ANALYSIS NOR IS IT AN EXPRESSION OF OPINION ON ANY INSURER. THIS PAGE MAY
CONTAIN INADVERTENT ERRORS.
© 2017 National Association of Insurance Commissioners 139
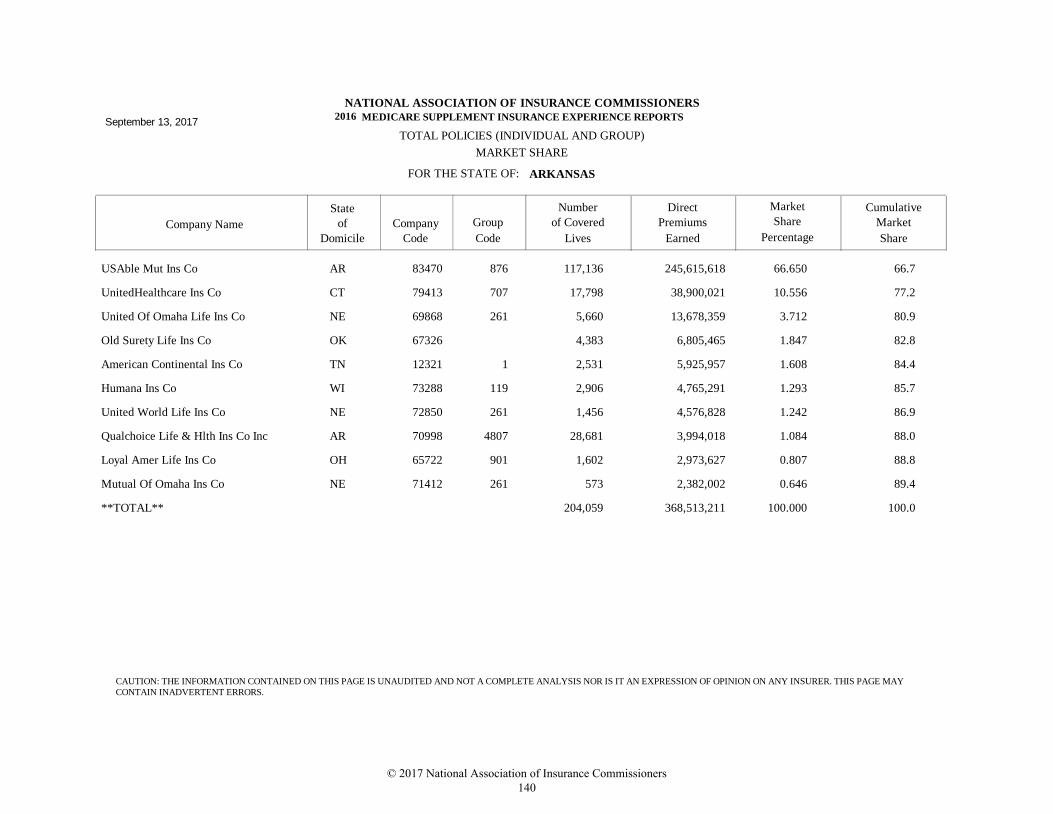
FOR THE STATE OF:
TOTAL POLICIES (INDIVIDUAL AND GROUP)
Company Name
State
Company Group
DirectNumber Market
ARKANSAS
MARKET SHARE
NATIONAL ASSOCIATION OF INSURANCE COMMISSIONERS
MEDICARE SUPPLEMENT INSURANCE EXPERIENCE REPORTS
of
Domicile Code Code
Premiums
Earned
Share
Percentage
Cumulative
Market
Share
of Covered
Lives
September 13, 20172016
USAble Mut Ins Co 83470 876 245,615,618117,136 66.650 66.7AR
UnitedHealthcare Ins Co 79413 707 38,900,02117,798 10.556 77.2CT
United Of Omaha Life Ins Co 69868 261 13,678,3595,660 3.712 80.9NE
Old Surety Life Ins Co 67326 6,805,4654,383 1.847 82.8OK
American Continental Ins Co 12321 1 5,925,9572,531 1.608 84.4TN
Humana Ins Co 73288 119 4,765,2912,906 1.293 85.7WI
United World Life Ins Co 72850 261 4,576,8281,456 1.242 86.9NE
Qualchoice Life & Hlth Ins Co Inc 70998 4807 3,994,01828,681 1.084 88.0AR
Loyal Amer Life Ins Co 65722 901 2,973,6271,602 0.807 88.8OH
Mutual Of Omaha Ins Co 71412 261 2,382,002573 0.646 89.4NE
**TOTAL** 368,513,211204,059 100.000 100.0
CAUTION: THE INFORMATION CONTAINED ON THIS PAGE IS UNAUDITED AND NOT A COMPLETE ANALYSIS NOR IS IT AN EXPRESSION OF OPINION ON ANY INSURER. THIS PAGE MAY
CONTAIN INADVERTENT ERRORS.
© 2017 National Association of Insurance Commissioners 140

FOR THE STATE OF:
TOTAL POLICIES (INDIVIDUAL AND GROUP)
Company Name
State
Company Group
DirectNumber Market
CALIFORNIA
MARKET SHARE
NATIONAL ASSOCIATION OF INSURANCE COMMISSIONERS
MEDICARE SUPPLEMENT INSURANCE EXPERIENCE REPORTS
of
Domicile Code Code
Premiums
Earned
Share
Percentage
Cumulative
Market
Share
of Covered
Lives
September 13, 20172016
UnitedHealthcare Ins Co 79413 707 750,742,323338,799 65.546 65.5CT
Health Net Life Ins Co 66141 1295 64,596,81527,397 5.640 71.2CA
Mutual Of Omaha Ins Co 71412 261 34,040,21119,496 2.972 74.2NE
USAA Life Ins Co 69663 200 32,733,17514,169 2.858 77.0TX
Continental Life Ins Co Brentwood 68500 1 31,189,0419,930 2.723 79.7TN
Humana Ins Co 73288 119 28,726,13315,636 2.508 82.2WI
Colonial Penn Life Ins Co 62065 233 27,616,49713,931 2.411 84.7PA
Aetna Life Ins Co 60054 1 27,458,6629,276 2.397 87.1CT
United Amer Ins Co 92916 290 25,646,93812,123 2.239 89.3NE
United World Life Ins Co 72850 261 18,278,1684,860 1.596 90.9NE
**TOTAL** 1,145,362,503514,026 100.000 100.0
CAUTION: THE INFORMATION CONTAINED ON THIS PAGE IS UNAUDITED AND NOT A COMPLETE ANALYSIS NOR IS IT AN EXPRESSION OF OPINION ON ANY INSURER. THIS PAGE MAY
CONTAIN INADVERTENT ERRORS.
© 2017 National Association of Insurance Commissioners 141

FOR THE STATE OF:
TOTAL POLICIES (INDIVIDUAL AND GROUP)
Company Name
State
Company Group
DirectNumber Market
COLORADO
MARKET SHARE
NATIONAL ASSOCIATION OF INSURANCE COMMISSIONERS
MEDICARE SUPPLEMENT INSURANCE EXPERIENCE REPORTS
of
Domicile Code Code
Premiums
Earned
Share
Percentage
Cumulative
Market
Share
of Covered
Lives
September 13, 20172016
UnitedHealthcare Ins Co 79413 707 158,513,23680,052 42.605 42.6CT
Rocky Mountain Hospital & Medical 11011 671 59,187,93525,797 15.909 58.5CO
Mutual Of Omaha Ins Co 71412 261 20,038,32913,784 5.386 63.9NE
United World Life Ins Co 72850 261 13,381,4234,218 3.597 67.5NE
American Retirement Life Ins Co 88366 901 13,229,6167,730 3.556 71.1OH
USAA Life Ins Co 69663 200 10,500,6975,080 2.822 73.9TX
Humana Ins Co 73288 119 9,779,8774,960 2.629 76.5WI
Colonial Penn Life Ins Co 62065 233 8,487,0624,621 2.281 78.8PA
Bankers Life & Cas Co 61263 233 6,554,5891,857 1.762 80.5IL
State Farm Mut Auto Ins Co 25178 176 6,471,0972,140 1.739 82.3IL
**TOTAL** 372,051,250177,866 100.000 100.0
CAUTION: THE INFORMATION CONTAINED ON THIS PAGE IS UNAUDITED AND NOT A COMPLETE ANALYSIS NOR IS IT AN EXPRESSION OF OPINION ON ANY INSURER. THIS PAGE MAY
CONTAIN INADVERTENT ERRORS.
© 2017 National Association of Insurance Commissioners 142

FOR THE STATE OF:
TOTAL POLICIES (INDIVIDUAL AND GROUP)
Company Name
State
Company Group
DirectNumber Market
CONNECTICUT
MARKET SHARE
NATIONAL ASSOCIATION OF INSURANCE COMMISSIONERS
MEDICARE SUPPLEMENT INSURANCE EXPERIENCE REPORTS
of
Domicile Code Code
Premiums
Earned
Share
Percentage
Cumulative
Market
Share
of Covered
Lives
September 13, 20172016
UnitedHealthcare Ins Co 79413 707 251,408,42597,954 68.895 68.9CT
Anthem Hlth Plans Inc 60217 671 86,391,16245,235 23.674 92.6CT
USAA Life Ins Co 69663 200 5,186,5261,755 1.421 94.0TX
Humana Ins Co 73288 119 3,060,5331,382 0.839 94.8WI
Loyal Amer Life Ins Co 65722 901 2,071,640748 0.568 95.4OH
Bankers Life & Cas Co 61263 233 2,054,537921 0.563 96.0IL
Combined Ins Co Of Amer 62146 626 1,718,350637 0.471 96.4IL
Colonial Penn Life Ins Co 62065 233 1,658,1421,696 0.454 96.9PA
United Amer Ins Co 92916 290 1,561,0851,342 0.428 97.3NE
Transamerica Life Ins Co 86231 468 1,386,948673 0.380 97.7IA
**TOTAL** 364,914,810155,219 100.000 100.0
CAUTION: THE INFORMATION CONTAINED ON THIS PAGE IS UNAUDITED AND NOT A COMPLETE ANALYSIS NOR IS IT AN EXPRESSION OF OPINION ON ANY INSURER. THIS PAGE MAY
CONTAIN INADVERTENT ERRORS.
© 2017 National Association of Insurance Commissioners 143

FOR THE STATE OF:
TOTAL POLICIES (INDIVIDUAL AND GROUP)
Company Name
State
Company Group
DirectNumber Market
DELAWARE
MARKET SHARE
NATIONAL ASSOCIATION OF INSURANCE COMMISSIONERS
MEDICARE SUPPLEMENT INSURANCE EXPERIENCE REPORTS
of
Domicile Code Code
Premiums
Earned
Share
Percentage
Cumulative
Market
Share
of Covered
Lives
September 13, 20172016
UnitedHealthcare Ins Co 79413 707 84,402,97039,216 66.523 66.5CT
Highmark BCBSD Inc 53287 812 15,218,2166,810 11.994 78.5DE
Humana Ins Co 73288 119 3,140,5151,947 2.475 81.0WI
Standard Life & Accident Ins Co 86355 408 2,563,5861,237 2.021 83.0TX
Bankers Life & Cas Co 61263 233 2,496,308711 1.967 85.0IL
State Farm Mut Auto Ins Co 25178 176 2,192,128662 1.728 86.7IL
Guarantee Trust Life Ins Co 64211 687 2,022,461496 1.594 88.3IL
Colonial Penn Life Ins Co 62065 233 2,001,557937 1.578 89.9PA
USAA Life Ins Co 69663 200 1,528,749612 1.205 91.1TX
Transamerica Premier Life Ins Co 66281 468 1,366,956986 1.077 92.2IA
**TOTAL** 126,878,60758,510 100.000 100.0
CAUTION: THE INFORMATION CONTAINED ON THIS PAGE IS UNAUDITED AND NOT A COMPLETE ANALYSIS NOR IS IT AN EXPRESSION OF OPINION ON ANY INSURER. THIS PAGE MAY
CONTAIN INADVERTENT ERRORS.
© 2017 National Association of Insurance Commissioners 144
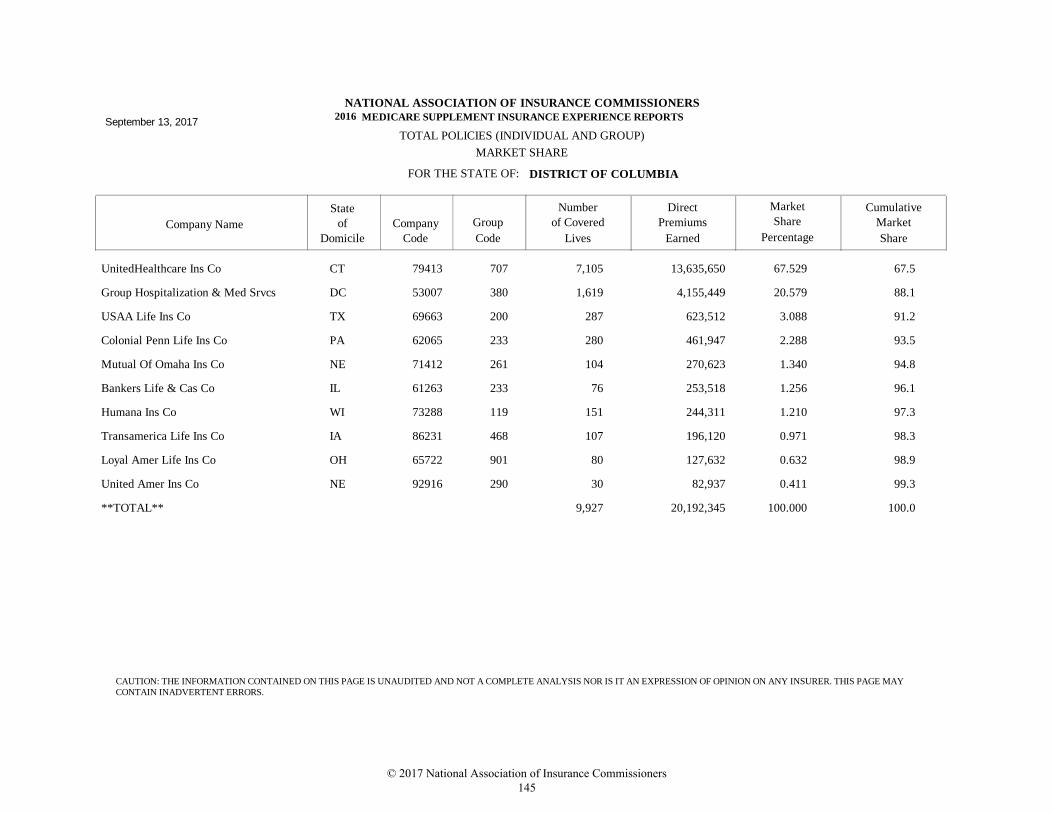
FOR THE STATE OF:
TOTAL POLICIES (INDIVIDUAL AND GROUP)
Company Name
State
Company Group
DirectNumber Market
DISTRICT OF COLUMBIA
MARKET SHARE
NATIONAL ASSOCIATION OF INSURANCE COMMISSIONERS
MEDICARE SUPPLEMENT INSURANCE EXPERIENCE REPORTS
of
Domicile Code Code
Premiums
Earned
Share
Percentage
Cumulative
Market
Share
of Covered
Lives
September 13, 20172016
UnitedHealthcare Ins Co 79413 707 13,635,6507,105 67.529 67.5CT
Group Hospitalization & Med Srvcs 53007 380 4,155,4491,619 20.579 88.1DC
USAA Life Ins Co 69663 200 623,512287 3.088 91.2TX
Colonial Penn Life Ins Co 62065 233 461,947280 2.288 93.5PA
Mutual Of Omaha Ins Co 71412 261 270,623104 1.340 94.8NE
Bankers Life & Cas Co 61263 233 253,51876 1.256 96.1IL
Humana Ins Co 73288 119 244,311151 1.210 97.3WI
Transamerica Life Ins Co 86231 468 196,120107 0.971 98.3IA
Loyal Amer Life Ins Co 65722 901 127,63280 0.632 98.9OH
United Amer Ins Co 92916 290 82,93730 0.411 99.3NE
**TOTAL** 20,192,3459,927 100.000 100.0
CAUTION: THE INFORMATION CONTAINED ON THIS PAGE IS UNAUDITED AND NOT A COMPLETE ANALYSIS NOR IS IT AN EXPRESSION OF OPINION ON ANY INSURER. THIS PAGE MAY
CONTAIN INADVERTENT ERRORS.
© 2017 National Association of Insurance Commissioners 145
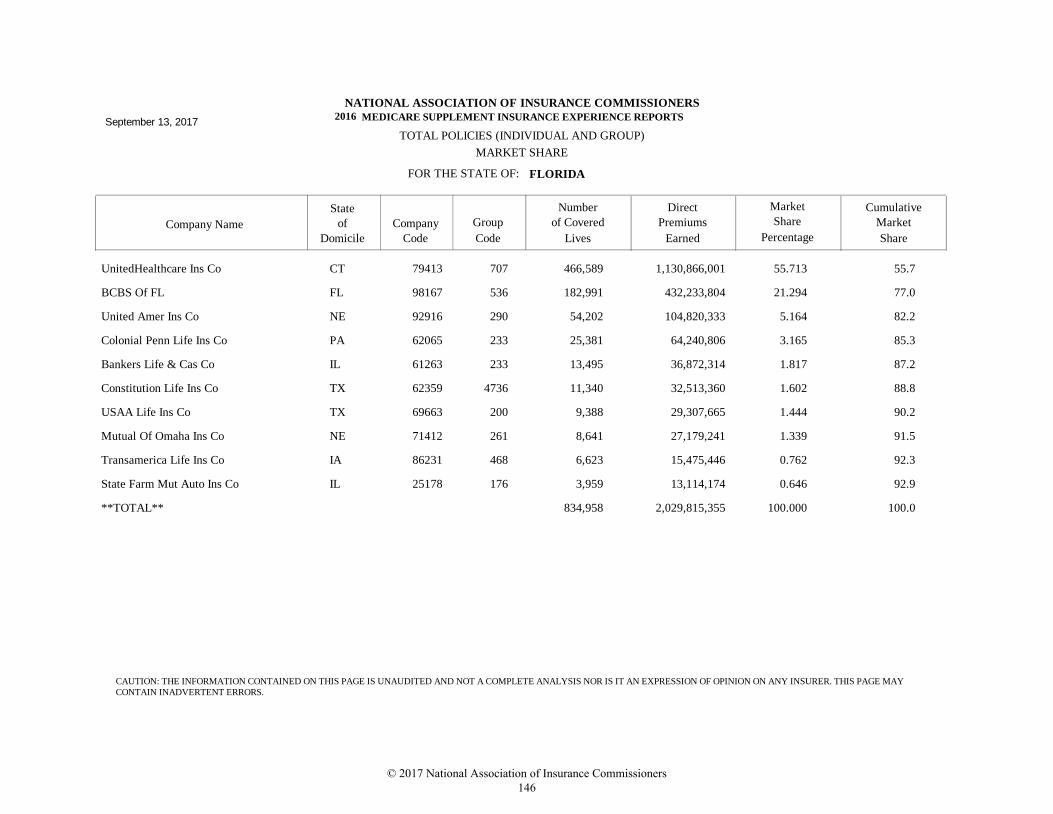
FOR THE STATE OF:
TOTAL POLICIES (INDIVIDUAL AND GROUP)
Company Name
State
Company Group
DirectNumber Market
FLORIDA
MARKET SHARE
NATIONAL ASSOCIATION OF INSURANCE COMMISSIONERS
MEDICARE SUPPLEMENT INSURANCE EXPERIENCE REPORTS
of
Domicile Code Code
Premiums
Earned
Share
Percentage
Cumulative
Market
Share
of Covered
Lives
September 13, 20172016
UnitedHealthcare Ins Co 79413 707 1,130,866,001466,589 55.713 55.7CT
BCBS Of FL 98167 536 432,233,804182,991 21.294 77.0FL
United Amer Ins Co 92916 290 104,820,33354,202 5.164 82.2NE
Colonial Penn Life Ins Co 62065 233 64,240,80625,381 3.165 85.3PA
Bankers Life & Cas Co 61263 233 36,872,31413,495 1.817 87.2IL
Constitution Life Ins Co 62359 4736 32,513,36011,340 1.602 88.8TX
USAA Life Ins Co 69663 200 29,307,6659,388 1.444 90.2TX
Mutual Of Omaha Ins Co 71412 261 27,179,2418,641 1.339 91.5NE
Transamerica Life Ins Co 86231 468 15,475,4466,623 0.762 92.3IA
State Farm Mut Auto Ins Co 25178 176 13,114,1743,959 0.646 92.9IL
**TOTAL** 2,029,815,355834,958 100.000 100.0
CAUTION: THE INFORMATION CONTAINED ON THIS PAGE IS UNAUDITED AND NOT A COMPLETE ANALYSIS NOR IS IT AN EXPRESSION OF OPINION ON ANY INSURER. THIS PAGE MAY
CONTAIN INADVERTENT ERRORS.
© 2017 National Association of Insurance Commissioners 146
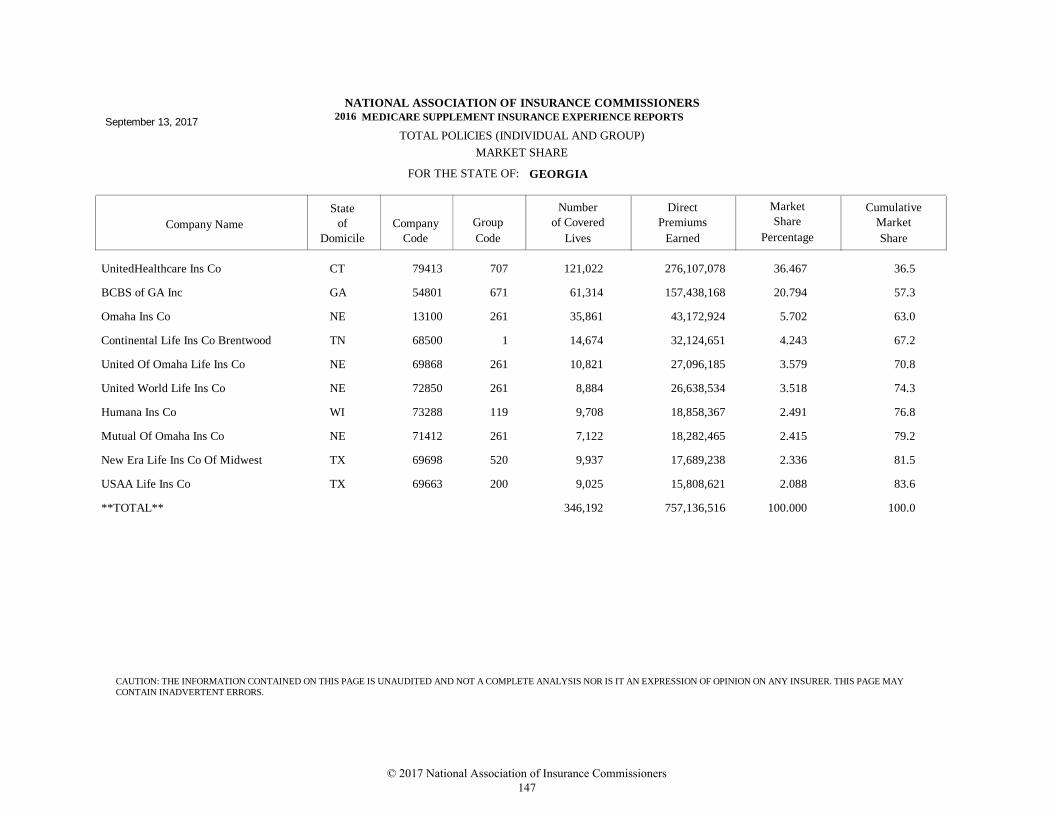
FOR THE STATE OF:
TOTAL POLICIES (INDIVIDUAL AND GROUP)
Company Name
State
Company Group
DirectNumber Market
GEORGIA
MARKET SHARE
NATIONAL ASSOCIATION OF INSURANCE COMMISSIONERS
MEDICARE SUPPLEMENT INSURANCE EXPERIENCE REPORTS
of
Domicile Code Code
Premiums
Earned
Share
Percentage
Cumulative
Market
Share
of Covered
Lives
September 13, 20172016
UnitedHealthcare Ins Co 79413 707 276,107,078121,022 36.467 36.5CT
BCBS of GA Inc 54801 671 157,438,16861,314 20.794 57.3GA
Omaha Ins Co 13100 261 43,172,92435,861 5.702 63.0NE
Continental Life Ins Co Brentwood 68500 1 32,124,65114,674 4.243 67.2TN
United Of Omaha Life Ins Co 69868 261 27,096,18510,821 3.579 70.8NE
United World Life Ins Co 72850 261 26,638,5348,884 3.518 74.3NE
Humana Ins Co 73288 119 18,858,3679,708 2.491 76.8WI
Mutual Of Omaha Ins Co 71412 261 18,282,4657,122 2.415 79.2NE
New Era Life Ins Co Of Midwest 69698 520 17,689,2389,937 2.336 81.5TX
USAA Life Ins Co 69663 200 15,808,6219,025 2.088 83.6TX
**TOTAL** 757,136,516346,192 100.000 100.0
CAUTION: THE INFORMATION CONTAINED ON THIS PAGE IS UNAUDITED AND NOT A COMPLETE ANALYSIS NOR IS IT AN EXPRESSION OF OPINION ON ANY INSURER. THIS PAGE MAY
CONTAIN INADVERTENT ERRORS.
© 2017 National Association of Insurance Commissioners 147
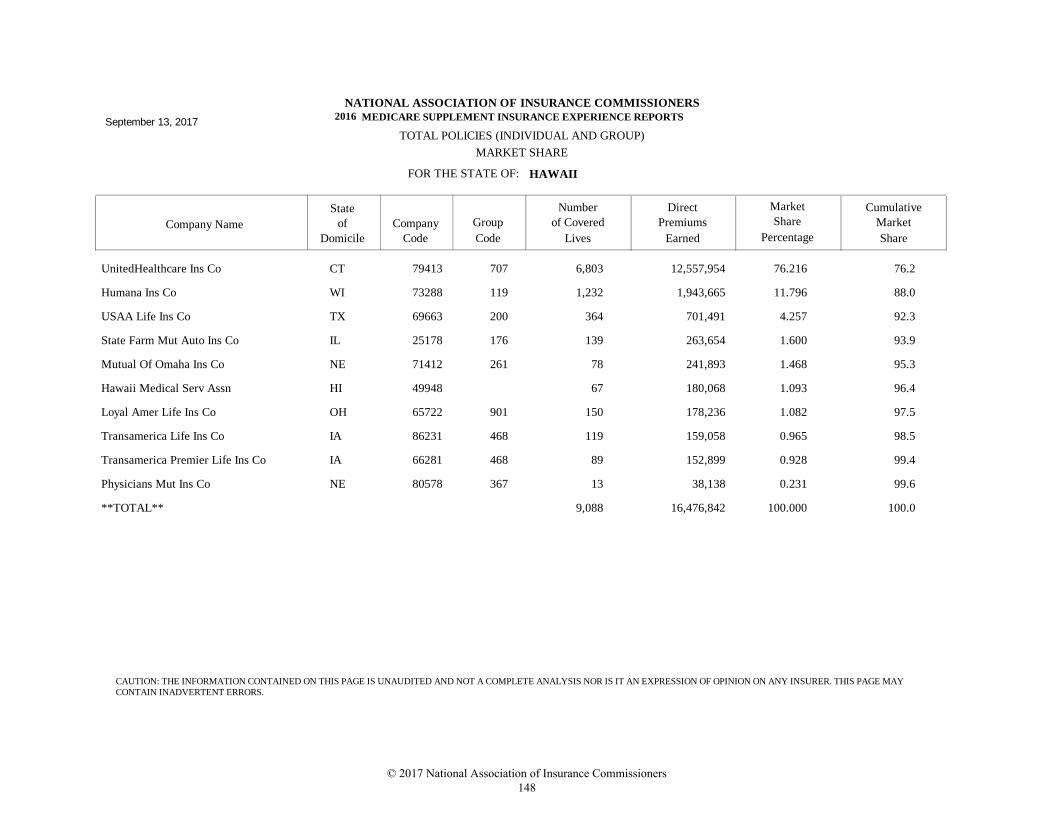
FOR THE STATE OF:
TOTAL POLICIES (INDIVIDUAL AND GROUP)
Company Name
State
Company Group
DirectNumber Market
HAWAII
MARKET SHARE
NATIONAL ASSOCIATION OF INSURANCE COMMISSIONERS
MEDICARE SUPPLEMENT INSURANCE EXPERIENCE REPORTS
of
Domicile Code Code
Premiums
Earned
Share
Percentage
Cumulative
Market
Share
of Covered
Lives
September 13, 20172016
UnitedHealthcare Ins Co 79413 707 12,557,9546,803 76.216 76.2CT
Humana Ins Co 73288 119 1,943,6651,232 11.796 88.0WI
USAA Life Ins Co 69663 200 701,491364 4.257 92.3TX
State Farm Mut Auto Ins Co 25178 176 263,654139 1.600 93.9IL
Mutual Of Omaha Ins Co 71412 261 241,89378 1.468 95.3NE
Hawaii Medical Serv Assn 49948 180,06867 1.093 96.4HI
Loyal Amer Life Ins Co 65722 901 178,236150 1.082 97.5OH
Transamerica Life Ins Co 86231 468 159,058119 0.965 98.5IA
Transamerica Premier Life Ins Co 66281 468 152,89989 0.928 99.4IA
Physicians Mut Ins Co 80578 367 38,13813 0.231 99.6NE
**TOTAL** 16,476,8429,088 100.000 100.0
CAUTION: THE INFORMATION CONTAINED ON THIS PAGE IS UNAUDITED AND NOT A COMPLETE ANALYSIS NOR IS IT AN EXPRESSION OF OPINION ON ANY INSURER. THIS PAGE MAY
CONTAIN INADVERTENT ERRORS.
© 2017 National Association of Insurance Commissioners 148
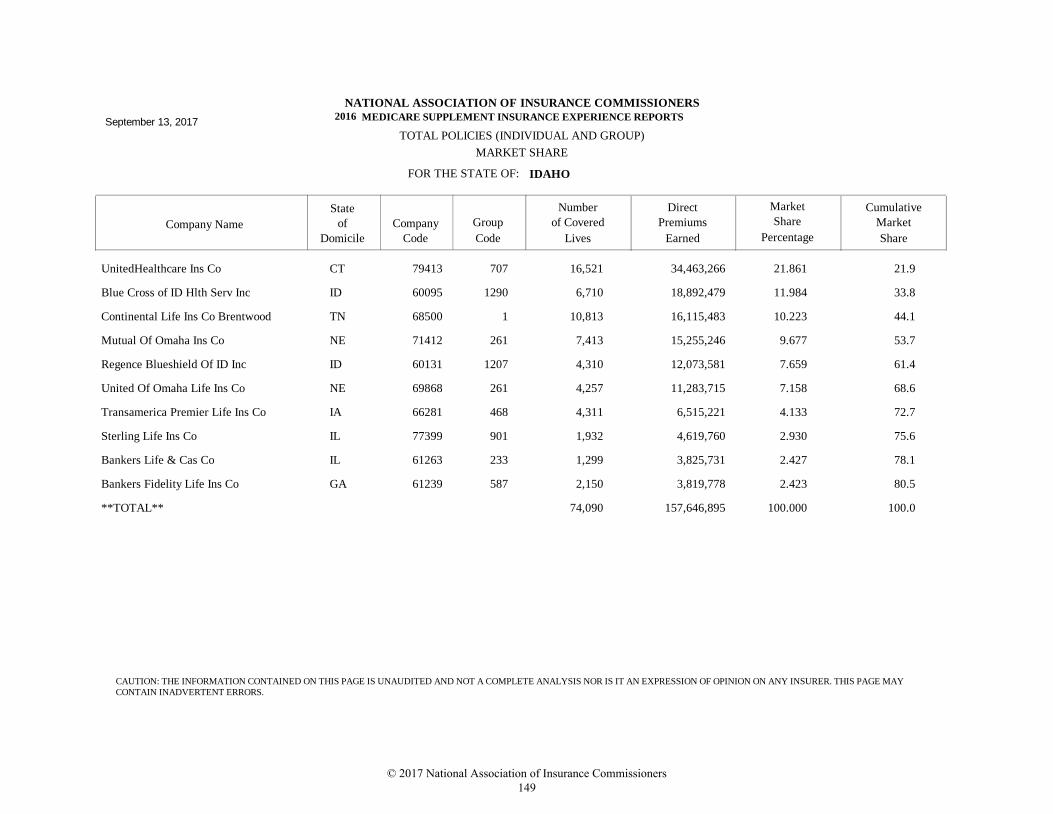
FOR THE STATE OF:
TOTAL POLICIES (INDIVIDUAL AND GROUP)
Company Name
State
Company Group
DirectNumber Market
IDAHO
MARKET SHARE
NATIONAL ASSOCIATION OF INSURANCE COMMISSIONERS
MEDICARE SUPPLEMENT INSURANCE EXPERIENCE REPORTS
of
Domicile Code Code
Premiums
Earned
Share
Percentage
Cumulative
Market
Share
of Covered
Lives
September 13, 20172016
UnitedHealthcare Ins Co 79413 707 34,463,26616,521 21.861 21.9CT
Blue Cross of ID Hlth Serv Inc 60095 1290 18,892,4796,710 11.984 33.8ID
Continental Life Ins Co Brentwood 68500 1 16,115,48310,813 10.223 44.1TN
Mutual Of Omaha Ins Co 71412 261 15,255,2467,413 9.677 53.7NE
Regence Blueshield Of ID Inc 60131 1207 12,073,5814,310 7.659 61.4ID
United Of Omaha Life Ins Co 69868 261 11,283,7154,257 7.158 68.6NE
Transamerica Premier Life Ins Co 66281 468 6,515,2214,311 4.133 72.7IA
Sterling Life Ins Co 77399 901 4,619,7601,932 2.930 75.6IL
Bankers Life & Cas Co 61263 233 3,825,7311,299 2.427 78.1IL
Bankers Fidelity Life Ins Co 61239 587 3,819,7782,150 2.423 80.5GA
**TOTAL** 157,646,89574,090 100.000 100.0
CAUTION: THE INFORMATION CONTAINED ON THIS PAGE IS UNAUDITED AND NOT A COMPLETE ANALYSIS NOR IS IT AN EXPRESSION OF OPINION ON ANY INSURER. THIS PAGE MAY
CONTAIN INADVERTENT ERRORS.
© 2017 National Association of Insurance Commissioners 149
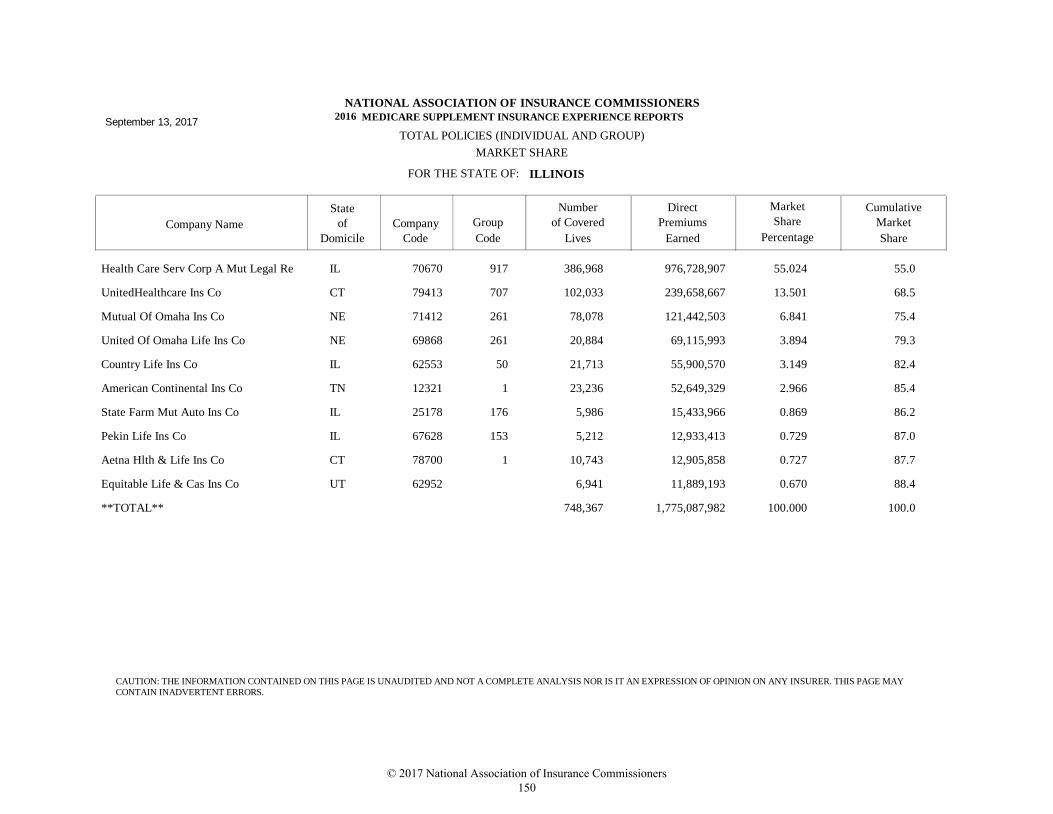
FOR THE STATE OF:
TOTAL POLICIES (INDIVIDUAL AND GROUP)
Company Name
State
Company Group
DirectNumber Market
ILLINOIS
MARKET SHARE
NATIONAL ASSOCIATION OF INSURANCE COMMISSIONERS
MEDICARE SUPPLEMENT INSURANCE EXPERIENCE REPORTS
of
Domicile Code Code
Premiums
Earned
Share
Percentage
Cumulative
Market
Share
of Covered
Lives
September 13, 20172016
Health Care Serv Corp A Mut Legal Re 70670 917 976,728,907386,968 55.024 55.0IL
UnitedHealthcare Ins Co 79413 707 239,658,667102,033 13.501 68.5CT
Mutual Of Omaha Ins Co 71412 261 121,442,50378,078 6.841 75.4NE
United Of Omaha Life Ins Co 69868 261 69,115,99320,884 3.894 79.3NE
Country Life Ins Co 62553 50 55,900,57021,713 3.149 82.4IL
American Continental Ins Co 12321 1 52,649,32923,236 2.966 85.4TN
State Farm Mut Auto Ins Co 25178 176 15,433,9665,986 0.869 86.2IL
Pekin Life Ins Co 67628 153 12,933,4135,212 0.729 87.0IL
Aetna Hlth & Life Ins Co 78700 1 12,905,85810,743 0.727 87.7CT
Equitable Life & Cas Ins Co 62952 11,889,1936,941 0.670 88.4UT
**TOTAL** 1,775,087,982748,367 100.000 100.0
CAUTION: THE INFORMATION CONTAINED ON THIS PAGE IS UNAUDITED AND NOT A COMPLETE ANALYSIS NOR IS IT AN EXPRESSION OF OPINION ON ANY INSURER. THIS PAGE MAY
CONTAIN INADVERTENT ERRORS.
© 2017 National Association of Insurance Commissioners 150

FOR THE STATE OF:
TOTAL POLICIES (INDIVIDUAL AND GROUP)
Company Name
State
Company Group
DirectNumber Market
INDIANA
MARKET SHARE
NATIONAL ASSOCIATION OF INSURANCE COMMISSIONERS
MEDICARE SUPPLEMENT INSURANCE EXPERIENCE REPORTS
of
Domicile Code Code
Premiums
Earned
Share
Percentage
Cumulative
Market
Share
of Covered
Lives
September 13, 20172016
UnitedHealthcare Ins Co 79413 707 226,786,63495,550 27.447 27.4CT
Anthem Ins Co Inc 28207 671 136,073,32548,711 16.468 43.9IN
United Of Omaha Life Ins Co 69868 261 79,683,23531,517 9.644 53.6NE
United World Life Ins Co 72850 261 39,495,89910,562 4.780 58.3NE
Medico Ins Co 31119 3527 24,704,86817,073 2.990 61.3NE
Colonial Penn Life Ins Co 62065 233 21,702,70812,681 2.627 64.0PA
Gerber Life Ins Co 70939 4483 19,720,0958,142 2.387 66.3NY
American Retirement Life Ins Co 88366 901 18,630,99211,629 2.255 68.6OH
Omaha Ins Co 13100 261 17,687,98614,288 2.141 70.7NE
Continental Life Ins Co Brentwood 68500 1 17,524,37216,520 2.121 72.9TN
**TOTAL** 826,275,401366,003 100.000 100.0
CAUTION: THE INFORMATION CONTAINED ON THIS PAGE IS UNAUDITED AND NOT A COMPLETE ANALYSIS NOR IS IT AN EXPRESSION OF OPINION ON ANY INSURER. THIS PAGE MAY
CONTAIN INADVERTENT ERRORS.
© 2017 National Association of Insurance Commissioners 151

FOR THE STATE OF:
TOTAL POLICIES (INDIVIDUAL AND GROUP)
Company Name
State
Company Group
DirectNumber Market
IOWA
MARKET SHARE
NATIONAL ASSOCIATION OF INSURANCE COMMISSIONERS
MEDICARE SUPPLEMENT INSURANCE EXPERIENCE REPORTS
of
Domicile Code Code
Premiums
Earned
Share
Percentage
Cumulative
Market
Share
of Covered
Lives
September 13, 20172016
Wellmark Inc 88848 770 376,547,645169,805 60.081 60.1IA
Continental Life Ins Co Brentwood 68500 1 35,745,84518,265 5.704 65.8TN
UnitedHealthcare Ins Co 79413 707 34,612,17716,077 5.523 71.3CT
United Of Omaha Life Ins Co 69868 261 29,035,13110,609 4.633 75.9NE
American Republic Ins Co 60836 3527 23,135,1869,197 3.691 79.6IA
Equitable Life & Cas Ins Co 62952 14,104,0278,203 2.250 81.9UT
Omaha Ins Co 13100 261 12,192,4039,823 1.945 83.8NE
American Republic Corp Ins Co 67679 3527 9,028,1093,371 1.441 85.3NE
Bankers Life & Cas Co 61263 233 7,509,8482,383 1.198 86.5IL
Aetna Hlth & Life Ins Co 78700 1 7,333,4006,729 1.170 87.6CT
**TOTAL** 626,730,705291,945 100.000 100.0
CAUTION: THE INFORMATION CONTAINED ON THIS PAGE IS UNAUDITED AND NOT A COMPLETE ANALYSIS NOR IS IT AN EXPRESSION OF OPINION ON ANY INSURER. THIS PAGE MAY
CONTAIN INADVERTENT ERRORS.
© 2017 National Association of Insurance Commissioners 152

FOR THE STATE OF:
TOTAL POLICIES (INDIVIDUAL AND GROUP)
Company Name
State
Company Group
DirectNumber Market
KANSAS
MARKET SHARE
NATIONAL ASSOCIATION OF INSURANCE COMMISSIONERS
MEDICARE SUPPLEMENT INSURANCE EXPERIENCE REPORTS
of
Domicile Code Code
Premiums
Earned
Share
Percentage
Cumulative
Market
Share
of Covered
Lives
September 13, 20172016
BCBS Of KS Inc 70729 430 269,907,681112,576 50.339 50.3KS
UnitedHealthcare Ins Co 79413 707 63,504,47328,198 11.844 62.2CT
United World Life Ins Co 72850 261 27,658,8547,797 5.158 67.3NE
BCBS of KC 47171 537 21,988,6498,560 4.101 71.4MO
American Continental Ins Co 12321 1 20,998,0298,164 3.916 75.4TN
American Retirement Life Ins Co 88366 901 12,126,4226,632 2.262 77.6OH
Aetna Hlth & Life Ins Co 78700 1 10,420,3637,589 1.943 79.6CT
Old Surety Life Ins Co 67326 6,374,6903,750 1.189 80.8OK
Medico Corp Life Ins Co 79987 3527 5,342,9753,437 0.996 81.7NE
State Farm Mut Auto Ins Co 25178 176 5,335,2671,835 0.995 82.7IL
**TOTAL** 536,181,328233,988 100.000 100.0
CAUTION: THE INFORMATION CONTAINED ON THIS PAGE IS UNAUDITED AND NOT A COMPLETE ANALYSIS NOR IS IT AN EXPRESSION OF OPINION ON ANY INSURER. THIS PAGE MAY
CONTAIN INADVERTENT ERRORS.
© 2017 National Association of Insurance Commissioners 153
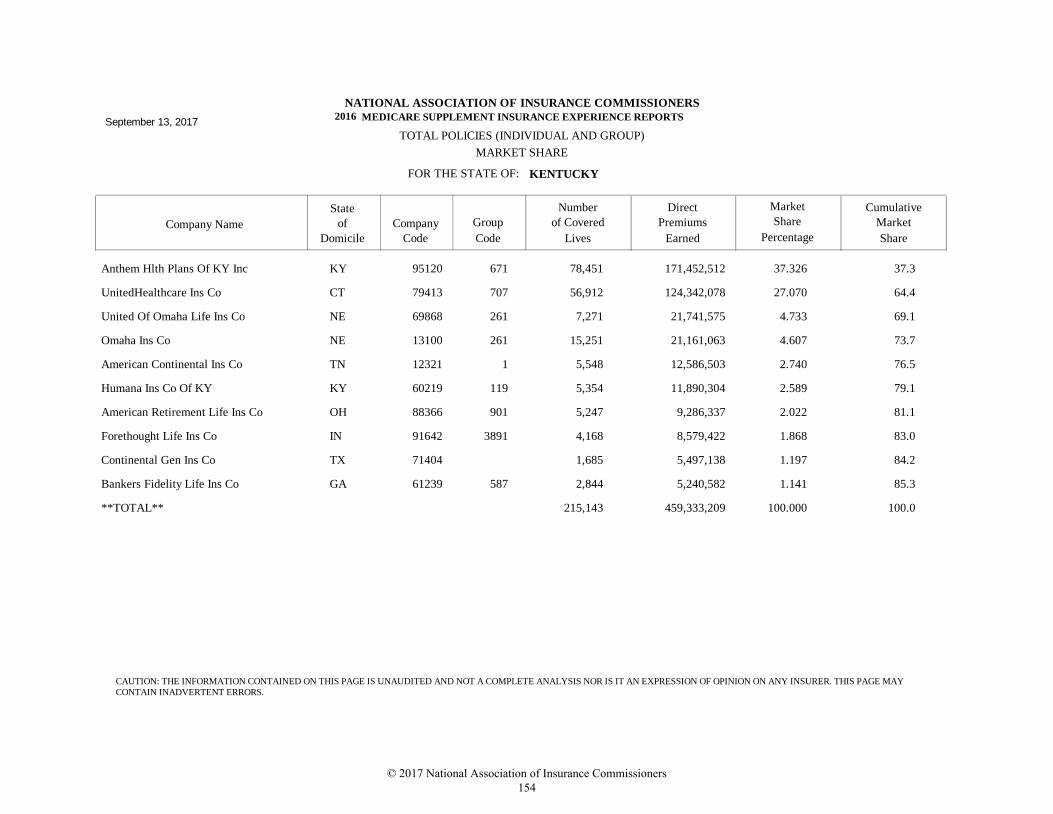
FOR THE STATE OF:
TOTAL POLICIES (INDIVIDUAL AND GROUP)
Company Name
State
Company Group
DirectNumber Market
KENTUCKY
MARKET SHARE
NATIONAL ASSOCIATION OF INSURANCE COMMISSIONERS
MEDICARE SUPPLEMENT INSURANCE EXPERIENCE REPORTS
of
Domicile Code Code
Premiums
Earned
Share
Percentage
Cumulative
Market
Share
of Covered
Lives
September 13, 20172016
Anthem Hlth Plans Of KY Inc 95120 671 171,452,51278,451 37.326 37.3KY
UnitedHealthcare Ins Co 79413 707 124,342,07856,912 27.070 64.4CT
United Of Omaha Life Ins Co 69868 261 21,741,5757,271 4.733 69.1NE
Omaha Ins Co 13100 261 21,161,06315,251 4.607 73.7NE
American Continental Ins Co 12321 1 12,586,5035,548 2.740 76.5TN
Humana Ins Co Of KY 60219 119 11,890,3045,354 2.589 79.1KY
American Retirement Life Ins Co 88366 901 9,286,3375,247 2.022 81.1OH
Forethought Life Ins Co 91642 3891 8,579,4224,168 1.868 83.0IN
Continental Gen Ins Co 71404 5,497,1381,685 1.197 84.2TX
Bankers Fidelity Life Ins Co 61239 587 5,240,5822,844 1.141 85.3GA
**TOTAL** 459,333,209215,143 100.000 100.0
CAUTION: THE INFORMATION CONTAINED ON THIS PAGE IS UNAUDITED AND NOT A COMPLETE ANALYSIS NOR IS IT AN EXPRESSION OF OPINION ON ANY INSURER. THIS PAGE MAY
CONTAIN INADVERTENT ERRORS.
© 2017 National Association of Insurance Commissioners 154
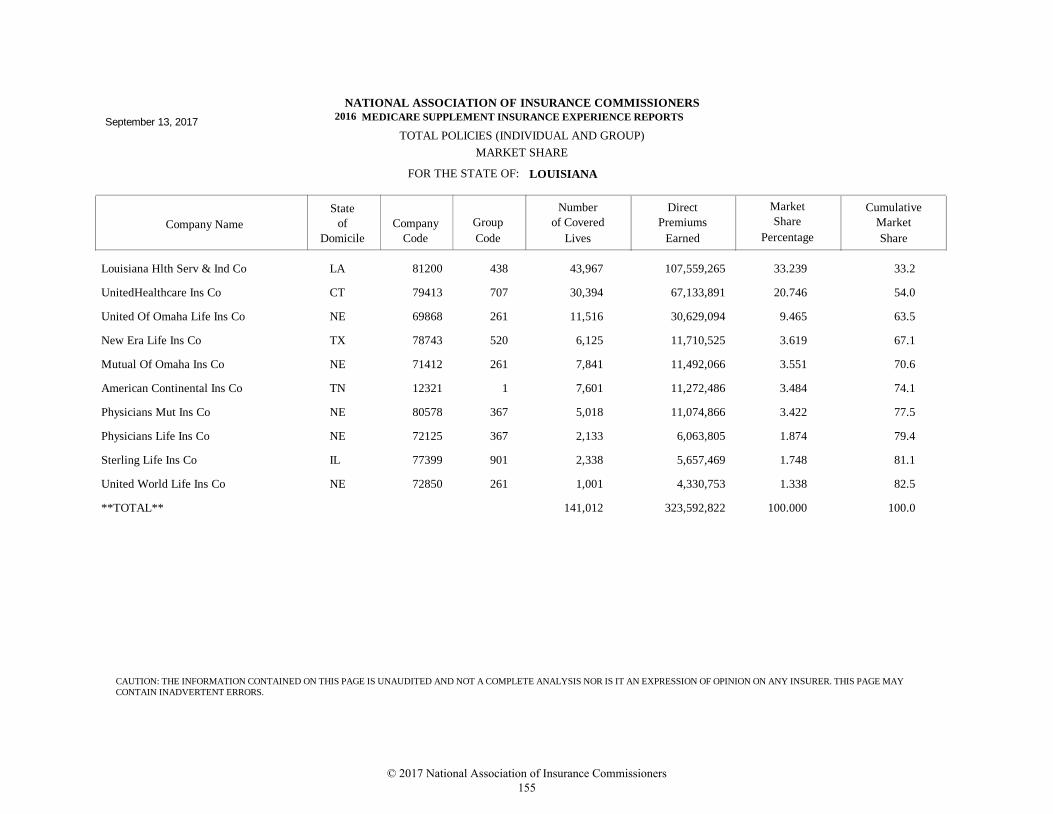
FOR THE STATE OF:
TOTAL POLICIES (INDIVIDUAL AND GROUP)
Company Name
State
Company Group
DirectNumber Market
LOUISIANA
MARKET SHARE
NATIONAL ASSOCIATION OF INSURANCE COMMISSIONERS
MEDICARE SUPPLEMENT INSURANCE EXPERIENCE REPORTS
of
Domicile Code Code
Premiums
Earned
Share
Percentage
Cumulative
Market
Share
of Covered
Lives
September 13, 20172016
Louisiana Hlth Serv & Ind Co 81200 438 107,559,26543,967 33.239 33.2LA
UnitedHealthcare Ins Co 79413 707 67,133,89130,394 20.746 54.0CT
United Of Omaha Life Ins Co 69868 261 30,629,09411,516 9.465 63.5NE
New Era Life Ins Co 78743 520 11,710,5256,125 3.619 67.1TX
Mutual Of Omaha Ins Co 71412 261 11,492,0667,841 3.551 70.6NE
American Continental Ins Co 12321 1 11,272,4867,601 3.484 74.1TN
Physicians Mut Ins Co 80578 367 11,074,8665,018 3.422 77.5NE
Physicians Life Ins Co 72125 367 6,063,8052,133 1.874 79.4NE
Sterling Life Ins Co 77399 901 5,657,4692,338 1.748 81.1IL
United World Life Ins Co 72850 261 4,330,7531,001 1.338 82.5NE
**TOTAL** 323,592,822141,012 100.000 100.0
CAUTION: THE INFORMATION CONTAINED ON THIS PAGE IS UNAUDITED AND NOT A COMPLETE ANALYSIS NOR IS IT AN EXPRESSION OF OPINION ON ANY INSURER. THIS PAGE MAY
CONTAIN INADVERTENT ERRORS.
© 2017 National Association of Insurance Commissioners 155

FOR THE STATE OF:
TOTAL POLICIES (INDIVIDUAL AND GROUP)
Company Name
State
Company Group
DirectNumber Market
MAINE
MARKET SHARE
NATIONAL ASSOCIATION OF INSURANCE COMMISSIONERS
MEDICARE SUPPLEMENT INSURANCE EXPERIENCE REPORTS
of
Domicile Code Code
Premiums
Earned
Share
Percentage
Cumulative
Market
Share
of Covered
Lives
September 13, 20172016
UnitedHealthcare Ins Co 79413 707 93,669,84940,589 58.128 58.1CT
Anthem Hlth Plans of ME Inc 52618 671 44,889,04920,412 27.856 86.0ME
HPHC Ins Co Inc 18975 595 7,224,4413,292 4.483 90.5MA
Transamerica Life Ins Co 86231 468 3,558,5761,937 2.208 92.7IA
Colonial Penn Life Ins Co 62065 233 2,755,9921,399 1.710 94.4PA
Bankers Life & Cas Co 61263 233 1,290,714614 0.801 95.2IL
Mutual Of Omaha Ins Co 71412 261 985,965260 0.612 95.8NE
United Of Omaha Life Ins Co 69868 261 881,991389 0.547 96.3NE
Principal Life Ins Co 61271 332 864,760191 0.537 96.9IA
Central States Ind Co Of Omaha 34274 31 785,353885 0.487 97.4NE
**TOTAL** 161,145,14172,053 100.000 100.0
CAUTION: THE INFORMATION CONTAINED ON THIS PAGE IS UNAUDITED AND NOT A COMPLETE ANALYSIS NOR IS IT AN EXPRESSION OF OPINION ON ANY INSURER. THIS PAGE MAY
CONTAIN INADVERTENT ERRORS.
© 2017 National Association of Insurance Commissioners 156

FOR THE STATE OF:
TOTAL POLICIES (INDIVIDUAL AND GROUP)
Company Name
State
Company Group
DirectNumber Market
MARYLAND
MARKET SHARE
NATIONAL ASSOCIATION OF INSURANCE COMMISSIONERS
MEDICARE SUPPLEMENT INSURANCE EXPERIENCE REPORTS
of
Domicile Code Code
Premiums
Earned
Share
Percentage
Cumulative
Market
Share
of Covered
Lives
September 13, 20172016
UnitedHealthcare Ins Co 79413 707 243,909,02299,866 43.287 43.3CT
Carefirst of MD Inc 47058 380 151,086,94153,587 26.814 70.1MD
Omaha Ins Co 13100 261 30,171,08219,737 5.355 75.5NE
United World Life Ins Co 72850 261 16,343,9744,205 2.901 78.4NE
United Amer Ins Co 92916 290 16,029,3145,182 2.845 81.2NE
Colonial Penn Life Ins Co 62065 233 15,399,3647,650 2.733 83.9PA
Continental Life Ins Co Brentwood 68500 1 14,355,9897,717 2.548 86.5TN
Group Hospitalization & Med Srvcs 53007 380 12,402,4915,644 2.201 88.7DC
USAA Life Ins Co 69663 200 11,927,4094,495 2.117 90.8TX
Humana Ins Co 73288 119 5,680,7032,625 1.008 91.8WI
**TOTAL** 563,465,191228,689 100.000 100.0
CAUTION: THE INFORMATION CONTAINED ON THIS PAGE IS UNAUDITED AND NOT A COMPLETE ANALYSIS NOR IS IT AN EXPRESSION OF OPINION ON ANY INSURER. THIS PAGE MAY
CONTAIN INADVERTENT ERRORS.
© 2017 National Association of Insurance Commissioners 157
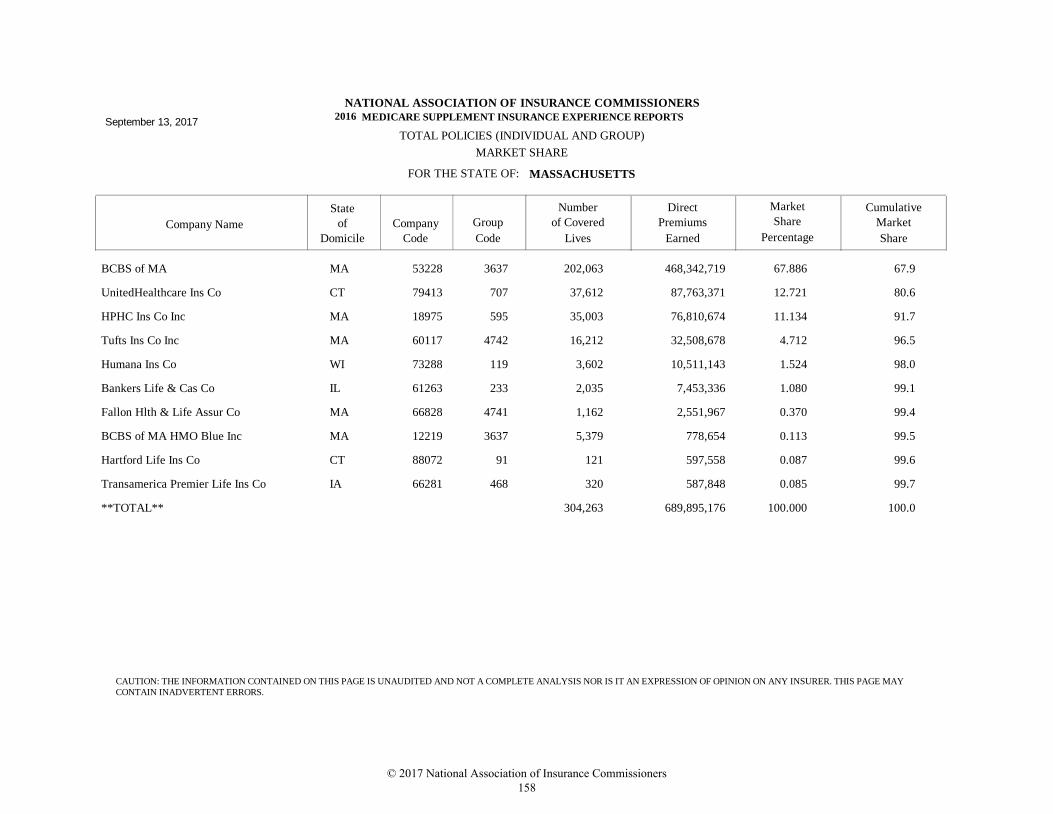
FOR THE STATE OF:
TOTAL POLICIES (INDIVIDUAL AND GROUP)
Company Name
State
Company Group
DirectNumber Market
MASSACHUSETTS
MARKET SHARE
NATIONAL ASSOCIATION OF INSURANCE COMMISSIONERS
MEDICARE SUPPLEMENT INSURANCE EXPERIENCE REPORTS
of
Domicile Code Code
Premiums
Earned
Share
Percentage
Cumulative
Market
Share
of Covered
Lives
September 13, 20172016
BCBS of MA 53228 3637 468,342,719202,063 67.886 67.9MA
UnitedHealthcare Ins Co 79413 707 87,763,37137,612 12.721 80.6CT
HPHC Ins Co Inc 18975 595 76,810,67435,003 11.134 91.7MA
Tufts Ins Co Inc 60117 4742 32,508,67816,212 4.712 96.5MA
Humana Ins Co 73288 119 10,511,1433,602 1.524 98.0WI
Bankers Life & Cas Co 61263 233 7,453,3362,035 1.080 99.1IL
Fallon Hlth & Life Assur Co 66828 4741 2,551,9671,162 0.370 99.4MA
BCBS of MA HMO Blue Inc 12219 3637 778,6545,379 0.113 99.5MA
Hartford Life Ins Co 88072 91 597,558121 0.087 99.6CT
Transamerica Premier Life Ins Co 66281 468 587,848320 0.085 99.7IA
**TOTAL** 689,895,176304,263 100.000 100.0
CAUTION: THE INFORMATION CONTAINED ON THIS PAGE IS UNAUDITED AND NOT A COMPLETE ANALYSIS NOR IS IT AN EXPRESSION OF OPINION ON ANY INSURER. THIS PAGE MAY
CONTAIN INADVERTENT ERRORS.
© 2017 National Association of Insurance Commissioners 158
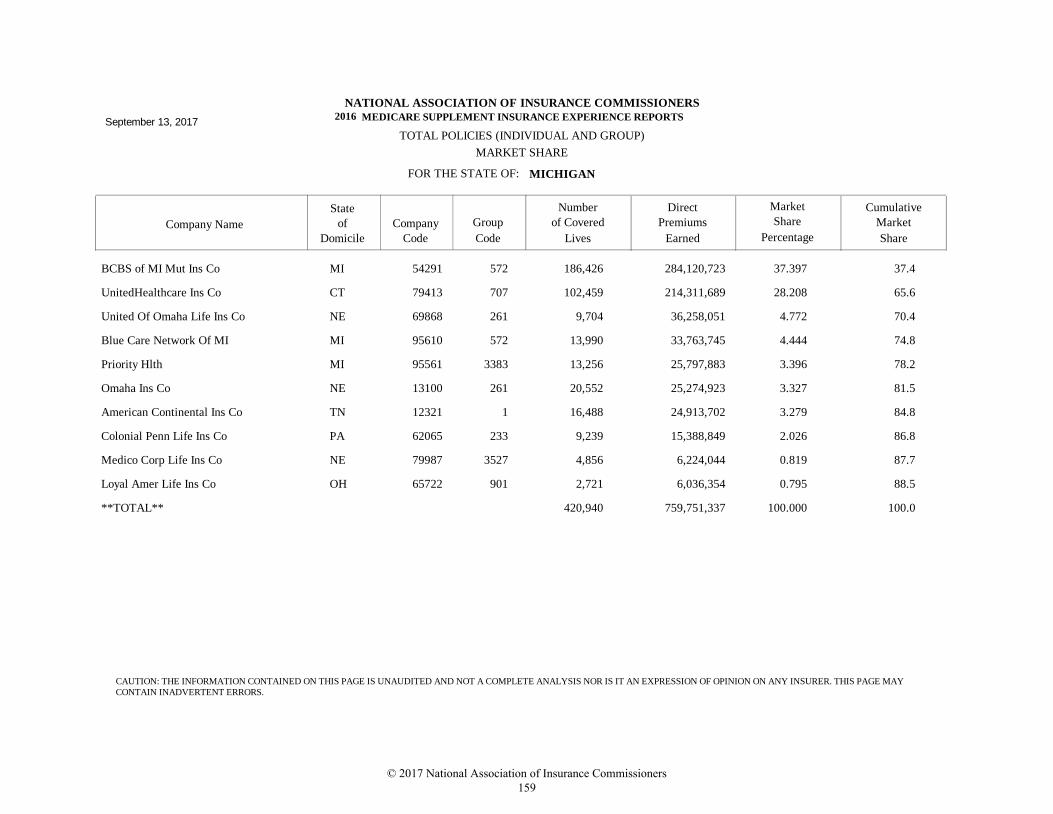
FOR THE STATE OF:
TOTAL POLICIES (INDIVIDUAL AND GROUP)
Company Name
State
Company Group
DirectNumber Market
MICHIGAN
MARKET SHARE
NATIONAL ASSOCIATION OF INSURANCE COMMISSIONERS
MEDICARE SUPPLEMENT INSURANCE EXPERIENCE REPORTS
of
Domicile Code Code
Premiums
Earned
Share
Percentage
Cumulative
Market
Share
of Covered
Lives
September 13, 20172016
BCBS of MI Mut Ins Co 54291 572 284,120,723186,426 37.397 37.4MI
UnitedHealthcare Ins Co 79413 707 214,311,689102,459 28.208 65.6CT
United Of Omaha Life Ins Co 69868 261 36,258,0519,704 4.772 70.4NE
Blue Care Network Of MI 95610 572 33,763,74513,990 4.444 74.8MI
Priority Hlth 95561 3383 25,797,88313,256 3.396 78.2MI
Omaha Ins Co 13100 261 25,274,92320,552 3.327 81.5NE
American Continental Ins Co 12321 1 24,913,70216,488 3.279 84.8TN
Colonial Penn Life Ins Co 62065 233 15,388,8499,239 2.026 86.8PA
Medico Corp Life Ins Co 79987 3527 6,224,0444,856 0.819 87.7NE
Loyal Amer Life Ins Co 65722 901 6,036,3542,721 0.795 88.5OH
**TOTAL** 759,751,337420,940 100.000 100.0
CAUTION: THE INFORMATION CONTAINED ON THIS PAGE IS UNAUDITED AND NOT A COMPLETE ANALYSIS NOR IS IT AN EXPRESSION OF OPINION ON ANY INSURER. THIS PAGE MAY
CONTAIN INADVERTENT ERRORS.
© 2017 National Association of Insurance Commissioners 159

FOR THE STATE OF:
TOTAL POLICIES (INDIVIDUAL AND GROUP)
Company Name
State
Company Group
DirectNumber Market
MINNESOTA
MARKET SHARE
NATIONAL ASSOCIATION OF INSURANCE COMMISSIONERS
MEDICARE SUPPLEMENT INSURANCE EXPERIENCE REPORTS
of
Domicile Code Code
Premiums
Earned
Share
Percentage
Cumulative
Market
Share
of Covered
Lives
September 13, 20172016
BCBSM Inc 55026 461 224,370,05383,222 73.284 73.3MN
UnitedHealthcare Ins Co 79413 707 34,198,82214,796 11.170 84.5CT
Continental Life Ins Co Brentwood 68500 1 7,859,1493,667 2.567 87.0TN
State Farm Mut Auto Ins Co 25178 176 5,786,8512,266 1.890 88.9IL
United World Life Ins Co 72850 261 3,613,2831,108 1.180 90.1NE
Bankers Life & Cas Co 61263 233 3,385,7731,069 1.106 91.2IL
Colonial Penn Life Ins Co 62065 233 3,109,3561,785 1.016 92.2PA
Mutual Of Omaha Ins Co 71412 261 3,070,105826 1.003 93.2NE
Omaha Ins Co 13100 261 2,562,8991,651 0.837 94.1NE
Combined Ins Co Of Amer 62146 626 2,207,746657 0.721 94.8IL
**TOTAL** 306,166,826116,464 100.000 100.0
CAUTION: THE INFORMATION CONTAINED ON THIS PAGE IS UNAUDITED AND NOT A COMPLETE ANALYSIS NOR IS IT AN EXPRESSION OF OPINION ON ANY INSURER. THIS PAGE MAY
CONTAIN INADVERTENT ERRORS.
© 2017 National Association of Insurance Commissioners 160

FOR THE STATE OF:
TOTAL POLICIES (INDIVIDUAL AND GROUP)
Company Name
State
Company Group
DirectNumber Market
MISSISSIPPI
MARKET SHARE
NATIONAL ASSOCIATION OF INSURANCE COMMISSIONERS
MEDICARE SUPPLEMENT INSURANCE EXPERIENCE REPORTS
of
Domicile Code Code
Premiums
Earned
Share
Percentage
Cumulative
Market
Share
of Covered
Lives
September 13, 20172016
UnitedHealthcare Ins Co 79413 707 64,401,08429,348 19.331 19.3CT
BCBS Of MS Mut Ins Co 60111 1126 33,436,59912,122 10.037 29.4MS
American Continental Ins Co 12321 1 32,055,44018,649 9.622 39.0TN
Philadelphia Amer Life Ins Co 67784 520 30,722,18417,051 9.222 48.2TX
United Of Omaha Life Ins Co 69868 261 24,348,2298,443 7.309 55.5NE
Omaha Ins Co 13100 261 17,272,57210,068 5.185 60.7NE
Mutual Of Omaha Ins Co 71412 261 16,806,4958,300 5.045 65.7NE
Manhattan Life Ins Co 65870 1117 11,908,4038,632 3.575 69.3NY
United World Life Ins Co 72850 261 11,715,4013,227 3.517 72.8NE
State Farm Mut Auto Ins Co 25178 176 7,990,9522,904 2.399 75.2IL
**TOTAL** 333,147,289150,863 100.000 100.0
CAUTION: THE INFORMATION CONTAINED ON THIS PAGE IS UNAUDITED AND NOT A COMPLETE ANALYSIS NOR IS IT AN EXPRESSION OF OPINION ON ANY INSURER. THIS PAGE MAY
CONTAIN INADVERTENT ERRORS.
© 2017 National Association of Insurance Commissioners 161

FOR THE STATE OF:
TOTAL POLICIES (INDIVIDUAL AND GROUP)
Company Name
State
Company Group
DirectNumber Market
MISSOURI
MARKET SHARE
NATIONAL ASSOCIATION OF INSURANCE COMMISSIONERS
MEDICARE SUPPLEMENT INSURANCE EXPERIENCE REPORTS
of
Domicile Code Code
Premiums
Earned
Share
Percentage
Cumulative
Market
Share
of Covered
Lives
September 13, 20172016
UnitedHealthcare Ins Co 79413 707 174,962,78377,758 23.830 23.8CT
Mutual Of Omaha Ins Co 71412 261 158,909,07773,488 21.644 45.5NE
Healthy Alliance Life Ins Co 78972 671 85,873,80033,464 11.696 57.2MO
Transamerica Premier Life Ins Co 66281 468 49,678,71824,461 6.766 63.9IA
BCBS of KC 47171 537 41,738,55214,234 5.685 69.6MO
United Of Omaha Life Ins Co 69868 261 28,882,7119,192 3.934 73.6NE
American Republic Ins Co 60836 3527 13,604,0944,967 1.853 75.4IA
Old Surety Life Ins Co 67326 13,035,1386,326 1.775 77.2OK
Humana Ins Co 73288 119 12,066,1095,595 1.643 78.8WI
Transamerica Life Ins Co 86231 468 12,039,9035,011 1.640 80.5IA
**TOTAL** 734,204,675315,136 100.000 100.0
CAUTION: THE INFORMATION CONTAINED ON THIS PAGE IS UNAUDITED AND NOT A COMPLETE ANALYSIS NOR IS IT AN EXPRESSION OF OPINION ON ANY INSURER. THIS PAGE MAY
CONTAIN INADVERTENT ERRORS.
© 2017 National Association of Insurance Commissioners 162

FOR THE STATE OF:
TOTAL POLICIES (INDIVIDUAL AND GROUP)
Company Name
State
Company Group
DirectNumber Market
MONTANA
MARKET SHARE
NATIONAL ASSOCIATION OF INSURANCE COMMISSIONERS
MEDICARE SUPPLEMENT INSURANCE EXPERIENCE REPORTS
of
Domicile Code Code
Premiums
Earned
Share
Percentage
Cumulative
Market
Share
of Covered
Lives
September 13, 20172016
Health Care Serv Corp A Mut Legal Re 70670 917 43,450,96119,217 28.697 28.7IL
UnitedHealthcare Ins Co 79413 707 24,012,62111,938 15.859 44.6CT
Sterling Life Ins Co 77399 901 12,307,9764,675 8.129 52.7IL
American Continental Ins Co 12321 1 8,994,0154,099 5.940 58.6TN
State Farm Mut Auto Ins Co 25178 176 5,501,2762,868 3.633 62.3IL
United World Life Ins Co 72850 261 4,525,1951,443 2.989 65.2NE
United Of Omaha Life Ins Co 69868 261 4,446,6453,086 2.937 68.2NE
Humana Ins Co 73288 119 4,373,4722,664 2.888 71.1WI
Mutual Of Omaha Ins Co 71412 261 3,903,4041,064 2.578 73.7NE
Old Surety Life Ins Co 67326 3,384,6481,721 2.235 75.9OK
**TOTAL** 151,411,17071,716 100.000 100.0
CAUTION: THE INFORMATION CONTAINED ON THIS PAGE IS UNAUDITED AND NOT A COMPLETE ANALYSIS NOR IS IT AN EXPRESSION OF OPINION ON ANY INSURER. THIS PAGE MAY
CONTAIN INADVERTENT ERRORS.
© 2017 National Association of Insurance Commissioners 163

FOR THE STATE OF:
TOTAL POLICIES (INDIVIDUAL AND GROUP)
Company Name
State
Company Group
DirectNumber Market
NEBRASKA
MARKET SHARE
NATIONAL ASSOCIATION OF INSURANCE COMMISSIONERS
MEDICARE SUPPLEMENT INSURANCE EXPERIENCE REPORTS
of
Domicile Code Code
Premiums
Earned
Share
Percentage
Cumulative
Market
Share
of Covered
Lives
September 13, 20172016
BCBS Of NE 77780 4858 174,049,51870,716 45.557 45.6NE
Mutual Of Omaha Ins Co 71412 261 22,268,2866,323 5.829 51.4NE
UnitedHealthcare Ins Co 79413 707 21,024,5268,343 5.503 56.9CT
American Continental Ins Co 12321 1 19,714,7369,283 5.160 62.0TN
Omaha Ins Co 13100 261 19,333,20316,805 5.060 67.1NE
United Of Omaha Life Ins Co 69868 261 14,329,7575,920 3.751 70.9NE
Physicians Mut Ins Co 80578 367 11,038,7556,228 2.889 73.7NE
Thrivent Financial For Lutherans 56014 2938 9,682,0684,096 2.534 76.3WI
Manhattan Life Ins Co 65870 1117 7,792,6256,182 2.040 78.3NY
Equitable Life & Cas Ins Co 62952 6,699,8323,979 1.754 80.1UT
**TOTAL** 382,049,234168,945 100.000 100.0
CAUTION: THE INFORMATION CONTAINED ON THIS PAGE IS UNAUDITED AND NOT A COMPLETE ANALYSIS NOR IS IT AN EXPRESSION OF OPINION ON ANY INSURER. THIS PAGE MAY
CONTAIN INADVERTENT ERRORS.
© 2017 National Association of Insurance Commissioners 164

FOR THE STATE OF:
TOTAL POLICIES (INDIVIDUAL AND GROUP)
Company Name
State
Company Group
DirectNumber Market
NEVADA
MARKET SHARE
NATIONAL ASSOCIATION OF INSURANCE COMMISSIONERS
MEDICARE SUPPLEMENT INSURANCE EXPERIENCE REPORTS
of
Domicile Code Code
Premiums
Earned
Share
Percentage
Cumulative
Market
Share
of Covered
Lives
September 13, 20172016
UnitedHealthcare Ins Co 79413 707 97,723,56642,762 49.278 49.3CT
Rocky Mountain Hospital & Medical 11011 671 23,746,4657,691 11.974 61.3CO
Mutual Of Omaha Ins Co 71412 261 9,694,2305,271 4.888 66.1NE
Equitable Life & Cas Ins Co 62952 8,905,9042,879 4.491 70.6UT
American Retirement Life Ins Co 88366 901 8,294,4435,137 4.183 74.8OH
Humana Ins Co 73288 119 7,633,5853,431 3.849 78.7WI
United Of Omaha Life Ins Co 69868 261 4,854,8811,412 2.448 81.1NE
American Continental Ins Co 12321 1 4,359,4253,233 2.198 83.3TN
United Amer Ins Co 92916 290 3,629,8381,332 1.830 85.1NE
USAA Life Ins Co 69663 200 2,919,6491,206 1.472 86.6TX
**TOTAL** 198,311,71485,417 100.000 100.0
CAUTION: THE INFORMATION CONTAINED ON THIS PAGE IS UNAUDITED AND NOT A COMPLETE ANALYSIS NOR IS IT AN EXPRESSION OF OPINION ON ANY INSURER. THIS PAGE MAY
CONTAIN INADVERTENT ERRORS.
© 2017 National Association of Insurance Commissioners 165
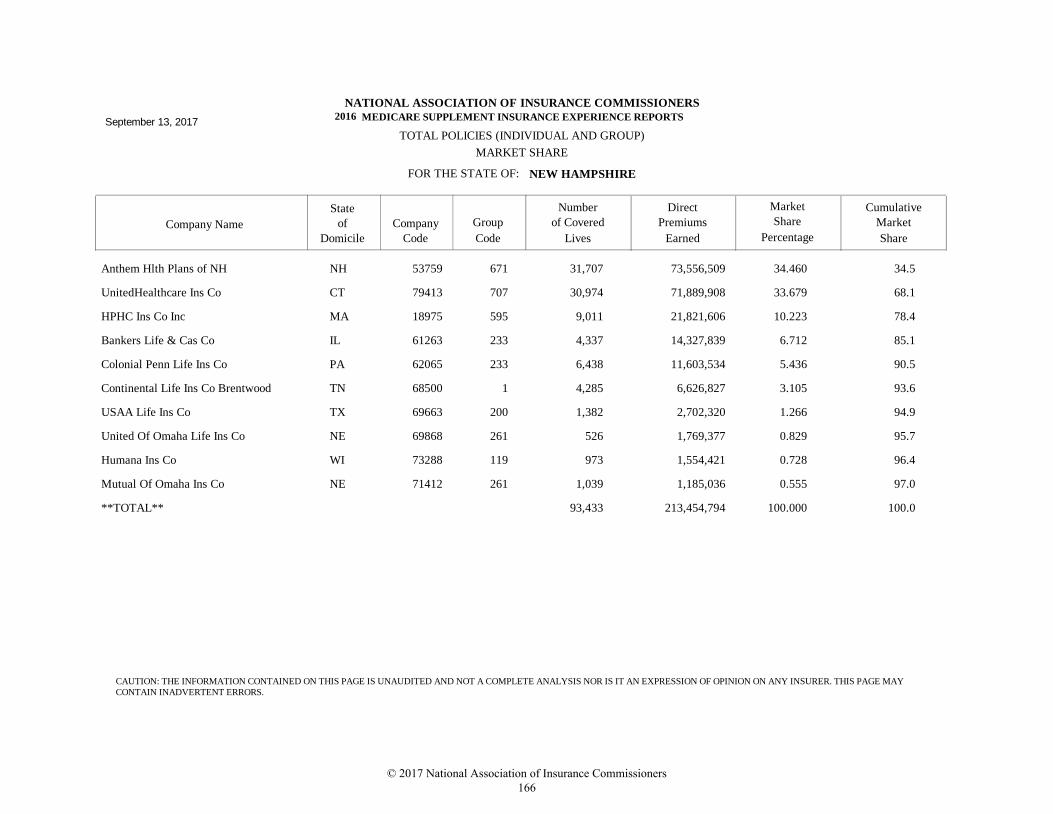
FOR THE STATE OF:
TOTAL POLICIES (INDIVIDUAL AND GROUP)
Company Name
State
Company Group
DirectNumber Market
NEW HAMPSHIRE
MARKET SHARE
NATIONAL ASSOCIATION OF INSURANCE COMMISSIONERS
MEDICARE SUPPLEMENT INSURANCE EXPERIENCE REPORTS
of
Domicile Code Code
Premiums
Earned
Share
Percentage
Cumulative
Market
Share
of Covered
Lives
September 13, 20172016
Anthem Hlth Plans of NH 53759 671 73,556,50931,707 34.460 34.5NH
UnitedHealthcare Ins Co 79413 707 71,889,90830,974 33.679 68.1CT
HPHC Ins Co Inc 18975 595 21,821,6069,011 10.223 78.4MA
Bankers Life & Cas Co 61263 233 14,327,8394,337 6.712 85.1IL
Colonial Penn Life Ins Co 62065 233 11,603,5346,438 5.436 90.5PA
Continental Life Ins Co Brentwood 68500 1 6,626,8274,285 3.105 93.6TN
USAA Life Ins Co 69663 200 2,702,3201,382 1.266 94.9TX
United Of Omaha Life Ins Co 69868 261 1,769,377526 0.829 95.7NE
Humana Ins Co 73288 119 1,554,421973 0.728 96.4WI
Mutual Of Omaha Ins Co 71412 261 1,185,0361,039 0.555 97.0NE
**TOTAL** 213,454,79493,433 100.000 100.0
CAUTION: THE INFORMATION CONTAINED ON THIS PAGE IS UNAUDITED AND NOT A COMPLETE ANALYSIS NOR IS IT AN EXPRESSION OF OPINION ON ANY INSURER. THIS PAGE MAY
CONTAIN INADVERTENT ERRORS.
© 2017 National Association of Insurance Commissioners 166
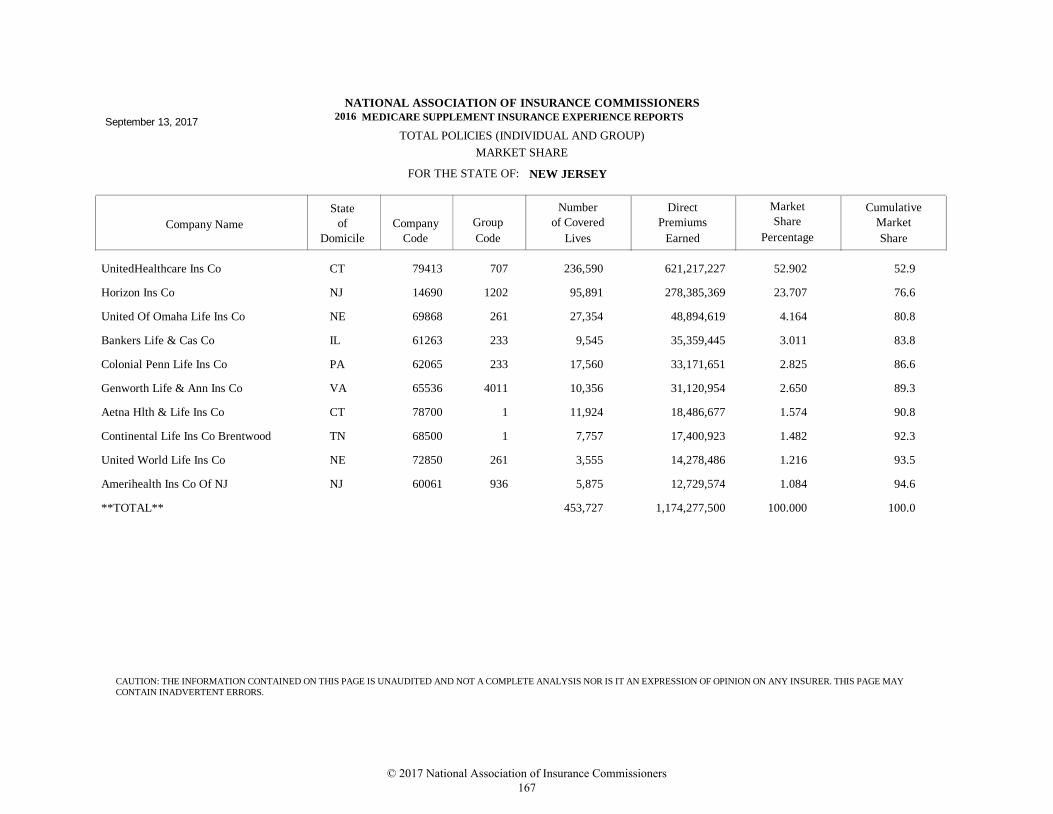
FOR THE STATE OF:
TOTAL POLICIES (INDIVIDUAL AND GROUP)
Company Name
State
Company Group
DirectNumber Market
NEW JERSEY
MARKET SHARE
NATIONAL ASSOCIATION OF INSURANCE COMMISSIONERS
MEDICARE SUPPLEMENT INSURANCE EXPERIENCE REPORTS
of
Domicile Code Code
Premiums
Earned
Share
Percentage
Cumulative
Market
Share
of Covered
Lives
September 13, 20172016
UnitedHealthcare Ins Co 79413 707 621,217,227236,590 52.902 52.9CT
Horizon Ins Co 14690 1202 278,385,36995,891 23.707 76.6NJ
United Of Omaha Life Ins Co 69868 261 48,894,61927,354 4.164 80.8NE
Bankers Life & Cas Co 61263 233 35,359,4459,545 3.011 83.8IL
Colonial Penn Life Ins Co 62065 233 33,171,65117,560 2.825 86.6PA
Genworth Life & Ann Ins Co 65536 4011 31,120,95410,356 2.650 89.3VA
Aetna Hlth & Life Ins Co 78700 1 18,486,67711,924 1.574 90.8CT
Continental Life Ins Co Brentwood 68500 1 17,400,9237,757 1.482 92.3TN
United World Life Ins Co 72850 261 14,278,4863,555 1.216 93.5NE
Amerihealth Ins Co Of NJ 60061 936 12,729,5745,875 1.084 94.6NJ
**TOTAL** 1,174,277,500453,727 100.000 100.0
CAUTION: THE INFORMATION CONTAINED ON THIS PAGE IS UNAUDITED AND NOT A COMPLETE ANALYSIS NOR IS IT AN EXPRESSION OF OPINION ON ANY INSURER. THIS PAGE MAY
CONTAIN INADVERTENT ERRORS.
© 2017 National Association of Insurance Commissioners 167

FOR THE STATE OF:
TOTAL POLICIES (INDIVIDUAL AND GROUP)
Company Name
State
Company Group
DirectNumber Market
NEW MEXICO
MARKET SHARE
NATIONAL ASSOCIATION OF INSURANCE COMMISSIONERS
MEDICARE SUPPLEMENT INSURANCE EXPERIENCE REPORTS
of
Domicile Code Code
Premiums
Earned
Share
Percentage
Cumulative
Market
Share
of Covered
Lives
September 13, 20172016
UnitedHealthcare Ins Co 79413 707 56,155,81829,048 50.059 50.1CT
Health Care Serv Corp A Mut Legal Re 70670 917 14,681,0826,937 13.087 63.1IL
United World Life Ins Co 72850 261 6,834,6822,843 6.093 69.2NE
United Of Omaha Life Ins Co 69868 261 5,977,3136,349 5.328 74.6NE
United Amer Ins Co 92916 290 3,891,4301,644 3.469 78.0NE
Mutual Of Omaha Ins Co 71412 261 3,657,0631,146 3.260 81.3NE
Humana Ins Co 73288 119 3,487,8912,001 3.109 84.4WI
USAA Life Ins Co 69663 200 2,648,5761,419 2.361 86.8TX
State Farm Mut Auto Ins Co 25178 176 1,413,093721 1.260 88.0IL
American Retirement Life Ins Co 88366 901 1,318,4091,037 1.175 89.2OH
**TOTAL** 112,178,23959,020 100.000 100.0
CAUTION: THE INFORMATION CONTAINED ON THIS PAGE IS UNAUDITED AND NOT A COMPLETE ANALYSIS NOR IS IT AN EXPRESSION OF OPINION ON ANY INSURER. THIS PAGE MAY
CONTAIN INADVERTENT ERRORS.
© 2017 National Association of Insurance Commissioners 168

FOR THE STATE OF:
TOTAL POLICIES (INDIVIDUAL AND GROUP)
Company Name
State
Company Group
DirectNumber Market
NEW YORK
MARKET SHARE
NATIONAL ASSOCIATION OF INSURANCE COMMISSIONERS
MEDICARE SUPPLEMENT INSURANCE EXPERIENCE REPORTS
of
Domicile Code Code
Premiums
Earned
Share
Percentage
Cumulative
Market
Share
of Covered
Lives
September 13, 20172016
United Hlthcare Ins Co Of NY 60093 707 974,687,521369,307 81.314 81.3NY
Empire Healthchoice Assur Inc 55093 671 78,608,60426,660 6.558 87.9NY
First United Amer Life Ins Co 74101 290 36,027,68926,352 3.006 90.9NY
Excellus Hlth Plan Inc 55107 1186 28,925,21511,397 2.413 93.3NY
Humana Ins Co of NY 12634 119 15,072,2537,506 1.257 94.5NY
Transamerica Financial Life Ins Co 70688 468 14,718,7315,500 1.228 95.8NY
Mutual Of Omaha Ins Co 71412 261 10,639,0522,363 0.888 96.7NE
CDPHP Universal Benefits Inc 47027 4708 9,478,7952,607 0.791 97.5NY
Health Now NY Inc 55204 6,812,0972,029 0.568 98.0NY
Bankers Conseco Life Ins Co 68560 233 6,223,9743,123 0.519 98.5NY
**TOTAL** 1,198,665,921462,130 100.000 100.0
CAUTION: THE INFORMATION CONTAINED ON THIS PAGE IS UNAUDITED AND NOT A COMPLETE ANALYSIS NOR IS IT AN EXPRESSION OF OPINION ON ANY INSURER. THIS PAGE MAY
CONTAIN INADVERTENT ERRORS.
© 2017 National Association of Insurance Commissioners 169
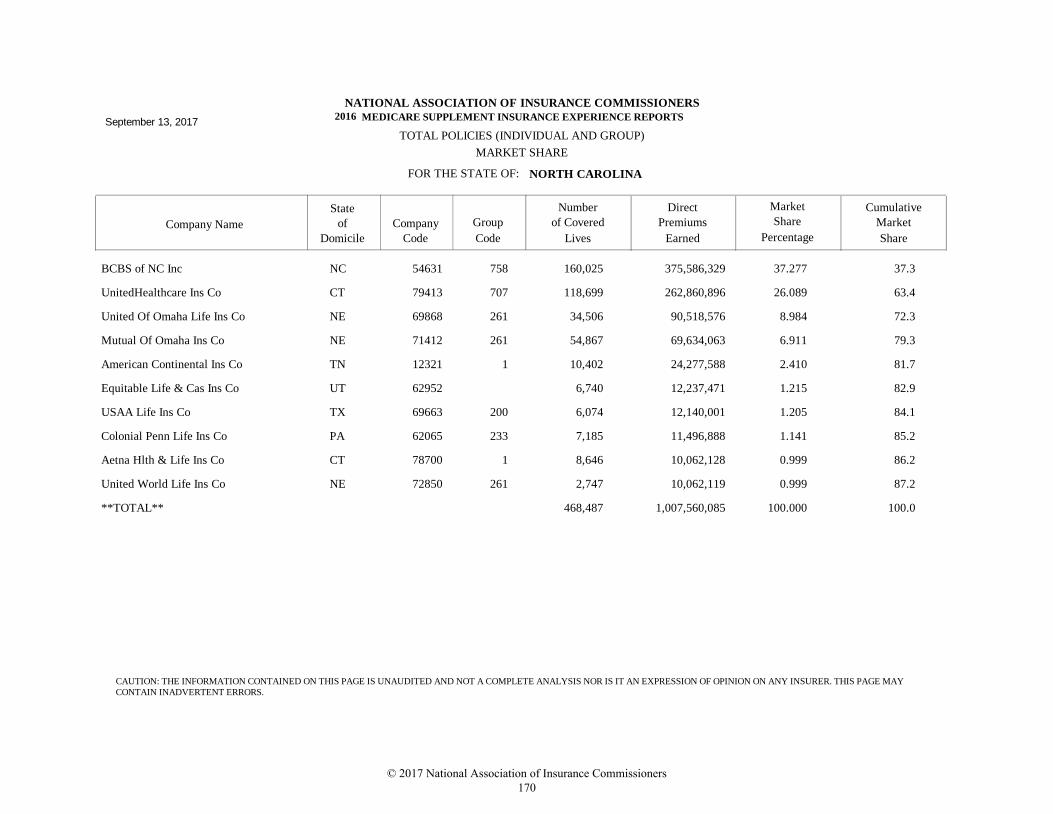
FOR THE STATE OF:
TOTAL POLICIES (INDIVIDUAL AND GROUP)
Company Name
State
Company Group
DirectNumber Market
NORTH CAROLINA
MARKET SHARE
NATIONAL ASSOCIATION OF INSURANCE COMMISSIONERS
MEDICARE SUPPLEMENT INSURANCE EXPERIENCE REPORTS
of
Domicile Code Code
Premiums
Earned
Share
Percentage
Cumulative
Market
Share
of Covered
Lives
September 13, 20172016
BCBS of NC Inc 54631 758 375,586,329160,025 37.277 37.3NC
UnitedHealthcare Ins Co 79413 707 262,860,896118,699 26.089 63.4CT
United Of Omaha Life Ins Co 69868 261 90,518,57634,506 8.984 72.3NE
Mutual Of Omaha Ins Co 71412 261 69,634,06354,867 6.911 79.3NE
American Continental Ins Co 12321 1 24,277,58810,402 2.410 81.7TN
Equitable Life & Cas Ins Co 62952 12,237,4716,740 1.215 82.9UT
USAA Life Ins Co 69663 200 12,140,0016,074 1.205 84.1TX
Colonial Penn Life Ins Co 62065 233 11,496,8887,185 1.141 85.2PA
Aetna Hlth & Life Ins Co 78700 1 10,062,1288,646 0.999 86.2CT
United World Life Ins Co 72850 261 10,062,1192,747 0.999 87.2NE
**TOTAL** 1,007,560,085468,487 100.000 100.0
CAUTION: THE INFORMATION CONTAINED ON THIS PAGE IS UNAUDITED AND NOT A COMPLETE ANALYSIS NOR IS IT AN EXPRESSION OF OPINION ON ANY INSURER. THIS PAGE MAY
CONTAIN INADVERTENT ERRORS.
© 2017 National Association of Insurance Commissioners 170
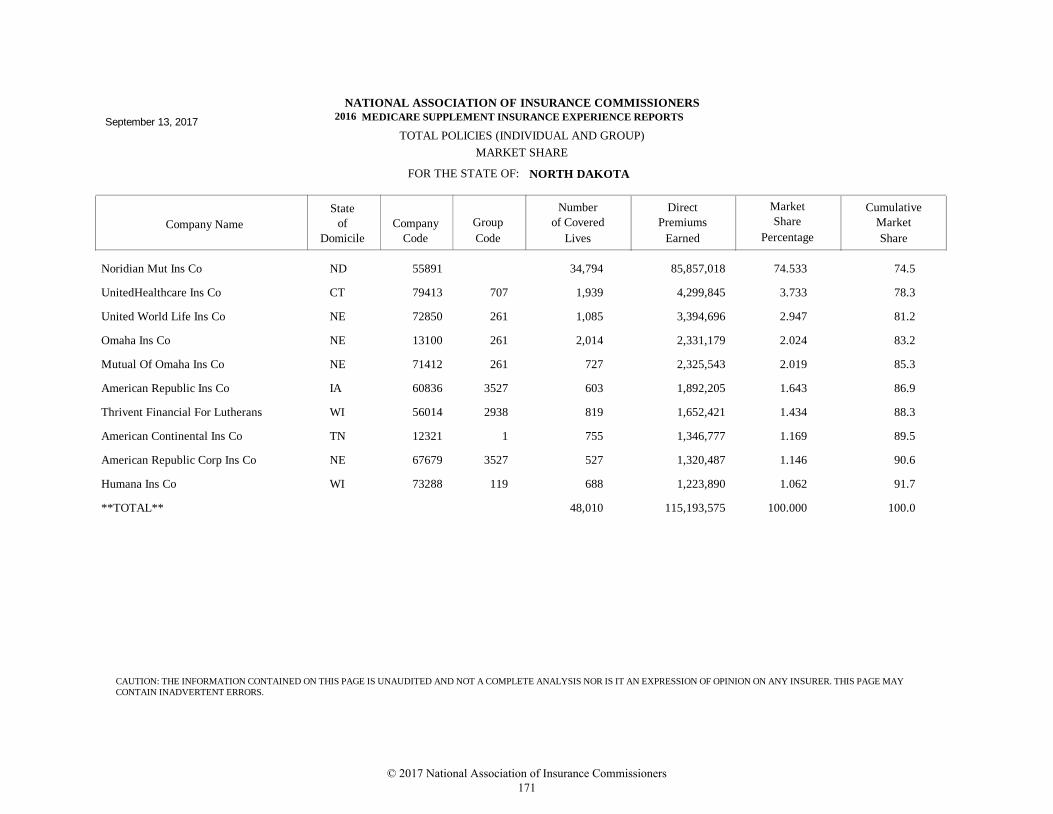
FOR THE STATE OF:
TOTAL POLICIES (INDIVIDUAL AND GROUP)
Company Name
State
Company Group
DirectNumber Market
NORTH DAKOTA
MARKET SHARE
NATIONAL ASSOCIATION OF INSURANCE COMMISSIONERS
MEDICARE SUPPLEMENT INSURANCE EXPERIENCE REPORTS
of
Domicile Code Code
Premiums
Earned
Share
Percentage
Cumulative
Market
Share
of Covered
Lives
September 13, 20172016
Noridian Mut Ins Co 55891 85,857,01834,794 74.533 74.5ND
UnitedHealthcare Ins Co 79413 707 4,299,8451,939 3.733 78.3CT
United World Life Ins Co 72850 261 3,394,6961,085 2.947 81.2NE
Omaha Ins Co 13100 261 2,331,1792,014 2.024 83.2NE
Mutual Of Omaha Ins Co 71412 261 2,325,543727 2.019 85.3NE
American Republic Ins Co 60836 3527 1,892,205603 1.643 86.9IA
Thrivent Financial For Lutherans 56014 2938 1,652,421819 1.434 88.3WI
American Continental Ins Co 12321 1 1,346,777755 1.169 89.5TN
American Republic Corp Ins Co 67679 3527 1,320,487527 1.146 90.6NE
Humana Ins Co 73288 119 1,223,890688 1.062 91.7WI
**TOTAL** 115,193,57548,010 100.000 100.0
CAUTION: THE INFORMATION CONTAINED ON THIS PAGE IS UNAUDITED AND NOT A COMPLETE ANALYSIS NOR IS IT AN EXPRESSION OF OPINION ON ANY INSURER. THIS PAGE MAY
CONTAIN INADVERTENT ERRORS.
© 2017 National Association of Insurance Commissioners 171

FOR THE STATE OF:
TOTAL POLICIES (INDIVIDUAL AND GROUP)
Company Name
State
Company Group
DirectNumber Market
OHIO
MARKET SHARE
NATIONAL ASSOCIATION OF INSURANCE COMMISSIONERS
MEDICARE SUPPLEMENT INSURANCE EXPERIENCE REPORTS
of
Domicile Code Code
Premiums
Earned
Share
Percentage
Cumulative
Market
Share
of Covered
Lives
September 13, 20172016
UnitedHealthcare Ins Co 79413 707 544,612,593250,615 46.521 46.5CT
Community Ins Co 10345 671 128,256,60453,076 10.956 57.5OH
Humana Ins Co 73288 119 93,451,10648,524 7.983 65.5WI
Medical Hlth Insuring Corp of OH 95828 730 49,838,01929,378 4.257 69.7OH
Omaha Ins Co 13100 261 30,459,14217,977 2.602 72.3NE
Medical Mut Of OH 29076 730 30,040,34712,616 2.566 74.9OH
United Of Omaha Life Ins Co 69868 261 29,309,1987,946 2.504 77.4NE
Aetna Hlth & Life Ins Co 78700 1 20,314,70717,362 1.735 79.1CT
Forethought Life Ins Co 91642 3891 17,587,0638,606 1.502 80.6IN
Colonial Penn Life Ins Co 62065 233 12,667,5706,889 1.082 81.7PA
**TOTAL** 1,170,671,183613,014 100.000 100.0
CAUTION: THE INFORMATION CONTAINED ON THIS PAGE IS UNAUDITED AND NOT A COMPLETE ANALYSIS NOR IS IT AN EXPRESSION OF OPINION ON ANY INSURER. THIS PAGE MAY
CONTAIN INADVERTENT ERRORS.
© 2017 National Association of Insurance Commissioners 172
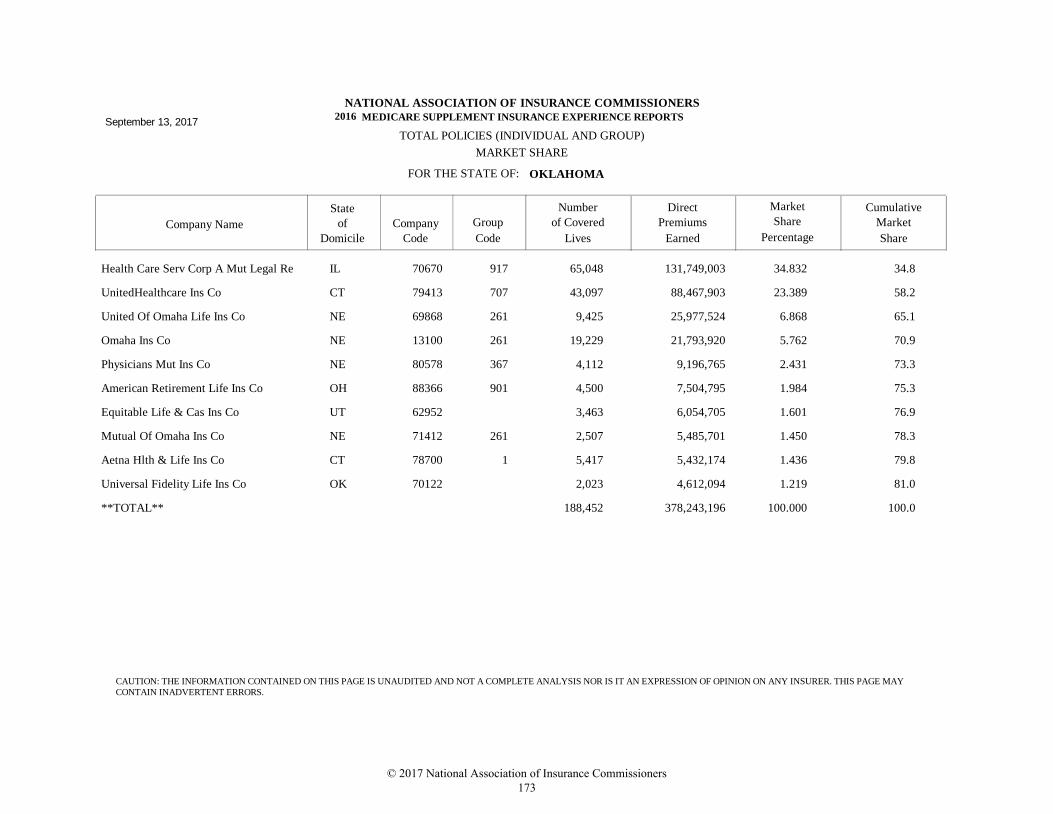
FOR THE STATE OF:
TOTAL POLICIES (INDIVIDUAL AND GROUP)
Company Name
State
Company Group
DirectNumber Market
OKLAHOMA
MARKET SHARE
NATIONAL ASSOCIATION OF INSURANCE COMMISSIONERS
MEDICARE SUPPLEMENT INSURANCE EXPERIENCE REPORTS
of
Domicile Code Code
Premiums
Earned
Share
Percentage
Cumulative
Market
Share
of Covered
Lives
September 13, 20172016
Health Care Serv Corp A Mut Legal Re 70670 917 131,749,00365,048 34.832 34.8IL
UnitedHealthcare Ins Co 79413 707 88,467,90343,097 23.389 58.2CT
United Of Omaha Life Ins Co 69868 261 25,977,5249,425 6.868 65.1NE
Omaha Ins Co 13100 261 21,793,92019,229 5.762 70.9NE
Physicians Mut Ins Co 80578 367 9,196,7654,112 2.431 73.3NE
American Retirement Life Ins Co 88366 901 7,504,7954,500 1.984 75.3OH
Equitable Life & Cas Ins Co 62952 6,054,7053,463 1.601 76.9UT
Mutual Of Omaha Ins Co 71412 261 5,485,7012,507 1.450 78.3NE
Aetna Hlth & Life Ins Co 78700 1 5,432,1745,417 1.436 79.8CT
Universal Fidelity Life Ins Co 70122 4,612,0942,023 1.219 81.0OK
**TOTAL** 378,243,196188,452 100.000 100.0
CAUTION: THE INFORMATION CONTAINED ON THIS PAGE IS UNAUDITED AND NOT A COMPLETE ANALYSIS NOR IS IT AN EXPRESSION OF OPINION ON ANY INSURER. THIS PAGE MAY
CONTAIN INADVERTENT ERRORS.
© 2017 National Association of Insurance Commissioners 173
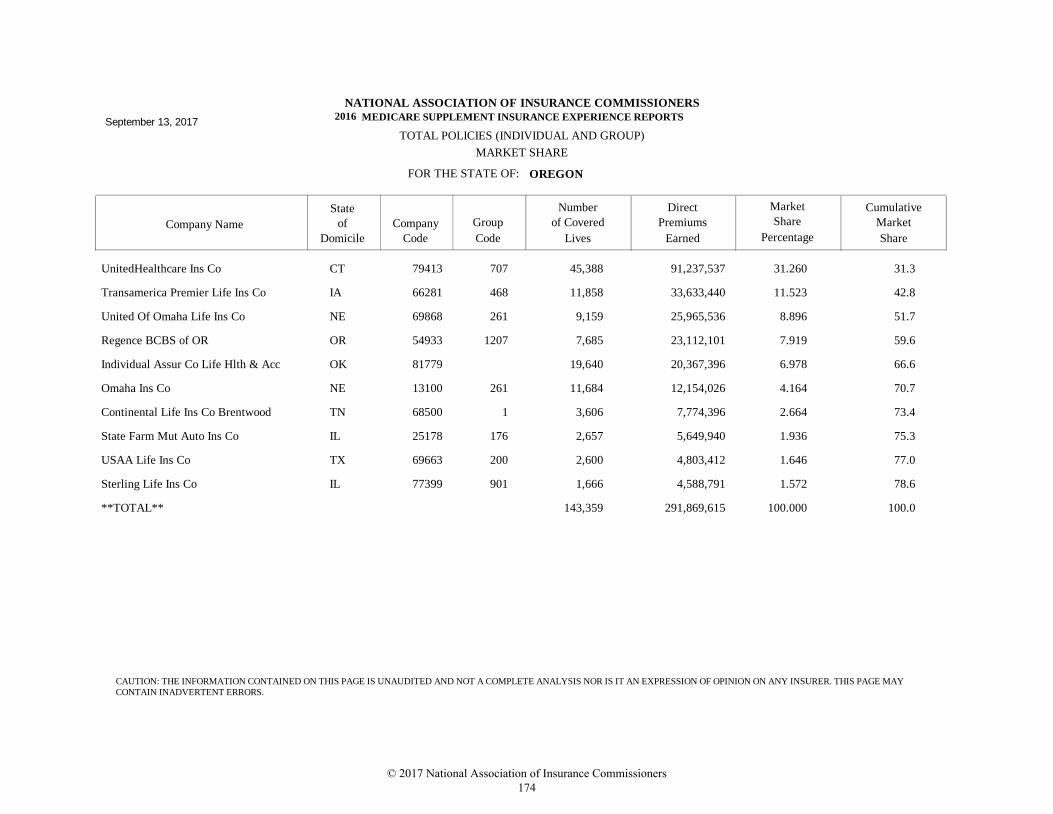
FOR THE STATE OF:
TOTAL POLICIES (INDIVIDUAL AND GROUP)
Company Name
State
Company Group
DirectNumber Market
OREGON
MARKET SHARE
NATIONAL ASSOCIATION OF INSURANCE COMMISSIONERS
MEDICARE SUPPLEMENT INSURANCE EXPERIENCE REPORTS
of
Domicile Code Code
Premiums
Earned
Share
Percentage
Cumulative
Market
Share
of Covered
Lives
September 13, 20172016
UnitedHealthcare Ins Co 79413 707 91,237,53745,388 31.260 31.3CT
Transamerica Premier Life Ins Co 66281 468 33,633,44011,858 11.523 42.8IA
United Of Omaha Life Ins Co 69868 261 25,965,5369,159 8.896 51.7NE
Regence BCBS of OR 54933 1207 23,112,1017,685 7.919 59.6OR
Individual Assur Co Life Hlth & Acc 81779 20,367,39619,640 6.978 66.6OK
Omaha Ins Co 13100 261 12,154,02611,684 4.164 70.7NE
Continental Life Ins Co Brentwood 68500 1 7,774,3963,606 2.664 73.4TN
State Farm Mut Auto Ins Co 25178 176 5,649,9402,657 1.936 75.3IL
USAA Life Ins Co 69663 200 4,803,4122,600 1.646 77.0TX
Sterling Life Ins Co 77399 901 4,588,7911,666 1.572 78.6IL
**TOTAL** 291,869,615143,359 100.000 100.0
CAUTION: THE INFORMATION CONTAINED ON THIS PAGE IS UNAUDITED AND NOT A COMPLETE ANALYSIS NOR IS IT AN EXPRESSION OF OPINION ON ANY INSURER. THIS PAGE MAY
CONTAIN INADVERTENT ERRORS.
© 2017 National Association of Insurance Commissioners 174
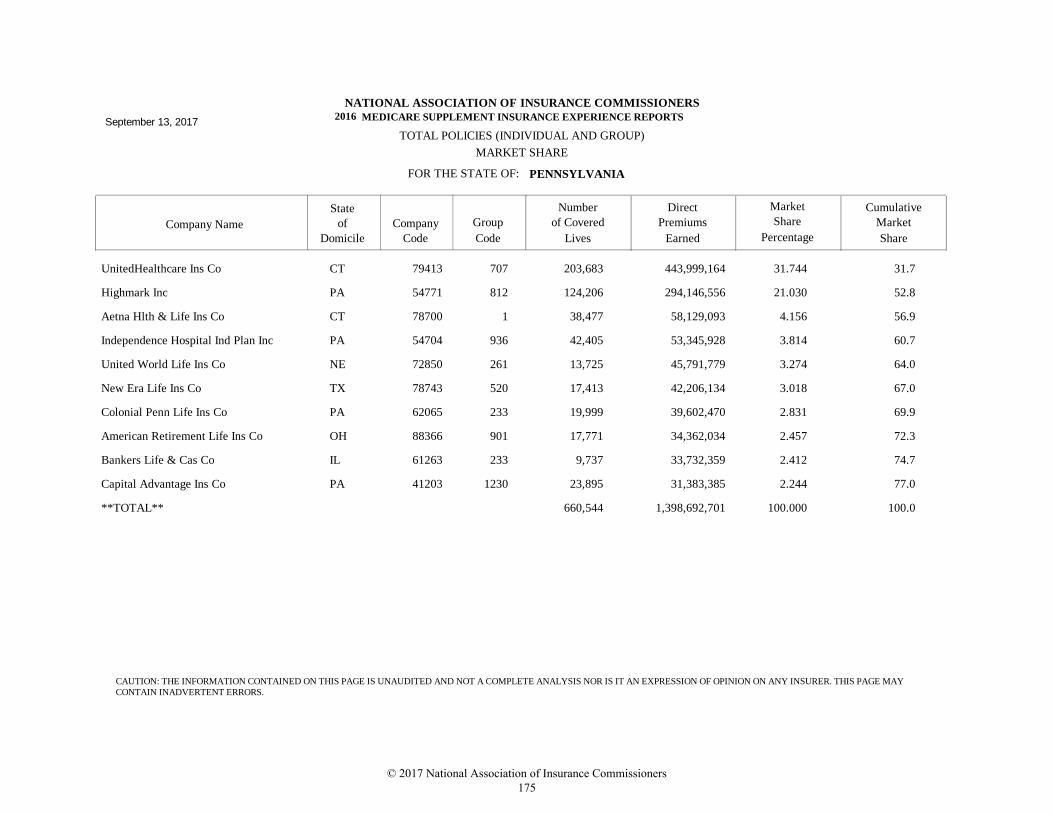
FOR THE STATE OF:
TOTAL POLICIES (INDIVIDUAL AND GROUP)
Company Name
State
Company Group
DirectNumber Market
PENNSYLVANIA
MARKET SHARE
NATIONAL ASSOCIATION OF INSURANCE COMMISSIONERS
MEDICARE SUPPLEMENT INSURANCE EXPERIENCE REPORTS
of
Domicile Code Code
Premiums
Earned
Share
Percentage
Cumulative
Market
Share
of Covered
Lives
September 13, 20172016
UnitedHealthcare Ins Co 79413 707 443,999,164203,683 31.744 31.7CT
Highmark Inc 54771 812 294,146,556124,206 21.030 52.8PA
Aetna Hlth & Life Ins Co 78700 1 58,129,09338,477 4.156 56.9CT
Independence Hospital Ind Plan Inc 54704 936 53,345,92842,405 3.814 60.7PA
United World Life Ins Co 72850 261 45,791,77913,725 3.274 64.0NE
New Era Life Ins Co 78743 520 42,206,13417,413 3.018 67.0TX
Colonial Penn Life Ins Co 62065 233 39,602,47019,999 2.831 69.9PA
American Retirement Life Ins Co 88366 901 34,362,03417,771 2.457 72.3OH
Bankers Life & Cas Co 61263 233 33,732,3599,737 2.412 74.7IL
Capital Advantage Ins Co 41203 1230 31,383,38523,895 2.244 77.0PA
**TOTAL** 1,398,692,701660,544 100.000 100.0
CAUTION: THE INFORMATION CONTAINED ON THIS PAGE IS UNAUDITED AND NOT A COMPLETE ANALYSIS NOR IS IT AN EXPRESSION OF OPINION ON ANY INSURER. THIS PAGE MAY
CONTAIN INADVERTENT ERRORS.
© 2017 National Association of Insurance Commissioners 175
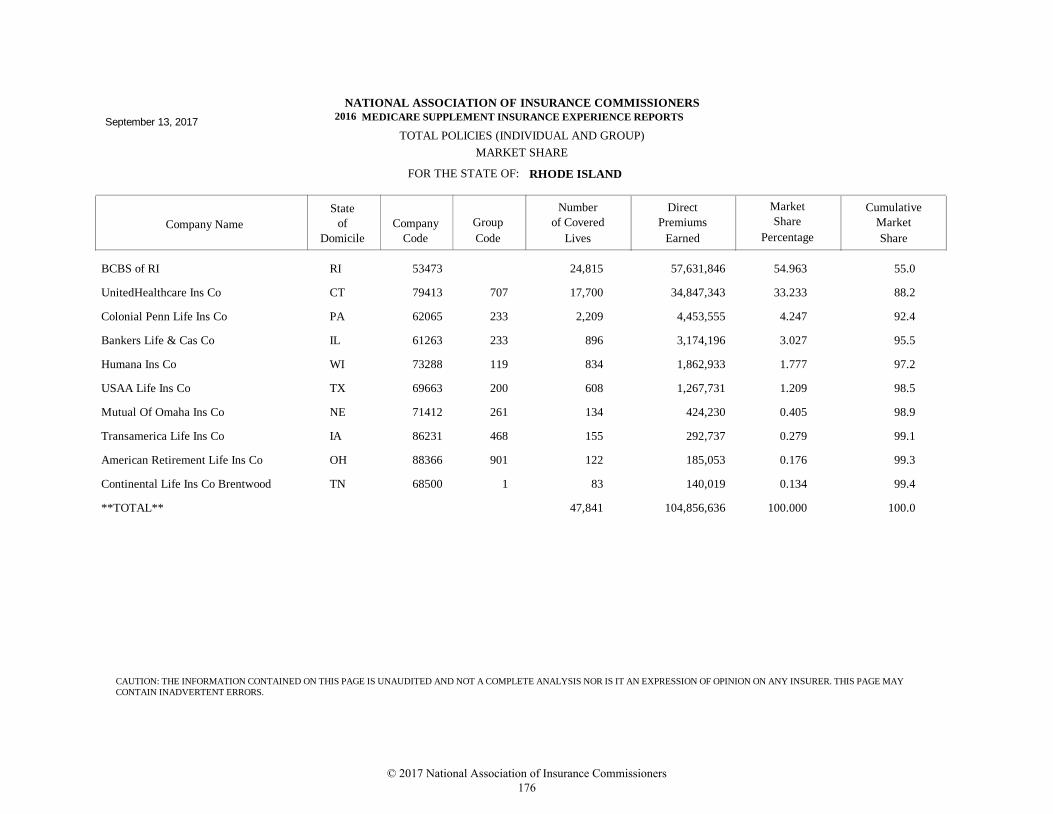
FOR THE STATE OF:
TOTAL POLICIES (INDIVIDUAL AND GROUP)
Company Name
State
Company Group
DirectNumber Market
RHODE ISLAND
MARKET SHARE
NATIONAL ASSOCIATION OF INSURANCE COMMISSIONERS
MEDICARE SUPPLEMENT INSURANCE EXPERIENCE REPORTS
of
Domicile Code Code
Premiums
Earned
Share
Percentage
Cumulative
Market
Share
of Covered
Lives
September 13, 20172016
BCBS of RI 53473 57,631,84624,815 54.963 55.0RI
UnitedHealthcare Ins Co 79413 707 34,847,34317,700 33.233 88.2CT
Colonial Penn Life Ins Co 62065 233 4,453,5552,209 4.247 92.4PA
Bankers Life & Cas Co 61263 233 3,174,196896 3.027 95.5IL
Humana Ins Co 73288 119 1,862,933834 1.777 97.2WI
USAA Life Ins Co 69663 200 1,267,731608 1.209 98.5TX
Mutual Of Omaha Ins Co 71412 261 424,230134 0.405 98.9NE
Transamerica Life Ins Co 86231 468 292,737155 0.279 99.1IA
American Retirement Life Ins Co 88366 901 185,053122 0.176 99.3OH
Continental Life Ins Co Brentwood 68500 1 140,01983 0.134 99.4TN
**TOTAL** 104,856,63647,841 100.000 100.0
CAUTION: THE INFORMATION CONTAINED ON THIS PAGE IS UNAUDITED AND NOT A COMPLETE ANALYSIS NOR IS IT AN EXPRESSION OF OPINION ON ANY INSURER. THIS PAGE MAY
CONTAIN INADVERTENT ERRORS.
© 2017 National Association of Insurance Commissioners 176
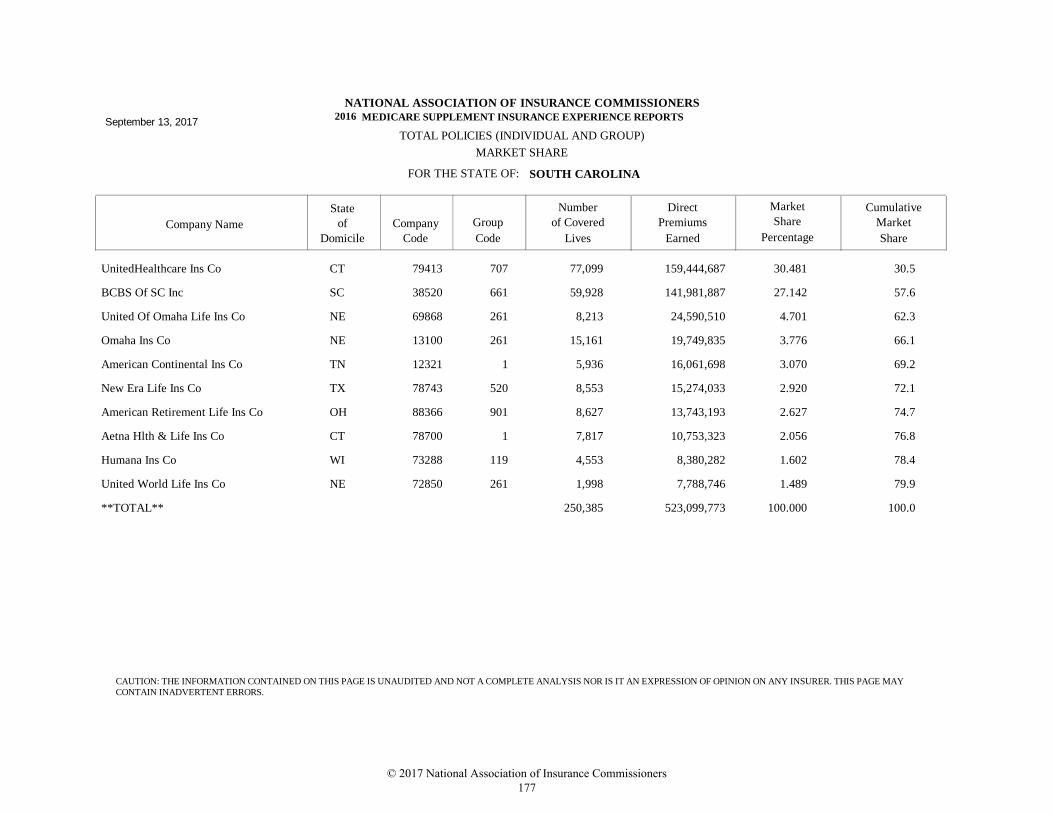
FOR THE STATE OF:
TOTAL POLICIES (INDIVIDUAL AND GROUP)
Company Name
State
Company Group
DirectNumber Market
SOUTH CAROLINA
MARKET SHARE
NATIONAL ASSOCIATION OF INSURANCE COMMISSIONERS
MEDICARE SUPPLEMENT INSURANCE EXPERIENCE REPORTS
of
Domicile Code Code
Premiums
Earned
Share
Percentage
Cumulative
Market
Share
of Covered
Lives
September 13, 20172016
UnitedHealthcare Ins Co 79413 707 159,444,68777,099 30.481 30.5CT
BCBS Of SC Inc 38520 661 141,981,88759,928 27.142 57.6SC
United Of Omaha Life Ins Co 69868 261 24,590,5108,213 4.701 62.3NE
Omaha Ins Co 13100 261 19,749,83515,161 3.776 66.1NE
American Continental Ins Co 12321 1 16,061,6985,936 3.070 69.2TN
New Era Life Ins Co 78743 520 15,274,0338,553 2.920 72.1TX
American Retirement Life Ins Co 88366 901 13,743,1938,627 2.627 74.7OH
Aetna Hlth & Life Ins Co 78700 1 10,753,3237,817 2.056 76.8CT
Humana Ins Co 73288 119 8,380,2824,553 1.602 78.4WI
United World Life Ins Co 72850 261 7,788,7461,998 1.489 79.9NE
**TOTAL** 523,099,773250,385 100.000 100.0
CAUTION: THE INFORMATION CONTAINED ON THIS PAGE IS UNAUDITED AND NOT A COMPLETE ANALYSIS NOR IS IT AN EXPRESSION OF OPINION ON ANY INSURER. THIS PAGE MAY
CONTAIN INADVERTENT ERRORS.
© 2017 National Association of Insurance Commissioners 177
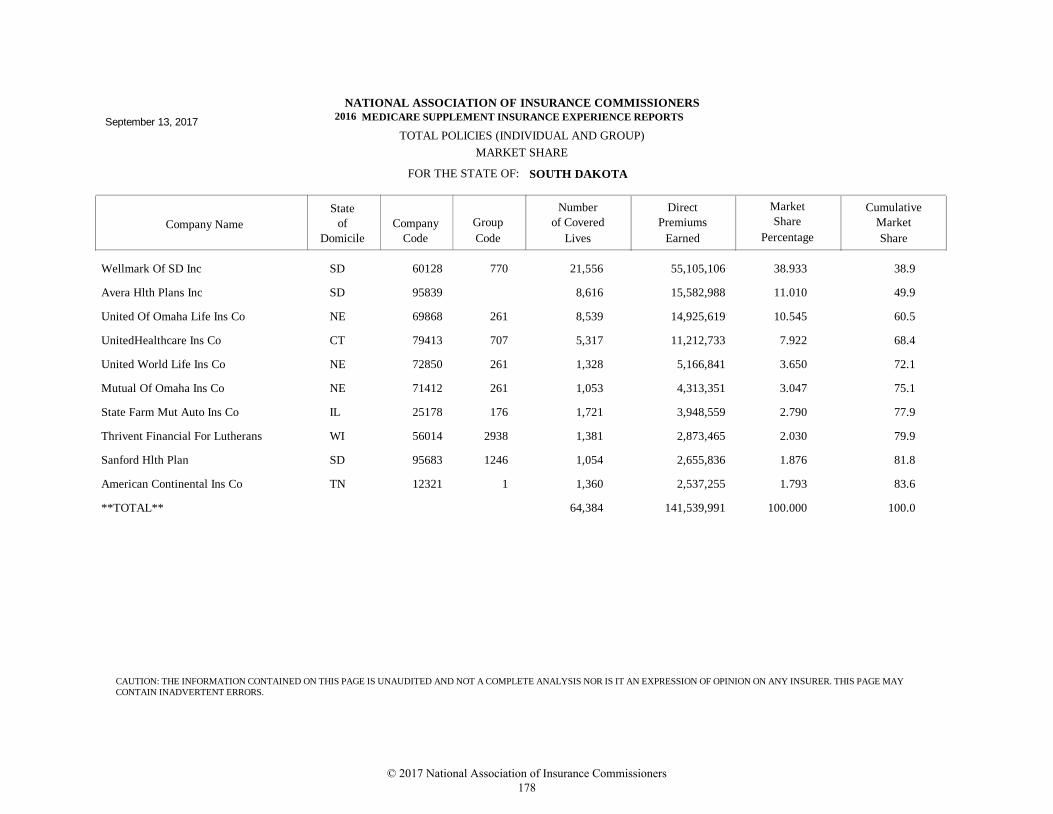
FOR THE STATE OF:
TOTAL POLICIES (INDIVIDUAL AND GROUP)
Company Name
State
Company Group
DirectNumber Market
SOUTH DAKOTA
MARKET SHARE
NATIONAL ASSOCIATION OF INSURANCE COMMISSIONERS
MEDICARE SUPPLEMENT INSURANCE EXPERIENCE REPORTS
of
Domicile Code Code
Premiums
Earned
Share
Percentage
Cumulative
Market
Share
of Covered
Lives
September 13, 20172016
Wellmark Of SD Inc 60128 770 55,105,10621,556 38.933 38.9SD
Avera Hlth Plans Inc 95839 15,582,9888,616 11.010 49.9SD
United Of Omaha Life Ins Co 69868 261 14,925,6198,539 10.545 60.5NE
UnitedHealthcare Ins Co 79413 707 11,212,7335,317 7.922 68.4CT
United World Life Ins Co 72850 261 5,166,8411,328 3.650 72.1NE
Mutual Of Omaha Ins Co 71412 261 4,313,3511,053 3.047 75.1NE
State Farm Mut Auto Ins Co 25178 176 3,948,5591,721 2.790 77.9IL
Thrivent Financial For Lutherans 56014 2938 2,873,4651,381 2.030 79.9WI
Sanford Hlth Plan 95683 1246 2,655,8361,054 1.876 81.8SD
American Continental Ins Co 12321 1 2,537,2551,360 1.793 83.6TN
**TOTAL** 141,539,99164,384 100.000 100.0
CAUTION: THE INFORMATION CONTAINED ON THIS PAGE IS UNAUDITED AND NOT A COMPLETE ANALYSIS NOR IS IT AN EXPRESSION OF OPINION ON ANY INSURER. THIS PAGE MAY
CONTAIN INADVERTENT ERRORS.
© 2017 National Association of Insurance Commissioners 178
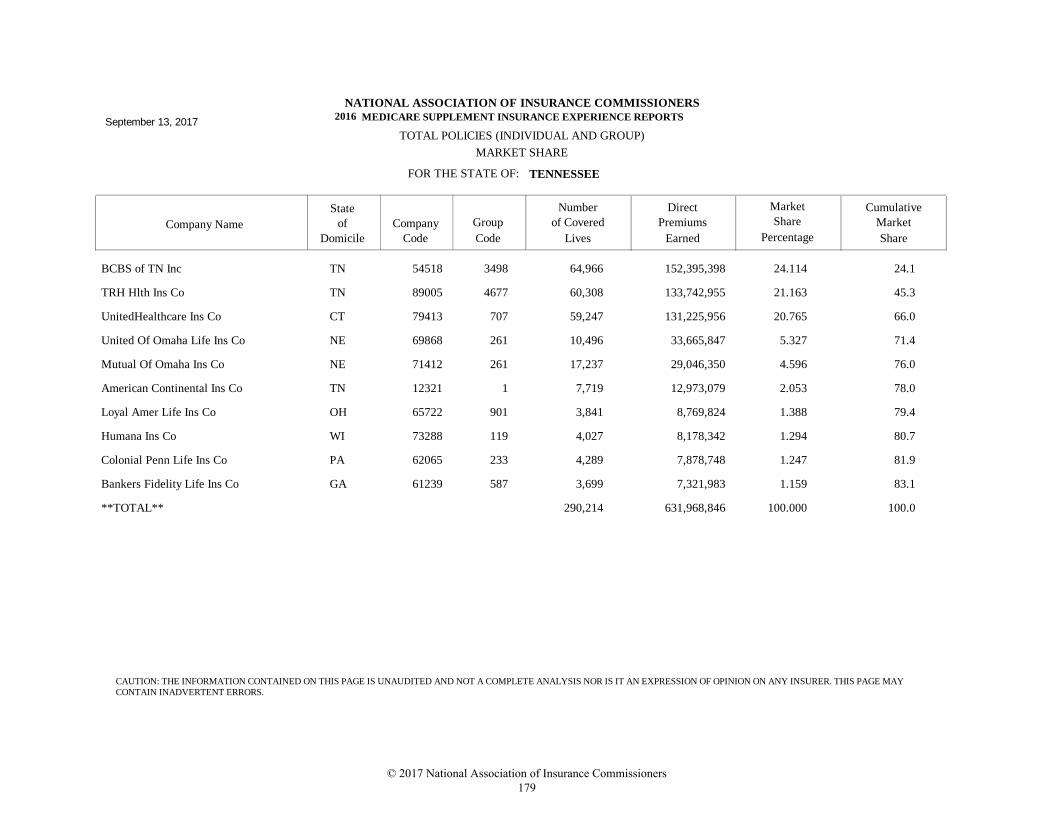
FOR THE STATE OF:
TOTAL POLICIES (INDIVIDUAL AND GROUP)
Company Name
State
Company Group
DirectNumber Market
TENNESSEE
MARKET SHARE
NATIONAL ASSOCIATION OF INSURANCE COMMISSIONERS
MEDICARE SUPPLEMENT INSURANCE EXPERIENCE REPORTS
of
Domicile Code Code
Premiums
Earned
Share
Percentage
Cumulative
Market
Share
of Covered
Lives
September 13, 20172016
BCBS of TN Inc 54518 3498 152,395,39864,966 24.114 24.1TN
TRH Hlth Ins Co 89005 4677 133,742,95560,308 21.163 45.3TN
UnitedHealthcare Ins Co 79413 707 131,225,95659,247 20.765 66.0CT
United Of Omaha Life Ins Co 69868 261 33,665,84710,496 5.327 71.4NE
Mutual Of Omaha Ins Co 71412 261 29,046,35017,237 4.596 76.0NE
American Continental Ins Co 12321 1 12,973,0797,719 2.053 78.0TN
Loyal Amer Life Ins Co 65722 901 8,769,8243,841 1.388 79.4OH
Humana Ins Co 73288 119 8,178,3424,027 1.294 80.7WI
Colonial Penn Life Ins Co 62065 233 7,878,7484,289 1.247 81.9PA
Bankers Fidelity Life Ins Co 61239 587 7,321,9833,699 1.159 83.1GA
**TOTAL** 631,968,846290,214 100.000 100.0
CAUTION: THE INFORMATION CONTAINED ON THIS PAGE IS UNAUDITED AND NOT A COMPLETE ANALYSIS NOR IS IT AN EXPRESSION OF OPINION ON ANY INSURER. THIS PAGE MAY
CONTAIN INADVERTENT ERRORS.
© 2017 National Association of Insurance Commissioners 179
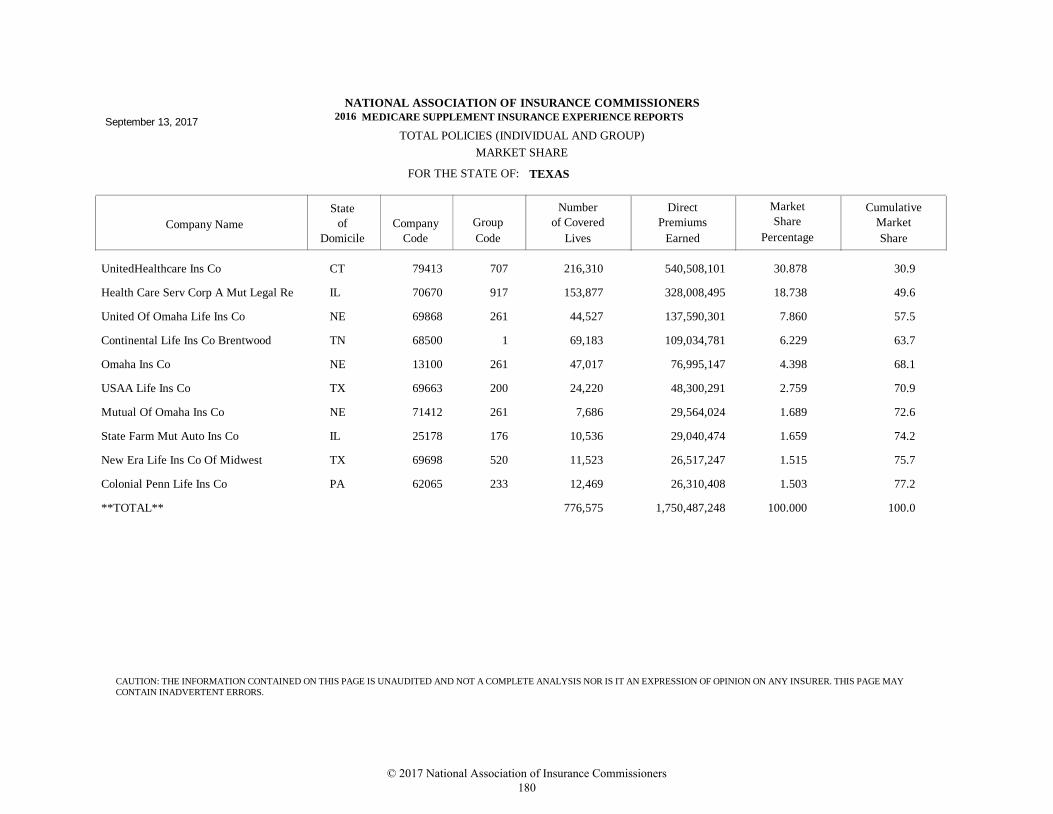
FOR THE STATE OF:
TOTAL POLICIES (INDIVIDUAL AND GROUP)
Company Name
State
Company Group
DirectNumber Market
TEXAS
MARKET SHARE
NATIONAL ASSOCIATION OF INSURANCE COMMISSIONERS
MEDICARE SUPPLEMENT INSURANCE EXPERIENCE REPORTS
of
Domicile Code Code
Premiums
Earned
Share
Percentage
Cumulative
Market
Share
of Covered
Lives
September 13, 20172016
UnitedHealthcare Ins Co 79413 707 540,508,101216,310 30.878 30.9CT
Health Care Serv Corp A Mut Legal Re 70670 917 328,008,495153,877 18.738 49.6IL
United Of Omaha Life Ins Co 69868 261 137,590,30144,527 7.860 57.5NE
Continental Life Ins Co Brentwood 68500 1 109,034,78169,183 6.229 63.7TN
Omaha Ins Co 13100 261 76,995,14747,017 4.398 68.1NE
USAA Life Ins Co 69663 200 48,300,29124,220 2.759 70.9TX
Mutual Of Omaha Ins Co 71412 261 29,564,0247,686 1.689 72.6NE
State Farm Mut Auto Ins Co 25178 176 29,040,47410,536 1.659 74.2IL
New Era Life Ins Co Of Midwest 69698 520 26,517,24711,523 1.515 75.7TX
Colonial Penn Life Ins Co 62065 233 26,310,40812,469 1.503 77.2PA
**TOTAL** 1,750,487,248776,575 100.000 100.0
CAUTION: THE INFORMATION CONTAINED ON THIS PAGE IS UNAUDITED AND NOT A COMPLETE ANALYSIS NOR IS IT AN EXPRESSION OF OPINION ON ANY INSURER. THIS PAGE MAY
CONTAIN INADVERTENT ERRORS.
© 2017 National Association of Insurance Commissioners 180
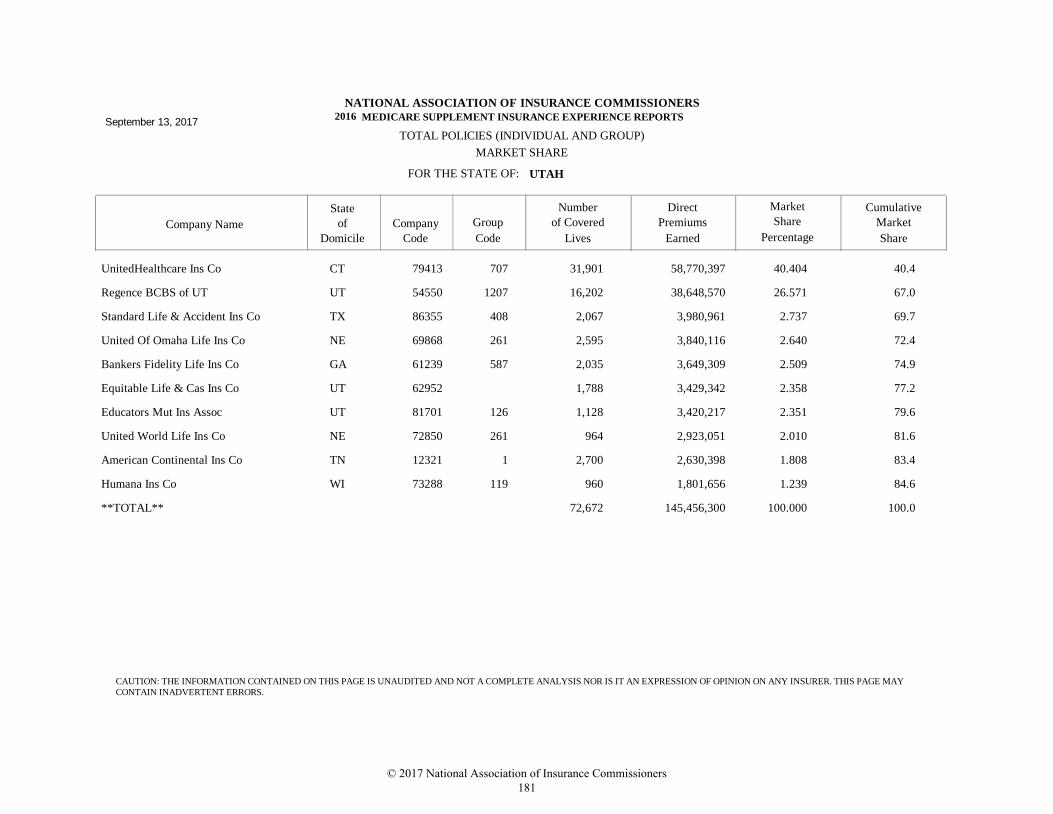
FOR THE STATE OF:
TOTAL POLICIES (INDIVIDUAL AND GROUP)
Company Name
State
Company Group
DirectNumber Market
UTAH
MARKET SHARE
NATIONAL ASSOCIATION OF INSURANCE COMMISSIONERS
MEDICARE SUPPLEMENT INSURANCE EXPERIENCE REPORTS
of
Domicile Code Code
Premiums
Earned
Share
Percentage
Cumulative
Market
Share
of Covered
Lives
September 13, 20172016
UnitedHealthcare Ins Co 79413 707 58,770,39731,901 40.404 40.4CT
Regence BCBS of UT 54550 1207 38,648,57016,202 26.571 67.0UT
Standard Life & Accident Ins Co 86355 408 3,980,9612,067 2.737 69.7TX
United Of Omaha Life Ins Co 69868 261 3,840,1162,595 2.640 72.4NE
Bankers Fidelity Life Ins Co 61239 587 3,649,3092,035 2.509 74.9GA
Equitable Life & Cas Ins Co 62952 3,429,3421,788 2.358 77.2UT
Educators Mut Ins Assoc 81701 126 3,420,2171,128 2.351 79.6UT
United World Life Ins Co 72850 261 2,923,051964 2.010 81.6NE
American Continental Ins Co 12321 1 2,630,3982,700 1.808 83.4TN
Humana Ins Co 73288 119 1,801,656960 1.239 84.6WI
**TOTAL** 145,456,30072,672 100.000 100.0
CAUTION: THE INFORMATION CONTAINED ON THIS PAGE IS UNAUDITED AND NOT A COMPLETE ANALYSIS NOR IS IT AN EXPRESSION OF OPINION ON ANY INSURER. THIS PAGE MAY
CONTAIN INADVERTENT ERRORS.
© 2017 National Association of Insurance Commissioners 181
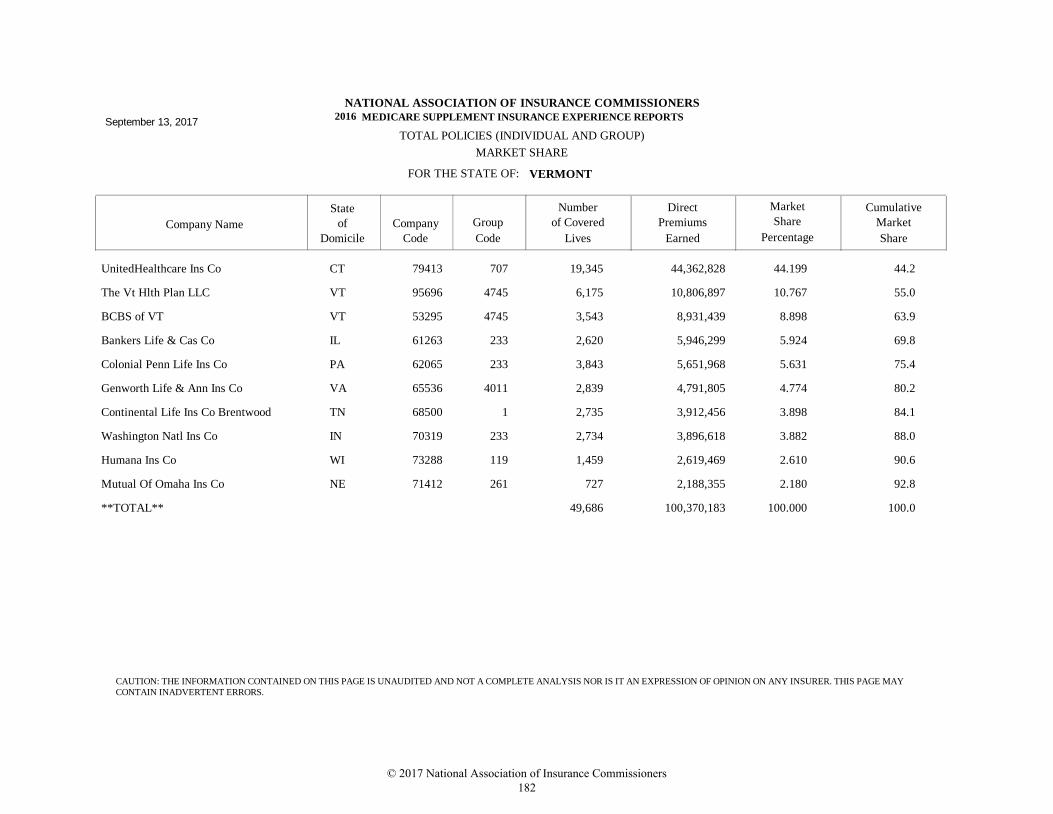
FOR THE STATE OF:
TOTAL POLICIES (INDIVIDUAL AND GROUP)
Company Name
State
Company Group
DirectNumber Market
VERMONT
MARKET SHARE
NATIONAL ASSOCIATION OF INSURANCE COMMISSIONERS
MEDICARE SUPPLEMENT INSURANCE EXPERIENCE REPORTS
of
Domicile Code Code
Premiums
Earned
Share
Percentage
Cumulative
Market
Share
of Covered
Lives
September 13, 20172016
UnitedHealthcare Ins Co 79413 707 44,362,82819,345 44.199 44.2CT
The Vt Hlth Plan LLC 95696 4745 10,806,8976,175 10.767 55.0VT
BCBS of VT 53295 4745 8,931,4393,543 8.898 63.9VT
Bankers Life & Cas Co 61263 233 5,946,2992,620 5.924 69.8IL
Colonial Penn Life Ins Co 62065 233 5,651,9683,843 5.631 75.4PA
Genworth Life & Ann Ins Co 65536 4011 4,791,8052,839 4.774 80.2VA
Continental Life Ins Co Brentwood 68500 1 3,912,4562,735 3.898 84.1TN
Washington Natl Ins Co 70319 233 3,896,6182,734 3.882 88.0IN
Humana Ins Co 73288 119 2,619,4691,459 2.610 90.6WI
Mutual Of Omaha Ins Co 71412 261 2,188,355727 2.180 92.8NE
**TOTAL** 100,370,18349,686 100.000 100.0
CAUTION: THE INFORMATION CONTAINED ON THIS PAGE IS UNAUDITED AND NOT A COMPLETE ANALYSIS NOR IS IT AN EXPRESSION OF OPINION ON ANY INSURER. THIS PAGE MAY
CONTAIN INADVERTENT ERRORS.
© 2017 National Association of Insurance Commissioners 182

FOR THE STATE OF:
TOTAL POLICIES (INDIVIDUAL AND GROUP)
Company Name
State
Company Group
DirectNumber Market
VIRGINIA
MARKET SHARE
NATIONAL ASSOCIATION OF INSURANCE COMMISSIONERS
MEDICARE SUPPLEMENT INSURANCE EXPERIENCE REPORTS
of
Domicile Code Code
Premiums
Earned
Share
Percentage
Cumulative
Market
Share
of Covered
Lives
September 13, 20172016
Anthem Hlth Plans of VA Inc 71835 671 284,516,703122,998 35.139 35.1VA
UnitedHealthcare Ins Co 79413 707 232,602,516112,974 28.728 63.9CT
United Of Omaha Life Ins Co 69868 261 56,178,72421,991 6.938 70.8NE
American Continental Ins Co 12321 1 45,705,21630,987 5.645 76.4TN
Omaha Ins Co 13100 261 34,322,73930,084 4.239 80.7NE
American Retirement Life Ins Co 88366 901 15,662,98312,550 1.934 82.6OH
Humana Ins Co 73288 119 13,205,6137,858 1.631 84.3WI
USAA Life Ins Co 69663 200 10,391,3785,202 1.283 85.5TX
United Amer Ins Co 92916 290 8,928,7952,815 1.103 86.6NE
Bankers Life & Cas Co 61263 233 8,712,5722,669 1.076 87.7IL
**TOTAL** 809,684,100393,691 100.000 100.0
CAUTION: THE INFORMATION CONTAINED ON THIS PAGE IS UNAUDITED AND NOT A COMPLETE ANALYSIS NOR IS IT AN EXPRESSION OF OPINION ON ANY INSURER. THIS PAGE MAY
CONTAIN INADVERTENT ERRORS.
© 2017 National Association of Insurance Commissioners 183
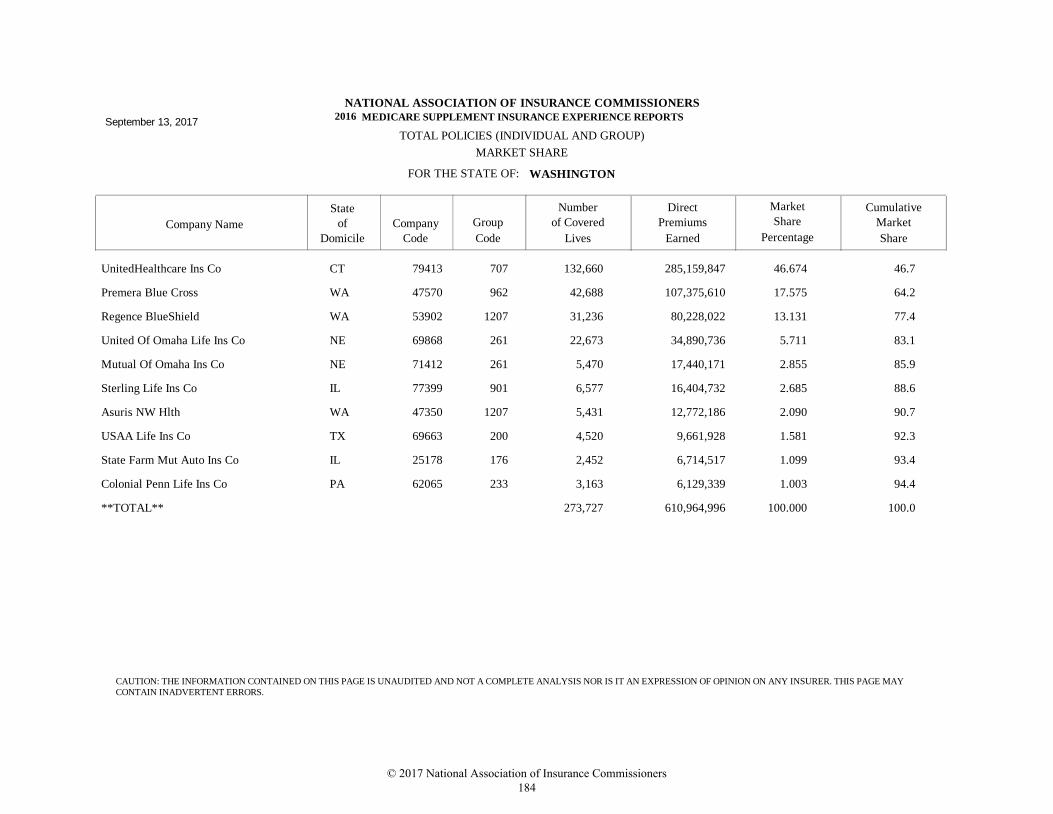
FOR THE STATE OF:
TOTAL POLICIES (INDIVIDUAL AND GROUP)
Company Name
State
Company Group
DirectNumber Market
WASHINGTON
MARKET SHARE
NATIONAL ASSOCIATION OF INSURANCE COMMISSIONERS
MEDICARE SUPPLEMENT INSURANCE EXPERIENCE REPORTS
of
Domicile Code Code
Premiums
Earned
Share
Percentage
Cumulative
Market
Share
of Covered
Lives
September 13, 20172016
UnitedHealthcare Ins Co 79413 707 285,159,847132,660 46.674 46.7CT
Premera Blue Cross 47570 962 107,375,61042,688 17.575 64.2WA
Regence BlueShield 53902 1207 80,228,02231,236 13.131 77.4WA
United Of Omaha Life Ins Co 69868 261 34,890,73622,673 5.711 83.1NE
Mutual Of Omaha Ins Co 71412 261 17,440,1715,470 2.855 85.9NE
Sterling Life Ins Co 77399 901 16,404,7326,577 2.685 88.6IL
Asuris NW Hlth 47350 1207 12,772,1865,431 2.090 90.7WA
USAA Life Ins Co 69663 200 9,661,9284,520 1.581 92.3TX
State Farm Mut Auto Ins Co 25178 176 6,714,5172,452 1.099 93.4IL
Colonial Penn Life Ins Co 62065 233 6,129,3393,163 1.003 94.4PA
**TOTAL** 610,964,996273,727 100.000 100.0
CAUTION: THE INFORMATION CONTAINED ON THIS PAGE IS UNAUDITED AND NOT A COMPLETE ANALYSIS NOR IS IT AN EXPRESSION OF OPINION ON ANY INSURER. THIS PAGE MAY
CONTAIN INADVERTENT ERRORS.
© 2017 National Association of Insurance Commissioners 184

FOR THE STATE OF:
TOTAL POLICIES (INDIVIDUAL AND GROUP)
Company Name
State
Company Group
DirectNumber Market
WEST VIRGINIA
MARKET SHARE
NATIONAL ASSOCIATION OF INSURANCE COMMISSIONERS
MEDICARE SUPPLEMENT INSURANCE EXPERIENCE REPORTS
of
Domicile Code Code
Premiums
Earned
Share
Percentage
Cumulative
Market
Share
of Covered
Lives
September 13, 20172016
UnitedHealthcare Ins Co 79413 707 86,558,75238,890 46.389 46.4CT
Highmark West Virginia Inc. 54828 812 19,355,6257,584 10.373 56.8WV
United Of Omaha Life Ins Co 69868 261 10,381,6603,418 5.564 62.3NE
Omaha Ins Co 13100 261 10,045,0208,124 5.383 67.7NE
Continental Life Ins Co Brentwood 68500 1 9,282,2414,533 4.975 72.7TN
State Farm Mut Auto Ins Co 25178 176 4,212,2211,954 2.257 74.9IL
Colonial Penn Life Ins Co 62065 233 4,108,3552,134 2.202 77.1PA
American Retirement Life Ins Co 88366 901 3,859,1862,444 2.068 79.2OH
Humana Ins Co 73288 119 3,524,7151,524 1.889 81.1WI
Bankers Life & Cas Co 61263 233 3,492,476924 1.872 83.0IL
**TOTAL** 186,594,80592,676 100.000 100.0
CAUTION: THE INFORMATION CONTAINED ON THIS PAGE IS UNAUDITED AND NOT A COMPLETE ANALYSIS NOR IS IT AN EXPRESSION OF OPINION ON ANY INSURER. THIS PAGE MAY
CONTAIN INADVERTENT ERRORS.
© 2017 National Association of Insurance Commissioners 185
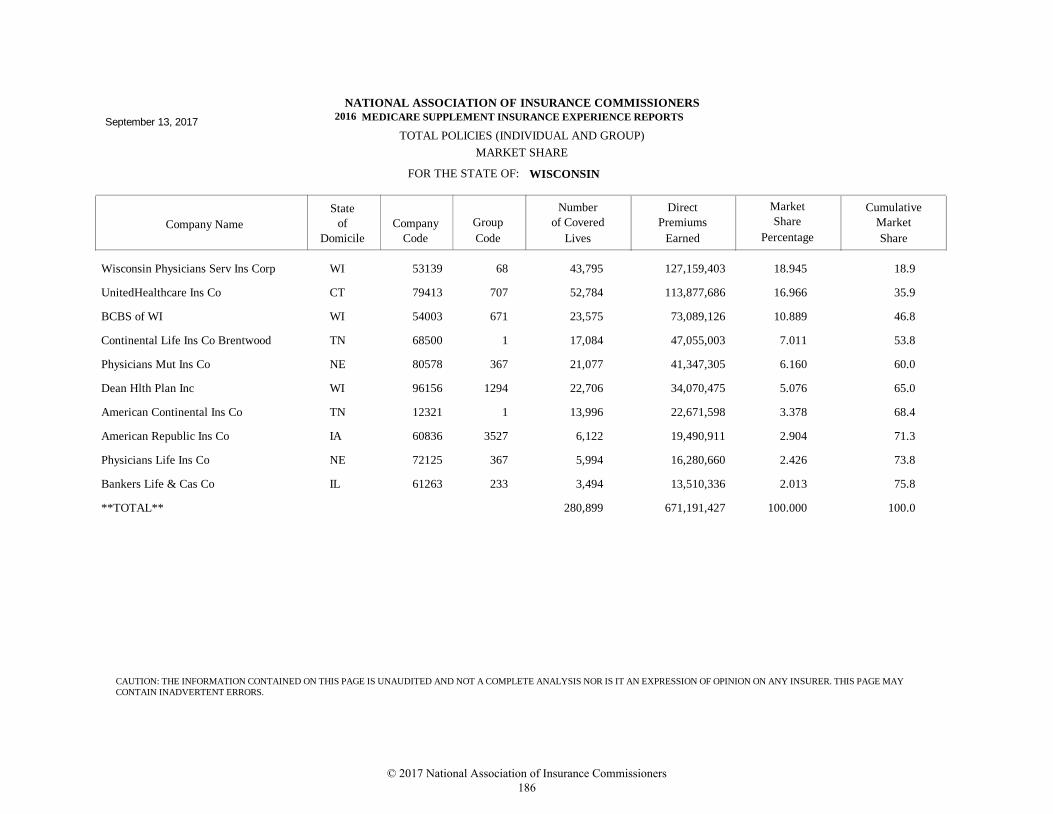
FOR THE STATE OF:
TOTAL POLICIES (INDIVIDUAL AND GROUP)
Company Name
State
Company Group
DirectNumber Market
WISCONSIN
MARKET SHARE
NATIONAL ASSOCIATION OF INSURANCE COMMISSIONERS
MEDICARE SUPPLEMENT INSURANCE EXPERIENCE REPORTS
of
Domicile Code Code
Premiums
Earned
Share
Percentage
Cumulative
Market
Share
of Covered
Lives
September 13, 20172016
Wisconsin Physicians Serv Ins Corp 53139 68 127,159,40343,795 18.945 18.9WI
UnitedHealthcare Ins Co 79413 707 113,877,68652,784 16.966 35.9CT
BCBS of WI 54003 671 73,089,12623,575 10.889 46.8WI
Continental Life Ins Co Brentwood 68500 1 47,055,00317,084 7.011 53.8TN
Physicians Mut Ins Co 80578 367 41,347,30521,077 6.160 60.0NE
Dean Hlth Plan Inc 96156 1294 34,070,47522,706 5.076 65.0WI
American Continental Ins Co 12321 1 22,671,59813,996 3.378 68.4TN
American Republic Ins Co 60836 3527 19,490,9116,122 2.904 71.3IA
Physicians Life Ins Co 72125 367 16,280,6605,994 2.426 73.8NE
Bankers Life & Cas Co 61263 233 13,510,3363,494 2.013 75.8IL
**TOTAL** 671,191,427280,899 100.000 100.0
CAUTION: THE INFORMATION CONTAINED ON THIS PAGE IS UNAUDITED AND NOT A COMPLETE ANALYSIS NOR IS IT AN EXPRESSION OF OPINION ON ANY INSURER. THIS PAGE MAY
CONTAIN INADVERTENT ERRORS.
© 2017 National Association of Insurance Commissioners 186

FOR THE STATE OF:
TOTAL POLICIES (INDIVIDUAL AND GROUP)
Company Name
State
Company Group
DirectNumber Market
WYOMING
MARKET SHARE
NATIONAL ASSOCIATION OF INSURANCE COMMISSIONERS
MEDICARE SUPPLEMENT INSURANCE EXPERIENCE REPORTS
of
Domicile Code Code
Premiums
Earned
Share
Percentage
Cumulative
Market
Share
of Covered
Lives
September 13, 20172016
UnitedHealthcare Ins Co 79413 707 31,237,02214,780 32.700 32.7CT
BCBS of WY 53767 20,879,3299,174 21.857 54.6WY
United Of Omaha Life Ins Co 69868 261 6,923,6164,802 7.248 61.8NE
State Farm Mut Auto Ins Co 25178 176 4,183,6081,892 4.380 66.2IL
American Continental Ins Co 12321 1 3,828,0022,404 4.007 70.2TN
United World Life Ins Co 72850 261 3,576,2791,317 3.744 73.9NE
Mutual Of Omaha Ins Co 71412 261 3,566,9301,105 3.734 77.7NE
Humana Ins Co 73288 119 2,734,8391,549 2.863 80.5WI
American Retirement Life Ins Co 88366 901 2,580,3902,192 2.701 83.2OH
USAA Life Ins Co 69663 200 2,464,8621,332 2.580 85.8TX
**TOTAL** 95,525,95446,469 100.000 100.0
CAUTION: THE INFORMATION CONTAINED ON THIS PAGE IS UNAUDITED AND NOT A COMPLETE ANALYSIS NOR IS IT AN EXPRESSION OF OPINION ON ANY INSURER. THIS PAGE MAY
CONTAIN INADVERTENT ERRORS.
© 2017 National Association of Insurance Commissioners 187
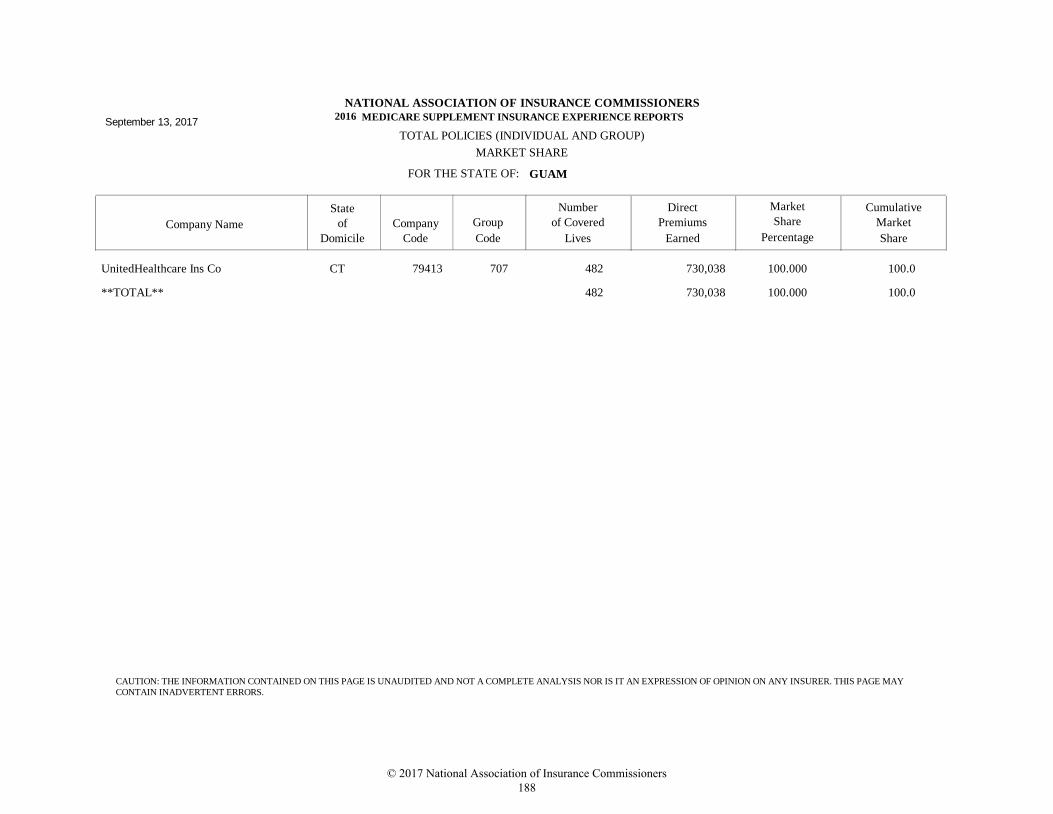
FOR THE STATE OF:
TOTAL POLICIES (INDIVIDUAL AND GROUP)
Company Name
State
Company Group
DirectNumber Market
GUAM
MARKET SHARE
NATIONAL ASSOCIATION OF INSURANCE COMMISSIONERS
MEDICARE SUPPLEMENT INSURANCE EXPERIENCE REPORTS
of
Domicile Code Code
Premiums
Earned
Share
Percentage
Cumulative
Market
Share
of Covered
Lives
September 13, 20172016
UnitedHealthcare Ins Co 79413 707 730,038482 100.000 100.0CT
**TOTAL** 730,038482 100.000 100.0
CAUTION: THE INFORMATION CONTAINED ON THIS PAGE IS UNAUDITED AND NOT A COMPLETE ANALYSIS NOR IS IT AN EXPRESSION OF OPINION ON ANY INSURER. THIS PAGE MAY
CONTAIN INADVERTENT ERRORS.
© 2017 National Association of Insurance Commissioners 188
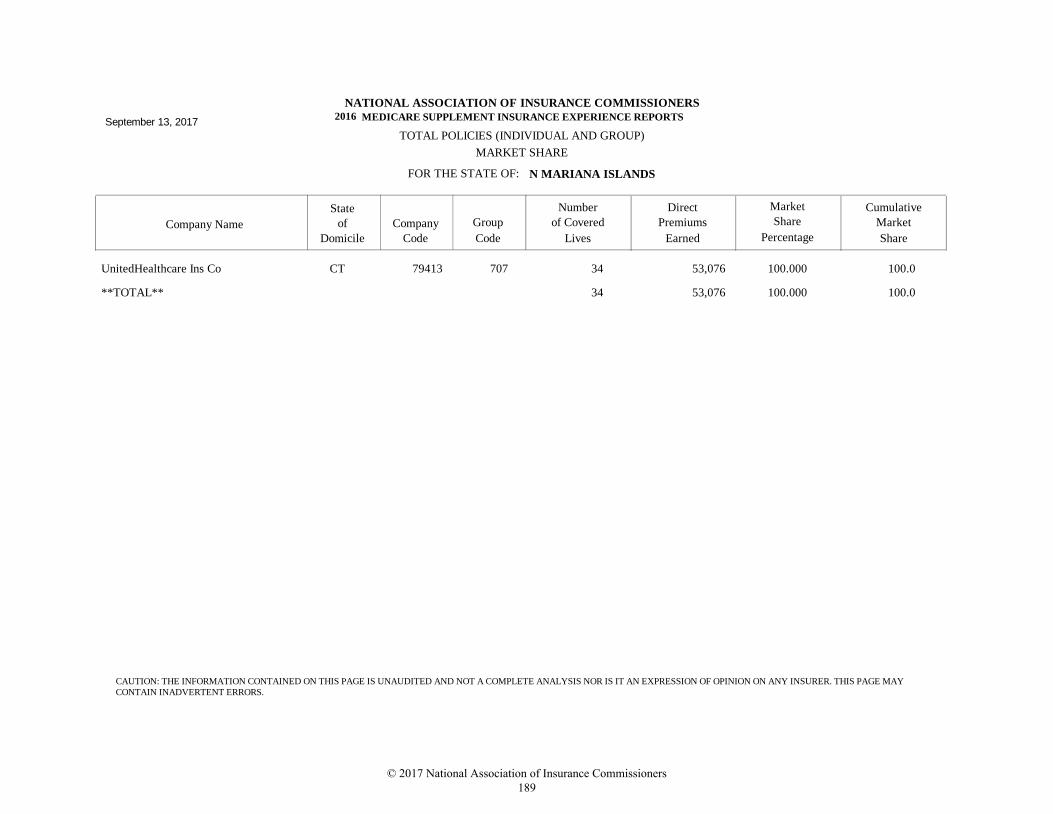
FOR THE STATE OF:
TOTAL POLICIES (INDIVIDUAL AND GROUP)
Company Name
State
Company Group
DirectNumber Market
N MARIANA ISLANDS
MARKET SHARE
NATIONAL ASSOCIATION OF INSURANCE COMMISSIONERS
MEDICARE SUPPLEMENT INSURANCE EXPERIENCE REPORTS
of
Domicile Code Code
Premiums
Earned
Share
Percentage
Cumulative
Market
Share
of Covered
Lives
September 13, 20172016
UnitedHealthcare Ins Co 79413 707 53,07634 100.000 100.0CT
**TOTAL** 53,07634 100.000 100.0
CAUTION: THE INFORMATION CONTAINED ON THIS PAGE IS UNAUDITED AND NOT A COMPLETE ANALYSIS NOR IS IT AN EXPRESSION OF OPINION ON ANY INSURER. THIS PAGE MAY
CONTAIN INADVERTENT ERRORS.
© 2017 National Association of Insurance Commissioners 189
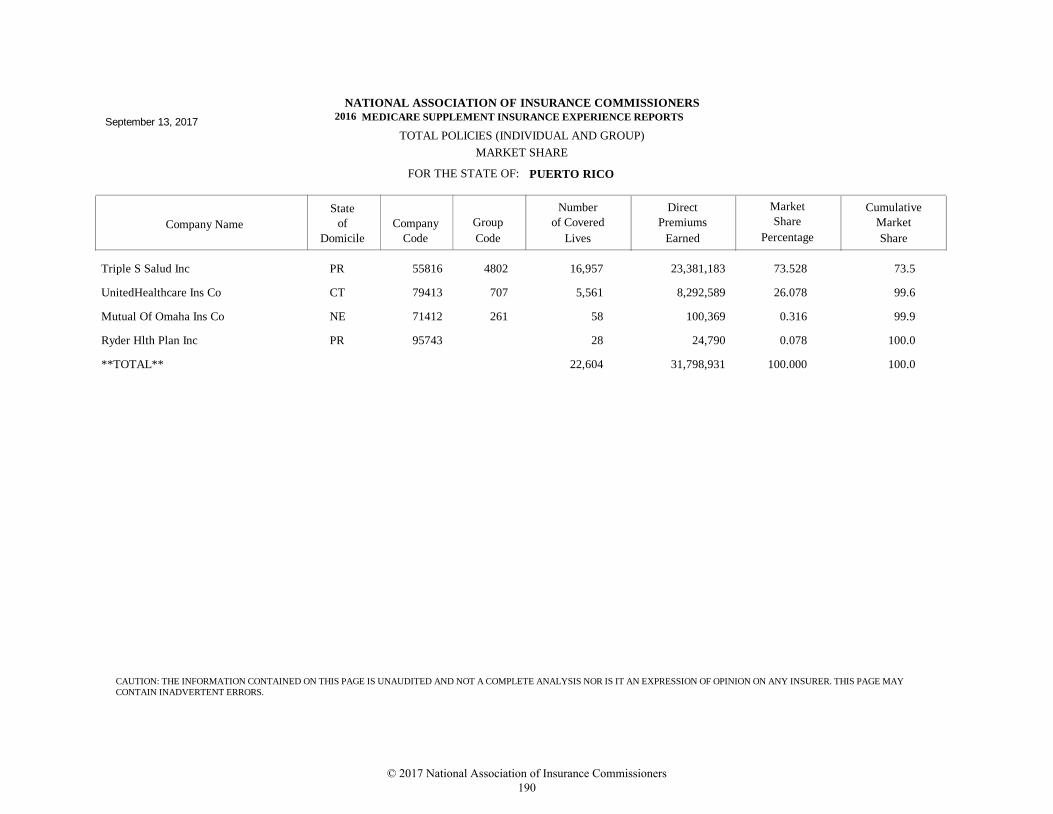
FOR THE STATE OF:
TOTAL POLICIES (INDIVIDUAL AND GROUP)
Company Name
State
Company Group
DirectNumber Market
PUERTO RICO
MARKET SHARE
NATIONAL ASSOCIATION OF INSURANCE COMMISSIONERS
MEDICARE SUPPLEMENT INSURANCE EXPERIENCE REPORTS
of
Domicile Code Code
Premiums
Earned
Share
Percentage
Cumulative
Market
Share
of Covered
Lives
September 13, 20172016
Triple S Salud Inc 55816 4802 23,381,18316,957 73.528 73.5PR
UnitedHealthcare Ins Co 79413 707 8,292,5895,561 26.078 99.6CT
Mutual Of Omaha Ins Co 71412 261 100,36958 0.316 99.9NE
Ryder Hlth Plan Inc 95743 24,79028 0.078 100.0PR
**TOTAL** 31,798,93122,604 100.000 100.0
CAUTION: THE INFORMATION CONTAINED ON THIS PAGE IS UNAUDITED AND NOT A COMPLETE ANALYSIS NOR IS IT AN EXPRESSION OF OPINION ON ANY INSURER. THIS PAGE MAY
CONTAIN INADVERTENT ERRORS.
© 2017 National Association of Insurance Commissioners 190
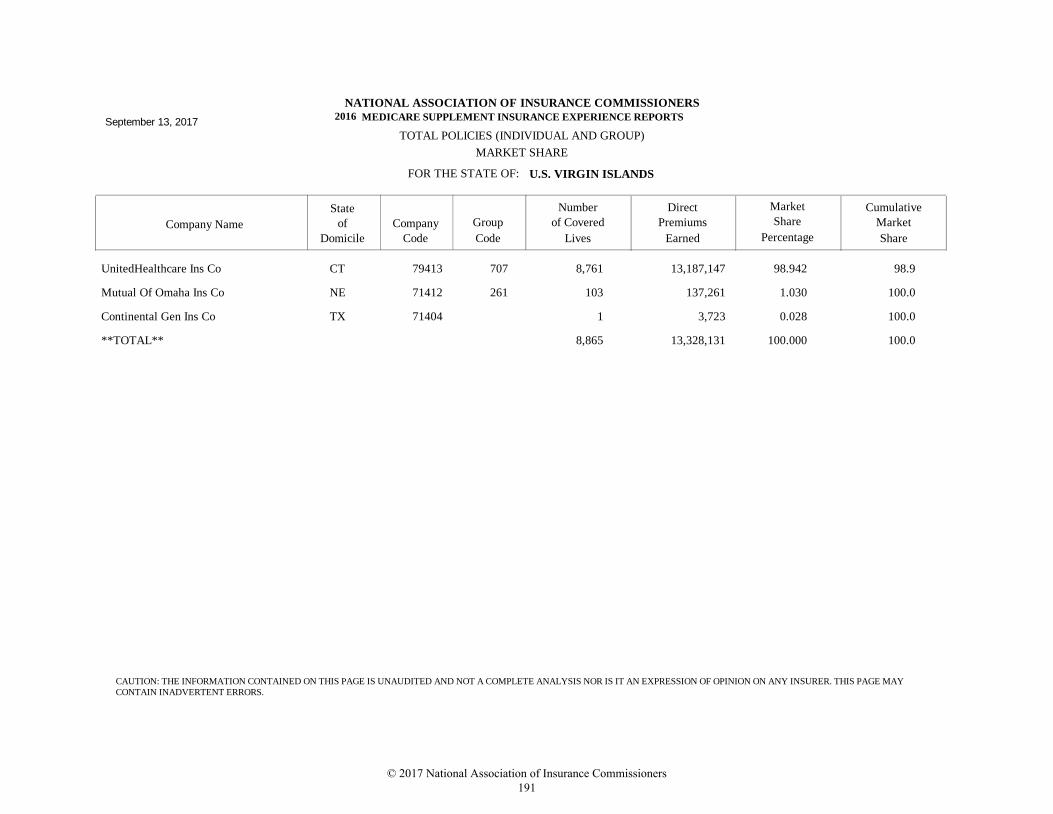
FOR THE STATE OF:
TOTAL POLICIES (INDIVIDUAL AND GROUP)
Company Name
State
Company Group
DirectNumber Market
U.S. VIRGIN ISLANDS
MARKET SHARE
NATIONAL ASSOCIATION OF INSURANCE COMMISSIONERS
MEDICARE SUPPLEMENT INSURANCE EXPERIENCE REPORTS
of
Domicile Code Code
Premiums
Earned
Share
Percentage
Cumulative
Market
Share
of Covered
Lives
September 13, 20172016
UnitedHealthcare Ins Co 79413 707 13,187,1478,761 98.942 98.9CT
Mutual Of Omaha Ins Co 71412 261 137,261103 1.030 100.0NE
Continental Gen Ins Co 71404 3,7231 0.028 100.0TX
**TOTAL** 13,328,1318,865 100.000 100.0
CAUTION: THE INFORMATION CONTAINED ON THIS PAGE IS UNAUDITED AND NOT A COMPLETE ANALYSIS NOR IS IT AN EXPRESSION OF OPINION ON ANY INSURER. THIS PAGE MAY
CONTAIN INADVERTENT ERRORS.
© 2017 National Association of Insurance Commissioners 191

© 2017 National Association of Insurance Commissioners 192
COMPANY INDEX
© 2017 National Association of Insurance Commissioners 193

© 2017 National Association of Insurance Commissioners 194
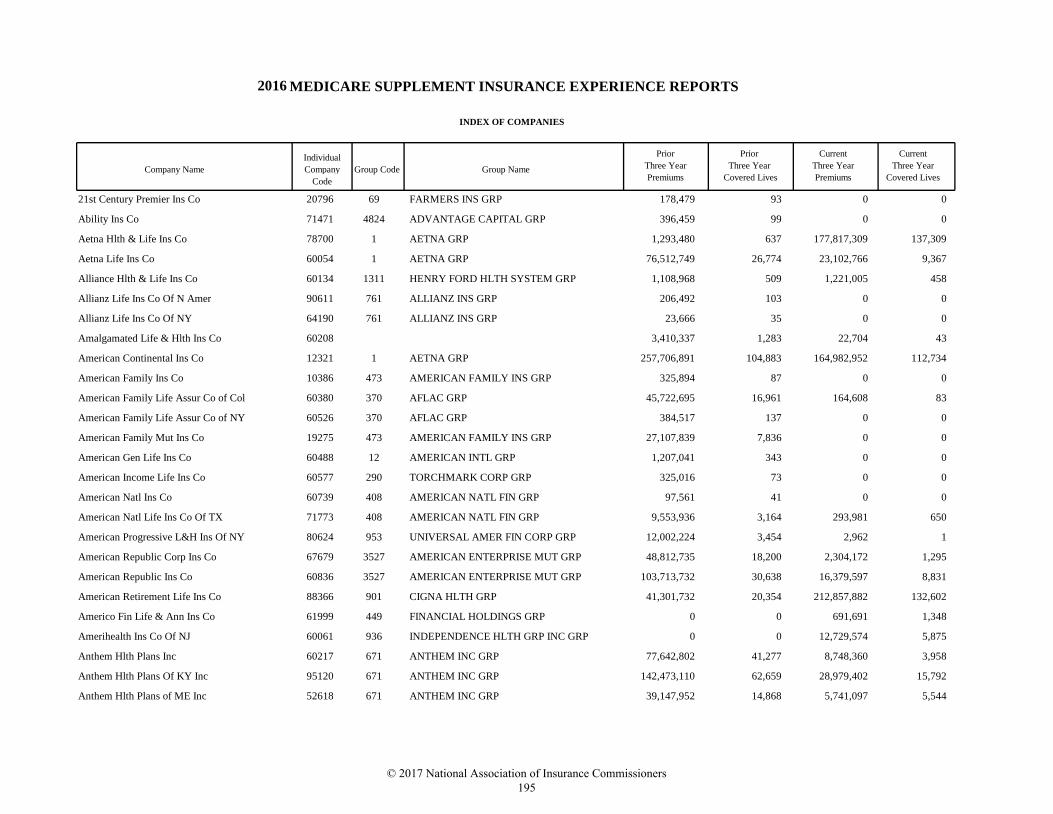
MEDICARE SUPPLEMENT INSURANCE EXPERIENCE REPORTS
INDEX OF COMPANIES
Company Name
Individual
Company
Code
Group Code Group Name
Prior
Three Year
Premiums
Prior Current Current
Three Year Three Year Three Year
Covered Lives Premiums Covered Lives
2016
21st Century Premier Ins Co 20796 69 FARMERS INS GRP 178,479 93 0 0
Ability Ins Co 71471 4824 ADVANTAGE CAPITAL GRP 396,459 99 0 0
Aetna Hlth & Life Ins Co 78700 1 AETNA GRP 1,293,480 637 177,817,309 137,309
Aetna Life Ins Co 60054 1 AETNA GRP 76,512,749 26,774 23,102,766 9,367
Alliance Hlth & Life Ins Co 60134 1311 HENRY FORD HLTH SYSTEM GRP 1,108,968 509 1,221,005 458
Allianz Life Ins Co Of N Amer 90611 761 ALLIANZ INS GRP 206,492 103 0 0
Allianz Life Ins Co Of NY 64190 761 ALLIANZ INS GRP 23,666 35 0 0
Amalgamated Life & Hlth Ins Co 60208 3,410,337 1,283 22,704 43
American Continental Ins Co 12321 1 AETNA GRP 257,706,891 104,883 164,982,952 112,734
American Family Ins Co 10386 473 AMERICAN FAMILY INS GRP 325,894 87 0 0
American Family Life Assur Co of Col 60380 370 AFLAC GRP 45,722,695 16,961 164,608 83
American Family Life Assur Co of NY 60526 370 AFLAC GRP 384,517 137 0 0
American Family Mut Ins Co 19275 473 AMERICAN FAMILY INS GRP 27,107,839 7,836 0 0
American Gen Life Ins Co 60488 12 AMERICAN INTL GRP 1,207,041 343 0 0
American Income Life Ins Co 60577 290 TORCHMARK CORP GRP 325,016 73 0 0
American Natl Ins Co 60739 408 AMERICAN NATL FIN GRP 97,561 41 0 0
American Natl Life Ins Co Of TX 71773 408 AMERICAN NATL FIN GRP 9,553,936 3,164 293,981 650
American Progressive L&H Ins Of NY 80624 953 UNIVERSAL AMER FIN CORP GRP 12,002,224 3,454 2,962 1
American Republic Corp Ins Co 67679 3527 AMERICAN ENTERPRISE MUT GRP 48,812,735 18,200 2,304,172 1,295
American Republic Ins Co 60836 3527 AMERICAN ENTERPRISE MUT GRP 103,713,732 30,638 16,379,597 8,831
American Retirement Life Ins Co 88366 901 CIGNA HLTH GRP 41,301,732 20,354 212,857,882 132,602
Americo Fin Life & Ann Ins Co 61999 449 FINANCIAL HOLDINGS GRP 0 0 691,691 1,348
Amerihealth Ins Co Of NJ 60061 936 INDEPENDENCE HLTH GRP INC GRP 0 0 12,729,574 5,875
Anthem Hlth Plans Inc 60217 671 ANTHEM INC GRP 77,642,802 41,277 8,748,360 3,958
Anthem Hlth Plans Of KY Inc 95120 671 ANTHEM INC GRP 142,473,110 62,659 28,979,402 15,792
Anthem Hlth Plans of ME Inc 52618 671 ANTHEM INC GRP 39,147,952 14,868 5,741,097 5,544
© 2017 National Association of Insurance Commissioners 195
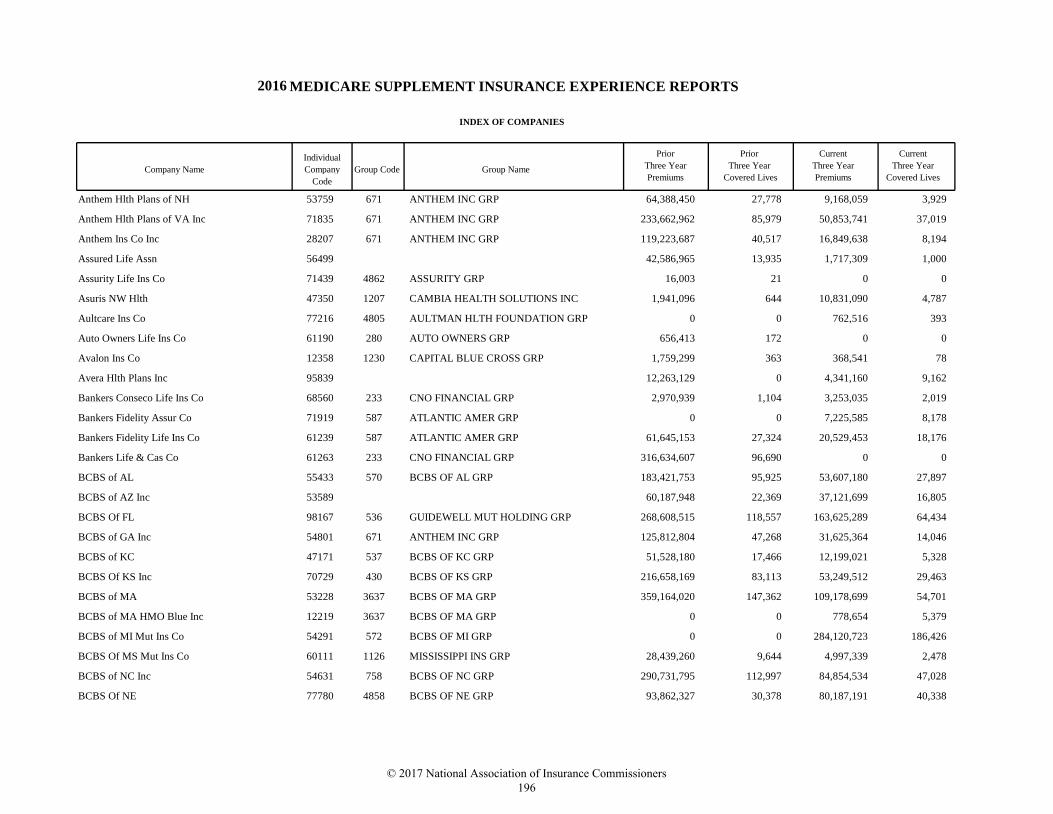
MEDICARE SUPPLEMENT INSURANCE EXPERIENCE REPORTS
INDEX OF COMPANIES
Company Name
Individual
Company
Code
Group Code Group Name
Prior
Three Year
Premiums
Prior Current Current
Three Year Three Year Three Year
Covered Lives Premiums Covered Lives
2016
Anthem Hlth Plans of NH 53759 671 ANTHEM INC GRP 64,388,450 27,778 9,168,059 3,929
Anthem Hlth Plans of VA Inc 71835 671 ANTHEM INC GRP 233,662,962 85,979 50,853,741 37,019
Anthem Ins Co Inc 28207 671 ANTHEM INC GRP 119,223,687 40,517 16,849,638 8,194
Assured Life Assn 56499 42,586,965 13,935 1,717,309 1,000
Assurity Life Ins Co 71439 4862 ASSURITY GRP 16,003 21 0 0
Asuris NW Hlth 47350 1207 CAMBIA HEALTH SOLUTIONS INC 1,941,096 644 10,831,090 4,787
Aultcare Ins Co 77216 4805 AULTMAN HLTH FOUNDATION GRP 0 0 762,516 393
Auto Owners Life Ins Co 61190 280 AUTO OWNERS GRP 656,413 172 0 0
Avalon Ins Co 12358 1230 CAPITAL BLUE CROSS GRP 1,759,299 363 368,541 78
Avera Hlth Plans Inc 95839 12,263,129 0 4,341,160 9,162
Bankers Conseco Life Ins Co 68560 233 CNO FINANCIAL GRP 2,970,939 1,104 3,253,035 2,019
Bankers Fidelity Assur Co 71919 587 ATLANTIC AMER GRP 0 0 7,225,585 8,178
Bankers Fidelity Life Ins Co 61239 587 ATLANTIC AMER GRP 61,645,153 27,324 20,529,453 18,176
Bankers Life & Cas Co 61263 233 CNO FINANCIAL GRP 316,634,607 96,690 0 0
BCBS of AL 55433 570 BCBS OF AL GRP 183,421,753 95,925 53,607,180 27,897
BCBS of AZ Inc 53589 60,187,948 22,369 37,121,699 16,805
BCBS Of FL 98167 536 GUIDEWELL MUT HOLDING GRP 268,608,515 118,557 163,625,289 64,434
BCBS of GA Inc 54801 671 ANTHEM INC GRP 125,812,804 47,268 31,625,364 14,046
BCBS of KC 47171 537 BCBS OF KC GRP 51,528,180 17,466 12,199,021 5,328
BCBS Of KS Inc 70729 430 BCBS OF KS GRP 216,658,169 83,113 53,249,512 29,463
BCBS of MA 53228 3637 BCBS OF MA GRP 359,164,020 147,362 109,178,699 54,701
BCBS of MA HMO Blue Inc 12219 3637 BCBS OF MA GRP 0 0 778,654 5,379
BCBS of MI Mut Ins Co 54291 572 BCBS OF MI GRP 0 0 284,120,723 186,426
BCBS Of MS Mut Ins Co 60111 1126 MISSISSIPPI INS GRP 28,439,260 9,644 4,997,339 2,478
BCBS of NC Inc 54631 758 BCBS OF NC GRP 290,731,795 112,997 84,854,534 47,028
BCBS Of NE 77780 4858 BCBS OF NE GRP 93,862,327 30,378 80,187,191 40,338
© 2017 National Association of Insurance Commissioners 196
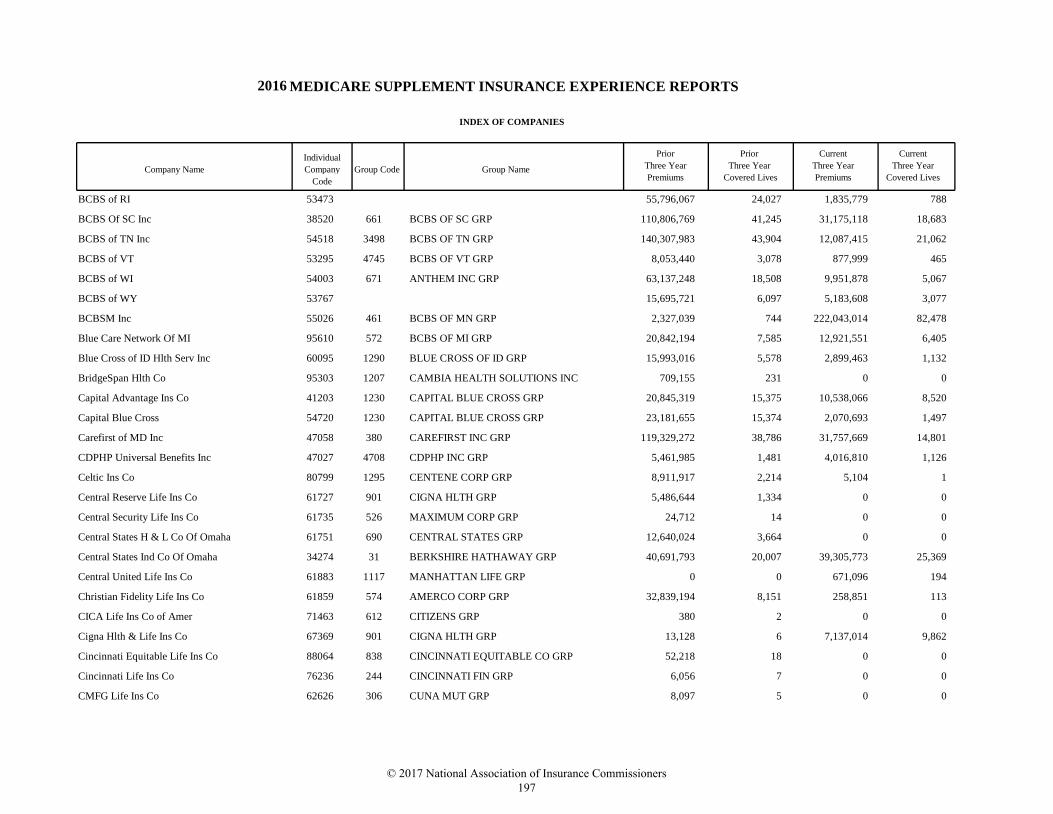
MEDICARE SUPPLEMENT INSURANCE EXPERIENCE REPORTS
INDEX OF COMPANIES
Company Name
Individual
Company
Code
Group Code Group Name
Prior
Three Year
Premiums
Prior Current Current
Three Year Three Year Three Year
Covered Lives Premiums Covered Lives
2016
BCBS of RI 53473 55,796,067 24,027 1,835,779 788
BCBS Of SC Inc 38520 661 BCBS OF SC GRP 110,806,769 41,245 31,175,118 18,683
BCBS of TN Inc 54518 3498 BCBS OF TN GRP 140,307,983 43,904 12,087,415 21,062
BCBS of VT 53295 4745 BCBS OF VT GRP 8,053,440 3,078 877,999 465
BCBS of WI 54003 671 ANTHEM INC GRP 63,137,248 18,508 9,951,878 5,067
BCBS of WY 53767 15,695,721 6,097 5,183,608 3,077
BCBSM Inc 55026 461 BCBS OF MN GRP 2,327,039 744 222,043,014 82,478
Blue Care Network Of MI 95610 572 BCBS OF MI GRP 20,842,194 7,585 12,921,551 6,405
Blue Cross of ID Hlth Serv Inc 60095 1290 BLUE CROSS OF ID GRP 15,993,016 5,578 2,899,463 1,132
BridgeSpan Hlth Co 95303 1207 CAMBIA HEALTH SOLUTIONS INC 709,155 231 0 0
Capital Advantage Ins Co 41203 1230 CAPITAL BLUE CROSS GRP 20,845,319 15,375 10,538,066 8,520
Capital Blue Cross 54720 1230 CAPITAL BLUE CROSS GRP 23,181,655 15,374 2,070,693 1,497
Carefirst of MD Inc 47058 380 CAREFIRST INC GRP 119,329,272 38,786 31,757,669 14,801
CDPHP Universal Benefits Inc 47027 4708 CDPHP INC GRP 5,461,985 1,481 4,016,810 1,126
Celtic Ins Co 80799 1295 CENTENE CORP GRP 8,911,917 2,214 5,104 1
Central Reserve Life Ins Co 61727 901 CIGNA HLTH GRP 5,486,644 1,334 0 0
Central Security Life Ins Co 61735 526 MAXIMUM CORP GRP 24,712 14 0 0
Central States H & L Co Of Omaha 61751 690 CENTRAL STATES GRP 12,640,024 3,664 0 0
Central States Ind Co Of Omaha 34274 31 BERKSHIRE HATHAWAY GRP 40,691,793 20,007 39,305,773 25,369
Central United Life Ins Co 61883 1117 MANHATTAN LIFE GRP 0 0 671,096 194
Christian Fidelity Life Ins Co 61859 574 AMERCO CORP GRP 32,839,194 8,151 258,851 113
CICA Life Ins Co of Amer 71463 612 CITIZENS GRP 380 2 0 0
Cigna Hlth & Life Ins Co 67369 901 CIGNA HLTH GRP 13,128 6 7,137,014 9,862
Cincinnati Equitable Life Ins Co 88064 838 CINCINNATI EQUITABLE CO GRP 52,218 18 0 0
Cincinnati Life Ins Co 76236 244 CINCINNATI FIN GRP 6,056 7 0 0
CMFG Life Ins Co 62626 306 CUNA MUT GRP 8,097 5 0 0
© 2017 National Association of Insurance Commissioners 197
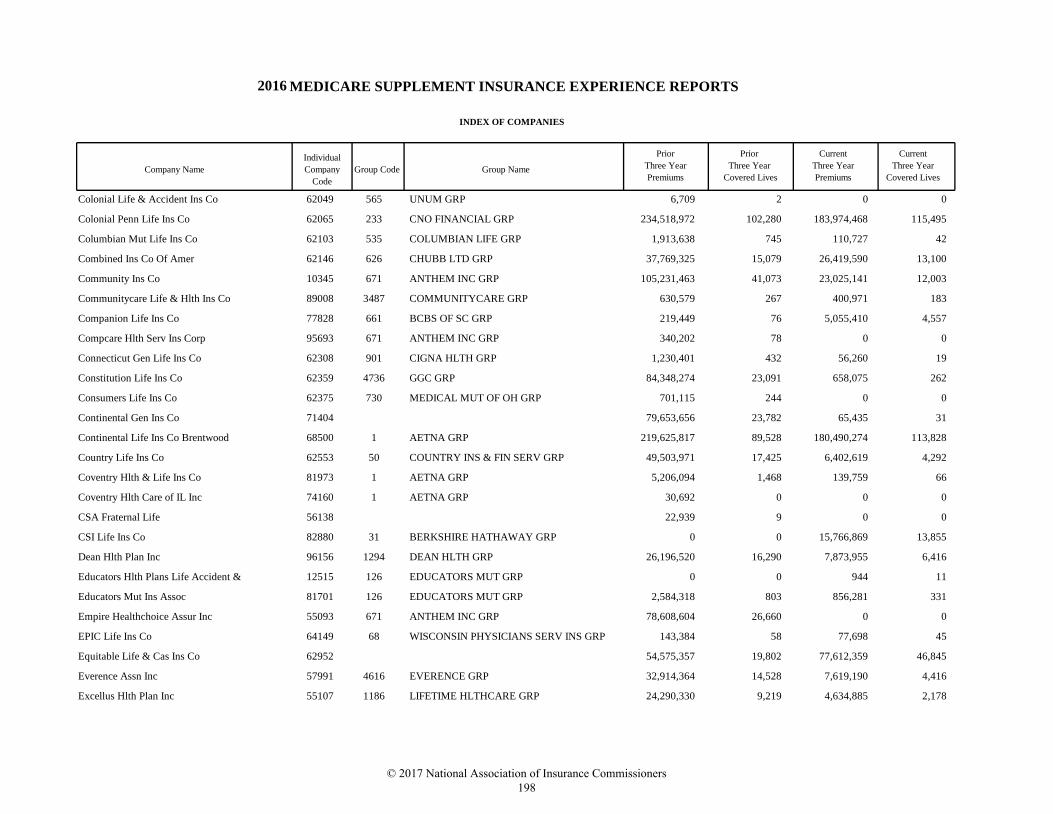
MEDICARE SUPPLEMENT INSURANCE EXPERIENCE REPORTS
INDEX OF COMPANIES
Company Name
Individual
Company
Code
Group Code Group Name
Prior
Three Year
Premiums
Prior Current Current
Three Year Three Year Three Year
Covered Lives Premiums Covered Lives
2016
Colonial Life & Accident Ins Co 62049 565 UNUM GRP 6,709 2 0 0
Colonial Penn Life Ins Co 62065 233 CNO FINANCIAL GRP 234,518,972 102,280 183,974,468 115,495
Columbian Mut Life Ins Co 62103 535 COLUMBIAN LIFE GRP 1,913,638 745 110,727 42
Combined Ins Co Of Amer 62146 626 CHUBB LTD GRP 37,769,325 15,079 26,419,590 13,100
Community Ins Co 10345 671 ANTHEM INC GRP 105,231,463 41,073 23,025,141 12,003
Communitycare Life & Hlth Ins Co 89008 3487 COMMUNITYCARE GRP 630,579 267 400,971 183
Companion Life Ins Co 77828 661 BCBS OF SC GRP 219,449 76 5,055,410 4,557
Compcare Hlth Serv Ins Corp 95693 671 ANTHEM INC GRP 340,202 78 0 0
Connecticut Gen Life Ins Co 62308 901 CIGNA HLTH GRP 1,230,401 432 56,260 19
Constitution Life Ins Co 62359 4736 GGC GRP 84,348,274 23,091 658,075 262
Consumers Life Ins Co 62375 730 MEDICAL MUT OF OH GRP 701,115 244 0 0
Continental Gen Ins Co 71404 79,653,656 23,782 65,435 31
Continental Life Ins Co Brentwood 68500 1 AETNA GRP 219,625,817 89,528 180,490,274 113,828
Country Life Ins Co 62553 50 COUNTRY INS & FIN SERV GRP 49,503,971 17,425 6,402,619 4,292
Coventry Hlth & Life Ins Co 81973 1 AETNA GRP 5,206,094 1,468 139,759 66
Coventry Hlth Care of IL Inc 74160 1 AETNA GRP 30,692 0 0 0
CSA Fraternal Life 56138 22,939 9 0 0
CSI Life Ins Co 82880 31 BERKSHIRE HATHAWAY GRP 0 0 15,766,869 13,855
Dean Hlth Plan Inc 96156 1294 DEAN HLTH GRP 26,196,520 16,290 7,873,955 6,416
Educators Hlth Plans Life Accident & 12515 126 EDUCATORS MUT GRP 0 0 944 11
Educators Mut Ins Assoc 81701 126 EDUCATORS MUT GRP 2,584,318 803 856,281 331
Empire Healthchoice Assur Inc 55093 671 ANTHEM INC GRP 78,608,604 26,660 0 0
EPIC Life Ins Co 64149 68 WISCONSIN PHYSICIANS SERV INS GRP 143,384 58 77,698 45
Equitable Life & Cas Ins Co 62952 54,575,357 19,802 77,612,359 46,845
Everence Assn Inc 57991 4616 EVERENCE GRP 32,914,364 14,528 7,619,190 4,416
Excellus Hlth Plan Inc 55107 1186 LIFETIME HLTHCARE GRP 24,290,330 9,219 4,634,885 2,178
© 2017 National Association of Insurance Commissioners 198
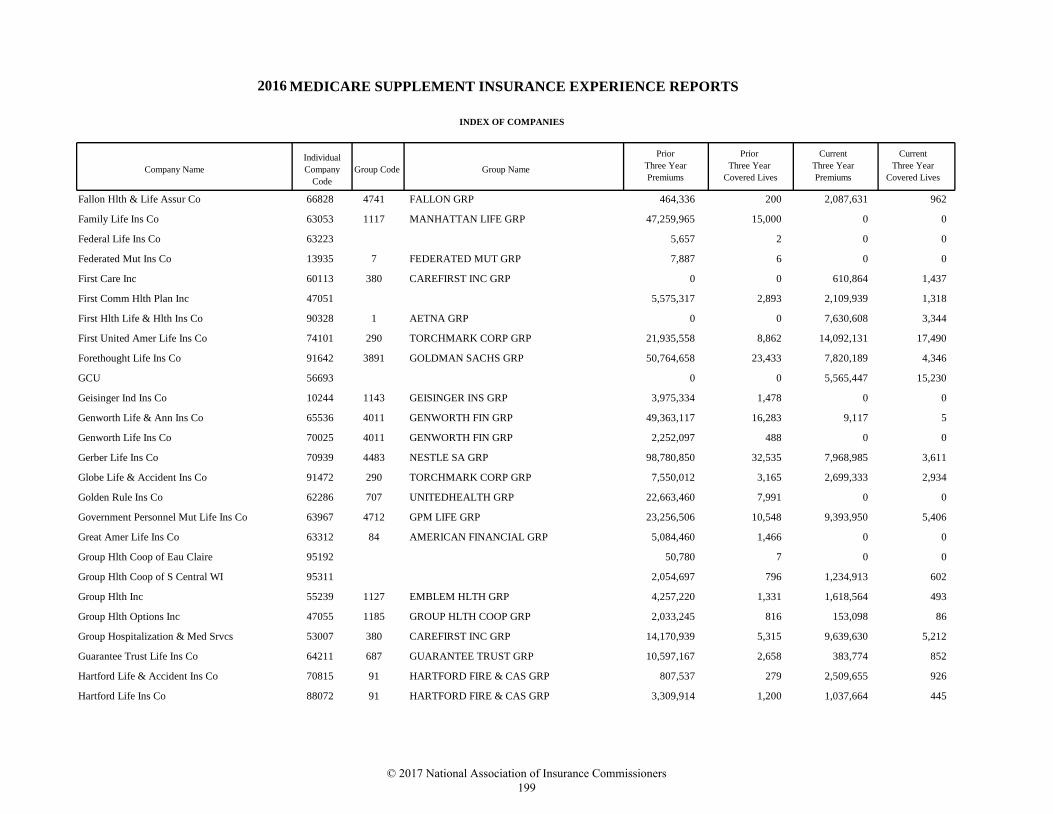
MEDICARE SUPPLEMENT INSURANCE EXPERIENCE REPORTS
INDEX OF COMPANIES
Company Name
Individual
Company
Code
Group Code Group Name
Prior
Three Year
Premiums
Prior Current Current
Three Year Three Year Three Year
Covered Lives Premiums Covered Lives
2016
Fallon Hlth & Life Assur Co 66828 4741 FALLON GRP 464,336 200 2,087,631 962
Family Life Ins Co 63053 1117 MANHATTAN LIFE GRP 47,259,965 15,000 0 0
Federal Life Ins Co 63223 5,657 2 0 0
Federated Mut Ins Co 13935 7 FEDERATED MUT GRP 7,887 6 0 0
First Care Inc 60113 380 CAREFIRST INC GRP 0 0 610,864 1,437
First Comm Hlth Plan Inc 47051 5,575,317 2,893 2,109,939 1,318
First Hlth Life & Hlth Ins Co 90328 1 AETNA GRP 0 0 7,630,608 3,344
First United Amer Life Ins Co 74101 290 TORCHMARK CORP GRP 21,935,558 8,862 14,092,131 17,490
Forethought Life Ins Co 91642 3891 GOLDMAN SACHS GRP 50,764,658 23,433 7,820,189 4,346
GCU 56693 0 0 5,565,447 15,230
Geisinger Ind Ins Co 10244 1143 GEISINGER INS GRP 3,975,334 1,478 0 0
Genworth Life & Ann Ins Co 65536 4011 GENWORTH FIN GRP 49,363,117 16,283 9,117 5
Genworth Life Ins Co 70025 4011 GENWORTH FIN GRP 2,252,097 488 0 0
Gerber Life Ins Co 70939 4483 NESTLE SA GRP 98,780,850 32,535 7,968,985 3,611
Globe Life & Accident Ins Co 91472 290 TORCHMARK CORP GRP 7,550,012 3,165 2,699,333 2,934
Golden Rule Ins Co 62286 707 UNITEDHEALTH GRP 22,663,460 7,991 0 0
Government Personnel Mut Life Ins Co 63967 4712 GPM LIFE GRP 23,256,506 10,548 9,393,950 5,406
Great Amer Life Ins Co 63312 84 AMERICAN FINANCIAL GRP 5,084,460 1,466 0 0
Group Hlth Coop of Eau Claire 95192 50,780 7 0 0
Group Hlth Coop of S Central WI 95311 2,054,697 796 1,234,913 602
Group Hlth Inc 55239 1127 EMBLEM HLTH GRP 4,257,220 1,331 1,618,564 493
Group Hlth Options Inc 47055 1185 GROUP HLTH COOP GRP 2,033,245 816 153,098 86
Group Hospitalization & Med Srvcs 53007 380 CAREFIRST INC GRP 14,170,939 5,315 9,639,630 5,212
Guarantee Trust Life Ins Co 64211 687 GUARANTEE TRUST GRP 10,597,167 2,658 383,774 852
Hartford Life & Accident Ins Co 70815 91 HARTFORD FIRE & CAS GRP 807,537 279 2,509,655 926
Hartford Life Ins Co 88072 91 HARTFORD FIRE & CAS GRP 3,309,914 1,200 1,037,664 445
© 2017 National Association of Insurance Commissioners 199
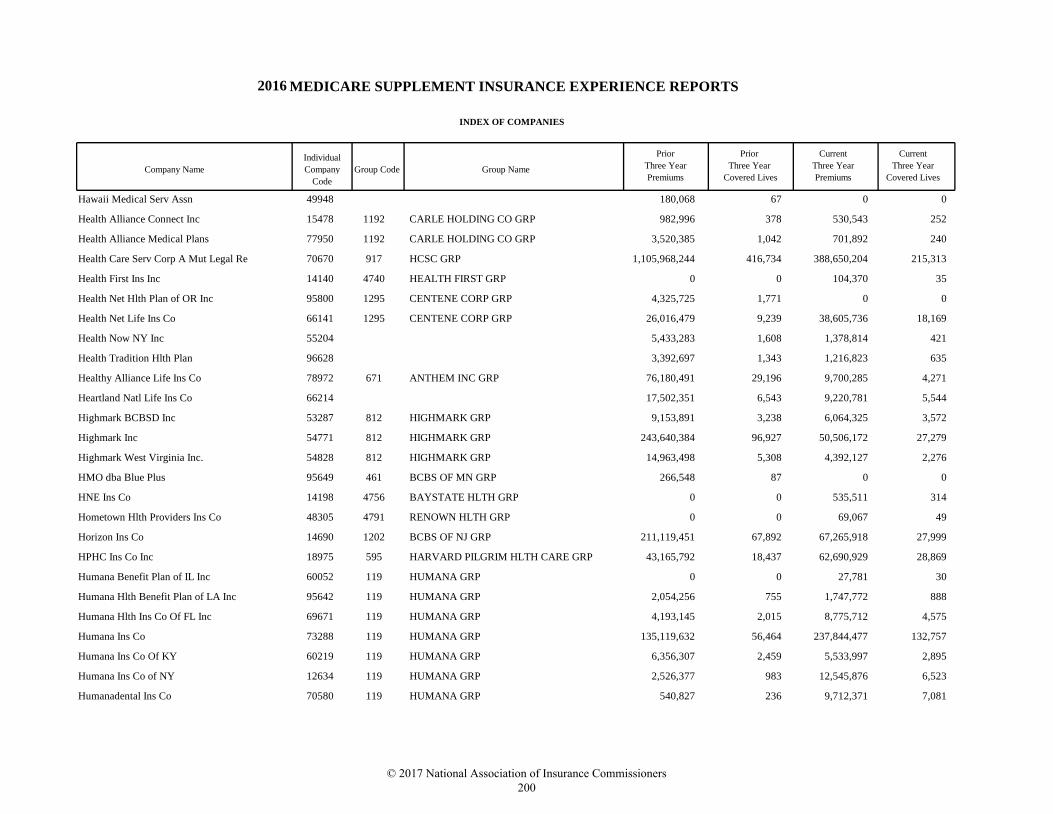
MEDICARE SUPPLEMENT INSURANCE EXPERIENCE REPORTS
INDEX OF COMPANIES
Company Name
Individual
Company
Code
Group Code Group Name
Prior
Three Year
Premiums
Prior Current Current
Three Year Three Year Three Year
Covered Lives Premiums Covered Lives
2016
Hawaii Medical Serv Assn 49948 180,068 67 0 0
Health Alliance Connect Inc 15478 1192 CARLE HOLDING CO GRP 982,996 378 530,543 252
Health Alliance Medical Plans 77950 1192 CARLE HOLDING CO GRP 3,520,385 1,042 701,892 240
Health Care Serv Corp A Mut Legal Re 70670 917 HCSC GRP 1,105,968,244 416,734 388,650,204 215,313
Health First Ins Inc 14140 4740 HEALTH FIRST GRP 0 0 104,370 35
Health Net Hlth Plan of OR Inc 95800 1295 CENTENE CORP GRP 4,325,725 1,771 0 0
Health Net Life Ins Co 66141 1295 CENTENE CORP GRP 26,016,479 9,239 38,605,736 18,169
Health Now NY Inc 55204 5,433,283 1,608 1,378,814 421
Health Tradition Hlth Plan 96628 3,392,697 1,343 1,216,823 635
Healthy Alliance Life Ins Co 78972 671 ANTHEM INC GRP 76,180,491 29,196 9,700,285 4,271
Heartland Natl Life Ins Co 66214 17,502,351 6,543 9,220,781 5,544
Highmark BCBSD Inc 53287 812 HIGHMARK GRP 9,153,891 3,238 6,064,325 3,572
Highmark Inc 54771 812 HIGHMARK GRP 243,640,384 96,927 50,506,172 27,279
Highmark West Virginia Inc. 54828 812 HIGHMARK GRP 14,963,498 5,308 4,392,127 2,276
HMO dba Blue Plus 95649 461 BCBS OF MN GRP 266,548 87 0 0
HNE Ins Co 14198 4756 BAYSTATE HLTH GRP 0 0 535,511 314
Hometown Hlth Providers Ins Co 48305 4791 RENOWN HLTH GRP 0 0 69,067 49
Horizon Ins Co 14690 1202 BCBS OF NJ GRP 211,119,451 67,892 67,265,918 27,999
HPHC Ins Co Inc 18975 595 HARVARD PILGRIM HLTH CARE GRP 43,165,792 18,437 62,690,929 28,869
Humana Benefit Plan of IL Inc 60052 119 HUMANA GRP 0 0 27,781 30
Humana Hlth Benefit Plan of LA Inc 95642 119 HUMANA GRP 2,054,256 755 1,747,772 888
Humana Hlth Ins Co Of FL Inc 69671 119 HUMANA GRP 4,193,145 2,015 8,775,712 4,575
Humana Ins Co 73288 119 HUMANA GRP 135,119,632 56,464 237,844,477 132,757
Humana Ins Co Of KY 60219 119 HUMANA GRP 6,356,307 2,459 5,533,997 2,895
Humana Ins Co of NY 12634 119 HUMANA GRP 2,526,377 983 12,545,876 6,523
Humanadental Ins Co 70580 119 HUMANA GRP 540,827 236 9,712,371 7,081
© 2017 National Association of Insurance Commissioners 200
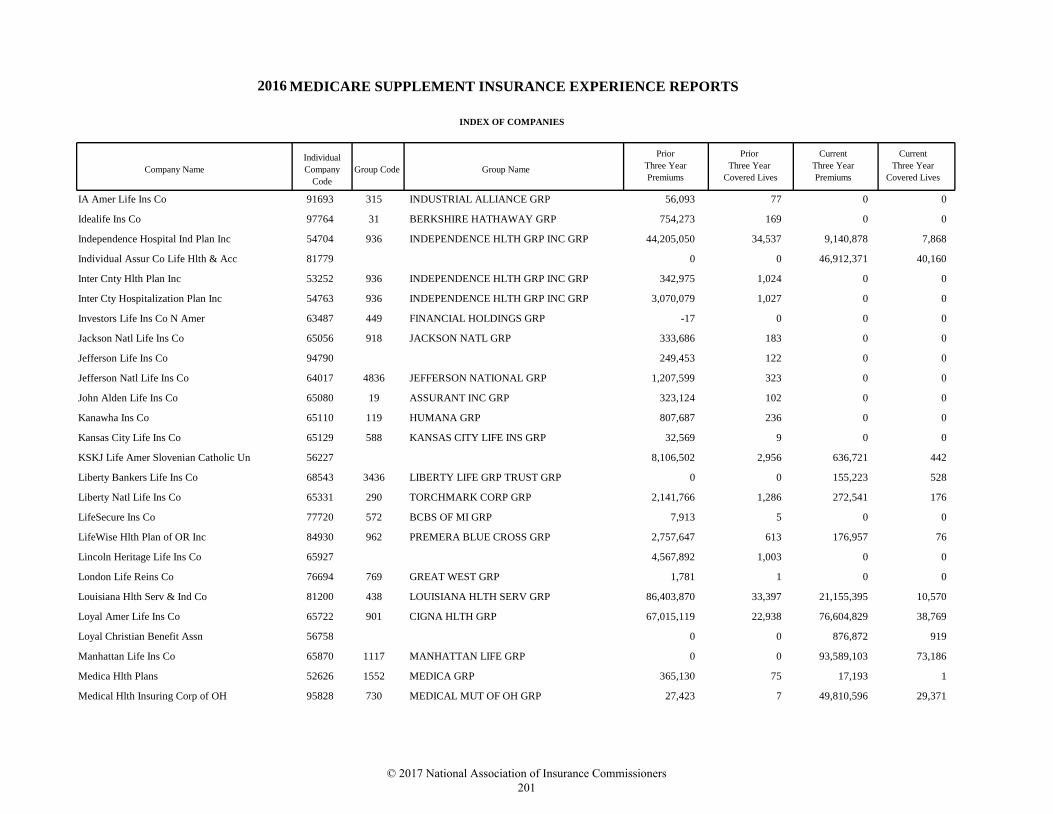
MEDICARE SUPPLEMENT INSURANCE EXPERIENCE REPORTS
INDEX OF COMPANIES
Company Name
Individual
Company
Code
Group Code Group Name
Prior
Three Year
Premiums
Prior Current Current
Three Year Three Year Three Year
Covered Lives Premiums Covered Lives
2016
IA Amer Life Ins Co 91693 315 INDUSTRIAL ALLIANCE GRP 56,093 77 0 0
Idealife Ins Co 97764 31 BERKSHIRE HATHAWAY GRP 754,273 169 0 0
Independence Hospital Ind Plan Inc 54704 936 INDEPENDENCE HLTH GRP INC GRP 44,205,050 34,537 9,140,878 7,868
Individual Assur Co Life Hlth & Acc 81779 0 0 46,912,371 40,160
Inter Cnty Hlth Plan Inc 53252 936 INDEPENDENCE HLTH GRP INC GRP 342,975 1,024 0 0
Inter Cty Hospitalization Plan Inc 54763 936 INDEPENDENCE HLTH GRP INC GRP 3,070,079 1,027 0 0
Investors Life Ins Co N Amer 63487 449 FINANCIAL HOLDINGS GRP -17 0 0 0
Jackson Natl Life Ins Co 65056 918 JACKSON NATL GRP 333,686 183 0 0
Jefferson Life Ins Co 94790 249,453 122 0 0
Jefferson Natl Life Ins Co 64017 4836 JEFFERSON NATIONAL GRP 1,207,599 323 0 0
John Alden Life Ins Co 65080 19 ASSURANT INC GRP 323,124 102 0 0
Kanawha Ins Co 65110 119 HUMANA GRP 807,687 236 0 0
Kansas City Life Ins Co 65129 588 KANSAS CITY LIFE INS GRP 32,569 9 0 0
KSKJ Life Amer Slovenian Catholic Un 56227 8,106,502 2,956 636,721 442
Liberty Bankers Life Ins Co 68543 3436 LIBERTY LIFE GRP TRUST GRP 0 0 155,223 528
Liberty Natl Life Ins Co 65331 290 TORCHMARK CORP GRP 2,141,766 1,286 272,541 176
LifeSecure Ins Co 77720 572 BCBS OF MI GRP 7,913 5 0 0
LifeWise Hlth Plan of OR Inc 84930 962 PREMERA BLUE CROSS GRP 2,757,647 613 176,957 76
Lincoln Heritage Life Ins Co 65927 4,567,892 1,003 0 0
London Life Reins Co 76694 769 GREAT WEST GRP 1,781 1 0 0
Louisiana Hlth Serv & Ind Co 81200 438 LOUISIANA HLTH SERV GRP 86,403,870 33,397 21,155,395 10,570
Loyal Amer Life Ins Co 65722 901 CIGNA HLTH GRP 67,015,119 22,938 76,604,829 38,769
Loyal Christian Benefit Assn 56758 0 0 876,872 919
Manhattan Life Ins Co 65870 1117 MANHATTAN LIFE GRP 0 0 93,589,103 73,186
Medica Hlth Plans 52626 1552 MEDICA GRP 365,130 75 17,193 1
Medical Hlth Insuring Corp of OH 95828 730 MEDICAL MUT OF OH GRP 27,423 7 49,810,596 29,371
© 2017 National Association of Insurance Commissioners 201
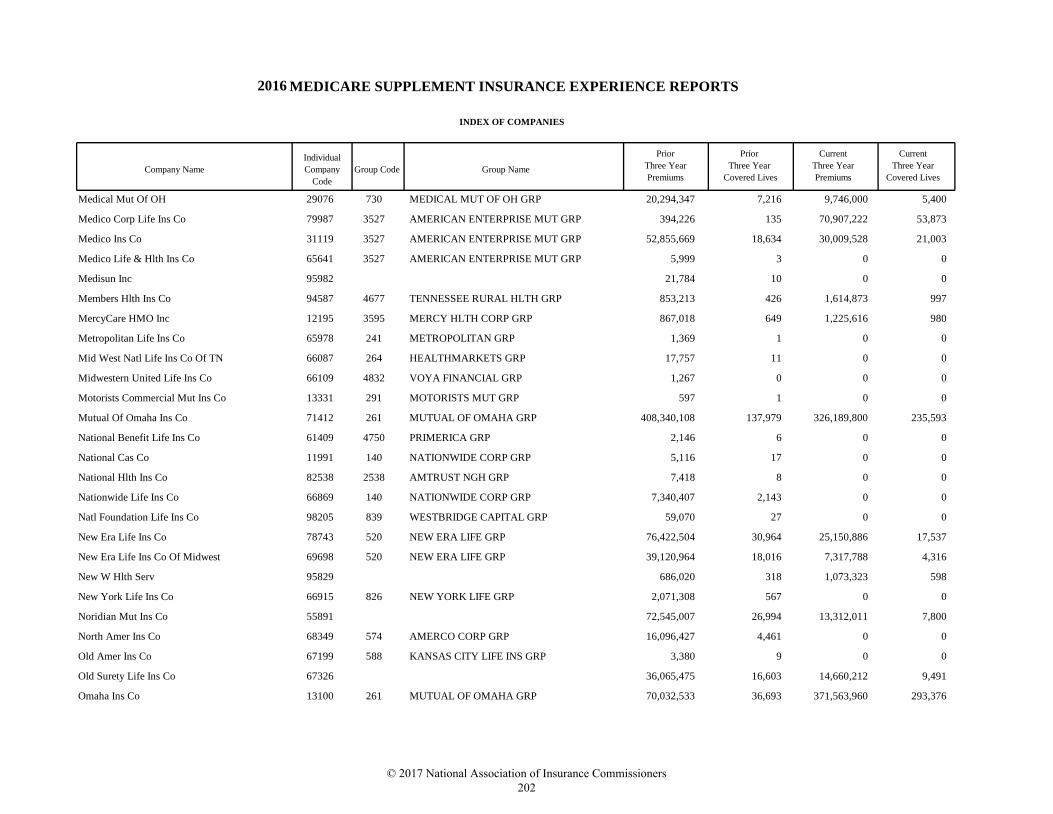
MEDICARE SUPPLEMENT INSURANCE EXPERIENCE REPORTS
INDEX OF COMPANIES
Company Name
Individual
Company
Code
Group Code Group Name
Prior
Three Year
Premiums
Prior Current Current
Three Year Three Year Three Year
Covered Lives Premiums Covered Lives
2016
Medical Mut Of OH 29076 730 MEDICAL MUT OF OH GRP 20,294,347 7,216 9,746,000 5,400
Medico Corp Life Ins Co 79987 3527 AMERICAN ENTERPRISE MUT GRP 394,226 135 70,907,222 53,873
Medico Ins Co 31119 3527 AMERICAN ENTERPRISE MUT GRP 52,855,669 18,634 30,009,528 21,003
Medico Life & Hlth Ins Co 65641 3527 AMERICAN ENTERPRISE MUT GRP 5,999 3 0 0
Medisun Inc 95982 21,784 10 0 0
Members Hlth Ins Co 94587 4677 TENNESSEE RURAL HLTH GRP 853,213 426 1,614,873 997
MercyCare HMO Inc 12195 3595 MERCY HLTH CORP GRP 867,018 649 1,225,616 980
Metropolitan Life Ins Co 65978 241 METROPOLITAN GRP 1,369 1 0 0
Mid West Natl Life Ins Co Of TN 66087 264 HEALTHMARKETS GRP 17,757 11 0 0
Midwestern United Life Ins Co 66109 4832 VOYA FINANCIAL GRP 1,267 0 0 0
Motorists Commercial Mut Ins Co 13331 291 MOTORISTS MUT GRP 597 1 0 0
Mutual Of Omaha Ins Co 71412 261 MUTUAL OF OMAHA GRP 408,340,108 137,979 326,189,800 235,593
National Benefit Life Ins Co 61409 4750 PRIMERICA GRP 2,146 6 0 0
National Cas Co 11991 140 NATIONWIDE CORP GRP 5,116 17 0 0
National Hlth Ins Co 82538 2538 AMTRUST NGH GRP 7,418 8 0 0
Nationwide Life Ins Co 66869 140 NATIONWIDE CORP GRP 7,340,407 2,143 0 0
Natl Foundation Life Ins Co 98205 839 WESTBRIDGE CAPITAL GRP 59,070 27 0 0
New Era Life Ins Co 78743 520 NEW ERA LIFE GRP 76,422,504 30,964 25,150,886 17,537
New Era Life Ins Co Of Midwest 69698 520 NEW ERA LIFE GRP 39,120,964 18,016 7,317,788 4,316
New W Hlth Serv 95829 686,020 318 1,073,323 598
New York Life Ins Co 66915 826 NEW YORK LIFE GRP 2,071,308 567 0 0
Noridian Mut Ins Co 55891 72,545,007 26,994 13,312,011 7,800
North Amer Ins Co 68349 574 AMERCO CORP GRP 16,096,427 4,461 0 0
Old Amer Ins Co 67199 588 KANSAS CITY LIFE INS GRP 3,380 9 0 0
Old Surety Life Ins Co 67326 36,065,475 16,603 14,660,212 9,491
Omaha Ins Co 13100 261 MUTUAL OF OMAHA GRP 70,032,533 36,693 371,563,960 293,376
© 2017 National Association of Insurance Commissioners 202
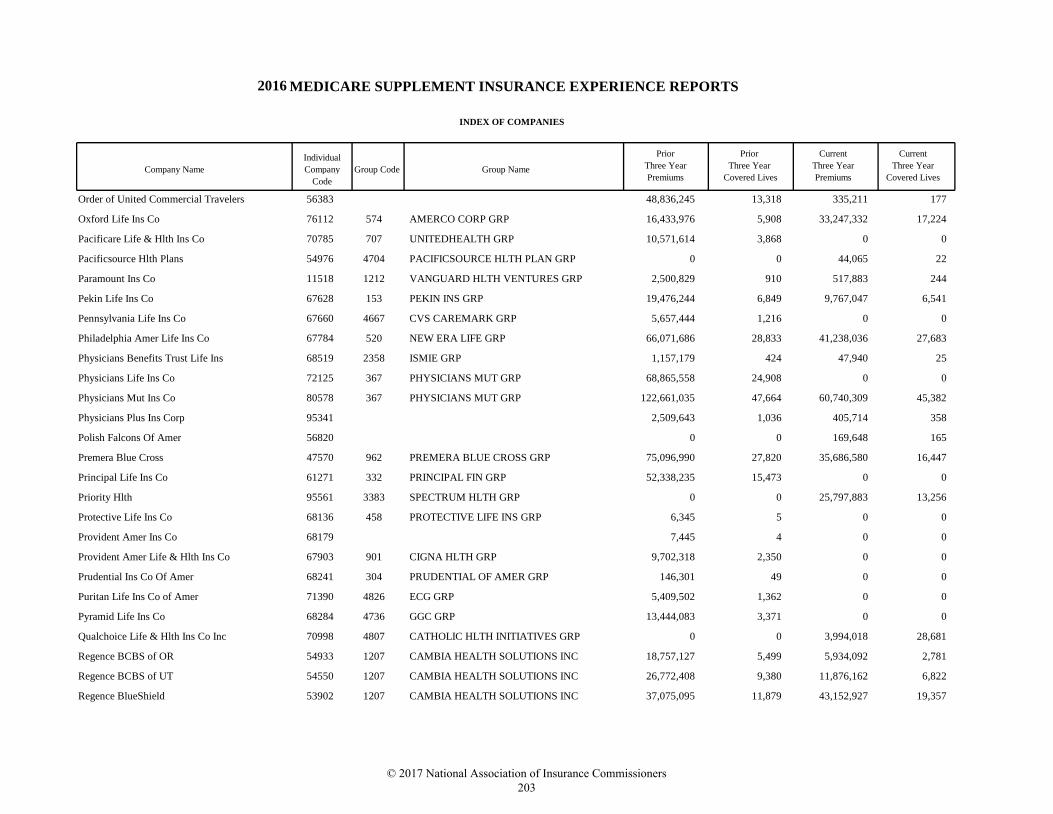
MEDICARE SUPPLEMENT INSURANCE EXPERIENCE REPORTS
INDEX OF COMPANIES
Company Name
Individual
Company
Code
Group Code Group Name
Prior
Three Year
Premiums
Prior Current Current
Three Year Three Year Three Year
Covered Lives Premiums Covered Lives
2016
Order of United Commercial Travelers 56383 48,836,245 13,318 335,211 177
Oxford Life Ins Co 76112 574 AMERCO CORP GRP 16,433,976 5,908 33,247,332 17,224
Pacificare Life & Hlth Ins Co 70785 707 UNITEDHEALTH GRP 10,571,614 3,868 0 0
Pacificsource Hlth Plans 54976 4704 PACIFICSOURCE HLTH PLAN GRP 0 0 44,065 22
Paramount Ins Co 11518 1212 VANGUARD HLTH VENTURES GRP 2,500,829 910 517,883 244
Pekin Life Ins Co 67628 153 PEKIN INS GRP 19,476,244 6,849 9,767,047 6,541
Pennsylvania Life Ins Co 67660 4667 CVS CAREMARK GRP 5,657,444 1,216 0 0
Philadelphia Amer Life Ins Co 67784 520 NEW ERA LIFE GRP 66,071,686 28,833 41,238,036 27,683
Physicians Benefits Trust Life Ins 68519 2358 ISMIE GRP 1,157,179 424 47,940 25
Physicians Life Ins Co 72125 367 PHYSICIANS MUT GRP 68,865,558 24,908 0 0
Physicians Mut Ins Co 80578 367 PHYSICIANS MUT GRP 122,661,035 47,664 60,740,309 45,382
Physicians Plus Ins Corp 95341 2,509,643 1,036 405,714 358
Polish Falcons Of Amer 56820 0 0 169,648 165
Premera Blue Cross 47570 962 PREMERA BLUE CROSS GRP 75,096,990 27,820 35,686,580 16,447
Principal Life Ins Co 61271 332 PRINCIPAL FIN GRP 52,338,235 15,473 0 0
Priority Hlth 95561 3383 SPECTRUM HLTH GRP 0 0 25,797,883 13,256
Protective Life Ins Co 68136 458 PROTECTIVE LIFE INS GRP 6,345 5 0 0
Provident Amer Ins Co 68179 7,445 4 0 0
Provident Amer Life & Hlth Ins Co 67903 901 CIGNA HLTH GRP 9,702,318 2,350 0 0
Prudential Ins Co Of Amer 68241 304 PRUDENTIAL OF AMER GRP 146,301 49 0 0
Puritan Life Ins Co of Amer 71390 4826 ECG GRP 5,409,502 1,362 0 0
Pyramid Life Ins Co 68284 4736 GGC GRP 13,444,083 3,371 0 0
Qualchoice Life & Hlth Ins Co Inc 70998 4807 CATHOLIC HLTH INITIATIVES GRP 0 0 3,994,018 28,681
Regence BCBS of OR 54933 1207 CAMBIA HEALTH SOLUTIONS INC 18,757,127 5,499 5,934,092 2,781
Regence BCBS of UT 54550 1207 CAMBIA HEALTH SOLUTIONS INC 26,772,408 9,380 11,876,162 6,822
Regence BlueShield 53902 1207 CAMBIA HEALTH SOLUTIONS INC 37,075,095 11,879 43,152,927 19,357
© 2017 National Association of Insurance Commissioners 203
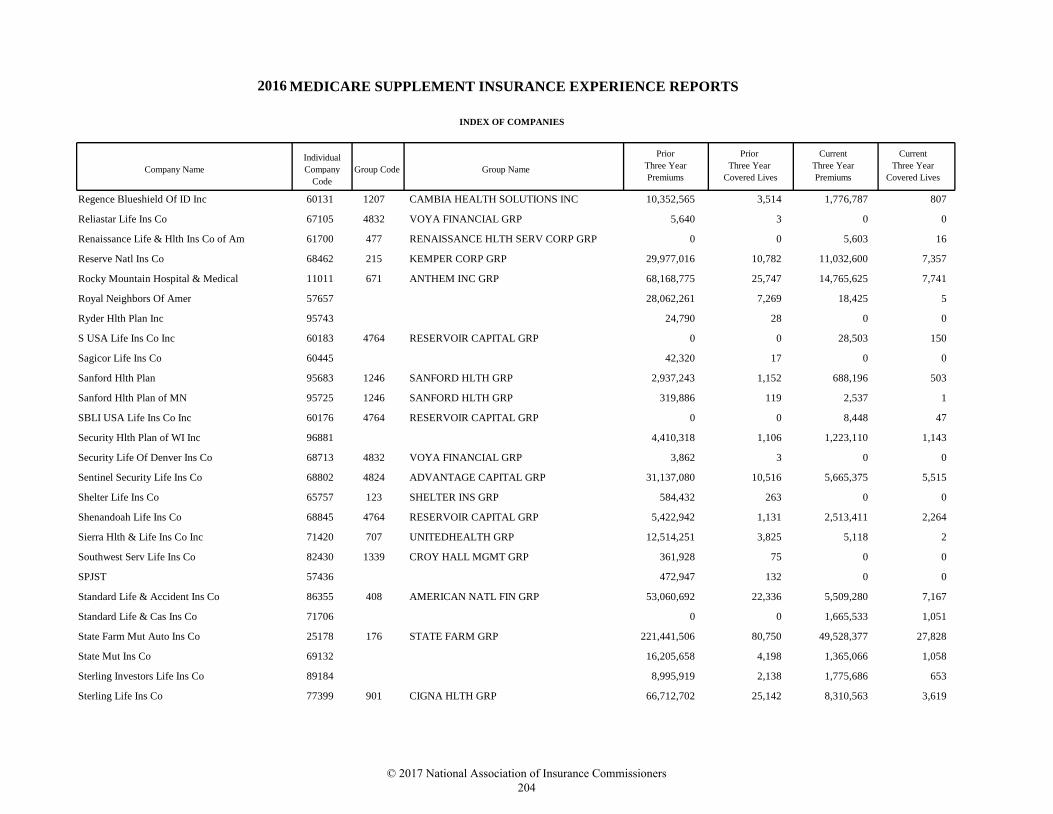
MEDICARE SUPPLEMENT INSURANCE EXPERIENCE REPORTS
INDEX OF COMPANIES
Company Name
Individual
Company
Code
Group Code Group Name
Prior
Three Year
Premiums
Prior Current Current
Three Year Three Year Three Year
Covered Lives Premiums Covered Lives
2016
Regence Blueshield Of ID Inc 60131 1207 CAMBIA HEALTH SOLUTIONS INC 10,352,565 3,514 1,776,787 807
Reliastar Life Ins Co 67105 4832 VOYA FINANCIAL GRP 5,640 3 0 0
Renaissance Life & Hlth Ins Co of Am 61700 477 RENAISSANCE HLTH SERV CORP GRP 0 0 5,603 16
Reserve Natl Ins Co 68462 215 KEMPER CORP GRP 29,977,016 10,782 11,032,600 7,357
Rocky Mountain Hospital & Medical 11011 671 ANTHEM INC GRP 68,168,775 25,747 14,765,625 7,741
Royal Neighbors Of Amer 57657 28,062,261 7,269 18,425 5
Ryder Hlth Plan Inc 95743 24,790 28 0 0
S USA Life Ins Co Inc 60183 4764 RESERVOIR CAPITAL GRP 0 0 28,503 150
Sagicor Life Ins Co 60445 42,320 17 0 0
Sanford Hlth Plan 95683 1246 SANFORD HLTH GRP 2,937,243 1,152 688,196 503
Sanford Hlth Plan of MN 95725 1246 SANFORD HLTH GRP 319,886 119 2,537 1
SBLI USA Life Ins Co Inc 60176 4764 RESERVOIR CAPITAL GRP 0 0 8,448 47
Security Hlth Plan of WI Inc 96881 4,410,318 1,106 1,223,110 1,143
Security Life Of Denver Ins Co 68713 4832 VOYA FINANCIAL GRP 3,862 3 0 0
Sentinel Security Life Ins Co 68802 4824 ADVANTAGE CAPITAL GRP 31,137,080 10,516 5,665,375 5,515
Shelter Life Ins Co 65757 123 SHELTER INS GRP 584,432 263 0 0
Shenandoah Life Ins Co 68845 4764 RESERVOIR CAPITAL GRP 5,422,942 1,131 2,513,411 2,264
Sierra Hlth & Life Ins Co Inc 71420 707 UNITEDHEALTH GRP 12,514,251 3,825 5,118 2
Southwest Serv Life Ins Co 82430 1339 CROY HALL MGMT GRP 361,928 75 0 0
SPJST 57436 472,947 132 0 0
Standard Life & Accident Ins Co 86355 408 AMERICAN NATL FIN GRP 53,060,692 22,336 5,509,280 7,167
Standard Life & Cas Ins Co 71706 0 0 1,665,533 1,051
State Farm Mut Auto Ins Co 25178 176 STATE FARM GRP 221,441,506 80,750 49,528,377 27,828
State Mut Ins Co 69132 16,205,658 4,198 1,365,066 1,058
Sterling Investors Life Ins Co 89184 8,995,919 2,138 1,775,686 653
Sterling Life Ins Co 77399 901 CIGNA HLTH GRP 66,712,702 25,142 8,310,563 3,619
© 2017 National Association of Insurance Commissioners 204
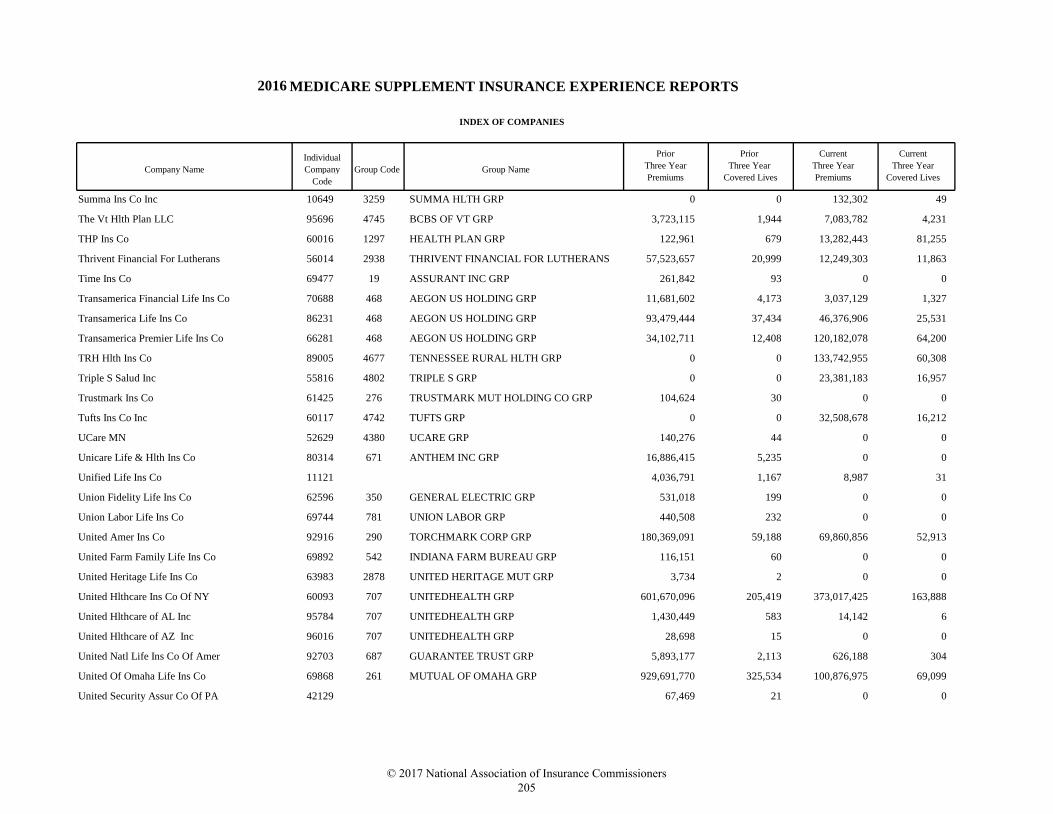
MEDICARE SUPPLEMENT INSURANCE EXPERIENCE REPORTS
INDEX OF COMPANIES
Company Name
Individual
Company
Code
Group Code Group Name
Prior
Three Year
Premiums
Prior Current Current
Three Year Three Year Three Year
Covered Lives Premiums Covered Lives
2016
Summa Ins Co Inc 10649 3259 SUMMA HLTH GRP 0 0 132,302 49
The Vt Hlth Plan LLC 95696 4745 BCBS OF VT GRP 3,723,115 1,944 7,083,782 4,231
THP Ins Co 60016 1297 HEALTH PLAN GRP 122,961 679 13,282,443 81,255
Thrivent Financial For Lutherans 56014 2938 THRIVENT FINANCIAL FOR LUTHERANS 57,523,657 20,999 12,249,303 11,863
Time Ins Co 69477 19 ASSURANT INC GRP 261,842 93 0 0
Transamerica Financial Life Ins Co 70688 468 AEGON US HOLDING GRP 11,681,602 4,173 3,037,129 1,327
Transamerica Life Ins Co 86231 468 AEGON US HOLDING GRP 93,479,444 37,434 46,376,906 25,531
Transamerica Premier Life Ins Co 66281 468 AEGON US HOLDING GRP 34,102,711 12,408 120,182,078 64,200
TRH Hlth Ins Co 89005 4677 TENNESSEE RURAL HLTH GRP 0 0 133,742,955 60,308
Triple S Salud Inc 55816 4802 TRIPLE S GRP 0 0 23,381,183 16,957
Trustmark Ins Co 61425 276 TRUSTMARK MUT HOLDING CO GRP 104,624 30 0 0
Tufts Ins Co Inc 60117 4742 TUFTS GRP 0 0 32,508,678 16,212
UCare MN 52629 4380 UCARE GRP 140,276 44 0 0
Unicare Life & Hlth Ins Co 80314 671 ANTHEM INC GRP 16,886,415 5,235 0 0
Unified Life Ins Co 11121 4,036,791 1,167 8,987 31
Union Fidelity Life Ins Co 62596 350 GENERAL ELECTRIC GRP 531,018 199 0 0
Union Labor Life Ins Co 69744 781 UNION LABOR GRP 440,508 232 0 0
United Amer Ins Co 92916 290 TORCHMARK CORP GRP 180,369,091 59,188 69,860,856 52,913
United Farm Family Life Ins Co 69892 542 INDIANA FARM BUREAU GRP 116,151 60 0 0
United Heritage Life Ins Co 63983 2878 UNITED HERITAGE MUT GRP 3,734 2 0 0
United Hlthcare Ins Co Of NY 60093 707 UNITEDHEALTH GRP 601,670,096 205,419 373,017,425 163,888
United Hlthcare of AL Inc 95784 707 UNITEDHEALTH GRP 1,430,449 583 14,142 6
United Hlthcare of AZ Inc 96016 707 UNITEDHEALTH GRP 28,698 15 0 0
United Natl Life Ins Co Of Amer 92703 687 GUARANTEE TRUST GRP 5,893,177 2,113 626,188 304
United Of Omaha Life Ins Co 69868 261 MUTUAL OF OMAHA GRP 929,691,770 325,534 100,876,975 69,099
United Security Assur Co Of PA 42129 67,469 21 0 0
© 2017 National Association of Insurance Commissioners 205
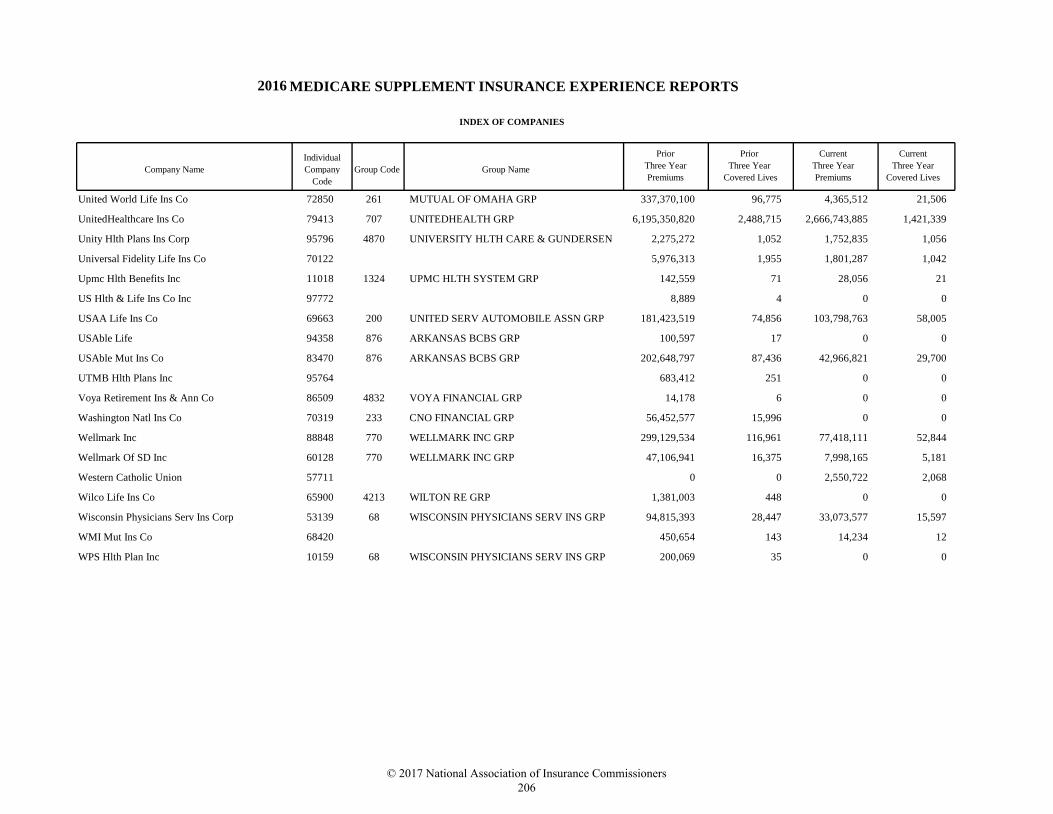
MEDICARE SUPPLEMENT INSURANCE EXPERIENCE REPORTS
INDEX OF COMPANIES
Company Name
Individual
Company
Code
Group Code Group Name
Prior
Three Year
Premiums
Prior Current Current
Three Year Three Year Three Year
Covered Lives Premiums Covered Lives
2016
United World Life Ins Co 72850 261 MUTUAL OF OMAHA GRP 337,370,100 96,775 4,365,512 21,506
UnitedHealthcare Ins Co 79413 707 UNITEDHEALTH GRP 6,195,350,820 2,488,715 2,666,743,885 1,421,339
Unity Hlth Plans Ins Corp 95796 4870 UNIVERSITY HLTH CARE & GUNDERSEN 2,275,272 1,052 1,752,835 1,056
Universal Fidelity Life Ins Co 70122 5,976,313 1,955 1,801,287 1,042
Upmc Hlth Benefits Inc 11018 1324 UPMC HLTH SYSTEM GRP 142,559 71 28,056 21
US Hlth & Life Ins Co Inc 97772 8,889 4 0 0
USAA Life Ins Co 69663 200 UNITED SERV AUTOMOBILE ASSN GRP 181,423,519 74,856 103,798,763 58,005
USAble Life 94358 876 ARKANSAS BCBS GRP 100,597 17 0 0
USAble Mut Ins Co 83470 876 ARKANSAS BCBS GRP 202,648,797 87,436 42,966,821 29,700
UTMB Hlth Plans Inc 95764 683,412 251 0 0
Voya Retirement Ins & Ann Co 86509 4832 VOYA FINANCIAL GRP 14,178 6 0 0
Washington Natl Ins Co 70319 233 CNO FINANCIAL GRP 56,452,577 15,996 0 0
Wellmark Inc 88848 770 WELLMARK INC GRP 299,129,534 116,961 77,418,111 52,844
Wellmark Of SD Inc 60128 770 WELLMARK INC GRP 47,106,941 16,375 7,998,165 5,181
Western Catholic Union 57711 0 0 2,550,722 2,068
Wilco Life Ins Co 65900 4213 WILTON RE GRP 1,381,003 448 0 0
Wisconsin Physicians Serv Ins Corp 53139 68 WISCONSIN PHYSICIANS SERV INS GRP 94,815,393 28,447 33,073,577 15,597
WMI Mut Ins Co 68420 450,654 143 14,234 12
WPS Hlth Plan Inc 10159 68 WISCONSIN PHYSICIANS SERV INS GRP 200,069 35 0 0
© 2017 National Association of Insurance Commissioners 206
SAMPLE MEDICARE SUPPLEMENT INSURANCE EXHIBIT
© 2017 National Association of Insurance Commissioners 207

© 2017 National Association of Insurance Commissioners 208
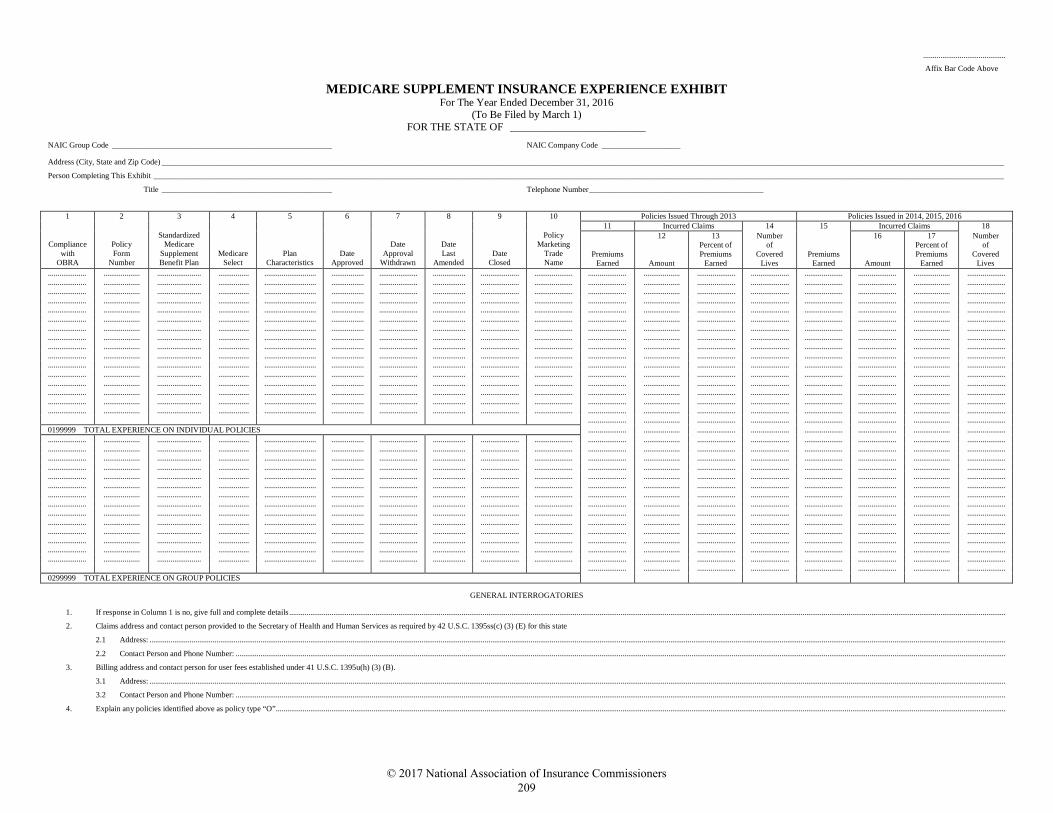
...........................................
Affix Bar Code Above
MEDICARE SUPPLEMENT INSURANCE EXPERIENCE EXHIBIT For The Year Ended December 31, 2016
(To Be Filed by March 1) FOR THE STATE OF _________________________ NAIC Group Code _____________________________________________________ NAIC Company Code ___________________ Address (City, State and Zip Code) ___________________________________________________________________________________________________________________________________________________________________________________________________________
Person Completing This Exhibit _____________________________________________________________________________________________________________________________________________________________________________________________________________
Title _________________________________________ Telephone Number __________________________________________
1 2 3 4 5 6 7 8 9 10 Policies Issued Through 2013 Policies Issued in 2014, 2015, 2016
Compliance with
OBRA
Policy Form
Number
Standardized
Medicare Supplement Benefit Plan
Medicare Select
Plan Characteristics
Date Approved
Date Approval
Withdrawn
Date Last
Amended
Date Closed
Policy
Marketing Trade Name
11 Incurred Claims 14 15 Incurred Claims 18
Premiums Earned
12
Amount
13 Percent of Premiums
Earned
Number of
Covered Lives
Premiums Earned
16
Amount
17 Percent of Premiums
Earned
Number of
Covered Lives
.................... ................... ....................... ................ ........................... ................. .................... ................. .................... .................... .................... ................... .................... .................... .................... .................... ................... ....................
.................... ................... ....................... ................ ........................... ................. .................... ................. .................... .................... .................... ................... .................... .................... .................... .................... ................... ....................
.................... ................... ....................... ................ ........................... ................. .................... ................. .................... .................... .................... ................... .................... .................... .................... .................... ................... ....................
.................... ................... ....................... ................ ........................... ................. .................... ................. .................... .................... .................... ................... .................... .................... .................... .................... ................... ....................
.................... ................... ....................... ................ ........................... ................. .................... ................. .................... .................... .................... ................... .................... .................... .................... .................... ................... ....................
.................... ................... ....................... ................ ........................... ................. .................... ................. .................... .................... .................... ................... .................... .................... .................... .................... ................... ....................
.................... ................... ....................... ................ ........................... ................. .................... ................. .................... .................... .................... ................... .................... .................... .................... .................... ................... ....................
.................... ................... ....................... ................ ........................... ................. .................... ................. .................... .................... .................... ................... .................... .................... .................... .................... ................... ....................
.................... ................... ....................... ................ ........................... ................. .................... ................. .................... .................... .................... ................... .................... .................... .................... .................... ................... ....................
.................... ................... ....................... ................ ........................... ................. .................... ................. .................... .................... .................... ................... .................... .................... .................... .................... ................... ....................
.................... ................... ....................... ................ ........................... ................. .................... ................. .................... .................... .................... ................... .................... .................... .................... .................... ................... ....................
.................... ................... ....................... ................ ........................... ................. .................... ................. .................... .................... .................... ................... .................... .................... .................... .................... ................... ....................
.................... ................... ....................... ................ ........................... ................. .................... ................. .................... .................... .................... ................... .................... .................... .................... .................... ................... ....................
.................... ................... ....................... ................ ........................... ................. .................... ................. .................... .................... .................... ................... .................... .................... .................... .................... ................... ....................
.................... ................... ....................... ................ ........................... ................. .................... ................. .................... .................... .................... ................... .................... .................... .................... .................... ................... ....................
.................... ................... ....................... ................ ........................... ................. .................... ................. .................... .................... .................... ................... .................... .................... .................... .................... ................... .................... .................... ................... .................... .................... .................... .................... ................... .................... 0199999 TOTAL EXPERIENCE ON INDIVIDUAL POLICIES .................... ................... .................... .................... .................... .................... ................... .................... .................... ................... ....................... ................ ........................... ................. .................... ................. .................... .................... .................... ................... .................... .................... .................... .................... ................... .................... .................... ................... ....................... ................ ........................... ................. .................... ................. .................... .................... .................... ................... .................... .................... .................... .................... ................... .................... .................... ................... ....................... ................ ........................... ................. .................... ................. .................... .................... .................... ................... .................... .................... .................... .................... ................... .................... .................... ................... ....................... ................ ........................... ................. .................... ................. .................... .................... .................... ................... .................... .................... .................... .................... ................... .................... .................... ................... ....................... ................ ........................... ................. .................... ................. .................... .................... .................... ................... .................... .................... .................... .................... ................... .................... .................... ................... ....................... ................ ........................... ................. .................... ................. .................... .................... .................... ................... .................... .................... .................... .................... ................... .................... .................... ................... ....................... ................ ........................... ................. .................... ................. .................... .................... .................... ................... .................... .................... .................... .................... ................... .................... .................... ................... ....................... ................ ........................... ................. .................... ................. .................... .................... .................... ................... .................... .................... .................... .................... ................... .................... .................... ................... ....................... ................ ........................... ................. .................... ................. .................... .................... .................... ................... .................... .................... .................... .................... ................... .................... .................... ................... ....................... ................ ........................... ................. .................... ................. .................... .................... .................... ................... .................... .................... .................... .................... ................... .................... .................... ................... ....................... ................ ........................... ................. .................... ................. .................... .................... .................... ................... .................... .................... .................... .................... ................... .................... .................... ................... ....................... ................ ........................... ................. .................... ................. .................... .................... .................... ................... .................... .................... .................... .................... ................... .................... .................... ................... ....................... ................ ........................... ................. .................... ................. .................... .................... .................... ................... .................... .................... .................... .................... ................... .................... .................... ................... ....................... ................ ........................... ................. .................... ................. .................... .................... .................... ................... .................... .................... .................... .................... ................... .................... .................... ................... .................... .................... .................... .................... ................... .................... 0299999 TOTAL EXPERIENCE ON GROUP POLICIES
GENERAL INTERROGATORIES
1. If response in Column 1 is no, give full and complete details ......................................................................................................................................................................................................................................................................................................................................................................................
2. Claims address and contact person provided to the Secretary of Health and Human Services as required by 42 U.S.C. 1395ss(c) (3) (E) for this state
2.1 Address: ...............................................................................................................................................................................................................................................................................................................................................................................................................................................................
2.2 Contact Person and Phone Number: ..................................................................................................................................................................................................................................................................................................................................................................................................................
3. Billing address and contact person for user fees established under 41 U.S.C. 1395u(h) (3) (B).
3.1 Address: ...............................................................................................................................................................................................................................................................................................................................................................................................................................................................
3.2 Contact Person and Phone Number: ..................................................................................................................................................................................................................................................................................................................................................................................................................
4. Explain any policies identified above as policy type “O” .............................................................................................................................................................................................................................................................................................................................................................................................
© 2017 National Association of Insurance Commissioners 209