Embed Size (px)
Citation preview

© 2016 IEEE. Personal use of this material is permitted. Permission from IEEE must be obtained for all other uses, in any current or future media, including reprinting/republishing this material for advertising or promotional purposes, creating new collective works, for resale or redistribution to servers or lists, or reuse of any copyrighted component of this work in other works.

Benchmarking of Real-Time LTE Network in
Dynamic Environment
Ramprasad Subramanian, Dr. Kumbesan Sandrasegaran, Dr. Xiaoying Kong
Centre for Real Time Information Networks
School of Computing and Communication
Faculty of Engineering and Information Technology University of Technology Sydney
Sydney, Australia
Abstract— LTE/LTE-A is high speed wireless communication
technology which got evolved from 2G/3G. LTE provides very
high throughput in uplink and downlink and hence it is
attracting more and more subscribers every day. This paper
analyzes the performance of real time LTE network of two
different LTE service providers through drive test. Test cases
were performed under dynamic environment where the test user
is dynamic or the environment around the test user is dynamic
(travelling in train or car). The performance comparison of
different Key Performance Indicators (KPI) such as Reference
Signal Received Power (RSRP), Reference Signal Received
Quality (RSRQ), Reference Signal Strength Indicator (RSSI) and
throughput (uplink - UL and downlink - DL) are made between
the two LTE service providers. The performance tests were
performed using Nemo tool in a real-time LTE network. Average
values were obtained for different KPIs to study the performance
of the LTE network.
Keywords—LTE; RSRP; RSRQ; RSSI; throughput;
benchmark; real-time; Nemo; drive test.
I. INTRODUCTION
LTE is the successor technology of third generation
telecommunication standard which is popularly called as 3G.
LTE provides the peak download speed of 100Mbps in
downlink and 50Mbps in the upload. Release 10 of LTE is
supports IMT Advanced, which provide 300 Mbps in the
download but still falls short of IMT - Advanced standards
which is 1 Gbps in the peak download and 500 Mbps in the
uplink. Air interface in LTE network utilizes two types of
duplexing namely LTE- FDD (Frequency division duplex) and
LTE-TDD (Time division duplex) to achieve high data rates
associated with the 4G technology. At this point LTE-FDD is
widely used technology. The reason credited to this being,
LTE-FDD provides greater compatibility with the existing and
prospective spectrum assignments. But, the implementation of
TDD is gradually picking up. The physical channels in LTE
can be classified as physical downlink shared channel
(PDSCH) that transports user data and modulated using
QPSK, 16-QAM or 64-QAM. The physical broadcast channel
(PBCH) sends cells specific system identification and control
parameters using QPSK every 40 millisecond. The Physical
Downlink Control Channel (PDCCH) provides the resources
to the UE and the reference signal (RS) is used for channel
estimation. In the uplink, the Physical Uplink Control Channel
(PUCCH) handles the control information and responses of
the UE. The physical uplink shared channel (PUSCH) is
similar to PDSCH. However, it handles the uplink using
QPSK, 16-QAM or 64-QAM. This capacity of the LTE/LTE-
A attracts new subscribers and as a result of this operators are
expanding the network at a rapid rate to increase the capacity
and coverage to many areas that are still uncovered. LTE is
based on the SC-FDMA in uplink and OFDMA in the
downlink. Hence, an attempt has been made to benchmark the
network coverage of this technology between two leading
LTE/LTE-A service providers. Hereafter we call the service
providers as Operator-A and Operator-B.
Benchmarking testing is an act of performing same tests
between the service providers in order to assess the relative
performance of the service providers. In these tests, the
network performance of Operator A and B are compared. Both
the service providers have an ambitious network roll out plan
for future. Operator A for instance, planning to shut down the
2G network operations by 2016 and they are planning to
allocate the spectrum used by 2G to LTE. They have also
extended the 700 MHz LTE trials in two major cities. Apart
from this, to boost the data speed Operator A has introduced
carrier aggregation using three bands to deliver data rate up to
450 Mbps. Furthermore, Operator-A is using nationwide fibre
service to reach out to various communities across the country
to expand the LTE/LTE-A coverage.
On the other hand, Operator-B is aiming to cover 98.5% of
the population with the LTE by end of 2016 where the initial
the service was started by Operator-B in the year 2013.
Subsequent to the launch, the network was rolled out across
various metropolitans in the country. The roll out was planned
in such a way that new mobile sites were installed and some
sites were upgraded to have combined 4G technologies of
LTE-TDD (2300MHz) and LTE-FDD (1800 MHz). Operator
B also has plans to utilize 700 MHz and 2600 MHz for 4G.
The purpose of this paper is to analyse the real time LTE
network under dynamic condition by explaining the key power
measurements reported by LTE enabled cell phone. The effect
of mobility on a LTE user is studied by monitoring KPIs such
as UL/DL through, RSSI, RSRP, and RSRQ. The results of
two real-time networks are compared.
The rest of the paper is organized as follows: Section II
provides important definition about KPIs monitoring in this

paper; Section II explains the benchmarking testing
methodology; Section IV presents the test results, and Section
V gives the conclusion of this testing.
II. SIGNAL POWER MEASUREMENT INDICATORS IN LTE
NETWORK
The KPIs such as RSRP, RSRQ and RSSI provides information regarding quality of the wireless channel in LTE network. These measurements are conducted over Resource Elements (RE) that contains Reference Symbols (RS). The fourth and sixth REs contain RS, and RSs are transmitted in the first and fourth OFDM symbol of each RB. Each OFDM consists of REs in fourth and sixth [1]. RSRP is a cell specific metric denoting received signal strength that is used by LTE enabled User Equipments (UE) for cell re-selection and handover. The definitions of KPIs are given below.
RSSI can be defined as the total power received in a single RE in a RB [2][3]. RE which is a smallest data unit in LTE standard represents 15 KHz in frequency domain and 1 OFDM symbol in time domain. Each RB constitutes 12 RE which corresponds to (12*15)180 KHz in frequency domain and 0.5 msec in time domain. It includes all the power from neighbor, serving cells and noise. Its units are defined in dBm. RSRP can be defined as power measured in a single RE. It is represented as the power of single RE which contains reference signal. RSRP does not include noise or interference from serving or neighboring cells. Its units are given as dBm. The value of RSRP is given as Energy Per Resource Element (EPRE) in every eNB. The unit of EPRE is defined as dBm/15 KHz, which is defined as power per 15 KHz or per RE. RSRQ can be defined as the quality of power received in RE that contains RS. It is an important KPI to assess the quality of the received signal. It is defined as follows;
(1)
As seen in Equation 1, RSRQ is calculated using RSRP and RSSI. This is used as the reference signal by the LTE network to make hand-off decision. N is the number of RBs and its value changes depending on the scheduling to the specific user. CQI is in the uplink direction transmitted by UE to the network. The UE transmits the channel quality as the feedback to the eNB. The CQI report by UE to the eNB is a vital information used by eNB to make critical decisions regarding scheduling. The better the wireless channel, the higher will be the CQI from a UE. This is used to decide on modulation formats, packet types, pre-coding matrix types which affects the throughput delivered to a particular user [4][5].
III. TEST METHODOLOGY
Benchmarking is a relative performance evaluation between
various service providers. The main objective of the testing is
to assess the performance of the various parameters of the
LTE network with similar test cases and tools. The objective
of our testing is:
To analyse the 4G network measurement in different
scenarios.
To compare the network performance between Operator
A and Operator B in a select locations in a huge
metropolitan city.
LTE capable UE is used in real LTE network for all the test cases. The entire test cases where performed in 10 MHz LTE network. The tests were carried out in sub-urban environment. Testing consist of different scenarios such as walk test in urban city center, drive testing in car, while travelling in train and inside the international airport. The LTE UE is connected to laptop and logs were collected using Nemo software. The speed of the test UE was not controlled. The testing was designed in such a way that UE should travel without control so that testing could be performed closed to the real world scenario as much as possible. Nemo test tool - The testing is carried out by using Nemo
hand held drive test tool. Nemo supports various technologies
like GSM, CDMA, EVDO, WCDMA, HSPA, HSPA+, LTE
and Wi-Fi. It also supports measuring and monitoring
QoS/QoE of various applications. The script to monitoring and
recording various QoS parameters for voice call, HTTP
accessing can be modified as per the test case design. The
interface options used in the testing:
Carrier RSSI - values range from -140 to -10
Serving SNR - Displays the SNR (signal to noise ratio)
for the serving channel in db.
Serving RSRQ - Displays the reference signal received
quality for the serving channel in db. Range -30 to 0.
Serving RSRP - Displays the reference signal received
power for the serving channel in dBm. Range -140 to 0.
As previously stated, Nemo Handy also allows the user to
monitor and record measurements in different situations by
creating scripts. Scripts can automate various features that
include: Voice call, Text message, video streaming, HTTP
accessing, etc. The files created from the Nemo handy are
analysed using the Nemo outdoor analysis tool that can
support over 280 terminals.
Test scenarios - In order to verify the LTE network
performance, two service providers were selected: Operator A
and Operator B. The below tests were performed as close as
possible over the same routes and areas to provide an accurate
comparison between Operator A and Operator B performance. In the real-time testing, our scenarios were considered for
testing:
Walking test: Data was collected by walking around city
center.
Train test: Data was collected whilst travelling in a train.
Driving test: Data was collected by driving in a car.
Indoor test: In order to test the performance inside the
International Airport.
In our testing, the same script was used to test the various
transmissions in different LTE environment.
The script includes:
FTP transfer
HTML Browsing
Send SMS

IV. BENCHMARK TESTING AND RESULTS
A. Experiment 1 – Walk test: This test was conducted while walking around the city
center in the heart city. The below Table1 and Table 2 provide KPI measurements of RSRP, RSRQ, RSSI and uplink/ downlink (with minimum, maximum and average) of both Operator A and Operator B respectively.
TABLE 1. OPERATOR A KPI MEASUREMENT – WALK TEST
Measurement
parameter
Min value Max value Average
RSRP (dBm) -109.3 -68.1 73.34
RSRQ (dBm) -22.6 -1.4 -6.7
RSSI -82.90 -37.36 -58.6
Throughput
in DL (bits/s)
0 320000
Throughput
in UL (bits/s)
0 1064000
TABLE.2. OPERATOR B KPI MEASUREMENT – WALK TEST
Measurement
parameter
Min value Max
value
Average
RSRP (dBm) -117.8 -64.2 -91.0
RSRQ (dBm) -23.3 -0.1 -12.2
RSSI -90.2 -33.6 -70.2
Throughput
in DL (bits/s)
0 280000
Throughput
in UL (bits/s)
0 1032000
Performance of Operator A around city center is better than Operator B in terms of quality and received signal strength. The RSSI indicates effective signal to noise ratio, the average RSSI for Operator B is high compared to Operator A which indicates that quality of received signal in Operator A is better than Operator B. On the other hand, high RSRQ for Operator B indicates frequent hand-off while walking in around the city center. During the test it was observed that Operator A is using two ports (port 0 and port 1) in antenna to support MIMO in eNB. The benefit of using MIMO was evident in the KPIs. Figure 1 and Figure 2 indicates the walk test for Operator A and Operator B. Table 1 and Table 2 indicate the KPI measurement for the test.
Fig.1. Operator A - Walk test
Fig.2. Operator B - Walk test
B. Experiment 2 – Train test:
This test conducted while travelling in the train from
Station A to Station B. In the figures, it shows that for most of
the time, the serving RSRP and RSRQ of Operator A
maintains high level of network quality and coverage.
However, the serving signal power reduces to -115 from -90
dBm inside a tunnel near to the station. On the other hand, the
network coverage for Operator B varies between -74.4 dBm to
-131.6 dBm. The variation in RSRQ is higher than Operator A
which resulted in more handoff.
TABLE 3. OPERATOR A KPI MEASUREMENT – TRAIN TEST
Measurement
parameter
Min value Max
value
Average
RSRP (dBm) -109.1 -65.2 -95.4
RSRQ (dBm) -14.3 -0.3 -6.3
RSSI -82.4 -41.1 -59.8
Throughput
in DL (bits/s)
0 280000
Throughput
in UL (bits/s)
0 142857
TABLE.4. OPERATOR B KPI MEASUREMENT – TRAIN TEST
Measurement
parameter
Min value Max
value
Average
RSRP (dBm) -131.6 -74.4 -96.5
RSRQ (dBm) -25.2 -4.7 -14.9

RSSI -94.3 -43.4 -70.2
Throughput
in DL (bits/s)
0 280000
Throughput
in UL (bits/s)
0 1032000
Fig.3. Operator A - Train test
Fig.4. Operator B - Train test
Figure 3 and Figure 4 indicates the train test for Operator A and Operator B. Table 3 and Table 4 indicate the KPI measurement for the test.
C. Experiment 3 – Drive test in a car inside the city:
This test was done while driving with a car inside the city.
The red patches in the Figure 5 for Operator A indicate that
serving power was unstable and choppy in certain locations.
But on the whole throughout this test the quality was high to
maintain high performance in terms of throughout. For
Operator B, the received signal strength was better than
Operator A and the quality of the link was similar to Operator
A. But RSRP for Operator A is better than Operator B which
indicates that Operator-A have less noise in the signal than
Operator B from neighbouring cells. The same is reflected in
RSRQ as well. This indicates that to boost the quality of the
received signal appropriate cell planning is the right strategy
than increasing the number of eNBs.
TABLE.5. OPERATOR-B KPI MEASUREMENT – DRIVE TEST CAR
Measurement
parameter
Min value Max
value
Average
RSRP (dBm) -110.9 -75.1 -82.0
RSRQ (dBm) -13.8 -0.3 -6.5
RSSI -94.4 -30.4 -69.3
Throughput
in DL (bits/s)
0 248000
Throughput
in UL (bits/s)
0 299200
TABLE.6. OPERATOR-B KPI MEASUREMENT –DRIVE TEST CAR
Measurement
parameter
Min value Max
value
Average
RSRP (dBm) -131.6 -74.4 -96.5
RSRQ (dBm) -25.2 -4.7 -14.9
RSSI -94.3 -43.4 -70.2
Throughput
in DL (bits/s)
0 280000
Throughput
in UL (bits/s)
0 1032000
Fig.5. Operator A - Drive test in car
Fig.6. Operator B - Drive test in car
Figure 5 and Figure 6 indicates the train test for Operator A
and Operator B. Table 1 and Table 2 indicate the KPI
measurement for the test.
D. Experiement 4 – Inside the Internation airport
This test conducted inside the international airport. The user remained stationary during the test. Since, it is an airport there was constant movement of people and trolleys around the
test user. Apart from this airport is a closed environment with metal and glass structures which may affect the quality of the received signal. The impact of structures and reflections are evident in Table 7 for Operator A. The average RSSI is high compared to RSRP which indicates that noise level in the signal high due to reflections and absorptions. Similar behavior is observed in Operator B (Table 8). Hence, appropriate planning is required to negate the impacts of reflections and absorptions emanating due to the building structures.
TABLE.7. OPERATOR-B KPI MEASUREMENT –DRIVE TEST CAR
Measurement
parameter
Min value Max
value
Average
RSRP (dBm) -100 -112 -105.6
RSRQ (dBm) -5.4 16.3 -7.9
RSSI -71.6 -93.9 -85.3
Throughput
in DL (bits/s)
0 248000
Throughput
in UL (bits/s)
0 112000
TABLE.8. OPERATOR-B KPI MEASUREMENT –DRIVE TEST CAR
Measurement
parameter
Min value Max
value
Average
RSRP (dBm) -122.4 -111.2 116.4
RSRQ (dBm) -28.2 -7.1 -17.65
RSSI -94.7 -80.9 -86.2
Throughput
in DL (bits/s)
0 232000
Throughput
in UL (bits/s)
0 218000
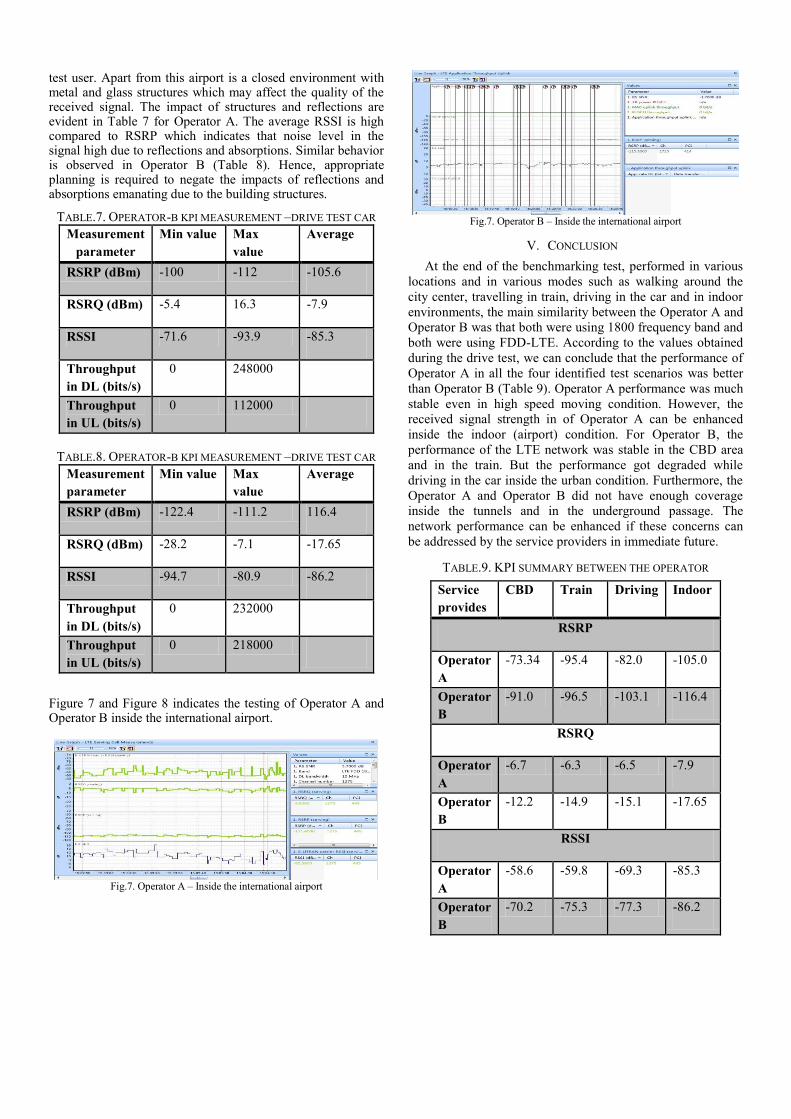
Figure 7 and Figure 8 indicates the testing of Operator A and Operator B inside the international airport.
Fig.7. Operator A – Inside the international airport
Fig.7. Operator B – Inside the international airport
V. CONCLUSION
At the end of the benchmarking test, performed in various
locations and in various modes such as walking around the
city center, travelling in train, driving in the car and in indoor
environments, the main similarity between the Operator A and
Operator B was that both were using 1800 frequency band and
both were using FDD-LTE. According to the values obtained
during the drive test, we can conclude that the performance of
Operator A in all the four identified test scenarios was better
than Operator B (Table 9). Operator A performance was much
stable even in high speed moving condition. However, the
received signal strength in of Operator A can be enhanced
inside the indoor (airport) condition. For Operator B, the
performance of the LTE network was stable in the CBD area
and in the train. But the performance got degraded while
driving in the car inside the urban condition. Furthermore, the
Operator A and Operator B did not have enough coverage
inside the tunnels and in the underground passage. The
network performance can be enhanced if these concerns can
be addressed by the service providers in immediate future.
TABLE.9. KPI SUMMARY BETWEEN THE OPERATOR
Service
provides
CBD Train Driving Indoor
RSRP
Operator
A
-73.34 -95.4 -82.0 -105.0
Operator
B
-91.0 -96.5 -103.1 -116.4
RSRQ
Operator
A
-6.7 -6.3 -6.5 -7.9
Operator
B
-12.2 -14.9 -15.1 -17.65
RSSI
Operator
A
-58.6 -59.8 -69.3 -85.3
Operator
B
-70.2 -75.3 -77.3 -86.2

REFERENCE
[1] 3GPP TS 36.211, Evolved Universal Terrestrial Radio Access (EUTRA); Physical Channels and Modulations.
[2] 3GPP TS 36.214, Evolved Universal Terrestrial Radio Access (EUTRA); Physical layer – Measurements.
[3] 3GPP TS 25.215, Physical layer Measurements (FDD).
[4] 3GPP TS 36.133, Evolved Universal Terrestrial Radio Access (EUTRA): Requirements for support of radio resource management.
[5] 3GPP TS 36.331, Evolved Universal Terrestrial Radio Access (EUTRA); Radio Resource Control (RRC); Protocol specification.


![1 Downlink and Uplink Cell Association with …arXiv:1601.05281v1 [cs.IT] 20 Jan 2016 1 Downlink and Uplink Cell Association with Traditional Macrocells and Millimeter Wave Small Cells](https://img.pdfslide.us/doc/110x75/5e95bd0c0c147f2995470045/1-downlink-and-uplink-cell-association-with-arxiv160105281v1-csit-20-jan-2016.jpg)


![10 gsm bss network kpi (uplink downlink balance) optimization manual[1].doc](https://img.pdfslide.us/doc/110x75/558ec7491a28ab66628b474b/10-gsm-bss-network-kpi-uplink-downlink-balance-optimization-manual1doc-558f343a2e921.jpg)


![10 GSM BSS Network KPI (Uplink-Downlink Balance) Optimization Manual[1].Doc](https://img.pdfslide.us/doc/110x75/545a3905af795998788b5b03/10-gsm-bss-network-kpi-uplink-downlink-balance-optimization-manual1doc.jpg)