Embed Size (px)
Citation preview

1
A GLOBAL LEADER IN METAL FLOW ENGINEERING
29 July 2016
François Wanecq
Chief Executive
2016 Half Year Results

2
Disclaimer
This presentation, which has been prepared by Vesuvius plc (the “Company”), includes statements that are, or may be deemed to be, "forward looking statements“,
which can be identified by the use of forward looking terminology, including the terms "believes", "estimates", "plans", "projects", "anticipates", "expects", "intends",
"may", "will", or "should" or, in each case, their negative or other variations or comparable terminology. These forward looking statements include matters that are not
historical facts and include statements regarding the Company’s intentions, beliefs or current expectations. By their nature, forward looking statements involve risk and
uncertainty because they relate to future events and circumstances. A number of factors could cause actual results and developments to differ materially from those
expressed or implied by any forward looking statements. Any forward looking statements in this presentation reflect the Company’s view with respect to future events
as at the date of this presentation and are subject to risks relating to future events and other risks, uncertainties and assumptions relating to the Company’s operations,
results of operations, growth strategy and liquidity. The Company undertakes no obligation publicly to release the results of any revisions or updates to any forward
looking statements in this presentation that may occur due to any change in its expectations or to reflect events or circumstances after the date of this presentation.
Certain industry and market data contained in this presentation has come from third-party sources. While the Company believes each of these sources to be accurate,
there is no guarantee as to the accuracy or completeness of such data, and the Company has not independently verified the data contained therein. In addition,
certain of the industry and market data contained in this presentation comes from the Company’s own internal research, knowledge and experience of the market.
While the Company believes that such research and estimates are reasonable and reliable, they, and their underlying methodology and assumptions, have not been
verified by any independent source for accuracy or completeness and are subject to change without notice. Accordingly, undue reliance should not be placed on any
of the industry or market data contained in this presentation
This presentation is only addressed to and directed at persons in member states of the European Economic Area (“EEA”) who are qualified investors within the
meaning of Article 2(1)(e) of the Prospectus Directive (Directive 2003/71/EC), as amended (“Qualified Investors”). In the UK, this presentation is addressed and
directed only at Qualified Investors who are persons who have professional experience in matters relating to investments falling within Article 19(5) of the Financial
Services and Markets Act 2000 (Financial Promotion) Order 2005, as amended (the “Order”), and persons who are high net worth entities falling within Article 49(2)(a)
to (d) of the Order, or are persons to whom it may otherwise be lawful to communicate it to (all such persons being referred to as “Relevant Persons”). This
presentation must not be acted on or relied on (i) in the UK by persons who are not Relevant Persons and (ii) in any member state of the EEA other than the UK, by
persons who are not Qualified Investors. Any investment or investment activity to which this presentation relates is available only to Relevant Persons in the UK and
Qualified Investors in any member state of the EEA other than the UK and will be engaged in only with such persons.
This presentation and the information contained herein are not an offer of securities and are not for publication or distribution in the US or to persons in the US (within
the meaning of Regulation S under the US Securities Act of 1933, as amended (the “Securities Act”)), or any other jurisdiction where such distribution or offer is
unlawful, except to QIBs as defined in Rule 144A.
This presentation includes extracts from the Announcement of Interim results for the six months ended 30 Jun 2016. You should read the whole of that announcement.
No reliance should be placed for any purposes whatsoever on the information contained in this document or on its completeness. None of the Company, its advisers,
or any other party is under any duty to update or inform you of any changes to the information contained in this presentation other than in compliance with ongoing
regulatory obligations.

3
• 2016 Half Year Group results – François Wanecq
• Financial Review – Guy Young
• Strategy and Outlook – François Wanecq
Agenda

4
• Revenue, profit and return on sales in line with expectations
• Improvement in revenue and profit compared to H2 2015
• Continued outperformance in India, a key strategic growth area
• Restructuring programme delivered £7.1m cost savings in H1 2016
Total annual programme benefits increased to £25m by the end of 2017 at
a cost of £35m
• Strong cash performance, with cash conversion of 111%
• Strong balance sheet, with long-term bank facilities in place to 2020
• Maintained the interim dividend at 5.15p per share
Summary

5
71.6
57.7 59.1
0.0
10.0
20.0
30.0
40.0
50.0
60.0
70.0
80.0
H1 2015 H2 2015 H1 2016
Trading Profit
-17.4%
+2.5%
H1 2016 Underlying(1) trading performance
%£m £m
723.0
658.7 668.3
0.0
100.0
200.0
300.0
400.0
500.0
600.0
700.0
800.0
H1 2015 H2 2015 H1 2016
Revenue
-7.6%
+1.5%
9.9%
8.7% 8.8%
0.0%
2.0%
4.0%
6.0%
8.0%
10.0%
12.0%
H1 2015 H2 2015 H1 2016
Return on Sales
-110 bps
+10 bps
(1) Underlying basis is at constant currency
and excludes separately reported items and the impact of acquisitions
7.0%
7.5%
8.0%
8.5%
9.0%
9.5%
10.0%
10.5%
260.0
280.0
300.0
320.0
340.0
360.0
Q1 2015 Q2 2015 Q3 2015 Q4 2015 Q1 2016 Q2 2016
Quarterly Group sales (£m) and margins %
Total Revenue Trading Margin %
6
The world steel markets declined year-on-year….
• World steel production down 1.6%
China (50.4% of global production) down 0.6%
Rest of world down 2.6%
• Brazil down 13.0%
• 44 out of 65 WSA countries reported a drop
6 of the top 10 producers reported drops
The top 10 producers represent 85% of global production
• India 3rd largest producer in the world behind China and Japan, keeps growing, confirming our strategy at CMD
(1) Size of bubble refers to relative amount of steel produced
China -0.6%
Ukraine +10.3%
Germany -1.2%Russia -1.3%
India +2.7%
USA +0.2%
Japan, -1.1%
South Korea -3.4%
Brazil -13.0%
Turkey +3.2%
-15.0%
-10.0%
-5.0%
0.0%
5.0%
10.0%
15.0%
Pro
du
ctio
n g
row
th (
H1
20
16
vs
H1
20
15
)
Steel volume produced
Rate of Growth in Steel Production Top 10 Steel Producers

7
…however progressed vs H2 2015 signalling they may have bottomed
• World steel production up 2.0%
China (50.4% of global production) up 2.1%
Rest of world up 1.9%
• Brazil still down 8.0%
• 36 out of 65 WSA countries reported an increase
6 of top 10 producers reported an increase
The top 10 producers represent 85% of global production
• India keeps growing
(1) Size of bubble refers to relative amount of steel produced
China +2.1%Ukraine +6.0% Germany +6.6%
Russia -0.2%
India +5.0%
USA +3.1%
Japan -0.9%South Korea -5.1%
Brazil -8.0%
Turkey +6.2%
-15.0%
-10.0%
-5.0%
0.0%
5.0%
10.0%
15.0%
Pro
du
ctio
n g
row
th (
H1
20
16
vs
H2
20
15
)
Steel volume produced
Rate of Growth in Steel ProductionTop 10 Steel Producers

8
ChinaSales +5.3%Steel -0.6%
UkraineSales +19.5%Steel +10.3%
GermanySales -6.7%Steel -1.2%
RussiaSales -9.0%Steel -1.3%
IndiaSales +8.5%Steel +2.7%
USASales -18.5%Steel +0.2%
JapanSales +1.6%Steel -1.1%
South Korea Sales +1.2%Steel -3.4%
BrazilSales -1.3%
Steel -13.0%
TurkeySales -8.7%Steel +3.2%
-20.0%
-15.0%
-10.0%
-5.0%
0.0%
5.0%
10.0%
15.0%
-25.0% -20.0% -15.0% -10.0% -5.0% 0.0% 5.0% 10.0% 15.0% 20.0% 25.0%
Pro
du
ctio
n g
row
th (
H1
16 v
s H
1 15
)
Sales growth (H1 2016 vs 2015)
Rate of Growth in Steel Production & Revenues H1 16 vs H1 15Top 10 Steel Producers
Revenue performance exceeded the market in key emerging markets
year-on-year…
(1) Size of bubble refers to relative size of Steel Division H1 Revenue in each country
(2) India includes Kazakhstan
Future
growth
drivers
9
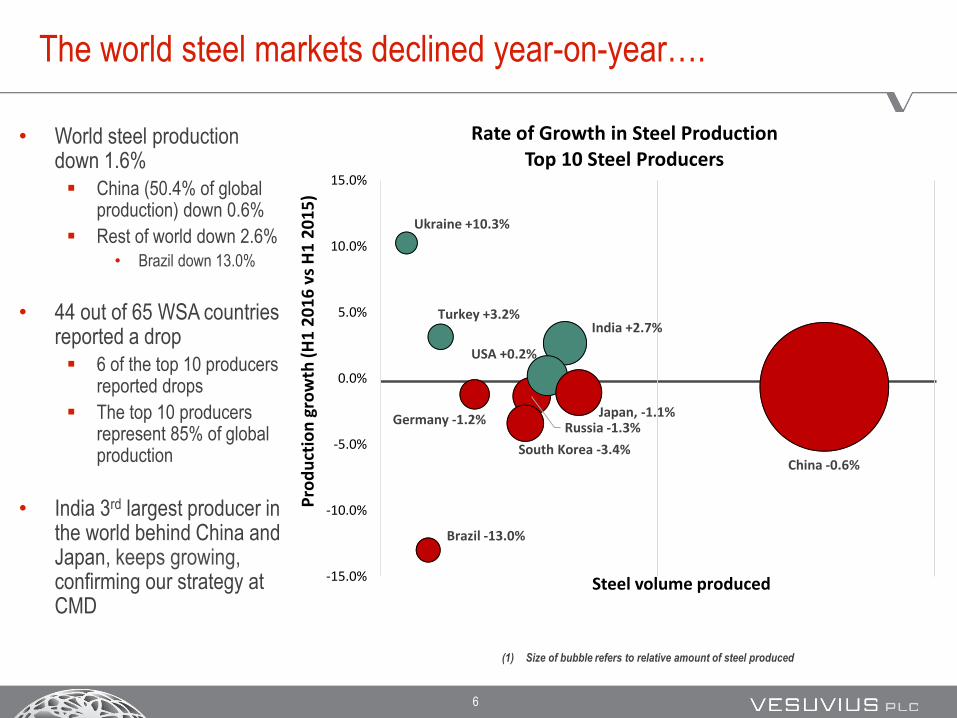
Steel division revenue
0
25
50
75
100
125
Americas EMEA Asia-Pacific
H1 2015 H2 2015 H1 2016
-3.1%
-13.6%
-1.0%
-8.8%+2.3%
-3.0%
Revenue* by region
Americas:
• Reduction in the USA due to the closure of plants where we had high
penetration
• Progression in Brazil and Mexico despite the reduction of crude steel
production
EMEA:
• Steel production down by 6.8% in EU 28
• Customer closures where we have high penetration
• Revenue up 2.3% vs H2 2015
Asia-Pacific:
• Sales in China supported by continuing shift from long to flat steel
• Lower sales in South Korea (-3.4%), Taiwan (-7.4%) and SE Asia
• Strong sales in India (+10.5%), outperforming underlying steel production
Steel Flow Control
0
25
50
75
100
125
Americas EMEA Asia-Pacific
H1 2015 H2 2015 H1 2016
-15.1%-9.9%
-2.6%-0.1%
+4.8%
-7.5%
Revenue* by region
Advanced Refractories
Americas:
• Lower activity in North America, driven by voluntary exit from some low
margin segments
• Lower brick sales in the US due to trading tariffs imposed
• Stabilization vs H2 2015
EMEA:
• Lower revenues due to decline in steel production in the region
• Revenue up 4.8% vs H2 2015
Asia-Pacific:
• Slowdown in IP market and ongoing pressure from Chinese imports
• Strong sales in India with 16.1% growth vs H1 2015
• Revenue down 7.5% vs H2 2015 due to low steel markets in SE Asia
£m £m
*On an underlying basis: at constant currency and excluding the impact of acquisitions and disposals

10
40
60
80
100
120
140
20
07
/H1
20
07
/H2
20
08
/H1
20
08
/H2
20
09
/H1
20
09
/H2
20
10
/H1
20
10
/H2
20
11
/H1
20
11
/H2
20
12
/H1
20
12
/H2
20
13
/H1
20
13
/H2
20
14
/H1
20
14
/H2
20
15
/H1
20
15
/H2
20
16
/H1
Mature steel markets: Vesuvius sales vs steel production
Source: WSA for steel production volumes, Vesuvius internal data for Vesuvius sales at constant currency. Note 2007 figures are rebased to 100.
Vesuvius
Sales
Value
Steel
Production
VolumesSal
es a
nd
Ste
el P
rod
uct
ion
Reb
ased
to 1
00
Sal
es a
nd
Ste
el P
rod
uct
ion
Reb
ased
to 1
00
H1 2016 vs H1 2015: -13.3%
H1 2016 vs H1 2015: -0.2% H1 2016 vs H12015: -3.5%
• Our sales in NAFTA and EMEA declined more than underlying market due to: Reduction in inventories
Retrenchment onto lower qualities when demand is low
Slowdown in high-end market and pipe market
However trend reversed in Q2 2016
40
60
80
100
120
140
160
180
20
07
/H1
20
07
/H2
20
08
/H1
20
08
/H2
20
09
/H1
20
09
/H2
20
10
/H1
20
10
/H2
20
11
/H1
20
11
/H2
20
12
/H1
20
12
/H2
20
13
/H1
20
13
/H2
20
14
/H1
20
14
/H2
20
15
/H1
20
15
/H2
20
16
/H1
H1 2016 vs H2 2015: -4.2%
H1 2016 vs H2 2015: +2.6%
H1 2016 vs H1 2015: -12.6%
H1 2016 vs H2 2015: +1.0%
H1 2016 vs H2 2015: +4.8%
80
90
100
110
Q115
Q215
Q315
Q415
Q116
Q216
80
90
100
110
Q115
Q215
Q315
Q415
Q116
Q216

11
40
90
140
190
240
290
340
H107
H207
H108
H208
H109
H209
H110
H210
H111
H211
H112
H212
H113
H213
H114
H214
H115
H215
H116
40
60
80
100
120
140
160
180
H107
H207
H108
H208
H109
H209
H110
H210
H111
H211
H112
H212
H113
H213
H114
H214
H115
H215
H116
Emerging steel markets
Source: WSA for steel production volumes, Vesuvius internal data for Vesuvius sales at constant currency.
Vesuvius
Sales
Value
Steel
Production
VolumesSal
es a
nd
Ste
el P
rod
uct
ion
Reb
ased
to 1
00
Sal
es a
nd
Ste
el P
rod
uct
ion
Reb
ased
to 1
00
40
60
80
100
120
140
160
180
H107
H207
H108
H208
H109
H209
H110
H210
H111
H211
H112
H212
H113
H213
H114
H214
H115
H215
H116
40
140
240
340
440
540
640
740
840
940
H107
H207
H108
H208
H109
H209
H110
H210
H111
H211
H112
H212
H113
H213
H114
H214
H115
H215
H116

12
Steel division margins
Underlying margin
• Underlying trading profit down 24.8%
reflecting:
Lower activity in key regions of NAFTA
and EMEA, together accounting for 75%
of revenue
Margins lowered by our materials
purchased in US Dollar and inventory
reduction action and a high level of bad
debt provision
9.2%
8.4%
7.5%
5.0%
5.5%
6.0%
6.5%
7.0%
7.5%
8.0%
8.5%
9.0%
9.5%
H1 2015 H2 2015 H1 2016
£m H1 2016 H1 2015 ChangeUnderlying
changeH2 2015 Change
Underlying
change
Total
Revenue443.1 476.3 -7.0% -9.6% 421.3 5.2% -0.7%
Total Trading
Profit33.2 44.5 -25.3% -24.8% 35.0 -5.2% -10.9%
Trading
Margin %7.5% 9.3% -180ps -160bps 8.3% -80bps -90bps
5.0%
6.0%
7.0%
8.0%
9.0%
10.0%
11.0%
180.0
190.0
200.0
210.0
220.0
230.0
240.0
250.0
Q1 2015 Q2 2015 Q3 2015 Q4 2015 Q1 2016 Q2 2016
Quarterly sales (£m) and margins %
Total Revenue Trading Margin %

13
Foundry market
Light vehicle production Truck production
Source : LMC Automotive Source : LMC Automotive
• Truck and Light Vehicle markets represent approximately 40% of Foundry product line sales
• Growth in light vehicle output counteracted by low demand in mining, construction and agriculture
• Steel foundries in US moving to China
-
2,000,000
4,000,000
6,000,000
8,000,000
10,000,000
12,000,000
14,000,000
NAFTA Europe
H1 2016 vs H1 2015 +3.7%
H1 2016 vs H1 2015 +3.6%
-
50,000
100,000
150,000
200,000
250,000
300,000
350,000
NAFTA Europe
H1 2016 vs H1 2015 -11.1%
H1 2016 vs H1 2015 +6.3%

14
Foundry revenue recovery vs H2 2015 but still lower than H1
2015
0
20
40
60
80
100
120
Americas EMEA Asia-Pacific
H1 2015 H2 2015 H1 2016Revenue* by region
£m
*On an underlying basis: at constant currency and excluding the impact of acquisitions
-8.2%
-2.4%
-0.8%
Americas:
• Weak demand in heavy truck, agriculture, construction and mining foundries,
partially offset by strong demand in light vehicle production
• Difficult market in South America due to political instability and the economic
contraction in Brazil
• Revenue up 2.4% vs H2 2015
EMEA:
• Increases in light vehicle and heavy truck production in the region were offset
by reductions in mining, construction, railroad and wind mill castings
• Western Europe impacted by reduced activity levels, except light vehicles,
partially offset by good growth in Central Europe
• Revenue up 10.7% vs H2 2015
Asia-Pacific:
• Revenue in China fell due to reduced mining activity
• Solid performance seen in India, up 14% vs H1 2015
• Revenue up 1.7% vs H2 2015
+2.4%
+10.7%
+1.7%
15
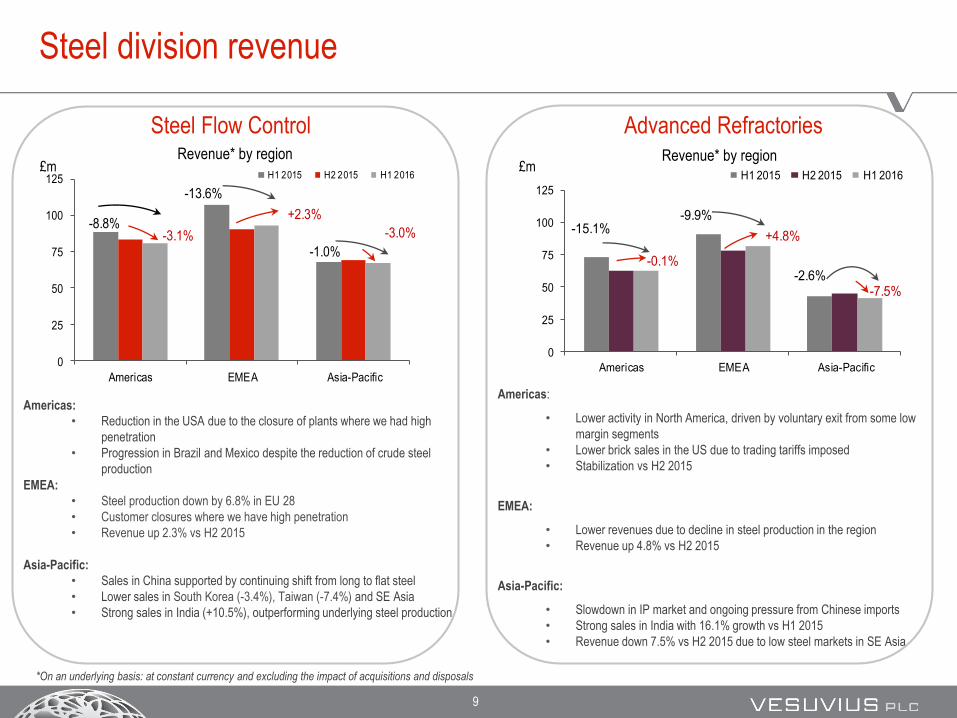
Foundry division margins
• Despite the global foundry
market remaining mixed:
• Underlying margin
improvement of 190bps vs
H2 2015 recovering the
good progress already
recorded in H1 2015
11.4%
9.6%
11.5%
0.0%
2.0%
4.0%
6.0%
8.0%
10.0%
12.0%
14.0%
H1 2015 H2 2015 H1 2016
Underlying margin£m H1 2016 H1 2015 Change
Underlying
changeH2 2015 Change
Underlying
change
Total
Revenue225.2 226.3 -0.5% -3.1% 198.1 13.7% 5.9%
Total Trading
Profit25.9 25.9 0.0% -2.6% 18.6 39.5% 27.0%
Trading
Margin %11.5% 11.5% 0bps +10bps 9.4% +210bps +190bps
8.0%
9.0%
10.0%
11.0%
12.0%
13.0%
90.0
95.0
100.0
105.0
110.0
115.0
120.0
Q12015
Q22015
Q32015
Q42015
Q12016
Q22016
Quarterly sales (£m) and margins %
Total Revenue Trading Margin %

16
A GLOBAL LEADER IN METAL FLOW ENGINEERING
Financial Review
Guy Young
Chief Financial Officer
17
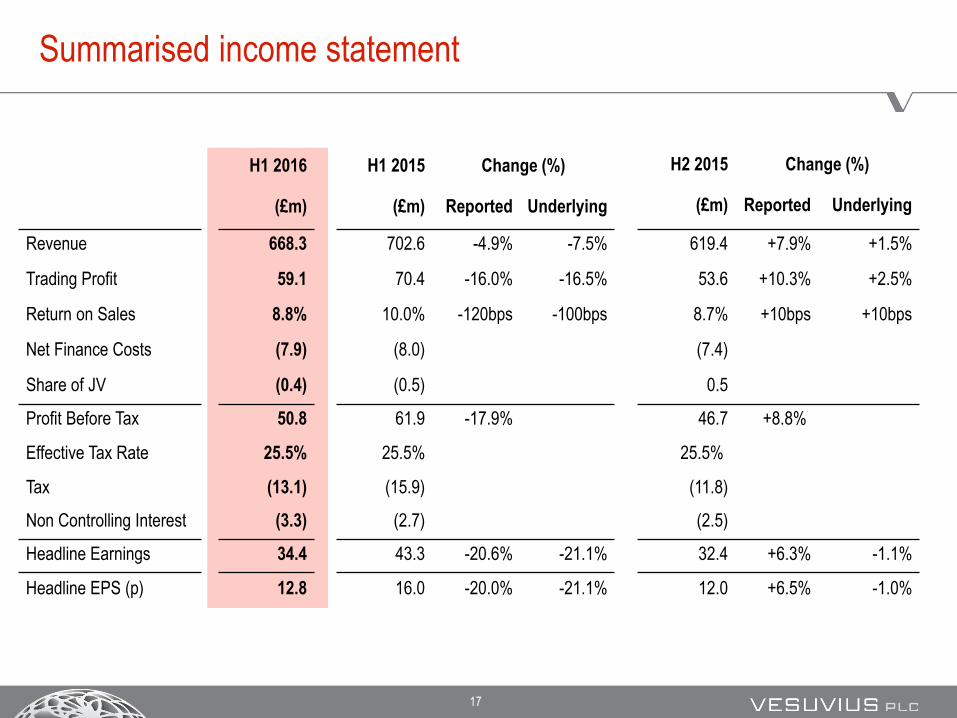
Summarised income statement
H1 2016 H1 2015 Change (%) H2 2015 Change (%)
(£m) Reported Underlying(£m) (£m) Reported Underlying
Revenue 668.3 702.6 -4.9% -7.5% 619.4 +7.9% +1.5%
Trading Profit 59.1 70.4 -16.0% -16.5% 53.6 +10.3% +2.5%
Return on Sales 8.8% 10.0% -120bps -100bps 8.7% +10bps +10bps
Net Finance Costs (7.9) (8.0) (7.4)
Share of JV (0.4) (0.5) 0.5
Profit Before Tax 50.8 61.9 -17.9% 46.7 +8.8%
Effective Tax Rate 25.5% 25.5% 25.5%
Tax (13.1) (15.9) (11.8)
Non Controlling Interest (3.3) (2.7) (2.5)
Headline Earnings 34.4 43.3 -20.6% -21.1% 32.4 +6.3% -1.1%
Headline EPS (p) 12.8 16.0 -20.0% -21.1% 12.0 +6.5% -1.0%

18
H1 to H1 shows revenue impact with partial cost mitigation
70.471.6
59.1
0.7
20.6
2.2
1.2
7.1
3.9
40.0
45.0
50.0
55.0
60.0
65.0
70.0
75.0
80.0
£mTrading Profit
702.6
717.2
668.3
47.8
5.9
14.64.8
600.0
620.0
640.0
660.0
680.0
700.0
720.0
740.0
£mRevenue

19
H2 to H1 shows the latest trend in market dynamics
53.6
57.7
59.11.8
4.1
2.21.2
40.0
45.0
50.0
55.0
60.0
65.0
£mTrading Profit
619.4
658.7
668.3
5.0
39.3
14.6
600.0
620.0
640.0
660.0
680.0
£mRevenue

20
Steel revenue decline slowing;
Foundry benefiting from some growth
35.0
37.2
33.22.2
2.2
2.2
0.4
25.0
30.0
35.0
40.0
45.0
H2 15Reported
FX Constantcurrency
Revenuedrop
through
Bad debtprov
Other H1 16Reported
Trading Profit - Steel
421.3
446.1443.15.0
24.8
2.0
400.0
420.0
440.0
460.0
H2 15Reported
FX Constantcurrency
Market &Closures
Gains H1 16Reported
Revenue – Steel
198.1
212.6
225.2
14.50.2
12.4
150.0
170.0
190.0
210.0
230.0
250.0
H2 15Reported
FX Constantcurrency
Market Seasonal &Gains
H1 16Reported
Revenue - Foundry
18.620.4
25.91.8
4.4 0.40.7
0.0
10.0
20.0
30.0
40.0
H2 15Reported
FX Constantcurrency
Revenuedrop
through
Bad debtprov
Other H1 16Reported
Trading Profit - Foundry

21
The cash conversion rate at 111% is up on last year
• Year to date cash conversion of 111%
is better than prior year 84%
• Working capital requirements lower
Trade working capital outflow is £8.0m
driven primarily by increased trade debtors
(Europe, China and India)
Partially offset by other working capital
£3.1m inflow
• Capex lower than depreciation, as
expected.
• Timing of some capex cash outflow
has been later than expected but will
be caught up in H2
59.1
65.8
8.4
18.20.7
20.0
10.9
3.1
0.0
10.0
20.0
30.0
40.0
50.0
60.0
70.0
80.0
90.0
100.0
Tra
ding
Pro
fit
Dep
reci
atio
n
Net
cap
ex
Tra
de d
ebto
rs
Tra
de c
redi
tors
Inve
ntor
y
Oth
er w
orki
ng c
apita
l
Ope
ratin
g C
ash
Flo
w
£m Operating cash flow
Trade working capital
22
65.8
43.7
33.3
5.8
16.3
0.9 10.20.2
0.9
0
10
20
30
40
50
60
70
80
Op.
Cas
h F
low
Inte
rest
Inco
me
Tax
es
Div
iden
ds R
ec'd
Div
iden
ds to
NC
Is
FC
F b
efor
e re
stru
ctur
e
Res
truc
turin
g
Oth
er
Fre
e C
ash
Flo
w
£m Free cash flow
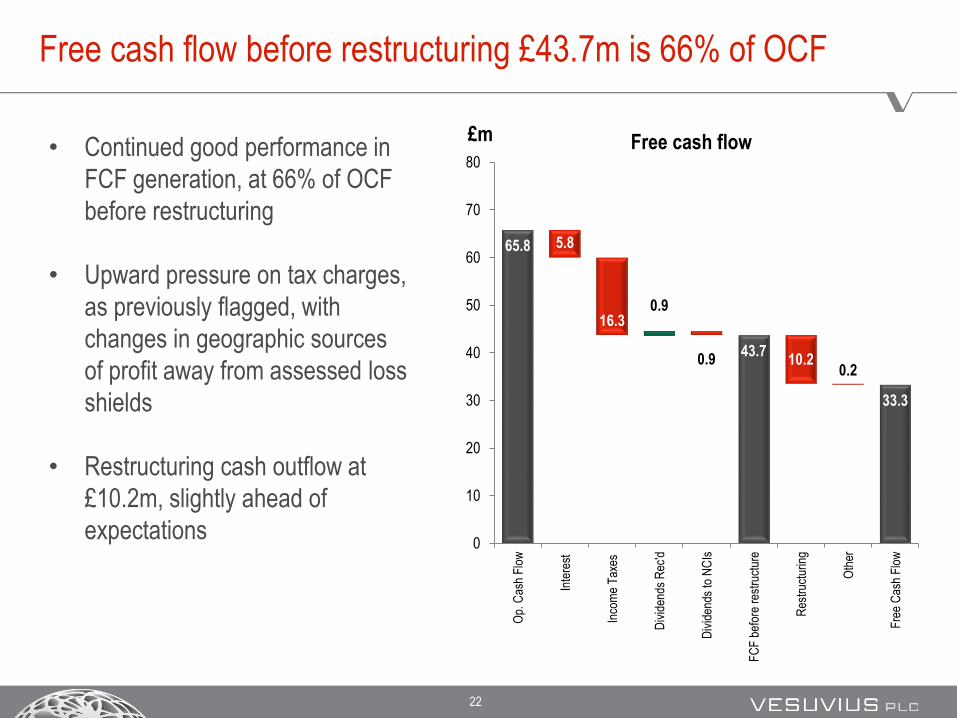
Free cash flow before restructuring £43.7m is 66% of OCF
• Continued good performance in
FCF generation, at 66% of OCF
before restructuring
• Upward pressure on tax charges,
as previously flagged, with
changes in geographic sources
of profit away from assessed loss
shields
• Restructuring cash outflow at
£10.2m, slightly ahead of
expectations
23
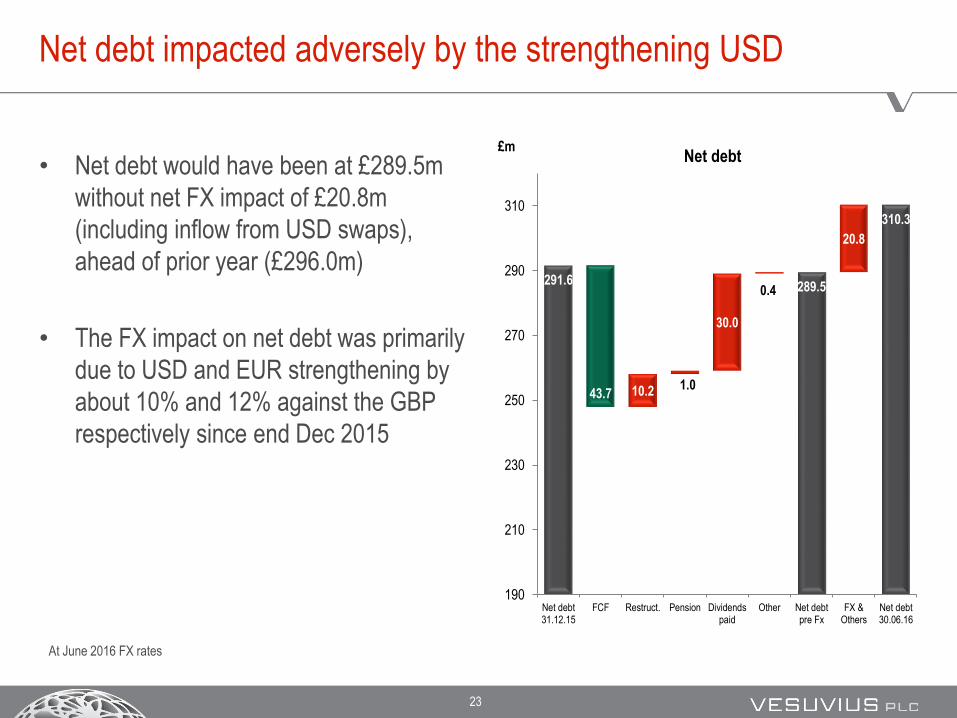
Net debt impacted adversely by the strengthening USD
291.6289.5
310.3
43.7 10.2 1.0
30.0
0.4
20.8
190
210
230
250
270
290
310
Net debt31.12.15
FCF Restruct. Pension Dividendspaid
Other Net debtpre Fx
FX &Others
Net debt30.06.16
£mNet debt• Net debt would have been at £289.5m
without net FX impact of £20.8m
(including inflow from USD swaps),
ahead of prior year (£296.0m)
• The FX impact on net debt was primarily
due to USD and EUR strengthening by
about 10% and 12% against the GBP
respectively since end Dec 2015
At June 2016 FX rates
24
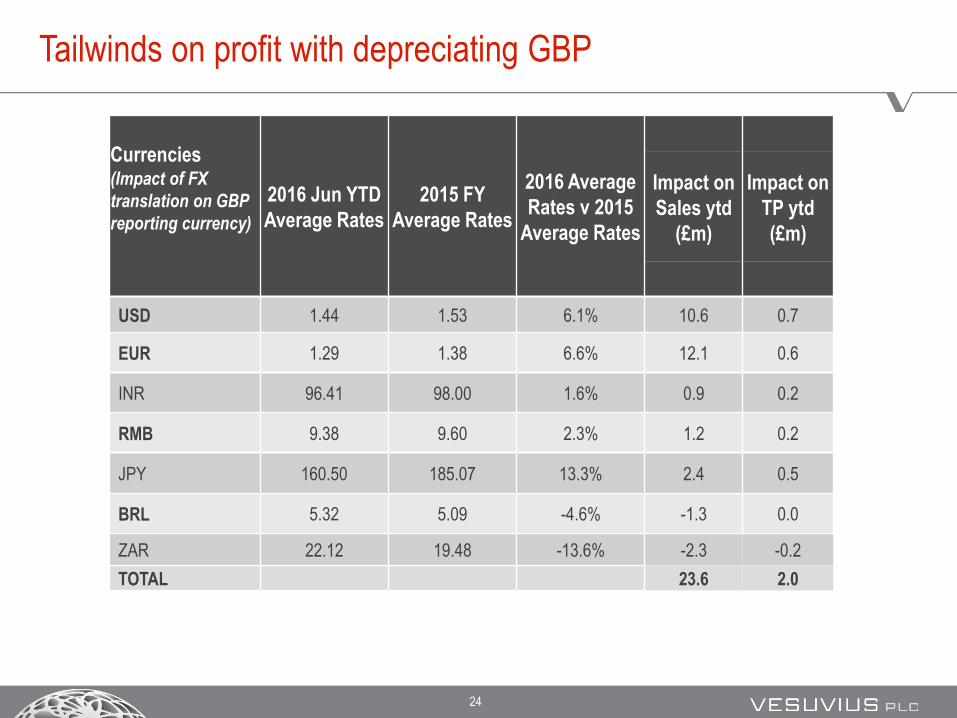
Tailwinds on profit with depreciating GBP
Currencies(Impact of FX
translation on GBP
reporting currency)
2016 Jun YTD
Average Rates
2015 FY
Average Rates
2016 Average
Rates v 2015
Average Rates
Impact on
Sales ytd
(£m)
Impact on
TP ytd
(£m)
USD 1.44 1.53 6.1% 10.6 0.7
EUR 1.29 1.38 6.6% 12.1 0.6
INR 96.41 98.00 1.6% 0.9 0.2
RMB 9.38 9.60 2.3% 1.2 0.2
JPY 160.50 185.07 13.3% 2.4 0.5
BRL 5.32 5.09 -4.6% -1.3 0.0
ZAR 22.12 19.48 -13.6% -2.3 -0.2
TOTAL 23.6 2.0

25
Geographic diversification counters currency risk
Balance sheet risk
• Europe and NAFTA account for ~60%
of Group profits
• Group debt split across GBP, USD and
Euro to match
• Pension fund de-risking strategy to
continue
P&L risk
• Low GBP exposure as UK forecast to
approx 4% of Group sales

26
Finance objectives and short term focus
• Ongoing cost reduction
Operational leverage
• Working capital management
Risk managed reductions
• Cash conversion >100%
Capex spend control
• Reduce net debt
• Shareholder returns

27
A GLOBAL LEADER IN METAL FLOW ENGINEERING
Strategy and Outlook
François Wanecq
Chief Executive

28
Delivering on the strategy
• Maintain technology leadership
• Increase penetration of value creating solutions
• Capture growth in developing markets
• Improve cost leadership
• Build technical services offering
Creation of a new R&D centre for Advanced Refractories in
India;
Launching new products: Framed filters, Ladle tube changer
Growing ahead of underlying steel market in China India
and Brazil in H1 2016;
Confirming our India growth strategy
Foundry margin improvement;
Enhanced restructuring programme;
£7.1m additional savings in H1 2016
Integration of Sidermes, acquired in 2015;
Conception of an integrated platform to give
interpretation of data and instruction to process
management
Successful start of the SST line at Hyundai;
Growing sales of MTS in Aluminum foundries

29
R&D progression
0.0%
2.0%
4.0%
6.0%
8.0%
10.0%
12.0%
14.0%
16.0%
18.0%
20.0%
2011 2012 2013 2014 2015 2016 H1FC FDY AR Total
New Product Sales as % of Total Sales

30
• Acquisitions bring us greater technological inroads and market intimacy in data capture
Temperature and gas content with ECIL Met Tec and Sidermes
Laser technology with Process Metrix
Sidermes integration is underway
Increased penetration of EcilMetTec in USA an Mexico
Successful inroads of XLEV and SERT in China and South Korea
Technical Services: Deliveries and potential

31
• Promoting new solutions in data capture
Roll-out Accuoptix
Roll-out X Mat now available on all continents
Radar T2 launched commercially
• Exploring synergies across our businesses
Smart stopper
Flux feeders
Laser guided robotic gunning
• Continue to pursue further acquisitions
Technical Services: Deliveries and potential

32
Objective: One platform for unlimited solutions
Vesuvius Platform
End users:
Control room, mgr.office,
Corporate office
Local Network (Factory Network)
Or cloud based (Internet)
Laser Scanner
Slag Detection
Mold Level
XMAT: Steel speed measure
Internet Remote Management with
Bank Grade Security
Break out preventer

33
• Steel
Flow Control Europe efficiency and manufacturing optimisation
Announced closures of Ostrawa plant and Lugano office
Discussions started about proposed restructuring of our Ostend plant
South American steel optimisation
• Foundry
Additional NAFTA plant optimisation
• Group wide
Raw materials efficiencies
Standardisation of business processes
Continue reduction in central and admin functions
• Ongoing progress with an incremental £7.1m cost savings delivered in H1
2016, on top of £8.8m delivered in 2015
• Total annual programme benefits increased to £25m by end of 2017 at a
cost of £35m
Restructuring remains our central focus

34
• Revenue, profit and return on sales in line with expectations
• Global steel and foundry markets showing signs of stabilisation; albeit mixed and at weak
levels
• Improvement in revenue and margins compared to H2 2015
• Restructuring programme delivered £7.1m cost savings in H1 2016 vs 2015 cost base
• Total annual restructuring programme benefits increased to £25m by the end of 2017 at a
total cost of £35m
• Improved debtor provision coverage of £3.7m
• Strong cash performance, with cash conversion of 111%
• Maintained interim dividend of 5.15 pence per share to be paid on 23 September 2016
H1 2016 Trading summary

35
• Underlying trading environment to remain similar to the first half of 2016
Growth in steel production not expected before 2017
• Steel and foundry end markets showing signs of stabilisation, although expect to remain at relatively weak levels for the remainder of the year
• Continued focus on medium-term strategy:
Building Technical Services business
Continued growth in India, China and Brazil as outlined at Capital Markets Day
• Restructuring programme to gather pace
Annualised benefits of £25 million delivered by end of 2017
• Maintain focus on cash, balance sheet strength and returns to shareholders
Outlook

36
A GLOBAL LEADER IN METAL FLOW ENGINEERING
Q&A

37
A GLOBAL LEADER IN METAL FLOW ENGINEERING
Appendix
38
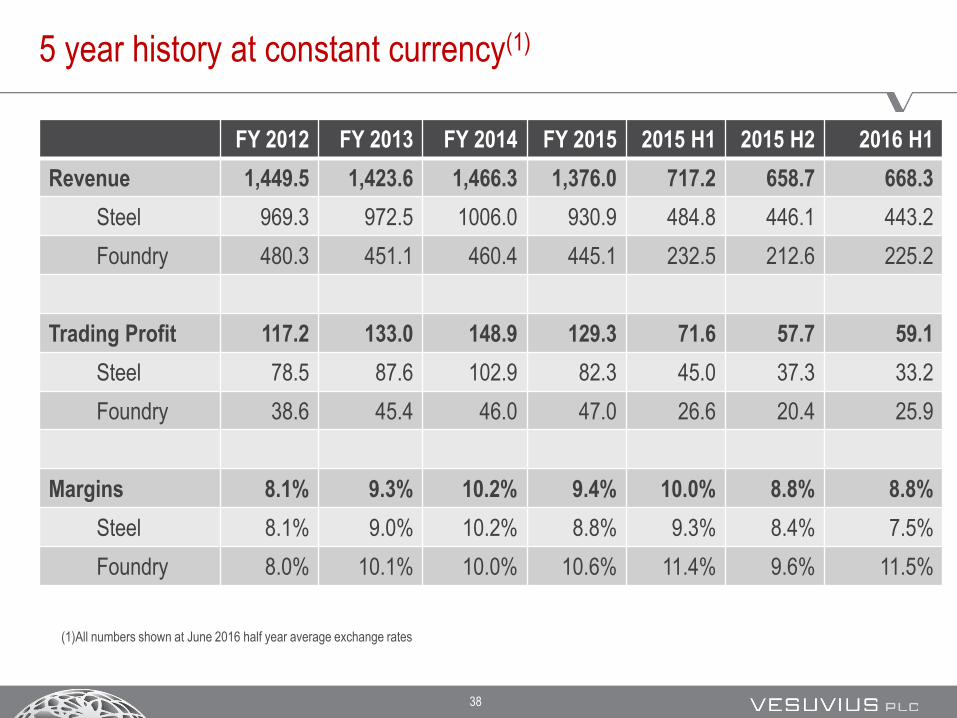
FY 2012 FY 2013 FY 2014 FY 2015 2015 H1 2015 H2 2016 H1
Revenue 1,449.5 1,423.6 1,466.3 1,376.0 717.2 658.7 668.3
Steel 969.3 972.5 1006.0 930.9 484.8 446.1 443.2
Foundry 480.3 451.1 460.4 445.1 232.5 212.6 225.2
Trading Profit 117.2 133.0 148.9 129.3 71.6 57.7 59.1
Steel 78.5 87.6 102.9 82.3 45.0 37.3 33.2
Foundry 38.6 45.4 46.0 47.0 26.6 20.4 25.9
Margins 8.1% 9.3% 10.2% 9.4% 10.0% 8.8% 8.8%
Steel 8.1% 9.0% 10.2% 8.8% 9.3% 8.4% 7.5%
Foundry 8.0% 10.1% 10.0% 10.6% 11.4% 9.6% 11.5%
5 year history at constant currency(1)
(1)All numbers shown at June 2016 half year average exchange rates
39
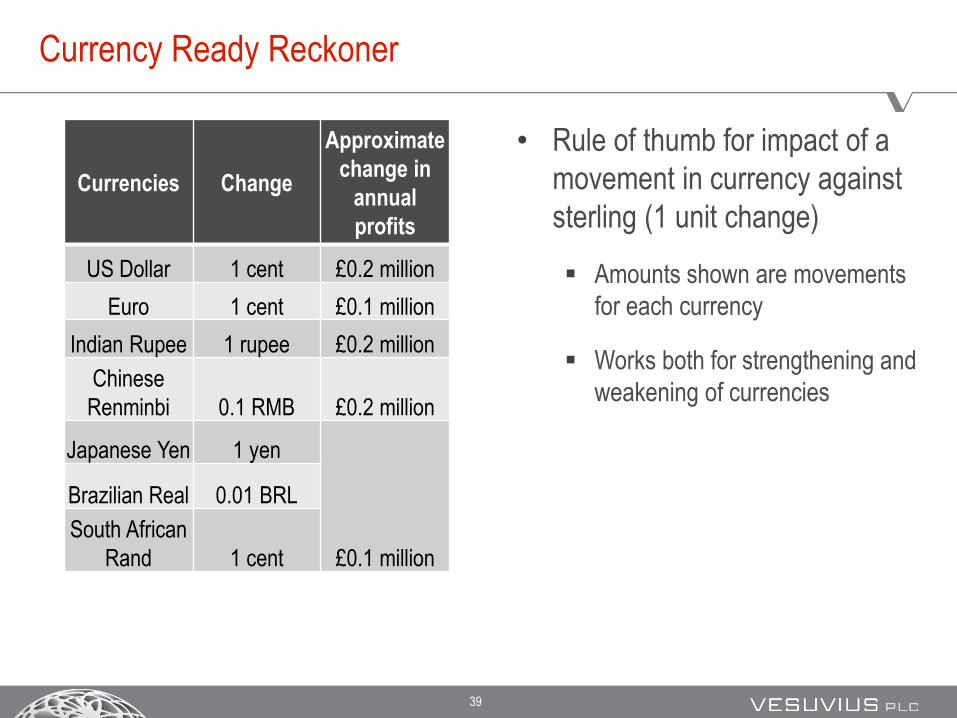
Currency Ready Reckoner
• Rule of thumb for impact of a
movement in currency against
sterling (1 unit change)
Amounts shown are movements
for each currency
Works both for strengthening and
weakening of currencies
Currencies Change
Approximate
change in
annual
profits
US Dollar 1 cent £0.2 million
Euro 1 cent £0.1 million
Indian Rupee 1 rupee £0.2 million
Chinese
Renminbi 0.1 RMB £0.2 million
Japanese Yen 1 yen
£0.1 million
Brazilian Real 0.01 BRL
South African
Rand 1 cent

40
Market leading positions across many of our products
Molten metal in steel industry Molten metal in foundries
A world leader in flow control systems (slide gates)
A world leader in isostatically pressed refractories
A world leader in flow control pre-cast solutions
A world leader in mould & tundish fluxes
A world leader in filters
A world leader in feeding systems
A world leader in coatings
Hamilton
Steel Flow Control Competitors Foundry Technologies Competitors

41
Steel Foundry
Steel Flow Control Technical
Services
Advanced Refractories Foundry Technologies
Revenue (% of group) £492m (37%) 26 (2%) £379m (29%) £424m (32%)
Overview Provides products, systems
and services to regulate and
protect the flow of steel in
the continuous casting
process
Provides products,
systems and services
to collect and interprete
data in the molten
metal flow process
Provides installation expertise
and materials that withstand
extreme temperatures and offer
corrosion resistance at our
customers’ facilities
Improves casting quality and
foundry process efficiency
through the supply of products
and applications engineering to
the global foundry industry
Products Probes Lasers
End Markets Steel (100%) Steel (80%)
Foundry (20%)
Iron & Steel (75%)
Cement, HPI (25%)
Vehicles (40%) Glass (5%)
Other (55%)
Employees 4,204 616 2,345 2,880
Vesuvius is focused on the Steel and Foundry markets
4
1
Sold under the Vesuvius brand
Filters Feeding
SystemsNozzlesTube
Changers
Sold under the Foseco brand
Lining Precasts

42
Main products and markets – Steel business segment
• World leader in the supply of consumable Steel Flow Control
products used in the enclosed continuous casting process and a
leading supplier of Advanced Refractories used as high temperature
linings
Steel business segment overview Steel business segment revenue by operating location
Vesuvius products
Advanced Refractories in blue text
Flow Control in red text
• Vesuvius is the only truly global player in Flow Control
• Asia Pacific major volume growth potential
• Europe and NAFTA as laboratories for innovation
Well balanced presence in all major areas
Source Vesuvius breakdown of 2016 Reported Revenues
Americas35%
EMEA40%
Asia Pacific33%
A global leader for steel flow control consumable ceramics

43
Potential for growth
Source: WSA for steel and World Bank for population
0.00
0.10
0.20
0.30
0.40
0.50
0.60
0.70
SouthKorea
China Russia Turkey EU 28 USA Brazil Mexico India
H1 2016 Steel production per capitaT / Capita
• Three heavily populated countries
constitute considerable potential
for growth
• All have low steel production
tonnes per capita vs peers,
indicating expected growth in
infrastructure and construction
development
India
Brazil
Mexico

44
Steel exports from China are now falling as barriers to trade increase

45
-10%
-5%
0%
5%
10%
15%
20%
0
100,000
200,000
300,000
400,000
500,000
600,000
700,000
800,000
900,000
1996 1999 2002 2005 2008 2011 2014
China – Steel production vs GDP growth
Steel Production GDP Growth
Steel production per capita in China 585kg
From 1996 to 2014 (18 years) steel production was multiplied 8x
Steel production per capita in Japan 831kg
From 1956 to 1974 (18 years) steel production was multiplied 10x
-5%
0%
5%
10%
15%
20%
0
20,000
40,000
60,000
80,000
100,000
120,000
140,000
1956 1959 1962 1965 1968 1971 1974
Japan – Steel production vs GDP growth
Steel Production GDP Growth %
End of high GDP
growth periodEnd of high GDP
growth period
China Steel Production: Has the limit been reached? Parallel with Japan

46
• Steel production per
capita in Japan 831kg
• After the peak in 1973
steel production
declined a little and
recovered to about 88%
of peak over 40 years
-10%
-5%
0%
5%
10%
15%
20%
0
20,000
40,000
60,000
80,000
100,000
120,000
140,000
1960 1965 1970 1975 1980 1985 1990 1995 2000 2005 2010 2015
Japan – Steel production vs GDP growth
Steel Production GDP Growth %
What is the steel profile of a maturing economy: The case of Japan
47
-10%
-5%
0%
5%
10%
15%
20%
0
20,000
40,000
60,000
80,000
100,000
120,000
140,000
160,000
180,000
200,000
19
80
19
81
19
82
19
83
19
84
19
85
19
86
19
87
19
88
19
89
19
90
19
91
19
92
19
93
19
94
19
95
19
96
19
97
19
98
19
99
20
00
20
01
20
02
20
03
20
04
20
05
20
06
20
07
20
08
20
09
20
10
20
11
20
12
20
13
20
14
20
15
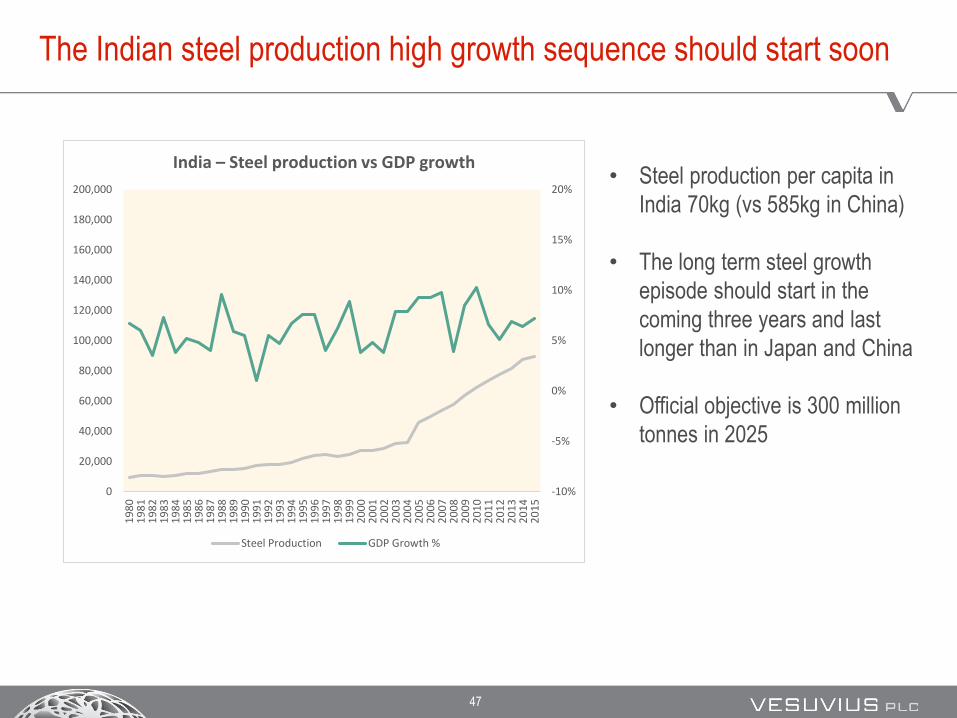
India – Steel production vs GDP growth
Steel Production GDP Growth %
• Steel production per capita in
India 70kg (vs 585kg in China)
• The long term steel growth
episode should start in the
coming three years and last
longer than in Japan and China
• Official objective is 300 million
tonnes in 2025
The Indian steel production high growth sequence should start soon

48
World Steel Production: Where is India in the growth cycle?
-25%
-20%
-15%
-10%
-5%
0%
5%
10%
15%
20%
25%
0
200000
400000
600000
800000
1000000
1200000
1400000
1600000
18000001
98
0
19
81
19
82
19
83
19
84
19
85
19
86
19
87
19
88
19
89
19
90
19
91
19
92
19
93
19
94
19
95
19
96
19
97
19
98
19
99
20
00
20
01
20
02
20
03
20
04
20
05
20
06
20
07
20
08
20
09
20
10
20
11
20
12
20
13
20
14
20
15
RoW India China RoW YoY Growth
• By directly comparing Chinese and Indian tonnages, India currently could be seen as being in the
same situation as China in 1994; and still progress to 124mT in 2020 and 273mT in 2025
49
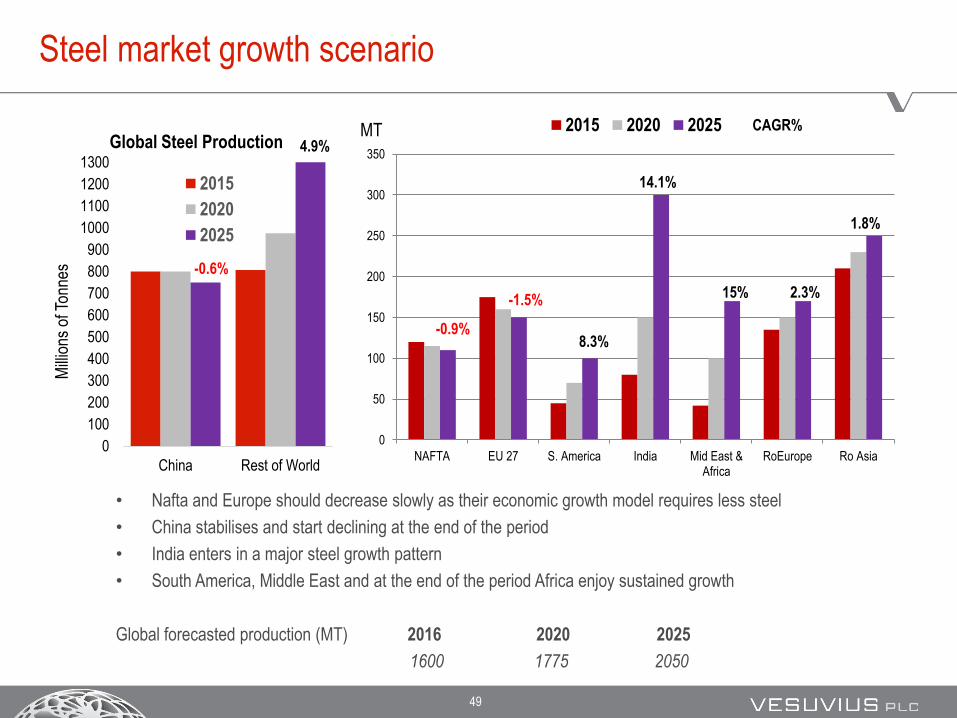
Steel market growth scenario
• Nafta and Europe should decrease slowly as their economic growth model requires less steel
• China stabilises and start declining at the end of the period
• India enters in a major steel growth pattern
• South America, Middle East and at the end of the period Africa enjoy sustained growth
Global forecasted production (MT) 2016 2020 2025
1600 1775 2050
0
50
100
150
200
250
300
350
NAFTA EU 27 S. America India Mid East &Africa
RoEurope Ro Asia
2015 2020 2025
0
100
200
300
400
500
600
700
800
900
1000
1100
1200
1300
China Rest of World
Mill
ions
of T
onne
s
Global Steel Production
2015
2020
2025
-0.9%
-1.5%
8.3%
4.9%
15% 2.3%
1.8%
CAGR%
-0.6%
14.1%
MT

50
Source Based on data from WSA & SBB, with Vesuvius assumptions used for China
0%
10%
20%
30%
40%
50%
60%
70%
80%
NAFTA EU28 South America Middle East China Africa
Pro
po
rtio
n o
f F
lat
Ste
el P
rod
uct
s (%
)
Proportion of Flat Steel by Region
Growth opportunities – Steel
Typical consumption of Flow Control products in flat steel is £1.5/ T of steel vs £0.5/ T of steel in long
Vesuvius serves mainly the flat products market which will grow at a higher pace than global steel as developing markets evolve towards consumption driven economies

51
2016 2015
Total CISA 144 147
Long 59 62
Flat 80 79
Long 41% 42%
Flat 56% 54%
China’s move towards flat steel is confirmed
• Proportion of flat steel produced increased by 150bps YoY for Chinese Steel Association
members (representing ~60% most advanced of total Chinese steel production)
• However CISA is the customer segment we address, already producing 56% of flat steel
• Growth potential of segment (due to the conversion of the Chinese economy) less than
previously expected

52
0
200
400
600
NAFTA EU 27 S. America China India Mid E & Af RoEurope Ro Asia
Conversion to flat steel is a growth opportunity
2015
0
200
400
600
NAFTA EU 27 S. America China India Mid E & Af RoEurope Ro Asia
2020
0
200
400
600
NAFTA EU 27 S. America China India Mid E & Af RoEurope Ro Asia
2025
0
200
400
600
800
1000
1200
2015 2020 2025
Flat LongmT
mT
mT
mT
• Progression of flat steel vs long steel
could generate growth in our accessible
market of 30% in 2020 and 55% in 2025
• In the same period global steel
production is expected to grow by only
10% and 28% respectively

53
Steel vs Aluminium: Growth of high-strength steel continues
along the previous trend
Source: WSA for steel production volumes, Vesuvius internal data for Vesuvius sales at constant currency.
0%
5%
10%
15%
20%
25%
30%
35%
40%
45%
2008 2009 2010 2011 2012 2013 2014 2015
Sh
are
of
Ker
b W
eig
ht
Material share as percent of vehicle kerb weight
Flat rolled mild, bake hardening & High Strength Steel
Aluminium
Flat Rolled Advance High Strength Steel
In vehicle production, conventional
steel is replaced by high-resistance
steels as well as by Aluminium
• High resistance steels require more
sophisticated technologies to be
produced (high Ni or Mn content)
and tighter control on the process
• Today the most advanced steel
makers suffer very low productivity
on such qualities

54
Steel vs Aluminum: Long term forecast give the major share to
high strength steels for light vehicles
81%
18%
1%2012
71%
23%
6%
2015
52%
31%
17%
2020
33%
41%
26%
2025
Mild and HSLA
AHSS/UHSS
Aluminium
Source: Ducker Worldwide

55
Main products and markets – Foundry business segment
Foundry casting process
• World leader in the supply of consumable products and technical
services used in the production of metal castings which themselves
have a wide variety of uses in engineered products
Note Red text denotes Vesuvius products
Ultimate end markets for castings
Foundry business segment revenue by operating location
Light Vehicles27%
Construction, Agriculture & Mining 18%
Medium & Heavy
Vehicles 12%
Other 10%
Valves & Pumps 7%
Power Generation 7%
Railroad 4%Pipes &
Fittings 2%
Source Management estimates
Source Vesuvius breakdown of 2016 Reported Revenues
Americas20%
EMEA47%
Asia-Pacific34%
A global leader in consumables for mould & methoding
General
engineering
13%

56
5000
10000
15000
20000
25000
30000
200000
250000
300000
350000
400000
450000
2002 2003 2004 2005 2006 2007 2008 2009 2010 2011 2012 2013 2014 2015
6,000
7,000
8,000
9,000
10,000
11,000
12,000
13,000
14,000
15,000
16,000
60,000
70,000
80,000
90,000
100,000
110,000
120,000
130,000
140,000
150,000
2002 2003 2004 2005 2006 2007 2008 2009 2010 2011 2012 2013 2014 2015
Steel and Foundry casting production tonnages move in parallel
Growth perspectives should be similar: Foundry should benefit from China and India
Source WSA for steel production volumes; Modern Casting and Vesuvius estimates for casting tonnes,
Casting
production
volumes
Steel
Production
Volumes
0
2000
4000
6000
8000
10000
12000
0
10,000
20,000
30,000
40,000
50,000
60,000
70,000
80,000
90,000
100,000
2002 2003 2004 2005 2006 2007 2008 2009 2010 2011 2012 2013 2014 2015
5,000
10,000
15,000
20,000
25,000
30,000
35,000
40,000
45,000
50,000
0
100,000
200,000
300,000
400,000
500,000
600,000
700,000
800,000
900,000
2002 2003 2004 2005 2006 2007 2008 2009 2010 2011 2012 2013 2014 2015
Ste
el P
rod
uct
ion
(to
nn
es)
Ste
el P
rod
uct
ion
(to
nn
es)
Cas
tin
g P
rod
uct
ion
(to
nn
es)
Cas
tin
g P
rod
uct
ion
(to
nn
es)

57
Foundry sales
£/T of total market casting (2014)
Significant upside potential through continuing market
penetration as emerging markets move towards higher quality foundry
castings
Ductile Iron
Long term growth in Foundry will come from innovation and marketing
0
10
20
x 20

58
Mining capital expenditure has fallen significantly since 2012
Source: Bloomberg, JPMC Research
0
20,000
40,000
60,000
80,000
100,000
120,000
140,000
160,000
2011 2012 2013 2014 2015
$mill
ions
RoW Australia North America

59
Shift of headcounts to emerging countries continued
2,850 2782
395 351
1098756
0
1,000
2,000
3,000
4,000
2012 2016
1,891 1829
0
1,000
2,000
3,000
4,000
2012 2016
2,792 2674
0
1,000
2,000
3,000
4,000
2012 2016
Other EMEA facilities and headcountEU 15 facilities and headcount
JVs
Developed markets Developing markets
NAFTA facilities and headcount
South America facilities and headcount Asia Pacific facilities and headcount
Employees Employees Employees
Employees Employees
5
714966
0
1,000
2,000
3,000
4,000
2012 2016 Facilities
38 41
17 15
811
744 778
1,760 1440
0
1,000
2,000
3,000
4,000
2012 2016
27
33
36 34
Source: Cognos, June 2016
Note: 2016 includes Sidermes, Ecil MET TEC and Process Metrix , not included in 2012 plants