Embed Size (px)
Citation preview

GLOBAL PAYMENTS 2016 SURVEY REPORT
Performed & Analyzed by Underwritten by
Copyright © 2016 Strategic Treasurer, LLC

Copyright © 2016 Strategic Treasurer, LLC2016 Global Payments Survey StrategicTreasurer.com | 2
Strategic Treasurer & Fides Treasury ServicesSummary Report: Table of Contents
TABLE OF CONTENTSSUMMARY REPORT . . . . . . . . . . . . . . . . . . . . . . . . . . . . . . . . . . . .3-10
Executive Summary . . . . . . . . . . . . . . . . . . . . . . . . . . . . . . . . . . . . . . . . . . . . 3
Introduction & Demographics . . . . . . . . . . . . . . . . . . . . . . . . . . . . . . . . . . . 4
Banks . . . . . . . . . . . . . . . . . . . . . . . . . . . . . . . . . . . . . . . . . . . . . . . . . . . . . . 4
+ Bank Participants Portrait
+ Bank Technology Adoption: Rapid & Highly Competitive
+ Top Bank Concerns: Fraud & Changing Regulations
+ Bank Perception of Corporates: Hit or Miss
Corporates . . . . . . . . . . . . . . . . . . . . . . . . . . . . . . . . . . . . . . . . . . . . . . . . . . . 6
+ Corporate Participant Portrait
+ Corporate Technology Adoption: Patient, but Willing
+ Top Corporate Payment Drivers: Fraud & Efficiency
+ Corporate Reality: Complex Payment Landscape
Outlook: New Payment Initiatives . . . . . . . . . . . . . . . . . . . . . . . . . . . . . . . . 8
+ Optimisim is High Across the Board
+ Bulk of Knowledge Held by Banks
Five Key Takeaways . . . . . . . . . . . . . . . . . . . . . . . . . . . . . . . . . . . . . . . . . . . . 8
1 . Bank & Corporate Priorities: Aligned, but Not Equal
2 . Corporates Need Education on New Developments
3 . Corporates Late to the Party on New Initiatives
4 . Despite Lag, Tech Adoption Does Occur & Will Continue
5 . Banks Will Continue to Lead with Payment Developments
Conclusion . . . . . . . . . . . . . . . . . . . . . . . . . . . . . . . . . . . . . . . . . . . . . . . . . . . 10
INFOGRAPHIC . . . . . . . . . . . . . . . . . . . . . . . . . . . . . . . . . . . . . . . . . 11
DETAILED RESULTS . . . . . . . . . . . . . . . . . . . . . . . . . . . . . . . . . . .12-66
Participant Demographics . . . . . . . . . . . . . . . . . . . . . . . . . . . . . . . . . . . . . 13
Current Bank Payments Environment . . . . . . . . . . . . . . . . . . . . . . . . . . . 15
Current Corporate Payments Environment . . . . . . . . . . . . . . . . . . . . . . 24
New Payment Initiatives Outlook: Banks . . . . . . . . . . . . . . . . . . . . . . . . . 41
+ Blockchain
+ U .S . Same Day ACH
+ U .K . Faster Payments Service (FPS)
+ European Faster Payments
+ Austrailian New Payments Platform (NPP)
+ SWIFT Global Payments Innovation Inititative (GPII)
New Payment Initiatives Outlook: Corporates . . . . . . . . . . . . . . . . . . . . 54
+ Blockchain
+ U .S . Same Day ACH
+ U .K . Faster Payments Service (FPS)
+ European Faster Payments
+ Austrailian New Payments Platform (NPP)
+ SWIFT Global Payments Innovation Inititative (GPII)
FIRM PROFILES . . . . . . . . . . . . . . . . . . . . . . . . . . . . . . . . . . . . . . . . 67
+ Author: Strategic Treasurer
+ Sponsor: Fides Treasury Services

Copyright © 2016 Strategic Treasurer, LLC2016 Global Payments Survey StrategicTreasurer.com | 3
Strategic Treasurer & Fides Treasury ServicesSummary Report: Executive Overview
EXECUTIVE SUMMARYThe channels through which organizations initiate and exchange payments are under constant evolution, as the globalization of business results in a wider array of banks, currencies, financial messaging networks, and initiatives within the payments landscape .
In recent years, new initiatives and technology such as SWIFT GPII and blockchain look to revolutionize the methods by which organizations transact with one another . At the same time, new developments such as Same Day ACH and U .K . Faster Payments Service aim to increase the speed and efficiency of electronic payments. As these developments evolve, organizations must decide how best to respond .As banks and corporations work to create an efficient and secure payment structure, a wide variety of questions and concerns must be addressed .
In today’s fast-paced business environment, there is constant pressure on organizations to move payments quickly, securely, and efficiently.
This survey, conducted by Strategic Treasurer with underwriting support from Fides Treasury Services, sought to measure the practices, plans, and priorities for payments on a global basis from the views of both corporations and banks .
The questions covered a range of categories regarding corporate and bank payment structures and practices, along with developments on faster payments, cross-border innovations, and new technology influences, including blockchain. While many of the questions asked were presented to both corporate and bank respondents, there were also specific questions asked to each
group, as there are several points of distinction between corporates and banks that necessitated the use of a segmented range of questions.
The result is that the payment structures and practices of banks and corporates are able to be viewed both holistically and by industry . This allows for the data to be used as a resource for understanding the payments landscape as a whole, while also allowing for the recognition of key metrics and practices that exist within the corporate and bank subgroups .
The following survey report provides an in-depth overview of the key findings and takeaways of the survey, along with a visual infographic that summarizes the analysis . Finally, we have provided an appendix of survey responses so that individual questions asked through the survey can be viewed . These questions are separated into five categories and include:
» Demographics » Current Bank Payments Environment » Current Corporate Payment Environment » Bank Payment Initiatives Outlook » Corporate Payment Initiatives Outlook
Strategic Treasurer and Fides Treasury Services are delighted to bring you the results of the 2016 Global Payments Survey. We hope you enjoy this report and find it useful. Thank you for reading.
IMPORTANT NOTE: The survey appendix does not contain every question asked as part of the 2016 Global Payments Survey. Rather, it is a selection of many critical and noteworthy responses. As part of an effort to limit the size of this report, certain questions and responses were redacted. In addition, all survey respondent data is confidential, and is not shared with any 3rd parties, including survey underwriters. The data is not shared or displayed in a manner that would identify any single company or respondent. Finally, Strategic Treasurer does not use individual survey responses to solicit services; the data obtained is used strictly as an informational resource.
INTRODUCTIONThe 2016 Global Payments Survey was released by Strategic Treasurer and Fides in early June and ran through late August . Over the three month period that it spanned, a total of 316 respondents submitted extensive information related to their organizations’ payment processes, as well as their awareness and attitudes regarding new regional and global payment initiatives .
The intent of introducing the Global Payments Survey was to better understand the current processes being used by corporates and banks for exchanging regional and global payments, and also to determine what each specific industry’s attitudes were regarding the introduction of new initiatives to the payments landscape .
In addition to their awareness and attitudes, we wanted to gauge the drivers of both corporates and banks to adopt new payments technology as it becomes available on the market and their strategies for responding to changes within the payments arena.
DEMOGRAPHICSAs we sought to gather a large assortment of data from the standpoint of both corporates and banks, there was a significant effort made to ensure that adequate numbers of respondents from both categories participated in the survey .
Of the 316 survey respondents, 25% were from banks, with the remaining 75% coming from corporates operating in a wide variety of industries . While there was a concentration of respondents headquartered in North America and Europe, at least one-third of respondents were operating in each of the major regions of the world (Middle East, Africa, India, Asia, etc .) . Furthermore, as over 80% of respondents were operating in more than one country and over
Copyright © 2016 Strategic Treasurer, LLC2016 Global Payments Survey StrategicTreasurer.com | 4
Strategic Treasurer & Fides Treasury ServicesSummary Report: Analysis & Key Findings
one-third in 20+ countries, we were satisfied with the global distribution of the sample size .
With regards to organizational size, nearly half (48%) of respondents’ companies had annual revenues exceeding $2 .5 billion . Overall, there was a fair distribution of organizations by size, including 18% with revenues below $100 million and 34% between $100 million and $2.5 billion.
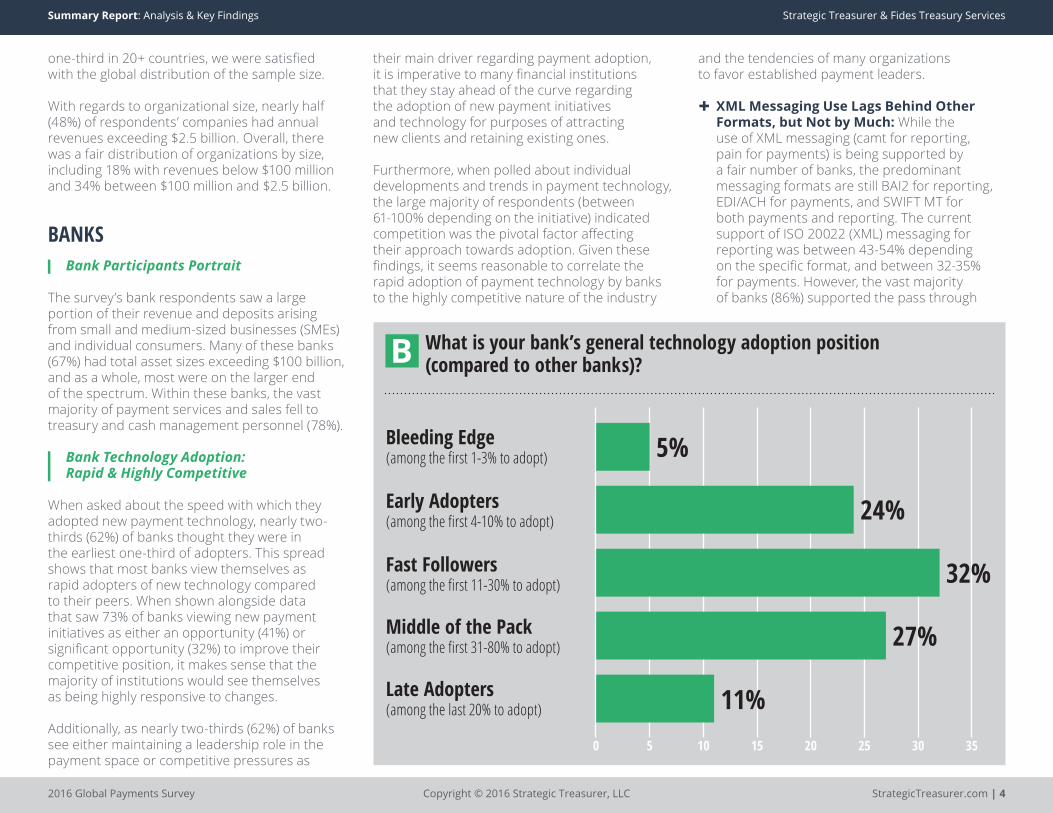
BANKSBank Participants Portrait
The survey’s bank respondents saw a large portion of their revenue and deposits arising from small and medium-sized businesses (SMEs) and individual consumers . Many of these banks (67%) had total asset sizes exceeding $100 billion, and as a whole, most were on the larger end of the spectrum . Within these banks, the vast majority of payment services and sales fell to treasury and cash management personnel (78%).
Bank Technology Adoption: Rapid & Highly Competitive
When asked about the speed with which they adopted new payment technology, nearly two-thirds (62%) of banks thought they were in the earliest one-third of adopters . This spread shows that most banks view themselves as rapid adopters of new technology compared to their peers . When shown alongside data that saw 73% of banks viewing new payment initiatives as either an opportunity (41%) or significant opportunity (32%) to improve their competitive position, it makes sense that the majority of institutions would see themselves as being highly responsive to changes .
Additionally, as nearly two-thirds (62%) of banks see either maintaining a leadership role in the payment space or competitive pressures as
their main driver regarding payment adoption, it is imperative to many financial institutions that they stay ahead of the curve regarding the adoption of new payment initiatives and technology for purposes of attracting new clients and retaining existing ones .
Furthermore, when polled about individual developments and trends in payment technology, the large majority of respondents (between 61-100% depending on the initiative) indicated competition was the pivotal factor affecting their approach towards adoption . Given these findings, it seems reasonable to correlate the rapid adoption of payment technology by banks to the highly competitive nature of the industry
and the tendencies of many organizations to favor established payment leaders.
XML Messaging Use Lags Behind Other Formats, but Not by Much: While the use of XML messaging (camt for reporting, pain for payments) is being supported by a fair number of banks, the predominant messaging formats are still BAI2 for reporting, EDI/ACH for payments, and SWIFT MT for both payments and reporting . The current support of ISO 20022 (XML) messaging for reporting was between 43-54% depending on the specific format, and between 32-35% for payments . However, the vast majority of banks (86%) supported the pass through
0 5 10 15 20 25 30 35
Bleeding Edge(among the first 1-3% to adopt)
Early Adopters(among the first 4-10% to adopt)
Fast Followers(among the first 11-30% to adopt)
Middle of the Pack(among the first 31-80% to adopt)
Late Adopters(among the last 20% to adopt)
5%
24%
32%
27%
11%
What is your bank’s general technology adoption position (compared to other banks)?

Copyright © 2016 Strategic Treasurer, LLC2016 Global Payments Survey StrategicTreasurer.com | 5
Strategic Treasurer & Fides Treasury ServicesSummary Report: Analysis & Key Findings
of all format types including ISO 20022 messages, which shows compatibility with the newer formats even if support for payment origination in XML is not being offered.
Banks Leverage Partnership with Tech Firms for Development: The survey found that in order to develop new payment capabilities, many banks are partnering with 3rd party firms. Overall, 57% of banks indicated a balance between internal resources and 3rd parties for developing capabilities, with 11% using 3rd parties almost all the time, and 5% using them occasionally . Only 16% of banks indicated that they almost always developed their capabilities solely using in-house resources.
Top Banking Concerns: Fraud & Changing Regulations
As changes occur within the payments industry, banks’ primary concerns in adopting new technology and taking on new initiatives center around the threat of fraud and the effect that regulations will have moving forward . For 62% of respondents, fraud was seen as a top concern, the threat of which could easily arise as new technologies are implemented and as criminal perpetrators find new ways of breaching organizational security measures and illegally accessing information .
In addition to fraud, the compliance and regulatory restrictions that are placed upon banks were seen as a top concern by 57% of respondents . In recent years, regulations such as Basel III and EMIR have increasingly affected the way banks do business, and any new development in the payments landscape typically has new regulatory guidelines that follow closely behind it . Thus, banks that work to immediately develop new payment capabilities as they are introduced run the risk of having their efforts sidetracked by regulations that would limit or prohibit their
use (e .g ., new regulations could be introduced that limit the use of blockchain for payments).
Sanctions Filtering Disparity: One interesting discovery made through the survey was that, while regulations remained a high priority and concern for many banks, a large number of them (38%) do not currently offer sanctions screening services to their clients . Given the heavy amount of scrutiny placed upon making sanctioned payments in recent years, and the jump in the frequency of penalties that have been assessed by legislative bodies such as OFAC for sanctions violations, the lack of service in this area is surprising.
Corporate Perception: Hit or Miss
When asked what they thought their clients’ top payment development priorities were, 65% of banks indicated in-country faster payments (Same Day ACH, U .K . Faster Payments Service, etc .) as the top priority, followed by APIs for payment management and approval at 54% and cross-border payments like SWIFT GPII at 51% .
While in-country payments was indeed the top corporate priority on the list, banks saw APIs as being a much higher priority for corporates than it actually was . Only 25% of corporates saw the development of APIs as a priority . When compared to the 54% of banks who thought it
0 10 20 30 40 50 60 70 80
Fraud
Amount of Regulation or Changes to Regulation
Competition from Non-Banks
Competition from Banks
62%
57%
49%
46%
Our top concerns about various payment changes are: (select all that apply)

Copyright © 2016 Strategic Treasurer, LLC2016 Global Payments Survey StrategicTreasurer.com | 6
Strategic Treasurer & Fides Treasury ServicesSummary Report: Analysis & Key Findings
would be a top priority for their clients, there appears to be a void in understanding between what corporates are looking for in the payments arena and what banks think they need.
CORPORATESCorporate Participant Portrait
Over half (54%) of the survey’s corporate respondents had treasury departments that consisted of fewer than six members . With regards to individual respondents’ roles, nearly two-thirds (61%) were either the Treasurer, Assistant Treasurer, or Treasury/Cash Manager of their organization . An additional 13% were Treasury Analysts, and 4% were CFOs .
Corporate Technology Adoption: Patient, but Willing
When compared to their banking counterparts, corporates appear to be much more patient in their approach to adopting new technology and services . Whereas 24% of banks saw themselves as among the first adopters of new payment technology, only 11% of corporates saw themselves in the same position . Instead, 64% of corporates indicated they would be either middle of the pack or later adopters (last 70% to adopt) of new technology, compared to only 38% of banks who saw themselves as mid-pack or late adopters.
Corporate XML Messaging Use: Approximately 50% of corporate respondents were either currently using or planning to use XML messaging within the next two years, which is roughly in line with banks’ support of the messaging standard . An additional 15% had plans to use XML messaging in 2 or more years . Approximately 20% of corporates did not have any plans to use XML messaging . This data indicates that the use of XML is close to the tipping point within the corporate realm .
Corporates Split Between Following Payment Leaders & Staying With Partners: Providing access to capital has long been the top driver for corporates when selecting their banking partners, channels, and services . However, as new payment technology and initiatives become available within the market, a sizable minority of corporates (38%) are indicating that they will turn to providers who are able to offer leading services, and are even willing to shift their business to new providers if their current provider or bank seems to be lagging behind the payments curve . In fact, 20% of corporate respondents were likely to move some or all of their business to a payment leader, and another 9% would leave
a provider who was lagging in the payment space . An additional 9% would be more likely to stay with their current payment provider if they were a payment leader . In total, 38% of corporate respondents indicated that their payment provider’s adoption of new technology and initiatives would impact their behavior towards them . In contrast, 60% of corporates indicated they would stay with their main banks to support their credit, and would only switch services if it was absolutely necessary.
Corporate Payment Spend Plans: Moving forward, 26% of corporates are planning to spend more or significantly more on payments within the next year, which is three
0 10 20 30 40 50
Bleeding Edge(among the first 1-3% to adopt)
Early Adopters(among the first 4-10% to adopt)
Fast Followers(among the first 11-30% to adopt)
Middle of the Pack(among the first 31-80% to adopt)
Late Adopters(among the last 20% to adopt)
3%
11%
22%
46%
18%
What is your company’s general technology adoption position (compared to other companies)?

Copyright © 2016 Strategic Treasurer, LLC2016 Global Payments Survey StrategicTreasurer.com | 7
Strategic Treasurer & Fides Treasury ServicesSummary Report: Analysis & Key Findings
times higher than the number planning to decrease spending . Of those planning to spend more, their planned investments are distributed across a wide array of categories, such as the implementation of a payment hub (24%), TMS payments (26%), and enhancements to an ERP (33%).
Top Corporate Payment Drivers: Fraud & Efficiency
The primary driver affecting corporate decision making with regards to payments was fraud management, with 46% of organizations indicating it as their top priority . Given the largescale fraud attacks that have occurred against organizations in recent years, the high level of focus that is currently being placed on fraud management is not unwarranted .
As a second payments driver, over one-third of organizations (34%) listed efficiency. As a large number of corporate respondents were using multiple banks and currencies for making payments and were also generating very high volumes of payments per month, it is justifiable that organizations would seek increased efficiency in this area.
After fraud management and efficiency, one-third (32%) of organizations saw cost as their third major driver for payments . The indication that cost played a lesser role than fraud protection and efficiency in driving new payments initiatives could point to a willingness by many organizations to invest in services that can provide them with enhanced security and increased efficiency.
However, it is important to note here that as part of a separate question, 79% of corporates indicated that reducing internal costs was the largest driver with regards to making changes to payment methods, even before fraud reduction (67%) and efficiency in reducing errors (62%). Thus, when corporates list efficiency as a key
driver, it may point to efficiency both with regards to operations and in helping to reduce the overall internal cost of managing payments .
Sanctions Filtering & Compliance: Of those planning to spend more on payments, 12% indicated spend on sanctions filtering services, while 24% indicated spend on compliance related areas other than sanctions filtering. Currently, 60% of corporates are not using sanctions filtering services. Given the amount of regulation in this area and the increasing penalties associated with making payments to a sanctioned party, the low levels of use regarding sanctions filtering is surprising. This is especially the case given that 75%
of corporates listed law and regulation coordination as an important or highly important aspect of their security measures.
Corporate Reality: Complex Payment Landscape
The payment processes used by corporate respondents to the survey tended to be global in nature and involved multiple banks. For instance, 46% of respondents indicated the use of more than six banks for originating payments, and 80% used more than three . In addition, organizations were making payments in a large variety of different currencies, with 51% using more than six currencies and 80% using more than three .
0 10 20 30 40 50 60 70 80
Fraud Protection& Management
Efficiency
Cost
Visibility
Working Capital
74%
71%
65%
54%
44%
Rate the following payment initiative drivers from (1) most to (8) least important. (Shown are top 5 responses rated 1-4 on importance)

Copyright © 2016 Strategic Treasurer, LLC2016 Global Payments Survey StrategicTreasurer.com | 8
Strategic Treasurer & Fides Treasury ServicesSummary Report: Analysis & Key Findings
This payment complexity was also evident with regards to the volumes of payments being sent, with half of respondents making more than 10,000 payments globally per month and one-quarter (24%) making more than 1,000,000.
With such high volumes of payments being made globally, it makes sense that organizations would run into obstacles in certain places, especially in regions that have underdeveloped payment structures or that are heavily sanctioned . This was found to be the case for almost one-quarter (23%) of organizations, who indicated that they had trouble making payments to certain countries such as Sudan, Libya, Syria, and others within Africa and the Middle East.
Payment Priorities: Approximately half of corporates saw in-country payments and cross-border payments as top priorities, which was roughly in line with what banks had anticipated corporate priorities would be . However, corporates were much less concerned about the use of APIs (25%) than banks thought they would be (54%), which demonstrates a gap in communication and understanding .
Connectivity - Room to Grow: The prevalent connectivity options used by corporates were bank portals at 75% and SWIFT at 54% . Host-to-Host (H2H) connectivity was also relatively high at 39% . Other options, such as a Treasury Aggregator and EBICS, were used less frequently, with 17% and 9% use respectively . This data shows that corporates are still relying heavily upon traditional connectivity options to exchange payments despite the introduction of newer and more advanced options to the payments landscape.
Centralizing Payment Structures: There is currently a largescale movement by corporates away from decentralized payment structures towards a more centralized approach . At this point in time, 72% of
corporates are using a centralized payment structure . In addition, 26% of respondents were planning to restructure their payment operations towards a more centralized environment, with either disbursements by entity or via a payment-on-behalf-of (POBO) structure . Overall, there were approximately three times as many organizations using a centralized payments structure as there were decentralized . Additionally, there were six times as many organizations moving towards a centralized structure as there were those moving away from it.
OUTLOOK: NEW PAYMENT INITIATIVES
Optimism Is High Across the Board
The overwhelming majority of respondents in both the corporate and banking sectors had a positive outlook towards new payment initiatives . Even while the majority of corporate respondents indicated little or only basic knowledge of the majority of initiatives listed throughout the survey, their optimism regarding future use as additional rails for payments was still quite high .
For corporates, favorability towards new initiatives ranged from a high of 81% for U .K . Faster Payments Service, to 59% for Australian NPP . Banks had a similar range, with the highest favorability at 90% for Same Day ACH, down to 63% for Australian NPP . Generally, any specific initiative had at least two-thirds of respondents in favor of its use.
Blockchain: The only development where respondents deviated from the overwhelmingly high optimism was with regards to blockchain, which had the lowest number of banks (60%) in favor of its use and less than one-third of corporates (31%)
in favor . Instead, 43% of corporates and 28% of banks had not considered the use of blockchain activity . A full 18% of corporates and 6% of banks were opposed to its use . While blockchain has garnered widespread attention as of late, data shows that many organizations are skeptical towards its use in the payments arena at this point in time.
Bulk of Knowledge Held by Banks
While the optimism for new payment initiatives is high across the board, survey data showed that banks, as a whole, have a more robust understanding of each initiative than corporates and were more aware of the anticipated impacts on the payments arena .
For corporates, approximately one-third of respondents were aware of SWIFT GPII, European Faster Payments, and U .K . Faster Payments . For banks, 70% were aware of SWIFT GPII, with 42% for European Faster Payments, and 57% for U .K . Faster Payments, which demonstrates a clear advancement in knowledge when compared to the corporate sector.
FIVE KEY TAKEAWAYS1. Bank & Corporate Priorities: Aligned, but Not Equal
Both corporates and banks shared a sense of optimism on most of the new developments affecting the payments landscape; however, there were two areas where their attitudes diverged. The first is with APIs, where banks were much more proactive about their development and use: 54% compared to corporate’s 25% . High bank prioritization in this area is possibly driven by PSD2 requirements .
In addition, corporate and bank attitudes differed regarding the use of blockchain, where 60% of

Copyright © 2016 Strategic Treasurer, LLC2016 Global Payments Survey StrategicTreasurer.com | 9
Strategic Treasurer & Fides Treasury ServicesSummary Report: Analysis & Key Findings
banks were found to be in favor of its use, vs. only 30% of corporates . In both of these instances, banks were twice as optimistic or enthusiastic as corporates about developing their capabilities, which shows that the outlooks of each industry, while generally aligned, are not always equal .
2. Corporates Need Education on New Developments
There is a lack of understanding by corporates regarding the new initiatives that are making their way into the payments arena . As a number of new initiatives and developments have been introduced in recent years, many organizations have fallen behind the curve with regards to their awareness of the payments landscape as it exists today . Updating one’s payment operations is not a once-in-a-career task . It is a continual process that involves constant assessment, analysis, and research to determine where operations are lacking and where improvements can be made .
As new technology arrives, organizations must remain prudent in educating themselves on the impact new developments will have and what their strategies should be for responding to them.
3. Corporates Late to the Party on New Initiatives
When asked about their connectivity options, three-quarters of organizations were found to be relying heavily on bank portals, along with half that maintain connectivity to SWIFT and just under two-fifths (38%) using direct (H2H) connections. Newer connectivity options, such as the use of EBICS or the implementation of a Treasury Aggregator, are seeing much less use . On a similar note, even the use of XML messaging, which is widely regarded as the messaging format of the future, is currently only being utilized by less than half of corporates .
Similarly, despite widespread optimism regarding new payment initiatives, very small numbers
of corporate clients have begun transitioning to their use . This is because corporates tend to only implement new technology or services once they are sure that the transition will optimize and enhance their current processes . It is not enough that something is “new” and “revolutionary .” If an organization does not clearly understand and recognize the benefits of a market development, they will avoid adoption until it becomes necessary to do so .
Similarly, corporates will not implement a security or compliance feature until they are able to clearly recognize the risk or danger involved in failing to adopt the feature . This can be highlighted through the reluctance of many organizations to adopt sanctions filtering services. According to the U .S . Department of the Treasury, nine companies have received civil penalties that ranged from $43,000 to $7 .6 million for sanctions violations so far in 2016* . There are currently an additional four companies that have completed settlement agreements outside of civil court for sanctions violations . Of these violations, over three-quarters of the penalties were delivered to non-financial institutions. This is information that most corporates might not be aware of .
Until recently, practically all of the sanctions violation penalties administered by OFAC were handed to banks, as they were the primary parties in charge of screening . However, recent regulation has shifted more responsibility to corporates for managing compliance on their own payments . As realization of the growing threat faced by increasing compliance regulations hits, a growing number of organizations will look to adopt services, as evidenced by the 10% expected growth of sanctions filtering services over the next two years.
Because organizations do not adopt new technologies and services until they clearly recognize the benefits, it takes time for new developments to catch on within an industry .
New technology must be tried out, analyzed, and assessed before organizations begin considering an implementation . This process can take years for corporates, as many choose to wait until a new technology has become a standard or leading practice before they choose to adopt . Thus, it is not until long after their introduction that many new initiatives gain traction in the market .
As the payments landscape evolves, it is important to note that the developments that are just now entering the market will not transform the industry overnight.
4. Despite Lag, Tech Adoption Does Occur & Will Continue for Corporates
As evidenced by the 26% of organizations that are increasing their spend on payments technology over the next year, there is indeed evolution and adoption taking place within the corporate payment landscape . Of those planning to increase their spend, there was a wide variety of areas where improvements were being made . These included enhancements to ERPs, updates to TMSs, the implementation of payment hubs and payment factories, the installation of various compliance and security measures, and the adoption of new cross-border and in-country payment initiatives.
There are two key areas of importance highlighted through the corporate payment spend plans:
The Adoption of New Technology Is Taking Place Within the Market, and It Is Occurring Across a Wide Variety of Areas. Within the corporate realm, updates to existing payments technology, as well as the implementation of new systems, is performed by approximately one-quarter of organizations on a yearly basis . However, these companies are not all focused on implementing the same features . Instead, corporate spend is distributed across a wide variety of areas, and can range from the implementation of a TMS to

Copyright © 2016 Strategic Treasurer, LLC2016 Global Payments Survey StrategicTreasurer.com | 10
Strategic Treasurer & Fides Treasury ServicesSummary Report: Analysis & Key Findings
updating the payments module of an ERP or the adoption of new payment security measures . As demonstrated through the survey, the introduction of a new technology will see anywhere from 3-6% adoption year over year, with larger increases in the adoption rate further down the road as a new development becomes a leading or best practice.
As Data Shows, Not Every New Technology and Initiative Is Needed by Every Organization. When confronted with five new payment developments, corporates may only implement the one or two that most closely match their needs . For example, an organization only operating in the U .S . need not worry about new cross-border payment initiatives, but should be paying very close attention to Same Day ACH developments . Furthermore, this company may not see the need to connect to EBICS or SWIFT, and may only maintain connectivity through bank portals and direct connections to a select few banks . On the other hand, a company operating in 20+ countries would need connectivity to a larger number of banking networks, would be affected by both in-country and cross-border payment initiatives, and would have an increased need for sanctions screening on payments leaving the country . However, even this organization may not feel the need to connect to both EBICS and SWIFT and may choose the one that provides the widest coverage . In this way, the adoption rates of new developments depend not only on their ability to solve market needs, but also on the number of firms that stand to benefit from their use and the number of available alternatives.
5. Banks Will Continue to Lead with Payment Development & Adoption
As evidenced by the knowledge and proactive approach exhibited by banks regarding the payments space, it appears as though banks will continue to lead the way with the development of new initiatives and the adoption of payments technology . Due mainly to inter-bank competition and attempts to lead in the payments arena, the majority of banks will look to quickly develop new technologies as they emerge .
As corporate banking constitutes a significant portion of revenue for banks, they have strong motivation to stay up-to-date with advancements and abreast of their peers for fear of losing out on business due to their lack of services . The indication of banks’ expedience in adoption can be found across a number of bank responses, including 62% who saw maintaining a leadership role in the payment space or competitive pressures as their key payments driver and 73% who viewed payment initiatives as an opportunity to improve their competitive position within the market.
CONCLUSIONExpanding globalization is coupled with increased complexity in the payments environment for most companies . This is causing many organizations to look for new ways of optimizing their payment processes and reducing complexity . Moving forward, the leading agents of change within the payments landscape will be banks and a select few corporate leaders .
Banks will naturally compete to develop new capabilities and introduce them to the market .
For corporates, only a select few organizations push the envelope on new developments and heavily influence the strategies of banks. The firms with this level of sway tend to be large, multinational organizations whose business is deemed vitally important to their banks . Together, these two forces drive most of the changes within the payments arena .
In order to help foster growth, banks must make more of an effort to educate their corporate clients on the changes that are occurring within the payments landscape and how the changes will affect the services they offer. Similarly, corporates must seek to educate themselves on new developments as they unfold and work to understand how the changes will affect them.
Moving forward, the organizations that architect their payments environment to be flexible will be able to more rapidly and fully take advantage of the best changes in payments technology over time.
As new developments are introduced, organizations may be hesitant to embrace them at first. However, as long as the benefits that these developments provide are understood and significant, companies will move forward to adopt them.

Same Day ACHBank: 90%Corp: 76%
14%Di�erence
SWIFTGPIIBank: 73%Corp: 61%
12%Di�erence
UK FasterPaymentsBank: 85%Corp: 81%
4%Di�erence
Euro FasterPaymentsBank: 80%Corp: 78%
2%Di�erence
AustralianNPPBank: 63%Corp: 59%
4%Di�erence
BlockchainTechnologyBank: 60%Corp: 31%
29%Di�erence
Fraud
Regulatory Changes
Competition From Banks
Non-Bank Competition
62%
57%
49%
25%
Fraud Protection/Management
E�ciency
Cost
Visibility
46%
34%
32%
25%
of bank respondents view themselves as early,
rapid adopters of new payment technology.
62%of corporate respondents
view themselves as patient, late adopters of new payment technology.
64%
316 Global Respondents
COMMON OUTLOOK: OPTIMISM TOWARDS NEW INITIATIVES ONE EXCEPTION: BLOCKCHAIN ADOPTION
NEW DEVELOPMENTS IN
GLOBAL PAYMENTS
The 2016 Global Payments Survey was released to better understand the current processes being used by corporates and banks for exchanging regional and global payments as well as prevailing attitudes
regarding new initiatives within the industry.
In today’s fast-paced business environment, there is constant pressure on organizations
to move payments quickly, securely, and e�ciently.
50% of banks have greater than
$250 billionin assets.
51% of corporates regularly use
6+ currenciesfor payments.
BANKS represented
25% of all survey respondents.
CORPORATES represented
75% of all survey respondents.
36% of banks operate in 30+
countries.
43% of corporates generate between
1,000 - 100,000payments/month.
45% of corporates use 6+ banksfor payments.
26% of banks’ corporate clients plan
to increase spend on payments.
TOP BANK CONCERNS TOP CORPORATE DRIVERS
CORPORATETECH ADOPTION
BANKTECH ADOPTION
BANK AWARENESS 56% average among bank respondents on new initiatives.
CORPORATE AWARENESS 37% average among corporate respondents on new initiatives.
DOWNLOAD FULL REPORTStrategicTreasurer.com/2016-Global-Payments
Data: 2016 Global Payments Survey by Strategic Treasurer (underwritten by Fides Treasury Services)
Graphics: Designed by Strategic Treasurer and FreePik

2016 Global Payments Survey Report Copyright © 2016 Strategic Treasurer, LLC 12
2 3 4 512016 GLOBAL PAYMENTS SURVEY: DETAILED FINDINGS
SURVEYAPPENDIXDETAILED FINDINGSFROM SELECT SURVEY
QUESTIONS &
RESPONSES
The following appendix of survey data does not contain every question asked as part of the 2016 Global Payments Survey. It is a selection of many critical and noteworthy responses. As part of an effort to limit the size of this report, certain questions and responses were redacted.

2016 Global Payments Survey Report Copyright © 2016 Strategic Treasurer, LLC 13
1. PARTICIPANT DEMOGRAPHICS 2 3 4 5
72%
1%
21%
5%
1%
0% 10% 20% 30% 40% 50% 60% 70% 80%
North America (Canada / US / Mexico)
Latin & South America
EMEA
Asia
Pacific
In what region is your organization headquartered? What is your company’s annual revenue?
18%
11%
11%
12%
23%
25%
0% 5% 10% 15% 20% 25% 30%
Under $100MM
$100MM-500MM
$500MM-1B
$1B-2.5B
$2.5-10B
Greater than $10B
Headquarter Location. Nearly three-quarters of respondents had headquarters in North America. Almost one-quarter were headquartered in Europe, and a small portion were located in South America, Asia and the Pacific.
Annual Revenue. Almost half of respondents had annual revenues exceeding $2.5 billion USD, and one-quarter had revenues greater than $10 billion. Overall, there was excellent feedback by companies of all revenue sizes.

2016 Global Payments Survey Report Copyright © 2016 Strategic Treasurer, LLC 14
Our business operates in this many countries: (Free response)
Which region(s) does your company operate in? (Select all that apply)
30%
34%
87%
43%
37%
53%
38%
62%
42%
0% 20% 40% 60% 80% 100%
Africa
Middle East
North America (Canada / US / Mexico)
Latin & South America
India
Asia (other)
Pacific
Western Europe
Eastern Europe62%
18%
7%
2%
5%
7%
1-20
21-40
41-60
61-80
81-100
>100
0% 10% 20% 30% 40% 50% 60% 70%
Global Spread. Over 80% of businesses operated in more than one country, and over one-third operated in 20+ countries.
Regional Footprint. There was a large proportion of businesses operating in each major world region, most notably in North America, Western Europe, and Asia. In total, each major region had at least 30% of respondents actively operating within it.
1. PARTICIPANT DEMOGRAPHICS 2 3 4 5

2016 Global Payments Survey Report Copyright © 2016 Strategic Treasurer, LLC 15
2. CURRENT BANK PAYMENTS ENVIRONMENT1 3 4 5
What is the total asset size of your bank?
8%
5%
5%
14%
19%
16%
32%
0% 5% 10% 15% 20% 25% 30% 35%
<$500MM USD
$500MM-$5B USD
$5B-$25B USD
$25B-$100B USD
$100B-$250B USD
$250B-$500B USD
>$500B USD
Asset Size. Approximately one-third of participating banks had total assets of over $500 billion USD, and nearly half had asset sizes of more than $250 billion. Less than one-fifth of respondents had asset sizes under $5 billion.
Where do the payment services and sales fall? (Select all that apply)
5%
30%
16%
78%
24%
11%
0% 10% 20% 30% 40% 50% 60% 70% 80% 90%
Investment Banking
Corporate Banking
Regional Banking
Treasury Management or CashManagement
Line of Business Management
Other (Specify)
Payment Service Responsibility. Over three-quarters of banks had designated the responsibilities of payment services and sales to treasury or cash management personnel. Approximately one-third of corporate banking staff also had payment service and sales responsibilities. As this was a “select all that apply” question, there is some overlap between the parties responsible for payment services.

2016 Global Payments Survey Report Copyright © 2016 Strategic Treasurer, LLC 16
Data Transformation – What types of data reformatting or transformation do you provide? (Select all that apply)
Supported Formats Information Reporting – We provide support for the following formats for information
reporting: (Select all that apply)
86%
86%
49%
27%
54%
22%
3%
0% 20% 40% 60% 80% 100%
Pass through of payment files (e.g. ACH,pain, BACS)
Pass through of information reporting files(e.g. BAI2, MT940, CAMT)
We reformat payment origination filesdirectly
We provide reformatting of paymentorigination files through 3rd parties
We reformat information reportingformats for our clients directly
We reformat information reportingformats for our clients through 3rd parties
Other (Specify)
81%
65%
78%
73%
43%
54%
46%
57%
11%
0% 10% 20% 30% 40% 50% 60% 70% 80% 90%
BAI2 (prior day)
BAI2 (current/intraday)
MT940 (prior day statement)
MT942 (current/intraday)
ISO 20022. Camt.054 (same daydebit/credit notification)
ISO 20022. Camt.053 (prior day statement)
ISO 20022. Camt.052 (current/intraday)
Bank Proprietary (incl. e-Mail)
Other (Please Specify)
Data Transformation. The vast majority of financial institutions (86%) allowed for the passing through of payment instructions and information reporting files in standard formats. Approximately half of banks reformat payment and reporting files directly for their clients, and about one-quarter reformat through 3rd parties.
Information Reporting: Supported Formats. Over three-quarters of financial institutions supported the standard SWIFT MT and BAI reporting formats. Support for ISO 20022 XML formats (camt) was less widespread, with approximately half of financial institutions offering support. Proprietary formats, including email, were supported by more than half of banks.
2. CURRENT BANK PAYMENTS ENVIRONMENT1 3 4 5

2016 Global Payments Survey Report Copyright © 2016 Strategic Treasurer, LLC 17
Supported Formats Payments – We provide support for the following formats for payment origination as a
standard offering: (Select all that apply)
What is your bank’s general technology adoption position (compared to other banks)?
68%
54%
73%
35%
78%
19%
30%
35%
35%
32%
24%
8%
0% 10% 20% 30% 40% 50% 60% 70% 80% 90%
EDI 820 (US)
EDI 835 (US)
NACHA (US)
Bacs (UK)
MT101 and/or MT103
CPA (Canada)
SAP eDocs
pain.001 (CGI XML payments
pain.001 (SEPA XML payments)
pain.008 (XML direct debits)
Local market format (e.g. Swiss DTA)
Other (Please Specify)
5%
24%
32%
27%
11%
0% 5% 10% 15% 20% 25% 30% 35%
Bleeding edge (we are among the first 1-3% to adopt)
Early adopters (we are among the first 4-10% to adopt)
Fast followers (we are among the first 11-30% to adopt)
Middle of the pack (we are among the first31-80% to adopt)
Late adopters (we are among the last 20%to adopt)
Payments: Supported Formats. Interestingly, bank support for payment formats was noticeably lower compared to information reporting formats. While support for standard SWIFT MT payment formats and for ACH wires (NACHA) was high, only one-third of participating banks offered support for ISO 20022 XML payment formats (pain). Also surprising was that only one-third of institutions were able to originate files through Bacs, the U.K’s automated clearing service. Origination of payment files in various EDI formats was between 54-68%.
Technology Adoption Position. The responses captured through this question saw the majority of banks viewing themselves as “fast followers” to adopt new technology as it is introduced to the industry. Also interesting was that nearly one-quarter of banks saw themselves as falling into the “early adopter” category, as part of the first 4-10% to adopt new technology. In total, 61% of banks believed that they were within the first 30% to adopt new technology when compared to their peers.
2. CURRENT BANK PAYMENTS ENVIRONMENT1 3 4 5

2016 Global Payments Survey Report Copyright © 2016 Strategic Treasurer, LLC 18
How are new payment initiatives typically viewed by your bank?
For development of payment capability, we:
32%
41%
11%
11%
0%
5%
0% 5% 10% 15% 20% 25% 30% 35% 40% 45%
An opportunity to significantly improveour competitive position
An opportunity to improve ourcompetitive position
A cost of doing business
A threat to existing business
A significant threat to our existing business
Unsure
16%
8%
57%
5%
11%
3%
0% 10% 20% 30% 40% 50% 60%
Do it ourselves all the time or mostly
Do it ourselves occasionally
A balance between internal developmentand 3rd parties
Use 3rd parties occasionally
Use 3rd parties all the time or mostly
Other (Please Specify)
Payment Initiatives. Overall, the vast majority of bank respondents had a positive outlook towards new payment initiatives, as nearly three-quarters viewed them to be opportunities for improving or significantly improving their competitive position. On the opposite end of the spectrum, 11% of respondents viewed new initiatives as a threat to their existing business.
Payment Capabilities. In order to develop their payment capabilities, the majority of banks utilize a mix of both internal and 3rd party resources (57%). 16% tend to develop their capabilities in-house, while 11% choose to rely almost exclusively on 3rd parties.
2. CURRENT BANK PAYMENTS ENVIRONMENT1 3 4 5

2016 Global Payments Survey Report Copyright © 2016 Strategic Treasurer, LLC 19
What general drivers push you to adopt new payment technology?
Payment Change Challenges – Our top concerns about various payment changes are: (Select all that apply)
5%
27%
11%
35%
19%
3%
0% 5% 10% 15% 20% 25% 30% 35% 40%
Attracting new corporate clients
Competitive pressures
Client retention
Maintaining leadership role in thepayment space
Increasing revenue
Other (Please Specify)
62%
49%
46%
57%
14%
32%
35%
41%
5%
0% 10% 20% 30% 40% 50% 60% 70%
Fraud
Competition from non-banks
Competition from banks
Amount of regulation or changes toregulations
Uneven regulatory playing field(Community banks and corporate banks)
Uneven regulatory playing field (All banksand technology firms)
Increased spend levels required to supportchanges
Increased spend levels required fordevelopment of new payment methods
Other (Please Specify)
Payment Drivers. Over one-third of banks saw the need to maintain their position as a leader in the payment space as the leading driver behind their adoption of new payments technology. Similarly, over one-quarter of banks saw competitive pressures as the primary driver behind their payment technology adoption. While many of the options provided as part of this question are related to one another, the intent was to pinpoint the specific drivers of banks that resulted in payment technology adoption.
Payment Challenges. Given the wide-sweeping effects that fraud and new regulations have had on the banking environment over the past several years, it is no surprise that fraud and regulations were the primary concerns of banks with regards to changes in payment structures and technology. Additionally, nearly half of banks saw the increase in competition that stems from the introduction of new payments technology as a top concern.
2. CURRENT BANK PAYMENTS ENVIRONMENT1 3 4 5

2016 Global Payments Survey Report Copyright © 2016 Strategic Treasurer, LLC 20
When do you estimate your organization will receive sufficient value and revenue by offering the following to
your clients:
0% 10% 20% 30% 40% 50%
SEPA Payments
Same Day ACH (US)
Faster Payments (UK)
SWIFT Global Payments InnovationInitiative (GPII)
Blockchain
Currently receiving value By 2018 By 2020 After 2022 Never N/A
Value of New Payment Initiatives. This question sought to gauge banks’ perceived value of offering new payment initiatives as time progresses, from “currently receiving value” to “never”. The area where banks seem to be realizing the highest value currently is through SEPA payments, while the area that respondents believed will be most promising in the next several years was Same Day ACH (US). Approximately proportionate numbers of respondents saw SWIFT GPII as sufficiently valuable from current day through to 2020. Blockchain, a new technology that is just starting to gain momentum, is seen by most banks as becoming valuable over the next several years.
2. CURRENT BANK PAYMENTS ENVIRONMENT1 3 4 5

2016 Global Payments Survey Report Copyright © 2016 Strategic Treasurer, LLC 21
Security/Sanction Filtering – Regarding sanction filtering, we:
24%
14%
54%
3%
5%
0% 10% 20% 30% 40% 50% 60%
Do NOT offer any sanction filteringservices and have no plans to offer it
within 2 years
Do NOT offer any sanction filteringservices currently but have plans to offer it
within 2 years
Offer sanction filtering services as part ofour payment offering
Offer sanction filtering services as anoption to our clients
Other (Please Specify)
Sanction Filtering. Regarding the offering of sanction filtering services to clients, over half of banks currently offer services as part of their payment offering, and 14% plan to start offering services within the next two years. Interestingly, over one-quarter of banks do not offer sanction filtering to clients, nor have any intentions of offering them within the next several years.
Connectivity Needed/Used – We offer to our corporate clients the following types of connectivity:
0% 10% 20% 30% 40% 50% 60% 70%
SWIFT (we maintain the infrastructure)
SWIFT (via correspondent relationship)
SWIFT (via 3rd party or SWIFT ServiceBureau)
SWIFT for corporates (SCORE)
EBICS for corporates
EBICS to banks, operators, central banks
Host to Host (our connectivity)
Host to Host (3rd party connectivity
Currently offer Plan to offer by 2018 Plan to offer by 2020
Plans to offer after 2020 No plans to offer N/A
Connectivity Options. The majority of banks offer a degree of SWIFT connectivity to clients, which was the most common connectivity offering. In addition, over half of banks also offered direct (H2H) connectivity to clients, while the other third used a third party for H2H connectivity. Use of EBICS was much less widespread, with approximately one-quarter of banks offering it as an option.
2. CURRENT BANK PAYMENTS ENVIRONMENT1 3 4 5

2016 Global Payments Survey Report Copyright © 2016 Strategic Treasurer, LLC 22
What do you think your clients’ top development priorities are? (Select all that apply)
65%
51%
19%
54%
11%
0% 10% 20% 30% 40% 50% 60% 70%
In country faster payments (Same Day ACH[US], Faster Payments [UK])
Cross-border faster payments (GPII)
Blockchain for payments
APIs for payment management and/orapproval
Other
Client Development Priorities. Nearly two-thirds of banks saw in-country faster payments, such as Same Day ACH in the U.S. and Faster Payments in the U.K., as top priorities for their clients. Over half of respondents also saw cross-border payments initiatives such as SWIFT GPII and Application Programming Interfaces (APIs) for payment management and approval as top client priorities.
Regarding our potential use of Application Programming Interface (API) technology for client use, our development
plans for the following are:
0% 10% 20% 30% 40% 50% 60%
Information. Balance reporting
Information. Transaction viewing
Transaction. Payment approval
Transaction. Payment initiation
Transaction. Exception management
BAM. Bank signer inquiry
BAM. Bank services inquiry (what servicesdo we have)
BAM. Bank service cost
BAM. Status of open request(s)
Currently under development Planned by 2017
Planned for after 2017 No plans
N/A
API Development Plans. This question looked to capture the development plans for banks with regards to their use of Application Programming Interface (API) technology. Overall, the area of highest potential use as indicated by banks was for information reporting and transaction viewing, with payment approval and initiation following closely behind.
2. CURRENT BANK PAYMENTS ENVIRONMENT1 3 4 5

2016 Global Payments Survey Report Copyright © 2016 Strategic Treasurer, LLC 23
Who is asking about the use of API for inquiries or self-service functionality? (Select all that apply)
27%
16%
38%
24%
14%
22%
0%
0% 5% 10% 15% 20% 25% 30% 35% 40%
Some corporate clients
Many corporate clients
Technology system vendors (TMS,Payment Hubs)
Technology vendors (ISV)
Consulting firms
No one
Other
API Interest. Many banks see the highest level of interest in API coming from financial technology providers, such as TMS or Payment Hub vendors. Slightly less than half of banks also see interest stemming from corporate clients. Just over one-fifth have not seen any elevated interest in API at all.
2. CURRENT BANK PAYMENTS ENVIRONMENT1 3 4 5

2016 Global Payments Survey Report Copyright © 2016 Strategic Treasurer, LLC 24
How large is your global Treasury organization, including analysts?
What is your role?
3. CURRENT CORPORATE PAYMENTS ENVIRONMENT2 4 51
30%
24%
19%
16%
11%
0% 5% 10% 15% 20% 25% 30% 35%
3 or fewer
4-6
7-10
11-25
> 25
4%
18%
17%
26%
13%
3%
20%
0% 5% 10% 15% 20% 25% 30%
CFO
Treasurer
Assistant Treasurer, Head of TreasuryOperations
Treasury Manager, Cash Manager
Treasury Analyst
Controller
Other (Specify)
Treasury Size. The data captured through this question showed that most respondents had smaller treasury teams, with nearly one-third having a treasury department comprised of three or less individuals. In total, over half of treasury departments were comprised of less than six members.
Respondent’s Role. The corporate respondents to this survey held a range of positions within their organization, the most prominent being treasury and cash managers. Also, over one-third were either the Treasurer or Assistant Treasurer/Head of Treasury in their organization.

2016 Global Payments Survey Report Copyright © 2016 Strategic Treasurer, LLC 25
How many banks do you originate payments with? How many currencies do you regularly make payments in?
12%
9%
34%
18%
8%
4%
5%
11%
0% 5% 10% 15% 20% 25% 30% 35% 40%
1
2
3-5
6-10
11-15
16-20
21-30
31+
13%
8%
29%
22%
8%
4%
4%
13%
0% 5% 10% 15% 20% 25% 30% 35%
1
2
3-5
6-10
11-15
16-20
21-30
>30
Payment Origination - Banks. Over half of corporates used between 3-10 main banks for originating payments. 21% of organizations used less than three banks, and 28% used more than ten.
Payment Currencies. The breakout for this question was almost identical to the previous question’s spread, with over half of corporates regularly using between 3-10 currencies for making payments, one-fifth using less than three currencies, and one-third using more than ten.
3. CURRENT CORPORATE PAYMENTS ENVIRONMENT2 4 51

2016 Global Payments Survey Report Copyright © 2016 Strategic Treasurer, LLC 26
Do you have problems with making payments in certain countries?
What is the approximate volume of payments you generate globally per month (check, ACH, wire, etc.)?
23%
77%
0% 10% 20% 30% 40% 50% 60% 70% 80% 90%
Yes
No
11%
12%
28%
15%
11%
10%
14%
0% 5% 10% 15% 20% 25% 30%
1-100
100-1,000
1,000-10,000
10,000-100,000
100,000-1,000,000
1,000,000-10,000,000
>10,000,000
Regional Payment Problems. One-quarter of respondents indicated they experienced problems making payments in certain countries. Overall, the majority of countries that posed problems were located in Africa (Sudan, Libya, etc.) and the Middle East (Syria, Iraq, etc.).
Monthly Payment Volume. 23% of organizations were generating less than 1,000 payments per month, 43% were generating between 1,000-100,000, and 35% were generating more than 100,000.
3. CURRENT CORPORATE PAYMENTS ENVIRONMENT2 4 51

2016 Global Payments Survey Report Copyright © 2016 Strategic Treasurer, LLC 27
Drivers – Rate the following payment initiative drivers on a scale from (1) most important to (8) least important.
46%
13%6% 9% 8% 11%
5% 4%
11%
34%
16% 9% 8% 5%9% 9%
8%
12%
32%
13%9%
5% 5%16%
9%12%
11%
11%19%
6% 7%
25%
6% 7%13%
21% 20%
8% 8%
18%
7% 7%11%
18% 18%
11% 13%
16%
4%9%
8%
14% 11%
19%
31%
5%11%
6% 3% 6% 8%
37%
23%
8%
0%
20%
40%
60%
80%
100%
120%
Most Important 2 3 4 5 6 7 Least Important
Corporate Payment Drivers. This question sought to determine the order of importance for corporates across a range of areas, such as achieving visibility and protecting against fraud, all with regards to their payment initiatives. The responses clearly indicated that protection against fraud was the top priority for the majority of corporates, with payment efficiency the 2nd highest priority, cost effectiveness 3rd, and achieving visibility 4th. The areas of lesser importance to organizations were the scalability of payment processes, and vendor/supplier management.
3. CURRENT CORPORATE PAYMENTS ENVIRONMENT2 4 51

2016 Global Payments Survey Report Copyright © 2016 Strategic Treasurer, LLC 28
How could a payment provider’s adoption or lack of adoption of new faster payment initiatives (such as Same Day ACH, Faster Payments,
GPII, Blockchain, etc.) influence your behavior towards them?
What is your company’s general technology adoption position (compared to other companies)?
2%
60%
20%
9%
9%
0% 10% 20% 30% 40% 50% 60% 70%
Other (Please Specify)
We will stay with our main or leadingbanks on services to support our credit
unless absolutely necessary
More likely to move some or all paymentsbusiness to a payment leader.
More likely to stay with a payment leader.
More likely to move from a provider wholags in the payments space.
3%
11%
22%
46%
18%
0% 10% 20% 30% 40% 50%
Bleeding edge (First 1-3% to adopt)
Early Adopters (we are among the first 4-10% to adopt)
Fast followers (we are among the first 11-30% to adopt)
Middle of the pack (we are among the first31-80% to adopt)
Late adopters (we are among the last 20%to adopt)
Payment Provider Initiative Adoption. This question saw a sizable minority (38%) of corporates willing to seek out leaders in the payment space, even if it meant switching their services to another provider. On the other hand, 60% of respondents indicated they would stay with their main banks to support credit, and would only leave if it were absolutely necessary.
Company Technology Adoption Position. Interestingly, the responses captured through this question were nearly in line with the ranges provided through each choice. For instance, 3% of corporates viewed themselves among the first 3% to adopt new technology, 11% in the first 4-10%, 22% viewed themselves among the first 11-30%, 46% viewed themselves in the middle 31-80%, and 18% viewed themselves as part of the last 20%. This is in stark contrast to the responses captured from banks, where over a quarter of respondents believed they were within the first 4-10% to adopt new technology.
3. CURRENT CORPORATE PAYMENTS ENVIRONMENT2 4 51

2016 Global Payments Survey Report Copyright © 2016 Strategic Treasurer, LLC 29
XML – Our status for using XML (ISO 20022) for payments and information reporting is as follows:
31%
23%
9%
2%
16%
2%
16%
31%
20%
6%
3%
16%
2%
20%
23%
19%
9%
2%
21%
4%
22%
0% 5% 10% 15% 20% 25% 30% 35%
Currently use
Don’t use, plan to use within 2 years
Don’t use but plan to use in 2-3 years
Don’t use but plan to use after 3 years
Don’t use and no current plans to use
Don’t use and have decided NOT to use
N/A
XML (Information Reporting – camt) XML Payments -pain XML Direct Debits
Value Drivers – Where do you see the value in making changes to payment methods and formats? (Select all that apply)
79%
62%
59%
67%
54%
38%
44%
28%
24%
13%
21%
0% 10% 20% 30% 40% 50% 60% 70% 80% 90%
Efficiency. Reducing internal costs.
Efficiency. Reducing errors.
Efficiency. Reducing external costs.
Control. Reduce Fraud.
Visibility. To cash balances.
Visibility. Exception management.
Flexibility. Supporting additional paymenttypes.
Flexibility. Supporting more informationsuch as end-to-end ID
Flexibility. Supporting additional banks.
Flexiblity. Supporting non-latin characters(such as standard Chinese).
Share of Wallet. Properly allocatingrevenue amount partners.
XML Message Use. Over half of corporates currently use or plan to use XML ISO 20022 messages for both information reporting (camt formats) and payments (pain formats) within the next 2 years. A slightly smaller number are using or plan to use XML Direct Debits.
Payment Format Value Drivers. Overall, the biggest drivers behind corporate adoption of new payment methods and formats were to improve efficiency through lower costs and the reduction of error-prone processes. Another large payments driver for respondents was to increase control and reduce fraud.
3. CURRENT CORPORATE PAYMENTS ENVIRONMENT2 4 51

2016 Global Payments Survey Report Copyright © 2016 Strategic Treasurer, LLC 30
What are your top payment priorities from this list? (Select all that apply)
55%
50%
11%
25%
7%
0% 10% 20% 30% 40% 50% 60%
In country faster payments (Same Day ACH(US), Faster Payments (UK))
Cross-border faster payments (GPII fromSWIFT)
Blockchain for payments
APIs for payment management and/orapproval
Other (Please Specify)
Top Payments Priorities. Regarding top payment priorities for corporates, both in-country and cross-border faster payments initiatives, including Same Day ACH, U.K. Faster Payments and SWIFT GPII, were top payment priorities for at least half of respondents. Other payment initiatives, such as the use of APIs and Blockchain, were much lower on the list.
Systems and Processing Used – We use the following systems or structures for payment generation or management:
(Select all that apply)
14%
14%
22%
23%
28%
15%
14%
48%
7%
0% 10% 20% 30% 40% 50% 60%
Payment hub (handles payment messageformatting through delivery for all
departments)
Payment hub (cloud or 3rd party managedtechnology)
Payment factory (handles all paymentsteps for all departments)
Payment Center (handles all non-treasurypayment steps)
SWIFT
SWIFT Service Bureau (only connects toSWIFT)
Treasury Aggregator (connectivity toSWIFT, H2H and other networks)
TMS/ERP
Other (Please Specify)
Payment Systems Used. 48% of corporates were using either a TMS or ERP for payment generation/management, which were by far the most frequently used payment systems among respondents. Additionally, SWIFT services were being utilized by over one-quarter of respondents. Payment Factories and Payment Centers were each being used by just over one-fifth of respondents, and Payment Hubs, along with Treasury Aggregators, were used by only 14%.
3. CURRENT CORPORATE PAYMENTS ENVIRONMENT2 4 51

2016 Global Payments Survey Report Copyright © 2016 Strategic Treasurer, LLC 31
Internal Systems – We use the following systems to generate payments electronically: (Select all that apply)
Mix of Payments – What type of payments do you make? (Select all that apply)
46%
18%
63%
58%
14%
17%
7%
0% 10% 20% 30% 40% 50% 60% 70%
Treasury ManagementSytems/TMS/TWS/TRMS
Home-grown or bespoke TMS
AP
Payroll
Claims
Benefits
Other (Please Specify)
85%
77%
44%
79%
46%
32%
25%
44%
77%
1%
0% 10% 20% 30% 40% 50% 60% 70% 80% 90%
Accounts Payable – Supply Vendors
Accounts Payable – Non-Supply Vendors
Consumers/Individuals
Payroll
Benefits (other than pension)
Pension
Awards/Promotions
Direct Debits / e-Bills
Treasury Payments / IntercompanyPayments
Other
Internal Payment Systems. Among the various internal systems used by corporates, AP and Payroll were used most frequently for the electronic generation of payments. In addition, nearly half (46%) of corporates were using a Treasury Management System to electronically generate payments.
Types of Payments. There were four specific types of payments that were made by over three-quarters of respondents; Accounts payable to both supply and non-supply vendors, payroll, and treasury/intercompany payments. These four types of payments were by far the most widely used. Each other category listed was used by less than half of respondents.
3. CURRENT CORPORATE PAYMENTS ENVIRONMENT2 4 51

2016 Global Payments Survey Report Copyright © 2016 Strategic Treasurer, LLC 32
Connectivity – What type of connectivity options do you have or hope to have? (Select all that apply)
54%
9%
6%
17%
39%
75%
1%
0% 10% 20% 30% 40% 50% 60% 70% 80%
SWIFT
EBICS
Zengin
Treasury Aggregator
Host to Host (H2H)
Bank Portals
Other
Connectivity Options. This question was asked to determine the preferences of corporates regarding the various bank connectivity options available on the market. Overall, three-quarters of respondents indicated high use of individual bank portals, which was by far the most commonly used method. Use of SWIFT was also high, with over half of organizations having connectivity to the network. Direct (H2H) connections were used by almost two-fifths of respondents. Other networks, such as Zengin and EBICS, were used by less than one-tenth of respondents, and Treasury Aggregators were used by 17%.
3. CURRENT CORPORATE PAYMENTS ENVIRONMENT2 4 51

2016 Global Payments Survey Report Copyright © 2016 Strategic Treasurer, LLC 33
Why do you have or hope to have the following connectivity options?
33%
8%
6%
14%
20%
44%
38%
7%
4%
12%
28%
46%
20%
6%
4%
12%
16%
20%
11%
3%
3%
4%
7%
31%
19%
4%
2%
10%
7%
34%
35%
81%
85%
69%
52%
10%
0% 10% 20% 30% 40% 50% 60% 70% 80% 90%
SWIFT
EBICS
Zengin
Treasury Aggregator
Host to Host (H2H)
Bank Portals
Cost / Savings Security or Control
Scalability Backup, Disaster Recovery
Coverage (full visibility) I don't have or hope to have this option
Connectivity Options. After confirming the connectivity preferences of corporates, we wanted to determine why they were using each specific network or channel. For the channels in high use by corporates, such as SWIFT and individual bank portals, cost savings and security were the two highest priorities for respondents. Security was also the top priority for those using H2H connections. However, for organizations utilizing the capabilities of a Treasury Aggregator, scalability was just as high of a priority as cost savings and security. For networks such as EBICS and Zengin, the large majority of respondents had no plans for their use.
3. CURRENT CORPORATE PAYMENTS ENVIRONMENT2 4 51

2016 Global Payments Survey Report Copyright © 2016 Strategic Treasurer, LLC 34
Centralization of Payment Structures – What type of structure do you currently have for payments?
19%
44%
28%
7%
2%
0% 10% 20% 30% 40% 50%
Decentralized teams and disbursements byentity
Centralized team with disbursements byentity
Centralized team with payment on behalfof structure
Decentralized teams with payment onbehalf of structure
Other (Please Specify)
Payment Centralization. The large majority (72%) of corporate respondents had a centralized payment structure, either with disbursements by entity (44%) or with a payment on behalf of (POBO) structure (28%). Approximately one-quarter of respondents were using a decentralized structure.
Centralization of Payment Structures CHANGES – If you plan to change your payment structure in the next two years, what do
you think it will move to?
54%
15%
2%
11%
15%
2%
1%
0% 10% 20% 30% 40% 50% 60%
No plans to make changes in the next twoyears
At this time, we can NOT give a good guessas to what model we would move to.
Decentralized teams and disbursements byentity
Centralized team with disbursements byentity
Centralized team with payment on behalfof structure
Decentralized teams with payment onbehalf of structure
Other (Please Specify)
Payment Structure Changes. This question sought to determine the trends that are occurring among corporates regarding changes to their payment structures. Of those planning to change their structure, over one-quarter plan to move towards a centralized structure. A very small (4%) plan to move towards a decentralized structure, and 15% were unsure as to what their direction was. Overall, there is a clear movement towards the adoption of centralized payment structures within the corporate realm.
3. CURRENT CORPORATE PAYMENTS ENVIRONMENT2 4 51

2016 Global Payments Survey Report Copyright © 2016 Strategic Treasurer, LLC 35
Tools In Use – What tools are you using for generating or managing payments? (Select all that apply)
85%
31%
14%
36%
64%
9%
14%
8%
12%
40%
4%
1%
0% 10% 20% 30% 40% 50% 60% 70% 80% 90%
Bank portals or tools
In-house developed systems
Specialized payment software (i.e.payment hub)
Treasury Management System (TMS)
ERP/Accounting Platform for AccountsPayable
Independent payment providers
Dedicated AP system
Claims system
Employee benefits system
Payroll system (internally hosted ormanaged)
Retiree benefits
Other
Payment Tool Usage. Currently, the two payment systems/tools most frequently in use by corporates looks to be bank portals (85%) and ERP accounting platforms (64%). Internal payroll systems were used by 40% of respondents, and TMSs and in-house systems were each used by roughly one-third of respondents.
3. CURRENT CORPORATE PAYMENTS ENVIRONMENT2 4 51

2016 Global Payments Survey Report Copyright © 2016 Strategic Treasurer, LLC 36
Spending – Our spending plans for payments in the next year are:
For our higher spend on payments, we intend to focus it on the following: (Select all that apply)
6%
20%
59%
7%
1%
7%
0% 10% 20% 30% 40% 50% 60% 70%
Significantly higher than last year
Higher than last year
About the same as last year
Lower than last year
Significantly lower than last year
We have no spending plans for payments
24%
24%
26%
33%
24%
21%
12%
19%
5%
0% 5% 10% 15% 20% 25% 30% 35%
Payment Hub
Payment Factory
TMS Payments
Enhancements to our ERP
Compliance activities (besides sanctionfiltering)
Payment Security
Sanction Filtering
More rapid payments (faster, same-dayACH, GPII)
Other
Planned Payment Spend. Over half of corporates are not planning any change in their spend on payments over the course of the next year. For those whose spend plans have changed, 26% plan to spend more or significantly more, while 8% plan to spend less. Overall, intent to spend more on payments is 3x higher than intent to spend less.
Increased Payment Spend. For those organizations planning to spend more or significantly more in the area of payments over the next year, approximately one-third will look to enhance the payment capabilities of their ERP. Payment Hubs, Payment Factories, TMS Payments, and compliance activities are the area of focus for approximately 25% of respondents, and payment security and faster payments for roughly 20%.
3. CURRENT CORPORATE PAYMENTS ENVIRONMENT2 4 51

2016 Global Payments Survey Report Copyright © 2016 Strategic Treasurer, LLC 37
Security – How important are these payment security measures?
0% 10% 20% 30% 40% 50% 60%
Payment Hub
Out of band confirmation
Full automation of the payment processes
Perimeter Security
Internal Monitoring
Single sign-on (SAML 2.0)
Highly Important or Required Now
Important Now
Will be important to us within 2 years
Will be important to us within 5 years
Not expected to be important to us within 5 years
Not expected to be important to us after 5 years
Not Applicable or Unknown
Payment Security Measures. For this question, respondents were asked to rate the importance of various security measures and practices that pertained to their payment processes. Currently, internal monitoring (71%), automation of payment processes (59%), and perimeter security (53%) were deemed as the areas with the highest level of importance.
3. CURRENT CORPORATE PAYMENTS ENVIRONMENT2 4 51

2016 Global Payments Survey Report Copyright © 2016 Strategic Treasurer, LLC 38
Development Priority – What would you like to be the top development priorities for payments at your banks?
(Select all that apply)
Regarding our potential use of Application Programming Interface (API) technology, our top priority for use would be?
56%
20%
43%
11%
17%
17%
9%
0% 10% 20% 30% 40% 50% 60%
In country faster payments (Same Day ACH(US), Faster Payments (UK), NPP
(Australia), etc.)
European faster payments (EBA)
Cross-border faster payments SWIFT (GPII)
Blockchain for payments
APIs for payment management and/orapproval
Direct Debits/e-Bills
Other
11%
14%
29%
18%
4%
4%
4%
7%
11%
0%
0%
0% 5% 10% 15% 20% 25% 30%
Information. Balance reporting
Information. Transaction viewing
Transaction. Payment approval
Transaction. Payment initiation
Transaction. Direct debit initiation
Transaction. Exception management
BAM. Bank signer inquiry
BAM. Bank services inquiry (what servicesdo we have)
BAM. Bank service cost
BAM. Status of open request(s)
Other (Please Specify)
Development Priority. This question asked corporates to indicate the areas in which they would want their banks to develop with regards to payments. 56% of respondents indicated that in-country faster payments (Same Day ACH, Faster Payments U.K., etc.) should be a top priority for banks, and under half (43%) listed cross-border payment initiatives such as SWIFT GPII as a priority. Other categories, such as blockchain, APIs and direct debits, received less interest.
Use of API Technology. Regarding the potential use of API technology, corporate respondents saw the areas of payment initiation (18%) and approval (29%) for transactions as the top priorities. Information balance reporting and transaction viewing were collectively a priority for one-quarter of respondents. For Bank Account Management, the area of bank service costs was a priority for 11% of respondents.
3. CURRENT CORPORATE PAYMENTS ENVIRONMENT2 4 51
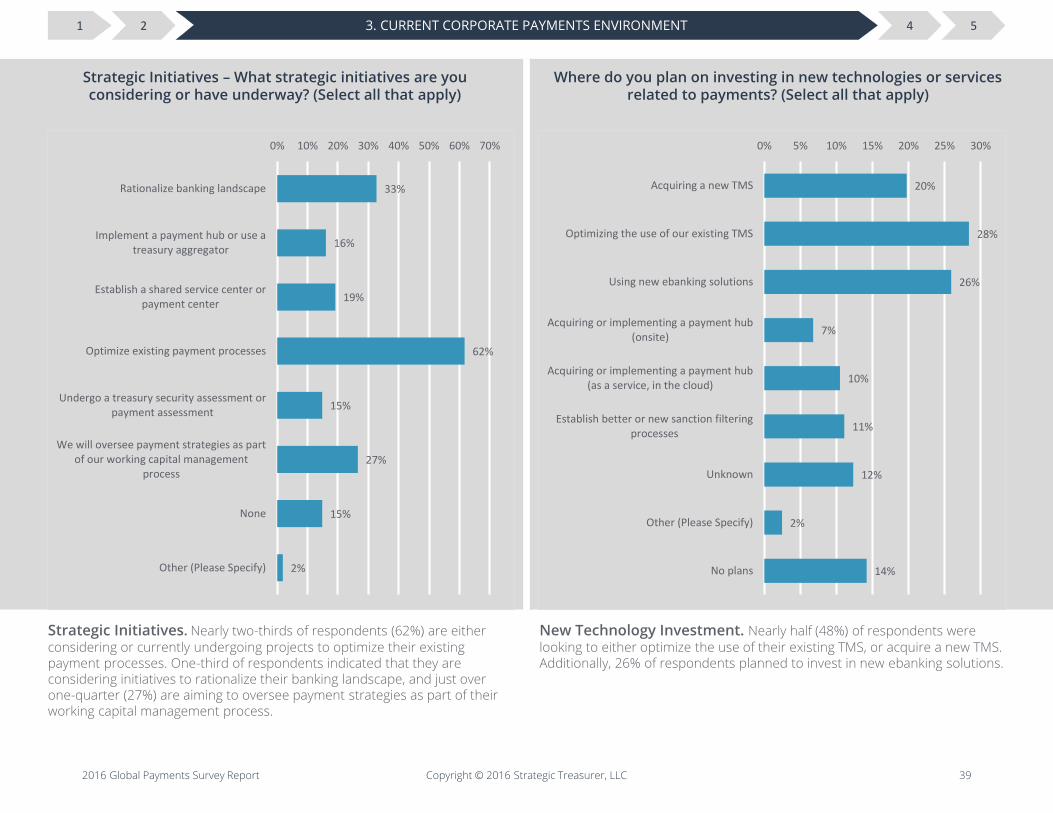
2016 Global Payments Survey Report Copyright © 2016 Strategic Treasurer, LLC 39
Strategic Initiatives – What strategic initiatives are you considering or have underway? (Select all that apply)
Where do you plan on investing in new technologies or services related to payments? (Select all that apply)
33%
16%
19%
62%
15%
27%
15%
2%
0% 10% 20% 30% 40% 50% 60% 70%
Rationalize banking landscape
Implement a payment hub or use atreasury aggregator
Establish a shared service center orpayment center
Optimize existing payment processes
Undergo a treasury security assessment orpayment assessment
We will oversee payment strategies as partof our working capital management
process
None
Other (Please Specify)
20%
28%
26%
7%
10%
11%
12%
2%
14%
0% 5% 10% 15% 20% 25% 30%
Acquiring a new TMS
Optimizing the use of our existing TMS
Using new ebanking solutions
Acquiring or implementing a payment hub(onsite)
Acquiring or implementing a payment hub(as a service, in the cloud)
Establish better or new sanction filteringprocesses
Unknown
Other (Please Specify)
No plans
Strategic Initiatives. Nearly two-thirds of respondents (62%) are either considering or currently undergoing projects to optimize their existing payment processes. One-third of respondents indicated that they are considering initiatives to rationalize their banking landscape, and just over one-quarter (27%) are aiming to oversee payment strategies as part of their working capital management process.
New Technology Investment. Nearly half (48%) of respondents were looking to either optimize the use of their existing TMS, or acquire a new TMS. Additionally, 26% of respondents planned to invest in new ebanking solutions.
3. CURRENT CORPORATE PAYMENTS ENVIRONMENT2 4 51

2016 Global Payments Survey Report Copyright © 2016 Strategic Treasurer, LLC 40
Security/Sanction Filtering – Regarding Sanction Filtering, we: Sanction Management – We seek the following sanction management services: (Select all that apply)
60%
10%
26%
4%
0% 10% 20% 30% 40% 50% 60% 70%
Do NOT use any sanction filtering servicesand have no plans to use it within 2 years
Do NOT use any sanction filtering servicescurrently but have plans to use it within 2
years
Use sanction filtering services as part ofour disbursement activity
Sanction filtering services are offered toareas or departments that make payments
as an option
48%
25%
23%
25%
22%
26%
8%
25%
2%
0% 10% 20% 30% 40% 50% 60%
The provider will have the ability to reviewpayees and notify us of issues before the
payment is sent on
They provide support and assistance inresolving false positives (one-time)
They help manage false positives forfuture payments (after the first time)
They have the ability to select whichsanction lists are applied
Provide data sets to us so we can performour own sanction filtering
They offer a portal for self-service tovalidate sanctioned parties
Support non-latin characters such assimple Chinese
We are not seeking any other sanctionmanagement services
Other (Please Specify)
Security & Sanction Filtering. Interestingly, almost two-thirds of corporate respondents are not using nor have any plans to use sanction filtering services. Given the rise of regulations regarding this area of the payments process and an increase in the number of penalties administered by governing bodies like OFAC, the high percentage of corporates not using any filtering services is surprising.
Sanction Management. The area highest on the list of priorities for respondents (48%) regarding sanction management was the ability for their sanction screening provider to review payees and notify them of issues before delivering the payment instructions. The majority of additional screening services listed, such as the ability to customize sanctions lists and the management of false positives, were sought after by approximately one-quarter of respondents.
3. CURRENT CORPORATE PAYMENTS ENVIRONMENT2 4 51

2016 Global Payments Survey Report Copyright © 2016 Strategic Treasurer, LLC 41
Which faster/rapid payments initiatives are you aware of? (Select all that apply)
3%
57%
84%
43%
27%
70%
0% 10% 20% 30% 40% 50% 60% 70% 80% 90%
None
UK. Faster Payment Services (FPS)
US. Same-Day ACH
Europe. EBA European faster payments(EBA)
Australian (NPP)
Cross Border (SWIFT GPII)
Payment Initiative Awareness. The intent of this question was to gauge awareness of various payment initiatives within the banking industry at large. As the majority of respondents were from North America, it is not surprising that 84% of respondents were aware of Same-Day ACH in the U.S. Banks were also highly aware of SWIFT GPII (70%), and the U.K’s Faster Payments Services was on the radar of 57% of respondents. On the lower end of the spectrum, less than half (43%) of respondents were aware of European Faster Payments (EBA), and only one-quarter were aware of Australia’s New Payments Platform (NPP).
What are your overall views/perspectives on various faster payments initiatives?
49%
11%
14%
8%
14%
5%
0% 10% 20% 30% 40% 50% 60%
There are significant opportunities for ourbank to offer more services
This represents a challenge to our pricingmodel
We are concerned about keeping ourtechnology up to date to handle all of
these changes
The potential for increased fraud is a topconcern
Not keeping current will threaten ourpayments business
Other
Faster Payments Outlook. Roughly half of banks are looking at the introduction of new payment initiatives to the payments landscape as significant opportunities to expand the scope of services that they offer. On the other hand, approximately half of respondents also indicated that the introduction of new initiatives either presents a threat/challenge to their payments business, increases the potential for fraud, or makes it difficult to maintain updated technology due to the number of new developments.
4. NEW PAYMENT INITIATIVES OUTLOOK: BANKS2 3 51

2016 Global Payments Survey Report Copyright © 2016 Strategic Treasurer, LLC 42
Awareness – What is your level of awareness of blockchain and its applicability to payment security?
Attitude – What is your attitude about using blockchain as another rail for payments or value-transfer?
14%
11%
51%
19%
5%
0% 10% 20% 30% 40% 50% 60%
Not aware
Little knowledge but I don’t understand the distinction between Blockchain and
Bitcoin.
Basic understanding of how Blockchainworks.
Strong understanding of how Blockchainworks and discussions around applicability
Expert level understanding of Blockchainand current on ideas about use for
payments.
13%
47%
28%
6%
0%
6%
0% 10% 20% 30% 40% 50%
Strongly in favor, strongly open to the idea
In favor, open to the idea
Unsure, haven’t considered it
Opposed, generally against the idea
Strongly opposed, strongly against the idea
Not applicable. We don't see how this willbe applicable to us in the foreseeable
future.
Blockchain Awareness. The majority of bank respondents (51%) had a basic understanding of how blockchain works. The other 50% of respondents were evenly distributed between having a strong/expert knowledge and little/no knowledge.
Blockchain Attitude. With regards to the use of blockchain as another rail for payments, almost two-thirds of banks were either in favor or strongly in favor. Just over one-quarter were unsure, while a small number (12%) were either opposed or did not see how blockchain was applicable to them.
4. NEW PAYMENT INITIATIVES OUTLOOK: BANKS2 3 51

2016 Global Payments Survey Report Copyright © 2016 Strategic Treasurer, LLC 43
Plans – What are your plans regarding blockchain as a payments enabler?
20%
43%
27%
7%
3%
0%
0% 10% 20% 30% 40% 50%
No plans at all.
Paying attention to what is going on.Ready to respond or act if appropriate.
Paying close attention and working onplans to use the technology in a pilot or
test environment.
Actively in the process of testing
We are using or offering Blockchain andplan to expand our use.
Other
Blockchain Plans. Regarding the potential use of blockchain as a payments enabler, 70% of banks are paying attention to developments, and 10% were either already using blockchain or were in the process of testing it. 20% had no plans to use blockchain at all.
4. NEW PAYMENT INITIATIVES OUTLOOK: BANKS2 3 51

2016 Global Payments Survey Report Copyright © 2016 Strategic Treasurer, LLC 44
4. NEW PAYMENT INITIATIVES OUTLOOK: BANKS2 3 51
Awareness – What is your level of awareness of Same Day ACH and its applicability to payment security?
Attitude – What is your attitude about using Same Day ACH as another rail for payments or value-transfer?
0%
3%
39%
39%
19%
0% 5% 10% 15% 20% 25% 30% 35% 40% 45%
Not aware.
I am familiar with the term but have littleunderstanding.
Basic understanding of how Same Day ACHworks.
Strong understanding of how Same DayACH works and discussions around
applicability.
Expert level understanding of Same DayACH and current on ideas about use for
payments.
48%
42%
6%
3%
0%
0%
0% 10% 20% 30% 40% 50% 60%
Strongly in favor, strongly open to the idea
In favor, open to the idea
Unsure, haven’t considered it
Opposed, generally against the idea
Strongly opposed, strongly against the idea
Not applicable. We don't see how this willbe applicable to us in the foreseeable
future
Same Day ACH Awareness. The majority of bank respondents (58%) had either a strong or expert level understanding of Same Day ACH and its applicability to payment security. 39% had a basic understanding, and a very small number (3%) had little understanding.
Same Day ACH Attitude. The vast majority of bank respondents (90%) were either in favor or strongly in favor of using Same day ACH as an additional rail for payments. Only 3% were opposed to the idea, and 6% had not yet considered its use.

2016 Global Payments Survey Report Copyright © 2016 Strategic Treasurer, LLC 45
Plans – What are your plans regarding Same Day ACH as a payments enabler?
6%
19%
23%
39%
13%
0% 5% 10% 15% 20% 25% 30% 35% 40% 45%
No plans at all.
Paying attention to what is going on.Ready to respond or act if appropriate.
Paying close attention and working onplans to use the technology in a pilot or
test environment.
Actively in the process of testing
We are using or offering Same Day ACHand plan to expand our use.
Same Day ACH Plans. Currently, nearly two-fifths (39%) of bank respondents are actively in the process of testing Same Day ACH capabilities, and 13% already offer it. An additional 42% are paying attention to its development, and a small number (6%) have no plans at all.
4. NEW PAYMENT INITIATIVES OUTLOOK: BANKS2 3 51

2016 Global Payments Survey Report Copyright © 2016 Strategic Treasurer, LLC 46
Attitude – What is your attitude about using Faster Payments as another rail for payments or value-transfer?
35%
50%
15%
0%
0%
0%
0% 10% 20% 30% 40% 50% 60%
Strongly in favor, strongly open to the idea
In favor, open to the idea
Unsure, haven’t considered it
Opposed, generally against the idea
Strongly opposed, strongly against the idea
Not applicable. We don’t see how this will be applicable to us in the foreseeable
future.
Faster Payments Attitude. The large majority of bank respondents (85%) were either in favor or strongly in favor of using Faster Payments as an additional offering. Only 15% were unsure, and not a single respondent was opposed.
Awareness – What is your level of awareness of Faster Payments and its applicability to payment security?
5%
19%
33%
33%
10%
0% 5% 10% 15% 20% 25% 30% 35%
Not aware
I am familiar with the term but have littleunderstanding
Basic understanding of how FasterPayments works
Strong understanding of how FasterPayments works and discussions around
applicability
Expert level understanding of FasterPayments and current on ideas about use
for payments
Faster Payments Awareness. Over half of bank respondents (52%) had basic or little understanding of Faster Payments U.K., with 5% being completely unaware of its development. 43% had either a strong or expert level understanding.
4. NEW PAYMENT INITIATIVES OUTLOOK: BANKS2 3 51

2016 Global Payments Survey Report Copyright © 2016 Strategic Treasurer, LLC 47
Plans – What are your plans regarding faster payments as a payments enabler?
20%
30%
15%
20%
15%
0% 5% 10% 15% 20% 25% 30% 35%
No plans at all.
Paying attention to what is going on.Ready to respond or act if appropriate.
Paying close attention and working onplans to use the technology in a pilot or
test environment.
Actively in the process of testing
We are using or offering Faster Paymentsand plan to expand our use.
Faster Payment Plans. Just over one-third of organizations are either actively testing their Faster Payments offering, or already offering it. 45% are continuing to pay attention to its development, and 20% have no plans regarding Faster Payments at all.
4. NEW PAYMENT INITIATIVES OUTLOOK: BANKS2 3 51

2016 Global Payments Survey Report Copyright © 2016 Strategic Treasurer, LLC 48
What is your attitude toward using European Faster Payments as another rail for payments or value-transfer?
33%
47%
13%
0%
0%
7%
0% 10% 20% 30% 40% 50%
Strongly in favor, strongly open to the idea
In favor, open to the idea
Unsure, haven’t considered it
Opposed, generally against the idea
Strongly opposed, strongly against the idea
N/A. We don't see how this will beapplicable to us in the foreseeable future.
EBA Attitude. Despite a drop in the level of understanding regarding EBA, the large majority of bank respondents (80%) were still open to and in favor of its use as another rail for payments. 13% were unsure, and 7% did not see the initiative as applicable to their business.
Awareness – What is your level of awareness of European Faster Payments (EBA) and its applicability to payment security?
6%
25%
44%
19%
6%
0% 10% 20% 30% 40% 50%
Not aware
I am familiar with the term but have littleunderstanding.
Basic understanding of how EuropeanFaster Payments works.
Strong understanding of how FasterPayments works and discussions around
applicability
Expert level understanding of FasterPayments and current on ideas about use
for payments.
EBA Awareness. Awareness of the European Faster Payments (EBA) initiative was lower than other initiatives, with only one-quarter of bank respondents having a strong or expert level understanding. Over two-thirds had basic or little understanding, and 6% were not aware of the initiative.
4. NEW PAYMENT INITIATIVES OUTLOOK: BANKS2 3 51

2016 Global Payments Survey Report Copyright © 2016 Strategic Treasurer, LLC 49
Plans – What are your plans regarding European Faster Payments as a payments enabler?
7%
36%
43%
7%
0%
7%
0% 5% 10% 15% 20% 25% 30% 35% 40% 45%
No plans at all.
Paying attention to what is going on.Ready to respond or act if appropriate.
Paying close attention and working onplans to use the technology in a pilot or
test environment.
Actively in the process of testing
We are using or offering Faster Paymentsand plan to expand our use.
Other
EBA Spend Plans. When compared to Same Day ACH and Faster Payments U.K., there is a much lower proportion of respondents (only 7%) actively testing EBA, and none of the respondents were currently offering it. Instead, the vast majority of organizations (79%) were paying attention to its development. 7% of respondents had no plans regarding EBA at all.
4. NEW PAYMENT INITIATIVES OUTLOOK: BANKS2 3 51

2016 Global Payments Survey Report Copyright © 2016 Strategic Treasurer, LLC 50
Attitude – What is your attitude toward using Australian New Payments Platform (NPP) as another rail for payments or value-
transfer?
13%
50%
0%
0%
0%
38%
0% 10% 20% 30% 40% 50% 60%
Strongly in favor, strongly open to the idea
In favor, open to the idea
Unsure, haven’t considered it
Opposed, generally against the idea
Strongly opposed, strongly against the idea
Not applicable. We don't see how this willbe applicable to us in the foreseeable
future.
NPP Attitude. Regarding respondents’ attitude towards NPP, a large portion (38%) did not see the initiative as applicable to their business. The remaining 63% of respondents were either in favor or strongly in favor of NPP. Not a single respondent was opposed.
Awareness – What is your level of awareness of Australian New Payments Platform (NPP) and its applicability to payments
security?
20%
10%
60%
10%
0%
0% 10% 20% 30% 40% 50% 60% 70%
Not aware
I am familiar with the term but have littleunderstanding.
Basic understanding of how AustralianNew Payments Platform (NPP) works.
Strong understanding of how AustralianNew Payments Platform (NPP) works and
discussions around applicability
Expert level understanding of AustralianNew Payments Platform (NPP) and current
on ideas about use for payments.
NPP Awareness. Regarding NPP, a large portion of respondents (70%) had basic or little understanding of the initiative, and 20% had no awareness. Furthermore, no respondents had an expert level understanding, and only 10% had a strong understanding. Seeing as the majority of respondents to the survey were headquartered in North America and Europe, this drop in awareness when compared to Same Day ACH and Faster Payments U.K. is not surprising.
4. NEW PAYMENT INITIATIVES OUTLOOK: BANKS2 3 51

2016 Global Payments Survey Report Copyright © 2016 Strategic Treasurer, LLC 51
Plans – What are your plans regarding Australian New Payments Platform (NPP) as a payments enabler?
0%
80%
0%
20%
0%
0% 10% 20% 30% 40% 50% 60% 70% 80% 90%
No plans at all.
Paying attention to what is going on.Ready to respond or act if appropriate.
Paying close attention and working onplans to use the technology in a pilot or
test environment.
Actively in the process of testing
We are using or offering Australian NewPayments Platform (NPP) and plan to
expand our use.
NPP Plans. Four-fifths of respondents indicated that they are paying attention to developments regarding NPP. The other 20% are currently in the process of testing its use for payments. At the time of the survey, there were no respondents actively offering NPP.
4. NEW PAYMENT INITIATIVES OUTLOOK: BANKS2 3 51

2016 Global Payments Survey Report Copyright © 2016 Strategic Treasurer, LLC 52
Attitude – What is your attitude about GPII as a way to improve cross-border payments?
18%
55%
27%
0%
0%
0%
0% 10% 20% 30% 40% 50% 60%
Strongly in favor, and participating in theinitiative.
In favor, monitoring progress andcommunication
Unsure, haven’t considered it
Opposed, generally against the idea at thistime
Strongly opposed, strongly against the idea
Not applicable. We don’t see how this will be applicable to us in the foreseeable
future.
GPII Attitude. Approximately three-quarters of respondents indicated that they were either in favor or strongly in favor of SWIFT GPII as a method of improving cross-border payments. The other one-quarter (27%) were unsure. Not a single respondent was opposed, and no respondents saw GPII as not being applicable to their business.
Awareness – What is your level of awareness of SWIFT’s Global Payments Innovation Initiative (GPII)?
15%
38%
31%
8%
8%
0% 5% 10% 15% 20% 25% 30% 35% 40% 45%
Not aware.
I am familiar with the term but have littleunderstanding.
Basic understanding of the goals andparticipating firms.
Strong understanding of GPII goals andapplicability to cross-border transactions.
Expert level understanding of the initiativeor participating member.
GPII Awareness. In total, 69% of bank respondents had either basic or little understanding of SWIFT GPII, and 15% were unaware of its development. 16% had a strong or expert level understanding.
4. NEW PAYMENT INITIATIVES OUTLOOK: BANKS2 3 51

2016 Global Payments Survey Report Copyright © 2016 Strategic Treasurer, LLC 53
Plans – What are your plans regarding GPII as a payments enabler?
9%
59%
14%
0%
18%
0% 10% 20% 30% 40% 50% 60% 70%
No plans at all.
Paying attention to what is going on.Ready to respond or act if appropriate.
Paying close attention and working onplans to use the technology in a pilot or
test environment
We plan to participate as soon as we can.
We are an active participant in thisinitiative.
GPII Plans. Almost one-fifth (18%) of respondents were already active participants in the SWIFT GPII initiative. 73% were monitoring the developments and paying attention to the activity around GPII, and just under 9% had no plans regarding GPII.
4. NEW PAYMENT INITIATIVES OUTLOOK: BANKS2 3 51

Global Payments Survey Report Copyright © 2016 Strategic Treasurer, LLC 54
5. NEW PAYMENT INITIATIVES OUTLOOK: CORPORATES2 3 41
What are your overall views/perspectives on various faster payments initiatives? (Select all that apply)
33%
27%
26%
16%
29%
12%
10%
23%
2%
0% 5% 10% 15% 20% 25% 30% 35%
It is a significant opportunity to bettersupport our businesses
This will lower our cost of transfers
They will help us better mobilize funds
We are concerned about keeping ourtechnology up to date to handle all of
these changes
The potential for increased fraud is a topconcern
Not keeping current could make usuncompetitive
This has been a long time coming
These initiatives are not really importantto us
Other (Please Specify)
Overall View on Initiatives. The overall views of corporate respondents regarding faster payment initiatives were positive, but contained pessimism in certain areas. On one hand, one-third (33%) of organizations saw the initiatives as an opportunity to better support their businesses, 27% believed they would lower the cost of transfers, and 26% saw them as a chance to better mobilize their funds. However, 29% had concerns related to the increased chance of fraud, 23% did not see the initiatives as important to them, and 16% were concerned about having to update their technology to accommodate new developments.
Which faster/rapid payments initiatives are you aware of? (Select all that apply)
29%
76%
31%
9%
39%
11%
0% 10% 20% 30% 40% 50% 60% 70% 80%
UK. Faster Payment Services (FPS)
US. Same-Day ACH
Europe. EBA European instant payments(EBA)
Australian (NPP)
Cross Border (SWIFT GPII)
None
Initiative Awareness. As a large portion of corporate respondents were from either North America or Europe, awareness of U.S. Same Day ACH as demonstrated through the survey was high. Various European initiatives, including SWIFT GPII, EBA, and FPS, were each recognized by roughly one-third of respondents. On the other hand, only 9% of respondents were aware of the Australian New Payments Platform (NPP), and 11% were not aware of any of the initiatives.

2016 Global Payments Survey Report Copyright © 2016 Strategic Treasurer, LLC 55
Awareness – What is your level of awareness of blockchain and its applicability to payment security?
Attitude – What is your attitude about using blockchain as another rail for payments or value-transfer?
42%
20%
29%
8%
1%
0% 5% 10% 15% 20% 25% 30% 35% 40% 45%
Not aware
Little knowledge but I don’t understand the distinction between blockchain and
Bitcoin.
Basic understanding of how blockchainworks.
Strong understanding of how blockchainworks and discussions around applicability
Expert level understanding of blockchainand current on ideas about use for
payments.
7%
24%
43%
13%
5%
7%
0% 5% 10% 15% 20% 25% 30% 35% 40% 45%
Strongly in favor, strongly open to the idea
In favor, open to the idea
Unsure, haven’t considered it
Opposed, generally against the idea
Strongly opposed, strongly against the idea
Not applicable. We don't see how this willbe applicable to us in the foreseeable
future.
Blockchain Awareness. The vast majority of corporate respondents were largely unaware of blockchain, with 42% having no awareness, 20% having little knowledge and 29% having a basic understanding. Less than one-tenth (9%) of respondents had a strong or expert level understanding of blockchain.
Blockchain Attitude. In contrast to the attitude expressed towards other payment developments and initiatives, a large percentage of corporates were either unsure or opposed to the idea of blockchain. In total, over two-fifths (43%) of respondents were unsure, and almost one-fifth (18%) were either opposed or strongly opposed. Less than one-third (31%) were in favor of blockchain.
5. NEW PAYMENT INITIATIVES OUTLOOK: CORPORATES2 3 41

2016 Global Payments Survey Report Copyright © 2016 Strategic Treasurer, LLC 56
Plans – What are your plans regarding blockchain as a payments enabler?
54%
32%
7%
5%
1%
1%
0% 10% 20% 30% 40% 50% 60%
No plans at all.
Paying attention to what is going on.Ready to respond or act if appropriate.
Paying close attention and working onplans to use the technology in a pilot or
test environment.
Actively in the process of testing
We are using or offering Blockchain andplan to expand our use.
Other
Blockchain Plans. The vast majority of corporates (54%) had no plans regarding the use of blockchain. Only 5% were in the process of testing it, and a mere 1% were already using it. 39% indicated that they were paying attention to developments regarding its use.
5. NEW PAYMENT INITIATIVES OUTLOOK: CORPORATES2 3 41

2016 Global Payments Survey Report Copyright © 2016 Strategic Treasurer, LLC 57
Attitude – What is your attitude about using Same Day ACH as another rail for payments or value-transfer?
22%
54%
13%
2%
1%
9%
0% 10% 20% 30% 40% 50% 60%
Strongly in favor, strongly open to the idea
In favor, open to the idea
Unsure, haven’t considered it
Opposed, generally against the idea
Strongly opposed, strongly against the idea
Not applicable. We don't see how this willbe applicable to us in the foreseeable
future.
Same Day ACH: Attitude. The overall attitude regarding the use of Same Day ACH among corporate respondents was positive, with 76% in favor or strongly in favor of the initiative. Only 3% of respondents were opposed to its use, and 13% were unsure. 9% of respondents did not believe it was applicable to their business.
Awareness – What is your level of awareness of Same Day ACH and its applicability to payment security?
5%
15%
41%
35%
4%
0% 5% 10% 15% 20% 25% 30% 35% 40% 45%
Not aware
I am familiar with the term but have littleunderstanding.
Basic understanding of how Same Day ACHworks.
Strong understanding of how Same DayACH works and discussions around
applicability.
Expert level understanding of Same DayACH and current on ideas about use for
payments
Same Day ACH Awareness. Overall, awareness of Same Day ACH and its applicability to payment security was high, with 39% of respondents having either a strong or expert level understanding, and 41% having a basic understanding. 20% of respondents either had little understanding or were completely unaware of Same Day ACH.
5. NEW PAYMENT INITIATIVES OUTLOOK: CORPORATES2 3 41

2016 Global Payments Survey Report Copyright © 2016 Strategic Treasurer, LLC 58
Plans – What are your plans regarding Same Day ACH as a payments enabler?
12%
64%
12%
7%
5%
0% 10% 20% 30% 40% 50% 60% 70%
No plans at all.
Paying attention to what is going on.Ready to respond or act if appropriate.
Paying close attention and working onplans to use the technology in a pilot or
test environment.
Actively in the process of testing
We are using or offering Same Day ACHand plan to expand our use.
Same Day ACH: Plans. 12% of corporate respondents were either already using or actively testing the use of Same Day ACH. In contrast, another 12% had no plans at all to begin using or testing Same Day ACH. In the middle of these two groups, the majority (76%) of respondents are continuing to pay attention to the development of the model.
5. NEW PAYMENT INITIATIVES OUTLOOK: CORPORATES2 3 41

2016 Global Payments Survey Report Copyright © 2016 Strategic Treasurer, LLC 59
Awareness – What is your level of awareness of Faster Payments and its applicability to payment security?
Attitude – What is your attitude about using Faster Payments as another rail for payments or value-transfer?
15%
21%
38%
26%
0%
0% 5% 10% 15% 20% 25% 30% 35% 40% 45%
Not aware
I am familiar with the term but have littleunderstanding.
Basic understanding of how FasterPayments works.
Strong understanding of how FasterPayments works and discussions around
applicability
Expert level understanding of FasterPayments and current on ideas about use
for payments.
23%
58%
15%
0%
0%
5%
0% 10% 20% 30% 40% 50% 60% 70%
Strongly in favor, strongly open to the idea
In favor, open to the idea
Unsure, haven’t considered it
Opposed, generally against the idea
Strongly opposed, strongly against the idea
Not applicable. We don’t see how this will be applicable to us in the foreseeable
future.
Faster Payments Awareness. Corporate respondents’ awareness of Faster Payments U.K. was overall skewed towards less understanding, with 38% having a basic understanding, 21% having little understanding, and 15% being completely unaware. Not a single respondent had an expert understanding of Faster Payments, and only 26% had a strong understanding.
Faster Payments Attitude. The general outlook regarding the use of Faster Payments by corporate respondents was positive, with 81% either in favor or strongly in favor of the initiative. 15% were unsure, and 5% did not see it as applicable to their business. Not a single respondent was opposed to the use of Faster Payments.
5. NEW PAYMENT INITIATIVES OUTLOOK: CORPORATES2 3 41

2016 Global Payments Survey Report Copyright © 2016 Strategic Treasurer, LLC 60
Plans – What are your plans regarding Faster Payments as a payments enabler?
24%
55%
13%
3%
5%
0% 10% 20% 30% 40% 50% 60%
No plans at all.
Paying attention to what is going on.Ready to respond or act if appropriate.
Paying close attention and working onplans to use the technology in a pilot or
test environment.
Actively in the process of testing
We are using or offering Faster Paymentsand plan to expand our use.
Faster Payments Plans. While there were no respondents opposed to the adoption of Faster Payments, there were only 8% either testing or currently using it as a payments enabler. On the other hand, 24% had no plans to being use of Faster Payments at all, and 68% indicated that they were paying attention to the initiative’s development.
5. NEW PAYMENT INITIATIVES OUTLOOK: CORPORATES2 3 41

2016 Global Payments Survey Report Copyright © 2016 Strategic Treasurer, LLC 61
Awareness – What is your level of awareness of European Faster Payments (EBA) and its applicability to payment security?
Attitude – What is your attitude about using EBA Payments as another rail for payments or value-transfer?
18%
33%
29%
20%
0%
0% 5% 10% 15% 20% 25% 30% 35%
Not aware
I am familiar with the term but have littleunderstanding.
Basic understanding of how EuropeanFaster Payments works.
Strong understanding of how EuropeanFaster Payments works and discussions
around applicability
Expert level understanding of EuropeanFaster Payments and current on ideas
about use for payments.
20%
58%
15%
0%
0%
8%
0% 10% 20% 30% 40% 50% 60% 70%
Strongly in favor, strongly open to the idea
In favor, open to the idea
Unsure, haven’t considered it
Opposed, generally against the idea
Strongly opposed, strongly against the idea
Not applicable. We don’t see how this will be applicable to us in the foreseeable
future
EBA Awareness. Similar to the level of awareness for Faster Payments U.K., there was an overall lack of awareness of European Faster Payments (EBA) among corporate respondents. Over half of respondents (51%) had either no awareness or little understanding of EBA, and 29% had only a basic understanding of the initiative. Only one-fifth of respondents had a strong understanding, and none with an expert level understanding.
EBA Attitude. While awareness of European Faster Payments was limited, respondents indicated a largely positive attitude towards its use as an additional rail for payments. In total, 78% of respondents were in favor or strongly in favor of its use, while 15% were unsure and 8% did not see it as applicable to their business. There were no respondents opposed to its use.
5. NEW PAYMENT INITIATIVES OUTLOOK: CORPORATES2 3 41

2016 Global Payments Survey Report Copyright © 2016 Strategic Treasurer, LLC 62
Plans – What are your plans regarding EBA Payments as a payments enabler?
19%
51%
19%
8%
3%
0%
0% 10% 20% 30% 40% 50% 60%
No plans at all.
Paying attention to what is going on.Ready to respond or act if appropriate.
Paying close attention and working onplans to use the technology in a pilot or
test environment.
Actively in the process of testing
We are using or offering Faster Paymentsand plan to expand our use.
Other
EBA Plans. In total, only 3% of respondents were currently using EBA, and only 8% were currently undergoing testing of the system. The majority (70%) are paying attention to developments, while 19% have no plans to adopt EBA at all.
5. NEW PAYMENT INITIATIVES OUTLOOK: CORPORATES2 3 41

2016 Global Payments Survey Report Copyright © 2016 Strategic Treasurer, LLC 63
Awareness – What is your level of awareness of Australian New Payments Platform (NPP) and its applicability to payment
security?
Attitude – What is your attitude about using Australian New Payments Platform (NPP) as another rail for payments or value-
transfer?
20%
7%
47%
27%
0%
0% 10% 20% 30% 40% 50%
Not aware
I am familiar with the term but have littleunderstanding.
Basic understanding of how AustralianNew Payments Platform (NPP) works.
Strong understanding of how AustralianNew Payments Platform (NPP) works and
discussions around applicability
Expert level understanding of AustralianNew Payments Platform (NPP) and current
on ideas about use for payments.
17%
42%
8%
8%
0%
25%
0% 5% 10% 15% 20% 25% 30% 35% 40% 45%
Strongly in favor, strongly open to the idea
In favor, open to the idea
Unsure, haven’t considered it
Opposed, generally against the idea
Strongly opposed, strongly against the idea
Not applicable. We don't see how this willbe applicable to us in the foreseeable
future.
NPP Awareness. One-fifth of corporate respondents had no awareness of the Australian New Payments Platform (NPP). 7% had little understanding, 47% had a basic understanding, and just over one-quarter of respondents (27%) had a strong understanding. Not a single corporate respondent had an expert level understanding of NPP.
NPP Attitude. When compared to its North American and European counterparts, the NPP initiative was listed as not applicable by a much larger number of corporate respondents (25%). Given that the majority of respondents to this survey were headquartered in North America and Europe, this is not surprising. Still, over half (59%) of respondents had a favorable outlook on the use of NPP, while only 8% were opposed. An additional 8% of respondents were unsure.
5. NEW PAYMENT INITIATIVES OUTLOOK: CORPORATES2 3 41

2016 Global Payments Survey Report Copyright © 2016 Strategic Treasurer, LLC 64
Plans – What are your plans regarding Australian New Payments Platform (NPP) as a payments enabler?
0%
44%
22%
22%
11%
0% 10% 20% 30% 40% 50%
No plans at all.
Paying attention to what is going on.Ready to respond or act if appropriate.
Paying close attention and working onplans to use the technology in a pilot or
test environment.
Actively in the process of testing
We are using or offering Australian NewPayments Platform (NPP) and plan to
expand our use.
NPP Plans. Surprisingly, one-third of respondents were either already using NPP or actively testing it for use, while the other two-thirds were paying attention to its continued development.
5. NEW PAYMENT INITIATIVES OUTLOOK: CORPORATES2 3 41

2016 Global Payments Survey Report Copyright © 2016 Strategic Treasurer, LLC 65
Attitude – What is your attitude about GPII as a way to improve cross-border payments?
9%
52%
31%
0%
0%
7%
0% 10% 20% 30% 40% 50% 60%
Strongly in favor, and participating in theinitiative.
In favor, monitoring progress andcommunication
Unsure, haven’t considered it
Opposed, generally against the idea at thistime
Strongly opposed, strongly against theidea
Not applicable. We don’t see how this will be applicable to us in the foreseeable
future.
GPII Attitude. Nearly two-thirds of respondents (61%) were either in favor or strongly in favor of using GPII as a way to improve cross-border payments. 31% were unsure, and 7% did not see the initiative as applicable to their business. There were no corporate respondents opposed to the use of GPII.
Awareness – What is your level of awareness of SWIFT’s Global Payments Innovation Initiative (GPII)?
13%
32%
44%
11%
0%
0% 10% 20% 30% 40% 50%
Not aware.
I am familiar with the term but have littleunderstanding.
Basic understanding of the goals andparticipating firms.
Strong understanding of GPII goals andapplicability to cross-border transactions.
Expert level understanding of the initiativeor participating member.
SWIFT GPII Awareness. 44% of respondents had a basic understanding of SWIFT GPII, with 45% either having no awareness or only little understanding of the initiative. 11% had a strong understanding, and no respondents considered themselves experts.
5. NEW PAYMENT INITIATIVES OUTLOOK: CORPORATES2 3 41

2016 Global Payments Survey Report Copyright © 2016 Strategic Treasurer, LLC 66
Plans – What are your plans regarding GPII as a payments enabler?
26%
54%
12%
6%
2%
0% 10% 20% 30% 40% 50% 60%
No plans at all.
Paying attention to what is going on.Ready to respond or act if appropriate.
Paying close attention and working onplans to use the technology in a pilot or
test environment
We plan to participate as soon as we can.
We are an active participant in thisinitiative.
GPII Plans. 8% of corporate respondents were either already active participants in the GPII initiative, or were planning to participate as soon as possible. The majority of respondents (66%) were paying attention to its development, and one-quarter (26%) had no plans concerning GPII.
5. NEW PAYMENT INITIATIVES OUTLOOK: CORPORATES2 3 41

Founded in 2004, Strategic Treasurer has helped hundreds of corporate clients face real-world treasury issues. Their senior consultants have practical, hands-on experience in corporate treasury environments and have held senior management and leadership roles across numerous industries. Strategic Treasurer consultants are known not only for their expertise in the treasury space, but also for their responsiveness to client issues and thorough follow-through on every project . The firm focus centers on maintaining true expertise in the treasury space, which is accomplished through a combination of annual industry surveys, a market discovery program, and insightful discussions with both corporate clients and treasury technology vendors . As a result, their awareness of the market is both global in scope and rich in detail .
Fides was originally founded in 1910 and has over a century of experience in providing financial services to clients. As part of the Credit Suisse Group, Fides is committed to the quality standards of a Swiss Bank . As a specialized Multibanking Service Provider with more than 60 employees, Fides provides clients with both flexibility and quick turnaround when developing their tailor-made solutions. With the goal of becoming the first-choice partner in multibanking and connectivity worldwide, Fides delivers an array of solutions designed with the intent of aiding international corporations and organizations in streamlining their banking and connectivity processes . Today, Fides offers account reporting services and electronic file transfer services to their more than 1,000 clients worldwide .
Consultants in Treasury
FIRM PROFILES
For more information on how to update or optimize your payment processes or for a full assessment, contact Strategic Treasurer or Fides Treasury Services .
525 Westpark Drive, Suite 130 Peachtree City, GA 30269
+1 678.466-2220
http://strategictreasurer.com
Badenerstrasse 141 8004 Zürich, Switzerland
+41 44 298 65 66
http://fides.ch