Embed Size (px)
Citation preview
Underlying sales growth, core operating margin, free cash flow, core earnings per share and constant core earnings per share are non-GAAP measures (see pages 5 to 9)
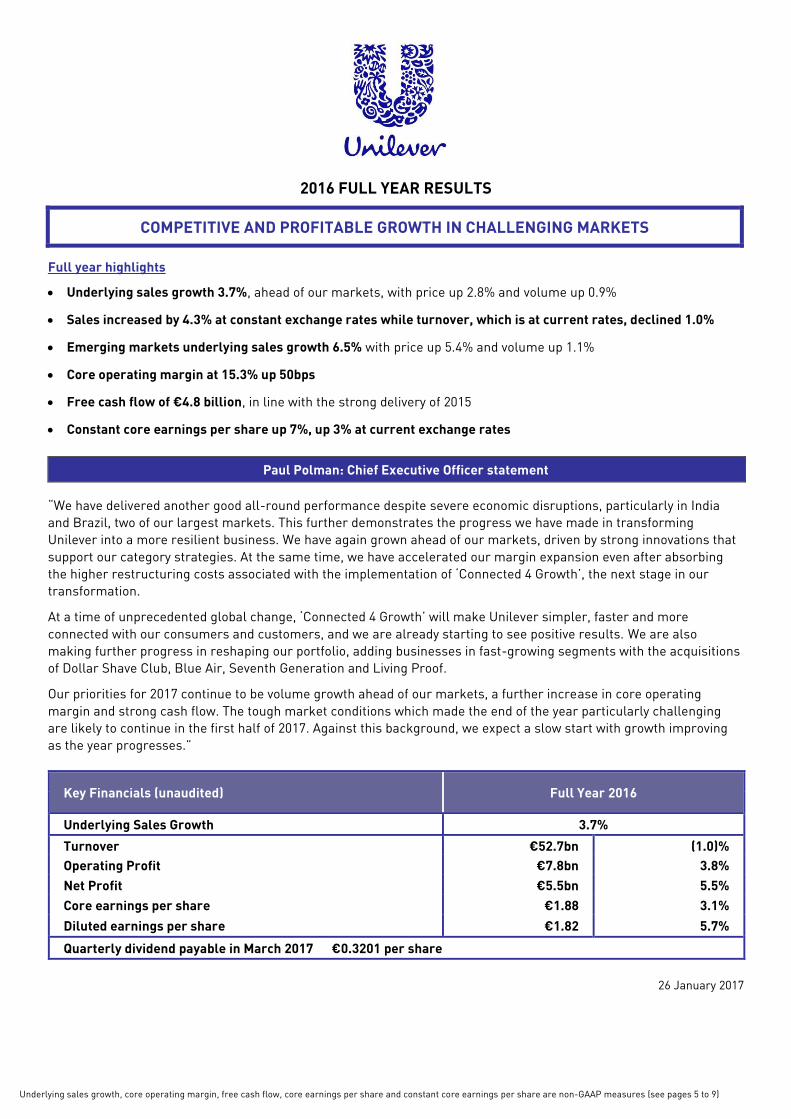
2016 FULL YEAR RESULTS
COMPETITIVE AND PROFITABLE GROWTH IN CHALLENGING MARKETS
Full year highlights
Underlying sales growth 3.7%, ahead of our markets, with price up 2.8% and volume up 0.9%
Sales increased by 4.3% at constant exchange rates while turnover, which is at current rates, declined 1.0%
Emerging markets underlying sales growth 6.5% with price up 5.4% and volume up 1.1%
Core operating margin at 15.3% up 50bps
Free cash flow of €4.8 billion, in line with the strong delivery of 2015
Constant core earnings per share up 7%, up 3% at current exchange rates
Paul Polman: Chief Executive Officer statement
“We have delivered another good all-round performance despite severe economic disruptions, particularly in India
and Brazil, two of our largest markets. This further demonstrates the progress we have made in transforming
Unilever into a more resilient business. We have again grown ahead of our markets, driven by strong innovations that
support our category strategies. At the same time, we have accelerated our margin expansion even after absorbing
the higher restructuring costs associated with the implementation of ‘Connected 4 Growth’, the next stage in our
transformation.
At a time of unprecedented global change, ‘Connected 4 Growth’ will make Unilever simpler, faster and more
connected with our consumers and customers, and we are already starting to see positive results. We are also
making further progress in reshaping our portfolio, adding businesses in fast-growing segments with the acquisitions
of Dollar Shave Club, Blue Air, Seventh Generation and Living Proof.
Our priorities for 2017 continue to be volume growth ahead of our markets, a further increase in core operating
margin and strong cash flow. The tough market conditions which made the end of the year particularly challenging
are likely to continue in the first half of 2017. Against this background, we expect a slow start with growth improving
as the year progresses.”
Key Financials (unaudited) Full Year 2016
Underlying Sales Growth 3.7%
Turnover €52.7bn (1.0)%
Operating Profit €7.8bn 3.8%
Net Profit €5.5bn 5.5%
Core earnings per share €1.88 3.1%
Diluted earnings per share €1.82 5.7%
Quarterly dividend payable in March 2017 €0.3201 per share
26 January 2017
Underlying sales growth, underlying volume growth, underlying price growth and core operating margin are non-GAAP measures (see pages 5 to 9) 2
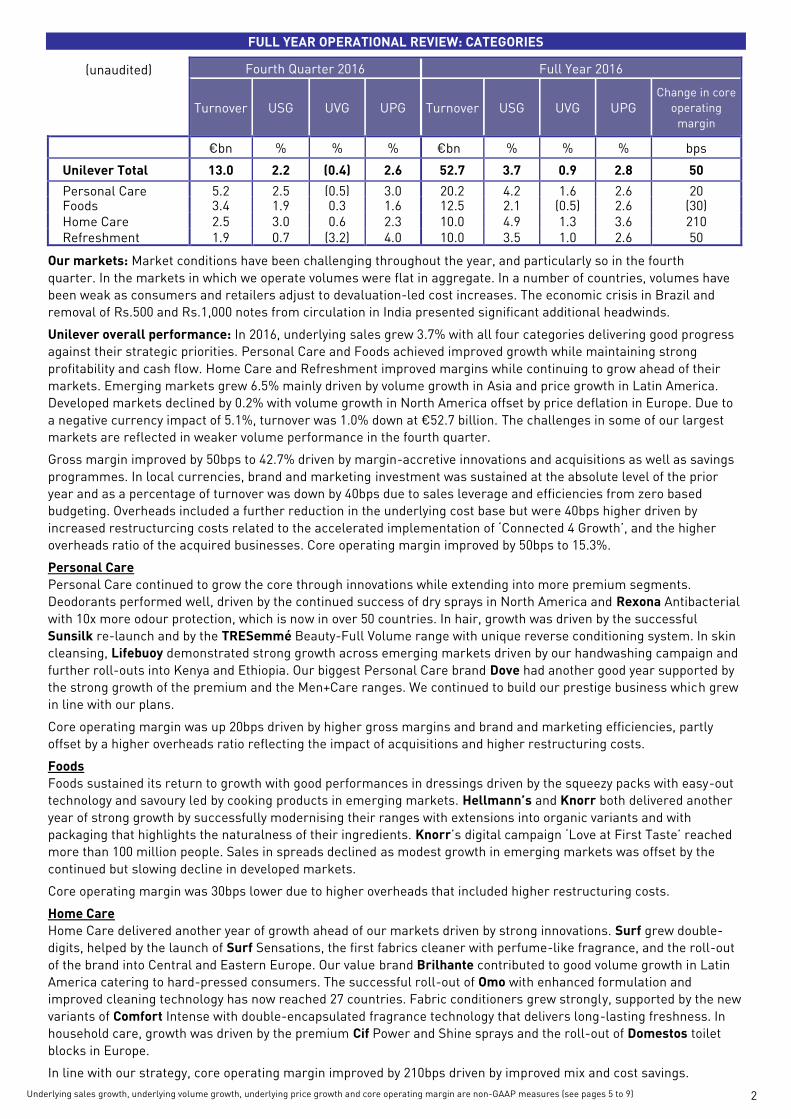
FULL YEAR OPERATIONAL REVIEW: CATEGORIES
(unaudited) Fourth Quarter 2016 Full Year 2016
Turnover USG UVG UPG Turnover USG UVG UPG Change in core
operating
margin
€bn % % % €bn % % % bps
Unilever Total 13.0 2.2 (0.4) 2.6 52.7 3.7 0.9 2.8 50
Personal Care 5.2 2.5 (0.5) 3.0 20.2 4.2 1.6 2.6 20 Foods 3.4 1.9 0.3 1.6 12.5 2.1 (0.5) 2.6 (30) Home Care 2.5 3.0 0.6 2.3 10.0 4.9 1.3 3.6 210 Refreshment 1.9 0.7 (3.2) 4.0 10.0 3.5 1.0 2.6 50
Our markets: Market conditions have been challenging throughout the year, and particularly so in the fourth
quarter. In the markets in which we operate volumes were flat in aggregate. In a number of countries, volumes have
been weak as consumers and retailers adjust to devaluation-led cost increases. The economic crisis in Brazil and
removal of Rs.500 and Rs.1,000 notes from circulation in India presented significant additional headwinds.
Unilever overall performance: In 2016, underlying sales grew 3.7% with all four categories delivering good progress
against their strategic priorities. Personal Care and Foods achieved improved growth while maintaining strong
profitability and cash flow. Home Care and Refreshment improved margins while continuing to grow ahead of their
markets. Emerging markets grew 6.5% mainly driven by volume growth in Asia and price growth in Latin America.
Developed markets declined by 0.2% with volume growth in North America offset by price deflation in Europe. Due to
a negative currency impact of 5.1%, turnover was 1.0% down at €52.7 billion. The challenges in some of our largest
markets are reflected in weaker volume performance in the fourth quarter.
Gross margin improved by 50bps to 42.7% driven by margin-accretive innovations and acquisitions as well as savings
programmes. In local currencies, brand and marketing investment was sustained at the absolute level of the prior
year and as a percentage of turnover was down by 40bps due to sales leverage and efficiencies from zero based
budgeting. Overheads included a further reduction in the underlying cost base but were 40bps higher driven by
increased restructurcing costs related to the accelerated implementation of ‘Connected 4 Growth’, and the higher
overheads ratio of the acquired businesses. Core operating margin improved by 50bps to 15.3%.
Personal Care
Personal Care continued to grow the core through innovations while extending into more premium segments.
Deodorants performed well, driven by the continued success of dry sprays in North America and Rexona Antibacterial
with 10x more odour protection, which is now in over 50 countries. In hair, growth was driven by the successful
Sunsilk re-launch and by the TRESemmé Beauty-Full Volume range with unique reverse conditioning system. In skin
cleansing, Lifebuoy demonstrated strong growth across emerging markets driven by our handwashing campaign and
further roll-outs into Kenya and Ethiopia. Our biggest Personal Care brand Dove had another good year supported by
the strong growth of the premium and the Men+Care ranges. We continued to build our prestige business which grew
in line with our plans.
Core operating margin was up 20bps driven by higher gross margins and brand and marketing efficiencies, partly
offset by a higher overheads ratio reflecting the impact of acquisitions and higher restructuring costs.
Foods
Foods sustained its return to growth with good performances in dressings driven by the squeezy packs with easy-out
technology and savoury led by cooking products in emerging markets. Hellmann’s and Knorr both delivered another
year of strong growth by successfully modernising their ranges with extensions into organic variants and with
packaging that highlights the naturalness of their ingredients. Knorr’s digital campaign ‘Love at First Taste’ reached
more than 100 million people. Sales in spreads declined as modest growth in emerging markets was offset by the
continued but slowing decline in developed markets.
Core operating margin was 30bps lower due to higher overheads that included higher restructuring costs.
Home Care
Home Care delivered another year of growth ahead of our markets driven by strong innovations. Surf grew double-
digits, helped by the launch of Surf Sensations, the first fabrics cleaner with perfume-like fragrance, and the roll-out
of the brand into Central and Eastern Europe. Our value brand Brilhante contributed to good volume growth in Latin
America catering to hard-pressed consumers. The successful roll-out of Omo with enhanced formulation and
improved cleaning technology has now reached 27 countries. Fabric conditioners grew strongly, supported by the new
variants of Comfort Intense with double-encapsulated fragrance technology that delivers long-lasting freshness. In
household care, growth was driven by the premium Cif Power and Shine sprays and the roll-out of Domestos toilet
blocks in Europe.
In line with our strategy, core operating margin improved by 210bps driven by improved mix and cost savings.
Underlying sales growth, underlying volume growth, underlying price growth and core operating margin are non-GAAP measures (see pages 5 to 9) 3
Refreshment
Growth in ice cream was driven by margin-accretive innovations behind our premium brands. These included the
Magnum Double range, the Ben & Jerry’s ‘Wich sandwich and dairy free range, as well as new variants of Talenti, the
premium gelato brand which has grown 60% since acquisition two years ago. In leaf tea, growth improved in emerging
markets but was held back by our black tea business in developed markets. We are continuing to build our presence
in more premium segments with good growth from T2 and specialty teas. We introduced Pure Leaf, already well-
established in ready-to-drink tea, as a premium brand in our leaf tea portfolio in the United States.
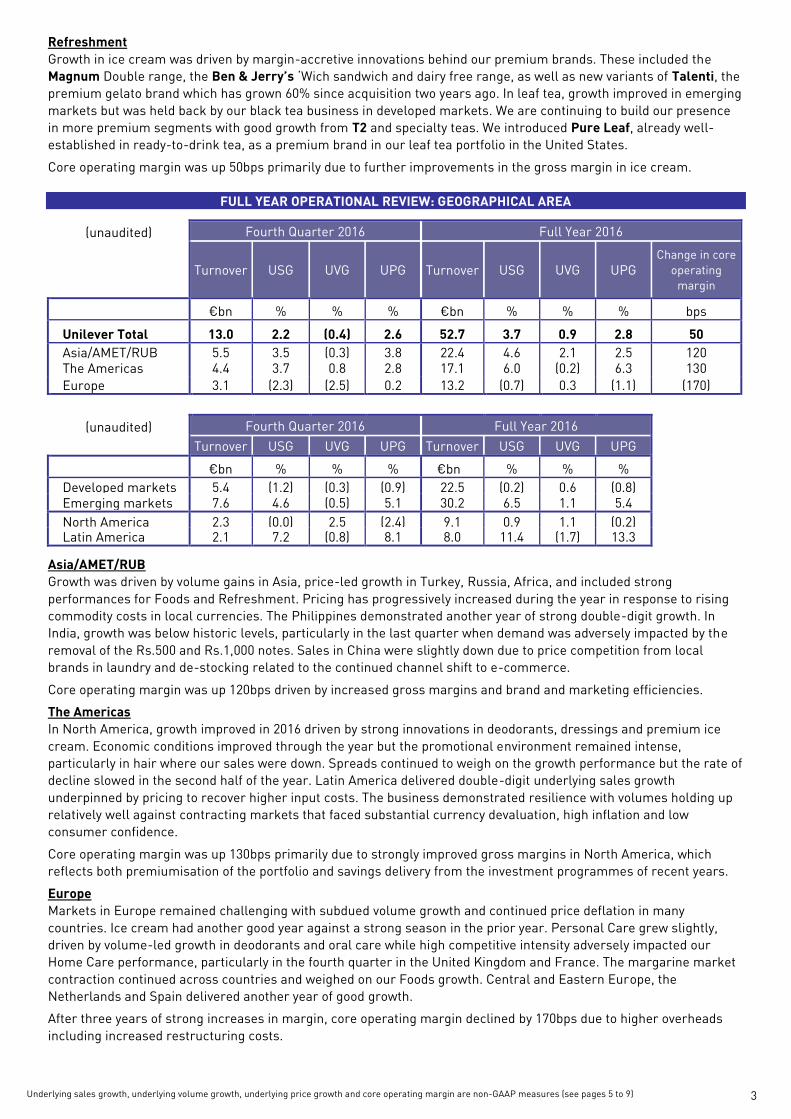
Core operating margin was up 50bps primarily due to further improvements in the gross margin in ice cream.
FULL YEAR OPERATIONAL REVIEW: GEOGRAPHICAL AREA
(unaudited) Fourth Quarter 2016 Full Year 2016
Turnover USG UVG UPG Turnover USG UVG UPG Change in core
operating
margin
€bn % % % €bn % % % bps
Unilever Total 13.0 2.2 (0.4) 2.6 52.7 3.7 0.9 2.8 50
Asia/AMET/RUB 5.5 3.5 (0.3) 3.8 22.4 4.6 2.1 2.5 120 The Americas 4.4 3.7 0.8 2.8 17.1 6.0 (0.2) 6.3 130
Europe 3.1 (2.3) (2.5) 0.2 13.2 (0.7) 0.3 (1.1) (170)
(unaudited) Fourth Quarter 2016 Full Year 2016
Turnover USG UVG UPG Turnover USG UVG UPG
€bn % % % €bn % % %
Developed markets 5.4 (1.2) (0.3) (0.9) 22.5 (0.2) 0.6 (0.8)
Emerging markets 7.6 4.6 (0.5) 5.1 30.2 6.5 1.1 5.4
North America 2.3 (0.0) 2.5 (2.4) 9.1 0.9 1.1 (0.2) Latin America 2.1 7.2 (0.8) 8.1 8.0 11.4 (1.7) 13.3
Asia/AMET/RUB
Growth was driven by volume gains in Asia, price-led growth in Turkey, Russia, Africa, and included strong
performances for Foods and Refreshment. Pricing has progressively increased during the year in response to rising
commodity costs in local currencies. The Philippines demonstrated another year of strong double-digit growth. In
India, growth was below historic levels, particularly in the last quarter when demand was adversely impacted by the
removal of the Rs.500 and Rs.1,000 notes. Sales in China were slightly down due to price competition from local
brands in laundry and de-stocking related to the continued channel shift to e-commerce.
Core operating margin was up 120bps driven by increased gross margins and brand and marketing efficiencies.
The Americas
In North America, growth improved in 2016 driven by strong innovations in deodorants, dressings and premium ice
cream. Economic conditions improved through the year but the promotional environment remained intense,
particularly in hair where our sales were down. Spreads continued to weigh on the growth performance but the rate of
decline slowed in the second half of the year. Latin America delivered double-digit underlying sales growth
underpinned by pricing to recover higher input costs. The business demonstrated resilience with volumes holding up
relatively well against contracting markets that faced substantial currency devaluation, high inflation and low
consumer confidence.
Core operating margin was up 130bps primarily due to strongly improved gross margins in North America, which
reflects both premiumisation of the portfolio and savings delivery from the investment programmes of recent years.
Europe
Markets in Europe remained challenging with subdued volume growth and continued price deflation in many
countries. Ice cream had another good year against a strong season in the prior year. Personal Care grew slightly,
driven by volume-led growth in deodorants and oral care while high competitive intensity adversely impacted our
Home Care performance, particularly in the fourth quarter in the United Kingdom and France. The margarine market
contraction continued across countries and weighed on our Foods growth. Central and Eastern Europe, the
Netherlands and Spain delivered another year of good growth.
After three years of strong increases in margin, core operating margin declined by 170bps due to higher overheads
including increased restructuring costs.
Core effective tax rate, core EPS, constant core EPS, free cash flow, net debt and return on invested capital are non-GAAP measures (see pages 5 to 9) 4
ADDITIONAL COMMENTARY ON THE CONDENSED FINANCIAL STATEMENTS – FULL YEAR
Finance costs and tax
Net finance costs increased by €70 million to €563 million in 2016. This was driven by increased borrowings and
reduced interest on cash deposits, partially offset by a lower pensions financing charge at €94 million. The average
interest rate on net debt was 3.5%.
The effective tax rate was 26.2% versus 27.6% in 2015. The change was primarily due to favourable tax audit
settlements. The core effective tax rate was 26.1% versus 26.9% in the prior year.
Joint ventures, associates and other income from non-current investments
Net profit from joint ventures and associates contributed €127 million compared to €107 million in 2015 due to higher
profits from the Pepsi Lipton joint venture. Other income from non-current investments increased to €104 million
versus €91 million in 2015, primarily driven by a gain of €107 million from the sale of financial assets.
Earnings per share
Core earnings per share increased by 3.1% to €1.88 for the full year, including an adverse currency impact of 3.7%.
Constant core earnings per share increased by 6.8% primarily driven by underlying sales growth and improved core
operating margin. These core measures exclude the impact of business disposals, acquisition and disposal related
costs, impairments and other one-off items.
Diluted earnings per share for the full year was up 5.7% to €1.82 due to lower charges within non-core items than in
the prior year. In 2016, we recorded acquisition and disposal related costs of €132 million and a loss on disposal of
€104 million for local Alberto Culver brands and the rights for VO5 in Argentina that we were required to sell as part
of the regulatory approval process.
Free cash flow
Free cash flow of €4.8 billion was in line with the strong prior year. Year-end working capital improved again after the
exceptional delivery in 2015. Net capital expenditure at 3.6% of turnover was slightly lower than in 2015. Cash flow
from operating activities for 2016 was €9.3 billion compared to €9.4 billion in 2015.
Net debt
Closing net debt increased to €12.6 billion from €11.5 billion as at 31 December 2015 primarily reflecting the cost of
acquisitions. Total financial liabilities amounted to €16.6 billion compared to €14.6 billion in the prior year. Cash and
other current financial assets increased by €0.8 billion to €4.0 billion at 31 December 2016.
Pensions
The net pension liability increased to €3.2 billion at the end of December 2016 versus €2.3 billion as at 31 December
2015. The increase in the net pension liability primarily reflects the impact of lower discount rates which exceeded
investment returns and cash contributions.
Return on invested capital
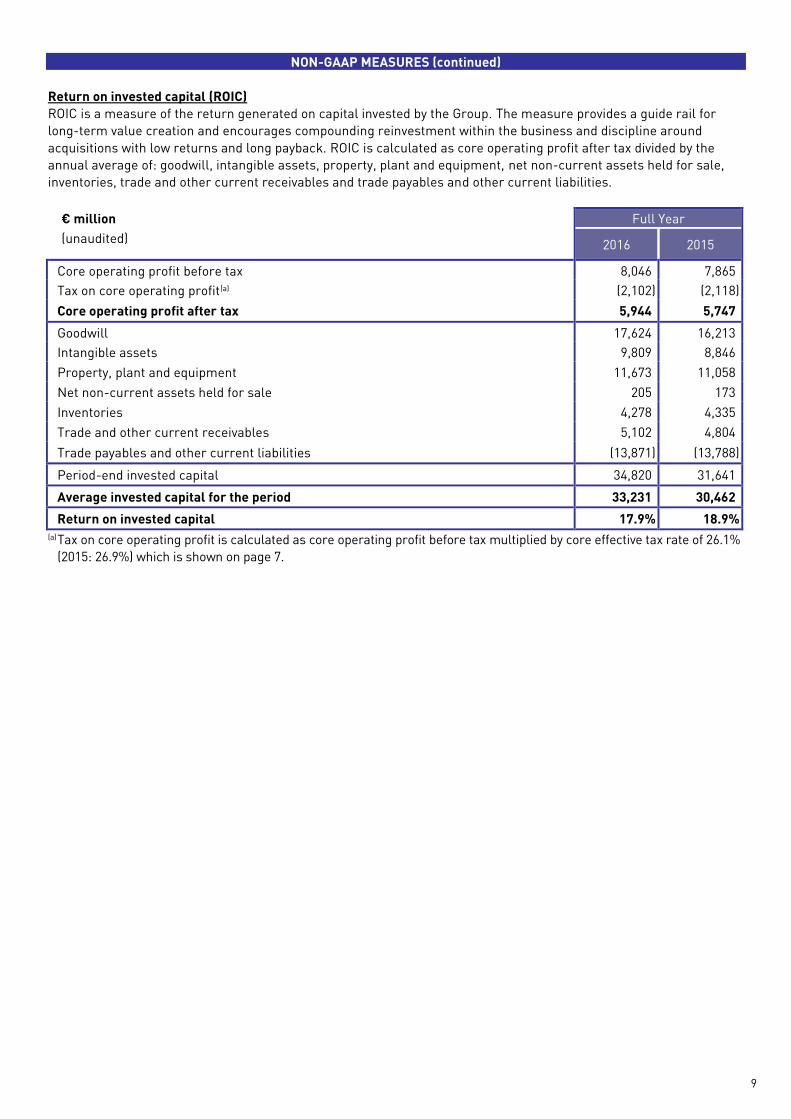
Return on invested capital was 17.9% compared to 18.9% in 2015. Core operating profit after tax and working capital
improved, however this was more than offset by an increase in goodwill as a result of recent acquisitions as well as an
adverse currency impact on the goodwill arising from the Bestfoods acquisition many years ago. COMPETITION INVESTIGATIONS
5
COMPETITION INVESTIGATIONS
As previously disclosed, along with other consumer products companies and retail customers, Unilever is involved in
a number of ongoing investigations by national competition authorities. These proceedings and investigations are at
various stages and concern a variety of product markets. Where appropriate, provisions are made and contingent
liabilities disclosed in relation to such matters.
Ongoing compliance with competition laws is of key importance to Unilever. It is Unilever’s policy to co-operate fully
with competition authorities whenever questions or issues arise. In addition the Group continues to reinforce and
enhance its internal competition law training and compliance programme on an ongoing basis.
BRAZIL TAX LITIGATION
In common with many other businesses operating in Brazil, Unilever has a number of open legal proceedings related
to indirect taxes. Where it is probable that an outflow of economic benefit will be required, a provision is recognised in
the Group balance sheet. Where an outflow of economic benefits is possible but not probable, no provision is recorded
and the matters are disclosed as contingent liabilities. Within our contingent liabilities there is an amount in respect
of a claim for €655 million for Brazilian PIS and COFINS indirect taxes, that had been determined in Unilever’s favour
in a prior judicial review but was reversed on appeal to a higher court. As we still believe our case remains strong it
has not been provided for and is considered to be a contingent liability, hence there is no charge to the 2016 income
statement as a result of this judgment. Whilst Unilever intends to appeal this ruling, we are likely to make a judicial
deposit equating to the potential amount owing during 2017.
NON-GAAP MEASURES
Certain discussions and analyses set out in this announcement include measures which are not defined by generally
accepted accounting principles (GAAP) such as IFRS. We believe this information, along with comparable GAAP
measurements, is useful to investors because it provides a basis for measuring our operating performance, ability to
retire debt and invest in new business opportunities. Our management uses these financial measures, along with the
most directly comparable GAAP financial measures, in evaluating our operating performance and value creation.
Non-GAAP financial measures should not be considered in isolation from, or as a substitute for, financial information
presented in compliance with GAAP. Wherever appropriate and practical, we provide reconciliations to relevant GAAP
measures.
Unilever uses ‘constant rate’, ‘underlying’ and ‘core’ measures primarily for internal performance analysis and
targeting purposes. We present certain items, percentages and movements, using constant exchange rates, which
exclude the impact of fluctuations in foreign currency exchange rates. We calculate constant currency values by
translating both the current and the prior period local currency amounts using the prior period average exchange
rates into euro.
The table below shows exchange rate movements in our key markets.
Annual Average
rate in 2016
Annual Average
rate in 2015
Brazilian Real (€1 = BRL) 3.889 3.607
Chinese Yuan (€1 = CNY) 7.355 6.967
Indian Rupee (€1 = INR) 74.588 71.047
Indonesia Rupiah (€1 = IDR) 14770 14820
UK Pound Sterling (€1 = GBP) 0.815 0.725
US Dollar (€1 = US $) 1.111 1.111
Underlying sales growth (USG)
Underlying Sales Growth or “USG” refers to the increase in turnover for the period, excluding any change in turnover
resulting from acquisitions, disposals and changes in currency. The impact of acquisitions and disposals is excluded
from USG for a period of 12 calendar months from the applicable closing date. Turnover from acquired brands that
are launched in countries where they were not previously sold is included in USG as such turnover is more
attributable to our existing sales and distribution network than the acquisition itself. We believe this measure provides
valuable additional information on the underlying sales performance of the business and is a key measure used
internally. The reconciliation of USG to changes in the GAAP measure turnover is provided in notes 3 and 4. AP
MEASURES (continued)
6
NON-GAAP MEASURES (continued)
Underlying volume growth (UVG)
“Underlying Volume Growth” or “UVG” is part of USG and means, for the applicable period, the increase in turnover in
such period calculated as the sum of (1) the increase in turnover attributable to the volume of products sold; and (2)
the increase in turnover attributable to the composition of products sold during such period. UVG therefore excludes
any impact to USG due to changes in prices. The measures and the related turnover GAAP measure are set out in
notes 3 and 4.
Underlying price growth (UPG)
Underlying price growth or “UPG” is part of USG, and means, for the applicable period, the increase in turnover
attributable to changes in prices during the period. UPG therefore excludes the impact to USG due to (1) the volume of
products sold; and (2) the composition of products sold during the period. The measures and the related turnover
GAAP measure are set out in notes 3 and 4.
Free cash flow (FCF)
Within the Unilever Group, free cash flow (FCF) is defined as cash flow from operating activities, less income taxes paid,
net capital expenditures and net interest payments and preference dividends paid. It does not represent residual cash
flows entirely available for discretionary purposes; for example, the repayment of principal amounts borrowed is not
deducted from FCF. Free cash flow reflects an additional way of viewing our liquidity that we believe is useful to investors
because it represents cash flows that could be used for distribution of dividends, repayment of debt or to fund our
strategic initiatives, including acquisitions, if any.
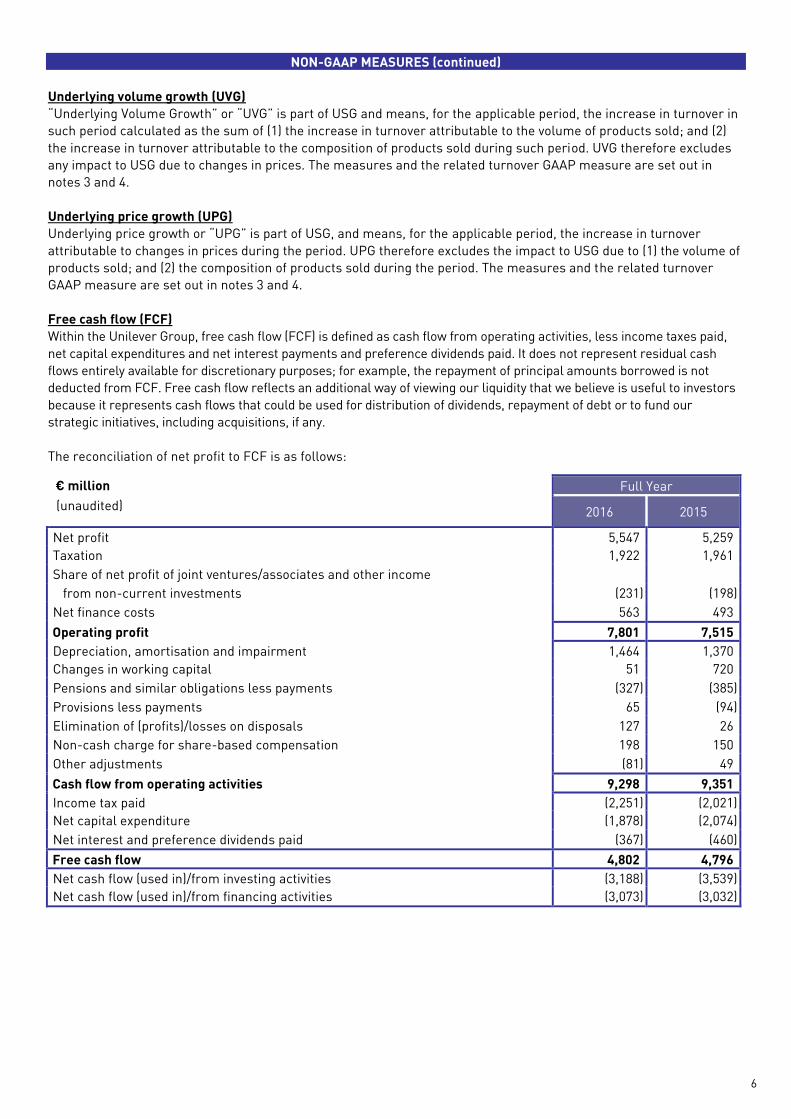
The reconciliation of net profit to FCF is as follows:
€ million Full Year
(unaudited) 2016 2015
Net profit 5,547 5,259
Taxation 1,922 1,961
Share of net profit of joint ventures/associates and other income
from non-current investments (231) (198)
Net finance costs 563 493
Operating profit 7,801 7,515
Depreciation, amortisation and impairment 1,464 1,370
Changes in working capital 51 720
Pensions and similar obligations less payments (327) (385)
Provisions less payments 65 (94)
Elimination of (profits)/losses on disposals 127 26
Non-cash charge for share-based compensation 198 150
Other adjustments (81) 49
Cash flow from operating activities 9,298 9,351
Income tax paid (2,251) (2,021)
Net capital expenditure (1,878) (2,074)
Net interest and preference dividends paid (367) (460)
Free cash flow 4,802 4,796
Net cash flow (used in)/from investing activities (3,188) (3,539)
Net cash flow (used in)/from financing activities (3,073) (3,032)

7
NON-GAAP MEASURES (continued)
Core operating profit (COP), core operating margin (COM) and non-core items
COP and COM means operating profit and operating margin, respectively, before the impact of business disposals,
acquisition and disposal related costs, impairments and other one-off items, which we collectively term non-core
items, due to their nature and/or frequency of occurrence. Core operating profit represents our measure of segment
profit or loss as it is the primary measure used for the purpose of making decisions about allocating resources and
assessing performance of segments. The reconciliation of operating profit to core operating profit is as follows:
€ million Full Year
(unaudited) 2016 2015
Operating profit 7,801 7,515
Non-core items (see note 2) 245 350
Core operating profit 8,046 7,865
Turnover 52,713 53,272
Operating margin (%) 14.8 14.1
Core operating margin (%) 15.3 14.8
Core EPS
Core EPS is calculated as core profit attributable to shareholders’ equity divided by the diluted combined average number
of share units. In calculating core earnings, net profit attributable to shareholders’ equity is adjusted to eliminate the post
tax impact of non-core items. This measure reflects the underlying earnings for each share unit of the Group. Refer to
note 2 on page 15 for reconciliation of core earnings to net profit attributable to shareholders’ equity.
Core effective tax rate
The core effective tax rate is calculated by dividing taxation excluding the tax impact of non-core items by profit before
tax excluding non-core items and share of net profit/(loss) of joint ventures and associates. This measure reflects the
underlying tax rate in relation to profit before tax, non-core items, joint ventures and associates.
The reconciliation of taxation to taxation before non-core items is as follows:
€ million Full Year
(unaudited) 2016 2015
Taxation 1,922 1,961
Tax impact of non-core items 60 49
Taxation before non-core items 1,982 2,010
Profit before taxation 7,469 7,220
Non-core items before tax 245 350
Share of net profit /loss of joint ventures and associates (127) (107)
Profit before tax, non-core items, joint ventures and associates 7,587 7,463
Core effective tax rate 26.1% 26.9%

8
NON-GAAP MEASURES (continued)
Constant core EPS
Constant core EPS is calculated as core profit attributable to shareholders’ equity at constant exchange rates and
excluding the impact of translational hedges divided by the diluted combined average number of share units. This
measure reflects the underlying earnings for each share unit of the Group in constant exchange rates.
The reconciliation of core profit attributable to shareholders’ equity to constant core earnings attributable to
shareholders’ equity and the calculation of constant core EPS is as follows:
€ million Full Year
(unaudited) 2016 2015
Core profit attributable to shareholders' equity (see note 2) 5,370 5,210
Impact of translation of earnings between constant and current exchange rates and
translational hedges 169 (125)
Constant core earnings attributable to shareholders' equity 5,539 5,085
Diluted combined average number of share units (millions of units) 2,853.9 2,855.4
Constant core EPS (€) 1.94 1.78
In calculating the movement in constant core EPS, the constant core EPS for 2016 is compared to the core EPS for 2015 as
adjusted for the impact of translational hedges, which was €1.82.
Net debt
Net debt is defined as the excess of total financial liabilities, excluding trade payables and other current liabilities,
over cash, cash equivalents and other current financial assets, excluding trade and other current receivables. It is a
measure that provides valuable additional information on the summary presentation of the Group’s net financial
liabilities and is a measure in common use elsewhere.
The reconciliation of total financial liabilities to net debt is as follows:
€ million As at As at
(unaudited) 31 December 31 December
2016 2015
Total financial liabilities (16,595) (14,643)
Current financial liabilities (5,450) (4,789)
Non-current financial liabilities (11,145) (9,854)
Cash and cash equivalents as per balance sheet 3,382 2,302
Cash and cash equivalents as per cash flow statement 3,198 2,128
Add bank overdrafts deducted therein 184 174
Other current financial assets 599 836
Net debt (12,614) (11,505)
9
NON-GAAP MEASURES (continued)
Return on invested capital (ROIC)
ROIC is a measure of the return generated on capital invested by the Group. The measure provides a guide rail for
long-term value creation and encourages compounding reinvestment within the business and discipline around
acquisitions with low returns and long payback. ROIC is calculated as core operating profit after tax divided by the
annual average of: goodwill, intangible assets, property, plant and equipment, net non-current assets held for sale,
inventories, trade and other current receivables and trade payables and other current liabilities.
€ million Full Year
(unaudited) 2016 2015
Core operating profit before tax 8,046 7,865
Tax on core operating profit(a) (2,102) (2,118)
Core operating profit after tax 5,944 5,747
Goodwill 17,624 16,213
Intangible assets 9,809 8,846
Property, plant and equipment 11,673 11,058
Net non-current assets held for sale 205 173
Inventories 4,278 4,335
Trade and other current receivables 5,102 4,804
Trade payables and other current liabilities (13,871) (13,788)
Period-end invested capital 34,820 31,641
Average invested capital for the period 33,231 30,462
Return on invested capital 17.9% 18.9% (a) Tax on core operating profit is calculated as core operating profit before tax multiplied by core effective tax rate of 26.1%
(2015: 26.9%) which is shown on page 7.
10
CAUTIONARY STATEMENT
This announcement may contain forward-looking statements, including ‘forward-looking statements’ within the
meaning of the United States Private Securities Litigation Reform Act of 1995. Words such as ‘will’, ‘aim’, ‘expects’,
‘anticipates’, ‘intends’, ‘looks’, ‘believes’, ‘vision’, or the negative of these terms and other similar expressions of
future performance or results, and their negatives, are intended to identify such forward-looking statements. These
forward-looking statements are based upon current expectations and assumptions regarding anticipated
developments and other factors affecting the Unilever Group (the “Group”). They are not historical facts, nor are they
guarantees of future performance.
Because these forward-looking statements involve risks and uncertainties, there are important factors that could
cause actual results to differ materially from those expressed or implied by these forward-looking statements.
Among other risks and uncertainties, the material or principal factors which could cause actual results to differ
materially are: Unilever’s global brands not meeting consumer preferences; Unilever’s ability to innovate and remain
competitive; Unilever’s investment choices in its portfolio management; inability to find sustainable solutions to
support long-term growth; customer relationships; the recruitment and retention of talented employees; disruptions
in our supply chain; the cost of raw materials and commodities; the production of safe and high quality products;
secure and reliable IT infrastructure; successful execution of acquisitions, divestitures and business transformation
projects; economic and political risks and natural disasters; financial risks; failure to meet high and ethical standards;
and failure to comply with laws and regulations, including tax laws. These forward-looking statements speak only as
of the date of this document. Except as required by any applicable law or regulation, the Group expressly disclaims
any obligation or undertaking to release publicly any updates or revisions to any forward-looking statements
contained herein to reflect any change in the Group’s expectations with regard thereto or any change in events,
conditions or circumstances on which any such statement is based. Further details of potential risks and uncertainties
affecting the Group are described in the Group’s filings with the London Stock Exchange, Euronext Amsterdam and
the US Securities and Exchange Commission, including in the Group’s Annual Report on Form 20-F for the year ended
31 December 2015 and the Annual Report and Accounts 2015.
ENQUIRIES
Media: Media Relations Team Investors: Investor Relations Team
UK
or
NL
+44 79 1727 1819
+44 78 2504 9151
+31 10 217 4844
+44 20 7822 6830
There will be a web cast of the results presentation available at:
www.unilever.com/ourcompany/investorcentre/results/quarterlyresults/default.asp
11
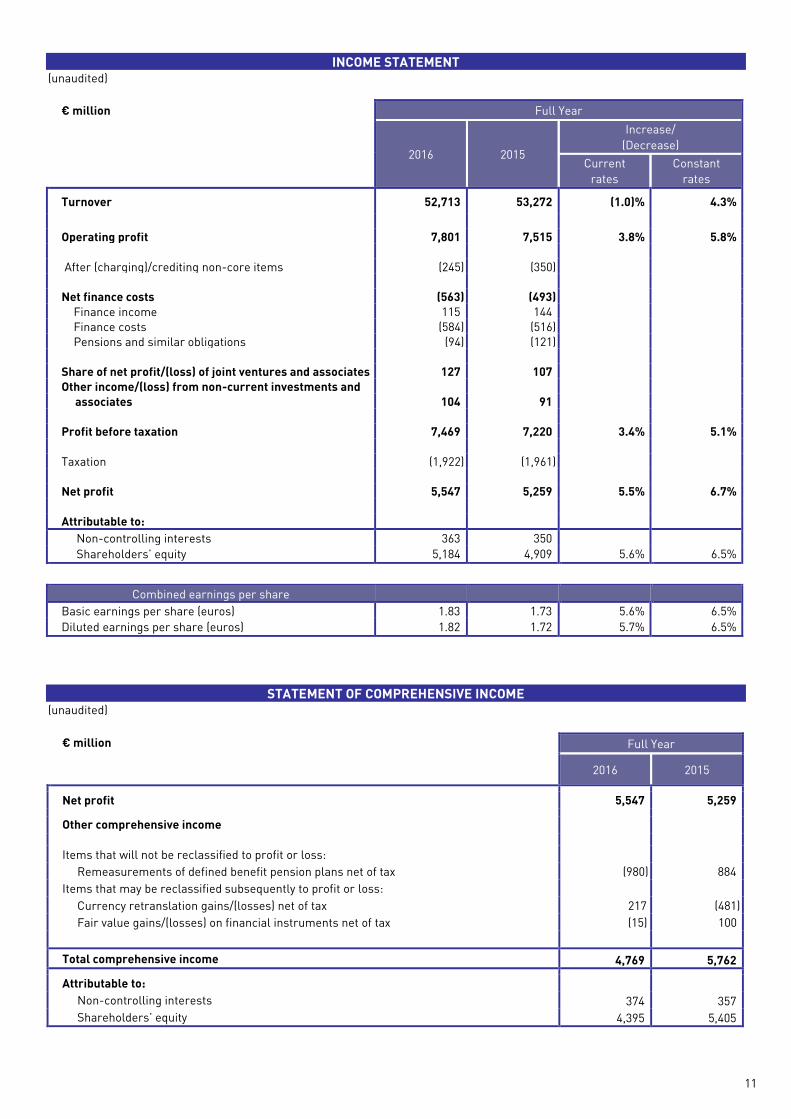
INCOME STATEMENT (unaudited)
€ million Full Year
2016 2015
Increase/
(Decrease)
Current Constant
rates rates
Turnover 52,713 53,272 (1.0)% 4.3%
Operating profit 7,801 7,515 3.8% 5.8%
After (charging)/crediting non-core items (245) (350)
Net finance costs (563) (493)
Finance income 115 144
Finance costs (584) (516)
Pensions and similar obligations (94) (121)
Share of net profit/(loss) of joint ventures and associates 127 107
Other income/(loss) from non-current investments and
associates 104 91
Profit before taxation 7,469 7,220 3.4% 5.1%
Taxation (1,922) (1,961)
Net profit 5,547 5,259 5.5% 6.7%
Attributable to:
Non-controlling interests 363 350
Shareholders’ equity 5,184 4,909 5.6% 6.5%
Combined earnings per share
Basic earnings per share (euros) 1.83 1.73 5.6% 6.5%
Diluted earnings per share (euros) 1.82 1.72 5.7% 6.5%
STATEMENT OF COMPREHENSIVE INCOME (unaudited)
€ million Full Year
2016 2015
Net profit 5,547 5,259
Other comprehensive income
Items that will not be reclassified to profit or loss:
Remeasurements of defined benefit pension plans net of tax (980) 884
Items that may be reclassified subsequently to profit or loss:
Currency retranslation gains/(losses) net of tax 217 (481)
Fair value gains/(losses) on financial instruments net of tax (15) 100
Total comprehensive income 4,769 5,762
Attributable to:
Non-controlling interests 374 357
Shareholders’ equity 4,395 5,405
12
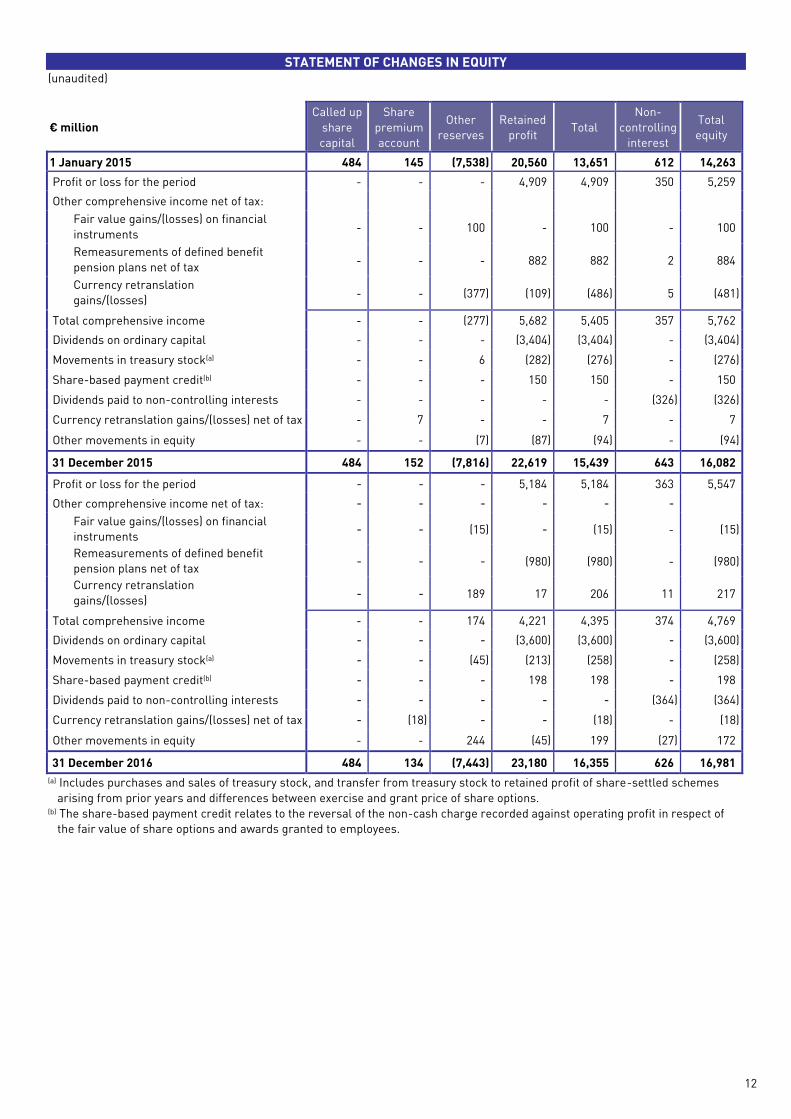
STATEMENT OF CHANGES IN EQUITY (unaudited)
€ million
Called up
share
capital
Share
premium
account
Other
reserves
Retained
profit Total
Non-
controlling
interest
Total
equity
1 January 2015 484 145 (7,538) 20,560 13,651 612 14,263
Profit or loss for the period - - - 4,909 4,909 350 5,259
Other comprehensive income net of tax:
Fair value gains/(losses) on financial
instruments - - 100 - 100 - 100
Remeasurements of defined benefit
pension plans net of tax - - - 882 882 2 884
Currency retranslation
gains/(losses) - - (377) (109) (486) 5 (481)
Total comprehensive income - - (277) 5,682 5,405 357 5,762
Dividends on ordinary capital - - - (3,404) (3,404) - (3,404)
Movements in treasury stock(a) - - 6 (282) (276) - (276)
Share-based payment credit(b) - - - 150 150 - 150
Dividends paid to non-controlling interests - - - - - (326) (326)
Currency retranslation gains/(losses) net of tax - 7 - - 7 - 7
Other movements in equity - - (7) (87) (94) - (94)
31 December 2015 484 152 (7,816) 22,619 15,439 643 16,082
Profit or loss for the period - - - 5,184 5,184 363 5,547
Other comprehensive income net of tax: - - - - - -
Fair value gains/(losses) on financial
instruments - - (15) - (15) - (15)
Remeasurements of defined benefit
pension plans net of tax - - - (980) (980) - (980)
Currency retranslation
gains/(losses) - - 189 17 206 11 217
Total comprehensive income - - 174 4,221 4,395 374 4,769
Dividends on ordinary capital - - - (3,600) (3,600) - (3,600)
Movements in treasury stock(a) - - (45) (213) (258) - (258)
Share-based payment credit(b) - - - 198 198 - 198
Dividends paid to non-controlling interests - - - - - (364) (364)
Currency retranslation gains/(losses) net of tax - (18) - - (18) - (18)
Other movements in equity - - 244 (45) 199 (27) 172
31 December 2016 484 134 (7,443) 23,180 16,355 626 16,981
(a) Includes purchases and sales of treasury stock, and transfer from treasury stock to retained profit of share-settled schemes
arising from prior years and differences between exercise and grant price of share options. (b) The share-based payment credit relates to the reversal of the non-cash charge recorded against operating profit in respect of
the fair value of share options and awards granted to employees.
13
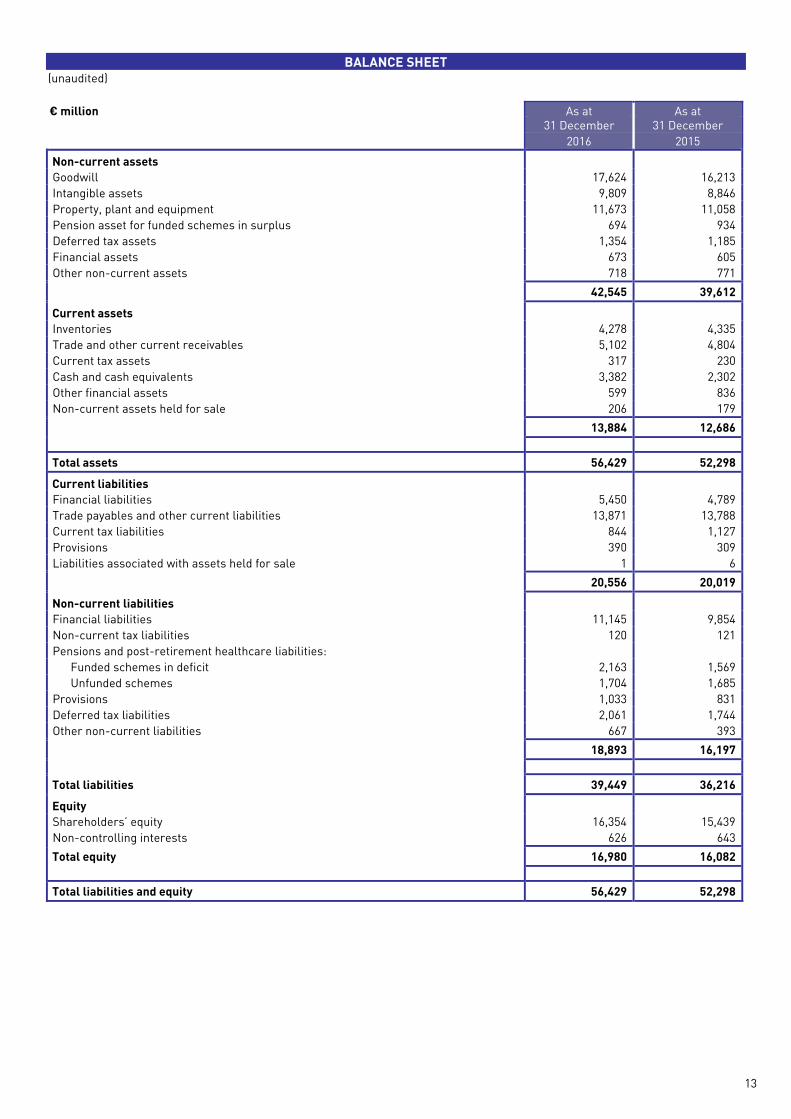
BALANCE SHEET (unaudited)
€ million As at As at 31 December 31 December
2016 2015
Non-current assets
Goodwill 17,624 16,213
Intangible assets 9,809 8,846
Property, plant and equipment 11,673 11,058
Pension asset for funded schemes in surplus 694 934
Deferred tax assets 1,354 1,185
Financial assets 673 605
Other non-current assets 718 771
42,545 39,612
Current assets
Inventories 4,278 4,335
Trade and other current receivables 5,102 4,804
Current tax assets 317 230
Cash and cash equivalents 3,382 2,302
Other financial assets 599 836
Non-current assets held for sale 206 179
13,884 12,686
Total assets 56,429 52,298
Current liabilities
Financial liabilities 5,450 4,789
Trade payables and other current liabilities 13,871 13,788
Current tax liabilities 844 1,127
Provisions 390 309
Liabilities associated with assets held for sale 1 6
20,556 20,019
Non-current liabilities
Financial liabilities 11,145 9,854
Non-current tax liabilities 120 121
Pensions and post-retirement healthcare liabilities:
Funded schemes in deficit 2,163 1,569
Unfunded schemes 1,704 1,685
Provisions 1,033 831
Deferred tax liabilities 2,061 1,744
Other non-current liabilities 667 393
18,893 16,197
Total liabilities 39,449 36,216
Equity
Shareholders’ equity 16,354 15,439
Non-controlling interests 626 643
Total equity 16,980 16,082
Total liabilities and equity 56,429 52,298
14
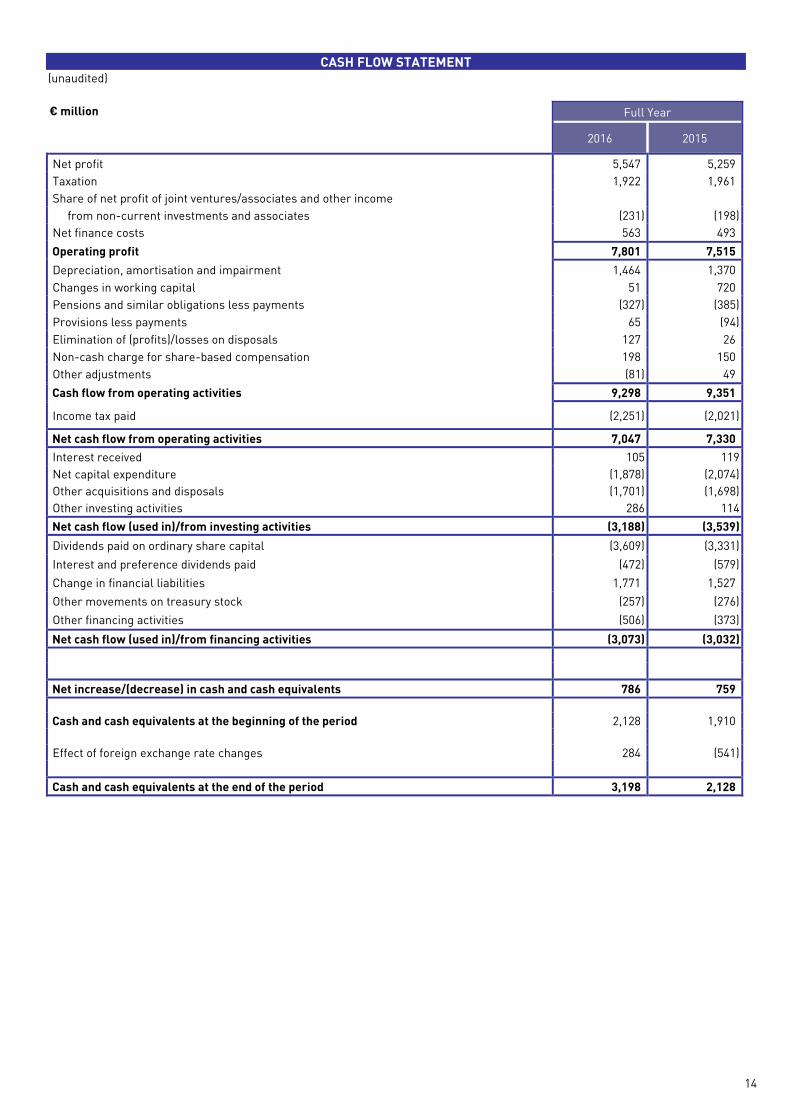
CASH FLOW STATEMENT (unaudited)
€ million Full Year
2016 2015
Net profit 5,547 5,259
Taxation 1,922 1,961
Share of net profit of joint ventures/associates and other income
from non-current investments and associates (231) (198)
Net finance costs 563 493
Operating profit 7,801 7,515
Depreciation, amortisation and impairment 1,464 1,370
Changes in working capital 51 720
Pensions and similar obligations less payments (327) (385)
Provisions less payments 65 (94)
Elimination of (profits)/losses on disposals 127 26
Non-cash charge for share-based compensation 198 150
Other adjustments (81) 49
Cash flow from operating activities 9,298 9,351
Income tax paid (2,251) (2,021)
Net cash flow from operating activities 7,047 7,330
Interest received 105 119
Net capital expenditure (1,878) (2,074)
Other acquisitions and disposals (1,701) (1,698)
Other investing activities 286 114
Net cash flow (used in)/from investing activities (3,188) (3,539)
Dividends paid on ordinary share capital (3,609) (3,331)
Interest and preference dividends paid (472) (579)
Change in financial liabilities 1,771 1,527
Other movements on treasury stock (257) (276)
Other financing activities (506) (373)
Net cash flow (used in)/from financing activities (3,073) (3,032)
Net increase/(decrease) in cash and cash equivalents 786 759
Cash and cash equivalents at the beginning of the period 2,128 1,910
Effect of foreign exchange rate changes 284 (541)
Cash and cash equivalents at the end of the period 3,198 2,128
15
NOTES TO THE CONDENSED FINANCIAL STATEMENTS (unaudited)
1 ACCOUNTING INFORMATION AND POLICIES
Except as set out below the accounting policies and methods of computation are consistent with the year ended 31 December 2015.
The condensed preliminary financial statements are based on International Financial Reporting Standards (IFRS) as adopted by the
EU and IFRS as issued by the International Accounting Standards Board. With effect from 1 January 2016 we have implemented
amendments to IAS 1 ‘Presentation of Financial Statements’ and IAS 41 ‘Agriculture: Bearer Plants’. The impact on the Group is
not material.
The condensed financial statements are shown at current exchange rates, while percentage year-on-year changes are shown at
both current and constant exchange rates to facilitate comparison. The income statement on page 11, the statement of
comprehensive income on page 11, the statement of changes in equity on page 12 and the cash flow statement on page 14 are
translated at exchange rates current in each period. The balance sheet on page 13 is translated at period-end rates of exchange.
The condensed financial statements attached do not constitute the full financial statements within the meaning of Section 434 of
the UK Companies Act 2006, which will be finalised and delivered to the Registrar of Companies in due course. Full accounts for
Unilever for the year ended 31 December 2015 have been delivered to the Registrar of Companies; the auditors’ reports on these
accounts were unqualified, did not include a reference to any matters by way of emphasis and did not contain a statement under
Section 498 (2) or Section 498 (3) of the UK Companies Act 2006.
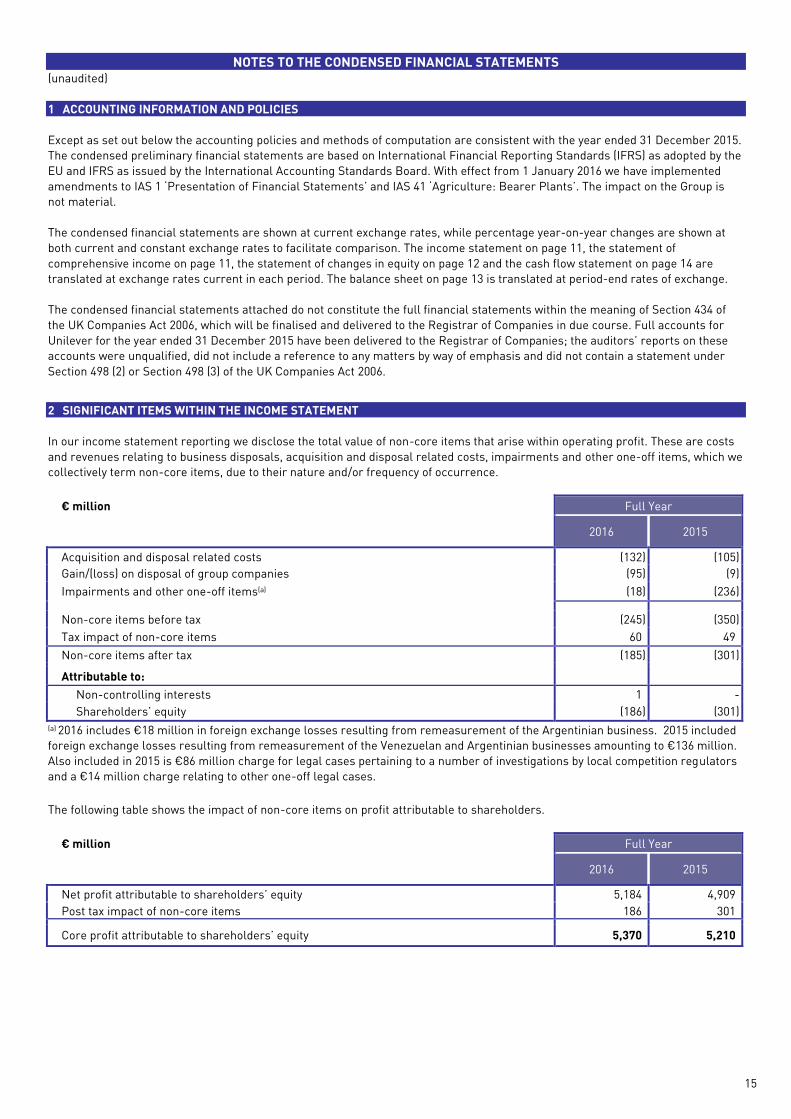
2 SIGNIFICANT ITEMS WITHIN THE INCOME STATEMENT
In our income statement reporting we disclose the total value of non-core items that arise within operating profit. These are costs
and revenues relating to business disposals, acquisition and disposal related costs, impairments and other one-off items, which we
collectively term non-core items, due to their nature and/or frequency of occurrence.
€ million Full Year
2016 2015
Acquisition and disposal related costs (132) (105)
Gain/(loss) on disposal of group companies (95) (9)
Impairments and other one-off items(a) (18) (236)
Non-core items before tax (245) (350)
Tax impact of non-core items 60 49
Non-core items after tax (185) (301)
Attributable to:
Non-controlling interests 1 -
Shareholders’ equity (186) (301)
(a) 2016 includes €18 million in foreign exchange losses resulting from remeasurement of the Argentinian business. 2015 included
foreign exchange losses resulting from remeasurement of the Venezuelan and Argentinian businesses amounting to €136 million.
Also included in 2015 is €86 million charge for legal cases pertaining to a number of investigations by local competition regulators
and a €14 million charge relating to other one-off legal cases.
The following table shows the impact of non-core items on profit attributable to shareholders.
€ million Full Year
2016 2015
Net profit attributable to shareholders’ equity 5,184 4,909
Post tax impact of non-core items 186 301
Core profit attributable to shareholders’ equity 5,370 5,210
16
NOTES TO THE CONDENSED FINANCIAL STATEMENTS (unaudited)
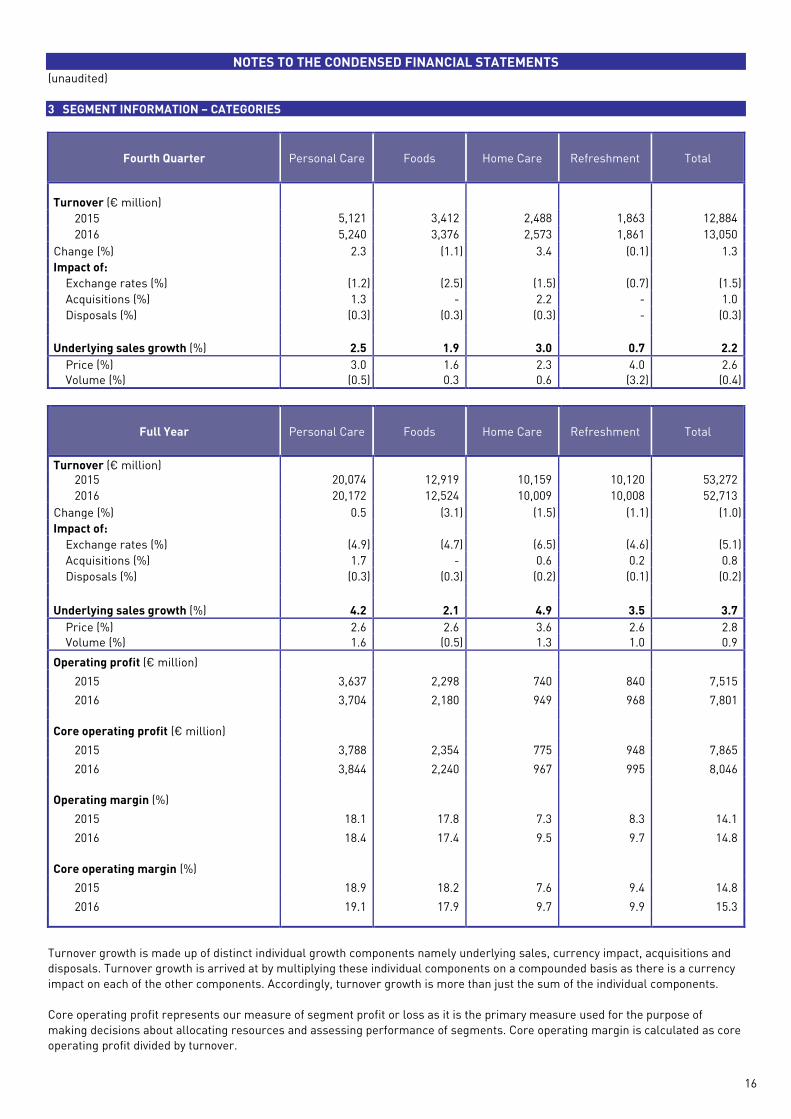
3 SEGMENT INFORMATION – CATEGORIES
Fourth Quarter Personal Care Foods Home Care Refreshment Total
Turnover (€ million)
2015 5,121 3,412 2,488 1,863 12,884
2016 5,240 3,376 2,573 1,861 13,050
Change (%) 2.3 (1.1) 3.4 (0.1) 1.3
Impact of:
Exchange rates (%) (1.2) (2.5) (1.5) (0.7) (1.5)
Acquisitions (%) 1.3 - 2.2 - 1.0
Disposals (%) (0.3) (0.3) (0.3) - (0.3)
Underlying sales growth (%) 2.5 1.9 3.0 0.7 2.2
Price (%) 3.0 1.6 2.3 4.0 2.6
Volume (%) (0.5) 0.3 0.6 (3.2) (0.4)
Full Year Personal Care Foods Home Care Refreshment Total
Turnover (€ million) 2015 20,074 12,919 10,159 10,120 53,272
2016 20,172 12,524 10,009 10,008 52,713
Change (%) 0.5 (3.1) (1.5) (1.1) (1.0)
Impact of:
Exchange rates (%) (4.9) (4.7) (6.5) (4.6) (5.1)
Acquisitions (%) 1.7 - 0.6 0.2 0.8
Disposals (%) (0.3) (0.3) (0.2) (0.1) (0.2)
Underlying sales growth (%) 4.2 2.1 4.9 3.5 3.7
Price (%) 2.6 2.6 3.6 2.6 2.8
Volume (%) 1.6 (0.5) 1.3 1.0 0.9
Operating profit (€ million)
2015 3,637 2,298 740 840 7,515
2016 3,704 2,180 949 968 7,801
Core operating profit (€ million)
2015 3,788 2,354 775 948 7,865
2016 3,844 2,240 967 995 8,046
Operating margin (%)
2015 18.1 17.8 7.3 8.3 14.1
2016 18.4 17.4 9.5 9.7 14.8
Core operating margin (%)
2015 18.9 18.2 7.6 9.4 14.8
2016 19.1 17.9 9.7 9.9 15.3
Turnover growth is made up of distinct individual growth components namely underlying sales, currency impact, acquisitions and
disposals. Turnover growth is arrived at by multiplying these individual components on a compounded basis as there is a currency
impact on each of the other components. Accordingly, turnover growth is more than just the sum of the individual components.
Core operating profit represents our measure of segment profit or loss as it is the primary measure used for the purpose of
making decisions about allocating resources and assessing performance of segments. Core operating margin is calculated as core
operating profit divided by turnover.
17
NOTES TO THE CONDENSED FINANCIAL STATEMENTS (unaudited)
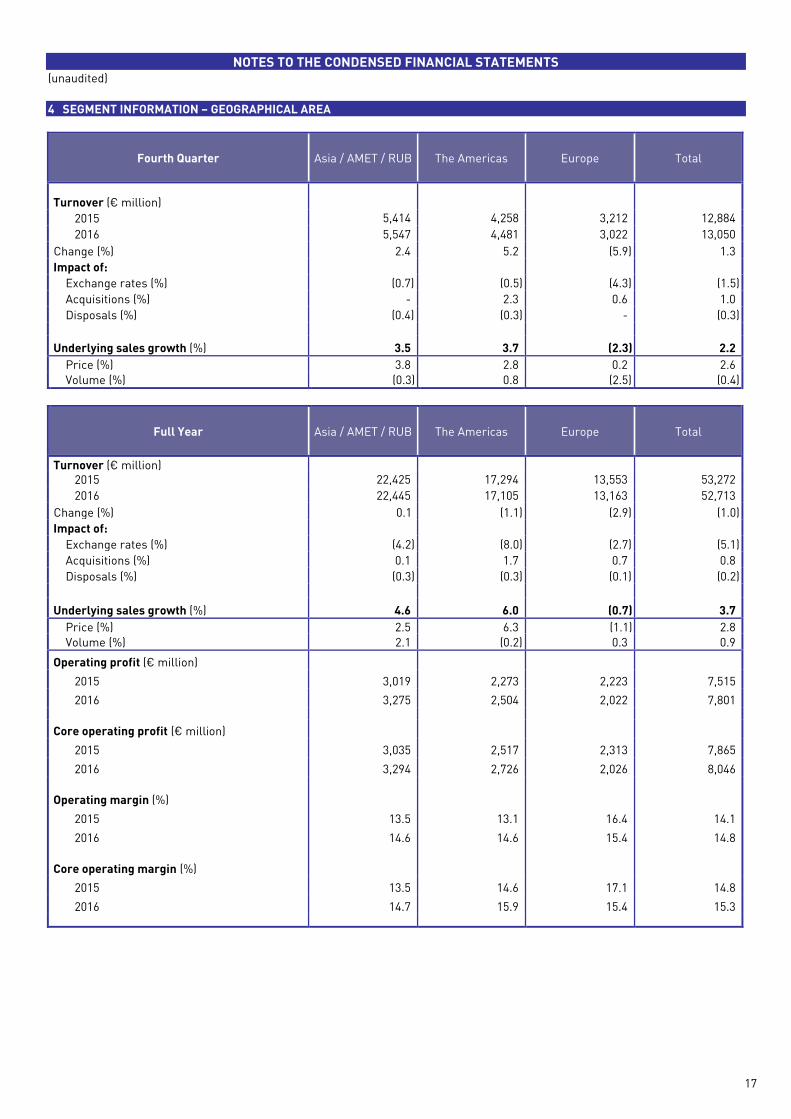
4 SEGMENT INFORMATION – GEOGRAPHICAL AREA
Fourth Quarter Asia / AMET / RUB The Americas Europe Total
Turnover (€ million)
2015 5,414 4,258 3,212 12,884
2016 5,547 4,481 3,022 13,050
Change (%) 2.4 5.2 (5.9) 1.3
Impact of:
Exchange rates (%) (0.7) (0.5) (4.3) (1.5)
Acquisitions (%) - 2.3 0.6 1.0
Disposals (%) (0.4) (0.3) - (0.3)
Underlying sales growth (%) 3.5 3.7 (2.3) 2.2
Price (%) 3.8 2.8 0.2 2.6
Volume (%) (0.3) 0.8 (2.5) (0.4)
Full Year Asia / AMET / RUB The Americas Europe Total
Turnover (€ million) 2015 22,425 17,294 13,553 53,272
2016 22,445 17,105 13,163 52,713
Change (%) 0.1 (1.1) (2.9) (1.0)
Impact of:
Exchange rates (%) (4.2) (8.0) (2.7) (5.1)
Acquisitions (%) 0.1 1.7 0.7 0.8
Disposals (%) (0.3) (0.3) (0.1) (0.2)
Underlying sales growth (%) 4.6 6.0 (0.7) 3.7
Price (%) 2.5 6.3 (1.1) 2.8
Volume (%) 2.1 (0.2) 0.3 0.9
Operating profit (€ million)
2015 3,019 2,273 2,223 7,515
2016 3,275 2,504 2,022 7,801
Core operating profit (€ million)
2015 3,035 2,517 2,313 7,865
2016 3,294 2,726 2,026 8,046
Operating margin (%)
2015 13.5 13.1 16.4 14.1
2016 14.6 14.6 15.4 14.8
Core operating margin (%)
2015 13.5 14.6 17.1 14.8
2016 14.7 15.9 15.4 15.3
18
NOTES TO THE CONDENSED FINANCIAL STATEMENTS (unaudited)
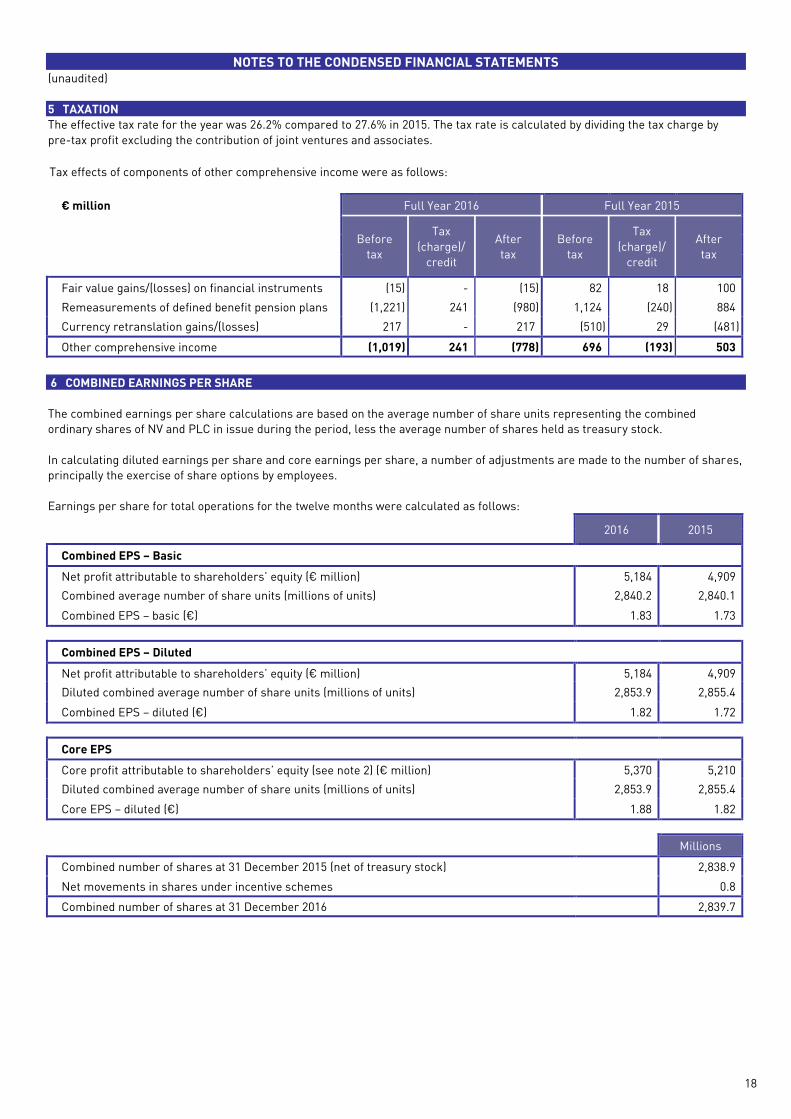
5 TAXATION
The effective tax rate for the year was 26.2% compared to 27.6% in 2015. The tax rate is calculated by dividing the tax charge by
pre-tax profit excluding the contribution of joint ventures and associates.
Tax effects of components of other comprehensive income were as follows:
€ million Full Year 2016 Full Year 2015
Before
tax
Tax
(charge)/
credit
After
tax
Before
tax
Tax
(charge)/
credit
After
tax
Fair value gains/(losses) on financial instruments (15) - (15) 82 18 100
Remeasurements of defined benefit pension plans (1,221) 241 (980) 1,124 (240) 884
Currency retranslation gains/(losses) 217 - 217 (510) 29 (481)
Other comprehensive income (1,019) 241 (778) 696 (193) 503
6 COMBINED EARNINGS PER SHARE
The combined earnings per share calculations are based on the average number of share units representing the combined
ordinary shares of NV and PLC in issue during the period, less the average number of shares held as treasury stock.
In calculating diluted earnings per share and core earnings per share, a number of adjustments are made to the number of shares,
principally the exercise of share options by employees.
Earnings per share for total operations for the twelve months were calculated as follows:
2016 2015
Combined EPS – Basic
Net profit attributable to shareholders’ equity (€ million) 5,184 4,909
Combined average number of share units (millions of units) 2,840.2 2,840.1
Combined EPS – basic (€) 1.83 1.73
Combined EPS – Diluted 2014
Net profit attributable to shareholders’ equity (€ million) 5,184 4,909
Diluted combined average number of share units (millions of units) 2,853.9 2,855.4
Combined EPS – diluted (€) 1.82 1.72
Core EPS
Core profit attributable to shareholders’ equity (see note 2) (€ million) 5,370 5,210
Diluted combined average number of share units (millions of units) 2,853.9 2,855.4
Core EPS – diluted (€) 1.88 1.82
Millions
Combined number of shares at 31 December 2015 (net of treasury stock) 2,838.9
Net movements in shares under incentive schemes 0.8
Combined number of shares at 31 December 2016 2,839.7
19
NOTES TO THE CONDENSED FINANCIAL STATEMENTS (unaudited)
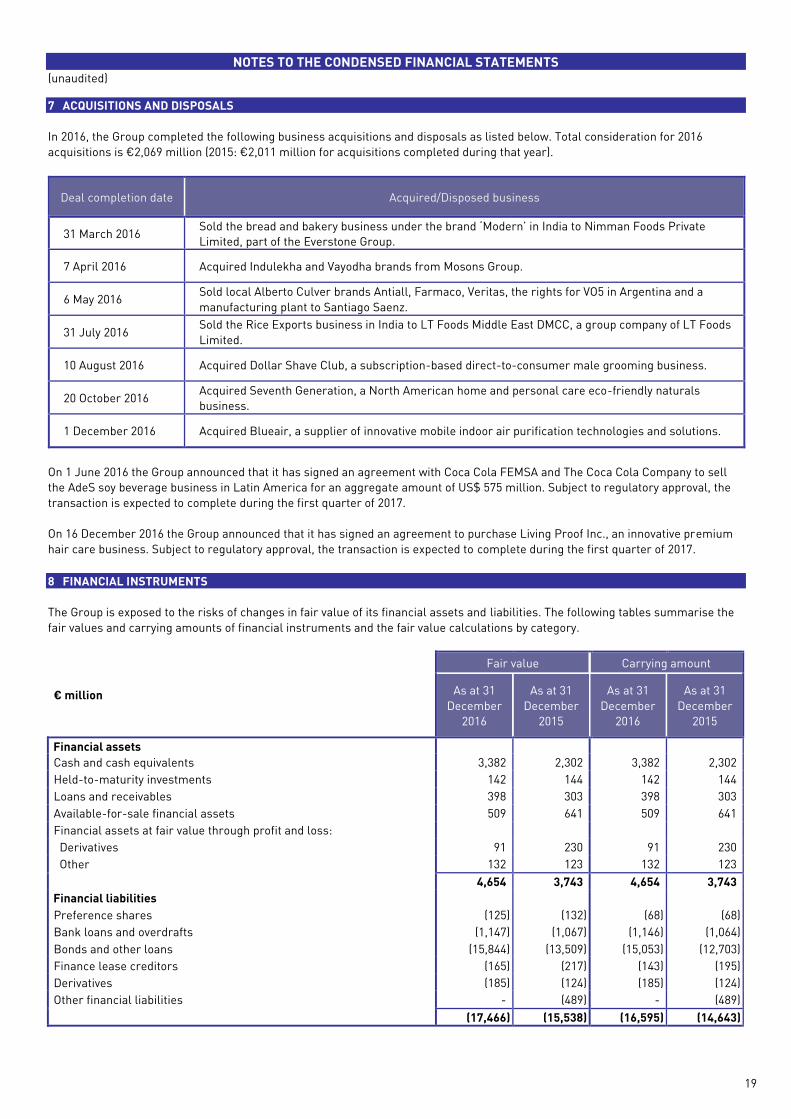
7 ACQUISITIONS AND DISPOSALS
In 2016, the Group completed the following business acquisitions and disposals as listed below. Total consideration for 2016
acquisitions is €2,069 million (2015: €2,011 million for acquisitions completed during that year).
Deal completion date Acquired/Disposed business
31 March 2016 Sold the bread and bakery business under the brand ‘Modern’ in India to Nimman Foods Private
Limited, part of the Everstone Group.
7 April 2016 Acquired Indulekha and Vayodha brands from Mosons Group.
6 May 2016 Sold local Alberto Culver brands Antiall, Farmaco, Veritas, the rights for VO5 in Argentina and a
manufacturing plant to Santiago Saenz.
31 July 2016 Sold the Rice Exports business in India to LT Foods Middle East DMCC, a group company of LT Foods
Limited.
10 August 2016 Acquired Dollar Shave Club, a subscription-based direct-to-consumer male grooming business.
20 October 2016 Acquired Seventh Generation, a North American home and personal care eco-friendly naturals
business.
1 December 2016 Acquired Blueair, a supplier of innovative mobile indoor air purification technologies and solutions.
On 1 June 2016 the Group announced that it has signed an agreement with Coca Cola FEMSA and The Coca Cola Company to sell
the AdeS soy beverage business in Latin America for an aggregate amount of US$ 575 million. Subject to regulatory approval, the
transaction is expected to complete during the first quarter of 2017.
On 16 December 2016 the Group announced that it has signed an agreement to purchase Living Proof Inc., an innovative premium
hair care business. Subject to regulatory approval, the transaction is expected to complete during the first quarter of 2017.
8 FINANCIAL INSTRUMENTS
The Group is exposed to the risks of changes in fair value of its financial assets and liabilities. The following tables summarise the
fair values and carrying amounts of financial instruments and the fair value calculations by category.
€ million
Fair value Carrying amount
As at 31
December
2016
As at 31
December
2015
As at 31
December
2016
As at 31
December
2015
Financial assets
Cash and cash equivalents 3,382 2,302 3,382 2,302
Held-to-maturity investments 142 144 142 144
Loans and receivables 398 303 398 303
Available-for-sale financial assets 509 641 509 641
Financial assets at fair value through profit and loss:
Derivatives 91 230 91 230
Other 132 123 132 123
4,654 3,743 4,654 3,743
Financial liabilities
Preference shares (125) (132) (68) (68)
Bank loans and overdrafts (1,147) (1,067) (1,146) (1,064)
Bonds and other loans (15,844) (13,509) (15,053) (12,703)
Finance lease creditors (165) (217) (143) (195)
Derivatives (185) (124) (185) (124)
Other financial liabilities - (489) - (489)
(17,466) (15,538) (16,595) (14,643)
20
NOTES TO THE CONDENSED FINANCIAL STATEMENTS (unaudited)
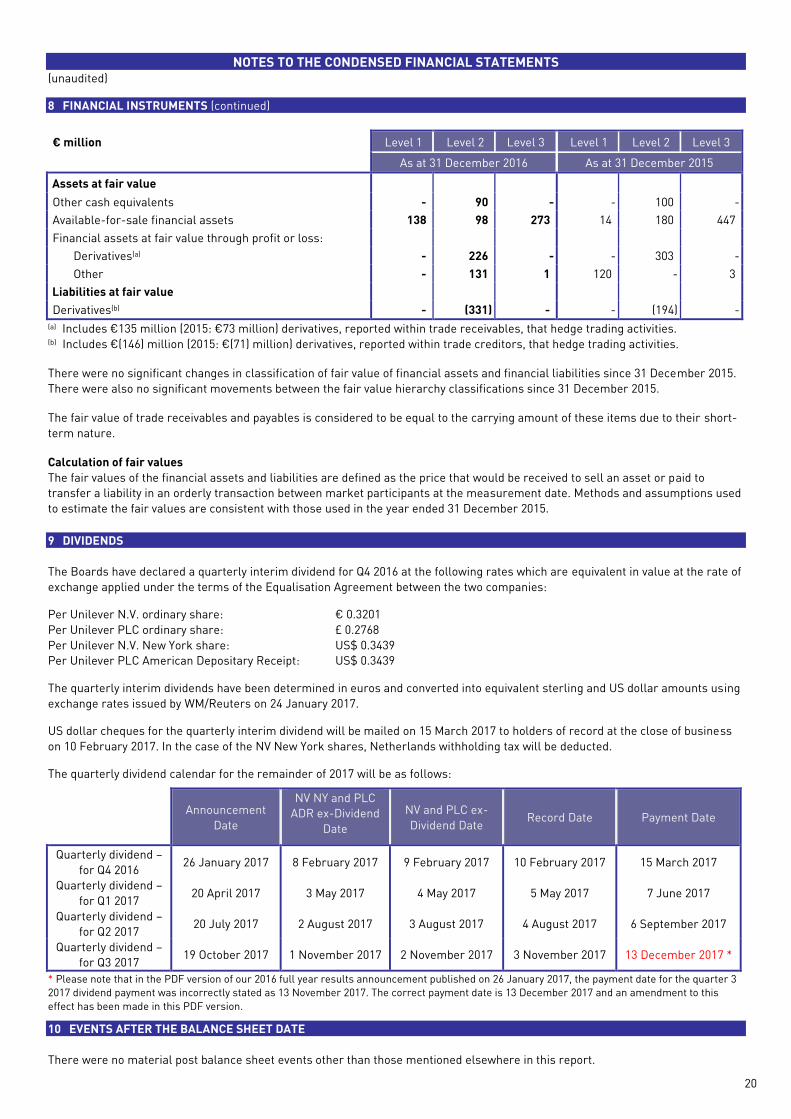
8 FINANCIAL INSTRUMENTS (continued)
€ million Level 1 Level 2 Level 3 Level 1 Level 2 Level 3
As at 31 December 2016 As at 31 December 2015
Assets at fair value
Other cash equivalents - 90 - - 100 -
Available-for-sale financial assets 138 98 273 14 180 447
Financial assets at fair value through profit or loss:
Derivatives(a) - 226 - - 303 -
Other - 131 1 120 - 3
Liabilities at fair value
Derivatives(b) - (331) - - (194) -
(a) Includes €135 million (2015: €73 million) derivatives, reported within trade receivables, that hedge trading activities. (b) Includes €(146) million (2015: €(71) million) derivatives, reported within trade creditors, that hedge trading activities.
There were no significant changes in classification of fair value of financial assets and financial liabilities since 31 December 2015.
There were also no significant movements between the fair value hierarchy classifications since 31 December 2015.
The fair value of trade receivables and payables is considered to be equal to the carrying amount of these items due to their short-
term nature.
Calculation of fair values
The fair values of the financial assets and liabilities are defined as the price that would be received to sell an asset or paid to
transfer a liability in an orderly transaction between market participants at the measurement date. Methods and assumptions used
to estimate the fair values are consistent with those used in the year ended 31 December 2015.
9 DIVIDENDS
The Boards have declared a quarterly interim dividend for Q4 2016 at the following rates which are equivalent in value at the rate of
exchange applied under the terms of the Equalisation Agreement between the two companies:
Per Unilever N.V. ordinary share: € 0.3201
Per Unilever PLC ordinary share: £ 0.2768
Per Unilever N.V. New York share: US$ 0.3439
Per Unilever PLC American Depositary Receipt: US$ 0.3439
The quarterly interim dividends have been determined in euros and converted into equivalent sterling and US dollar amounts using
exchange rates issued by WM/Reuters on 24 January 2017.
US dollar cheques for the quarterly interim dividend will be mailed on 15 March 2017 to holders of record at the close of business
on 10 February 2017. In the case of the NV New York shares, Netherlands withholding tax will be deducted.
The quarterly dividend calendar for the remainder of 2017 will be as follows:
Announcement
Date
NV NY and PLC
ADR ex-Dividend
Date
NV and PLC ex-
Dividend Date Record Date Payment Date
Quarterly dividend –
for Q4 2016 26 January 2017 8 February 2017 9 February 2017 10 February 2017 15 March 2017
Quarterly dividend –
for Q1 2017 20 April 2017 3 May 2017 4 May 2017 5 May 2017 7 June 2017
Quarterly dividend –
for Q2 2017 20 July 2017 2 August 2017 3 August 2017 4 August 2017 6 September 2017
Quarterly dividend –
for Q3 2017 19 October 2017 1 November 2017 2 November 2017 3 November 2017 13 December 2017 *
* Please note that in the PDF version of our 2016 full year results announcement published on 26 January 2017, the payment date for the quarter 3
2017 dividend payment was incorrectly stated as 13 November 2017. The correct payment date is 13 December 2017 and an amendment to this
effect has been made in this PDF version.
10 EVENTS AFTER THE BALANCE SHEET DATE
There were no material post balance sheet events other than those mentioned elsewhere in this report.