Embed Size (px)
Citation preview

GROUP
2016 Full Year
Results
Investor Call
December 2016
December 2016
Investor Call Presentation1

GROUPInvestor Call Presentation
December 2016
2
Michael Uzielli – Group Chief Financial Officer
Joined Cognita on 13th June 2016
Formerly the CFO of Heathrow Airport Holdings
Prior to Heathrow, senior positions at British Gas,
Schroders and British Airways
Introduction

GROUPInvestor Call Presentation
December 2016
3
Significant strengthening of the management team
Michael Uzielli – Group Chief Financial Officer
Joined Cognita in June 2016
Formerly the CFO of Heathrow Airport Holdings
Prior to Heathrow, senior positions at British Gas,
Schroders and British Airways
Stuart Rolland – Chief Executive Officer, Europe
Joined Cognita in March 2016
20 years of general management experience and
people leadership for organisations including Hozelock
and British Gas
Michael Drake – Chief Executive Officer, Asia
Joined Cognita in October 2016
Formerly Regional Managing Director for TNT (Asia,
Middle East and Africa)
Helen Thornton – Group Director of Human Resources
Joined Cognita in October 2016
20 years in senior HR positions for organisations
including British Airways, GNER and National Express
East Coast
Josep Caubet – Chief Executive Officer, Latin America
Joined Cognita in November 2007
Appointed CEO, Latin America in April 2013
Formerly Vice President of investment banking for
Atlas Capital Close Brothers
Dean Villa – Chief Operating Officer and Property Director
Founder member of Cognita
Formerly Property Director for Thistle Hotels following
18 years as Development Director for Whitbread plc.
Kevin Mercer – Group General Counsel
Joined Cognita in November 2015
Formerly Regional General Counsel for Ciena
Corporation (EMEA, Russia and CIS)
Chris Jansen – Group Chief Executive Officer
Joined Cognita in October 2015
Former CEO of the AA and senior executive roles at
Centrica and British Airways

GROUP
* Net Debt is shown excluding capitalised transaction costs. ** Net leverage is based on LTM Adjusted EBITDA (excluding 100% of JV) of £60.2m
December 2016
Investor Call Presentation4
All numbers included in the presentation include joint venture (JV) (St. Nicholas), unless otherwise stated
2015/16 - Financial Highlights
Year Ended 31 August
2015 2016 Change
Revenue £300.6m £330.9m +10.1%
Group Adjusted EBITDA £53.5m £61.4m +14.8%
Group Adjusted EBITDA margin 17.8% 18.6% +0.8 ppts
Capex £42.0m £59.4m +41.5%
Net Debt* £247.5m £352.6m +42.4%
Net Leverage** 4.8x 5.9x +1.1x

GROUPDecember 2016
Investor Call Presentation5
2015/16 - Operational Highlights
Early Childhood Facility, Singapore on track and on budget
Refurbishment and marketing in Hong Kong underway, education licence secured
Construction ongoing on new campus in Vietnam
Year Ended 31 August
2015 2016 Change
Students (ave FTE)
Europe 13,642 13,817 +1.3%
Asia 7,310 7,930 +8.5%
Latin America 10,812 11,848 +9.6%
Group 31,764 33,595 +5.8%
Capacity 42,063 43,544 +3.5%
Utilisation 75.5% 77.2% +1.7%

GROUP
Weaker sterling
58% of Group revenue and 82% of EBITDA in non-sterling currencies
Forward exchange contracts in place to cover Senior Secured Note repayments
Broadly neutral impact on net leverage
Student and staff recruitment and retention
Potential impact on London’s status as a financial centre
Visa requirements for students and staff may change
UK schools should be more affordable and competitive internationally
Regulatory environment to be clarified
Use of British qualifications for Spanish university entrance
Impact on Spanish students applying to British universities
December 2016
Investor Call Presentation6
Diversified, global portfolio and robust education sector
provides resilience vs Brexit uncertainty
GROUPDecember 2016
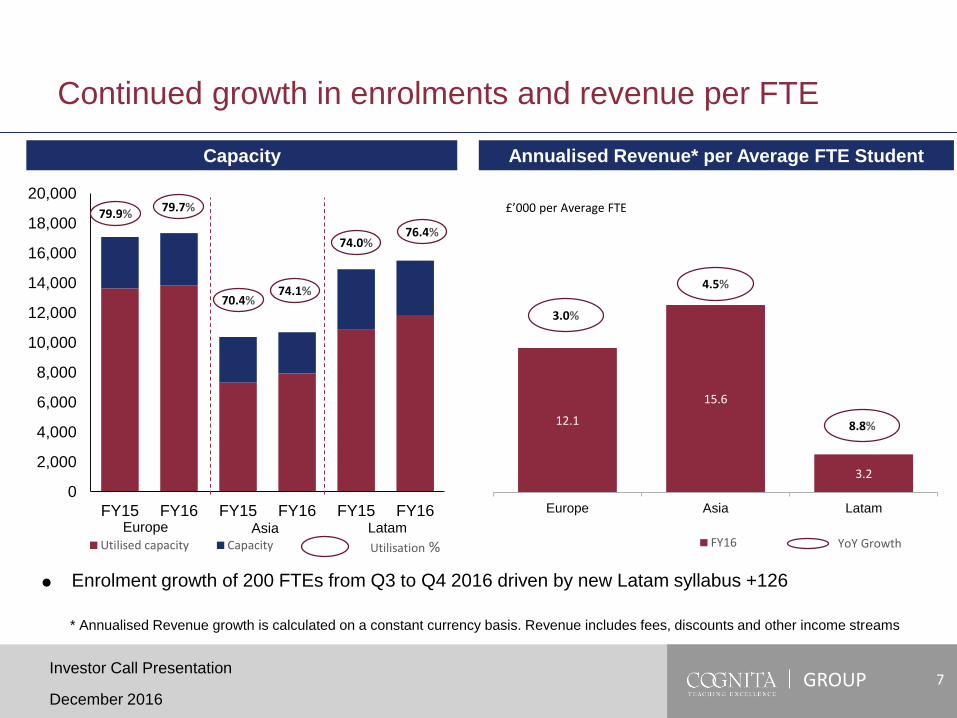
Investor Call Presentation7
Enrolment growth of 200 FTEs from Q3 to Q4 2016 driven by new Latam syllabus +126
Continued growth in enrolments and revenue per FTE
Capacity Annualised Revenue* per Average FTE Student
£’000 per Average FTE
12.1
15.6
3.2
Europe Asia Latam
FY16
8.8%
3.0%
4.5%
* Annualised Revenue growth is calculated on a constant currency basis. Revenue includes fees, discounts and other income streams
YoY Growth
0
2,000
4,000
6,000
8,000
10,000
12,000
14,000
16,000
18,000
20,000
FY15 FY16 FY15 FY16 FY15 FY16
Utilised capacity Capacity
79.7%79.9%
74.1%70.4%
76.4%74.0%
Asia Latam
Utilisation %
Europe
GROUP
Revenue
December 2016
Investor Call Presentation8
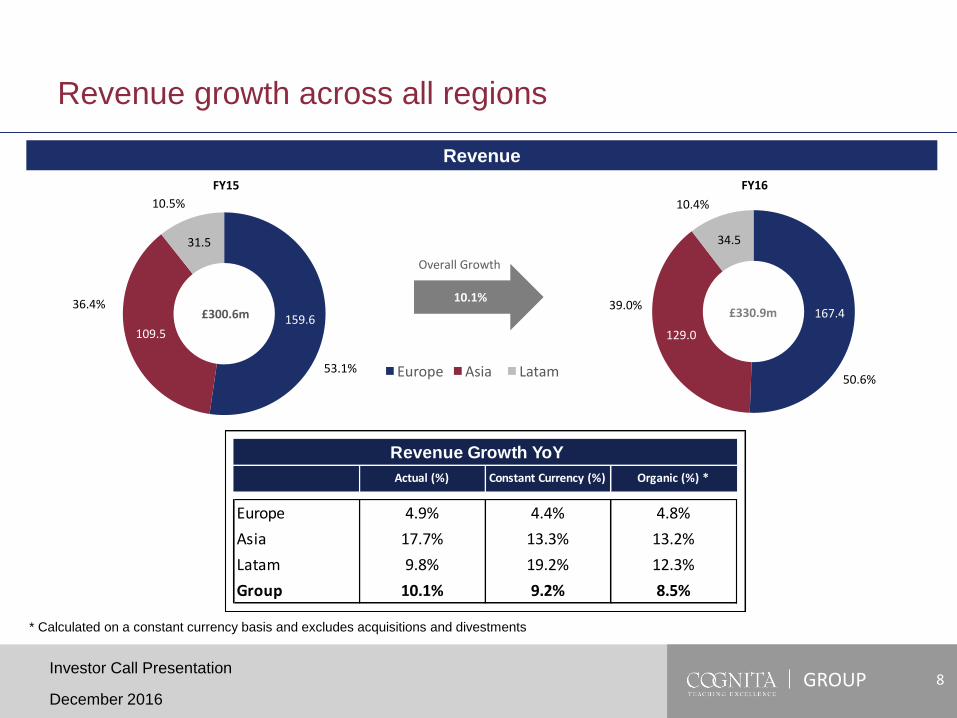
Revenue growth across all regions
159.6109.5
31.5
FY16FY15
167.4
129.0
34.5
£300.6m £330.9m
10.4%
50.6%
39.0%
10.5%
53.1%
36.4%10.1%
Overall Growth
Europe Asia Latam
Revenue Growth YoY
Europe 4.9% 4.4% 4.8%
Asia 17.7% 13.3% 13.2%
Latam 9.8% 19.2% 12.3%
Group 10.1% 9.2% 8.5%
Actual (%) Constant Currency (%) Organic (%) *
* Calculated on a constant currency basis and excludes acquisitions and divestments

GROUP
* Regional Adjusted EBITDA is calculated as Group Adjusted EBITDA of £61.4m (2015: £53.5m) before Group Central Costs of £9.8m (2015: £8.2m)
** Calculated on a constant currency basis and excludes acquisitions and divestments
December 2016
Investor Call Presentation9
Regional Adjusted EBITDA grew by over 15%
Regional Adjusted EBITDA*
26.0
29.1
6.6
26.8
37.5
6.9
Europe Asia Latam
15.4%£61.7m £71.2m
9.7%
37.6%
52.7%
10.7%
42.1%
47.2%
Regional Adjusted
EBITDA Margin
21.0%
26.6%
16.3%
Regional Adjusted
EBITDA Margin
19.9%
29.1%
16.0%
FY16FY15
Overall Growth
EBITDA Growth YoY
Europe 3.0% 2.4% 9.7%
Asia 28.9% 24.0% 24.3%
Latam 4.6% 12.1% 11.8%
Regional 15.4% 13.6% 17.0%
Actual (%) Constant Currency (%) Organic (%) **

GROUPDecember 2016
Investor Call Presentation10
Cost discipline and EBITDA growth
£’m
163.4 177.6
83.691.9
247.0269.5
FY15 FY16
Staff Costs Other Op. Costs
53.7%
81.4%
£’m
53.561.4
FY15 FY16
17.8%
18.6%
Group Adjusted EBITDA MarginCosts % Group Revenue
54.4%
27.8%
Underlying Operating Costs Group Adjusted EBITDA
+0.8 ppts
+14.8%27.8%
82.2%
GROUPDecember 2016
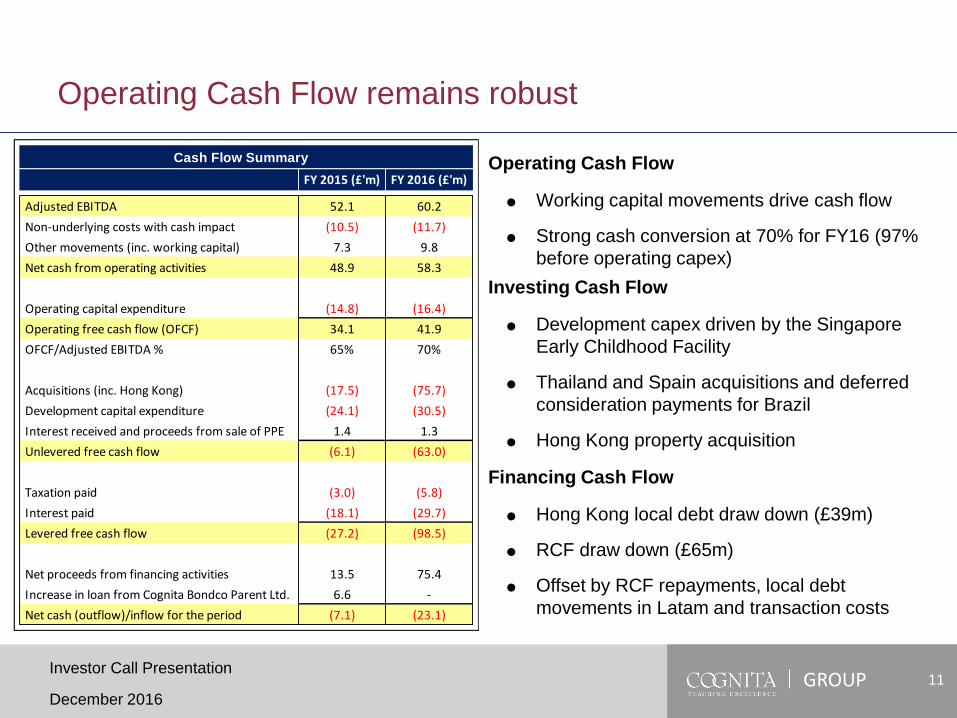
Operating Cash Flow
Working capital movements drive cash flow
Strong cash conversion at 70% for FY16 (97%
before operating capex)
Investing Cash Flow
Development capex driven by the Singapore
Early Childhood Facility
Thailand and Spain acquisitions and deferred
consideration payments for Brazil
Hong Kong property acquisition
Financing Cash Flow
Hong Kong local debt draw down (£39m)
RCF draw down (£65m)
Offset by RCF repayments, local debt
movements in Latam and transaction costs
11
Operating Cash Flow remains robust
FY 2015 (£'m) FY 2016 (£'m)
Adjusted EBITDA 52.1 60.2
Non-underlying costs with cash impact (10.5) (11.7)
Other movements (inc. working capital) 7.3 9.8
Net cash from operating activities 48.9 58.3
Operating capital expenditure (14.8) (16.4)
Operating free cash flow (OFCF) 34.1 41.9
OFCF/Adjusted EBITDA % 65% 70%
Acquisitions (inc. Hong Kong) (17.5) (75.7)
Development capital expenditure (24.1) (30.5)
Interest received and proceeds from sale of PPE 1.4 1.3
Unlevered free cash flow (6.1) (63.0)
Taxation paid (3.0) (5.8)
Interest paid (18.1) (29.7)
Levered free cash flow (27.2) (98.5)
Net proceeds from financing activities 13.5 75.4
Increase in loan from Cognita Bondco Parent Ltd. 6.6 -
Net cash (outflow)/inflow for the period (7.1) (23.1)
Cash Flow Summary
Investor Call Presentation

GROUPDecember 2016
Investor Call Presentation12
Higher development capex
Operating Capex
£’m
8.810.2
4.6
4.8
1.4
1.4
FY15 FY16
Europe Asia Latam
16.4
Development Capex*
£’m
14.8
4.5 6.5
20.6
34.1
2.1
2.4
FY15 FY16
Europe Asia Latam
27.2
43.0
FY16 development capex includes £27m (2015: £15m) for Singapore Early Childhood Facility
* Development capex excludes £65m for HK property acquisition in April 2016
GROUP
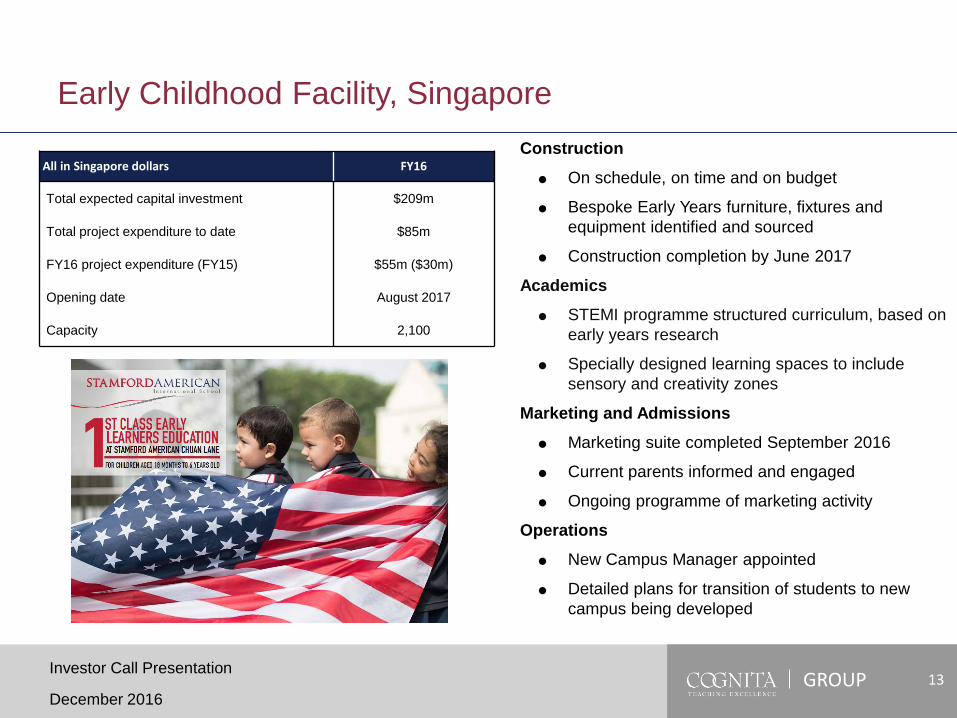
Construction
On schedule, on time and on budget
Bespoke Early Years furniture, fixtures and
equipment identified and sourced
Construction completion by June 2017
Academics
STEMI programme structured curriculum, based on
early years research
Specially designed learning spaces to include
sensory and creativity zones
Marketing and Admissions
Marketing suite completed September 2016
Current parents informed and engaged
Ongoing programme of marketing activity
Operations
New Campus Manager appointed
Detailed plans for transition of students to new
campus being developed
December 2016
Investor Call Presentation13
Early Childhood Facility, Singapore
All in Singapore dollars FY16
Total expected capital investment $209m
Total project expenditure to date $85m
FY16 project expenditure (FY15) $55m ($30m)
Opening date August 2017
Capacity 2,100
GROUP
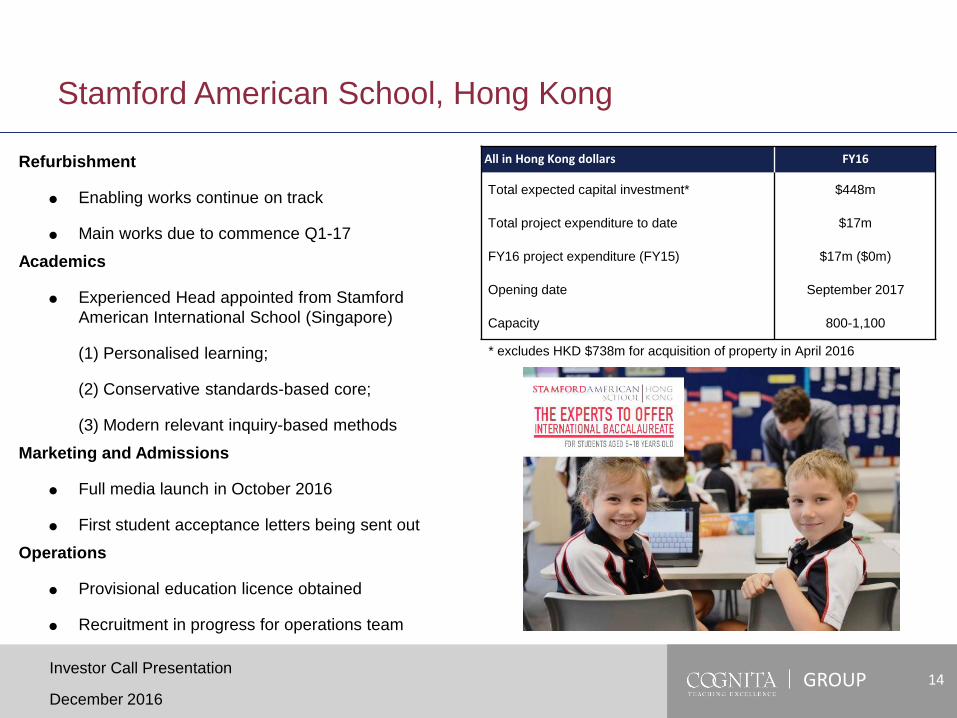
Refurbishment
Enabling works continue on track
Main works due to commence Q1-17
Academics
Experienced Head appointed from Stamford
American International School (Singapore)
(1) Personalised learning;
(2) Conservative standards-based core;
(3) Modern relevant inquiry-based methods
Marketing and Admissions
Full media launch in October 2016
First student acceptance letters being sent out
Operations
Provisional education licence obtained
Recruitment in progress for operations team
14
Stamford American School, Hong Kong
All in Hong Kong dollars FY16
Total expected capital investment* $448m
Total project expenditure to date $17m
FY16 project expenditure (FY15) $17m ($0m)
Opening date September 2017
Capacity 800-1,100
* excludes HKD $738m for acquisition of property in April 2016
December 2016
Investor Call Presentation
GROUPDecember 2016
Investor Call Presentation15
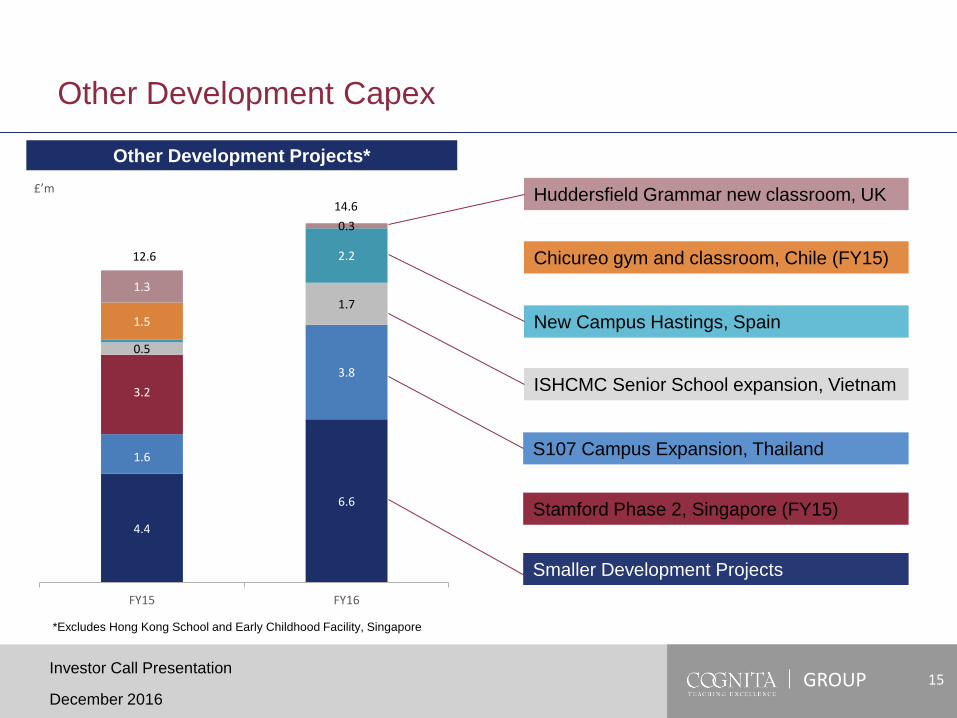
Other Development Capex
Other Development Projects*
£’m
4.4
6.6
1.6
3.8
3.2
0.5
1.7
2.2
1.5
1.3
0.3
FY15 FY16
12.6
14.6
*Excludes Hong Kong School and Early Childhood Facility, Singapore
Huddersfield Grammar new classroom, UK
Chicureo gym and classroom, Chile (FY15)
New Campus Hastings, Spain
ISHCMC Senior School expansion, Vietnam
Stamford Phase 2, Singapore (FY15)
S107 Campus Expansion, Thailand
Smaller Development Projects

GROUP
New campus for ISHCMC
Adding capacity of c.900
16
Other Development Capex ̶ Asia expansion
Expansion in S107 completed August 2016
Opened to students with capacity of c.350
ThailandVietnam
December 2016
Investor Call Presentation
GROUP
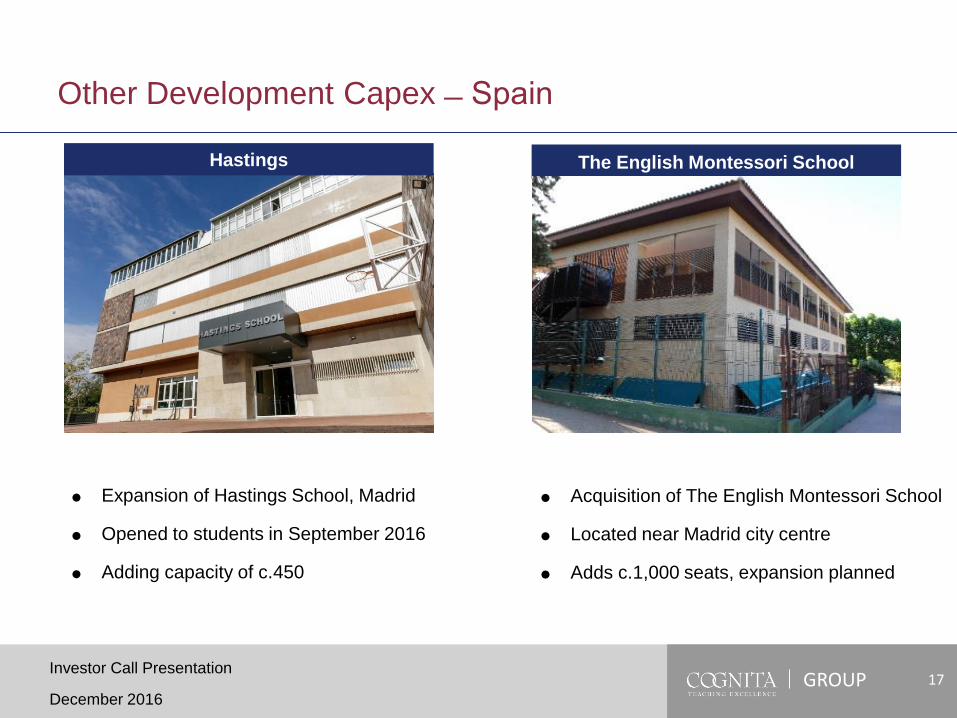
Expansion of Hastings School, Madrid
Opened to students in September 2016
Adding capacity of c.450
17
Other Development Capex ̶ Spain
Acquisition of The English Montessori School
Located near Madrid city centre
Adds c.1,000 seats, expansion planned
The English Montessori SchoolHastings
December 2016
Investor Call Presentation
GROUP
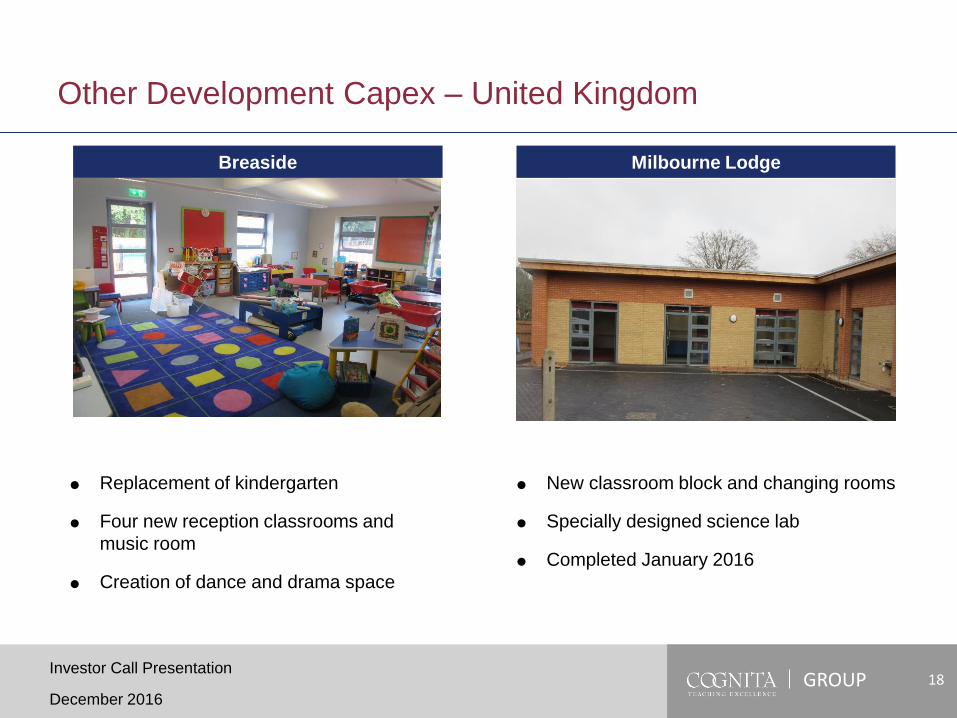
Replacement of kindergarten
Four new reception classrooms and
music room
Creation of dance and drama space
18
Other Development Capex – United Kingdom
Breaside
New classroom block and changing rooms
Specially designed science lab
Completed January 2016
Milbourne Lodge
December 2016
Investor Call Presentation

GROUP 19
Other Development Capex – Latin America
Brazil
GayLussac construction commencing Dec
2016 (c.£3m)
9 classrooms, additional capacity of c.260
New restaurant, arts classroom, reading
room, covered playground, football field
Chile
Ten new classrooms across four schools,
creating additional capacity of over 300
New gym complex at Curauma
December 2016
Investor Call Presentation

GROUP
Pro forma measures
Pro forma adjusted EBITDA is LTM adjusted
EBITDA plus 50% share of the Joint Venture and
the full year impact of the pro forma adjustments
Adjusted cash pay interest expense is £26.8m
being LTM net interest expense, adjusted for the
August 2016 Bond and RCF refinancing
20
Net Debt and Leverage – Cognita Bondco Group
FY 2016
(£'m)
Cash (61.0)
Senior Secured Notes (SSN) 280.0
SSN Accrued Interest 0.5
Revolving Credit Facility 45.6
Finance Leases 3.4
Net Senior Secured Debt 268.5
Local bank debt (inc. accrued interest) 84.1
Net Debt 352.6
FY 2016FY 2016
Pro forma
LTM Adjusted EBITDA (£'m) 60.2 64.6
Net senior leverage 4.5x 4.2x
Total net leverage 5.9x 5.5x
Interest cover 2.2x 2.4x
The table above excludes capitalised transaction costs
December 2016
Investor Call Presentation

GROUP
Business as usual/organic
Continued growth across the group
Opening pupil numbers c. 5% higher than the previous year
Expansions
Development of Early Childhood Facility, Singapore continues to run to schedule
ISHCMC and Spain expansion projects on schedule
GayLussac expansion due to start December 2016
Acquisitions
Hong Kong licence obtained, school to open in September 2017
The English Montessori School in Madrid (Spain) acquired in September
Outstanding 49% of DDEE (Chile) acquired in October
Usual pipeline of acquisitions and activity
December 2016
Investor Call Presentation21
Outlook – Organic growth to be boosted by investments

GROUP
Appendices
December 2016
Investor Call Presentation22

GROUP
Group EBITDA is calculated excluding the following non-underlying costs:
Acquisition and business exploration costs of £4.6m FY16 (FY15: £6.6m) incurred on business
development in new regions and countries. The total cost directly attributable to acquisitions was £0.9m.
Restructuring and one-off advisory costs of £7.1m FY16 (FY15: £3.9m) related to one-off redundancy
payments, restructuring costs and the review of the Group's child safeguarding policies/procedures. The
FY16 charge includes a £2.5m provision relating to the closure of two UK schools.
23
EBITDA Reconciliation
FY15 (£'m) FY16 (£'m)
Group EBITDA (includes 100% of joint venture) 51.9 57.5
Share Based Payments (non-cash) 1.6 4.0
Group Adjusted EBITDA (includes 100% of joint venture) 53.5 61.4
Less: Joint Venture (100%) (1.4) (1.2)
Adjusted EBITDA (excludes 100% of joint venture) 52.1 60.2
EBITDA
December 2016
Investor Call Presentation

GROUP 24
Pro Forma Capitalisation (copy from October 2016 for information only)
(1) Indicates aggregate principal amount of notes(2) Includes accrued interest on refinanced debt, financing fees and related expenses(3) Based on unaudited LTM Aug-16 adjusted EBITDA of £60m, based on our unaudited management accounts and information currently available, and pro forma for (a) Impact from UK school closures of
£2.0m (b) Full year pro forma adjustments for Sitges and Dusit acquisitions and Chicauma school opening of £0.2 MM (c) Impact from increased capacity at Cannonbury of £1.0m (d) Full year pro forma adjustment for acquisition of school in Spain, completed in Sep-16, of £1.0m
December 2016
Investor Call Presentation
£m
45.4
2.2
47.6
Particulars Adjustments Pro Formax LTM Preliminary
PF Adj EBITDA
Cash (2.6) 55.8
Revolving Credit Facility (45.4) -
Senior Secured Notes 45.0 325.0
Accrued Interest - 1.2
Finance Leases - 3.4
Net Senior Secured Debt 2.2 273.8 4.3x
Other Bank Debt - 85.7
Capitalised Fees (net of Premium) (2.1) (15.3)
Net Total Debt 0.1 344.2 5.5x
LTM Pro forma Adjusted EBITDA (Aug-16) 63.7(3)
Sources and Uses
Pro Forma Capitalisation
Total Sources
73.5
21.5
280.0
Preliminary Aug-16
Unaudited
58.4
45.4
280.0
3.4
Sources
Additional Senior Secured Notes Tap Offered Hereby(1)
Cash on Hand
£m
45.0
2.6
47.6
6.4
3.2
237.6
71.2
(12.4)
296.4
May-16 Reported
63.7(3)
344.1
(13.2)
85.7
271.6
1.2
Uses
Repayment of Revolving Credit Facility
Accrued Interest and Transaction Costs(2)
Total Uses

GROUP 25
Cognita Schools
* The school property purchased in Hong Kong will not be an operational school until August 2017. This school is therefore excluded from this list.
December 2016
Investor Call Presentation
Cognita Group (68) *
Asia (9) * Europe (47) Latin America (12)
Singapore (2) United Kingdom (41) Brazil (2)
Australian International School (AIS)
Stamford American International School (SAIS) Akeley Wood Schools (2) Southbank International School (3) Escola Cidade Jardim/PlayPen
Breaside Preparatory School St Clare’s School Instituto GayLussac
Vietnam (3) Charterhouse Square School St Margaret’s Preparatory School
International School Ho Chi Minh City (ISHCMC) Clifton Lodge School St Mary’s School Chile (10)
American Academy (AAVN) Colchester High School St Nicholas Preparatory School
International School Saigon Pearl Cumnor House School for Boys Colegio Manquecura, Ciudad de los Valles
Cumnor House School for Girls Colegio Manquecura, Ciudad del Este
Thailand (4) Downsend Schools (4) Colegio Manquecura, Valle Lo Campino
Duncombe School Colegio Pumahue, Chicureo
St Andrews International School Sathorn Glenesk School Colegio Pumahue, Chicauma
St Andrews International School Green Valley Hendon Preparatory School Colegio Pumahue, Curauma
St Andrews International School Sukhumvit 107 Huddersfield Grammar School Colegio Pumahue, Huechuraba
St Andrews International School Bangkok Dusit Hydesville Tower School Colegio Pumahue, Peñalolén
King’s School and Nursery Colegio Pumahue, Puerto Montt
Kingscourt School Colegio Pumahue, Temuco
Europe (47)
Spain (6) Meoncross School
Milbourne Lodge Preparatory School
British School of Barcelona North Bridge House Schools (5)
Hastings School, Madrid Oakfields Montessori School
El Limonar International School, Murcia Oakleigh House School
El Limonar International School, Villamartin Oxford House School
International School of Barcelona, Sitges Polam School
The English Montessori School, Madrid Quinton House School
Sackville School
Salcombe Preparatory School
Long Close School

GROUP
Group EBITDA is calculated as profit/(loss) on ordinary activities
before taxation, before net interest, depreciation and amortisation
and impairments of tangible and intangible fixed assets and non-
underlying income/(expenses)
Non-underlying income/(expenses) includes acquisition,
business exploration expenses and restructuring and exceptional
advisory costs, loss on disposal of fixed assets, school pre-
opening losses and non-cash share based payment expense
Group Adjusted EBITDA is calculated as Group EBITDA before
share based payment charges
Share based payment charges are non-cash expenses
associated with the 2013 management incentive plan awards
Adjusted EBITDA is calculated as Group Adjusted EBITDA less
joint venture
Regional Adjusted EBITDA is calculated as Group Adjusted
EBITDA before Group Central Costs
Unless otherwise indicated Group EBITDA and Group Adjusted
EBITDA measures include 100% of the joint venture (JV), St.
Nicholas Preparatory School
Pro forma adjusted EBITDA is LTM adjusted EBITDA adjusted
for 50% share of the Joint Venture and the full year impact of the
pro forma adjustments made in line with the terms of the indenture
Net Senior Leverage (NSL) Net Senior Secured Debt
LTM Adjusted EBITDA
Total Leverage Net Debt
LTM Adjusted EBITDA
Interest Cover LTM Adjusted EBITDA
Adjusted cash pay
interest expense
26
Key Terms, Definitions and Ratios
AIS Australian International School
SAIS Stamford American International School
FTE Full time equivalent students or staff
SSN Senior Secured Notes
RCF Revolving Credit Facility
Like for like at constant currency excluding acquisitions
FY Financial Year
Period 12 months ended 31 August
YoYYTD comparison i.e. 12 months ended 31 August
2016 compared to 12 months ended 31 August 2015
December 2016
Investor Call Presentation
GROUP
Any information in this presentation that is not a historical fact is a “forward-looking statement”. Such statements may include
opinions and expectations regarding Cognita Bondco Parent Limited ( the ‘Company’) and its future business, Management’s
confidence and strategies as well as details of Management’s expectations of global economic and regulatory trends.
Such forward-looking statements involve known and unknown risks, uncertainties and other important factors beyond the
Company's and/or its Management control that could cause the actual results, performance or achievements of the Company
to be materially different from future results, performance or achievements expressed or implied by such forward-looking
statements. While the Company believes that its assumptions concerning future events are reasonable, there are inherent
difficulties in predicting certain important factors that could impact the future performance or results of the Company’s
business. Accordingly, such statements should not be regarded as representations as to whether such anticipated events will
occur nor that expected objectives will be achieved. The Company expressly disclaims any intention or obligation to revise or
update any forward-looking statements, whether as a result of new information, future events, or otherwise.
In this presentation, the Company makes references to Group EBITDA, Group Adjusted EBITDA, Adjusted EBITDA, Regional
Adjusted EBITDA and EBITDA margin, which are not defined under International Financial Reporting Standards, as issued by
the International Accounting Standards Board and as adopted by the European Union (“IFRS”). The items excluded from
Group EBITDA, Group Adjusted EBITDA, Adjusted EBITDA, Regional Adjusted EBITDA and EBITDA margin are significant
in assessing the Company’s operating results and liquidity. Group EBITDA, Group Adjusted EBITDA, Adjusted EBITDA,
Regional Adjusted EBITDA and EBITDA margin have limitations as analytical tools and should not be considered in isolation
from, or as a substitute for, analysis of the Company’s results as reported under IFRS. Other companies in the Company’s
industry and in other industries may calculate Group EBITDA, Group Adjusted EBITDA, Adjusted EBITDA, Regional Adjusted
EBITDA and EBITDA margin differently from the way that the Company does, limiting their usefulness as comparative
measures.
Cognita Bondco Parent Limited is a new company and as such does not have comparative figures for the prior year.
Management have included the results of Cognita Holdings Limited to assist the reader of this presentation.
27
Important Information
December 2016
Investor Call Presentation

GROUP
We have prepared this document solely for informational purposes. You should not definitively rely upon it or use it to form the definitive basis for
any decision, contract, commitment or action whatsoever, with respect to any proposed transaction or otherwise. You and your directors, officers,
employees, agents and affiliates must hold this document and any oral information provided in connection with this document in strict confidence
and may not communicate, reproduce, distribute or disclose it to any other person, or refer to it publicly, in whole or in part at any time except with
our prior written consent. If you are not the intended recipient of this document, please delete and destroy all copies immediately.
We have prepared this document and the analyses contained in it based, in part, on certain assumptions and information obtained by us from the
recipient, its directors, officers, employees, agents, affiliates and/or from other sources. Our use of such assumptions and information does not
imply that we have independently verified or necessarily agree with any of such assumptions or information, and we have assumed and relied
upon the accuracy and completeness of such assumptions and information for purposes of this document. Neither we nor any of our affiliates, or
our or their respective officers, employees or agents, make any representation or warranty, express or implied, in relation to the accuracy or
completeness of the information contained in this document or any oral information provided in connection herewith, or any data it generates and
accept no responsibility, obligation or liability (whether direct or indirect, in contract, tort or otherwise) in relation to any of such information. We
and our affiliates and our and their respective officers, employees and agents expressly disclaim any and all liability which may be based on this
document and any errors therein or omissions therefrom. Neither we nor any of our affiliates, or our or their respective officers, employees or
agents, make any representation or warranty, express or implied, that any transaction has been or may be effected on the terms or in the manner
stated in this document, or as to the achievement or reasonableness of future projections, management targets, estimates, prospects or returns, if
any. Any views or terms contained herein are preliminary only, and are based on financial, economic, market and other conditions prevailing as of
the date of this document and are therefore subject to change. We undertake no obligation or responsibility to update any of the information
contained in this document. Past performance does not guarantee or predict future performance.
This document and the information contained herein do not constitute an offer to sell or the solicitation of an offer to buy any security, commodity
or instrument or related derivative, nor do they constitute an offer or commitment to lend, syndicate or arrange a financing, underwrite or purchase
or act as an agent or advisor or in any other capacity with respect to any transaction, or commit capital, or to participate in any trading strategies,
and do not constitute legal, regulatory, accounting or tax advice to the recipient. We recommend that the recipient seek independent third party
legal, regulatory, accounting and tax advice regarding the contents of this document. This document does not constitute and should not be
considered as any form of financial opinion or recommendation by us or any of our affiliates.
December 2016
Investor Call Presentation28
Disclaimer