Embed Size (px)
Citation preview
2016 FIRST-HALF FINANCIAL REPORT
GAZTRANSPORT & TECHNIGAZ
A joint stock limited liability company (Société Anonyme) with a Board of Directors and share capital of 370,783,57 euros
Registered office: 1 Route de Versailles – 78470 Saint-Rémy-lès-Chevreuse, France
Page2
Versailles Trade and Companies Register No. 662 001 403
Table of contents
STATEMENT OF THE PERSON RESPONSIBLE .................................................................. 3
FIRST HALF MANAGEMENT REPORT ............................................................................. 4
1. KEY BUSINESS HIGHLIGHTS FOR THE FIRST HALF.................................................................... 4
2. SUBSIDIARY ACTIVITIES ................................................................................................... 6
3. ANALYSIS OF RESULTS FOR THE FIRST HALF OF 2016............................................................. 8
4. GTT BALANCE SHEET ANALYSIS ...................................................................................... 13
5. OUTLOOK .................................................................................................................. 15
6. THIRD PARTY TRANSACTIONS ......................................................................................... 15
RISK FACTORS .............................................................................................................. 15
HALF-YEAR CONDENSED FINANCIAL STATEMENTS ..................................................... 16
STATUTORY AUDITOR’S REVIEW REPORT ON THE HALF-YEARLY FINANCIAL INFORMATION ............................................................................................................. 35
Page3
STATEMENT OF THE PERSON RESPONSIBLE
“I certify that, to the best of my knowledge, the condensed financial statements for the 2015 first half year have been prepared in accordance with the applicable accounting standards (IFRS), and give a true and fair view of the assets and liabilities, the financial position and results of the Company, and that the half-year management report attached provides a fair view of the main events of the first six months of the year, their impact on the condensed financial statements, the significant transactions with related parties, and a description of the main risks and uncertainties for the next six months of this financial year.” July 21, 2016 Philippe Berterottière, Chairman and Chief Executive Officer
Page4
FIRST HALF MANAGEMENT REPORT
KEY BUSINESS HIGHLIGHTS FOR THE FIRST HALF
1/ Order book at a high level
Since January 1, 2016, the GTT order book has changed, with:
- 13 deliveries:
11 LNG carriers
1 FSRU1
1 FLNG2 - 2 new orders for LNG carriers
At June 30, 2016, the order book stood at 107 units:
- 96 LNG and ethane carriers - 6 FSRUs - 2 FLNGs - 2 onshore storage tanks - 1 LNG bunker barge
During the first half of 2016, GTT’s activity saw a number of highlights: o LNG carriers: In early June, GTT received an order from the Korean shipyard Hyundai
Heavy Industries (HHI) to equip two new LNG carriers with the Mark III Flex technology. The ships will be built for the Korean ship-owner SK Shipping. Delivery is expected to take place in 2019.
o FLNG: In May, the first floating LNG liquefaction and storage unit (FLNG) was delivered by the DSME shipyard to the Malaysian company Petronas. Equipped with the NO96 membrane, this FLNG will eventually have the capacity to produce 1.2 million metric tonnes per year and store 177,000 m3 of LNG on-board. To date, GTT's technologies have been selected to outfit the only three FLNGs ordered worldwide.
o Development of industrial partnerships to accelerate the development of the LNG fuel chain: During the first half of 2016, GTT signed technical assistance and licence agreements with two new outfitters (subcontractor installers): AG&P in the Philippines and Endel in France. These partnerships make it possible to offer companies in the LNG logistics chain appropriate solutions that meet their specific needs, while benefiting from reduced delivery times and costs.
1 Floating Storage and Regasification Unit 2 Floating Liquefied Natural Gas vessel: LNG liquefaction unit
Page5
2/ Combined Shareholders Meeting
GTT’s annual combined shareholders meeting took place on May 18, 2016, chaired by Philippe Berterottière, Chairman and Chief Executive Officer, at Domaine de Saint-Paul, Saint-Rémy-lès-Chevreuse. All resolutions put to the shareholders meeting were adopted. The shareholders approved the financial statements for the 2015 financial year and voted a dividend of 2.66 euros per share, it being stipulated that an interim dividend of 1.30 euro per share had already been paid on September 30, 2015. The Shareholders’ Meeting approved the co-option of Andrew Jamieson, Sandra Lagumina, Françoise Leroy and Benoît Mignard to the Board of Directors.
3/ Opening of an office in China
In June 2016, the Company opened its China office: GTT China. This office will allow the Company to be closer to its customers and partners in China and to provide the best support to this country's growing LNG needs.
4/ Participation in exhibitions and seminar sponsorships
GTT takes part in major industry trade shows and creates opportunities for regular exchanges of views and feedback with its customers, partners and potential customers during theme-based seminars. During these high-visibility events, GTT highlights its technological innovations and new services on offer.
GTT has renewed its presence at the LNG 18 (Perth, Australia - April 2016) and Posidonia (Athens, Greece - June 2016) exhibitions. LNG 18 is a key event for GTT. This year, offshore services took centre stage, particularly with the showcasing of "Prelude", the very first FLNG project led by Shell. During the Posidonia event, the Company met with the Greek shipyards and ship-owners regarding the subject of LNG as a marine fuel, including the associated logistics chain, and its range of services.
In February, GTT invited Japanese industry players to discuss the specific features of small and mid-scale LNG carriers during a seminar held in Tokyo, Japan. During this event, GTT presented the latest developments in the services related to LNG as a marine fuel, as well as the recent changes in the Mark technologies.
Page6
SUBSIDIARY ACTIVITIES
Cryovision, a GTT subsidiary created in 2012, offers innovative services to ship-owners and terminal operators: thermal camera membrane inspection (Thermal Assessment of Membrane Integrity (TAMI test)) and installation of monitoring systems, and management and optimisation tools for boil-off. Cryovision experienced sustained activity for the first half of 2016 with TAMI inspections completed on 17 tanks, acoustic emissions tests completed on 12 tanks, and two installations of Sloshield, the management solution for sloshing.
GTT North America, an American GTT subsidiary created in 2013, continued its business development on the American continent. During the first half of the year, it signed, with GTT Training, a contract with TOTE (the ship-owner of the barge under construction at the Conrad shipyard) for the development and implementation of a comprehensive LNG training program for the barge and tugboat crew.
GTT North America also signed contracts for feasibility and modifications studies to be made to vessels in service.
Finally, the US National Fire Protection Association (NFPA) recently included the membrane tank system to the list of full integrity containment technologies recognised for the onshore storage of LNG in the 2016 edition of the NFPA code. This is an internationally recognised standard in the LNG industry.
GTT Training Ltd, a subsidiary created in 2014, received its first orders for its simulation software for LNG cargo operations from L-3 Communication/Chevron and Teekay Shipping. This software makes it possible to provide training using 12 different LNG carrier configurations.
GTT Training also received, through the GTT North America subsidiary, orders for the development of simulation software for LNG bunkering and for the initial training of the crews that will be responsible for performing these operations on the LNG bunker barge under construction at Conrad Shipyard.
GTT Training Ltd also provides training on subjects associated with GTT technologies, LNG as a fuel and LNG operations.
Cryometrics, a wholly owned GTT subsidiary created in November 2015, markets services that help to improve the performance and operational flexibility of LNG carriers. LNG Advisor ensures the transmission in real time, at sea and on land, of reliable data relating to the energy performance of the vessel. Sloshield, available since 2014, makes it possible to monitor sloshing activity inside tanks in real time.
GTT South East Asia (GTT SEA), a GTT subsidiary established in Singapore in 2015, performs business development activities on behalf of GTT in the Asia-Pacific region. The first half of
Page7
2016 saw the signature of a licensing agreement with Atlantic, Gulf and Pacific of Manila (AG&P), a subcontractor installer (outfitter). This agreement will enable GTT to develop its presence in small-scale LNG chains, LNG bunkering, as well as onshore storage, which are growing sectors in South-East Asia. This Singapore presence also permits GTT to strengthen its collaboration with its long-term partners in ship repair in Singapore, as well as the LNG players in the region.
Due to its business development activities on behalf of GTT, this subsidiary is not expected to generate revenue.
Page8
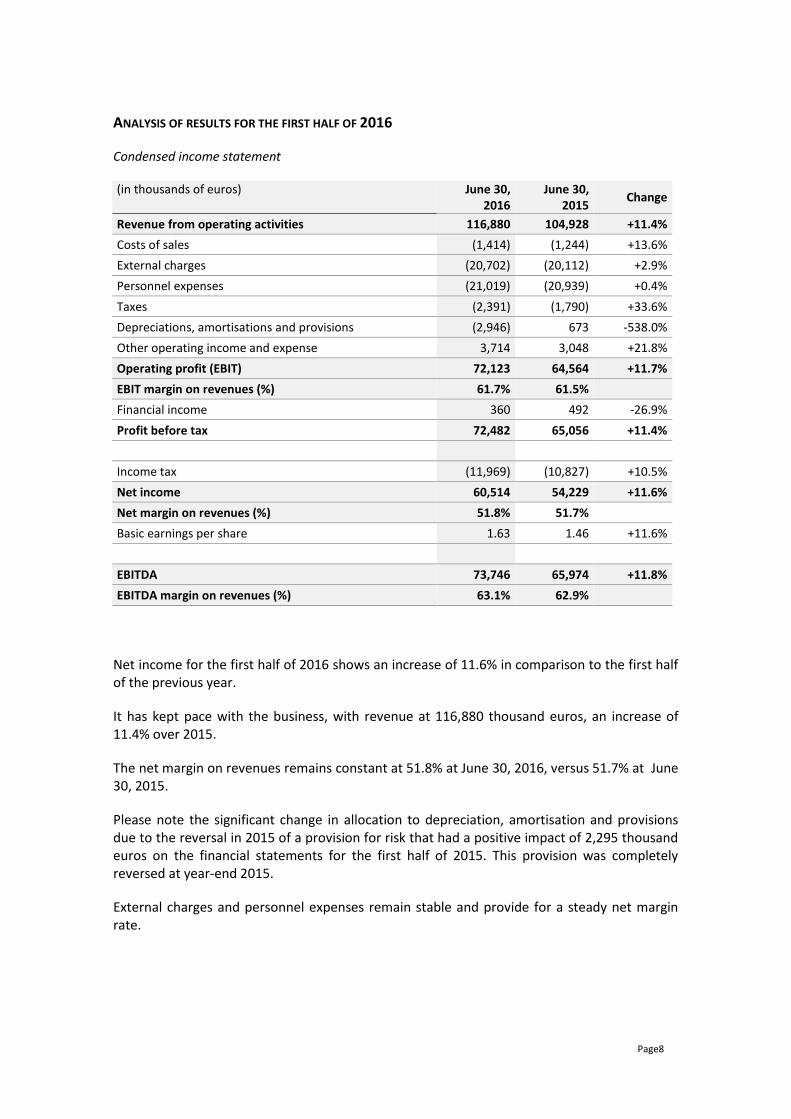
ANALYSIS OF RESULTS FOR THE FIRST HALF OF 2016
Condensed income statement
(in thousands of euros) June 30, 2016
June 30, 2015
Change
Revenue from operating activities 116,880 104,928 +11.4%
Costs of sales (1,414) (1,244) +13.6%
External charges (20,702) (20,112) +2.9%
Personnel expenses (21,019) (20,939) +0.4%
Taxes (2,391) (1,790) +33.6%
Depreciations, amortisations and provisions (2,946) 673 -538.0%
Other operating income and expense 3,714 3,048 +21.8%
Operating profit (EBIT) 72,123 64,564 +11.7%
EBIT margin on revenues (%) 61.7% 61.5%
Financial income 360 492 -26.9%
Profit before tax 72,482 65,056 +11.4%
Income tax (11,969) (10,827) +10.5%
Net income 60,514 54,229 +11.6%
Net margin on revenues (%) 51.8% 51.7%
Basic earnings per share 1.63 1.46 +11.6%
EBITDA 73,746 65,974 +11.8%
EBITDA margin on revenues (%) 63.1% 62.9%
Net income for the first half of 2016 shows an increase of 11.6% in comparison to the first half of the previous year.
It has kept pace with the business, with revenue at 116,880 thousand euros, an increase of 11.4% over 2015.
The net margin on revenues remains constant at 51.8% at June 30, 2016, versus 51.7% at June 30, 2015.
Please note the significant change in allocation to depreciation, amortisation and provisions due to the reversal in 2015 of a provision for risk that had a positive impact of 2,295 thousand euros on the financial statements for the first half of 2015. This provision was completely reversed at year-end 2015.
External charges and personnel expenses remain stable and provide for a steady net margin rate.
Page9
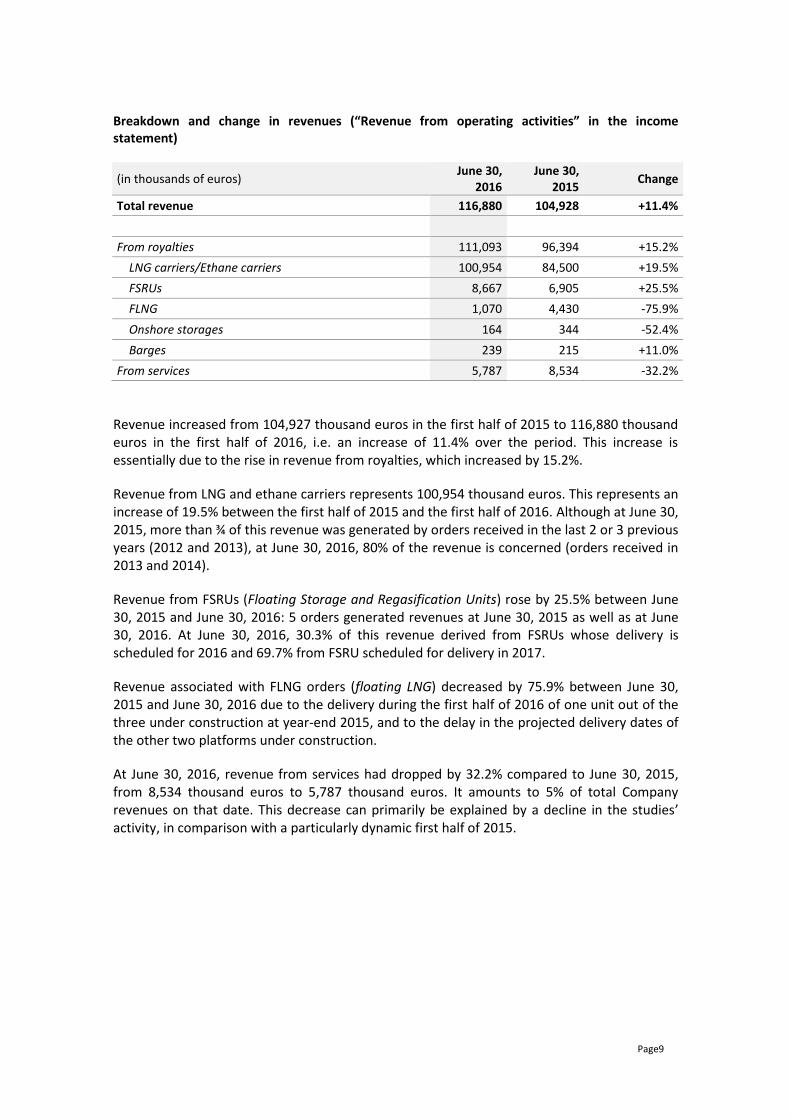
Breakdown and change in revenues (“Revenue from operating activities” in the income statement)
(in thousands of euros) June 30,
2016 June 30,
2015 Change
Total revenue 116,880 104,928 +11.4%
From royalties 111,093 96,394 +15.2%
LNG carriers/Ethane carriers 100,954 84,500 +19.5%
FSRUs 8,667 6,905 +25.5%
FLNG 1,070 4,430 -75.9%
Onshore storages 164 344 -52.4%
Barges 239 215 +11.0%
From services 5,787 8,534 -32.2%
Revenue increased from 104,927 thousand euros in the first half of 2015 to 116,880 thousand euros in the first half of 2016, i.e. an increase of 11.4% over the period. This increase is essentially due to the rise in revenue from royalties, which increased by 15.2%.
Revenue from LNG and ethane carriers represents 100,954 thousand euros. This represents an increase of 19.5% between the first half of 2015 and the first half of 2016. Although at June 30, 2015, more than ¾ of this revenue was generated by orders received in the last 2 or 3 previous years (2012 and 2013), at June 30, 2016, 80% of the revenue is concerned (orders received in 2013 and 2014).
Revenue from FSRUs (Floating Storage and Regasification Units) rose by 25.5% between June 30, 2015 and June 30, 2016: 5 orders generated revenues at June 30, 2015 as well as at June 30, 2016. At June 30, 2016, 30.3% of this revenue derived from FSRUs whose delivery is scheduled for 2016 and 69.7% from FSRU scheduled for delivery in 2017.
Revenue associated with FLNG orders (floating LNG) decreased by 75.9% between June 30, 2015 and June 30, 2016 due to the delivery during the first half of 2016 of one unit out of the three under construction at year-end 2015, and to the delay in the projected delivery dates of the other two platforms under construction.
At June 30, 2016, revenue from services had dropped by 32.2% compared to June 30, 2015, from 8,534 thousand euros to 5,787 thousand euros. It amounts to 5% of total Company revenues on that date. This decrease can primarily be explained by a decline in the studies’ activity, in comparison with a particularly dynamic first half of 2015.
Page10
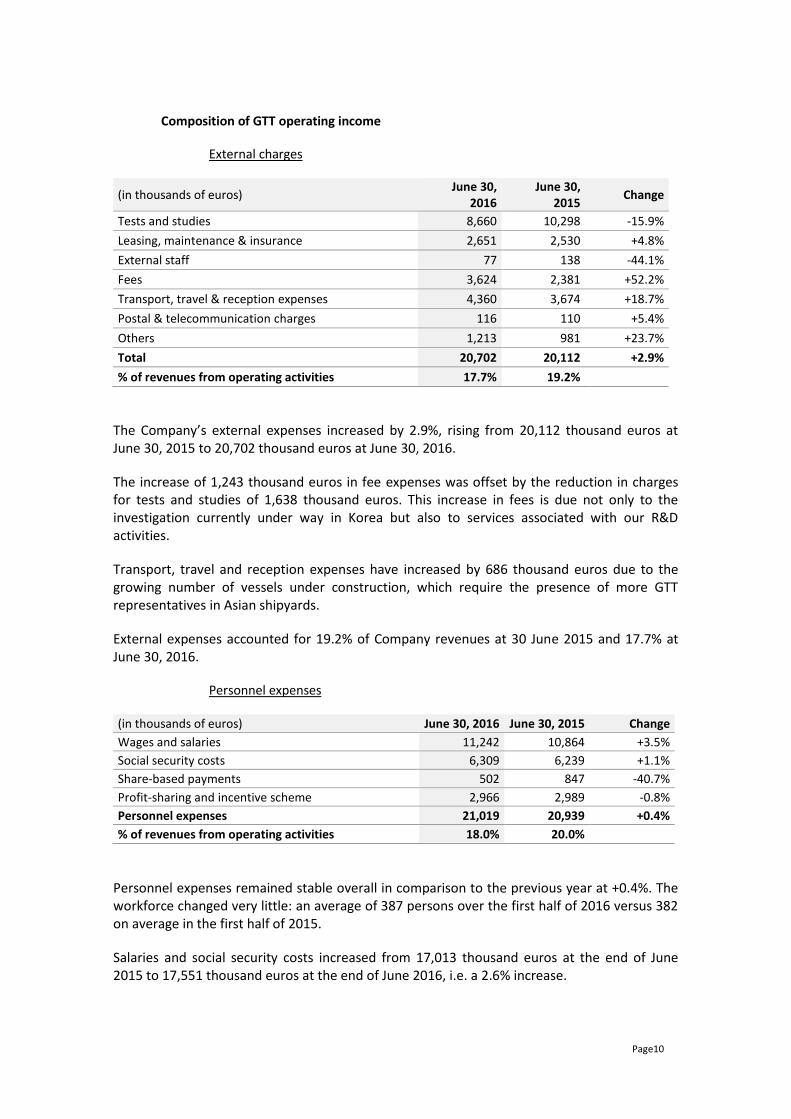
Composition of GTT operating income
External charges
(in thousands of euros) June 30,
2016 June 30,
2015 Change
Tests and studies 8,660 10,298 -15.9%
Leasing, maintenance & insurance 2,651 2,530 +4.8%
External staff 77 138 -44.1%
Fees 3,624 2,381 +52.2%
Transport, travel & reception expenses 4,360 3,674 +18.7%
Postal & telecommunication charges 116 110 +5.4%
Others 1,213 981 +23.7%
Total 20,702 20,112 +2.9%
% of revenues from operating activities 17.7% 19.2%
The Company’s external expenses increased by 2.9%, rising from 20,112 thousand euros at June 30, 2015 to 20,702 thousand euros at June 30, 2016.
The increase of 1,243 thousand euros in fee expenses was offset by the reduction in charges for tests and studies of 1,638 thousand euros. This increase in fees is due not only to the investigation currently under way in Korea but also to services associated with our R&D activities.
Transport, travel and reception expenses have increased by 686 thousand euros due to the growing number of vessels under construction, which require the presence of more GTT representatives in Asian shipyards.
External expenses accounted for 19.2% of Company revenues at 30 June 2015 and 17.7% at June 30, 2016.
Personnel expenses
(in thousands of euros) June 30, 2016 June 30, 2015 Change
Wages and salaries 11,242 10,864 +3.5%
Social security costs 6,309 6,239 +1.1%
Share-based payments 502 847 -40.7%
Profit-sharing and incentive scheme 2,966 2,989 -0.8%
Personnel expenses 21,019 20,939 +0.4%
% of revenues from operating activities 18.0% 20.0%
Personnel expenses remained stable overall in comparison to the previous year at +0.4%. The workforce changed very little: an average of 387 persons over the first half of 2016 versus 382 on average in the first half of 2015.
Salaries and social security costs increased from 17,013 thousand euros at the end of June 2015 to 17,551 thousand euros at the end of June 2016, i.e. a 2.6% increase.
Page11
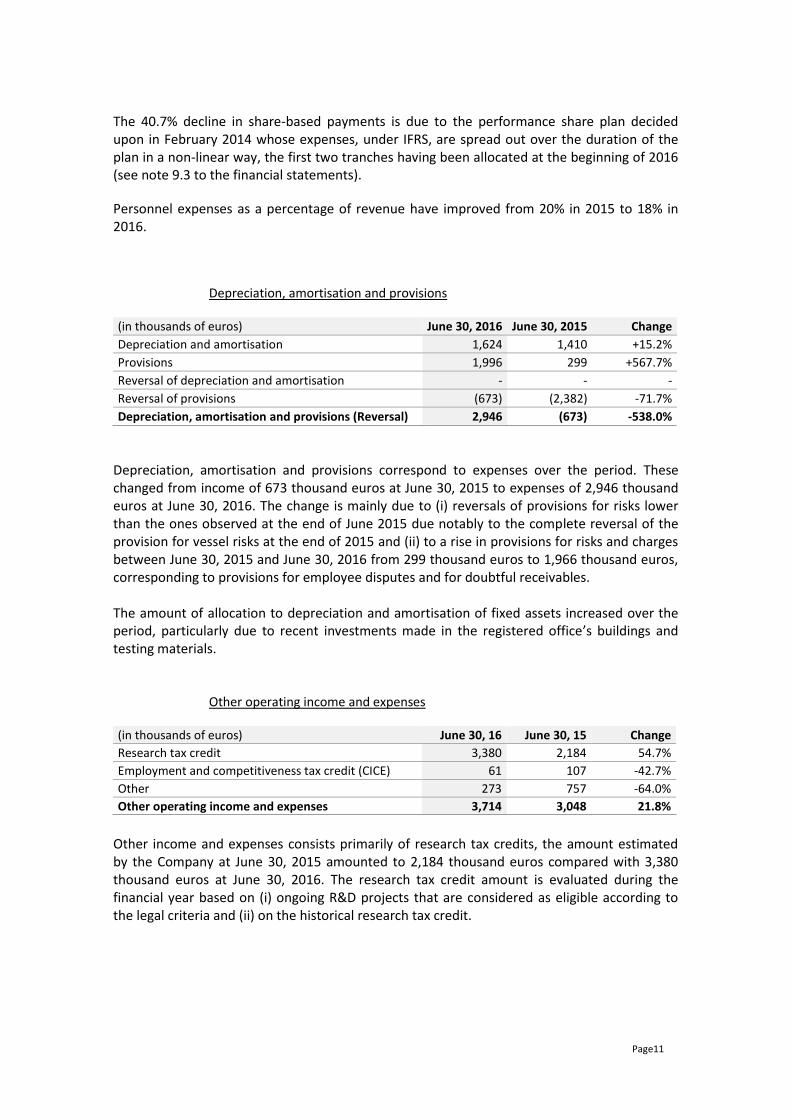
The 40.7% decline in share-based payments is due to the performance share plan decided upon in February 2014 whose expenses, under IFRS, are spread out over the duration of the plan in a non-linear way, the first two tranches having been allocated at the beginning of 2016 (see note 9.3 to the financial statements).
Personnel expenses as a percentage of revenue have improved from 20% in 2015 to 18% in 2016.
Depreciation, amortisation and provisions
(in thousands of euros) June 30, 2016 June 30, 2015 Change
Depreciation and amortisation 1,624 1,410 +15.2%
Provisions 1,996 299 +567.7%
Reversal of depreciation and amortisation - - -
Reversal of provisions (673) (2,382) -71.7%
Depreciation, amortisation and provisions (Reversal) 2,946 (673) -538.0%
Depreciation, amortisation and provisions correspond to expenses over the period. These changed from income of 673 thousand euros at June 30, 2015 to expenses of 2,946 thousand euros at June 30, 2016. The change is mainly due to (i) reversals of provisions for risks lower than the ones observed at the end of June 2015 due notably to the complete reversal of the provision for vessel risks at the end of 2015 and (ii) to a rise in provisions for risks and charges between June 30, 2015 and June 30, 2016 from 299 thousand euros to 1,966 thousand euros, corresponding to provisions for employee disputes and for doubtful receivables. The amount of allocation to depreciation and amortisation of fixed assets increased over the period, particularly due to recent investments made in the registered office’s buildings and testing materials.
Other operating income and expenses
(in thousands of euros) June 30, 16 June 30, 15 Change
Research tax credit 3,380 2,184 54.7%
Employment and competitiveness tax credit (CICE) 61 107 -42.7%
Other 273 757 -64.0%
Other operating income and expenses 3,714 3,048 21.8%
Other income and expenses consists primarily of research tax credits, the amount estimated by the Company at June 30, 2015 amounted to 2,184 thousand euros compared with 3,380 thousand euros at June 30, 2016. The research tax credit amount is evaluated during the financial year based on (i) ongoing R&D projects that are considered as eligible according to the legal criteria and (ii) on the historical research tax credit.
Page12
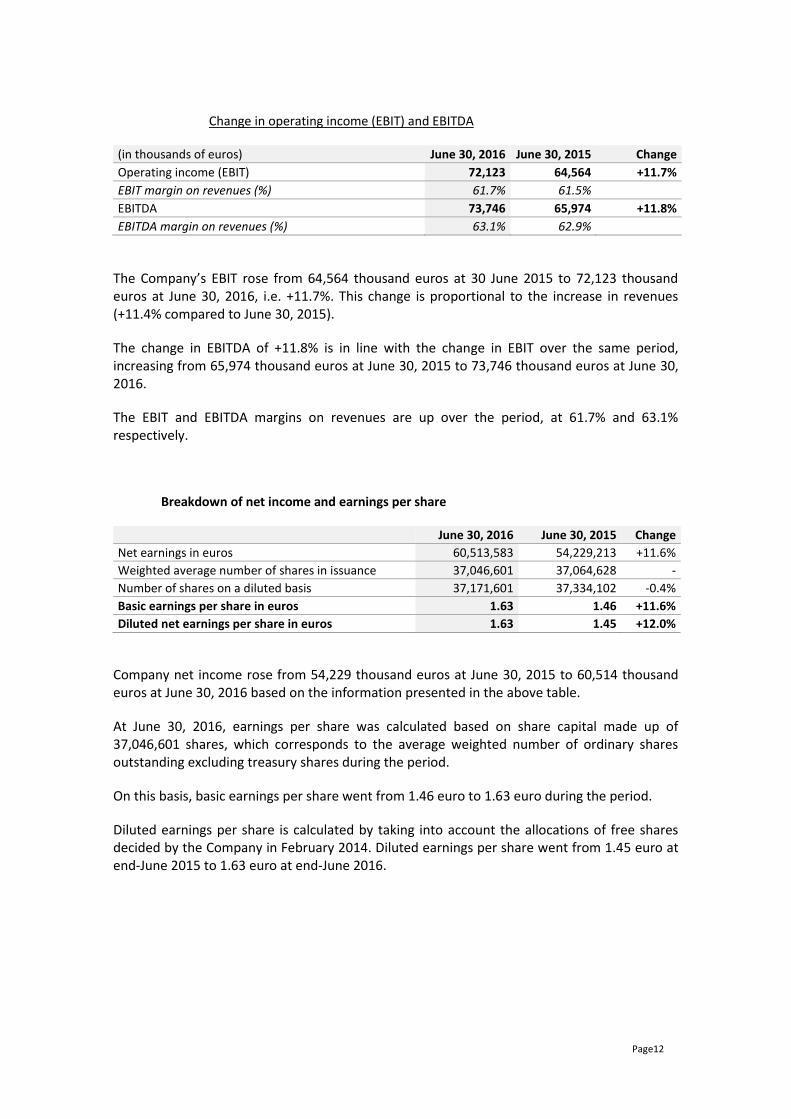
Change in operating income (EBIT) and EBITDA
(in thousands of euros) June 30, 2016 June 30, 2015 Change
Operating income (EBIT) 72,123 64,564 +11.7%
EBIT margin on revenues (%) 61.7% 61.5%
EBITDA 73,746 65,974 +11.8%
EBITDA margin on revenues (%) 63.1% 62.9%
The Company’s EBIT rose from 64,564 thousand euros at 30 June 2015 to 72,123 thousand euros at June 30, 2016, i.e. +11.7%. This change is proportional to the increase in revenues (+11.4% compared to June 30, 2015).
The change in EBITDA of +11.8% is in line with the change in EBIT over the same period, increasing from 65,974 thousand euros at June 30, 2015 to 73,746 thousand euros at June 30, 2016.
The EBIT and EBITDA margins on revenues are up over the period, at 61.7% and 63.1% respectively.
Breakdown of net income and earnings per share
June 30, 2016 June 30, 2015 Change
Net earnings in euros 60,513,583 54,229,213 +11.6%
Weighted average number of shares in issuance 37,046,601 37,064,628 -
Number of shares on a diluted basis 37,171,601 37,334,102 -0.4%
Basic earnings per share in euros 1.63 1.46 +11.6%
Diluted net earnings per share in euros 1.63 1.45 +12.0%
Company net income rose from 54,229 thousand euros at June 30, 2015 to 60,514 thousand euros at June 30, 2016 based on the information presented in the above table.
At June 30, 2016, earnings per share was calculated based on share capital made up of 37,046,601 shares, which corresponds to the average weighted number of ordinary shares outstanding excluding treasury shares during the period.
On this basis, basic earnings per share went from 1.46 euro to 1.63 euro during the period.
Diluted earnings per share is calculated by taking into account the allocations of free shares decided by the Company in February 2014. Diluted earnings per share went from 1.45 euro at end-June 2015 to 1.63 euro at end-June 2016.
Page13
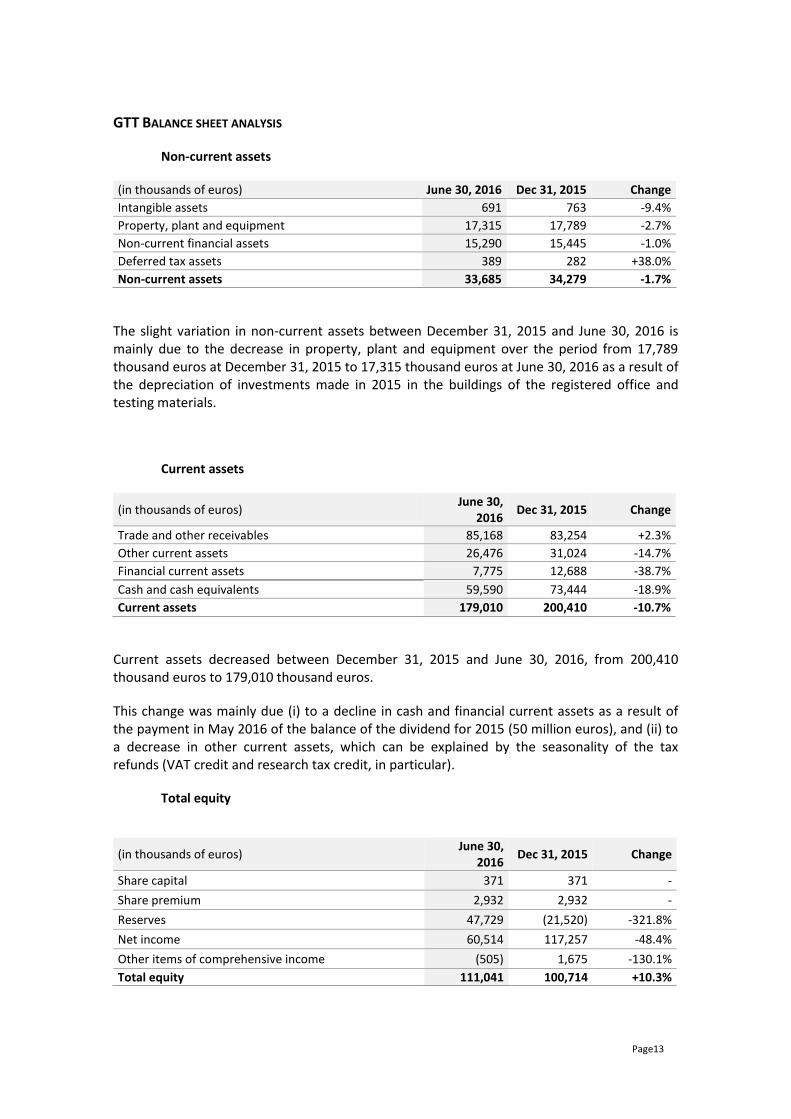
GTT BALANCE SHEET ANALYSIS
Non-current assets
(in thousands of euros) June 30, 2016 Dec 31, 2015 Change
Intangible assets 691 763 -9.4%
Property, plant and equipment 17,315 17,789 -2.7%
Non-current financial assets 15,290 15,445 -1.0%
Deferred tax assets 389 282 +38.0%
Non-current assets 33,685 34,279 -1.7%
The slight variation in non-current assets between December 31, 2015 and June 30, 2016 is mainly due to the decrease in property, plant and equipment over the period from 17,789 thousand euros at December 31, 2015 to 17,315 thousand euros at June 30, 2016 as a result of the depreciation of investments made in 2015 in the buildings of the registered office and testing materials.
Current assets
(in thousands of euros) June 30,
2016 Dec 31, 2015 Change
Trade and other receivables 85,168 83,254 +2.3%
Other current assets 26,476 31,024 -14.7%
Financial current assets 7,775 12,688 -38.7%
Cash and cash equivalents 59,590 73,444 -18.9%
Current assets 179,010 200,410 -10.7%
Current assets decreased between December 31, 2015 and June 30, 2016, from 200,410 thousand euros to 179,010 thousand euros.
This change was mainly due (i) to a decline in cash and financial current assets as a result of the payment in May 2016 of the balance of the dividend for 2015 (50 million euros), and (ii) to a decrease in other current assets, which can be explained by the seasonality of the tax refunds (VAT credit and research tax credit, in particular).
Total equity
(in thousands of euros) June 30,
2016 Dec 31, 2015 Change
Share capital 371 371 -
Share premium 2,932 2,932 -
Reserves 47,729 (21,520) -321.8%
Net income 60,514 117,257 -48.4%
Other items of comprehensive income (505) 1,675 -130.1%
Total equity 111,041 100,714 +10.3%
Page14
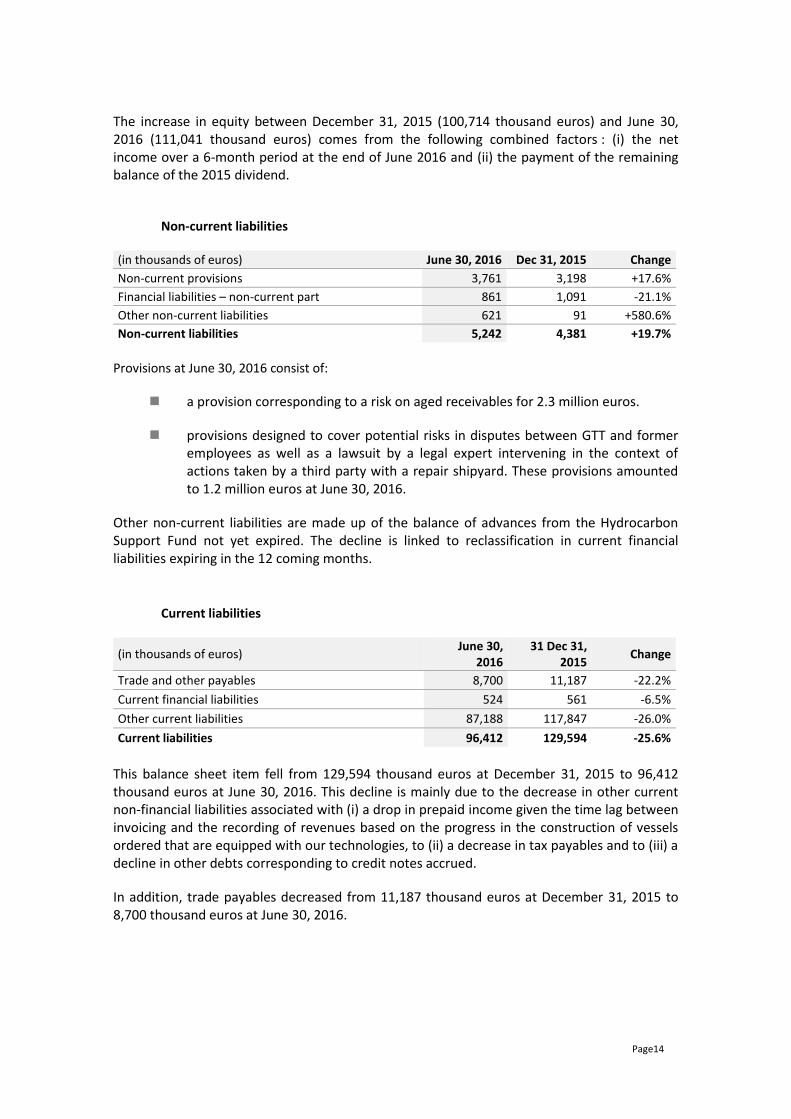
The increase in equity between December 31, 2015 (100,714 thousand euros) and June 30, 2016 (111,041 thousand euros) comes from the following combined factors : (i) the net income over a 6-month period at the end of June 2016 and (ii) the payment of the remaining balance of the 2015 dividend.
Non-current liabilities
(in thousands of euros) June 30, 2016 Dec 31, 2015 Change
Non-current provisions 3,761 3,198 +17.6%
Financial liabilities – non-current part 861 1,091 -21.1%
Other non-current liabilities 621 91 +580.6%
Non-current liabilities 5,242 4,381 +19.7%
Provisions at June 30, 2016 consist of:
a provision corresponding to a risk on aged receivables for 2.3 million euros.
provisions designed to cover potential risks in disputes between GTT and former employees as well as a lawsuit by a legal expert intervening in the context of actions taken by a third party with a repair shipyard. These provisions amounted to 1.2 million euros at June 30, 2016.
Other non-current liabilities are made up of the balance of advances from the Hydrocarbon Support Fund not yet expired. The decline is linked to reclassification in current financial liabilities expiring in the 12 coming months.
Current liabilities
(in thousands of euros) June 30,
2016 31 Dec 31,
2015 Change
Trade and other payables 8,700 11,187 -22.2%
Current financial liabilities 524 561 -6.5%
Other current liabilities 87,188 117,847 -26.0%
Current liabilities 96,412 129,594 -25.6%
This balance sheet item fell from 129,594 thousand euros at December 31, 2015 to 96,412 thousand euros at June 30, 2016. This decline is mainly due to the decrease in other current non-financial liabilities associated with (i) a drop in prepaid income given the time lag between invoicing and the recording of revenues based on the progress in the construction of vessels ordered that are equipped with our technologies, to (ii) a decrease in tax payables and to (iii) a decline in other debts corresponding to credit notes accrued.
In addition, trade payables decreased from 11,187 thousand euros at December 31, 2015 to 8,700 thousand euros at June 30, 2016.
Page15
OUTLOOK
Based on the revenue from royalties recorded for the first half of the year and the value of the current order book, and in the absence of any significant postponements or cancellations in orders, the cumulative revenue for the 2016-2020 period would amount to 636 million euros
(229 million euros in 20163, 213 million euros in 2017, 155 million euros in 2018, 35 million euros in 2019 and 4 million euros in 2020).
Accordingly, given the time lag observed in shipbuilding milestones and the current level of new orders, the Company now estimates at around 240 million euros the revenue for the 2016 financial year4.
The other two objectives remain unchanged:
- A 2016 net margin above 50%5,
- A dividend amount, for 2016 and 2017, at least equivalent to that paid in 20156.
The Group maintains its attractive payout policy to shareholders and will pay an interim dividend for 2016 on September 30, 2016 of 1.33 euro per share in respect of 2016 (ex-dividend date set at September 28, 2016).
THIRD PARTY TRANSACTIONS
During the first half of 2016, no third-party transactions likely to have a material impact on the Company’s financial situation or results took place. Similarly, no changes were made to previously agreed third-party transactions likely to have a material impact on the Company’s financial situation or results during the period.
Details of the amounts of third party transactions can be found in Note 14 to the condensed half-yearly financial statements.
RISK FACTORS
The Group’s activities are exposed to certain macroeconomic and sector-specific, operational, market, industrial, environmental and legal risk factors. The main risk factors to which the Group could be exposed are described in detail in the Risk Factors section in the 2015 Registration Document filed with the AMF on April 27, 2016, number R 16-028. There were no significant changes in these risk factors during the first half of 2016.
3 Of which 111.0 million euros recognised for the first half of 2016 4 In the absence of any significant new postponements or cancellations of orders 5 Excluding the effect of potential acquisitions 6 2016 dividend to be submitted for approval by the Shareholders' Meeting of 18 May 2017
Page16
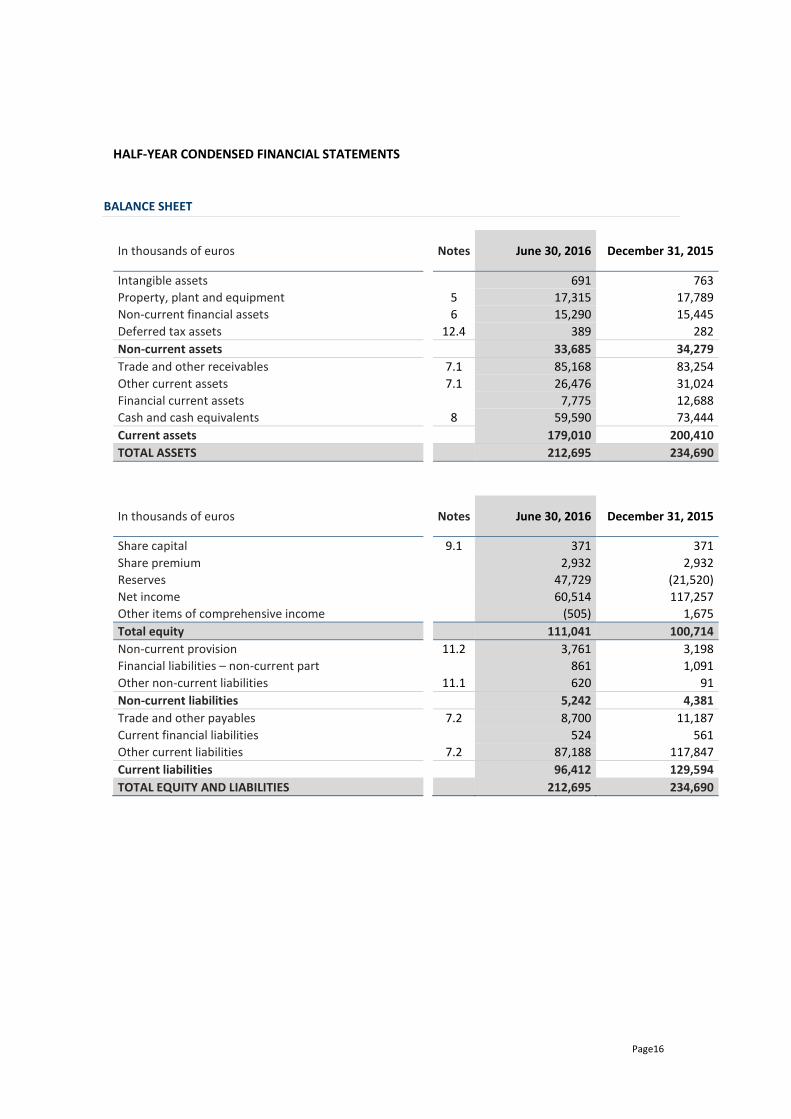
HALF-YEAR CONDENSED FINANCIAL STATEMENTS
BALANCE SHEET
In thousands of euros
Notes June 30, 2016 December 31, 2015
Intangible assets
691 763
Property, plant and equipment
5 17,315 17,789
Non-current financial assets
6 15,290 15,445
Deferred tax assets
12.4 389 282
Non-current assets
33,685 34,279
Trade and other receivables
7.1 85,168 83,254
Other current assets
7.1 26,476 31,024
Financial current assets
7,775 12,688
Cash and cash equivalents
8 59,590 73,444
Current assets
179,010 200,410
TOTAL ASSETS
212,695 234,690
In thousands of euros
Notes June 30, 2016 December 31, 2015
Share capital
9.1 371 371
Share premium
2,932 2,932
Reserves
47,729 (21,520)
Net income
60,514 117,257
Other items of comprehensive income
(505) 1,675
Total equity
111,041 100,714
Non-current provision
11.2 3,761 3,198
Financial liabilities – non-current part
861 1,091
Other non-current liabilities
11.1 620 91
Non-current liabilities
5,242 4,381
Trade and other payables
7.2 8,700 11,187
Current financial liabilities
524 561
Other current liabilities
7.2 87,188 117,847
Current liabilities
96,412 129,594
TOTAL EQUITY AND LIABILITIES
212,695 234,690
Page17
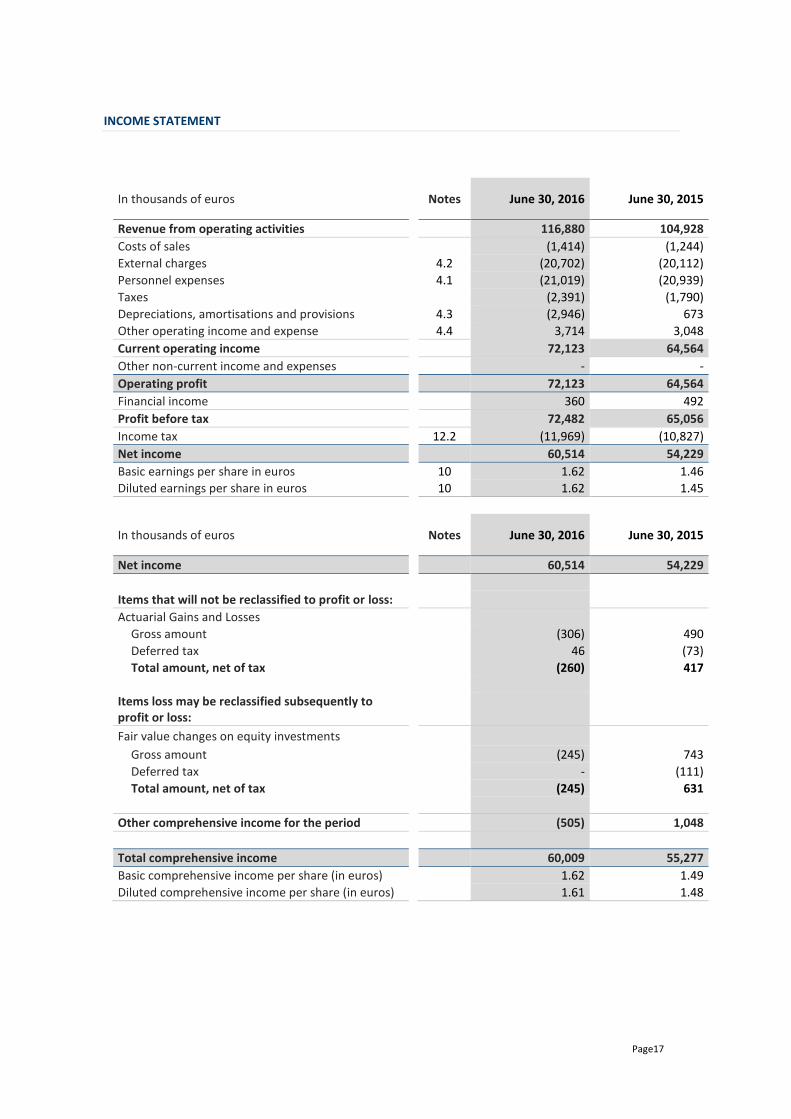
INCOME STATEMENT
In thousands of euros
Notes June 30, 2016 June 30, 2015
Revenue from operating activities
116,880 104,928
Costs of sales
(1,414) (1,244)
External charges
4.2 (20,702) (20,112)
Personnel expenses
4.1 (21,019) (20,939)
Taxes
(2,391) (1,790)
Depreciations, amortisations and provisions
4.3 (2,946) 673
Other operating income and expense
4.4 3,714 3,048
Current operating income
72,123 64,564
Other non-current income and expenses
- -
Operating profit
72,123 64,564
Financial income
360 492
Profit before tax
72,482 65,056
Income tax
12.2 (11,969) (10,827)
Net income
60,514 54,229
Basic earnings per share in euros
10 1.62 1.46
Diluted earnings per share in euros
10 1.62 1.45
In thousands of euros
Notes June 30, 2016 June 30, 2015
Net income
60,514 54,229
Items that will not be reclassified to profit or loss:
Actuarial Gains and Losses
Gross amount
(306) 490
Deferred tax
46 (73)
Total amount, net of tax
(260) 417
Items loss may be reclassified subsequently to profit or loss:
Fair value changes on equity investments
Gross amount
(245) 743
Deferred tax
- (111)
Total amount, net of tax
(245) 631
Other comprehensive income for the period
(505) 1,048
Total comprehensive income
60,009 55,277
Basic comprehensive income per share (in euros)
1.62 1.49
Diluted comprehensive income per share (in euros)
1.61 1.48
Page18
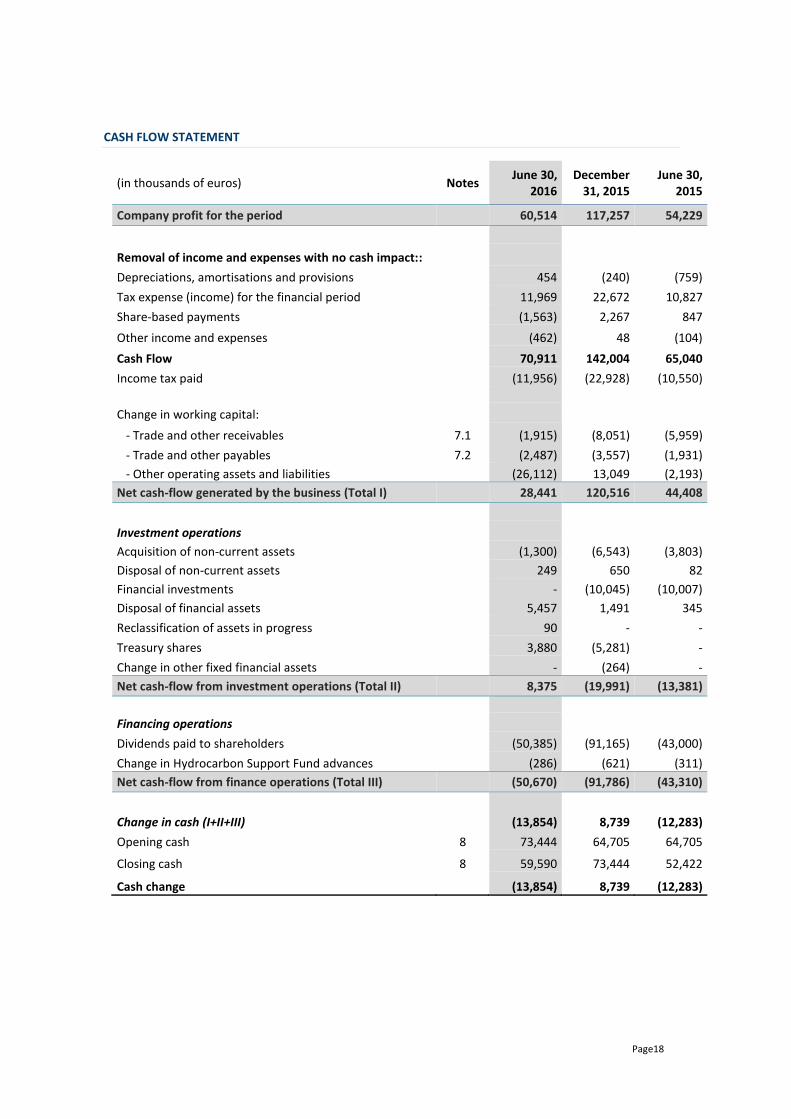
CASH FLOW STATEMENT
(in thousands of euros) Notes June 30,
2016 December
31, 2015 June 30,
2015
Company profit for the period 60,514 117,257 54,229
Removal of income and expenses with no cash impact::
Depreciations, amortisations and provisions 454 (240) (759)
Tax expense (income) for the financial period 11,969 22,672 10,827
Share-based payments (1,563) 2,267 847
Other income and expenses (462) 48 (104)
Cash Flow 70,911 142,004 65,040
Income tax paid (11,956) (22,928) (10,550)
Change in working capital:
- Trade and other receivables 7.1 (1,915) (8,051) (5,959)
- Trade and other payables 7.2 (2,487) (3,557) (1,931)
- Other operating assets and liabilities (26,112) 13,049 (2,193)
Net cash-flow generated by the business (Total I) 28,441 120,516 44,408
Investment operations
Acquisition of non-current assets (1,300) (6,543) (3,803)
Disposal of non-current assets 249 650 82
Financial investments - (10,045) (10,007)
Disposal of financial assets 5,457 1,491 345
Reclassification of assets in progress 90 - -
Treasury shares 3,880 (5,281) -
Change in other fixed financial assets - (264) -
Net cash-flow from investment operations (Total II) 8,375 (19,991) (13,381)
Financing operations
Dividends paid to shareholders (50,385) (91,165) (43,000)
Change in Hydrocarbon Support Fund advances (286) (621) (311)
Net cash-flow from finance operations (Total III) (50,670) (91,786) (43,310)
Change in cash (I+II+III) (13,854) 8,739 (12,283)
Opening cash 8 73,444 64,705 64,705
Closing cash 8 59,590 73,444 52,422
Cash change (13,854) 8,739 (12,283)
Page19
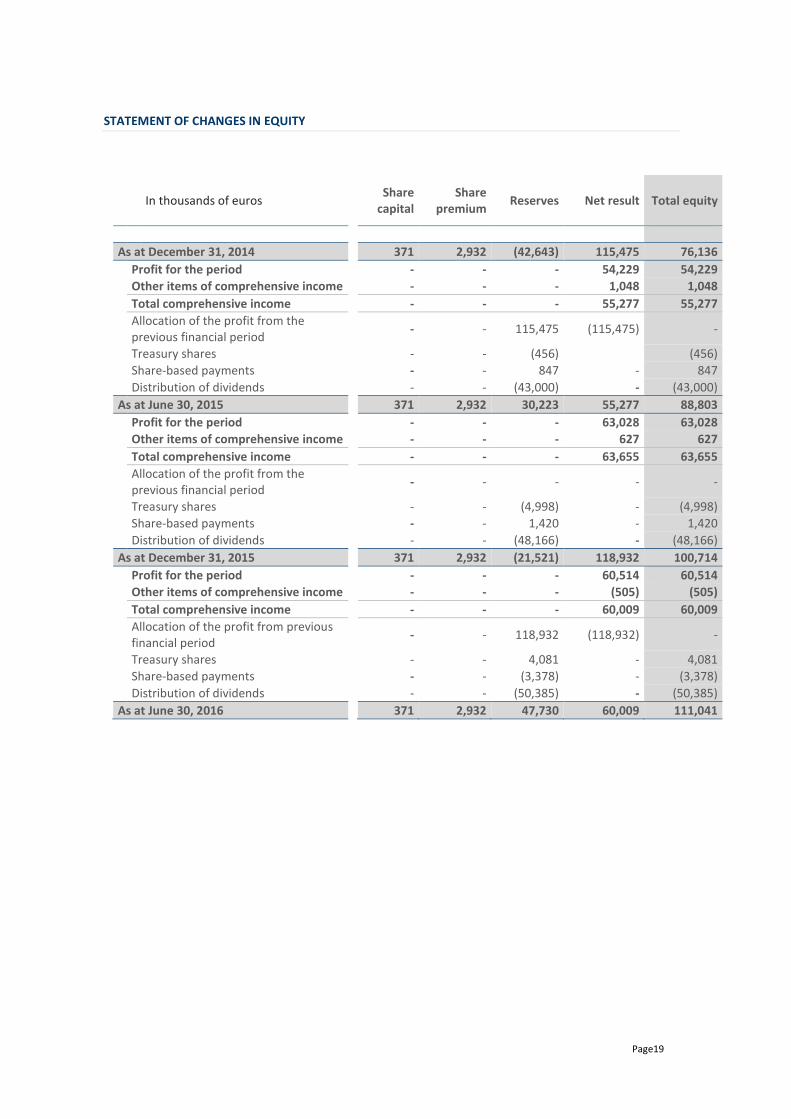
STATEMENT OF CHANGES IN EQUITY
In thousands of euros
Share capital
Share premium
Reserves Net result Total equity
As at December 31, 2014
371 2,932 (42,643) 115,475 76,136
Profit for the period
- - - 54,229 54,229
Other items of comprehensive income
- - - 1,048 1,048
Total comprehensive income
- - - 55,277 55,277
Allocation of the profit from the previous financial period
- - 115,475 (115,475) -
Treasury shares
- - (456)
(456)
Share-based payments
- - 847 - 847
Distribution of dividends
- - (43,000) - (43,000)
As at June 30, 2015
371 2,932 30,223 55,277 88,803
Profit for the period
- - - 63,028 63,028
Other items of comprehensive income
- - - 627 627
Total comprehensive income
- - - 63,655 63,655
Allocation of the profit from the previous financial period
- - - - -
Treasury shares
- - (4,998) - (4,998)
Share-based payments
- - 1,420 - 1,420
Distribution of dividends
- - (48,166) - (48,166)
As at December 31, 2015
371 2,932 (21,521) 118,932 100,714
Profit for the period
- - - 60,514 60,514
Other items of comprehensive income
- - - (505) (505)
Total comprehensive income
- - - 60,009 60,009
Allocation of the profit from previous financial period
- - 118,932 (118,932) -
Treasury shares
- - 4,081 - 4,081
Share-based payments
- - (3,378) - (3,378)
Distribution of dividends
- - (50,385) - (50,385)
As at June 30, 2016
371 2,932 47,730 60,009 111,041
Page20
NOTES TO THE FINANCIAL STATEMENTS
Note 1. GENERAL PRESENTATION
Gaztransport et Technigaz-GTT (the “Company” or “GTT”) is a joint stock limited liability company (société anonyme) under French law, whose registered office is domiciled in France, at 1 route de Versailles, 78470 Saint-Rémy-lès-Chevreuse.
The Company is specialised in the production of services related to the construction of storage facilities for transporting liquefied natural gas (LNG). It offers engineering services, technical assistance and patent licenses for the construction of LNG tanks installed mainly on LNG carriers.
The Company is based in France and operates mainly with shipyards in Asia.
The Company does not prepare consolidated financial statements that include its subsidiaries Cryovision (established on February 2, 2012), GTT North America (established in September 2013), GTT Training Ltd (established in June 2014), GAZTRANSPORT & TECHNIGAZ - GTT SEA PTE. LTD (established in April 2015), Cryometrics (established in November 2015) and GTT ICS (established in April 2016), due to their low level of business activity in the period covered by these financial statements.
These financial statements are presented for the period beginning on January 1 and ending June 30, 2016.
Note 2. ACCOUNTING RULES AND METHODS
2.1. Basis of preparation of the financial statements
The condensed interim financial statements for all the periods have been prepared in accordance with the IFRS international accounting standards in force at June 30, 2016.
These standards are available on the website of the European Commission at: http://ec.europa.eu/internal_market/accounting/ias/index_fr.htm.
The condensed half-year interim financial statements for the six months to June 30, 2016, as presented, have been prepared in compliance with IAS 34 "Interim Financial Reporting".
These interim financial statements do not include all the information required by IFRS for the preparation of financial statements. These notes should therefore be read in conjunction with the GTT financial statements established for the year ended December 31, 2015.
The financial statements are presented in thousands of euros, rounded to the nearest thousand euros, unless otherwise indicated.
The condensed financial statements are prepared in accordance with the same accounting principles and methods applied in the preparation of the Company’s IFRS financial statements for the year ended December 31, 2015 (as described in Note 2 the Company’s IFRS financial
Page21
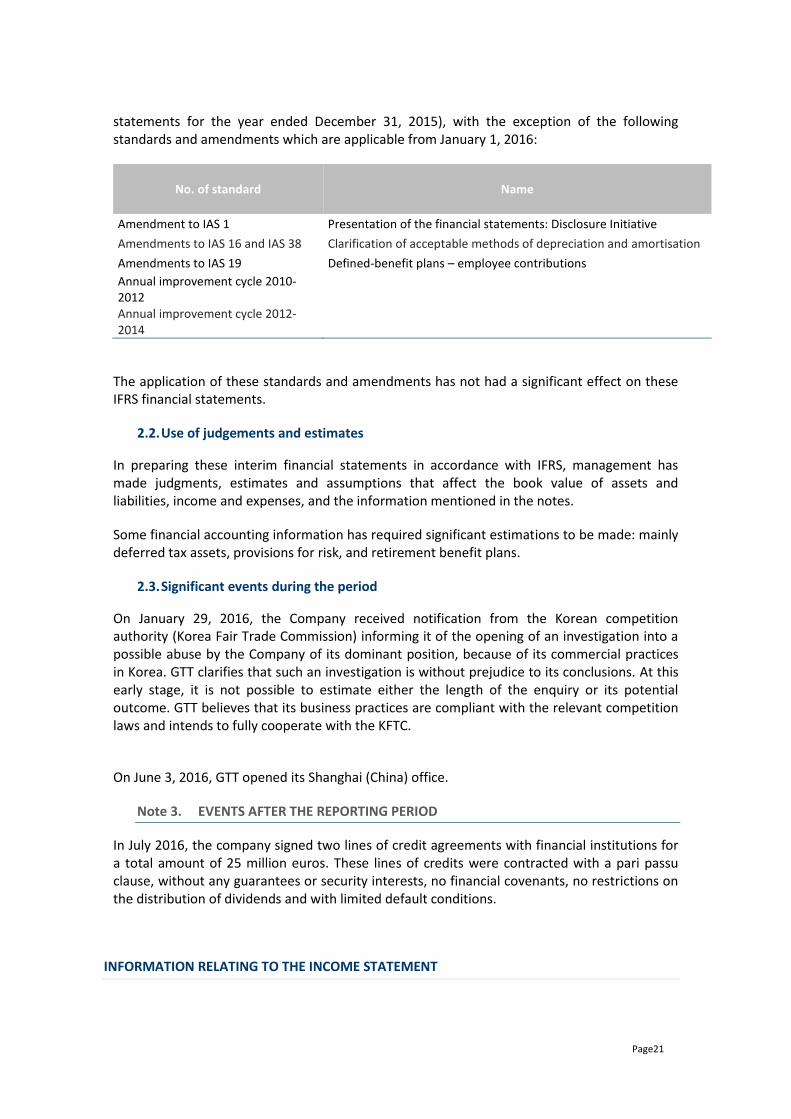
statements for the year ended December 31, 2015), with the exception of the following standards and amendments which are applicable from January 1, 2016:
No. of standard Name
Amendment to IAS 1 Presentation of the financial statements: Disclosure Initiative
Amendments to IAS 16 and IAS 38 Clarification of acceptable methods of depreciation and amortisation
Amendments to IAS 19 Defined-benefit plans – employee contributions
Annual improvement cycle 2010-2012 Annual improvement cycle 2012-2014
The application of these standards and amendments has not had a significant effect on these IFRS financial statements.
2.2. Use of judgements and estimates
In preparing these interim financial statements in accordance with IFRS, management has made judgments, estimates and assumptions that affect the book value of assets and liabilities, income and expenses, and the information mentioned in the notes.
Some financial accounting information has required significant estimations to be made: mainly deferred tax assets, provisions for risk, and retirement benefit plans.
2.3. Significant events during the period
On January 29, 2016, the Company received notification from the Korean competition authority (Korea Fair Trade Commission) informing it of the opening of an investigation into a possible abuse by the Company of its dominant position, because of its commercial practices in Korea. GTT clarifies that such an investigation is without prejudice to its conclusions. At this early stage, it is not possible to estimate either the length of the enquiry or its potential outcome. GTT believes that its business practices are compliant with the relevant competition laws and intends to fully cooperate with the KFTC.
On June 3, 2016, GTT opened its Shanghai (China) office.
Note 3. EVENTS AFTER THE REPORTING PERIOD
In July 2016, the company signed two lines of credit agreements with financial institutions for a total amount of 25 million euros. These lines of credits were contracted with a pari passu clause, without any guarantees or security interests, no financial covenants, no restrictions on the distribution of dividends and with limited default conditions.
INFORMATION RELATING TO THE INCOME STATEMENT
Page22
Note 4. OPERATING INCOME
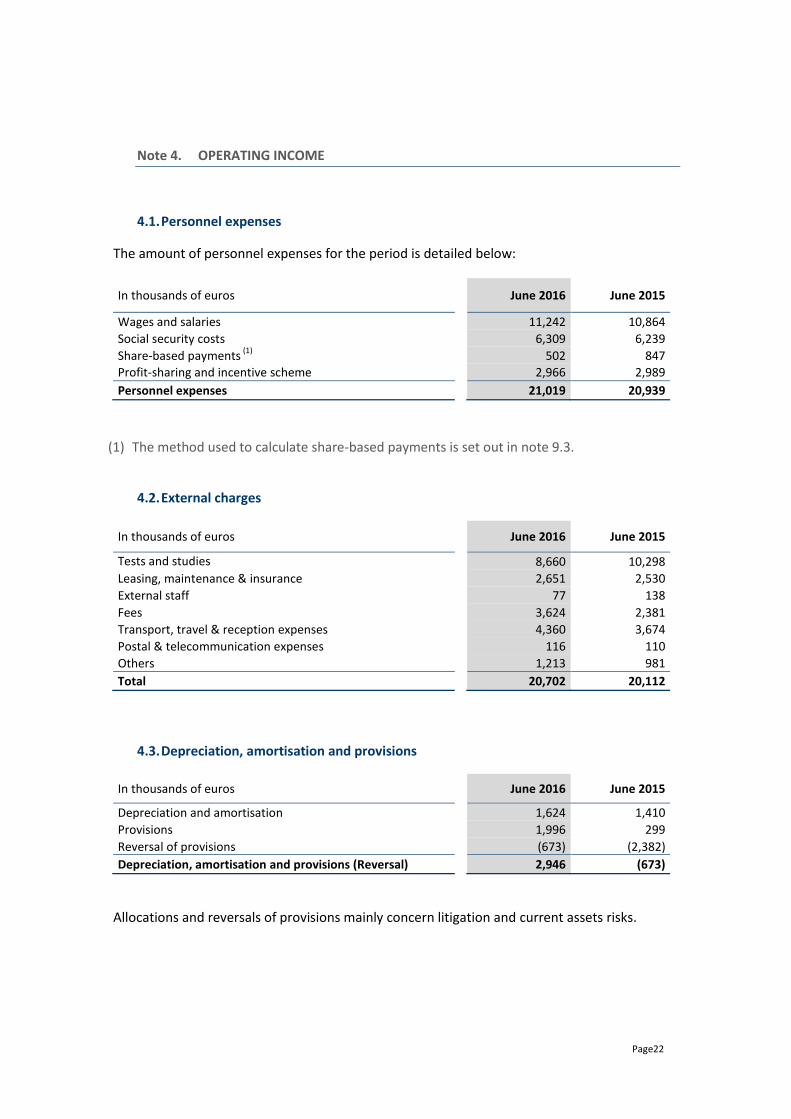
4.1. Personnel expenses
The amount of personnel expenses for the period is detailed below:
In thousands of euros
June 2016 June 2015
Wages and salaries
11,242 10,864
Social security costs
6,309 6,239
Share-based payments (1)
502 847
Profit-sharing and incentive scheme
2,966 2,989
Personnel expenses
21,019 20,939
(1) The method used to calculate share-based payments is set out in note 9.3.
4.2. External charges
In thousands of euros
June 2016 June 2015
Tests and studies
8,660 10,298
Leasing, maintenance & insurance
2,651 2,530
External staff
77 138
Fees
3,624 2,381
Transport, travel & reception expenses
4,360 3,674
Postal & telecommunication expenses
116 110
Others
1,213 981
Total
20,702 20,112
4.3. Depreciation, amortisation and provisions
In thousands of euros
June 2016 June 2015
Depreciation and amortisation
1,624 1,410
Provisions
1,996 299
Reversal of provisions
(673) (2,382)
Depreciation, amortisation and provisions (Reversal)
2,946 (673)
Allocations and reversals of provisions mainly concern litigation and current assets risks.
Page23
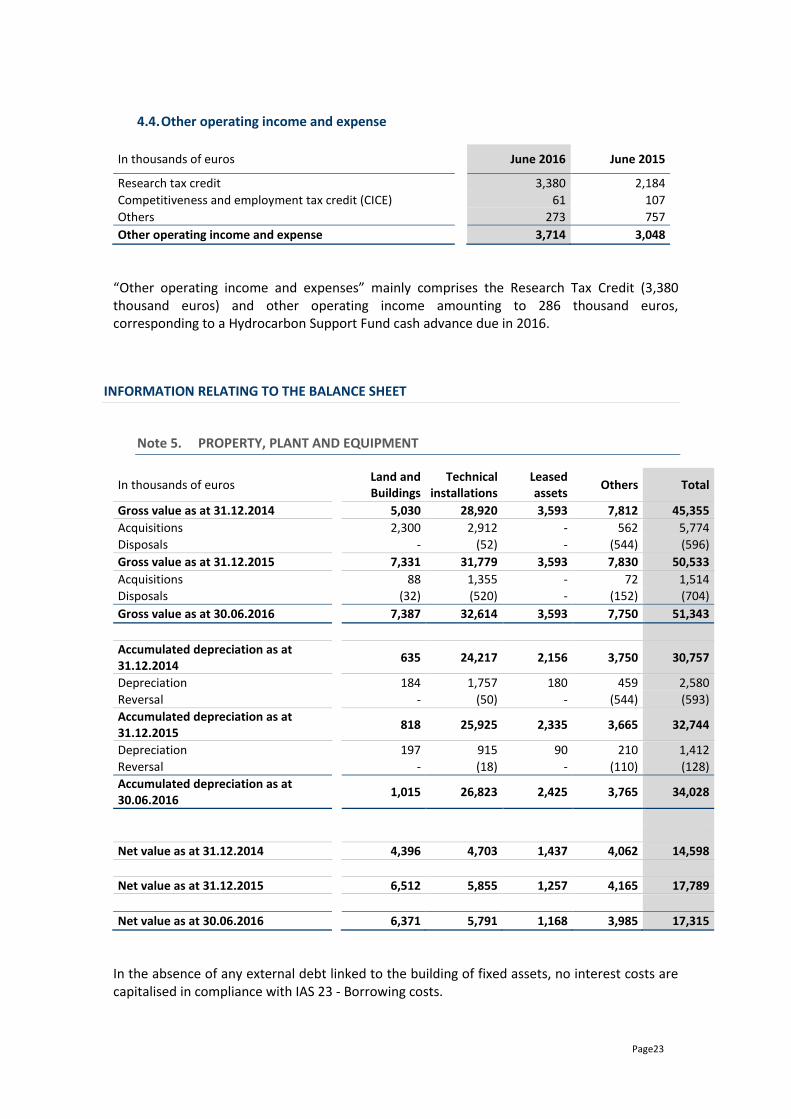
4.4. Other operating income and expense
In thousands of euros
June 2016 June 2015
Research tax credit
3,380 2,184
Competitiveness and employment tax credit (CICE)
61 107
Others
273 757
Other operating income and expense
3,714 3,048
“Other operating income and expenses” mainly comprises the Research Tax Credit (3,380 thousand euros) and other operating income amounting to 286 thousand euros, corresponding to a Hydrocarbon Support Fund cash advance due in 2016.
INFORMATION RELATING TO THE BALANCE SHEET
Note 5. PROPERTY, PLANT AND EQUIPMENT
In thousands of euros
Land and Buildings
Technical installations
Leased assets
Others Total
Gross value as at 31.12.2014
5,030 28,920 3,593 7,812 45,355
Acquisitions
2,300 2,912 - 562 5,774
Disposals
- (52) - (544) (596)
Gross value as at 31.12.2015
7,331 31,779 3,593 7,830 50,533
Acquisitions
88 1,355 - 72 1,514
Disposals
(32) (520) - (152) (704)
Gross value as at 30.06.2016
7,387 32,614 3,593 7,750 51,343
Accumulated depreciation as at 31.12.2014
635 24,217 2,156 3,750 30,757
Depreciation
184 1,757 180 459 2,580
Reversal
- (50) - (544) (593)
Accumulated depreciation as at 31.12.2015
818 25,925 2,335 3,665 32,744
Depreciation
197 915 90 210 1,412
Reversal
- (18) - (110) (128)
Accumulated depreciation as at 30.06.2016
1,015 26,823 2,425 3,765 34,028
Net value as at 31.12.2014
4,396 4,703 1,437 4,062 14,598
Net value as at 31.12.2015
6,512 5,855 1,257 4,165 17,789
Net value as at 30.06.2016
6,371 5,791 1,168 3,985 17,315
In the absence of any external debt linked to the building of fixed assets, no interest costs are capitalised in compliance with IAS 23 - Borrowing costs.
Page24
Assets acquired under finance leases correspond to the building used since 2003 as the Company headquarters, as described in note 2.8 to the financial statements for the financial year ended December 31, 2015.
With regard to the building used since 2003 as the company headquarters, its historical acquisition cost under the first-time application of IFRS, was determined using the transfer price paid by GTT in January 2003 to the previous tenant in order to obtain the rights and obligations relative to the leasing contract for this building, increased by the outstanding capital element at the date of the lease transfer, to be amortised over the remaining term of the lease contract. GTT became the owner of this building at the end of contractual lease period in December 2005.
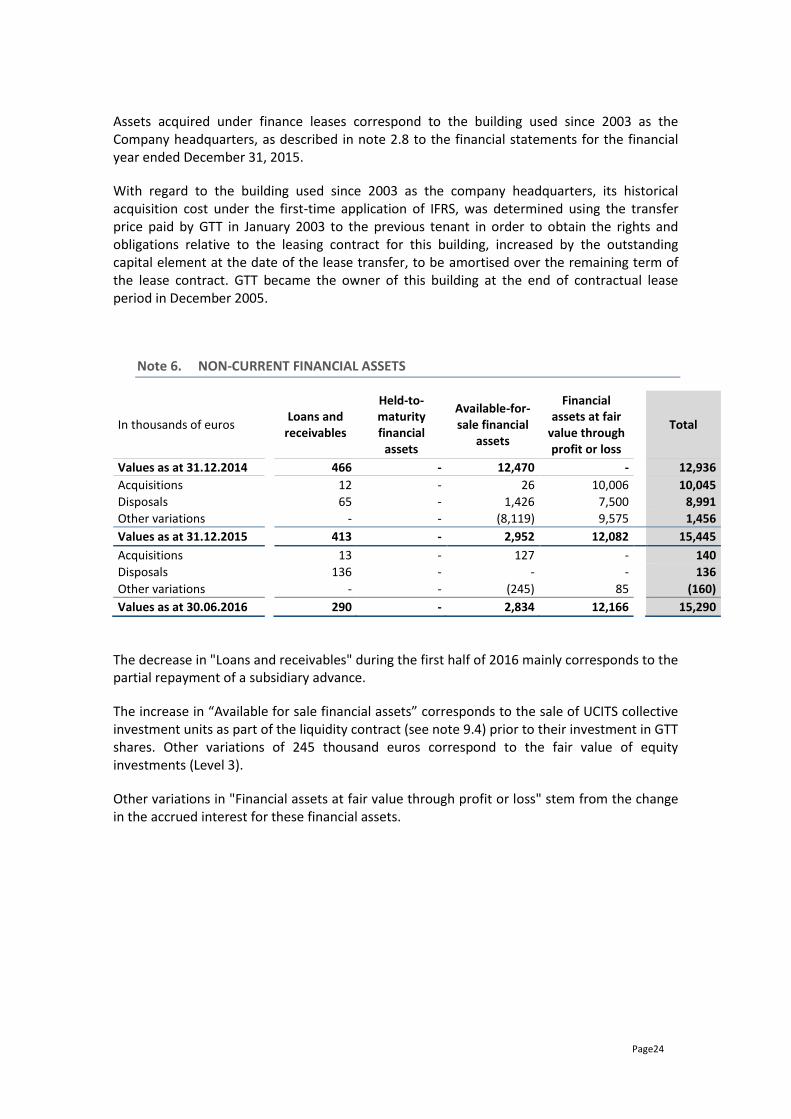
Note 6. NON-CURRENT FINANCIAL ASSETS
In thousands of euros
Loans and receivables
Held-to-maturity financial
assets
Available-for-sale financial
assets
Financial assets at fair
value through profit or loss
Total
Values as at 31.12.2014
466 - 12,470 -
12,936
Acquisitions
12 - 26 10,006
10,045
Disposals
65 - 1,426 7,500
8,991
Other variations
- - (8,119) 9,575
1,456
Values as at 31.12.2015
413 - 2,952 12,082 15,445
Acquisitions
13 - 127 -
140
Disposals
136 - - -
136
Other variations
- - (245) 85
(160)
Values as at 30.06.2016
290 - 2,834 12,166
15,290
The decrease in "Loans and receivables" during the first half of 2016 mainly corresponds to the partial repayment of a subsidiary advance.
The increase in “Available for sale financial assets” corresponds to the sale of UCITS collective investment units as part of the liquidity contract (see note 9.4) prior to their investment in GTT shares. Other variations of 245 thousand euros correspond to the fair value of equity investments (Level 3).
Other variations in "Financial assets at fair value through profit or loss" stem from the change in the accrued interest for these financial assets.
Page25
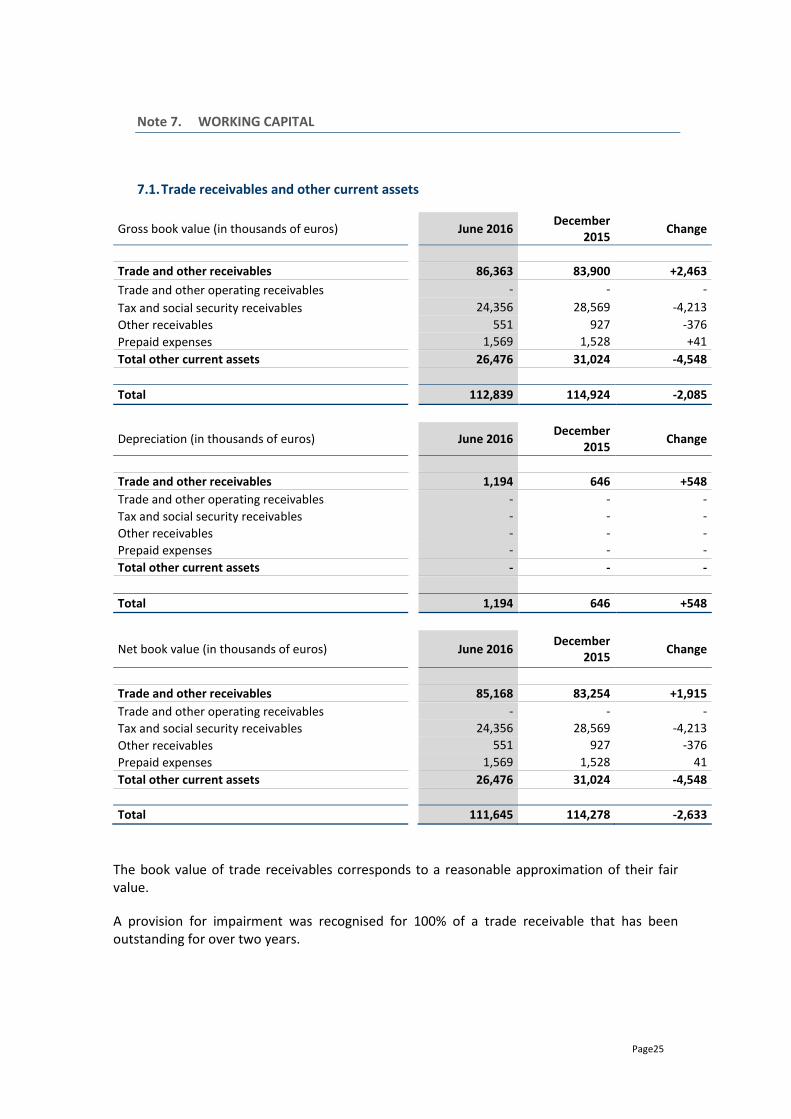
Note 7. WORKING CAPITAL
7.1. Trade receivables and other current assets
Gross book value (in thousands of euros)
June 2016 December
2015 Change
Trade and other receivables
86,363 83,900 +2,463
Trade and other operating receivables
- - -
Tax and social security receivables
24,356 28,569 -4,213
Other receivables
551 927 -376
Prepaid expenses
1,569 1,528 +41
Total other current assets
26,476 31,024 -4,548
Total
112,839 114,924 -2,085
Depreciation (in thousands of euros)
June 2016
December 2015
Change
Trade and other receivables
1,194 646 +548
Trade and other operating receivables
- - -
Tax and social security receivables
- - -
Other receivables
- - -
Prepaid expenses
- - -
Total other current assets
- - -
Total
1,194 646 +548
Net book value (in thousands of euros)
June 2016
December 2015
Change
Trade and other receivables
85,168 83,254 +1,915
Trade and other operating receivables
- - -
Tax and social security receivables
24,356 28,569 -4,213
Other receivables
551 927 -376
Prepaid expenses
1,569 1,528 41
Total other current assets
26,476 31,024 -4,548
Total
111,645 114,278 -2,633
The book value of trade receivables corresponds to a reasonable approximation of their fair value.
A provision for impairment was recognised for 100% of a trade receivable that has been outstanding for over two years.
Page26
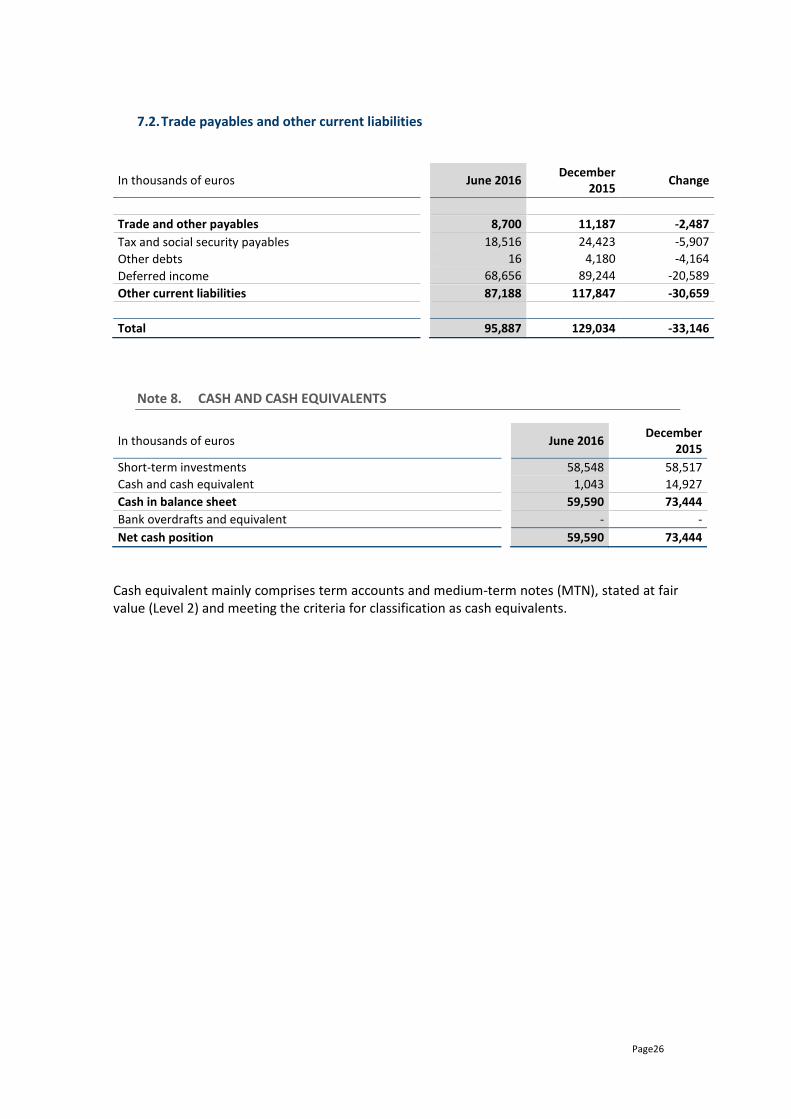
7.2. Trade payables and other current liabilities
In thousands of euros
June 2016 December
2015 Change
Trade and other payables
8,700 11,187 -2,487
Tax and social security payables
18,516 24,423 -5,907
Other debts
16 4,180 -4,164
Deferred income
68,656 89,244 -20,589
Other current liabilities
87,188 117,847 -30,659
Total
95,887 129,034 -33,146
Note 8. CASH AND CASH EQUIVALENTS
In thousands of euros
June 2016 December
2015
Short-term investments
58,548 58,517
Cash and cash equivalent
1,043 14,927
Cash in balance sheet
59,590 73,444
Bank overdrafts and equivalent
- -
Net cash position
59,590 73,444
Cash equivalent mainly comprises term accounts and medium-term notes (MTN), stated at fair value (Level 2) and meeting the criteria for classification as cash equivalents.
Page27
Note 9. SHARE CAPITAL
9.1. Share capital
As at June 30, 2016, the share capital comprised 37,078,357 shares with a nominal value of 0.01 euros.
9.2. Dividends
The shareholders meeting held on May 18, 2016 approved the payment of an ordinary dividend of 2.66 euros per share for the year ended December 31, 2015 payable in cash.
As an interim dividend was paid on September 30, 2015 for 48,165,556 euros, the balance of 50,385,027 euros was paid on May 31, 2016.
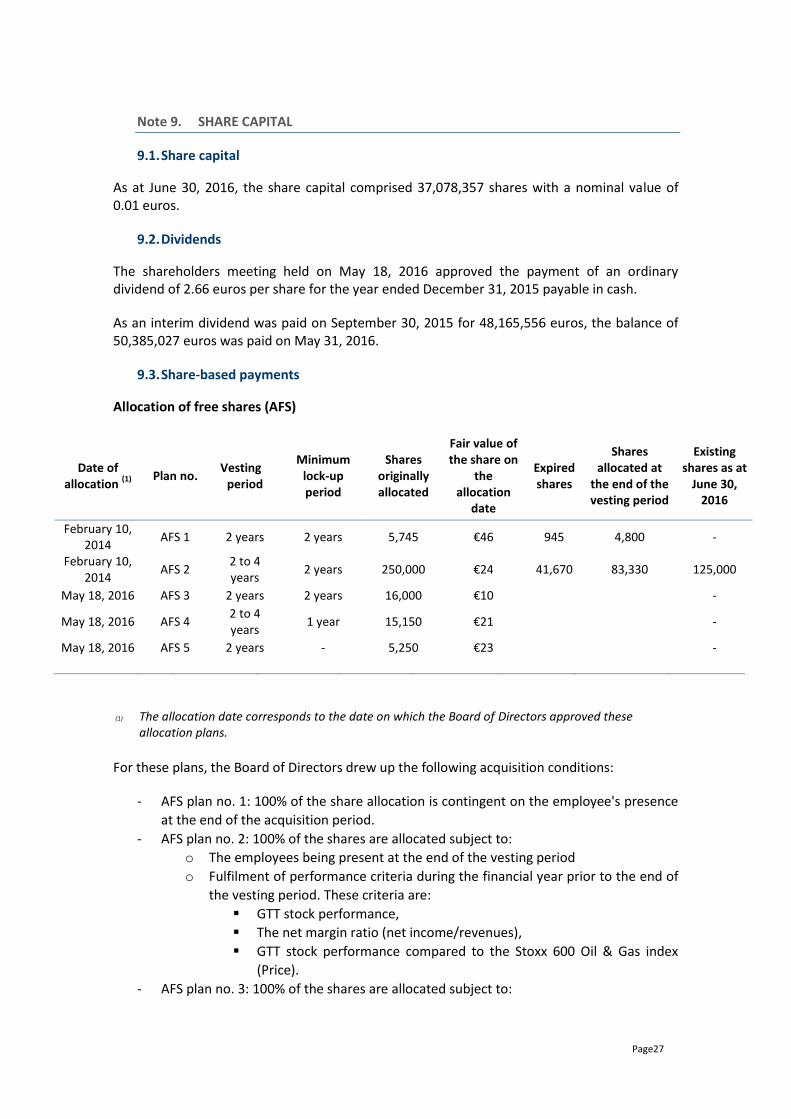
9.3. Share-based payments
Allocation of free shares (AFS)
Date of allocation
(1)
Plan no. Vesting
period
Minimum lock-up period
Shares originally allocated
Fair value of the share on
the allocation
date
Expired shares
Shares allocated at
the end of the vesting period
Existing shares as at
June 30, 2016
February 10, 2014
AFS 1 2 years 2 years 5,745 €46 945 4,800 -
February 10, 2014
AFS 2 2 to 4 years
2 years 250,000 €24 41,670 83,330 125,000
May 18, 2016 AFS 3 2 years 2 years 16,000 €10
-
May 18, 2016 AFS 4 2 to 4 years
1 year 15,150 €21
-
May 18, 2016 AFS 5 2 years - 5,250 €23
-
(1) The allocation date corresponds to the date on which the Board of Directors approved these allocation plans.
For these plans, the Board of Directors drew up the following acquisition conditions:
- AFS plan no. 1: 100% of the share allocation is contingent on the employee's presence
at the end of the acquisition period.
- AFS plan no. 2: 100% of the shares are allocated subject to:
o The employees being present at the end of the vesting period
o Fulfilment of performance criteria during the financial year prior to the end of
the vesting period. These criteria are:
GTT stock performance,
The net margin ratio (net income/revenues),
GTT stock performance compared to the Stoxx 600 Oil & Gas index
(Price).
- AFS plan no. 3: 100% of the shares are allocated subject to:
Page28
o The employees being present at the end of the vesting period
o Fulfilment of performance criteria during the financial year prior to the end of
the vesting period. These criteria are:
GTT stock performance,
The net margin ratio (net income/revenues),
GTT stock performance compared to the Stoxx 600 Oil & Gas index
(Price).
- AFS plan no. 4: 100% of the shares are allocated subject to:
o The employees being present at the end of the vesting period
o Fulfilment of performance criteria during the financial year prior to the end of
the vesting period. These criteria are:
GTT stock performance compared to the Stoxx 600 Oil & Gas index
(Price),
Company performance in terms of services and diversification,
The net margin ratio (net income/revenues),
- AFS plan no. 5: 100% of the share allocation is contingent on the employees’ presence
at the end of the vesting period.
Calculating the charge for the period
In application of the IFRS 2, an expense representing of the benefit granted to beneficiaries of these plans is recorded under “Personnel expenses” (operating income) (note 4.1).
For share-based plans benefiting all employees, the unit value is based on the share price when the plan is allocated and takes changes in headcount into account.
For share-based plans allocated to executive committee members, the unit value is based on the share price when the plan is allocated, weighted by the reasonable estimation of attaining the share allocation criteria.
The expense is calculated by multiplying these unit values by the estimated number of shares to be allocated. It is spread over the rights vesting period following the date of the decision by the Board of Directors on each plan, and according to the probability of performance criteria fulfilment.
For the period from January 1 to June 30, 2016, the expense recognised for the share-based plans no.1 and no.2 amounted to 502 thousand euros. It amounted to 847 thousand euros at June 30, 2015. No expenses were recorded for the plans nos.3, 4 and 5, decided by the Board of Directors on May 18, 2016, as the information to the concerned employees has not been done yet at the end of June 2016.
Page29
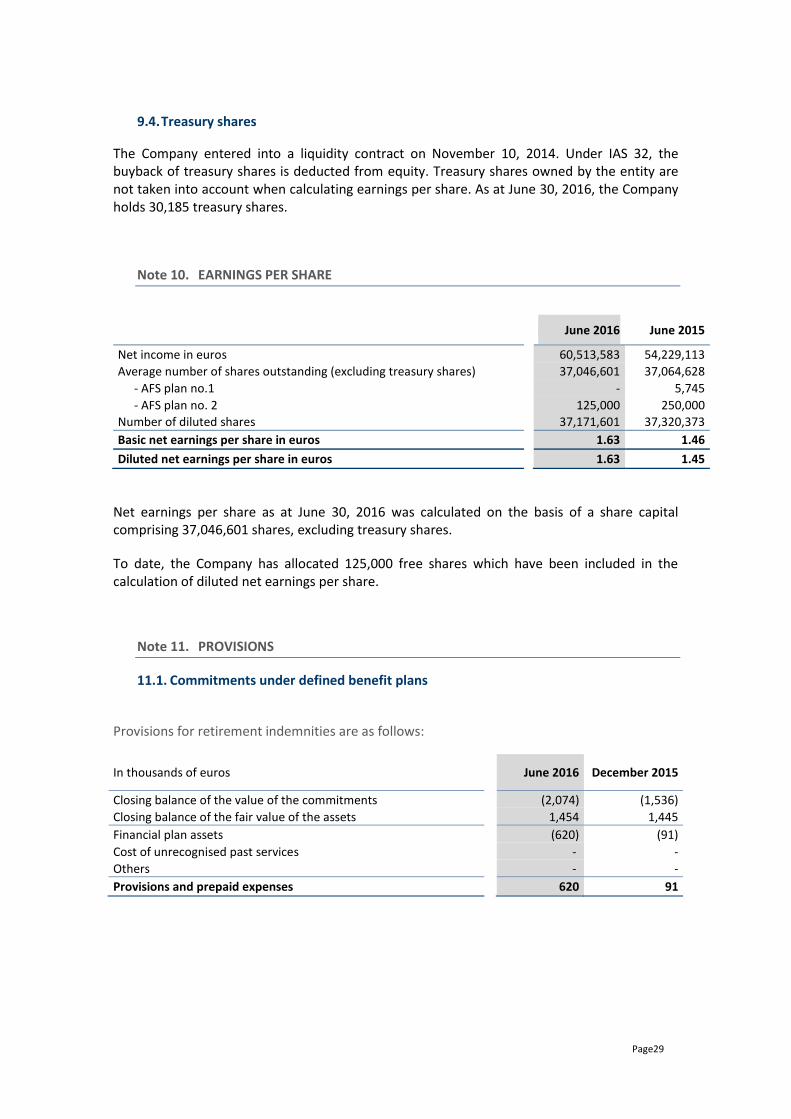
9.4. Treasury shares
The Company entered into a liquidity contract on November 10, 2014. Under IAS 32, the buyback of treasury shares is deducted from equity. Treasury shares owned by the entity are not taken into account when calculating earnings per share. As at June 30, 2016, the Company holds 30,185 treasury shares.
Note 10. EARNINGS PER SHARE
June 2016
June 2015
Net income in euros
60,513,583 54,229,113
Average number of shares outstanding (excluding treasury shares) 37,046,601 37,064,628
- AFS plan no.1
- 5,745
- AFS plan no. 2
125,000 250,000
Number of diluted shares
37,171,601 37,320,373
Basic net earnings per share in euros
1.63 1.46
Diluted net earnings per share in euros
1.63 1.45
Net earnings per share as at June 30, 2016 was calculated on the basis of a share capital comprising 37,046,601 shares, excluding treasury shares.
To date, the Company has allocated 125,000 free shares which have been included in the calculation of diluted net earnings per share.
Note 11. PROVISIONS
11.1. Commitments under defined benefit plans
Provisions for retirement indemnities are as follows:
In thousands of euros
June 2016 December 2015
Closing balance of the value of the commitments (2,074) (1,536)
Closing balance of the fair value of the assets 1,454 1,445
Financial plan assets (620) (91)
Cost of unrecognised past services - -
Others - -
Provisions and prepaid expenses 620 91
Page30
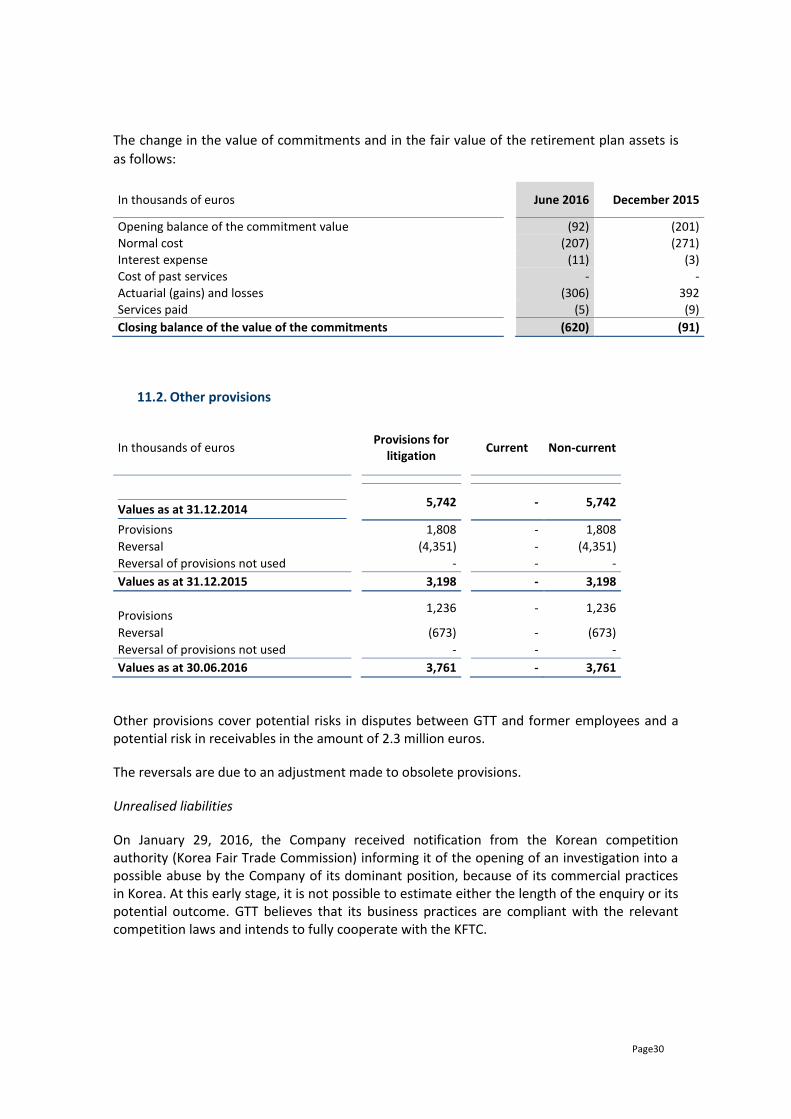
The change in the value of commitments and in the fair value of the retirement plan assets is
as follows:
In thousands of euros June 2016 December 2015
Opening balance of the commitment value (92) (201)
Normal cost (207) (271)
Interest expense (11) (3)
Cost of past services - -
Actuarial (gains) and losses (306) 392
Services paid (5) (9)
Closing balance of the value of the commitments (620) (91)
11.2. Other provisions
In thousands of euros
Provisions for litigation
Current Non-current
Values as at 31.12.2014
5,742
- 5,742
Provisions
1,808
- 1,808
Reversal
(4,351)
- (4,351)
Reversal of provisions not used
-
- -
Values as at 31.12.2015
3,198
- 3,198
Provisions
1,236
- 1,236
Reversal
(673)
- (673)
Reversal of provisions not used
-
- -
Values as at 30.06.2016
3,761
- 3,761
Other provisions cover potential risks in disputes between GTT and former employees and a potential risk in receivables in the amount of 2.3 million euros.
The reversals are due to an adjustment made to obsolete provisions.
Unrealised liabilities
On January 29, 2016, the Company received notification from the Korean competition authority (Korea Fair Trade Commission) informing it of the opening of an investigation into a possible abuse by the Company of its dominant position, because of its commercial practices in Korea. At this early stage, it is not possible to estimate either the length of the enquiry or its potential outcome. GTT believes that its business practices are compliant with the relevant competition laws and intends to fully cooperate with the KFTC.
Page31
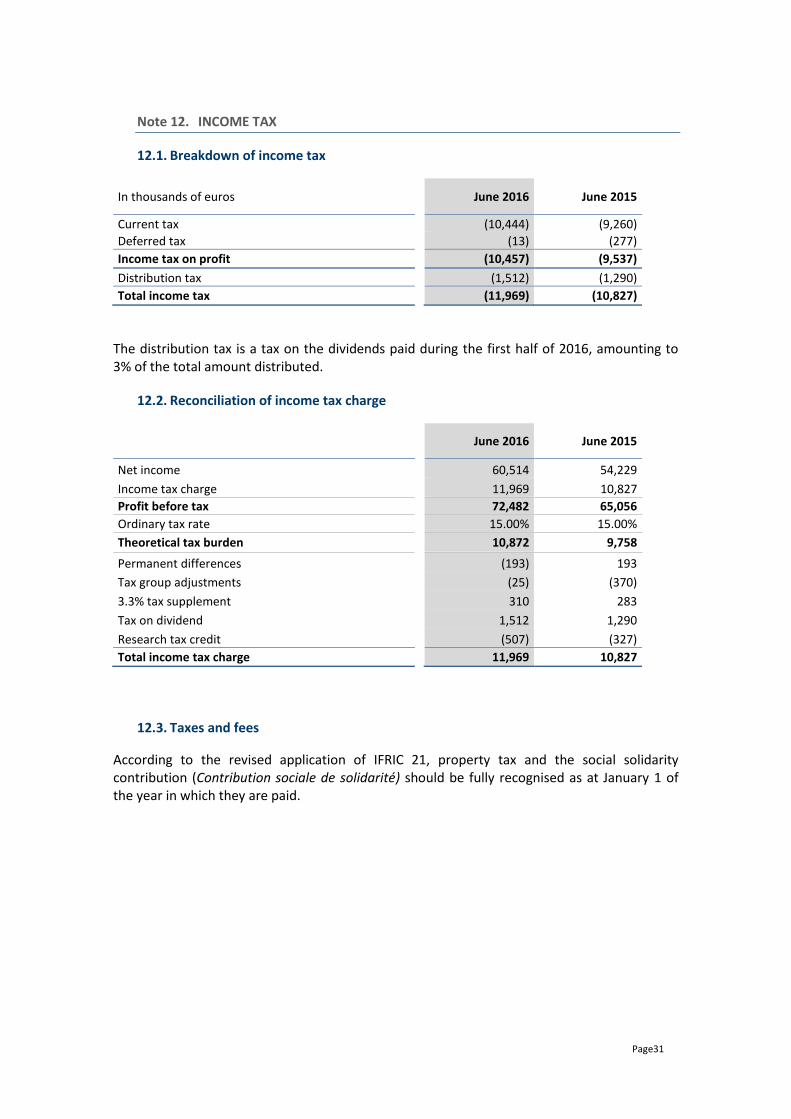
Note 12. INCOME TAX
12.1. Breakdown of income tax
In thousands of euros
June 2016 June 2015
Current tax
(10,444) (9,260)
Deferred tax
(13) (277)
Income tax on profit
(10,457) (9,537)
Distribution tax
(1,512) (1,290)
Total income tax
(11,969) (10,827)
The distribution tax is a tax on the dividends paid during the first half of 2016, amounting to 3% of the total amount distributed.
12.2. Reconciliation of income tax charge
June 2016 June 2015
Net income
60,514 54,229
Income tax charge
11,969 10,827
Profit before tax
72,482 65,056
Ordinary tax rate
15.00% 15.00%
Theoretical tax burden
10,872 9,758
Permanent differences
(193) 193
Tax group adjustments
(25) (370)
3.3% tax supplement
310 283
Tax on dividend
1,512 1,290
Research tax credit
(507) (327)
Total income tax charge
11,969 10,827
12.3. Taxes and fees
According to the revised application of IFRIC 21, property tax and the social solidarity contribution (Contribution sociale de solidarité) should be fully recognised as at January 1 of the year in which they are paid.
Page32
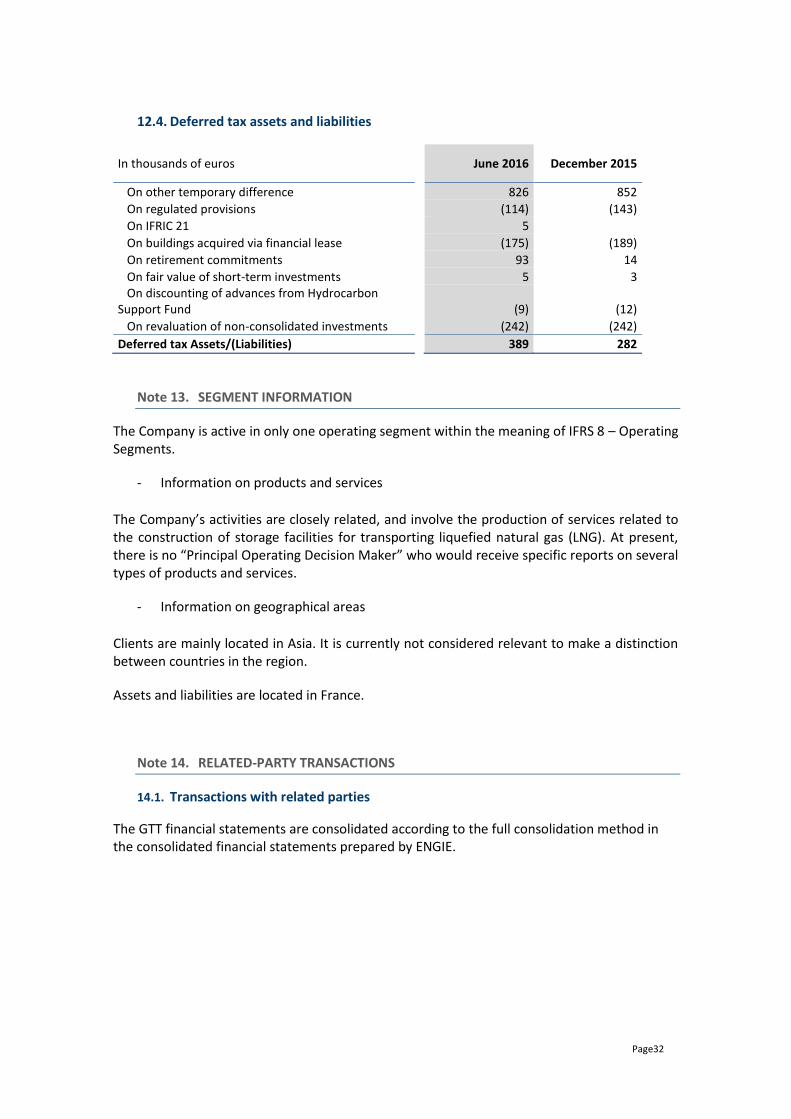
12.4. Deferred tax assets and liabilities
In thousands of euros
June 2016 December 2015
On other temporary difference
826 852
On regulated provisions
(114) (143)
On IFRIC 21
5 On buildings acquired via financial lease
(175) (189)
On retirement commitments
93 14
On fair value of short-term investments
5 3 On discounting of advances from Hydrocarbon Support Fund
(9) (12)
On revaluation of non-consolidated investments
(242) (242)
Deferred tax Assets/(Liabilities)
389 282
Note 13. SEGMENT INFORMATION
The Company is active in only one operating segment within the meaning of IFRS 8 – Operating Segments.
- Information on products and services
The Company’s activities are closely related, and involve the production of services related to the construction of storage facilities for transporting liquefied natural gas (LNG). At present, there is no “Principal Operating Decision Maker” who would receive specific reports on several types of products and services.
- Information on geographical areas
Clients are mainly located in Asia. It is currently not considered relevant to make a distinction between countries in the region.
Assets and liabilities are located in France.
Note 14. RELATED-PARTY TRANSACTIONS
14.1. Transactions with related parties
The GTT financial statements are consolidated according to the full consolidation method in the consolidated financial statements prepared by ENGIE.
Page33
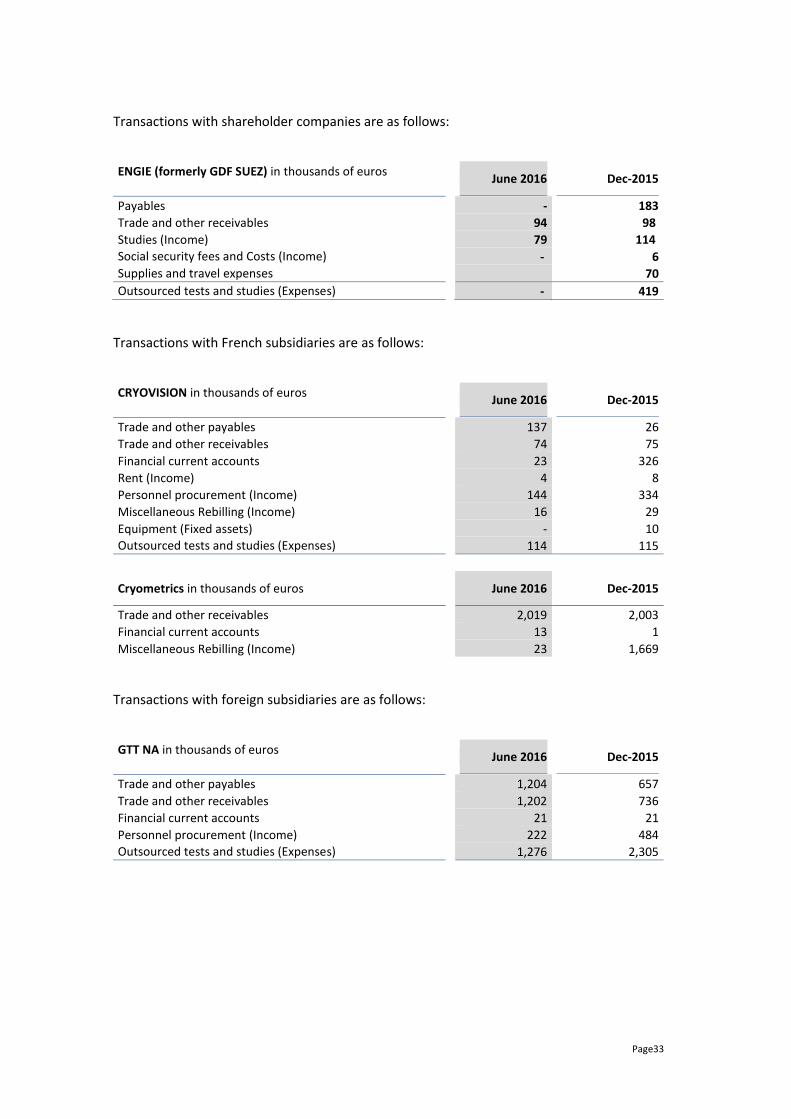
Transactions with shareholder companies are as follows:
ENGIE (formerly GDF SUEZ) in thousands of euros
June 2016
Dec-2015
Payables - 183
Trade and other receivables
94 98
Studies (Income)
79 114
Social security fees and Costs (Income)
- 6
Supplies and travel expenses 70
Outsourced tests and studies (Expenses)
- 419
Transactions with French subsidiaries are as follows:
CRYOVISION in thousands of euros
June 2016
Dec-2015
Trade and other payables
137 26
Trade and other receivables
74 75
Financial current accounts
23 326
Rent (Income)
4 8
Personnel procurement (Income)
144 334
Miscellaneous Rebilling (Income)
16 29
Equipment (Fixed assets)
- 10
Outsourced tests and studies (Expenses)
114 115
Cryometrics in thousands of euros
June 2016 Dec-2015
Trade and other receivables
2,019 2,003
Financial current accounts
13 1
Miscellaneous Rebilling (Income)
23 1,669
Transactions with foreign subsidiaries are as follows:
GTT NA in thousands of euros
June 2016
Dec-2015
Trade and other payables
1,204 657
Trade and other receivables
1,202 736
Financial current accounts
21 21
Personnel procurement (Income)
222 484
Outsourced tests and studies (Expenses)
1,276 2,305

Page34
GTT TRAINING in thousands of euros
June 2016 Dec-2015
Trade and other payables
- 89
Trade and other receivables
1 2
Financial current accounts
158 158
Loans
185 314
Rent (Income)
3 -
Outsourced tests and studies (Expenses)
213 637
GTT SEA in thousands of euros
June 2016 Dec-2015
Trade and other payables
(85) (7)
Trade and other receivables
11 53
Financial current accounts
- 72
Personnel procurement (Income)
71 53
Outsourced tests and studies (Expenses)
234 93
14.2. Compensation of Executive Directors
in thousands of euros
June 2016
June 2015
Wages and bonuses
668 485
Payments in shares (IFRS 2)
- -
Expenses for payments in shares (IFRS 2)
- -
Other long-term benefits
88 65
The compensation shown above at the end of June 2016 includes the nomination of Julien
Burdeau as Chief Operating Officer of GTT since October 2015.
Note 15. PROVISIONS AND CONTINGENT LIABILITIES
On June 30, 2016, the company entered into a line of credit agreement with BNP PARIBAS for 25 million euros for a 5-year period with the possibility of a renewal for two years, with a pari passu clause, without any guarantees or security interests, without any financial covenant, without restrictions on the distribution of dividends and with limited defaulting conditions. This line of credit was not used between June 1 and June 30, 2016.
Page35
STATUTORY AUDITOR’S REVIEW REPORT ON THE HALF-YEARLY FINANCIAL INFORMATION
This is a free translation into English of the statutory auditors' review report on the half-yearly financial information issued in French and it is provided solely for the convenience of English-speaking users. This report also includes information relating to the specific verification of information given in the group’s half-yearly management report.
This report should be read in conjunction with and construed in accordance with French law and professional standards applicable in France.
To the Shareholders,
In compliance with the assignment entrusted to us by your annual general meeting and in accordance with the requirements of article L. 451-1-2 III of the French monetary and financial code (“Code monétaire et financier”), we hereby report to you on:
the review of the accompanying condensed half-yearly financial statements of Gaztransport & Technigaz, for the period from January 1 to June 30, 2016;
the verification of the information presented in the half-yearly management report.
These condensed half-yearly financial statements are the responsibility of your board of directors. Our role is to express an opinion on these financial statements based on our review.
1. Conclusion on the financial statements
We conducted our review in accordance with professional standards applicable in France. A review of interim financial information mainly consists of making inquiries, primarily of persons responsible for financial and accounting matters, and applying analytical and other review procedures. A review is substantially less in scope than an audit conducted in accordance with professional standards applicable in France and consequently does not enable us to obtain assurance that we would become aware of all significant matters that might be identified in an audit. Accordingly, we do not express an audit opinion.
Based on our review, nothing has come to our attention that causes us to believe that the accompanying condensed half-yearly consolidated financial statements are not prepared in all material respects in accordance with IAS 34 – the standard of the IFRSs as adopted by the European Union applicable to interim financial information.
Page36
2. Specific verification
We have also verified the information provided in the half-yearly management report in respect of the condensed half-yearly financial statements subject to our review.
We have no matters to report on the fair presentation and consistency of this information with the condensed half-yearly financial statements.
Paris-La Défense, July 21, 2016
The statutory auditor ERNST & YOUNG Audit French original signed by Aymeric de La Morandière