Embed Size (px)
Citation preview

2016 Evidence and Opportunity:
Impact of Life Sciences in North CarolinaPrepared for: North Carolina Biotechnology CenterPrepared by: TEConomy Partners, LLC

TEConomy Partners, LLC (TEConomy) endeavors at all times to produce work of the highest quality,
consistent with our contract commitments. However, because of the research and/or experimental
nature of this work, the client undertakes the sole responsibility for the consequence of any use or
misuse of, or inability to use, any information or result obtained from TEConomy, and TEConomy, its
partners, or employees have no legal liability for the accuracy, adequacy, or efficacy thereof.

Table of ContentsExecutive Summary .................................................................................................................................................... i
Introduction .................................................................................................................................................................1
North Carolina’s Life Science Industry – Driving Economic Growth and High-Wage Jobs ......................1Closer Examination of North Carolina’s Life Science Subsectors ........................................................................................ 4
Life Science Industry Wages: High-Wage Jobs with Outsized Gains ...................................................................................6
Benchmarking North Carolina Against Other Top Life Sciences States ..............................................................................8
Broader Economic Impacts of the Life Science Industry: Increasing, Deepening, and Reaching Every Region of North Carolina ...................................................... 11
Impacts of the Life Science Industry in North Carolina ........................................................................................................12
Regional Economic Impacts of the Life Science Industry in North Carolina ................................................................... 17
State Life Science Industry Impact by North Carolina Economic Development Tier.................................................... 17
Regional Life Science Industry by Prosperity Zone ................................................................................................................21
The Life Science Industry Footprint Across North Carolina’s Prosperity Zones ........................................................... 25
The North Carolina Biotechnology Center’s Long-term, Multi-Faceted Role in Catalyzing Statewide Industry Development ...............................................................................................33
Measuring the Economic Impact of NCBiotech on the Development
of the North Carolina Life Science Industry .............................................................................................................................35
The Evolving Role and Focus of NCBiotech’s Support—
Recent Accomplishments & New Developments ................................................................................................................... 38
Appendix: Data and Methodology ..................................................................................................................... 43About TEConomy Partners .......................................................................................................................................................... 43
Defining the Life Science Industry ............................................................................................................................................ 43
Economic Impact Approach and Methodology ...................................................................................................................... 45
Academic Life Sciences Research – Additional Data Analysis ............................................................................................ 46


Executive Summary


i
Executive SummaryThis fifth biennial edition of Evidence and Opportunity assesses the performance and economic impacts of the life
science industry in North Carolina and the activities and progress of the North Carolina Biotechnology Center
(NCBiotech) in leading industry development. The report, developed by TEConomy Partners, LLC, the new
organization established by the former principals and staff of Battelle’s Technology Partnership Practice, finds North
Carolina among the national leaders in the life science industry with an impressive recent growth trajectory, and
having significant impacts in driving the state’s economy.
North Carolina is “winning” in life science industry development with today’s state
cluster characterized as large, specialized, high-growth, and notably diverse.
North Carolina’s life science industry is continuing its impressive record of job growth, well outpacing the industry
nationwide. Highlights from the industry performance analysis include:
• At more than 70,000 industry jobs, North Carolina is among the nation’s largest life science industry clusters
and the state is highly specialized in its concentration of jobs.
• The life science industry has added nearly 20,000 net new jobs since 2001, increasing its base by 40 percent.
During this same period, the state’s private sector payrolls increased by less than 6 percent. Since 2001, the life
sciences have accounted for one in ten net new jobs in North Carolina.
• More recently, the industry has seen strong job growth since 2012, rising 6.6 percent or three times the national
growth rate of 2.2 percent.
• North Carolina’s life science industry base is diverse. It has much higher levels of employment concentration
than the nation, and is in fact specialized in i) drugs and pharmaceuticals, ii) research, testing, and medical labs,
and iii) the agricultural biosciences. In addition, its presence in bioscience-related distribution employment
also exceeds the national average.
• The jobs generated in the life science industry pay wages nearly double that of the overall private sector in
North Carolina. In 2014, the average wage for a life science worker topped $87,000 compared with just over
$45,000 for workers across the private sector.
• In North Carolina, average life science industry wages have grown by 13 percent since 2001 in real, inflation-
adjusted terms. This is twice the real wage growth for the average state private sector worker over this same
decade and a half (6 percent).

ii
2016 EVIDENCE AND OPPORTUNITY: IMPACT OF LIFE SCIENCES IN NORTH CAROLINA
Figure ES-1: Life Science Industry Employment Trends, North Carolina and U.S., 2001-14
Source: TEConomy Partners analysis of U.S. Bureau of Labor Statistics, QCEW data; enhanced file from IMPLAN.
North Carolina’s strong record of performance stands up well against peer states. In recent years, the state has
recorded the strongest job growth among the top ten life science states.
Figure ES-2: Life Science Industry Employment Trends, North Carolina and Comparison States, 2012-14
Source: TEConomy Partners analysis of U.S. Bureau of Labor Statistics, QCEW data; enhanced file from IMPLAN.

iii
2016 EVIDENCE AND OPPORTUNITY: IMPACT OF LIFE SCIENCES IN NORTH CAROLINA
With its recent strong growth has come increasing economic impacts for North
Carolina and a more mature, integrated industry.
The total economic impact of the state’s life science industry exceeded $86 billion in 2016, rising an impressive 34
percent during the current economic expansion.
• Since the 2010 economic impact report prepared for NCBiotech, the direct employment of the North Carolina
life science industry, as measured by the NCBiotech company database, has increased by more than 11 percent
and the estimated revenues of the sector have grown even more rapidly, by more than 34 percent.
• The life science industry generated nearly $2.2 billion in state and local government tax revenues in 2016, up
more than 13 percent from $1.9 billion in 2010.
• In terms of employment, the total economic impact from the life science industry stands at nearly 260,000 jobs,
accounting for nearly 5 percent of total employment in the state.
The life science industry’s impacts are not only broad, but also deepening as the state industry continues to develop
and to mature. As industries grow and mature, their local supply chains and workforce development relationships
strengthen. As a result, more of an industry’s operational spending is captured locally, increasing economic
integration and expanding local impacts. As North Carolina has emerged as a leading national and international
center for life sciences business activity, this increasing integration is evident in increases in local jobs supported by
the sector—the employment multiplier has increased from 3.99 state jobs supported by each life sciences job in 2010
to 4.13 jobs in 2016.
Though highly concentrated in two regions of the state, the life science industry’s
economic impacts extend to every region in North Carolina. Strong interactions
between regions are also evident.
Two regional analyses of the statewide impacts of the industry have been developed. To measure and quantify the
impacts of the life science industry and its interrelationships across the state, the study analyzed:
1. The state-level impacts and inter-regional supply chain and commuting relationships of the industry on each of
North Carolina’s three economic development tier designation groupings of counties using the IMPLAN Multi-
Regional Input-Output (MRIO) system; and
2. The economic impacts attributable to the industry in each of North Carolina’s eight “Prosperity Zones.”
While the economic benefits of the life science industry are distributed throughout the state, they are concentrated in
the least distressed “Tier 3” counties, which account for more than three-quarters of all life science industry impacts.

iv
2016 EVIDENCE AND OPPORTUNITY: IMPACT OF LIFE SCIENCES IN NORTH CAROLINA
Despite this concentration of life sciences business activity impacts in Tier 3 counties, the regional impact analysis
yielded two key findings:
• Despite the concentration of industry in Tier 3 counties, life sciences establishments in Tier 1 and 2
jurisdictions are larger, and more concentrated in manufacturing. Thus, North Carolina can offer a broad
spectrum of site selection choices to the life science industry, ranging from urban metropolitan areas,
with a high concentration of research and start-up activities, to lower-cost rural locations for larger-scale
manufacturing activities. It is this diversity of geographic opportunities, within the context of a strong state life
science industry that reinforces North Carolina’s internationally competitive position.
• The analysis of economic linkages between the three tiers of counties identified strong interactions between
tiers, especially between the middle group of Tier 2 counties and the rest of the state. More than one-quarter
(26 percent) of the life sciences generated job impacts in the grouping of Tier 2 counties is caused by inter-
regional supply chain or commuting relationships, indicating that these counties are well integrated into the
state’s overall life science industry.
The regional impact analysis of North Carolina’s eight regional Prosperity Zones found:
• The life science industry impacts all of the state’s regional prosperity zones, with direct life sciences
employment ranging from a low of 284 jobs in the Sandhills Zone to a high of 43,597 direct life science jobs in
the North Central Zone; and
• While each of the state’s prosperity zones are impacted by the life science industry, the impacts are highly
concentrated in the North Central region, with total impacts of $58.7 billion in economic activity and 168,186
jobs, and in the Piedmont-Triad (Central) Region, with $7.8 billion in economic activity and 26,262 jobs; and
• While the economic impacts associated with the life science industry are concentrated in these two regions,
approximately 20 percent of economic and employment activity occurs in the other six regions.
NCBiotech is advancing regional industry development through its regional offices and its relatively new “RISE
North Carolina” initiative which is bolstering the statewide model of the Center with an explicit goal of increasing
statewide impacts via identified areas of opportunity and specific projects.
North Carolina’s diverse life science industry strengths can be leveraged for increasing these regional impacts. The
uniquely diverse state industry is well positioned from an economic development perspective for each region of the
state to find its niche, from opportunities in the agbiosciences to lower-cost manufacturing locations in rural regions.
Industry diversity as a strength is being reinforced through NCBiotech’s sector and technology initiatives that span
biodefense, marine biotechnology, precision medicine, and agricultural biotechnology, all of which can provide new
opportunities for industry development throughout all regions of the state.

v
2016 EVIDENCE AND OPPORTUNITY: IMPACT OF LIFE SCIENCES IN NORTH CAROLINA
NCBiotech’s multi-faceted, holistic role in life science industry and ecosystem
development is increasing impact and catalyzing cluster growth.
The current strength, broad impacts, and long-term growth of North Carolina’s life science industry reflect a
dedicated and sustained focus on effective partnerships of NCBiotech with the industry. The Center’s role in
advancing life science industry development utilizes a multi-faceted, comprehensive approach that addresses the key
phases and ingredients for a successful technology-based economic development (TBED) ecosystem. NCBiotech’s
programs, initiatives, and broader role are highlighted in gray across the development chain in Figure ES-3.
Figure ES-3: Technology-Based Economic Development Chain and NCBiotech Programmatic Efforts
Inte
grat
ion
into
exi
stin
g, e
xpan
ding
and
new
clu
ster
bus
ines
ses
Successful andexpanding
business clusters
TechnologyTransfer
BusinessAttraction
ExistingIndustry
BusinessExpansion
New EnterpriseDevelopment
Basic ScienceInnovationTranslation
Piloting &Demonstration
Support forBusiness Formation,
Attraction and Growth
Long-term, sustained commitment to development of the cluster by all parties
GRANTSExamples:
Biotechnology Innovation Grants (BIG)
Collaborative Funding Grant (CFG)
Institutional Development Grant (IDG)
GRANTSExamples:
Technology Enhancement Grant
REGIONAL & SECTOR
DEVELOPMENTExamples:
RISE NC Projects; AgBiotech,
Precision Health and BioDefense Initiatives
BUSINESS SERVICESExamples:
Economic Development Award
NCBIOTECH BUSINESS LOANS
Company Inception LoanSmall Business Research Loan
Strategic Growth Loan
EXTERNAL FUNDING
RESOURCES
BIOTECHNOLOGY—INFORM AND
EDUCATE
JOB SERVICES
NCBIOTECH PROGRAMS
Source: TEConomy Partners and NCBiotech.

vi
2016 EVIDENCE AND OPPORTUNITY: IMPACT OF LIFE SCIENCES IN NORTH CAROLINA
Economic Impact of Selected NCBiotech Programs:NCBiotech’s loan programs directed to early-stage companies create a “portfolio” of businesses assisted by the
Center. Since 1989, NCBiotech has made 272 business loans to 188 companies. Of the 188 companies that have
received loans, 102 are currently active in some form and these companies employ a total of 2,914 workers. These
companies had estimated revenues of $2.8 billion and generate:
• $4.3 billion in economic activity in the state;
• Create or support 12,666 jobs earning $887 million in labor income; and
• Generate an estimated $115.9 million in state and local tax revenues.
NCBiotech is actively recruiting life science companies to locate in North Carolina as well as supporting existing state
companies in efforts to expand their presence within the state. The current analysis focuses on the economic impact
of the more recent 16 companies where the Center assisted its economic development partners in Fiscal Years 2015
and 2016. Based on data provided by the Center, these 16 companies have the potential to create a total of 2,158 jobs
once they reach their projected employment levels.
• The analysis finds that once the companies involved in these 16 projects attain their full projected level of
employment, they will generate $2.8 billion in economic activity and support 8,526 jobs earning $600 million in
labor income and generate $73 million in combined state and local government revenues.
As it looks to the future, NCBiotech is continuing to evolve, just as it has over its three-decade history. The Center is
looking ahead by actively promoting sector- and technology-specific strategies to maintain industry diversity and to
seize upon emerging opportunities. Further, NCBiotech is focusing on statewide life sciences development to ensure
all North Carolina regions reap the benefits of this high-impact industry, all while maintaining its multi-faceted,
proven approach to ensuring a robust ecosystem for industry development.

Full Report


1
IntroductionThe North Carolina Biotechnology Center (NCBiotech) has long been on the forefront of leadership in life sciences
cluster development, and the Center’s unique and holistic support for the industry and its broader innovation ecosystem
is paying dividends for the state and its citizens. At a time when more states, regions, and nations are turning toward the
life sciences as an economic development driver, North Carolina has established a strong and leading position with a
three-decade long strategic, focused, and sustained commitment to the industry’s development in the state.
Vital to the success of the Center has been a continual evaluation of its performance, impacts, and progress in
achieving its vision of “North Carolina: a global life science leader.” Since 2008, NCBiotech has commissioned the
Evidence and Opportunity report biennially to assess progress that includes an examination of life science industry
trends, competitive position, and economic impacts, and each report has shown measurable progress. In addition
to economic, programmatic, and other impacts of NCBiotech, each biennial report has also featured a special
topic. This 2016 edition focuses on the regional impact and geographic footprint of the life science industry across
North Carolina. The new analysis presented herein finds the industry present in every region of North Carolina,
though with varying concentrations. Complementing this assessment are examples of NCBiotech’s leadership and
commitment to ensuring the benefits of the life science industry accrue in all regions of the state.
I. North Carolina’s Life Science Industry – Driving Economic Growth and High-Wage Jobs
North Carolina’s life science industry is continuing its
impressive record of job growth, well outpacing the
industry nationwide, and in recent years posting the
strongest job growth among the top ten life science
states. Looking inward, the industry is generating
high-quality, high-wage jobs and well outpacing overall
private sector job and wage growth in North Carolina.
North Carolina’s strength and emergence in life science
industry development has been impressive over the
past decade and a half, and has helped to bolster the
state’s economy. The life science industry has added
nearly 20,000 net new jobs since 2001, increasing its
base by 40 percent (see Figure 1). During this same
period, the state’s private sector payrolls increased
by less than 6 percent. Since 2001, the life sciences
have accounted for one in ten net new jobs in North
NC Life Science Industry Snapshot
• Large & Highly Specialized: More than
70,000 state jobs; industry 46% more
concentrated in NC compared to the
nation;
• Diverse: Specialized in 3 distinct
subsectors of life sciences;
• Steady, Long-term Growth: 40% job
growth since 2001;
• Recent Gains: 6.6% growth since 2012 –
faster than other top life sciences states;
• High & Growing Wages: $87,000 for
average life science worker, nearly double
that for private sector; wage growth
double that for private sector since 2001.

2
2016 EVIDENCE AND OPPORTUNITY: IMPACT OF LIFE SCIENCES IN NORTH CAROLINA
Carolina. More recently, the industry has seen strong job growth since 2012, rising 6.6 percent or three times the
national growth rate of 2.2 percent.
Figure 1: Life Science Industry Employment Trends, North Carolina and U.S., 2001-14
Source: TEConomy Partners analysis of U.S. Bureau of Labor Statistics, QCEW data; enhanced file from IMPLAN.
Impressively, life science industry growth has acted as a buffer for North Carolina in the last two recessions.
Following the recession of 2001, North Carolina’s private sector employment base declined by 3.1 percent through
2003 while the life science industry continued to add jobs, growing 8.1 percent during this difficult period. The Great
Recession of the late 2000s saw the state’s private sector jobs decline by 7.5 percent from the economic peak in 2007
through the end of the recession in 2009; meanwhile, the life sciences continued to add jobs, increasing employment
by 1.7 percent.
North Carolina’s success in life science industry growth has now placed it among the national leaders. State life
science companies employed more than 70,000 in 2014, which relative to the size of the state’s private sector, is 46
percent more concentrated than the national average (its location quotient, or LQ, is 1.46). This high concentration
means the life science industry is considered to be “specialized” in North Carolina.1
North Carolina’s life science industry base is also diverse. It has much higher levels of employment concentration
than the nation, and is in fact specialized, in drugs and pharmaceuticals; research, testing, and medical labs; and the
agricultural biosciences. In addition, its presence in bioscience-related distribution employment also exceeds the
national average. This impressive diversity across the life sciences is relatively rare—among all states, just 11 states
and Puerto Rico stand out as the only that are specialized in at least 3 of the 5 life science subsectors.2
1 State or regional location quotients (LQs) measure the degree of job concentration within the state relative to the nation. A state with a LQ
greater than 1.0 is said to have a concentration in the sector. When the LQ is significantly above average, 1.20 or greater, the state is said to have a
“specialization” in the sector.
2 Analysis based on TEConomy/BIO, The Value of Bioscience Innovation in Growing Jobs and Improving Quality of Life, 2016.

3
2016 EVIDENCE AND OPPORTUNITY: IMPACT OF LIFE SCIENCES IN NORTH CAROLINA
Table 1: Summary Employment Metrics, North Carolina and U.S., 2014
LiFE SCiENCES & MAJOR SUBSECTORS
NC Establishments NC Employment U.S. Employment NC
Location Quotient,
2014Count, 2014
Change, 2012-14
Count, 2014
Change, 2012-14
Change, 2012-14
Total Life Sciences 3,179 10.3% 70,466 6.6% 2.2% 1.46
Agricultural Feedstock & Chemicals 53 3.9% 3,116 -4.7% 1.5% 1.38
Bioscience-related Distribution 1,395 5.7% 13,864 3.4% 2.3% 1.05
Drugs & Pharmaceuticals 118 7.3% 21,658 3.4% 3.2% 2.54
Medical Devices & Equipment 195 -1.5% 8,545 -3.5% -0.1% 0.84
Research, Testing, & Medical Labs 1,418 17.9% 23,282 18.5% 3.4% 1.66
Source: TEConomy Partners analysis of U.S. Bureau of Labor Statistics, QCEW data; enhanced file from IMPLAN.
Defining the Life Science IndustryDefining the life science industry is challenging due to its diverse mix of technologies, products, R&D focus,
and companies. The industry includes companies engaged in advanced manufacturing, research activities,
and technology services but has a common thread or link in their application of knowledge in the life
sciences and how living organisms function. At a practical level, federal industry classifications don’t provide
for one over-arching industry code that encompasses the entire industry. Instead, more than two dozen
detailed industries must be combined to best track the life science industry in its primary activities.
The TEConomy/BIO State Initiatives report has developed an evolving set of major aggregated subsectors
that group the life science industry into five major subsectors shown here. For a detailed list of the NAICS
industry codes that define each subsector see the Appendix.
Agriculture Feedstock
&Chemicals
Bioscience- Related
Distribution
Drugs & Pharma
Medical Devices & Equipment
Research, Testing & Medical
Labs

4
2016 EVIDENCE AND OPPORTUNITY: IMPACT OF LIFE SCIENCES IN NORTH CAROLINA
Closer Examination of North Carolina’s Life Science SubsectorsLeading the job growth for North Carolina is the industry’s research, testing, and medical labs subsector that has
grown a rapid 18.5 percent over the recent 2-year period. The largest component of the state’s life science industry,
this high-growth subsector is positioned on the far right of the “bubble” chart below, signaling its rapid growth,
specialized concentration, and status as a state “star” or current strength (see Figure 2). North Carolina has
specializations in the two major detailed industry components of this subsector—commercial life science R&D and
medical labs (see Figure 3).
Figure 2: NC Life Science Industry: Employment Size, Concentration, and Change, 2012-14
Source: TEConomy Partners analysis of U.S. Bureau of Labor Statistics, QCEW data; enhanced file from IMPLAN.
Drugs and pharmaceutical firms also have a growing, specialized presence in North Carolina. Since 2012, the industry
subsector has grown by 3.4 percent, just above the U.S. growth rate of 3.2 percent. The state has specializations in the
large pharmaceutical preparations manufacturing component as well as in manufacturing biologics.
Bioscience-related distribution is also well positioned in North Carolina. Distributors of pharmaceuticals, medical
equipment, and agbioscience-related products have added jobs since 2012. These types of companies are well
concentrated in the state, with a 5 percent greater concentration of jobs as compared with the national average.
State medical device manufacturers have shed jobs since 2012, seeing a decline of roughly 300 jobs or 3.5 percent
while the national devices subsector held mostly flat (-0.1 percent). Still, North Carolina has grown this subsector
quite substantially since 2001, rising 25 percent over the decade-and-a-half period.
The agricultural feedstock and chemicals subsector remains a key specialization for North Carolina, with a 38 percent
greater concentration of jobs compared to the national average. This despite a recent decline in employment of nearly
200 jobs since 2012 (-4.7 percent). The nation grew its agbioscience sector from 2012 through 2014 by a modest 1.5

5
2016 EVIDENCE AND OPPORTUNITY: IMPACT OF LIFE SCIENCES IN NORTH CAROLINA
percent, though this growth while North Carolina saw a decline is concerning. The subsector has been an area of
emphasis and investment for NCBiotech through its sector strategies and the recent job loss warrants continued
monitoring and investment.
Figure 3: North Carolina’s Life Science Subsectors, Current Status and Specialized Components
• Status: Transitional/Priority Retention Target (specialized, but not growing)
• Specialized NC components: Phosphatic Fertilizers; Pesticides & Other Ag Chemicals; Cellulosic Organic Fiber Mfg.
AGRICULTURAL FEEDSTOCK & CHEMICALS
• Status: Emerging Strength (not specialized, growing, outpacing U.S.)
• Specialized NC components: Medical, Dental, & Hospital Equipment & Supplies Wholesalers
BIOSCIENCE-RELATED DISTRIBUTION
• Status: Current Strength (specialized, growing, outpacing U.S.)
• Specialized NC components: Pharmaceutical Preparation Mfg.; Biological Product Mfg.
DRUGS & PHARMACEUTICALS
• Status: Divergent (not specialized, not growing)
• Specialized NC components: Surgical Appliance & Supplies Mfg.
MEDICAL DEVICES & EQUIPMENT
• Status: Current Strength (specialized, growing, outpacing U.S.)
• Specialized NC components: Commercial Life Sciences R&D; Medical Labs
RESEARCH, TESTING, & MEDICAL LABS
Source: TEConomy Partners analysis of U.S. Bureau of Labor Statistics, QCEW data; enhanced file from IMPLAN.

6
2016 EVIDENCE AND OPPORTUNITY: IMPACT OF LIFE SCIENCES IN NORTH CAROLINA
North Carolina’s National Employment Rankings• Drugs and Pharmaceuticals: 3rd largest employment state;
• Research, Testing, and Medical Labs: 6th largest employment state;
• Agricultural Feedstock & Chemicals: 8th largest employment state;
• Bioscience-related Distribution: 10th largest employment state;
• Medical Devices and Equipment: 17th largest employment state.
Source: Ranking analysis developed from TEConomy/BIO, The Value of Bioscience Innovation in Growing Jobs and
Improving Quality of Life, 2016. The biennial report does not explicitly rank life sciences states.
Life Science Industry Wages: High-Wage Jobs with Outsized GainsThe jobs generated in the life science industry pay wages nearly double that of the overall private sector in North
Carolina. In 2014, the average wage for a life science worker topped $87,000 compared with just over $45,000 for
workers across the private sector—a wage premium of 94 percent (see Table 2). Advancing innovation in the life
sciences requires a highly-skilled and well-educated mix of talent spanning science, engineering, and information
technology. Industry wages not only reflect the skills deployed but also the high value-added nature of the products
developed and manufactured across the major subsectors.
Table 2: Average Annual Wages in the Life Science Industry and Major Subsectors, North Carolina and U.S., 2014
LiFE SCiENCE iNDUSTRY & SUBSECTORS North Carolina U.S.
Drugs & Pharmaceuticals $99,867 $117,524
Agricultural Feedstock & Chemicals $88,908 $80,640
Total Life Sciences $87,158 $94,543
Research, Testing, & Medical Labs $86,279 $97,485
Bioscience-related Distribution $85,089 $90,458
Medical Devices & Equipment $60,063 $79,537
Total Private Sector $45,021 $51,148
Source: TEConomy Partners analysis of U.S. Bureau of Labor Statistics, QCEW data; enhanced file from IMPLAN.
In North Carolina, average life science industry wages have grown by 13 percent since 2001 in real, inflation-adjusted
terms. This compares to 6 percent real wage growth for the average state private sector workers over this same
decade and a half. At the national level, life science industry wages have risen by 19 percent, in real terms, since
2001 compared with 6 percent for the private sector. These double-digit wage gains that have doubled gains for the

7
2016 EVIDENCE AND OPPORTUNITY: IMPACT OF LIFE SCIENCES IN NORTH CAROLINA
overall economy highlight the already high and increasing value-adding activities of the sector, and yet another value
proposition for states, regions, and nations pursuing life sciences economic development.
Figure 4: Growth in Real Average Annual Wages in the Life Sciences and Overall Private Sector, 2001-14
Source: TEConomy Partners analysis of U.S. Bureau of Labor Statistics, QCEW data; enhanced file from IMPLAN. Wages adjust-
ed for inflation using Bureau of Labor Statistics, Consumer Price Index data.

8
2016 EVIDENCE AND OPPORTUNITY: IMPACT OF LIFE SCIENCES IN NORTH CAROLINA
Benchmarking North Carolina Against Other Top Life Sciences StatesNorth Carolina’s strength and continued growth in the life sciences has propelled it into the ranks of the nation’s
largest industry clusters. The state’s more than 70,000 industry jobs places it among the top ten life science industry
states (ranking 9th overall). In terms of recent trends, North Carolina is the fastest growing among these 10 states
relative to its employment base—an exciting development for the dynamic state industry (see Table 3 and Figure 5).
It is one of five top states to have a specialized life science industry overall, emphasizing its importance to the North
Carolina economy relative to other sectors.
Table 3: Summary Life Science Industry Employment Metrics, North Carolina and Comparison States, 2014
STATE Establishments, 2014 Employment, 2014 Employment
Change, 2012-14Location Quotient,
2014
California 8,762 242,557 2.8% 1.26
New Jersey 2,585 87,614 1.9% 1.89
Florida 5,895 82,801 4.9% 0.86
Massachusetts 2,227 81,495 4.7% 1.95
Texas 4,865 81,472 0.8% 0.60
Illinois 3,744 80,965 3.1% 1.14
Pennsylvania 2,358 77,140 -1.5% 1.09
New York 3,054 75,685 -0.5% 0.71
North Carolina 3,179 70,466 6.6% 1.46
Indiana 1,727 58,461 1.4% 1.64
Source: TEConomy Partners analysis of U.S. Bureau of Labor Statistics, QCEW data; enhanced file from IMPLAN.

9
2016 EVIDENCE AND OPPORTUNITY: IMPACT OF LIFE SCIENCES IN NORTH CAROLINA
Figure 5: Life Science Industry Employment Trends, North Carolina and Comparison States, 2012-14
Source: TEConomy Partners analysis of U.S. Bureau of Labor Statistics, QCEW data; enhanced file from IMPLAN.
North Carolina’s rapid growth, ahead of both the nation and the set of leading peers, means it is gaining U.S. industry
market share and increasing its relative concentration (location quotient). That said, its concentration remains below
states like Massachusetts, New Jersey, and Indiana where the life sciences represent a greater share of economic
activity relative to the country (Figure 6).
Figure 6: Life Science Industry: Employment Size, Concentration, and Change, 2012-14
Source: TEConomy Partners analysis of U.S. Bureau of Labor Statistics, QCEW data; enhanced file from IMPLAN.

10
2016 EVIDENCE AND OPPORTUNITY: IMPACT OF LIFE SCIENCES IN NORTH CAROLINA
North Carolina’s large, specialized, and high-growth life science industry is performing well and generating high-
wage, quality jobs for the state. But, how does this translate into even broader economic impacts and is the entire
state reaping these economic gains? The next section of the report explores these questions in detail.

11
II. Broader Economic Impacts of the Life Science Industry: Increasing, Deepening, and Reaching Every Region of North Carolina
North Carolina’s life science industry is on a high-growth trajectory in recent years, led by rapid growth in some of its
largest and highest-paying industry subsectors, and acting as a core driver of the state economy. These gains, as one
would expect, are translating into broader, steadily rising economic impacts. The total economic impact of the state’s life
science industry exceeded $86 billion in 2016, rising an impressive 34 percent during the current economic expansion.
These broad impacts are extending across and throughout the state, reflecting the diverse nature of North Carolina’s
industry and revealing one of the core value propositions for life sciences economic development—local areas, both
urban and rural, can develop a comparative advantage in an industry niche. In the life sciences, that niche can range
from the innovative biotechnology research conducted in the lab to the production of new therapeutics and vaccines
to the distribution of precision medical devices.
A regional assessment of the North Carolina life sciences, conducted here in a new analysis, reveals an industry
having significant impacts throughout the state, in both urban and rural areas, and across each region of the state.
The life science industry’s impacts are not only broad, but also deepening as the state industry continues to develop
and to mature. As industries grow and mature, their local supply chains and workforce development relationships
strengthen. As a result, more of an industry’s operational spending is captured locally, increasing economic
integration and expanding local impacts. As North Carolina has emerged as a leading national and international
center for life sciences business activity, this increasing integration is evident in increases in local jobs supported by
the sector—the employment multiplier has increased from 3.99 state jobs supported by each life sciences job in 2010
to 4.13 jobs in 2016.
This section examines the impacts of the industry statewide and by sub-state regions. In addition, the impact of life
sciences R&D at North Carolina’s colleges and universities, is also reported.

12
2016 EVIDENCE AND OPPORTUNITY: IMPACT OF LIFE SCIENCES IN NORTH CAROLINA
Impacts of the Life Science Industry in North CarolinaNorth Carolina’s life science industry continued to grow throughout the current economic expansion and the state
continues to be a national leader in industry growth and performance. Not surprisingly, given the growth and success
of the industry, the contributions of this sector to the state’s economy have similarly increased. Key findings from the
industry economic impact assessment include:
• Since the 2010 economic impact report prepared for NCBiotech, the direct employment of the North Carolina
life science industry has increased by more than 11 percent and the estimated revenues of the industry have
grown even more rapidly, by more than 34 percent.
• The total economic impact on state output estimated for the life science industry has increased to over $86
billion in 2016.
• The life science industry generated nearly $2.2 billion in state and local government revenues in 2016, up more
than 13 percent from $1.9 billion in 2010.
• In terms of employment, the total economic impact from the life science industry stands at nearly 260,000 jobs,
accounting for nearly 5 percent of total employment in the state.
Table 4: Comparison of the Economic Contribution of the Life Science Industry to the North Carolina Economy 2010, 2012, 2014 and 2016
iTEM 2010 2012 2014 2016 Change 2010-16
% Change 2010-16
Direct Impact (Output Mil. $s) $41,156 $36,477 $49,478 $55,324 $14,168 34%
Total Impact (Output Mil. $s) $64,642 $59,009 $73,463 $86,364 $21,722 34%
State Impact Multiplier 1.57 1.62 1.48 1.56
Direct Impact (Employment) 56,842 58,589 60,717 62,937 6,095 11%
Total Impact (Employment) 226,823 237,665 228,259 259,963 33,140 15%
State Impact Multiplier 3.99 4.06 3.76 4.13
State and Local Tax Revenues (Mil. $) 1,918 1,731 1,781 2,175 257 13%
Source: TEConomy Partners analysis of NCBiotech data using IMPLAN.
13
2016 EVIDENCE AND OPPORTUNITY: IMPACT OF LIFE SCIENCES IN NORTH CAROLINA
In 2016 the North Carolina life science industry, as
measured through the NCBiotech company database,
had total employment of 62,937 jobs and $55.3 billion in
estimated revenues thereby generating:
• $19.3 billion in business activity and 108,590 jobs
through the Indirect Impacts associated with
purchases from local suppliers; and
• $11.8 billion in economic activity and 88,437 jobs
through the Induced Impacts associated with the
increase in household incomes associated with
the jobs created by the sector, for a total impact of
$86.4 billion in business activity and 259,963 jobs.
The economic impacts of the life science industry are
presented by major subsector in Table 5.
• The drugs and pharmaceutical subsector has
the largest impact, generating $58.0 billion in
economic activity and supporting 148,650 jobs;
• The research, testing, and medical laboratories
subsector has the second-largest impact,
generating $13.3 billion in economic activity and
supporting 74,215 jobs;
• The agricultural feedstock and chemicals
subsector has the third-largest impact, generating
$8.0 billion in economic activity and supporting
16,555 jobs;
• The other life sciences subsector, which includes
life science-related distribution as well as life sciences companies active in sectors not included in TEConomy’s
industry-based definition, has the fourth-largest impact, generating $3.6 billion in economic activity and
supporting 8,052 jobs;
• The medical devices and equipment subsector generates $3.4 billion in economic activity and supports 12,491 jobs.
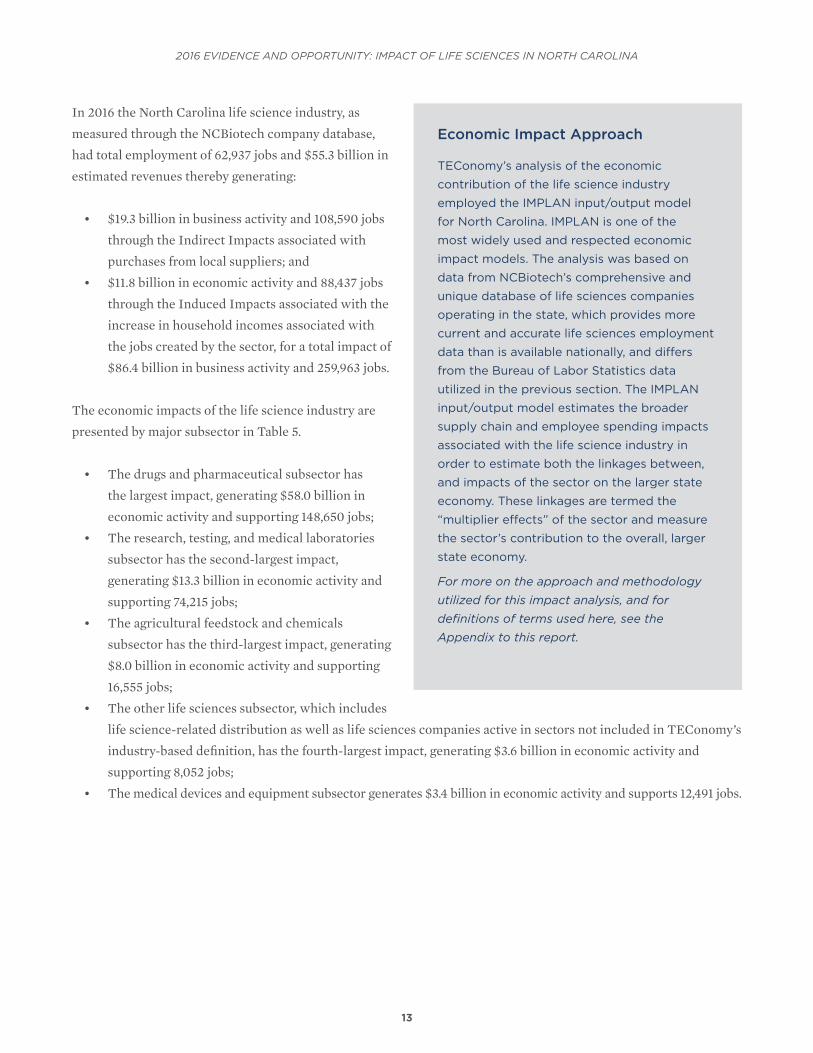
Economic Impact Approach
TEConomy’s analysis of the economic
contribution of the life science industry
employed the IMPLAN input/output model
for North Carolina. IMPLAN is one of the
most widely used and respected economic
impact models. The analysis was based on
data from NCBiotech’s comprehensive and
unique database of life sciences companies
operating in the state, which provides more
current and accurate life sciences employment
data than is available nationally, and differs
from the Bureau of Labor Statistics data
utilized in the previous section. The IMPLAN
input/output model estimates the broader
supply chain and employee spending impacts
associated with the life science industry in
order to estimate both the linkages between,
and impacts of the sector on the larger state
economy. These linkages are termed the
“multiplier effects” of the sector and measure
the sector’s contribution to the overall, larger
state economy.
For more on the approach and methodology
utilized for this impact analysis, and for
definitions of terms used here, see the
Appendix to this report.

14
2016 EVIDENCE AND OPPORTUNITY: IMPACT OF LIFE SCIENCES IN NORTH CAROLINA
Table 5: Economic Contribution of the Life Science Industry to the North Carolina Economy by Subsector, 2016
iTEM Output (Mil. $s) Labor income (Mil. $s) Employment
State/Local Tax Revenue (Mil.
$s)
Total Life Science Industry
Direct Effect $55,324.4 $6,654.8 62,937 $700.9
Indirect Impacts $19,278.1 $7,295.7 108,590 $891.7
Induced Impacts $11,761.4 $3,758.4 88,437 $582.0
Total Impact $86,363.9 $17,708.9 259,963 $2,174.6
State Impact Multiplier 1.56 2.66 4.13
Agricultural Feedstock & Chemicals
Direct Effect $5,634.4 $374.2 2,617 $61.2
Indirect Impacts $1,573.5 $548.5 8,115 $68.8
Induced Impacts $774.3 $247.5 5,823 $38.3
Total Impact $7,982.3 $1,170.1 16,555 $168.3
State Impact Multiplier 1.42 3.13 6.33
Drugs & Pharmaceuticals
Direct Effect $37,715.9 $3,188.0 24,833 $422.0
Indirect Impacts $13,247.5 $5,178.8 70,570 $660.3
Induced Impacts $7,081.7 $2,262.9 53,247 $350.4
Total Impact $58,045.0 $10,629.7 148,650 $1,432.8
State Impact Multiplier 1.54 3.33 5.99
Medical Devices & Equipment
Direct Effect $2,247.4 $403.8 4,571 $32.2
Indirect Impacts $670.2 $233.4 3,931 $31.3
Induced Impacts $530.5 $169.5 3,989 $26.3
Total Impact $3,448.2 $806.7 12,491 $89.8
State Impact Multiplier 1.53 2.00 2.73

15
2016 EVIDENCE AND OPPORTUNITY: IMPACT OF LIFE SCIENCES IN NORTH CAROLINA
iTEM Output (Mil. $s) Labor income (Mil. $s) Employment
State/Local Tax Revenue (Mil.
$s)
Research, Testing, & Medical Laboratories
Direct Effect $7,126.0 $2,521.8 29,023 $142.0
Indirect Impacts $3,088.9 $1,121.9 22,187 $99.7
Induced Impacts $3,059.4 $977.7 23,005 $151.4
Total Impact $13,274.4 $4,621.4 74,215 $393.1
State Impact Multiplier 1.86 1.83 2.56
Other Life Sciences
Direct Effect $2,600.7 $167.0 1,893 $43.4
Indirect Impacts $698.0 $213.1 3,786 $31.6
Induced Impacts $315.4 $100.8 2,373 $15.6
Total Impact $3,614.1 $480.9 8,052 $90.6
State Impact Multiplier 1.39 2.88 4.25
Source: TEConomy Partners analysis of NCBiotech data using IMPLAN.
The economic activity supported by the life science industry affects other sectors across the state. The IMPLAN
model used in this analysis permits the identification of the industries where the life science industry makes its
purchases. The top ten industries impacted by the North Carolina life science industry in terms of both output
(purchases) and total jobs supported are presented in Table 6.

16
2016 EVIDENCE AND OPPORTUNITY: IMPACT OF LIFE SCIENCES IN NORTH CAROLINA
Table 6: Top Ten Supplier Industries to the North Carolina Life Science industry in Terms of Output and Jobs, 2016
TOP TEN iNDiRECT iMPACT iNDUSTRiES - OUTPUT Mil. $s TOP TEN iNDiRECT iMPACT
iNDUSTRiES - EMPLOYMENT Jobs
Management of companies and enterprises $4,801 Management of companies and
enterprises 19,654
Wholesale trade $3,293 Wholesale trade 14,473
Real estate $1,057 Management consulting services 7,051
Management consulting services $859 Real estate 5,654
Advertising, public relations, and related services $378 Employment services 5,099
Maintenance and repair construction of nonresidential structures $370 Services to buildings 3,579
Legal services $359Marketing research and all other miscellaneous professional, scientific, and technical services
3,039
Monetary authorities and depository credit intermediation $352 Maintenance and repair construction
of nonresidential structures 2,302
Employment services $348 Legal services 2,292
Electric power transmission and distribution $344 Truck transportation 2,159
Source: TEConomy Partners analysis of NCBiotech data using IMPLAN.

17
2016 EVIDENCE AND OPPORTUNITY: IMPACT OF LIFE SCIENCES IN NORTH CAROLINA
Regional Economic Impacts of the Life Science Industry in North CarolinaNorth Carolina is realizing strong, and growing, economic impacts from its life science industry. The geographic
footprint of this industry and gains accruing in regions throughout the state is of significant interest to NCBiotech.
The Center has 6 offices across the state to advance life sciences development statewide. The Center asked
TEConomy to provide insights into this geographic distribution of the industry.
In addition to analyzing the statewide economic impacts of the life science industry, two additional regional analyses
of the sector have been developed. In order to measure and quantify the impacts of the life science industry and its
interrelationships across the state, TEConomy has analyzed:
1. The state-level impacts and inter-regional supply chain and commuting relationships of the industry on each of
North Carolina’s three economic development tier designation groupings of counties using the IMPLAN Multi-
Regional Input-Output (MRIO) system; and
2. The economic impacts attributable to the industry in each of North Carolina’s eight “Prosperity Zones.”
State Life Science Industry Impact by North Carolina Economic Development TierIn 2007, the State of North Carolina established a three-tier system for classifying its 100 counties from most
distressed (Tier 1) to least distressed (Tier 3), with mandated classification of 40 counties each into Tiers 1 and 2, and
20 counties into Tier 3. County tier designations are determined based on unemployment, median household income,
population growth, and property tax base.
To assess the linkages between the life science industry and industries and workers across the state, the state-level
economic impacts of the life science industry were estimated for each of these three tiers of counties using the
Multi-Regional Input-Output (MRIO) modeling capabilities of IMPLAN. Data from the NCBiotech life sciences
company database were analyzed at the individual county level to determine the employment by county and by tier.
This analysis demonstrates the regional linkages of the life science industry in terms of both commuting patterns and
supplier relationships between these groupings of counties, with the sector being able to draw from both workforce
and supply chain assets and resources distributed throughout the state.
The IMPLAN MRIO system allows for the estimation of linkages between regions in an economy. In this case,
TEConomy analyzed the economic activity in each of North Carolina’s economic development tier groupings. Life
science activity occurring within each tier of counties as well as the inter-relationships between the tiers were
analyzed and are shown in Table 7. Both Indirect Impacts, in terms of supplier relationships, and Induced Impacts,
in terms of commuting, were compared among the different tiers of counties. In essence, this analysis measures the
impact of the life science industry on each tier of counties from both local life sciences business activity, as well as from
each tier’s supplier relationships and commuting patterns to support life sciences business activities in the rest of the
state. These data indicate that economic activity generated by the life science industry are distributed throughout the
state with:

18
2016 EVIDENCE AND OPPORTUNITY: IMPACT OF LIFE SCIENCES IN NORTH CAROLINA
• $65.4 billion in economic activity and 207,819 jobs generated in North Carolina’s least distressed, Tier 3
counties;
• $10.3 billion in economic activity and 31,038 jobs generated in North Carolina’s middle, Tier 2 counties; and
• $10.6 billion in economic activity and 21,106 jobs generated in North Carolina’s most distressed, Tier 1 counties.
Table 7: State Economic Contribution of the Life Science Industry by County Economic Well-being Tier, 2016
iTEM Output (Mil. $s) Labor income (Mil. $s) Employment
State/Local Tax Revenue (Mil.
$s)
Total Impact
Direct Effect $55,324.4 $6,654.8 62,937 $700.9
Indirect Impacts $19,278.1 $7,295.7 108,590 $891.7
Induced Impacts $11,761.4 $3,758.4 88,437 $582.0
Total Impact $86,363.9 $17,708.9 259,963 $2,174.6
State Impact Multiplier 1.56 2.66 4.13
Tier 1 – Most Distressed Counties Impact
Direct Effect $8,594.4 $473.5 5,853 $95.2
Indirect Impacts $1,503.6 $454.4 10,534 $89.5
Induced Impacts $532.3 $142.7 4,719 $29.6
Total Impact $10,630.3 $1,070.7 21,106 $214.3
State Impact Multiplier 1.24 2.26 3.61
Tier 2 – Middle Tier Counties Impact
Direct Effect $7,170.1 $742.8 9,084 $96.3
Indirect Impacts $2,156.1 $665.3 13,715 $104.7
Induced Impacts $984.2 $267.5 8,239 $51.8
Total Impact $10,310.4 $1,675.7 31,038 $252.8
State Impact Multiplier 1.44 2.26 3.42

19
2016 EVIDENCE AND OPPORTUNITY: IMPACT OF LIFE SCIENCES IN NORTH CAROLINA
iTEM Output (Mil. $s) Labor income (Mil. $s) Employment
State/Local Tax Revenue (Mil.
$s)
Tier 3 – Least Distressed Counties Impact
Direct Effect $39,559.9 $5,438.4 48,000 $509.4
Indirect Impacts $15,618.4 $6,175.9 84,341 $697.5
Induced Impacts $10,245.0 $3,348.2 75,478 $500.6
Total Impact $65,423.2 $14,962.5 207,819 $1,707.5
State Impact Multiplier 1.65 2.75 4.33
Source: TEConomy Partners analysis of NCBiotech data using IMPLAN.
Based on the regional impact analysis conducted, while
the economic benefits of the life science industry are
distributed throughout the state, they are concentrated
in the least distressed Tier 3 counties, that account for
more than three-quarters of all life science industry
impact. Despite this concentration of life science
business activity impact in Tier 3 counties, the regional
impact analysis yielded two interesting findings:
• In terms of overall activity, the life science
industry is highly concentrated in North
Carolina’s least distressed, Tier 3 counties,
which account for 88 percent of life sciences
establishments analyzed and 76 percent of direct
life sciences employment; however, life sciences
establishments in Tier 1 and 2 jurisdictions are
larger, and more concentrated in manufacturing
(Figure 7). Thus, North Carolina can offer a broad spectrum of site selection choices to the life science industry,
ranging from urban metropolitan areas, with a high concentration of research and start-up activities, to lower-
cost rural locations for larger-scale manufacturing activities. It is the diversity of geographic opportunities,
within the context of a strong state life science sector that reinforces North Carolina’s internationally
competitive position.
• The IMPLAN MRIO analysis of economic linkages between the three tiers of counties identified strong
interactions between the tiers of counties, especially between the middle group of Tier 2 counties and the rest
of the state. More than one-quarter (26 percent) of the life sciences generated job impacts in the grouping
of Tier 2 counties is caused by inter-regional supply chain or commuting relationships, indicating that these
counties are well integrated into the state’s overall life science industry (Figure 8).
Strong Economic Connections Between the Three Tiers of NC Counties
The analysis identified strong interactions
between the tiers of counties, especially
between the middle group of Tier 2 counties
and the rest of the state. More than one-
quarter (26 percent) of the life sciences
generated job impacts in the grouping of Tier
2 counties is caused by inter-regional supply
chain or commuting relationships, indicating
that these counties are well integrated into the
state’s overall life science industry.

20
2016 EVIDENCE AND OPPORTUNITY: IMPACT OF LIFE SCIENCES IN NORTH CAROLINA
Figure 7: Average Establishment Size and Percentage of Employment in Manufacturing, by North Carolina Development Tier, 2016
Source: TEConomy Partners analysis of NCBiotech data.
Figure 8: Share of Regional Job Impacts Generated by Inter-Regional Activity, 2016
Source: TEConomy Partners analysis of NCBiotech data using IMPLAN.

21
2016 EVIDENCE AND OPPORTUNITY: IMPACT OF LIFE SCIENCES IN NORTH CAROLINA
NCBiotech’s Eastern North Carolina Commuting AnalysisMark Phillips, Executive Director of the Eastern Region Office and VP of Statewide Operations, initiated
a recent survey of local companies to understand the draw of local life science companies’ workforce.
Commuting patterns signal the broad “laborshed” in which companies reach and bolster local economies.
Based on responses from 12 companies, located across 5 counties, the survey found that the laborshed
reaches 49 counties or nearly half of North Carolina’s 100 counties. This analysis, while not comprehensive,
demonstrates the broad economic reach and impact of these technology-intensive manufacturing and other
facilities. While not every county or locality may have a life science-related company present, these high-
paying jobs are benefitting rural counties.
Regional Life Science Industry by Prosperity ZoneThe North Carolina Department of Commerce has established eight “prosperity zones” to organize its efforts to grow
the state’s economy. These eight multi-county regions help to ensure economic growth across all of North Carolina’s
100 counties, by leveraging regional economic, workforce and educational resources.3
Figure 9: North Carolina’s Eight Regional Prosperity Zones
The NCBiotech database was analyzed at the county level to determine employment by county and by regional
prosperity zone. This analysis focuses on the impacts derived from the life sciences business activity directly
occurring within each zone and does not include the impacts of inter-regional purchases analyzed in the IMPLAN
3 For more information and county-level definitions of the Prosperity Zones see: https://www.nccommerce.com/about-our-department/
north-carolina-prosperity-zones.

22
2016 EVIDENCE AND OPPORTUNITY: IMPACT OF LIFE SCIENCES IN NORTH CAROLINA
MRIO tier-based analysis presented above. The analyses presented in Table 8 shows the impacts of the life sciences
business activity occurring within each region on the zone being analyzed. The key findings of this regional analysis
are as follows:
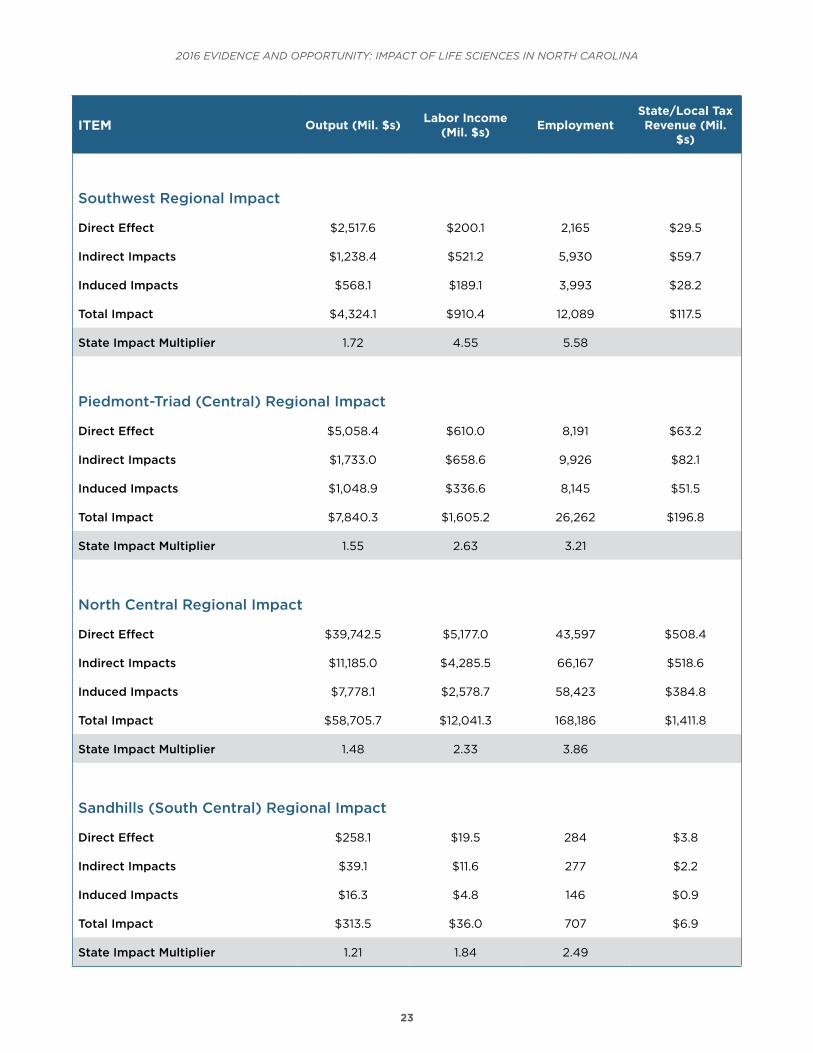
• The life science industry impacts all of the state’s regional prosperity zones, with direct life sciences
employment ranging from a low of 284 jobs in the Sandhills Zone to a high of 43,597 direct life sciences jobs in
the North Central Zone; and
• While each of the state’s prosperity zones are impacted by the life science industry, the impacts are highly
concentrated in the North Central region, with total impacts of $58.7 billion in economic activity and 168,186
jobs, and in the Piedmont-Triad (Central) Region, with $7.8 billion in economic activity and 26,262 jobs; and
• While the economic impacts associated with the life science industry are concentrated in these two regions,
approximately 20 percent of economic and employment activity occurs in the other six regions.
Table 8: Regional Economic Contribution(1) of the Life Science Industry to the North Carolina Economy by Prosperity Zone, 2016
iTEM Output (Mil. $s) Labor income (Mil. $s) Employment
State/Local Tax Revenue (Mil.
$s)
Western Regional Impact
Direct Effect $484.0 $40.3 622 $5.8
Indirect Impacts $116.9 $36.3 866 $6.2
Induced Impacts $54.2 $16.9 488 $2.8
Total Impact $655.1 $93.5 1,976 $14.8
State Impact Multiplier 1.35 2.32 3.18
Northwest Regional Impact
Direct Effect $3,761.9 $175.5 2,569 $40.6
Indirect Impacts $1,036.4 $354.4 6,816 $63.4
Induced Impacts $302.0 $90.6 2,726 $17.1
Total Impact $5,100.3 $620.5 12,111 $121.0
State Impact Multiplier 1.36 3.53 4.71
23
2016 EVIDENCE AND OPPORTUNITY: IMPACT OF LIFE SCIENCES IN NORTH CAROLINA
iTEM Output (Mil. $s) Labor income (Mil. $s) Employment
State/Local Tax Revenue (Mil.
$s)
Southwest Regional Impact
Direct Effect $2,517.6 $200.1 2,165 $29.5
Indirect Impacts $1,238.4 $521.2 5,930 $59.7
Induced Impacts $568.1 $189.1 3,993 $28.2
Total Impact $4,324.1 $910.4 12,089 $117.5
State Impact Multiplier 1.72 4.55 5.58
Piedmont-Triad (Central) Regional Impact
Direct Effect $5,058.4 $610.0 8,191 $63.2
Indirect Impacts $1,733.0 $658.6 9,926 $82.1
Induced Impacts $1,048.9 $336.6 8,145 $51.5
Total Impact $7,840.3 $1,605.2 26,262 $196.8
State Impact Multiplier 1.55 2.63 3.21
North Central Regional Impact
Direct Effect $39,742.5 $5,177.0 43,597 $508.4
Indirect Impacts $11,185.0 $4,285.5 66,167 $518.6
Induced Impacts $7,778.1 $2,578.7 58,423 $384.8
Total Impact $58,705.7 $12,041.3 168,186 $1,411.8
State Impact Multiplier 1.48 2.33 3.86
Sandhills (South Central) Regional Impact
Direct Effect $258.1 $19.5 284 $3.8
Indirect Impacts $39.1 $11.6 277 $2.2
Induced Impacts $16.3 $4.8 146 $0.9
Total Impact $313.5 $36.0 707 $6.9
State Impact Multiplier 1.21 1.84 2.49

24
2016 EVIDENCE AND OPPORTUNITY: IMPACT OF LIFE SCIENCES IN NORTH CAROLINA
iTEM Output (Mil. $s) Labor income (Mil. $s) Employment
State/Local Tax Revenue (Mil.
$s)
Northeast Regional Impact
Direct Effect $1,961.7 $129.4 1,663 $22.2
Indirect Impacts $369.2 $121.9 2,480 $21.2
Induced Impacts $143.4 $41.6 1,237 $7.7
Total Impact $2,474.3 $292.9 5,380 $51.1
State Impact Multiplier 1.26 2.26 3.23
Southeast Regional Impact
Direct Effect $1,540.1 $302.9 3,846 $27.4
Indirect Impacts $393.4 $117.4 3,055 $16.0
Induced Impacts $267.8 $76.2 2,180 $14.3
Total Impact $2,201.3 $496.5 9,081 $57.7
State Impact Multiplier 1.43 1.64 2.36
(1) Economic contribution of direct Life sciences company activity occurring in each zone.
Source: TEConomy Partners analysis of NCBiotech data using IMPLAN.

25
2016 EVIDENCE AND OPPORTUNITY: IMPACT OF LIFE SCIENCES IN NORTH CAROLINA
Activities & Highlights from NCBiotech’s Regional Offices, 2015-16The Center’s regional offices are working to ensure the benefits of the life science industry are reaching each part of the state. The offices align regional strengths with life science technologies and NCBiotech programs to grow companies and advance technologies. Recent activities and highlights from the regions include:
Eastern Office: This year, Greenville’s Mayne Pharma, formerly Metrics Contract Services, announced an $80 million facility expansion and 110 new jobs. D R Burton Healthcare Products LLC, makers of surgical and respiratory products, purchased their global headquarters facility in Farmville. The company is relocating its assembly and packaging operations to North Carolina, and it plans to move in additional manufacturing operations. The initial investment is $1.5 million and 25 new employees are forecast.
Greater Charlotte Office: Home to a diversity of assets, the Greater Charlotte Regional Office collaborates with numerous companies, researchers, and economic development partners to grow life sciences. In the fall of 2015, the office worked with Medical Murray on its open house and showcase event for its new 6,000 square foot facility, the second expansion in just two years. The office continues its strong partnership with the North Carolina Research Campus, one of the region’s most significant assets. This year, as a result of a connection from NCBiotech, the campus and Kannapolis participated in a life science exchange program to Tokyo and Singapore with the Center for International Understanding.
Piedmont Triad Office: The office worked this year to grow small companies and recruit established ones. One major accomplishment was SoBran Bioscience, a contract research provider of animal testing. Following its location at Gateway University Research Park in Greensboro, the company, in partnership with the Piedmont Triad Office, announced the Innovation to Impact Prize. The goal is to advance technology commercialization by funding a preclinical study. Entrepreneurial company, SynShark, is a NCBiotech loan portfolio company and is currently running a field test on five acres in Guilford County, thanks to the partnership of the Triad Office. SynShark also won the 2015 Ag Biotech Entrepreneurial Showcase. SynShark is just one example of approximately a dozen partnerships that the office helped to facilitate. In addition, the office continues its partnership with two strong biotechnology workforce development programs at Forsyth Tech and Alamance community colleges and the National Center for the Biotechnology Workforce. Finally, the office will host its sixth successful Triad BioNight awards and recognition event in collaboration with its regional advisory committee in the Spring of 2017.
Southeastern Office: The Southeastern Office worked on many projects related to company relocation/recruitment and expansion, as well as entrepreneurial venture creation and support. Projects included the OptimaKV waste-to-energy, industrial biotech venture in Duplin County and Atlantic Biotechnology in New Hanover County. The office also initiated several company visits, relocations, and potential business line expansions to the University of North Carolina Wilmington (UNCW) MARBIONC Biotech Building. As part of the NC Coast Clinical Research Initiative, the Southeastern Office continued its work to implement a clinical research workforce development program with UNCW’s College of Health and Human Services. The program is funded initially by a $390,000 grant from Duke Energy, with significant matching support from UNCW. In addition, the Southeastern office was a co-host for the international 2015 BioMarine Business Convention in October.
Western Office: In January 2016, Raumedic, a German-based supplier of polymer components and systems for the medical and pharmaceutical industries, opened its North American headquarters in Mills River. The facility represents 56 new jobs and $11 million in investment, with expansion expected. Gaia Herbs, in Brevard, announced a $5 million expansion of its production facility and has been experiencing double-digit growth in recent years. The region also initiated the Asheville Angels investment group, which has funded ten startups with a total investment of $550,000 to date.
Source: NCBiotech.

26
2016 EVIDENCE AND OPPORTUNITY: IMPACT OF LIFE SCIENCES IN NORTH CAROLINA
The Life Science Industry Footprint Across North Carolina’s Prosperity ZonesThe following are statewide and regional maps for North Carolina’s eight regional prosperity zones showing the
presence of life science industry companies by industry subsector and by level of employment. The underlying data
are based on the current NCBiotech database of companies.
Figure 10: North Carolina Life Science Industry Companies, Statewide and by Prosperity Zone, Industry Subsector, and Employment Level, 2016
North Carolina, Statewide

27
2016 EVIDENCE AND OPPORTUNITY: IMPACT OF LIFE SCIENCES IN NORTH CAROLINA
Western Region
Northwest Region

28
2016 EVIDENCE AND OPPORTUNITY: IMPACT OF LIFE SCIENCES IN NORTH CAROLINA
Southwest Region
Piedmont-Triad (Central) Region
29
2016 EVIDENCE AND OPPORTUNITY: IMPACT OF LIFE SCIENCES IN NORTH CAROLINA
North Central Region
Sandhills (South Central) Region

30
2016 EVIDENCE AND OPPORTUNITY: IMPACT OF LIFE SCIENCES IN NORTH CAROLINA
Northeast Region
Southeast Region

31
2016 EVIDENCE AND OPPORTUNITY: IMPACT OF LIFE SCIENCES IN NORTH CAROLINA
RISE North Carolina: Regional Impact of Statewide Engagement across NCThe RISE program takes what the Biotech Center does already – investing in technology development
through loan and grant awards, and forging partnerships to attract and grow companies – and applies the
model statewide. The goal is to increase the Center’s statewide impact, and to ensure that the economic
benefits from the life sciences are realized across the state.
Each regional office has looked within their current activities to identify three areas of opportunity that,
if realized, have an economic impact on the region and contribute to North Carolina’s global life science
leadership. Regional stakeholders and advisory committees will participate in these projects, thereby
increasing impact.
Selected RISE projects include:• Eastern Office (Greenville) – North Carolina Pharmaceutical Services Network, focused on Oral
and Solid Dose manufacturing and development of Good Manufacturing and Lab Practices (GMP)
(GLP) to support regional pharmaceutical manufacturing expansion activities and to provide a sector-
focused trained workforce. The goal is to serve the local regional and statewide industry needs, while
marketing the capabilities to serve companies outside of North Carolina.
• Greater Charlotte Office – Kannapolis-based North Carolina Research Campus (NCRC) Food and
Nutrition Initiative aims to accelerate commercialization of technologies, business growth, and
company relocation to the region. The goal is to provide support to the campus and its academic/
industry partners with a myriad of programs and services; and establish a new, more formalized role as
a partner agency moving forward.
• Piedmont Triad Office (Winston-Salem) – Research, Testing, and Medical Laboratory Center of
Excellence to help accelerate new job growth by strengthening community capacity to provide sector-
focused, trained workforce.
• Southeastern Office (Wilmington) – The clinical research industry cluster in this area of the state
continues to grow, with support from the office’s NC Coast Clinical Research Initiative. A recent grant
from the Duke Energy Foundation to UNCW will expand workforce training capabilities in the region,
allowing existing professionals to enhance skills, while also attracting and developing new talent.
• Western Office (Asheville) – Natural products are a growing industry. North Carolina’s Western
region is home to some of these companies, and it has some of the greatest biodiversity in the world.
The office is working with its partners to look at benefits that biomanufacturing expertise can lend to
this developing industry.

32
2016 EVIDENCE AND OPPORTUNITY: IMPACT OF LIFE SCIENCES IN NORTH CAROLINA
Economic Impact of Life Science University R&D in North CarolinaUniversity research is itself a significant economic market and driver in North Carolina, with the state home to leading colleges, universities, and academic medical centers that in 2014 combined to spend $2.0 billion in research in life science-related fields. Life sciences research accounts for three-quarters of all science and engineering research activity in North Carolina—a much greater share than for the nation’s research universities overall (61 percent). NCBiotech has long promoted the expansion of academic life sciences research in the state.
Medical sciences is the largest area of academic life science-related R&D expenditures, accounting for 56 percent of total academic life science-related R&D, followed by biological sciences at 28 percent, then agricultural sciences (5 percent), bioengineering (2 percent), and other life sciences (9 percent).
Since 2001, North Carolina’s life science-related academic R&D has well outpaced the nation in growth—rising by 1.5 times (147 percent) while the U.S. grew by 100 percent. This growth in life sciences R&D has driven overall growth in science and engineering research in the state. Recently, however, the pace of growth in academic life science-related university research in North Carolina is leveling off, reflecting the broader constraints in federal research funding and industry-sponsored research.
Economic ImpactsNorth Carolina’s academic life science-related research resources contributes to the state’s competitive economic position in the life science industry through the development and commercialization of new technologies. These research activities also contribute to the strength of the state’s economy though their purchases of goods and services from other businesses and business sectors across the state economy. The impacts of the academic life science-related research expenditures were estimated using the IMPLAN model.
The $2.0 billion in academic life science R&D expenditures directly creates an estimated 7,245 jobs with $676 million in labor income. Including multiplier effects, academic life science-related R&D expenditures generate nearly $3.9 billion in economic activity in North Carolina (up from $3.1 billion in 2010) and supports 20,893 jobs earning an estimated $1.3 billion in labor income (Table 9).1
Table 9: Economic Impact of Life Science-related University R&D Expenditures in North Carolina, 2014
Output (Mil. $s) Labor income (Mil. $s) Employment State/Local Tax
Revenue (Mil. $s)
Direct Effect $2,049.4 $675.9 7,245 $39.5
Indirect Impacts $956.2 $347.0 7,003 $30.5
Induced Impacts $862.1 $272.9 6,645 $42.8
Total Impact $3,867.8 $1,295.9 20,893 $112.8
State Impact Multiplier 1.89 1.92 2.88
Source: TEConomy Partners analysis of National Science Foundation(NSF) data using IMPLAN.
For additional data tables see the Appendix to this report.
1 Impact figures are in the 2014 dollars of the NSF data used.

33
III. The North Carolina Biotechnology Center’s Long-term, Multi-Faceted Role in Catalyzing Statewide Industry Development
The current strength, broad impacts, and long-term
growth of North Carolina’s life science industry reflect a
dedicated and sustained focus on effective partnerships
of NCBiotech with the industry. The Center, recognizing
the unique and relatively challenging demands of
developing a world-class life science industry, has acted
as an effective convener, facilitator, investor, and partner
to the industry. Now in its 33rd year, NCBiotech is a
model organization for catalyzing life science industry
development and growth across the state.
The Center’s role in advancing life science industry
development utilizes a multi-faceted, comprehensive
approach that addresses the key phases and ingredients
for a successful technology-based economic
development (TBED) ecosystem. Each of the “links”
in this complex development chain are vital—reaching
from research toward achieving commercialization milestones, to applied R&D, addressing the ecosystem for
investment capital and workforce, and on through to critical support for business formation, attraction, and retention.
NCBiotech’s programs, initiatives, and broader role are highlighted across the development chain in Figure 11.
NCBiotech’s Vision is North Carolina: a global life science leader.
During the 2016 Fiscal Year, NCBiotech
formalized a strategy outlining the Center’s
approach to technology-based economic
development with key pillars including:
• “Build” a robust life science community
• “Partner” – develop networks leading
to partnerships
• “invest” to catalyze innovation,
commercialization & company growth
• “Communicate” the state’s global life
science brand

34
2016 EVIDENCE AND OPPORTUNITY: IMPACT OF LIFE SCIENCES IN NORTH CAROLINA
Figure 11: Technology-Based Economic Development Chain and NCBiotech Programmatic Efforts
Inte
gra
tio
n in
to e
xist
ing
, exp
and
ing
and
new
clu
ster
bus
ines
ses
Successful andexpanding
business clusters
TechnologyTransfer
BusinessAttraction
ExistingIndustry
BusinessExpansion
New EnterpriseDevelopment
Basic ScienceInnovationTranslation
Piloting &Demonstration
Support forBusiness Formation,
Attraction and Growth
Long-term, sustained commitment to development of the cluster by all parties
GRANTSExamples:
Biotechnology Innovation Grants (BIG)
Collaborative Funding Grant (CFG)
Institutional Development Grant (IDG)
GRANTSExamples:
Technology Enhancement Grant
REGIONAL & SECTOR
DEVELOPMENTExamples:
RISE NC Projects; AgBiotech,
Precision Health and BioDefense Initiatives
BUSINESS SERVICESExamples:
Economic Development Award
NCBIOTECH BUSINESS LOANS
Company Inception LoanSmall Business Research Loan
Strategic Growth Loan
EXTERNAL FUNDING
RESOURCES
BIOTECHNOLOGY—INFORM AND
EDUCATE
JOB SERVICES
NCBIOTECH PROGRAMS
The economic impacts of NCBiotech’s role in advancing key facets of this value chain are presented in this section.

35
2016 EVIDENCE AND OPPORTUNITY: IMPACT OF LIFE SCIENCES IN NORTH CAROLINA
Measuring the Economic Impact of NCBiotech on the Development of the North Carolina Life Science IndustryIn addition to NCBiotech’s primary, broad strategic impact on the industry as a whole, the Center has directly
supported the growth and development of life sciences in North Carolina through its business loan and support
programs as well as specific efforts toward recruitment and expansion of specific companies.
Targeted, early-stage loans to life science businesses help create and support business activity in the companies
receiving loans, which has a long-term impact on the state’s economy. As a result, NCBiotech’s loan programs create
a “portfolio” of businesses assisted by the Center and the operations of these businesses created or assisted represent
the economic development impacts associated with NCBiotech. This analysis focuses on the impact of the total
portfolio of all of the companies participating in these programs since 1989 that are still in operation.
Since 1989, NCBiotech has made 272 business loans to 188 companies. Of the 188 companies that have received
loans, 102 are currently active in some form and these companies employ 2,914 workers.4 NCBiotech’s business loan
programs have invested in an expanding portfolio of companies that account for a growing share of life sciences
employment in the state. The growth in employment in the portfolio of NCBiotech business loan program supported
companies is presented in Figure 12.
Figure 12: Employment in Companies Receiving Loans from the North Carolina Biotechnology Center
TEConomy estimated the economic impacts of these 102 companies. As presented in Table 11, these 102 companies
had total employment of 2,914 and estimated revenues of $2.8 billion and generate:
• $4.3 billion in economic activity in the state;
• Create or support 12,666 jobs earning $887 million in labor income; and
• Generate an estimated $115.9 million in state and local tax revenues.
4 Some of these companies may have been acquired by other companies or have changed their name and, thus, may be active in some form. In
cases where a company was known to be acquired the acquiring company was included.

36
2016 EVIDENCE AND OPPORTUNITY: IMPACT OF LIFE SCIENCES IN NORTH CAROLINA
TEConomy estimated the state government revenue portion of the estimated $115.9 million in combined state and
local government revenues, based on U.S. Bureau of the Census government finances data.5 This analysis yields an
estimated $73.6 million in state revenues alone, an amount more than five times greater than the state’s appropriation
of $13.6 million. Companies receiving business loans from the Center now account for 5 percent of the economic
activity associated with the entire life science industry.
Table 10: The Economic Contribution to the North Carolina Economy of the 102 Currently Active Companies that Received NCBiotech Business Loans
Output (Mil. $s) Labor income (Mil. $s) Employment State/Local Tax
Revenue (Mil. $s)
Total Life Science Industry Impact
Direct Effect $55,324 $6,654.8 62,937 $700.9
Indirect Impacts $19,278 $7,295.7 108,590 $891.7
Induced Impacts $11,761 $3,758.4 88,437 $582.0
Total Impact $86,364 $17,708.9 259,963 $2,174.6
Impact of the 102 Currently Active Companies that Received Business Development Loans
Direct Effect $2,760 $331.6 2,914 $34.2
Indirect Impacts $957 $366.7 5,307 $51.9
Induced Impacts $591 $188.9 4,444 $29.8
Total Impact $4,308 $887.2 12,666 $115.9
Share of Total Industry Impact
Direct Effect 5.0% 5.0% 4.6% 4.9%
Indirect Impacts 5.0% 5.0% 4.9% 5.8%
Induced Impacts 5.0% 5.0% 5.0% 5.1%
Total Impact 5.0% 5.0% 4.9% 5.3%
Source: TEConomy Partners analysis of NCBiotech data using IMPLAN.
5 The IMPLAN model estimates aggregated state and local government revenues. These were decomposed into their estimated state and local
government revenue shares based on data from the U.S. Bureau of the Census.

37
2016 EVIDENCE AND OPPORTUNITY: IMPACT OF LIFE SCIENCES IN NORTH CAROLINA
NCBiotech is actively recruiting life
science companies to locate in North
Carolina as well as supporting existing
state companies in efforts to expand their
presence within the state. Since 2008,
the Center has assisted in the effort to
attract or retain 52 major life sciences
employers, including Novartis (now
Seqirus), Medicago, Pfizer, and Novo
Nordisk. This analysis focuses on the
economic impact of the more recent, 16
companies where the Center assisted
its economic development partners in
Fiscal Years 2015 and 2016. Based on
data provided by the Center, these 16
companies have the potential to create
a total of 2,158 jobs once they reach
projected employment levels.
Table 11 presents the results of
TEConomy’s analysis, indicating that
once the companies involved in these 16
projects attain their full projected level of
employment, they will generate $2.8 billion
in economic activity and support 8,526 jobs
earning $600 million in labor income and
generate $73 million in combined state and
local government revenues.
Table 11: Economic Contribution (2016) of the 16 Life Sciences Companies Assisted by NCBiotech in State Recruitment/Expansion Efforts in 2015 and 2016 on the North Carolina Economy
Output (Mil. $s) Labor income (Mil. $s) Employment State/Local Tax
Revenue (Mil. $s)
Direct Effect $1,717.7 $241.8 2,158 $21.7
Indirect Impacts $661.9 $231.4 3,408 $31.9
Induced Impacts $400.0 $126.3 2,960 $19.8
Total Impact $2,779.5 $599.5 8,526 $73.4
State Impact Multiplier 1.62 2.48 3.95
Source: TEConomy Partners analysis of NCBiotech data using IMPLAN.
North Carolina’s Recruitment & Expansion Highlights from 2015-16:
• Novo Nordisk announced a $1.8 billion expansion
in Johnston County. The project, the largest single
manufacturing investment in state history, will double
the Danish drug maker’s workforce in Johnston County
by creating 700 new positions.
• india-based Aurobindo Pharma USA, inc. will bring
275 new R&D and pharmaceutical manufacturing
jobs to Durham. The New Jersey-based generic
pharmaceuticals maker plans to invest more than $31.7
million in a new state-of-the-art national headquarters
for specialty pharmaceutical R&D.
• Humacyte inc., a regenerative medicine company based
in Morrisville, will invest $38 million and create 115 jobs
in a biomanufacturing facility in Durham County.
• Grifols, the Spanish specialist in blood plasma products,
will invest $210 million to build two new facilities at its
Clayton campus in Johnston County.
• Braeburn Pharmaceuticals, a New Jersey-based
developer of pill-free drugs for psychiatric disorders,
announced plans for a manufacturing and development
plant in Durham County, creating 52 jobs and investing
$19.9 million over five years.
Source: NCBiotech

38
2016 EVIDENCE AND OPPORTUNITY: IMPACT OF LIFE SCIENCES IN NORTH CAROLINA
The Evolving Role and Focus of NCBiotech’s Support—Recent Accomplishments & New DevelopmentsWith a three-decade history, NCBiotech has learned that for the industry to thrive throughout the state, its role
must continually be evaluated and evolve, where appropriate, to emphasize new and emerging opportunities. Recent
activities and developments include:
Sector development in the following areas during FY2016:Agricultural Biotechnology – NCBiotech has positioned North Carolina as a global ag biotech (agbiosciences)
leader by combining the state’s life sciences base with its agricultural assets. Several successful recruitments this
fiscal year added diversity to the sector through additional focus areas such as high-tech feed supplements, soil
health, and plant microbiome. Activities of the AgBiotech Initiative are guided by the North Carolina AgBiotech
Advisory Council, 16 leaders from industry, academia, and government who meet three times annually. Key activities
include:
• AgBiotech Entrepreneurial Showcase 2016
• Agricultural Bioscience Company and Entrepreneurial Profile System – This list catalogs 26 entrepreneurial
companies in search of funding. The initiative team met with companies one-on-one to refocus this publication
to better bring investment to North Carolina.
• Biotechnology Crop Commercialization Center (BCCC) – The BCCC accelerates crop development to meet
critical industry needs.
• AgBio[sphere] – This web brand launched in 2014 to position North Carolina as the leading global hub for
agbiosciences.
• NC AgBiotech Professional Forum – This professional networking forum welcomed attendees from more than
200 separate organizations.
• Ag Industry in the Classroom – This week-long program targets middle and high school agriculture and
“STEM” (Science, Technology, Engineering, and Math) teachers, providing a curriculum and tools focused on
technology in agriculture. Seventy percent of the attendees are from rural counties. To date the program has
reached more than 60,000 students.
Bio Defense – NCBiotech has taken a broad view of this sector to bring North Carolina research expertise, innovative
solutions, and products to the Department of Defense and the Department of Homeland Security, leveraging North
Carolina’s strengths in life sciences to serve the nation’s armed forces and national security. Life science applications
include vaccines and novel technologies that will protect our soldiers, heal those who sustain wounds in battle, and
protect the food supply. The Bio Defense initiative leveraged the existing NCBiotech infrastructure to provide new
loans and grants targeting Bio Defense applications.
NCBiotech has held the following events, which linked local researchers and companies with federal military and
agency representatives:
• Medical, Biomedical and Biodefense: Support to the Warfighter Symposium (co-hosted with the NC Military
Business Center);

39
2016 EVIDENCE AND OPPORTUNITY: IMPACT OF LIFE SCIENCES IN NORTH CAROLINA
• Workshop: Biomedical Science & Technology for Special Operations Forces – Human Performance and
Portable Lab Diagnostics;
• National Defense University, Eisenhower School, U.S. Department of Defense Senior Service School,
Biotechnology Industry Study Group and Agribusiness Industry Study Group;
• NC Defense Business Association Science and Technology Committee Meeting (Coordinated by NCBiotech
staff and hosted in partnership with the NCDBA).
Center staff continued efforts to better connect NC life sciences to the defense sector by engaging and collaborating
with many military support groups including the NC Military Business Center, the NC Military Foundation and the
NC Defense Business Association. Additionally, the direct relationships that the Center staff has established with
the defense, military and homeland security personnel have allowed several referrals for potential funding and
collaboration opportunities.
Precision Health represents a new area of focus for NCBiotech. Widely thought to be the future of healthcare in the
United States, precision medicine tailors medical treatment to each patient, accounting for genetics, family history
and environment. Ideally, precision medicine tools provide effective treatments for those who will benefit, but spare
expense and side effects for those who will not.
North Carolina has significant assets and resources in precision health. Harnessing those assets will require a
multidisciplinary team across a variety of stakeholders, including researchers, doctors, patients, providers (hospitals
and ACOs), and payers (insurance). This year, NCBiotech, in partnership with Duke University’s Center for Applied
Genomics and Precision Medicine, assembled a Precision Health Steering Committee. The committee includes
NCBiotech, Duke University, the University of North Carolina, East Carolina University, North Carolina State
University, Renaissance Computing Institute, GlaxoSmithKline, Blue Cross and Blue Shield of North Carolina, RTI
International, Pappas Ventures and the North Carolina Department of Health and Human Services. The Committee
has begun to identify collaborative opportunities toward the goal of implementing precision health in clinical settings
drawing on the diverse strengths and interests of the team members. In turn, precision health applications are
expected to provide more effective targeted treatments for patients, while reducing costs and increasing efficiencies
in healthcare systems.
Marine Biotechnology – The Marine Biotech Center of Innovation (MBCOI), created by NCBiotech, continues
to track assets and form partnerships across the state. The MBCOI works with faculty from all marine institutes to
better understand where commercial opportunities exist. The most recent success was the Sandbar Oyster Company,
founded by a UNC-Chapel Hill Institute for Marine Sciences faculty member and partnered with a local shellfish
harvester. Sandbar makes a biodegradable surface on which oysters can grow. The technology could bring oysters back
into the coastal marketplace. MBCOI has provided business planning support for Sandbar over the last two years. This
culminated in a NC IDEA grant award of $50,000 to pilot the model in the waters off the state’s coast.
In October 2015, the MBCOI and NCBiotech’s Southeastern Office, co-hosted the International BioMarine Business
Conference in Wilmington. This annual international meeting, that is devoted to the commercial development of

40
2016 EVIDENCE AND OPPORTUNITY: IMPACT OF LIFE SCIENCES IN NORTH CAROLINA
marine bioresources through business partnerships, was attended by over 200 leaders in business, investment, and
government from 19 countries and brought unprecedented attention to the state’s marine biotechnology sector.
Beyond individual technology and sector areas, NCBiotech is also hosting early-stage domestic and
international companies at its Research Triangle facilities:
The Landing Pad – NCBiotech is dedicated to attracting both domestic and international life science companies to
North Carolina and encouraging expansion of existing companies in the state. To support this, NCBiotech created
space at its facilities in Research Triangle Park for lease only by early-stage life science companies who wish to start/
grow their businesses in North Carolina and for international life science companies seeking to enter U.S. markets
through an initial base of operations, often referred to as a “soft landing” location.
Companies accepted for the Landing Pad program have access to furnished office space for up to one year at
competitive rates. Information and guidance is provided in securing long-term office, lab, and manufacturing space.
Several companies have already gotten their start in the Landing Pad and have remained in the state, proving the
effort is working to continue to grow the life sciences cluster in North Carolina.
These exciting activities and new areas of focus and support for industry development demonstrate the commitment
of NCBiotech to a thriving life sciences cluster throughout North Carolina and to maintaining the high-growth and
broad impacts that characterize the industry today well into the future.

Appendix


43
2016 EVIDENCE AND OPPORTUNITY: IMPACT OF LIFE SCIENCES IN NORTH CAROLINA
Appendix: Data and MethodologyAbout TEConomy PartnersThis fifth biennial edition of Evidence and Opportunity has been developed by TEConomy Partners, LLC. In the
fourth quarter of 2015, TEConomy Partners was formed as an independent company, transitioning the complete staff
and capabilities of the Technology Partnership Practice (TPP) from Battelle Memorial Institute. In 1990, Battelle
formed TPP to serve state and local organizations, universities, non-profit technology organizations, industry and
professional associations, and others in the assessment, design, and implementation of research and technology
programs. Over time the practice evolved into a full-service assessment and strategy group including leading analysts
and practitioners in innovation-based economic development. Today that practice is TEConomy Partners, LLC.
TEConomy Partners is a comprehensive technology-based economic development consulting group whose principals
have a 25-year track record in developing core competency analyses, strategic plans, national thought-pieces, and
implementation strategies for industry associations, state and local governments, universities and university research
park developments, business development groups, and foundations around the world. The expert team at TEConomy
works extensively with clients in the U.S. and internationally to assess scientific and technological capabilities, and
to translate them into technology platforms linked with market opportunities. The team also sustains an intensive
practice in economic analytics, and regularly applies this expertise in performance of economic and functional impact
analysis for government, higher education institutions, academic medical centers, industry and related associations,
and other client groups. Active in both domestic and international markets, the TEConomy team has performed
projects in nearly every U.S. State.
Defining the Life Science IndustryThe following presents the industry definition utilized in Section 1 of this report based on the detailed North
American Industry Classification System (NAICS) that make up the five major subsectors of the life science industry.
Table A-1: NAICS-based Definition of the Life Science Industry
LiFE SCiENCE SUBSECTOR NAiCS Code NAiCS Description
Agricultural Feedstock & Chemicals
311221 Wet Corn Milling
311222 Soybean Processing
311223 Other Oilseed Processing
325193 Ethyl Alcohol Manufacturing
325221 Cellulosic Organic Fiber Manufacturing
325311 Nitrogenous Fertilizer Manufacturing

44
2016 EVIDENCE AND OPPORTUNITY: IMPACT OF LIFE SCIENCES IN NORTH CAROLINA
LiFE SCiENCE SUBSECTOR NAiCS Code NAiCS Description
325312 Phosphatic Fertilizer Manufacturing
325314 Fertilizer (Mixing Only) Manufacturing
325320 Pesticide and Other Agricultural Chemical Manufacturing
Drugs & Pharmaceuticals
325411 Medicinal and Botanical Manufacturing
325412 Pharmaceutical Preparation Manufacturing
325413 In-Vitro Diagnostic Substance Manufacturing
325414 Biological Product (except Diagnostic) Manufacturing
Medical Devices & Equipment
334510 Electromedical and Electrotherapeutic Apparatus Manufacturing
334516 Analytical Laboratory Instrument Manufacturing
334517 Irradiation Apparatus Manufacturing
339112 Surgical and Medical Instrument Manufacturing
339113 Surgical Appliance and Supplies Manufacturing
339114 Dental Equipment and Supplies Manufacturing
Research, Testing, & Medical Laboratories
541380* Testing Laboratories
54171* Research and Development in the Physical, Engineering, and Life Sciences
621511 Medical Laboratories
Bioscience-Related Distribution
423450 Medical, Dental, and Hospital Equipment and Supplies Merchant Wholesalers
424210* Drugs and Druggists’ Sundries Merchant Wholesalers
424910* Farm Supplies Merchant Wholesalers
*Includes only the portion of these industries engaged in relevant life science activities.
45
2016 EVIDENCE AND OPPORTUNITY: IMPACT OF LIFE SCIENCES IN NORTH CAROLINA
Economic Impact Approach and MethodologyUsing the information on the size and composition of the North Carolina life science industry provided by
NCBiotech, TEConomy Partners prepared an analysis of the economic impact of the industry on the State of North
Carolina’s economy using the IMPLAN input-output model.6 IMPLAN is one of the most widely used models in the
nation, and can be used to analyze the impacts of companies, projects, or of entire industries. An input-output (I/O)
analysis examines the relationships among businesses and among businesses and final consumers. I/O analysis is
based on the use of multipliers, which describe the response of an economy to a change in demand or production.
Multipliers measure the effects on an economy from a source of economic activity, in this case the jobs and activities
of companies in the life science industry in North Carolina.
The economic activity generated in a state is greater than the simple total of spending associated with the event
or activity being studied. This is because as this money is earned it is, in turn, spent, earned and re-spent by other
businesses and workers in the regional economy through successive cycles of spending, earning and spending.
However, the spending in each successive cycle is less than in the preceding cycle because a certain portion of
spending “leaks” out of the economy in each round of spending. Leakages occur though purchases of goods or
services from outside of the region and federal taxation. The IMPLAN multipliers used in this analysis capture the
effects of these multiple rounds of spending.
This report measures the economic impact of the life science industry by focusing on three measures of economic
impact:
• Employment. The total number of full and part time jobs in all industries; and
• Output. The total value of production or sales in all industries;
• Labor Income. Total employment income including wages and salaries, benefits, and self-reported income
earned by the workers holding the jobs created.7
Four measures of the economic activity and impact of the jobs supported by the life science industry are included:
• Direct effects. The change in economic activity being analyzed—in this case the business activities of the life
science industry, including life science companies, technology commercialization research, and the Center’s
operations. For this analysis, TEConomy used the employment data from the NCBiotech database and the
IMPLAN model to estimate business activity based on these employment figures;
• Indirect effects. The changes in inter-industry purchases, for example the purchase of raw materials by a life
science manufacturer, in response to the change in demand from the directly affected industries;
• Induced effects. The changes in spending from households as income and population increase due to changes
in production; and
• Total effects. The combined total of direct, indirect and induced effects.
6 See www.implan.com for a description of the model.
7 The earlier 2008 and 2010 reports reported Employee Compensation. In this report, in order to be comparable to other research done in this
area, the broader Labor Income measure which includes self-reported and proprietor income was used in the 2012 and 2014 reports as well as in
this report.

46
2016 EVIDENCE AND OPPORTUNITY: IMPACT OF LIFE SCIENCES IN NORTH CAROLINA
Academic Life Sciences Research – Additional Data Analysis
Table A-2: Life Science-related University R&D Expenditures in North Carolina, 2011 to 2014.
2011 2012 2013 2014
Life Science Field ($1,000s) % ($1,000s) % ($1,000s) % ($1,000s) %
Agricultural Sciences $104,339 5% $110,097 6% $109,740 6% $100,291 5%
Bioengineering/ Biomedical Engineering $30,860 2% $31,968 2% $33,997 2% $35,914 2%
Biological Sciences $566,785 29% $564,196 28% $566,798 28% $574,683 28%
Medical Sciences $1,126,071 57% $1,148,818 57% $1,106,544 56% $1,153,299 56%
Other Life Sciences $156,099 8% $143,957 7% $173,437 9% $185,248 9%
Total $1,984,154 100% $1,999,036 100% $1,990,516 100% $2,049,435 100%
Source: TEConomy Partners analysis of National Science Foundation data.
Table A-3: Economic Impact of Life Science-related University R&D Expenditures in North Carolina by Research Field, 2014
Estimated Direct impact Total impacts
Life Science Field Output ($ M) Employment (# of Jobs) Output ($ M) Employment
(# of Jobs)Labor
Income ($ M)
State & Local Government
Revenues ($ M)
Agricultural Sciences $100.3 355 $189.3 1,022.4 63.4 5.5
Bioengineering/ Biomedical Engineering $35.9 127 $67.8 366.1 22.7 2.0
Biological Sciences $574.7 2,031 $1,084.6 5,858.5 363.4 31.6
Medical Sciences $1,153.3 4,077 $2,176.6 11,757.1 729.2 63.5
Other Bioscience- related research $185.2 655 $349.6 1,888.5 117.1 10.2
Total $2,049.4 7,245 $3,867.8 20,892.6 1,295.9 112.8
Source: TEConomy Partners analysis of National Science Foundation data using IMPLAN.