Embed Size (px)
Citation preview

Bank Name Landesbank Hessen-Thüringen Girozentrale
LEI Code DIZES5CFO5K3I5R58746
Country Code DELa
2016 EU-wide Stress Test

Actual
(starting year)Baseline Scenario Adverse Scenario
(mln EUR, %) 31/12/2015 31/12/2018 31/12/2018
Cumulative 3y: Net interest income 4,204.19 3,438.04
Cumulative 3y: Gains or (-) losses on financial assets and liabilities held for trading or designated at fair value through profit
and loss, net250.27 -547.63
Cumulative 3y: (Impairment or (-) reversal of impairment on financial assets not measured at fair value through profit or loss) -538.39 -985.83
Cumulative 3y: Profit or (-) loss for the year 1,197.30 -818.48
Coverage ratio - Default stock 35.29% 33.56% 38.79%
Common Equity Tier 1 capital 7,563.98 8,042.61 6,229.04
Total Risk exposure amount 54,859.47 55,779.71 61,655.87
Common Equity Tier 1 ratio, % 13.8% 14.4% 10.1%
Fully loaded Common Equity Tier 1 ratio, % 13.1% 14.4% 10.1%
Tier 1 capital 8,171.02 8,463.24 6,649.67
Total leverage ratio exposures 183,275.35 183,275.35 183,275.35
Leverage ratio, % 4.5% 4.6% 3.6%
Fully loaded leverage ratio, % 3.9% 4.4% 3.4%
Total amount of instruments with mandatory conversion into ordinary shares upon a fixed date in the 2016 -2018 period
(cumulative conversions)1 0
Total Additional Tier 1 and Tier 2 instruments eligible as regulatory capital under the CRR provisions that convert into Common
Equity Tier 1 or are written down upon a trigger event2 0
Of which: eligible instruments whose trigger is above CET1 capital ratio in the adverse scenario2 0
1 Conversions not considered for CET1 computation
2 Excluding instruments with mandatory conversion into ordinary shares upon a fixed date in the 2016 -2018 period
2016 EU-wide Stress Test: SummaryLandesbank Hessen-Thüringen Girozentrale
Memorandum items
2016 EU-wide Stress Test:
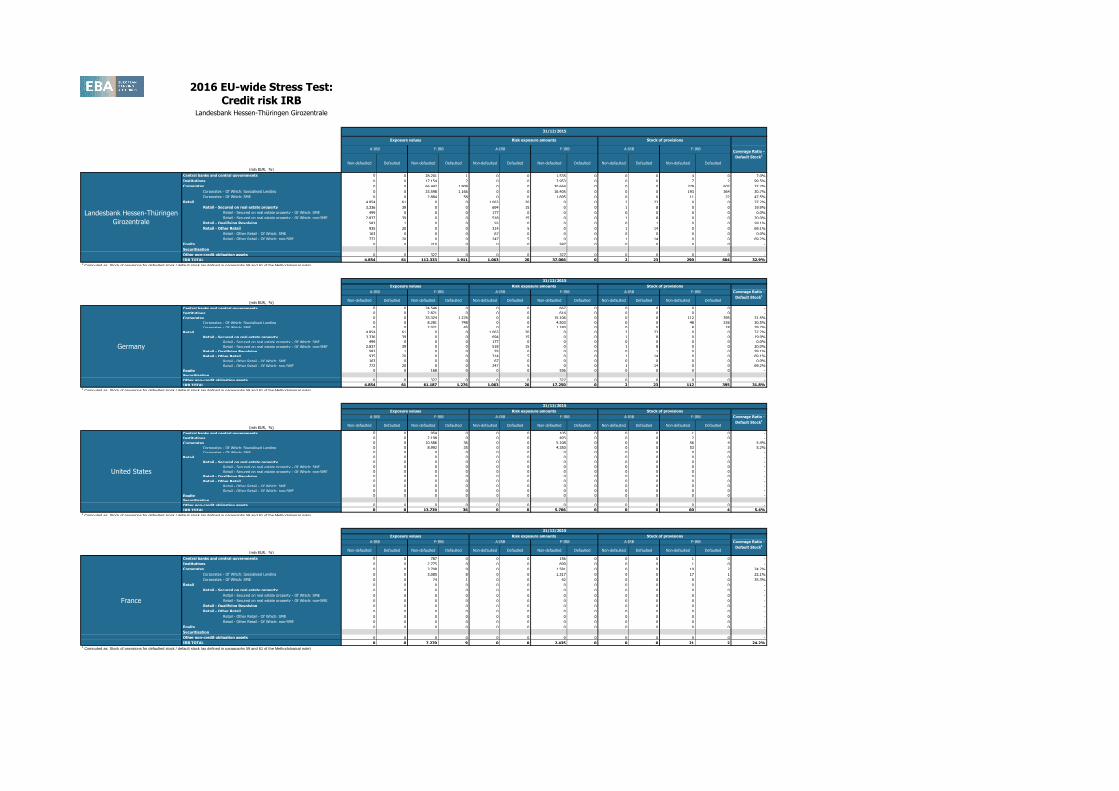
Credit risk IRBLandesbank Hessen-Thüringen Girozentrale
(mln EUR, %)
Non-defaulted Defaulted Non-defaulted Defaulted Non-defaulted Defaulted Non-defaulted Defaulted Non-defaulted Defaulted Non-defaulted Defaulted
Central banks and central governments 0 0 28,201 1 0 0 1,535 0 0 0 4 0 7.0%
Institutions 0 0 17,154 2 0 0 3,953 0 0 0 7 2 99.5%
Corporates 0 0 66,442 1,908 0 0 30,664 0 0 0 279 602 32.7%
Corporates - Of Which: Specialised Lending 0 0 33,598 1,166 0 0 16,405 0 0 0 193 364 30.7%
Corporates - Of Which: SME 0 0 2,884 58 0 0 1,695 0 0 0 11 22 47.5%
Retail 4,854 61 0 0 1,063 20 0 0 2 23 0 0 37.2%
Retail - Secured on real estate property 3,336 39 0 0 694 15 0 0 1 8 0 0 19.9%
Retail - Secured on real estate property - Of Which: SME 499 0 0 0 177 0 0 0 0 0 0 0 0.0%
Retail - Secured on real estate property - Of Which: non-SME 2,837 39 0 0 518 15 0 0 1 8 0 0 20.0%
Retail - Qualifying Revolving 583 1 0 0 55 0 0 0 0 1 0 0 59.1%
Retail - Other Retail 935 20 0 0 314 5 0 0 1 14 0 0 69.1%
Retail - Other Retail - Of Which: SME 163 0 0 0 67 0 0 0 0 0 0 0 0.0%
Retail - Other Retail - Of Which: non-SME 772 20 0 0 247 5 0 0 1 14 0 0 69.2%
Equity 0 0 210 0 0 0 587 0 0 0 0 0 -
Securitisation
Other non-credit obligation assets 0 0 327 0 0 0 327 0 0 0 0 0 -
IRB TOTAL 4,854 61 112,333 1,911 1,063 20 37,066 0 2 23 290 604 32.9%1 Computed as: Stock of provisions for defaulted stock / default stock (as defined in paragraphs 59 and 61 of the Methodological note)
(mln EUR, %)Non-defaulted Defaulted Non-defaulted Defaulted Non-defaulted Defaulted Non-defaulted Defaulted Non-defaulted Defaulted Non-defaulted Defaulted
Central banks and central governments 0 0 24,546 0 0 0 667 0 0 0 0 0 -
Institutions 0 0 2,821 0 0 0 614 0 0 0 0 0 -
Corporates 0 0 33,324 1,276 0 0 15,106 0 0 0 112 395 31.5%
Corporates - Of Which: Specialised Lending 0 0 8,281 748 0 0 4,503 0 0 0 48 226 30.5%
Corporates - Of Which: SME 0 0 2,021 45 0 0 1,180 0 0 0 8 18 39.2%
Retail 4,854 61 0 0 1,063 20 0 0 2 23 0 0 37.2%
Retail - Secured on real estate property 3,336 39 0 0 694 15 0 0 1 8 0 0 19.9%
Retail - Secured on real estate property - Of Which: SME 499 0 0 0 177 0 0 0 0 0 0 0 0.0%
Retail - Secured on real estate property - Of Which: non-SME 2,837 39 0 0 518 15 0 0 1 8 0 0 20.0%
Retail - Qualifying Revolving 583 1 0 0 55 0 0 0 0 1 0 0 59.1%
Retail - Other Retail 935 20 0 0 314 5 0 0 1 14 0 0 69.1%
Retail - Other Retail - Of Which: SME 163 0 0 0 67 0 0 0 0 0 0 0 0.0%
Retail - Other Retail - Of Which: non-SME 772 20 0 0 247 5 0 0 1 14 0 0 69.2%
Equity 0 0 168 0 0 0 536 0 0 0 0 0 -
Securitisation
Other non-credit obligation assets 0 0 327 0 0 0 327 0 0 0 0 0 -
IRB TOTAL 4,854 61 61,187 1,276 1,063 20 17,250 0 2 23 112 395 31.8%1 Computed as: Stock of provisions for defaulted stock / default stock (as defined in paragraphs 59 and 61 of the Methodological note)
(mln EUR, %)Non-defaulted Defaulted Non-defaulted Defaulted Non-defaulted Defaulted Non-defaulted Defaulted Non-defaulted Defaulted Non-defaulted Defaulted
Central banks and central governments 0 0 954 0 0 0 105 0 0 0 1 0 -
Institutions 0 0 2,198 0 0 0 493 0 0 0 2 0 -
Corporates 0 0 10,586 36 0 0 5,108 0 0 0 56 4 5.4%
Corporates - Of Which: Specialised Lending 0 0 8,992 35 0 0 4,350 0 0 0 53 3 5.2%
Corporates - Of Which: SME 0 0 0 0 0 0 0 0 0 0 0 0 -
Retail 0 0 0 0 0 0 0 0 0 0 0 0 -
Retail - Secured on real estate property 0 0 0 0 0 0 0 0 0 0 0 0 -
Retail - Secured on real estate property - Of Which: SME 0 0 0 0 0 0 0 0 0 0 0 0 -
Retail - Secured on real estate property - Of Which: non-SME 0 0 0 0 0 0 0 0 0 0 0 0 -
Retail - Qualifying Revolving 0 0 0 0 0 0 0 0 0 0 0 0 -
Retail - Other Retail 0 0 0 0 0 0 0 0 0 0 0 0 -
Retail - Other Retail - Of Which: SME 0 0 0 0 0 0 0 0 0 0 0 0 -
Retail - Other Retail - Of Which: non-SME 0 0 0 0 0 0 0 0 0 0 0 0 -
Equity 0 0 0 0 0 0 0 0 0 0 0 0 -
Securitisation
Other non-credit obligation assets 0 0 0 0 0 0 0 0 0 0 0 0 -
IRB TOTAL 0 0 13,739 36 0 0 5,706 0 0 0 60 4 5.4%1 Computed as: Stock of provisions for defaulted stock / default stock (as defined in paragraphs 59 and 61 of the Methodological note)
(mln EUR, %)Non-defaulted Defaulted Non-defaulted Defaulted Non-defaulted Defaulted Non-defaulted Defaulted Non-defaulted Defaulted Non-defaulted Defaulted
Central banks and central governments 0 0 787 0 0 0 156 0 0 0 1 0 -
Institutions 0 0 2,775 0 0 0 699 0 0 0 1 0 -
Corporates 0 0 3,708 9 0 0 1,581 0 0 0 19 2 24.2%
Corporates - Of Which: Specialised Lending 0 0 3,085 8 0 0 1,317 0 0 0 17 1 22.1%
Corporates - Of Which: SME 0 0 74 1 0 0 42 0 0 0 0 0 35.3%
Retail 0 0 0 0 0 0 0 0 0 0 0 0 -
Retail - Secured on real estate property 0 0 0 0 0 0 0 0 0 0 0 0 -
Retail - Secured on real estate property - Of Which: SME 0 0 0 0 0 0 0 0 0 0 0 0 -
Retail - Secured on real estate property - Of Which: non-SME 0 0 0 0 0 0 0 0 0 0 0 0 -
Retail - Qualifying Revolving 0 0 0 0 0 0 0 0 0 0 0 0 -
Retail - Other Retail 0 0 0 0 0 0 0 0 0 0 0 0 -
Retail - Other Retail - Of Which: SME 0 0 0 0 0 0 0 0 0 0 0 0 -
Retail - Other Retail - Of Which: non-SME 0 0 0 0 0 0 0 0 0 0 0 0 -
Equity 0 0 0 0 0 0 0 0 0 0 0 0 -
Securitisation
Other non-credit obligation assets 0 0 0 0 0 0 0 0 0 0 0 0 -
IRB TOTAL 0 0 7,270 9 0 0 2,435 0 0 0 21 2 24.2%1 Computed as: Stock of provisions for defaulted stock / default stock (as defined in paragraphs 59 and 61 of the Methodological note)
31/12/2015
Exposure values Risk exposure amounts Stock of provisions
Coverage Ratio -
Default Stock1
A-IRB
Landesbank Hessen-Thüringen
Girozentrale
F-IRB A-IRB F-IRB A-IRB F-IRB
31/12/2015
Exposure values Risk exposure amounts Stock of provisions
Coverage Ratio -
Default Stock1
A-IRB F-IRB A-IRB
Germany
31/12/2015
Exposure values Risk exposure amounts Stock of provisions
F-IRB A-IRB F-IRB
Coverage Ratio -
Default Stock1
A-IRB F-IRB A-IRB F-IRB A-IRB F-IRB
United States
31/12/2015
Exposure values Risk exposure amounts Stock of provisions
Coverage Ratio -
Default Stock1
A-IRB F-IRB
France
A-IRB F-IRB A-IRB F-IRB

2016 EU-wide Stress Test:
Credit risk IRBLandesbank Hessen-Thüringen Girozentrale
(mln EUR, %)Non-defaulted Defaulted Non-defaulted Defaulted Non-defaulted Defaulted Non-defaulted Defaulted Non-defaulted Defaulted Non-defaulted Defaulted
Central banks and central governments 0 0 600 0 0 0 55 0 0 0 0 0 -
Institutions 0 0 2,014 0 0 0 548 0 0 0 0 0 -
Corporates 0 0 4,082 0 0 0 1,487 0 0 0 17 0 36.6%
Corporates - Of Which: Specialised Lending 0 0 3,161 0 0 0 1,072 0 0 0 13 0 -
Corporates - Of Which: SME 0 0 0 0 0 0 0 0 0 0 0 0 -
Retail 0 0 0 0 0 0 0 0 0 0 0 0 -
Retail - Secured on real estate property 0 0 0 0 0 0 0 0 0 0 0 0 -
Retail - Secured on real estate property - Of Which: SME 0 0 0 0 0 0 0 0 0 0 0 0 -
Retail - Secured on real estate property - Of Which: non-SME 0 0 0 0 0 0 0 0 0 0 0 0 -
Retail - Qualifying Revolving 0 0 0 0 0 0 0 0 0 0 0 0 -
Retail - Other Retail 0 0 0 0 0 0 0 0 0 0 0 0 -
Retail - Other Retail - Of Which: SME 0 0 0 0 0 0 0 0 0 0 0 0 -
Retail - Other Retail - Of Which: non-SME 0 0 0 0 0 0 0 0 0 0 0 0 -
Equity 0 0 0 0 0 0 0 0 0 0 0 0 -
Securitisation
Other non-credit obligation assets 0 0 0 0 0 0 0 0 0 0 0 0 -
IRB TOTAL 0 0 6,696 0 0 0 2,090 0 0 0 17 0 36.6%1 Computed as: Stock of provisions for defaulted stock / default stock (as defined in paragraphs 59 and 61 of the Methodological note)
(mln EUR, %)Non-defaulted Defaulted Non-defaulted Defaulted Non-defaulted Defaulted Non-defaulted Defaulted Non-defaulted Defaulted Non-defaulted Defaulted
Central banks and central governments 0 0 56 0 0 0 0 0 0 0 0 0 -
Institutions 0 0 854 0 0 0 188 0 0 0 0 0 -
Corporates 0 0 1,926 63 0 0 776 0 0 0 6 29 46.2%
Corporates - Of Which: Specialised Lending 0 0 1,091 62 0 0 467 0 0 0 4 28 46.3%
Corporates - Of Which: SME 0 0 2 0 0 0 1 0 0 0 0 0 -
Retail 0 0 0 0 0 0 0 0 0 0 0 0 -
Retail - Secured on real estate property 0 0 0 0 0 0 0 0 0 0 0 0 -
Retail - Secured on real estate property - Of Which: SME 0 0 0 0 0 0 0 0 0 0 0 0 -
Retail - Secured on real estate property - Of Which: non-SME 0 0 0 0 0 0 0 0 0 0 0 0 -
Retail - Qualifying Revolving 0 0 0 0 0 0 0 0 0 0 0 0 -
Retail - Other Retail 0 0 0 0 0 0 0 0 0 0 0 0 -
Retail - Other Retail - Of Which: SME 0 0 0 0 0 0 0 0 0 0 0 0 -
Retail - Other Retail - Of Which: non-SME 0 0 0 0 0 0 0 0 0 0 0 0 -
Equity 0 0 0 0 0 0 0 0 0 0 0 0 -
Securitisation
Other non-credit obligation assets 0 0 0 0 0 0 0 0 0 0 0 0 -
IRB TOTAL 0 0 2,836 63 0 0 964 0 0 0 6 29 46.2%1 Computed as: Stock of provisions for defaulted stock / default stock (as defined in paragraphs 59 and 61 of the Methodological note)
(mln EUR, %)Non-defaulted Defaulted Non-defaulted Defaulted Non-defaulted Defaulted Non-defaulted Defaulted Non-defaulted Defaulted Non-defaulted Defaulted
Central banks and central governments 0 0 32 0 0 0 5 0 0 0 0 0 -
Institutions 0 0 55 0 0 0 9 0 0 0 0 0 -
Corporates 0 0 2,844 105 0 0 1,371 0 0 0 10 34 32.8%
Corporates - Of Which: Specialised Lending 0 0 2,306 0 0 0 1,164 0 0 0 8 0 -
Corporates - Of Which: SME 0 0 0 0 0 0 0 0 0 0 0 0 -
Retail 0 0 0 0 0 0 0 0 0 0 0 0 -
Retail - Secured on real estate property 0 0 0 0 0 0 0 0 0 0 0 0 -
Retail - Secured on real estate property - Of Which: SME 0 0 0 0 0 0 0 0 0 0 0 0 -
Retail - Secured on real estate property - Of Which: non-SME 0 0 0 0 0 0 0 0 0 0 0 0 -
Retail - Qualifying Revolving 0 0 0 0 0 0 0 0 0 0 0 0 -
Retail - Other Retail 0 0 0 0 0 0 0 0 0 0 0 0 -
Retail - Other Retail - Of Which: SME 0 0 0 0 0 0 0 0 0 0 0 0 -
Retail - Other Retail - Of Which: non-SME 0 0 0 0 0 0 0 0 0 0 0 0 -
Equity 0 0 0 0 0 0 0 0 0 0 0 0 -
Securitisation
Other non-credit obligation assets 0 0 0 0 0 0 0 0 0 0 0 0 -
IRB TOTAL 0 0 2,931 105 0 0 1,385 0 0 0 10 34 32.8%1 Computed as: Stock of provisions for defaulted stock / default stock (as defined in paragraphs 59 and 61 of the Methodological note)
(mln EUR, %)Non-defaulted Defaulted Non-defaulted Defaulted Non-defaulted Defaulted Non-defaulted Defaulted Non-defaulted Defaulted Non-defaulted Defaulted
Central banks and central governments 0 0 25 0 0 0 15 0 0 0 0 0 -
Institutions 0 0 1,084 0 0 0 288 0 0 0 1 0 -
Corporates 0 0 476 2 0 0 189 0 0 0 2 0 7.6%
Corporates - Of Which: Specialised Lending 0 0 94 0 0 0 49 0 0 0 1 0 -
Corporates - Of Which: SME 0 0 0 0 0 0 0 0 0 0 0 0 -
Retail 0 0 0 0 0 0 0 0 0 0 0 0 -
Retail - Secured on real estate property 0 0 0 0 0 0 0 0 0 0 0 0 -
Retail - Secured on real estate property - Of Which: SME 0 0 0 0 0 0 0 0 0 0 0 0 -
Retail - Secured on real estate property - Of Which: non-SME 0 0 0 0 0 0 0 0 0 0 0 0 -
Retail - Qualifying Revolving 0 0 0 0 0 0 0 0 0 0 0 0 -
Retail - Other Retail 0 0 0 0 0 0 0 0 0 0 0 0 -
Retail - Other Retail - Of Which: SME 0 0 0 0 0 0 0 0 0 0 0 0 -
Retail - Other Retail - Of Which: non-SME 0 0 0 0 0 0 0 0 0 0 0 0 -
Equity 0 0 0 0 0 0 0 0 0 0 0 0 -
Securitisation
Other non-credit obligation assets 0 0 0 0 0 0 0 0 0 0 0 0 -
IRB TOTAL 0 0 1,586 2 0 0 492 0 0 0 3 0 7.6%1 Computed as: Stock of provisions for defaulted stock / default stock (as defined in paragraphs 59 and 61 of the Methodological note)
31/12/2015
Exposure values Risk exposure amounts Stock of provisions
Coverage Ratio -
Default Stock1
A-IRB F-IRB A-IRB F-IRB A-IRB F-IRB
United Kingdom
31/12/2015
Exposure values Risk exposure amounts Stock of provisions
Coverage Ratio -
Default Stock1
A-IRB F-IRB
Netherlands
31/12/2015
Exposure values Risk exposure amounts
A-IRB F-IRB A-IRB F-IRB
Stock of provisions
Coverage Ratio -
Default Stock1
A-IRB F-IRB A-IRB F-IRB A-IRB F-IRB
Luxembourg
31/12/2015
Exposure values Risk exposure amounts Stock of provisions
Coverage Ratio -
Default Stock1
A-IRB F-IRB
Switzerland
A-IRB F-IRB A-IRB F-IRB

2016 EU-wide Stress Test:
Credit risk IRBLandesbank Hessen-Thüringen Girozentrale
(mln EUR, %)Non-defaulted Defaulted Non-defaulted Defaulted Non-defaulted Defaulted Non-defaulted Defaulted Non-defaulted Defaulted Non-defaulted Defaulted
Central banks and central governments 0 0 535 0 0 0 225 0 0 0 0 0 -
Institutions 0 0 338 0 0 0 81 0 0 0 0 0 -
Corporates 0 0 565 124 0 0 523 0 0 0 7 48 38.8%
Corporates - Of Which: Specialised Lending 0 0 425 113 0 0 467 0 0 0 6 37 32.8%
Corporates - Of Which: SME 0 0 0 0 0 0 0 0 0 0 0 0 -
Retail 0 0 0 0 0 0 0 0 0 0 0 0 -
Retail - Secured on real estate property 0 0 0 0 0 0 0 0 0 0 0 0 -
Retail - Secured on real estate property - Of Which: SME 0 0 0 0 0 0 0 0 0 0 0 0 -
Retail - Secured on real estate property - Of Which: non-SME 0 0 0 0 0 0 0 0 0 0 0 0 -
Retail - Qualifying Revolving 0 0 0 0 0 0 0 0 0 0 0 0 -
Retail - Other Retail 0 0 0 0 0 0 0 0 0 0 0 0 -
Retail - Other Retail - Of Which: SME 0 0 0 0 0 0 0 0 0 0 0 0 -
Retail - Other Retail - Of Which: non-SME 0 0 0 0 0 0 0 0 0 0 0 0 -
Equity 0 0 0 0 0 0 0 0 0 0 0 0 -
Securitisation
Other non-credit obligation assets 0 0 0 0 0 0 0 0 0 0 0 0 -
IRB TOTAL 0 0 1,438 124 0 0 828 0 0 0 7 48 38.8%1 Computed as: Stock of provisions for defaulted stock / default stock (as defined in paragraphs 59 and 61 of the Methodological note)
(mln EUR, %)Non-defaulted Defaulted Non-defaulted Defaulted Non-defaulted Defaulted Non-defaulted Defaulted Non-defaulted Defaulted Non-defaulted Defaulted
Central banks and central governments 0 0 14 0 0 0 1 0 0 0 0 0 -
Institutions 0 0 1,367 0 0 0 180 0 0 0 0 0 -
Corporates 0 0 141 0 0 0 66 0 0 0 1 0 36.6%
Corporates - Of Which: Specialised Lending 0 0 101 0 0 0 32 0 0 0 1 0 -
Corporates - Of Which: SME 0 0 0 0 0 0 0 0 0 0 0 0 -
Retail 0 0 0 0 0 0 0 0 0 0 0 0 -
Retail - Secured on real estate property 0 0 0 0 0 0 0 0 0 0 0 0 -
Retail - Secured on real estate property - Of Which: SME 0 0 0 0 0 0 0 0 0 0 0 0 -
Retail - Secured on real estate property - Of Which: non-SME 0 0 0 0 0 0 0 0 0 0 0 0 -
Retail - Qualifying Revolving 0 0 0 0 0 0 0 0 0 0 0 0 -
Retail - Other Retail 0 0 0 0 0 0 0 0 0 0 0 0 -
Retail - Other Retail - Of Which: SME 0 0 0 0 0 0 0 0 0 0 0 0 -
Retail - Other Retail - Of Which: non-SME 0 0 0 0 0 0 0 0 0 0 0 0 -
Equity 0 0 0 0 0 0 0 0 0 0 0 0 -
Securitisation
Other non-credit obligation assets 0 0 0 0 0 0 0 0 0 0 0 0 -
IRB TOTAL 0 0 1,522 0 0 0 246 0 0 0 1 0 36.6%1 Computed as: Stock of provisions for defaulted stock / default stock (as defined in paragraphs 59 and 61 of the Methodological note)
(mln EUR, %)Non-defaulted Defaulted Non-defaulted Defaulted Non-defaulted Defaulted Non-defaulted Defaulted Non-defaulted Defaulted Non-defaulted Defaulted
Central banks and central governments 0 0 129 0 0 0 20 0 0 0 0 0 -
Institutions 0 0 389 0 0 0 79 0 0 0 1 0 -
Corporates 0 0 873 51 0 0 524 0 0 0 6 0 36.6%
Corporates - Of Which: Specialised Lending 0 0 398 0 0 0 239 0 0 0 3 0 -
Corporates - Of Which: SME 0 0 0 0 0 0 0 0 0 0 0 0 -
Retail 0 0 0 0 0 0 0 0 0 0 0 0 -
Retail - Secured on real estate property 0 0 0 0 0 0 0 0 0 0 0 0 -
Retail - Secured on real estate property - Of Which: SME 0 0 0 0 0 0 0 0 0 0 0 0 -
Retail - Secured on real estate property - Of Which: non-SME 0 0 0 0 0 0 0 0 0 0 0 0 -
Retail - Qualifying Revolving 0 0 0 0 0 0 0 0 0 0 0 0 -
Retail - Other Retail 0 0 0 0 0 0 0 0 0 0 0 0 -
Retail - Other Retail - Of Which: SME 0 0 0 0 0 0 0 0 0 0 0 0 -
Retail - Other Retail - Of Which: non-SME 0 0 0 0 0 0 0 0 0 0 0 0 -
Equity 0 0 0 0 0 0 0 0 0 0 0 0 -
Securitisation
Other non-credit obligation assets 0 0 0 0 0 0 0 0 0 0 0 0 -
IRB TOTAL 0 0 1,391 51 0 0 624 0 0 0 7 0 36.6%1 Computed as: Stock of provisions for defaulted stock / default stock (as defined in paragraphs 59 and 61 of the Methodological note)
31/12/2015
Exposure values Risk exposure amounts Stock of provisions
Coverage Ratio -
Default Stock1
A-IRB F-IRB A-IRB F-IRB A-IRB F-IRB
Spain
31/12/2015
Exposure values Risk exposure amounts Stock of provisions
Coverage Ratio -
Default Stock1
A-IRB F-IRB
Canada
31/12/2015
Exposure values Risk exposure amounts
A-IRB F-IRB A-IRB F-IRB
Austria
Stock of provisions
Coverage Ratio -
Default Stock1
A-IRB F-IRB A-IRB F-IRB A-IRB F-IRB

2016 EU-wide Stress Test:
Credit risk IRBLandesbank Hessen-Thüringen Girozentrale
(mln EUR, %)
Central banks and central governments
Institutions
Corporates
Corporates - Of Which: Specialised Lending
Corporates - Of Which: SME
Retail
Retail - Secured on real estate property
Retail - Secured on real estate property - Of Which: SME
Retail - Secured on real estate property - Of Which: non-SME
Retail - Qualifying Revolving
Retail - Other Retail
Retail - Other Retail - Of Which: SME
Retail - Other Retail - Of Which: non-SME
Equity
Securitisation
Other non-credit obligation assets
IRB TOTAL1 Computed as: Stock of provisions for defaulted stock / default stock (as defined in paragraphs 59 and 61 of the Methodological note)
Landesbank Hessen-Thüringen
Girozentrale
Germany
United States
France
Impairment
rate
Stock of
Provisions
Coverage Ratio -
Default Stock1
Impairment
rate
Stock of
Provisions
Coverage Ratio -
Default Stock1
Impairment
rate
Stock of
Provisions
Coverage Ratio -
Default Stock1
Impairment
rate
Stock of
Provisions
Coverage Ratio -
Default Stock1
Impairment
rate
Stock of
Provisions
Coverage Ratio -
Default Stock1
Impairment
rate
Stock of
Provisions
Coverage Ratio -
Default Stock1
0.0% 5 31.8% 0.0% 7 31.7% 0.0% 8 31.7% 0.0% 7 43.0% 0.0% 11 44.5% 0.0% 14 45.0%
0.1% 12 70.6% 0.1% 14 65.3% 0.1% 16 62.9% 0.1% 13 72.5% 0.1% 18 69.6% 0.1% 21 67.4%
0.2% 1,075 35.3% 0.2% 1,172 34.5% 0.1% 1,271 34.4% 0.3% 1,237 39.8% 0.3% 1,453 40.2% 0.2% 1,637 41.6%
0.1% 637 31.7% 0.1% 676 30.8% 0.1% 714 30.4% 0.2% 742 37.0% 0.2% 867 38.1% 0.1% 981 40.4%
0.5% 44 47.1% 0.5% 53 46.8% 0.5% 63 46.9% 0.7% 50 51.1% 0.7% 64 52.3% 0.6% 76 53.2%
0.4% 51 48.7% 0.4% 74 48.2% 0.5% 99 48.1% 0.4% 58 53.8% 0.6% 94 56.4% 0.8% 139 58.6%
0.3% 26 37.1% 0.3% 37 36.7% 0.3% 51 36.8% 0.3% 29 40.9% 0.5% 48 42.7% 0.6% 71 44.6%
0.7% 4 33.6% 0.7% 7 33.6% 0.7% 11 33.5% 0.9% 4 37.3% 1.0% 10 38.5% 1.2% 15 39.5%
0.2% 22 37.8% 0.2% 30 37.5% 0.3% 40 37.9% 0.2% 25 41.7% 0.3% 38 44.0% 0.5% 56 46.2%
0.4% 3 68.6% 0.5% 7 71.2% 0.6% 10 72.3% 0.5% 4 76.0% 0.7% 9 84.0% 1.0% 16 88.9%
0.7% 22 70.7% 0.8% 29 70.5% 0.8% 37 70.4% 0.8% 25 78.2% 1.1% 37 83.1% 1.4% 52 86.5%
1.4% 2 57.4% 1.3% 5 59.7% 1.4% 7 60.2% 1.7% 3 63.7% 1.9% 6 70.6% 2.3% 10 74.3%
0.5% 20 72.8% 0.7% 25 72.9% 0.7% 31 73.1% 0.6% 22 80.6% 1.0% 31 86.2% 1.2% 42 90.0%
0.9% 0 100.0% 0.9% 0 100.0% 0.9% 0 100.0% 0.9% 0 100.0% 0.9% 0 100.0% 0.9% 0 100.0%
0.0% 0 40.0% 0.0% 0 42.0% 0.0% 0 42.7% 0.0% 0 40.0% 0.0% 0 42.0% 0.0% 0 42.7%
0.2% 1,143 35.9% 0.1% 1,267 35.4% 0.1% 1,395 35.4% 0.2% 1,316 40.5% 0.2% 1,576 41.2% 0.2% 1,812 42.9%
Impairment
rate
Stock of
Provisions
Coverage Ratio -
Default Stock1
Impairment
rate
Stock of
Provisions
Coverage Ratio -
Default Stock1
Impairment
rate
Stock of
Provisions
Coverage Ratio -
Default Stock1
Impairment
rate
Stock of
Provisions
Coverage Ratio -
Default Stock1
Impairment
rate
Stock of
Provisions
Coverage Ratio -
Default Stock1
Impairment
rate
Stock of
Provisions
Coverage Ratio -
Default Stock1
0.0% 1 20.8% 0.0% 1 21.8% 0.0% 2 22.2% 0.0% 1 23.7% 0.0% 2 24.9% 0.0% 2 25.2%
0.0% 0 25.6% 0.0% 0 26.7% 0.0% 0 27.0% 0.0% 0 33.4% 0.0% 0 34.7% 0.0% 1 35.1%
0.3% 670 37.1% 0.2% 737 36.4% 0.2% 808 36.6% 0.4% 802 42.9% 0.3% 948 43.7% 0.2% 1,080 45.7%
0.2% 315 32.5% 0.2% 329 31.7% 0.2% 346 31.5% 0.4% 392 40.0% 0.4% 459 42.3% 0.2% 529 46.6%
0.5% 38 45.1% 0.5% 49 45.8% 0.5% 58 46.5% 0.7% 45 50.8% 0.7% 60 52.1% 0.6% 72 52.9%
0.4% 51 48.7% 0.4% 74 48.2% 0.5% 99 48.1% 0.4% 58 53.8% 0.6% 94 56.4% 0.8% 139 58.6%
0.3% 26 37.1% 0.3% 37 36.7% 0.3% 51 36.8% 0.3% 29 40.9% 0.5% 48 42.7% 0.6% 71 44.6%
0.7% 4 33.6% 0.7% 7 33.6% 0.7% 11 33.5% 0.9% 4 37.3% 1.0% 10 38.5% 1.2% 15 39.5%
0.2% 22 37.8% 0.2% 30 37.5% 0.3% 40 37.9% 0.2% 25 41.7% 0.3% 38 44.0% 0.5% 56 46.2%
0.4% 3 68.6% 0.5% 7 71.2% 0.6% 10 72.3% 0.5% 4 76.0% 0.7% 9 84.0% 1.0% 16 88.9%
0.7% 22 70.7% 0.8% 29 70.5% 0.8% 37 70.4% 0.8% 25 78.2% 1.1% 37 83.1% 1.4% 52 86.5%
1.4% 2 57.4% 1.3% 5 59.7% 1.4% 7 60.2% 1.7% 3 63.7% 1.9% 6 70.6% 2.3% 10 74.3%
0.5% 20 72.8% 0.7% 25 72.9% 0.7% 31 73.1% 0.6% 22 80.6% 1.0% 31 86.2% 1.2% 42 90.0%
0.9% 0 100.0% 0.9% 0 100.0% 0.9% 0 100.0% 0.9% 0 100.0% 0.9% 0 100.0% 0.9% 0 100.0%
0.0% 0 40.0% 0.0% 0 42.0% 0.0% 0 42.7% 0.0% 0 40.0% 0.0% 0 42.0% 0.0% 0 42.7%
0.2% 722 37.8% 0.2% 812 37.3% 0.2% 910 37.6% 0.3% 861 43.5% 0.3% 1,045 44.6% 0.2% 1,222 46.9%
Impairment
rate
Stock of
Provisions
Coverage Ratio -
Default Stock1
Impairment
rate
Stock of
Provisions
Coverage Ratio -
Default Stock1
Impairment
rate
Stock of
Provisions
Coverage Ratio -
Default Stock1
Impairment
rate
Stock of
Provisions
Coverage Ratio -
Default Stock1
Impairment
rate
Stock of
Provisions
Coverage Ratio -
Default Stock1
Impairment
rate
Stock of
Provisions
Coverage Ratio -
Default Stock1
0.0% 1 - 0.0% 1 - 0.0% 1 - 0.0% 1 - 0.0% 1 - 0.0% 1 -
0.0% 3 84.2% 0.0% 3 88.8% 0.0% 3 89.4% 0.1% 3 93.5% 0.1% 4 95.6% 0.0% 4 96.8%
0.1% 70 11.1% 0.1% 78 13.4% 0.0% 83 14.1% 0.1% 74 12.6% 0.1% 95 18.1% 0.1% 111 20.9%
0.1% 65 10.6% 0.1% 72 13.0% 0.0% 77 13.6% 0.1% 69 12.0% 0.1% 88 17.6% 0.1% 102 20.5%
- 0 - - 0 - - 0 - - 0 - - 0 - - 0 -
- 0 - - 0 - - 0 - - 0 - - 0 - - 0 -
- 0 - - 0 - - 0 - - 0 - - 0 - - 0 -
- 0 - - 0 - - 0 - - 0 - - 0 - - 0 -
- 0 - - 0 - - 0 - - 0 - - 0 - - 0 -
- 0 - - 0 - - 0 - - 0 - - 0 - - 0 -
- 0 - - 0 - - 0 - - 0 - - 0 - - 0 -
- 0 - - 0 - - 0 - - 0 - - 0 - - 0 -
- 0 - - 0 - - 0 - - 0 - - 0 - - 0 -
0.9% 0 100.0% 0.9% 0 100.0% 0.9% 0 100.0% 0.9% 0 100.0% 0.9% 0 100.0% 0.9% 0 100.0%
- 0 - - 0 - - 0 - - 0 - - 0 - - 0 -
0.1% 74 11.3% 0.1% 82 13.7% 0.0% 87 14.4% 0.1% 78 13.0% 0.1% 100 18.7% 0.1% 116 21.5%
Impairment
rate
Stock of
Provisions
Coverage Ratio -
Default Stock1
Impairment
rate
Stock of
Provisions
Coverage Ratio -
Default Stock1
Impairment
rate
Stock of
Provisions
Coverage Ratio -
Default Stock1
Impairment
rate
Stock of
Provisions
Coverage Ratio -
Default Stock1
Impairment
rate
Stock of
Provisions
Coverage Ratio -
Default Stock1
Impairment
rate
Stock of
Provisions
Coverage Ratio -
Default Stock1
0.0% 1 56.1% 0.0% 1 59.6% 0.0% 1 60.7% 0.1% 1 60.7% 0.1% 2 63.8% 0.1% 2 64.8%
0.1% 1 37.4% 0.1% 1 39.5% 0.1% 1 40.3% 0.1% 1 45.0% 0.1% 1 47.3% 0.1% 1 48.0%
0.1% 27 44.8% 0.1% 32 43.9% 0.1% 36 43.4% 0.2% 30 46.6% 0.2% 38 46.5% 0.1% 44 47.1%
0.1% 24 44.4% 0.1% 28 43.3% 0.1% 32 42.8% 0.2% 26 46.1% 0.2% 34 45.9% 0.1% 39 46.5%
0.1% 1 47.3% 0.1% 1 46.1% 0.1% 1 45.3% 0.2% 1 48.3% 0.2% 1 49.3% 0.2% 1 49.5%
- 0 - - 0 - - 0 - - 0 - - 0 - - 0 -
- 0 - - 0 - - 0 - - 0 - - 0 - - 0 -
- 0 - - 0 - - 0 - - 0 - - 0 - - 0 -
- 0 - - 0 - - 0 - - 0 - - 0 - - 0 -
- 0 - - 0 - - 0 - - 0 - - 0 - - 0 -
- 0 - - 0 - - 0 - - 0 - - 0 - - 0 -
- 0 - - 0 - - 0 - - 0 - - 0 - - 0 -
- 0 - - 0 - - 0 - - 0 - - 0 - - 0 -
- 0 - - 0 - - 0 - - 0 - - 0 - - 0 -
- 0 - - 0 - - 0 - - 0 - - 0 - - 0 -
0.1% 29 44.8% 0.1% 34 43.9% 0.1% 38 43.5% 0.2% 32 46.9% 0.2% 41 47.0% 0.1% 47 47.7%
Baseline Scenario Adverse Scenario
31/12/2017 31/12/2018 31/12/2016 31/12/2017 31/12/201831/12/2016
Baseline Scenario Adverse Scenario
31/12/2016 31/12/2017 31/12/2018
Baseline Scenario Adverse Scenario
31/12/2016 31/12/2017 31/12/2018
31/12/2016 31/12/2017 31/12/2018 31/12/2016 31/12/2017 31/12/2018
Baseline Scenario Adverse Scenario
31/12/2018 31/12/2016 31/12/2017 31/12/201831/12/2016 31/12/2017

2016 EU-wide Stress Test:
Credit risk IRBLandesbank Hessen-Thüringen Girozentrale
(mln EUR, %)
Central banks and central governments
Institutions
Corporates
Corporates - Of Which: Specialised Lending
Corporates - Of Which: SME
Retail
Retail - Secured on real estate property
Retail - Secured on real estate property - Of Which: SME
Retail - Secured on real estate property - Of Which: non-SME
Retail - Qualifying Revolving
Retail - Other Retail
Retail - Other Retail - Of Which: SME
Retail - Other Retail - Of Which: non-SME
Equity
Securitisation
Other non-credit obligation assets
IRB TOTAL1 Computed as: Stock of provisions for defaulted stock / default stock (as defined in paragraphs 59 and 61 of the Methodological note)
(mln EUR, %)
Central banks and central governments
Institutions
Corporates
Corporates - Of Which: Specialised Lending
Corporates - Of Which: SME
Retail
Retail - Secured on real estate property
Retail - Secured on real estate property - Of Which: SME
Retail - Secured on real estate property - Of Which: non-SME
Retail - Qualifying Revolving
Retail - Other Retail
Retail - Other Retail - Of Which: SME
Retail - Other Retail - Of Which: non-SME
Equity
Securitisation
Other non-credit obligation assets
IRB TOTAL1 Computed as: Stock of provisions for defaulted stock / default stock (as defined in paragraphs 59 and 61 of the Methodological note)
(mln EUR, %)
Central banks and central governments
Institutions
Corporates
Corporates - Of Which: Specialised Lending
Corporates - Of Which: SME
Retail
Retail - Secured on real estate property
Retail - Secured on real estate property - Of Which: SME
Retail - Secured on real estate property - Of Which: non-SME
Retail - Qualifying Revolving
Retail - Other Retail
Retail - Other Retail - Of Which: SME
Retail - Other Retail - Of Which: non-SME
Equity
Securitisation
Other non-credit obligation assets
IRB TOTAL1 Computed as: Stock of provisions for defaulted stock / default stock (as defined in paragraphs 59 and 61 of the Methodological note)
(mln EUR, %)
Central banks and central governments
Institutions
Corporates
Corporates - Of Which: Specialised Lending
Corporates - Of Which: SME
Retail
Retail - Secured on real estate property
Retail - Secured on real estate property - Of Which: SME
Retail - Secured on real estate property - Of Which: non-SME
Retail - Qualifying Revolving
Retail - Other Retail
Retail - Other Retail - Of Which: SME
Retail - Other Retail - Of Which: non-SME
Equity
Securitisation
Other non-credit obligation assets
IRB TOTAL1 Computed as: Stock of provisions for defaulted stock / default stock (as defined in paragraphs 59 and 61 of the Methodological note)
United Kingdom
Netherlands
Luxembourg
Switzerland
Impairment
rate
Stock of
Provisions
Coverage Ratio -
Default Stock1
Impairment
rate
Stock of
Provisions
Coverage Ratio -
Default Stock1
Impairment
rate
Stock of
Provisions
Coverage Ratio -
Default Stock1
Impairment
rate
Stock of
Provisions
Coverage Ratio -
Default Stock1
Impairment
rate
Stock of
Provisions
Coverage Ratio -
Default Stock1
Impairment
rate
Stock of
Provisions
Coverage Ratio -
Default Stock1
0.0% 0 39.5% 0.0% 0 41.5% 0.0% 0 42.1% 0.0% 0 41.4% 0.0% 0 43.5% 0.0% 0 44.2%
0.1% 0 34.3% 0.1% 0 36.3% 0.1% 0 37.1% 0.1% 0 43.2% 0.1% 0 45.4% 0.1% 1 46.1%
0.1% 21 23.6% 0.1% 25 25.4% 0.1% 28 25.6% 0.1% 22 24.1% 0.1% 28 27.0% 0.1% 33 29.4%
0.0% 14 10.0% 0.0% 15 11.4% 0.0% 16 11.7% 0.0% 14 10.3% 0.1% 17 15.0% 0.1% 19 18.0%
- 0 - - 0 - - 0 - - 0 - - 0 - - 0 -
- 0 - - 0 - - 0 - - 0 - - 0 - - 0 -
- 0 - - 0 - - 0 - - 0 - - 0 - - 0 -
- 0 - - 0 - - 0 - - 0 - - 0 - - 0 -
- 0 - - 0 - - 0 - - 0 - - 0 - - 0 -
- 0 - - 0 - - 0 - - 0 - - 0 - - 0 -
- 0 - - 0 - - 0 - - 0 - - 0 - - 0 -
- 0 - - 0 - - 0 - - 0 - - 0 - - 0 -
- 0 - - 0 - - 0 - - 0 - - 0 - - 0 -
- 0 - - 0 - - 0 - - 0 - - 0 - - 0 -
- 0 - - 0 - - 0 - - 0 - - 0 - - 0 -
0.1% 21 23.7% 0.1% 25 25.6% 0.1% 29 25.8% 0.1% 22 24.4% 0.1% 29 27.2% 0.1% 34 29.7%
Impairment
rate
Stock of
Provisions
Coverage Ratio -
Default Stock1
Impairment
rate
Stock of
Provisions
Coverage Ratio -
Default Stock1
Impairment
rate
Stock of
Provisions
Coverage Ratio -
Default Stock1
Impairment
rate
Stock of
Provisions
Coverage Ratio -
Default Stock1
Impairment
rate
Stock of
Provisions
Coverage Ratio -
Default Stock1
Impairment
rate
Stock of
Provisions
Coverage Ratio -
Default Stock1
- 0 - - 0 - - 0 - - 0 - - 0 - - 0 -
0.0% 0 34.9% 0.0% 0 36.8% 0.0% 0 37.6% 0.0% 0 42.5% 0.0% 0 44.6% 0.0% 0 45.3%
0.1% 42 54.2% 0.1% 43 52.9% 0.1% 44 51.7% 0.1% 44 56.7% 0.1% 47 55.0% 0.1% 49 54.6%
0.1% 40 54.5% 0.1% 40 53.3% 0.1% 41 52.0% 0.1% 42 57.0% 0.1% 44 55.4% 0.1% 45 55.0%
0.6% 0 43.2% 0.6% 0 45.6% 0.6% 0 46.4% 0.9% 0 48.1% 0.9% 0 50.6% 0.8% 0 51.5%
- 0 - - 0 - - 0 - - 0 - - 0 - - 0 -
- 0 - - 0 - - 0 - - 0 - - 0 - - 0 -
- 0 - - 0 - - 0 - - 0 - - 0 - - 0 -
- 0 - - 0 - - 0 - - 0 - - 0 - - 0 -
- 0 - - 0 - - 0 - - 0 - - 0 - - 0 -
- 0 - - 0 - - 0 - - 0 - - 0 - - 0 -
- 0 - - 0 - - 0 - - 0 - - 0 - - 0 -
- 0 - - 0 - - 0 - - 0 - - 0 - - 0 -
- 0 - - 0 - - 0 - - 0 - - 0 - - 0 -
- 0 - - 0 - - 0 - - 0 - - 0 - - 0 -
0.1% 42 54.2% 0.1% 43 52.9% 0.1% 44 51.7% 0.1% 44 56.7% 0.1% 47 55.0% 0.1% 49 54.6%
Impairment
rate
Stock of
Provisions
Coverage Ratio -
Default Stock1
Impairment
rate
Stock of
Provisions
Coverage Ratio -
Default Stock1
Impairment
rate
Stock of
Provisions
Coverage Ratio -
Default Stock1
Impairment
rate
Stock of
Provisions
Coverage Ratio -
Default Stock1
Impairment
rate
Stock of
Provisions
Coverage Ratio -
Default Stock1
Impairment
rate
Stock of
Provisions
Coverage Ratio -
Default Stock1
0.0% 0 44.8% 0.0% 0 47.2% 0.0% 0 48.1% 0.0% 0 49.4% 0.0% 0 51.9% 0.0% 0 52.7%
0.0% 0 27.1% 0.0% 0 28.6% 0.0% 0 29.3% 0.0% 0 37.6% 0.0% 0 39.2% 0.0% 0 39.8%
0.1% 48 32.3% 0.1% 51 32.3% 0.1% 55 32.3% 0.2% 49 32.4% 0.2% 57 32.7% 0.1% 61 33.3%
0.1% 11 28.0% 0.1% 14 30.0% 0.1% 18 30.6% 0.2% 13 30.1% 0.3% 19 32.4% 0.1% 23 34.3%
- 0 - - 0 - - 0 - - 0 - - 0 - - 0 -
- 0 - - 0 - - 0 - - 0 - - 0 - - 0 -
- 0 - - 0 - - 0 - - 0 - - 0 - - 0 -
- 0 - - 0 - - 0 - - 0 - - 0 - - 0 -
- 0 - - 0 - - 0 - - 0 - - 0 - - 0 -
- 0 - - 0 - - 0 - - 0 - - 0 - - 0 -
- 0 - - 0 - - 0 - - 0 - - 0 - - 0 -
- 0 - - 0 - - 0 - - 0 - - 0 - - 0 -
- 0 - - 0 - - 0 - - 0 - - 0 - - 0 -
- 0 - - 0 - - 0 - - 0 - - 0 - - 0 -
- 0 - - 0 - - 0 - - 0 - - 0 - - 0 -
0.1% 48 32.3% 0.1% 51 32.3% 0.1% 55 32.3% 0.2% 49 32.4% 0.2% 57 32.7% 0.1% 61 33.3%
Impairment
rate
Stock of
Provisions
Coverage Ratio -
Default Stock1
Impairment
rate
Stock of
Provisions
Coverage Ratio -
Default Stock1
Impairment
rate
Stock of
Provisions
Coverage Ratio -
Default Stock1
Impairment
rate
Stock of
Provisions
Coverage Ratio -
Default Stock1
Impairment
rate
Stock of
Provisions
Coverage Ratio -
Default Stock1
Impairment
rate
Stock of
Provisions
Coverage Ratio -
Default Stock1
0.0% 0 - 0.0% 0 - 0.0% 0 - 0.0% 0 - 0.0% 0 - 0.0% 0 -
0.0% 1 24.1% 0.0% 1 26.1% 0.0% 1 26.8% 0.0% 1 31.5% 0.0% 1 32.1% 0.0% 1 33.8%
0.1% 3 29.4% 0.1% 3 33.0% 0.1% 3 33.7% 0.1% 3 31.7% 0.1% 3 36.1% 0.1% 4 37.7%
0.1% 1 23.3% 0.1% 1 23.4% 0.1% 1 23.3% 0.1% 1 23.0% 0.1% 1 24.6% 0.1% 2 27.0%
- 0 - - 0 - - 0 - - 0 - - 0 - - 0 -
- 0 - - 0 - - 0 - - 0 - - 0 - - 0 -
- 0 - - 0 - - 0 - - 0 - - 0 - - 0 -
- 0 - - 0 - - 0 - - 0 - - 0 - - 0 -
- 0 - - 0 - - 0 - - 0 - - 0 - - 0 -
- 0 - - 0 - - 0 - - 0 - - 0 - - 0 -
- 0 - - 0 - - 0 - - 0 - - 0 - - 0 -
- 0 - - 0 - - 0 - - 0 - - 0 - - 0 -
- 0 - - 0 - - 0 - - 0 - - 0 - - 0 -
- 0 - - 0 - - 0 - - 0 - - 0 - - 0 -
- 0 - - 0 - - 0 - - 0 - - 0 - - 0 -
0.0% 3 29.3% 0.0% 4 32.7% 0.0% 4 33.4% 0.0% 4 31.7% 0.1% 4 35.8% 0.0% 5 37.4%
Baseline Scenario Adverse Scenario
31/12/2016 31/12/2017 31/12/2018 31/12/2016 31/12/2017 31/12/2018
Baseline Scenario Adverse Scenario
31/12/2018 31/12/2016 31/12/2017 31/12/2018
Baseline Scenario Adverse Scenario
31/12/2016 31/12/2017
31/12/2016 31/12/2017 31/12/2018 31/12/2016 31/12/2017 31/12/2018
Baseline Scenario Adverse Scenario
31/12/2018 31/12/2016 31/12/2017 31/12/201831/12/2016 31/12/2017

2016 EU-wide Stress Test:
Credit risk IRBLandesbank Hessen-Thüringen Girozentrale
(mln EUR, %)
Central banks and central governments
Institutions
Corporates
Corporates - Of Which: Specialised Lending
Corporates - Of Which: SME
Retail
Retail - Secured on real estate property
Retail - Secured on real estate property - Of Which: SME
Retail - Secured on real estate property - Of Which: non-SME
Retail - Qualifying Revolving
Retail - Other Retail
Retail - Other Retail - Of Which: SME
Retail - Other Retail - Of Which: non-SME
Equity
Securitisation
Other non-credit obligation assets
IRB TOTAL1 Computed as: Stock of provisions for defaulted stock / default stock (as defined in paragraphs 59 and 61 of the Methodological note)
(mln EUR, %)
Central banks and central governments
Institutions
Corporates
Corporates - Of Which: Specialised Lending
Corporates - Of Which: SME
Retail
Retail - Secured on real estate property
Retail - Secured on real estate property - Of Which: SME
Retail - Secured on real estate property - Of Which: non-SME
Retail - Qualifying Revolving
Retail - Other Retail
Retail - Other Retail - Of Which: SME
Retail - Other Retail - Of Which: non-SME
Equity
Securitisation
Other non-credit obligation assets
IRB TOTAL1 Computed as: Stock of provisions for defaulted stock / default stock (as defined in paragraphs 59 and 61 of the Methodological note)
(mln EUR, %)
Central banks and central governments
Institutions
Corporates
Corporates - Of Which: Specialised Lending
Corporates - Of Which: SME
Retail
Retail - Secured on real estate property
Retail - Secured on real estate property - Of Which: SME
Retail - Secured on real estate property - Of Which: non-SME
Retail - Qualifying Revolving
Retail - Other Retail
Retail - Other Retail - Of Which: SME
Retail - Other Retail - Of Which: non-SME
Equity
Securitisation
Other non-credit obligation assets
IRB TOTAL1 Computed as: Stock of provisions for defaulted stock / default stock (as defined in paragraphs 59 and 61 of the Methodological note)
Spain
Canada
Austria
Impairment
rate
Stock of
Provisions
Coverage Ratio -
Default Stock1
Impairment
rate
Stock of
Provisions
Coverage Ratio -
Default Stock1
Impairment
rate
Stock of
Provisions
Coverage Ratio -
Default Stock1
Impairment
rate
Stock of
Provisions
Coverage Ratio -
Default Stock1
Impairment
rate
Stock of
Provisions
Coverage Ratio -
Default Stock1
Impairment
rate
Stock of
Provisions
Coverage Ratio -
Default Stock1
0.1% 1 48.1% 0.1% 1 50.5% 0.1% 2 51.3% 0.4% 2 55.3% 0.4% 4 58.1% 0.4% 6 59.0%
0.1% 0 45.9% 0.1% 0 48.4% 0.1% 0 49.3% 0.2% 0 52.6% 0.2% 0 55.2% 0.2% 0 56.1%
0.8% 59 36.8% 0.6% 62 35.8% 0.5% 65 35.2% 0.9% 60 36.7% 0.9% 65 35.6% 0.8% 69 34.7%
1.0% 47 31.4% 0.8% 50 30.8% 0.6% 52 30.4% 1.2% 48 31.4% 1.1% 52 30.7% 1.0% 56 30.2%
- 0 - - 0 - - 0 - - 0 - - 0 - - 0 -
- 0 - - 0 - - 0 - - 0 - - 0 - - 0 -
- 0 - - 0 - - 0 - - 0 - - 0 - - 0 -
- 0 - - 0 - - 0 - - 0 - - 0 - - 0 -
- 0 - - 0 - - 0 - - 0 - - 0 - - 0 -
- 0 - - 0 - - 0 - - 0 - - 0 - - 0 -
- 0 - - 0 - - 0 - - 0 - - 0 - - 0 -
- 0 - - 0 - - 0 - - 0 - - 0 - - 0 -
- 0 - - 0 - - 0 - - 0 - - 0 - - 0 -
- 0 - - 0 - - 0 - - 0 - - 0 - - 0 -
- 0 - - 0 - - 0 - - 0 - - 0 - - 0 -
0.5% 60 36.9% 0.4% 64 36.0% 0.3% 67 35.5% 0.7% 62 37.2% 0.7% 69 36.5% 0.6% 75 36.1%
Impairment
rate
Stock of
Provisions
Coverage Ratio -
Default Stock1
Impairment
rate
Stock of
Provisions
Coverage Ratio -
Default Stock1
Impairment
rate
Stock of
Provisions
Coverage Ratio -
Default Stock1
Impairment
rate
Stock of
Provisions
Coverage Ratio -
Default Stock1
Impairment
rate
Stock of
Provisions
Coverage Ratio -
Default Stock1
Impairment
rate
Stock of
Provisions
Coverage Ratio -
Default Stock1
- 0 - - 0 - - 0 - - 0 - - 0 - - 0 -
0.0% 0 27.0% 0.0% 0 28.6% 0.0% 0 29.3% 0.0% 0 37.5% 0.0% 0 39.4% 0.0% 0 40.0%
0.1% 1 10.7% 0.0% 1 9.2% 0.0% 1 8.5% 0.1% 1 10.2% 0.1% 1 10.0% 0.1% 1 10.2%
0.0% 1 22.4% 0.0% 1 23.6% 0.0% 1 23.9% 0.0% 1 22.9% 0.1% 1 23.9% 0.1% 1 24.2%
- 0 - - 0 - - 0 - - 0 - - 0 - - 0 -
- 0 - - 0 - - 0 - - 0 - - 0 - - 0 -
- 0 - - 0 - - 0 - - 0 - - 0 - - 0 -
- 0 - - 0 - - 0 - - 0 - - 0 - - 0 -
- 0 - - 0 - - 0 - - 0 - - 0 - - 0 -
- 0 - - 0 - - 0 - - 0 - - 0 - - 0 -
- 0 - - 0 - - 0 - - 0 - - 0 - - 0 -
- 0 - - 0 - - 0 - - 0 - - 0 - - 0 -
- 0 - - 0 - - 0 - - 0 - - 0 - - 0 -
- 0 - - 0 - - 0 - - 0 - - 0 - - 0 -
- 0 - - 0 - - 0 - - 0 - - 0 - - 0 -
0.1% 1 10.7% 0.0% 1 9.2% 0.0% 1 8.6% 0.1% 1 10.2% 0.1% 1 10.0% 0.1% 1 10.2%
Impairment
rate
Stock of
Provisions
Coverage Ratio -
Default Stock1
Impairment
rate
Stock of
Provisions
Coverage Ratio -
Default Stock1
Impairment
rate
Stock of
Provisions
Coverage Ratio -
Default Stock1
Impairment
rate
Stock of
Provisions
Coverage Ratio -
Default Stock1
Impairment
rate
Stock of
Provisions
Coverage Ratio -
Default Stock1
Impairment
rate
Stock of
Provisions
Coverage Ratio -
Default Stock1
0.0% 0 28.9% 0.0% 0 30.3% 0.0% 0 30.8% 0.0% 0 33.2% 0.0% 0 34.9% 0.0% 0 35.4%
0.0% 1 28.9% 0.0% 1 30.3% 0.0% 1 30.8% 0.0% 1 33.3% 0.0% 1 34.9% 0.0% 1 35.5%
0.3% 8 38.2% 0.2% 10 40.0% 0.2% 12 41.2% 0.4% 9 40.9% 0.4% 13 44.1% 0.2% 15 46.7%
0.3% 4 35.0% 0.3% 5 36.1% 0.3% 6 37.1% 0.5% 5 36.9% 0.5% 7 40.0% 0.3% 9 42.8%
- 0 - - 0 - - 0 - - 0 - - 0 - - 0 -
- 0 - - 0 - - 0 - - 0 - - 0 - - 0 -
- 0 - - 0 - - 0 - - 0 - - 0 - - 0 -
- 0 - - 0 - - 0 - - 0 - - 0 - - 0 -
- 0 - - 0 - - 0 - - 0 - - 0 - - 0 -
- 0 - - 0 - - 0 - - 0 - - 0 - - 0 -
- 0 - - 0 - - 0 - - 0 - - 0 - - 0 -
- 0 - - 0 - - 0 - - 0 - - 0 - - 0 -
- 0 - - 0 - - 0 - - 0 - - 0 - - 0 -
- 0 - - 0 - - 0 - - 0 - - 0 - - 0 -
- 0 - - 0 - - 0 - - 0 - - 0 - - 0 -
0.2% 9 38.0% 0.2% 11 39.8% 0.2% 13 41.0% 0.3% 10 40.8% 0.3% 13 43.9% 0.2% 16 46.5%
Baseline Scenario Adverse Scenario
31/12/2016 31/12/2017 31/12/2018 31/12/2016 31/12/2017 31/12/2018
Baseline Scenario Adverse Scenario
31/12/2018 31/12/2016 31/12/2017 31/12/2018
Baseline Scenario Adverse Scenario
31/12/2016 31/12/2017
31/12/2016 31/12/2017 31/12/2018 31/12/2016 31/12/2017 31/12/2018

2016 EU-wide Stress Test:
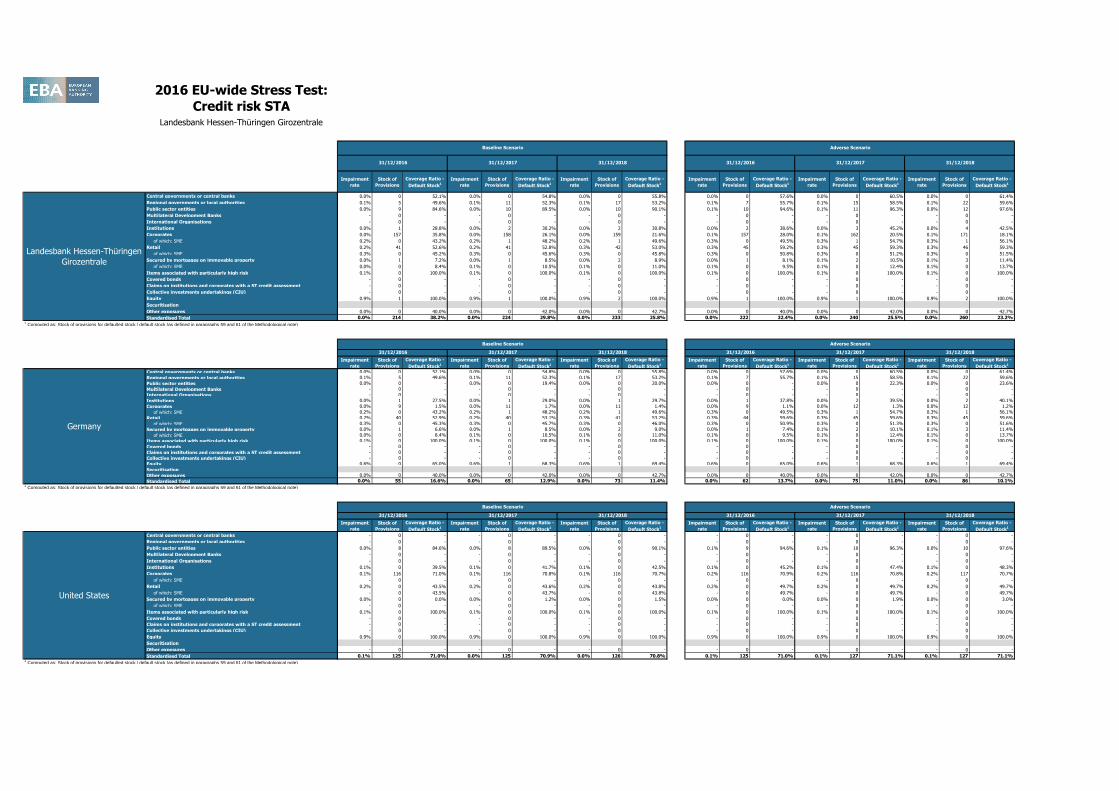
Credit risk STALandesbank Hessen-Thüringen Girozentrale
Non-defaulted Defaulted Non-defaulted Defaulted Non-defaulted Defaulted
Central governments or central banks 1,382 0 38 0 0 0 0.0%
Regional governments or local authorities 11,327 0 20 0 0 0 0.0%
Public sector entities 1,991 0 205 0 9 0 0.0%
Multilateral Development Banks 231 0 0 0 0 0 0.0%
International Organisations 577 0 0 0 0 0 0.0%
Institutions 16,959 0 778 0 1 0 0.0%
Corporates 2,093 165 1,835 109 27 129 71.4%
of which: SME 106 0 99 0 0 0 0.0%
Retail 128 66 97 79 6 4 6.8%
of which: SME 5 0 3 0 0 0 0.0%
Secured by mortgages on immovable property 1,382 0 483 0 0 0 0.0%
of which: SME 126 0 36 0 0 0 0.0%
Items associated with particularly high risk 62 0 93 0 0 0 0.0%
Covered bonds 186 0 19 0 0 0 0.0%
Claims on institutions and corporates with a ST credit assessment 0 0 0 0 0 0 0.0%
Collective investments undertakings (CIU) 0 0 0 0 0 0 0.0%
Equity 918 0 996 0 0 0 0.0%
Securitisation
Other exposures 368 0 365 0 0 0 0.0%
Standardised Total 37,602 231 4,928 188 42 133 54.1%1 Computed as: Stock of provisions for defaulted stock / default stock (as defined in paragraphs 59 and 61 of the Methodological note)
Non-defaulted Defaulted Non-defaulted Defaulted Non-defaulted Defaulted
Central governments or central banks 937 0 30 0 0 0 0.0%
Regional governments or local authorities 7,477 0 13 0 0 0 0.0%
Public sector entities 933 0 28 0 0 0 0.0%
Multilateral Development Banks 0 0 0 0 0 0 0.0%
International Organisations 0 0 0 0 0 0 0.0%
Institutions 15,567 0 466 0 1 0 0.0%
Corporates 1,466 0 1,191 6 6 2 0.0%
of which: SME 106 0 99 0 0 0 0.0%
Retail 126 64 96 77 5 4 6.8%
of which: SME 5 0 3 0 0 0 0.0%
Secured by mortgages on immovable property 1,381 0 483 0 0 0 0.0%
of which: SME 126 0 36 0 0 0 0.0%
Items associated with particularly high risk 23 0 35 0 0 0 0.0%
Covered bonds 186 0 19 0 0 0 0.0%
Claims on institutions and corporates with a ST credit assessment 0 0 0 0 0 0 0.0%
Collective investments undertakings (CIU) 0 0 0 0 0 0 0.0%
Equity 859 0 925 0 0 0 0.0%
Securitisation
Other exposures 368 0 365 0 0 0 0.0%
Standardised Total 29,324 64 3,651 82 12 6 10.1%1 Computed as: Stock of provisions for defaulted stock / default stock (as defined in paragraphs 59 and 61 of the Methodological note)
Non-defaulted Defaulted Non-defaulted Defaulted Non-defaulted Defaulted
Central governments or central banks 0 0 0 0 0 0 0.0%
Regional governments or local authorities 0 0 0 0 0 0 0.0%
Public sector entities 843 0 163 0 8 0 0.0%
Multilateral Development Banks 0 0 0 0 0 0 0.0%
International Organisations 0 0 0 0 0 0 0.0%
Institutions 120 0 23 0 0 0 0.0%
Corporates 73 160 69 50 3 114 71.1%
of which: SME 0 0 0 0 0 0 0.0%
Retail 0 0 0 0 0 0 9.5%
of which: SME 0 0 0 0 0 0 9.5%
Secured by mortgages on immovable property 0 0 0 0 0 0 0.0%
of which: SME 0 0 0 0 0 0 0.0%
Items associated with particularly high risk 3 0 4 0 0 0 0.0%
Covered bonds 0 0 0 0 0 0 0.0%
Claims on institutions and corporates with a ST credit assessment 0 0 0 0 0 0 0.0%
Collective investments undertakings (CIU) 0 0 0 0 0 0 0.0%
Equity 50 0 50 0 0 0 0.0%
Securitisation
Other exposures 0 0 0 0 0 0 0.0%
Standardised Total 1,089 160 309 50 10 114 71.0%1 Computed as: Stock of provisions for defaulted stock / default stock (as defined in paragraphs 59 and 61 of the Methodological note)
Landesbank Hessen-Thüringen
Girozentrale
31/12/2015
Exposure values Risk exposure amounts Stock of provisions
Coverage Ratio -
Default Stock1
Germany
31/12/2015
31/12/2015
Exposure values Risk exposure amounts Stock of provisionsCoverage Ratio -
Default Stock1
United States
Exposure values Risk exposure amounts Stock of provisionsCoverage Ratio -
Default Stock1

2016 EU-wide Stress Test:
Credit risk STALandesbank Hessen-Thüringen Girozentrale
Non-defaulted Defaulted Non-defaulted Defaulted Non-defaulted Defaulted
Central governments or central banks 0 0 0 0 0 0 0.0%
Regional governments or local authorities 0 0 0 0 0 0 0.0%
Public sector entities 0 0 0 0 0 0 0.0%
Multilateral Development Banks 0 0 0 0 0 0 0.0%
International Organisations 0 0 0 0 0 0 0.0%
Institutions 54 0 27 0 0 0 0.0%
Corporates 0 0 0 0 0 0 0.0%
of which: SME 0 0 0 0 0 0 0.0%
Retail 0 0 0 0 0 0 6.3%
of which: SME 0 0 0 0 0 0 0.0%
Secured by mortgages on immovable property 0 0 0 0 0 0 0.0%
of which: SME 0 0 0 0 0 0 0.0%
Items associated with particularly high risk 0 0 0 0 0 0 0.0%
Covered bonds 0 0 0 0 0 0 0.0%
Claims on institutions and corporates with a ST credit assessment 0 0 0 0 0 0 0.0%
Collective investments undertakings (CIU) 0 0 0 0 0 0 0.0%
Equity 0 0 0 0 0 0 0.0%
Securitisation
Other exposures 0 0 0 0 0 0 0.0%
Standardised Total 54 0 27 0 0 0 6.3%1 Computed as: Stock of provisions for defaulted stock / default stock (as defined in paragraphs 59 and 61 of the Methodological note)
Non-defaulted Defaulted Non-defaulted Defaulted Non-defaulted Defaulted
Central governments or central banks 0 0 0 0 0 0 0.0%
Regional governments or local authorities 0 0 0 0 0 0 0.0%
Public sector entities 0 0 0 0 0 0 0.0%
Multilateral Development Banks 0 0 0 0 0 0 0.0%
International Organisations 0 0 0 0 0 0 0.0%
Institutions 7 0 2 0 0 0 0.0%
Corporates 83 6 55 1 3 5 93.1%
of which: SME 0 0 0 0 0 0 0.0%
Retail 0 0 0 0 0 0 5.8%
of which: SME 0 0 0 0 0 0 0.0%
Secured by mortgages on immovable property 0 0 0 0 0 0 0.0%
of which: SME 0 0 0 0 0 0 0.0%
Items associated with particularly high risk 0 0 0 0 0 0 0.0%
Covered bonds 0 0 0 0 0 0 0.0%
Claims on institutions and corporates with a ST credit assessment 0 0 0 0 0 0 0.0%
Collective investments undertakings (CIU) 0 0 0 0 0 0 0.0%
Equity 9 0 21 0 0 0 0.0%
Securitisation
Other exposures 0 0 0 0 0 0 0.0%
Standardised Total 100 6 78 1 3 5 89.1%1 Computed as: Stock of provisions for defaulted stock / default stock (as defined in paragraphs 59 and 61 of the Methodological note)
Non-defaulted Defaulted Non-defaulted Defaulted Non-defaulted Defaulted
Central governments or central banks 0 0 0 0 0 0 0.0%
Regional governments or local authorities 0 0 0 0 0 0 0.0%
Public sector entities 0 0 0 0 0 0 0.0%
Multilateral Development Banks 0 0 0 0 0 0 0.0%
International Organisations 0 0 0 0 0 0 0.0%
Institutions 147 0 56 0 0 0 0.0%
Corporates 141 0 132 0 9 0 0.0%
of which: SME 0 0 0 0 0 0 0.0%
Retail 0 0 0 0 0 0 6.3%
of which: SME 0 0 0 0 0 0 0.0%
Secured by mortgages on immovable property 0 0 0 0 0 0 0.0%
of which: SME 0 0 0 0 0 0 0.0%
Items associated with particularly high risk 0 0 0 0 0 0 0.0%
Covered bonds 0 0 0 0 0 0 0.0%
Claims on institutions and corporates with a ST credit assessment 0 0 0 0 0 0 0.0%
Collective investments undertakings (CIU) 0 0 0 0 0 0 0.0%
Equity 0 0 0 0 0 0 0.0%
Securitisation
Other exposures 0 0 0 0 0 0 0.0%
Standardised Total 288 0 188 0 9 0 10.5%1 Computed as: Stock of provisions for defaulted stock / default stock (as defined in paragraphs 59 and 61 of the Methodological note)
31/12/2015
France
31/12/2015
Exposure values Risk exposure amounts Stock of provisionsCoverage Ratio -
Default Stock1
United Kingdom
31/12/2015
Exposure values Risk exposure amounts Stock of provisionsCoverage Ratio -
Default Stock1
Netherlands
Exposure values Risk exposure amounts Stock of provisionsCoverage Ratio -
Default Stock1

2016 EU-wide Stress Test:
Credit risk STALandesbank Hessen-Thüringen Girozentrale
Non-defaulted Defaulted Non-defaulted Defaulted Non-defaulted Defaulted
Central governments or central banks 0 0 0 0 0 0 0.0%
Regional governments or local authorities 0 0 0 0 0 0 0.0%
Public sector entities 0 0 0 0 0 0 0.0%
Multilateral Development Banks 0 0 0 0 0 0 0.0%
International Organisations 0 0 0 0 0 0 0.0%
Institutions 0 0 0 0 0 0 0.0%
Corporates 5 0 4 0 0 0 0.0%
of which: SME 0 0 0 0 0 0 0.0%
Retail 0 0 0 0 0 0 0.0%
of which: SME 0 0 0 0 0 0 0.0%
Secured by mortgages on immovable property 0 0 0 0 0 0 0.0%
of which: SME 0 0 0 0 0 0 0.0%
Items associated with particularly high risk 5 0 7 0 0 0 0.0%
Covered bonds 0 0 0 0 0 0 0.0%
Claims on institutions and corporates with a ST credit assessment 0 0 0 0 0 0 0.0%
Collective investments undertakings (CIU) 0 0 0 0 0 0 0.0%
Equity 0 0 0 0 0 0 0.0%
Securitisation
Other exposures 0 0 0 0 0 0 0.0%
Standardised Total 10 0 12 0 0 0 0.0%1 Computed as: Stock of provisions for defaulted stock / default stock (as defined in paragraphs 59 and 61 of the Methodological note)
Non-defaulted Defaulted Non-defaulted Defaulted Non-defaulted Defaulted
Central governments or central banks 0 0 0 0 0 0 0.0%
Regional governments or local authorities 0 0 0 0 0 0 0.0%
Public sector entities 0 0 0 0 0 0 0.0%
Multilateral Development Banks 0 0 0 0 0 0 0.0%
International Organisations 0 0 0 0 0 0 0.0%
Institutions 0 0 0 0 0 0 0.0%
Corporates 0 0 0 0 0 0 0.0%
of which: SME 0 0 0 0 0 0 0.0%
Retail 0 0 0 0 0 0 5.9%
of which: SME 0 0 0 0 0 0 0.0%
Secured by mortgages on immovable property 0 0 0 0 0 0 0.0%
of which: SME 0 0 0 0 0 0 0.0%
Items associated with particularly high risk 0 0 0 0 0 0 0.0%
Covered bonds 0 0 0 0 0 0 0.0%
Claims on institutions and corporates with a ST credit assessment 0 0 0 0 0 0 0.0%
Collective investments undertakings (CIU) 0 0 0 0 0 0 0.0%
Equity 0 0 0 0 0 0 0.0%
Securitisation
Other exposures 0 0 0 0 0 0 0.0%
Standardised Total 1 0 0 0 0 0 5.9%1 Computed as: Stock of provisions for defaulted stock / default stock (as defined in paragraphs 59 and 61 of the Methodological note)
Non-defaulted Defaulted Non-defaulted Defaulted Non-defaulted Defaulted
Central governments or central banks 0 0 0 0 0 0 0.0%
Regional governments or local authorities 0 0 0 0 0 0 0.0%
Public sector entities 0 0 0 0 0 0 0.0%
Multilateral Development Banks 0 0 0 0 0 0 0.0%
International Organisations 0 0 0 0 0 0 0.0%
Institutions 15 0 3 0 0 0 0.0%
Corporates 0 0 0 0 0 0 0.0%
of which: SME 0 0 0 0 0 0 0.0%
Retail 0 0 0 0 0 0 6.3%
of which: SME 0 0 0 0 0 0 0.0%
Secured by mortgages on immovable property 0 0 0 0 0 0 0.0%
of which: SME 0 0 0 0 0 0 0.0%
Items associated with particularly high risk 0 0 0 0 0 0 0.0%
Covered bonds 0 0 0 0 0 0 0.0%
Claims on institutions and corporates with a ST credit assessment 0 0 0 0 0 0 0.0%
Collective investments undertakings (CIU) 0 0 0 0 0 0 0.0%
Equity 0 0 0 0 0 0 0.0%
Securitisation
Other exposures 0 0 0 0 0 0 0.0%
Standardised Total 15 0 3 0 0 0 6.3%1 Computed as: Stock of provisions for defaulted stock / default stock (as defined in paragraphs 59 and 61 of the Methodological note)
31/12/2015
Luxembourg
31/12/2015
Exposure values Risk exposure amounts Stock of provisionsCoverage Ratio -
Default Stock1
Switzerland
31/12/2015
Exposure values Risk exposure amounts Stock of provisionsCoverage Ratio -
Default Stock1
Spain
Exposure values Risk exposure amounts Stock of provisionsCoverage Ratio -
Default Stock1

2016 EU-wide Stress Test:
Credit risk STALandesbank Hessen-Thüringen Girozentrale
Non-defaulted Defaulted Non-defaulted Defaulted Non-defaulted Defaulted
Central governments or central banks 0 0 0 0 0 0 0.0%
Regional governments or local authorities 0 0 0 0 0 0 0.0%
Public sector entities 0 0 0 0 0 0 0.0%
Multilateral Development Banks 0 0 0 0 0 0 0.0%
International Organisations 0 0 0 0 0 0 0.0%
Institutions 0 0 0 0 0 0 0.0%
Corporates 0 0 0 0 0 0 0.0%
of which: SME 0 0 0 0 0 0 0.0%
Retail 0 0 0 0 0 0 0.0%
of which: SME 0 0 0 0 0 0 0.0%
Secured by mortgages on immovable property 0 0 0 0 0 0 0.0%
of which: SME 0 0 0 0 0 0 0.0%
Items associated with particularly high risk 0 0 0 0 0 0 0.0%
Covered bonds 0 0 0 0 0 0 0.0%
Claims on institutions and corporates with a ST credit assessment 0 0 0 0 0 0 0.0%
Collective investments undertakings (CIU) 0 0 0 0 0 0 0.0%
Equity 0 0 0 0 0 0 0.0%
Securitisation
Other exposures 0 0 0 0 0 0 0.0%
Standardised Total 0 0 0 0 0 0 0.0%1 Computed as: Stock of provisions for defaulted stock / default stock (as defined in paragraphs 59 and 61 of the Methodological note)
Non-defaulted Defaulted Non-defaulted Defaulted Non-defaulted Defaulted
Central governments or central banks 0 0 0 0 0 0 0.0%
Regional governments or local authorities 0 0 0 0 0 0 0.0%
Public sector entities 0 0 0 0 0 0 0.0%
Multilateral Development Banks 0 0 0 0 0 0 0.0%
International Organisations 0 0 0 0 0 0 0.0%
Institutions 0 0 0 0 0 0 0.0%
Corporates 4 0 4 0 0 0 0.0%
of which: SME 0 0 0 0 0 0 0.0%
Retail 0 0 0 0 0 0 9.5%
of which: SME 0 0 0 0 0 0 0.0%
Secured by mortgages on immovable property 0 0 0 0 0 0 0.0%
of which: SME 0 0 0 0 0 0 0.0%
Items associated with particularly high risk 0 0 0 0 0 0 0.0%
Covered bonds 0 0 0 0 0 0 0.0%
Claims on institutions and corporates with a ST credit assessment 0 0 0 0 0 0 0.0%
Collective investments undertakings (CIU) 0 0 0 0 0 0 0.0%
Equity 0 0 0 0 0 0 0.0%
Securitisation
Other exposures 0 0 0 0 0 0 0.0%
Standardised Total 4 0 4 0 0 0 9.6%1 Computed as: Stock of provisions for defaulted stock / default stock (as defined in paragraphs 59 and 61 of the Methodological note)
31/12/2015
Canada
31/12/2015
Exposure values Risk exposure amounts Stock of provisionsCoverage Ratio -
Default Stock1
Austria
Exposure values Risk exposure amounts Stock of provisionsCoverage Ratio -
Default Stock1
2016 EU-wide Stress Test:
Credit risk STALandesbank Hessen-Thüringen Girozentrale
Central governments or central banks
Regional governments or local authorities
Public sector entities
Multilateral Development Banks
International Organisations
Institutions
Corporates
of which: SME
Retail
of which: SME
Secured by mortgages on immovable property
of which: SME
Items associated with particularly high risk
Covered bonds
Claims on institutions and corporates with a ST credit assessment
Collective investments undertakings (CIU)
Equity
Securitisation
Other exposures
Standardised Total1 Computed as: Stock of provisions for defaulted stock / default stock (as defined in paragraphs 59 and 61 of the Methodological note)
Landesbank Hessen-Thüringen
Girozentrale
Germany
United States
Impairment
rate
Stock of
Provisions
Coverage Ratio -
Default Stock1
Impairment
rate
Stock of
Provisions
Coverage Ratio -
Default Stock1
Impairment
rate
Stock of
Provisions
Coverage Ratio -
Default Stock1
Impairment
rate
Stock of
Provisions
Coverage Ratio -
Default Stock1
Impairment
rate
Stock of
Provisions
Coverage Ratio -
Default Stock1
Impairment
rate
Stock of
Provisions
Coverage Ratio -
Default Stock1
0.0% 0 52.1% 0.0% 0 54.8% 0.0% 0 55.8% 0.0% 0 57.6% 0.0% 0 60.5% 0.0% 0 61.4%
0.1% 5 49.6% 0.1% 11 52.3% 0.1% 17 53.2% 0.1% 7 55.7% 0.1% 15 58.5% 0.1% 22 59.6%
0.0% 9 84.6% 0.0% 10 89.5% 0.0% 10 90.1% 0.1% 10 94.6% 0.1% 11 96.3% 0.0% 12 97.6%
- 0 - - 0 - - 0 - - 0 - - 0 - - 0 -
- 0 - - 0 - - 0 - - 0 - - 0 - - 0 -
0.0% 1 28.8% 0.0% 2 30.2% 0.0% 2 30.8% 0.0% 2 38.6% 0.0% 3 45.2% 0.0% 4 42.5%
0.0% 157 35.8% 0.0% 158 26.1% 0.0% 159 21.6% 0.1% 157 28.0% 0.1% 162 20.5% 0.1% 171 18.1%
0.2% 0 43.2% 0.2% 1 48.2% 0.2% 1 49.6% 0.3% 0 49.5% 0.3% 1 54.7% 0.3% 1 56.1%
0.2% 41 52.6% 0.2% 41 52.8% 0.3% 42 53.0% 0.3% 45 59.2% 0.3% 45 59.3% 0.3% 46 59.3%
0.3% 0 45.2% 0.3% 0 45.6% 0.3% 0 45.8% 0.3% 0 50.8% 0.3% 0 51.2% 0.3% 0 51.5%
0.0% 1 7.2% 0.0% 1 8.5% 0.0% 2 8.9% 0.0% 1 8.1% 0.1% 2 10.5% 0.1% 3 11.4%
0.0% 0 8.4% 0.1% 0 10.5% 0.1% 0 11.0% 0.1% 0 9.5% 0.1% 0 12.4% 0.1% 0 13.7%
0.1% 0 100.0% 0.1% 0 100.0% 0.1% 0 100.0% 0.1% 0 100.0% 0.1% 0 100.0% 0.1% 0 100.0%
- 0 - - 0 - - 0 - - 0 - - 0 - - 0 -
- 0 - - 0 - - 0 - - 0 - - 0 - - 0 -
- 0 - - 0 - - 0 - - 0 - - 0 - - 0 -
0.9% 1 100.0% 0.9% 1 100.0% 0.9% 2 100.0% 0.9% 1 100.0% 0.9% 1 100.0% 0.9% 2 100.0%
0.0% 0 40.0% 0.0% 0 42.0% 0.0% 0 42.7% 0.0% 0 40.0% 0.0% 0 42.0% 0.0% 0 42.7%
0.0% 214 38.2% 0.0% 224 29.8% 0.0% 233 25.8% 0.0% 222 32.4% 0.0% 240 25.5% 0.0% 260 23.2%
Impairment
rate
Stock of
Provisions
Coverage Ratio -
Default Stock1
Impairment
rate
Stock of
Provisions
Coverage Ratio -
Default Stock1
Impairment
rate
Stock of
Provisions
Coverage Ratio -
Default Stock1
Impairment
rate
Stock of
Provisions
Coverage Ratio -
Default Stock1
Impairment
rate
Stock of
Provisions
Coverage Ratio -
Default Stock1
Impairment
rate
Stock of
Provisions
Coverage Ratio -
Default Stock1
0.0% 0 52.1% 0.0% 0 54.8% 0.0% 0 55.8% 0.0% 0 57.6% 0.0% 0 60.5% 0.0% 0 61.4%
0.1% 5 49.6% 0.1% 11 52.3% 0.1% 17 53.2% 0.1% 7 55.7% 0.1% 15 58.5% 0.1% 22 59.6%
0.0% 0 - 0.0% 0 19.4% 0.0% 0 20.0% 0.0% 0 - 0.0% 0 22.3% 0.0% 0 23.6%
- 0 - - 0 - - 0 - - 0 - - 0 - - 0 -
- 0 - - 0 - - 0 - - 0 - - 0 - - 0 -
0.0% 1 27.5% 0.0% 1 29.0% 0.0% 1 29.7% 0.0% 1 37.8% 0.0% 2 39.5% 0.0% 2 40.1%
0.0% 9 1.5% 0.0% 11 1.7% 0.0% 11 1.4% 0.0% 9 1.1% 0.0% 12 1.3% 0.0% 12 1.2%
0.2% 0 43.2% 0.2% 1 48.2% 0.2% 1 49.6% 0.3% 0 49.5% 0.3% 1 54.7% 0.3% 1 56.1%
0.2% 40 52.9% 0.2% 40 53.1% 0.3% 41 53.2% 0.3% 44 59.6% 0.3% 45 59.6% 0.3% 45 59.6%
0.3% 0 45.3% 0.3% 0 45.7% 0.3% 0 46.0% 0.3% 0 50.9% 0.3% 0 51.3% 0.3% 0 51.6%
0.0% 1 6.6% 0.0% 1 8.5% 0.0% 2 9.0% 0.0% 1 7.4% 0.1% 2 10.1% 0.1% 3 11.4%
0.0% 0 8.4% 0.1% 0 10.5% 0.1% 0 11.0% 0.1% 0 9.5% 0.1% 0 12.4% 0.1% 0 13.7%
0.1% 0 100.0% 0.1% 0 100.0% 0.1% 0 100.0% 0.1% 0 100.0% 0.1% 0 100.0% 0.1% 0 100.0%
- 0 - - 0 - - 0 - - 0 - - 0 - - 0 -
- 0 - - 0 - - 0 - - 0 - - 0 - - 0 -
- 0 - - 0 - - 0 - - 0 - - 0 - - 0 -
0.6% 0 65.0% 0.6% 1 68.3% 0.6% 1 69.4% 0.6% 0 65.0% 0.6% 1 68.3% 0.6% 1 69.4%
0.0% 0 40.0% 0.0% 0 42.0% 0.0% 0 42.7% 0.0% 0 40.0% 0.0% 0 42.0% 0.0% 0 42.7%0.0% 55 16.6% 0.0% 65 12.9% 0.0% 73 11.4% 0.0% 62 13.7% 0.0% 75 11.0% 0.0% 86 10.1%
Impairment
rate
Stock of
Provisions
Coverage Ratio -
Default Stock1
Impairment
rate
Stock of
Provisions
Coverage Ratio -
Default Stock1
Impairment
rate
Stock of
Provisions
Coverage Ratio -
Default Stock1
Impairment
rate
Stock of
Provisions
Coverage Ratio -
Default Stock1
Impairment
rate
Stock of
Provisions
Coverage Ratio -
Default Stock1
Impairment
rate
Stock of
Provisions
Coverage Ratio -
Default Stock1
- 0 - - 0 - - 0 - - 0 - - 0 - - 0 -
- 0 - - 0 - - 0 - - 0 - - 0 - - 0 -
0.0% 8 84.6% 0.0% 8 89.5% 0.0% 9 90.1% 0.1% 9 94.6% 0.1% 10 96.3% 0.0% 10 97.6%
- 0 - - 0 - - 0 - - 0 - - 0 - - 0 -
- 0 - - 0 - - 0 - - 0 - - 0 - - 0 -
0.1% 0 39.5% 0.1% 0 41.7% 0.1% 0 42.5% 0.1% 0 45.2% 0.1% 0 47.4% 0.1% 0 48.3%
0.1% 116 71.0% 0.1% 116 70.8% 0.1% 116 70.7% 0.2% 116 70.9% 0.2% 116 70.8% 0.2% 117 70.7%
- 0 - - 0 - - 0 - - 0 - - 0 - - 0 -
0.2% 0 43.5% 0.2% 0 43.6% 0.2% 0 43.8% 0.2% 0 49.7% 0.2% 0 49.7% 0.2% 0 49.7%
- 0 43.5% - 0 43.7% - 0 43.8% - 0 49.7% - 0 49.7% - 0 49.7%
0.0% 0 0.0% 0.0% 0 1.2% 0.0% 0 1.5% 0.0% 0 0.0% 0.0% 0 1.9% 0.0% 0 3.0%
- 0 - - 0 - - 0 - - 0 - - 0 - - 0 -
0.1% 0 100.0% 0.1% 0 100.0% 0.1% 0 100.0% 0.1% 0 100.0% 0.1% 0 100.0% 0.1% 0 100.0%
- 0 - - 0 - - 0 - - 0 - - 0 - - 0 -
- 0 - - 0 - - 0 - - 0 - - 0 - - 0 -
- 0 - - 0 - - 0 - - 0 - - 0 - - 0 -
0.9% 0 100.0% 0.9% 0 100.0% 0.9% 0 100.0% 0.9% 0 100.0% 0.9% 0 100.0% 0.9% 0 100.0%
- 0 - - 0 - - 0 - - 0 - - 0 - - 0 -
0.1% 125 71.0% 0.0% 125 70.9% 0.0% 126 70.8% 0.1% 125 71.0% 0.1% 127 71.1% 0.1% 127 71.1%
31/12/2018
31/12/2016 31/12/2017 31/12/2018
Baseline Scenario Adverse Scenario
31/12/2016 31/12/2017 31/12/2018 31/12/2016 31/12/2017
Baseline Scenario Adverse Scenario
Baseline Scenario Adverse Scenario
31/12/2016 31/12/2017 31/12/2018
31/12/2018 31/12/2016 31/12/2017 31/12/201831/12/2016 31/12/2017

2016 EU-wide Stress Test:
Credit risk STALandesbank Hessen-Thüringen Girozentrale
Central governments or central banks
Regional governments or local authorities
Public sector entities
Multilateral Development Banks
International Organisations
Institutions
Corporates
of which: SME
Retail
of which: SME
Secured by mortgages on immovable property
of which: SME
Items associated with particularly high risk
Covered bonds
Claims on institutions and corporates with a ST credit assessment
Collective investments undertakings (CIU)
Equity
Securitisation
Other exposures
Standardised Total1 Computed as: Stock of provisions for defaulted stock / default stock (as defined in paragraphs 59 and 61 of the Methodological note)
Central governments or central banks
Regional governments or local authorities
Public sector entities
Multilateral Development Banks
International Organisations
Institutions
Corporates
of which: SME
Retail
of which: SME
Secured by mortgages on immovable property
of which: SME
Items associated with particularly high risk
Covered bonds
Claims on institutions and corporates with a ST credit assessment
Collective investments undertakings (CIU)
Equity
Securitisation
Other exposures
Standardised Total1 Computed as: Stock of provisions for defaulted stock / default stock (as defined in paragraphs 59 and 61 of the Methodological note)
Central governments or central banks
Regional governments or local authorities
Public sector entities
Multilateral Development Banks
International Organisations
Institutions
Corporates
of which: SME
Retail
of which: SME
Secured by mortgages on immovable property
of which: SME
Items associated with particularly high risk
Covered bonds
Claims on institutions and corporates with a ST credit assessment
Collective investments undertakings (CIU)
Equity
Securitisation
Other exposures
Standardised Total1 Computed as: Stock of provisions for defaulted stock / default stock (as defined in paragraphs 59 and 61 of the Methodological note)
France
United Kingdom
Netherlands
Impairment
rate
Stock of
Provisions
Coverage Ratio -
Default Stock1
Impairment
rate
Stock of
Provisions
Coverage Ratio -
Default Stock1
Impairment
rate
Stock of
Provisions
Coverage Ratio -
Default Stock1
Impairment
rate
Stock of
Provisions
Coverage Ratio -
Default Stock1
Impairment
rate
Stock of
Provisions
Coverage Ratio -
Default Stock1
Impairment
rate
Stock of
Provisions
Coverage Ratio -
Default Stock1
- 0 - - 0 - - 0 - - 0 - - 0 - - 0 -
- 0 - - 0 - - 0 - - 0 - - 0 - - 0 -
- 0 - - 0 - - 0 - - 0 - - 0 - - 0 -
- 0 - - 0 - - 0 - - 0 - - 0 - - 0 -
- 0 - - 0 - - 0 - - 0 - - 0 - - 0 -
- 0 - - 0 - - 0 - - 0 - - 0 - - 0 -
- 0 - - 0 - - 0 - - 0 - - 0 - - 0 -
- 0 - - 0 - - 0 - - 0 - - 0 - - 0 -
- 0 49.6% - 0 49.8% - 0 49.9% - 0 54.6% - 0 54.6% - 0 54.6%
- 0 - - 0 - - 0 - - 0 - - 0 - - 0 -
0.1% 0 17.2% 0.1% 0 19.0% 0.1% 0 19.5% 0.1% 0 18.9% 0.1% 0 21.1% 0.1% 0 22.2%
- 0 - - 0 - - 0 - - 0 - - 0 - - 0 -
- 0 - - 0 - - 0 - - 0 - - 0 - - 0 -
- 0 - - 0 - - 0 - - 0 - - 0 - - 0 -
- 0 - - 0 - - 0 - - 0 - - 0 - - 0 -
- 0 - - 0 - - 0 - - 0 - - 0 - - 0 -
- 0 - - 0 - - 0 - - 0 - - 0 - - 0 -
- 0 - - 0 - - 0 - - 0 - - 0 - - 0 -
0.1% 0 49.4% 0.1% 0 49.2% 0.1% 0 49.1% 0.1% 0 54.3% 0.1% 0 54.0% 0.1% 0 53.8%
Impairment
rate
Stock of
Provisions
Coverage Ratio -
Default Stock1
Impairment
rate
Stock of
Provisions
Coverage Ratio -
Default Stock1
Impairment
rate
Stock of
Provisions
Coverage Ratio -
Default Stock1
Impairment
rate
Stock of
Provisions
Coverage Ratio -
Default Stock1
Impairment
rate
Stock of
Provisions
Coverage Ratio -
Default Stock1
Impairment
rate
Stock of
Provisions
Coverage Ratio -
Default Stock1
- 0 - - 0 - - 0 - - 0 - - 0 - - 0 -
- 0 - - 0 - - 0 - - 0 - - 0 - - 0 -
- 0 - - 0 - - 0 - - 0 - - 0 - - 0 -
- 0 - - 0 - - 0 - - 0 - - 0 - - 0 -
- 0 - - 0 - - 0 - - 0 - - 0 - - 0 -
0.0% 0 45.2% 0.0% 0 47.6% 0.0% 0 48.5% 0.1% 0 50.5% 0.1% 0 53.1% 0.1% 0 53.9%
0.1% 8 90.9% 0.1% 8 89.0% 0.1% 8 87.1% 0.2% 8 90.7% 0.2% 8 88.5% 0.2% 8 86.8%
- 0 - - 0 - - 0 - - 0 - - 0 - - 0 -
0.2% 0 32.8% 0.2% 0 33.2% 0.2% 0 33.4% 0.2% 0 37.5% 0.2% 0 38.0% 0.2% 0 38.2%
- 0 - - 0 - - 0 - - 0 - - 0 - - 0 -
0.1% 0 11.6% 0.1% 0 13.1% 0.1% 0 13.6% 0.1% 0 13.2% 0.1% 0 15.2% 0.1% 0 16.2%
- 0 - - 0 - - 0 - - 0 - - 0 - - 0 -
- 0 - - 0 - - 0 - - 0 - - 0 - - 0 -
- 0 - - 0 - - 0 - - 0 - - 0 - - 0 -
- 0 - - 0 - - 0 - - 0 - - 0 - - 0 -
- 0 - - 0 - - 0 - - 0 - - 0 - - 0 -
1.6% 0 100.0% 1.6% 0 100.0% 1.6% 0 100.0% 2.0% 0 100.0% 2.0% 0 100.0% 1.7% 0 100.0%
- 0 - - 0 - - 0 - - 0 - - 0 - - 0 -
0.1% 8 88.3% 0.1% 8 86.5% 0.1% 8 84.8% 0.2% 8 88.3% 0.2% 8 86.3% 0.2% 9 84.7%
Impairment
rate
Stock of
Provisions
Coverage Ratio -
Default Stock1
Impairment
rate
Stock of
Provisions
Coverage Ratio -
Default Stock1
Impairment
rate
Stock of
Provisions
Coverage Ratio -
Default Stock1
Impairment
rate
Stock of
Provisions
Coverage Ratio -
Default Stock1
Impairment
rate
Stock of
Provisions
Coverage Ratio -
Default Stock1
Impairment
rate
Stock of
Provisions
Coverage Ratio -
Default Stock1
- 0 - - 0 - - 0 - - 0 - - 0 - - 0 -
- 0 - - 0 - - 0 - - 0 - - 0 - - 0 -
- 0 - - 0 - - 0 - - 0 - - 0 - - 0 -
- 0 - - 0 - - 0 - - 0 - - 0 - - 0 -
- 0 - - 0 - - 0 - - 0 - - 0 - - 0 -
0.0% 0 40.2% 0.0% 0 42.4% 0.0% 0 43.2% 0.1% 0 45.7% 0.1% 0 48.0% 0.1% 0 48.8%
0.0% 9 5.6% 0.0% 9 3.8% 0.0% 9 3.5% 0.0% 9 5.8% 0.0% 9 7.0% 0.0% 9 7.2%
- 0 - - 0 - - 0 - - 0 - - 0 - - 0 -
- 0 47.6% - 0 47.7% - 0 47.8% - 0 53.0% - 0 53.0% - 0 53.0%
- 0 - - 0 - - 0 - - 0 - - 0 - - 0 -
0.0% 0 4.6% 0.0% 0 6.0% 0.0% 0 6.4% 0.0% 0 5.1% 0.0% 0 7.2% 0.0% 0 8.3%
- 0 - - 0 - - 0 - - 0 - - 0 - - 0 -
- 0 - - 0 - - 0 - - 0 - - 0 - - 0 -
- 0 - - 0 - - 0 - - 0 - - 0 - - 0 -
- 0 - - 0 - - 0 - - 0 - - 0 - - 0 -
- 0 - - 0 - - 0 - - 0 - - 0 - - 0 -
1.6% 0 100.0% 1.6% 0 100.0% 1.6% 0 100.0% 2.0% 0 100.0% 2.0% 0 100.0% 1.7% 0 100.0%
- 0 - - 0 - - 0 - - 0 - - 0 - - 0 -
0.0% 9 10.2% 0.0% 9 7.9% 0.0% 10 7.5% 0.0% 9 11.7% 0.0% 10 12.2% 0.0% 10 12.4%
Baseline Scenario Adverse Scenario
31/12/2018 31/12/2016 31/12/2017 31/12/2018
Baseline Scenario Adverse Scenario
31/12/2016 31/12/2017
31/12/2018 31/12/2016 31/12/2017 31/12/2018
Baseline Scenario Adverse Scenario
31/12/2016 31/12/2017
31/12/2018 31/12/2016 31/12/2017 31/12/201831/12/2016 31/12/2017

2016 EU-wide Stress Test:
Credit risk STALandesbank Hessen-Thüringen Girozentrale
Central governments or central banks
Regional governments or local authorities
Public sector entities
Multilateral Development Banks
International Organisations
Institutions
Corporates
of which: SME
Retail
of which: SME
Secured by mortgages on immovable property
of which: SME
Items associated with particularly high risk
Covered bonds
Claims on institutions and corporates with a ST credit assessment
Collective investments undertakings (CIU)
Equity
Securitisation
Other exposures
Standardised Total1 Computed as: Stock of provisions for defaulted stock / default stock (as defined in paragraphs 59 and 61 of the Methodological note)
Central governments or central banks
Regional governments or local authorities
Public sector entities
Multilateral Development Banks
International Organisations
Institutions
Corporates
of which: SME
Retail
of which: SME
Secured by mortgages on immovable property
of which: SME
Items associated with particularly high risk
Covered bonds
Claims on institutions and corporates with a ST credit assessment
Collective investments undertakings (CIU)
Equity
Securitisation
Other exposures
Standardised Total1 Computed as: Stock of provisions for defaulted stock / default stock (as defined in paragraphs 59 and 61 of the Methodological note)
Central governments or central banks
Regional governments or local authorities
Public sector entities
Multilateral Development Banks
International Organisations
Institutions
Corporates
of which: SME
Retail
of which: SME
Secured by mortgages on immovable property
of which: SME
Items associated with particularly high risk
Covered bonds
Claims on institutions and corporates with a ST credit assessment
Collective investments undertakings (CIU)
Equity
Securitisation
Other exposures
Standardised Total1 Computed as: Stock of provisions for defaulted stock / default stock (as defined in paragraphs 59 and 61 of the Methodological note)
Luxembourg
Switzerland
Spain
Impairment
rate
Stock of
Provisions
Coverage Ratio -
Default Stock1
Impairment
rate
Stock of
Provisions
Coverage Ratio -
Default Stock1
Impairment
rate
Stock of
Provisions
Coverage Ratio -
Default Stock1
Impairment
rate
Stock of
Provisions
Coverage Ratio -
Default Stock1
Impairment
rate
Stock of
Provisions
Coverage Ratio -
Default Stock1
Impairment
rate
Stock of
Provisions
Coverage Ratio -
Default Stock1
- 0 - - 0 - - 0 - - 0 - - 0 - - 0 -
- 0 - - 0 - - 0 - - 0 - - 0 - - 0 -
- 0 - - 0 - - 0 - - 0 - - 0 - - 0 -
- 0 - - 0 - - 0 - - 0 - - 0 - - 0 -
- 0 - - 0 - - 0 - - 0 - - 0 - - 0 -
0.1% 0 46.5% 0.1% 0 49.0% 0.1% 0 49.8% 0.1% 0 50.8% 0.1% 0 53.3% 0.1% 0 54.3%
0.2% 0 26.3% 0.2% 0 25.1% 0.2% 0 25.4% 0.2% 0 26.3% 0.2% 0 25.1% 0.2% 0 25.4%
- 0 - - 0 - - 0 - - 0 - - 0 - - 0 -
- 0 - - 0 - - 0 - - 0 - - 0 - - 0 -
- 0 - - 0 - - 0 - - 0 - - 0 - - 0 -
0.0% 0 0.0% 0.0% 0 1.5% 0.0% 0 1.8% 0.0% 0 0.0% 0.0% 0 2.1% 0.0% 0 3.3%
- 0 - - 0 - - 0 - - 0 - - 0 - - 0 -
0.1% 0 100.0% 0.1% 0 100.0% 0.1% 0 100.0% 0.1% 0 100.0% 0.1% 0 100.0% 0.1% 0 100.0%
- 0 - - 0 - - 0 - - 0 - - 0 - - 0 -
- 0 - - 0 - - 0 - - 0 - - 0 - - 0 -
- 0 - - 0 - - 0 - - 0 - - 0 - - 0 -
- 0 - - 0 - - 0 - - 0 - - 0 - - 0 -
- 0 - - 0 - - 0 - - 0 - - 0 - - 0 -
0.2% 0 27.0% 0.2% 0 25.8% 0.2% 0 26.1% 0.2% 0 27.2% 0.2% 0 26.0% 0.2% 0 26.3%
Impairment
rate
Stock of
Provisions
Coverage Ratio -
Default Stock1
Impairment
rate
Stock of
Provisions
Coverage Ratio -
Default Stock1
Impairment
rate
Stock of
Provisions
Coverage Ratio -
Default Stock1
Impairment
rate
Stock of
Provisions
Coverage Ratio -
Default Stock1
Impairment
rate
Stock of
Provisions
Coverage Ratio -
Default Stock1
Impairment
rate
Stock of
Provisions
Coverage Ratio -
Default Stock1
- 0 - - 0 - - 0 - - 0 - - 0 - - 0 -
- 0 - - 0 - - 0 - - 0 - - 0 - - 0 -
- 0 - - 0 - - 0 - - 0 - - 0 - - 0 -
- 0 - - 0 - - 0 - - 0 - - 0 - - 0 -
- 0 - - 0 - - 0 - - 0 - - 0 - - 0 -
- 0 - - 0 - - 0 - - 0 - - 0 - - 0 -
- 0 - - 0 - - 0 - - 0 - - 0 - - 0 -
- 0 - - 0 - - 0 - - 0 - - 0 - - 0 -
0.2% 0 35.2% 0.2% 0 35.7% 0.2% 0 35.9% 0.2% 0 39.9% 0.2% 0 40.4% 0.2% 0 40.6%
- 0 - - 0 - - 0 - - 0 - - 0 - - 0 -
0.0% 0 4.1% 0.0% 0 5.5% 0.0% 0 5.8% 0.0% 0 4.7% 0.0% 0 6.6% 0.0% 0 7.7%
- 0 - - 0 - - 0 - - 0 - - 0 - - 0 -
- 0 - - 0 - - 0 - - 0 - - 0 - - 0 -
- 0 - - 0 - - 0 - - 0 - - 0 - - 0 -
- 0 - - 0 - - 0 - - 0 - - 0 - - 0 -
- 0 - - 0 - - 0 - - 0 - - 0 - - 0 -
- 0 - - 0 - - 0 - - 0 - - 0 - - 0 -
- 0 - - 0 - - 0 - - 0 - - 0 - - 0 -
0.1% 0 35.1% 0.1% 0 35.5% 0.1% 0 35.6% 0.1% 0 39.8% 0.1% 0 40.1% 0.2% 0 40.3%
Impairment
rate
Stock of
Provisions
Coverage Ratio -
Default Stock1
Impairment
rate
Stock of
Provisions
Coverage Ratio -
Default Stock1
Impairment
rate
Stock of
Provisions
Coverage Ratio -
Default Stock1
Impairment
rate
Stock of
Provisions
Coverage Ratio -
Default Stock1
Impairment
rate
Stock of
Provisions
Coverage Ratio -
Default Stock1
Impairment
rate
Stock of
Provisions
Coverage Ratio -
Default Stock1
- 0 - - 0 - - 0 - - 0 - - 0 - - 0 -
- 0 - - 0 - - 0 - - 0 - - 0 - - 0 -
- 0 - - 0 - - 0 - - 0 - - 0 - - 0 -
- 0 - - 0 - - 0 - - 0 - - 0 - - 0 -
- 0 - - 0 - - 0 - - 0 - - 0 - - 0 -
0.1% 0 47.3% 0.1% 0 49.8% 0.1% 0 50.7% 0.1% 0 51.4% 0.1% 0 53.9% 0.1% 0 55.0%
- 0 - - 0 - - 0 - - 0 - - 0 - - 0 -
- 0 - - 0 - - 0 - - 0 - - 0 - - 0 -
- 0 52.1% - 0 52.2% - 0 52.3% - 0 56.5% - 0 56.5% - 0 56.5%
- 0 - - 0 - - 0 - - 0 - - 0 - - 0 -
- 0 - - 0 - - 0 - - 0 - - 0 - - 0 -
- 0 - - 0 - - 0 - - 0 - - 0 - - 0 -
- 0 - - 0 - - 0 - - 0 - - 0 - - 0 -
- 0 - - 0 - - 0 - - 0 - - 0 - - 0 -
- 0 - - 0 - - 0 - - 0 - - 0 - - 0 -
- 0 - - 0 - - 0 - - 0 - - 0 - - 0 -
- 0 - - 0 - - 0 - - 0 - - 0 - - 0 -
- 0 - - 0 - - 0 - - 0 - - 0 - - 0 -
0.1% 0 51.2% 0.1% 0 51.4% 0.1% 0 51.6% 0.1% 0 55.4% 0.1% 0 55.6% 0.1% 0 55.8%
Baseline Scenario Adverse Scenario
31/12/2018 31/12/2016 31/12/2017 31/12/2018
Baseline Scenario Adverse Scenario
31/12/2016 31/12/2017
31/12/2018 31/12/2016 31/12/2017 31/12/2018
Baseline Scenario Adverse Scenario
31/12/2016 31/12/2017
31/12/2018 31/12/2016 31/12/2017 31/12/201831/12/2016 31/12/2017

2016 EU-wide Stress Test:
Credit risk STALandesbank Hessen-Thüringen Girozentrale
Central governments or central banks
Regional governments or local authorities
Public sector entities
Multilateral Development Banks
International Organisations
Institutions
Corporates
of which: SME
Retail
of which: SME
Secured by mortgages on immovable property
of which: SME
Items associated with particularly high risk
Covered bonds
Claims on institutions and corporates with a ST credit assessment
Collective investments undertakings (CIU)
Equity
Securitisation
Other exposures
Standardised Total1 Computed as: Stock of provisions for defaulted stock / default stock (as defined in paragraphs 59 and 61 of the Methodological note)
Central governments or central banks
Regional governments or local authorities
Public sector entities
Multilateral Development Banks
International Organisations
Institutions
Corporates
of which: SME
Retail
of which: SME
Secured by mortgages on immovable property
of which: SME
Items associated with particularly high risk
Covered bonds
Claims on institutions and corporates with a ST credit assessment
Collective investments undertakings (CIU)
Equity
Securitisation
Other exposures
Standardised Total1 Computed as: Stock of provisions for defaulted stock / default stock (as defined in paragraphs 59 and 61 of the Methodological note)
Canada
Austria
Impairment
rate
Stock of
Provisions
Coverage Ratio -
Default Stock1
Impairment
rate
Stock of
Provisions
Coverage Ratio -
Default Stock1
Impairment
rate
Stock of
Provisions
Coverage Ratio -
Default Stock1
Impairment
rate
Stock of
Provisions
Coverage Ratio -
Default Stock1
Impairment
rate
Stock of
Provisions
Coverage Ratio -
Default Stock1
Impairment
rate
Stock of
Provisions
Coverage Ratio -
Default Stock1
- 0 - - 0 - - 0 - - 0 - - 0 - - 0 -
- 0 - - 0 - - 0 - - 0 - - 0 - - 0 -
- 0 - - 0 - - 0 - - 0 - - 0 - - 0 -
- 0 - - 0 - - 0 - - 0 - - 0 - - 0 -
- 0 - - 0 - - 0 - - 0 - - 0 - - 0 -
- 0 - - 0 - - 0 - - 0 - - 0 - - 0 -
- 0 - - 0 - - 0 - - 0 - - 0 - - 0 -
- 0 - - 0 - - 0 - - 0 - - 0 - - 0 -
- 0 - - 0 - - 0 - - 0 - - 0 - - 0 -
- 0 - - 0 - - 0 - - 0 - - 0 - - 0 -
- 0 - - 0 - - 0 - - 0 - - 0 - - 0 -
- 0 - - 0 - - 0 - - 0 - - 0 - - 0 -
- 0 - - 0 - - 0 - - 0 - - 0 - - 0 -
- 0 - - 0 - - 0 - - 0 - - 0 - - 0 -
- 0 - - 0 - - 0 - - 0 - - 0 - - 0 -
- 0 - - 0 - - 0 - - 0 - - 0 - - 0 -
- 0 - - 0 - - 0 - - 0 - - 0 - - 0 -
- 0 - - 0 - - 0 - - 0 - - 0 - - 0 -
- 0 - - 0 - - 0 - - 0 - - 0 - - 0 -
Impairment
rate
Stock of
Provisions
Coverage Ratio -
Default Stock1
Impairment
rate
Stock of
Provisions
Coverage Ratio -
Default Stock1
Impairment
rate
Stock of
Provisions
Coverage Ratio -
Default Stock1
Impairment
rate
Stock of
Provisions
Coverage Ratio -
Default Stock1
Impairment
rate
Stock of
Provisions
Coverage Ratio -
Default Stock1
Impairment
rate
Stock of
Provisions
Coverage Ratio -
Default Stock1
- 0 - - 0 - - 0 - - 0 - - 0 - - 0 -
- 0 - - 0 - - 0 - - 0 - - 0 - - 0 -
- 0 - - 0 - - 0 - - 0 - - 0 - - 0 -
- 0 - - 0 - - 0 - - 0 - - 0 - - 0 -
- 0 - - 0 - - 0 - - 0 - - 0 - - 0 -
- 0 - - 0 - - 0 - - 0 - - 0 - - 0 -
0.0% 0 0.0% 0.0% 0 0.0% 0.0% 0 0.0% 0.0% 0 0.0% 0.0% 0 0.0% 0.0% 0 0.0%
- 0 - - 0 - - 0 - - 0 - - 0 - - 0 -
0.2% 0 46.3% 0.2% 0 46.4% 0.2% 0 46.5% 0.3% 0 51.9% 0.3% 0 51.9% 0.3% 0 51.9%
- 0 - - 0 - - 0 - - 0 - - 0 - - 0 -
0.0% 0 0.0% 0.0% 0 1.4% 0.0% 0 1.7% 0.0% 0 0.0% 0.0% 0 2.0% 0.0% 0 3.2%
- 0 - - 0 - - 0 - - 0 - - 0 - - 0 -
- 0 - - 0 - - 0 - - 0 - - 0 - - 0 -
- 0 - - 0 - - 0 - - 0 - - 0 - - 0 -
- 0 - - 0 - - 0 - - 0 - - 0 - - 0 -
- 0 - - 0 - - 0 - - 0 - - 0 - - 0 -
- 0 - - 0 - - 0 - - 0 - - 0 - - 0 -
- 0 - - 0 - - 0 - - 0 - - 0 - - 0 -
0.0% 0 1.9% 0.0% 0 1.2% 0.0% 0 1.0% 0.0% 0 1.7% 0.0% 0 1.1% 0.0% 0 1.0%
Baseline Scenario Adverse Scenario
31/12/2018 31/12/2016 31/12/2017 31/12/2018
Baseline Scenario Adverse Scenario
31/12/2016 31/12/2017
31/12/2018 31/12/2016 31/12/2017 31/12/201831/12/2016 31/12/2017

(mln EUR) 31/12/2016 31/12/2017 31/12/2018 31/12/2016 31/12/2017 31/12/2018
STA 1,406IRB 5,339Total 6,744
STA 1,160 1,372 1,390 1,403 1,720 2,063 2,328IRB 2,142 2,243 2,219 2,241 2,589 2,700 2,599Total 3,302 3,616 3,608 3,644 4,309 4,764 4,927
Impairments Total banking book others than assessed at fair value 49 4 0 0 6 1 0
2016 EU-wide Stress Test: SecuritisationsLandesbank Hessen-Thüringen Girozentrale
Risk exposure amounts
31/12/2015Baseline Scenario Adverse Scenario
Exposure values
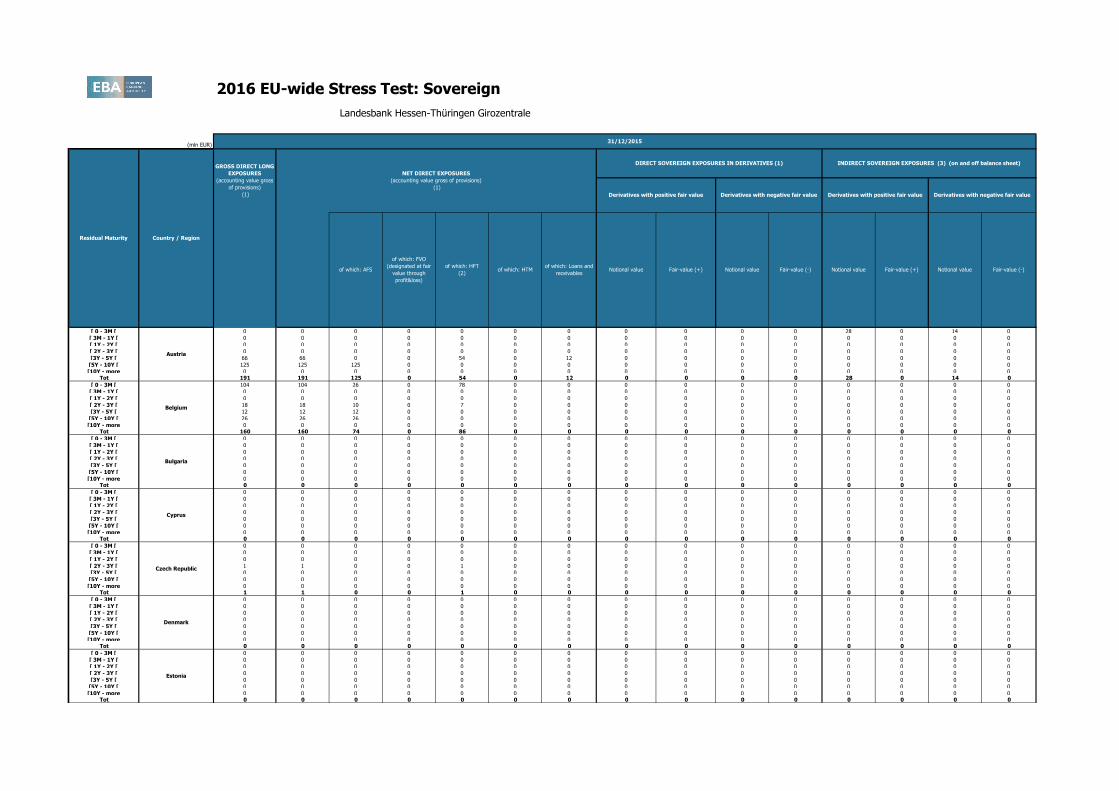
2016 EU-wide Stress Test: Sovereign
(mln EUR)
[ 0 - 3M [ 0 0 0 0 0 0 0 0 0 0 0 28 0 14 0
[ 3M - 1Y [ 0 0 0 0 0 0 0 0 0 0 0 0 0 0 0
[ 1Y - 2Y [ 0 0 0 0 0 0 0 0 0 0 0 0 0 0 0
[ 2Y - 3Y [ 0 0 0 0 0 0 0 0 0 0 0 0 0 0 0
[3Y - 5Y [ 66 66 0 0 54 0 12 0 0 0 0 0 0 0 0
[5Y - 10Y [ 125 125 125 0 0 0 0 0 0 0 0 0 0 0 0
[10Y - more 0 0 0 0 0 0 0 0 0 0 0 0 0 0 0Tot 191 191 125 0 54 0 12 0 0 0 0 28 0 14 0
[ 0 - 3M [ 104 104 26 0 78 0 0 0 0 0 0 0 0 0 0
[ 3M - 1Y [ 0 0 0 0 0 0 0 0 0 0 0 0 0 0 0
[ 1Y - 2Y [ 0 0 0 0 0 0 0 0 0 0 0 0 0 0 0
[ 2Y - 3Y [ 18 18 10 0 7 0 0 0 0 0 0 0 0 0 0
[3Y - 5Y [ 12 12 12 0 0 0 0 0 0 0 0 0 0 0 0
[5Y - 10Y [ 26 26 26 0 0 0 0 0 0 0 0 0 0 0 0
[10Y - more 0 0 0 0 0 0 0 0 0 0 0 0 0 0 0Tot 160 160 74 0 86 0 0 0 0 0 0 0 0 0 0
[ 0 - 3M [ 0 0 0 0 0 0 0 0 0 0 0 0 0 0 0
[ 3M - 1Y [ 0 0 0 0 0 0 0 0 0 0 0 0 0 0 0
[ 1Y - 2Y [ 0 0 0 0 0 0 0 0 0 0 0 0 0 0 0
[ 2Y - 3Y [ 0 0 0 0 0 0 0 0 0 0 0 0 0 0 0
[3Y - 5Y [ 0 0 0 0 0 0 0 0 0 0 0 0 0 0 0
[5Y - 10Y [ 0 0 0 0 0 0 0 0 0 0 0 0 0 0 0
[10Y - more 0 0 0 0 0 0 0 0 0 0 0 0 0 0 0Tot 0 0 0 0 0 0 0 0 0 0 0 0 0 0 0
[ 0 - 3M [ 0 0 0 0 0 0 0 0 0 0 0 0 0 0 0
[ 3M - 1Y [ 0 0 0 0 0 0 0 0 0 0 0 0 0 0 0
[ 1Y - 2Y [ 0 0 0 0 0 0 0 0 0 0 0 0 0 0 0
[ 2Y - 3Y [ 1 1 0 0 1 0 0 0 0 0 0 0 0 0 0
[3Y - 5Y [ 0 0 0 0 0 0 0 0 0 0 0 0 0 0 0
[5Y - 10Y [ 0 0 0 0 0 0 0 0 0 0 0 0 0 0 0
[10Y - more 0 0 0 0 0 0 0 0 0 0 0 0 0 0 0Tot 1 1 0 0 1 0 0 0 0 0 0 0 0 0 0
[ 0 - 3M [ 0 0 0 0 0 0 0 0 0 0 0 0 0 0 0
[ 3M - 1Y [ 0 0 0 0 0 0 0 0 0 0 0 0 0 0 0
[ 1Y - 2Y [ 0 0 0 0 0 0 0 0 0 0 0 0 0 0 0
[ 2Y - 3Y [ 0 0 0 0 0 0 0 0 0 0 0 0 0 0 0
[3Y - 5Y [ 0 0 0 0 0 0 0 0 0 0 0 0 0 0 0
[5Y - 10Y [ 0 0 0 0 0 0 0 0 0 0 0 0 0 0 0
[10Y - more 0 0 0 0 0 0 0 0 0 0 0 0 0 0 0Tot 0 0 0 0 0 0 0 0 0 0 0 0 0 0 0
[ 0 - 3M [ 0 0 0 0 0 0 0 0 0 0 0 0 0 0 0
[ 3M - 1Y [ 0 0 0 0 0 0 0 0 0 0 0 0 0 0 0
[ 1Y - 2Y [ 0 0 0 0 0 0 0 0 0 0 0 0 0 0 0
[ 2Y - 3Y [ 0 0 0 0 0 0 0 0 0 0 0 0 0 0 0
[3Y - 5Y [ 0 0 0 0 0 0 0 0 0 0 0 0 0 0 0
[5Y - 10Y [ 0 0 0 0 0 0 0 0 0 0 0 0 0 0 0
[10Y - more 0 0 0 0 0 0 0 0 0 0 0 0 0 0 0Tot 0 0 0 0 0 0 0 0 0 0 0 0 0 0 0
Denmark
Estonia
Derivatives with negative fair value
Notional value Fair-value (-)Notional value
Cyprus
Czech Republic
of which: Loans and
receivablesof which: AFS
of which: FVO
(designated at fair
value through
profit&loss)
of which: HFT
(2)of which: HTM
Austria
Belgium
Bulgaria
Landesbank Hessen-Thüringen Girozentrale
31/12/2015
Residual Maturity Country / Region
GROSS DIRECT LONG
EXPOSURES
(accounting value gross
of provisions)
(1)
NET DIRECT EXPOSURES
(accounting value gross of provisions)
(1)
Notional value Fair-value (+) Fair-value (-) Notional value Fair-value (+)
DIRECT SOVEREIGN EXPOSURES IN DERIVATIVES (1) INDIRECT SOVEREIGN EXPOSURES (3) (on and off balance sheet)
Derivatives with positive fair value Derivatives with negative fair value Derivatives with positive fair value
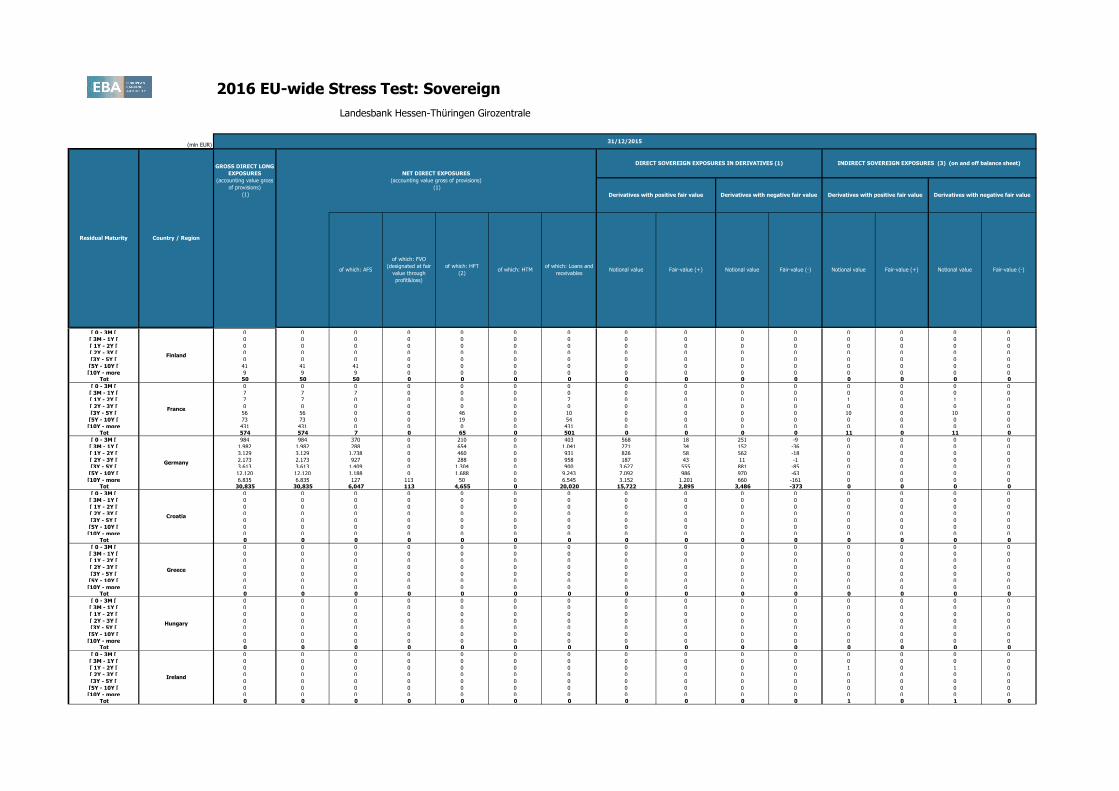
2016 EU-wide Stress Test: Sovereign
(mln EUR)
Derivatives with negative fair value
Notional value Fair-value (-)Notional valueof which: Loans and
receivablesof which: AFS
of which: FVO
(designated at fair
value through
profit&loss)
of which: HFT
(2)of which: HTM
Austria
Landesbank Hessen-Thüringen Girozentrale
31/12/2015
Residual Maturity Country / Region
GROSS DIRECT LONG
EXPOSURES
(accounting value gross
of provisions)
(1)
NET DIRECT EXPOSURES
(accounting value gross of provisions)
(1)
Notional value Fair-value (+) Fair-value (-) Notional value Fair-value (+)
DIRECT SOVEREIGN EXPOSURES IN DERIVATIVES (1) INDIRECT SOVEREIGN EXPOSURES (3) (on and off balance sheet)
Derivatives with positive fair value Derivatives with negative fair value Derivatives with positive fair value
[ 0 - 3M [ 0 0 0 0 0 0 0 0 0 0 0 0 0 0 0
[ 3M - 1Y [ 0 0 0 0 0 0 0 0 0 0 0 0 0 0 0
[ 1Y - 2Y [ 0 0 0 0 0 0 0 0 0 0 0 0 0 0 0
[ 2Y - 3Y [ 0 0 0 0 0 0 0 0 0 0 0 0 0 0 0
[3Y - 5Y [ 0 0 0 0 0 0 0 0 0 0 0 0 0 0 0
[5Y - 10Y [ 41 41 41 0 0 0 0 0 0 0 0 0 0 0 0
[10Y - more 9 9 9 0 0 0 0 0 0 0 0 0 0 0 0Tot 50 50 50 0 0 0 0 0 0 0 0 0 0 0 0
[ 0 - 3M [ 0 0 0 0 0 0 0 0 0 0 0 0 0 0 0
[ 3M - 1Y [ 7 7 7 0 0 0 0 0 0 0 0 0 0 0 0
[ 1Y - 2Y [ 7 7 0 0 0 0 7 0 0 0 0 1 0 1 0
[ 2Y - 3Y [ 0 0 0 0 0 0 0 0 0 0 0 0 0 0 0
[3Y - 5Y [ 56 56 0 0 46 0 10 0 0 0 0 10 0 10 0
[5Y - 10Y [ 73 73 0 0 19 0 54 0 0 0 0 0 0 0 0
[10Y - more 431 431 0 0 0 0 431 0 0 0 0 0 0 0 0Tot 574 574 7 0 65 0 501 0 0 0 0 11 0 11 0
[ 0 - 3M [ 984 984 370 0 210 0 403 568 18 251 -9 0 0 0 0
[ 3M - 1Y [ 1,982 1,982 288 0 654 0 1,041 271 34 152 -36 0 0 0 0
[ 1Y - 2Y [ 3,129 3,129 1,738 0 460 0 931 826 58 562 -18 0 0 0 0
[ 2Y - 3Y [ 2,173 2,173 927 0 288 0 958 187 43 11 -1 0 0 0 0
[3Y - 5Y [ 3,613 3,613 1,409 0 1,304 0 900 3,627 555 881 -85 0 0 0 0
[5Y - 10Y [ 12,120 12,120 1,188 0 1,688 0 9,243 7,092 986 970 -63 0 0 0 0
[10Y - more 6,835 6,835 127 113 50 0 6,545 3,152 1,201 660 -161 0 0 0 0Tot 30,835 30,835 6,047 113 4,655 0 20,020 15,722 2,895 3,486 -373 0 0 0 0
[ 0 - 3M [ 0 0 0 0 0 0 0 0 0 0 0 0 0 0 0
[ 3M - 1Y [ 0 0 0 0 0 0 0 0 0 0 0 0 0 0 0
[ 1Y - 2Y [ 0 0 0 0 0 0 0 0 0 0 0 0 0 0 0
[ 2Y - 3Y [ 0 0 0 0 0 0 0 0 0 0 0 0 0 0 0
[3Y - 5Y [ 0 0 0 0 0 0 0 0 0 0 0 0 0 0 0
[5Y - 10Y [ 0 0 0 0 0 0 0 0 0 0 0 0 0 0 0
[10Y - more 0 0 0 0 0 0 0 0 0 0 0 0 0 0 0Tot 0 0 0 0 0 0 0 0 0 0 0 0 0 0 0
[ 0 - 3M [ 0 0 0 0 0 0 0 0 0 0 0 0 0 0 0
[ 3M - 1Y [ 0 0 0 0 0 0 0 0 0 0 0 0 0 0 0
[ 1Y - 2Y [ 0 0 0 0 0 0 0 0 0 0 0 1 0 1 0
[ 2Y - 3Y [ 0 0 0 0 0 0 0 0 0 0 0 0 0 0 0
[3Y - 5Y [ 0 0 0 0 0 0 0 0 0 0 0 0 0 0 0
[5Y - 10Y [ 0 0 0 0 0 0 0 0 0 0 0 0 0 0 0
[10Y - more 0 0 0 0 0 0 0 0 0 0 0 0 0 0 0Tot 0 0 0 0 0 0 0 0 0 0 0 1 0 1 0
Ireland
Finland
France
Germany
Croatia
Hungary
Greece

2016 EU-wide Stress Test: Sovereign
(mln EUR)
Derivatives with negative fair value
Notional value Fair-value (-)Notional valueof which: Loans and
receivablesof which: AFS
of which: FVO
(designated at fair
value through
profit&loss)
of which: HFT
(2)of which: HTM
Austria
Landesbank Hessen-Thüringen Girozentrale
31/12/2015
Residual Maturity Country / Region
GROSS DIRECT LONG
EXPOSURES
(accounting value gross
of provisions)
(1)
NET DIRECT EXPOSURES
(accounting value gross of provisions)
(1)
Notional value Fair-value (+) Fair-value (-) Notional value Fair-value (+)
DIRECT SOVEREIGN EXPOSURES IN DERIVATIVES (1) INDIRECT SOVEREIGN EXPOSURES (3) (on and off balance sheet)
Derivatives with positive fair value Derivatives with negative fair value Derivatives with positive fair value
[ 0 - 3M [ 0 0 0 0 0 0 0 0 0 0 0 0 0 0 0
[ 3M - 1Y [ 45 45 45 0 0 0 0 0 0 0 0 73 0 73 0
[ 1Y - 2Y [ 0 0 0 0 0 0 0 0 0 0 0 0 0 0 0
[ 2Y - 3Y [ 1 1 0 0 1 0 0 0 0 0 0 0 0 0 0
[3Y - 5Y [ 0 0 0 0 0 0 0 0 0 0 0 0 0 0 0
[5Y - 10Y [ 0 0 0 0 0 0 0 0 0 0 0 0 0 0 0
[10Y - more 6 6 0 0 6 0 0 0 0 0 0 0 0 0 0Tot 52 52 45 0 7 0 0 0 0 0 0 73 0 73 0
[ 0 - 3M [ 0 0 0 0 0 0 0 0 0 0 0 0 0 0 0
[ 3M - 1Y [ 0 0 0 0 0 0 0 0 0 0 0 0 0 0 0
[ 1Y - 2Y [ 0 0 0 0 0 0 0 0 0 0 0 0 0 0 0
[ 2Y - 3Y [ 0 0 0 0 0 0 0 0 0 0 0 0 0 0 0
[3Y - 5Y [ 0 0 0 0 0 0 0 0 0 0 0 2 0 2 0
[5Y - 10Y [ 1 1 0 0 1 0 0 0 0 0 0 0 0 0 0
[10Y - more 0 0 0 0 0 0 0 0 0 0 0 0 0 0 0Tot 1 1 0 0 1 0 0 0 0 0 0 2 0 2 0
[ 0 - 3M [ 0 0 0 0 0 0 0 0 0 0 0 0 0 0 0
[ 3M - 1Y [ 0 0 0 0 0 0 0 0 0 0 0 0 0 0 0
[ 1Y - 2Y [ 0 0 0 0 0 0 0 0 0 0 0 0 0 0 0
[ 2Y - 3Y [ 0 0 0 0 0 0 0 0 0 0 0 0 0 0 0
[3Y - 5Y [ 0 0 0 0 0 0 0 0 0 0 0 0 0 0 0
[5Y - 10Y [ 0 0 0 0 0 0 0 0 0 0 0 0 0 0 0
[10Y - more 0 0 0 0 0 0 0 0 0 0 0 0 0 0 0Tot 0 0 0 0 0 0 0 0 0 0 0 0 0 0 0
[ 0 - 3M [ 0 0 0 0 0 0 0 0 0 0 0 0 0 0 0
[ 3M - 1Y [ 0 0 0 0 0 0 0 0 0 0 0 0 0 0 0
[ 1Y - 2Y [ 0 0 0 0 0 0 0 0 0 0 0 0 0 0 0
[ 2Y - 3Y [ 0 0 0 0 0 0 0 0 0 0 0 0 0 0 0
[3Y - 5Y [ 0 0 0 0 0 0 0 0 0 0 0 0 0 0 0
[5Y - 10Y [ 63 63 17 0 46 0 0 0 0 0 0 0 0 0 0
[10Y - more 0 0 0 0 0 0 0 0 0 0 0 0 0 0 0Tot 63 63 17 0 46 0 0 0 0 0 0 0 0 0 0
[ 0 - 3M [ 0 0 0 0 0 0 0 0 0 0 0 0 0 0 0
[ 3M - 1Y [ 0 0 0 0 0 0 0 0 0 0 0 0 0 0 0
[ 1Y - 2Y [ 0 0 0 0 0 0 0 0 0 0 0 0 0 0 0
[ 2Y - 3Y [ 0 0 0 0 0 0 0 0 0 0 0 0 0 0 0
[3Y - 5Y [ 0 0 0 0 0 0 0 0 0 0 0 0 0 0 0
[5Y - 10Y [ 0 0 0 0 0 0 0 0 0 0 0 0 0 0 0
[10Y - more 0 0 0 0 0 0 0 0 0 0 0 0 0 0 0Tot 0 0 0 0 0 0 0 0 0 0 0 0 0 0 0
[ 0 - 3M [ 0 0 0 0 0 0 0 0 0 0 0 0 0 0 0
[ 3M - 1Y [ 0 0 0 0 0 0 0 0 0 0 0 0 0 0 0
[ 1Y - 2Y [ 0 0 0 0 0 0 0 0 0 0 0 119 0 60 0
[ 2Y - 3Y [ 0 0 0 0 0 0 0 0 0 0 0 0 0 0 0
[3Y - 5Y [ 0 0 0 0 0 0 0 0 0 0 0 20 0 20 0
[5Y - 10Y [ 112 112 56 0 56 0 0 0 0 0 0 0 0 0 0
[10Y - more 0 0 0 0 0 0 0 0 0 0 0 0 0 0 0Tot 112 112 56 0 56 0 0 0 0 0 0 139 1 80 0
[ 0 - 3M [ 9 9 9 0 0 0 0 0 0 0 0 0 0 0 0
[ 3M - 1Y [ 0 0 0 0 0 0 0 0 0 0 0 2 0 2 0
[ 1Y - 2Y [ 0 0 0 0 0 0 0 0 0 0 0 0 0 0 0
[ 2Y - 3Y [ 0 0 0 0 0 0 0 0 0 0 0 23 0 23 0
[3Y - 5Y [ 0 0 0 0 0 0 0 0 0 0 0 0 0 0 0
[5Y - 10Y [ 7 7 0 0 7 0 0 0 0 0 0 0 0 0 0
[10Y - more 0 0 0 0 0 0 0 0 0 0 0 0 0 0 0Tot 16 16 9 0 7 0 0 0 0 0 0 25 0 25 0
Latvia
Lithuania
Malta
Netherlands
Poland
Luxembourg
Italy

2016 EU-wide Stress Test: Sovereign
(mln EUR)
Derivatives with negative fair value
Notional value Fair-value (-)Notional valueof which: Loans and
receivablesof which: AFS
of which: FVO
(designated at fair
value through
profit&loss)
of which: HFT
(2)of which: HTM
Austria
Landesbank Hessen-Thüringen Girozentrale
31/12/2015
Residual Maturity Country / Region
GROSS DIRECT LONG
EXPOSURES
(accounting value gross
of provisions)
(1)
NET DIRECT EXPOSURES
(accounting value gross of provisions)
(1)
Notional value Fair-value (+) Fair-value (-) Notional value Fair-value (+)
DIRECT SOVEREIGN EXPOSURES IN DERIVATIVES (1) INDIRECT SOVEREIGN EXPOSURES (3) (on and off balance sheet)
Derivatives with positive fair value Derivatives with negative fair value Derivatives with positive fair value
[ 0 - 3M [ 0 0 0 0 0 0 0 0 0 0 0 0 0 0 0
[ 3M - 1Y [ 0 0 0 0 0 0 0 0 0 0 0 0 0 0 0
[ 1Y - 2Y [ 0 0 0 0 0 0 0 0 0 0 0 0 0 0 0
[ 2Y - 3Y [ 0 0 0 0 0 0 0 0 0 0 0 0 0 0 0
[3Y - 5Y [ 0 0 0 0 0 0 0 0 0 0 0 0 0 0 0
[5Y - 10Y [ 0 0 0 0 0 0 0 0 0 0 0 0 0 0 0
[10Y - more 0 0 0 0 0 0 0 0 0 0 0 0 0 0 0Tot 0 0 0 0 0 0 0 0 0 0 0 0 0 0 0
[ 0 - 3M [ 0 0 0 0 0 0 0 0 0 0 0 0 0 0 0
[ 3M - 1Y [ 0 0 0 0 0 0 0 0 0 0 0 0 0 0 0
[ 1Y - 2Y [ 0 0 0 0 0 0 0 0 0 0 0 0 0 0 0
[ 2Y - 3Y [ 0 0 0 0 0 0 0 0 0 0 0 0 0 0 0
[3Y - 5Y [ 0 0 0 0 0 0 0 0 0 0 0 0 0 0 0
[5Y - 10Y [ 0 0 0 0 0 0 0 0 0 0 0 0 0 0 0
[10Y - more 0 0 0 0 0 0 0 0 0 0 0 0 0 0 0Tot 0 0 0 0 0 0 0 0 0 0 0 0 0 0 0
[ 0 - 3M [ 17 17 17 0 0 0 0 0 0 0 0 0 0 0 0
[ 3M - 1Y [ 0 0 0 0 0 0 0 0 0 0 0 46 0 46 0
[ 1Y - 2Y [ 0 0 0 0 0 0 0 0 0 0 0 0 0 0 0
[ 2Y - 3Y [ 0 0 0 0 0 0 0 0 0 0 0 0 0 0 0
[3Y - 5Y [ 0 0 0 0 0 0 0 0 0 0 0 0 0 0 0
[5Y - 10Y [ 0 0 0 0 0 0 0 0 0 0 0 0 0 0 0
[10Y - more 0 0 0 0 0 0 0 0 0 0 0 0 0 0 0Tot 17 17 17 0 0 0 0 0 0 0 0 46 0 46 0
[ 0 - 3M [ 0 0 0 0 0 0 0 0 0 0 0 0 0 0 0
[ 3M - 1Y [ 0 0 0 0 0 0 0 0 0 0 0 0 0 0 0
[ 1Y - 2Y [ 0 0 0 0 0 0 0 0 0 0 0 0 0 0 0
[ 2Y - 3Y [ 0 0 0 0 0 0 0 0 0 0 0 0 0 0 0
[3Y - 5Y [ 0 0 0 0 0 0 0 0 0 0 0 0 0 0 0
[5Y - 10Y [ 0 0 0 0 0 0 0 0 0 0 0 0 0 0 0
[10Y - more 0 0 0 0 0 0 0 0 0 0 0 0 0 0 0Tot 0 0 0 0 0 0 0 0 0 0 0 0 0 0 0
[ 0 - 3M [ 0 0 0 0 0 0 0 0 0 0 0 0 0 0 0
[ 3M - 1Y [ 18 18 0 0 0 0 18 0 0 0 0 0 0 0 0
[ 1Y - 2Y [ 221 221 60 0 0 0 161 0 0 0 0 23 0 23 0
[ 2Y - 3Y [ 21 21 0 0 21 0 0 0 0 0 0 10 0 10 0
[3Y - 5Y [ 89 89 0 0 0 0 89 0 0 0 0 0 0 0 0
[5Y - 10Y [ 143 143 0 0 33 0 110 0 0 0 0 0 0 0 0
[10Y - more 85 85 0 0 0 0 85 0 0 0 0 0 0 0 0Tot 579 579 60 0 54 0 464 0 0 0 0 33 0 33 0
[ 0 - 3M [ 0 0 0 0 0 0 0 0 0 0 0 0 0 0 0
[ 3M - 1Y [ 0 0 0 0 0 0 0 0 0 0 0 0 0 0 0
[ 1Y - 2Y [ 0 0 0 0 0 0 0 0 0 0 0 0 0 0 0
[ 2Y - 3Y [ 0 0 0 0 0 0 0 0 0 0 0 0 0 0 0
[3Y - 5Y [ 0 0 0 0 0 0 0 0 0 0 0 0 0 0 0
[5Y - 10Y [ 0 0 0 0 0 0 0 0 0 0 0 0 0 0 0
[10Y - more 0 0 0 0 0 0 0 0 0 0 0 0 0 0 0Tot 0 0 0 0 0 0 0 0 0 0 0 0 0 0 0
[ 0 - 3M [ 0 0 0 0 0 0 0 0 0 0 0 0 0 0 0
[ 3M - 1Y [ 0 0 0 0 0 0 0 0 0 0 0 0 0 0 0
[ 1Y - 2Y [ 0 0 0 0 0 0 0 0 0 0 0 0 0 0 0
[ 2Y - 3Y [ 0 0 0 0 0 0 0 0 0 0 0 0 0 0 0
[3Y - 5Y [ 9 9 0 0 0 0 9 0 0 0 0 0 0 0 0
[5Y - 10Y [ 0 0 0 0 0 0 0 0 0 0 0 0 0 0 0
[10Y - more 0 0 0 0 0 0 0 0 0 0 0 0 0 0 0Tot 9 9 0 0 0 0 9 0 0 0 0 0 0 0 0
Portugal
Romania
Slovakia
Slovenia
Spain
Sweden
United Kingdom

2016 EU-wide Stress Test: Sovereign
(mln EUR)
Derivatives with negative fair value
Notional value Fair-value (-)Notional valueof which: Loans and
receivablesof which: AFS
of which: FVO
(designated at fair
value through
profit&loss)
of which: HFT
(2)of which: HTM
Austria
Landesbank Hessen-Thüringen Girozentrale
31/12/2015
Residual Maturity Country / Region
GROSS DIRECT LONG
EXPOSURES
(accounting value gross
of provisions)
(1)
NET DIRECT EXPOSURES
(accounting value gross of provisions)
(1)
Notional value Fair-value (+) Fair-value (-) Notional value Fair-value (+)
DIRECT SOVEREIGN EXPOSURES IN DERIVATIVES (1) INDIRECT SOVEREIGN EXPOSURES (3) (on and off balance sheet)
Derivatives with positive fair value Derivatives with negative fair value Derivatives with positive fair value
[ 0 - 3M [ 0 0 0 0 0 0 0 0 0 0 0 0 0 0 0
[ 3M - 1Y [ 0 0 0 0 0 0 0 0 0 0 0 0 0 0 0
[ 1Y - 2Y [ 0 0 0 0 0 0 0 0 0 0 0 0 0 0 0
[ 2Y - 3Y [ 0 0 0 0 0 0 0 0 0 0 0 0 0 0 0
[3Y - 5Y [ 0 0 0 0 0 0 0 0 0 0 0 0 0 0 0
[5Y - 10Y [ 0 0 0 0 0 0 0 0 0 0 0 0 0 0 0
[10Y - more 0 0 0 0 0 0 0 0 0 0 0 0 0 0 0Tot 0 0 0 0 0 0 0 0 0 0 0 0 0 0 0
[ 0 - 3M [ 0 0 0 0 0 0 0 0 0 0 0 0 0 0 0
[ 3M - 1Y [ 0 0 0 0 0 0 0 0 0 0 0 0 0 0 0
[ 1Y - 2Y [ 0 0 0 0 0 0 0 0 0 0 0 0 0 0 0
[ 2Y - 3Y [ 0 0 0 0 0 0 0 0 0 0 0 0 0 0 0
[3Y - 5Y [ 0 0 0 0 0 0 0 0 0 0 0 0 0 0 0
[5Y - 10Y [ 0 0 0 0 0 0 0 0 0 0 0 0 0 0 0
[10Y - more 0 0 0 0 0 0 0 0 0 0 0 0 0 0 0Tot 0 0 0 0 0 0 0 0 0 0 0 0 0 0 0
[ 0 - 3M [ 0 0 0 0 0 0 0 0 0 0 0 0 0 0 0
[ 3M - 1Y [ 0 0 0 0 0 0 0 0 0 0 0 0 0 0 0
[ 1Y - 2Y [ 0 0 0 0 0 0 0 0 0 0 0 0 0 0 0
[ 2Y - 3Y [ 14 14 14 0 0 0 0 0 0 0 0 0 0 0 0
[3Y - 5Y [ 0 0 0 0 0 0 0 0 0 0 0 0 0 0 0
[5Y - 10Y [ 1 1 0 0 1 0 0 0 0 0 0 0 0 0 0
[10Y - more 0 0 0 0 0 0 0 0 0 0 0 0 0 0 0Tot 15 15 14 0 1 0 0 0 0 0 0 0 0 0 0
[ 0 - 3M [ 0 0 0 0 0 0 0 0 0 0 0 0 0 0 0
[ 3M - 1Y [ 0 0 0 0 0 0 0 0 0 0 0 0 0 0 0
[ 1Y - 2Y [ 0 0 0 0 0 0 0 0 0 0 0 0 0 0 0
[ 2Y - 3Y [ 0 0 0 0 0 0 0 0 0 0 0 0 0 0 0
[3Y - 5Y [ 0 0 0 0 0 0 0 0 0 0 0 0 0 0 0
[5Y - 10Y [ 0 0 0 0 0 0 0 0 0 0 0 0 0 0 0
[10Y - more 0 0 0 0 0 0 0 0 0 0 0 0 0 0 0Tot 0 0 0 0 0 0 0 0 0 0 0 0 0 0 0
[ 0 - 3M [ 0 0 0 0 0 0 0 0 0 0 0 0 0 0 0
[ 3M - 1Y [ 0 0 0 0 0 0 0 0 0 0 0 0 0 0 0
[ 1Y - 2Y [ 0 0 0 0 0 0 0 0 0 0 0 0 0 0 0
[ 2Y - 3Y [ 0 0 0 0 0 0 0 0 0 0 0 0 0 0 0
[3Y - 5Y [ 0 0 0 0 0 0 0 0 0 0 0 0 0 0 0
[5Y - 10Y [ 0 0 0 0 0 0 0 0 0 0 0 0 0 0 0
[10Y - more 0 0 0 0 0 0 0 0 0 0 0 0 0 0 0Tot 0 0 0 0 0 0 0 0 0 0 0 0 0 0 0
Norway
Australia
Canada
Hong Kong
Japan
Liechtenstein
Iceland

2016 EU-wide Stress Test: Sovereign
(mln EUR)
Derivatives with negative fair value
Notional value Fair-value (-)Notional valueof which: Loans and
receivablesof which: AFS
of which: FVO
(designated at fair
value through
profit&loss)
of which: HFT
(2)of which: HTM
Austria
Landesbank Hessen-Thüringen Girozentrale
31/12/2015
Residual Maturity Country / Region
GROSS DIRECT LONG
EXPOSURES
(accounting value gross
of provisions)
(1)
NET DIRECT EXPOSURES
(accounting value gross of provisions)
(1)
Notional value Fair-value (+) Fair-value (-) Notional value Fair-value (+)
DIRECT SOVEREIGN EXPOSURES IN DERIVATIVES (1) INDIRECT SOVEREIGN EXPOSURES (3) (on and off balance sheet)
Derivatives with positive fair value Derivatives with negative fair value Derivatives with positive fair value
[ 0 - 3M [ 0 0 0 0 0 0 0 0 0 0 0 0 0 0 0
[ 3M - 1Y [ 0 0 0 0 0 0 0 0 0 0 0 0 0 32 0
[ 1Y - 2Y [ 5 5 5 0 0 0 0 0 0 0 0 0 0 625 -3
[ 2Y - 3Y [ 175 175 0 0 0 0 175 0 0 0 0 0 0 0 0
[3Y - 5Y [ 601 601 76 0 0 0 525 0 0 0 0 0 0 0 0
[5Y - 10Y [ 0 0 0 0 0 0 0 0 0 0 0 0 0 0 0
[10Y - more 0 0 0 0 0 0 0 0 0 0 0 0 0 0 0Tot 781 781 81 0 0 0 699 0 0 0 0 0 0 657 -3
[ 0 - 3M [ 0 0 0 0 0 0 0 0 0 0 0 0 0 0 0
[ 3M - 1Y [ 0 0 0 0 0 0 0 0 0 0 0 0 0 0 0
[ 1Y - 2Y [ 0 0 0 0 0 0 0 0 0 0 0 0 0 0 0
[ 2Y - 3Y [ 0 0 0 0 0 0 0 0 0 0 0 0 0 0 0
[3Y - 5Y [ 0 0 0 0 0 0 0 0 0 0 0 0 0 0 0
[5Y - 10Y [ 0 0 0 0 0 0 0 0 0 0 0 0 0 0 0
[10Y - more 0 0 0 0 0 0 0 0 0 0 0 0 0 0 0Tot 0 0 0 0 0 0 0 0 0 0 0 0 0 0 0
[ 0 - 3M [ 0 0 0 0 0 0 0 0 0 0 0 0 0 0 0
[ 3M - 1Y [ 0 0 0 0 0 0 0 0 0 0 0 0 0 0 0
[ 1Y - 2Y [ 0 0 0 0 0 0 0 0 0 0 0 0 0 0 0
[ 2Y - 3Y [ 0 0 0 0 0 0 0 0 0 0 0 0 0 0 0
[3Y - 5Y [ 0 0 0 0 0 0 0 0 0 0 0 0 0 0 0
[5Y - 10Y [ 0 0 0 0 0 0 0 0 0 0 0 0 0 0 0
[10Y - more 46 46 0 0 0 0 46 0 0 0 0 0 0 0 0Tot 46 46 0 0 0 0 46 0 0 0 0 0 0 0 0
[ 0 - 3M [ 0 0 0 0 0 0 0 0 0 0 0 0 0 0 0[ 3M - 1Y [ 0 0 0 0 0 0 0 0 0 0 0 0 0 0 0
[ 1Y - 2Y [ 0 0 0 0 0 0 0 0 0 0 0 0 0 0 0
[ 2Y - 3Y [ 1 1 1 0 0 0 0 0 0 0 0 0 0 0 0
[3Y - 5Y [ 0 0 0 0 0 0 0 0 0 0 0 0 0 0 0
[5Y - 10Y [ 0 0 0 0 0 0 0 0 0 0 0 0 0 0 0
[10Y - more 0 0 0 0 0 0 0 0 0 0 0 0 0 0 0Tot 1 1 1 0 0 0 0 0 0 0 0 0 0 0 0
[ 0 - 3M [ 0 0 0 0 0 0 0 0 0 0 0 0 0 0 0[ 3M - 1Y [ 0 0 0 0 0 0 0 0 0 0 0 0 0 0 0
[ 1Y - 2Y [ 0 0 0 0 0 0 0 0 0 0 0 0 0 0 0
[ 2Y - 3Y [ 0 0 0 0 0 0 0 0 0 0 0 0 0 0 0
[3Y - 5Y [ 4 4 0 0 0 0 4 0 0 0 0 0 0 0 0
[5Y - 10Y [ 1 1 0 0 0 0 1 0 0 0 0 0 0 0 0
[10Y - more 0 0 0 0 0 0 0 0 0 0 0 0 0 0 0Tot 5 5 0 0 0 0 5 0 0 0 0 0 0 0 0
[ 0 - 3M [ 0 0 0 0 0 0 0 0 0 0 0 0 0 0 0
[ 3M - 1Y [ 0 0 0 0 0 0 0 0 0 0 0 0 0 0 0
[ 1Y - 2Y [ 0 0 0 0 0 0 0 0 0 0 0 0 0 0 0
[ 2Y - 3Y [ 0 0 0 0 0 0 0 0 0 0 0 0 0 0 0
[3Y - 5Y [ 0 0 0 0 0 0 0 0 0 0 0 0 0 0 0
[5Y - 10Y [ 0 0 0 0 0 0 0 0 0 0 0 0 0 0 0
[10Y - more 0 0 0 0 0 0 0 0 0 0 0 0 0 0 0Tot 0 0 0 0 0 0 0 0 0 0 0 0 0 0 0
[ 0 - 3M [ 0 0 0 0 0 0 0 0 0 0 0 0 0 0 0[ 3M - 1Y [ 0 0 0 0 0 0 0 0 0 0 0 0 0 0 0
[ 1Y - 2Y [ 0 0 0 0 0 0 0 0 0 0 0 0 0 0 0
[ 2Y - 3Y [ 0 0 0 0 0 0 0 0 0 0 0 0 0 0 0
[3Y - 5Y [ 2 2 0 0 0 0 2 0 0 0 0 0 0 0 0
[5Y - 10Y [ 0 0 0 0 0 0 0 0 0 0 0 0 0 0 0
[10Y - more 0 0 0 0 0 0 0 0 0 0 0 0 0 0 0Tot 2 2 0 0 0 0 2 0 0 0 0 0 0 0 0
Latin America and the
Caribbean
Middle East
U.S.
China
Switzerland
Other advanced
economies non EEA
Other Central and eastern
Europe countries non EEA

2016 EU-wide Stress Test: Sovereign
(mln EUR)
Derivatives with negative fair value
Notional value Fair-value (-)Notional valueof which: Loans and
receivablesof which: AFS
of which: FVO
(designated at fair
value through
profit&loss)
of which: HFT
(2)of which: HTM
Austria
Landesbank Hessen-Thüringen Girozentrale
31/12/2015
Residual Maturity Country / Region
GROSS DIRECT LONG
EXPOSURES
(accounting value gross
of provisions)
(1)
NET DIRECT EXPOSURES
(accounting value gross of provisions)
(1)
Notional value Fair-value (+) Fair-value (-) Notional value Fair-value (+)
DIRECT SOVEREIGN EXPOSURES IN DERIVATIVES (1) INDIRECT SOVEREIGN EXPOSURES (3) (on and off balance sheet)
Derivatives with positive fair value Derivatives with negative fair value Derivatives with positive fair value
[ 0 - 3M [ 0 0 0 0 0 0 0 0 0 0 0 0 0 0 0
[ 3M - 1Y [ 0 0 0 0 0 0 0 0 0 0 0 0 0 0 0
[ 1Y - 2Y [ 0 0 0 0 0 0 0 0 0 0 0 0 0 0 0
[ 2Y - 3Y [ 0 0 0 0 0 0 0 0 0 0 0 0 0 0 0
[3Y - 5Y [ 0 0 0 0 0 0 0 0 0 0 0 0 0 0 0
[5Y - 10Y [ 0 0 0 0 0 0 0 0 0 0 0 0 0 0 0
[10Y - more 0 0 0 0 0 0 0 0 0 0 0 0 0 0 0Tot 0 0 0 0 0 0 0 0 0 0 0 0 0 0 0
33,509 33,509 6,603 113 5,033 0 21,759 15,722 2,895 3,486 -373 358 2 941 -4
Notes, definitions and regions:
(1) The exposures reported cover only exposures to central, regional and local governments on immediate borrower basis, and do not include exposures to other counterparts with full or partial government guarantees. Exposures to central banks should not be included here.(2) For positions in HFT this should include gross exposures (long) net of cash short positions of sovereign debt to other counterpaties only where there is a maturity matching(3) The exposures reported include the positions towards counterparts (other than sovereign) on sovereign credit risk (i.e. CDS) booked in all the accounting portfolio (on-off balance sheet). Irrespective of the denomination and or accounting classification of the positions.Other advanced non EEA: Israel, Korea, New Zealand, San Marino, Singapore,Taiwan and RussiaOther CEE non EEA: Albania, Bosnia and Herzegovina, Kosovo, FYR Macedonia, Montenegro, Serbia, and Turkey.Middle East: Yemen,United Arab Emirates,Syrian ,Sudan,Saudi Arabia,Qatar ,Oman ,Mauritania ,Libya ,Lebanon ,Kuwait ,Jordan ,Iraq ,Iran,Djibouti and Bahrain.Latin America: Venezuela,Uruguay ,Trinidad and Tobago,Suriname ,St. Vincent and the Grenadines,St. Lucia,St. Kitts and Nevis,Peru ,Paraguay ,Panama ,Nicaragua ,Mexico ,Jamaica ,Honduras ,Haiti ,Guyana ,Guatemala ,Grenada ,El Salvador,Ecuador ,Dominican Republic,Dominica ,Costa Rica,Colombia ,Chile ,Brazil ,Bolivia and Belize.Africa: South Africa, Tunisia ,Morocco ,Egypt and Algeria.
Africa
Others
Total

2016 EU-wide Stress Test - Risk exposure amounts
(mln EUR) 31/12/2015 31/12/2016 31/12/2017 31/12/2018 31/12/2016 31/12/2017 31/12/2018
Risk exposure amount for credit risk 46,567 48,280 47,438 47,488 55,285 58,036 53,078
Risk exposure amount for securitisations and re-securitisations 3,302 3,616 3,608 3,644 4,309 4,764 4,927
Risk exposure amount other credit risk 43,265 44,665 43,830 43,844 50,977 53,273 48,151
Risk exposure amount for market risk 4,589 4,589 4,589 4,589 4,809 4,895 4,875
Risk exposure amount for operational risk 3,703 3,703 3,703 3,703 3,703 3,703 3,703
Other risk exposure amounts 0 0 0 0 0 0 0
Total risk exposure amount 54,859 56,572 55,730 55,780 63,797 66,635 61,656
Baseline scenario Adverse scenario
Landesbank Hessen-Thüringen Girozentrale

2016 EU-wide Stress Test - P&L
31/12/2015 31/12/2016 31/12/2017 31/12/2018 31/12/2016 31/12/2017 31/12/2018
Net interest income (1) 1,4271,403 1,409 1,392 1,190 1,152 1,096
Interest income 6,557 5,513 5,611 5,800 6,422 6,769 6,643
(Interest expense) -5,130 -4,109 -4,202 -4,408 -5,232 -5,617 -5,547
Dividend income 45 45 45 45 45 45 45
Net fee and commission income 307 307 307 307 216 216 216
Gains or (-) losses on financial assets and liabilities held for trading, net 136 83 83 83 -936 63 63
Gains or (-) losses on financial assets and liabilities designated at fair
value through profit and loss, net-31 263
Other operating income not listed above, net 32 -4 -4 -4 -10 -4 -4
Total operating income, net 1,916 1,835 1,841 1,824 769 1,472 1,416
(Impairment or (-) reversal of impairment on financial assets not
measured at fair value through profit or loss)-301 -267 -133 -137 -451 -279 -256
Other income and expenses not listed above, net -1,065 -1,083 -1,083 -1,083 -1,245 -1,109 -1,127
Profit or (-) loss before tax from continuing operations 550 484 624 603 -926 85 34
(Tax expenses or (-) income related to profit or loss from continuing operations) -167 -145 -187 -181 0 -8 -3
Profit or (-) loss after tax from discontinued operations 0 0 0 0 0 0 0
Profit or (-) loss for the year 383 339 437 422 -926 77 31
Attributable to owners of the parent 386 339 437 422 -926 77 31
Amount of dividends paid 100 102 131 127 0 0 0
Attributable to owners of the parent net of estimated dividends 286 237 306 295 -926 77 31
(mln EUR)
Baseline Scenario Adverse Scenario
Landesbank Hessen-Thüringen Girozentrale
(1) Projected NII may differ from the sum of interest income and interest expenses due to the application of the cap on NII (paragraphs 308 of the methodological note).

2016 EU-wide Stress Test: Capital
(mln EUR,%) 31/12/2015 31/12/2016 31/12/2017 31/12/2018 31/12/2016 31/12/2017 31/12/2018
A OWN FUNDS 10,879 10,951 11,097 11,170 9,669 9,550 9,431
A.1 COMMON EQUITY TIER 1 CAPITAL (net of deductions and after applying transitional adjustments) 7,564 7,702 7,879 8,043 6,400 6,318 6,229
A.1.1 Capital instruments eligible as CET1 Capital (including share premium and net own capital instruments) 3,947 3,947 3,947 3,947 3,947 3,947 3,947
A.1.1.1 Of which: CET1 instruments subscribed by Government 0 0 0 0 0 0 0
A.1.2 Retained earnings 3,770 4,007 4,312 4,607 2,844 2,921 2,951
A.1.3 Accumulated other comprehensive income -180 -180 -180 -180 -454 -454 -454
A.1.3.1 Of which: arising from unrealised gains/losses from Sovereign exposure in AFS portfolio 105 105 105 105 -36 -36 -36
A.1.3.2 Of which: arising from unrealised gains/losses from the rest of AFS portfolio 98 98 98 98 -366 -366 -366
A.1.4 Other Reserves 0 0 0 0 0 0 0
A.1.5 Funds for general banking risk 0 0 0 0 0 0 0
A.1.6 Minority interest given recognition in CET1 capital 0 0 0 0 0 0 0
A.1.7 Adjustments to CET1 due to prudential filters -62 -62 -62 -62 -62 -62 -62
A.1.8 (-) Intangible assets (including Goodwill) -148 -148 -148 -148 -148 -148 -148
A.1.9 (-) DTAs that rely on future profitability and do not arise from temporary differences net of associated DTLs -2 -2 -2 -2 -2 -2 -2
A.1.10 (-) IRB shortfall of credit risk adjustments to expected losses -132 -92 -108 -120 -47 -44 -4
A.1.11 (-) Defined benefit pension fund assets 0 0 0 0 0 0 0
A.1.12 (-) Reciprocal cross holdings in CET1 Capital 0 0 0 0 0 0 0
A.1.13 (-) Excess deduction from AT1 items over AT1 Capital 0 0 0 0 0 0 0
A.1.14 (-) Deductions related to assets which can alternatively be subject to a 1.250% risk weight 0 0 0 0 0 0 0
A.1.14.1 Of which: from securitisation positions (-) 0 0 0 0 0 0 0
A.1.15(-) Holdings of CET1 capital instruments of financial sector entities where the institiution does not have a significant
investment0 0 0 0 0 0 0
A.1.16 (-) Deductible DTAs that rely on future profitability and arise from temporary differences 0 0 0 0 0 0 0
A.1.17 (-) CET1 instruments of financial sector entities where the institiution has a significant investment 0 0 0 0 0 0 0
A.1.18 (-) Amount exceding the 17.65% threshold 0 0 0 0 0 0 0
A.1.19 (-) Additional deductions of CET1 Capital due to Article 3 CRR 0 0 0 0 0 0 0
A.1.20 CET1 capital elements or deductions - other 0 0 0 0 0 0 0
A.1.21 Transitional adjustments 370 231 119 0 322 160 0
A.1.21.1 Transitional adjustments due to grandfathered CET1 Capital instruments (+/-) 0 0 0 0 0 0 0
A.1.21.2 Transitional adjustments due to additional minority interests (+/-) 0 0 0 0 0 0 0
A.1.21.3Transitional adjustments to CET1 Capital from unrealised gains/losses from Sovereign exposure in AFS portfolio (+/-
)-42 -42 -21 0 14 7 0
A.1.21.4 Transitional adjustments to CET1 Capital from unrealised gains/losses from the rest of AFS portfolio (+/-) -39 -39 -20 0 146 73 0
A.1.21.5 Other transitional adjustments to CET1 Capital 451 312 159 0 161 79 0
A.1.21.5.1 Of which: due to DTAs that rely on future profitability and do not arise from temporary differences 1 1 0 0 1 0 0
A.1.21.5.2Of which: due to DTAs that rely on future profitability and arise from temporary differences and CET1
instruments of financial sector entities where the institution has a significant investment0 0 0 0 0 0 0
A.2 ADDITIONAL TIER 1 CAPITAL (net of deductions and after transitional adjustments) 607 553 485 421 562 492 421
A.2.1 Additional Tier 1 Capital instruments 0 0 0 0 0 0 0
A.2.2 (-) Excess deduction from T2 items over T2 capital 0 0 0 0 0 0 0
A.2.3 Other Additional Tier 1 Capital components and deductions -1 -1 -1 -1 -1 -1 -1
A.2.4 Additional Tier 1 transitional adjustments 608 554 486 421 563 493 421
A.3 TIER 1 CAPITAL (net of deductions and after transitional adjustments) 8,171 8,255 8,364 8,463 6,963 6,810 6,650
A.4 TIER 2 CAPITAL (net of deductions and after transitional adjustments) 2,708 2,697 2,733 2,707 2,706 2,740 2,781
A.4.1 Tier 2 Capital instruments 2,690 2,629 2,631 2,612 2,629 2,631 2,612
A.4.2 Other Tier 2 Capital components and deductions -5 -5 -5 -5 -5 -5 69
A.4.3 Tier 2 transitional adjustments 23 72 107 100 81 114 100
B TOTAL RISK EXPOSURE AMOUNT 54,859 56,572 55,730 55,780 63,797 66,635 61,656
B.1 Of which: Transitional adjustments included 0 0 0 0 0 0 0
C.1 Common Equity Tier 1 Capital ratio 13.79% 13.61% 14.14% 14.42% 10.03% 9.48% 10.10%
C.2 Tier 1 Capital ratio 14.89% 14.59% 15.01% 15.17% 10.91% 10.22% 10.79%
C.3 Total Capital ratio 19.83% 19.36% 19.91% 20.03% 15.16% 14.33% 15.30%
D.1 Common Equity Tier 1 Capital ratio (1) 13.11% 13.20% 13.92% 14.42% 9.53% 9.24% 10.10%
D.2 Tier 1 Capital ratio (2) 13.11% 13.20% 13.92% 14.42% 9.53% 9.24% 10.10%
D.3 Total Capital ratio (3) 18.01% 17.84% 18.64% 19.09% 13.64% 13.18% 14.45%
ETotal amount of instruments with mandatory conversion into ordinary shares upon a fixed date in the 2016 -2018 period
(cumulative conversions) (4)0 0 0 0 0 0 0
FTotal Additional Tier 1 and Tier 2 instruments eligible as regulatory capital under the CRR provisions that convert into
Common Equity Tier 1 or are written down upon a trigger event (5)0 0 0
F.1 Of which: eligible instruments whose trigger is above CET1 capital ratio in the adverse scenario (5) 0 0 0
G.1 Total leverage ratio exposures (transitional) 183,275 183,275 183,275 183,275 183,275 183,275 183,275
G.2 Total leverage ratio exposures (fully loaded) 183,096 183,096 183,096 183,096 183,096 183,096 183,096
G.3 Leverage ratio (transitional) 4.46% 4.50% 4.56% 4.62% 3.80% 3.72% 3.63%
G.4 Leverage ratio (fully loaded) 3.93% 4.08% 4.24% 4.39% 3.32% 3.36% 3.40%
(1) Fully loaded CET1 capital ratio estimation: [A.1-A.1.13-A.1.21+MIN(A.2+A.1.13-A.2.2-A.2.4+MIN(A.4+A.2.2-A.4.3,0),0)]/[B-B.1]
(2) Fully loaded T1 capital ratio estimation: [A.1-A.1.21+A.2-A.2.2-A.2.4+MIN(A.4+A.2.2-A.4.3,0)]/[B-B.1]
(3) Fully loaded Total capital ratio estimation: [A.1-A.1.21+A.2-A.2.4+A.4-A.4.3)/[B-B.1]. This ratio does not include grandfathered AT1 capital instruments meeting the conditions laid down in Article 63 of CRR and, hence, eligible as fully loaded T2 capital. Therefore, the ratio could be underestimated for banks with material instruments of such kind.
(4) Conversions not considered for CET1 computation
(5) Excluding instruments included in row E
Memorandum items
Baseline Scenario Adverse Scenario
CAPITAL RATIOS (%)
Transitional period
Landesbank Hessen-Thüringen Girozentrale
OWN FUNDS
CAPITAL RATIOS (%)
Fully loaded
TOTAL RISK EXPOSURE
AMOUNT

(mln EUR)
Of which:
defaulted
Debt securities (including at amortised cost and fair value) 23,440 0 88 88 2 37 0
Central banks 0 0 0 0 0 0 0
General governments 7,945 0 0 0 1 0 0
Credit institutions 14,152 0 0 0 0 0 0
Other financial corporations 1,099 0 0 0 1 0 0
Non-financial corporations 244 0 88 88 0 37 0
Loans and advances(including at amortised cost and fair value) 112,732 33 2,392 2,385 356 748 516
Central banks 1,832 0 0 0 0 0 0
General governments 20,525 0 2 2 7 2 0
Credit institutions 17,049 0 3 3 1 1 2
Other financial corporations 11,615 0 482 482 15 88 123
Non-financial corporations 56,111 30 1,763 1,757 328 613 348
Households 5,600 3 141 140 5 44 44
DEBT INSTRUMENTS other than HFT 136,171 33 2,480 2,473 358 785 516
OFF-BALANCE SHEET EXPOSURES 29,054 89 88 9 35 11 For the definition of non-performing exposures please refer to COMMISSION IMPLEMENTING REGULATION (EU) 2015/227 of 9 January 2015, ANNEX V, Part 2-Template related instructions, subtitle 29
2 Insitutions report here collective allowances for incurrred but not reported losses (instruments at amortised cost) and changes in fair value of performing exposures due to credit risk and provisions (instruments at fair value other than HFT)
3 Insitutions report here specific allowances for financial assets, individually and collectively estimated (instruments at amortised cost) and changes in fair value of NPE due to credit risk and provisions (instruments at fair value other than HFT)
On non-performing
exposures3
2016 EU-wide Stress Test Information on performing and non-performing exposures
1
31/12/2015
Gross carrying amount
Accumulated impairment,
accumulated changes in fair value due
to credit risk and provisions Collaterals and
financial
guarantees
received on non-
performing
exposures
Of which performing
but past due >30 days
and <=90 days
Of which non-performing
On performing
exposures2
Landesbank Hessen-Thüringen Girozentrale

(mln EUR)
Debt securities (including at amortised cost and fair value) 0 0 0 0 0
Central banks 0 0 0 0 0
General governments 0 0 0 0 0
Credit institutions 0 0 0 0 0
Other financial corporations 0 0 0 0 0
Non-financial corporations 0 0 0 0 0
Loans and advances (including at amortised cost and fair value) 2,332 1,756 532 516 372
Central banks 0 0 0 0 0
General governments 2 2 2 2 0
Credit institutions 0 0 0 0 0
Other financial corporations 338 294 53 49 94
Non-financial corporations 1,947 1,426 470 458 263
Households 45 35 7 7 15
DEBT INSTRUMENTS other than HFT 2,332 1,756 532 516 372
Loan commitments given 39 22 3 3 01 For the definition of forborne exposures please refer to COMMISSION IMPLEMENTING REGULATION (EU) 2015/227 of 9 January 2015, ANNEX V, Part 2-Template related instructions, subtitle 30
2016 EU-wide Stress Test Information on forborne exposures
1
31/12/2015
Of which non-
performing
exposures with
forbearance
measures
Of which on non-
performing
exposures with
forbearance
measures
Gross carrying amount of exposures
with forbearance measures
Accumulated impairment, accumulated
changes in fair value due to credit risk
and provisions for exposures with
forbearance measures Collateral and financial
guarantees received on
exposures with forbearance
measures
Landesbank Hessen-Thüringen Girozentrale